Embed Size (px)
Citation preview

The Economic Impact of U.S. Trade Sanctions on Imports of Paper ProductsA Research and Analysis Report by Dr. Robert Shapiroand Sonecon, LLC, International Economic Advisory Firm
Commissioned by World Growth
September 2011
The Economic Impact of U.S. Trade Sanctions on Imports of Paper Products
About the Authors
Robert J. Shapiro is the chairman of Sonecon, LLC, a private firm that advises U.S. and foreign businesses, governments
and non-profit organizations on market conditions and economic policy. From 1997 to 2001, Dr. Shapiro was President
Clinton’s Under Secretary of Commerce for Economic Affairs. In that post, he directed economic policy for the Commerce
Department and oversaw the nation’s major statistical agencies, including the Census Bureau before and during the
2000 decennial census. Prior to that, he was co-founder and Vice President of the Progressive Policy Institute, Legislative
Director for Senator Daniel P. Moynihan, and Associate Editor of U.S. News & World Report. Dr. Shapiro also served as
the principal economic advisor to Governor Bill Clinton in his 1991-1992 presidential campaign, and economic advisor
to the campaigns of Vice President Albert Gore, Jr. and Senator John Kerry. In 2008, he advised the campaign and
presidential transition of Senator Barack Obama. Dr. Shapiro has been a Fellow of Harvard University, the Brookings
Institution, and the National Bureau of Economic Research. He holds a Ph.D. and M.A. from Harvard University, a
M.Sc. from the London School of Economics and Political Science, and a B.A. from the University of Chicago.
Nam D. Pham is the managing partner of NDP Group, LLC, an economics consulting firm that specializes in assessing
complex issues in finance, industrial organization and international trade. Clients of NDP Group include U.S. and foreign
corporations, financial institutions, federal and local governments, trade associations and multi-national organizations.
Prior to founding NDP Group in 2000, Dr. Pham was Vice President at Scudder Kemper Investments in Boston, where
he was responsible for research, asset allocations and currency hedges for Scudder's global and international bond funds.
Before that, he was Chief Economist of the Asia Region for Standard & Poor's DRI in Boston. Dr. Pham's has more than
twenty years of experience in multinational organizations and government agencies in Washington D.C. This tenure
includes posts as an economist at the World Bank and a consultant to the Department of Commerce and the Federal
Trade Commission. In addition, Dr. Pham has been an adjunct professor at the George Washington University, where
he has taught undergraduate and graduate courses in monetary economics, international trade and finance,
macroeconomics and microeconomics. Dr. Pham earned a Ph.D. in economics from the George Washington University
with concentrations in international trade and finance, economic development and applied microeconomics, a M.A.
from Georgetown University and a B.A. from the University of Maryland.

The Economic Impact of U.S. Trade Sanctions on Imports of Paper Products
The World Growth Forestry and Poverty Project
Forestry for Sustainable Development
Sustainable forestry and the development of sustainable forest plantations are the basis of a path to
sustainable development that is both practical and achievable, particularly in developing countries.
Forestry for Climate Change Mitigation
The expansion of sustainable forestry and forest areas is a low-cost means of climate change mitigation
for developing countries that does not threaten economic growth.
Forestry for Reducing Poverty
The expansion of sustainable forestry — from small-scale community harvesting to large-scale forest and
plantation management — is a means to large-scale economic growth in developing countries, thereby
reducing poverty and supporting livelihoods.
Forestry for Equity
The expansion of sustainable forestry for climate change mitigation and poverty reduction must be
treated equally between nations, and must not be used as a tool for implementing political objectives
that will threaten economic growth.

The Economic Impact of U.S. Trade Sanctions on Imports of Paper Products
Table of Contents
Executive Summary . . . . . . . . . . . . . . . . . . . . . . . . . . . . .1
I. Introduction . . . . . . . . . . . . . . . . . . . . . . . . . . . . . . . .2
II. Industry Background . . . . . . . . . . . . . . . . . . . . . . . . .6
The Rise of Anti-Dumping Duties . . . . . . . . . . . . . .8
III. Trade Issues . . . . . . . . . . . . . . . . . . . . . . . . . . . . . . .10
The Coated Paper Market in the United States . .11
Do Chinese and Indonesian Exports of Coated . . . . . .Paper Products Substitute for U.S. Products? . . . . .13
IV. The Economic Effects of the Antidumping and Countervailing Duties . . . . . . .16
The Price Effects of Antidumping and Countervailing Duties . . . . . . . . . . . . . . . . . . .16
The Impact of Antidumping and Countervailing Duties on U.S. Exports . . . . . . . . .18
Trade Retaliation and Global Trade Flows under U.S. Trade Sanctions . . . . . . . . . . . . . . . . . . .19
Additional Adverse Effects of Trade Sanctions on U.S. National Welfare . . . . . . . . . . .20
V. Lessons for the U.S. Paper Industry: Case Studies of Other U.S. Industries Facing Lower-Cost Foreign Competition . . . . . . . .23
Textiles . . . . . . . . . . . . . . . . . . . . . . . . . . . . . . . . . . .23
Steel . . . . . . . . . . . . . . . . . . . . . . . . . . . . . . . . . . . . .24
VI. Conclusion . . . . . . . . . . . . . . . . . . . . . . . . . . . . . . . .27
Appendix . . . . . . . . . . . . . . . . . . . . . . . . . . . . . . . . . . . . .29
Industry Background . . . . . . . . . . . . . . . . . . . . . . . .29
U.S. Duties on Chinese and Indonesian Coated Paper Products . . . . . . . . . . . .34
References . . . . . . . . . . . . . . . . . . . . . . . . . . . . . . . . . . . .35

EXEC
UTI
VE
SUM
MA
RY
The Economic Impact of U.S. Trade Sanctions on Imports of Paper Products • 1
Executive Summary
• In September 2009, three, large U.S.-based paper companies (NewPage Corporation, Appleton Coated andSappi-North America) and the United Steelworkers Union (USW), filed complaints of unfair trade practicesby Chinese and Indonesian coated paper producers with the International Trade Commission (ITC) of the U.S.Department of Commerce. This study examines the economic impact of the anti-dumping and countervailingduties ultimately imposed on those imports by the ITC.
• This conflict between U.S. and foreign paper producers ignores the most basic features of the global papermarket: nations expand their capacity to produce paper products primarily to meet domestic demand. As aresult, the global market share claimed by paper producers in the United States and other major paperproducing nations closely tracks each country’s share of global paper consumption.
• The duties directly raise the U.S. domestic prices for the targeted products produced not only by the Chineseand Indonesian companies, but also by their U.S. and European competitors in the American market. Yet,these duties do not produce net benefits for U.S. producers and their workers. The primary reason: the U.S.duties directly reduce the flow of Chinese and Indonesian coated paper products to America, and therebyindirectly increase the supply of those Chinese and Indonesian products to third country markets, where theyalso compete with U.S.-made coated paper. We estimate that the U.S. duties will lower the prices of Chinese andIndonesian exports to those third-country markets by, respectively, 7 percent and almost 19 percent.
• U.S. exporters of coated paper products, therefore, now face more intense price competition from Chinese andIndonesia coated paper producers in the rest of the world, which will quickly reduce their foreign market shares.
• These duties also increase the risk of retaliatory measures by China and Indonesia, which would reduce theexports of U.S. coated paper products to those countries.
• Economic analysis has established that antidumping and countervailing duties do not ultimately protectdomestic producers and promote national welfare. These duties not only increase U.S. domestic prices. Asdocumented in other industries, including textiles and steel, these duties reduce the market pressures andincentives for U.S. producers to respond to foreign competitors, here and abroad, through technologicalinnovation and the development of high-value added products.

2 • The Economic Impact of U.S. Trade Sanctions on Imports of Paper Products
In response, some U.S. industries have received tradeprotection from the U.S. International TradeCommission under the U.S. antidumping andcountervailing duty programs. This study examines thechallenges for American coated paper businesses andtheir workers coming from competition with Chineseand Indonesian paper producers, and the economicconsequences likely to flow from recently-approvedantidumping and countervailing duties.
In September 2009, three American paper companies– NewPage Corporation, Appleton Coated and Sappi-North America – along with the United Steelworkers(USW), filed ‘unfair trade cases’ with the U.S.
Department of Commerce and the U.S. InternationalTrade Commission against Chinese and Indonesiancoated paper imports. The filings alleged that certaincoated paper originating from China and Indonesia hadbeen dumped and subsidized, undermining the viabilityof domestic producers of coated paper. The USW,representing 6,000 workers among the threecompanies who filed, also expressed concern forAmerican jobs, citing the need to protect employment.
The growth of paper and pulp production in bothadvanced and developing economies follows a clearpattern: A country’s capacity to produce paper andpulp products, as a share of the global industry,expands and contracts with its share of worldwideconsumption of the products. For example, from 1970to 2009, U.S. consumption of paper products,measured in tons or volume, fell from more than 41percent of worldwide paper consumption to 19.4percent; and over the same period, U.S. production ofthose products fell from just over 40 percent ofworldwide production to 20.5 percent. The samepattern is evident in major developing nations. Forexample, as China and Indonesia’s combined share ofworldwide consumption of paper products rose from2.1 percent in 1970 to 25.3 percent in 2009, theircombined share of worldwide production of those
1 The authors want to acknowledge the excellent research assistance provided by Jiwon Vellucci and the financial support for the researchprovided by World Growth. The views expressed here are solely those of the authors.
As China and Indonesia’s combined share of
worldwide consumption of paper products rose
from 2.1 percent in 1970 to 25.3 percent in 2009,
their combined share of worldwide production
of those products increased from 1.7 percent
to 25.6 percent.
The Economic Impact of U.S. Trade Sanctions on the Asian and American Paper Industries1
by Robert J. Shapiro and Nam D. Pham
I. Introduction
Globalization has fundamentally changed the economic landscape for everyone, presenting
new challenges for American businesses, workers and policymakers. One challenge which has
received great public attention and concern is the increased competition that many long-
established American industries now feel from producers in fast-modernizing developing
nations, especially China and Indonesia benefitting from large-scale transfers of advanced
technologies and business methods.
I. INTRO
DU
CTION

The Economic Impact of U.S. Trade Sanctions on Imports of Paper Products • 3
products increased from 1.7 percent to 25.6 percent.
This industry also is characterized by extensive andcomplex trade flows: While the United States producesmore paper products than it consumes, it also accountsfor 8.4 percent of worldwide imports of paper productsand 11.7 percent of worldwide exports of thoseproducts, both measured in dollars. Some of thesetrade flows reflect a division of labor across the globalpaper industry, with advanced economies morefocused on relatively higher value-added productswhich they export while importing relatively lowervalue-added products. However, the extensive globaltrade in these products also reflects the rapidmodernization of paper production in manydeveloping nations, driven by both fast-rising domesticdemand and large foreign direct investments. Theseinvestments enable developing nations to producehigher value-added paper in demand in both their owneconomies and in advanced nations.
The United States remains one of the two dominantproducers in the global pulp and paper products.Measured by tons or volume, American companiesaccount for nearly one-quarter of worldwide pulpproduction, a substantially larger share than any othercountry, and for more than one-fifth of worldwidepaper production. However, a new competitivelandscape in the industry is evident in China’s newly-achieved prominence as the world’s second largestproducer of pulp products and number one producerof paper products. This competition also is evident inthe industry’s coated paper segment. From 2007 to2009, while Americans consumed about $2.56 billionper-year in coated paper products, Americancompanies produced $1.62 billion of those productsannually, for an annual trade deficit in these productsaveraging $0.95 billion. This has occurred even as theoverall U.S. paper industry has more than held its ownin global markets. From 2000 to 2009, while U.S.imports as a share of worldwide imports of all paperproducts declined from 14.5 percent to 8.4 percent,measured in dollars, U.S. exports of paper productsremained steady at about 11.7 percent of worldwideexports of the products.
The major sources of U.S. imports of these productsalso have changed. From 2007 to 2009, while the valueof U.S. imports of coated paper products declined bynearly 35 percent, coated paper products from China
and Indonesian producers displaced products fromproducers in other countries: The share of U.S. importsof coated paper products from China increased from29 percent to more than 41 percent and the share ofthose imports from Indonesia grew from about 4percent to 7 percent, while the share from all othercountries fell from 67 percent to 51.5 percent.
A survey by the International Trade Commission (ITC)of U.S business purchasers of coated paper productsprovides an explanation for these developments. Lowerprices are the major factor behind the increased use ofChinese and Indonesian coated paper products. In fact,price was the only factor which U.S. purchasers judgedU.S. producers to be inferior to Chinese and Indonesianalternatives. Among the other factors that U.S.customers consider important in their purchasingdecisions, Chinese and Indonesian coated paperproducts were found to be comparable to theirAmerican competition in terms of their quality meetingindustry standards, product consistency, and creditprovisions. However, U.S. products beat their Chineseand Indonesian competitors on availability andreliability of supply, and delivery time and terms. Forcertain segments of the U.S. market, therefore, price wasdeterminative given the comparability of U.S. andChinese or Indonesian products on quality, consistencyand credit. For other American customers, U.S.producers’ ability to ensure reliable and availablesupplies of the products and to deliver them on timetrumps the price advantage of their foreign competitors.
The recent U.S. trade deficits in coated paper productsarise from the underlying fact that Americanproduction of these products falls short of Americandemand for them, and Chinese and Indonesianimports have displaced imports from other countries.
American business and workers cannot avoid
the increasing competition from businesses
in fast growing-developing countries that can
combine lower costs and the use of advanced
technologies and business methods provided
through foreign direct investment.

4 • The Economic Impact of U.S. Trade Sanctions on Imports of Paper Products
Nevertheless, the ITC approved antidumping andcountervailing duties of many of these Chinese andIndonesian imports.
These effects reflect, first and foremost, the pricedifferences: In 2009, the U.S. price of American-madecoated paper products was 15 percent higher than theU.S. price for the same products imported from Chinaand 14 percent higher than the U.S. price for theseproducts imported from Indonesia. However, the U.S.price for these products made in America is 4 percentless than the average U.S. price for those productsimported from other countries. In fact, Chinese andIndonesian producers have a price advantage comparedto other non-U.S. producers of 15 percent to 17 percent,which explains why Chinese and Indonesian productshave displaced imports from other countries.
The duties applied by the United States to theseChinese and Indonesian imports will directly raise U.S.domestic prices for these products, without producingnet benefits to U.S. producers and their workers. Tobegin, the duties will indirectly lower the prices ofChinese and Indonesian imports to third countries by,respectively, 7 percent and almost 19 percent, becauselower imports to the United States will increase thesupply of Chinese and coated paper available for exportto other countries. As a result, U.S. exports of theseproducts will become less competitive in those third-country markets.
On balance, Chinese and Indonesian producers willlikely be unaffected, since their lower exports to theUnited States will be offset by higher exports to thirdcountries. Overall, U.S. producers and their workersalso should be largely unaffected: Less competitionfrom Chinese and Indonesian imports at home will beoffset by more intense competition from Chinese and
Indonesian producers in third-country markets. Inaddition, the new duties may trigger retaliatorysanctions by China and Indonesia targeting U.S.exports of these same products to their own markets,as has occurred in other instances of U.S. antidumpingduties. Such retaliation could have significant adverseeffects for U.S. paper companies and workers, sinceChina is the third largest market for U.S. coated paperexports, just behind Mexico and Canada.
These trade dynamics also will entail adverse effectsfor U.S. businesses and consumers, who will end uppaying more for coated paper products. This effect goesbeyond the direct substitution of higher-pricedAmerican-made coated paper for some Chinese andIndonesian imports and higher prices for the Chineseand Indonesian coated-paper products that continueto come into the United States. In addition, weakercompetition from Chinese and Indonesian importshere will allow both U.S. producers and exporters fromother countries to raise their prices in the UnitedStates. Furthermore, some 33,000 U.S. businesses usecoated paper in their own production and employalmost 704,000 American workers. The higher priceswhich these downstream businesses will have to paywill reduce demand for their products andconsequently put downward pressure on theiremployment. And even as the higher domestic pricesand increased market share at home for U.S. producerswill help them and their workers, all or some of thesebenefits will be offset by lower U.S. exports of theseproducts to other countries.
American business and workers cannot avoid theincreasing competition from businesses in fastgrowing-developing countries that can combine lowercosts and the use of advanced technologies and businessmethods provided through foreign direct investment.
U.S. -based printing companies also expressed seriousconcerns about the new duties. According to Steve Rupe,owner of Bethlehem Printing Company in Connecticut,the duties “will jeopardize the competitiveness of U.S.printers as higher costs force many publishers to seekcheaper foreign printing solutions or use other media.”Our analysis of the U.S. pulp and paper market supportsthese concerns and demonstrates that they will notsatisfy the concerns of pulp and paper producers (andtheir workers) about jobs and market share.
According to Steve Rupe, owner of Bethlehem
Printing Company in Connecticut, the duties “will
jeopardize the competitiveness of U.S. printers as
higher costs force many publishers to seek cheaper
foreign printing solutions or use other media.”

The Economic Impact of U.S. Trade Sanctions on Imports of Paper Products • 5
Other U.S. industries such as textiles and steel havefaced the same challenge and adapted in ways whichmay provide guidance for U.S. coated paper businesses.In both of those cases, the industries received decadesof trade protections in various forms which failed topreserve the industry in its pre-competitive form. Bothindustries experienced large job reductions over thelong-term, but most of those losses were driven not byimport competition but by technological modernization.In effect, intense competition from imports mayaccelerate for import-sensitive industries broaderdevelopments affecting of the economy. In particular,many industries, especially in manufacturing, haveincreased their capital investment in new productiontechnologies and IT-based business networks over thelast two decades. As a result, those industries’ totalworkforces often declined while employment of morehighly-skilled workers rose. In addition, theirproduction focused more on higher valued-addedproducts, and their productivity gains increased. Infirms concentrating on higher-end products, overallemployment often increased. Moreover, this pattern isevident not only in textiles and steel, but across much ofU.S. manufacturing. The capacity to innovate, bothtechnologically and organizationally, is the hallmark ofsuccessful companies across the American economy.Those capacities will well serve American paper makersfacing tough competition from producers in lower-costcountries.
The attempts to circumvent these dynamics bywinning anti-dumping and countervailing duties willnot succeed. The artificial reduction in the share of the
U.S. market served by Chinese and Indonesian paperproducers will increase the supplies of their goodsavailable for sale in third-country markets, reducingthe price of their exports and making them morecompetitive there with U.S. producers. Further, ifAsian paper producers continue to upgrade theirtechnologies and organizations while Americanproducers depend upon duties to make their productsmore price-competitive in the United States, theultimate result will be a growing share of the worldmarket for Asian producers and a shrinking share forU.S. companies.
Further, if Asian paper producers continue
to upgrade their technologies and
organizations while American producers
depend upon duties to make their products
more price-competitive in the United States,
the ultimate result will be a growing share
of the world market for Asian producers
and a shrinking share for U.S. companies.

6 • The Economic Impact of U.S. Trade Sanctions on Imports of Paper Products
II. Industry Background
The pulp and paper industries in the United States andthroughout the world exhibit the characteristicfeatures of a mature, commodity business. In suchindustries, developing nations have a comparativeadvantage when international competition focuses onthe production costs of technologically-standardizedproducts, from basic steel to call-center services.2 Thescientific knowledge embodied in the productionprocess is easily transferable, and differences in laborand other costs become more important. In someindustries such as textiles and steel, the production oflower value-added products has shifted significantly tocost-competitive developing countries. The focus ofsuch industries in advanced economies such as theUnited States generally shifts to higher-value-addedproducts, such as designer textiles and specialty steel,or to new production arrangements such as steel mini-mills. While the U.S. paper and pulp industries remainmuch larger players in their global industries than U.S.steel or textile producers, a similar adaptive process isevident in the paper and pulp sectors.
Paper production is capital intensive wherever itoccurs. Since the 1970s, many developing countriesincluding China and Indonesia have undertaken large-scale investments in new paper machinery and largepaper mills with state-of-the-art technologies,supported by government subsidies and the rapidgrowth of domestic demand for their products. Theseinvestments enable many developing nation producersto lower their production costs by taking advantage oftechnologies from advanced countries that increasetheir firms’ productivity, raise their energy efficiency,and make better use of their domestic resources.3 Forexample, Indonesian producers have applied modernmachinery to reduce energy and other costs in pulpproduction. Combined with low labor costs and a largeproduction base, these imported innovations haveenabled Indonesian mills to sharply cut their per-unitvariable costs.4
In addition to technology transfers, rapidly-expandingdemand for paper products in developing countriesalso has supported the development of highly-competitive paper production.5 In fact, increases (and
Table 1Consumption and Production of Paper Products, in Tons, by Region,As Shares of Worldwide Consumption and Production (%), 1970-20096
Note: Paper products include newsprint, paper and paperboard, printing and writing paper, wrapping and packaging paper and board, and household sanitary paper.
Year Africa US Canada Latin Europe Japan China Indonesia Rest of OceaniaAmerica Asia
Consumption
1970 1.30 41.27 2.80 4.37 33.89 10.70 1.97 0.09 2.15 1.471980 1.55 37.30 2.43 6.23 31.93 11.36 3.66 0.25 3.80 1.481990 1.66 32.38 2.28 5.27 30.92 11.61 8.52 0.57 5.47 1.322000 1.62 28.68 2.81 6.18 26.93 9.46 13.60 1.50 7.87 1.342009 1.61 19.40 1.60 7.49 25.39 6.53 23.78 1.49 11.76 0.94
Production
1970 0.71 40.18 6.98 3.13 33.77 11.03 1.70 0.01 1.22 1.271980 1.08 36.57 6.37 5.00 32.51 11.23 3.11 0.13 2.70 1.311990 1.20 31.33 5.39 4.84 31.75 11.55 7.81 0.59 4.36 1.182000 1.35 28.02 5.17 4.73 29.62 9.51 11.79 2.09 6.55 1.182009 1.00 20.54 2.79 5.68 27.78 6.52 23.55 2.03 9.24 0.87
2 Van Dijk (2003).3 Pulp and Paper Industry Strategy Group (2010).4 Ibid.5 Ibid.6 FAO STAT, Forestry, Food and Agricultural Organization of the United Nations.
II. IND
USTRY BACKG
ROU
ND

The Economic Impact of U.S. Trade Sanctions on Imports of Paper Products • 7
decreases) in a nation’s paper production generallytrack increases (and decreases) in its domestic paperconsumption. From 1970 to 2009, Asia’s share ofworldwide paper consumption (excluding Japan)increased almost nine-fold, from 4.2 percent to 37.0percent. (Table 1) In China and Indonesia, the shares ofworldwide consumption grew even faster: China’sshare expanded 12 times from 2.0 percent to 23.8percent, and Indonesia’s share jumped 16.5 times from0.09 percent to 1.5 percent. Over the same period,China’s share of global production of these productsgrew from 1.7 percent to 23.6 percent, measured intons or volume, and Indonesia’s share of globalproduction of those products rose from 0.01 percent to2.013 percent. Similarly, from 1970 to 2009, the U.S.share of worldwide consumption of paper products fellfrom 41.3 percent to 19.4 percent, measured by tons orvolume. Over the same period, its share of worldwideproduction of these goods declined from 40.2 percentto 20.5 percent. These same patterns are in alladvanced economies: The share of worldwide paperconsumption of paper products accounted for by theU.S., Canada, Europe and Japan fell from 88.7 percentto 52.9 percent; and their share of worldwide paperproduction declined from 92.0 percent to 57.5 percentover the same period. While there is substantial worldtrade in these products, these relationships suggestthat nations expand their capacity to produce paperproducts to meet rising domestic demand for thoseproducts.
The same patterns are generally evident for pulp andpulp products. As the advanced countries’ share ofworldwide consumption of pulp and pulp products hasdeclined, and the share claimed by developing nationshas risen, the advanced countries’ share of worldwideproduction of pulp and pulp products has declinedwith it, and the share met by developing nations hasexpanded. The data for this relationship over theperiod 1970-2009, by nation and region, is provided inAppendix. Table A-1. Moreover, these developmentspose no economic threat to the United States. Weshould expect U.S. paper producers to increasinglyfocus on higher value-added specialty paper and pulpproducts, as developing nations expand their lower-cost production of more basic pulp and paperproducts, especially those countries with large naturalfiber resources. Moreover, the United States continuesto be the world’s largest producer of pulp and pulpproducts, and the second largest producer of paper and
paper products. For further discussion of thesedynamics, see Appendix, Table A-2 and Table A-3, andaccompanying discussion.
The worldwide industry also is broadly characterizedby certain divisions of labor and production, withdeveloping nations tending to produce lower-end pulpand paper while advanced nations tend to producehigher-end goods. As a result, while each regionaccounts for generally comparable shares of globalconsumption and production of all pulp and paperproducts by weight, the country and regional shares ofglobal imports and exports of each class exhibit adifferent pattern. In 2009, for example, the U.S.,Canada, and Europe exported considerably more paperproducts than they imported (measured in tons) —especially the United States and Canada — while China,the rest of non-Japan Asia, Latin America, and Africaall imported much greater shares of these productsthan they exported. (See Appendix, Table A-4)
More subtle shifts in the U.S. and worldwide paperindustry are evident when we measure the industry’strade by value rather than volume. Here, we see thateven as the production of paper products in developingcountries has expanded sharply, and the U.S. share ofthe value of all worldwide imports of paper productsfell by nearly half from 1970 to 2009, the U.S. share ofthe total value of worldwide exports of paper productsdeclined much less, by 22 percent. (Table 6) Among thedeveloping nations, their share of the total value ofboth worldwide imports and exports of paper productsrose even faster. While those levels remain less thanthe United States, the expansion and modernization ofpaper producers, especially in China and Indonesia,could enable them to challenge U.S. and otheradvanced country producers as worldwide exporters inthe future.
...developing nations have a comparative
advantage when international competition
focuses on the production costs of technologically-
standardized products, from basic steel to
call-center services.

8 • The Economic Impact of U.S. Trade Sanctions on Imports of Paper Products
As Table 2, shows, from 1970 to 2009, the U.S. share ofworldwide imports of paper products, measured byvalue, fell from 16.1 percent to 8.4 percent while itsshare of worldwide exports of those products fell from15.0 percent to 11.7 percent. Over the same period,China and Indonesia’s combined share of worldwideimports of paper products rose from 2.6 percent to 6.0percent, and their combined share of worldwideexports of those products rose from 0.43 percent to 6.4percent.
These same developments are also evident in pulp andpulp products. For those data and discussion, seeAppendix, Table 5-A, and accompanying analysis.
The Rise of Anti-Dumping Duties
Even as the underlying growth of the Chinese andIndonesian coated paper industries has followed thesame pattern seen in other countries — with domesticproduction expanding with domestic consumption,and segmenting into domestic and export markets —
the recent inroads of Chinese and Indonesian paperimports in the American market have been met bydemands for protection by U.S. domestic producers. Asnoted earlier, the anti-dumping cases before the ITCwere brought by three large U.S. paper producers andthe United Steel Workers union, representing coated-paper workers in unionized facilities. This should notbe surprising: A considerable body of research byeconomists and political scientists has established thatpolitically well-organized industries and labor unionsoften succeed in winning such protection.
One recent study, for example, found that politically-active industries, as measured by their lobbying effortsand political contributions, were more likely to secureanti-dumping duty relief, and higher rates for thoseduties, than industries that are less active politically.8
The impact of such political activism is also evident atthe congressional level: Economic researchers havealso found that industries located in the districts orstates of members who serve on the House and Senateappropriations subcommittees with control over theITC’s budget fare better at the ITC than industries
7 FAO STAT, Forestry, Food and Agricultural Organization of the United Nations.8 Evans and Sherlud (2008); also, see Grossman and Helpman (1994).
Table 2Imports and Exports of Paper Products, by Value, by Nation and Region,As Shares of Worldwide Imports and Exports of These Products (%), 1970-20097
Note: Paper products include newsprint, paper and paperboard, printing and writing paper, wrapping and packaging paper and board, and household sanitary paper.
Year Africa US Canada Latin Europe Japan China Indonesia Rest of OceaniaAmerica Asia
Consumption
1970 5.06 16.14 1.22 8.08 57.73 0.75 1.993 0.58 6.20 2.251980 3.81 12.29 1.13 8.33 58.74 2.85 3.622 0.49 6.57 2.171990 3.48 13.77 2.13 3.31 60.81 2.27 5.216 0.42 6.84 1.752000 1.87 14.47 3.55 6.98 50.10 2.24 9.489 0.38 9.03 1.892009 3.73 8.40 2.69 9.77 52.54 1.75 5.402 0.60 13.35 1.75
Production
1970 0.28 14.98 20.73 0.53 58.98 3.21 0.43 0.00 0.28 0.591980 0.40 12.86 14.68 1.35 64.81 3.60 0.66 0.00 0.83 0.821990 0.16 9.56 11.92 1.51 67.75 3.96 2.28 0.24 2.03 0.582000 0.43 11.84 11.67 1.46 61.97 2.90 3.74 2.01 3.22 0.752009 0.91 11.68 6.30 3.86 63.46 2.18 3.82 2.59 4.23 0.97

The Economic Impact of U.S. Trade Sanctions on Imports of Paper Products • 9
located elsewhere, especially when those industriescontributed to the political action committees (PACs)of those appropriating members.9
The use of anti-dumping duties by U.S. industries wasrelatively rare until the late 1970s. With the conclusionof the Tokyo Round in 1979, however, the United Statesand other countries counter-balanced the Round’sreductions in tariffs and quotas by broadening thescope of their anti-dumping statutes. Under the newrules, the number of anti-dumping cases worldwidedoubled from the 1970s to the 1980s.10 In the UnitedStates, at least, it did not help much: Economists foundthat U.S. industries receiving anti-dumping protectionin the 1980s continued to significantly underperformother American manufacturing industries.11
Nevertheless, Congress continued to expand the scopeof the anti-dumping statutes. In 1984, for example,Congress directed the ITC to measure dumping-related injuries on the basis of the total combinedimports of a particular good from all countries, insteadof using a country-by-country basis. Researchers laterestimated that this one change increased affirmativedeterminations of anti-dumping injury by 50 percent,for cases decided from 1985 to 1988.12 Studies alsofound that the use of anti-dumping duties by theUnited States increased again with the establishmentof the World Trade Organization, in response to thenew WTO strict restrictions on other forms ofprotection.13
Adverse economic conditions also have drivenincreases in anti-dumping complaints by politically-connected industries. Researchers from the World
Bank, for example, noted a significant increase in anti-dumping during by the United States and theEuropean Union as the financial crisis and subsequentdeep recession unfolded in 2008 and 2009.14 Othercountries also increased many of their tariffs. Still, theexpanded use of antidumping duties by the UnitedStates in 2009 is estimated to have reduced U.S. tradein that year by $24 billion, or more than half of thetotal reduction in world trade traced to increasedprotectionism in 2008 and 2009.15
9 Hansen and Prusa (1996, 1997).10 Ibid.11 Hansen and Prusa (1993).12 Hansen and Prusa (1996).13 Blonigern and Prusa (NBER).14 Kee, Neagu and Nicitya (2010). 15 Ibid.
Adverse economic conditions also have
driven increases in anti-dumping complaints
by politically-connected industries.
10 • The Economic Impact of U.S. Trade Sanctions on Imports of Paper Products
III. Trade Issues
Recent trading dynamics in the U.S. paper industrywould not lead most objective observers to expect astrong push by politically well-connected companiesfor new anti-dumping duties on foreign paper imports.Measured by value, the U.S. shares of worldwideimports of both paper and pulp products have declinedsteadily since 1970, falling particularly sharply since2000. By contrast, the U.S. share of worldwide exportsof pulp products has remained steady at about 20percent, and the U.S. share of worldwide exports ofpaper products has declined only modestly. (Table 2and Table 5-A, Appendix) Nevertheless, the U.S. paperindustry pressed the ITC for trade sanctions againstChinese and Indonesian exporters; and theDepartment of Commerce issued antidumping andcountervailing duty orders in November 2010 coveringcertain imports of coated paper and paperboardproducts from China and Indonesia. The antidumpingduties were applied on the basis of the ITC’s findingthat the Chinese and Indonesian imports were sold inthe United States for less than “normal value,” and thecountervailing duties were applied to on the basis ofthe ITC’s view that China and Indonesia hadsubsidized their coated-paper exports to the UnitedStates and thereby injured U.S. producers.
The focus of the November 2010 rulings, coated paperand paperboard, are produced from bleached chemi-thermo-mechanical pulp. This type of coated paper isoften used for multi-colored graphics in books,
16 The DOC orders specifically defined certain coated paper and paperboard in the investigation are those in sheets suitable for high qualityprint graphics using sheet-fed presses; coated on one or both sides with kaolin, calcium carbonate, titanium dioxide, and/or other inorgan-ic substances; with or without binder; having a General Electric (GE) brightness level of 80 or higher; weighing not more than 340 gramsper square meter; whether gloss grade, satin grade, matte grade, dull grade, or any other grade of finish; whether or not surface-colored,surface-decorated, printed, embossed, or perforated; and, irrespective of dimension. Notices, Federal Register, Vol. 75, No. 221, November17, 2010.
17 International Paper: $624 million; Smurfit, $276 million; Domtar, $172 million, Verso Paper, $142 million; New Page, $120 million;Abitibi Bowater, $118 million; Mead Westvaco, $112 million; Weyerhauser, $107 million. See Gateway Packaging Company (2010).
catalogues, magazines, envelopes, labels and wraps,greeting cards, and other commercial printing thatrequire high-quality print graphics. Coated paperboardis heavier, thicker and more rigid than coated paper,and is often used to make folding cartons.16 The“Harmonized Tariff System” (HTS) codes for theproducts subject to the recent orders and theantidumping and countervailing duty rates applied toparticular Chinese and Indonesian exporters andproducers can be found in the Appendix, Table 1-A.
The debate over the anti-dumping and countervailingduties applied to Chinese and Indonesian coated paperproducts also has included discussions of variousspecial subsidies available to the paper industries in thethree countries. Particular attention has focused on theAlternative Fuel Mixture Credit, popularly referred toas the “black liquor tax credit,” used by U.S. papercompanies in 2009 and 2010. “Black liquor” is a by-product of paper production which the industry hasreused for fuel since the 1930s. In 2007, however,Congress extended the use of the existing tax credit tonon-mobile uses of alternative fuels. In 2009, eight ofthe U.S. paper companies who began using the credit,claimed $1.67 billion in tax credits for use of blackliquor fuel in the first half of the year.17 While Congresssubsequently withdrew the use of the credit for blackliquor, its value to the paper industry in 2009 and 2010while the ITC was considering the anti-dumping caseactually exceeded the value of all U.S. coated paperproduction in that year. (See Table 3)
From the other side, U.S. paper producers have longclaimed that China and Indonesia broadly subsidizetheir coated-paper industries. Claims of suchsubsidization provided much of the basis for theindustry’s filings for anti-dumping and countervailingduty relief. To be sure, the ITC as well as the EuropeanUnion have found that such subsidization exists,especially for Chinese paper producers. However, theevidence provided has been largely indirect, with theindustry noting that “after controlling for the poorquality of domestically sourced raw materials, the price
Economists found that U.S. industries receiving
anti-dumping protection in the 1980s continued
to significantly underperform other American
manufacturing industries.
III. TRAD
E ISSUES

The Economic Impact of U.S. Trade Sanctions on Imports of Paper Products • 11
differentials [between Chinese and U.S. paper products]are difficult to explain without subsidies.”18 This study,however, focuses not on the nature or extent of suchsubsidies in China, Indonesia or the United States.Rather, we evaluate the economic effects of the anti-dumping and countervailing duty decisions for the U.S.paper industry, its workers and American consumers.
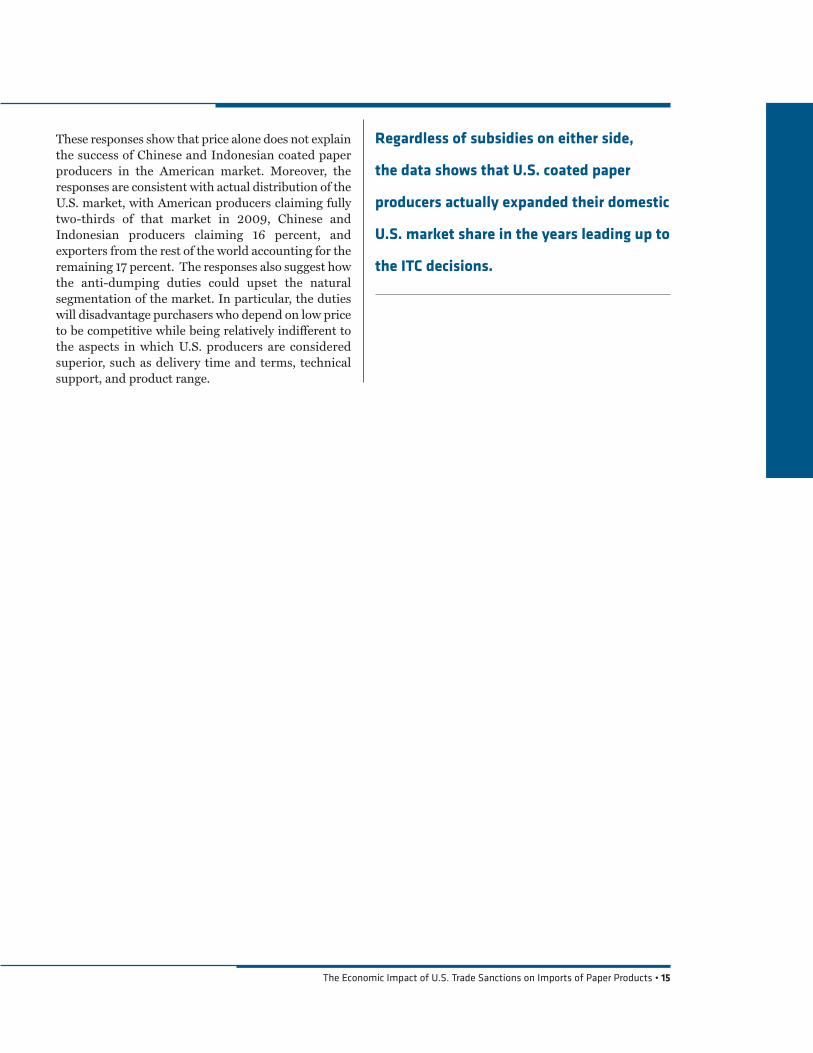
The Coated Paper Market in the United States
Regardless of subsidies on either side, the data showsthat U.S. coated paper producers actually expandedtheir domestic U.S. market share in the years leadingup to the ITC decisions. Table 3, below, summarizes theU.S. market for these coated paper products. From theeconomic downturn of 2007 to 2009, U.S. totaldemand for these products declined by 21.3 percent asmeasured in tons and by 23.6 percent measured in
dollars (including a unit price decline of about 3percent). Yet, U.S. domestic production of coated paperproducts, which is largely concentrated in elevencompanies,19 fell less sharply: U.S. domestic productionfell by only 15 percent as measured by quantity and by16.5 percent as measured by value or revenues.Furthermore, the U.S. market share of Americanproducers increased from about 61 percent in 2007 toabout 66 percent in 2009, even though U.S. domesticproducers charged more than their Chinese andIndonesian counterparts.20 In fact, the unit productioncost of these products declined by 1.8 percent for U.S.producers compared to a 5.5 percent drop for foreignproducers. Finally, all told, U.S. coated paper importsfell by 31 percent over this period, as measured byquantity, and by 34.7 percent as measured by value.
While overall imports of coated paper products
Table 3 The U.S. Market for Coated Paper Products, 2007-200921
2007 2008 2009 Change
Domestic Consumption
Quantity in tons 2,862,837 2,642,844 2,254,299 -21.3%Value $2,820,192,000 $2,712,759,000 $2,153,830,000 -23.6%Unit Value, per-ton $985.10 $1,026.45 $955.43 -3.0%
Domestic Production
Quantity in tons 1,737,222 1,648,972 1,477,233 -15.0%Share of US Consumption 60.7% 62.4% 65.5% + 7.9%
Value $1,719,332,000 $1,694,553,000 $1,435,314,000 -16.5%Share of US Consumption 61.0% 62.5% 66.6% + 9.2%
Unit Value, per-ton $989.70 $1,027.64 $971.62 -1.8%
Total Imports
Quantity in tons 1,125,615 993,872 777,066 -31.0%Share of US Consumption 39.3% 37.6% 34.5% -12.2%
Value $1,100,860,000 $1,018,206,000 $718,516,000 -34.7%Share of US Consumption 39.0% 37.5% 33.4% -14.4%
Unit Value, per-ton $978.01 $1,024.48 $924.65 -5.5%
18 Haley (2010). 19 Appleton, Cascades Boxboard Group, Clearwater Paper Co., International Paper, Georgia-Pacific, MeadWestvaco Corp., Mohawk Fine
Papers, Inc., NewPage, Rock-Tenn Co., Sappi, and Smart Papers, Inc.20 The market share of domestic producers for U.S. consumption increased from 60.7 percent to 65.5 percent when measured by quantity,
and from 61.0 to 66.6 percent when measured in value. 21 U.S. International Trade Commission (2010).

12 • The Economic Impact of U.S. Trade Sanctions on Imports of Paper Products
declined over the past three years, imports from Chinaand Indonesia increased by 3.8 percent, as measuredby quantity, growing from 398.3 tons in 2007 to 413.6tons in 2009. By 2009, Chinese and Indonesianimports of coated paper products accounted for abouthalf of the quantity and value of all coated paperimports into the United States. These importsaccounted for 18.3 percent of U.S. consumption ofthese products, measured by quantity, and 16.2 percent
measured by value. However, since the unit cost ofthese imports from China and Indonesia fell by 7.3percent, from $913 per-ton in 2007 to $846 per-ton in2009, their total value also declined, by 3.8 percentfrom $363.6 million in 2007 to $350 million in 2009.(Table 4, below)
While industry and government analysts often lumptogether Chinese and Indonesian paper producers, the
Table 4U.S. Imports of Certain Coated Paper ProductsFrom China, Indonesia, and Other Nations, 2007-200922
2007 2008 2009 Change
Domestic Consumption
Quantity (tons) 1,125,615 993,872 777,066 -31.0%Value ($) $1,100,860,000 $1,018,206,000 $718,516,000 -34.7%Unit value ($) $978.01 $1,024.48 $924.65 -5.5%
China
Quantity (tons) 345,786 329,307 352,555 2.0%Share of US Imports 30.8% 33.2% 45.2% 46.9%Share of US Consumption 12.1% 12.5% 15.6% 28.9%
Value ($) $318,066,000 $319,306,000 $297,527,000 -6.5%Share of US Imports 29.0% 31.5% 41.3% 42.6%Share of US Consumption 11.3% 11.8% 13.8% 22.1%
Unit value ($) $919.83 $969.63 $843.92 -8.3%
Indonesia
Quantity (tons) 52,541 52,938 61,039 16.2%Share of US imports 4.6% 5.3% 7.8% 70.9%Share of US Consumption 1.8% 2.0% 2.7% 50.0%
Value ($) $45,543,000 $48,765,000 $52,384,000 15.0%Share of US Imports 4.1% 4.8% 7.2% 75.1%Share of US Consumption 1.6% 1.8% 2.4% 50.0%Unit value ($) $866.81 $921.17 $858.21 -1.0%
Others
Quantity (tons) 727,288 611,627 363,472 -50.0%Share of US Imports 64.6% 61.4% 47.0% -27.3%Share of US Consumption 25.4% 23.1% 16.2% -36.2%
Value ($) $737,251,000 $650,135,000 $368,605,000 -50.0%Share of US Imports 66.9%% 63.7% 51.5% -23.1%Share of US Consumption 26.1% 23.9% 17.2% -34.1%Unit value ($) $1,013.70 $1,062.96 $1,014.12 0.0%
22 U.S. International Trade Commission (2010).
The Economic Impact of U.S. Trade Sanctions on Imports of Paper Products • 13
two countries’ U.S. market presence is actually quitedifferent. From 2007 to 2009, U.S. imports of coatedpaper products from China increased by 2 percent, asmeasured in quantity, from 345,786 tons in 2007 to352,555 tons in 2009. However, their share of all U.S.imports of those products increased much moresharply, from 30.8 percent in 2007 to 45.2 percent in2009. These imports accounted for 15.6 percent of U.S.consumption of those products in 2009, up from 12.1percent in 2007, even as their value fell from $318million in 2007 to $297.5 million in 2009. By contrast,Indonesia’s exports of coated paper products to theUnited States are less than one-fifth the size of China’s:In 2009, imports of these coated paper products fromIndonesia totaled 61,039 tons at a value of $52.4million, amounting to about 8 percent of all U.S.imports of these products and less than 3 percent ofU.S. consumption of those products. WithinIndonesia’s modest U.S. market niche, these exports tothe U.S. increased by 16.2 percent over this period, andtheir value rose by 15 percent. (Table 4) Therefore, theprice of Indonesian coated paper exports to the UnitedStates fell little in recent years, compared to the 8percent price decline of comparable Chinese exports tothe United States.
Unsurprisingly, given that the U.S. industry’s domesticmarket share rose in this period, the increases in theimports from China (in quantity) and Indonesia (inboth quantity and value) were more than offset by a 50percent declines in both the quantity and value ofcoated paper imports from other countries. By 2009,the quantity of coated paper imports from all othercountries roughly equaled the quantity of theseimports from China alone; and their value roughlyequaled the value of these imports from China andIndonesia.
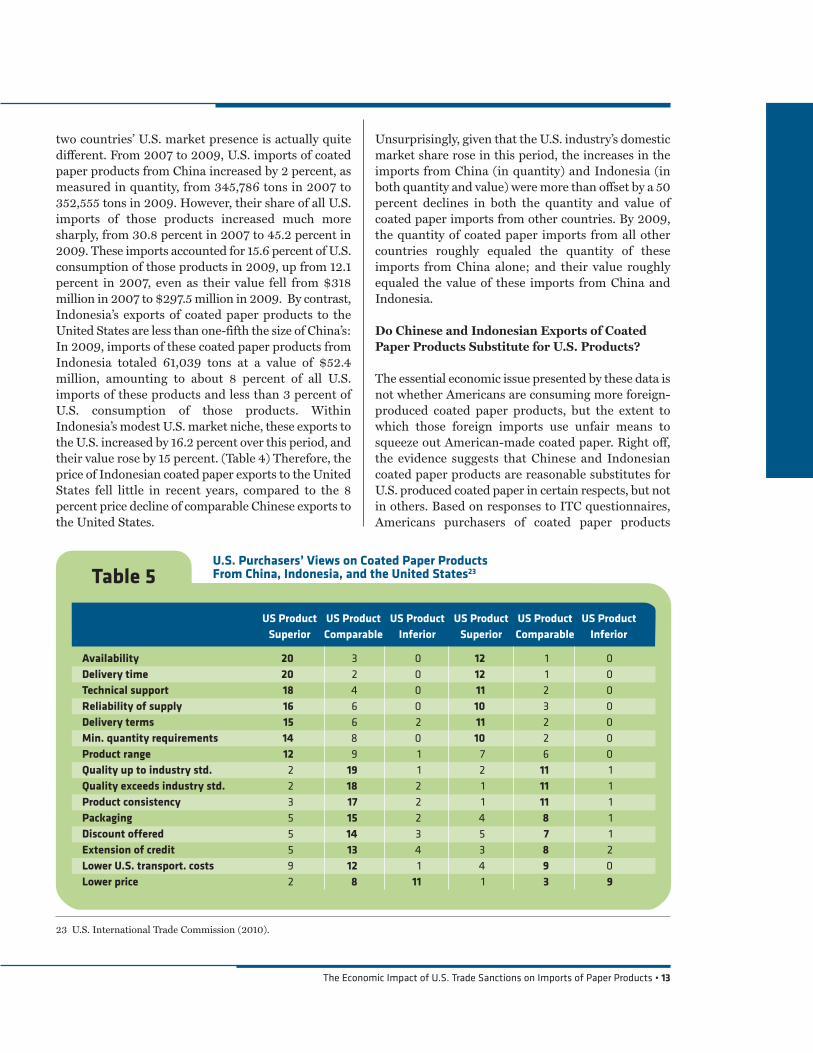
Do Chinese and Indonesian Exports of CoatedPaper Products Substitute for U.S. Products?
The essential economic issue presented by these data isnot whether Americans are consuming more foreign-produced coated paper products, but the extent towhich those foreign imports use unfair means tosqueeze out American-made coated paper. Right off,the evidence suggests that Chinese and Indonesiancoated paper products are reasonable substitutes forU.S. produced coated paper in certain respects, but notin others. Based on responses to ITC questionnaires,Americans purchasers of coated paper products
US Product US Product US Product US Product US Product US ProductSuperior Comparable Inferior Superior Comparable Inferior
Availability 20 3 0 12 1 0Delivery time 20 2 0 12 1 0Technical support 18 4 0 11 2 0Reliability of supply 16 6 0 10 3 0Delivery terms 15 6 2 11 2 0Min. quantity requirements 14 8 0 10 2 0Product range 12 9 1 7 6 0Quality up to industry std. 2 19 1 2 11 1Quality exceeds industry std. 2 18 2 1 11 1Product consistency 3 17 2 1 11 1Packaging 5 15 2 4 8 1Discount offered 5 14 3 5 7 1Extension of credit 5 13 4 3 8 2Lower U.S. transport. costs 9 12 1 4 9 0Lower price 2 8 11 1 3 9
Table 5U.S. Purchasers’ Views on Coated Paper ProductsFrom China, Indonesia, and the United States23
23 U.S. International Trade Commission (2010).

14 • The Economic Impact of U.S. Trade Sanctions on Imports of Paper Products
reported that they find U.S. producers superior toChinese and Indonesian imports in terms of the rangeand availability of product, reliability of supply,minimum quantity requirements, delivery time anddelivery terms, and technical support. The respondentsalso find that Chinese and Indonesian coated paperproducts are comparable to U.S. coated paper productsin terms of their quality, product consistency,packaging, discounts, extensions of credit, and eventransportation costs. On only one ground — price —do U.S. purchasers of coated paper products findChinese and Indonesian producers superior to theirAmerican counterparts.
Table 5 summarizes these responses, with the numbersin each category showing the number of respondents.For example, 20 of 23 purchasers said that U.S. coatedpaper is superior to Chinese products in terms ofavailability, while 3 purchasers believed that the U.S.and Chinese products are comparable in this respect.The majority response in each case is in bold.
These responses suggest that U.S., Chinese andIndonesian paper producers meet different marketneeds. American producers are preferred by customers
who have to count on their coated paper provider for areliable supply of the product they want, a range ofcoated-paper products that will be available quickly,and delivered on time at favorable terms withminimum quantity requirements. Other customersprefer the foreign-produced products, because they areless expensive and still up to industry standards interms of quality, consistency, packaging; andcomparable to U.S. products in terms of discounts,credit provisions and transportation costs. Therespondents to the ITC survey identified as the threemost important factors, the quality, price, andavailability of the products. On these three factors, U.S.coated paper producers are superior in terms ofavailability, comparable in quality to Chinese andIndonesian producers, and inferior in price. Therespondents also identified five other factors whichthey considered important to their purchasingdecisions, if not the most important – reliability ofsupply, delivery time, delivery terms, productconsistency, and the availability of credit. They judgedU.S. producers superior with respect to three of theseadditional factors, and comparable to Chinese andIndonesian producers on the other two. (Table 6)
Table 6Survey of Factors in Purchasing Decisions of Coated Paper Products,U.S. Producers Compared to Chinese and Indonesian Producers
U.S. Producers,Important Factor in
Compared to ChinesePurchasing Decision
and Indonesian Producers
Availability Superior VeryDelivery time Superior VeryTechnical support Superior SomewhatReliability of supply Superior VeryDelivery terms Superior VeryMin. quantity requirements Superior SomewhatProduct range Superior SomewhatQuality meets industry standard Comparable VeryQuality exceeds industry standard Comparable SomewhatProduct consistency Comparable VeryPackaging Comparable SomewhatDiscount offered Comparable SomewhatExtension of credit Comparable VeryLower U.S. transport. costs Comparable SomewhatLower price Inferior Very
The Economic Impact of U.S. Trade Sanctions on Imports of Paper Products • 15
These responses show that price alone does not explainthe success of Chinese and Indonesian coated paperproducers in the American market. Moreover, theresponses are consistent with actual distribution of theU.S. market, with American producers claiming fullytwo-thirds of that market in 2009, Chinese andIndonesian producers claiming 16 percent, andexporters from the rest of the world accounting for theremaining 17 percent. The responses also suggest howthe anti-dumping duties could upset the naturalsegmentation of the market. In particular, the dutieswill disadvantage purchasers who depend on low priceto be competitive while being relatively indifferent tothe aspects in which U.S. producers are consideredsuperior, such as delivery time and terms, technicalsupport, and product range.
Regardless of subsidies on either side,
the data shows that U.S. coated paper
producers actually expanded their domestic
U.S. market share in the years leading up to
the ITC decisions.

16 • The Economic Impact of U.S. Trade Sanctions on Imports of Paper Products
IV. The Economic Effects of theAntidumping and Countervailing Duties
As the United States struggles to recover fully from the2007-2008 financial crisis and subsequent deeprecession, pressures to protect domestic industriesfrom import competition have increased. The numbersof antidumping investigations and subsequentantidumping duties have both surged since 2007. TheUnited States is not alone in this respect: TheEuropean Union has been a leading user ofantidumping laws, and the approach also has becomemore common in developing nations in recent years.According to the World Bank, a majority ofantidumping investigations and duties since 2007 haveoccurred in developing countries.24
Despite increasing use of these duties, economists havelong found that they rarely benefit the countriesimposing them. Theoretical and empirical analysishave shown, for example, that when country A (suchas the United States) imposes antidumping and othertrade sanctions against country B (such as China or
Indonesia), the results usually include not only theexpected decline in exports from Country B to CountryA (“trade destruction”), but also offsetting increases inexports from the rest of the world to Country A (“tradecreation”), and increases in exports from Country B tothe rest of the world (“trade deflection”). (Figure 1,below) This political re-routing of trade flows has otherconsequences. When the United States imposesantidumping and countervailing duties, it also raisesdomestic prices in several ways, including the directeffect of the duties and the substitution of the reducedsupply of goods from the targeted country by higher-priced goods produced in the U.S. and other countries.The higher prices may even result in increased imports,as measured in dollars, from the targeted country tothe United States.
The Price Effects of Antidumping andCountervailing Duties
These dynamics suggest that over time, theantidumping duties applied to Indonesian and Chinesecoated paper imports will impose additional costs on
24 Gamberoni and Newfarmer (2009).
Figure 1 Trade Effects of Antidumping Duties from the U.S. against China and Indonesia
CHINA
INDONESIA
USA
OTHERCOUNTRIES
Trade Destruction:Exports to FallPrice to Rise
Trade Deflection:Exports to Rise
Price to Fall
Trade Creation:Exports to Rise
Price to FallIV. TH
E ECON
OM
IC EFFECTS
The Economic Impact of U.S. Trade Sanctions on Imports of Paper Products • 17
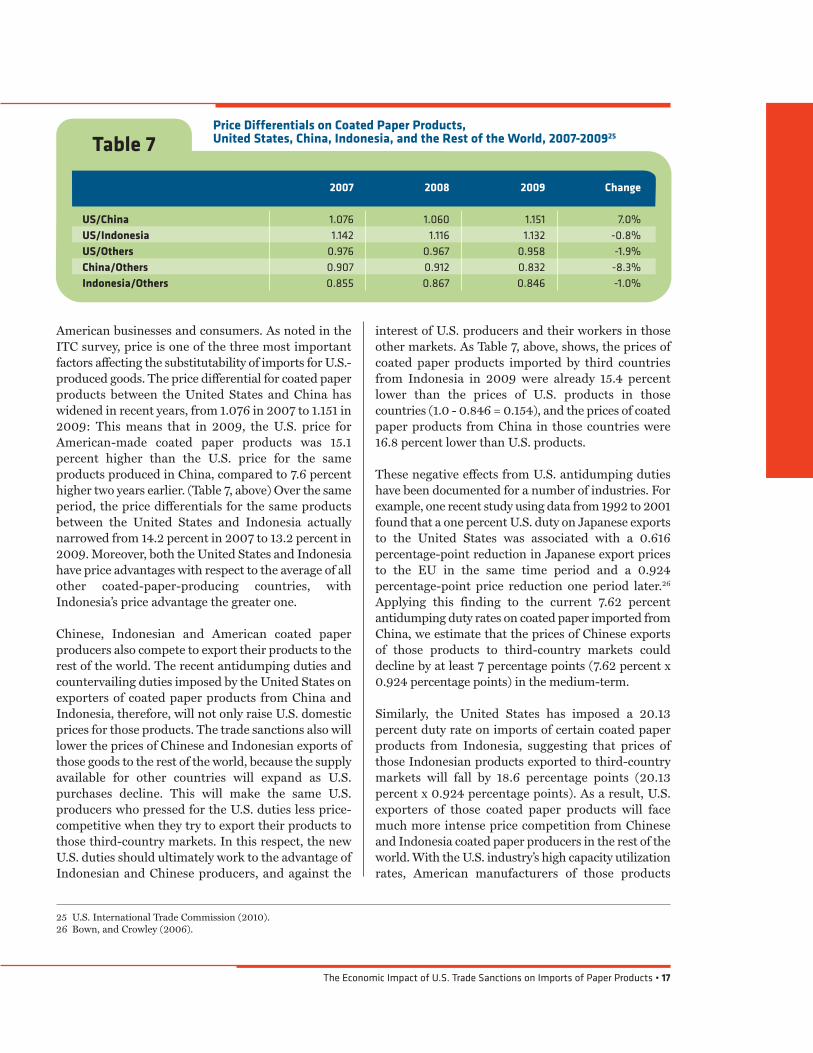
American businesses and consumers. As noted in theITC survey, price is one of the three most importantfactors affecting the substitutability of imports for U.S.-produced goods. The price differential for coated paperproducts between the United States and China haswidened in recent years, from 1.076 in 2007 to 1.151 in2009: This means that in 2009, the U.S. price forAmerican-made coated paper products was 15.1percent higher than the U.S. price for the sameproducts produced in China, compared to 7.6 percenthigher two years earlier. (Table 7, above) Over the sameperiod, the price differentials for the same productsbetween the United States and Indonesia actuallynarrowed from 14.2 percent in 2007 to 13.2 percent in2009. Moreover, both the United States and Indonesiahave price advantages with respect to the average of allother coated-paper-producing countries, withIndonesia’s price advantage the greater one.
Chinese, Indonesian and American coated paperproducers also compete to export their products to therest of the world. The recent antidumping duties andcountervailing duties imposed by the United States onexporters of coated paper products from China andIndonesia, therefore, will not only raise U.S. domesticprices for those products. The trade sanctions also willlower the prices of Chinese and Indonesian exports ofthose goods to the rest of the world, because the supplyavailable for other countries will expand as U.S.purchases decline. This will make the same U.S.producers who pressed for the U.S. duties less price-competitive when they try to export their products tothose third-country markets. In this respect, the newU.S. duties should ultimately work to the advantage ofIndonesian and Chinese producers, and against the
interest of U.S. producers and their workers in thoseother markets. As Table 7, above, shows, the prices ofcoated paper products imported by third countriesfrom Indonesia in 2009 were already 15.4 percentlower than the prices of U.S. products in thosecountries (1.0 - 0.846 = 0.154), and the prices of coatedpaper products from China in those countries were16.8 percent lower than U.S. products.
These negative effects from U.S. antidumping dutieshave been documented for a number of industries. Forexample, one recent study using data from 1992 to 2001found that a one percent U.S. duty on Japanese exportsto the United States was associated with a 0.616percentage-point reduction in Japanese export pricesto the EU in the same time period and a 0.924percentage-point price reduction one period later.26
Applying this finding to the current 7.62 percentantidumping duty rates on coated paper imported fromChina, we estimate that the prices of Chinese exportsof those products to third-country markets coulddecline by at least 7 percentage points (7.62 percent x0.924 percentage points) in the medium-term.
Similarly, the United States has imposed a 20.13percent duty rate on imports of certain coated paperproducts from Indonesia, suggesting that prices ofthose Indonesian products exported to third-countrymarkets will fall by 18.6 percentage points (20.13percent x 0.924 percentage points). As a result, U.S.exporters of those coated paper products will facemuch more intense price competition from Chineseand Indonesia coated paper producers in the rest of theworld. With the U.S. industry’s high capacity utilizationrates, American manufacturers of those products
25 U.S. International Trade Commission (2010).26 Bown, and Crowley (2006).
Table 7Price Differentials on Coated Paper Products, United States, China, Indonesia, and the Rest of the World, 2007-200925
2007 2008 2009 Change
US/China 1.076 1.060 1.151 7.0%US/Indonesia 1.142 1.116 1.132 -0.8%US/Others 0.976 0.967 0.958 -1.9%China/Others 0.907 0.912 0.832 -8.3%Indonesia/Others 0.855 0.867 0.846 -1.0%

18 • The Economic Impact of U.S. Trade Sanctions on Imports of Paper Products
almost certainly will see their exports slow and have todivert more sales to the U.S. market, which may wellentail cutting their prices here.
The Impact of Antidumping and CountervailingDuties on U.S. Exports
These adverse effects are not negligible. One study of350 U.S. antidumping orders from 1981 to 1996 foundthat every one percent increase in prices fromantidumping duties reduced the volume of the importsby 0.9 percent — imports which then were diverted tothird country markets.27 The study cited earlier ofJapanese exports from 1992 to 2001 used data onnearly 4,800 Japanese product exports to 37 countriesto estimate the trade effects from U.S. antidumpingduties and other trade sanctions. Over that recentperiod, the United States imposed antidumping dutieson 157 distinct products from Japan. The authors foundstrong evidence of “trade deflection” arising from theU.S. measures against Japan: Every one percent U.S.
duty rate on Japanese exports to the United States wasassociated with a 0.322 percentage-point increase inthe volume of Japanese exports to the EU in the sameperiod and an additional 0.507 percentage-pointincrease in those volumes two periods later.28 A thirdstudy used a panel of U.S. industry-level imports andU.S. antidumping measures over the period from 1980to 1994 to also examine import substitutions from atargeted country to other markets. This analysis foundthat not only did exports from the targeted country tothe United States decline, and exports from thetargeted country to other countries increase, but alsothat other countries exported more of the sameproducts to the United States.29
At the current antidumping duty rates of 7.62 percentand 135.84 percent on imports of certain coated paperproducts from China, we should expect Chineseproducers to increase their exports to other countriesby between 3.87 percentage points (7.62 percent dutyrate x 0.507 percentage points) and 63.6 percentage
27 Nye (2006); see also, Krupp and Skeath (2002). 28 Bown and Crowley (2007). The magnitude of this trade deflection varied across the third-country markets and across the products, with
larger effects on non-steel products than on steel products.29 Prusa, (2001); Prusa (1997).30 United Nations Commodity Trade Statistics Database.
Figure 2The Distribution of Chinese Exports of Coated Paper and Paperboard Coated withKaolin or Other Inorganic Substances, 2005–200930
United States (19.1%)
Hong Kong (12.8%)
Japan (9.3%)
India (4.5%)
Australia (4.2%)
Korea (3.9%)
Turkey (3.6%)
Taipei (3.0%)
Thailand (2.8%)
UK (2.8%)
Others (33.9%)
The Economic Impact of U.S. Trade Sanctions on Imports of Paper Products • 19
points in the near-term (135.84 percent duty rate x0.507 percentage points). (Figure 2)
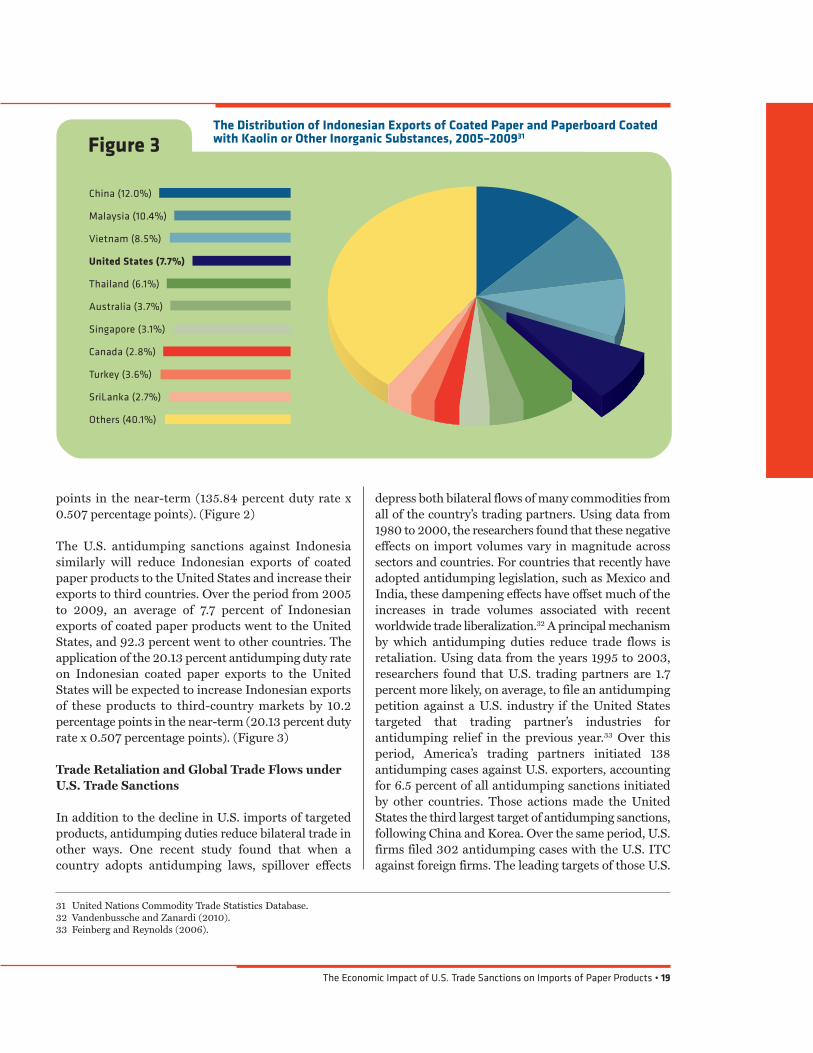
The U.S. antidumping sanctions against Indonesiasimilarly will reduce Indonesian exports of coatedpaper products to the United States and increase theirexports to third countries. Over the period from 2005to 2009, an average of 7.7 percent of Indonesianexports of coated paper products went to the UnitedStates, and 92.3 percent went to other countries. Theapplication of the 20.13 percent antidumping duty rateon Indonesian coated paper exports to the UnitedStates will be expected to increase Indonesian exportsof these products to third-country markets by 10.2percentage points in the near-term (20.13 percent dutyrate x 0.507 percentage points). (Figure 3)
Trade Retaliation and Global Trade Flows underU.S. Trade Sanctions
In addition to the decline in U.S. imports of targetedproducts, antidumping duties reduce bilateral trade inother ways. One recent study found that when acountry adopts antidumping laws, spillover effects
depress both bilateral flows of many commodities fromall of the country’s trading partners. Using data from1980 to 2000, the researchers found that these negativeeffects on import volumes vary in magnitude acrosssectors and countries. For countries that recently haveadopted antidumping legislation, such as Mexico andIndia, these dampening effects have offset much of theincreases in trade volumes associated with recentworldwide trade liberalization.32 A principal mechanismby which antidumping duties reduce trade flows isretaliation. Using data from the years 1995 to 2003,researchers found that U.S. trading partners are 1.7percent more likely, on average, to file an antidumpingpetition against a U.S. industry if the United Statestargeted that trading partner’s industries forantidumping relief in the previous year.33 Over thisperiod, America’s trading partners initiated 138antidumping cases against U.S. exporters, accountingfor 6.5 percent of all antidumping sanctions initiatedby other countries. Those actions made the UnitedStates the third largest target of antidumping sanctions,following China and Korea. Over the same period, U.S.firms filed 302 antidumping cases with the U.S. ITCagainst foreign firms. The leading targets of those U.S.
Figure 3The Distribution of Indonesian Exports of Coated Paper and Paperboard Coatedwith Kaolin or Other Inorganic Substances, 2005–200931
China (12.0%)
Malaysia (10.4%)
Vietnam (8.5%)
United States (7.7%)
Thailand (6.1%)
Australia (3.7%)
Singapore (3.1%)
Canada (2.8%)
Turkey (3.6%)
SriLanka (2.7%)
Others (40.1%)
31 United Nations Commodity Trade Statistics Database.32 Vandenbussche and Zanardi (2010).33 Feinberg and Reynolds (2006).

20 • The Economic Impact of U.S. Trade Sanctions on Imports of Paper Products
cases were China (17 percent), Japan and the EU-15 (10percent each), and Korea (7 percent); while the leadingsources of antidumping action against U.S. exporterswere Mexico (17 percent), India (14 percent), Brazil (13percent), Canada (9 percent) and China (8 percent).34
The recent antidumping and countervailing dutiesimposed on Chinese exports of coated paper productsto the United States increase the risk of trade retaliationthat would adversely affect U.S. exports to China. From2005 to 2009, U.S. coated paper exports averagednearly $1.5 billion goods per-year. (Table 8, below)China is the third largest customer for these U.S.exports, just behind Mexico and Canada, purchasingsome $117 million of these products per-year from U.S.producers, nearly 8 percent of all U.S. exports of thosegoods. China also has been a fast-growing market forthese U.S. exports: From 2005 to 2009, Americanexports of coated paper products to China increased33.1 percent, compared to gains of 19.3 percent in allexports by the U.S. coated paper industry. Theapplication of antidumping and countervailing dutieson Chinese producers could reduce future U.S. exportsof coated paper products to China.
Additional Adverse Effects of Trade Sanctions onU.S. National Welfare
Antidumping and countervailing duties are widelyconsidered a weak mechanism for protecting domesticproducers and promoting national welfare. As notedearlier, the imposition of these duties raises domesticprices of both the foreign products subject to thesanctions and their domestically-produced competition.These higher prices benefit U.S. producers competingwith the sanctioned imports, but they harm both directU.S. consumers and downstream producers who use thesanctioned products as intermediate inputs, along withtheir consumers. Further, the higher prices reducedemand for the sanctioned product, and thecombination of higher prices and lower demand reducesproduction and employment, especially by downstreamproducers. Eventually, these dynamics can reducedemand for those producers which the sanctions aredesigned to help — the domestic producers competingwith the sanctioned foreign exporters. In 2009, U.S.industries that use coated paper employed 703,704workers in 32,730 establishments, of which nearly 80percent were small businesses with less than 20employees. (Table 9) The value of the shipments bythese downstream industries totaled $132.2 billion,including more than $75 billion in value added.
Table 8 The Ten Largest Markets for U.S. Coated Paper Exports, 2005-200935
Average Annual Exports, Change,2005-2009 ($ millions) Share of Total 2005-2009
Canada 454.1 30.9% -8.6%Mexico 220.9 15.0% 174.9%China 116.6 7.9% 33.1%Japan 89.9 6.1% 57.0%Netherlands 71.7 4.9% -1.6%Germany 57.9 3.9% 85.3%Australia 39.6 2.7% -33.9%Korea 39.3 2.7% 59.4%France 36.0 2.5% -38.6%United Kingdom 33.3 2.3% 19.2%Total $1,468.1 100.0% 19.3%
34 Ibid.35 U.S. International Trade Commission (2010).

The Economic Impact of U.S. Trade Sanctions on Imports of Paper Products • 21
For these and other reasons, U.S. antidumping andcountervailing duties are generally seen by economistsas a highly-costly way to address low-cost importcompetition, as measured by the net effect on the nation’seconomic welfare.37 For example, the U.S. antidumpingregime often creates a perverse incentive for foreignexporters to increase their U.S. prices. Researchers haveestimated that 306 antidumping and countervailingduty orders in place in 1993, affecting $332.5 billion ofU.S. imports in that year, produced a net cost to U.S.producers and consumers of some $4 billion.38
Antidumping and countervailing duties also may affectU.S. exports to producers whose U.S. imports aresubject to the sanctions. In 2009, for example, U.S.companies exported nearly $135 million inintermediate products related to the production ofcoated paper in China and Indonesia, accounting formore than 10 percent of all U.S. exports of theseproducts to all countries. (Table 10) These U.S. exportswere equivalent to 38.5 percent of the $350 million inU.S. imports of coated paper products from China andIndonesia. The sanctions against these imports put at
risk U.S. exports of the intermediate products used toproduce them.
36 U.S. Census Bureau.37 Gallaway, Blonigen and Flynn (1999).38 Ibid.
Table 9 Downstream Industries Using Coated Paper Products, 200936
Employees Shipments Value-Added($ 000) ($ 000)
Setup paperboard box manufacturing 3,557 533,245 248,709Fiber can, tube, drum & similar products mfg 7,600 2,327,229 939,592Non-folding sanitary food container mfg 11,001 3,653,173 1,662,061Coated and laminated packaging paper mfg 4,937 1,493,624 583,475Coated and laminated paper mfg 34,097 14,260,011 6,974,108Coated paper bag and pouch mfg 3,183 784,805 348,752Folding paperboard box mfg 43,132 11,315,208 5,000,648Commercial lithographic printing 314,819 53,451,955 32,272,327Commercial gravure printing 17,131 4,074,069 2,090,602Commercial flexographic printing 34,362 7,303,050 3,923,506Commercial screen printing 70,429 8,627,726 5,176,316Quick printing 34,040 3,245,993 2,268,548Digital printing 42,009 6,437,410 4,528,326Manifold business forms printing 22,591 5,419,597 3,280,830TOTAL 703,704 $132,196,344 $75,207,100

22 • The Economic Impact of U.S. Trade Sanctions on Imports of Paper Products
39 United Nations Commodity Trade Statistics Database.40 U.S. Census Bureau.
Table 10U.S. Exports to China and Indonesia of Intermediate Products Related to the Production of Coated Paper in China and Indonesia, 2009 ($ thousands)39
U.S. Exports Share of All Total U.S. to China and U.S. Exports of Exports of
Indonesia These Products These Products
Kaolin, and other kaolinic clays $65,622.9 10.5% $626,326.0Sodium hydroxide (caustic soda) solid 57.5 0.5% 12,051.0Anthraquinone 55.8 2.8% 1,992.0Finishing agents used in the paper industry 24,883.9 11.6% 214,746.0Dryers for wood, paper pulp, paper and paperboard 1,630.7 14.3% 11,409.0Machinery for producing pulp 20,618.1 97.7% 21,099.0Machinery for producing paper or paperboard 2,500.0 13.4% 18,645.0Machinery for finishing paper or paperboard 1,366.9 4.8% 28,672.0Machine parts for producing pulp 5,450.9 4.9% 111,470.0Cutting machines for pulp, paper and paperboard 2,919.4 5.5% 53,386.0Machines for molding paper 287.5 1.8% 16,376.0Machinery for coated paper production 4,491.1 13.5% 33,328.0Machine parts for coated paper production 4,322.9 3.3% 129,647.0Planing/milling or molding machinery 556.9 1.3% 43,140.0TOTAL $134,764.4 10.2% $1,322,287.0
Table 11 Downstream Industries Using Coated Paper Products, 200940
Shipments Value-AddedEmployees ($ 000) ($ 000)
Setup paperboard box manufacturing 3,557 $533,245 $248,709Fiber can, tube, drum & similar products mfg 7,600 2,327,229 939,592Non-folding sanitary food container mfg 11,001 3,653,173 1,662,061Coated and laminated packaging paper mfg 4,937 1,493,624 583,475Coated and laminated paper mfg 34,097 14,260,011 6,974,108Coated paper bag and pouch mfg 3,183 784,805 348,752Folding paperboard box mfg 43,132 11,315,208 5,000,648Commercial lithographic printing 314,819 53,451,955 32,272,327Commercial gravure printing 17,131 4,074,069 2,090,602Commercial flexographic printing 34,362 7,303,050 3,923,506Commercial screen printing 70,429 8,627,726 5,176,316Quick printing 34,040 3,245,993 2,268,548Digital printing 42,009 6,437,410 4,528,326Manifold business forms printing 22,591 5,419,597 3,280,830TOTAL 703,704 $132,196,344 $75,207,100

V. L
ESSO
NS
FOR
THE
PAPE
R IN
DU
STRY
The Economic Impact of U.S. Trade Sanctions on Imports of Paper Products • 23
V. Lessons for the U.S. Paper Industry: Case Studies of Other U.S. Industries Facing Lower-Cost Foreign Competition
Textiles
Other American industries facing strong competitivepressures from lower-cost foreign producers, includingtextiles and steel, have adapted by focusing on highervalue-added products. Textiles achieved this shift onlyvery gradually while relying on extensive tradeprotections which prolonged the process and imposedlarge costs on American consumers. American steelproducers refocused on higher value-added specialtysteels and production processes with somewhat lessgovernment protection and consequently loweradditional costs to U.S. consumers and businesses. Inneither case could trade protections preserve the partsof the two industries that competed most directly withmuch lower-cost foreign producers.
For more than a half-century, the U.S. governmentmaintained trade protection for domestic textile andgarment producers. Under the most recent iteration ofthe Multifibre Agreement (MFA), in place from 1974to 1994, the government applied national quotas toU.S. imports of textiles and garments.41 According toone credible analysis, these arrangements increasedthe cost of textiles and garments paid by Americanconsumers by more than $20 billion per-year.42 TheMFA was superseded in 1995 by the WTO’s Agreement
on Textiles and Clothing (ATC), which graduallyreduced and finally eliminated quotas on WTO-member nations.43 However, when the ATC expired inJanuary 2005, the United States and other textile-importing nations were free to apply antidumping andcountervailing duties. In fact, China’s Accession to theWTO in 2005 included provisions establishing quotason 10 classes of Chinese textile and apparel imports tothe United States, and many of those quotas remain inplace today.
Throughout this half-century of protection, U.S.employment in the textile sector has declined steadilyfrom its peak level of some 1.3 million jobs in 1948,beginning before large imports created strong industrydemands for protection.44 From 1970 to 1988, forexample, industry employment fell by 25 percent asimports’ share of total U.S. consumption of textilesincreased by only 4.6 percent, to 6.8 percent.45 In short,import competition was not the main cause of theindustry’s contracting employment — technology was.The application of new technologies and businessmethods to the industry produced productivity gainsaveraging 3.9 percent per year from 1949 to 1991, ormore than 50 percent faster than all U.S.manufacturing. Naturally, these productivity gains alsoput downward pressure on the industry’semployment.46 Figure 4, shows that these trends havecontinued since 1991.
Economic researchers have found that in addition tothese strong productivity gains, the industry has alsoseen substantial new business creation and new plantsbeing built, as well as the more often-reported firm and
41 Sun and Ke (2008); WTO, “Textiles Monitoring Body (TMB): The Agreement on Textiles and Clothing.”; US Customs and BorderProtection. “China Textile MOU.”
42 Stokes, Bruce (2007) “Protectionism and Politics.” eJournal USA: Economic Perspectives, 7-10. http://guangzhou.usembassy-china.org.cn/uploads/images/80vI9pgJ9Vnho-mJQGUPcQ/ijee0107.pdf.
43 Martin (2007).44 Murray (1995).45 Ibid.46 Ibid.
In short, import competition was not the main
cause of the industry’s contracting employment —
technology was.
Much like textiles, U.S. steel companies
also gained considerable trade protection
which could preserve significant American
production of the basic steel products also
produced in lower-cost countries.

24 • The Economic Impact of U.S. Trade Sanctions on Imports of Paper Products
Lower-cost foreign producers focus on more basictextile and garment products such T-shirts and sheets;and over the same period, this area produced a largeU.S. trade deficit. Overall, foreign producers’ totalshare of textiles and textile products has remainedabout one-third. Since U.S. exports of basic textiles areless than one-fifth of U.S. imports of the sameproducts, the overall textile industry has run tradedeficits of $10 billion or more every year since 2005.
Steel
Much like textiles, U.S. steel companies also gainedconsiderable trade protection which could preservesignificant American production of the basic steelproducts also produced in lower-cost countries. TheUnited States was an important or even dominantplayer in world steel markets from the 1920s throughthe 1950s, and first became a net steel importer onlyin 1959. A decade later, a series of trade protectionswere in place; but they could not stop a deterioratingtrade position in basic steel. (Figure 2)
plant closings.48 Most of the new establishments andfacilities represent the industry’s adaptation to its newcompetition, producing high-end products that do notcompete with the low value-added imports, includingnew products such as Polartec and Gor-Tex.49 As a result,some U.S. textile companies have expanded productionand employment. Using high-speed automatedequipment, they produce highly-engineered andspecialized fabrics and products that cannot be easilycopied by low-cost foreign producers. For example, GlenRaven mills shifted its focus to specialized fabricsdesigned to stand up without fading to prolongedexposure to sunshine or bleach, and are now used widelyfor awnings, convertible automobile roofs, and patiofurniture.50 Research has shown that the United Statesnow has a significant competitive advantage inproducing such sophisticated industrial textiles.51
The result is that U.S. exports of such advanced textilesexpanded by 52 percent from 1997 to 2007 whileimports increased only 18 percent, producing tradesurpluses in the textile mill subsector exceeding $1billion per year, every year since 2006. (Table 12)
47 Bureau of Labor Statistics. 48 Levinsohn and Petropoulos (2002).49 Ibid.50 Malone (2010).51 Chi et al (2005).
Figure 4 U.S. Textile Employment and Productivity Trends, 1990–200847
Employment Textile
Productivity Textile
Employment Textile Product
Productivity Textile Product
600
500
400
300
200
100
0
In thousands 1990 = 100250
200
150
100
50
0
1990 1992 1994 1996 1998 2000 2002 2004 2006 2008

The Economic Impact of U.S. Trade Sanctions on Imports of Paper Products • 25
From 1969 to 1974, the United States applied effectivequotas to steel imports under Voluntary RestraintAgreements (VRAs) with Japan and the European
Community (EC). These VRAs were succeeded in 1977by a Trigger Price Mechanism (TPM) covering all steelimports, under which imports could not cost less than
Table 12 U.S. Textile Trade, 1997-2009 ($ million)52
Textile Mill Textile Mill Products TotalYear Net Net Net
Exports Imports Exports Exports Imports Exports Exports Imports Exports
1997 5,587 6,343 -756 2,197 4,780 -2,583 7,784 11,123 -3,3391998 5,672 6,473 -801 2,218 5,599 -3,381 7,890 12,072 4,1821999 6,055 6,443 -388 2211 6,350 -4,139 8,266 12,793 -4,5272000 7,284 7,042 242 2,333 7,347 -5,014 9,617 14,389 -4,7722001 7,365 6,336 1,029 2,083 7,580 -5,497 9,448 13,916 -4,4682002 7,642 6,778 864 1,982 8,643 -6,661 9,624 15,421 -5,7972003 7,805 6,791 1,014 2,004 9,857 -7,853 9,809 16,648 -6,8392004 8,626 7,387 1,239 2,225 11,707 -9,482 10,851 19,094 -8,2432005 8,756 7,453 1,303 2,546 13,508 -10,962 11,302 20,961 -9,6592006 8,781 7,361 1,420 2,784 14,680 -11,896 11,565 22,041 -10,4762007 8,479 7,456 1,023 2,872 15,412 -12,540 11,351 22,868 -11,5172008 8,471 6,943 1,528 2,873 14,985 -12,112 11,344 21,928 -10,5842009 6,682 5,287 1,395 2,547 13,229 -10,682 9,229 18,516 -9,287
Figure 5 U.S. Steel Trade, 1920–200853
40,000
30,000
20,000
10,000
0
–10,000
–20,000
–30,000
–40,000
Thousand metric tons
1920 1925 1930 1935 1940 1945 1950 1955 1960 1965 1975 1980 1985 1990 1995 2000 20051970 2010
Exports Imports Trade Balance
52 U.S. Census Bureau.53 U.S. Geological Survey.

26 • The Economic Impact of U.S. Trade Sanctions on Imports of Paper Products
54 Blonigen et al. (2007).55 Ibid.56 Ibid. The exception was the VRAs of the late-1980s, which briefly allowed U.S, producers to price their products above their marginal cost.
That capacity, however, imposed disproportionate costs on American consumers: The ITC found in 2002 that these protections cost U.S.consumers $600 million per-year while boosting earnings by U.S. steel makers by less than $70 million. Noreen and DeFilippo (2003).Similarly, another study found that the announcement of new steel protections was followed by both large declines in the stocks of domes-tic steel-using companies and gains for the stocks of domestic steel makers. See Liebman and Tomlin (2007).
57 Blonigen et al. (2007).58 Ikenson (2002).59 Madar (2009).60 Ibid.61 Ibid.
Japanese production costs, plus an 8 percent profit.When the TPM expired in 1981, domestic producersfiled hundreds of antidumping and countervailing dutycases, first against EC producers and later againststeelmakers in developing countries. These filingsslowed only when comprehensive VRAs werereinstated from 1984 to 1992. Case filings increasedagain when those VRAs expired; and by one measure,steel accounted for at least one-third of allantidumping and countervailing duty cases filed from1980 to 2000.54 Finally, in 2002, new tariffs wereapplied briefly to steel imports and then rolled back inearly 2004, when the WTO held that they violated itsrules and standards.55
Most studies have found that these steel protectionsprovided little if any benefit to domestic steel makers.56
Instead, the strong competition from lower value-added steel imports, along with technological advancesin the production of higher value-added specialtysteels, provided the basis for the industry’s adjustment.Steel making today is divided into two classes: Theintegrated mills which used to dominate the industry,producing raw steel and steel products by smeltingiron ore in basic oxygen furnaces; and the new “mini-mills” that use electric arc furnaces to melt downrecycled steel scrap, usually to produce specialtysteels.57 The old integrated mills are highly energy-intensive, use iron ore and coal that are costly to ship,and require large economies of scale. By contrast, themini-mills require less capital investment because theplants are smaller; their electric furnaces consume only10 percent of the energy of a oxygen furnace; they usescrap steel which is less expensive to ship than iron ore;and they can be located close to their markets,reducing transportation expenses. The U.S. mini-millsalso need fewer workers to produce a ton of steel. Alltold, the labor productivity of the mini-mills is seventimes that of the integrated mills.58
The first mini-mills appeared in the 1960s, and from1970 to 2008, their share of total U.S. steel productionrose from 15 percent to 57 percent. Moreover, the mini-mills’ gains in industry production were far greaterthan the increases in the share of U.S. steelconsumption accounted for by imports, which merelygrew from 14 percent in 1970 to 28 percent in 2008.The most recent data on U.S. steel imports reflects thedomestic industry’s shift away from lower-endproducts produced by large integrated mills.59 Today,U.S. steel producers focus on higher value-addedproducts such as flat products, particularly specialtysheet steels;60 and in 2008, these flat productsaccounted for four of the top five U.S. steel productsand 63 percent of total U.S. steel production.Moreover, the largest import categories, semi-finishedsteel and hot-rolled sheets and coil, are used toproduce higher-end products by U.S. mini-mills.61
These case studies of the U.S. textile and steel industriesprovide important lessons for the American coatedpaper and other industries. Most economies havecertain comparative advantages, and industries prosperwhen they make effective use of those advantages. Assteel, textiles and many other industries demonstrate,America’s greatest comparative advantages lie in itscapacity to innovate, in its low barriers to the formationof new firms which produce or adopt innovations, andin its large and discriminating market. In the face ofcompetition from producers in countries whosecomparative advantages lie mainly in their lower factorcosts, trade protection for U.S. producers hasconsistently failed to preserve the market shares andjobs of those trying to compete directly with lower-costforeign producers. Instead, such protection prolongsthe transition to a more competitive position based onAmerica’s comparative advantages.

VI.
CON
CLU
STIO
N
The Economic Impact of U.S. Trade Sanctions on Imports of Paper Products • 27
VI. Conclusion
Globalization has changed and accelerated the processof modernization in many developing nations. For thelast generation, one of the hallmarks of globalizationhas been large-scale foreign direct investments whichtransfer advanced technologies, business methods andentire business organizations to developing economies.These transfers integrate the subsidiaries or affiliatesin developing economies into the global networks ofthe multinational companies responsible for the FDI.They also can produce powerful spillover effects thataccelerate the broader modernization of theseeconomies. Moreover, in recent years, this process hasproduced a new stage of globalization, in whichentrepreneurs in developing countries create domesticcompetitors for the foreign-owned, FDI-basedsubsidiaries that began this process. In most cases,these domestic competitors compete with thesubsidiaries or affiliates in their domestic market, tomeet growing demand created by the prosperity whichthe FDI process triggers.Paper production in China and Indonesia are examplesof this process. The two countries’ share of worldwideconsumption of these products, measured in tons orvolume, increased from just over 2 percent in 1970 tomore than 25 percent in 2009; and over the sameperiod, their share of worldwide production of theseproducts rose from just under 2 percent to nearly 26percent. The same relationship is also evident in manyadvanced economies: U.S. consumption of paperproducts fell over this period from more than 41percent of worldwide consumption to just over 19percent while U.S. production of paper products alsofell from just over 40 percent to 20.5 percent.
At the same time, the world’s major producers andconsumers of paper products, in both developing andadvanced economies, engage in large volumes of tradein these products. As the domestic industry takes holdin a developing economy, this trade is broadlycharacterized by the expected division of labor inwhich producers in advanced countries export highervalue-added paper products and producers indeveloping countries export lower value-addedproducts. However, globalization accelerates themodernization of these industries, and in recent yearsproducers in place such as China and Indonesia alsoare producing and exporting higher value-addedproducts. And in the American market for those
products, China and Indonesia have substantiallydisplaced imports from other countries.
The United States has run significant trade deficits inpaper products in recent years, and in response toapplications by U.S. producers, the ITC recentlyapplied sanctions to Chinese and Indonesia coatedpaper producers. We do not analyze here the merits ofthese cases. However, it is clear that a U.S. trade deficitin these products is inescapable regardless of thepractices of foreign producers, because U.S. productionof these products falls short of U.S. consumption ordemand for them. Further, while the ITC found thatlower prices are an important factor in decisions byU.S. businesses to import Chinese and Indonesiancoated-paper products, the ITC also reported thatthose foreign producers are considered comparable totheir American competitors on quality, productconsistency, and the provision of credit. U.S. producerswere found superior on the availability and reliabilityof supplies and on delivery time and terms. Moreover,Chinese and Indonesian coated-paper products haveabout the same price advantage over other foreignproducers in the U.S. market as they have over U.S.producers. Given that the quality of these productsmeets U.S. standards, this explains why Chinese andIndonesian coated-paper imports have largelydisplaced imports from other countries.
These Asian and American producers of coated papercompete not only in the United States, but in marketsaround the world. As a result, the duties applied tothese U.S. imports will likely impose significant costson U.S. businesses and consumers withoutstrengthening the U.S. industry. By reducing U.S.imports, the duties will increase the supply availablefor export to third-country markets, reducing the priceof Chinese and Indonesian products in those countries
The United States cannot avoid increasing
competition from developing economies that
combine lower costs with the use of advanced
technologies and business methods provided
through foreign direct investment.

28 • The Economic Impact of U.S. Trade Sanctions on Imports of Paper Products
where they also compete with U.S. exports. In effect,the sanctions trade a piece of the share of the U.S.market for a piece of the share of foreign markets. Thesanctions also may trigger retaliation which couldharm U.S. coated-paper companies and their workers,as China is the third largest foreign market for U.S.coated-paper products. Further, the sanctions willincrease not only the price of Chinese and Indonesiancoated-paper products in the United States; theweaker competition from these foreign producers alsowill allow U.S. producers and exporters from othercountries to raise their prices in the United States.Those higher prices may dampen demand andconsequently put pressure on the jobs of U.S. coatedpaper workers. In short, the policy is unlikely toproduce net benefits for American workers andbusinesses, including the U.S. coated paper industry.
The United States cannot avoid increasing competitionfrom developing economies that combine lower costswith the use of advanced technologies and businessmethods provided through foreign direct investment.Moreover, the use of sanctions will not strengthen theU.S. industry, especially if it focuses on standardproducts which can now be produced almost anywherein the world. Based on the record of other industriesthat faced these issues in earlier decades, includingtextiles and steel, trade protection also cannot stoplarge workforce reductions in these industries. Muchof these job losses reflect a natural response to lower-cost foreign competition, as U.S producers increasetheir productivity and margins by focusing new capitalinvestments on the production of high-end productsbeyond the capacity of domestic producers indeveloping economies. This strategy combininginvestment and innovation provides the best responseto the increasing competition from coated paperproducers in developing countries.

APP
END
IX –
IND
UST
RY B
ACKG
ROU
ND
The Economic Impact of U.S. Trade Sanctions on Imports of Paper Products • 29
Appendix – Industry Background
As noted in the text, there is a general relationshipbetween a nation’s global market share of pulpproduction and pulp consumption.
62 FAO STAT, Forestry, Food and Agricultural Organization of the United Nations.Note: Paper products include newsprint, paper and paperboard, printing and writing paper, wrapping and packaging paper and board,and household sanitary paper.
Table A-1Consumption and Production of Pulp Products, in Tons, By Nation or Region,As Shares of Worldwide Consumption and Production (%), 1970-200962
Year Africa US Canada Latin Europe Japan China Indonesia Rest of OceaniaAmerica Asia
Consumption
1970 0.71 35.63 8.88 2.95 35.49 10.52 3.11 0.02 1.43 1.261980 1.03 33.36 7.73 4.66 33.91 11.03 4.01 0.18 2.85 1.241990 1.16 29.81 6.66 4.42 31.93 11.35 8.80 0.63 4.22 1.022000 1.04 27.95 5.68 4.96 28.90 9.78 11.80 2.09 6.69 1.122009 1.11 18.75 3.59 6.62 25.55 7.78 24.68 1.88 8.80 1.23
Production
1970 0.91 35.58 12.50 2.47 33.53 9.76 3.07 0.01 1.08 1.091980 1.17 34.47 11.36 4.60 31.58 9.74 3.69 0.10 1.96 1.331990 1.27 33.02 9.58 4.30 29.57 9.97 8.01 0.38 2.68 1.212000 1.28 30.98 8.62 5.67 27.94 8.98 9.24 1.49 4.46 1.332009 1.22 24.38 5.54 8.33 27.76 8.18 15.01 1.74 6.11 1.72
The symmetry between production and consumptionis even closer in the paper segment of the industry.Among the world’s top 20 producers and consumers of
paper and paper products in 2009, 12 nations havegenerally comparable shares of worldwide productionand consumption, measured in tons or volume. They

30 • The Economic Impact of U.S. Trade Sanctions on Imports of Paper Products
63 FAO STAT, Forestry, Food and Agricultural Organization of the United Nations.
Table A-2 Global Pulp Industry Production and Consumption, By Volume and Nation, 200963
Top 20 Producers Top 20 ProducersMillion Tons Share Million Tons Share
U.S. 90.10 24.38% China 90.85 24.68%China 55.45 15.01% U.S. 69.03 18.75%Japan 30.24 8.18% Japan 28.64 7.78%Canada 20.47 5.54% Germany 21.31 5.79%Germany 18.40 4.98% Canada 13.21 3.59%Brazil 17.59 4.76% Korea 11.88 3.23%Sweden 13.46 3.64% Sweden 11.08 3.01%Finland 9.74 2.64% Brazil 10.73 2.92%Russia 9.05 2.45% Finland 8.51 2.31%U.K. 8.43 2.28% Spain 7.74 2.10%Korea 8.37 2.26% Mexico 7.50 2.04%France 8.02 2.17% India 7.40 2.01%Spain 7.90 2.14% France 7.28 1.98%Indonesia 6.45 1.74% Russia 7.18 1.95%Chile 5.41 1.46% Indonesia 6.93 1.88%Italy 5.34 1.45% Italy 6.87 1.87%India 5.15 1.395 U.K. 5.47 1.49%Australia 4.61 1.25% Thailand 4.62 1.25%Mexico 3.39 0.92% Austria 4.44 1.21%Austria 3.37 0.91% Australia 3.81 1.03%World 369.50 100.00% World 368.08 100.00%
include both advanced and developing nations,including the world’s four largest economies — China,the United States, Japan, and Germany — as well as
Korea, Brazil, France, Italy, Indonesia, Russia, Spain,and Turkey.

The Economic Impact of U.S. Trade Sanctions on Imports of Paper Products • 31
Fast-growing demand for paper goods in emergingmarkets has led both domestic and foreign producersto search for cheaper sources of fiber in thosemarkets.65 China lacks the natural resources for large-scale paper production and depends on imports ofwood pulp, recovered paper, and wood chips. Otherdeveloping nation producers including Indonesia,Vietnam, Russia, Brazil, and Chile have become largeexporters of wood raw materials to China and othernations, as well as producers of their own pulp andpaper products.
While labor plays a modest role in the total costs ofpulp and paper production, the lower labor costs indeveloping economies still have an impact on theircompetitiveness. For example, waste collection for
paper production based on recycling is more labor-intensive than production using non-recycled inputs.66
Approximately 61 percent of all global exports ofrecycled paper go to China, where they account formore than half of the total production costs of thecountry’s paper industry.67
Imports and exports of paper products, by volume ortons, displays a different pattern than the closerelationship noted earlier between domesticproduction and domestic consumption of theseproducts. Generally, advanced nations export morethan they import, and developing nations import morethan they export. This largely reflects certaincomparative legacy advantages in advanced productionstill retained by advanced economies.
Table A-3 Global Pulp Industry Production and Consumption, By Volume and Nation, 200964
Top 20 Producers Top 20 ProducersMillion Tons Share Million Tons Share
China 142.6 23.5% China 144.0 23.8%U.S. 124.4 20.5% U.S. 117.5 19.4%Japan 39.5 6.5% Japan 39.5 6.5%Germany 35.0 5.8% Germany 30.8 5.1%Sweden 17.6 2.9% France 16.2 2.7%Finland 17.5 2.9% Italy 16.1 2.7%Canada 16.9 2.8% U.K. 16.0 2.6%Korea 16.5 2.7% Korea 14.7 2.4%Brazil 16.0 2.6% Mexico 14.7 2.45%France 14.9 2.5% Brazil 14.0 2.3%Italy 14.1 2.3% India 13.0 2.1%Indonesia 12.3 2.0% Spain 12.8 2.1%Russia 12.3 2.0% Turkey 11.2 1.9%India 11.6 1.9% Russia 10.3 1.7%Spain 11.2 1.8% Canada 9.7 1.6%Mexico 8.9 1.5% Indonesia 9.0 1.5%Turkey 8.4 1.4% Poland 7.0 1.2%U.K. 7.8 1.35% Thailand 6.5 1.1%Thailand 7.0 1.2% Netherlands 5.6 0.9%Austria 6.7 1.1% Finland 5.5 0.9%World 605.4 100.0% World 605.5 100.0%
64 FAO STAT, Forestry, Food and Agricultural Organization of the United Nations. 65 Honnold (2009).66 Berglund and S derholm (2003).67 Haley (2010).

32 • The Economic Impact of U.S. Trade Sanctions on Imports of Paper Products
U.S. imports of pulp and pulp products as a share ofworldwide imports, measured by value, fell from 17.5percent in 1970 to 6.3 percent in 2009; but U.S.exports of pulp and pulp products as a share ofworldwide exports actually increased, from 19.1percent to 20.0 percent. The same dynamic did notoccur in Canada, where pulp exports accounted for12.2 percent of worldwide pulp exports in 2009compared to 28.9 percent in 1970, nor in Europewhere its share of worldwide pulp exports fell from
47.9 percent to 33.6 percent. These differences mayreflect the more successful application of advancedtechnologies to pulp production in the United Statesthan in Canada or Europe. More important, whileexports of pulp and pulp products rose sharply in somedeveloping nations, especially Latin America andIndonesia, China has become the world’s largestimporter of pulp and pulp products. This reflectsChina’s need to import these products as inputs for itspaper production.
68 FAO STAT, Forestry, Food and Agricultural Organization of the United Nations.
Table A-4Imports and Exports of Paper Products, in Tons, by Nation or Region,As Shares of Worldwide Imports and Exports of These Products (%), 1970-200968
Year Africa US Canada Latin Europe Japan China Indonesia Rest of OceaniaAmerica Asia
Imports
1970 3.91 20.74 0.96 8.25 55.12 0.45 2.12 0.48 6.01 1.981980 2.96 18.41 0.83 7.55 54.88 2.46 3.46 0.69 6.69 2.071990 2.36 17.38 1.86 4.26 56.16 2.34 6.62 0.24 7.20 1.572000 1.79 14.10 4.77 7.07 48.92 1.60 11.24 0.29 8.54 1.682009 3.50 8.50 2.77 11.07 50.54 1.42 5.44 0.46 14.56 1.74
Exports
1970 0.22 14.37 26.85 0.49 54.03 2.61 0.46 0.00 0.23 0.741980 0.45 15.78 21.38 1.06 56.41 2.35 0.62 0.01 0.78 1.151990 0.19 12.45 16.56 2.20 60.07 2.07 3.25 0.32 1.97 0.922000 0.79 11.59 13.44 1.75 58.88 1.75 4.57 2.45 3.66 1.122009 1.09 12.97 7.42 3.96 59.95 1.38 4.52 2.61 4.63 1.45

The Economic Impact of U.S. Trade Sanctions on Imports of Paper Products • 33
Table A-5Imports and Exports of Pulp and Its Products, by Value, By Nation and Region,As Shares of Worldwide Imports and Exports of These Products (%), 1970-200969
Year Africa US Canada Latin Europe Japan China Indonesia Rest of OceaniaAmerica Asia
Imports
1970 1.08 17.52 0.47 4.48 64.88 6.12 0.78 0.02 3.05 1.601980 1.46 15.81 1.23 4.18 57.72 10.51 2.21 0.54 5.34 1.021990 0.81 15.25 1.42 3.40 53.99 10.51 4.01 1.36 8.27 0.992000 0.62 12.57 1.79 4.56 44.79 7.40 12.19 3.93 11.42 0.742009 0.97 6.31 0.65 5.48 31.99 4.01 33.25 3.82 12.97 0.55
Exports
1970 2.18 19.07 28.92 0.97 47.94 0.09 0.39 0.00 0.06 0.381980 2.14 19.60 31.99 5.48 38.35 0.50 0.54 0.00 0.14 1.261990 1.85 23.07 30.15 5.71 36.13 0.07 0.64 0.40 0.45 1.522000 2.04 18.89 27.71 12.04 32.52 0.52 0.29 2.99 1.62 1.372009 2.04 20.03 12.23 21.59 33.56 2.54 0.44 4.56 1.11 1.90
69 FAO STAT, Forestry, Food and Agricultural Organization of the United Nations.

34 • The Economic Impact of U.S. Trade Sanctions on Imports of Paper Products
Appendix – U.S. Duties on Chinese andIndonesian Coated Paper Products
70 Notices, Federal Register, Vol. 75, No. 221, November 17, 2010.
Table A-6
4810.14.11,4810.14.1900,4810.14.2010,4810.14.2090,4810.14.5000,4810.14.6000,
4810.14.70,4810.19.1100,4810.19.1900,4810.19.2010,4810.19.2090,4810.22.1000,
4810.22.50,4810.22.6000,
4810.22.70,4810.29.1000,4810.29.5000,4810.29.6000,
4810.29.70,4810.32, 4810.39, 4810.92.
China
Indonesia
HTS Code Country Remedy Exporter/Producer Duty Rate
Gold East Paper (Jiangsu) Co., Ltd., Gold HuashengPaper Co., Ningbo Zhonghua Paper Co., Ltd.,Ningbo Asia Pulp and Paper Co., Ltd., Gold East(Hong Kong) Trading Co., Ltd. and ShandongChenming Paper Holdings Ltd.
PRC-Wide Entity (Shandong Sun Paper IndustryJoint Stock Co., Ltd., Yanzhou Tianzhang PaperIndustry Co., Ltd., Shandong International Paperand Sun Coated Paperboard Co., Ltd.,International Paper and Sun Cartonboard Co., Ltd.)
Gold East Paper (Jiangsu) Co., Ltd., GoldHuasheng Paper Co., Ltd., Gold East Trading (HongKong) Company Ltd., Ningbo Zhonghua Paper Co.,Ltd., and Ningbo Asia Pulp & Paper Co., Ltd.
Shandong Sun Paper Industry Joint Stock Co., Ltd.,and Yanzhou Tianzhang Paper Industry Co., Ltd.
All Others
PT. Pabrik Kertas Tjiwi Kimia Tbk./PT. Pindo DeliPulp, and Paper Mills/PT. Indah Kiat Pulp andPaper Tbk.
All Others
PT Pabrik Kertas Tjiwi Kimia, Tbk, PT Pindo DeliPulp and Paper Mills, PT Indah Kiat Pulp andPaper, Tbk (i.e., APP/SMG)
All others
7.62%
135.84%
19.46%
202.84%
19.46%
20.13%
20.13%
17.94%
17.94%
Anti-Dumping
Duties
Anti-Dumping
Duties
Counter-vailing Duties
Counter-vailing Duties
Antidumping and Countervailing DutiesOn Imports of Certain Coated Paper from China and Indonesia70
APPEN
DIX
–U
.S. DU
TIES ON
CHIN
ESE AN
DIN
DO
NEISA
N COATED
PAPER PRO
DU
CTS

REFE
REN
CES
The Economic Impact of U.S. Trade Sanctions on Imports of Paper Products • 35
References
Berglund, Christer and Patrik S derholm (2003) “An Econometric Analysis of Global Waste Paper Recovery and Utilization.”Environmental and Resource Economics, Vol. 26, 429-456.
Blonigen, Bruce A., Benjamin H. Liebman, Wesley W. Wilson (2007) “Trade Policy and Market Power: The Case of the USSteel Industry.” NBER, Working Paper 13671.
Blonigern, Bruce A. and Prusa (2001) “Antidumping.” NBER, Working Paper 8398.
Bown, Chad P. and Meredith A. Crowley (2006) “Policy Externalities: How US Antidumping Affects Japanese Exports to theEU.” European Journal of Political Economy.
______ (2007) “Trade Deflection and Trade Depression.” Journal of International Economics.
Bureau of Labor Statistics.
Chi, Ting, Peter Kilduff, and Carl Dyer (2005) “An Assessment of US Comparative Advantage in Technical Textiles from aTrade Perspective.” Journal of Industrial Textiles, Vol. 35, 17-37.
Evans, Carolyn L. and Shane M. Sherlud (2008) “Are Antidumping Duties for Sale? Case-Level Evidence on the GrossmanHelpman Protection for Sale Model.” Board of Governors of the Federal Reserve System.
FAO STAT, Forestry, Food and Agricultural Organization of the United Nations.
Feinberg, Robert M. and Kara M. Reynolds (2006) “Friendly Fire? The Impact of U.S. Antidumping Enforcement on U.S.Exporters.” American University, Department of Economics, Working Paper Series.
Gallaway, Michael P., Bruce A. Blonigen and Joseph E. Flynn (1999) “Welfare Costs of the U.S. antidumping andCountervailing Duty Laws.” Journal of International Economics.
Gamberoni, Elisa and Richard Newfarmer (2009) “Trade Protection: Incipient but Worrisome Trends.” Trade Notes, World Bank.
Gateway Packaging Company (2010) “Black Liquor Tax Credit.” www.gtewaypackaging.com/black-liquor-tax-credit.html.
Grossman, Gene M. and Elhanan Helpman (1994) “Protection for Sale.” American Economic Review, Vol. 84 (4), 833-850.
Haley, Usha C. V. (2010) “No Paper Tiger: Subsidies to China’s Paper Industry from 2002-09.” Economic Policy Institute,EPI Briefing Paper #264.
Hansen, Wendy L. and Thomas J. Prusa (1993) “Does Administrative Protection Protect? A Reexamination of the US TitleVII and Escape Clause Statutes.” Regulation 16: 35-42.
______ (1996) “Cumulation and ITC Decision Making: The Sum of the Parts is Greater than the Whole.” Economic Inquiry,Vol. 34, 746-69.
______ (1997) “Economics and Politics of Trade Policy: An Empirical Analysis of ITC Decision Making.” Review ofInternational Economics. Vol.5, 230-45.
36 • The Economic Impact of U.S. Trade Sanctions on Imports of Paper Products
Honnold, Vincent (2009) “Developments in the Sourcing of Raw Materials for the Production of Paper.” Journal ofInternational Commerce and Economics, United States International Trade Commission.
Ikenson, Dan (2002) “Steel Trap: How Subsidies and Protectionism Weaken the U.S. Steel Industry.” CATO Institute: TradeBriefing Paper.
Kee, Hiau Looi, Cristina Neagu and Alessandro Nicitya (2010) “Is Protectionism on the Rise? Assessing National TradePolicies During the Crisis of 2008.” The World Bank, Working Paper 5274.
Krupp, Corinne M. and Susan Skeath. 2002. “Evidence on the Upstream and Downstream Impacts of Antidumping Cases.”Working Paper.
Levinsohn, Jim and Wendy Petropoulos (2002) “Creative Destruction of Just Plain Destruction?: The U.S. Textile andApparel Industries Since 1972.” NBER, Working Paper 8348.
Liebman, Benjamin H. and Kasaundra M. Tomlin (2007). “Steel safeguards and the welfare of U.S. steel firms anddownstream consumers of steel: a shareholder wealth perspective.” Canadian Economics Association.
Malone, Scott (2010) “Textile Firms Prosper by Climbing the Value Chain, But Jobs are Scarcer.” Reuters, Special Report.
Martin, Michael F. (2007) “U.S. Clothing and Textile Trade with China and the World: Trends Since the End of Quotas.” CRSReport.
Murray, Lauren A. (1995) “Unraveling Employment Trends in Textiles and Apparel.” Monthly Labor Review, August 1995.
Noreen, Bonnie J. and Catherine DeFilippo (2003) “Steel: Monitoring Developments in the Domestic Industry.” UnitedStates International Trade Commission, Investigation No. TA-204-9.
Notices, Federal Register, Vol. 75, No. 221, November 17, 2010.
Nye, William W. (2006) “What is the Effect of U.S. Antidumping Duties on Imports? Some Evidence from the SunsetReview Process.” Economic Analysis Group Discussion Paper, Antitrust Division, U.S. Department of Justice.
Prusa, Thomas (1997) “The Trade Effects of U.S. Antidumping Actions.” In Effects of U.S. Trade Protection and PromotionPolicies, ed. R. C. Feenstra. Chicago: University of Chicago Press.
______ . 2001. “On the Spread and Impact of Anti-Dumping.” Canadian Journal of Economics.
Pulp and Paper Industry Strategy Group (2010) “Review of the Pulp and Paper Manufacturing Industry.”
Stokes, Bruce (2007) “Protectionism and Politics.” eJournal USA: Economic Perspectives, 7-10.http://guangzhou.usembassy-china.org.cn/uploads/images/80vI9pgJ9Vnho-mJQGUPcQ/ijee0107.pdf
Sun, Lin and Hao Ke (2008) “Voluntary Export Restraints and Dumping – A Theoretical Analysis & its Revelation.” ZJUT,College of Business and Administration.
United Nations Commodity Trade Statistics Database.
U.S. Census Bureau.

The Economic Impact of U.S. Trade Sanctions on Imports of Paper Products • 37
US Customs and Border Protection. “China Textile MOU.”
U.S. Geological Survey.
U.S. International Trade Commission (2010) “Certain Coated Paper Suitable for High-Quality Print Graphics Using Sheet-Fed Presses from China and Indonesia.” Publication 4192.
Van Dijk, Michiel (2003) “Industry Evolution in Developing Countries: the Indonesian Pulp and Paper Industry.” EindhovenCenter for Innovation Studies.
Vandenbussche, Hulke and Maurizio Zanardi (2010) “The Chilling Trade Effects of Antidumping Proliferation.” EuropeanEconomic Review.
WTO. “Textiles Monitoring Body (TMB): The Agreement on Textiles and Clothing.”http://www.wto.org/english/tratop_e/texti_e/texintro_e.htm.

PO Box 3693Arlington, VA 22203-3693
(866) 467-7200
www.worldgrowth.org