Embed Size (px)
Citation preview
The Economic Impacts of the Motorsports Industry on the North Carolina Economy
Belk College of Business Administration University of North Carolina at Charlotte
October 2004
Research Sponsored By:
Prepared by: John E. Connaughton TIAA-CREF Professor of Economics Ronald A. Madsen Professor of Economics John M. Gandar Associate Dean Belk College of Business Administration

1
The Economic Impacts of the Motorsports Industry On the North Carolina Economy
Section 1: Introduction
Background: Politicians, economic developers, citizens, business people, and
academics often do not understand the economic importance of professional sports. This is the
case with motorsports in North Carolina. We are familiar with the amount of money top athletes
make, how much a ticket costs, how much a stadium or track costs, and even the value of
broadcast rights. However, while sports catches and sometimes consumes our attention, we fail
to equate entertainment value with economic value. This report focuses not on the entertainment
value of motorsports but rather on the economic value that motorsports generates for the North
Carolina economy.
Motorsports includes a wide variety of sports that involve the racing of engine powered
vehicles in order to compete against other drivers and pilots. Primarily one thinks of automotive
racing which represents the bulk of motorsports related competition. It is important to point out
that there are other popular categories including truck racing, motorcycle racing and boat racing.
As motorsports competitions have become increasingly popular, multi-billion dollar
industries have developed around the sports themselves. We are familiar with the popularity of
NASCAR and Indy Car Series in the United States and the popularity of Formula One in Europe
and Australasia. Worldwide a significant amount of economic output as well as employment is
generated yearly by motorsports related industries. The most obvious sources of such economic
activity are the race events themselves that attract large crowds and generate television and other
revenue. Much less visible, but significantly larger, is the economic activity of different
manufacturing and service industries that take part in the production process of the race
equipment and activities.
The economic principles that drive the decisions and choices of motorsports related
manufacturing and service industries are the same as for other industries. There is a tendency of
firms within any industry to cluster in a particular region, also called industrial agglomerations.
These agglomerations have been widely studied by various researchers and although the origins
of cluster theory are not precisely known, Michael Porter’s The Competitive Advantage of
Nations (New York: Basic Books, 1990) has widely publicized the use of the term industrial
cluster.

2
An industry cluster is a group of companies that are related through at least one of the
following types of relationships:
1. Buyer-Supplier Relationships
2. Competitor and Collaborator Relationships
3. Shared Resources Relationships
In addition to the relationships mentioned above, geographic proximity plays a key role in the
formation of industrial clusters. These industrial clusters can be observed worldwide and are
found in a variety of industries. The reasons for such clustering of firms are widely debated but
not material to this study. In the specific case of motorsports, the example of the British
motorsports industry is well known and has been studied by several interest groups. Virtually
the entire British motorsports industry is clustered within a 50-mile radius around Oxford in
Southern England. The region has been named “Silicon Valley of Motor Sport” or simply
“Motor Sport Valley”. Approximately three quarters of the world’s single seat racing cars are
designed and assembled in the region. The production of equipment is focused on Formula One,
Championship Auto Racing, Indy Racing League, as well as Rally cars.
A similar regional concentration of motorsports related industries can be found in North
Carolina with the main difference being that most of the economic activity is tied to NASCAR.
Other significant motorsports related racing activity would include the Grand National series,
truck series, drag and short track racing. There is even a significant presence of powerboat
manufacturing in the state. The Southeastern part of the United States has traditionally been the
cradle of stock car racing, a sport that has seen a tremendous gain in popularity with a
continuously expanding audience. NASCAR has expanded out of its traditional geographic
region and grown to be the second most popular sport watched on TV in the U.S. Traditionally,
North Carolina has been the home of most NASCAR teams and together with its race tracks and
race events, the state has experienced the development of a sizable industrial cluster. The rapid
growth of the motorsports cluster in North Carolina has been the result of the increased
popularity of the sport itself as well as the historical advantage the state has had in providing the
industry with a specialized labor pool, a supplier chain, infrastructure in the form of race tracks
and testing facilities, and a culture of stock car racing.
Due to the sharp decline in many of the traditional manufacturing industries in the
southeast, the state governments of Virginia, West Virginia and South Carolina have turned to
motorsports as a viable source of economic development. Unfortunately the development of the

3
motorsports cluster in North Carolina has to a large extent escaped public attention. It is
important that policy makers, business leaders, and citizens understand the importance of our
existing motorsports clusters in North Carolina, both in terms of economic output as well as the
number of jobs provided by motorsports related industries.
Previous Studies: For those interested in previous economic impact studies related to
the motorsports industry, the following is a selection of previous research: The Economic Impact
of the European Grand Prix, which is an economic impact study approximating the effects of the
European Grand Prix on the European Union. The study was conduced in 1999 by William
Lilley II and Laurence J. DeFranco. The Economic Impact of the 2002 FIA Foster’s British
Grand Prix, which was a report done by the Motorsport Industry Association in 2003. The
National Survey of Motorsport Engineering and Services, which is a full overview of the UK
motor sport industry. The research was carried out by various universities within the UK. The
Economic Impact of the Network Q Rally of Great Britain, which is an economic impact study of
the event conduced by William Lilley III and Laurence J. DeFranco conducted in 1998. An
Impact Analysis of the Dragons Ridge Motorsports Park on the Economy of New Kent County,
Virginia, conducted by Chmura Economics & Analytics in 2003. Hampton Motorsports Complex
Impact Study, which was conducted in 2003 by Frost Motorsports, LLC. USA Motorsport Market
Research Report, conducted by Motorsports Research Associates in 2002. Economic Impact
Analysis Proposed Autoracing Complex in Immokalee, Florida, which was prepared by Bernhard
Weinstein and Terry Clower in 2000. Survey of the Motorsports Industry in Cabarrus, Iredell
and Mecklenburg Counties, 1996 by UNC Charlotte. The Economic Impact of Lowe’s Motor
Speedway on the Cabarrus, Iredell and Mecklenburg County Economies, prepared by John
Connaughton in 2000. The Economic Impact of Sports on the North Carolina Economy, prepared
by John Connaughton in 1997.
Section 2: Methodology
Data Collection: Most industries in the U.S. economy have their own unique industry
classification. U.S. industries are currently classified using the North American Industrial
Classification System (NAICS). This system recently replaced the Standard Industrial
Classification (SIC) system. These industrial classification systems assign firms a code based on
the product or service the firm produces. This allows both the U.S. Bureau of Economic
Analysis (BEA), which collects and publishes output and income data, and the U.S. Bureau of

4
Labor Statistics (BLS), which collects and publishes employment and wage data, to compute
total output, income, employment, and wages by a common industry code. The objective is for
NAICS to provide aggregate industry specific data for homogeneous firm groupings.
However, some industry concepts, such as the motorsports industry, are not comprised of
homogeneous firms within a unique NAICS code. The motorsports industry is comprised of
firms that are classified in over 40 different NAICS codes, based on the product or service they
provide. An additional complication is that not all of the firms within each of these over 40
industry codes produce goods or services related to motorsports. As a result, there is no
secondary motorsports data source for output, income, employment, or wages. This requires
collection of primary data in order to estimate the size and impact of the motorsports industry.
In this study, the primary data collection consisted of several different techniques. First,
firms located in North Carolina that were known to produce motorsports goods and services were
identified using several different approaches, including the membership list for the North
Carolina Motorsports Association, NASCAR teams, interviews, and referrals. These firms were
sent surveys to gather employment, output, wage, and other economic information. Because of
the variety of products and services provided by firms in the motorsports industry, 13 different
surveys, based on type of product or service, were used. These 13 surveys appear in Appendix
A.
In addition to the direct survey approach, a second technique of data collection involved
the use of proprietary databases. Firm and industry databases such as Reference USA and Dunn
and Bradstreet were analyzed based on key SIC/NAICS codes and key words. This process
produced a lengthy list of firms that were subsequently vetted to ensure involvement in
motorsports. The output and employment estimates supplied by the proprietary databases were
used for these firms.
The third technique used in this primary data collection process involved cross-checking
firm names and addresses to other motorsports data lists. Lists were provided by the Carolinas
Partnership, local economic developers, and the North Carolina Department of Commerce.
Output and employment data for omitted firms were then obtained either through direct survey or
by searching proprietary databases.
Finally, despite all the different techniques to collect primary data, output and
employment data for a number of firms were incomplete. In order to estimate the missing data
for these firms, the 13 industry categories were each further divided based on firm size (small,

5
medium, and large). This produced 39 different groupings. For each class size in each category,
employment and output averages were calculated based on direct survey data, proprietary data,
and a combination of direct survey and proprietary data. Missing data were then estimated
using the three different techniques described above. The averaging technique that produced the
most conservative estimate of employment and output was used to estimate the missing data.
Impact Methodology: The economic impact of an industry or event is typically
measured in terms of total output and/or jobs. To accurately assess the total economic impact,
the most important piece of information is direct output. The term direct refers to the dollar
output or employment associated with the firm or industry being evaluated. For the motorsports
impact study, the term direct is most closely associated with the total annual sales/revenue
generated by the different organizations that make up the motorsports industry in North Carolina.
Once the estimates of direct output and employment are established, the multiplier
concept can then capture the total effect of the economic activity on output, employment, value
added, and employee compensation. For instance, a job multiplier value of 2.1 would mean that
for each direct job in an industry, 1.1 additional jobs are generated in other parts of the economy
(the total benefit to the economy being 2.1 jobs). Thus, an event or firm that creates 100 new
jobs in a particular industry would, through the multiplier effect, translate into a subsequent
employment gain of 110 jobs in other sectors, for a total employment gain of 210 jobs (100 x
2.1).
The basic multiplier methodology used in the motorsports study is provided by the
Minnesota IMPLAN Group. IMPLAN is a multiplier methodology originally developed by the
United States Government and currently maintained by the Minnesota IMPLAN Group. Table
2.1 presents the IMPLAN sectors used in this study.
IMPLAN code 4XB, Off-site fan expenditures, represents a blended multiplier.
Off-site fan expenditures occur when motorsports fans spend money on non-motorsports
activities while attending motorsports events. Examples of this type of spending are hotel and
motel expenses, food and entertainment spending, gasoline purchases, and other retail purchases
including souvenirs. The blended multiplier is a weighted average multiplier based on all
expenditure categories associated with the off-site expenditures. The weights were determined
using survey data collected from a Lowe’s Motor Speedway fan expenditure survey conducted in
2000.

6
Table 2.1 IMPLAN and NAICS Codes
Sector IMPLAN Code IMPLAN Industry NAICS Code(s) NASCAR Mktg. 450 All other miscellaneous professional and technical 54191 54193 54199 Marketing 450 All other miscellaneous professional and technical 54191 54193 54199 NonProfit Assoc 493 Civic, social, professional organizations 8134 8139 Travel & Tourism 456 Travel arrangement and reservation services 5615 Travel & Tourism 4XB Off-Site event expenditures 452 453 7211 722 8111 Travel & Tourism 478 Other amusement, gambling, and recreation industries 7131 7132 71391 71392 71393 71399 Museums 475 Museums, historical sites, zoos, and parks 712 Suppliers 139 Commercial printing 32311 Suppliers 146 All other petroleum products manufacturing 32419 Suppliers 180 Rubber and plastics hose and belting manufacturing 32622 Suppliers 174 Laminated plastics plate, sheet, and shapes 32613 Suppliers 213 Other aluminum rolling and drawing 33131 Suppliers 247 Electroplating, anodizing, and coloring metal 33281 Suppliers 301 Scales, balances, and miscellaneous general purposes 33399 Suppliers 350 Motor vehicle parts manufacturing 3363 Suppliers 350 Motor vehicle parts manufacturing 3363 Suppliers 336 Relay and industrial control manufacturing 33531 Suppliers 347 Truck trailer manufacturing 33621 Suppliers 384 Sign manufacturing 33995 Suppliers 391 Air transportation 481 Suppliers 397 Scenic and sightseeing transportation and support 487 488 Suppliers 350 Motor vehicle parts manufacturing 3363 Suppliers 402 Furniture and home furnishings stores 442 Suppliers 439 Architectural and engineering services 5413 Suppliers 450 All other miscellaneous professional and technical 54191 54193 54199 Retail 362 Wood kitchen cabinet and countertop manufacturing 33711 Retail 139 Commercial printing 32311 Retail 347 Truck trailer manufacturing 33621 Retail 358 Boat building 33661 Retail 255 Miscellaneous fabricated metal product manufacturing 33299 Retail 350 Motor vehicle parts manufacturing 3363 Retail 408 Clothing and clothing accessories stores 448 Retail 402 Furniture and home furnishings stores 442 Retail 411 Miscellaneous store retailers 453 Retail 439 Architectural and engineering services 5413 NASCAR Testing 446 Scientific research and development services 5417 NASCAR Teams 350 Motor vehicle parts manufacturing 3363 Sanctioning Org 474 Promoters of performing arts and sports and agents 7113 7114 Driving Schools 463 Other educational services 6114 6115 6116 6117 Major Track 472 Spectator sports 7112 Drag Tracks 472 Spectator sports 7112 Drag Racers 350 Motor vehicle parts manufacturing 3363 Short-Track Racers 350 Motor vehicle parts manufacturing 3363 Short-Tracks 472 Spectator sports 7112

In this particular study, the state was divided into seven regions. These seven regions
correspond to North Carolina’s seven economic development regions as defined by the North
Carolina Department of Commerce. Figure 2.1 presents a map showing the seven regions. For
each region, an IMPLAN multi-county multiplier model was constructed. The number of
industries included in the model varies by region. Table 2.2 presents the number of industries
included in each region. The Input/Output (I/O) matrix for each region provides multipliers
based on the new North American Industrial Classification System (NAICS) definitions of
industries. The IMPLAN data used to estimate the region specific industry multipliers were the
latest available and were based on 2001 data and adjusted for inflation to reflect the estimated
effects in 2003.
Figure 2.1
North Carolina Economic Development Planning Regions
Table 2.2Planning Region Population and Industry Count
Planning Region Population Number of Industries Number of CountiesAdvanta 23 ge West 1,011,131 372 Carolinas Partnership 1,862,588 434 12 Piedmont Triad Partnership 1,482,917 423 12 Research Triangle Regional Partnership 1,601,395 391 13 North Carolina's Southeast 971,165 347 11 North Carolina’s Eastern Region 913,695 345 13 North Carolina’s Northeast Partnership 331,890 255 16 North Carolina 8,186,269 481 100
7

8
d
ty of
ta
approac as part
n a
supplie heir
employment through the multiplier process.
Using the regional models and multipliers, output and employment impacts were
within each region. In regions with either small industries or a small
number
In addition, the IMPLAN multiplier model provides a comprehensive set of
disaggregated multipliers that can be used to estimate the indirect impacts and the induce
impacts separately from the total impact at the regional level. The indirect impact is the
additional economic activity of the supplier chain network, within the region, caused by the
economic activity of the direct industry. The induced impact is the additional economic activity
of all other unrelated firms and households, within the region, caused by the economic activi
the direct industry as well as the indirect impact.
In this motorsports study there is an additional complication. As part of the primary da
collection process firms were grouped into industries. Some industry groups (suppliers,
marketing, etc.) may represent part of the supplier chain (indirect) for other industry groups
(NASCAR teams, short track teams, etc). Using the primary data directly with the multiplier
h could result in double counting when estimating total impacts. Firms identified
of a supplier chain received surveys that included questions asking the percent of their total
business originating from within North Carolina. Based on the survey information, an
adjustment was made to reduce the direct output and employment estimates of firms withi
r chain industry. The resulting direct output and employment estimates reflect only t
rest of world (outside of North Carolina) business. The in-state business is therefore only
picked-up as indirect expenditures and indirect
estimated for each industry
of firms within an industry the reporting table suppresses the results. This is to minimize
the dissemination of proprietary information. The data however are carried to the total.
State level results for output and employment by industry are the simple sum of the
regional results. The state level multipliers are weighted residual multipliers based on the
industry activity within the seven regions.
Section 3: State Impacts
At the state level four different types of economic impacts generated by the motorspo
industry are estimated based on 2003 information. These impacts include: (1) output impacts;
(2) employment impacts; (3) employee compensation impacts; and (4) value added impacts.
These impacts were estimated for each of the seven regional economic development areas an
rts
d
the state results are the sum of these regional estimates.

9
total state output. This table is organized by
motors
s
ate the
industry on total state employment. Like Table 3.1 this table is
organiz r
AN
e
s
ll
addition to direct output impacts, there were just
over 1.0 billion dollars ($1,104,941,429) of indirect (supplier chain) output impacts and another
870 Million ($ 870,291,997) of induced economic impacts. The total economic impact of the
otorsports industry on the North Carolina economy in 2003 was just over 5.0 billion dollars
($5,075,067,394) which i pacts. This large
conomic impact is an indication of how important the motorsports industry has become to the
mic o
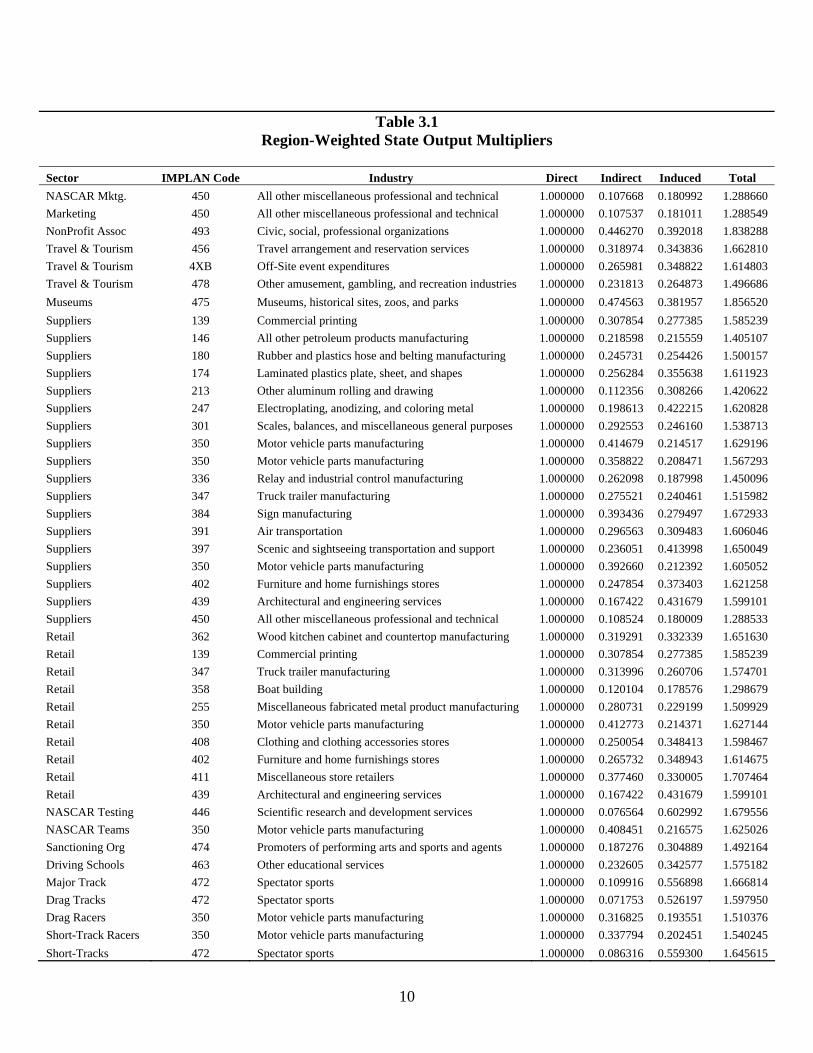
Table 3.1 displays the region-weighted state output multipliers used to estimate the
annual impact of the motorsports industry on
ports sector and by IMPLAN Industry Code. Table 3.1 shows that for each dollar of
direct expenditure by a firm in the NASCAR Marketing sector, IMPLAN Industry Code 450,
there are 10.77 cents spent in indirect (supplier chain) industries within the state, and 18.10 cents
in induced spending within the state, so that the total state output impact of $1 spent by the
NASCAR Marketing firm increases state output by $1.29. Each of the output multipliers in thi
table can be interpreted in a similar manner.
Table 3.2 presents the region-weighted state employment multipliers used to estim
annual impact of the motorsports
ed by motorsports sector and by IMPLAN Industry Code. Table 3.2 shows that that fo
each $1,000,000 of direct spending by a firm in the NASCAR Marketing sector, IMPL
Industry Code 450, there are 3.91 new jobs supported directly. In addition to these direct jobs,
there are 0.70 indirect (supplier chain) jobs, as well as 1.14 induced jobs, which in total add up to
5.76 total jobs at the state level. Each of the employment multipliers in this table can be
interpreted in a similar manner.
Output Impacts: Table 3.3 contains the estimated annual output impact on the state
economy of the North Carolina motorsports industry. The table is again organized by
motorsports sector and IMPLAN Industry Code. In North Carolina the total direct spending by
all motorsports related firms in 2003 was almost 3.2 billion dollars ($,3,189,833,874). Of thes
direct expenditures, the largest reported total was for NASCAR Teams with 1.26 billion dollar
of direct expenditures. The results show several ND (not disclosed) entries that reflect
motorsports sectors and IMPLAN Industry Codes where the number of firms is sufficiently sma
that confidentiality requires non-disclosure. In
m
s the sum of the direct, indirect, and induced im
e
econo perfo ncerma f the state economy.
10
Table 3.1
Region-Weighted State Output Multiplie
IMPL e
rs
Sector AN Cod Industry Direct Indirect Induced Total NASCAR Mktg. 450 All other miscellaneous professional and technical 1.000000 0.107668 0.180992 1.288660 Marketing hnical
Assoc s ourism ourism ourism creation industries
parks
manufacturing ose and belting manufacturing
plate, sheet, and shapes
ing metal eral purposes
rs rs uring rs rs ion rs rs rs rs rs sional and technical
anufacturing
tal product manufacturing manufacturing
hing accessories stores es
engineering services NASCAR Testing 446 Scientific research and development services 1.000000 0.076564 0.602992 1.679556 NASCAR Teams 350 Motor vehicle parts manufacturing 1.000000 0.408451 0.216575 1.625026 Sanctioning Org 474 Promoters of performing and agents 1.000000 0.187276 0.304889 1.492164 Driving Schools 463 0 0.232605 0.342577 1.575182 Major Track Spectator sports 1.000000 0.109916 0.556898 1.666814
Tracks Spectator spor 0 1.50 0. 1.
ck Racers 0 0. 1.2 0. 1.645615
450 All other miscellaneous professional and tec 1.000000 0.107537 0.181011 1.288549 NonProfit 493 Civic, social, professional organization 1.000000 0.446270 0.392018 1.838288 Travel & T 456 Travel arrangement and reservation services 1.000000 0.318974 0.343836 1.662810 Travel & T 4XB Off-Site event expenditures 1.000000 0.265981 0.348822 1.614803 Travel & T 478 Other amusement, gambling, and re 1.000000 0.231813 0.264873 1.496686 Museums 475 Museums, historical sites, zoos, and 1.000000 0.474563 0.381957 1.856520 Suppliers 139 Commercial printing 1.000000 0.307854 0.277385 1.585239 Suppliers 146 All other petroleum products 1.000000 0.218598 0.215559 1.405107 Suppliers 180 Rubber and plastics h 1.000000 0.245731 0.254426 1.500157 Suppliers 174 Laminated plastics 1.000000 0.256284 0.355638 1.611923 Suppliers 213 Other aluminum rolling and drawing 1.000000 0.112356 0.308266 1.420622 Suppliers 247 Electroplating, anodizing, and color 1.000000 0.198613 0.422215 1.620828 Suppliers 301 Scales, balances, and miscellaneous gen 1.000000 0.292553 0.246160 1.538713 Suppliers 350 Motor vehicle parts manufacturing 1.000000 0.414679 0.214517 1.629196 Suppliers 350 Motor vehicle parts manufacturing 1.000000 0.358822 0.208471 1.567293 Supplie 336 Relay and industrial control manufacturing 1.000000 0.262098 0.187998 1.450096 Supplie 347 Truck trailer manufact 1.000000 0.275521 0.240461 1.515982 Supplie 384 Sign manufacturing 1.000000 0.393436 0.279497 1.672933 Supplie 391 Air transportat 1.000000 0.296563 0.309483 1.606046 Supplie 397 Scenic and sightseeing transportation and support 1.000000 0.236051 0.413998 1.650049 Supplie 350 Motor vehicle parts manufacturing 1.000000 0.392660 0.212392 1.605052 Supplie 402 Furniture and home furnishings stores 1.000000 0.247854 0.373403 1.621258 Supplie 439 Architectural and engineering services 1.000000 0.167422 0.431679 1.599101 Supplie 450 All other miscellaneous profes 1.000000 0.108524 0.180009 1.288533 Retail 362 Wood kitchen cabinet and countertop m 1.000000 0.319291 0.332339 1.651630 Retail 139 Commercial printing 1.000000 0.307854 0.277385 1.585239 Retail 347 Truck trailer manufacturing 1.000000 0.313996 0.260706 1.574701 Retail 358 Boat building 1.000000 0.120104 0.178576 1.298679 Retail 255 Miscellaneous fabricated me 1.000000 0.280731 0.229199 1.509929 Retail 350 Motor vehicle parts 1.000000 0.412773 0.214371 1.627144 Retail 408 Clothing and clot 1.000000 0.250054 0.348413 1.598467 Retail 402 Furniture and home furnishings stor 1.000000 0.265732 0.348943 1.614675 Retail 411 Miscellaneous store retailers 1.000000 0.377460 0.330005 1.707464 Retail 439 Architectural and 1.000000 0.167422 0.431679 1.599101
arts and sportsOther educational services 1.00000
472 Drag 472 ts 1.000000 0.071753 .526197 97950 Drag Racers 35 Motor vehicle parts manufacturing 1.000000 0.316825 193551 510376 Short-Tra 35 Motor vehicle parts manufacturing 1.000000 0.337794 202451 540245 Short-Tracks 47 Spectator sports 1.000000 0.086316 559300

11
Table 3.2
Region-Weighted State Employment Mult
IMPLAN Code
ipliers
Sector IMPLAN Industry Direct Indirect Induced Total NASCAR Mktg. 450 All other miscellaneous professional and technical 3.915370 0.700339 1.145753 5.761461 Marketing 450 All other miscellaneous professional and technical
Assoc s 2 1 5ourism 1ourism 1 2ourism creation industries 1
parks 2 111.913953
manufacturing ose and belting manufacturing
plate, sheet, and shapes 1
ing metal 1eral purposes
1rs rs uring rs rs on 17.808565 rs 1rs rs rs rs ssional and technical
anufacturing 1
16.095459
tal product manufacturing manufacturing
hing accessories stores es 1
engineering services NASCAR Testing 446 Scientific research and development services 12.466533 0.581639 4.794728 17.842900 NASCAR Teams 8.209448 Sanctioning 0 6.636691 Driving Schools 11.918513 Major Track 16783 3.134138 Drag Tracks 8411 14.554826 Drag Racers 7992 9.029743 Short-Track 5676 2.703888 2.368484 9.138049 Short-Tracks 472 Spectator sports 10.039716 0.555457 1.518300 12.113474
3.271568 0.585105 0.960704 4.817378 NonProfit 493 Civic, social, professional organization 8.000448 5.510691 9.795019 3.306157 Travel & T 456 Travel arrangement and reservation services 1.125887 2.806347 3.144135 17.076370 Travel & T 4XB Off-Site event expenditures 9.059809 2.001718 3.035179 4.096706 Travel & T 478 Other amusement, gambling, and re 2.857437 1.970025 2.276165 17.103627 Museums 475 Museums, historical sites, zoos, and 3.773471 2.872585 8.105770 44.751825 Suppliers 139 Commercial printing 7.153629 2.092658 2.667667 Suppliers 146 All other petroleum products 2.738547 1.012022 1.036317 4.134851 Suppliers 180 Rubber and plastics h 5.000000 1.310555 1.888535 8.199090 Suppliers 174 Laminated plastics 2.000192 2.064825 4.265072 18.330089 Suppliers 213 Other aluminum rolling and drawing 6.666667 0.378887 1.573420 8.618973 Suppliers 247 Electroplating, anodizing, and color 9.333333 0.868775 2.785039 2.987147 Suppliers 301 Scales, balances, and miscellaneous gen 4.166667 1.684329 1.960346 7.811342 Suppliers 350 Motor vehicle parts manufacturing 9.105099 6.377858 4.992107 20.475063 Suppliers 350 Motor vehicle parts manufacturing 4.414963 3.035942 2.608882 0.059786 Supplie 336 Relay and industrial control manufacturing 5.000001 2.538506 2.303176 9.841682 Supplie 347 Truck trailer manufact 5.194818 1.481713 1.971709 8.648240 Supplie 384 Sign manufacturing 9.314013 3.341331 3.465269 16.120612 Supplie 391 Air transportati 7.504356 5.101566 5.202643 Supplie 397 Scenic and sightseeing transportation and support 5.270724 1.670967 3.556511 0.498202 Supplie 350 Motor vehicle parts manufacturing 3.251658 2.256429 1.853411 7.361498 Supplie 402 Furniture and home furnishings stores 5.133820 0.972255 1.478867 7.584942 Supplie 439 Architectural and engineering services 8.988314 1.581215 3.449032 14.018561 Supplie 450 All other miscellaneous profe 5.650467 1.010801 1.649433 8.310701 Retail 362 Wood kitchen cabinet and countertop m 2.000192 2.292613 3.430063 17.722868 Retail 139 Commercial printing 9.871688 2.887775 3.681261 16.440723 Retail 347 Truck trailer manufacturing 9.009009 3.147676 3.938775 Retail 358 Boat building 3.717717 0.757113 1.436604 5.911434 Retail 255 Miscellaneous fabricated me 3.393199 1.156203 1.267224 5.816627 Retail 350 Motor vehicle parts 2.302111 1.605335 1.275888 5.183334 Retail 408 Clothing and clot 8.333333 0.890499 1.349398 10.573230 Retail 402 Furniture and home furnishings stor 8.571448 1.487806 2.148948 2.208202 Retail 411 Miscellaneous store retailers 4.535715 0.868714 0.812493 6.216921 Retail 439 Architectural and 8.571448 1.507881 3.289070 13.368399
350 Motor vehicle parts manufacturing 3.605467 2.557579 2.046402 Org 474 Promoters of performing arts and sports and agents 5.626342 0.461539 0.54881
463 Other educational services 8.650407 1.485837 1.782269 472 Spectator sports 2.198309 0.219046 0.7472 Spectator sports 12.724278 0.482138 1.34350 Motor vehicle parts manufacturing 4.070646 2.631105 2.32
Racers 350 Motor vehicle parts manufacturing 4.06

12
Error! Not a valid link. Table 3.4 shows how this output impact was distributed among the
North Carolina’s regi output impa ts by
motorsports sector and IMPLAN Industry Code for each region is pres the reg
re able 3.4 it can be larg e p
motorsports industry is on the Carolina Pl n
4
onal economic development areas. (The breakdown of c
ented in ional
sults section.) In T seen that the est regional conomic im act of the
s Partnership anning Regio .
Table 3.Aggregate Motor ut I R
Planning Region Direct Indirect Induced Total
sports Outp mpacts by egion
Advantage West $93,790,847 $27,611,741 $23,624,761 $145,027,414 Carolinas Partnership $2,425,386,963 $808,250,117 $658,573,719 $3,892,210,835Piedmont Triad Partnership $363,687,393 $128,263,452 $91,228,999 $58Research Triangle Regional Partnership $42,816,198 $12,957,649 $11,652,228 $67,426,077North Carolina's Southeast $155,651,653 $18,304,765 $62,974,585 $236,931North Carolina’s Eastern Region $59,536,733 $12,632,591 $12,581,445
3,179,862
,004
$84,750,769 North Carolina’s Northeast Partnership $48,964,088 $6,921,114 $9,656,260 $65,541,433 Totals $3,189,833,874 $1,014,941,429 $870,291,997 $5,075,067,394
This region had just over 2.4 billion dollars in direct output expenditures in 2003 and the total
output impact on the region was just under 3.9 billion dollars. Even in the economic
development region with the smallest direct motorsports output impact, Research Triangle
artner
s
rts
rts
AR Teams had the largest estimated
direct employment impact with 4,559 jobs. el & Tourism sector, for IMPLAN
Industry Code n the
Suppliers sector, for IMPLAN Industry Code 350 (Motor vehicle parts manufacturing) there
ther 1,49 ect jo nerated tal of ,406 j
003 for the sta onom f 12,29 rect , 5,6
supplier n) jobs
P ship, the motorsports total 2003 output impact exceeded 67 million dollars.
Employment Impacts: In addition to the output impacts, there are employment impact
for the motorsports industry in North Carolina. Using the employment multipliers from Table
3.5 and the estimated output impacts, the employment impacts were estimated by motorspo
sector and by IMPLAN Industry Code. Table 3.6 presents the 2003 impact of the motorspo
industry on total state employment.
Again the results show several ND (not disclosed) entries that reflect motorsports sectors
and IMPLAN Industry Codes where employment levels or the number of firms is sufficiently
small that confidentiality requires non-disclosure. NASC
In the Trav
4XB (Off-site expenditures) there were 1,673 direct jobs supported. I
were ano 0 dir bs. Overall the motorsports industry ge a to 24 obs
in 2 te ec y. This employment impact consisted o 2 di jobs 98
indirect ( chai , and 5,506 induced jobs.

13
3.5 Table State Employment Impacts by Sector and by IMPLAN I stry
IMPL e Industry Direct Indirect Induc Total
ndu
Sector AN Cod ed NASCAR Mktg. nical 1450 All other miscellaneous professional and tech 81 14 24 18 Marketing 450 All other miscellaneous professional and technical 8 14 2 1,1
Assoc ourism rvices ourism 1 2ourism
parks
belting manufacturing
ate, sheet, and shapes lling and drawing N N N N
general purposes N N N N
rs rs rs rs tseeing transportation and support N N Nrs 1 1 3rs es rs N N N Nrs d technical N N N N
ntertop manufacturing N NND ND ND ND N N N
ng N N N Ncturing 3 2 1
hing accessories stores
es ting h and development services ms 350 otor vehicle parts manufacturing
Sanctioning Org 474 Promoters of performing arts and sports and agents 27 2 3 31 Driving Schools 55 366 Major ND ND Drag T 14 146 Drag R 818 Short-T 239 924 Short-T 76 604 State T 6 24,406
08 4 37 89 NonProfit 493 Civic, social, professional organizations 56 31 20 107 Travel & T 456 Travel arrangement and reservation se 120 30 34 184 Travel & T 4XB Off-Site event expenditures ,673 176 266 ,115 Travel & T 478 Other amusement, gambling, and recreation industries ND ND ND ND Museums 475 Museums, historical sites, zoos, and 79 43 27 148 Suppliers 139 Commercial printing 34 10 13 57 Suppliers 146 All other petroleum products manufacturing 42 16 16 63 Suppliers 180 Rubber and plastics hose and 28 7 10 46 Suppliers 174 Laminated plastics pl ND ND ND ND Suppliers 213 Other aluminum ro D D D D Suppliers 247 Electroplating, anodizing, and coloring metal ND ND ND ND Suppliers 301 Scales, balances, and miscellaneous ND ND ND ND Suppliers 350 Motor vehicle parts manufacturing D D D D Suppliers 350 Motor vehicle parts manufacturing 63 44 37 144 Suppliers 336 Relay and industrial control manufacturing 65 33 30 127 Supplie 347 Truck trailer manufacturing ND ND ND ND Supplie 384 Sign manufacturing ND ND ND ND Supplie 391 Air transportation 19 13 13 45 Supplie 397 Scenic and sigh D D D ND Supplie 350 Motor vehicle parts manufacturing ,490 ,034 849 ,374 Supplie 402 Furniture and home furnishings stor 42 8 12 62 Supplie 439 Architectural and engineering services D D D D Supplie 450 All other miscellaneous professional an D D D D Retail 362 Wood kitchen cabinet and cou ND D D ND Retail 139 Commercial printing Retail 347 Truck trailer manufacturing D D D ND Retail 358 Boat building 79 16 31 126 Retail 255 Miscellaneous fabricated metal product manufacturi D D D D Retail 350 Motor vehicle parts manufa 448 12 48 ,009 Retail 408 Clothing and clot 48 5 8 61 Retail 402 Furniture and home furnishings stores 15 3 4 21 Retail 411 Miscellaneous store retailers 381 73 68 522 Retail 439 Architectural and engineering servic 15 3 6 23 NASCAR Tes 446 Scientific researc 75 3 29 107 NASCAR Tea M 4,559 3,234 2,587 10,379
463 Other educational services 266 46 Track 472 Spectator sports ND ND racks 472 Spectator sports 128 5 acers 350 Motor vehicle parts manufacturing 369 238 211 rack Racers 350 Motor vehicle parts manufacturing 411 273 racks 472 Spectator sports 501 28 otals 12,942 5,968 5,50
14
nal employment estimates indicate that in all seven
egional economic development areas, the motorsports industry employment impacts exceeded
400 total jobs in 20 otorsports
industry is in the Carolinas Part direct employm
9,558 jobs acc ,248 indirect (supplier in) jo nd 3, indu obs for a total
employment i
Table 3
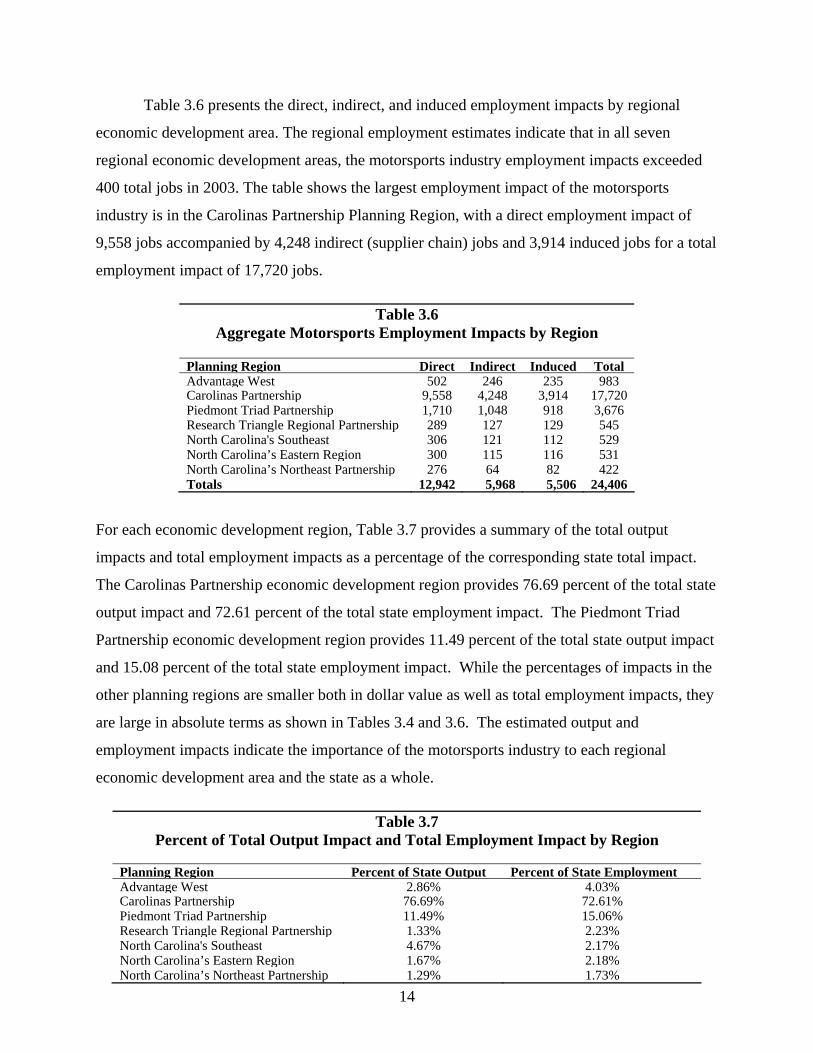
Table 3.6 presents the direct, indirect, and induced employment impacts by regional
economic development area. The regio
r
03. The table shows the largest employment impact of the m
nership Planning Region, with a ent impact of
ompanied by 4 cha bs a 914 ced j
mpact of 17,720 jobs.
.6 Aggregate Motorsports Emplo nt Im cts by egion
Plannin
yme pa R
g Region Direct Indirect Induced Total Advantage West 502 246 235 983 Carolinas Partnership 9,558 4,248 3,914 17,720 Piedmont Triad Partnership 1,710 1,048 918 3,676 Research Triangle Regional Partnership 289 127 129 545 North Carolina's Southeast 306 121 112 529 North Carolina’s Eastern Region 300 115 116 531 North Carolina’s Northeast Partnership 276 64 82 422 Totals 12,942 5,968 5,506 24,406
For each economic development region, Table 3.7 provides a summary of the total output
impacts and total employment impacts as a percentage of the corresponding state total impact.
The Carolinas Partnership economic development region provides 76.69 percent of the
output impact and 72.61 percent of the total state employment impact. The Piedmont Tria
Partnership economic development region provides 11
total state
d
.49 percent of the total state output impact
nd 15.08 percent of the total state employment impact. While the percentages of impacts in the
other pla ts, they
are large in absolute terms as shown in Tables 3.4 and 3.6. The estim
emp ts indicate the importance of torsports industry to each regional
eco and the state as a w
Tab
a
nning regions are smaller both in dollar value as well as total employment impac
ated output and
loyment impac the mo
nomic development area hole.
le 3.7 Percent of Total Output Impact and Employment Impac gion Total t by Re
Planning Region Percent of State Output Percent of State EmploymentAdvantage West 2.86% 4.03% Carolinas Partnership 76.69% 72.61% Piedmont Triad Partnership 11.49% 15.06% Research Triangle Regional Partnership 1.33% 2.23% North Carolina's Southeast 4.67% 2.17% North Carolina’s Eastern Region 1.67% 2.18% North Carolina’s Northeast Partnership 1.29% 1.73%
15
AN
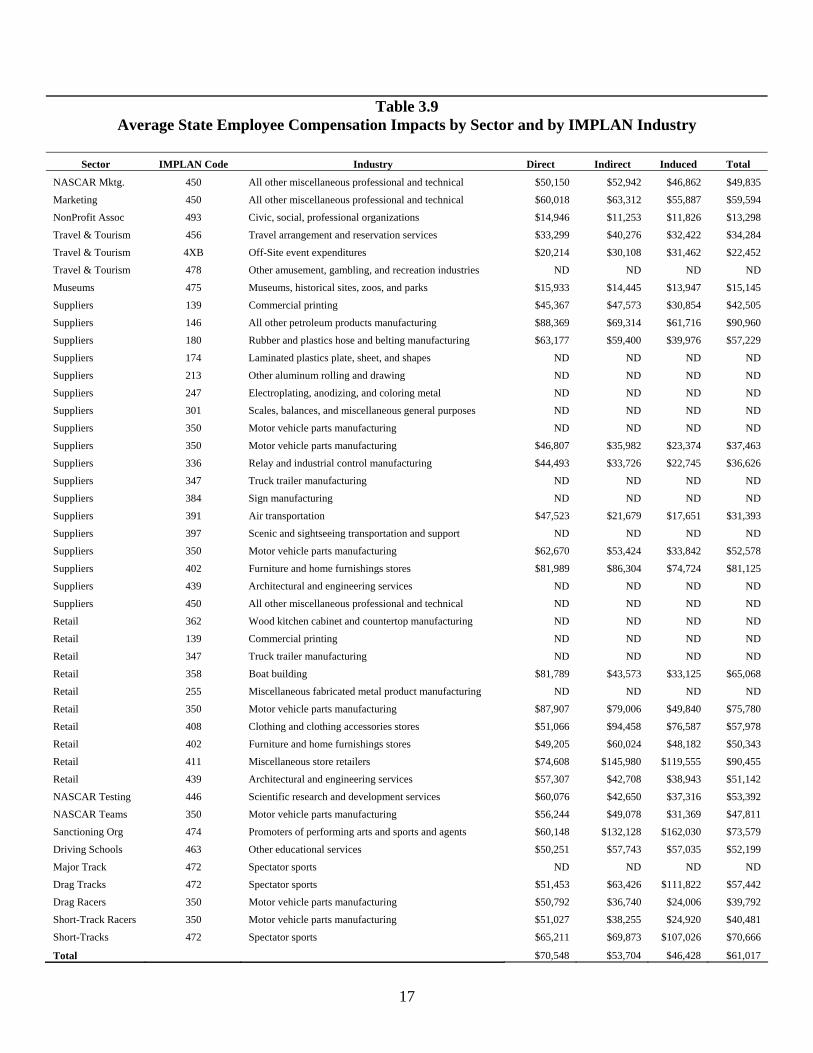
otorsports generated jobs (12,942 jobs) was $70,548 per year.
Assuming non-wage benefits are 25 percent of this total, the average annual wage of
ese direct jobs was $52,911 in 2003. Table 3.9 also indicates the overall average compensation
er employee for the state for all 24,406 direct, indirect, and induced jobs was $61,017 per year.
gain assuming non-wage benefits are 25 percent of this total, the average annual wage of these
bs was $45,763 in 2003.
Compensation Impacts: In addition to the output and employment impacts, estimates of
employee compensation impacts on a state level were made by motorsports sector and IMPL
Industry Code, displayed in Table 3.8. Compensation consists of all wage benefits and non-
wage benefits for the 24,406 North Carolina jobs estimated earlier.
Table 3.8 shows that just under 1.5 billion dollars ($1,489,175,042) of employee
compensation in 2003 resulted from direct, indirect, and induced economic activity related to the
motorsports industry. Table 3.9 provides the average compensation per job by motorsports
sector and IMPLAN Industry Code for the state. This table shows that the average compensation
per employee for the direct m
th
p
A
jo

16
3.8 Table S Emp n Impacts by Sector MP dus
or IMPL ode Indirect Induced
tate loyee Compensatio and by I LAN In try
Sect AN C Industry Direct Total
NASCAR Mktg. s professional and technical $450 All other miscellaneou $4,037,038 $762,303 1,103,917 $5,903,256
Marketing 450 All other miscellaneous professional and technical $ $1 $
ssoc
ourism $3,995, $1,219, $1,099, $6,314,
ourism $33,817, $5,290, $8,382, $47,489,
ourism dustries
$1,250, $613 $373 $2,238,
$1,560, $478 $395 $2,435,
acturing
cturing
et, and shapes
ng and drawing
izing, and coloring metal
es
$
ing $2,880, $1,108, $678 $4,667,
rs
rs $900, $279 $231 $1,410,
rs ortation and support
rs parts manufacturing $ $5 $ $1
rs $3,459, $689, $908, $5,058,
rs es
rs technical
anufacturing
uct manufacturing
$ $2 $1 $
sories stores
e furnishings stores $738, $156, $181, $1,075,
re retailers $ $1 $
es
services
ms ts manufacturing $ $1 $ $
ning Or 474 omoters of performing arts and sports and agents
Driving Schools 463 Other educational services $13,366,656 $2,638,258 $3,125,799 $19,130,713
Major Track ND
Drag Tracks $8,377,520
Drag Racers 350 Motor vehicle parts manufacturing $18,724,542 $8,754,452 $5,061,070 $32,540,066
Short-Trac tor vehicle parts manufacturing $20,966,434 $10,45 $5, 5,104
Shor 472 Spect $32,638,108 $1,934,8 $8,1
Tot $913,044,14 ,507,3 55,6 $1 2
48,475,231 $9,145,312 3,255,019 70,875,543
NonProfit A 493 Civic, social, professional organizations $836,992 $349,089 $231,670 $1,417,751
Travel & T 456 Travel arrangement and reservation services 878 071 492 441
Travel & T 4XB Off-Site event expenditures 322 089 123 530
Travel & T 478 Other amusement, gambling, and recreation in ND ND ND ND
Museums 475 Museums, historical sites, zoos, and parks 753 ,991 ,289 032
Suppliers 139 Commercial printing 617 ,725 ,798 141
Suppliers 146 All other petroleum products manuf $3,711,504 $1,075,824 $980,889 $5,768,202
Suppliers 180 Rubber and plastics hose and belting manufa $1,753,156 $432,051 $419,003 $2,604,210
Suppliers 174 Laminated plastics plate, she ND ND ND ND
Suppliers 213 Other aluminum rolli ND ND ND ND
Suppliers 247 Electroplating, anod ND ND ND ND
Suppliers 301 Scales, balances, and miscellaneous general purpos ND ND ND ND
Suppliers 350 Motor vehicle parts manufacturing ND ND ND ND
Suppliers 350 Motor vehicle parts manufacturing $2,963,908 1,566,797 $874,612 $5,405,314
Suppliers 336 Relay and industrial control manufactur 895 688 ,399 982
Suppliers 347 Truck trailer manufacturing ND ND ND ND
Supplie 384 Sign manufacturing ND ND ND ND
Supplie 391 Air transportation 004 ,101 ,750 858
Supplie 397 Scenic and sightseeing transp ND ND ND ND
Supplie 350 Motor vehicle 93,396,748 5,248,422 28,746,666 77,391,812
Supplie 402 Furniture and home furnishings stores 920 735 368 024
Supplie 439 Architectural and engineering servic ND ND ND ND
Supplie 450 All other miscellaneous professional and ND ND ND ND
Retail 362 Wood kitchen cabinet and countertop m ND ND ND ND
Retail 139 Commercial printing ND ND ND ND
Retail 347 Truck trailer manufacturing ND ND ND ND
Retail 358 Boat building $6,461,302 $701,024 $1,011,205 $8,173,531
Retail 255 Miscellaneous fabricated metal prod ND ND ND ND
Retail 350 Motor vehicle parts manufacturing 39,382,141 4,681,690 2,374,900 76,438,729
Retail 408 Clothing and clothing acces $2,451,180 $484,499 $595,276 $3,530,949
Retail 402 Furniture and hom 073 282 195 549
Retail 411 Miscellaneous sto 28,425,715 0,652,458 $8,159,557 47,237,748
Retail 439 Architectural and engineering servic $859,607 $112,698 $224,152 $1,196,457
NASCAR Testing 446 Scientific research and development $4,475,653 $148,247 $1,069,214 $5,693,108
NASCAR Tea 350 Motor vehicle par 256,387,134 58,698,503 81,162,825 496,248,438
Sanctio g Pr $1,593,931 $287,225 $418,829 $2,299,985
472 Spectator sports ND ND ND
472 Spectator sports $6,560,235 $306,416 $1,510,875
k Racers 350 Mo 3,716 964,973 $37,38
t-Tracks ator sports 31 00,826 $42,673,753
al 9 $320 45 $2 23,769 ,489,175,04
17
Table 3.9 Average S Emp n Impacts by Sector an PL du
or IMPL ode Direct In I
tate loyee Compensatio d by IM AN In stry
Sect AN C Industry direct nduced Total
NASCAR Mktg. s professional and technical 450 All other miscellaneou $50,150 $52,942 $46,862 $49,835
Marketing 450 All other miscellaneous professional and technical
ssoc
ourism $33, $40, $32 $34
ourism $20, $30, $31 $22
ourism dustries
$15, $14, $13 $15
$45, $47, $30 $42
cturing
cturing
et, and shapes
ng and drawing
izing, and coloring metal
es
ing $44, $33, $22 $36
rs
rs $47, $21, $17 $31
rs ortation and support
rs arts manufacturing
rs $81, $86, $74, $81,
rs es
rs technical
anufacturing
uct manufacturing
sories stores
e furnishings stores $49, $60, $48, $50,
re retailers $
es
services
ms ts manufacturing
nin Org
Driving Schools $52,199
Major Tra ND
Drag Tracks $57,442
Drag Rac $39,792
Short-Tra $40,481
Short-Tra $70,666
Total $61,017
$60,018 $63,312 $55,887 $59,594
NonProfit A 493 Civic, social, professional organizations $14,946 $11,253 $11,826 $13,298
Travel & T 456 Travel arrangement and reservation services 299 276 ,422 ,284
Travel & T 4XB Off-Site event expenditures 214 108 ,462 ,452
Travel & T 478 Other amusement, gambling, and recreation in ND ND ND ND
Museums 475 Museums, historical sites, zoos, and parks 933 445 ,947 ,145
Suppliers 139 Commercial printing 367 573 ,854 ,505
Suppliers 146 All other petroleum products manufa $88,369 $69,314 $61,716 $90,960
Suppliers 180 Rubber and plastics hose and belting manufa $63,177 $59,400 $39,976 $57,229
Suppliers 174 Laminated plastics plate, she ND ND ND ND
Suppliers 213 Other aluminum rolli ND ND ND ND
Suppliers 247 Electroplating, anod ND ND ND ND
Suppliers 301 Scales, balances, and miscellaneous general purpos ND ND ND ND
Suppliers 350 Motor vehicle parts manufacturing ND ND ND ND
Suppliers 350 Motor vehicle parts manufacturing $46,807 $35,982 $23,374 $37,463
Suppliers 336 Relay and industrial control manufactur 493 726 ,745 ,626
Suppliers 347 Truck trailer manufacturing ND ND ND ND
Supplie 384 Sign manufacturing ND ND ND ND
Supplie 391 Air transportation 523 679 ,651 ,393
Supplie 397 Scenic and sightseeing transp ND ND ND ND
Supplie 350 Motor vehicle p $62,670 $53,424 $33,842 $52,578
Supplie 402 Furniture and home furnishings stores 989 304 724 125
Supplie 439 Architectural and engineering servic ND ND ND ND
Supplie 450 All other miscellaneous professional and ND ND ND ND
Retail 362 Wood kitchen cabinet and countertop m ND ND ND ND
Retail 139 Commercial printing ND ND ND ND
Retail 347 Truck trailer manufacturing ND ND ND ND
Retail 358 Boat building $81,789 $43,573 $33,125 $65,068
Retail 255 Miscellaneous fabricated metal prod ND ND ND ND
Retail 350 Motor vehicle parts manufacturing $87,907 $79,006 $49,840 $75,780
Retail 408 Clothing and clothing acces $51,066 $94,458 $76,587 $57,978
Retail 402 Furniture and hom 205 024 182 343
Retail 411 Miscellaneous sto $74,608 145,980 $119,555 $90,455
Retail 439 Architectural and engineering servic $57,307 $42,708 $38,943 $51,142
NASCAR Testing 446 Scientific research and development $60,076 $42,650 $37,316 $53,392
NASCAR Tea 350 Motor vehicle par $56,244 $49,078 $31,369 $47,811
Sanctio g 474 omoters of performing arts and sports and agents $ $
463 Other educational services $50,251 $57,743 $57,035
ck 472 Spectator sports ND ND ND
472 Spectator sports $51,453 $63,426 $111,822
ers 350 Motor vehicle parts manufacturing $50,792 $36,740 $24,006
ck Racers 350 Motor vehicle parts manufacturing $51,027 $38,255 $24,920
cks 472 Spectator sports $65,211 $69,873 $107,026
$70,548 $53,704 $46,428
Pr $60,148 132,128 162,030 $73,579

18
ded in
ted as
is a
.10
d
oyed just over 6.7 percent of the 2003 state labor force.
the m 8
81 IMPLAN Industries in the state in 2003. Table 3.12
lso shows the total employment level and the value added for each of these 40 industries. If the
otorsports industry were included in this table, its direct 2003 output level of $,3,189,833,874
Table 3.3) would rank as the 30th lar in the state. Measured both by average
employee com lays a very
significant role in the state econom
Value Added Impacts. The output impacts reported earlier estimate the total spending
in North Carolina generated by the motorsports industry measured by the final selling prices of
goods and services. Value added impacts measure the value of North Carolina inputs inclu
the final selling price of a good or service. These value added impacts would be interpre
the impact of the North Carolina motorsports industry on Gross State Product (GSP). GSP
state measure analogous to Gross Domestic Product (GDP) for the national economy. Table 3
presents the estimated value added impacts by motorsports sector and IMPLAN Industry Code
for the state. The largest value added comes from the NASCAR Teams sector, IMPLAN
Industry Code 350, with a direct value added estimate of just under 400 million dollars
($399,396,748). Table 3.10 shows the NASCAR Teams sector activity also generated an
indirect value added impact of 253 million dollars and an induced value added impact of 187
million dollars for the North Carolina economy. Overall the motorsports industry in 2003 was
estimated to have a direct value added impact of 1.4 billion dollars ($1,426,829,620) and a total
value added impact on the state economy of just under 2.5 billion dollars ($2,496,911,841).
Comparative Analysis. For comparison purposes, Table 3.11 presents the IMPLAN
Industries in North Carolina with average compensation per employee for 2003 that exceede
$60,000 per year. These industries empl
If otorsports industry were included in this table, its average compensation level of $70,54
(from Table 3.9, for the 12,942 direct motorsports jobs) would be in the top 3.6 percent of all
jobs in the state. The average annual compensation for the 24,406 total motorsports generated
jobs (direct, indirect, and induced) of $61,017 also indicates that these jobs are, on average,
among the top paying jobs in the state.
Again for comparison purposes, Table 3.12 presents the IMPLAN Industries for the 40
largest private sector industries in the state in 2003, ranked by the dollar value of their output. It
should be noted there were a total of 4
a
m
(from gest industry
pensation and direct output impact, the motorsports industry clearly p
y.

19
3.10 Table State Value Added Impacts by Sector and by IMPLAN Industry
or IMPL ode Induced
Sect AN C Industry Direct Indirect Total
NASCAR Mktg. s professional and technical $ $ $ $450 All other miscellaneou 17,106,681 1,487,532 2,213,591 20,807,805
Marketing 450 All other miscellaneous professional and technical $2 $ $ $2
Assoc
ourism $5,502, $2,164, $2,199, $9,866,
ourism $62,162, $10,919, $16,884, $89,965,
ourism dustries
$1,294, $1,044, $740 $3,079,
$2,052, $834 $795 $3,682,
acturing
cturing
t, and shapes
ng and drawing
dizing, and coloring metal
es
ing $3,253, $1,795, $1,419, $6,468,
rs
rs $1,099, $444 $465 $2,009,
rs ortation and support
rs arts manufacturing $ $ $ $
rs $5,193, $1,265, $1,775, $8,234,
rs es
rs technical
anufacturing
$ $ $
uct manufacturing
$ $4 $2 $1
sories stores
e furnishings stores $1,107, $296, $364, $1,768,
re retailers $ $1 $
es
services
ms rts manufacturing $ $2 $
ning Org 474 omoters of performing arts and sports and agents
Driving School 463 Other educational services $21,089,826 $4,714,006 $6,281,518 $32,085,350
Major Track 472 Spectator sports ND ND ND ND
Drag Tracks 472 S 87,701 $3,069,690 $11,940,015
Drag Racers 350 Motor vehicle parts manufacturing $25,769,381 162,347 $11,00 837 $50,936,568
Short-Tra 350 Motor veh anufacturing $30,415,0 4,0 ,536,028
Short-Tracks ,743 $ 2,636 $16,191,150 8,545
Total ,620 $ 1,856 $542,660,395 11,841
05,410,567 17,835,291 26,575,483 49,821,360
NonProfit 493 Civic, social, professional organizations $866,494 $594,383 $463,403 $1,924,280
Travel & T 456 Travel arrangement and reservation services 131 259 877 264
Travel & T 4XB Off-Site event expenditures 229 546 000 691
Travel & T 478 Other amusement, gambling, and recreation in ND ND ND ND
Museums 475 Museums, historical sites, zoos, and parks 919 288 ,701 908
Suppliers 139 Commercial printing 061 ,924 ,386 371
Suppliers 146 All other petroleum products manuf $3,516,550 $2,036,357 $1,969,736 $7,522,658
Suppliers 180 Rubber and plastics hose and belting manufa $2,602,129 $752,452 $842,007 $4,196,588
Suppliers 174 Laminated plastics plate, shee ND ND ND ND
Suppliers 213 Other aluminum rolli ND ND ND ND
Suppliers 247 Electroplating, ano ND ND ND ND
Suppliers 301 Scales, balances, and miscellaneous general purpos ND ND ND ND
Suppliers 350 Motor vehicle parts manufacturing ND ND ND ND
Suppliers 350 Motor vehicle parts manufacturing $3,619,335 $2,552,709 $1,741,713 $7,913,758
Suppliers 336 Relay and industrial control manufactur 259 556 915 731
Suppliers 347 Truck trailer manufacturing ND ND ND ND
Supplie 384 Sign manufacturing ND ND ND ND
Supplie 391 Air transportation 542 ,218 ,719 479
Supplie 397 Scenic and sightseeing transp ND ND ND ND
Supplie 350 Motor vehicle p 121,199,326 91,021,341 59,556,798 271,777,465
Supplie 402 Furniture and home furnishings stores 461 549 748 765
Supplie 439 Architectural and engineering servic ND ND ND ND
Supplie 450 All other miscellaneous professional and ND ND ND ND
Retail 362 Wood kitchen cabinet and countertop m ND ND ND ND
Retail 139 Commercial printing ND ND ND ND
Retail 347 Truck trailer manufacturing ND ND ND ND
Retail 358 Boat building 10,133,637 1,251,793 $2,190,940 13,576,391
Retail 255 Miscellaneous fabricated metal prod ND ND ND ND
Retail 350 Motor vehicle parts manufacturing 48,423,207 1,043,376 4,951,536 14,418,119
Retail 408 Clothing and clothing acces $3,751,910 $916,652 $1,191,832 $5,860,398
Retail 402 Furniture and hom 875 997 127 999
Retail 411 Miscellaneous sto 38,077,487 9,996,913 16,351,377 $74,425,759
Retail 439 Architectural and engineering servic $1,305,222 $198,278 $450,461 $1,953,962
NASCAR Testing 446 Scientific research and development $4,876,637 $274,310 $2,148,725 $7,299,672
NASCAR Tea 350 Motor vehicle pa 399,396,748 53,528,534 $186,862,580 839,787,840
Sanctio Pr $2,761,355 $571,208 $849,484 $4,182,048
s
pectator sports $8,382,621 $4
$14, 4,
ck Racers icle parts m 94 $16,85 85 $13,266,842 $60
472 Spectator sports $41,704 3,00 $60,89
$1,426,829 527,42 $2,496,9

20
Table 3.11 Average Direct Compensation by Indus
IMPLAN Code Empl Compensation per Em
IMPLAN try
Industry Output oyment ployee 217 Copper wire, except mechanical, drawing $16,927,000 77 $198,078 322 Software reproducing $252,728,000 1,615 $
opper $$$
facturing $ 1, $anufacturing $ 2, $
$5, 14,724 e manufacturing $
$1 10,cine manufacturing $7, 17,580
anufacturing rument and lens manufacturing
facturing d part manufacturing
product manufacturing
$ 896
$ts manufacturing $ 1,4
ration and supply $ 1vice manufacturing $ 1,
$ 7acturing $3, 17,810
acturing $1, 6,manufacturing 1,
$ 1,082
anufacturing 1,
oil manufacturing on
turing ent $ 2,
pressor manufacturing Pump and pumping equipment manufacturing $239,204,000 954 $61,839 Paper and paperboard mills $2,365,434,000 5,962 $61,517
transportation $345,960,000 2,166 $61,431 318 Electricity and signal testing instruments $180,648,000 1,162 $60,982 298 Industrial process furnace and ove $60,861 424 Data $60,412 314 Search, detection, and navigation inst ments $107,92 0 28 $60,244 398 Postal service $1,767,929,000 24,080 $60,220
138,650 218 Secondary processing of c $3,946,000 11 135,909 316 Industrial process variable instruments $676,605,000 3,696 117,731 491 Religious organizations $612,694,000 3,954 112,039 305 Other computer peripheral equipment manu 519,827,000 683 111,393 159 Pesticide and other agricultural chemical M 1,322,934,000 120 105,199 302 Electronic computer manufacturing 030,955,000 $99,863 81 Flavoring syrup and concentrat 28,079,000 51 $87,745
304 Computer terminal manufacturing $168,328,000 1,455 $85,551 90 Cigarette manufacturing 9,600,447,000 855 $82,780
160 Pharmaceutical and medi 554,099,000 $82,239 306 Telephone apparatus m $768,096,000 1,509 $81,135 271 Optical inst $18,423,000 157 $80,815 149 Synthetic dye and pigment manu $264,842,000 960 $80,364 325 Electric lamp bulb an $10,140,000 59 $79,322 310 Electron tube manufacturing $3,045,000 17 $77,765 171 Other miscellaneous chemical $507,737,000 1,411 $77,035 147 Petrochemical manufacturing $391,366,000 897 $76,910 495 Federal electric utilities $33,401,000 72 $74,903 506 Federal Non-Military $2,527,621,000 28,776 $74,886 86 Breweries 486,865,000 $74,215
197 Gypsum product manufacturing $142,403,000 466 $72,991 417 Software publishers 1,570,342,000 6,430 $72,932 352 Aircraft engine and engine par 427,997,000 91 $72,429 30 Power gene 4,094,884,000 0,970 $71,271
311 Semiconductors and related de 202,729,000 231 $71,058 451 Management of companies and enterprises 8,087,053,000 2,253 $70,747 312 All other electronic component manuf 583,963,000 $70,257 29 Support activities for other mining $23,192,000 90 $69,533
345 Heavy duty truck manuf 857,593,000 552 $68,507 150 Other basic inorganic chemical $386,504,000 097 $68,463 51 Wet corn milling $57,945,000 71 $67,507
124 Pulp mills 455,487,000 $67,301 148 Industrial gas manufacturing $41,164,000 286 $67,147 285 Turbine and turbine generator set units m $808,965,000 541 $66,242 156 Nitrogenous fertilizer manufacturing $14,645,000 45 $66,222 211 Aluminum sheet, plate, and f $330,761,000 554 $64,668 396 Pipeline transportati $67,827,000 144 $63,069 189 Glass container manufacturing $215,961,000 986 $63,041 264 Paper industry machinery manufacturing $64,037,000 362 $62,343 83 Spice and extract manufac $10,454,000 32 $62,281
307 Broadcast and wireless communications equipm 1,212,694,000 965 $62,042 289 Air and gas com $206,338,000 814 $61,928 288 125 392 Rail
n manufacturi $33,098,000 202 processing services $2,310,375,000 14,958
ng
ru 0,00 5

21
Table 3.12
Largest 40 North Carolina IMPLAN Ind irec u
IM N Industry Empl
ustries by D t Outp t
PLA
Code Industry Output oyment Value Added
390 Wholesale trade $ 1 $21,573,695,000 71,629 14,414,401,000
90 Cigarette manufacturing $ $
$ 1
$ 2
mediaries $
t structures, nonfarm $
ns, dentists, and other health
nterprises
ance, except car wash
ne manufacturing
$
buildings $
ealers
stores
component manufacturing $
6 $
$
care facilities
rations, nonfarm
ric mills
cts, investments 3 $
Employment services $2,832,170,000 127,541 $2,444,198,000
97 Textile and fabric finishing mills $2,829,447,000 21,568 $670,537,000
363 Upholstered household furniture manufacturing $2,660,858,000 29,359 $870,117,000
0
19,600,447,000 10,855 11,434,884,000
431 Real estate 14,058,016,000 19,625 $9,800,317,000
481 Food services and drinking places 10,937,282,000 91,542 $5,173,825,000
430 Monetary authorities and depository credit inter 10,619,286,000 45,579 $7,239,979,000
33 New residential 1-uni 10,230,017,000 87,693 $3,230,836,000
467 Hospitals $9,433,186,000 88,423 $3,693,857,000
465 Offices of physicia $9,429,710,000 95,789 $7,139,754,000
451 Management of companies and e $8,087,053,000 72,253 $5,782,324,000
422 Telecommunications $8,037,309,000 32,452 $4,943,148,000
483 Automotive repair and mainten $7,560,902,000 61,646 $3,396,735,000
160 Pharmaceutical and medici $7,554,099,000 17,580 $3,309,088,000
394 Truck transportation $7,158,803,000 58,097 3,459,292,000
38 Commercial and institutional $6,962,454,000 91,466 2,713,096,000
427 Insurance carriers $6,300,783,000 37,246 $2,213,256,000
401 Motor vehicle and parts d $5,317,463,000 65,254 $3,412,125,000
302 Electronic computer manufacturing $5,030,955,000 14,724 $1,591,464,000
30 Power generation and supply $4,094,884,000 10,970 $2,644,751,000
405 Food and beverage $4,027,591,000 90,692 $2,226,401,000
350 Motor vehicle parts manufacturing $3,958,430,000 16,760 $996,327,000
92 Fiber, yarn, and thread mills $3,843,637,000 26,687 $918,830,000
312 All other electronic $3,583,963,000 17,810 1,522,356,000
41 Other new construction $3,507,973,000 2,660 1,884,465,000
439 Architectural and engineering services $3,373,769,000 44,288 $2,516,301,000
410 General merchandise stores $3,319,397,000 85,666 2,233,801,000
391 Air transportation $3,260,959,000 17,730 $1,230,253,000
468 Nursing and residential $3,208,609,000 86,306 $2,004,598,000
35 New residential additions and alte $3,177,793,000 29,116 $939,857,000
70 Poultry processing $3,152,513,000 22,747 $563,942,000
67 Animal, except poultry, slaughtering $3,041,850,000 7,989 $261,139,000
425 Nondepository credit intermediation and related a $3,033,299,000 21,566 $2,400,151,000
93 Broadwoven fab $2,994,333,000 23,485 $915,979,000
426 Securities, commodity contra $2,845,396,000 4,372 1,645,542,000
454
13 Animal production, except cattle and poultry and e $2,518,185,000 32,477 $463,017,000
404 Building material and garden supply stores $2,504,773,000 40,869 $1,696,858,000
437 Legal services $2,489,104,000 32,678 $1,888,653,000
12 Poultry and egg production $2,458,264,000 5,749 $993,573,00

22
n 2003 were estimated to have direct impacts that: (1) increased output by
lmost
ct
lars
of
stry on the North Carolina economy in 2003 were estimated to have: (1)
creased total output by just over 5.0 billion dollars ($5,075,067,394), (2) increased total
increased total employee compensation by just under 1.5 billion
dollars
Summary of State Impacts: The economic impacts of the motorsports industry on the North
Carolina economy i
a 3.2 billion dollars ($,3,189,833,874); (2) increased employment by 12,292 jobs; (3)
increased employee compensation by 913 million dollars ($913,044,149) with an average dire
compensation per job of $70,548 per year; and (4) increased value added by 1.4 billion dol
($1,426,829,620).
Adding the indirect and induced impacts to these direct impacts the economic impacts
the motorsports indu
in
employment by 24,406 jobs, (3)
($1,489,175,042), and (4) increased total value added by just under 2.5 billion dollars
($2,496,911,841).
Section 4: Regional Impacts
In this section the economic impacts generated by the motorsports industry are estimated
for each of the seven state regional economic development areas. The reported regional results
evelopment region is made
up of the 22 counties located in the far western corner of the state (Figure 4.1). This region has
age
re
the region, so that the total regional output impact of $1 spent by the Marketing firm increases
provide output impacts and employment impacts for each region by motorsports sector and
IMPLAN Industry Code. The state results reported in the previous section are the sum of these
regional estimates.
Advantage West Results: The Advantage West economic d
12 percent of the NC population and the region’s labor force is 11 percent of the NC labor force.
The largest employment sectors in this region are manufacturing and wholesale/retail trade. The
fastest growing sectors in the region are construction and services.
Table 4.1 and Table 4.2 present the output and employment multipliers for the Advant
West economic development region by motorsports sector and IMPLAN Industry Code. These
tables only present multipliers for the motorsports sectors and IMPLAN Industry Codes with
firms in the Advantage West region. Table 4.1 shows that for each dollar of direct expenditu
by a firm in the Marketing sector, IMPLAN Industry Code 450, there are 8.40 cents spent in
indirect (supplier chain) industries within the region and 17.69 cents in induced spending within

23
ect job at a firm in the Marketing
sector, IMPLAN Industry Code 450, there are 0.14 indirect (supplier chain) jobs, as well as 0.23
induced jobs, which (added t s. Each of the employment
multipliers in Table 4.2 can be interpreted in a similar manner.
Figure 4.1: Advantage West Region
regional output by $1.26. Each of the output multipliers in this table can be interpreted in a
similar manner. Table 4.2 shows that in this region, for each dir
o the direct job) adds up to 1.37 total job
Table 4.1
A tage W and by IM d
or IMPL e
dvan est Output Multipliers by Sector PLAN In ustry
Sect AN Cod Industry Direct Indirect Induced Total Marketing l and technical 450 All other miscellaneous professiona 1.000000 0.084009 0.176917 1.260926 NonProfit Assoc ns
parks rts manufacturing
s s manufacturing Drag Tracks 472 Spectator sports 1.000000 0.070567 0.556205 1.626772 Drag Racers 350 Motor vehicle parts manufacturing 1.000000 0.314199 0.199095 1.513295 Short-Track R ers 350 Motor vehicle parts manufacturing 1.000000 0.314199 0.199095 1.513295 Short-Tracks 472 Spectator sports 1.000000 0.070567 0.556205 1.626772
493 Civic, social, professional organizatio 1.000000 0.453653 0.301743 1.755396 Museums 475 Museums, historical sites, zoos, and 1.000000 0.453653 0.301743 1.755396 Suppliers 350 Motor vehicle pa 1.000000 0.314199 0.199095 1.513295 Suppliers 350 Motor vehicle parts manufacturing 1.000000 0.314199 0.199095 1.513295 Retail 350 Motor vehicle parts manufacturing
re retailers 1.000000 0.314199 0.199095 1.513295
Retail NASCAR Tea
411 350
Miscellaneous stoMotor vehicle part
1.000000 1.000000
0.331445 0.314199
0.306107 0.199095
1.637552 1.513295 m
ac

24
Table 4.2 Advantage West Employment Multipliers
or IMPL e
Sect AN Cod Industry Direct Indirect Induced Total Marketing 450 All other miscellaneous professional and technical 1.000000 0.138615 0.231579 1.370194 NonProfit Assoc ions
s and parks
rts manufacturing
s rts manufacturing Drag Tracks 472 Spectator sports 1.000000 0.033013 0.108283 1.141296 Drag Racers 69 2.320377 Short-Track R 769 2.320377 Short-Tracks 283 1.141296
493 Civic, social, professional organizat 1.000000 0.606453 0.251673 1.858126 Museum 475 Museums, historical sites, zoos, 1.000000 0.606453 0.251673 1.858126 Suppliers 350 Motor vehicle parts manufacturing 1.000000 0.678608 0.641769 2.320377 Suppliers 350 Motor vehicle pa 1.000000 0.678608 0.641769 2.320377 Retail 350 Motor vehicle parts manufacturing 1.000000 0.678608 0.641769 2.320377 Retail 411 Miscellaneous store retailers 1.000000 0.207609 0.183659 1.391268 NASCAR Team 350 Motor vehicle pa 1.000000 0.678608 0.641769 2.320377
350 Motor vehicle parts manufacturing 1.000000 0.678608 0.6417acers 350 Motor vehicle parts manufacturing 1.000000 0.678608 0.641
472 Spectator sports 1.000000 0.033013 0.108
Table 4.3 contains the estimated annual output impact on the Advantage West econom
by the motorsports industry, organized by motorsports sector and IMPLAN Industry Code. In
2003 total direct spending by all motorsports related firms in the region was $93,790,847. The
results show several ND (not disclosed) entries that reflect motorsports sectors and IMPLAN
Industry Codes where the number of firms is sufficiently small that confidentiality requi
y
res non-
isclosure. In addition to the direct output impacts there was $27,611,741 of indirect (supplier
hain) output impacts and $23,624,761 of induced economic impacts. The total output impact of
the motorsp
d
c
orts industry on the Advantage West economy in 2003 was $145,027,414.
Table 4.3
Advantage West Outp tor and by IM N Ind y
tor IMPL e I I
ut Impacts by Sec PLA ustr
Sec AN Cod Industry Direct ndirect nduced Total
Marketing l and
450 All other miscellaneous professionatechnical ND ND ND ND
NonProfit Assoc ions s s, and parks
nufacturing $19,108,841 $6,003,979 $3,804,475 $28,917,314
ms nufacturing $22,466,000 $472 ectator sports
Drag Racers 350 Motor vehicle parts manufacturing $7,762,500 $2,438,970 $1,545,475 $11,746,952 Short-Track R $19,464,757 Short-Tracks 8 $12,237,467 Region Totals $145,027,414
493 Civic, social, professional organizat ND ND ND ND Museum 475 Museums, historical sites, zoo ND ND ND ND Suppliers 350 Motor vehicle parts manufacturing $2,775,000 $871,902 $552,489 $4,199,394 Suppliers 350 Motor vehicle parts maRetail 350 Motor vehicle parts manufacturing ND ND ND ND Retail 411 Miscellaneous store retailers $18,000,000 $5,966,010 $5,509,926 $29,475,936 NASCAR Tea 350 Motor vehicle parts ma 7,058,795 $4,472,868 $33,997,685 Drag Tracks Sp ND ND ND ND
acers 350 Motor vehicle parts manufacturing $12,862,500 $4,041,385 $2,560,859 472 Spectator sports $7,522,546 $530,844 $4,184,07
$93,790,847 $27,611,741 $23,624,761

25
s where employment levels or the number of firms is sufficiently small
at confidentiality requires non-disclosure. Overall the motorsports industry generated a total of
983 jobs in 2003 for the region, consisting o t jobs, 246 indirect (supplier chain) jobs,
and 235 induced jobs.
Table 4.4 presents the 2003 impact of the motorsports industry on Advantage West employment.
Again the results show several ND (not disclosed) entries that reflect motorsports sectors and
IMPLAN Industry Code
th
f 502 direc
Table 4.4
Advantage West Employment Impacts by Sector and by Industry
or IMPL e Dir Indire Induce To
Sect AN Cod Industry ect ct d tal Marketing 450 All other miscellaneous professional and technical N N ND D D ND NonProfit Assoc ions
s and parks N N N
rts manufacturing N N N N
ms rts manufacturing 1 10 9 3472 ectator sports
Drag Racers 350 Motor vehicle parts manufacturing 31 21 20 72 Short-Trac 33 120 Short-Trac 8 81 Region To 235 983
493 Civic, social, professional organizat ND ND ND ND Museum 475 Museums, historical sites, zoos, D D D ND Suppliers 350 Motor vehicle parts manufacturing 13 9 8 30 Suppliers 350 Motor vehicle pa 66 45 42 153 Retail 350 Motor vehicle parts manufacturing D D D D Retail 411 Miscellaneous store retailers 75 16 14 104 NASCAR Tea 350 Motor vehicle pa 54 5 9 57 Drag Tracks Sp ND ND ND ND
k Racers 350 Motor vehicle parts manufacturing 52 35 ks 472 Spectator sports 71 2 tal 502 246
Carolinas Partnership Results: The Carolinas Partnership economic development region is
made up of the 12 counties located in the south central portion of the state (Figure 4.2). This
region has almost a quarter of the NC population and the region’s labor force is 25 percent of the
NC labor force. The largest employment sectors in this region are services. Manufacturing and
wholesale/retail trade and the fastest growing sectors in the region are construction and services.
This is
nas
e.
es
10.85 cents spent in indirect (supplier chain) industries within the region and 18.00 cents in
the region with the largest concentration of motorsports activity and the largest number of
motorsports related firms.
Table 4.5 and Table 4.6 present the output and employment multipliers for the Caroli
Partnership economic development region by motorsports sector and IMPLAN Industry Cod
These tables only present multipliers for the motorsports sectors and IMPLAN Industry Cod
for firms in the Carolinas Partnership region. Table 4.5 shows that for each dollar of direct
expenditure by a firm in the NASCAR Mktg. sector, IMPLAN Industry Code 450, there are

26
d
well as 0.29 induced jobs, which (added to the direct job) sums to 1.47 total jobs. Each of the
employment multipliers in er.
Figure 4.2: Carolinas Partnership Region
induced spending within the region, so that the total regional output impact of $1 spent by the
NASCAR Marketing firm is $1.29. Each of the output multipliers in this table can be interprete
in a similar manner. Table 4.6 shows that in this region, for each direct job in the NASCAR
Marketing sector, IMPLAN Industry Code 450, there are 0.18 indirect (supplier chain) jobs, as
Table 4.6 can be interpreted in a similar mann
Table
the motorsports industry, organized by motorspo ts sector and IMPLAN Industry Code. In 2003,
direct sp ng by on wa li s
($2,425,386,9 The entri fl r
rs and IM AN In firms is su y a
dentialit uires outp ts a
million dollars ($808,25 ) output imp 6 o
($658,573,71 induc pa m rt
industry on th rolina unde li s
($3,892,210,8 This e economic deve r n
4.7 contains the estimated annual output impact on the Carolinas Partnership economy by
r
total endi all motorsports related firms in the regi s 2.4 bil on dollar
63). results show several ND (not disclosed) es that re ect moto sports
secto PL dustry Codes where the number of fficientl small th t
confi y req non-disclosure. In addition to the direct ut impac there w s 808
0,117) of indirect (supplier chain acts and 58 milli n dollars
9) of ed economic impacts. The total output im ct of the otorspo s
e Ca s Partnership economy in 2003 was just r 3.9 bil on dollar
35). impact is the largest of all th lopment egions a d as

27
noted in Tabl , it rep e total motorsports industry output im
the state as a whole.
Table 4.5
e 3.7 resents 76.69 percent of th pact on
Caroli Partn and b A tr
tor IMPL e
nas ership Output Multipliers by Sector y IMPL N Indus y
Sec AN Cod Industry Direct Indirect Induced Total NASCAR Mktg. technical 450 All other miscellaneous professional and 1.000000 0.108524 0.180009 1.288533 Marketing 450 All other miscellaneous professional and technical 1.000000 0.108524 0.180009 1.288533 NonProfit Assoc
& Tourism eservation services & Tourism & Tourism creation industry
s s rs rs roducts manufacturing rs nufacturing
llaneous general purposes s manufacturing s manufacturing
Suppliers 397 Scenic and sightseeing transportation and support 1.000000 0.236051 0.413998 1.650049 Suppliers 350 Motor vehicle parts manufacturing 1.000000 0.414679 0.214517 1.629196 Suppliers 402 1.614675 Suppliers 439 0 0.167422 0.431679 1.599101 Suppliers 450 All other miscellaneous professional and technical 1.000000 0.108524 0.180009 1.288533 Retail Wood kitchen cabinet an p manufacturing 1.000000 0.319291 0.332339 30 R 13 C 1 9 R 25 M 1 9 R 35 M 1 6 R 40 C 1 3 R 4 F stores 1 5 R 41 M 1 1 R 43 A 1 1 NASCAR Testing 44 S evelopment services 1 6 NASCAR Teams 35 M 1 6 Sa rg 47 P 1 0 Driving Schools 46 O 1 2 M 47 S 1 8 D 47 S 1 8 D 35 M 1 6 Sh acers 35 M 1 6 Short-Tracks 472 S 1 8
493 Civic, social, professional organizations 1.000000 0.435805 0.411066 1.846871 Travel 456 Travel arrangement and r 1.000000 0.321342 0.351780 1.673122 Travel 4XB Off-Site event expenditures 1.000000 0.270537 0.353113 1.623650 Travel 478 Other amusement, gambling, and re 1.000000 0.257129 0.304988 1.562117 Museum 475 Museums, historical sites, zoos, and park 1.000000 0.435805 0.411066 1.846871 Supplie 139 Commercial printing 1.000000 0.307854 0.277385 1.585239 Supplie 146 All other petroleum and coal p 1.000000 0.221726 0.222960 1.444686 Supplie 180 Rubber and plastics hose and belting ma 1.000000 0.245731 0.254426 1.500157 Suppliers 174 Laminated plastics plate, sheet, and shapes 1.000000 0.256284 0.355638 1.611923 Suppliers 213 Other aluminum rolling and drawing 1.000000 0.112356 0.308266 1.420622 Suppliers 247 Electroplating, anodizing, and coloring metal 1.000000 0.198613 0.422215 1.620828 Suppliers 301 Scales, balances, and misce 1.000000 0.292553 0.246160 1.538713 Suppliers 350 Motor vehicle part 1.000000 0.414679 0.214517 1.629196 Suppliers 350 Motor vehicle part 1.000000 0.414679 0.214517 1.629196 Suppliers 347 Truck trailer manufacturing 1.000000 0.275521 0.240461 1.515982 Suppliers 384 Sign manufacturing 1.000000 0.401725 0.274253 1.675978 Suppliers 391 Air transportation 1.000000 0.296563 0.309483 1.606046
Furniture and home furnis 1.000000 0.265732 0.348943 Architectural and engineering services 1.00000
hings stores
362 d counterto 1.6516etail 9 ommercial printing .000000 0.307854 0.277385 1.58523etail 5 iscellaneous fabricated metal product manufacturing .000000 0.281399 0.219490 1.50088etail 0 otor vehicle parts manufacturing .000000 0.414679 0.214517 1.62919etail 8 lothing and clothing accessories stores .000000 0.250669 0.345914 1.59658etail 02 urniture and home furnishings .000000 0.265732 0.348943 1.61467etail 1 iscellaneous store retailers .000000 0.390105 0.336446 1.72655etail 9 rchitectural and engineering services .000000 0.167422 0.431679 1.59910
6 cientific research and d .000000 0.076564 0.602992 1.679550 otor vehicle parts manufacturing .000000 0.414679 0.214517 1.62919
nctioning O 4 romoters of performing arts and sports and agents .000000 0.189106 0.333104 1.522213 ther educational services .000000 0.232605 0.342577 1.57518
ajor Track 2 pectator sports .000000 0.128698 0.575320 1.70401rag Tracks 2 pectator sports .000000 0.128698 0.575320 1.70401rag Racers 0 otor vehicle parts manufacturing .000000 0.414679 0.214517 1.62919ort-Track R 0 otor vehicle parts manufacturing .000000 0.414679 0.214517 1.62919
pectator sports .000000 0.128698 0.575320 1.70401

28
Table 4.6
Carolinas Partnership Employment Multip
tor IMPL e
liers
Sec AN Cod Industry Direct Indirect Induced Total NASCAR Mktg. d technical 450 All other miscellaneous professional an 1.000000 0.178888 0.291911 1.470799 Marketing 450 All other miscellaneous professional and technical 1.000000 0.178888 0.291911 1.470799 NonProfit Assoc
& Tourism eservation services & Tourism & Tourism recreation industry
s rs rs roducts manufacturing rs nufacturing
laneous general purpose rts manufacturing rts manufacturing
Suppliers 397 Scenic and sightseeing transportation and support 1.000000 0.317028 0.674767 1.991795 Suppliers 350 Motor vehicle parts manufacturing 1.000000 0.700471 0.548276 2.248747 Suppliers 402 Furniture and home furnishings stores 1.000000 0.173577 0.250710 1.424287 Suppliers 439 Architectural and engineering services 1.000000 0.175919 0.383724 1.559643 Suppliers 450 All other miscellaneous prof ical 1.000000 0.178888 0.291911 1.470799 Retail 362 Wood kitchen cabinet a anufacturing 1.000000 0.191048 0.285834 1.476882 Retail 372911 1.665442 Retail 255 Miscellaneous fabricated metal product manufacturing 1.000000 0.321339 0.349911 1.671250 R 1 Motor vehi rts dealers 1.000 00471 76 2.2
408 res .000 827 1.402 s .00 577 1411 s .00000 409 1.3439 rvices .000 919 1.5
sting 446 d development services .00 65 1ams 350 .000000 471 0.54 2.248747
oning Org 474 and sports and age .00000 036 1.2g Schools 463 ational services .000 765 1.3 Track 472 .000 982 1.Tracks 472 .000 982 1.4Racers 350 ring .000000 471 0.54 2.248747-Track Racers 350 facturing .000000 471 0.54 2.248747-Tracks 472 .000000 982 0.33 1.439417
493 Civic, social, professional organizations 1.000000 0.549803 0.376886 1.926689 Travel 456 Travel arrangement and r 1.000000 0.248904 0.287824 1.536728 Travel 4XB Off-Site event expenditures 1.000000 0.104184 0.157871 1.262055 Travel 478 Other amusement, gambling, and 1.000000 0.182651 0.225571 1.408222 Museum 475 Museums, historical sites, zoos, and parks 1.000000 0.549803 0.376886 1.926689 Supplie 139 Commercial printing 1.000000 0.292531 0.372911 1.665442 Supplie 146 All other petroleum and coal p 1.000000 0.313736 0.418524 1.732260 Supplie 180 Rubber and plastics hose and belting ma 1.000000 0.262111 0.377707 1.639818 Suppliers 174 Laminated plastics plate, sheet, and shapes 1.000000 0.172066 0.355417 1.527483 Suppliers 213 Other aluminum rolling and drawing 1.000000 0.056833 0.236013 1.292846 Suppliers 247 Electroplating, anodizing, and coloring metal 1.000000 0.093083 0.298397 1.391480 Suppliers 301 Scales, balances, and miscel 1.000000 0.404239 0.470483 1.874722 Suppliers 350 Motor vehicle pa 1.000000 0.700471 0.548276 2.248747 Suppliers 350 Motor vehicle pa 1.000000 0.700471 0.548276 2.248747 Suppliers 347 Truck trailer manufacturing 1.000000 0.285229 0.379553 1.664782 Suppliers 384 Sign manufacturing 1.000000 0.347324 0.352501 1.699825 Suppliers 391 Air transportation 1.000000 0.679814 0.693283 2.373097
essional and technnd countertop m
139 Commercial printing 1.000000 0.292531 0.
etail 40 cle and pa 000 0.7 0.5482 48747Retail Clothing and clothing accessories sto 1 000 0.106 0.162151 268978 Retail Furniture and home furnishings store 1 0000 0.173 0.250710 .424287 Retail Miscellaneous store retailer 1 0 0.187 0.177786 65195 Retail Architectural and engineering se 1 000 0.175 0.383724 59643 NASCAR Te Scientific research an 1 0000 0.046 6 0.384608 .431264 NASCAR Te Motor vehicle parts manufacturing 1 0.700 8276 Sancti Promoters of performing arts nts 1 0 0.113 0.167656 80692 Drivin Other educ 1 000 0.171 0.206033 77798 Major Spectator sports 1 000 0.102 0.336435 439417 Drag Spectator sports 1 000 0.102 0.336435 39417 Drag Motor vehicle parts manufactu 1 0.700 8276 Short Motor vehicle parts manu 1 0.700 8276 Short Spectator sports 1 0.102 6435

29
Table 4.7 Carolinas Partnership Output Impacts by Sector a PL ustr
or IMPL ode
nd by IM AN Ind y
Sect AN C Industry Direct Indirect Induced Total
NASCAR Mktg. d technical $19,060, $2,068, $3,430, $24,559,450 All other miscellaneous professional an 000 467 972 439
Marketing 450 All other miscellaneous professional and technical $226,989, $24,633, $40,860, $292,483,
Assoc $1,499, $653 $616 $2,770,
& Tourism $5,821, $1,870, $2,047, $9,739,
& Tourism itures $83,976, $22,718, $29,653, $136,348,
& Tourism
s parks
rs
rs anufacturing $ $ $ $
rs belting manufacturing
rs es
ing metal
s
cturing
rts manufacturing $4,879, $2,023, $1,046, $7,949,
facturing
eeing transportation and support
350 otor vehicle parts manufacturing
Suppliers 402 Furniture and home furnishings stores ND ND ND ND
Suppliers 439 Architectural and engineering services ND ND ND ND
Suppliers 450 All other miscellaneous professional and technical ND ND ND ND
Retail 362 Wood kitchen cabinet and counterto ND ND ND ND
Retail 1 ND ND
Retail 2 ND ND
Retail 350 Motor vehicle parts manufacturing $190,163,984 $78,857,011 $40,793,407 $309,814,402
Retail and clothing accessories stores $5,040,000 $
R 402 niture a $4 0,649 $2,8
R 411 iscellane $25 1 1,322 13
R 439 chitectur $1,749,996 $2 437 $2,798
N 446 976,000 $4 3,480 037
N 350 otor veh $1,042,623,896 $4 5 $ 550
S 474 omoters D ND
D ls 463 Other educ 0,750,000 $7,1 4 $ 4,243 436
M 472 s ND ND ND
D 472 s D ND
D 350 otor veh $6,4 $ 0,376 293
S acers 350 otor veh 3,887,500 $9 5 4,275 $38,91
S 472 s $9,444,776 $1, 4 3,769 09
R 86,963 $808, 7 $ 719 2
847 846 215 909
NonProfit 493 Civic, social, professional organizations 976 ,697 ,589 262
Travel 456 Travel arrangement and reservation services 395 659 850 904
Travel 4XB Off-Site event expend 338 697 118 190
Travel 478 Other amusement, gambling, and recreation industry ND ND ND ND
Museum 475 Museums, historical sites, zoos, and $1,360,000 $592,695 $559,050 $2,511,745
Supplie 139 Commercial printing $4,808,748 $1,480,392 $1,333,875 $7,623,016
Supplie 146 All other petroleum and coal products m 14,445,532 3,202,950 3,220,776 20,869,258
Supplie 180 Rubber and plastics hose and $5,550,000 $1,363,807 $1,412,064 $8,325,871
Supplie 174 Laminated plastics plate, sheet, and shap ND ND ND ND
Suppliers 213 Other aluminum rolling and drawing ND ND ND ND
Suppliers 247 Electroplating, anodizing, and color ND ND ND ND
Suppliers 301 Scales, balances, and miscellaneous general purpose ND ND ND ND
Suppliers 350 Motor vehicle parts manufa ND ND ND ND
Suppliers 350 Motor vehicle pa 675 499 773 948
Suppliers 347 Truck trailer manu ND ND ND ND
Suppliers 384 Sign manufacturing ND ND ND ND
Suppliers 391 Air transportation $2,523,634 $748,417 $781,022 $4,053,073
Suppliers 397 Scenic and sights ND ND ND ND
Suppliers M $335,082,233 $138,951,565 $71,880,835 $545,914,634
p manufacturing
39 Commercial printing ND ND
55 Miscellaneous fabricated metal product manufacturing ND ND
408 Clothing $1,263,372 $1,743,407 8,046,778
etail Fur nd home furnishings stores $1,749,996 65,030 $61 25,675
etail M ous store retailers $65,749,992 ,649,40 $22,12 $1 ,520,714
etail Ar al and engineering services 92,988 $755, ,420
ASCAR Testing Scientific research and development services $5, 57,546 $3,60 $10, ,027
ASCAR Teams M icle parts manufacturing 32,354,23 223,660, $1,698,638,681
anctioning Org Pr of performing arts and sports and agents ND N ND
riving Schoo ational services $3 52,60 10,53 $48, ,847
ajor Track Spectator ports ND
rag Tracks Spectator ports ND N ND
rag Racers M icle parts manufacturing $15,525,000 37,891 3,33 $25, ,268
hort-Track R M icle parts manufacturing $2 ,905,64 $5,12 7,419
hort-Tracks Spectator ports 215,52 $5,43 $16, 4,068
egion Total $2,425,3 250,11 658,573, $3,892, 10,835

30
Table 4.8 Carolinas Partnership Employment Impacts by Sector and by Industry
or IMPL e Di Indi Indu
Sect AN Cod Industry rect rect ced Total NASCAR Mktg. d technical 450 All other miscellaneous professional an 78 14 23 115 Marketing 1,
soc & Tourism & Tourism itures 1, 1,
Tourism s s
rs 1 13 rs anufacturing rs belting manufacturing rs es N N N N
ing metal
cturing N Nts manufacturing
ND N ND
eeing transportation and support N N N350 otor vehicle parts manufacturing
Suppliers 402 Furniture and home furnishings stores ND ND ND ND Suppliers 439 Architectural and engineering services ND ND ND ND Suppliers 450 All other miscellaneous professional and technical ND ND ND ND Retail ND ND Retail ND ND Retail ND Retail 3 913 Retail 7 53 Retail 4 21 Retail 54 414 Retail 6 23 NASCAR T 29 107 NASCAR T 65 8,058 Sanctionin ND Driving Sch vices 266 46 55 366 Major Trac ND ND ND ND Drag Tracks 472 Spectator sports ND ND ND ND Drag Racer 5 143 Short-Track 4 220 Short-Track 138 Region To 4 17,720
450 All other miscellaneous professional and technical Civic, social, professional organizations
742 133 217 091 NonProfit As 493 42 23 16 81 Travel 456 Travel arrangement and reservation services 55 14 16 85 Travel 4XB Off-Site event expend 570 164 248 981 Travel & 478 Other amusement, gambling, and recreation industry ND ND ND ND Museum 475 Museums, historical sites, zoos, and park
Commercial printing 46 25 17 88
Supplie 139 34 0 57 Supplie 146 All other petroleum and coal products m 22 7 9 38 Supplie 180 Rubber and plastics hose and 28 7 10 46 Supplie 174 Laminated plastics plate, sheet, and shap D D D D Suppliers 213 Other aluminum rolling and drawing N
ND D N
ND D N
ND D ND
Suppliers 247 Electroplating, anodizing, and color ND Suppliers 301 Scales, balances, and miscellaneous general purpose ND ND ND ND Suppliers 350 Motor vehicle parts manufa ND D D ND Suppliers 350 Motor vehicle par 23 16 12 51 Suppliers 347 Truck trailer manufacturing
Sign manufacturing ND ND ND ND
Suppliers 384 D ND Suppliers 391 Air transportation 19 13 13 45 Suppliers 397 Scenic and sights D D D ND Suppliers M 960 673 526 2,159
362 Wood kitchen cabinet and countertop manufacturing ND ND 139 Commercial printing ND ND255 Miscellaneous fabricated metal product manufacturing ND ND ND 401 Motor vehicle and parts dealers 406 284 22408 Clothing and clothing accessories stores 42 4 402 Furniture and home furnishings stores 15 3 411 Miscellaneous store retailers 303 57 439 Architectural and engineering services 15 3
esting 446 Scientific research and development services 75 3 eams 350 Motor vehicle parts manufacturing 3,584 2,510 1,9
g Org 474 Promoters of performing arts and sports and agents ND ND ND ools 463 Other educational ser
k 472 Spectator sports
s 350 Motor vehicle parts manufacturing 64 45 3 Racers 350 Motor vehicle parts manufacturing 98 69 5s 472 Spectator sports 96 10 32
tal 9,558 4,248 3,91
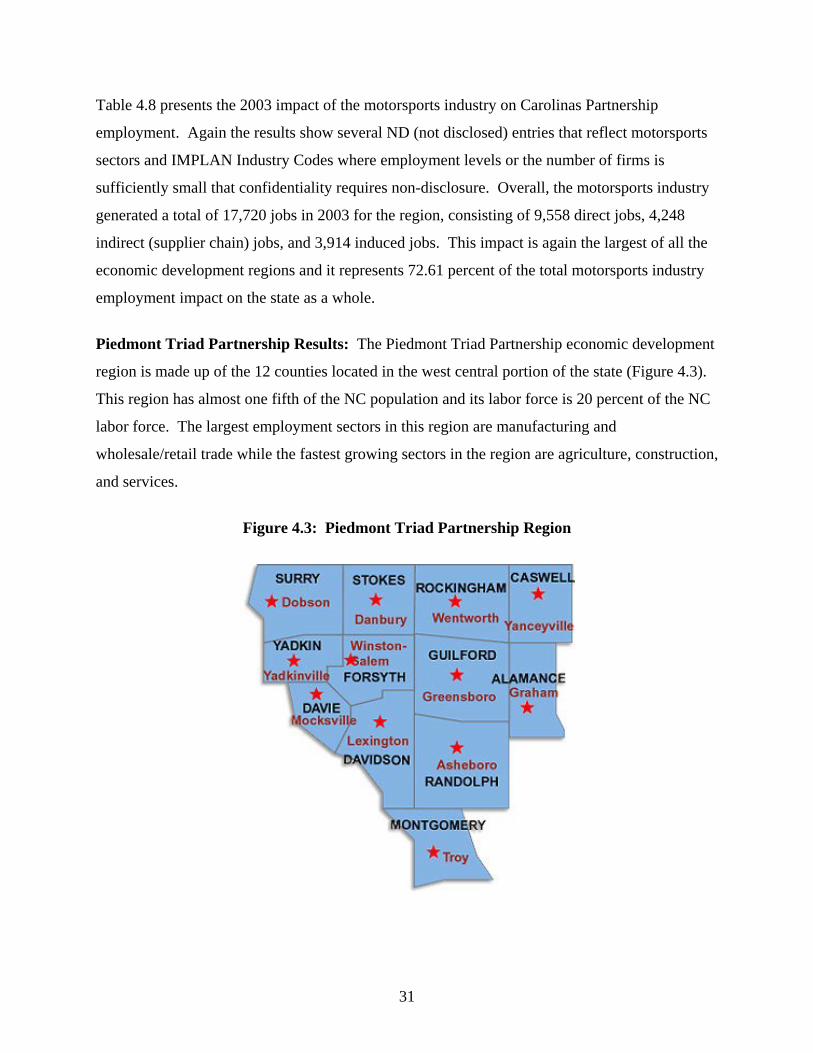
31
gain the results show several ND (not disclosed) entries that reflect motorsports
sectors and IMPLAN Industry Codes where employment levels or the number of firms is
sufficiently small that otorsports industry
generated a total of 17,720 jobs in 2003 for the region, consisting of 9,558 direct jobs, 4,248
indirect (supplier chain) jobs, and 3,914 induced jobs. This impact is again the largest of all the
economic development regions and it represents 72.61 percent of the total motorsports industry
employment impact on the state as a whole.
Piedmont Triad Partnership Results: The Piedmont Triad Partnership economic development
region is made up of the 12 counties located in the west central portion of the state (Figure 4.3).
This region has almost one fifth of the NC population and its labor force is 20 percent of the NC
labor force. The largest employment sectors in this region are manufacturing and
wholesale/retail trade while the fastest growing sectors in the region are agriculture, construction,
and services.
Figure 4.3: Piedmont Triad Partnership Region
Table 4.8 presents the 2003 impact of the motorsports industry on Carolinas Partnership
employment. A
confidentiality requires non-disclosure. Overall, the m

32
Table 4.9 and Table 4.10 present the output and employment multipliers for the Piedmont
Triad Partnership economic development re torsports sector and IMPLAN Industry
Co
odes fo Piedmont Triad Pa p region. Table 4.9 tha h
rect expe ure by tor, IM d d
e are 9.68 ts spe dustries within o .3
uced sp ng wi ional outpu o t
NASCAR M ting fi ach o p l
this table can nterpr s th r r
direct job at a firm in th or, IMPLAN Indu e e
0.18 indirect plier c uced jobs, whic t c
sums to 1.49 l jobs. ble b re
similar mann
gion by mo
de. These tables only present multipliers for the motorsports sectors and IMPLAN Industry
C r firms in the rtnershi shows t for eac dollar
of di ndit a firm in the NASCAR Marketing sec PLAN In ustry Co e 450,
ther cen nt in indirect (supplier chain) in the regi n and 19 5 cents
in ind endi thin the region, so that the total reg t impact f $1 spen by a
arke rm increases regional output by $1.29. E f the out ut multip iers in
be i eted in a similar manner. Table 4.10 show at in this egion, fo each
e NASCAR Marketing sect stry Cod 450, ther are
(sup hain) jobs, as well as 0.31 ind h (added o the dire t job)
tota Each of the employment multipliers in Ta 4.10 can e interp ted in a
er.
Table 4.9
Piedmont Triad Partnership Output Multipliers by Sector and by IMPLAN Indu
IMPL e
stry
Sector AN Cod Industry Direct Indirect Induced Total NASCAR Mktg. neous professional and technical 450 All other miscella 1.000000 0.096788 0.193488 1.290277 Marketing 450 All other miscellaneous professional and technical 1.000000 0.096788 0.193488 1.290277 NonProfit Assoc 493 Civic, social, professional organizations 1.000000 0.501677 0.368007 1.869684 Travel & Tourism 456 Travel arrangement and r es 1.000000 0.340294 0.345545 1.685839 Museums 475 0.501677 0.368007 1.869684 Suppliers 144 0.335792 0.191149 1.526941 Suppliers Motor vehicle parts manufacturing 1.000000
S350 Motor vehicle p
FTM cturing M
408 Clothing and cloMiscellaneous
Teams Mg Org P and agents s S
350 Motor vehicle prack Racers Mracks S
eservation servicMuseums, historical sites, zoos, and parks 1.000000 Asphalt shingle and coating materials manufacturing 1.000000
350 0.386889 0.229396 1.616285 0.383631 Suppliers 384 ign manufacturing 1.000000 0.285700 1 .669331
Suppliers Suppliers
arts manufacturing urniture and home furnishings stores
1.000000 1.000000
0.386889 0.229396 1.616285 0.247177 402 0.374330 1.621507
Retail 347 ruck trailer manufacturing 1.000000 0.313996 0.260706 1.574701 Retail 255 iscellaneous fabricated metal product manufa 1.000000 0.280236 0.236383 1.516619 Retail 350 otor vehicle parts manufacturing 1.000000 0.386889 0.229396 1.616285 Retail Retail
thing accessories stores store retailers
1.000000 1.000000
0.245749 0.365904 1.611652 0.364815 411 0.356529 1.721344
NASCAR 350 otor vehicle parts manufacturing romoters of performing arts and spor
1.000000 0.386889 0.229396 1.616285 Sanctionin 474 ts
pectator sports 1.000000 0.259353 0.309820 1.569173
Drag Track 472 1.000000 0.093101 0.610352 1.703453 Drag Racers Short-T
arts manufacturing otor vehicle parts manufacturing
1.000000 1.000000
0.386889 0.229396 1.616285 0.386889 350 0.229396 1.616285
Short-T 472 pectator sports 1.000000 0.093101 0.610352 1.703453

33
Table 4.10 Piedmont Triad Partnership Employment Mu
IMPL e
ltipliers
Sector AN Cod Industry Direct Indirect Induced Total NASCAR Mktg. neous professional and technical 450 All other miscella 1.000000 0.178280 0.315048 1.493328 Marketing 0.315048 1.493328 NonProfit Assoc 0.285543 1.811827 Travel & To 1.506238 Museums 475 Suppliers 2.530484 Suppliers 220 2.393347 Suppliers 384 Suppliers 0.638220 2.393347 Suppliers 57 1.479002 Retail 04 1.786596 Retail 1.772687 Retail 2.393347 Retail 1.267455 Retail 0.201934 1.407381 NASCAR Teams Sanctioning Org 72056 1.153275 Drag Tracks 1.186427 Drag Racers Short-Track 20 2.393347 Short-Track 1 1.186427
450 All other miscellaneous professional and technical 1.000000 0.178280493 Civic, social, professional organizations 1.000000 0.526284
urism 456 Travel arrangement and reservation services 1.000000 0.255992 0.250246 Museums, historical sites, zoos, and parks 1.000000 0.526284 0.285543 1.811827
144 Asphalt shingle and coating materials manufacturing 1.000000 0.861879 0.668605350 Motor vehicle parts manufacturing 1.000000 0.755127 0.638
Sign manufacturing 1.000000 0.369489 0.390447 1.759936 350 Motor vehicle parts manufacturing 1.000000 0.755127 402 Furniture and home furnishings stores 1.000000 0.189845 0.2891347 Truck trailer manufacturing 1.000000 0.349392 0.4372255 Miscellaneous fabricated metal product manufacturing 1.000000 0.367161 0.405526350 Motor vehicle parts manufacturing 1.000000 0.755127 0.638220 408 Clothing and clothing accessories stores 1.000000 0.107090 0.160365 411 Miscellaneous store retailers 1.000000 0.205447 350 Motor vehicle parts manufacturing 1.000000 0.755127 0.638220 2.393347 474 Promoters of performing arts and sports and agents 1.000000 0.081219 0.0
472 Spectator sports 1.000000 0.056916 0.129511350 Motor vehicle parts manufacturing 1.000000 0.755127 0.638220 2.393347
Racers 350 Motor vehicle parts manufacturing 1.000000 0.755127 0.6382s 472 Spectator sports 1.000000 0.056916 0.12951
Table 4.11 contains the estimated annual output impact on the Piedmont Triad
Partnership economy by the motorsports industry, organized by motorsports sector and IMPLAN
Industry Code. In 2003, total direct spending by all motorsports related firms in the region was
363 million dollars ($363,687,393). The re everal ND (not disclosed) entries that
refle
ufficie at confidentiality s non-disclosure. In addition to the direct
pacts the as 12 er cha im 9
llars of in ed ec utput impact of the torsports industry on the
Piedmont T Partn 583 million dollars ($583,179,862).
Tab 12 pr ports on t Tr
Partnership employment. Again the results show several ND (not disclosed) entries that reflect
motorsports sectors and IMPLAN Industry Codes where employment levels or the number of
firms is sufficiently small that confidentiality requires non-disclosure. Overall the motorsports
industry generated a total of 3,676 jobs in 2003 for the region, consisting of 1,702 direct jobs,
1,048 indirect (supplier chain) jobs, and 918 induced jobs.
sults show s
ct motorsports sectors and IMPLAN Industry Codes where the number of firms is
s ntly small th require output
im re w 8 million dollars of indirect (suppli in) output pacts and 1 million
do duc onomic impacts. The total o mo
riad ership economy in 2003 was
le 4. esents the 2003 impact of the motors industry Piedmon iad

34
Table 4.11 Piedmont Triad Partnership Output Impacts by Sector and by IMPLAN Industry
Sector IMPLAN Code Industry Direct Indirect Induced Total NASCAR Mktg. 450 All other miscellaneous professional and technical ND ND ND ND Marketing 450 All other miscellaneous professional and technical $18,457,826 $1,786,496 $3,571,368 $23,815,709 NonProfit Assoc 493 Civic, social, professional organizations ND ND ND ND Travel & Tourism 456 Travel arrangement and reservation services ND ND ND ND Museums 475 Museums, historical sites, zoos, and parks $1,062,000 $532,781 $390,823 $1,985,604 Suppliers 144 Asphalt shingle and coating materials manufacturing $445,535 $149,607 $85,164 $680,306 Suppliers 350 Motor vehicle parts manufacturing $4,095,998 $1,584,697 $939,606 $6,620,301 Suppliers 384 Sign manufacturing $1,136,134 $435,856 $324,593 $1,896,584 Suppliers 350 Motor vehicle parts manufacturing $60,821,874 $23,531,314 $13,952,295 $98,305,483 Suppliers 402 Furniture and home furnishings stores $7,920,000 $1,957,642 $2,964,694 $12,842,335 Retail 347 Truck trailer manufacturing ND ND ND ND Retail 255 Miscellaneous fabricated metal product manufacturing ND ND ND ND Retail 350 Motor vehicle parts manufacturing ND ND ND ND Retail 408 Clothing and clothing accessories stores ND ND ND ND Retail 411 Miscellaneous store retailers ND ND ND ND NASCAR Teams 350 Motor vehicle parts manufacturing $197,869,976 $76,553,717 $45,390,581 $319,814,274 Sanctioning Org 474 Promoters of performing arts and sports and agents ND ND ND ND Drag Tracks 472 Spectator sports $910,800 $84,796 $555,909 $1,551,505 Drag Racers 350 Motor vehicle parts manufacturing $20,700,000 $8,008,602 $4,748,497 $33,457,100 Short-Track Racers 350 Motor vehicle parts manufacturing $25,725,000 $9,952,720 $5,901,212 $41,578,932 Short-Tracks 472 Spectator sports $17,182,546 $1,599,712 $10,487,401 $29,269,660 Region Total $363,687,393 $128,263,452 $91,228,999 $583,179,862
Table 4.12 Piedmont Triad Partnership Employment Impacts by Sector and by Industry
Sector IMPLAN Code Industry Direct Indirect Induced Total NASCAR Mktg. 450 All other miscellaneous professional and technical ND ND ND ND Marketing 450 All other miscellaneous professional and technical 55 10 17 83 NonProfit Assoc 493 Civic, social, professional organizations ND ND ND ND Travel & Tourism 456 Travel arrangement and reservation services ND ND ND ND Museums 475 Museums, historical sites, zoos, and parks 19 10 5 34 Suppliers 144 Asphalt shingle and coating materials manufacturing 10 9 7 25 Suppliers 350 Motor vehicle parts manufacturing 17 13 11 41 Suppliers 384 Sign manufacturing 12 4 5 21 Suppliers 350 Motor vehicle parts manufacturing 266 201 170 636 Suppliers 402 Furniture and home furnishings stores 41 8 12 61 Retail 347 Truck trailer manufacturing ND ND ND ND Retail 255 Miscellaneous fabricated metal product manufacturing ND ND ND ND Retail 350 Motor vehicle parts manufacturing ND ND ND ND Retail 408 Clothing and clothing accessories stores ND ND ND ND Retail 411 Miscellaneous store retailers ND ND ND ND NASCAR Teams 350 Motor vehicle parts manufacturing 814 615 520 1,948 Sanctioning Org 474 Promoters of performing arts and sports and agents ND ND ND ND Drag Tracks 472 Spectator sports 26 1 3 30 Drag Racers 350 Motor vehicle parts manufacturing 85 64 54 202 Short-Track Racers 350 Motor vehicle parts manufacturing 105 79 67 252 Short-Tracks 472 Spectator sports 201 11 26 238 Region Total 1,710 1,048 918 3,676

35
Research Triangle Regional Partnership Results: The Research Triangle Regional
Partnership economic development region is made up of the 13 counties located in the north
central part of the state (Figure 4.4). This region has almost one fifth of the NC population and
the region’s labor force is about 20 percent of the NC labor force. The largest employment
sectors in this region are services, wholesale/retail trade, government, and manufacturing. The
fastest growing sectors in the region are construction, agriculture, and services.
Figure 4.4: Research Triangle Regional Partnership Region
Table 4.13 and Table 4.14 present the output and employment multipliers for the
Research Triangle Regional Partnership economic development region by motorsports sector and
IMPLAN Industry Code. These tables only present multipliers for the motorsports sectors and
IMPLAN Industry Codes for firms in the Research Triangle Regional Partnership region. Table
4.13 shows that for each dollar of direct expenditure by a firm in the Marketing sector, IMPLAN
Industry Code 450, there are 10.10 cents spent in indirect (supplier chain) industries within the
region and 18.33 cents in induced spending within the region, so that the total regional output
impact of $1 spent by the Marketing firm is $1.28. Each of the output multipliers in this table
can be interpreted in a similar manner. Table 4.14 shows that in this region, for each direct job at
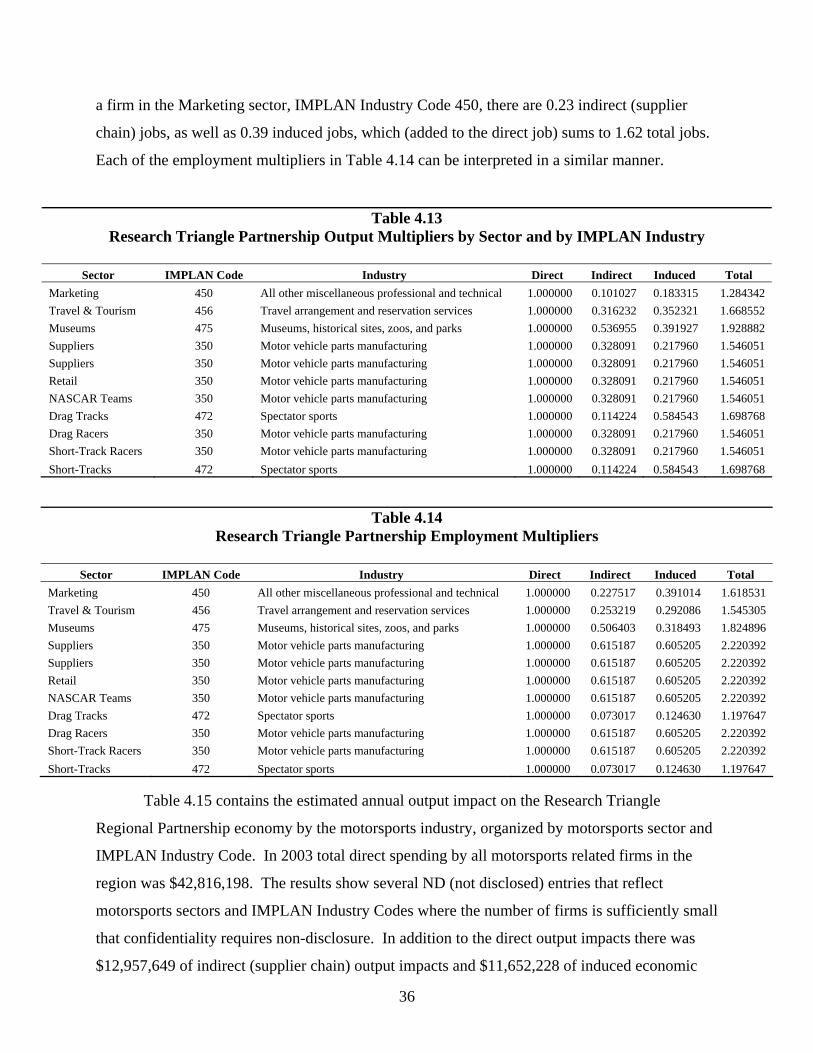
36
a firm in the Marketing sector, IMPLAN Industry Code 450, there are 0.23 indirect (supplier
chain) jobs, as well as 0.39 induced jobs, which (added to the direct job) sums to 1.62 total jobs.
Each of the employment multipliers in Table 4.14 can be interpreted in a similar manner.
Table 4.13 Research Triangle Partnership Output Multipliers by Sector and by IMPLAN Industry
Sector IMPLAN Code Industry Direct Indirect Induced Total
Marketing 450 All other miscellaneous professional and technical 1.000000 0.101027 0.183315 1.284342 Travel & Tourism 456 Travel arrangement and reservation services 1.000000 0.316232 0.352321 1.668552 Museums 475 Museums, historical sites, zoos, and parks 1.000000 0.536955 0.391927 1.928882 Suppliers 350 Motor vehicle parts manufacturing 1.000000 0.328091 0.217960 1.546051 Suppliers 350 Motor vehicle parts manufacturing 1.000000 0.328091 0.217960 1.546051 Retail 350 Motor vehicle parts manufacturing 1.000000 0.328091 0.217960 1.546051 NASCAR Teams 350 Motor vehicle parts manufacturing 1.000000 0.328091 0.217960 1.546051 Drag Tracks 472 Spectator sports 1.000000 0.114224 0.584543 1.698768 Drag Racers 350 Motor vehicle parts manufacturing 1.000000 0.328091 0.217960 1.546051 Short-Track Racers 350 Motor vehicle parts manufacturing 1.000000 0.328091 0.217960 1.546051 Short-Tracks 472 Spectator sports 1.000000 0.114224 0.584543 1.698768
Table 4.14 Research Triangle Partnership Employment Multipliers
Sector IMPLAN Code Industry Direct Indirect Induced Total
Marketing 450 All other miscellaneous professional and technical 1.000000 0.227517 0.391014 1.618531 Travel & Tourism 456 Travel arrangement and reservation services 1.000000 0.253219 0.292086 1.545305 Museums 475 Museums, historical sites, zoos, and parks 1.000000 0.506403 0.318493 1.824896 Suppliers 350 Motor vehicle parts manufacturing 1.000000 0.615187 0.605205 2.220392 Suppliers 350 Motor vehicle parts manufacturing 1.000000 0.615187 0.605205 2.220392 Retail 350 Motor vehicle parts manufacturing 1.000000 0.615187 0.605205 2.220392 NASCAR Teams 350 Motor vehicle parts manufacturing 1.000000 0.615187 0.605205 2.220392 Drag Tracks 472 Spectator sports 1.000000 0.073017 0.124630 1.197647 Drag Racers 350 Motor vehicle parts manufacturing 1.000000 0.615187 0.605205 2.220392 Short-Track Racers 350 Motor vehicle parts manufacturing 1.000000 0.615187 0.605205 2.220392 Short-Tracks 472 Spectator sports 1.000000 0.073017 0.124630 1.197647
Table 4.15 contains the estimated annual output impact on the Research Triangle
Regional Partnership economy by the motorsports industry, organized by motorsports sector and
IMPLAN Industry Code. In 2003 total direct spending by all motorsports related firms in the
region was $42,816,198. The results show several ND (not disclosed) entries that reflect
motorsports sectors and IMPLAN Industry Codes where the number of firms is sufficiently small
that confidentiality requires non-disclosure. In addition to the direct output impacts there was
$12,957,649 of indirect (supplier chain) output impacts and $11,652,228 of induced economic

37
impacts. The total output impact of the motorsports industry on the Research Triangle Regional
Partnership economy in 2003 was $67,426,077.
Table 4.15 Research Triangle Partnership Output Impacts by Sector and by IMPLAN Industry
Sector IMPLAN Code Industry Direct Indirect Induced Total
Marketing 450 All other miscellaneous professional and technical ND ND ND ND
Travel & Tourism 456 Travel arrangement and reservation services $3,357,129 $1,061,632 $1,182,787 $5,601,544
Museums 475 Museums, historical sites, zoos, and parks ND ND ND ND
Suppliers 350 Motor vehicle parts manufacturing ND ND ND ND
Suppliers 350 Motor vehicle parts manufacturing $12,702,479 $4,167,569 $2,768,632 $19,638,680
Retail 350 Motor vehicle parts manufacturing ND ND ND ND
NASCAR Teams 350 Motor vehicle parts manufacturing ND ND ND ND
Drag Tracks 472 Spectator sports ND ND ND ND
Drag Racers 350 Motor vehicle parts manufacturing $5,175,000 $1,697,871 $1,127,943 $8,000,814
Short-Track Racers 350 Motor vehicle parts manufacturing $12,862,500 $4,220,070 $2,803,511 $19,886,081
Short-Tracks 472 Spectator sports $3,660,092 $418,070 $2,139,481 $6,217,647
Region Total $42,816,198 $12,957,649 $11,652,228 $67,426,077 Table 4.16 presents the 2003 impact of the motorsports industry on Research Triangle Regional
Partnership employment. Again the results show several ND (not disclosed) entries that reflect
motorsports sectors and IMPLAN Industry Codes where employment levels or the number of
firms is sufficiently small that confidentiality requires non-disclosure. Overall the motorsports
industry generated a total of 545 jobs in 2003 for the region, consisting of 289 direct jobs, 127
indirect (supplier chain) jobs, and 129 induced jobs.
Table 4.16 Research Triangle Partnership Employment Impacts by Sector and by Industry
Sector IMPLAN Code Industry Direct Indirect Induced Total
Marketing 450 All other miscellaneous professional and technical ND ND ND ND Travel & Tourism 456 Travel arrangement and reservation services 50 13 15 77 Museums 475 Museums, historical sites, zoos, and parks ND ND ND ND Suppliers 350 Motor vehicle parts manufacturing ND ND ND ND Suppliers 350 Motor vehicle parts manufacturing 78 48 47 173 Retail 350 Motor vehicle parts manufacturing ND ND ND ND NASCAR Teams 350 Motor vehicle parts manufacturing ND ND ND ND Drag Tracks 472 Spectator sports ND ND ND ND Drag Racers 350 Motor vehicle parts manufacturing 21 13 12 46 Short-Track Racers 350 Motor vehicle parts manufacturing 51 31 31 114 Short-Tracks 472 Spectator sports 41 3 5 49 Region Total 289 127 129 545

38
North Carolina’s Southeast Results: The North Carolina’s Southeast economic development
region is made up of the 11 counties located in the southeast corner of the state (Figure 4.5).
This region has 12 percent of the NC population and the region’s labor force is about 11 percent
of the NC labor force. The largest employment sectors in this region are manufacturing and
wholesale/retail trade and, the fastest growing sectors in the region are agriculture, construction,
and services.
Figure 4.5: North Carolina’s Southeast Region
Table 4.17 and Table 4.18 present the output and employment multipliers for the North
Carolina’s Southeast economic development region by motorsports sector and IMPLAN Industry
Code. These tables only present multipliers for the motorsports sectors and IMPLAN Industry
Codes for firms in the North Carolina’s Southeast region. Table 4.17 shows that for each dollar
of direct expenditure by a firm in the Travel and Tourism sector, IMPLAN Industry Code 456,
there are 30.17 cents spent in indirect (supplier chain) industries within the region and 28.95
cents in induced spending within the region, so that the total regional output impact of $1 spent
by the Travel and Tourism firm amounts to $1.59. Each of the output multipliers in this table
can be interpreted in a similar manner. Table 4.18 shows that in this region, for each direct job at
a firm in the Travel and Tourism sector, IMPLAN Industry Code 456, there are 0.28 indirect

39
(supplier chain) jobs, as well as 0.25 induced jobs, which (added to the direct job) sums to 1.53
total jobs. Each of the employment multipliers in Table 4.18 can be interpreted in a similar
manner.
Table 4.17 North Carolina's Southeast Output Multipliers by Sector and by IMPLAN Industry
Sector IMPLAN Code Industry Direct Indirect Induced Total Travel & Tourism 456 Travel arrangement and reservation services 1.000000 0.301759 0.289479 1.591239 Travel & Tourism 4XB Off-Site event expenditures 1.000000 0.235990 0.310828 1.546818 Travel & Tourism 478 Other amusement, gambling, and recreation industry 1.000000 0.234738 0.266513 1.501251 Suppliers 350 Motor vehicle parts manufacturing 1.000000 0.267760 0.171795 1.439555 Suppliers 336 Relay and industrial control manufacturing 1.000000 0.262098 0.187998 1.450096 Suppliers 350 Motor vehicle parts manufacturing 1.000000 0.267760 0.171795 1.439555 Sanctioning Org 474 Promoters of performing arts and sports and agents 1.000000 0.172877 0.252017 1.424894 Major Track 472 Spectator sports 1.000000 0.054018 0.502069 1.556087 Drag Tracks 472 Spectator sports 1.000000 0.054018 0.502069 1.556087 Drag Racers 350 Motor vehicle parts manufacturing 1.000000 0.267760 0.171795 1.439555 Short-Track Racers 350 Motor vehicle parts manufacturing 1.000000 0.267760 0.171795 1.439555 Short-Tracks 472 Spectator sports 1.000000 0.054018 0.502069 1.556087
Table 4.18 North Carolina's Southeast Employment Multipliers
Sector IMPLAN Code Industry Direct Indirect Induced Total Travel & Tourism 456 Travel arrangement and reservation services 1.000000 0.280092 0.249942 1.530034 Travel & Tourism 4XB Off-Site event expenditures 1.000000 0.115562 0.162053 1.277615 Travel & Tourism 478 Other amusement, gambling, and recreation industry 1.000000 0.151822 0.167238 1.319060 Suppliers 350 Motor vehicle parts manufacturing 1.000000 0.617758 0.543571 2.161329 Suppliers 336 Relay and industrial control manufacturing 1.000000 0.507701 0.460635 1.968336 Suppliers 350 Motor vehicle parts manufacturing 1.000000 0.617758 0.543571 2.161329 Sanctioning Org 474 Promoters of performing arts and sports and agents 1.000000 0.057098 0.067434 1.124532 Major Track 472 Spectator sports 1.000000 0.018723 0.074659 1.093382 Drag Tracks 472 Spectator sports 1.000000 0.018723 0.074659 1.093382 Drag Racers 350 Motor vehicle parts manufacturing 1.000000 0.617758 0.543571 2.161329 Short-Track Racers 350 Motor vehicle parts manufacturing 1.000000 0.617758 0.543571 2.161329 Short-Tracks 472 Spectator sports 1.000000 0.018723 0.074659 1.093382
Table 4.19 contains the estimated annual output impact on the North Carolina’s Southeast
economy by the motorsports industry, organized by motorsports sector and IMPLAN Industry
Code. In 2003 total direct spending by all motorsports related firms in the region was
$155,651,653. The results show several ND (not disclosed) entries that reflect motorsports
sectors and IMPLAN Industry Codes where the number of firms is sufficiently small that
confidentiality requires non-disclosure. In addition to the direct output impacts there was
$18,304,765 of indirect (supplier chain) output impacts and $62,974,585 of induced economic

40
impacts. The total output impact of the motorsports industry on the North Carolina’s Southeast
economy in 2003 was $236,931,004.
Table 4.19 North Carolina's Southeast Output Impacts by Sector and by IMPLAN Industry
Sector IMPLAN Code Industry Direct Indirect Induced Total
Travel & Tourism 456 Travel arrangement and reservation services ND ND ND ND Travel & Tourism 4XB Off-Site event expenditures ND ND ND ND Travel & Tourism 478 Other amusement, gambling, and recreation industry ND ND ND ND Suppliers 350 Motor vehicle parts manufacturing ND ND ND ND Suppliers 336 Relay and industrial control manufacturing $12,949,997 $3,394,168 $2,434,574 $18,778,739 Suppliers 350 Motor vehicle parts manufacturing $8,614,010 $2,306,487 $1,479,844 $12,400,341 Sanctioning Org 474 Promoters of performing arts and sports and agents ND ND ND ND Major Track 472 Spectator sports ND ND ND ND Drag Tracks 472 Spectator sports $2,070,000 $111,817 $1,039,283 $3,221,100 Drag Racers 350 Motor vehicle parts manufacturing $15,525,000 $4,156,974 $2,667,117 $22,349,091 Short-Track Racers 350 Motor vehicle parts manufacturing $7,350,000 $1,968,036 $1,262,693 $10,580,729 Short-Tracks 472 Spectator sports ND ND ND ND Region Total $155,651,653 $18,304,765 $62,974,585 $236,931,004
Table 4.20 presents the 2003 impact of the motorsports industry on North Carolina’s Southeast
employment. Again the results show several ND (not disclosed) entries that reflect motorsports
sectors and IMPLAN Industry Codes where employment levels or the number of firms is
sufficiently small that confidentiality requires non-disclosure. Overall the motorsports industry
generated a total of 529 jobs in 2003 for the region, consisting of 306 direct jobs, 121 indirect
(supplier chain) jobs, and 112 induced jobs.
Table 4.20 North Carolina's Southeast Employment Impacts by Sector and by Industry
Sector IMPLAN Code Industry Direct Indirect Induced Total
Travel & Tourism 456 Travel arrangement and reservation services ND ND ND ND Travel & Tourism 4XB Off-Site event expenditures ND ND ND ND Travel & Tourism 478 Other amusement, gambling, and recreation industry ND ND ND ND Suppliers 350 Motor vehicle parts manufacturing ND ND ND ND Suppliers 336 Relay and industrial control manufacturing 65 33 30 127 Suppliers 350 Motor vehicle parts manufacturing 41 25 22 88 Sanctioning Org 474 Promoters of performing arts and sports and agents ND ND ND ND Major Track 472 Spectator sports ND ND ND ND Drag Tracks 472 Spectator sports 24 0 2 26 Drag Racers 350 Motor vehicle parts manufacturing 63 39 34 137 Short-Track Racers 350 Motor vehicle parts manufacturing 30 19 16 65 Short-Tracks 472 Spectator sports ND ND ND ND Region Total 306 121 112 529

41
North Carolina’s Eastern Region Results: The North Carolina’s Eastern Region
economic development area is made up of the 13 counties located in the southeast corner of the
state (Figure 4.6). This region has 12 percent of the NC population and the region’s labor force
is about 10 percent of the NC labor force. The largest employment sectors in this region are
wholesale/retail trade, government, and manufacturing and the fastest growing sectors in the
region are agriculture and services.
Figure 4.6: North Carolina’s Eastern Region
Table 4.21 and Table 4.22 present the output and employment multipliers for the North
Carolina’s Eastern Region economic development region by motorsports sector and IMPLAN
Industry Code. These tables only present multipliers for the motorsports sectors and IMPLAN
Industry Codes for firms in the North Carolina’s Eastern Region. Table 4.21 shows that for each
dollar of direct expenditure by a firm in the Travel and Tourism sector, IMPLAN Industry Code
456, there are 30.63 cents spent in indirect (supplier chain) industries within the region and 25.70
cents in induced spending within the region, so that the total regional output impact of $1 spent
by the Travel and Tourism firm is $1.56. Each of the output multipliers in this table can be
interpreted in a similar manner. Table 4.22 shows that in this region, for each direct job at a firm

42
in the Travel and Tourism sector, IMPLAN Industry Code 456, there are 0.25 indirect (supplier
chain) jobs, as well as 0.19 induced jobs, which (added to the direct job) adds up to 1.44 total
jobs. Each of the employment multipliers in Table 4.22 can be interpreted in a similar manner.
Table 4.21 North Carolina's Eastern Region Output Multipliers by Sector and by IMPLAN Industry
Sector IMPLAN Code Industry Direct Indirect Induced Total
Travel & Tourism 456 Travel arrangement and reservation services 1.000000 0.306311 0.256994 1.563305 Suppliers 350 Motor vehicle parts manufacturing 1.000000 0.239640 0.164814 1.404454 Suppliers 350 Motor vehicle parts manufacturing 1.000000 0.239640 0.164814 1.404454 Retail 350 Motor vehicle parts manufacturing 1.000000 0.239640 0.164814 1.404454 Drag Tracks 472 Spectator sports 1.000000 0.043641 0.483899 1.527540 Drag Racers 350 Motor vehicle parts manufacturing 1.000000 0.239640 0.164814 1.404454 Short-Track Racers 350 Motor vehicle parts manufacturing 1.000000 0.239640 0.164814 1.404454 Short-Tracks 472 Spectator sports 1.000000 0.043641 0.483899 1.527540
Table 4.22 North Carolina’s Eastern Region Employment Multipliers
Sector IMPLAN Code Industry Direct Indirect Induced Total
Travel & Tourism 456 Travel arrangement and reservation services 1.000000 0.247442 0.195201 1.442643 Suppliers 350 Motor vehicle parts manufacturing 1.000000 0.543818 0.536890 2.080708 Suppliers 350 Motor vehicle parts manufacturing 1.000000 0.543818 0.536890 2.080708 Retail 350 Motor vehicle parts manufacturing 1.000000 0.543818 0.536890 2.080708 Drag Tracks 472 Spectator sports 1.000000 0.008972 0.040217 1.049189 Drag Racers 350 Motor vehicle parts manufacturing 1.000000 0.543818 0.536890 2.080708 Short-Track Racers 350 Motor vehicle parts manufacturing 1.000000 0.543818 0.536890 2.080708 Short-Tracks 472 Spectator sports 1.000000 0.008972 0.040217 1.049189
Table 4.23 contains the estimated annual output impact on the North Carolina’s Eastern
Region economy by the motorsports industry, organized by motorsports sector and IMPLAN
Industry Code. In 2003 total direct spending by all motorsports related firms in the region was
$59,536,733. The results show several ND (not disclosed) entries that reflect motorsports sectors
and IMPLAN Industry Codes where the number of firms is sufficiently small that confidentiality
requires non-disclosure. In addition to the direct output impacts there was $12,632,591 of
indirect (supplier chain) output impacts and $12,581,445 of induced economic impacts. The
total output impact of the motorsports industry on the North Carolina’s Eastern Region economy
in 2003 was $84,750,769.

43
Table 4.23
North Carolina’s Eastern Region Output Impacts by Sector and by IMPLAN Industry
Sector IMPLAN Code Industry Direct Indirect Induced Total Travel & Tourism 456 Travel arrangement and reservation services ND ND ND NDSuppliers 350 Motor vehicle parts manufacturing ND ND ND NDSuppliers 350 Motor vehicle parts manufacturing $16,424,976 $3,936,081 $2,707,066 $23,068,123Retail 350 Motor vehicle parts manufacturing ND ND ND NDDrag Tracks 472 Spectator sports $3,105,000 $135,505 $1,502,506 $4,743,012Drag Racers 350 Motor vehicle parts manufacturing $20,700,000 $4,960,548 $3,411,650 $29,072,198Short-Track Racers 350 Motor vehicle parts manufacturing $11,025,000 $2,642,031 $1,817,074 $15,484,105Short-Tracks 472 Spectator sports $5,418,046 $236,449 $2,621,787 $8,276,282Region Total $59,536,733 $12,632,591 $12,581,445 $84,750,769
Table 4.24 presents the 2003 impact of the motorsports industry on North Carolina’s Eastern
Region employment. Again the results show several ND (not disclosed) entries that reflect
motorsports sectors and IMPLAN Industry Codes where employment levels or the number of
firms is sufficiently small that confidentiality requires non-disclosure. Overall the motorsports
industry generated a total of 531 jobs in 2003 for the region, consisting of 300 direct jobs, 115
indirect (supplier chain) jobs, and 116 induced jobs.
Table 4.24 North Carolina’s Eastern Region Employment Impacts by Sector and by Industry
Sector IMPLAN Code Industry Direct Indirect Induced Total
Travel & Tourism 456 Travel arrangement and reservation services ND ND ND ND Suppliers 350 Motor vehicle parts manufacturing ND ND ND ND Suppliers 350 Motor vehicle parts manufacturing 65 36 35 136 Retail 350 Motor vehicle parts manufacturing ND ND ND ND Drag Tracks 472 Spectator sports 35 0 1 37 Drag Racers 350 Motor vehicle parts manufacturing 84 46 45 174 Short-Track Racers 350 Motor vehicle parts manufacturing 45 24 24 93 Short-Tracks 472 Spectator sports 52 0 2 55 Region Total 300 115 116 531
North Carolina’s Northeast Partnership Results: The North Carolina’s Northeast Partnership
economic development region is made up of the 16 counties located in the southeast corner of
the state (Figure 4.7). This region has 5 percent of the NC population and the region’s labor
force is about 4 percent of the NC labor force. The largest employment sectors in this region are
wholesale/retail trade and manufacturing and the fastest growing sectors in the region are
agriculture, construction, and services.

44
Figure 4.7: North Carolina’s Northeast Partnership Region
Table 4.25 and Table 4.26 present the output and employment multipliers for the North
Carolina’s Northeast Partnership economic development region by motorsports sector and
IMPLAN Industry Code. These tables only present multipliers for the motorsports sectors and
IMPLAN Industry Codes for firms in the North Carolina’s Northeast Partnership region. Table
4.25 shows that for each dollar of direct expenditure by a firm in the Travel and Tourism sector,
IMPLAN Industry Code 478, there are 20.42 cents spent in indirect (supplier chain) industries
within the region and 22.34 cents in induced spending within the region, so that the total regional
output impact of $1 spent by the Travel and Tourism firm increases regional output by $1.43.
Each of the output multipliers in this table can be interpreted in a similar manner. Table 4.26
shows that in this region, for each direct job at a firm in the Travel and Tourism sector, IMPLAN
Industry Code 478, there are 0.12 indirect (supplier chain) jobs, as well as 0.14 induced jobs,
which (added to the direct job) sums to 1.26 total jobs. Each of the employment multipliers in
Table 4.26 can be interpreted in a similar manner.

45
Table 4.25
North Carolina’s Northeast Partnership Output Multipliers by Sector and by IMPLAN Industry
Sector IMPLAN Code Industry Direct Indirect Induced Total Travel & Tourism 4XB Off-Site event expenditures 1.000000 0.159231 0.249127 1.408357 Travel & Tourism 478 Other amusement, gambling, and recreation industry 1.000000 0.204157 0.223445 1.427602 Suppliers 350 Motor vehicle parts manufacturing 1.000000 0.191616 0.134770 1.326386 Suppliers 350 Motor vehicle parts manufacturing 1.000000 0.191616 0.134770 1.326386 Retail 357 Ship building and repairing 1.000000 0.120104 0.178576 1.298679 Drag Tracks 472 Spectator sports 1.000000 0.042864 0.439671 1.482534 Drag Racers 350 Motor vehicle parts manufacturing 1.000000 0.191616 0.134770 1.326386 Short-Track Racers 350 Motor vehicle parts manufacturing 1.000000 0.191616 0.134770 1.326386 Short-Tracks 472 Spectator sports 1.000000 0.042864 0.439671 1.482534
Table 4.26 North Carolina’s Northeast Partnership Employment Multipliers
Sector IMPLAN Code Industry Direct Indirect Induced Total
Travel & Tourism 4XB Off-Site event expenditures 1.000000 0.117878 0.180730 1.298608 Travel & Tourism 478 Other amusement, gambling, and recreation industry 1.000000 0.125189 0.138284 1.263473 Suppliers 350 Motor vehicle parts manufacturing 1.000000 0.524303 0.466823 1.991126 Suppliers 350 Motor vehicle parts manufacturing 1.000000 0.524303 0.466823 1.991126 Retail 357 Ship building and repairing 1.000000 0.203650 0.386421 1.590071 Drag Tracks 472 Spectator sports 1.000000 0.012042 0.055910 1.067952 Drag Racers 350 Motor vehicle parts manufacturing 1.000000 0.524303 0.466823 1.991126 Short-Track Racers 350 Motor vehicle parts manufacturing 1.000000 0.524303 0.466823 1.991126 Short-Tracks 472 Spectator sports 1.000000 0.012042 0.055910 1.067952
Table 4.27 contains the estimated annual output impact on the North Carolina’s Northeast
Partnership economy by the motorsports industry, organized by motorsports sector and IMPLAN
Industry Code. In 2003, total direct spending by all motorsports related firms in the region was
$48,964,088. The results show several ND (not disclosed) entries that reflect motorsports sectors
and IMPLAN Industry Codes where the number of firms is sufficiently small that confidentiality
requires non-disclosure. In addition to the direct output impacts, there was $6,921,114 of
indirect (supplier chain) output impacts and $9,656,260 of induced economic impacts. The total
output impact of the motorsports industry on the North Carolina’s Northeast Partnership
economy in 2003 was $65,541,433.
Table 4.28 presents the 2003 impact of the motorsports industry on North Carolina’s
Northeast Partnership employment. Again the results show several ND (not disclosed) entries
that reflect motorsports sectors and IMPLAN Industry Codes where employment levels or the
number of firms is sufficiently small that confidentiality requires non-disclosure. Overall, the

46
motorsports industry generated a total of 422 jobs in 2003 for the region, consisting of 276 direct
jobs, 64 indirect (supplier chain) jobs, and 82 induced jobs.
Table 4.27 North Carolina’s Northeast Partnership Output Impacts by Sector and by IMPLAN Industry
Sector IMPLAN Code Industry Direct Indirect Induced Total
Travel & Tourism 4XB Off-Site event expenditures $3,500,000 $557,308 $871,945 $4,929,251
Travel & Tourism 478 Other amusement, gambling, and recreation industry ND ND ND ND
Suppliers 350 Motor vehicle parts manufacturing ND ND ND ND
Suppliers 350 Motor vehicle parts manufacturing $5,562,492 $1,065,862 $749,657 $7,378,012
Retail 357 Ship building and repairing $21,249,600 $2,552,162 $3,794,669 $27,596,409
Drag Tracks 472 Spectator sports ND ND ND ND
Drag Racers 350 Motor vehicle parts manufacturing $5,175,000 $991,613 $697,435 $6,864,048
Short-Track Racers 350 Motor vehicle parts manufacturing $7,350,000 $1,408,378 $990,560 $9,748,937
Short-Tracks 472 Spectator sports $4,968,000 $212,948 $2,184,286 $7,365,229
Region Total $48,964,088 $6,921,114 $9,656,260 $65,541,433
Table 4.28 North Carolina’s Northeast Partnership Employment Impacts by Sector and by Industry
Sector IMPLAN Code Industry Direct Indirect Induced Total
Travel & Tourism 4XB Off-Site event expenditures 100 12 18 130 Travel & Tourism 478 Other amusement, gambling, and recreation industry ND ND ND ND Suppliers 350 Motor vehicle parts manufacturing ND ND ND ND Suppliers 350 Motor vehicle parts manufacturing 15 8 7 29 Retail 357 Ship building and repairing 79 16 31 126 Drag Tracks 472 Spectator sports ND ND ND ND Drag Racers 350 Motor vehicle parts manufacturing 21 11 10 42 Short-Track Racers 350 Motor vehicle parts manufacturing 30 16 14 60 Short-Tracks 472 Spectator sports 24 0 1 26 Region Total 276 64 82 422
The reported regional results for all seven regions were summed by motorsports sector
and IMPLAN Industry Code. The state results reported in the previous sections are the sum of
these regional estimates.
Section 5: Conclusions
This report has focused on the economic value that motorsports generates for the
North Carolina economy. At the state level four different types of economic impacts generated
by the motorsports industry were estimated based on 2003 information. These impacts include:
(1) output impacts; (2) employment impacts; (3) employee compensation impacts; and (4) value
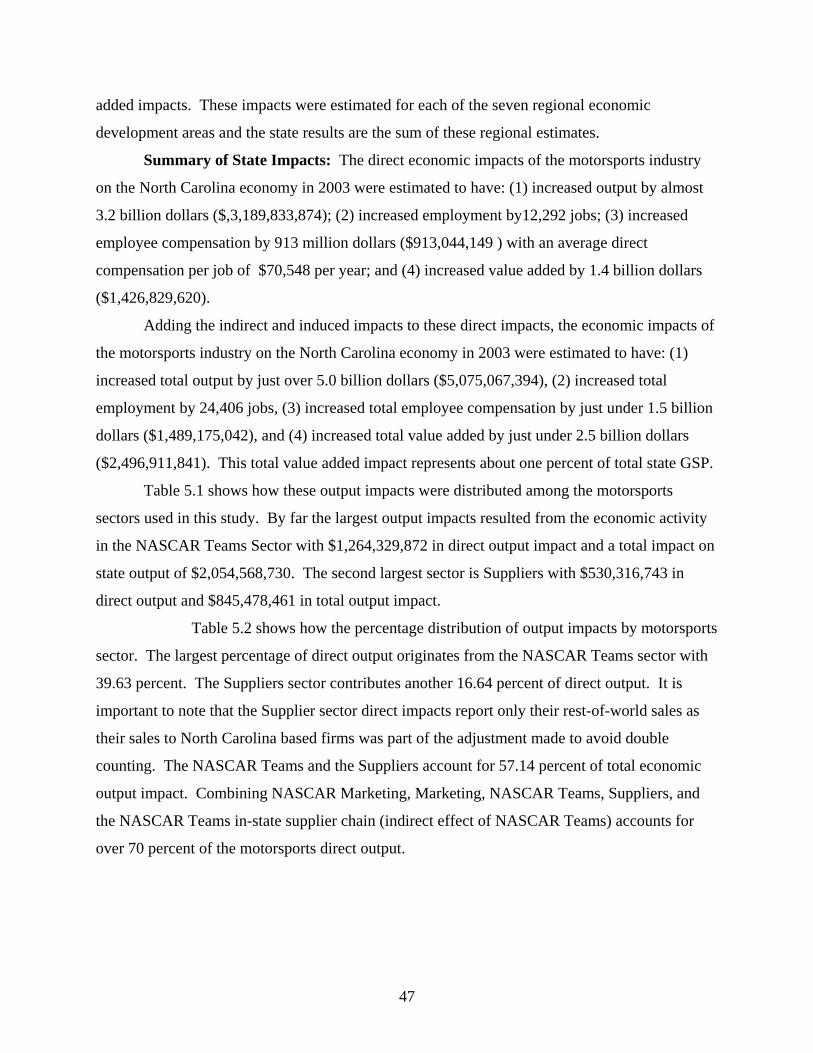
47
added impacts. These impacts were estimated for each of the seven regional economic
development areas and the state results are the sum of these regional estimates.
Summary of State Impacts: The direct economic impacts of the motorsports industry
on the North Carolina economy in 2003 were estimated to have: (1) increased output by almost
3.2 billion dollars ($,3,189,833,874); (2) increased employment by12,292 jobs; (3) increased
employee compensation by 913 million dollars ($913,044,149 ) with an average direct
compensation per job of $70,548 per year; and (4) increased value added by 1.4 billion dollars
($1,426,829,620).
Adding the indirect and induced impacts to these direct impacts, the economic impacts of
the motorsports industry on the North Carolina economy in 2003 were estimated to have: (1)
increased total output by just over 5.0 billion dollars ($5,075,067,394), (2) increased total
employment by 24,406 jobs, (3) increased total employee compensation by just under 1.5 billion
dollars ($1,489,175,042), and (4) increased total value added by just under 2.5 billion dollars
($2,496,911,841). This total value added impact represents about one percent of total state GSP.
Table 5.1 shows how these output impacts were distributed among the motorsports
sectors used in this study. By far the largest output impacts resulted from the economic activity
in the NASCAR Teams Sector with $1,264,329,872 in direct output impact and a total impact on
state output of $2,054,568,730. The second largest sector is Suppliers with $530,316,743 in
direct output and $845,478,461 in total output impact.
Table 5.2 shows how the percentage distribution of output impacts by motorsports
sector. The largest percentage of direct output originates from the NASCAR Teams sector with
39.63 percent. The Suppliers sector contributes another 16.64 percent of direct output. It is
important to note that the Supplier sector direct impacts report only their rest-of-world sales as
their sales to North Carolina based firms was part of the adjustment made to avoid double
counting. The NASCAR Teams and the Suppliers account for 57.14 percent of total economic
output impact. Combining NASCAR Marketing, Marketing, NASCAR Teams, Suppliers, and
the NASCAR Teams in-state supplier chain (indirect effect of NASCAR Teams) accounts for
over 70 percent of the motorsports direct output.

48
Table 5.1 State Output Impact by Motorsports Sector
Sector Direct Indirect Induced Total
NASCAR Marketing $20,560,000 $2,213,649 $3,721,204 $26,494,854 Marketing $246,876,720 $26,548,479 $44,687,445 $318,112,661 Nonprofit Associations $1,999,968 $892,526 $784,024 $3,676,518 Travel & Tourism $99,261,967 $26,949,404 $34,512,216 $160,723,619 Museums $3,302,000 $1,567,008 $1,261,221 $6,130,228 Suppliers $530,316,743 $199,943,364 $115,218,331 $845,478,461 Retail $314,365,556 $118,352,910 $77,960,642 $510,679,086 NASCAR Testing $5,976,000 $457,546 $3,603,480 $10,037,027 NASCAR Teams $1,264,329,872 $516,416,231 $273,822,605 $2,054,568,730 Sanctioning Organizations $4,709,987 $882,067 $1,436,021 $7,028,075 Driving Schools $30,750,000 $7,152,604 $10,534,243 $48,436,847 Major Track $415,887,840 $45,712,931 $231,607,053 $693,207,824 Drag Tracks $10,020,215 $718,976 $5,272,608 $16,011,800 Drag Racers $90,562,500 $28,692,469 $17,528,493 $136,783,470 Short-Track Racers $101,062,500 $34,138,264 $20,460,184 $155,660,961 Short-Tracks $49,852,006 $4,303,001 $27,882,228 $82,037,233 Totals $3,189,833,874 $1,014,941,429 $870,291,997 $5,075,067,394
Table 5.2 State Percentage Contributions by Motorsports Sector
Sector Direct Indirect Induced Total
NASCAR Marketing 0.64% 0.22% 0.43% 0.52% Marketing 7.74% 2.62% 5.13% 6.27% Nonprofit Associations 0.06% 0.09% 0.09% 0.07% Travel & Tourism 3.11% 2.66% 3.97% 3.17% Museums 0.10% 0.15% 0.14% 0.12% Suppliers 16.64% 19.70% 13.24% 16.66% Retail 9.85% 11.66% 8.96% 10.06% NASCAR Testing 0.19% 0.05% 0.41% 0.20% NASCAR Teams 39.63% 50.88% 31.46% 40.48% Sanctioning Organizations 0.15% 0.09% 0.17% 0.14% Driving Schools 0.96% 0.70% 1.21% 0.95% Major Track 13.04% 4.50% 26.61% 13.66% Drag Tracks 0.31% 0.07% 0.61% 0.32% Drag Racers 2.84% 2.83% 2.01% 2.70% Short-Track Racers 3.17% 3.36% 2.35% 3.07% Short-Tracks 1.56% 0.42% 3.20% 1.62% Totals 100.00% 100.00% 100.00% 100.00%
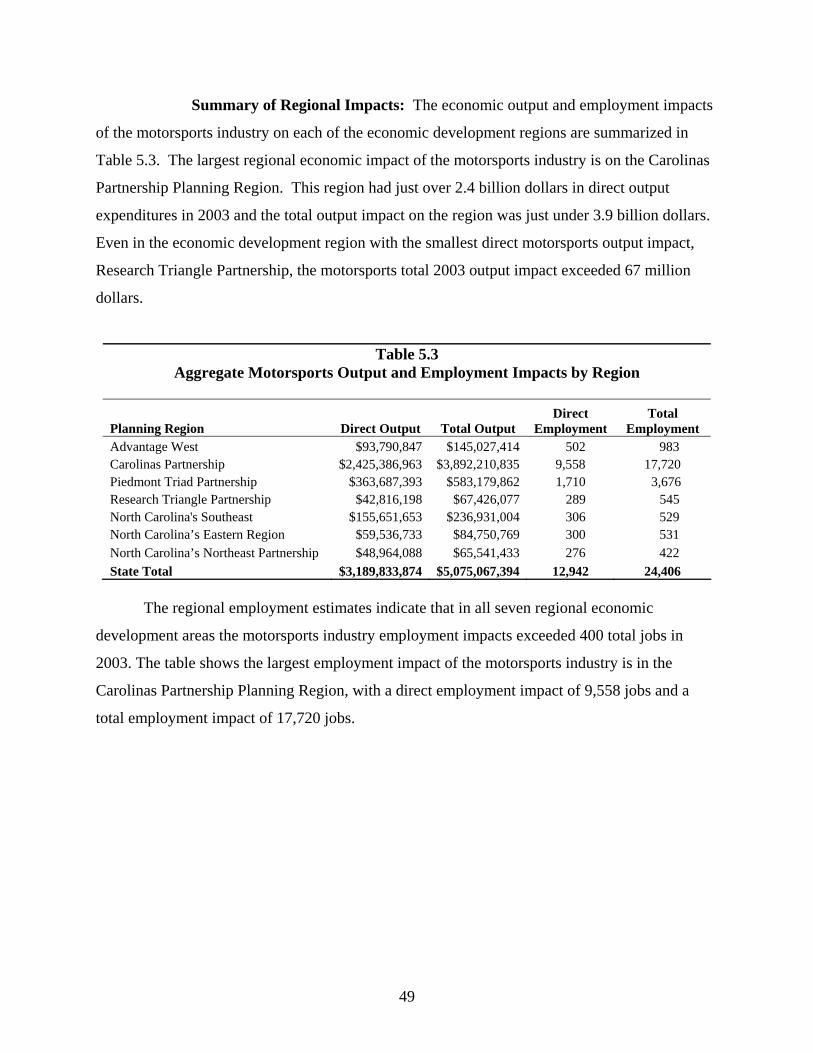
49
Summary of Regional Impacts: The economic output and employment impacts
of the motorsports industry on each of the economic development regions are summarized in
Table 5.3. The largest regional economic impact of the motorsports industry is on the Carolinas
Partnership Planning Region. This region had just over 2.4 billion dollars in direct output
expenditures in 2003 and the total output impact on the region was just under 3.9 billion dollars.
Even in the economic development region with the smallest direct motorsports output impact,
Research Triangle Partnership, the motorsports total 2003 output impact exceeded 67 million
dollars.
Table 5.3 Aggregate Motorsports Output and Employment Impacts by Region
Planning Region Direct Output Total Output Direct
Employment Total
Employment Advantage West $93,790,847 $145,027,414 502 983 Carolinas Partnership $2,425,386,963 $3,892,210,835 9,558 17,720 Piedmont Triad Partnership $363,687,393 $583,179,862 1,710 3,676 Research Triangle Partnership $42,816,198 $67,426,077 289 545 North Carolina's Southeast $155,651,653 $236,931,004 306 529 North Carolina’s Eastern Region $59,536,733 $84,750,769 300 531 North Carolina’s Northeast Partnership $48,964,088 $65,541,433 276 422 State Total $3,189,833,874 $5,075,067,394 12,942 24,406
The regional employment estimates indicate that in all seven regional economic
development areas the motorsports industry employment impacts exceeded 400 total jobs in
2003. The table shows the largest employment impact of the motorsports industry is in the
Carolinas Partnership Planning Region, with a direct employment impact of 9,558 jobs and a
total employment impact of 17,720 jobs.

50
Bibliography
Brooks Institute. The Clemson University Motorsports Program. Posted on Clemson University’s website www.clemson.edu February 2004 Cabarrus Economic Development. Motorsports Businesses in Cabarrus County. Prepared for Cabarrus Regional Chamber of Commerce. August 2002. Charlotte USA, 2003. Motorsports. Special Report prepared for the Charlotte Regional Partnership posted on www.charlotteusa.com Chmura Economics & Analytics. An Impact Analysis of the Dragons Ridge Motorsports Park on the Economy of New Kent County, Virginia. Prepared for Dominion Land Ventures, LLC. July 14 2003. Clemson University Press Release. Clemson Research Campus will Make SC an Automotive Research Hub. Posted on PR News on November 13, 2003 Commonwealth of Virginia, Office of the Governor. 2003. Governor Warner Launches Virginia Motorsports Initiative. Press Release available at www.yesvirginia.org. Connaughton, John E. The Economic Impact of Lowe’s Motor Speedway on the Cabarrus, Iredell and Mecklenburg County Economies. Prepared for Lowe’s Motor Speedway. 2000. Connaughton, John E. The Economic Impact of Sports on the North Carolina Economy. Prepared for the North Carolina Department of Commerce. 1997. Frost Motorsports, 2003. Hampton Motorsports Complex Impact Study. Prepared for the City of Hampton, Virginia, January 2003 Hartgen, David, Lord, Dennis, Campbell, Harrison and Spawn, David, 1996. Survey of the Motorsport Industry in Cabarrus, Iredell and Mecklenburg Counties. Prepared for the Cabarrus Chamber of Commerce, Cabarrus Economic Development, City of Concord and Cabarrus County Tourism Authority by UNC Charlotte. Henry, Nick and Pinch, Steven, 2000. The Industrial Agglomeration of Motor Sport Valley. Pages 120–141 in Bryson, J., Daniels, J, Henry, N and Pollard, J Knowledge, Space and Economy, London, Routledge. Indianapolis Regional Economic Development Partnership. 2001. The Partnership Report. Posted on www.iredp.com. International Center for Automotive Research, 2004. Special report by Upstate Alliance (South Carolina) on Motorsport Industry posted on www.upstatealliance.com. Langston, Jennifer. 2004. NASCAR Boosters Release glowing Economic Report. Seattle Post Intelligencer. May 2004.

51
Lilley, William and DeFranco, Laurence, 1999. The Economic Impact of the European Grands Prix. Presented to the Federation Internationale de l’Automobile, February 2003. Lilley, William and DeFranco, Laurence, 1999. The Economic Impact of the Network Q Rally of Great Britain. Commissioned by the Motorsports Association, Colnbrook England. MRA (Motorsport Research Associates). 2002. USA Motorsport – Market Research Report. Prepared for MIA (Motorsports Industry Association). MIA (Motorsports Industry Association), 2003. The Economic Impact of the 2002 FIA Foster’s British Grand Prix. Final Report issued July 2003. Motorsport New Zealand. Towards 2010. Report issued April 20, 2000 for Motorsport New Zealand Inc. Motorsport Valley. Workforce Development Plan. Motorsports Industry Association, May 2003. Northamtonshire Chamber. Introduction to the Government Motorsport Unit. Posted on website www.northants-chamber.co.uk as of February 2004. Northamptonshire Partnership, 2003. Punching Above Its Weight: The Motorsports Industry in Northamptonshire. Report of the Motorsport Competitiveness Panel, 2003. Presented to the Secretary of State for Trade and Industry, United Kingdom. The Business Journal – Serving the Triangle’s Business Communities (Raleigh, NC). 2001. Racing gets a Boost. American City Business Journals, Inc. Weinstein, Bernard L. and Clower, Terry L., 2000. Economic Impact Analysis: Proposed Auto racing Complex in Immokalee, Florida. Center for Economic Development and Research University of North Texas. West Virginia Economic Development Plan, 2003. Posted on West Virginia’s home page www.state.wv.us.

52
Appendix A Survey Questionnaires

53
NORTH CAROLINA MOTORSPORTS IMPACT PROJECT NASCAR MARKETING/PUBLIC RELATIONS SURVEY
The North Carolina Motorsports Association in conjunction with UNC Charlotte is conducting an economic impact study of the North Carolina Motorsports industry. This survey questionnaire is part of that study. The information received in this questionnaire will be held in strict confidence and no specific firm information will be released or published. In addition, all questionnaires and firm specific information will be destroyed once the study is completed. If you have any questions please contact John Connaughton of UNC Charlotte at (704) 687-4134. Please return the survey by January 15, 2004 in the enclosed stamped envelope. 1. Name of Operation _____________________________________ 2. County ______________________________________ 3. Contact Person ___________________________________ 4. Telephone # _____________________ Fax # ________________________ 5. NAICS Code _______________ SIC Code _______________ 6. Please specify primary nature of business _______________________ 7. Please specify the types of activities that are conducted by this office ______________ ________________ _________________ _________________ __________________ 8. Total number of full-time employees __________________ 9. Number of part-time employees ________________ 10. Average monthly payroll in 2003 __________________ 11. Average monthly revenue in 2003 ____________________ 12. Building(s) size (in square feet) _______________________ Do you own________ or lease_________ 13. Estimated replacement cost of building(s) ____________________ (including leasehold improvements) 14. Estimated replacement value of equipment (including mobile equipment) ___________________ 15. Do you plan to expand your North Carolina facilities over the next three years? yes___ no___ If yes what will be your estimated investment $___________ 16. Do you plan to increase you North Carolina employment over the next three years? yes___ no___ If yes what is your estimated number of new employees __________

54
NORTH CAROLINA MOTORSPORTS IMPACT PROJECT
MARKETING/PUBLIC RELATIONS/MEDIA SURVEY
The North Carolina Motorsports Association in conjunction with UNC Charlotte is conducting an economic impact study of the North Carolina Motorsports industry. This survey questionnaire is part of that study. The information received in this questionnaire will be held in strict confidence and no specific firm information will be released or published. In addition, all questionnaires and firm specific information will be destroyed once the study is completed. If you have any questions please contact John Connaughton of UNC Charlotte at (704) 687-4134. Please return the survey by January 15, 2004 in the enclosed stamped envelope. 1. Company Name _____________________________________ 2. County ______________________________________ 3. Contact Person ___________________________________ 4. Telephone # _____________________ Fax # ________________________ 5. NAICS Code _______________ SIC Code _______________ 6. Please specify primary nature of business _______________________ 7. Please specify other types of business activities __________________________________ ______________________________________________________________________________ 8. Total number of full-time employees __________________ 9. Number of part-time employees ________________ 10. Average monthly payroll in 2003 __________________ 11. Average monthly revenue in 2003 ____________________ 12. Estimated percentage of revenue received from motorsports related activities (teams/suppliers/sponsors/etc.) located in North Carolina ____________________ 13. Building(s) size (in square feet) _______________________ Do you own________ or lease_________ 14. Estimated replacement cost of building(s) _____________________ (including leasehold improvements) 15. Estimated replacement value of equipment ___________________ 16. Do you plan to expand your North Carolina facilities over the next three years? yes___ no___ If yes what will be your estimated investment $___________ 17. Do you plan to increase you North Carolina employment over the next three years? yes___ no___ If yes what is your estimated number of new employees __________

55
NORTH CAROLINA MOTORSPORTS IMPACT PROJECT
MOTORSPORTS MUSEUMS SURVEY
The North Carolina Motorsports Association in conjunction with UNC Charlotte is conducting an economic impact study of the North Carolina Motorsports industry. This survey questionnaire is part of that study. The information received in this questionnaire will be held in strict confidence and no specific firm information will be released or published. In addition, all questionnaires and firm specific information will be destroyed once the study is completed. If you have any questions please contact John Connaughton of UNC Charlotte at (704) 687-4134. Please return the survey by January 15, 2004 in the enclosed stamped envelope. 1. Museum Name _____________________________________ 2. County ______________________________________ 3. Contact Person ___________________________________ 4. Telephone # _____________________ Fax # ________________________ 5. NAICS Code _______________ SIC Code _______________ 6. Please specify primary focus of museum _______________________ 7. Total number of full-time employees __________________ 8. Number of part-time employees ________________ 9. Average monthly payroll in 2003 __________________ 10. Average monthly revenue in 2003 ____________________ 11. Estimated percentage of revenue paid in royalties to motorsports teams/suppliers/etc. located in North Carolina ____________________ 12. Building(s) size (in square feet) _______________________ Do you own________ or lease_________ 13. Estimated replacement cost of building(s) _____________________ (including leasehold improvements) 14. Estimated replacement value of museum collection ____________ 15. Do you plan to expand your North Carolina facilities over the next three years? yes___ no___ If yes what will be your estimated investment $___________ 16. Do you plan to increase you North Carolina employment over the next three years? yes___ no___ If yes what is your estimated number of new employees __________

56
NORTH CAROLINA MOTORSPORTS IMPACT PROJECT
SUPPLIERS/MANUFACTURERS SURVEY
The North Carolina Motorsports Association in conjunction with UNC Charlotte is conducting an economic impact study of the North Carolina Motorsports industry. This survey questionnaire is part of that study. The information received in this questionnaire will be held in strict confidence and no specific firm information will be released or published. In addition, all questionnaires and firm specific information will be destroyed once the study is completed. If you have any questions please contact John Connaughton of UNC Charlotte at (704) 687-4134. Please return the survey by January 15, 2004 in the enclosed stamped envelope. 1. Company Name _____________________________________ 2. County ______________________________________ 3. Contact Person ___________________________________ 4. Telephone # _____________________ Fax # ________________________ 5. NAICS Code _______________ SIC Code _______________ 6. Please specify primary product _______________________ 7. Please specify other major products ___________________________________________ ______________________________________________________________________________ 8. Total number of full-time employees __________________ 9. Number of part-time employees ________________ 10. Average monthly payroll in 2003 __________________ 11. Average monthly revenue in 2003 ____________________ 12. Estimated percentage of revenue received from motorsports teams located in North Carolina ____________________ 13. Building(s) size (in square feet) _______________________ Do you own________ or lease_________ 14. Estimated replacement cost of building(s) _____________________ (including leasehold improvements) 15. Estimated replacement value of equipment ___________________ 16. Do you plan to expand your North Carolina facilities over the next three years? yes___ no___ If yes what will be your estimated investment $___________ 17. Do you plan to increase you North Carolina employment over the next three years? yes___ no___ If yes what is your estimated number of new employees __________

57
NORTH CAROLINA MOTORSPORTS IMPACT PROJECT RETAIL SURVEY
The North Carolina Motorsports Association in conjunction with UNC Charlotte is conducting an economic impact study of the North Carolina Motorsports industry. This survey questionnaire is part of that study. The information received in this questionnaire will be held in strict confidence and no specific firm information will be released or published. In addition, all questionnaires and firm specific information will be destroyed once the study is completed. If you have any questions please contact John Connaughton of UNC Charlotte at (704) 687-4134. Please return the survey by January 15, 2004 in the enclosed stamped envelope. 1. Company Name _____________________________________ 2. County ______________________________________ 3. Contact Person ___________________________________ 4. Telephone # _____________________ Fax # ________________________ 5. NAICS Code _______________ SIC Code _______________ 6. Please specify primary nature of business _______________________ 7. Please specify other types of business activities _________________________________ ______________________________________________________________________________ 8. Total number of full-time employees __________________ 9. Number of part-time employees ________________ 10. Average monthly payroll in 2003 __________________ 11. Average monthly revenue in 2003 ____________________ 12. Estimated percentage of revenue paid in royalties to motorsports teams/suppliers/etc. located in North Carolina ____________________ 13. Building(s) size (in square feet) _______________________ Do you own________ or lease_________ 14. Estimated replacement cost of building(s) _____________________ (including leasehold improvements) 15. Estimated replacement value of equipment, including mobile facilities____________ 16. Do you plan to expand your North Carolina facilities over the next three years? yes___ no___ If yes what will be your estimated investment $___________ 17. Do you plan to increase you North Carolina employment over the next three years? yes___ no___ If yes what is your estimated number of new employees __________

58
NORTH CAROLINA MOTORSPORTS IMPACT PROJECT NASCAR TEST FACILITY SURVEY
The North Carolina Motorsports Association in conjunction with UNC Charlotte is conducting an economic impact study of the North Carolina Motorsports industry. This survey questionnaire is part of that study. The information received in this questionnaire will be held in strict confidence and no specific firm information will be released or published. In addition, all questionnaires and firm specific information will be destroyed once the study is completed. If you have any questions please contact John Connaughton of UNC Charlotte at (704) 687-4134. Please return the survey by January 15, 2004 in the enclosed stamped envelope. 1. Sanctioning Organization Name _____________________________________ 2. County ______________________________________ 3. Contact Person ___________________________________ 4. Telephone # _____________________ Fax # ________________________ 5. NAICS Code _______________ SIC Code _______________ 6. Total number of North Carolina full-time employees __________________ 7. Number of North Carolina part-time employees ________________ 8. Average monthly North Carolina payroll in 2003 __________________ 9. Building(s) size (in square feet) _______________________ Do you own________ or lease_________ 10. Estimated replacement cost of building(s) and other fixed assets _________________ (including leasehold improvements) 11. Estimated replacement value of equipment, including mobile facilities ____________ 12. Please list the types of activities performed by this facility __________________ __________________ __________________ _________________ ________________ 13. Do you plan to expand your North Carolina facilities over the next three years? yes___ no___ If yes what will be your estimated investment $___________ 14. Do you plan to increase you North Carolina employment over the next three years? yes___ no___ If yes what is your estimated number of new employees __________

59
NORTH CAROLINA MOTORSPORTS IMPACT PROJECT
NASCAR TEAMS SURVEY
The North Carolina Motorsports Association in conjunction with UNC Charlotte is conducting an economic impact study of the North Carolina Motorsports industry. This survey questionnaire is part of that study. The information received in this questionnaire will be held in strict confidence and no specific firm information will be released or published. In addition, all questionnaires and firm specific information will be destroyed once the study is completed. If you have any questions please contact John Connaughton of UNC Charlotte at (704) 687-4134. Please return the survey by January 15, 2004 in the enclosed stamped envelope. 1. Team Name _____________________________________ 2. County ______________________________________ 3. Contact Person ___________________________________ 4. Telephone # _____________________ Fax # ________________________ 5. Number of Nextel Series teams _______________________ 6. Number of Busch Series teams _______________________ 7. Number or Craftsman Truck Series teams __________________ 8. Number of other teams ________________ Please specify other series _____________ 9. SIC or NAICS Code _______________ 10. Total number of employees __________________ 11. Average monthly payroll in 2003 __________________ 12. Average monthly operating budget in 2003 ____________________ (not including payroll) 13. Building size (in square feet) _______________________ Do you own________ or lease_________ 14. Estimated replacement cost of building _____________________ (including leasehold improvements) 15. Estimated replacement value of equipment ___________________ (not including value of cars) 16. Do you plan to expand your North Carolina facilities over the next three years? yes___ no___ If yes what will be your estimated investment $___________ 17. Do you plan to increase you North Carolina employment over the next three years? yes___ no___ If yes what is your estimated number of new employees __________

60
NORTH CAROLINA MOTORSPORTS IMPACT PROJECT SANCTIONING ORGANIZATION SURVEY
The North Carolina Motorsports Association in conjunction with UNC Charlotte is conducting an economic impact study of the North Carolina Motorsports industry. This survey questionnaire is part of that study. The information received in this questionnaire will be held in strict confidence and no specific firm information will be released or published. In addition, all questionnaires and firm specific information will be destroyed once the study is completed. If you have any questions please contact John Connaughton of UNC Charlotte at (704) 687-4134. Please return the survey by January 15, 2004 in the enclosed stamped envelope. 1. Sanctioning Organization Name _____________________________________ 2. County ______________________________________ 3. Contact Person ___________________________________ 4. Telephone # _____________________ Fax # ________________________ 5. NAICS Code _______________ SIC Code _______________ 6. Please specify primary type of racing _______________________ 7. Please specify sanctioned tracks in North Carolina _______________________________ ______________________________________________________________________________ 8. Total number of North Carolina full-time employees __________________ 9. Number of North Carolina part-time employees ________________ 10. Average monthly North Carolina payroll in 2003 __________________ 11. Average monthly North Carolina based revenue in 2003 ____________________ 12. Building(s) size (in square feet) _______________________ Do you own________ or lease_________ 13. Estimated replacement cost of building(s) _____________________ (including leasehold improvements) 14. Estimated replacement value of equipment, including mobile facilities ____________ 15. Do you plan to expand your North Carolina facilities over the next three years? yes___ no___ If yes what will be your estimated investment $___________ 16. Do you plan to increase you North Carolina employment over the next three years? yes___ no___ If yes what is your estimated number of new employees __________

61
NORTH CAROLINA MOTORSPORTS IMPACT PROJECT
MAJOR TRACK SURVEY
The North Carolina Motorsports Association in conjunction with UNC Charlotte is conducting an economic impact study of the North Carolina Motorsports industry. This survey questionnaire is part of that study. The information received in this questionnaire will be held in strict confidence and no specific firm information will be released or published. In addition, all questionnaires and firm specific information will be destroyed once the study is completed. If you have any questions please contact John Connaughton of UNC Charlotte at (704) 687-4134. Please return the survey by January 15, 2004 in the enclosed stamped envelope. 1. Track Name _____________________________________ 2. County ______________________________________ 3. Contact Person ___________________________________ 4. Telephone # _____________________ Fax # ________________________ 5. NAICS Code _______________ SIC Code _______________ 6. Number of racing events in 2003 (based on admission charge)________________ 7. Total attendance for all racing events in 2003 _________________ 8. Number of other revenue events in 2003 _____________ 9. Total attendance for all other revenue events in 2003 ______________ 10. Total number of full-time employees __________ 11. Total number of part-time employees ___________ 12. Average monthly payroll in 2003 __________________ 13. Total annual revenue from all activities in 2003 ____________________ 14. Estimated replacement cost of building(s) and fixed facilities ____________________ 15. Estimated replacement value of equipment ___________________ (not including value of cars) 16. Do you plan to expand your North Carolina facilities over the next three years? yes___ no___ If yes what will be your estimated investment $___________ 17. Do you plan to increase you North Carolina employment over the next three years? yes___ no___ If yes what is your estimated number of new employees __________

62
NORTH CAROLINA MOTORSPORTS IMPACT PROJECT DRAG RACING TRACK SURVEY
The North Carolina Motorsports Association in conjunction with UNC Charlotte is conducting an economic impact study of the North Carolina Motorsports industry. This survey questionnaire is part of that study. The information received in this questionnaire will be held in strict confidence and no specific firm information will be released or published. In addition, all questionnaires and firm specific information will be destroyed once the study is completed. If you have any questions please contact John Connaughton of UNC Charlotte at (704) 687-4134. Please return the survey by January 15, 2004 in the enclosed stamped envelope. 1. Track Name _____________________________________ 2. County ______________________________________ 3. Contact Person ___________________________________ 4. Telephone # _____________________ Fax # ________________________ 5. NAICS Code _______________ SIC Code _______________ 6. Number of racing events in 2003 (based on admission charge)________________ 7. Total attendance for all racing events in 2003 _________________ 8. Total number of participating racing teams (cars) in 2003 _________________ 9. Number of other revenue events in 2003 _____________ 10. Total attendance for all other revenue events in 2003 ______________ 11. Total number of full-time employees __________ 12. Total number of part-time employees ___________ 13. Average monthly payroll in 2003 __________________ 14. Total annual revenue from all activities in 2003 ____________________ 15. Estimated replacement cost of building(s) and fixed facilities ____________________ 16. Estimated replacement value of equipment ___________________ (not including value of cars) 17. Do you plan to expand your North Carolina facilities over the next three years? yes___ no___ If yes what will be your estimated investment $___________ 18. Do you plan to increase you North Carolina employment over the next three years? yes___ no___ If yes what is your estimated number of new employees __________

63
NORTH CAROLINA MOTORSPORTS IMPACT PROJECT
DRAG RACING TEAMS SURVEY
The North Carolina Motorsports Association in conjunction with UNC Charlotte is conducting an economic impact study of the North Carolina Motorsports industry. This survey questionnaire is part of that study. The information received in this questionnaire will be held in strict confidence and no specific firm information will be released or published. In addition, all questionnaires and firm specific information will be destroyed once the study is completed. If you have any questions please contact John Connaughton of UNC Charlotte at (704) 687-4134. Please return the survey by January 15, 2004 in the enclosed stamped envelope. 1. Team Name _____________________________________ 2. County ______________________________________ 3. Contact Person ___________________________________ 4. Telephone # _____________________ Fax # ________________________ 5. Number of teams (cars) _______________________ 6. Please specify primary series _______________________ 7. Please specify any other series __________________ 8. Please list the tracks you race on _____________________ ______________________ 9. NAICS Code _______________ SIC Code _______________ 10. Total number of full-time employees __________ part-time employees ___________ 11. Average monthly payroll in 2003 __________________ 12. Average monthly operating budget in 2003 ____________________ (not including payroll) 13. Building(s) size (in square feet) _______________________ Do you own________ or lease_________ 14. Estimated replacement cost of building(s) _____________________ (including leasehold improvements) 15. Estimated replacement value of equipment ___________________ (not including value of cars) 16. Do you plan to expand your North Carolina facilities over the next three years? yes___ no___
If yes what will be your estimated investment $___________ 17. Do you plan to increase you North Carolina employment over the next three years? yes___ no___ If yes what is your estimated number of new employees __________
64
NORTH CAROLINA MOTORSPORTS IMPACT PROJECT SHORT TRACK OVAL TEAMS SURVEY
The North Carolina Motorsports Association in conjunction with UNC Charlotte is conducting an economic impact study of the North Carolina Motorsports industry. This survey questionnaire is part of that study. The information received in this questionnaire will be held in strict confidence and no specific firm information will be released or published. In addition, all questionnaires and firm specific information will be destroyed once the study is completed. If you have any questions please contact John Connaughton of UNC Charlotte at (704) 687-4134. Please return the survey by January 15, 2004 in the enclosed stamped envelope. 1. Team Name _____________________________________ 2. County ______________________________________ 3. Contact Person ___________________________________ 4. Telephone # ___________________ Fax # ________________________ 5. Number of teams (cars) _______________________ 6. Please specify primary series _______________________ 7. Please specify any other series __________________ 8. Please list the tracks you race on _____________________ ______________________ 9. NAICS Code _______________ SIC Code _______________ 10. Total number of full-time employees __________ part-time employees ___________ 11. Average monthly payroll in 2003 __________________ 12. Average monthly operating budget in 2003 ____________________ (not including payroll) 13. Building(s) size (in square feet) _______________________ Do you own________ or lease_________ 14. Estimated replacement cost of building(s) _____________________ (including leasehold improvements) 15. Estimated replacement value of equipment ___________________ (not including value of cars) 16. Do you plan to expand your North Carolina facilities over the next three years? yes___ no___ If yes what will be your estimated investment $___________ 17. Do you plan to increase you North Carolina employment over the next three years? yes___ no___ If yes what is your estimated number of new employees __________
65
NORTH CAROLINA MOTORSPORTS IMPACT PROJECT
SHORT-TRACK SURVEY
The North Carolina Motorsports Association in conjunction with UNC Charlotte is conducting an economic impact study of the North Carolina Motorsports industry. This survey questionnaire is part of that study. The information received in this questionnaire will be held in strict confidence and no specific firm information will be released or published. In addition, all questionnaires and firm specific information will be destroyed once the study is completed. If you have any questions please contact John Connaughton of UNC Charlotte at (704) 687-4134. Please return the survey by January 15, 2004 in the enclosed stamped envelope. 1. Track Name _____________________________________ 2. County ______________________________________ 3. Contact Person ___________________________________ 4. Telephone # _____________________ Fax # ________________________ 5. NAICS Code _______________ SIC Code _______________ 6. Number of racing events in 2003 (based on admission charge)________________ 7. Total attendance for all racing events in 2003 _________________ 8. Total number of participating racing teams (cars) in 2003 _________________ 9. Number of other revenue events in 2003 _____________ 10. Total attendance for all other revenue events in 2003 ______________ 11. Total number of full-time employees __________ 12. Total number of part-time employees ___________ 13. Average monthly payroll in 2003 __________________ 14. Total annual revenue from all activities in 2003 ____________________ 15. Estimated replacement cost of building(s) and fixed facilities ____________________ 16. Estimated replacement value of equipment ___________________ (not including value of cars) 17. Do you plan to expand your North Carolina facilities over the next three years? yes___ no___ If yes what will be your estimated investment $___________ 18. Do you plan to increase you North Carolina employment over the next three years? yes___ no___ If yes what is your estimated number of new employees __________