Embed Size (px)
Citation preview

The Economic Importance of St. Louis Convention, Sports, and
Entertainment Infrastructure and
the Economic Impact of the Proposed St. Louis NFL Stadium
November 13, 2015

1
About This Economic Analysis Chamber review of current published reports and analysis
Over the last year, a number of reports have been issued related to the proposed new St. Louis
NFL stadium. We have analyzed the published reports and statements and commissioned our
own independent analysis by PricewaterhouseCoopers LLP (PwC) to examine the incremental
economic impact of the new stadium on the St. Louis, MO-IL Metropolitan Statistical Area
(MSA) and the State of Missouri.
This report presents the Chamber’s summary of selected findings from PwC as well as
discusses findings from other sources. The other studies considered in this summary include:
The NFL commissioned Conventions, Sports & Leisure International (CSL) to conduct a
feasibility analysis for the proposed new stadium. The report draft “New St. Louis Open Air Stadium Market Feasibility Analysis” dated May 13, 2015 was reviewed. CSL surveyed and
interviewed Rams ticket and seat holders and other area businesses and individuals. The
results were used to project potential revenues for the proposed new stadium.
The Missouri Economic Research and Information Center (MERIC) conducted two analyses.
One report “The Economic Impact of a NFL Stadium Complex” dated August 2015, to estimate the general economic impact of the new stadium construction and expected
operational impacts of an NFL franchise through the year 2051. This analysis includes state
fiscal returns and does not include local fiscal benefits or costs. The other report, “Local Cost-Benefit Analysis: Construction of a New Stadium and Retention of a National Football League Team in the St. Louis Region” dated July 2015, examined the local impact of the
construction of the Proposed Stadium and NFL activities. The scope, methodology, and
underlying data assumptions of these reports differ from the PwC report such that the
results cannot be directly compared.
It is important to note that there are key differences between the PwC and MERIC analyses:
Scope of analysis - MERIC analysis appears to be limited to NFL impacts; while the PwC
analysis considers impacts of broader stadium operation and other stadium events.
Basis of presentation - MERIC analysis is a 32-year or 36-year presentation, depending on
document, expressed in real dollars with net consideration of a $12 million annual bond
payment; while the PwC analysis presents a construction period and stabilized year of
operation with all figures expressed in 2015 dollars and no consideration of a $12 million
annual bond payment.
Underlying assumptions - other differences resulting from different base sources and/or
adjustments applied thereto - ability to assess these differences is limited by the
documentation included in the respective reports.

2
The Economic Importance of St. Louis Convention, Sports, and Entertainment Infrastructure and the Economic Impact of the
Proposed St. Louis NFL Stadium
The Context for the St. Louis Region
St. Louis is at a critical moment of decision about building and reinvesting in facilities
St. Louis has world-class, major league venues: Busch Stadium and Ballpark Village,
America's Center, Gateway Motorsports Park, and the Scottrade Center. These
complement each other. The addition of the new riverfront stadium will significantly
enhance the region’s capacity as a convention, sports, and entertainment destination.
We need them all. Public/private partnerships are necessary for their success. With the
right investment, strategy and coordination, together with completion of the City-Arch-
River Project, we will create a stunning makeover of the urban core, increase
employment in our hospitality and construction industries, and boost our civic confidence
and pride.
St. Louis is a major league center for sports
We’re home to the Rams (NFL), Cardinals (MLB), Blues (NHL), and Gateway
Motorsports Park (NHRA, NASCAR) major league sports teams and venues, along with
many other popular professional teams. Greater St. Louis also has two Frontier League
Baseball teams, the Gateway Grizzlies and River City Rascals.
Greater St. Louis is also home to many colleges that compete nationally, ranging from
members of the National Junior College Athletic Association to the NCAA Division I.
Many area teams have been conference, division, and national champions.
St. Louis area sports teams play in numerous venues, which attract millions of visitors to
the area every year. Its central location and world-class venues have supported St.
Louis as a popular host city to numerous NCAA college and other national
championships. St. Louis is also home to many annual sporting events ranging from
amateur to professional competitions.i
These teams and venues host millions of annual attendees from throughout the region
and the U.S. Sports tourists generate significant local spending on food, hotels, and
retail. This spending is a major source of support for area jobs in hospitality and other
industries. They also provide a venue to showcase our region to visitors. These visits
can build a positive image of our region to potential investors and immigrants.

3
Perhaps more importantly, these teams and events provide a focal point for regional
pride and community. When the Rams won the Super Bowl in 2000 there were
numerous articles extoling the importance of the widespread sense of civic pride.ii This
community spirit was broadcast to the whole country. In fact, that same year St. Louis
was named the Best Sports City in North America by The Sporting News.iii
Sports is a major league industry for St. Louis
Sports is a major industry. Greater St. Louis is home to many sports related businesses
including major firms like Rawlings Sporting Goods as well as entrepreneurial
companies like Lockerdome. Lockerdome, founded in St. Louis as a sports social
networking platform, is an entrepreneurial success story. Their website is organized by
interests including sports and has seen dramatic growth over the last few years to over
75 million users.
In 2015, the St. Louis Regional Chamber organized Spirit of St. Louis Ventures to
invest in venture funds, loan funds and other enterprises. One of the inaugural
investments is in Stadia Ventures, a sports business accelerator and academy for
entrepreneurs, industry partners and investors.
Convention, sports, and entertainment industries create jobs
The St. Louis MSA Leisure and Hospitality industry had employment of 143,300 in 2014
according to the U.S. Bureau of Labor Statistics. Job creation in these sectors has been
positive for the region. St. Louis MSA Leisure and Hospitality industry employment grew
by 4,300 between August 2014 and August 2015.iv
Competition is increasing for convention, sports, and entertainment business
Competing cities from Nashville to Indianapolis to Denver are aggressively expanding
and updating facilities to capture additional share of convention and tourism business.v
St. Louis’ existing venues need investment to be competitive.

4
The Impact of Being an NFL City and the Economics of the Proposed Stadium
Background on Methodology
As the St. Louis region and the State of Missouri consider a proposal to build a new
National Football League (NFL) stadium there has been a wide range of media coverage
and related information released. We have analyzed the published reports and
statements by MERIC and CSL and commissioned our own independent analysis by
PricewaterhouseCoopers LLP (PwC) to examine the incremental economic impact of the
new stadium on the St. Louis, MO-IL Metropolitan Statistical Area (MSA) and the State
of Missouri.
PwC analyzed the economic impacts of the new stadium. MERIC estimated the annual
net general revenue for the State of Missouri and the estimated direct tax revenues for
the City of St. Louis and other taxing jurisdictions. Both reports estimate the incremental
impacts related to the proposed new stadium and retention of an NFL team.
PwC used conservative assumptions to estimate direct spending. They then employed
well-established economic analysis methods to estimate the total economic impact of the
Proposed Stadium. Determining direct spending is the first step in the analysis. PwC
defines direct spending as the “estimated first round of spending in the MSA and State by non-residents and non-local businesses generated by incremental activity resulting from the Proposed Stadium as well as resident and local business spending in the MSA and State which would otherwise occur elsewhere but for the construction and operation of the Proposed Stadium.”vi. Incremental activity is defined as “…the difference between the potential activity level resulting from the Proposed Stadium and a baseline level of recent historical activity, less any activity which could be reasonably assumed to be lost in the near future but for the construction and operation of the Proposed Stadium (e.g., NFL St. Louis Rams)."vii
“The indirect and induced effects of the incremental direct spend generated as a result of the Proposed Stadium were also calculated to reflect the ‘ripple’ effect as the initial dollars are re-spent locally. … Indirect spending was also considered based on IMPLAN spending multipliers to acknowledge additional expenditures which occur in either the MSA or State economy within other industries that provide goods and services to the ‘direct’ industries which support events at the Proposed Stadium and related activities. Further, induced effects were computed through the IMPLAN spending multipliers to reflect household spending in either the MSA or State economy of personal income earned either directly or indirectly from the Proposed Stadium event activity”.viii
The St. Louis Regional Chamber’s conclusions are based on our review of published reports by PwC, CSL, and MERIC.

5
Being an NFL City is qualitatively and economically important to St. Louis
o Being an NFL City is good for our brand and helps us attract and retain talent
NFL teams not only provide a quality of life amenity for current residents, but also
can help draw new residents to the Region. While the PwC report does not directly
address talent attraction and retention, the strong community brand that being an
NFL city develops can make a significant impact on the strength of a growing
workforce. The PwC report notes that 5,000 new jobs were created in Jacksonville, Florida due to corporate relocation within a year after they hosted Super Bowl XXXIX. ix
o NFL Teams have extensive community giving programs
Community Giving Programs - "Local community groups and non-profit organizations benefit from the community programs of the stadium operator and the facility’s professional sports tenants along with local outreach initiatives of special events held at the venue and the individual players and executives of the professional sports tenants." x
The PwC report summarizes the community work the Rams did during the 2014 season. This work included making 343 appearances at 100 school and non-profit organizations, reaching 11,700 kids through 2,500 hours of time with the PLAY 60 program, and raising money for a variety of charities and charity events. xi
The economics of the proposal are net-positive, fiscally-sound, and doable
o The Proposed Stadium generates a unique, positive, substantial net economic impact
The proposed new stadium is estimated to generate a positive incremental impact to
both the St. Louis MSA and State of Missouri both through its construction and
during its operation that is over and above the current Rams operations.
o New Stadium generates significant economic and fiscal impactsxii
- Retention of current impact
PwC estimates that “the Proposed Stadium would generate approximately $23 million … in new incremental direct spend in the MSA…”. PwC’s analysis estimates that an additional $80 million of direct spending, currently
generated by the NFL St. Louis Rams in the MSA would also be retained in St.
Louis. This $80 million of direct spend would be lost without the Proposed
Stadium.xiii

6
“The operating direct spend attributed to the project represents the difference between the potential activity level resulting from the Proposed Stadium and a baseline level of recent historical activity, less any activity which could be reasonably assumed to be lost in the near future but for the construction and operation of the Proposed Stadium (e.g. NFL St. Louis Rams)”.xiv
- Impact of operations
The new stadium operations would produce a total economic impact that approaches $200 million annually for the St. Louis MSA.xv
PwC estimates that the direct spending during annual operations at the new
stadium would generate $102 million in direct output and another $97 million in
indirect and induced output in the St. Louis MSA.xvi The total economic impact in
the State of Missouri from annual operations is estimated to be $177 million ($96
million in direct output and $81 million indirect and induced output). In the St. Louis MSA, one year of stabilized operations would generate a total of 1,600 jobs, 910 will be direct jobs and another 690 jobs will be created by
indirect and induced impacts.xvii
- Impact of construction
Construction would produce a total economic impact of $895 million of output for the St. Louis MSA
The PwC report found that the construction of the new stadium would generate
$450 million in direct output and another $446 million in indirect and induced
output in the St. Louis MSA during the two to three year construction period. The
economic impact to the State of Missouri is estimated to be $908 million ($486
million direct output and $422 million indirect and induced output). This large
scale construction project would generate 2,950 direct jobs in St. Louis, and another 2,970 indirect and induced jobs, for a total of 5,920 jobs during
the entire construction period.xviii
There is regional support for this major construction projects from area construction unions. In February 2015, unions agreed to forgo overtime pay
during round-the-clock construction of a football stadium proposed on the
riverfront. The labor agreement calls for three eight-hour shifts, at straight time,
which officials said would reduce overtime costs on the up-to-$985 million
stadium while speeding up construction, Governor Nixon announced in a press
conference at the electricians training center on Hampton Avenue.xix
- Tax impacts
Operation of the Proposed Stadium would generate about $19 million in direct state and local taxes in the St. Louis MSA

7
Annual operation would generate about $19 million in direct state and local
taxes in the St. Louis MSA, another $5 million will be generated by indirect and
induced effects for a total of $24 million in state and local taxes. The analysis
presents a combined state and local tax impact. Because the majority of the
economic activity will take place in St. Louis, the analysis at the state level also
indicates a total state and local tax total of $24 million.xx
The construction phase is estimated to generate about $6 million in direct
state and local taxes in the St. Louis MSA and another $21 million in taxes
generated by indirect and induced spending for a total of $27 million. The state
and local tax impact on the state is estimated to total $26 million.xxi
If the Proposed Stadium is not built and the Rams leave the region, the continued obligation to fund the Jones Dome will total $78 million through 2024.xxii However the taxes generated by the Rams will not occur, leaving a
deficit to government funding.
o New stadium produces major qualitative impacts
The PwC report also found that stadium venues and the professional sports teams
hosted can provide other qualitative impacts to the communities where they are
located. By reviewing case studies and secondary data sources, PwC reviewed the
potential impacts of an NFL Franchise on:
Community Brand
Resident Quality of Life
Ancillary Real Estate Development
Locally Sourced Requirements
Community Giving Programs
Community Brand - PwC finds that communities receive value from the name recognition and media exposure provided by sports broadcasting and publishing.
The benefits and value of these media impressions to community brand may be substantial when compared with media advertising rates. The report provides
several examples including the 2013 MLB Playoffs earning approximately $60
million in media exposure for Anheuser-Busch and having the ballpark mentioned by
name over 29,000 times across various forms of media/newsxxiii.
TV audience demographics for the NFL and MLS show that being an NFL-community brings regional exposure and provides a way to reach out to diverse, working age, higher income individuals.

8
Resident Quality of Life - The PwC report discusses the importance to resident’s quality of life of being in a “major-league” city. They note the
importance of major sports to retaining and attracting residents and forming a sense
of community.xxiv Teams create value for local residents that owners cannot
capture. People like professional football. Even if they cannot afford to attend
games, they like having and following a home team. The Super Bowl was the most watched television program in America. No one is excluded from enjoying
the external benefits generated by local sports teams.xxv
Ancillary Real Estate Development - Major league sport facilities often act as anchors for area real estate developments. There are many examples from
other cities of mixed use development around the stadia. The development of the Proposed Stadium could launch additional redevelopment activity along the North Riverfront in St. Louis City. The St. Louis Development Corporation finds
that “the vast majority of the Proposed Stadium site is blighted and undeveloped with much of the area abandoned and most of the few remaining structures decaying and in need of demolition or significant rehabilitation”. “The overall goal of the plan is to promote economic revitalization of the North Riverfront by transforming vacant property along the Mississippi River into public parks and recreation amenities and by stimulating private investment in the area. The Proposed Stadium is anticipated to occupy a portion of the North Riverfront planning area and plans for the project have now been integrated into the broader North Riverfront planning effort.”xxvi
Locally Sourced Requirements - Both the construction and the operation of sport stadia offer the opportunity to support local suppliers and vendors. There are many examples of such local sourcing initiatives at other major league
sports facilities. These initiative often include Minority Business Enterprise and
Women Business Enterprise (MBE/WBE) requirements for inclusion.xxvii The
stadium task force has committed to the “gold standard” for MBE/WBE contracting, improving on the standard used in the recent Minnesota and Atlanta stadia.
About 40% of the Proposed Stadium would be funded publicly
The mix of private and public funding is reasonable – approximately the average for all new NFL stadia projects since 2006. The use of public funds for the project are
contingent on at least $450 million in private capital contributions from the NFL and or
the team and at least $150 million in seat licenses. The $600 million in private
investment would be the largest private investment in a stadium project in St. Louis
history. “Public financing is also contingent on a lease agreed for at least 30 years and including a reasonable rent and CIP payment plan”.xxviii
The PwC report summarizes the funding for seven NFL stadia of various costs and
capacities built between 2006 and 2017. The percentage public funding for these seven

9
stadia varies significantly from no public funding for the very large market, New York
Giants/Jets’ stadium to 86% for the Indianapolis Colts’ stadium. The St. Louis Proposed Stadium’s approximately 40% share of public funding is in-line with four of the seven NFL Stadia and below the share of public funding for the Minnesota Vikings stadium, which is closest to the Proposed Stadium in terms of capacity, total cost, and metro population. The PwC report also summarizes the funding for
eleven MLS stadia built between 2005 and 2018. The percentage public funding ranges
from no public funding for the Orlando City Soccer Club and San Jose Earthquakes, to
100% for the Sporting Kansas City and the Chicago Fire.xxix
Stadia Developed Since 2005 and Planned Percent of Public Financing of Total Costsxxx
Team Venue Year Built
Total Capacity
Total Cost
% Public
NFL Indianapolis Colts Lucas Oil Stadium 2008 63,000 $720 86%
Arizona Cardinals University of Phoenix Stadium 2006 63,400 $456 68%
Minnesota Vikings U.S. Bank Stadium 2016 65,400 $1,027 48%
ST. LOUIS NFLxxxi Proposed Stadium 2019 62,500 $988 40% Dallas Cowboys AT&T Stadium 2009 80,000 $1,194 37%
Atlanta Falcons Mercedes-Benz Stadium 2017 71,000 $1,500 13%
San Francisco 49ers Levi's Stadium 2014 68,500 $1,300 9%
New York Giants / New York Jets MetLife Stadium 2010 82,500 $1,600 0%
MLS Sporting KC Sporting Park 2011 18,467 $200 100%
Chicago Fire Toyota Park 2006 20,000 $98 100%
FC Dallas Toyota Stadium 2005 20,500 $90 61%
New York Red Bull Red Bull Park 2009 30,000 $200 56%
Toronto FC BMO Field 2007 20,000 $57 56%
D.C. United D.C. United Stadium 2018 20,000 $287 52%
Colorado Rapids Dick's Sporting Goods Park 2007 18,000 $131 40%
Houston Dynamo BBVA Compass Stadium 2012 22,000 $95 37%
Real Salt Lake RioTinto Stadium 2008 20,000 $110 32%
Orlando City SC Orlando City Stadium 2016 25,500 $155 0%
San Jose Earthquakes Avaya Stadium 2015 18,000 $100 0%
The CSL Stadium Market feasibility analysis that surveyed corporations and Rams ticket
holders found potential funding sources receiving the highest level of support included
revenues from additional stadium events, hotel and motel tax revenue, government
grants, and sales tax revenue.xxxii
Public funding will come from the State of Missouri and St. Louis City government. On
August 18th, the Missouri Development Finance Board approved $15 million in state tax
credits from the Tax Credit for Contribution Program to support the construction of the
10
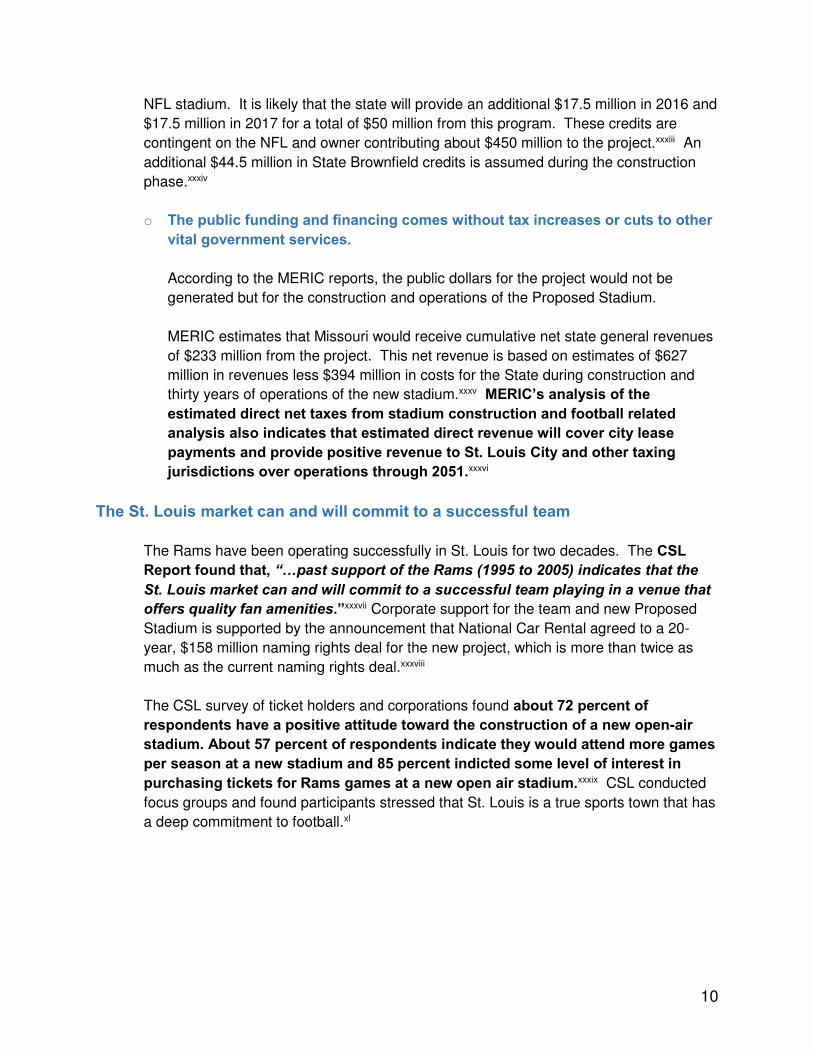
NFL stadium. It is likely that the state will provide an additional $17.5 million in 2016 and
$17.5 million in 2017 for a total of $50 million from this program. These credits are
contingent on the NFL and owner contributing about $450 million to the project.xxxiii An
additional $44.5 million in State Brownfield credits is assumed during the construction
phase.xxxiv
o The public funding and financing comes without tax increases or cuts to other vital government services.
According to the MERIC reports, the public dollars for the project would not be
generated but for the construction and operations of the Proposed Stadium.
MERIC estimates that Missouri would receive cumulative net state general revenues
of $233 million from the project. This net revenue is based on estimates of $627
million in revenues less $394 million in costs for the State during construction and
thirty years of operations of the new stadium.xxxv MERIC’s analysis of the estimated direct net taxes from stadium construction and football related analysis also indicates that estimated direct revenue will cover city lease payments and provide positive revenue to St. Louis City and other taxing jurisdictions over operations through 2051.xxxvi
The St. Louis market can and will commit to a successful team
The Rams have been operating successfully in St. Louis for two decades. The CSL Report found that, “…past support of the Rams (1995 to 2005) indicates that the St. Louis market can and will commit to a successful team playing in a venue that offers quality fan amenities.”xxxvii Corporate support for the team and new Proposed
Stadium is supported by the announcement that National Car Rental agreed to a 20-
year, $158 million naming rights deal for the new project, which is more than twice as
much as the current naming rights deal.xxxviii
The CSL survey of ticket holders and corporations found about 72 percent of respondents have a positive attitude toward the construction of a new open-air stadium. About 57 percent of respondents indicate they would attend more games per season at a new stadium and 85 percent indicted some level of interest in purchasing tickets for Rams games at a new open air stadium.xxxix CSL conducted
focus groups and found participants stressed that St. Louis is a true sports town that has
a deep commitment to football.xl

11
With the right investment, strategy and coordination, the Proposed Stadium and existing convention, sports and entertainment infrastructure will complement each other to grow the market
St. Louis is at a critical decision point regarding investment in convention, sports, and
entertainment infrastructure. The St. Louis MSA Leisure and Hospitality industry had
employment of 143,300 in 2014 according to the U.S. Bureau of Labor Statistics. Job
creation in these sectors has been positive for the region. St. Louis MSA Leisure and
Hospitality industry employment grew by 4,300 between August 2014 and August
2015.xli
St. Louis has world-class, major league venues: Busch Stadium and Ballpark Village,
America's Center, Gateway Motorsports Park, and the Scottrade Center. These
complement each other. The addition of the new riverfront stadium will significantly
enhance the region’s capacity as a convention, sports, and entertainment destination.
We need them all. Public/private partnerships are necessary for their success. With the
right investment, strategy and coordination, together with completion of the City-Arch-
River Project, we will create a stunning makeover of the urban core, increase
employment in our hospitality and construction industries, and boost our civic confidence
and pride.
o Almost all of the forecast attendance would be lost without the Proposed Stadium
According to the PwC report the stadium would support a mix of new events as well
as give existing events more choices for venues. "Approximately 86 percent of the Proposed Stadium’s estimated attendance considered in this analysis is associated with event activity which has been assumed to be incremental to the market or otherwise would not materialize in the near future but for the Proposed Stadium."xlii
o Cities from Nashville to Indianapolis to Denver are aggressively expanding and updating facilities to capture additional share of the region’s convention business
St. Louis’ existing venues need investment to be competitive. America’s Center, which last underwent upgrades in 2012, commissioned a study in April to compare
the facility’s competitiveness. Music City Center in Nashville had a $623 million
investment in 2012, while the Colorado Convention Center will begin a $100 million
update next year. America’s Center is at a particular disadvantage in terms of ballroom size, a crucial need for conventions, offering visitors only 28,000 square
feet compared to over 50,000 in competing cities. The study has not yet been made
public, but media reported the initial upgrade needs could run around $100 million.xliii

12
Scottrade Center, the home of the St. Louis Blues NHL franchise, passed the 20-
year mark last year. Blues owner Tom Stillman said publicly that the venue is in
need of renovation in order to continue playing a key role in bringing concerts and
collegiate sporting events to St. Louis. Details of what the proposed renovation
might cost and entail have not yet been released.xliv
o Other cities have found that having multiple event venues with different
capabilities is a competitive advantage, one that St. Louis could replicate
St. Louis public and private sector leaders need to thoughtfully consider oversight
and management strategies to optimize opportunity. Management of these facilities
to ensure that the region works cooperatively to attract business — whether sporting
events, concerts, cultural events or other activities — will be crucial to maximizing
the return to the region and to investors. Different models of management exist, and
regional leaders will have to develop a collaborative St. Louis solution to oversight
and management.
The table below shows that 83 percent of the 31 NFL stadia and 50 percent of the 20 MLS stadia are publicly owned. Eighty-four percent of the NFL stadia and 95 percent of the MLS stadia are managed by private organizations. There are
a number of examples of multiple sports venues in a single market under common
management.
Market Operators Venues Oakland AEG O.co Coliseum (NFL/MLB) and Oracle Arena (NBA)
New Orleans SMG Mercedes-Benz Superdome (NFL) and Smoothie King Center (NBA)
Philadelphia Global Spectrum Wells Fargo Center (NBA/NHL) and Citizens Bank Park (MLB)
Orlando Orlando Venues Amway Center (NBA) and Citrus Bowl
Toronto MLSE Air Canada Center (NBA/NHL) and BMO Field (MLS)
Los Angeles AEG Staples Center (NBA/NHL) and StubHub Center (MLS)
Denver Kroenke Pepsi Center (NBA/NHL) and Dick's Sporting Goods Park (MLS)

13
Conclusion
Summary of Economic Impacts of the Proposed Stadium
Create nearly $200 million (St Louis MSA) and $177 million (Missouri) total annual economic impact.xlv
Create $895 million (St Louis MSA) and $908 million (Missouri) total economic impact from construction over a 2-3 year construction period.xlvi
Maintain community brand, media exposure, quality of life, and central city development.
St. Louis Regional Chamber Position
St. Louis is at a critical moment of decision about building and reinvesting in
convention, sports, and entertainment infrastructure.
Being an NFL City is economically important to St. Louis.
The economics of the Stadium Proposal are net-positive, fiscally-sound, and
doable.
With the right investment, strategy and coordination, the Proposed Stadium and
existing convention, sports and entertainment facilities will complement each
other for new business development.
Contact: Hart Nelson, Director of Public Policy
(314) 444-1144, [email protected]
Sources:
“St. Louis Regional Chamber: Proposed North Riverfront Stadium Analysis” PwC, November
2015.
“The Economic Impact of a NFL Stadium Complex” Missouri Economic Research and
Information Center (MERIC), August 2015.
“Local Cost-Benefit Analysis: Construction of a New Stadium and Retention of a National Football League Team in the St. Louis Region” MERIC, July 2015.
“New St. Louis Open--‐Air Stadium Market Feasibility Analysis” Convention, Sports & Leisure
(CSL), May 13, 2015, https://cdn3.vox-
cdn.com/uploads/chorus_asset/file/3853102/NFL_Market_Feasibility_Analysis_-
_St._Louis_07July2015.0.pdf

14
i “Events” St. Louis Sports Commission, http://stlsports.org/events/, Accessed 10/21/15. ii “Starting Another Super Season in Our Super City” St. Louis Business Journal, Sep. 3, 2000, http://www.bizjournals.com/stlouis/stories/2000/09/04/editorial1.html, Accessed 10/22/15. iii “Football Focuses Spotlight on City” St. Louis Business Journal, Aug. 27, 2000, http://www.bizjournals.com/stlouis/stories/2000/08/28/story4.html, Accessed 10/22/15. iv “Employment, Hours, and Earnings (CES)” U.S Bureau of Labor Statistics, http://data.bls.gov/pdq/querytool.jsp?survey=sm, Accessed 11/9/15. v “CVC Wants $100 Million Expansion” St. Louis Business Journal, Oct. 9, 2015, http://www.bizjournals.com/stlouis/print-edition/2015/10/09/cvc-wants-100-million-expansion.html, Accessed 10/14/15. vi PwC Page 6. vii PwC Page 7. viii PwC Page 9. ix PwC Page 22. x PwC page 24. xi PwC page 25. xii PwC Estimated impacts and economic contributions measured in terms of output, employment, labor income and taxes for the construction period and one stabilized year of operations. This summary presents direct spending, total output, employment and taxes defined by PwC as follows: “Direct Spending - Estimated first round of spending in the MSA and State by non-residents and non-local businesses generated by incremental activity resulting from the Proposed Stadium as well as resident and local business spending in the MSA and State which would otherwise occur elsewhere but for the construction and operation of the Proposed Stadium.” “Total Output - Output is an economic concept akin to sales or revenue which reflects direct spending as well as the potential indirect and induced effects of direct spending. Indirect spending is additional spending occurring within other industries that provide goods and services to the "direct" industries involved in the activity generated by the Proposed Stadium. Induced spending represents household spending of income earned either directly or indirectly from activity as a result of the Proposed Stadium.” “Employment - Potential full-time and part-time jobs resulting from the direct, indirect and induced spending generated by activity resulting from the Proposed Stadium.” “Labor income - Potential wages and salaries, benefits, and proprietors' income resulting from the direct, indirect and induced spending generated by activity resulting from the Proposed Stadium.” “Taxes - Potential local (within MSA) and State tax receipts created by the direct, indirect and induced spending generated by activity resulting from the Proposed Stadium.” PwC page 6. xiii PwC page 18. xiv PwC page 18. xv Note that the PwC report indicates total impact of $199 million. This report rounds up to about $200 million. xvi Note that the indirect impact was adjusted up from $96 million to account for rounding. xvii PwC page 19. xviii PwC page 17. xix “Deal for round-the-clock construction on new St. Louis football stadium could save $5 Million” St. Louis Post Dispatch February, 20, 2015 http://www.stltoday.com/news/local/metro/deal-for-round-the-clock-construction-on-new-st-louis/article_459efd23-4bbf-5761-974e-61298f63de05.html xx PwC page 19. xxi PwC page 17. xxii North Riverfront Redevelopment, Public Benefit State of Missouri, Slide 2. xxiii PwC page 22. xxiv PwC page 23. xxv “Should Cities be Ready for Some Football? Assessing the Social Benefits of Hosting an NFL Team” Carlino and Coulson, Philadelphia Federal Reserve Bank, Business Review Q2 2004, page 11.

15
xxvi Regional Convention and Sports Complex Authority, “New Riverfront Stadium Complex in St. Louis Missouri”, Missouri Development Finance Board Tax Credit for Contribution Program Application, July 1, 2015, page Attachment 2 2-1. xxvii PwC pages 26 – 27. xxviii North Riverfront Redevelopment, Public Benefit State of Missouri, Slide 4. xxix PwC page 31. xxx PwC page 31. xxxi “Could Obama’s budget snag funding for the proposed riverfront stadium?” St. Louis Business Journal, March 19, 2015, http://www.bizjournals.com/stlouis/morning_call/2015/03/could-obamas-budget-snag-funding-for-the-proposed.html, Accessed 11/9/15. xxxii CSL report page 68. xxxiii “State approves tax credits for proposed NFL stadium” St. Louis Business Journal, Aug. 18, 2015, http://www.bizjournals.com/stlouis/news/2015/08/18/state-approves-50-million-for-proposed-nfl-stadium.html, Accessed 8/22/15. xxxiv MERIC “The Economic Impact of a NFL Stadium Complex” August 2015, page 2. xxxv MERIC “The Economic Impact of a NFL Stadium Complex” August 2015, pages 1-2. xxxvi MERIC “Local Cost-Benefit Analysis: Construction of a New Stadium and Retention of a National Football League Team in the St. Louis Region”, page 5. xxxvii CSL page X. xxxviii “Proposed NFL Stadium Gets a Name and Sponsor” St. Louis Business Journal, Oct. 6, 2015, www.bizjournals.com/stlouis/news/2015/10/06/proposed-nfl-stadium-gets-a-name-and-sponsor.html, Accessed 11/11/15. xxxix CSL pages 65 – 67. xl CSL page 105. xli “Employment, Hours, and Earnings (CES)” U.S Bureau of Labor Statistics, http://data.bls.gov/pdq/querytool.jsp?survey=sm, Accessed 11/9/15. xlii PwC page 13. xliii “CVC Wants $100 Million Expansion” St. Louis Business Journal, Oct. 9, 2015, http://www.bizjournals.com/stlouis/print-edition/2015/10/09/cvc-wants-100-million-expansion.html, Accessed 10/14/15. xliv “Blues in Need of Upgrades for Scottrade Center” St. Louis Business Journal, Oct. 2, 2015, http://www.bizjournals.com/stlouis/print-edition/2015/10/02/blues-in-need-of-upgrades-for-scottrade-center.html, Accessed 10/14/15. xlv PwC page 19 PwC reports total impact reported as $199 million, this reports rounds up to nearly $200 million. xlvi PwC page 17.

St. Louis Regional Chamber
Proposed North Riverfront Stadium Analysis
November 2015
Strictly Private and Confidential - For Internal Company Use Only
www.pwc.com

PricewaterhouseCoopers LLP, 4040 West Boy Scout Boulevard, Suite 1000, Tampa, Florida 33607T: (813) 222-5429, F: (813) 342-8630, www.pwc.com
November 11, 2015
Dear Mr. Reagan:
PricewaterhouseCoopers LLP (“PwC”) was engaged by the St. Louis Regional Chamber (“you” or “Client”) to calculate the potential economic and fiscal impacts on both the St. Louis metropolitan statistical area (“MSA”) and State of Missouri (“State”) economies generated by incremental activity resulting from a proposed stadium venue along the north riverfront in downtown St. Louis, Missouri (“Proposed Stadium”). The study also identified and aggregated potential intangible and qualitative impacts as a result of the Proposed Stadium and/ or potential NFL and MLS tenants. Our services were performed and this deliverable (which is hereafter referred to as “Report”) was developed in accordance with our engagement letter dated May 15, 2015 and are subject to the terms and conditions included therein.
This report and PwC’s services are confidential and access, use and distribution are restricted. The services were performed, and this report prepared, at Client’s direction and exclusively for Client’s sole benefit and use. The services and report may not be relied upon by any person or entity other than Client. PwC makes no representations or warranties regarding the services or this report and expressly disclaims any contractual or other duty, responsibility or liability to any person or entity other than Client. I f you are not Client, or otherwise authorized by Client and PwC, you may not access or use the services or this report.
The services were performed in accordance with Standards for Consulting Services established by the American Institute of Certified Public Accountants ("AICPA"). The procedures we performed did not constitute an examination or a review in accordance with generally accepted auditing standards or attestation standards. Accordingly, we provide no opinion, attestation or other form of assurance with respect to our work or the information upon which our work was based. We did not audit or otherwise verify the information supplied to us in connection with this engagement, from whatever source, except as may be specified in this Report.
The services and this report shall be maintained in strict confidence and may not be discussed with, distributed or otherwise disclosed to any third party, in whole or in part, without PwC’s prior written consent, nor may the services or this report (or contents thereof) be associated with, referred to or quoted in any way in any offering memorandum, prospectus, registration statement, public filing, loan or other agreement.
Our work was limited to the specific procedures and analysis described herein and was based only on the information made available through June 22, 2015. Accordingly, changes in circumstances after this date could affect the findings outlined in this Report.
Some assumptions underlying study findings inevitably may not materialize and unanticipated events and circumstances may occur. Therefore, potential economic and fiscal impacts may differ from study findings and such differences may be material. Additional primary research such as surveys of event attendees regarding their geographic origin and spending patterns might yield additional insight which could further refine the analysis presented in this deliverable.
This report was not intended or written to be used, and it may not be used for the purpose of avoiding U.S. Federal, state or local tax penalties, or supporting the promotion or marketing of any transactions or matters addressed in this report. Client has no obligation of confidentiality with respect to any information related to the tax structure or tax treatment of any transaction.
Very truly yours,
Mr. Joe ReaganPresident & CEOSt. Louis Regional ChamberOne Metropolitan SquareSuite 1300St. Louis, Missouri 63102

Table of Contents
1. Study Overview…..…………….…………………………….............................................................................4
2. Key Inputs for Analysis…….………..…………….….………………………………………………..........................11
3. Economic & Fiscal Impacts……...…..……………………………………………………………............................16
4. Intangible & Qualitative Considerations.………………………………………………………………………………20
5. Appendices………………………………………….....………………………………...............................................29

Section 1
Study Overview

Confidential Information for the sole benefit and use of PwC’s Client.
Proposed North Riverfront Stadium Analysis
Economies Analyzed
The purpose of this study was to calculate the potential economic and fiscal impacts on both the St. Louis metropolitan statistical area (“MSA”) and State of Missouri (“State”) economies generated by incremental activity which could result from the development and operation of a proposed stadium venue along the north riverfront in downtown St. Louis, Missouri (“Proposed Stadium”). I t was assumed for this study the Proposed Stadium would be designed and programmed to host a tenant National Football League (“NFL”) club, a tenant Major League Soccer (“MLS”) club, and an annual calendar of recurring and non-recurring special events and other stadium rentals.
For purposes of this study, the St. Louis MSA consists of 15 counties; with seven counties located in the State of Missouri and eight counties located in the State of I llinois.
Study IntroductionThis study evaluated the potential economic and fiscal impacts on both the St. Louis MSA and State of Missouri economies generated by incremental activity resulting from the Proposed Stadium.
5
Study Overview
St. Louis MSA
Source: ESRI

Confidential Information for the sole benefit and use of PwC’s Client.
Proposed North Riverfront Stadium Analysis
Impacts AnalyzedEstimated impacts and economic contributions have been expressed in terms of output, employment, labor income, and taxes for the construction period as well as a stabilized year of operations.
Impact Types
6
Study Overview
Direct spending Estimated first round of spending in the MSA and State by non-residents and non-local businesses generated by incremental activity resulting from the Proposed Stadium as well as resident and local business spending in the MSA and State which would otherwise occur elsewhere but for the construction and operation of the Proposed Stadium.
Total output Economic concept akin to sales or revenue which reflects direct spending as well as the potential indirect and induced effects of direct spending. Indirect spending is additional spending occurring within other industries that provide goods and services to the "direct" industries involved in the activity generated by the Proposed Stadium. Induced spending represents household spending of income earned either directly or indirectly from activity as a result of the Proposed Stadium.
Employment Potential full-time and part-time jobs resulting from the direct, indirect and induced spending generated by activity resulting from the Proposed Stadium.
Labor income Potential wages and salaries, benefits, and proprietors' income resulting from the direct, indirect and induced spending generated by activity resulting from the Proposed Stadium.
Taxes Potential local (within MSA) and State tax receipts created by the direct, indirect and induced spending generated by activity resulting from the Proposed Stadium.

Proposed North Riverfront Stadium Analysis
Confidential Information for the sole benefit and use of PwC’s Client.
Direct SpendingThe estimated direct spend resulting from the Proposed Stadium served as the basis for calculating the project’s economic and fiscal impacts to the MSA and State.
Direct Spend Activities
Spending in the MSA and/ or State resulting from the Proposed Stadium was considered for the following activities to the extent such expenditures occurred in the local market (MSA and/ or State) and were funded by non-local sources.
• Stadium construction – hard costs, including labor and materials, as well as soft costs related to activities such as design, engineering, insurance, legal, and other professional services. Costs related to land acquisition and project financing were excluded.
• Stadium operations – event operating costs as well as expenditures related to facility operations.
• Tenant operations – player costs as well as expenditures related to team operations and business operations.
• Event organizers & visiting teams – accommodations, food service, ground transportation, professional services, and other miscellaneous expenditures.
• Event attendees – accommodations, food service, food stores, retail sales, entertainment, rental car, ground transportation, and other miscellaneous out-of-stadium expenditures.
Incremental Activity
The direct spend attributed to the project represents the difference between the potential activity level resulting from the Proposed Stadium and a baseline level of recent historical activity, less any activity which could be reasonably assumed to be lost in the near future but for the construction and operation of the Proposed Stadium (e.g., NFL St. Louis Rams).
7
Study Overview

Proposed North Riverfront Stadium Analysis
Confidential Information for the sole benefit and use of PwC’s Client.
Direct Spend ExclusionsDirect spend levels calculated were adjusted as necessary to limit the analysis to expenditures which occur and remain in the local market and are funded by non-local sources which can be considered incremental to the MSA and/or State.
Local Sources: Substitution Effect
Local event attendee spending has been assumed to be entirely displaced and therefore excluded in the analysis along with the portion of operating expenditures of the Proposed Stadium and its tenants otherwise funded by local sources. This concept, known as the substitution effect, assumes any spending by or as a result of local sources will still occur in the local economy in some form if not spent on activities generated by the Proposed Stadium. For example, if a local resident did not spend money to attend an NFL game, it is assumed that he or she would have spent that money on another form of purchase in the local economy. Therefore, since such spending is not considered new to the local economy or is otherwise leaked outside the local economy but for the Proposed Stadium, it has not been included in the estimates presented in this report.
Professional Sports Operating Expenditures
Adjustments to direct spending sources were also applied, as appropriate, to reflect that spending patterns of professional teams vary from those which take place in other industries as a significant portion of initial spending immediately leaves the local economy. Typically, player salaries, the largest expense of a professional sports franchise, do not fully impact the local economy as players (and their families) often do not reside in the local area year-round and are likely to put a substantial portion of their salary into savings or non-local investments. Therefore, the majority of player salaries were not included in our direct spending estimates and other areas of initial direct spending was adjusted, as necessary, to reflect the spending which typically will immediately leave the market area.
8
Study Overview

Proposed North Riverfront Stadium Analysis
Confidential Information for the sole benefit and use of PwC’s Client.
Indirect Spending & Induced EffectsThe indirect and induced effects of the incremental direct spend generated as a result of the Proposed Stadium were also calculated to reflect the “ripple” effect as the initial dollars are re-spent locally.
Indirect Spending & Induced Effects
Indirect spending was also considered based on IMPLAN spending multipliers to acknowledge additional expenditures which occur in either the MSA or State economy within other industries that provide goods and services to the "direct" industries which support events at the Proposed Stadium and related activities.
Further, induced effects were computed through the IMPLAN spending multipliers to reflect household spending in either the MSA or State economy of personal income earned either directly or indirectly from the Proposed Stadium event activity.
9
Study Overview
Sources of Impacts
Induced Effects
IndirectSpending
DirectSpending

Confidential Information for the sole benefit and use of PwC’s Client.
Proposed North Riverfront Stadium Analysis
Study ApproachModel inputs and underlying assumptions were informed by data provided by project stakeholders and further built out and/or refined using industry sources and our past experience.
Study Approach
Study findings were based on direct spending and impact models developed by PwC. Inputs and underlying assumptions to the direct spending model were based on historical and prospective information provided by the St. Louis Regional Chamber and other project stakeholders related to considerations such as the following:
• Proposed Stadium event activity levels and event profiles
• Proposed Stadium attendee volume, place of origin and spending profiles
• Proposed Stadium operating expenditures and tenant organization operating expenditures
• Proposed Stadium development costs
• Edward Jones Dome replacement business
Industry sources and our past experience were used to refine inputs and assumptions, as appropriate, and fill in gaps in information provided by the St. Louis Regional Chamber and other project stakeholders, as needed, to complete the direct spending model. Inputs and assumptions to the direct spending model were not based on a detailed market study by PwC nor involved primary research such as a survey of event attendees regarding geographic origin and spending patterns. Therefore, model results should be considered preliminary and subject to further diligence and refinement. As events and circumstances frequently do not occur as expected, there may be material differences between model assumptions and actual results. PwC disclaims responsibility and liability for model assumptions and any results achieved.
Impact model results were computed based on direct spending results and spending multipliers sourced from IMPLAN input -output models for the MSA and State.
10
Study Overview

Section 2
Key Inputs for Analysis

Confidential Information for the sole benefit and use of PwC’s Client.
Proposed North Riverfront Stadium Analysis
Stadium Development CostsThe current cost estimate for the development of the Proposed Stadium is $905 million. It has been assumed that 50 percent and 54 percent of the estimated project cost would be spent in the MSA and State, respectively.
12
Key Inputs for Analysis
($ in millions)
Construction Materials & Other Related Costs $441
Construction Labor 294
Design and Engineering Services 130
Legal Services 9
Insurance 31
Total $905
1. Dollar amounts are presented in millions and 2015 dollars. Figures may not sum due to rounding.
2. Analysis does not consider costs related to land acquisition and project financing.
Source: St. Louis NFL Stadium Task Force and its advisors, PwC, Industry Resources

Confidential Information for the sole benefit and use of PwC’s Client.
Proposed North Riverfront Stadium Analysis
Annual Event ActivityThe Proposed Stadium has been assumed to host an NFL club, an MLS club, and an annual calendar of recurring and non-recurring special events and other stadium rentals.
13
Key Inputs for Analysis
Event Type Event DaysTotal
AttendanceAverage
Attendance
NFL 10 550,000 55,000
MLS 21 525,000 25,000
Motor Sports 1.5 71,250 47,500
Concerts 1 47,500 47,500
International Soccer 1 40,000 40,000
NCAA Football 1 37,500 37,500
High School Events 11 45,000 4,091
Other Events 75 99,800 1,331
Total 121.5 1,416,050 11,655
1. Figures may not sum due to rounding.
2. Figures presented exclude NFL training camp attendance which has also been considered in the impact analysis.
3. Other events include catered events, ethnic festivals, and plaza events.
4. Analysis does not consider potential playoff games and special events such as NFL Super Bowl, MLS All-Star Game, and MLS Cup which could materialize as a result of the Proposed Stadium.
Source: St. Louis NFL Stadium Task Force and its advisors
The event activity assumed for the Proposed Stadium includes a mix of new events to the market as well as existing events displaced from the Edward Jones Dome and other venues in the local area such as Busch Stadium, Scottrade Center, Chaifetz Arena, and Hollywood Casino Amphitheatre. Approximately 86 percent of the Proposed Stadium’s estimated attendance considered in this analysis is associated with event activity which has been assumed to be incremental to the market or otherwise would not materialize in the near future but for the Proposed Stadium.
A detailed market study has not been performed to assess the competitive impact of the Proposed Stadium on the market’s existing event venues. As such, the assumed event activity for the Proposed Stadium presented may not be reflective of its full potential to displace existing event activity from other local venues depending on factors such as its physical design, management, and market positioning. Such effects, while important to the future operation of those venues, were not considered in this analysis as any incremental impacts to the MSA and/ or State resulting from a shift of this type of activity to the Proposed Stadium are likely immaterial.
Further, the potential incremental impact of repositioning the Edward Jones Dome to attract additional conventions, trade and consumer shows, or other activity to the market has also not been considered in this analysis.

Confidential Information for the sole benefit and use of PwC’s Client.
Proposed North Riverfront Stadium Analysis
Event Attendee ProfilesThe geographic origin of event attendees and their estimated per cap spend outside the stadium in the MSA and/or State has been assumed to vary by event type.
14
Key Inputs for Analysis
Attendee OriginAveragePer Cap
Outside Missouri - Inside MSA $33
Missouri - Outside MSA $141
Outside Missouri - Outside MSA $357
1. Figures presented exclude in-stadium expenditures which have also been considered in the impact analysis.
2. Figures presented represent the estimated weighted average per cap across all event types.
3. Per cap spend by Missouri residents located inside the MSA has not been disclosed and is not considered in the analysis in recognition of substitution effect.
4. Non-local attendee length of stay in the local market has been assumed to vary by the attendee’s geographic origin ranging from an average of 1 day to 1.75 days.
Source: PwC, Industry Resources
% Non-Local Attendees
Event Type MSA State
NFL 20% 25%
MLS 10% 20%
Motor Sports 20% 25%
Concerts 20% 25%
International Soccer 10% 20%
NCAA Football 30% 30%
High School Events 10% 5%
Other Events 6% 18%
1. Figures presented represent assumed percentage of event attendees that do not reside in MSA and State.
2. Figures presented exclude NFL training camp attendance which has also been considered in the impact analysis.
3. Other events include catered events, ethnic festivals, and plaza events.
Source: PwC, Industry Resources

Confidential Information for the sole benefit and use of PwC’s Client.
Proposed North Riverfront Stadium Analysis
Annual Operating ExpendituresThe combined operations of the Proposed Stadium and its primary tenants are estimated to result in $106 million of direct spend in the local market, 64 percent and 66 percent of which is assumed to be funded by non-local sources (incremental) to the MSA and State, respectively.
15
Key Inputs for Analysis
($ in millions)St. Louis
MSAState of
Missouri
Total Expenditures $311 $311
% Spent in Local Market 34% 34%
Local Expenditures $106 $106
% Funded by Non-Local Sources 64% 66%
Adjusted Local Expenditures $68 $70
1. Dollar amounts are presented in millions and 2015 dollars.
2. Figures presented include operating expenditures of stadium management, stadium vendors, the NFL club, and the MLS club.
3. Figures presented exclude out-of-stadium expenditures by event organizers, visiting teams, and event attendees which have also been considered in the analysis.
Source: St. Louis NFL Stadium Task Force and its advisors, PwC, Industry Resources
The estimated operating expenditures of the Proposed Stadium and its primary tenants were adjusted to account for dollars spent outside the MSA and/ or State on non-local goods and services or otherwise immediately transferred outside the local economy such as player salaries and league dues and revenue sharing.
Expenditures retained locally were then further adjusted to reflect only the portion of operations funded by non-local sources which could be considered incremental to the market and not otherwise subject to the substitution effect.

Section 3
Economic & Fiscal Impacts

Confidential Information for the sole benefit and use of PwC’s Client.
Proposed North Riverfront Stadium Analysis
Construction Period ImpactsConstruction of the Proposed Stadium is estimated to generate approximately $895 million and $908 million of total output in the MSA and State, respectively, over a 2- to 3-year construction period.
17
Economic & Fiscal Impacts
($ in millions) DirectIndirect/Induced Total
St. Louis MSA
Sales (Output) $450 $446 $895
Labor Income $218 $153 $371
Employment 2,950 2,970 5,920
State and Local Taxes $6 $21 $27
State of Missouri
Sales (Output) $486 $422 $908
Labor Income $238 $144 $383
Employment 3,210 3,010 6,220
State and Local Taxes $6 $20 $26
1. Dollar amounts are presented in millions and 2015 dollars. Figures may not sum due to rounding.
2. MSA and State estimates are not mutually exclusive and therefore cannot be added.
3. Figures represent impacts over the multi-year construction period and would need to be adjusted for comparison to any annualized estimates.
4. Direct expenditures on goods associated with construction have been assumed to be exempt from sales taxes.
Source: PwC

Confidential Information for the sole benefit and use of PwC’s Client.
Proposed North Riverfront Stadium Analysis
Annual Operating Direct SpendThe estimated direct spend in the local market which has been attributed to the Proposed Stadium in a stabilized year of operation is $102 million and $96 million in the MSA and State, respectively.
18
Economic & Fiscal Impacts
($ in millions)St. Louis
MSAState of
Missouri
Adjusted Operating Expenditures (A) $68 $70
Other Incremental Expenditures (B) 37 29
New Stadium (A + B) $105 $99
Market Baseline (C) 82 79
Incremental Direct Spend (A + B - C) $23 $20
NFL Club Baseline Retained (D) 80 76
Attributed Direct Spend (A + B – C + D) $102 $96
1. Dollar amounts are presented in millions and 2015 dollars. Figures may not sum due to rounding.
2. MSA and State estimates are not mutually exclusive and therefore cannot be added.
3. “Other Incremental Expenditures” include out-of-stadium expenditures by event organizers, visiting teams, and event attendees.
4. “Market Baseline” represents the estimated existing incremental direct spend in the MSA and/orState as a result of the NFL St. Louis Rams and Edward Jones Dome.
5. “NFL Club Baseline Retained” represents the estimated existing incremental direct spend in the MSA and/or State as a result of the NFL St. Louis Rams which has been assumed would otherwise be lost but for the development and operation of the Proposed Stadium.
6. Spending by local fans and revenue funded by local sources are assumed to be entirely displaced and were therefore excluded in the direct spend analysis and figures presented.
Source: PwC
The operating direct spend attributed to the project represents the difference between the potential activity level resulting from the Proposed Stadium and a baseline level of recent historical activity, less any activity which could be reasonably assumed to be lost in the near future but for the construction and operation of the Proposed Stadium (e.g., NFL St. Louis Rams).
The Proposed Stadium is estimated to generate approximately $23 million and $20 million of incremental direct spend in the MSA and State, respectively. An additional $80 million and $76 million of direct spend currently generated by the NFL St. Louis Rams in the MSA and State, respectively, has been estimated would also be retained in each economy which otherwise could be assumed to be lost in the near future but for the Proposed Stadium.

Confidential Information for the sole benefit and use of PwC’s Client.
Proposed North Riverfront Stadium Analysis
Annual Operating ImpactsThe direct spend attributed to the Proposed Stadium is estimated to generate $199 million and $177 million of total output in the MSA and State, respectively, in a stabilized year of operation.
19
Economic & Fiscal Impacts
($ in millions) DirectIndirect/Induced Total
St Louis MSA
Sales $102 $96 $199
Labor Income $69 $33 $102
Employment 910 690 1,600
State and Local Taxes $19 $5 $24
State of Missouri
Sales $96 $81 $177
Labor Income $68 $28 $95
Employment 810 610 1,420
State and Local Taxes $20 $4 $24
1. Dollar amounts are presented in millions and 2015 dollars. Figures may not sum due to rounding.
2. MSA and State estimates are not mutually exclusive and therefore cannot be added.
Source: PwC

Section 4
Intangible & Qualitative Considerations

Confidential Information for the sole benefit and use of PwC’s Client.
Proposed North Riverfront Stadium Analysis
Intangible & Qualitative ImpactsPotential non-quantifiable impacts were identified and aggregated through limited case studies of select other sports communities and new stadium projects in North America.
In addition to economic and fiscal impacts resulting from the Proposed Stadium that are quantitatively measured, there are other potential impacts that are either intangible or qualitative in nature. The following potential intangible and qualitative impacts generated by activities as a result of the Proposed Stadium and/ or the potential NFL and MLS tenants were examined:
• Community Brand
• Resident Quality of Life
• Community Giving Programs
• Locally Sourced Initiatives
• Ancillary Real Estate Development
Potential impacts are illustrated on the following pages through limited case studies of select other professional sports communities and other new stadium projects in North America. Historical related impacts on the St. Louis market were also analyzed, as appropriate, based on information provided by the St. Louis Regional Chamber and other project stakeholders.
21
Intangible & Qualitative Considerations

Confidential Information for the sole benefit and use of PwC’s Client.
Proposed North Riverfront Stadium Analysis
Community BrandStadium venues and the professional sports teams hosted can have a positive impact on a community’s image and elevate the awareness of its brand outside the local area.
A community can derive value from references to its name and other brand marks during television and radio broadcasts of stadium events as well as through media coverage of activity leading up to and following major events and the recurring, year -round activity of a venue’s professional sports tenant(s). Broadcast and media impressions, which total in the millions for an NFL or MLS event based on number of broadcast viewers, can enhance name recognition among the national or international audience, broaden audience exposure to the community’s culture and attractions, and create a point of differentiation from other communities, including classification as a “major-league” market.
Hosting high profile special events can also generate value for a destination beyond broadcast and media impressions. Such in-demand events create opportunities for community leaders to showcase the market to visitors attending the event which can lead to future leisure travel visitation as well as future conventions/ meeting activity, office openings, and/ or corporate headquarters relocations.
The following examples illustrate the potential value or scale of media exposure generated by sport events. Past research available to reference focuses on team and sponsor related impacts, but also provides an indication of the potential benefit to the event’s host community which receives much of the same exposure/ number of impressions.
• The Green Bay Packers generated more than $14 million in weekday television and radio media exposure during the 2009 football season, which excludes weekend coverage when most games are played.
• A reported 5,000 new jobs came to Jacksonville, Florida via corporate relocations within one year after hosting Super Bowl XXXIX.
• The 2011 NHL All Star game generated 685,000 media impressions worth approximately $49 million in media exposure for the Greater Raleigh market.
• The nine games played at Busch Stadium during the 2013 MLB playoffs generated nearly $60 million in media exposure value for Anheuser-Busch, the ballpark naming rights sponsor. The ballpark name was referenced nearly 2,000 times on television, more than 26,000 times in internet articles, and more than 1,300 times in print news stories.
• A 2011 study calculated the two-year sponsorship value generated by six naming rights partners of NFL stadiums to range between $39 million and $79 million per partner in 2010 and 2011 combined.
• Levi Strauss & Co. indicated Levi’s Stadium generated over 40 billion impressions prior to opening in 2014. The company’s naming rights deal has been reported as $220 million over 20 years.
A demographic profile of the television audience for NFL and MLS regular season games has been provided in Appendix C.
22
Intangible & Qualitative Considerations

Confidential Information for the sole benefit and use of PwC’s Client.
Proposed North Riverfront Stadium Analysis
Resident Quality of LifeStadium events provide residents a source of entertainment and a stadium’s professional sports tenants can influence a community’s identity and foster a sense of pride among residents.
Major sports facilities can enhance the vibrancy of a community and its attractiveness to residents; serving as an anchor for activity within a market’s urban core or other strategic sub-market. Stadium events provide a source of entertainment and contribute to a communi ty’s distinction as a “major-league” market, which can be an important factor in attracting and retaining residents. Research indicates residents value being part of a community that hosts major events and often cite such events as an attractive feature of living in a community. In addition, local professional sports teams serve as a form of social currency that can create a sense of community and build a strong af filiation around a common cause.
Studies of housing values over the past two decades have shown property values and average rents are higher in markets which host professional sports compared to other comparable markets, suggesting the presence of professional sports in a community contr ibutes to a higher quality of life which is valued by its residents.
23
Intangible & Qualitative Considerations

Confidential Information for the sole benefit and use of PwC’s Client.
Proposed North Riverfront Stadium Analysis
Community Giving ProgramsStadium operators and professional sports teams are typically active members of a local community and operate comprehensive community giving programs.
Local community groups and non-profit organizations benefit from the community programs of the stadium operator and the facility’s professional sports tenants along with local outreach initiatives of special events held at the venue and the individual players and executives of the professional sports tenants. Programs and initiatives generally involve the following elements.
• Financial contributions and grants to other community programs, activities, and infrastructure projects (e.g., parks, playgrounds, youth sports fields, child care centers)
• In-kind donations of event tickets, memorabilia and venue space rentals for community use or fundraising activities
• Donated supplies of food, beverages, clothing, toys, and other household items
• Volunteer hours for community service projects and organization/ event appearances
• Sanctioned community events and activities
These activities are demonstrated by reference to examples of the St. Louis Rams community involvement shown on the following page.
24
Intangible & Qualitative Considerations

Confidential Information for the sole benefit and use of PwC’s Client.
Proposed North Riverfront Stadium Analysis
Rams Community InvolvementThe St. Louis Rams organization has a well-established community outreach program which raises awareness and resources for issues and causes relevant to the MSA and State.
Below is a summary of local community initiatives/ activities during the 2014 season which were organized/ funded by the Rams organization.
• Rams players made 343 community appearances and impacted 100 local non-profits and schools
• 38 Rams players purchased 8,300 tickets for schools and non-profits
• The Rams reached 11,700 kids through the PLAY 60 efforts, including devoting more than 2,500 hours over 29 events
• Rams cheerleaders and staff contributed more than 2,400 hours of community service and impacted 18 non-profits through the team’s monthly Staff Days of Service program
• The Rams provided more than 3,500 items to help recipient organizations raise thousands of dollars through raffles, auctions, and other fundraising endeavors
• The Rams built a playground for the local community during the past six seasons as part of the annual Community Improvement Project
• The Rams raised $83,500 over the course of the 2013 and 2014 seasons for the American Cancer Society
• The Rams contributed $145,000 in support for the United Way through special events, tickets, and financial assistance - Rams players contributed an additional $120,000 in direct support to United Way agencies
• Since 1996, the Rams have partnered with the Make-A-Wish Foundation of Missouri and raised more than $2 million to help grant wishes to more than 400 St. Louis area children who are battling life-threatening medical conditions
• During the holidays, the Rams opened up the Edward Jones Dome for more than 4,000 underprivileged children who enjoyed holiday gifts, entertainment, activities, and visits with Santa as well as Rams players, cheerleaders, and mascot
• Since 2012, the Rams partnered with the American Red Cross on the Holiday Mail for Heroes campaign which resulted in 75,000 personalized holiday thank you cards being sent to active and veteran military serving overseas and domestically
• The Rams continued its community outreach program launched in 2012 entitled Rams Blitz: Youth Working Together to Break Through Boundaries which helps promote diversity and inclusion among area youth
In addition to the initiatives/ activities listed above, the Rams recently announced the organization will provide medical coverage at Public High League football games starting in Fall 2015.
25
Intangible & Qualitative Considerations

Confidential Information for the sole benefit and use of PwC’s Client.
Proposed North Riverfront Stadium Analysis
Locally Sourced InitiativesCommunities have placed emphasis on sourcing locally to increase the percentage of investment retained and level of local impact generated by the development and operation of a sports facility.
Locally sourced materials and labor are used during construction and the ongoing operations of a sports facility. The appropriate percentage of a development and/ or operating budget allocated to local or state sourced materials and/ or workforce will vary depending on t he market and relevant resources available. The following are examples of locally sourced resources from recently constructed sports venues:
• More than $680 million worth of materials, or 70 percent, used during construction of MetLife Stadium was sourced locally.
• More than 90 percent of the firms involved in the construction of Target Field were local.
• More than 51 percent of the entire workforce building the new Detroit Red Wings Arena will be Detroit residents.
• Approximately 25 percent of the entire workforce building the new Golden State Warriors Arena will be from San Francisco.
• At least 60 percent of the biddable work at the Golden 1 Center (Sacramento Kings new arena) will be awarded to local businesses.
• At least 50 percent of the workforce that constructed Marlins Park was required to be residents of Miami-Dade County and 20 percent of the workforce was required to be residents of the City of Miami.
In addition to local sourcing initiatives, there are often legislative requirements to award bids to minority and women owned businesses in the local area. Minority Business Enterprise (MBE) and Women Business Enterprise (WBE) certified businesses are often hired during the construction process and in some cases, the planning stage, of a new sports venue. Project managers are generally required to allocate a certain percentage of the total budget or of the total workforce to MBEs, WBEs, and other groups, such as veterans. The businesses usually need to be local or based within the state or a specified area in order to count towards the requirements.
26
Intangible & Qualitative Considerations

Confidential Information for the sole benefit and use of PwC’s Client.
Proposed North Riverfront Stadium Analysis
MBE/WBE RequirementsRecent new sports facility projects budgeted approximately 30 to 40 percent of the deployed workforce and/or 20 to 35 percent of the total construction cost to MBE and WBE certified businesses.
27
Intangible & Qualitative Considerations
Venue Team Year Built MBE % WBE % Total %
Workforce
U.S. Bank Stadium Minnesota Vikings 2016 32% 6% 38%Target Field Minnesota Twins 2010 32% 6% 38%MetLife Stadium New York Jets / Giants 2010 n/a n/a 32%Mercedes-Benz Stadium Atlanta Falcons 2017 n/a n/a 31%Busch Stadium St. Louis Cardinals 2006 25% 5% 30%
Overall Expenditures
CONSOL Energy Center Pittsburgh Penguins 2010 25% 10% 35%Target Field Minnesota Twins 2010 n/a n/a 32%Proposed Stadium St Louis NFL / MLS TBD 25% 5% 30%BBVA Compass Stadium Houston Dynamo 2012 n/a n/a 30%Barclays Center Brooklyn Nets 2012 20% 10% 30%University of Phoenix Stadium Arizona Cardinals 2006 25% 5% 30%AT&T Stadium Dallas Cowboys 2009 n/a n/a 25%Orlando City Stadium Orlando City SC 2016 18% 6% 24%Amway Center Orlando Magic 2010 18% 6% 24%Sporting Park Sporting KC 2011 15% 7% 22%U.S. Bank Stadium Minnesota Vikings 2016 9% 11% 20%Lucas Oil Stadium Indianapolis Colts 2006 15% 5% 20%
1. Data presented represents actual results in the case where both actual and budgeted data was available for a completed project.2. Excludes spending requirements for other groups such as veterans businesses.
Source: PwC, St. Louis NFL Stadium Task Force and its advisors

Confidential Information for the sole benefit and use of PwC’s Client.
Proposed North Riverfront Stadium Analysis
Ancillary Real Estate DevelopmentSports facilities can serve as anchors for mixed use real estate development projects and a catalyst for developing surrounding real estate with lodging, office, retail and residential uses, among others.
28
Intangible & Qualitative Considerations
Gross Square Feet (thousands)Sports Venue Name(s) Development Name Location First Year Acreage Lodging Office Retail Residential UOP Stadium &Gila River Arena
Westgate District Glendale, AZ 2006 223 315 230 651 3,600
Golden 1 Center TBD Sacramento, CA 2016 184 85 475 600 70
PETCO Park Ballpark District San Diego, CA 2004 130 660 325 285 3,900
Paul Brown Stadium & Great American Ballpark
The Banks Cincinnati, OH 2011 89 400 1,000 400 1,800
American Airlines Center Victory Park Dallas, TX 2001 75 230 1,130 342 315
Nationwide Arena Arena District Columbus, OH 2000 75 0 1,500 300 320
SunTrust Park The Battery Atlanta, GA 2017 74 150 630 400 490
Scottrade Center Union Station St. Louis, MO 2014 45 275 0 335 0
Busch Stadium Ballpark Village St. Louis, MO 2014 35 0 750 660 2,160
Sprint Center Power & Light District Kansas City, MO 2008 35 0 1,200 475 2,160
Gillette Stadium Patriots Place Foxborough, MA 2007 31 250 230 810 0
AT&T Park Mission Rock San Francisco, CA TBD 28 0 1,500 500 1,470
Staples Center L.A. Live Los Angeles, CA 2007 27 1,634 165 1,835 366
1. See Appendix D for representative images of each development.
2. Lodging, office, retail, and residential figures represent scope at project build-out and have been presented in thousands.
3. “Retail” includes entertainment venues and food & beverage establishments.
Source: PwC

Appendices
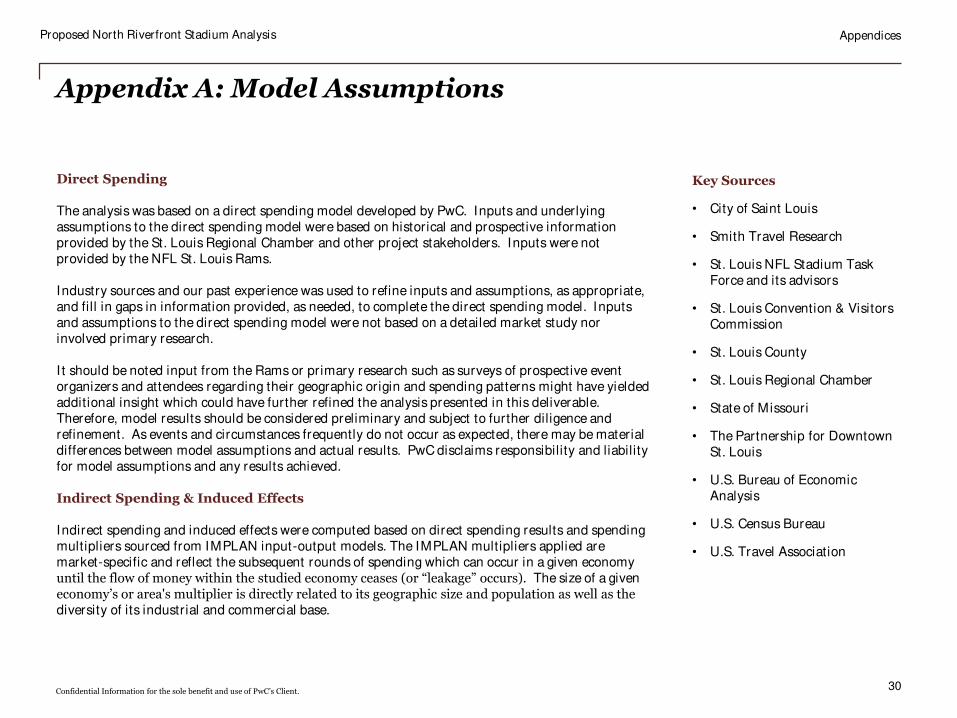
Confidential Information for the sole benefit and use of PwC’s Client.
Proposed North Riverfront Stadium Analysis
Appendix A: Model Assumptions
Direct Spending
The analysis was based on a direct spending model developed by PwC. Inputs and underlying assumptions to the direct spending model were based on historical and prospective information provided by the St. Louis Regional Chamber and other project stakeholders. Inputs were not provided by the NFL St. Louis Rams.
Industry sources and our past experience was used to refine inputs and assumptions, as appropriate, and fill in gaps in information provided, as needed, to complete the direct spending model. Inputs and assumptions to the direct spending model were not based on a detailed market study nor involved primary research.
I t should be noted input from the Rams or primary research such as surveys of prospective event organizers and attendees regarding their geographic origin and spending patterns might have yielded additional insight which could have further refined the analysis presented in this deliverable. Therefore, model results should be considered preliminary and subject to further diligence and refinement. As events and circumstances frequently do not occur as expected, there may be material differences between model assumptions and actual results. PwC disclaims responsibility and liability for model assumptions and any results achieved.
Indirect Spending & Induced Effects
Indirect spending and induced effects were computed based on direct spending results and spending multipliers sourced from IMPLAN input-output models. The IMPLAN multipliers applied are market-specific and reflect the subsequent rounds of spending which can occur in a given economy until the flow of money within the studied economy ceases (or “leakage” occurs). The size of a given economy’s or area's multiplier is directly related to its geographic size and population as well as the diversity of its industrial and commercial base.
30
Appendices
Key Sources
• City of Saint Louis
• Smith Travel Research
• St. Louis NFL Stadium Task Force and its advisors
• St. Louis Convention & Visitors Commission
• St. Louis County
• St. Louis Regional Chamber
• State of Missouri
• The Partnership for Downtown St. Louis
• U.S. Bureau of Economic Analysis
• U.S. Census Bureau
• U.S. Travel Association

Confidential Information for the sole benefit and use of PwC’s Client.
Proposed North Riverfront Stadium Analysis
Appendix B: Stadium Funding Sources
31
Appendices
Team Venue Year Built Total Capacity Total Cost % Public
NFL
New York Giants / New York Jets MetLife Stadium 2010 82,500 $1,600 0%Atlanta Falcons Mercedes-Benz Stadium 2017 71,000 $1,500 13%San Francisco 49ers Levi’s Stadium 2014 68,500 $1,300 9%Dallas Cowboys AT&T Stadium 2009 80,000 $1,194 37%Minnesota Vikings U.S. Bank Stadium 2016 65,400 $1,027 48%Indianapolis Colts Lucas Oil Stadium 2008 63,000 $720 86%Arizona Cardinals University of Phoenix Stadium 2006 63,400 $456 68%
MLS
D.C. United D.C. United Stadium 2018 20,000 $287 52%New York Red Bull Red Bull Park 2009 30,000 $200 56%Sporting KC Sporting Park 2011 18,467 $200 100%Orlando City SC Orlando City Stadium 2016 25,500 $155 0%Colorado Rapids Dick’s Sporting Goods Park 2007 18,000 $131 40%Real Salt Lake Rio Tinto Stadium 2008 20,000 $110 32%San Jose Earthquakes Avaya Stadium 2015 18,000 $100 0%Chicago Fire Toyota Park 2006 20,000 $98 100%Houston Dynamo BBVA Compass Stadium 2012 22,000 $95 37%FC Dallas Toyota Stadium 2005 20,500 $90 61%Toronto FC BMO Field 2007 20,000 $57 56%
1. Analysis limited to new build projects completed since 2005.2. Reported development cost at time of construction ($ in millions). 3. Public cost does not include publicly financed costs funded directly by facility revenues or other private sources.
Source: PwC

Confidential Information for the sole benefit and use of PwC’s Client.
Proposed North Riverfront Stadium Analysis
Appendix C: TV Audience Demographics
32
Appendices
NFL MLS
Gender
MaleFemale
65%35%
68%32%
Age
2-1718-3435-5455+
9%20%34%37%
14%26%34%27%
Race/Ethnicity
BlackWhiteHispanic
15%77%8%
8%65%34%
Income
Less than $20K$20K-$40K$40K-$75K$75K-$100K$100K+
9%17%32%17%25%
17%21%24%18%20%
Source: The Nielsen Company (2013)

Confidential Information for the sole benefit and use of PwC’s Client.
Proposed North Riverfront Stadium Analysis
Appendix D: Ancillary Real Estate Development
33
Appendices
UOP Stadium & Gila River Arena
Westgate District
Glendale, AZ
Golden 1 Center
TBD
Sacramento, CA
PETCO Park
Ballpark District
San Diego, CA

Confidential Information for the sole benefit and use of PwC’s Client.
Proposed North Riverfront Stadium Analysis
Appendix D: Ancillary Real Estate Development
34
Appendices
Paul Brown Stadium & Great American
Ballpark
The Banks
Cincinnati, OH
Nationwide Arena
Arena District
Columbus, OH
American Airlines Center
Victory Park
Dallas, TX

Confidential Information for the sole benefit and use of PwC’s Client.
Proposed North Riverfront Stadium Analysis
Appendix D: Ancillary Real Estate Development
35
Appendices
Scottrade Center
Union Station
St. Louis, MO
SunTrust Park
The Battery
Atlanta, GA
Busch Stadium
Ballpark Village
St. Louis, MO

Confidential Information for the sole benefit and use of PwC’s Client.
Proposed North Riverfront Stadium Analysis
Appendix D: Ancillary Real Estate Development
36
Appendices
Sprint Center
Power & Light District
Kansas City, MO
Staples Center
L.A. Live
Los Angeles, CA
Gillette Stadium
Patriots Place
Foxborough, MA
AT&T Park
Mission Rock
San Francisco, CA
AT&T Park
Mission Rock
San Francisco, CA

This document has been prepared pursuant to an engagement between PricewaterhouseCoopers LLP and its Client. As to all other parties, it is for general information purposes only, and should not be used as a substitution for consultation with professional advisors.
© 2015 PricewaterhouseCoopers LLP. All rights reserved. In this document, “PwC” refers to PricewaterhouseCoopers LLP, which is a member firm of PricewaterhouseCoopers International Limited, each member firm of which is a separate legal entity.

MISSOURI ECONOMIC RESEARCH AND INFORMATION CENTER
Summary of Research
The Economic Impact of a New NFL Stadium Complex
In January 2015 the St. Louis NFL stadium task force released details for the construction of a
new riverfront professional football stadium complex in downtown St. Louis. The stadium would be
built north of the Arch, along the riverfront, in an older industrial area and is expected to be in
operation by 2019. Total project cost is estimated at $998 million and includes a 62,500 seat stadium.
This analysis estimates the general economic impact of the new stadium construction, as well
as the expected operational impacts of the franchise through the year 2051, when the last state bond
payments are made. The state fiscal benefit is also calculated to consider the cost of bond payments
over a 36 year period, additional tax credit costs during construction, and the expected tax revenues
that would be generated to the state general fund in that time. This research summary is based on
preliminary data available from the task force and other figures outlined in the Assumptions section.
The analysis only includes the state fiscal return and does not include local fiscal benefits or costs.
The construction of a new stadium and continued operations is expected to generate $233
million in net state general revenue (see Table 1) over 36 years. Net general revenue deducts the
annual bond payment of $12 million along with an estimated $94.5 million in anticipated brownfield
and contribution credits during the construction period. Just over 2,754 jobs would be supported
annually over the four year construction period to include construction, supplier, and indirect jobs
created by the spending as well as ongoing NFL activities. The continued franchise operation is
estimated to support an average of 635 jobs annually during the remaining years. The construction
and continued operations would contribute $3.59 billion to total state personal income and $3.82
billion to gross domestic product over the 36 years. State bond payments of $432 million and $94.5
million in brownfield and contribution credits, over the 36 years, would result in an expected state
fiscal benefit ratio of 1.59 ($627M cumulative state general revenue / $394M cumulative state cost in
present value 2015 dollars resulting in $233M in net state revenue).
This preliminary estimate seems reasonable given other stadium research reviewed in this
analysis (see Table 2). An average annual state revenue impact of $16.6 million during the operations
phase compares to estimates between $12 and $21 million in other studies.

MISSOURI ECONOMIC RESEARCH AND INFORMATION CENTER NFL STADIUM COMPLEX ECONOMIC IMPACT MISSOURI DEPARTMENT OF ECONOMIC DEVELOPMENT PAGE 2
Economic Impact Estimate
Table 1. Economic Impact Estimate for the New NFL Stadium Complex in St. Louis *All Figures in Millions of 2015 Constant Dollars
Phase Year
2016 1,632 $113.6 $182.8 $8.1 $8.1 1.68
2017 2,921 $177.1 $356.1 ($15.4) ($7.3) 0.86
2018 4,151 $243.4 $560.2 ($11.7) ($19.1) 0.80
2019 2,310 $170.7 $306.4 ($19.6) ($38.6) 0.71
2020 771 $103.3 $76.7 $3.1 ($35.6) 0.76
2021 685 $93.9 $68.3 $3.1 ($32.4) 0.79
2022 629 $86.4 $63.2 $3.3 ($29.2) 0.83
2023 603 $81.9 $61.1 $3.6 ($25.6) 0.86
2024 595 $79.5 $61.0 $4.0 ($21.6) 0.88
2025 596 $78.2 $61.8 $4.4 ($17.2) 0.91
2026 602 $77.9 $63.4 $4.8 ($12.4) 0.94
2027 611 $78.5 $65.2 $5.3 ($7.1) 0.97
2028 621 $79.5 $67.4 $5.7 ($1.4) 0.99
2029 630 $80.7 $69.4 $6.1 $4.7 1.02
2030 638 $82.1 $71.4 $6.6 $11.3 1.05
2031 644 $83.3 $73.0 $7.0 $18.3 1.07
2032 648 $84.4 $74.3 $7.4 $25.7 1.10
2033 652 $85.7 $75.6 $7.8 $33.5 1.12
2034 653 $86.9 $76.7 $8.2 $41.7 1.15
2035 653 $87.9 $77.4 $8.6 $50.2 1.18
2036 651 $88.8 $78.1 $8.9 $59.2 1.20
2037 647 $89.4 $78.3 $9.3 $68.5 1.23
2038 645 $90.5 $78.9 $9.6 $78.1 1.25
2039 641 $91.4 $79.3 $10.0 $88.1 1.28
2040 639 $92.3 $79.9 $10.3 $98.4 1.30
2041 636 $93.2 $80.4 $10.7 $109.0 1.33
2042 634 $94.2 $80.9 $11.0 $120.0 1.36
2043 632 $95.2 $81.4 $11.3 $131.4 1.38
2044 630 $96.1 $82.0 $11.7 $143.0 1.41
2045 627 $97.0 $82.6 $12.0 $155.0 1.43
2046 624 $97.6 $82.9 $12.3 $167.3 1.46
2047 622 $98.8 $83.5 $12.6 $179.9 1.49
2048 620 $99.9 $84.1 $12.9 $192.8 1.51
2049 619 $101.3 $84.8 $13.2 $206.0 1.54
2050 618 $103.0 $85.7 $13.5 $219.5 1.57
2051 619 $104.6 $86.5 $13.6 $233.1 1.59*Net GR deducts nominal annual bond payments of $12 million through year 2051 along with $50 million in Contribution credits and $44.5 million in Brownfield credits during the construction period.
Construction
Phase
Annual Net State GR
Cumulative Net State
GR
State Fiscal Benefit Ratio
Annual Avg. Emp.
Annual Personal Income
Annual Gross
Domestic Product
Net State General Revenue*
Operations
Phase

MISSOURI ECONOMIC RESEARCH AND INFORMATION CENTER NFL STADIUM COMPLEX ECONOMIC IMPACT MISSOURI DEPARTMENT OF ECONOMIC DEVELOPMENT PAGE 3
Other Related Research
Numerous cities and several economists have conducted studies to determine the
economic impact of NFL stadiums and franchises. Most stadium analyses include the impact of
construction to the economy but only a few provide detail estimates of the annual impact that a
state can expect in terms of sales and income taxes. This research analyzes Green Bay and
Minneapolis’ economic impact studies to determine the possible state tax revenues that could
be obtained by hosting an NFL franchise. A study by the Kansas City Federal Reserve Bank,
which covers a broader range of impact analyses and research, was also reviewed.
The Green Bay/Brown County Professional Football Stadium District (Green Bay, WI) and
the Metropolitan Sports Facilities Commission (Minneapolis, MN) released economic impact
studies discussing the economic benefits of each city’s respective NFL franchises, the Green Bay
Packers and Minnesota Vikings. The reports discussed state sales and income tax revenues
produced in relation to the franchises. The table below shows the revenue and employment
impacts for Green Bay and Minneapolis, along with Federal Reserve and Missouri Department of
Economic Development (DED) estimates. The Packers annual impact to the state was estimated
at over $11.8 million and supported 760 jobs.1 The Vikings report estimated over $20.7 million
in state tax revenue and 3,000 jobs supported.2
Table 2. Annual state fiscal and job impact estimates of NFL Team operations
Several factors determined the calculations of state tax revenue. Consumer spending at
the stadium (e.g. concessions, team store apparel and parking) drives much of the sales tax
revenue calculation. Sales tax figures also include out‐of‐stadium spending such as restaurants,
1 “Economic Impact Study of the Green Bay Packers and the Redeveloped Lambeau Field,” AECOM Technical Services, Inc. 22 September 2010: 18. 2 “Economic and Jobs Impact of Metrodome Next Multipurpose Facility,” Conventions Sports & Leisure. 23 February 2009: A‐2
Annual Operational Impact
Green Bay Packers
Minnesota Vikings
Federal Reserve Estimate*
DED Estimate
Total State Tax Revenue $11,873,000 $20,778,000 $13,367,752 $16,596,221
Number of Jobs Generated 760 3,000 500 635
* KC Federal Reserve estimates adjusted for inflation and St. Louis figures.

MISSOURI ECONOMIC RESEARCH AND INFORMATION CENTER NFL STADIUM COMPLEX ECONOMIC IMPACT MISSOURI DEPARTMENT OF ECONOMIC DEVELOPMENT PAGE 4
lodging, and transportation cost. Salaries of personnel from the NFL franchise, (e.g. players,
coaches, front office staff, stadium and game day staff) figure into the state income tax revenue
portion.
Economists have analyzed the impacts of NFL teams and stadiums in detailed studies
over the past couple decades. The Kansas City Federal Reserve Bank released a report reviewing
much of the research literature and analyzing several economic impact studies of proposed
stadium plans dating back to 1994 across the four major sports leagues in the United States
(MLB, NFL, NBA, and NHL).3 The purpose of the Bank’s research was to verify whether the
economic benefits (e.g. economic impact and projected jobs) as predicted by local economic
impact analyses were comparable to their findings.
Determining the possible tax revenues that a football team could bring to St. Louis, the
Federal Reserve Bank figures were used as a framework to test the reasonableness of estimates
contained in this brief. Adjusting Rappaport and Wilkerson’s estimates to account for Missouri
sales and income tax rates, St. Louis Rams payroll figures, and inflation, the state could receive
nearly $13.4 million in revenue yearly.4 According to the authors, the midpoint of the number
of net jobs generated is 500 for an average sports franchise.5 The DED estimates, by
comparison, showed average state general revenues slightly higher at $16.6 million with 635
jobs supported annually during operations.
Rappaport and Wilkerson’s study states that tax revenues, especially sales tax revenues,
may be hard to measure due to several factors. Sales tax revenue can be affected by the
number of visitors that attend games and how much they spend on average.6 Additionally, the
substitution effect could occur where money is spent at a football game or venues surrounding
the stadium instead of other entertainment venues and events.7 This could cause a shifting of
sales tax revenues and jobs away from other entertainment venues.
3 Joseph Rappaport and Chad Wilkerson, “What Are the Benefits of Hosting a Major League Sports Franchise?” Federal Reserve Bank of Kansas City Economic Review. (1st Quarter 2001): 55. 4 Rappaport and Wilkerson, 67. 5 Rappaport and Wilkerson, 65. 6 Rappaport and Wilkerson, 66. 7 Ibid, 66

MISSOURI ECONOMIC RESEARCH AND INFORMATION CENTER NFL STADIUM COMPLEX ECONOMIC IMPACT MISSOURI DEPARTMENT OF ECONOMIC DEVELOPMENT PAGE 5
Assumptions
1. The construction phase begins in 2016 and is completed by 2019. Total cost of $998 million
is broken out as follows:
a. Land cost of $60 million and relocation, remediation, and demolition of existing
facilities of $70 million in 2016.
b. Parking and infrastructure costs of $90 million spread over years 2016‐2018.
c. Stadium construction cost of $778 million spread over years 2017‐2019.
2. During the construction phase it is assumed that the state sales tax intake on building
materials will be minimal if a public entity tax exemption status is in effect.
3. Due to the large salaries and additional 2% entertainer and athletes’ tax, income taxes are
calculated separately for the football players based on an estimated 2014 total wage bill of
$132 million which grows at an annual rate of 3 percent. The wage bill represents the
median value of salary estimates from five commercial sites (Spottrac, OvertheCap, Forbes,
CBS Sports, and ESPN). Only 25% of players are assumed to spend their income in the area,
therefore spurring local business activity, as often professional players live part of the year
away from the franchise city.
4. The Rams full‐time operations staff is estimated at 133 based on the organization’s website.
A wage bill of $14.8 million is assumed based on an average management occupation salary
in the St. Louis workforce area. Although several staff members and owners will make much
larger salaries than the average worker, and ownership income would likely grow with a
newer stadium, it is not known how much of that income would accrue to the state general
revenue given the more complex nature of this tax situation (for example, income earned in
out‐of‐state games, from advertisements, etc.). According to Forbes the team had a 2013
operating income of $16.2 million and this analysis assumes 80% would be subject to state
income taxes. Wage and operating income is expected to grow at 3% per year.
5. A stadium operation collects sales taxes on an estimated $45 million in total gate receipts
based on a Forbes report (http://www.forbes.com/teams/st‐louis‐rams/). The majority of
taxes are paid by area residents (65% based on Kansas City Federal Reserve report
estimates) so it is assumed that only 35% would be net new to the area as local consumers
would spend income on other entertainment if no NFL team existed. The analysis assumes
that 3% of the non‐local sales tax revenue would accrue to state general revenue which
amounts to just under $500,000 in 2015. From 2019 to 2021 attendance of 62,500 is

MISSOURI ECONOMIC RESEARCH AND INFORMATION CENTER NFL STADIUM COMPLEX ECONOMIC IMPACT MISSOURI DEPARTMENT OF ECONOMIC DEVELOPMENT PAGE 6
anticipated with the new stadium and 61,000 from year 2022 onward. An average ticket
price of $98 at the new stadium starting in 2019 is assumed with an annual growth rate of 3
percent.
6. Average home game attendance in 2014 was 57,000 based on ESPN figures
(http://espn.go.com/nfl/attendance). It is assumed that 35% are non‐local attendees and
additional per person spending of $45 outside the stadium and $25 at the game on
concessions can be expected (Kansas City Federal Reserve estimates adjusted for inflation).
With 10 home games this results in just under $14 million in spending by non‐local
attendees in areas of lodging, other food, retail and travel. In 2019 the estimated total
attendees is assumed to increase to 62,500 for the first 3 years due to the draw of a new
stadium then to settle back to 61,000 in years 2022‐2051. Annual spending growth rate of
3% is assumed.
7. The impact analysis was developed using the REMI Policy Insight economic model (REMI)
and the above assumptions about future events. Therefore the results of this brief should
be considered an estimate that is subject to change, based on variations in the assumptions
or economy, over the time period of study. REMI has been used by the Department of
Economic Development for over fifteen years to analyze the economic and fiscal impacts to
the state of new firms locating to Missouri or the contribution of existing companies in
threat of departure. It is a long‐term, dynamic model that considers changes in the
economy over time, new fiscal costs due to migrating workers, and sales displacement when
firms compete for local market share. Over one hundred and fifty organization, universities,
and consulting firms use this model for impact analysis, including governmental agencies in
thirty three states. The fiscal component of the model is updated annually with Missouri
Office of Administration budget figures to produce better state tax estimates.
August 2015

D-8
LOCAL COST-BENEFIT ANALYSIS:
CONSTRUCTION OF A NEW STADIUM COMPLEX
AND
RETENTION
OF A
NATIONAL FOOTBALL LEAGUE TEAM
IN THE
ST. LOUIS REGION
BACKGROUND
According to widely-publicized news reports, the current owner of the Rams (“Rams”) NationalFootball League (“NFL”) team, which now plays its home games in the City of St. Louis (the“City”), intends to move the team to California. If that intention becomes reality and anotherNFL team does not replace the Rams, the State of Missouri (the “State”), the City and taxingjurisdictions in the St. Louis region will lose significant amounts of tax revenue. Of equalimportance, loss of an NFL presence will significantly impair the St. Louis region’s status as ametropolitan area attractive to businesses and residents.
In 2014 the Governor appointed a task force to work with the Regional Convention and SportsComplex Authority (the “RSA”), an entity created by Missouri law to address the region’s needfor convention and sports facilities, to develop a plan to address this threat to the State’s and theregion’s economic health. NFL officials have made it clear that without a new stadium theregion will not retain an NFL team. For that reason, the Governor’s task force and the RSA haveworked with the region’s business leaders and others to develop a plan to build a new stadiumthat meets NFL standards.
In January 2015 the RSA released a proposal for construction of a new outdoor stadiumcomplex, including ancillary transportation and other infrastructure, in a deteriorated andunderutilized area on the St. Louis riverfront north of the Gateway Arch. The cost of theproposed project is currently estimated at $998 million and the new stadium’s seating capacity iscurrently estimated at 62,500. If construction begins in early 2016, the new stadium will open intime for the 2019 NFL season.
The purpose of this analysis is to examine the potential local economic impact if the proposednew stadium complex is constructed and an NFL team plays its home games in the new complex.A companion analysis performed by the Missouri Economic Research and Information Center(“MERIC”) analyzes State benefits anticipated to be associated with the new stadium proposal.This analysis is based on preliminary data provided by the task force and certain of itsconsultants as well as other available data consistent with the MERIC analysis. Unlike theMERIC analysis, this analysis estimates only direct local revenue impacts and ignores thepositive impact of indirect revenue that may result from application of "multipliers"—e.g., the
F

D-9
additional local tax revenue generated when workers and businesses spend their stadiumcomplex and football-related revenue on other taxable goods and services. If multipliers wereapplied in this analysis, one-time local revenues from stadium complex construction andrecurring local revenues from stadium complex and NFL operations would be greater than areestimated in this analysis.
Retention of an NFL team in the St. Louis region is necessary to preserve the region’s “bigleague” image and the positive impact of that image on the region’s ability to retain and attractbusinesses and employees. A new state-of-the-art stadium complex can also be expected toenhance the region’s reputation. This analysis does not attempt to quantify intangible andindirect economic impact resulting from such preservation and enhancement of the region’simage or associated business retention and attraction.
This analysis ignores any revenues that currently accrue to St. Louis County (the “County”) fromNFL team operations and that may accrue to the County as a result of the construction of the newstadium complex and the retention of an NFL team. The current NFL team practice facility islocated in the County; it is therefore likely that the County receives sales tax revenues fromspending by players and team staff during time spent at that facility. It is also likely that someportion of the taxable material purchases required for the new stadium complex’s constructionwill occur in the County. And it is also likely that the County receives hotel tax revenues fromvisiting team players and home team players who do not reside in the St. Louis region. Like theCity, the County also benefits from the enhanced regional image associated with the presence ofan NFL team and will experience the same intangible negative impact as the City if the regionloses professional football.
In addition to NFL games, it is also anticipated that sporting and other entertainment events newto the region will take place in the new stadium complex and that those events will also producedirect recurring revenue for the City and its taxing jurisdictions. This analysis ignores theeconomic impact of those new events.
Finally, it is anticipated that a new stadium complex will stimulate additional economicdevelopment in the broader North Riverfront area. This analysis does not include the economicimpact of such anticipated additional development.
LOCAL IMPACT ESTIMATES:
CONSTRUCTION OF A NEW STADIUM COMPLEX
AND
RETENTION OF A NATIONAL FOOTBALL LEAGUE TEAM
Construction of the proposed new stadium complex will not begin unless an NFL team commitsto play all of its home games in the new stadium complex and the team and/or the NFL committo a substantial financial investment in the stadium development.
F

D-10
This analysis assumes that arrangements for construction of a new stadium and retention of aprofessional football team in the St. Louis region are finalized before 2015 year-end and thateither the Rams or another NFL team will play home games in the existing Edward Jones Dome(the “Jones Dome”) through 2018 and will play home games in the new stadium in 2019 andthereafter.
If the new stadium complex is constructed, the City is expected to benefit significantly from “onetime” earnings and payroll tax on the wages anticipated to be paid to the new stadium’sconstruction workers from the beginning of 2016 through the first half of 2019. This analysisalso anticipates that the City will receive a minimal amount of sales tax revenues from stadium-related construction materials and equipment purchased without use of the RSA’s tax exemptioncertificate.
In the second half of 2019 and thereafter, the presence of a new, state-of-the-art stadium complexis expected to produce growth in recurring NFL-related direct City revenues in excess of whatcould be expected merely from the effects of across-the-board inflation on the status quo. Whenthe new stadium complex opens in 2019, it is anticipated that football fans as well as others inthe region will want to experience the new complex and that professional football’s renewedcommitment to the region will engender more regional loyalty to the sport. As a result, it is alsoanticipated that NFL ticket pricing, the number of NFL tickets purchased, and actual attendanceat NFL games will increase. The MERIC analysis assumes that NFL games at the new 62,500-seat facility will be sold out for the first three years after the new stadium opens. It is furtherassumed that the average St. Louis NFL ticket price in 2019 will be the national average 2019NFL ticket price. Because it is also assumed that the number of people who actually attend NFLgames in the new stadium will be a higher percentage of the number of tickets purchased than iscurrently the case at the Jones Dome, percentage increases in football-related food, beveragesand merchandise sales will outpace the percentage increase in number of tickets purchased.Anticipated increases in football-related sales are expected to increase direct revenues fromcertain taxes imposed by the City on various types of sales. Other modest direct revenuesassociated with football operations in the new stadium are expected to be derived from the City’sparking tax and from earnings and payroll tax applied to NFL player and staff earnings at thestadium complex and the earnings of game day and other staff employed by the RSA and itssubcontractors at the stadium complex. It is anticipated that the RSA will employ 2,600 part-time people at the stadium complex on each NFL game day and 50 new full-time staff to managethe stadium complex.
Other governmental entities that impose taxes in the City are also expected to benefit fromrecurring revenues if NFL football remains in St. Louis. One example is the St. Louis Board ofEducation, the City’s public school district that operates only in the City and imposes a tax onsales in the City. In addition, the Regional Convention and Visitors Commission (“CVC”) andthe Regional Arts Commission (“RAC”) are expected to receive minimal direct recurringrevenue from a statutorily dedicated hotel tax applied to NFL-related hotel room sales.
MERIC assumes that 65% of the local disposable income projected to be spent on professionalfootball-related purchases would be spent on other taxable purchases in Missouri if not spent onNFL-related purchases in St. Louis. MERIC therefore discounts its sales tax estimates
F

D-11
accordingly. The MERIC 65% discount has not been applied to City or Board of Educationdirect revenue estimates because the City and the Board of Education receive no revenue fromtaxable spending in other parts of the region and it is unlikely that regional consumers willsubstitute other spending in the City for football-related spending in the City: most people whoattend football games in the City do not live in the City and the City offers few attractiveopportunities for substitute retail spending other than baseball and hockey. Baseball and hockeyseasons do not overlap professional football seasons to any significant degree. The MERICdiscount has not been applied to the CVC and RAC revenue estimates because those projectionsare based only on estimated hotel room sales to football fans from outside the region and suchsales would not occur if professional football leaves the region.
The Metropolitan Parks and Recreation District (“Great Rivers Greenway,” or “GRG”) imposestwo sales taxes in the City. Because St. Louis County imposes both GRG sales taxes and St.Charles County imposes one GRG tax and because it is likely that substitute local spendingwould occur in one of those counties, MERIC’s 65% discount has been applied to the GRGrevenue estimates.
The task force proposal currently anticipates that the new stadium project will be financed with avariety of public and private funding sources, including new bonds issued by the RSA and a totalof $450 million in contributions from the NFL and/or an NFL football team.
Although the City has taken no action with respect to any aspect of the proposed new stadiumcomplex development, the task force proposal currently anticipates that the State and the Citywill lease the new stadium complex from the RSA, that the new lease will replace the State’s andCity’s current debt service commitments for the Jones Dome, and that the RSA will use the leasepayments made by the State and the City to pay debt service on the new RSA bonds. The currenttask force proposal and this analysis assume that the City will make lease payments of $5 millioneach year through 2023, $5.5 million in 2024, and $6 million annually through 2051. The Citywill ultimately decide whether to enter into the proposed new lease and whether to provide otherincentives that may be requested for the development which this analysis does not take intoaccount. The RSA has not discussed the contents of this MDFB application with the City.
The table on the following page summarizes direct revenues estimated to accrue to the City andother jurisdictions that impose taxes in the City as a result of new stadium complex constructionand professional football retention, taking into account the amounts of City lease paymentsanticipated by the task force proposal.
This analysis involves certain assumptions and judgments relating to future events and economicand other conditions over a 35-year time period. Therefore, this analysis should not be viewed asa prediction or assurance that the revenues estimated herein will be realized. Actual revenuesover the 35-year period will vary from the estimates in this analysis.
See the “General Notes” following the table for additional information related to this analysis.
F

D-12
Year
TOTAL
ESTIMATED
DIRECT
CITY
REVENUE
LESS:
Anticipated
City Lease
Payment
ESTIMATED
NET
DIRECT
CITY
REVENUE
BOARD
OF
EDUCATION
ESTIMATED
REVENUE
GREAT
RIVERS
GREENWAY
ESTIMATED
REVENUE
CONVENTION
& VISITORS
COMMISSION
REGIONAL
ARTS
COMMISSION
TOTAL
ESTIMATED
NET
DIRECT
REVENUE
2015* 4,212,535 (6,000,000) (1,787,465) 354,284 30,311 8,250 3,000 (1,391,620)
2016 5,129,833 (5,000,000) 129,833 362,388 31,004 8,498 3,090 534,813
2017 5,226,090 (5,000,000) 226,090 370,685 31,714 8,752 3,183 640,424
2018 5,324,576 (5,000,000) 324,576 379,179 32,441 9,015 3,278 748,489
2019 6,143,257 (5,000,000) 1,143,257 489,088 41,844 9,285 3,377 1,686,852
2020 5,903,121 (5,000,000) 903,121 503,761 43,100 9,564 3,478 1,463,023
2021 6,079,727 (5,000,000) 1,079,727 518,874 44,393 9,851 3,582 1,656,427
2022 6,090,641 (5,000,000) 1,090,641 516,981 44,231 10,146 3,690 1,665,688
2023 6,272,890 (5,000,000) 1,272,890 532,490 45,557 10,451 3,800 1,865,189
2024 6,460,598 (5,500,000) 960,598 548,465 46,924 10,764 3,914 1,570,666
2025 6,653,927 (6,000,000) 653,927 564,919 48,332 11,087 4,032 1,282,297
2026 6,853,046 (6,000,000) 853,046 581,866 49,782 11,420 4,153 1,500,267
2027 7,058,129 (6,000,000) 1,058,129 599,322 51,275 11,763 4,277 1,724,767
2028 7,269,354 (6,000,000) 1,269,354 617,302 52,814 12,115 4,406 1,955,991
2029 7,486,906 (6,000,000) 1,486,906 635,821 54,398 12,479 4,538 2,194,141
2030 7,710,973 (6,000,000) 1,710,973 654,896 56,030 12,853 4,674 2,439,426
2031 7,941,752 (6,000,000) 1,941,752 674,543 57,711 13,239 4,814 2,692,058
2032 8,179,443 (6,000,000) 2,179,443 694,779 59,442 13,636 4,959 2,952,259
2033 8,424,253 (6,000,000) 2,424,253 715,622 61,225 14,045 5,107 3,220,254
2034 8,676,397 (6,000,000) 2,676,397 737,091 63,062 14,466 5,261 3,496,277
2035 8,936,093 (6,000,000) 2,936,093 759,204 64,954 14,900 5,418 3,780,570
2036 9,203,568 (6,000,000) 3,203,568 781,980 66,903 15,347 5,581 4,073,379
2037 9,479,055 (6,000,000) 3,479,055 805,439 68,910 15,808 5,748 4,374,960
2038 9,762,794 (6,000,000) 3,762,794 829,602 70,977 16,282 5,921 4,685,577
2039 10,055,033 (6,000,000) 4,055,033 854,491 73,106 16,771 6,098 5,005,499
2040 10,356,026 (6,000,000) 4,356,026 880,125 75,300 17,274 6,281 5,335,006
2041 10,666,036 (6,000,000) 4,666,036 906,529 77,559 17,792 6,470 5,674,385
2042 10,985,333 (6,000,000) 4,985,333 933,725 79,885 18,326 6,664 6,023,933
2043 11,314,195 (6,000,000) 5,314,195 961,737 82,282 18,875 6,864 6,383,952
2044 11,652,908 (6,000,000) 5,652,908 990,589 84,750 19,442 7,070 6,754,759
2045 12,001,769 (6,000,000) 6,001,769 1,020,306 87,293 20,025 7,282 7,136,675
2046 12,361,081 (6,000,000) 6,361,081 1,050,916 89,912 20,626 7,500 7,530,035
2047 12,731,158 (6,000,000) 6,731,158 1,082,443 92,609 21,244 7,725 7,935,180
2048 13,112,322 (6,000,000) 7,112,322 1,114,916 95,387 21,882 7,957 8,352,465
2049 13,504,906 (6,000,000) 7,504,906 1,148,364 98,249 22,538 8,196 8,782,252
2050 13,909,251 (6,000,000) 7,909,251 1,182,815 101,196 23,214 8,442 9,224,918
2051 14,325,710 (6,000,000) 8,325,710 1,218,299 104,232 23,911 8,695 9,680,847
TOTAL--35YEARS: 115,742,153 27,219,553 2,328,784 537,687 195,523 146,023,699
AVERAGE PER YEAR: 3,306,919 777,702 66,537 15,362 5,586 4,172,106
Ύ ϱ�ŝƐ�ƚŚĞ��Η ĂƐĞ� ĞĂƌΗ͕�ƌĞƉƌĞƐĞ Ɵ Ő� ƵƌƌĞ ƚ�E&>�:Ž ĞƐ��Ž Ğ�ŽƉĞƌĂƟŽ Ɛ�ƉƌŝŽƌ�ƚŽ� Ž Ğ Ğ Ğ ƚ�ŽĨ� Ğǁ�ƐƚĂĚŝƵ � Ž ƉůĞ �ƉƌŽũĞ ƚ͘
SUMMARY:
ESTIMATED DIRECT NET TAXING JURISDICTION REVENUE FROM
STADIUM COMPLEX CONSTRUCTION AND FOOTBALL-RELATED ACTIVITIES
OTHER TAXING JURISDICTIONSCITY OF ST. LOUIS
F

D-13
GENERAL NOTES
This analysis:
Estimates only direct revenues anticipated from NFL games and directly related activities.
Ignores the positive economic impact of other sports/entertainment events that are expectedto take place in the new stadium complex.
Estimates only direct revenues from local taxes imposed in the City of St. Louis and ignoresany direct revenues that may accrue to St. Louis County as a result of the construction of thenew stadium complex and the retention of an NFL team. The current NFL team practicefacility is located in St. Louis County; it is therefore likely that St. Louis County receives andmay continue to receive sales tax revenues from spending by players and team staff duringtheir time at the practice facility. It is also likely that some portion of the taxable materialpurchases required for the new stadium complex's construction will occur in St. LouisCounty. And it is also likely that St. Louis County receives hotel tax revenues from visitingteam players and home team players who do not reside in the St. Louis region.
Ignores the positive impact of new events that may take place in the Jones Dome because useof that facility will no longer be constrained by an NFL lease.
Ignores the impact of collection and/or administrative fees that may be deducted fromrevenues by City and State collection entities.
Assumes that new 35-year bonds are issued in early 2016 to finance a portion of the newstadium's construction cost, that the City and State lease the facility from the RSA, and thatthe City's payments pursuant to the lease are $5 million annually through 2023, $5.5 millionin 2024, and $6 million annually through 2051.
Ignores the impact of any additional incentives that may be provided by the City.
Assumes that construction of the new stadium complex begins in early 2016 and iscompleted in August 2019, and that the complex opens for the 2019 NFL season in August2019.
Assumes that an NFL team will play all of its home games (2 pre-season and 8 regularseason games) in the Jones Dome until the new stadium is complete and in the new stadiumthereafter.
Ignores the impact of any corporate earnings tax payable during construction or operationsbecause it is impossible to quantify profits that may be earned on the construction project orestimate the degree to which any such profits will be deemed to have been earned in the City.
F

DRAFT For Discussion Purposes Only
Subject to Change
DRAFT For Discussion Purposes Only
Subject to Change
New St. Louis
Open‐Air Stadium
Market Feasibility
Analysis
May 13, 2015

Table of Contents DraA Copy
Subject to
Change
Execu;ve Summary i
Introduc;on 1
St. Louis Market Overview 2
Na;onal Football League Benchmarking 3
Email Survey Results 6
Corporate Telephone Survey Results 48
Demand Summary 90
Revenue Projec;ons 99
Focus Group Summaries 101

ExecuHve Summary DraA Copy
Subject to
Change
i
Conven;ons, Sports & Leisure Interna;onal (“CSL”) was engaged by the Na;onal Football League (“NFL”) to conduct a feasibility analysis to determine demand for a new open‐air stadium in the St. Louis area. As part
of this effort, CSL implemented a comprehensive email survey that was completed by approximately 8,100
St. Louis Rams premium seat holders, season ;cket holders, occasional game ;cket buyers, and other
members of the St. Louis Rams database. In addi;on, 300 telephone interviews were conducted with
corpora;ons within the St. Louis metropolitan area with at least $5.0 million in annual sales and 25 employees.
This execu;ve summary presents the key findings and conclusions related to interest in and poten;al
demand for sea;ng at a new open‐air stadium in downtown St. Louis based on the results of both the email
and corporate telephone surveys.
Survey Respondent Profile:
• Overall, approximately 81 percent of email survey respondents categorized themselves as “Avid Fans” of
the St. Louis Rams, approximately 18 percent are “Casual Fans”, and one percent are not fans. In contrast,
only 38 percent of telephone survey respondents considered themselves “Avid Fans”, approximately 54
percent are “Casual Fans” and eight percent are not fans.
• Approximately 89 percent of email and 80 percent of telephone survey respondents have a`ended a St.
Louis Rams home game in the past three (3) years. Email survey respondents a`end an average of 4.8
home games per season and telephone survey respondents a`end an average of 3.1 games per season.
• Email and telephone survey respondents that have a`ended a Rams home game in the past three (3)
years were asked to rate their level of sa;sfac;on with a variety of elements of the Edward Jones Dome
on a scale of 1 to 7, with “1” being “Very Dissa;sfied” and “7” being “Very Sa;sfied. On the following page
is a summary of their responses.

• Elements of the Edward Jones Dome email survey respondents are most saHsfied with include seat loca;on/sightline to field (5.1), stadium loca;on/seeng (5.0), the number of restrooms (4.8), the
number of concession stands (4.8), and quality of restrooms (4.6).
• Elements of the Edward Jones Dome telephone survey respondents are most saHsfied with include
premium seat offerings (5.9), seat loca;on/sightline to field (5.3), the number of concession stands (5.2) and tailga;ng experience (5.1).
• Elements of the Edward Jones Dome email survey respondents are least saHsfied with include
concession prices (3.9), vehicle traffic flow (4.1), parking access/convenience (4.1), interior stadium
appearance (4.1) and stadium entrance/exi;ng (4.3).
• Elements of the Edward Jones Dome telephone survey respondents are least saHsfied with include
technology (3.2), stadium restaurant prices (3.5), concession prices (3.5), tailga;ng experience (3.7),
and parking access/convenience (3.7).
• Survey par;cipants were asked to characterize their current ;cket purchase with the St. Louis Rams.
Email survey results indicated that 43 percent were occasional game buyers, 38 percent were season
;cket holders, 13 percent were non‐buyers, and five percent were premium seat holders. Telephone
survey results indicated that 38 percent were occasional game buyers, 34 percent were non‐buyers, 21 percent were season ;cket holders and six percent were premium seat holders.
ExecuHve Summary DraA Copy
Subject to
Change
ii

ExecuHve Summary
• Overall, email respondents purchase an average of three (3) ;ckets per game while telephone survey
respondents purchase four (4) ;ckets per game. Premium seat buyers purchase the largest number of
;ckets among all survey groups (3.9 ;ckets for email respondents and 5.2 ;ckets for telephone survey
respondents).
• In both surveys, common reasons cited by occasional game buyers for not purchasing season ;ckets
include can’t commit to every game, cost of ;ckets, poor team performance, family/work
commitments, and can’t jus;fy the cost in terms of the number of games they would a`end.
• Approximately 22 percent (email) and 20 percent (telephone) of occasional ;cket buyers and non‐buyers have purchased season ;ckets in the past. The most common reasons for discon;nuing the
purchase of season ;ckets include poor team performance, not being able to commit to every game,
family/work commitments, cost of season ;ckets, and poor game day experience.
• Approximately 77 percent (email) and 63 percent (telephone) of lapsed season ;cket holders would consider purchasing season ;ckets in a new stadium. The most common reasons for considering
purchasing season ;ckets again would be an improvement in team performance and long‐term
commitment by the Rams to remain in St. Louis.
• Approximately 84 percent (email) and 88 percent (telephone) of season ;cket holders indicated that
they have purchased a PSL along with their season ;ckets. The most common reasons for not
purchasing a PSL include the ability to obtain good seats without purchasing the PSL, the cost of the
PSL, and the benefits of a PSL do not jus;fy the cost.
iii
DraA Copy
Subject to
Change
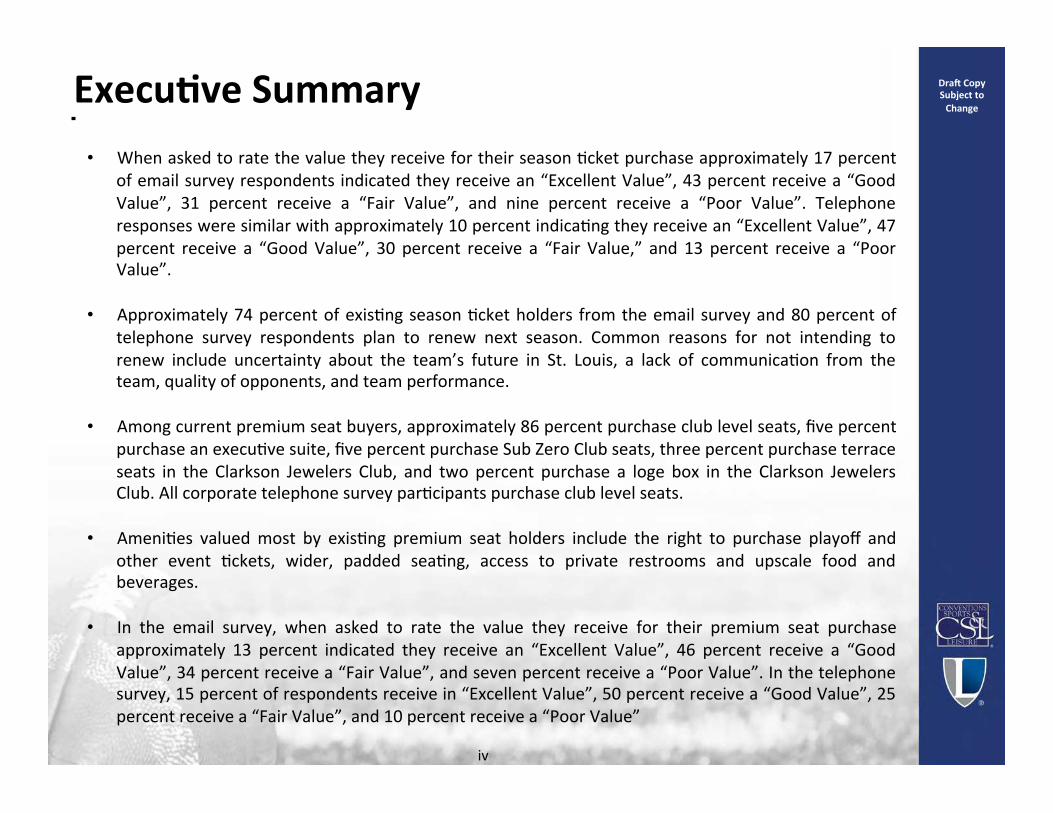
• When asked to rate the value they receive for their season ;cket purchase approximately 17 percent
of email survey respondents indicated they receive an “Excellent Value”, 43 percent receive a “Good
Value”, 31 percent receive a “Fair Value”, and nine percent receive a “Poor Value”. Telephone
responses were similar with approximately 10 percent indica;ng they receive an “Excellent Value”, 47
percent receive a “Good Value”, 30 percent receive a “Fair Value,” and 13 percent receive a “Poor Value”.
• Approximately 74 percent of exis;ng season ;cket holders from the email survey and 80 percent of
telephone survey respondents plan to renew next season. Common reasons for not intending to
renew include uncertainty about the team’s future in St. Louis, a lack of communica;on from the team, quality of opponents, and team performance.
• Among current premium seat buyers, approximately 86 percent purchase club level seats, five percent
purchase an execu;ve suite, five percent purchase Sub Zero Club seats, three percent purchase terrace
seats in the Clarkson Jewelers Club, and two percent purchase a loge box in the Clarkson Jewelers Club. All corporate telephone survey par;cipants purchase club level seats.
• Ameni;es valued most by exis;ng premium seat holders include the right to purchase playoff and
other event ;ckets, wider, padded sea;ng, access to private restrooms and upscale food and beverages.
• In the email survey, when asked to rate the value they receive for their premium seat purchase
approximately 13 percent indicated they receive an “Excellent Value”, 46 percent receive a “Good
Value”, 34 percent receive a “Fair Value”, and seven percent receive a “Poor Value”. In the telephone survey, 15 percent of respondents receive in “Excellent Value”, 50 percent receive a “Good Value”, 25
percent receive a “Fair Value”, and 10 percent receive a “Poor Value”
ExecuHve Summary DraA Copy
Subject to
Change
iv

ExecuHve Summary
• Approximately 65 percent of all premium seat holders from the email survey and 85 percent from the
telephone survey are planning to renew next season.
Other Area Team Ticket Purchase:
• Approximately 80 percent of email and 75 percent of telephone survey par;cipants purchase
occasional game ;ckets to other areas sports teams. The most common occasional game ;cket
purchases are for the St. Louis Cardinals (96 percent), St. Louis Blues (69 percent), and University of
Missouri football (35 percent).
• Approximately 16 percent of email survey respondents purchase season ;ckets to other areas sports
teams. The most common season ;cket purchases are for the St. Louis Cardinals (62 percent), St. Louis
Blues (32 percent), and University of Missouri football (18 percent). Approximately 35 percent of
telephone survey par;cipants purchase season ;ckets to other St. Louis sports teams. The most
common season ;cket purchases are for the St. Louis Cardinals (87 percent) and St. Louis Blues (23 percent).
• Among email survey respondents that purchase season ;ckets to both the Rams and Cardinals,
approximately 73 percent indicated they receive a be`er value with the Cardinals. Common reasons for ra;ng the Cardinals value higher included team performance (96 percent), be`er
game day atmosphere (68 percent), and higher quality food and beverages (37 percent).
v
DraA Copy
Subject to
Change

• Approximately 85 percent of telephone survey respondents that purchase season ;ckets to both
the Rams and Cardinals indicated they receive a be`er value with the Cardinals. Common
reasons for ra;ng the Cardinals higher included team performance (52 percent) and be`er game
day atmosphere (13 percent).
• Among email survey respondents that purchase season ;ckets to both the Rams and Blues,
approximately 63 percent indicated they receive a be`er value with the Blues. Common reasons
for ra;ng the Blues value higher included team performance (92 percent), be`er game day
atmosphere (71 percent), and cost of ;ckets (40 percent).
• Approximately 56 percent of telephone survey respondents that purchase season ;ckets to both
the Rams and Blues indicated they receive a be`er value with the Blues. Common reason for
ra;ng the Blues higher included be`er game day atmosphere (40 percent), team performance
(20 percent), and ease of parking (20 percent).
• Approximately three percent of email survey respondents purchase club seats to other area sports
teams. The most common club seat purchases are for the St. Louis Cardinals (74 percent), St. Louis
Blues (36 percent), and University of Missouri football (nine percent). Approximately 14 percent of
telephone survey respondents purchase club seats to other area sports teams. Common club seat purchases are for the Cardinals (74 percent) and Blues (24 percent).
• Among email survey respondents that purchase club seats to both the Rams and Cardinals,
approximately 74 percent indicated they receive a be`er value with the Cardinals. Common
reasons for ra;ng the Cardinals value higher included team performance (91 percent), be`er game day atmosphere (75 percent), and be`er overall premium experience (59 percent). All
telephone survey respondents considered their Cardinals club seats to be of higher value.
ExecuHve Summary DraA Copy
Subject to
Change
vi

• Among email survey respondents that purchase club seats to both the Rams and Blues,
approximately 70 percent indicated they receive a be`er value with the Blues. Common reasons
for ra;ng the Blues value higher included team performance (81 percent), be`er game day
atmosphere (71 percent), and higher level of ameni;es (71 percent).
• Approximately 50 percent of telephone survey respondents indicated they receive be`er value
with the Blues. Common reasons for ra;ng the Blues higher include team performance (50
percent) and cost of ;ckets (50 percent).
• Approximately one percent of email survey respondents purchase a luxury suite to other areas sports teams. No telephone survey par;cipants purchase a luxury suite to another area sports team. The most
common luxury suite purchases are for the St. Louis Cardinals (72 percent), St. Louis Blues (48 percent),
and University of Missouri football (11 percent).
• Among respondents that purchase luxury suites to both the Rams and Cardinals, approximately 74 percent indicated they receive a be`er value with the Cardinals. Common reasons for ra;ng
the Cardinals value higher included team performance (50 percent) and suite cost (50 percent).
• Among respondents that purchase luxury suites to both the Rams and Blues, all indicated they receive a be`er value with the Blues. Common reasons for ra;ng the Blues value higher included
overall premium experience (67 percent) and team performance (33 percent).
• Overall, respondents rated the St. Louis Cardinals as the most important professional team in St. Louis,
followed by the St. Louis Rams and the St. Louis Blues.
ExecuHve Summary DraA Copy
Subject to
Change
vii

New Open‐Air Stadium in St. Louis:
• When asked to indicate their aetude towards a new open‐air stadium in the St. Louis area,
approximately 78 percent of email survey respondents have a posi;ve aetude towards a new
stadium, 17 percent have a nega;ve aetude, and six percent are indifferent. Approximately 72
percent of telephone survey respondents have a posi;ve aetude towards a new stadium, eight percent have a nega;ve aetude, and 21 percent are indifferent.
• Approximately 55 percent of email survey respondents and 57 percent of telephone survey
respondents indicated they would a`end more games in a new open‐air stadium in St. Louis.
Approximately 29 percent of email survey respondents would a`end the same number of games, nine percent would a`end fewer games, and seven percent would not a`end any games. Approximately 36
percent of telephone survey respondents would a`end the same number of games, three percent
would a`end fewer games, and four percent would not a`end any games.
• In general, respondents indicated strong support for a variety of poten;al stadium funding sources. Funding sources receiving the highest levels of support included revenues from other stadium events
(93 percent), hotel/motel tax revenue (84 percent), and a government grant (79 percent).
Approximately 73 percent of email survey respondents and 67 percent of telephone survey
respondents indicated some level of support for Personal Seat Licenses.
• Approximately 89 percent of email survey respondents and 85 percent of telephone survey
respondents indicated some level of interest in purchasing ;ckets in a new open‐air stadium in St.
Louis.
ExecuHve Summary DraA Copy
Subject to
Change
viii

ExecuHve Summary
New Open‐Air Stadium Preferred Seat LocaHons:
• Email survey respondents indica;ng an interest in purchasing ;ckets in a new open‐air stadium in the
St. Louis area were asked to specify which three (3) poten;al general and premium sea;ng loca;ons
they would most prefer. General and premium seat loca;ons most preferred by survey respondents
included upper level sideline season ;ckets (62 percent), mezzanine level sideline club seats (48 percent), lower level corner season ;ckets (46 percent), and lower level sideline club seats (40
percent).
• General and premium seat loca;ons most preferred by telephone survey respondents included lower
level sideline club seats (65 percent), upper level sideline season ;ckets (55 percent), lower level end zone season ;ckets (47 percent), and lower level corner season ;ckets (46 percent).
ix
DraA Copy
Subject to
Change

ExecuHve Summary
x
DraA Copy
Subject to
Change
Market Conclusions
1. The St. Louis Rams were not rated as the most important team in its market. Respondents rated the Cardinals
as the most important, with the Rams the second‐most important.
2. The St. Louis Rams rank 29th in the NFL in terms of percent of total sea;ng capacity sold seasonally and 30th in
total annual ;cket revenue.
3. Current support of the Cardinals and past support of the Rams (1995 to 2005) indicates that the St. Louis
market can and will commit to a successful team playing in a venue that offers quality fan ameni;es.
4. Fans that previously purchased a PSL felt that they received proper value for their purchase and indicated that
the purchase of another PSL in a new stadium is “the cost of doing business.”
5. Survey respondents selected lower level club seats, mezzanine level club seats, upper level sideline season
;ckets, and lower level corner season ;ckets as the top four most preferred seat loca;ons in a new open‐air
stadium.
6. When pricing was introduced, approximately 72 percent of current premium buyers, 71 percent of season
;cket holders and 37 percent of occasional buyers would follow through with their purchase intent.
7. Focus group par;cipants indicated that while keeping the Rams in St. Louis was preferred, remaining a NFL
city was of the utmost importance. The vast majority of par;cipants would support a new NFL team if it came
to the market.
8. Poten;al plans for a new riverfront stadium in downtown St. Louis have been discussed publicly.

DraA Copy
Subject to
Change ExecuHve Summary
Projected Season Ticket and PSL Revenue
Based on the market‐specific informa;on collected throughout the research process, as well as the real‐
world, NFL‐specific experience of Legends Global Sales, es;mates were made regarding the poten;al to
generate revenue from the sale of PSLs, season ;ckets, and premium sea;ng in a new stadium. The
following presents a summary of the considera;ons u;lized to develop revenue es;mates in the St. Louis market.
Although the email and telephone surveys indicated demand for $189 million in PSL revenue, it is not
an;cipated that there is the poten;al to generate significantly more revenue in the marketplace beyond
the survey results. Several factors contributed to this determina;on, including, but not limited to:
1. Although the market generated enough PSL revenue to bring the franchise to St. Louis, that level of
support was not sustained once the team’s on‐field success waned.
2. The Rams rank in the bo`om third of the NFL in terms of average season ;cket price (22nd) and average club seat price (28th), and have the fourth‐lowest average a`endance in the NFL over the
past five (5) years.
3. Respondents exhibited low levels of intent to follow through with their purchase aner the introduc;on of pricing.
4. The Rams share a market with the Cardinals, which are one of the most successful teams in MLB, play
in a new ballpark, and are viewed by respondents as the most important sports team in St. Louis.
5. The market lacks a robust regional area from which to draw individuals and corpora;ons that are not
already a`ending games and purchasing ;ckets.
xi
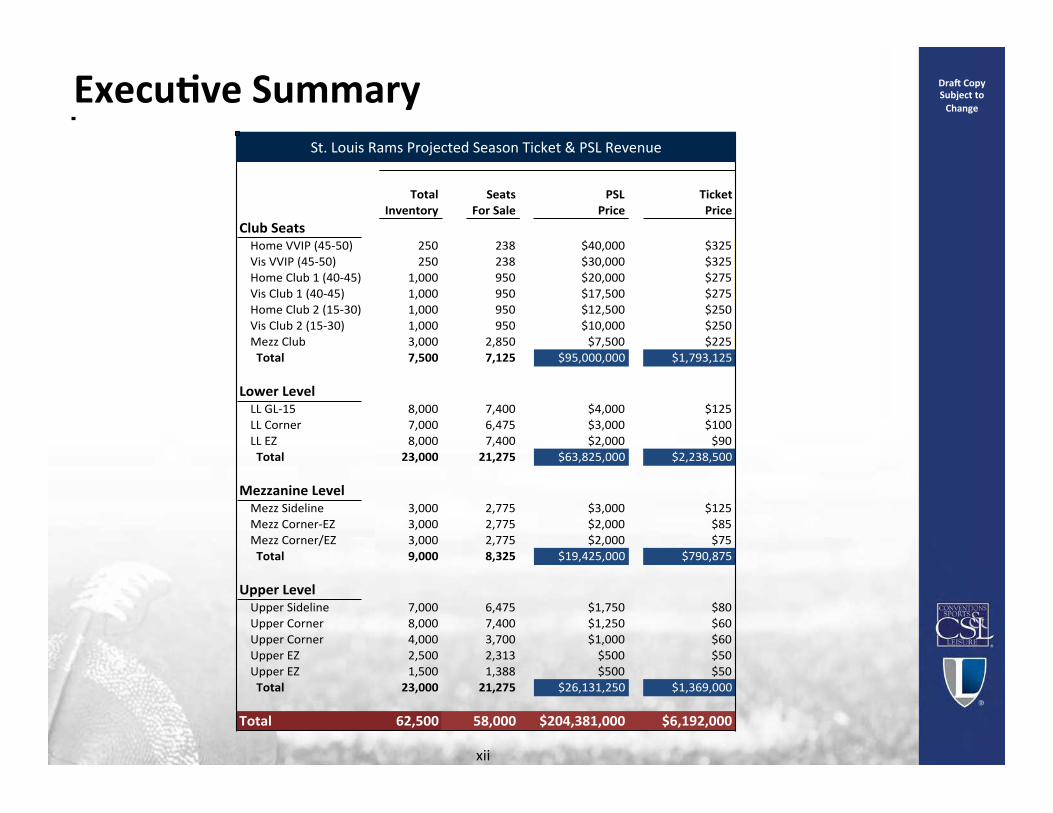
ExecuHve Summary
Club%SeatsHome%VVIP%(45,50)
Vis%VVIP%(45,50)
Home%Club%1%(40,45)
Vis%Club%1%(40,45)
Home%Club%2%(15,30)
Vis%Club%2%(15,30)
Mezz%Club
%%Total
Lower%LevelLL%GL,15
LL%Corner
LL%EZ
%%Total
Mezzanine%LevelMezz%Sideline
Mezz%Corner,EZ
Mezz%Corner/EZ
%%Total
Upper%LevelUpper%Sideline
Upper%Corner
Upper%Corner
Upper%EZ
Upper%EZ
%%Total
St.%Louis%Ram
Total
Total Seats
Inventory For%Sale
250 238
250 238
1,000 950
1,000 950
1,000 950
1,000 950
3,000 2,850
7,500 7,125
8,000 7,400
7,000 6,475
8,000 7,400
23,000 21,275
3,000 2,775
3,000 2,775
3,000 2,775
9,000 8,325
7,000 6,475
8,000 7,400
4,000 3,700
2,500 2,313
1,500 1,388
23,000 21,275
62,500 58,000
%Rams%Projected%Season%T
PSL
Price
$40,000
$30,000
$20,000
$17,500
$12,500
$10,000
$7,500
$95,000,000
$4,000
$3,000
$2,000
$63,825,000
$3,000
$2,000
$2,000
$19,425,000
$1,750
$1,250
$1,000
$500
$500
$26,131,250
$204,381,000
on%Ticket%&%PSL%Reven
Ticket
Price
$325
$325
$275
$275
$250
$250
$225
$1,793,125
$125
$100
$90
$2,238,500
$125
$85
$75
$790,875
$80
$60
$60
$50
$50
$1,369,000
$6,192,000
RevenueSt. Louis Rams Projected Season Ticket & PSL Revenue
xii
DraA Copy
Subject to
Change

ExecuHve Summary
xiii
Average Total
Annual Annual
Suite/Type Inventory Price Revenue
Owners 8 $300,000 $2,400,000
Lower0Level 6 $225,000 $1,350,000
Field0Level 8 $150,000 $1,200,000
Mezzanine0Level 50 $135,000 $6,750,000
Upper0Level 40 $123,000 $4,920,000
Total 112 $148,000 $16,620,000
St./Louis/New/Stadium/Suite/Revenue/Projections