Embed Size (px)
Citation preview
THE ECONOMIC IMPORTANCE OF THE MILITARY IN KENTUCKY 2016 Update
Paul Coomes, Ph.D., Emeritus Professor of Economics
Janet Kelly, Ph.D., Professor and Executive Director Barry Kornstein, Research Manager Joe Slaughter, Research Assistant
Sponsored by:
The Kentucky Commission on Military Affairs This study was prepared under contract with the Commonwealth of Kentucky, with financial support from the Office of Economic Adjustment, Department of Defense.
The content reflects the views of the Commonwealth of Kentucky, and does not necessarily reflect the views of the Office of Economic Adjustment.
prepared by:
The Urban Studies Institute at the University of Louisville
June 2016
Companion web site: http://kcma.ky.gov/Dashboard/Pages/default.aspx
by Sarin Adhikari
Table of Contents Executive Summary ....................................................................................................................................... 1
Introduction .................................................................................................................................................. 3
Employment .................................................................................................................................................. 3
Civilian Employment ................................................................................................................................. 6
Military Employment in Perspective ......................................................................................................... 9
Earnings and Compensation ....................................................................................................................... 11
Military Personnel ................................................................................................................................... 11
DoD Civilian Employees .......................................................................................................................... 12
Veterans and Retirees ............................................................................................................................. 14
Veteran Characteristics ........................................................................................................................... 16
Education ............................................................................................................................................ 17
Insurance Benefits............................................................................................................................... 18
Medical Benefits ................................................................................................................................. 19
Summary of Non-Pension Spending ....................................................................................................... 19
Reserve Components .................................................................................................................................. 20
The Kentucky National Guard ................................................................................................................. 20
Defense Spending as Share of Kentucky Gross State Product .................................................................... 23
Contract and Grant Spending ................................................................................................................. 24
Grant and Contract Spending by County ............................................................................................ 26
Military-Related Federal Spending ......................................................................................................... 26
Major Military Sites and Operations in Kentucky ....................................................................................... 28
Fort Campbell .......................................................................................................................................... 29
Employment ........................................................................................................................................ 30
Residential Patterns ............................................................................................................................ 31
Contract Activity.................................................................................................................................. 32
Fort Knox ................................................................................................................................................. 33
Employment and Compensation ........................................................................................................ 34
Contract Activity.................................................................................................................................. 35
Residential Patterns ............................................................................................................................ 36
Military Operations in Louisville ............................................................................................................. 37
The U.S. Army Corps of Engineers ...................................................................................................... 37
The United States Coast Guard ........................................................................................................... 38
Military Operations in Central Kentucky ................................................................................................. 39
Blue Grass Army Depot ....................................................................................................................... 39
Employment and Compensation ........................................................................................................ 40
Contract Activity.................................................................................................................................. 40
Bluegrass Station ................................................................................................................................. 41
Residential Patterns ............................................................................................................................ 41
Economic and Fiscal Impacts of Changes in Military Activity ..................................................................... 42
The Military Production Process ............................................................................................................. 44
Impact of Changes in Military Activity, 2011 to 2014 ............................................................................. 45
Regional Issues ........................................................................................................................................ 47
Fort Campbell Region .......................................................................................................................... 47
Fort Knox Region ................................................................................................................................. 49
Louisville Region .................................................................................................................................. 50
Blue Grass Army Depot (BGAD) and Bluegrass Station....................................................................... 51
Economic Multipliers .............................................................................................................................. 52
Fiscal Effects ............................................................................................................................................ 53
Conclusion ................................................................................................................................................... 57
1
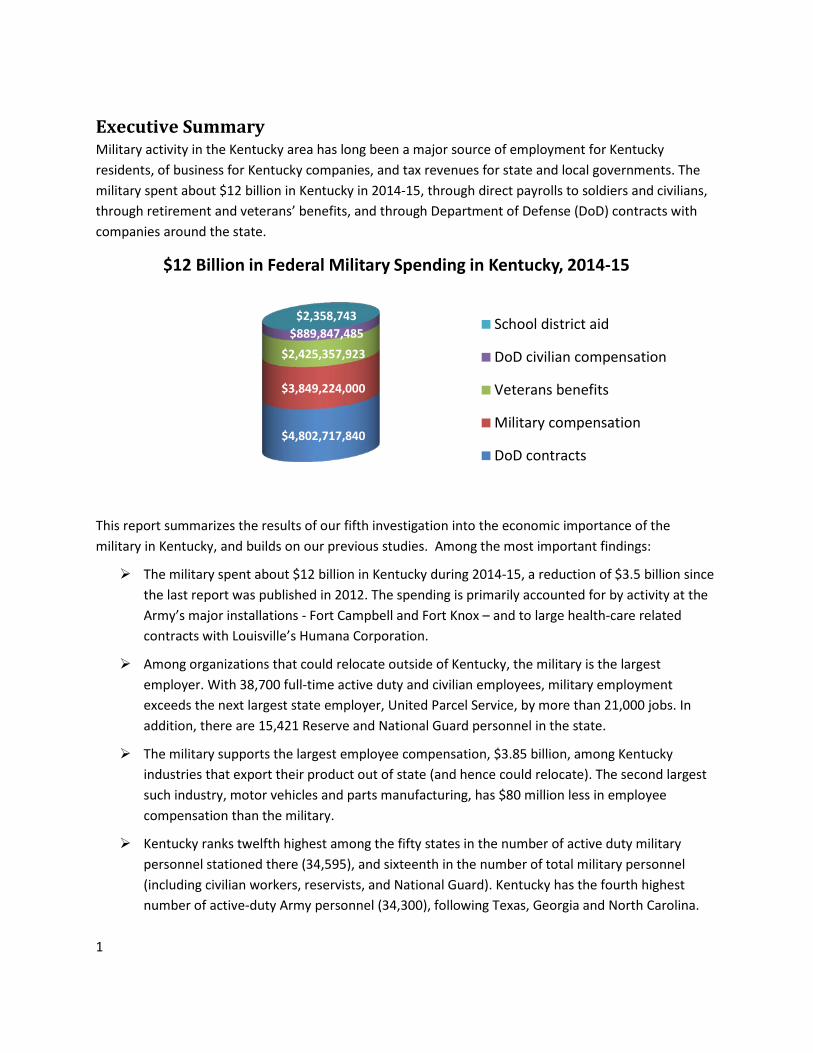
Executive Summary Military activity in the Kentucky area has long been a major source of employment for Kentucky residents, of business for Kentucky companies, and tax revenues for state and local governments. The military spent about $12 billion in Kentucky in 2014-15, through direct payrolls to soldiers and civilians, through retirement and veterans’ benefits, and through Department of Defense (DoD) contracts with companies around the state.
This report summarizes the results of our fifth investigation into the economic importance of the military in Kentucky, and builds on our previous studies. Among the most important findings:
The military spent about $12 billion in Kentucky during 2014-15, a reduction of $3.5 billion since the last report was published in 2012. The spending is primarily accounted for by activity at the Army’s major installations - Fort Campbell and Fort Knox – and to large health-care related contracts with Louisville’s Humana Corporation.
Among organizations that could relocate outside of Kentucky, the military is the largest employer. With 38,700 full-time active duty and civilian employees, military employment exceeds the next largest state employer, United Parcel Service, by more than 21,000 jobs. In addition, there are 15,421 Reserve and National Guard personnel in the state.
The military supports the largest employee compensation, $3.85 billion, among Kentucky industries that export their product out of state (and hence could relocate). The second largest such industry, motor vehicles and parts manufacturing, has $80 million less in employee compensation than the military.
Kentucky ranks twelfth highest among the fifty states in the number of active duty military personnel stationed there (34,595), and sixteenth in the number of total military personnel (including civilian workers, reservists, and National Guard). Kentucky has the fourth highest number of active-duty Army personnel (34,300), following Texas, Georgia and North Carolina.
$4,802,717,840
$3,849,224,000
$2,425,357,923 $889,847,485
$2,358,743
$12 Billion in Federal Military Spending in Kentucky, 2014-15
School district aid
DoD civilian compensation
Veterans benefits
Military compensation
DoD contracts
2
After strong growth in the 2000s, the number of military personnel and civilian employees in Kentucky has been declining the last few years. Between 2011 and 2014, the number of military employees fell by 9,100 and the number of DoD civilian employees fell about 1,200.
Expenditures for military personnel and contracts continue to rise in Kentucky, from $8.2 billion in FY 2013 to $9 billion in FY2014.
Kentucky received almost $5 billion in procurement contracts and $34.5 million in grants from DoD in fiscal 2015, 17th highest among the 50 states. Humana was the top contractor with awards of $3.6 billion for its management of the TRICARE military health insurance program for the south region. Some of this award revenue flowed out of Kentucky as Humana handled administrative work for the program in other locations.
There are about 28,500 military retirees in Kentucky, and in 2015 they received about $637 million in retirement pay. Kentucky ranks 22rd in the number of retired military residents. Because retirees’ residential decisions are not made in Washington, local and state policy in Kentucky influences our share of national retiree dollars. Kentucky’s two installations are retiree magnets, as is the exemption of most retirement income from the Kentucky state individual income tax. Texas and Florida are the top two states of residence for military retirees owing to their warm winters and no state income tax.
In 2014 Kentucky had 328,408 veterans, almost 10 percent of the Commonwealth’s population over 18. Jefferson County has over 53,000 veterans, followed by Fayette County with 19,500. Federal spending for veterans’ compensation and pension was about $1.25 billion in 2014; for veterans education was $155 million; and for insurance programs was nearly $19 million. By far the greatest non-pension category of federal veterans spending was medical care, which was about $950 million in 2014.
This report begins with an overview of military personnel, veterans and retirees in Kentucky. The remainder of the report documents the economic importance of military activity in Kentucky. We track the US Department of Defense dollars coming into Kentucky by category, including payroll, retirement and veteran income, and contracts. Next, we provide profiles of major military sites. Finally, we provide new research on the regional economic impacts of military spending in Kentucky.
Note that the tables, charts, and text refer to data from many different sources, and sometimes the data points differ by source for the same economic concept. This is largely due to different time references, such as fiscal year versus calendar year, or a snapshot as of September or December of a year. Also, some published data refer to full-time employees only, while other data refer to all employees regardless of status. We attempt to use the best measure for each subject, and to explain apparent discrepancies where they are significant.
3
Introduction Kentucky military activities have long been a major source of employment for Kentucky residents, of business for Kentucky companies, and tax revenues for state and local governments. This report and the accompanying website identifies those economic benefits, compares them to other states and the nation as a whole, compares them among Kentucky counties, and compares them among military installations.
The report begins with an overview of employment and compensation of military personnel in Kentucky. Subsequent sections describe retiree and veterans benefits by county. We track the Department of Defense (DoD) dollars coming into Kentucky by category, including payroll, retirement and veteran income, and contracts. Next, we provide profiles of major military sites. Finally, we provide new research on the regional economic impacts of military spending in Kentucky.
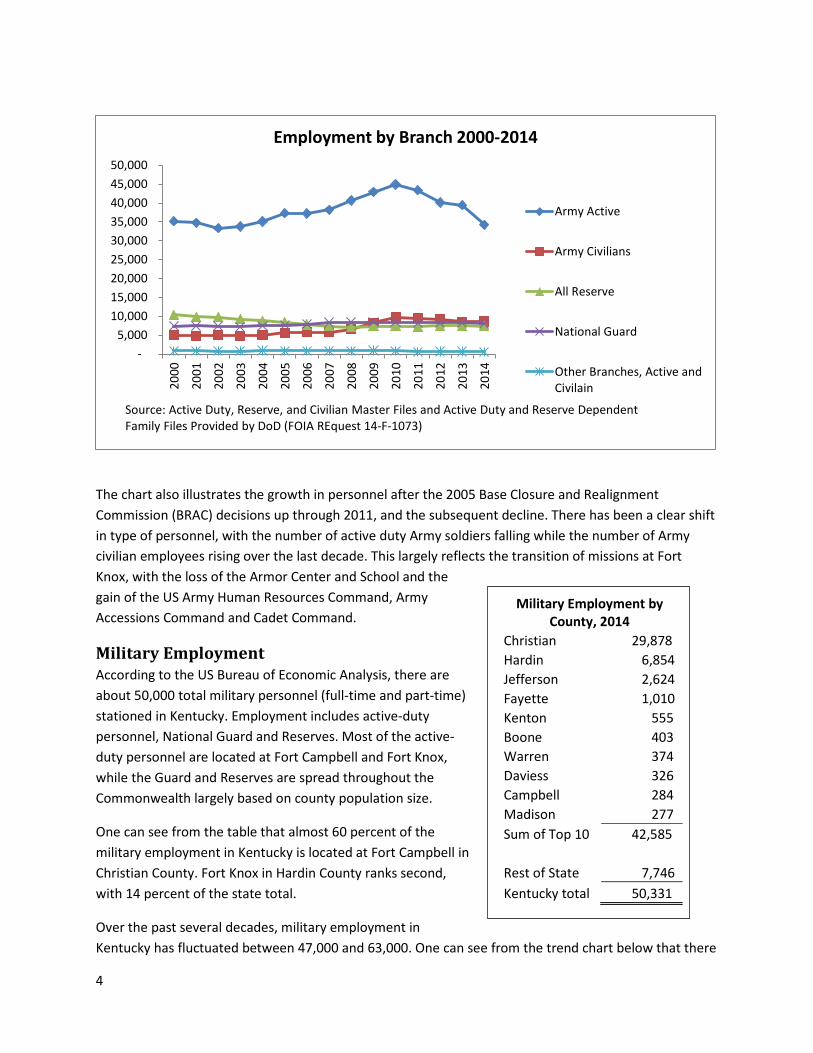
Employment In this section we organize data on the different types of military-related employment in Kentucky. This includes full-time active duty military personnel, part-time Reserves and National Guard, and full-time and part-time civilian employees of the US Department of Defense. The broadest measure counts all these jobs, and totals about 59,000 employees in Kentucky at the end of 2014. More than half of these are active duty Army. The chart below shows the composition of active duty Army, Army civilians, and active duty employees and civilians of other branches, Reserves for all branches and the National Guard. The Army clearly dominates the presence of military activity in Kentucky.
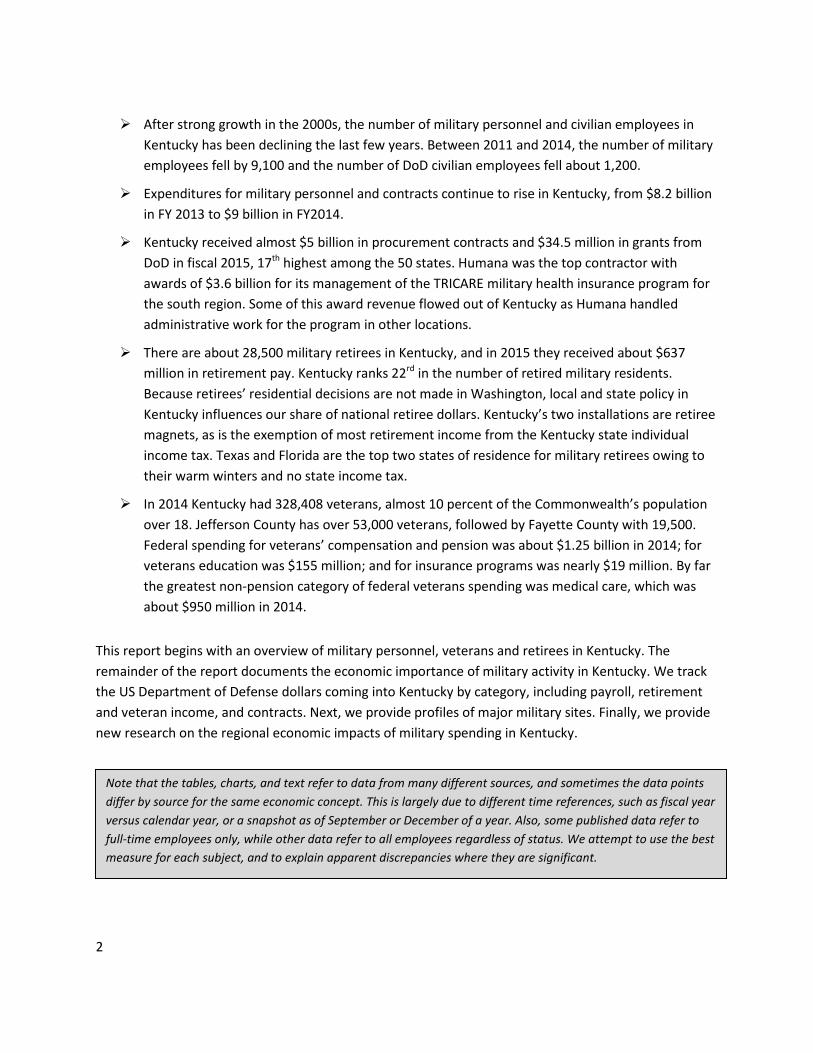
Additionally, we recognize the significant economic impact of the military presence in our communities. Please take a few moments to read this new study on the economic importance of military activity in Kentucky.” - Matt Bevin, Governor
As a former active duty Army officer and longtime advocate for veterans, I have a very personal interest in Kentucky’s role in our national defense. We will never take for granted the safety and security that our military provides for us here and around the world.
"The Commonwealth of Kentucky is proud to be home to some of the finest military bases in America and ranks among the top 25 states as an employer of defense personnel.
4
The chart also illustrates the growth in personnel after the 2005 Base Closure and Realignment Commission (BRAC) decisions up through 2011, and the subsequent decline. There has been a clear shift in type of personnel, with the number of active duty Army soldiers falling while the number of Army civilian employees rising over the last decade. This largely reflects the transition of missions at Fort Knox, with the loss of the Armor Center and School and the gain of the US Army Human Resources Command, Army Accessions Command and Cadet Command.
Military Employment According to the US Bureau of Economic Analysis, there are about 50,000 total military personnel (full-time and part-time) stationed in Kentucky. Employment includes active-duty personnel, National Guard and Reserves. Most of the active-duty personnel are located at Fort Campbell and Fort Knox, while the Guard and Reserves are spread throughout the Commonwealth largely based on county population size.
One can see from the table that almost 60 percent of the military employment in Kentucky is located at Fort Campbell in Christian County. Fort Knox in Hardin County ranks second, with 14 percent of the state total.
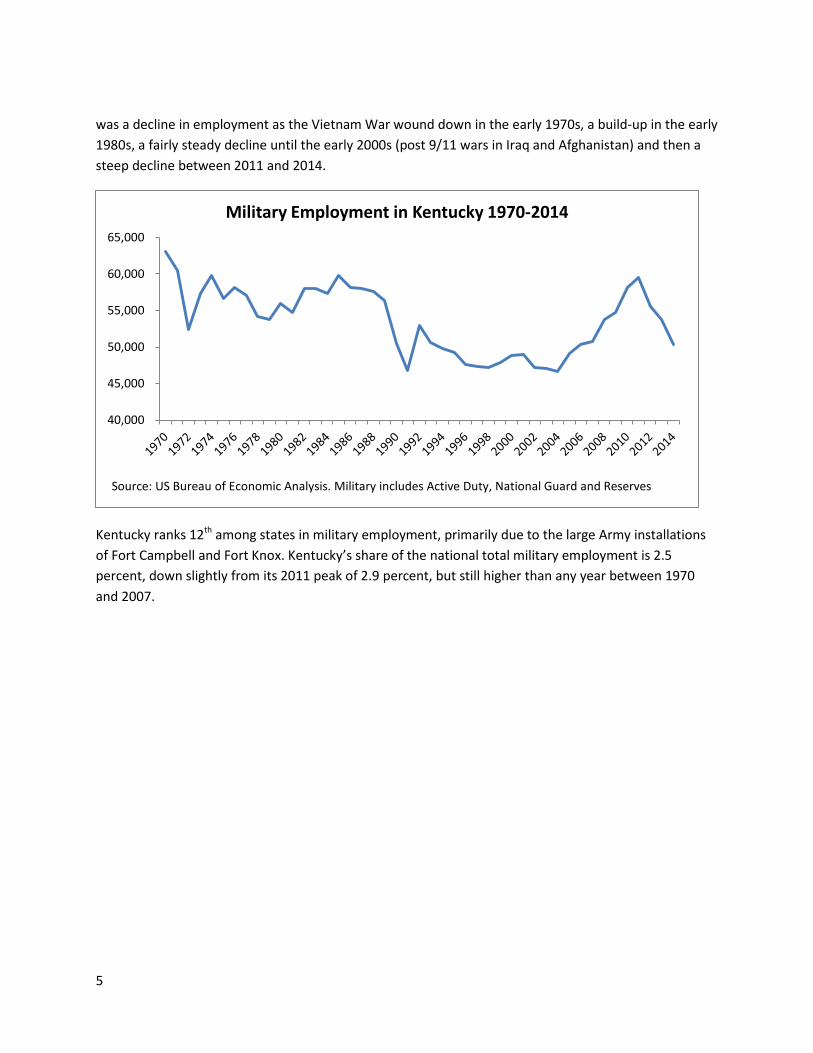
Over the past several decades, military employment in Kentucky has fluctuated between 47,000 and 63,000. One can see from the trend chart below that there
- 5,000
10,000 15,000 20,000 25,000 30,000 35,000 40,000 45,000 50,000
2000
2001
2002
2003
2004
2005
2006
2007
2008
2009
2010
2011
2012
2013
2014
Employment by Branch 2000-2014
Army Active
Army Civilians
All Reserve
National Guard
Other Branches, Active andCivilain
Source: Active Duty, Reserve, and Civilian Master Files and Active Duty and Reserve Dependent Family Files Provided by DoD (FOIA REquest 14-F-1073)
Military Employment by County, 2014
Christian 29,878 Hardin 6,854 Jefferson 2,624 Fayette 1,010 Kenton 555 Boone 403 Warren 374 Daviess 326 Campbell 284 Madison 277 Sum of Top 10 42,585
Rest of State 7,746 Kentucky total 50,331
5
was a decline in employment as the Vietnam War wound down in the early 1970s, a build-up in the early 1980s, a fairly steady decline until the early 2000s (post 9/11 wars in Iraq and Afghanistan) and then a steep decline between 2011 and 2014.
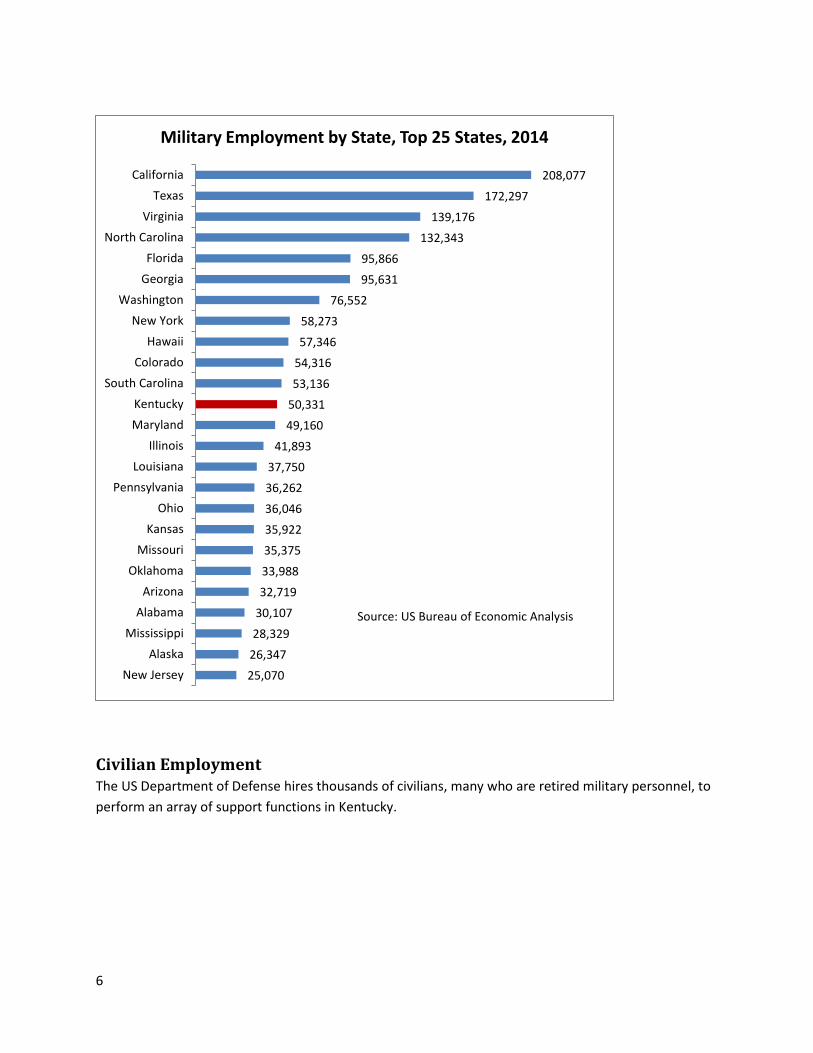
Kentucky ranks 12th among states in military employment, primarily due to the large Army installations of Fort Campbell and Fort Knox. Kentucky’s share of the national total military employment is 2.5 percent, down slightly from its 2011 peak of 2.9 percent, but still higher than any year between 1970 and 2007.
40,000
45,000
50,000
55,000
60,000
65,000
Military Employment in Kentucky 1970-2014
Source: US Bureau of Economic Analysis. Military includes Active Duty, National Guard and Reserves
6
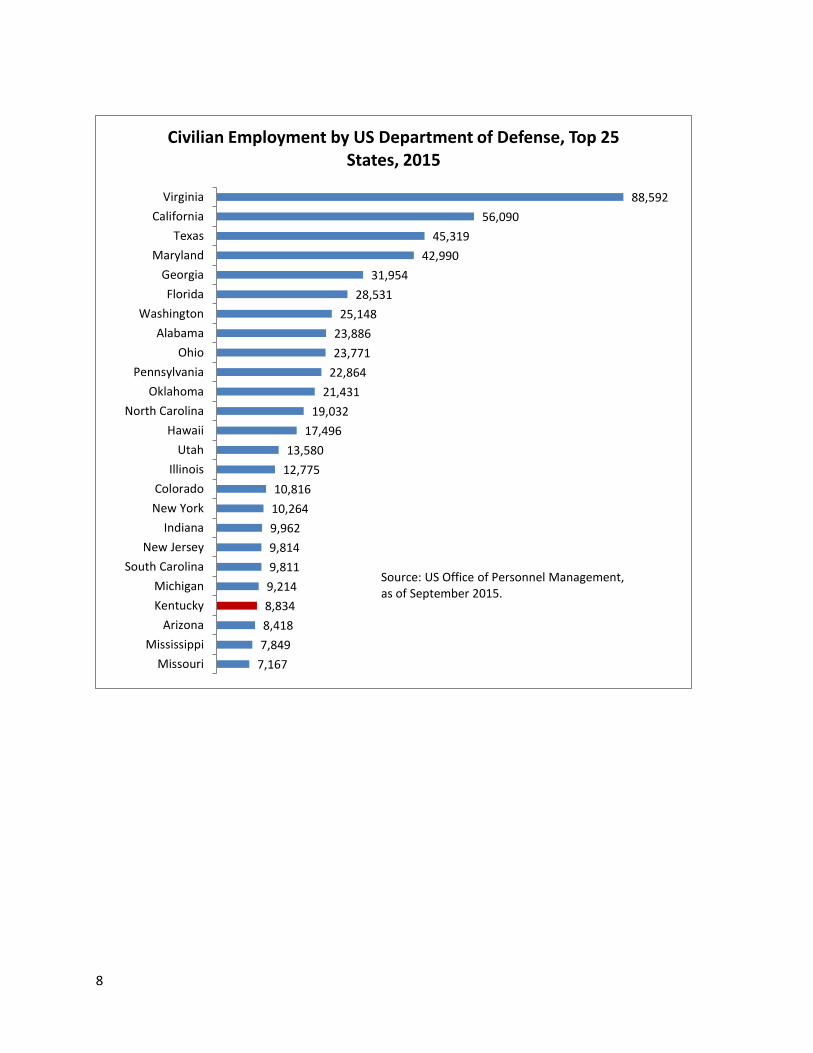
Civilian Employment The US Department of Defense hires thousands of civilians, many who are retired military personnel, to perform an array of support functions in Kentucky.
25,070 26,347 28,329 30,107 32,719 33,988 35,375 35,922 36,046 36,262 37,750
41,893 49,160 50,331 53,136 54,316 57,346 58,273
76,552 95,631 95,866
132,343 139,176
172,297 208,077
New JerseyAlaska
MississippiAlabama
ArizonaOklahoma
MissouriKansas
OhioPennsylvania
LouisianaIllinois
MarylandKentucky
South CarolinaColorado
HawaiiNew York
WashingtonGeorgiaFlorida
North CarolinaVirginia
TexasCalifornia
Military Employment by State, Top 25 States, 2014
Source: US Bureau of Economic Analysis
7
DOD Employees in Kentucky, September 2015
Hardin 4,804 Christian 2,284 Jefferson 1,013 Madison 898 Top Four Counties 8,999
Rest of State 862 Kentucky total 9,861
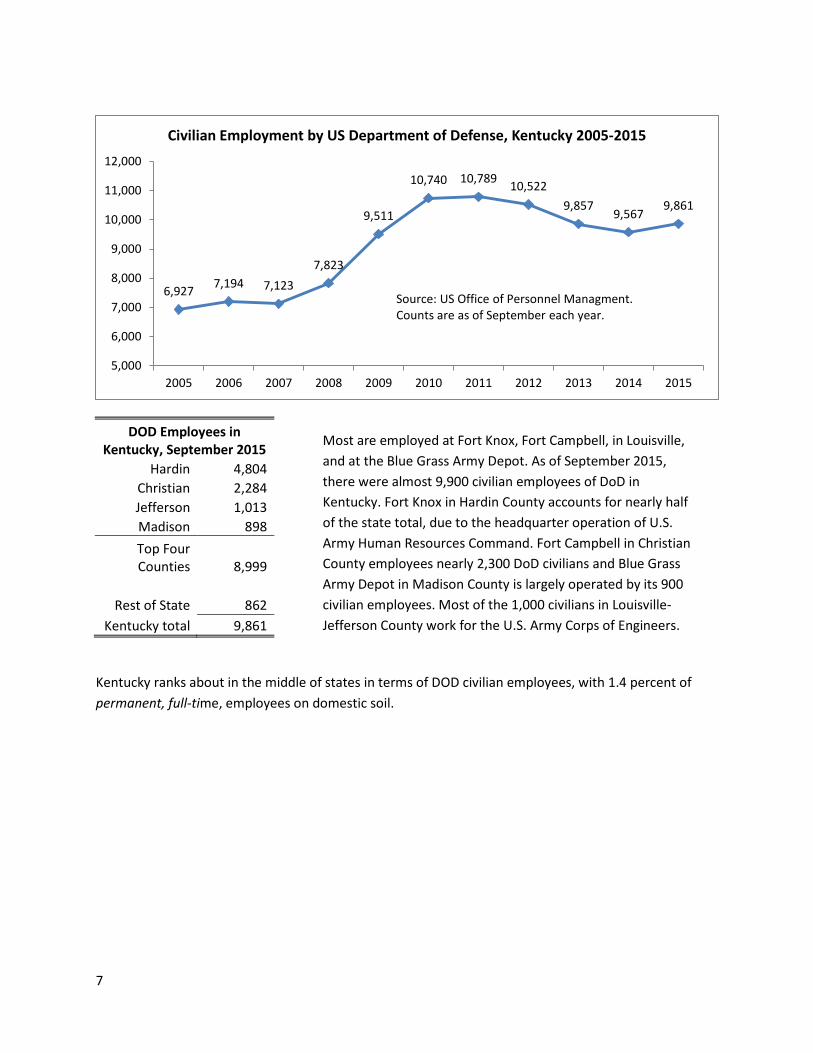
Kentucky ranks about in the middle of states in terms of DOD civilian employees, with 1.4 percent of permanent, full-time, employees on domestic soil.
6,927 7,194 7,123 7,823
9,511
10,740 10,789 10,522 9,857
9,567 9,861
5,000
6,000
7,000
8,000
9,000
10,000
11,000
12,000
2005 2006 2007 2008 2009 2010 2011 2012 2013 2014 2015
Civilian Employment by US Department of Defense, Kentucky 2005-2015
Source: US Office of Personnel Managment. Counts are as of September each year.
Most are employed at Fort Knox, Fort Campbell, in Louisville, and at the Blue Grass Army Depot. As of September 2015, there were almost 9,900 civilian employees of DoD in Kentucky. Fort Knox in Hardin County accounts for nearly half of the state total, due to the headquarter operation of U.S. Army Human Resources Command. Fort Campbell in Christian County employees nearly 2,300 DoD civilians and Blue Grass Army Depot in Madison County is largely operated by its 900 civilian employees. Most of the 1,000 civilians in Louisville-Jefferson County work for the U.S. Army Corps of Engineers.
8
7,167 7,849 8,418 8,834 9,214 9,811 9,814 9,962 10,264 10,816
12,775 13,580
17,496 19,032
21,431 22,864 23,771 23,886 25,148
28,531 31,954
42,990 45,319
56,090 88,592
MissouriMississippi
ArizonaKentuckyMichigan
South CarolinaNew Jersey
IndianaNew YorkColorado
IllinoisUtah
HawaiiNorth Carolina
OklahomaPennsylvania
OhioAlabama
WashingtonFlorida
GeorgiaMaryland
TexasCalifornia
Virginia
Civilian Employment by US Department of Defense, Top 25 States, 2015
Source: US Office of Personnel Management, as of September 2015.
9
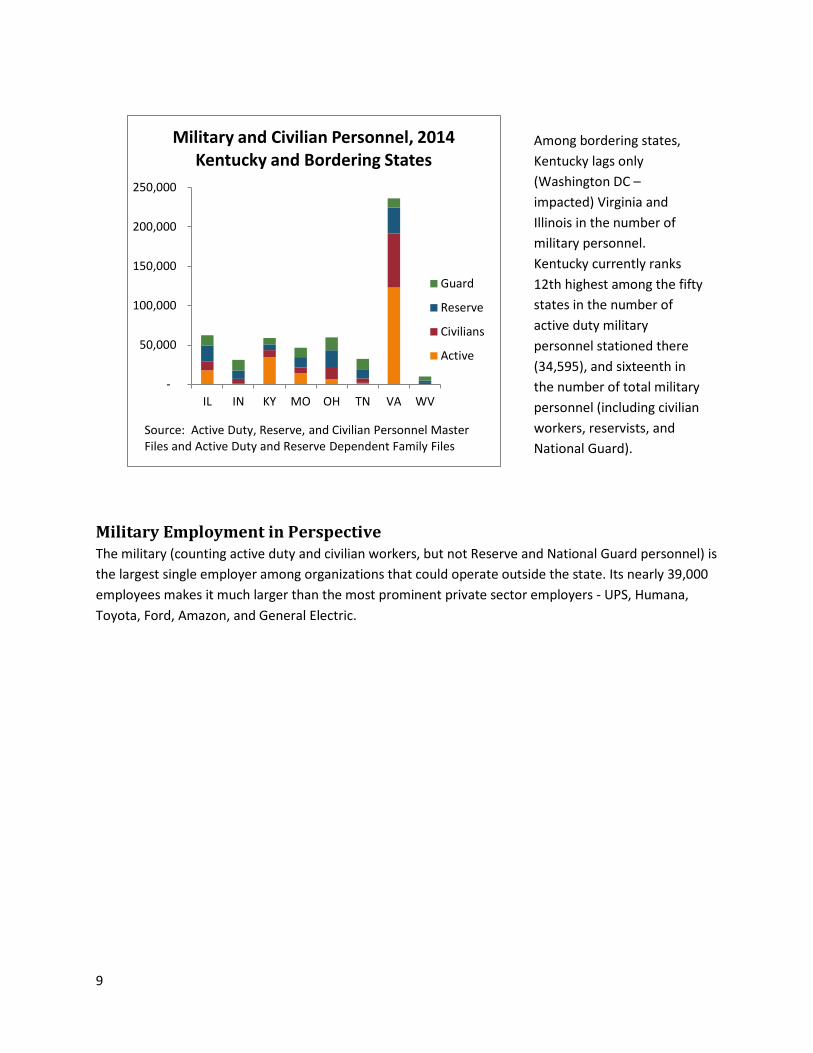
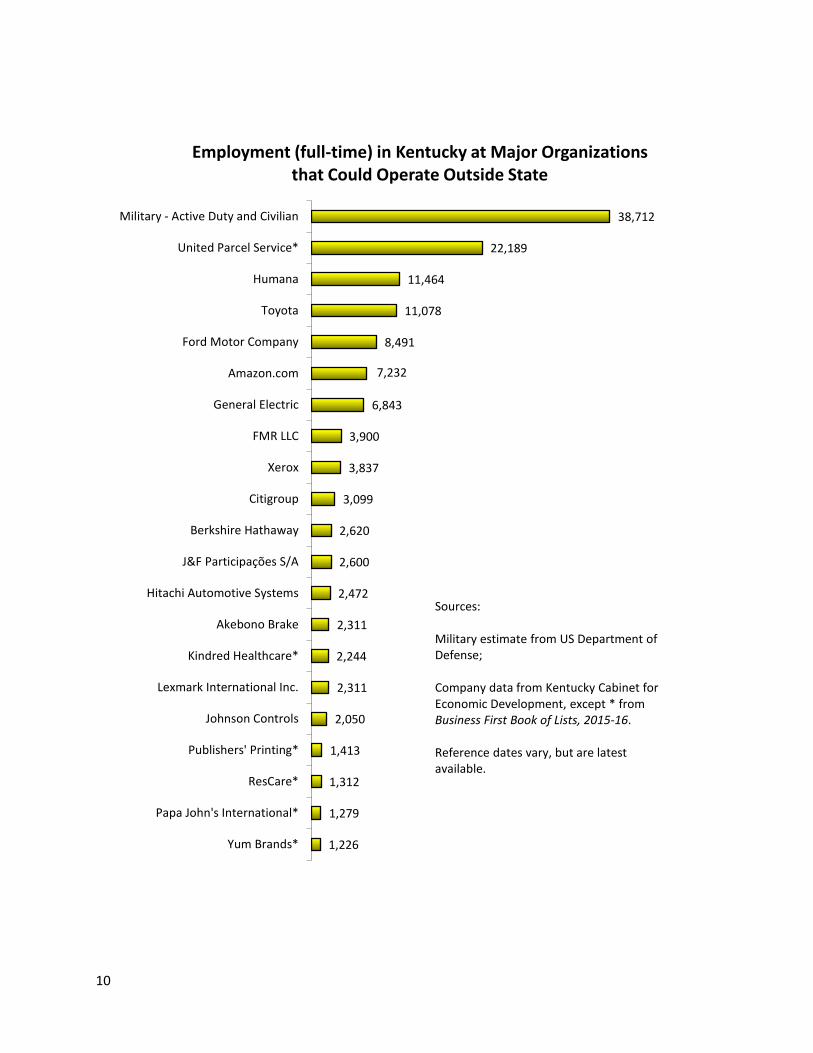
Military Employment in Perspective The military (counting active duty and civilian workers, but not Reserve and National Guard personnel) is the largest single employer among organizations that could operate outside the state. Its nearly 39,000 employees makes it much larger than the most prominent private sector employers - UPS, Humana, Toyota, Ford, Amazon, and General Electric.
-
50,000
100,000
150,000
200,000
250,000
IL IN KY MO OH TN VA WV
Military and Civilian Personnel, 2014 Kentucky and Bordering States
Guard
Reserve
Civilians
Active
Source: Active Duty, Reserve, and Civilian Personnel Master Files and Active Duty and Reserve Dependent Family Files
Among bordering states, Kentucky lags only (Washington DC – impacted) Virginia and Illinois in the number of military personnel. Kentucky currently ranks 12th highest among the fifty states in the number of active duty military personnel stationed there (34,595), and sixteenth in the number of total military personnel (including civilian workers, reservists, and National Guard).
10
1,226
1,279
1,312
1,413
2,050
2,311
2,244
2,311
2,472
2,600
2,620
3,099
3,837
3,900
6,843
7,232
8,491
11,078
11,464
22,189
38,712
Yum Brands*
Papa John's International*
ResCare*
Publishers' Printing*
Johnson Controls
Lexmark International Inc.
Kindred Healthcare*
Akebono Brake
Hitachi Automotive Systems
J&F Participações S/A
Berkshire Hathaway
Citigroup
Xerox
FMR LLC
General Electric
Amazon.com
Ford Motor Company
Toyota
Humana
United Parcel Service*
Military - Active Duty and Civilian
Employment (full-time) in Kentucky at Major Organizations
that Could Operate Outside State
Sources: Military estimate from US Department of Defense; Company data from Kentucky Cabinet for Economic Development, except * from Business First Book of Lists, 2015-16. Reference dates vary, but are latest available.
11
Earnings and Compensation In this section we examine data on compensation of military-related employees. Compensation includes wages and salaries, in-kind payments like meals and housing, plus fringe benefits like pensions and health insurance. Employees may be military personnel or civilian employees of DoD. We first consider military personnel.
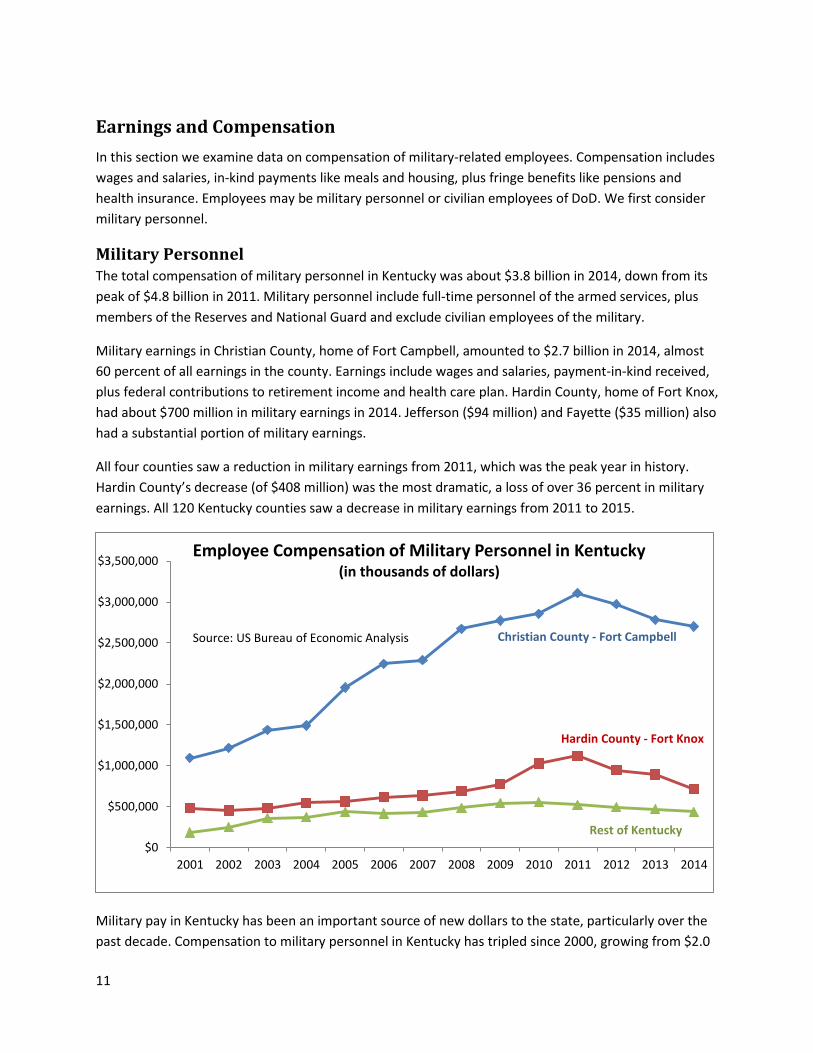
Military Personnel The total compensation of military personnel in Kentucky was about $3.8 billion in 2014, down from its peak of $4.8 billion in 2011. Military personnel include full-time personnel of the armed services, plus members of the Reserves and National Guard and exclude civilian employees of the military.
Military earnings in Christian County, home of Fort Campbell, amounted to $2.7 billion in 2014, almost 60 percent of all earnings in the county. Earnings include wages and salaries, payment-in-kind received, plus federal contributions to retirement income and health care plan. Hardin County, home of Fort Knox, had about $700 million in military earnings in 2014. Jefferson ($94 million) and Fayette ($35 million) also had a substantial portion of military earnings.
All four counties saw a reduction in military earnings from 2011, which was the peak year in history. Hardin County’s decrease (of $408 million) was the most dramatic, a loss of over 36 percent in military earnings. All 120 Kentucky counties saw a decrease in military earnings from 2011 to 2015.
Military pay in Kentucky has been an important source of new dollars to the state, particularly over the past decade. Compensation to military personnel in Kentucky has tripled since 2000, growing from $2.0
$0
$500,000
$1,000,000
$1,500,000
$2,000,000
$2,500,000
$3,000,000
$3,500,000
2001 2002 2003 2004 2005 2006 2007 2008 2009 2010 2011 2012 2013 2014
Employee Compensation of Military Personnel in Kentucky (in thousands of dollars)
Christian County - Fort Campbell
Hardin County - Fort Knox
Rest of Kentucky
Source: US Bureau of Economic Analysis
12
billion to $6.1 billion in 2011. This was due both to growth in personnel and also to increased compensation per person. The trend reversed in 2011 as indicated on the graph below.
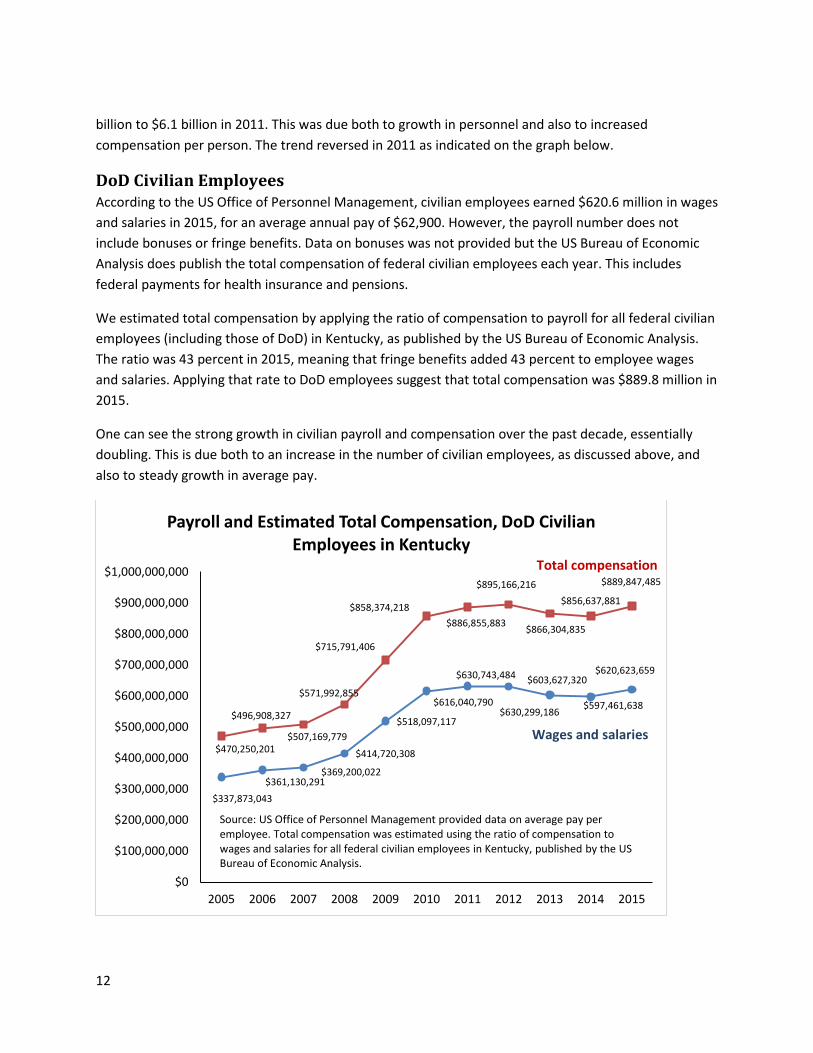
DoD Civilian Employees According to the US Office of Personnel Management, civilian employees earned $620.6 million in wages and salaries in 2015, for an average annual pay of $62,900. However, the payroll number does not include bonuses or fringe benefits. Data on bonuses was not provided but the US Bureau of Economic Analysis does publish the total compensation of federal civilian employees each year. This includes federal payments for health insurance and pensions.
We estimated total compensation by applying the ratio of compensation to payroll for all federal civilian employees (including those of DoD) in Kentucky, as published by the US Bureau of Economic Analysis. The ratio was 43 percent in 2015, meaning that fringe benefits added 43 percent to employee wages and salaries. Applying that rate to DoD employees suggest that total compensation was $889.8 million in 2015.
One can see the strong growth in civilian payroll and compensation over the past decade, essentially doubling. This is due both to an increase in the number of civilian employees, as discussed above, and also to steady growth in average pay.
$337,873,043 $361,130,291
$369,200,022
$414,720,308
$518,097,117
$616,040,790
$630,743,484
$630,299,186
$603,627,320
$597,461,638
$620,623,659
$470,250,201
$496,908,327
$507,169,779
$571,992,855
$715,791,406
$858,374,218 $886,855,883
$895,166,216
$866,304,835
$856,637,881
$889,847,485
$0
$100,000,000
$200,000,000
$300,000,000
$400,000,000
$500,000,000
$600,000,000
$700,000,000
$800,000,000
$900,000,000
$1,000,000,000
2005 2006 2007 2008 2009 2010 2011 2012 2013 2014 2015
Payroll and Estimated Total Compensation, DoD Civilian Employees in Kentucky
Source: US Office of Personnel Management provided data on average pay per employee. Total compensation was estimated using the ratio of compensation to wages and salaries for all federal civilian employees in Kentucky, published by the US Bureau of Economic Analysis.
Wages and salaries
Total compensation
13
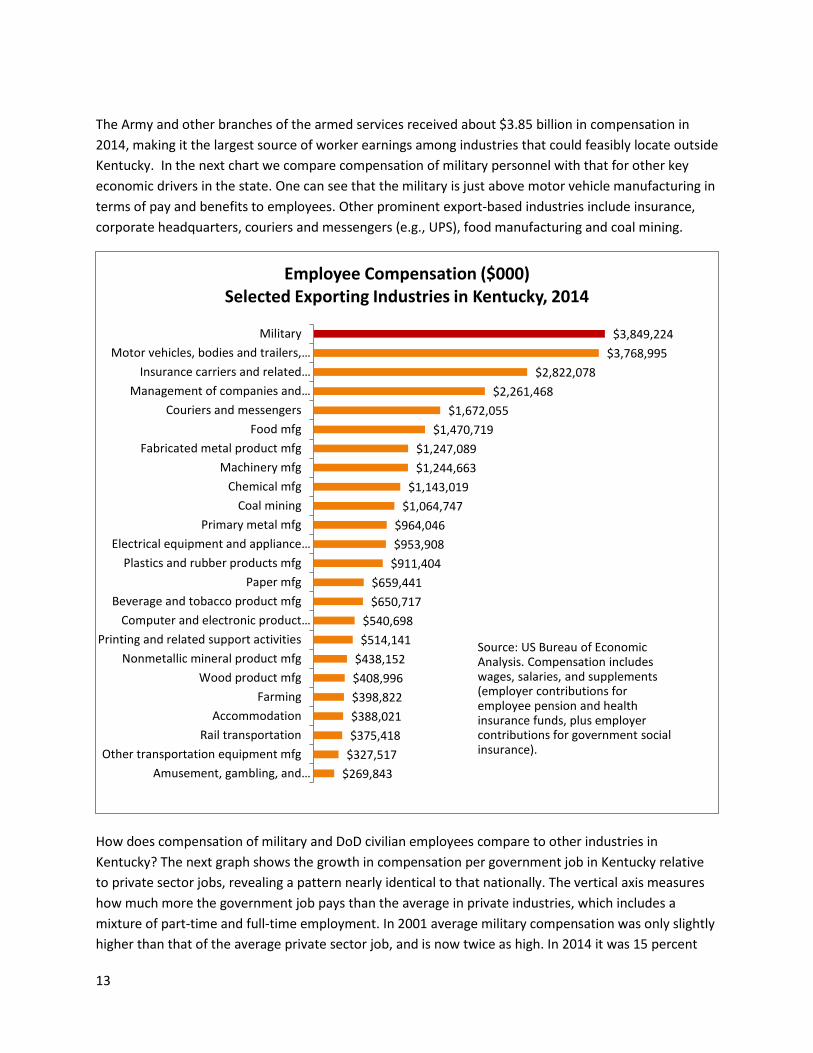
The Army and other branches of the armed services received about $3.85 billion in compensation in 2014, making it the largest source of worker earnings among industries that could feasibly locate outside Kentucky. In the next chart we compare compensation of military personnel with that for other key economic drivers in the state. One can see that the military is just above motor vehicle manufacturing in terms of pay and benefits to employees. Other prominent export-based industries include insurance, corporate headquarters, couriers and messengers (e.g., UPS), food manufacturing and coal mining.
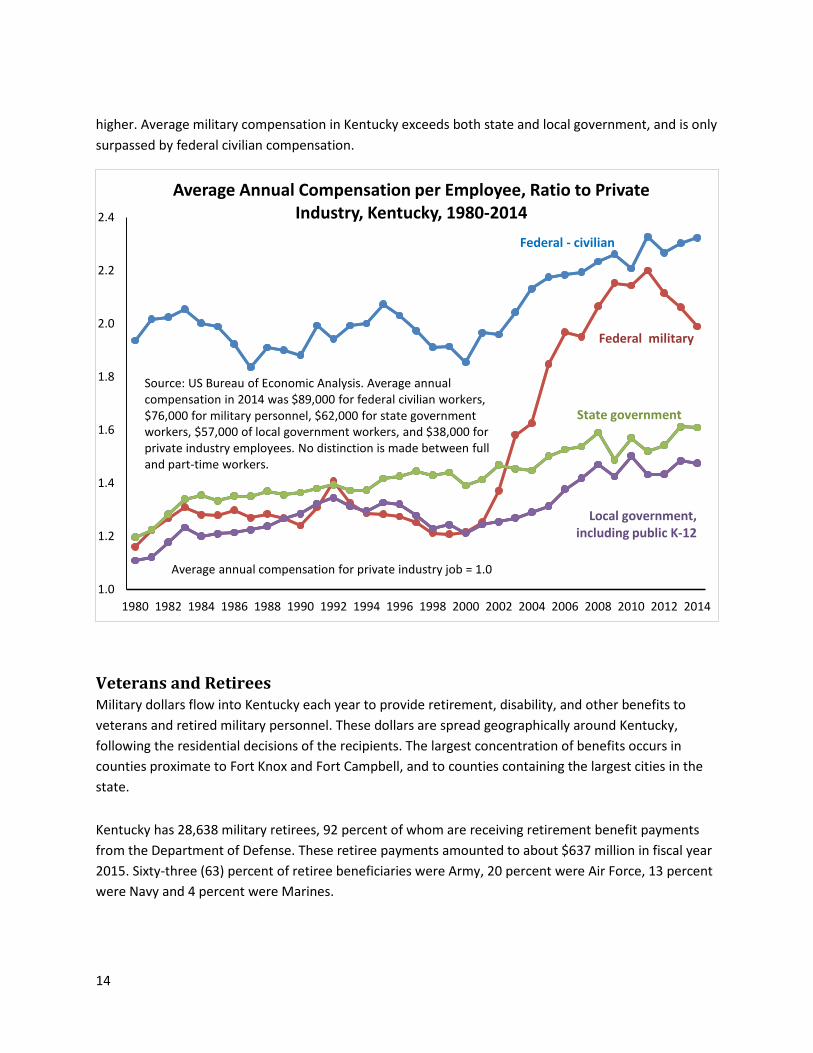
How does compensation of military and DoD civilian employees compare to other industries in Kentucky? The next graph shows the growth in compensation per government job in Kentucky relative to private sector jobs, revealing a pattern nearly identical to that nationally. The vertical axis measures how much more the government job pays than the average in private industries, which includes a mixture of part-time and full-time employment. In 2001 average military compensation was only slightly higher than that of the average private sector job, and is now twice as high. In 2014 it was 15 percent
$269,843 $327,517 $375,418 $388,021 $398,822 $408,996 $438,152 $514,141 $540,698
$650,717 $659,441
$911,404 $953,908 $964,046
$1,064,747 $1,143,019
$1,244,663 $1,247,089
$1,470,719 $1,672,055
$2,261,468 $2,822,078
$3,768,995 $3,849,224
Amusement, gambling, and…Other transportation equipment mfg
Rail transportationAccommodation
FarmingWood product mfg
Nonmetallic mineral product mfgPrinting and related support activities
Computer and electronic product…Beverage and tobacco product mfg
Paper mfgPlastics and rubber products mfg
Electrical equipment and appliance…Primary metal mfg
Coal miningChemical mfg
Machinery mfgFabricated metal product mfg
Food mfgCouriers and messengers
Management of companies and…Insurance carriers and related…
Motor vehicles, bodies and trailers,…Military
Employee Compensation ($000) Selected Exporting Industries in Kentucky, 2014
Source: US Bureau of Economic Analysis. Compensation includes wages, salaries, and supplements (employer contributions for employee pension and health insurance funds, plus employer contributions for government social insurance).
14
higher. Average military compensation in Kentucky exceeds both state and local government, and is only surpassed by federal civilian compensation.
Veterans and Retirees Military dollars flow into Kentucky each year to provide retirement, disability, and other benefits to veterans and retired military personnel. These dollars are spread geographically around Kentucky, following the residential decisions of the recipients. The largest concentration of benefits occurs in counties proximate to Fort Knox and Fort Campbell, and to counties containing the largest cities in the state. Kentucky has 28,638 military retirees, 92 percent of whom are receiving retirement benefit payments from the Department of Defense. These retiree payments amounted to about $637 million in fiscal year 2015. Sixty-three (63) percent of retiree beneficiaries were Army, 20 percent were Air Force, 13 percent were Navy and 4 percent were Marines.
1.0
1.2
1.4
1.6
1.8
2.0
2.2
2.4
1980 1982 1984 1986 1988 1990 1992 1994 1996 1998 2000 2002 2004 2006 2008 2010 2012 2014
Average Annual Compensation per Employee, Ratio to Private Industry, Kentucky, 1980-2014
Federal - civilian
Federal military
State government
Local government, including public K-12
Average annual compensation for private industry job = 1.0
Source: US Bureau of Economic Analysis. Average annual compensation in 2014 was $89,000 for federal civilian workers, $76,000 for military personnel, $62,000 for state government workers, $57,000 of local government workers, and $38,000 for private industry employees. No distinction is made between full and part-time workers.
15
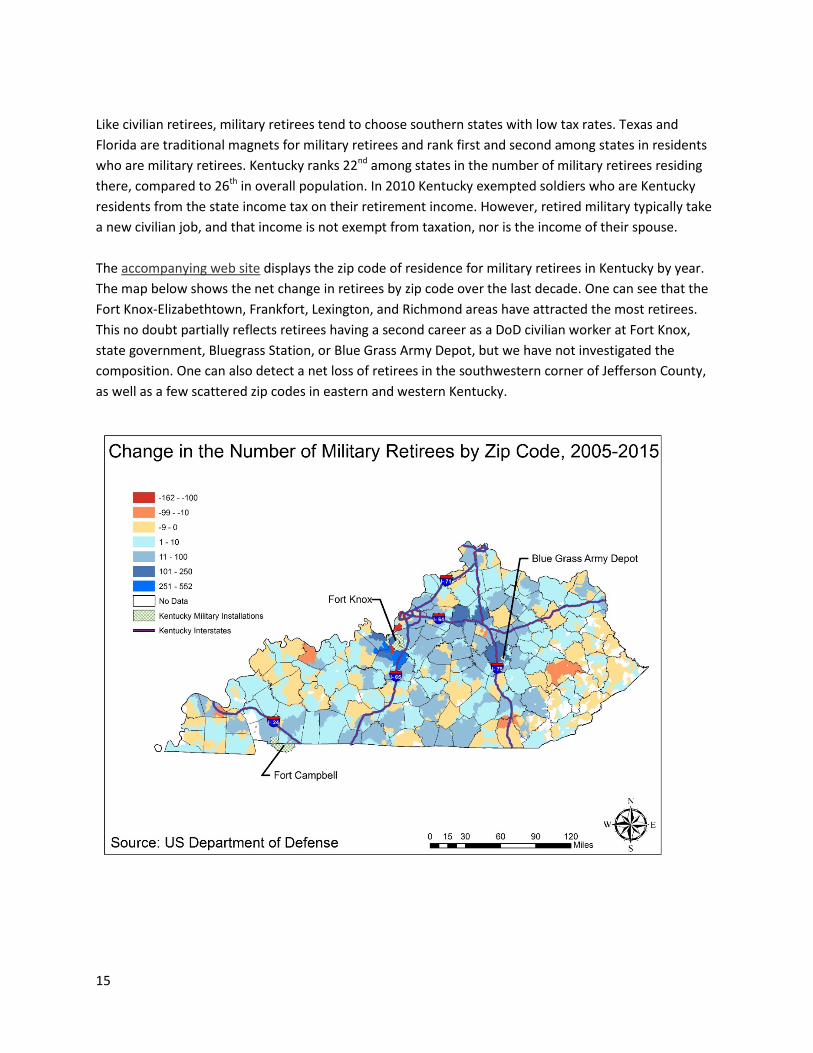
Like civilian retirees, military retirees tend to choose southern states with low tax rates. Texas and Florida are traditional magnets for military retirees and rank first and second among states in residents who are military retirees. Kentucky ranks 22nd among states in the number of military retirees residing there, compared to 26th in overall population. In 2010 Kentucky exempted soldiers who are Kentucky residents from the state income tax on their retirement income. However, retired military typically take a new civilian job, and that income is not exempt from taxation, nor is the income of their spouse. The accompanying web site displays the zip code of residence for military retirees in Kentucky by year. The map below shows the net change in retirees by zip code over the last decade. One can see that the Fort Knox-Elizabethtown, Frankfort, Lexington, and Richmond areas have attracted the most retirees. This no doubt partially reflects retirees having a second career as a DoD civilian worker at Fort Knox, state government, Bluegrass Station, or Blue Grass Army Depot, but we have not investigated the composition. One can also detect a net loss of retirees in the southwestern corner of Jefferson County, as well as a few scattered zip codes in eastern and western Kentucky.
16
Unlike civilian retirees, former career military personnel have an incentive to live near a large military installation, where they can take advantage of on-base shopping and medical services at below-market prices. Hardin County, the primary host county for Fort Knox, appears to have capitalized on this economic opportunity.
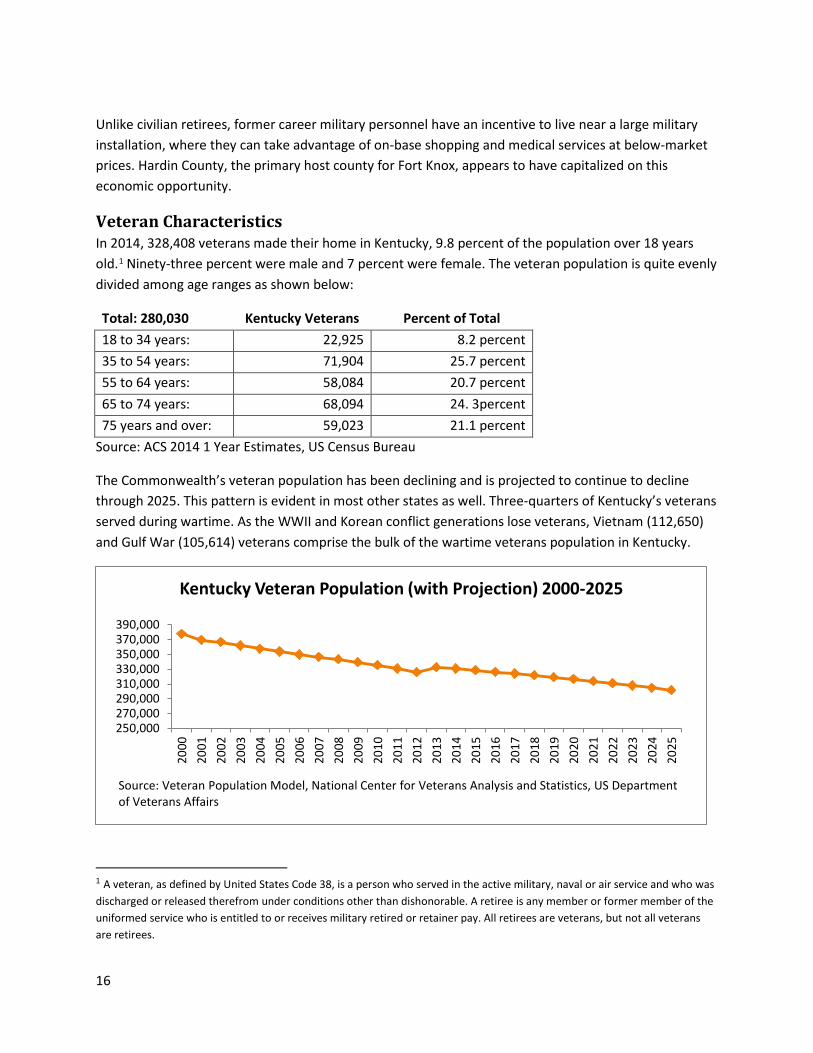
Veteran Characteristics In 2014, 328,408 veterans made their home in Kentucky, 9.8 percent of the population over 18 years old.1 Ninety-three percent were male and 7 percent were female. The veteran population is quite evenly divided among age ranges as shown below:
Total: 280,030 Kentucky Veterans Percent of Total 18 to 34 years: 22,925 8.2 percent 35 to 54 years: 71,904 25.7 percent 55 to 64 years: 58,084 20.7 percent 65 to 74 years: 68,094 24. 3percent 75 years and over: 59,023 21.1 percent
Source: ACS 2014 1 Year Estimates, US Census Bureau
The Commonwealth’s veteran population has been declining and is projected to continue to decline through 2025. This pattern is evident in most other states as well. Three-quarters of Kentucky’s veterans served during wartime. As the WWII and Korean conflict generations lose veterans, Vietnam (112,650) and Gulf War (105,614) veterans comprise the bulk of the wartime veterans population in Kentucky.
1 A veteran, as defined by United States Code 38, is a person who served in the active military, naval or air service and who was discharged or released therefrom under conditions other than dishonorable. A retiree is any member or former member of the uniformed service who is entitled to or receives military retired or retainer pay. All retirees are veterans, but not all veterans are retirees.
250,000270,000290,000310,000330,000350,000370,000390,000
2000
2001
2002
2003
2004
2005
2006
2007
2008
2009
2010
2011
2012
2013
2014
2015
2016
2017
2018
2019
2020
2021
2022
2023
2024
2025
Kentucky Veteran Population (with Projection) 2000-2025
Source: Veteran Population Model, National Center for Veterans Analysis and Statistics, US Department of Veterans Affairs
17
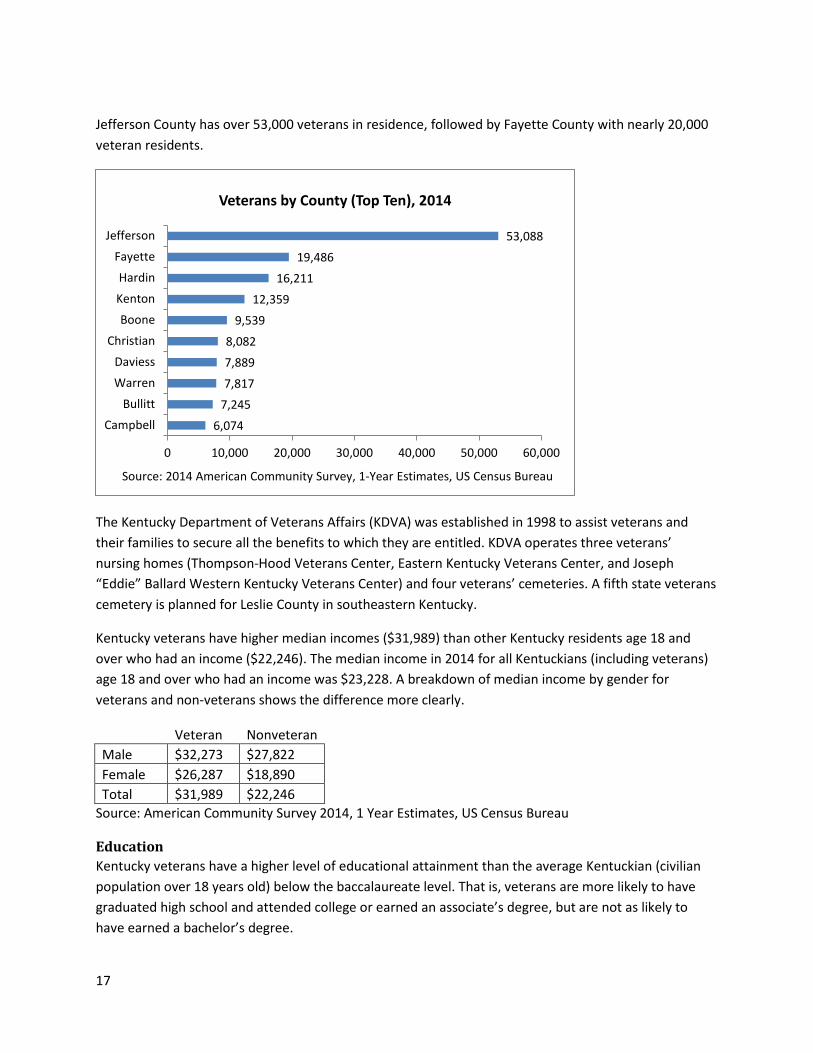
Jefferson County has over 53,000 veterans in residence, followed by Fayette County with nearly 20,000 veteran residents.
The Kentucky Department of Veterans Affairs (KDVA) was established in 1998 to assist veterans and their families to secure all the benefits to which they are entitled. KDVA operates three veterans’ nursing homes (Thompson-Hood Veterans Center, Eastern Kentucky Veterans Center, and Joseph “Eddie” Ballard Western Kentucky Veterans Center) and four veterans’ cemeteries. A fifth state veterans cemetery is planned for Leslie County in southeastern Kentucky.
Kentucky veterans have higher median incomes ($31,989) than other Kentucky residents age 18 and over who had an income ($22,246). The median income in 2014 for all Kentuckians (including veterans) age 18 and over who had an income was $23,228. A breakdown of median income by gender for veterans and non-veterans shows the difference more clearly.
Veteran Nonveteran
Male $32,273 $27,822 Female $26,287 $18,890 Total $31,989 $22,246
Source: American Community Survey 2014, 1 Year Estimates, US Census Bureau
Education Kentucky veterans have a higher level of educational attainment than the average Kentuckian (civilian population over 18 years old) below the baccalaureate level. That is, veterans are more likely to have graduated high school and attended college or earned an associate’s degree, but are not as likely to have earned a bachelor’s degree.
6,074
7,245
7,817
7,889
8,082
9,539
12,359
16,211
19,486
53,088
0 10,000 20,000 30,000 40,000 50,000 60,000
Campbell
Bullitt
Warren
Daviess
Christian
Boone
Kenton
Hardin
Fayette
Jefferson
Veterans by County (Top Ten), 2014
Source: 2014 American Community Survey, 1-Year Estimates, US Census Bureau
18
Veteran Non-Veteran
Less than high school graduate 10.6% 16.1% High school graduate (includes equivalency) 34.8% 33.8%
Some college or associate's degree 34.9% 27.7% Bachelor's degree or higher 19.7% 22.5%
Source: Source: American Community Survey 2014, 1 Year Estimates, US Census Bureau
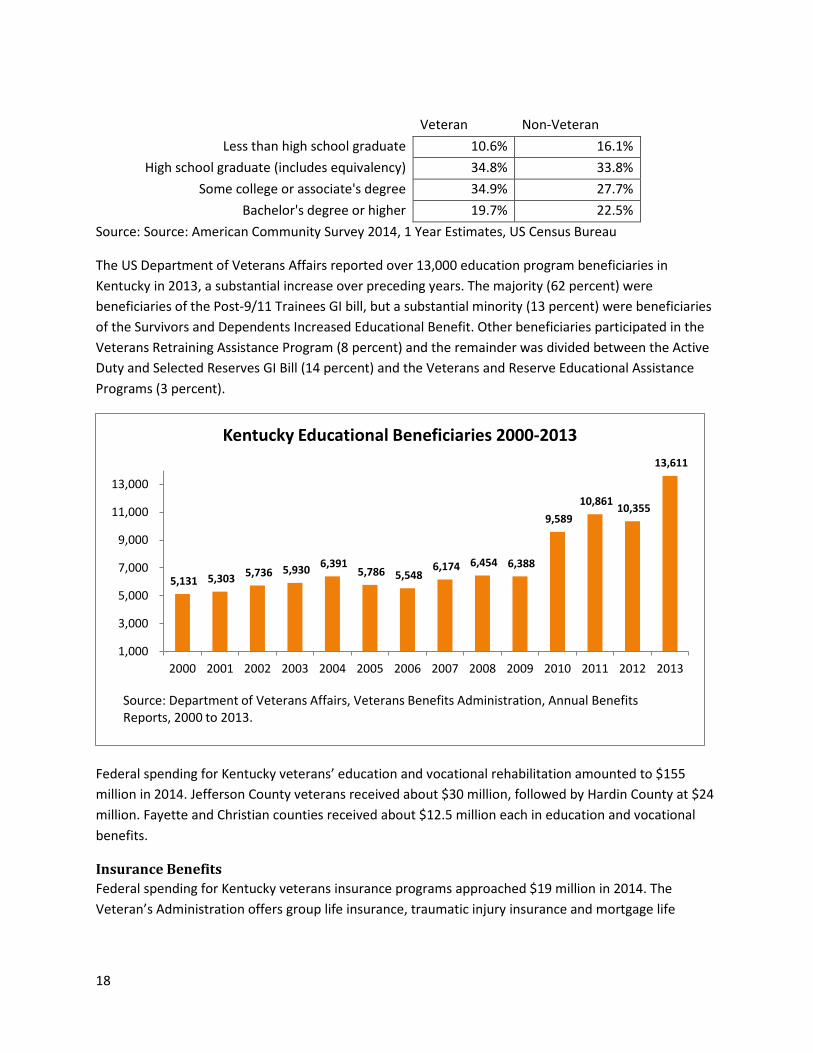
The US Department of Veterans Affairs reported over 13,000 education program beneficiaries in Kentucky in 2013, a substantial increase over preceding years. The majority (62 percent) were beneficiaries of the Post-9/11 Trainees GI bill, but a substantial minority (13 percent) were beneficiaries of the Survivors and Dependents Increased Educational Benefit. Other beneficiaries participated in the Veterans Retraining Assistance Program (8 percent) and the remainder was divided between the Active Duty and Selected Reserves GI Bill (14 percent) and the Veterans and Reserve Educational Assistance Programs (3 percent).
Federal spending for Kentucky veterans’ education and vocational rehabilitation amounted to $155 million in 2014. Jefferson County veterans received about $30 million, followed by Hardin County at $24 million. Fayette and Christian counties received about $12.5 million each in education and vocational benefits.
Insurance Benefits Federal spending for Kentucky veterans insurance programs approached $19 million in 2014. The Veteran’s Administration offers group life insurance, traumatic injury insurance and mortgage life
5,131 5,303 5,736 5,930 6,391 5,786 5,548
6,174 6,454 6,388
9,589 10,861 10,355
13,611
1,000
3,000
5,000
7,000
9,000
11,000
13,000
2000 2001 2002 2003 2004 2005 2006 2007 2008 2009 2010 2011 2012 2013
Kentucky Educational Beneficiaries 2000-2013
Source: Department of Veterans Affairs, Veterans Benefits Administration, Annual Benefits Reports, 2000 to 2013.
19
insurance. These benefits are based on where the veteran lives, which is why Jefferson County ($4.25 million) and Fayette County ($1.7 million) are the largest recipients.
Medical Benefits Over 100,000 Kentucky veterans received treatment at a VA Medical facility in 2014. Much, but not all, of their medical care was provided by the veteran hospitals in Lexington and Louisville, and by outpatient clinics in 16 other locations throughout the Commonwealth. Many veterans receive medical care from local providers rather than VA facilities. Data on medical spending by county is based on the veteran’s county of residence rather than where the medical care was provided.
Jefferson County veterans received about $168 million in medical care in 2014, followed by Fayette County with about $77 million. Kenton, Hardin, Campbell and Boone counties all had medical care expenditures above $20 million. Thirteen counties had medical expenditures in excess of $10 million.
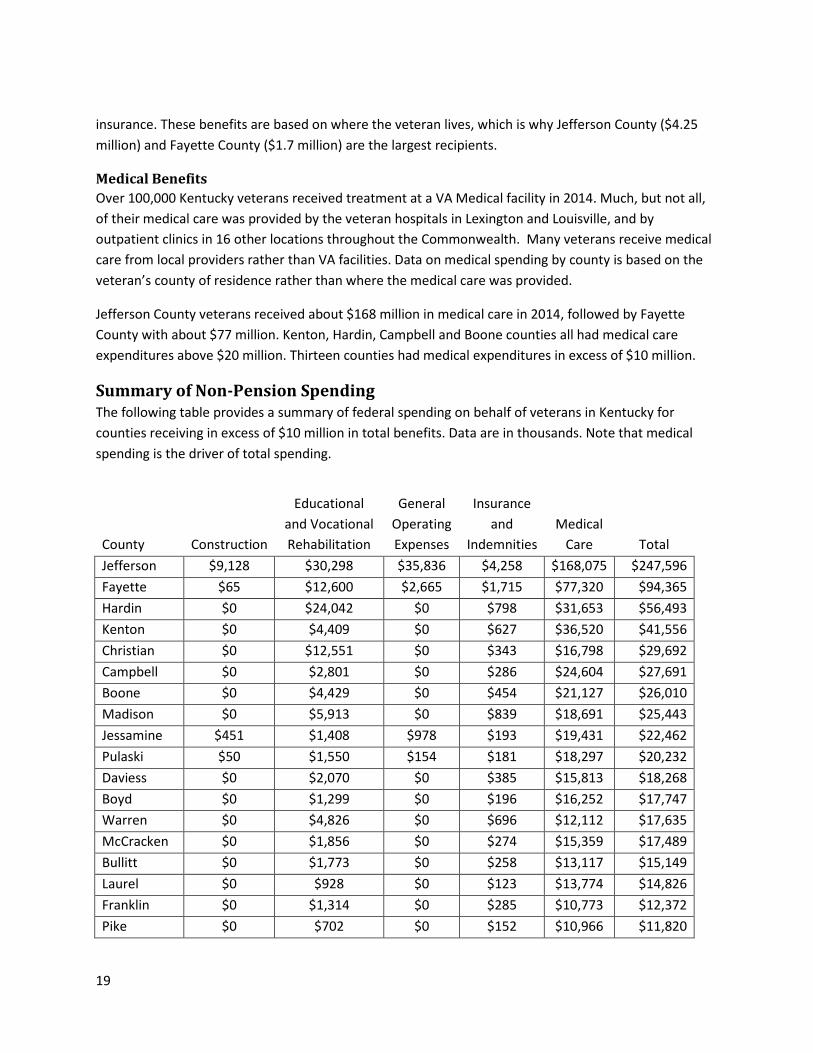
Summary of Non-Pension Spending The following table provides a summary of federal spending on behalf of veterans in Kentucky for counties receiving in excess of $10 million in total benefits. Data are in thousands. Note that medical spending is the driver of total spending.
County Construction
Educational and Vocational Rehabilitation
General Operating Expenses
Insurance and
Indemnities Medical
Care Total Jefferson $9,128 $30,298 $35,836 $4,258 $168,075 $247,596 Fayette $65 $12,600 $2,665 $1,715 $77,320 $94,365 Hardin $0 $24,042 $0 $798 $31,653 $56,493 Kenton $0 $4,409 $0 $627 $36,520 $41,556 Christian $0 $12,551 $0 $343 $16,798 $29,692 Campbell $0 $2,801 $0 $286 $24,604 $27,691 Boone $0 $4,429 $0 $454 $21,127 $26,010 Madison $0 $5,913 $0 $839 $18,691 $25,443 Jessamine $451 $1,408 $978 $193 $19,431 $22,462 Pulaski $50 $1,550 $154 $181 $18,297 $20,232 Daviess $0 $2,070 $0 $385 $15,813 $18,268 Boyd $0 $1,299 $0 $196 $16,252 $17,747 Warren $0 $4,826 $0 $696 $12,112 $17,635 McCracken $0 $1,856 $0 $274 $15,359 $17,489 Bullitt $0 $1,773 $0 $258 $13,117 $15,149 Laurel $0 $928 $0 $123 $13,774 $14,826 Franklin $0 $1,314 $0 $285 $10,773 $12,372 Pike $0 $702 $0 $152 $10,966 $11,820
20
Greenup $0 $561 $0 $194 $10,639 $11,394 Clark $0 $854 $0 $159 $9,785 $10,797 Whitley $0 $1,276 $0 $50 $9,120 $10,446 Hopkins $0 $779 $0 $450 $8,846 $10,076
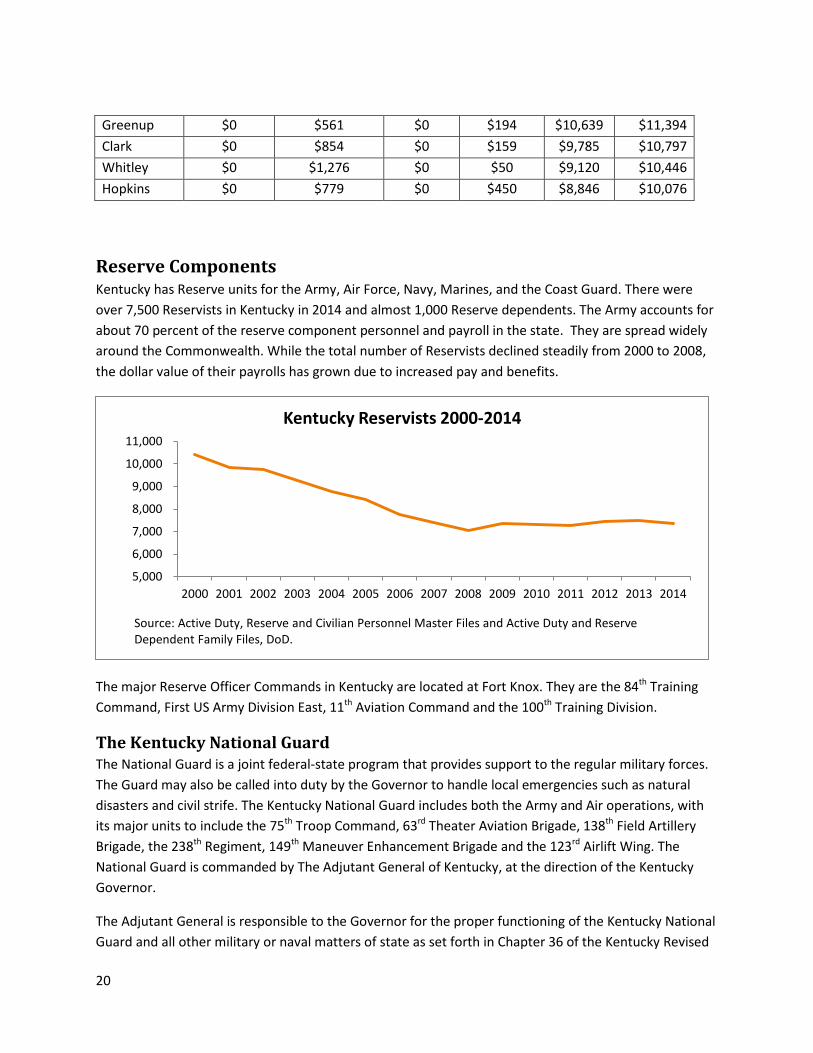
Reserve Components Kentucky has Reserve units for the Army, Air Force, Navy, Marines, and the Coast Guard. There were over 7,500 Reservists in Kentucky in 2014 and almost 1,000 Reserve dependents. The Army accounts for about 70 percent of the reserve component personnel and payroll in the state. They are spread widely around the Commonwealth. While the total number of Reservists declined steadily from 2000 to 2008, the dollar value of their payrolls has grown due to increased pay and benefits.
The major Reserve Officer Commands in Kentucky are located at Fort Knox. They are the 84th Training Command, First US Army Division East, 11th Aviation Command and the 100th Training Division.
The Kentucky National Guard The National Guard is a joint federal-state program that provides support to the regular military forces. The Guard may also be called into duty by the Governor to handle local emergencies such as natural disasters and civil strife. The Kentucky National Guard includes both the Army and Air operations, with its major units to include the 75th Troop Command, 63rd Theater Aviation Brigade, 138th Field Artillery Brigade, the 238th Regiment, 149th Maneuver Enhancement Brigade and the 123rd Airlift Wing. The National Guard is commanded by The Adjutant General of Kentucky, at the direction of the Kentucky Governor.
The Adjutant General is responsible to the Governor for the proper functioning of the Kentucky National Guard and all other military or naval matters of state as set forth in Chapter 36 of the Kentucky Revised
5,000
6,000
7,000
8,000
9,000
10,000
11,000
2000 2001 2002 2003 2004 2005 2006 2007 2008 2009 2010 2011 2012 2013 2014
Kentucky Reservists 2000-2014
Source: Active Duty, Reserve and Civilian Personnel Master Files and Active Duty and Reserve Dependent Family Files, DoD.
21
Statutes. The Adjutant General has a dual role as both head of the Kentucky National Guard and also as the head of the Kentucky Department of Military Affairs, a state agency.
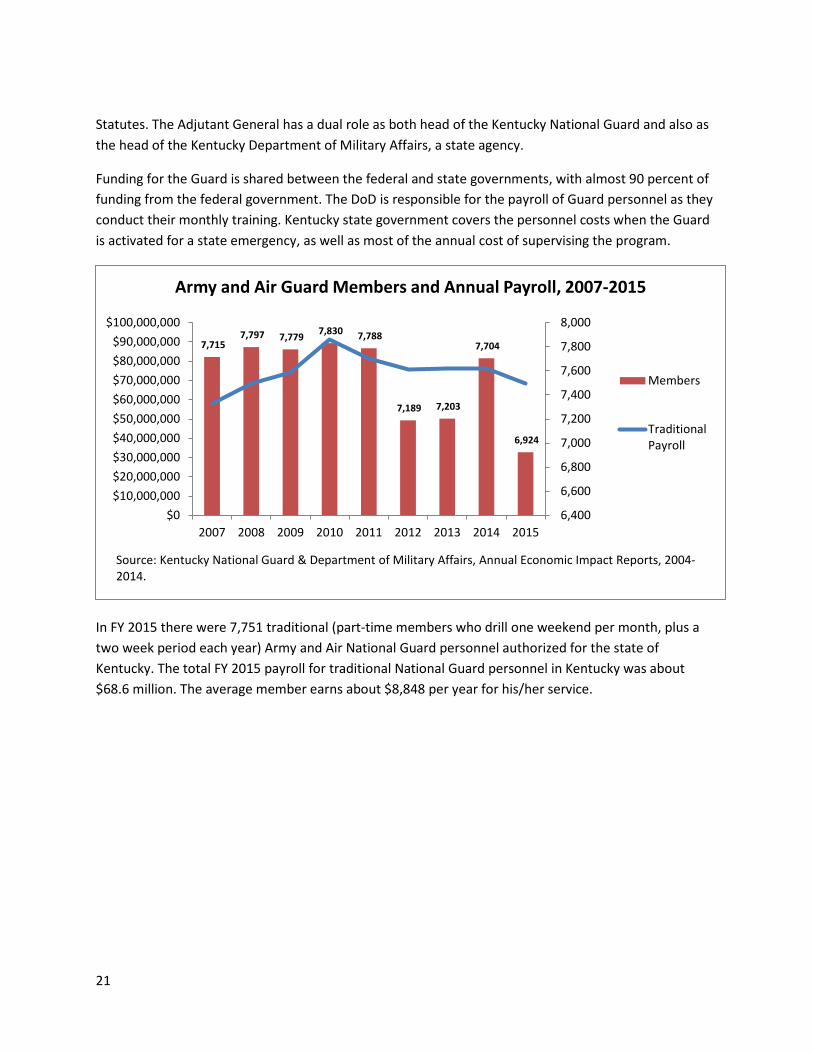
Funding for the Guard is shared between the federal and state governments, with almost 90 percent of funding from the federal government. The DoD is responsible for the payroll of Guard personnel as they conduct their monthly training. Kentucky state government covers the personnel costs when the Guard is activated for a state emergency, as well as most of the annual cost of supervising the program.
In FY 2015 there were 7,751 traditional (part-time members who drill one weekend per month, plus a two week period each year) Army and Air National Guard personnel authorized for the state of Kentucky. The total FY 2015 payroll for traditional National Guard personnel in Kentucky was about $68.6 million. The average member earns about $8,848 per year for his/her service.
7,715 7,797 7,779 7,830 7,788
7,189 7,203
7,704
6,924
6,400
6,600
6,800
7,000
7,200
7,400
7,600
7,800
8,000
$0$10,000,000$20,000,000$30,000,000$40,000,000$50,000,000$60,000,000$70,000,000$80,000,000$90,000,000
$100,000,000
2007 2008 2009 2010 2011 2012 2013 2014 2015
Army and Air Guard Members and Annual Payroll, 2007-2015
Members
TraditionalPayroll
Source: Kentucky National Guard & Department of Military Affairs, Annual Economic Impact Reports, 2004-2014.
22
County Personnel Annual Payroll
Jefferson 1,128 $9,662,913 Fayette 610 $4,928,976 Madison 271 $2,159,937 Hardin 248 $1,935,180 Franklin 248 $1,760,031 Kenton 211 $1,749,033 Warren 218 $1,677,078 Boone 188 $1,513,161 Oldham 126 $1,174,563 Scott 149 $1,142,505 Daviess 141 $1,111,383 Bullitt 150 $1,090,206 Pulaski 122 $1,021,293 Whitley 130 $1,002,456 Shelby 123 $942,318
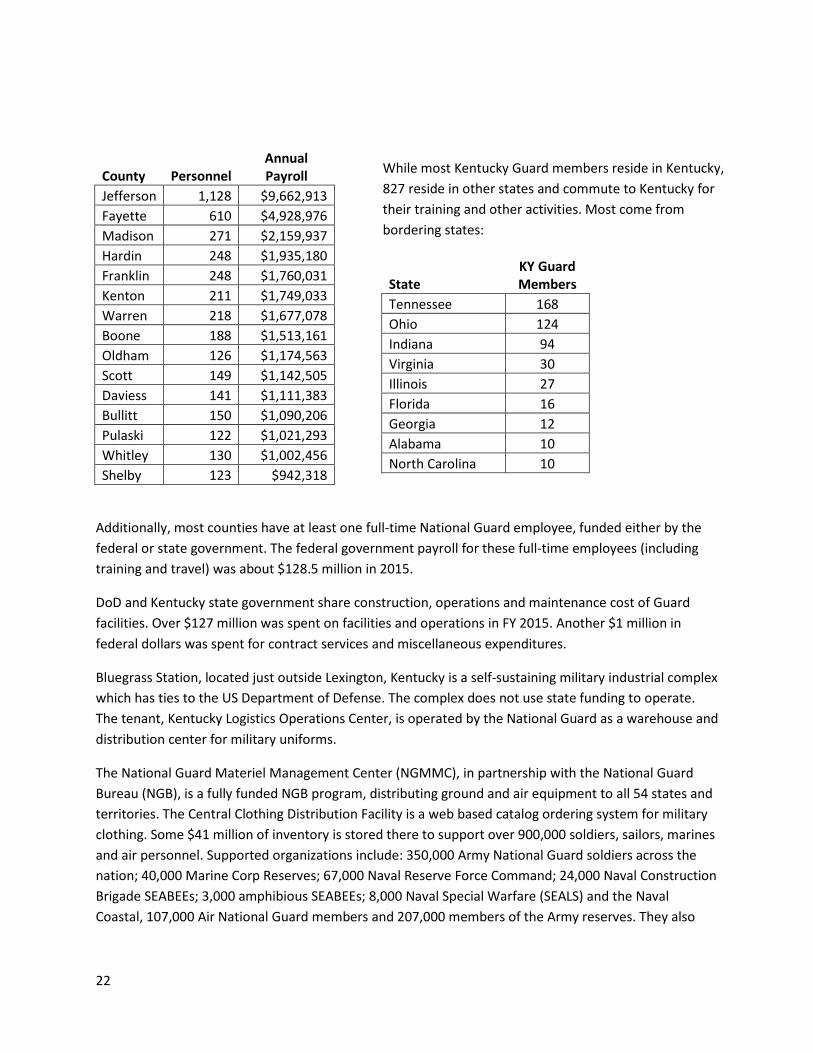
Additionally, most counties have at least one full-time National Guard employee, funded either by the federal or state government. The federal government payroll for these full-time employees (including training and travel) was about $128.5 million in 2015.
DoD and Kentucky state government share construction, operations and maintenance cost of Guard facilities. Over $127 million was spent on facilities and operations in FY 2015. Another $1 million in federal dollars was spent for contract services and miscellaneous expenditures.
Bluegrass Station, located just outside Lexington, Kentucky is a self-sustaining military industrial complex which has ties to the US Department of Defense. The complex does not use state funding to operate. The tenant, Kentucky Logistics Operations Center, is operated by the National Guard as a warehouse and distribution center for military uniforms.
The National Guard Materiel Management Center (NGMMC), in partnership with the National Guard Bureau (NGB), is a fully funded NGB program, distributing ground and air equipment to all 54 states and territories. The Central Clothing Distribution Facility is a web based catalog ordering system for military clothing. Some $41 million of inventory is stored there to support over 900,000 soldiers, sailors, marines and air personnel. Supported organizations include: 350,000 Army National Guard soldiers across the nation; 40,000 Marine Corp Reserves; 67,000 Naval Reserve Force Command; 24,000 Naval Construction Brigade SEABEEs; 3,000 amphibious SEABEEs; 8,000 Naval Special Warfare (SEALS) and the Naval Coastal, 107,000 Air National Guard members and 207,000 members of the Army reserves. They also
While most Kentucky Guard members reside in Kentucky, 827 reside in other states and commute to Kentucky for their training and other activities. Most come from bordering states:
State KY Guard Members
Tennessee 168 Ohio 124 Indiana 94 Virginia 30 Illinois 27 Florida 16 Georgia 12 Alabama 10 North Carolina 10
23
provide the Army Direct Ordering program that has supported sustainment of war fighters in Afghanistan, the Horn of Africa AOR and Iraq.
The Kentucky National Guard operates the Wendell H. Ford Regional Training Center (WHFRTC), approximately 12,000 acres capable of supporting medium sized training requirements of a large number of units from all the Services. Thousands of Kentucky National Guard troops, active duty members from all branches of service and even civilians have trained at the facility.
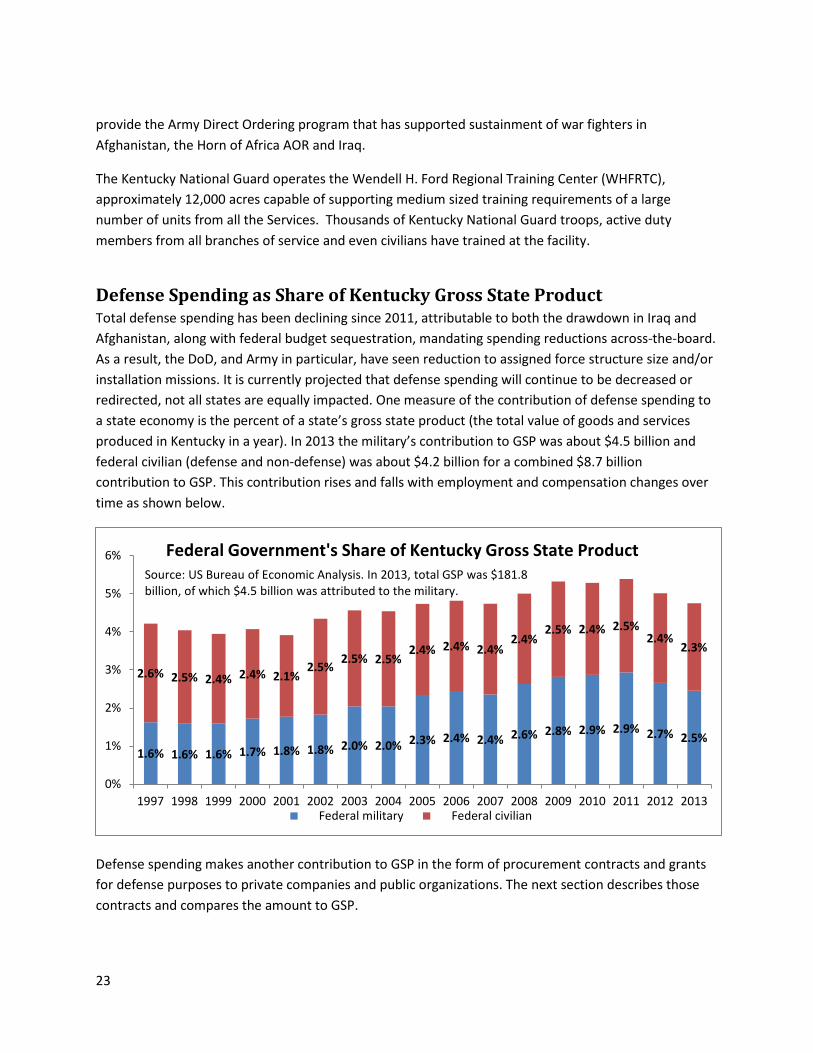
Defense Spending as Share of Kentucky Gross State Product Total defense spending has been declining since 2011, attributable to both the drawdown in Iraq and Afghanistan, along with federal budget sequestration, mandating spending reductions across-the-board. As a result, the DoD, and Army in particular, have seen reduction to assigned force structure size and/or installation missions. It is currently projected that defense spending will continue to be decreased or redirected, not all states are equally impacted. One measure of the contribution of defense spending to a state economy is the percent of a state’s gross state product (the total value of goods and services produced in Kentucky in a year). In 2013 the military’s contribution to GSP was about $4.5 billion and federal civilian (defense and non-defense) was about $4.2 billion for a combined $8.7 billion contribution to GSP. This contribution rises and falls with employment and compensation changes over time as shown below.
Defense spending makes another contribution to GSP in the form of procurement contracts and grants for defense purposes to private companies and public organizations. The next section describes those contracts and compares the amount to GSP.
1.6% 1.6% 1.6% 1.7% 1.8% 1.8% 2.0% 2.0% 2.3% 2.4% 2.4% 2.6% 2.8% 2.9% 2.9% 2.7% 2.5%
2.6% 2.5% 2.4% 2.4% 2.1% 2.5% 2.5% 2.5%
2.4% 2.4% 2.4% 2.4%
2.5% 2.4% 2.5% 2.4%
2.3%
0%
1%
2%
3%
4%
5%
6%
1997 1998 1999 2000 2001 2002 2003 2004 2005 2006 2007 2008 2009 2010 2011 2012 2013 Federal military Federal civilian
Source: US Bureau of Economic Analysis. In 2013, total GSP was $181.8 billion, of which $4.5 billion was attributed to the military.
Federal Government's Share of Kentucky Gross State Product
24
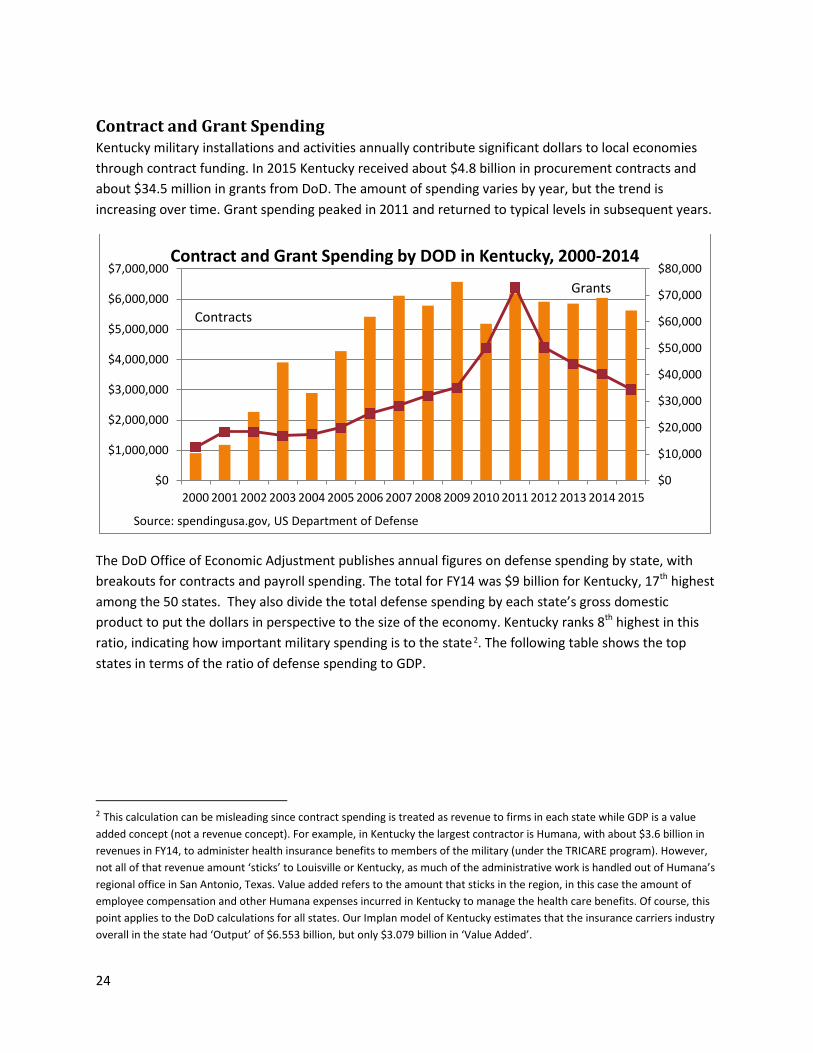
Contract and Grant Spending Kentucky military installations and activities annually contribute significant dollars to local economies through contract funding. In 2015 Kentucky received about $4.8 billion in procurement contracts and about $34.5 million in grants from DoD. The amount of spending varies by year, but the trend is increasing over time. Grant spending peaked in 2011 and returned to typical levels in subsequent years.
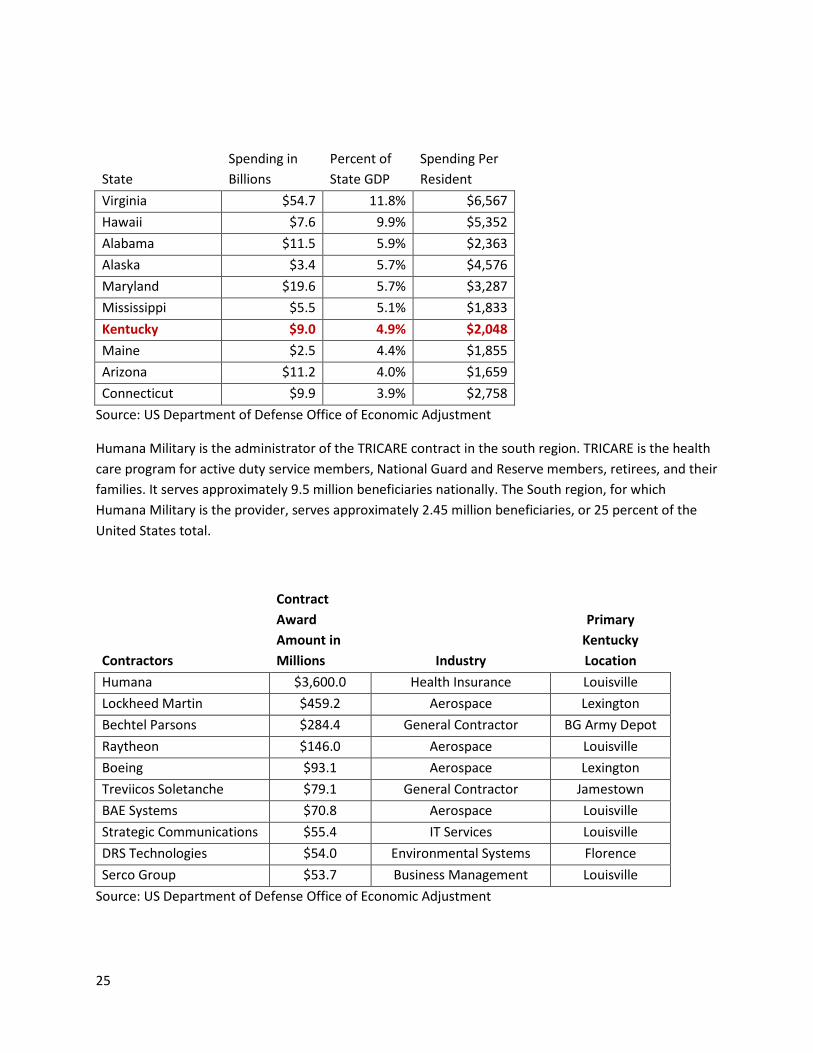
The DoD Office of Economic Adjustment publishes annual figures on defense spending by state, with breakouts for contracts and payroll spending. The total for FY14 was $9 billion for Kentucky, 17th highest among the 50 states. They also divide the total defense spending by each state’s gross domestic product to put the dollars in perspective to the size of the economy. Kentucky ranks 8th highest in this ratio, indicating how important military spending is to the state 2. The following table shows the top states in terms of the ratio of defense spending to GDP.
2 This calculation can be misleading since contract spending is treated as revenue to firms in each state while GDP is a value added concept (not a revenue concept). For example, in Kentucky the largest contractor is Humana, with about $3.6 billion in revenues in FY14, to administer health insurance benefits to members of the military (under the TRICARE program). However, not all of that revenue amount ‘sticks’ to Louisville or Kentucky, as much of the administrative work is handled out of Humana’s regional office in San Antonio, Texas. Value added refers to the amount that sticks in the region, in this case the amount of employee compensation and other Humana expenses incurred in Kentucky to manage the health care benefits. Of course, this point applies to the DoD calculations for all states. Our Implan model of Kentucky estimates that the insurance carriers industry overall in the state had ‘Output’ of $6.553 billion, but only $3.079 billion in ‘Value Added’.
$0
$10,000
$20,000
$30,000
$40,000
$50,000
$60,000
$70,000
$80,000
$0
$1,000,000
$2,000,000
$3,000,000
$4,000,000
$5,000,000
$6,000,000
$7,000,000
2000 2001 2002 2003 2004 2005 2006 2007 2008 2009 2010 2011 2012 2013 2014 2015
Contract and Grant Spending by DOD in Kentucky, 2000-2014
Source: spendingusa.gov, US Department of Defense
Contracts
Grants
25
State Spending in Billions
Percent of State GDP
Spending Per Resident
Virginia $54.7 11.8% $6,567 Hawaii $7.6 9.9% $5,352 Alabama $11.5 5.9% $2,363 Alaska $3.4 5.7% $4,576 Maryland $19.6 5.7% $3,287 Mississippi $5.5 5.1% $1,833 Kentucky $9.0 4.9% $2,048 Maine $2.5 4.4% $1,855 Arizona $11.2 4.0% $1,659 Connecticut $9.9 3.9% $2,758
Source: US Department of Defense Office of Economic Adjustment
Humana Military is the administrator of the TRICARE contract in the south region. TRICARE is the health care program for active duty service members, National Guard and Reserve members, retirees, and their families. It serves approximately 9.5 million beneficiaries nationally. The South region, for which Humana Military is the provider, serves approximately 2.45 million beneficiaries, or 25 percent of the United States total.
Contractors
Contract Award Amount in Millions Industry
Primary Kentucky Location
Humana $3,600.0 Health Insurance Louisville Lockheed Martin $459.2 Aerospace Lexington Bechtel Parsons $284.4 General Contractor BG Army Depot Raytheon $146.0 Aerospace Louisville Boeing $93.1 Aerospace Lexington Treviicos Soletanche $79.1 General Contractor Jamestown BAE Systems $70.8 Aerospace Louisville Strategic Communications $55.4 IT Services Louisville DRS Technologies $54.0 Environmental Systems Florence Serco Group $53.7 Business Management Louisville
Source: US Department of Defense Office of Economic Adjustment
26
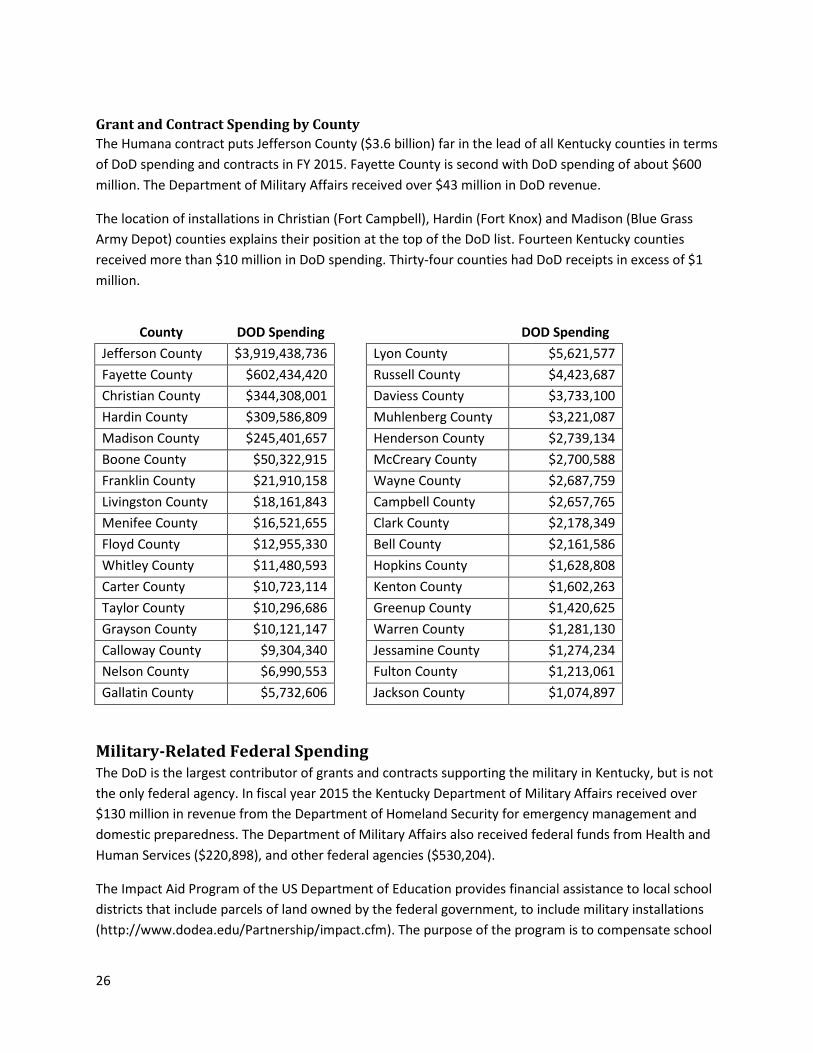
Grant and Contract Spending by County The Humana contract puts Jefferson County ($3.6 billion) far in the lead of all Kentucky counties in terms of DoD spending and contracts in FY 2015. Fayette County is second with DoD spending of about $600 million. The Department of Military Affairs received over $43 million in DoD revenue.
The location of installations in Christian (Fort Campbell), Hardin (Fort Knox) and Madison (Blue Grass Army Depot) counties explains their position at the top of the DoD list. Fourteen Kentucky counties received more than $10 million in DoD spending. Thirty-four counties had DoD receipts in excess of $1 million.
County DOD Spending
DOD Spending Jefferson County $3,919,438,736
Lyon County $5,621,577
Fayette County $602,434,420
Russell County $4,423,687 Christian County $344,308,001
Daviess County $3,733,100
Hardin County $309,586,809
Muhlenberg County $3,221,087 Madison County $245,401,657
Henderson County $2,739,134
Boone County $50,322,915
McCreary County $2,700,588 Franklin County $21,910,158
Wayne County $2,687,759
Livingston County $18,161,843
Campbell County $2,657,765 Menifee County $16,521,655
Clark County $2,178,349
Floyd County $12,955,330
Bell County $2,161,586 Whitley County $11,480,593
Hopkins County $1,628,808
Carter County $10,723,114
Kenton County $1,602,263 Taylor County $10,296,686
Greenup County $1,420,625
Grayson County $10,121,147
Warren County $1,281,130 Calloway County $9,304,340
Jessamine County $1,274,234
Nelson County $6,990,553
Fulton County $1,213,061 Gallatin County $5,732,606
Jackson County $1,074,897
Military-Related Federal Spending The DoD is the largest contributor of grants and contracts supporting the military in Kentucky, but is not the only federal agency. In fiscal year 2015 the Kentucky Department of Military Affairs received over $130 million in revenue from the Department of Homeland Security for emergency management and domestic preparedness. The Department of Military Affairs also received federal funds from Health and Human Services ($220,898), and other federal agencies ($530,204).
The Impact Aid Program of the US Department of Education provides financial assistance to local school districts that include parcels of land owned by the federal government, to include military installations (http://www.dodea.edu/Partnership/impact.cfm). The purpose of the program is to compensate school
27
districts for the opportunity cost of property tax revenue, a critical source of funding for most school districts. There are four components of the Impact Aid Program.
Payments for federal property (section 8002) are received by the school district when the assessed valuation of at least 10 percent of real property in the district belongs to the federal government. Clinton, Edmonson, Lyon, Russell, Taylor and Trigg counties together received $1.6 million in 8002 payments in FY 2014.
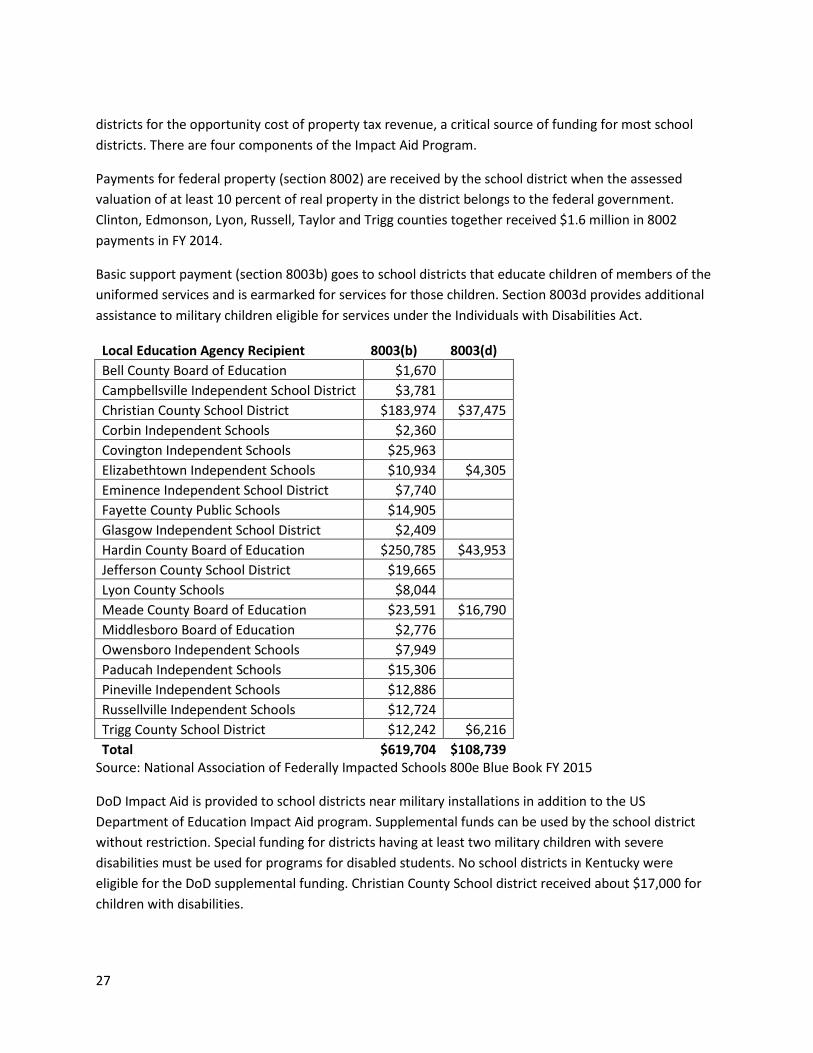
Basic support payment (section 8003b) goes to school districts that educate children of members of the uniformed services and is earmarked for services for those children. Section 8003d provides additional assistance to military children eligible for services under the Individuals with Disabilities Act.
Local Education Agency Recipient 8003(b) 8003(d) Bell County Board of Education $1,670 Campbellsville Independent School District $3,781 Christian County School District $183,974 $37,475 Corbin Independent Schools $2,360 Covington Independent Schools $25,963 Elizabethtown Independent Schools $10,934 $4,305 Eminence Independent School District $7,740 Fayette County Public Schools $14,905 Glasgow Independent School District $2,409 Hardin County Board of Education $250,785 $43,953 Jefferson County School District $19,665 Lyon County Schools $8,044 Meade County Board of Education $23,591 $16,790 Middlesboro Board of Education $2,776 Owensboro Independent Schools $7,949 Paducah Independent Schools $15,306 Pineville Independent Schools $12,886 Russellville Independent Schools $12,724 Trigg County School District $12,242 $6,216 Total $619,704 $108,739
Source: National Association of Federally Impacted Schools 800e Blue Book FY 2015
DoD Impact Aid is provided to school districts near military installations in addition to the US Department of Education Impact Aid program. Supplemental funds can be used by the school district without restriction. Special funding for districts having at least two military children with severe disabilities must be used for programs for disabled students. No school districts in Kentucky were eligible for the DoD supplemental funding. Christian County School district received about $17,000 for children with disabilities.
28
Major Military Sites and Operations in Kentucky Kentucky is home to two major Army military installations - Fort Campbell and Fort Knox. These have large residential and daytime populations, and are essentially self-contained cities surrounded by tens of thousands of acres of rugged training areas. The Blue Grass Army Depot, adjacent to Richmond, is another large Army facility. It is a storage, distribution and demilitarization center for ammunition and chemical defense weapons, with specialty manufacturing facilities. Nearly all of its employees are civilians.
Louisville has a number of important military activities, including a district headquarters of the U.S. Army Corps of Engineers, the U.S. Coast Guard, the Air National Guard, and the Airport Industrial Center (formerly the Technology Park of Greater Louisville, and prior to that the Naval Ordnance Station). Other military personnel are scattered throughout Kentucky, generally distributed according to the population at large. Training reservists, National Guard units, military recruiters, and ROTC students are present in all major Kentucky cities. Frankfort serves as the state headquarters for the National Guard.
Military retirees and veterans reside across the state, though they tend to cluster around Fort Campbell and Fort Knox. According to federal data, there are military personnel in almost every Kentucky county.
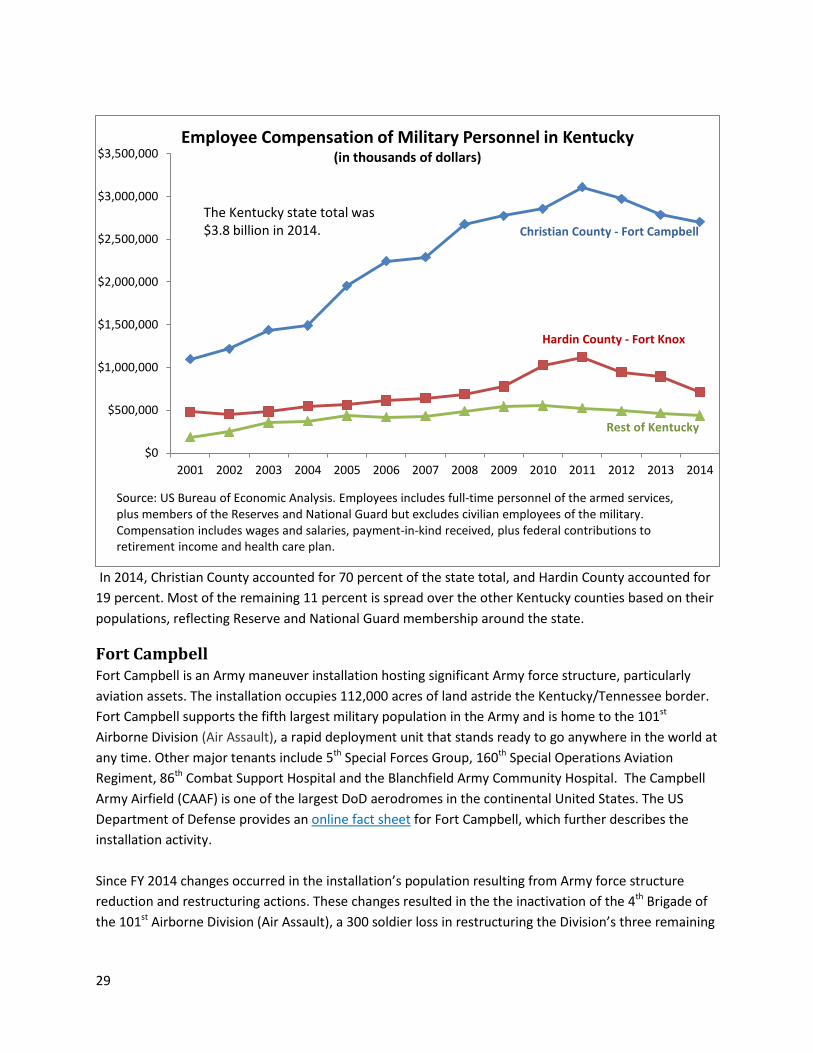
One can see the relative importance of Fort Campbell and Fort Knox in the chart. This shows employee compensation to military personnel over the last fifteen years, breaking out Christian and Hardin counties.
29
In 2014, Christian County accounted for 70 percent of the state total, and Hardin County accounted for 19 percent. Most of the remaining 11 percent is spread over the other Kentucky counties based on their populations, reflecting Reserve and National Guard membership around the state.
Fort Campbell Fort Campbell is an Army maneuver installation hosting significant Army force structure, particularly aviation assets. The installation occupies 112,000 acres of land astride the Kentucky/Tennessee border. Fort Campbell supports the fifth largest military population in the Army and is home to the 101st Airborne Division (Air Assault), a rapid deployment unit that stands ready to go anywhere in the world at any time. Other major tenants include 5th Special Forces Group, 160th Special Operations Aviation Regiment, 86th Combat Support Hospital and the Blanchfield Army Community Hospital. The Campbell Army Airfield (CAAF) is one of the largest DoD aerodromes in the continental United States. The US Department of Defense provides an online fact sheet for Fort Campbell, which further describes the installation activity. Since FY 2014 changes occurred in the installation’s population resulting from Army force structure reduction and restructuring actions. These changes resulted in the the inactivation of the 4th Brigade of the 101st Airborne Division (Air Assault), a 300 soldier loss in restructuring the Division’s three remaining
$0
$500,000
$1,000,000
$1,500,000
$2,000,000
$2,500,000
$3,000,000
$3,500,000
2001 2002 2003 2004 2005 2006 2007 2008 2009 2010 2011 2012 2013 2014
Employee Compensation of Military Personnel in Kentucky (in thousands of dollars)
Christian County - Fort Campbell
Hardin County - Fort Knox
Rest of Kentucky
Source: US Bureau of Economic Analysis. Employees includes full-time personnel of the armed services, plus members of the Reserves and National Guard but excludes civilian employees of the military. Compensation includes wages and salaries, payment-in-kind received, plus federal contributions to retirement income and health care plan.
The Kentucky state total was $3.8 billion in 2014.
30
Brigade Combat Teams. Additionally, the 159th Combat Aviation Brigade, 101st Airborne Division was inactivated with a loss of 2,400 soldiers and 3,800 dependents.
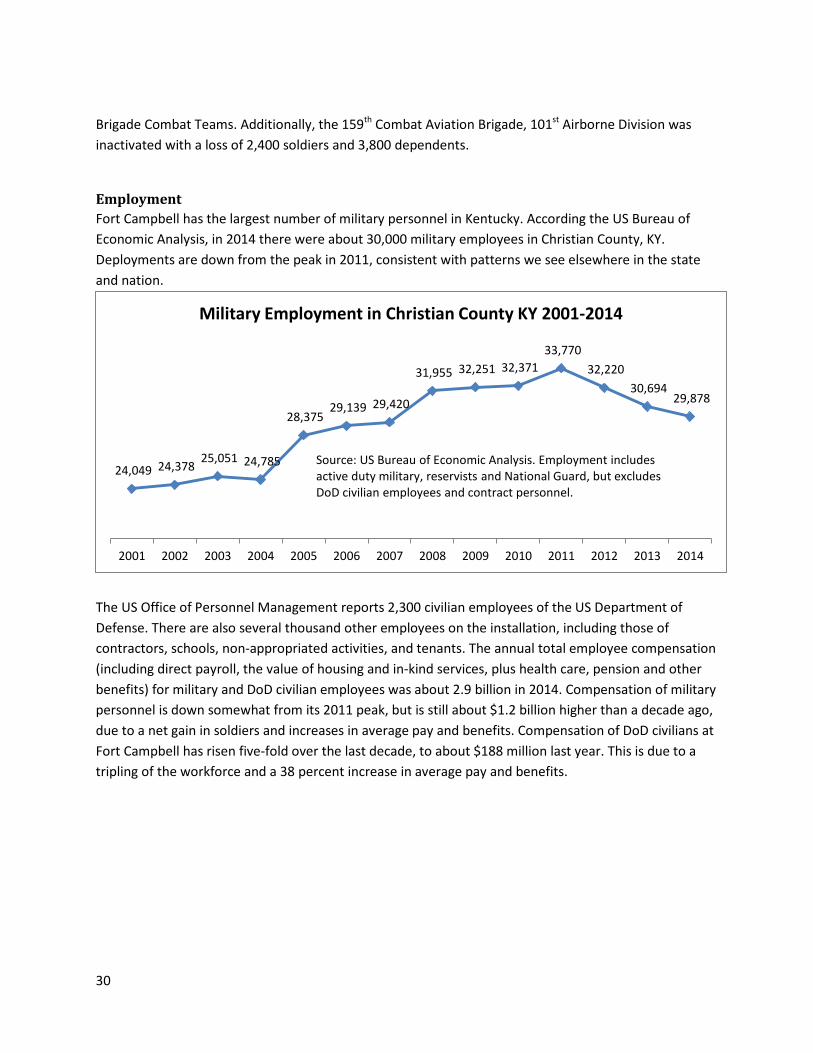
Employment Fort Campbell has the largest number of military personnel in Kentucky. According the US Bureau of Economic Analysis, in 2014 there were about 30,000 military employees in Christian County, KY. Deployments are down from the peak in 2011, consistent with patterns we see elsewhere in the state and nation.
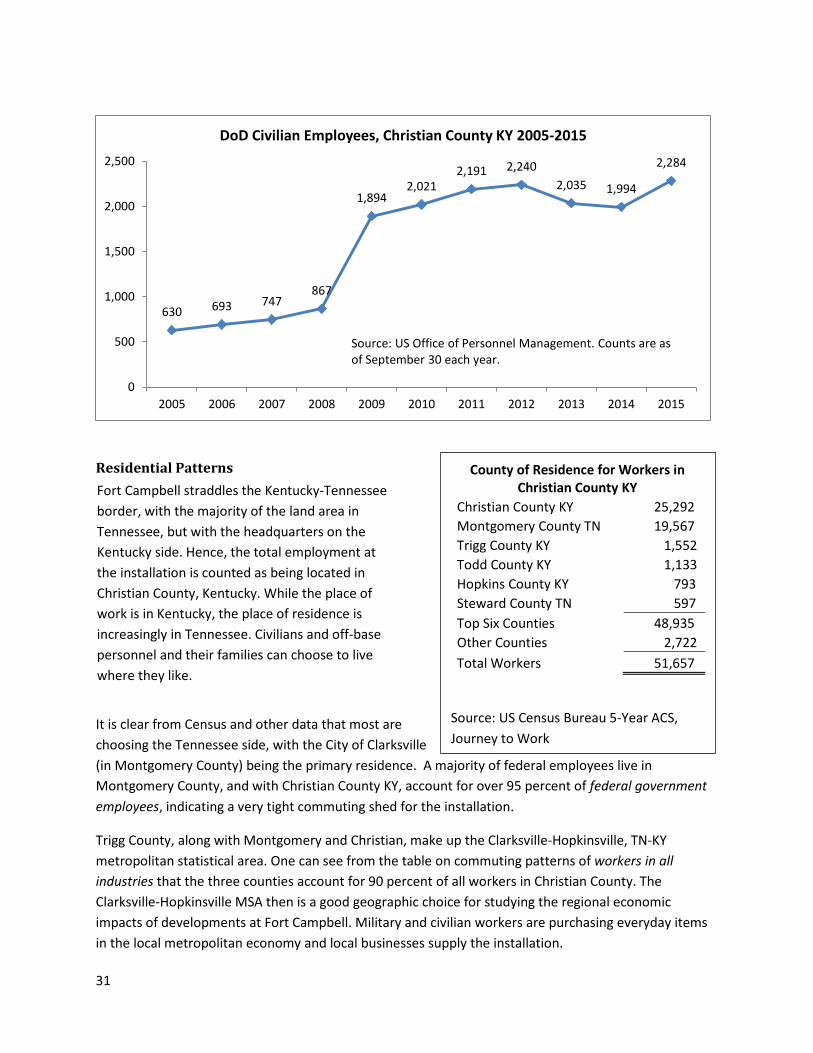
The US Office of Personnel Management reports 2,300 civilian employees of the US Department of Defense. There are also several thousand other employees on the installation, including those of contractors, schools, non-appropriated activities, and tenants. The annual total employee compensation (including direct payroll, the value of housing and in-kind services, plus health care, pension and other benefits) for military and DoD civilian employees was about 2.9 billion in 2014. Compensation of military personnel is down somewhat from its 2011 peak, but is still about $1.2 billion higher than a decade ago, due to a net gain in soldiers and increases in average pay and benefits. Compensation of DoD civilians at Fort Campbell has risen five-fold over the last decade, to about $188 million last year. This is due to a tripling of the workforce and a 38 percent increase in average pay and benefits.
24,049 24,378 25,051 24,785
28,375 29,139 29,420
31,955 32,251 32,371 33,770
32,220 30,694
29,878
2001 2002 2003 2004 2005 2006 2007 2008 2009 2010 2011 2012 2013 2014
Military Employment in Christian County KY 2001-2014
Source: US Bureau of Economic Analysis. Employment includes active duty military, reservists and National Guard, but excludes DoD civilian employees and contract personnel.
31
Residential Patterns
It is clear from Census and other data that most are choosing the Tennessee side, with the City of Clarksville (in Montgomery County) being the primary residence. A majority of federal employees live in Montgomery County, and with Christian County KY, account for over 95 percent of federal government employees, indicating a very tight commuting shed for the installation.
Trigg County, along with Montgomery and Christian, make up the Clarksville-Hopkinsville, TN-KY metropolitan statistical area. One can see from the table on commuting patterns of workers in all industries that the three counties account for 90 percent of all workers in Christian County. The Clarksville-Hopkinsville MSA then is a good geographic choice for studying the regional economic impacts of developments at Fort Campbell. Military and civilian workers are purchasing everyday items in the local metropolitan economy and local businesses supply the installation.
630 693 747 867
1,894 2,021
2,191 2,240 2,035 1,994
2,284
0
500
1,000
1,500
2,000
2,500
2005 2006 2007 2008 2009 2010 2011 2012 2013 2014 2015
DoD Civilian Employees, Christian County KY 2005-2015
Source: US Office of Personnel Management. Counts are as of September 30 each year.
Fort Campbell straddles the Kentucky-Tennessee border, with the majority of the land area in Tennessee, but with the headquarters on the Kentucky side. Hence, the total employment at the installation is counted as being located in Christian County, Kentucky. While the place of work is in Kentucky, the place of residence is increasingly in Tennessee. Civilians and off-base personnel and their families can choose to live where they like.
County of Residence for Workers in Christian County KY
Christian County KY 25,292 Montgomery County TN 19,567 Trigg County KY 1,552 Todd County KY 1,133 Hopkins County KY 793 Steward County TN 597 Top Six Counties 48,935 Other Counties 2,722 Total Workers 51,657
Source: US Census Bureau 5-Year ACS, Journey to Work
32
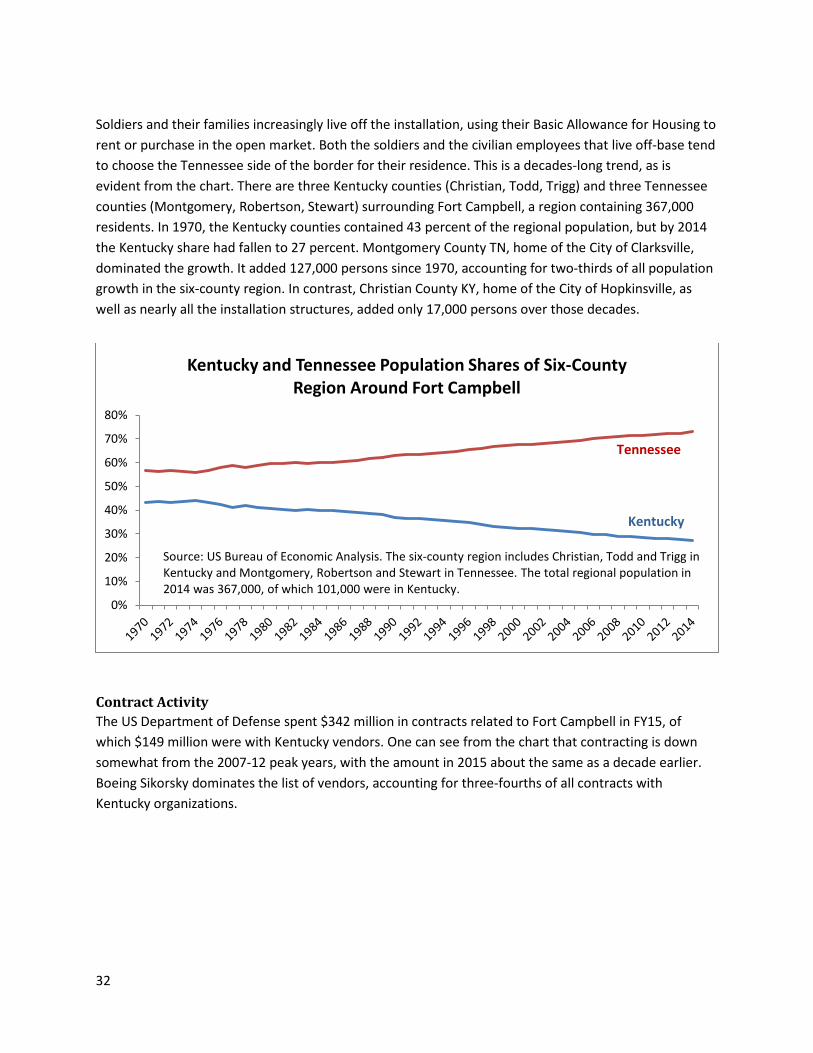
Soldiers and their families increasingly live off the installation, using their Basic Allowance for Housing to rent or purchase in the open market. Both the soldiers and the civilian employees that live off-base tend to choose the Tennessee side of the border for their residence. This is a decades-long trend, as is evident from the chart. There are three Kentucky counties (Christian, Todd, Trigg) and three Tennessee counties (Montgomery, Robertson, Stewart) surrounding Fort Campbell, a region containing 367,000 residents. In 1970, the Kentucky counties contained 43 percent of the regional population, but by 2014 the Kentucky share had fallen to 27 percent. Montgomery County TN, home of the City of Clarksville, dominated the growth. It added 127,000 persons since 1970, accounting for two-thirds of all population growth in the six-county region. In contrast, Christian County KY, home of the City of Hopkinsville, as well as nearly all the installation structures, added only 17,000 persons over those decades.
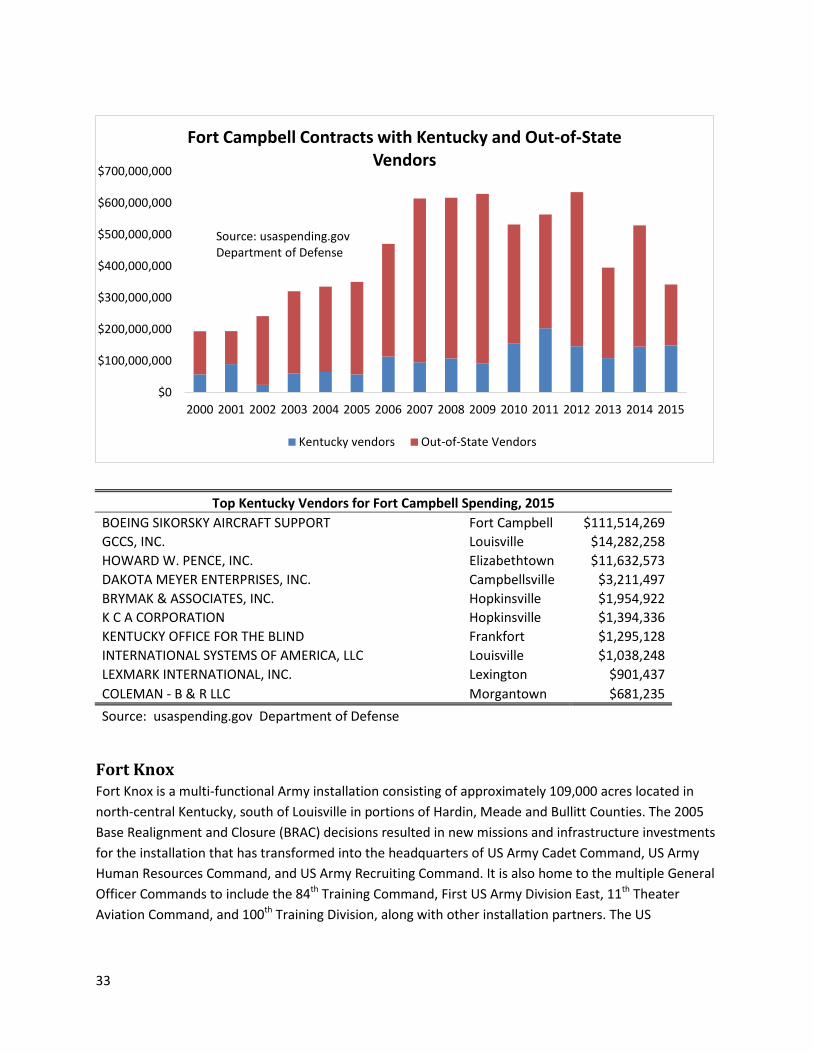
Contract Activity The US Department of Defense spent $342 million in contracts related to Fort Campbell in FY15, of which $149 million were with Kentucky vendors. One can see from the chart that contracting is down somewhat from the 2007-12 peak years, with the amount in 2015 about the same as a decade earlier. Boeing Sikorsky dominates the list of vendors, accounting for three-fourths of all contracts with Kentucky organizations.
0%
10%
20%
30%
40%
50%
60%
70%
80%
Kentucky and Tennessee Population Shares of Six-County Region Around Fort Campbell
Tennessee
Kentucky
Source: US Bureau of Economic Analysis. The six-county region includes Christian, Todd and Trigg in Kentucky and Montgomery, Robertson and Stewart in Tennessee. The total regional population in 2014 was 367,000, of which 101,000 were in Kentucky.
33
Top Kentucky Vendors for Fort Campbell Spending, 2015 BOEING SIKORSKY AIRCRAFT SUPPORT Fort Campbell $111,514,269 GCCS, INC. Louisville $14,282,258 HOWARD W. PENCE, INC. Elizabethtown $11,632,573 DAKOTA MEYER ENTERPRISES, INC. Campbellsville $3,211,497 BRYMAK & ASSOCIATES, INC. Hopkinsville $1,954,922 K C A CORPORATION Hopkinsville $1,394,336 KENTUCKY OFFICE FOR THE BLIND Frankfort $1,295,128 INTERNATIONAL SYSTEMS OF AMERICA, LLC Louisville $1,038,248 LEXMARK INTERNATIONAL, INC. Lexington $901,437 COLEMAN - B & R LLC Morgantown $681,235 Source: usaspending.gov Department of Defense
Fort Knox Fort Knox is a multi-functional Army installation consisting of approximately 109,000 acres located in north-central Kentucky, south of Louisville in portions of Hardin, Meade and Bullitt Counties. The 2005 Base Realignment and Closure (BRAC) decisions resulted in new missions and infrastructure investments for the installation that has transformed into the headquarters of US Army Cadet Command, US Army Human Resources Command, and US Army Recruiting Command. It is also home to the multiple General Officer Commands to include the 84th Training Command, First US Army Division East, 11th Theater Aviation Command, and 100th Training Division, along with other installation partners. The US
$0
$100,000,000
$200,000,000
$300,000,000
$400,000,000
$500,000,000
$600,000,000
$700,000,000
2000 2001 2002 2003 2004 2005 2006 2007 2008 2009 2010 2011 2012 2013 2014 2015
Fort Campbell Contracts with Kentucky and Out-of-State Vendors
Kentucky vendors Out-of-State Vendors
Source: usaspending.gov Department of Defense
34
Department of Defense provides an online fact sheet for Fort Knox, which further describes the installation activity.
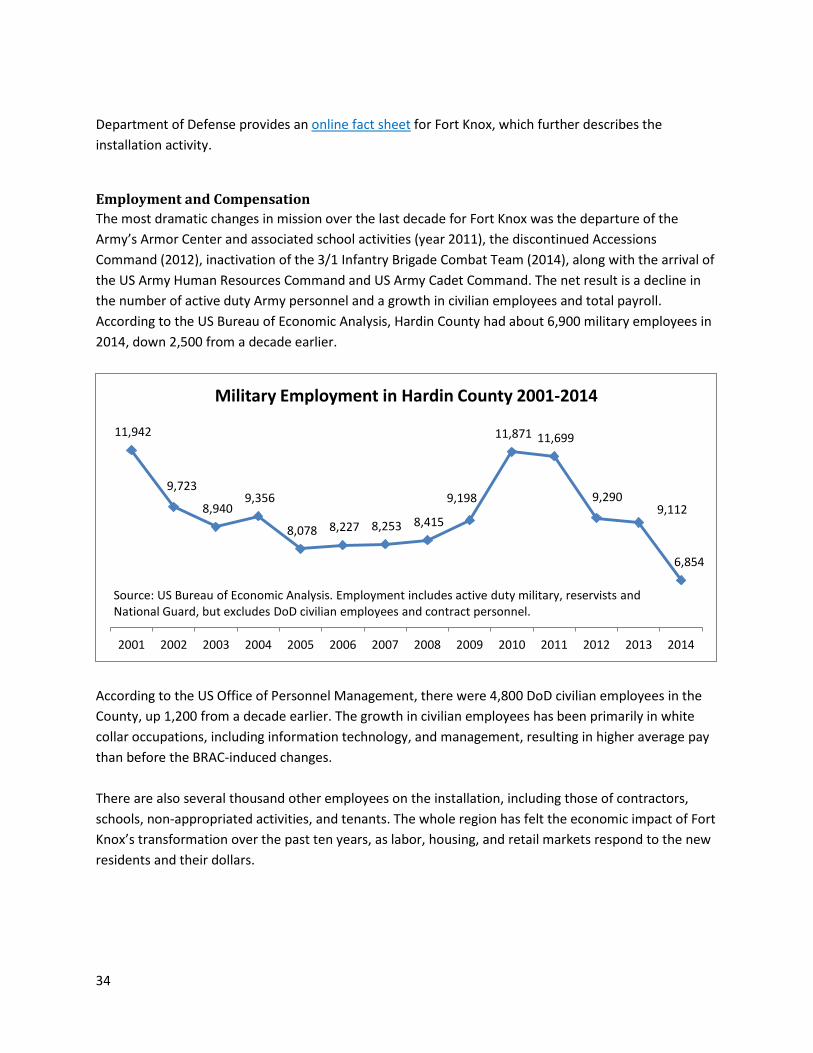
Employment and Compensation The most dramatic changes in mission over the last decade for Fort Knox was the departure of the Army’s Armor Center and associated school activities (year 2011), the discontinued Accessions Command (2012), inactivation of the 3/1 Infantry Brigade Combat Team (2014), along with the arrival of the US Army Human Resources Command and US Army Cadet Command. The net result is a decline in the number of active duty Army personnel and a growth in civilian employees and total payroll. According to the US Bureau of Economic Analysis, Hardin County had about 6,900 military employees in 2014, down 2,500 from a decade earlier.
According to the US Office of Personnel Management, there were 4,800 DoD civilian employees in the County, up 1,200 from a decade earlier. The growth in civilian employees has been primarily in white collar occupations, including information technology, and management, resulting in higher average pay than before the BRAC-induced changes. There are also several thousand other employees on the installation, including those of contractors, schools, non-appropriated activities, and tenants. The whole region has felt the economic impact of Fort Knox’s transformation over the past ten years, as labor, housing, and retail markets respond to the new residents and their dollars.
11,942
9,723
8,940 9,356
8,078 8,227 8,253 8,415
9,198
11,871 11,699
9,290 9,112
6,854
2001 2002 2003 2004 2005 2006 2007 2008 2009 2010 2011 2012 2013 2014
Military Employment in Hardin County 2001-2014
Source: US Bureau of Economic Analysis. Employment includes active duty military, reservists and National Guard, but excludes DoD civilian employees and contract personnel.
35
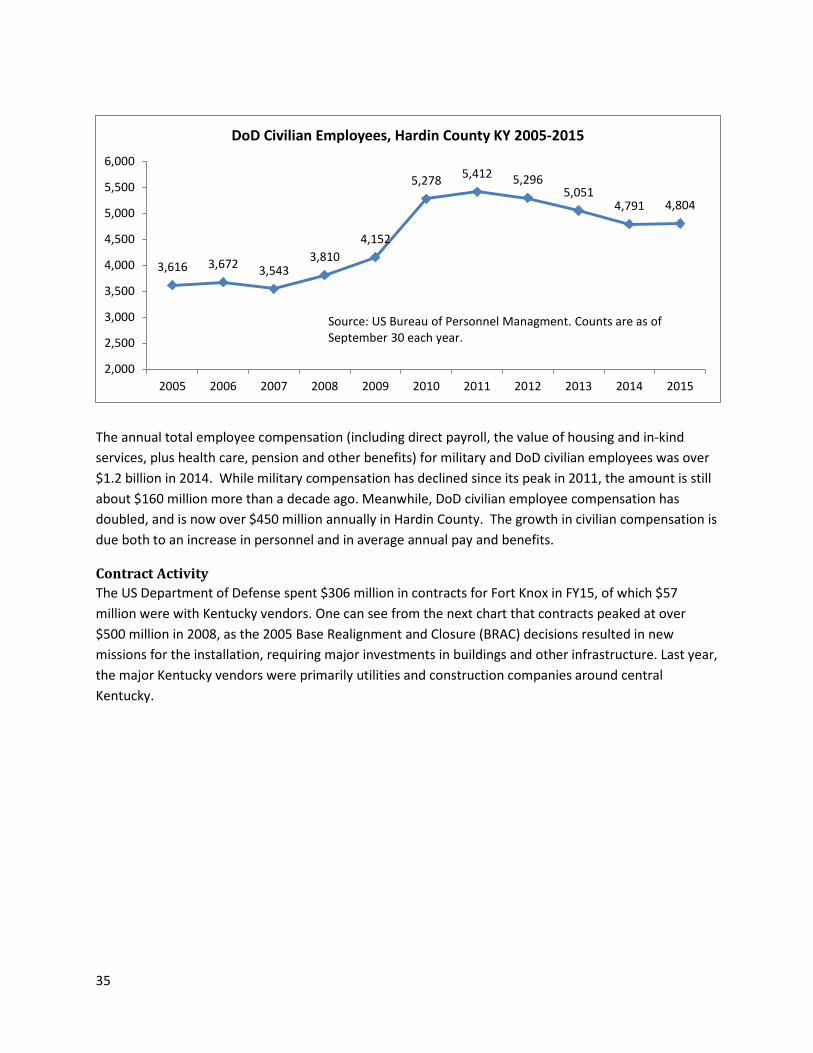
The annual total employee compensation (including direct payroll, the value of housing and in-kind services, plus health care, pension and other benefits) for military and DoD civilian employees was over $1.2 billion in 2014. While military compensation has declined since its peak in 2011, the amount is still about $160 million more than a decade ago. Meanwhile, DoD civilian employee compensation has doubled, and is now over $450 million annually in Hardin County. The growth in civilian compensation is due both to an increase in personnel and in average annual pay and benefits.
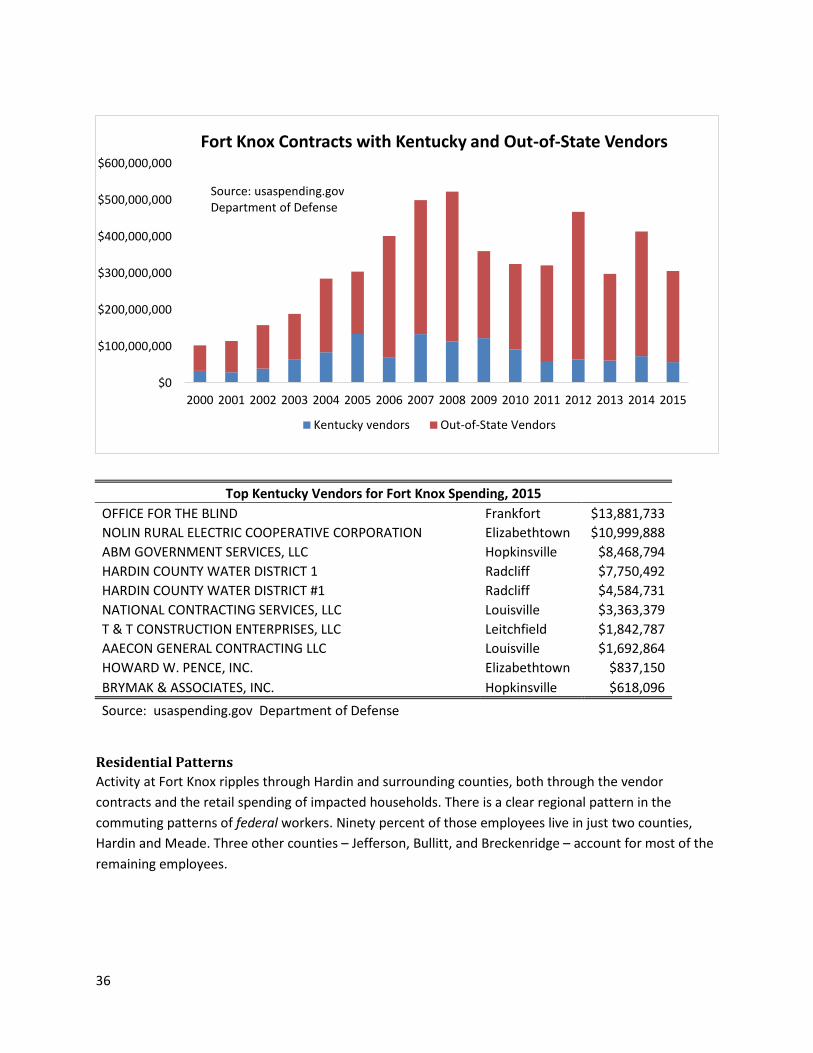
Contract Activity The US Department of Defense spent $306 million in contracts for Fort Knox in FY15, of which $57 million were with Kentucky vendors. One can see from the next chart that contracts peaked at over $500 million in 2008, as the 2005 Base Realignment and Closure (BRAC) decisions resulted in new missions for the installation, requiring major investments in buildings and other infrastructure. Last year, the major Kentucky vendors were primarily utilities and construction companies around central Kentucky.
3,616 3,672 3,543 3,810
4,152
5,278 5,412 5,296 5,051
4,791 4,804
2,000
2,500
3,000
3,500
4,000
4,500
5,000
5,500
6,000
2005 2006 2007 2008 2009 2010 2011 2012 2013 2014 2015
DoD Civilian Employees, Hardin County KY 2005-2015
Source: US Bureau of Personnel Managment. Counts are as of September 30 each year.
36
Top Kentucky Vendors for Fort Knox Spending, 2015 OFFICE FOR THE BLIND Frankfort $13,881,733 NOLIN RURAL ELECTRIC COOPERATIVE CORPORATION Elizabethtown $10,999,888 ABM GOVERNMENT SERVICES, LLC Hopkinsville $8,468,794 HARDIN COUNTY WATER DISTRICT 1 Radcliff $7,750,492 HARDIN COUNTY WATER DISTRICT #1 Radcliff $4,584,731 NATIONAL CONTRACTING SERVICES, LLC Louisville $3,363,379 T & T CONSTRUCTION ENTERPRISES, LLC Leitchfield $1,842,787 AAECON GENERAL CONTRACTING LLC Louisville $1,692,864 HOWARD W. PENCE, INC. Elizabethtown $837,150 BRYMAK & ASSOCIATES, INC. Hopkinsville $618,096 Source: usaspending.gov Department of Defense
Residential Patterns Activity at Fort Knox ripples through Hardin and surrounding counties, both through the vendor contracts and the retail spending of impacted households. There is a clear regional pattern in the commuting patterns of federal workers. Ninety percent of those employees live in just two counties, Hardin and Meade. Three other counties – Jefferson, Bullitt, and Breckenridge – account for most of the remaining employees.
$0
$100,000,000
$200,000,000
$300,000,000
$400,000,000
$500,000,000
$600,000,000
2000 2001 2002 2003 2004 2005 2006 2007 2008 2009 2010 2011 2012 2013 2014 2015
Fort Knox Contracts with Kentucky and Out-of-State Vendors
Kentucky vendors Out-of-State Vendors
Source: usaspending.gov Department of Defense
37
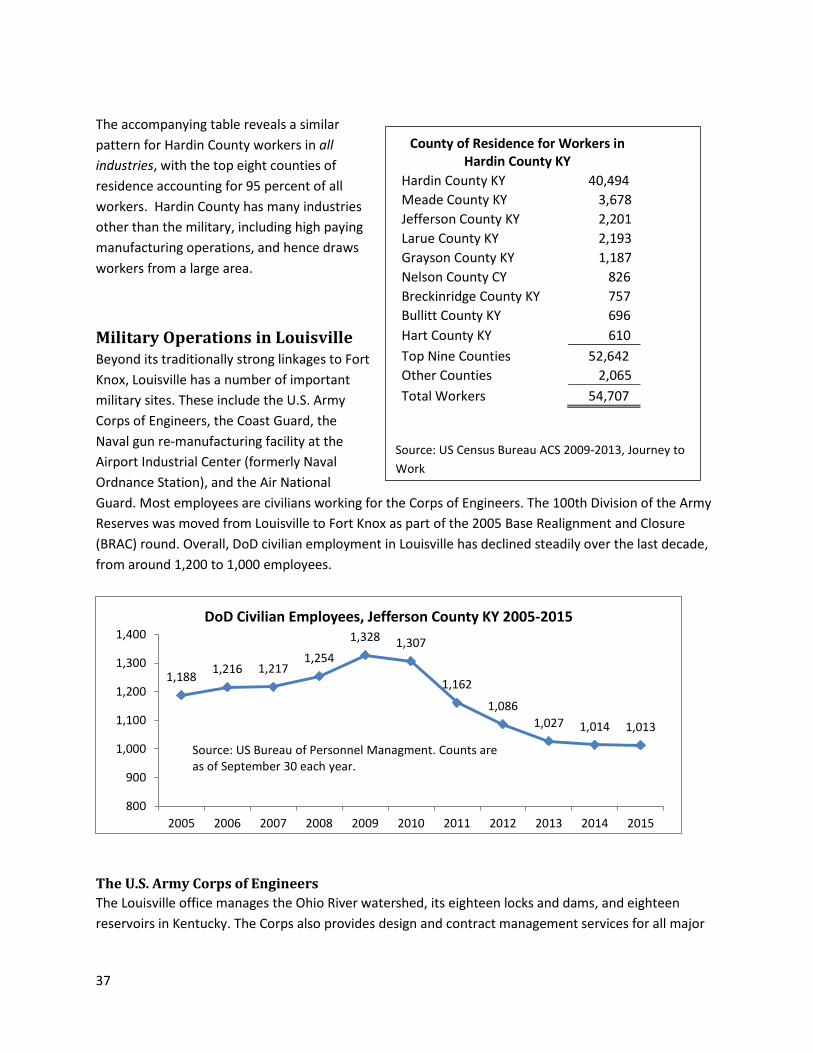
The accompanying table reveals a similar pattern for Hardin County workers in all industries, with the top eight counties of residence accounting for 95 percent of all workers. Hardin County has many industries other than the military, including high paying manufacturing operations, and hence draws workers from a large area.
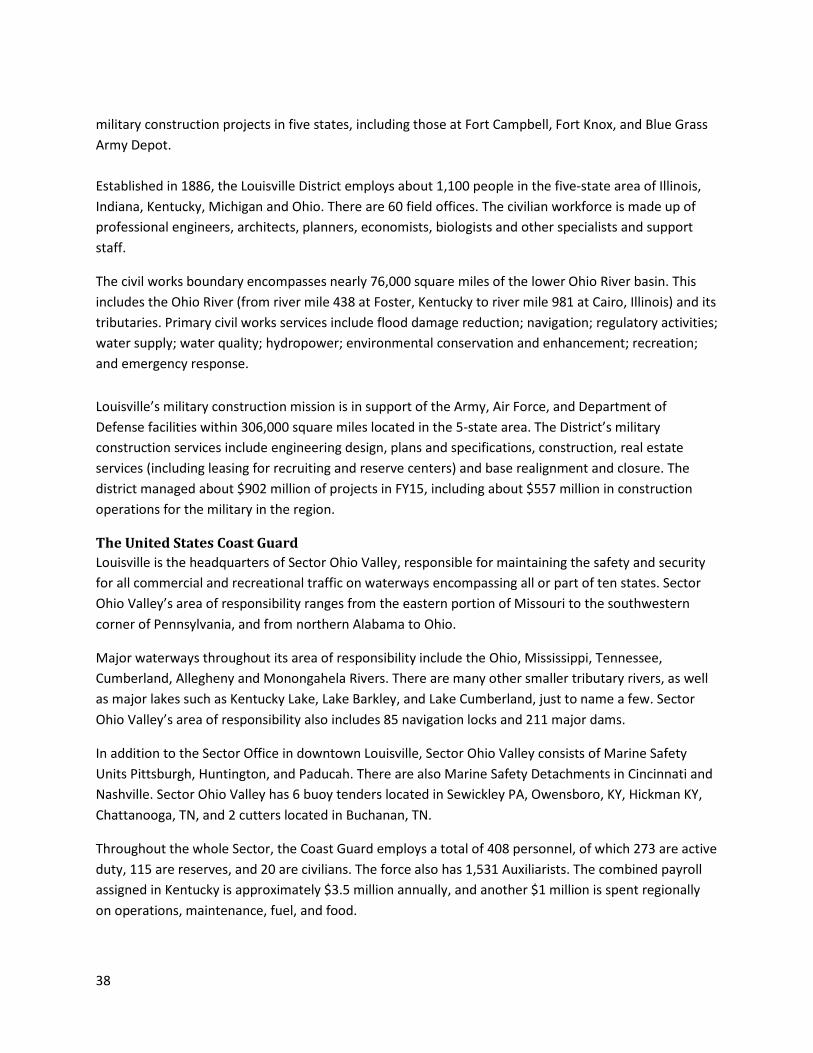
Military Operations in Louisville Beyond its traditionally strong linkages to Fort Knox, Louisville has a number of important military sites. These include the U.S. Army Corps of Engineers, the Coast Guard, the Naval gun re-manufacturing facility at the Airport Industrial Center (formerly Naval Ordnance Station), and the Air National Guard. Most employees are civilians working for the Corps of Engineers. The 100th Division of the Army Reserves was moved from Louisville to Fort Knox as part of the 2005 Base Realignment and Closure (BRAC) round. Overall, DoD civilian employment in Louisville has declined steadily over the last decade, from around 1,200 to 1,000 employees.
The U.S. Army Corps of Engineers The Louisville office manages the Ohio River watershed, its eighteen locks and dams, and eighteen reservoirs in Kentucky. The Corps also provides design and contract management services for all major
1,188 1,216 1,217 1,254
1,328 1,307
1,162
1,086 1,027 1,014 1,013
800
900
1,000
1,100
1,200
1,300
1,400
2005 2006 2007 2008 2009 2010 2011 2012 2013 2014 2015
DoD Civilian Employees, Jefferson County KY 2005-2015
Source: US Bureau of Personnel Managment. Counts are as of September 30 each year.
County of Residence for Workers in Hardin County KY
Hardin County KY 40,494 Meade County KY 3,678 Jefferson County KY 2,201 Larue County KY 2,193 Grayson County KY 1,187 Nelson County CY 826 Breckinridge County KY 757 Bullitt County KY 696 Hart County KY 610 Top Nine Counties 52,642 Other Counties 2,065 Total Workers 54,707
Source: US Census Bureau ACS 2009-2013, Journey to Work
38
military construction projects in five states, including those at Fort Campbell, Fort Knox, and Blue Grass Army Depot. Established in 1886, the Louisville District employs about 1,100 people in the five-state area of Illinois, Indiana, Kentucky, Michigan and Ohio. There are 60 field offices. The civilian workforce is made up of professional engineers, architects, planners, economists, biologists and other specialists and support staff.
The civil works boundary encompasses nearly 76,000 square miles of the lower Ohio River basin. This includes the Ohio River (from river mile 438 at Foster, Kentucky to river mile 981 at Cairo, Illinois) and its tributaries. Primary civil works services include flood damage reduction; navigation; regulatory activities; water supply; water quality; hydropower; environmental conservation and enhancement; recreation; and emergency response. Louisville’s military construction mission is in support of the Army, Air Force, and Department of Defense facilities within 306,000 square miles located in the 5-state area. The District’s military construction services include engineering design, plans and specifications, construction, real estate services (including leasing for recruiting and reserve centers) and base realignment and closure. The district managed about $902 million of projects in FY15, including about $557 million in construction operations for the military in the region.
The United States Coast Guard Louisville is the headquarters of Sector Ohio Valley, responsible for maintaining the safety and security for all commercial and recreational traffic on waterways encompassing all or part of ten states. Sector Ohio Valley’s area of responsibility ranges from the eastern portion of Missouri to the southwestern corner of Pennsylvania, and from northern Alabama to Ohio.
Major waterways throughout its area of responsibility include the Ohio, Mississippi, Tennessee, Cumberland, Allegheny and Monongahela Rivers. There are many other smaller tributary rivers, as well as major lakes such as Kentucky Lake, Lake Barkley, and Lake Cumberland, just to name a few. Sector Ohio Valley’s area of responsibility also includes 85 navigation locks and 211 major dams.
In addition to the Sector Office in downtown Louisville, Sector Ohio Valley consists of Marine Safety Units Pittsburgh, Huntington, and Paducah. There are also Marine Safety Detachments in Cincinnati and Nashville. Sector Ohio Valley has 6 buoy tenders located in Sewickley PA, Owensboro, KY, Hickman KY, Chattanooga, TN, and 2 cutters located in Buchanan, TN.
Throughout the whole Sector, the Coast Guard employs a total of 408 personnel, of which 273 are active duty, 115 are reserves, and 20 are civilians. The force also has 1,531 Auxiliarists. The combined payroll assigned in Kentucky is approximately $3.5 million annually, and another $1 million is spent regionally on operations, maintenance, fuel, and food.
39
An agency of the US Department of Homeland Security, the U.S. Coast Guard is tasked with conducting search and rescue operations, environmental protection, port and waterways management (including aids to navigation, vessel traffic systems, and general port safety), drug interdiction, and illegal migrant interdiction. Sector Ohio Valley primarily focuses on aids to navigation, search and rescue, and maritime safety, security, and environmental protection. Kentucky has over a century of Coast Guard history, dating back to an 1881 life boat station in Louisville.
Military Operations in Central Kentucky There are two major military operations in central Kentucky – the Blue Grass Army Depot in Richmond, and the Bluegrass Station industrial park in Lexington.
Blue Grass Army Depot The Blue Grass Army Depot (BGAD) located near Richmond, KY is a multifunctional installation that is home to varied organizations and missions focused on either conventional munitions or chemical weapons.
BGAD performs a variety of standard depot operations surrounding conventional (non-chemical) and non-standard munitions, to include receiving, shipping, storing, renovating, maintaining and demilitarizing (destroying) a complete range of bullets and bombs. It is the primary munitions depot serving Army units in the Southeast U.S. region with its command headquarters’ Joint Munitions Command. BGAD also provides munitions to U.S. military services around the world, supported by its reporting units Anniston Munitions Center (ANMC) in Alabama and Scranton Army Ammunition Plant (SCAAP) in Pennsylvania. Additionally, BGAD is the sole-source provider of chemical defense equipment (protective suits and masks) to the Army. Although commanded by an Army Colonel, the BGAD workforce is comprised of federal civilian employees.
BGAD also is home to tenants Blue Grass Chemical Activity (BGCA) and the Blue Grass Chemical Agent-destruction Pilot Plant (BGCAPP).
BGCA, under the Army’s Chemical Materials Activity (CMA), is responsible for the secure and safe storage of 523 tons of chemical weapons, including nerve agents GB and VS, and mustard agent in projectiles, warheads and rockets.
BGCAPP, under the Department of Defense’s Assembled Chemical Weapons Alternatives (ACWA) program, is responsible for construction of a chemical demilitarization plant and the eventual safe and effective destruction in accordance with international treaty of the country’s last remaining stockpile of banned chemical weapons. The destruction technology is known as neutralization followed supercritical water oxidation or SCWO. Operations to destroy the mustard rounds are scheduled to begin in 2017, with main plant operations to destroy the nerve agent scheduled to begin in 2020. Construction of the plan was essentially completed in 2015. Since the chemical plant construction began, more than $153 million has been spent with Kentucky companies and more than $90 million with companies in Madison or surrounding counties. Payroll to date (December 2015) has been nearly $800 million.
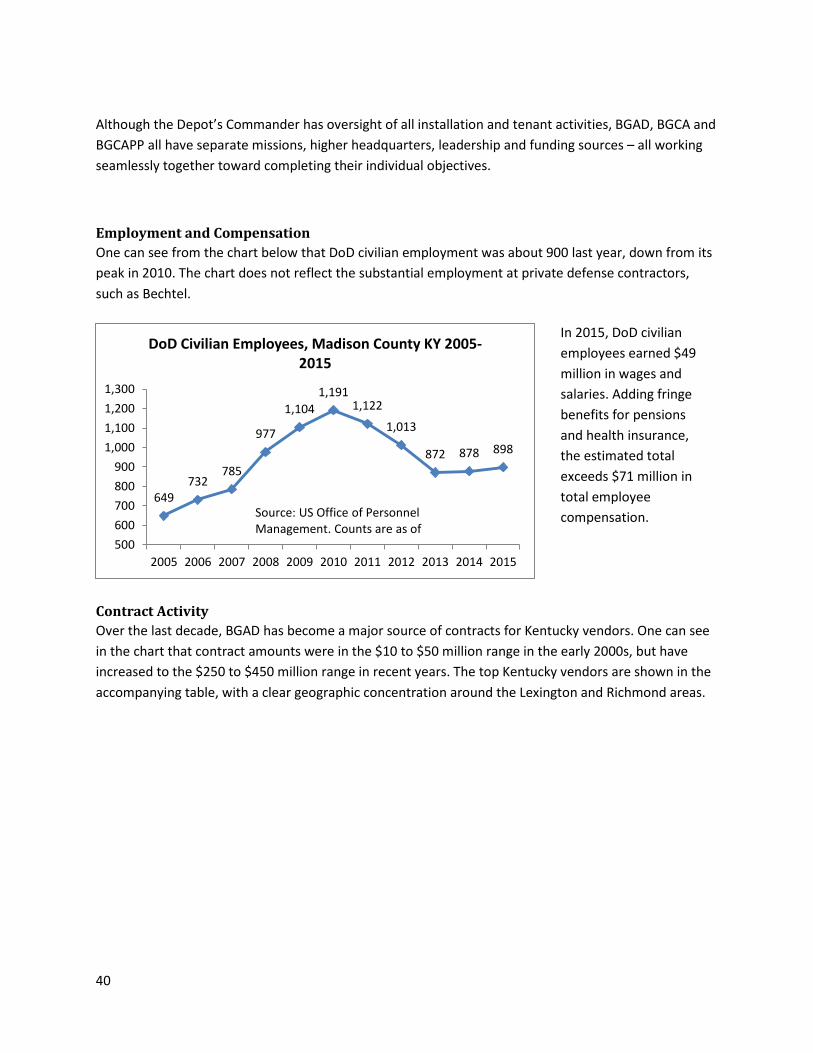
40
Although the Depot’s Commander has oversight of all installation and tenant activities, BGAD, BGCA and BGCAPP all have separate missions, higher headquarters, leadership and funding sources – all working seamlessly together toward completing their individual objectives.
Employment and Compensation One can see from the chart below that DoD civilian employment was about 900 last year, down from its peak in 2010. The chart does not reflect the substantial employment at private defense contractors, such as Bechtel.
Contract Activity Over the last decade, BGAD has become a major source of contracts for Kentucky vendors. One can see in the chart that contract amounts were in the $10 to $50 million range in the early 2000s, but have increased to the $250 to $450 million range in recent years. The top Kentucky vendors are shown in the accompanying table, with a clear geographic concentration around the Lexington and Richmond areas.
649 732
785
977
1,104 1,191
1,122
1,013
872 878 898
500600700800900
1,0001,1001,2001,300
2005 2006 2007 2008 2009 2010 2011 2012 2013 2014 2015
DoD Civilian Employees, Madison County KY 2005-2015
Source: US Office of Personnel Management. Counts are as of
In 2015, DoD civilian employees earned $49 million in wages and salaries. Adding fringe benefits for pensions and health insurance, the estimated total exceeds $71 million in total employee compensation.
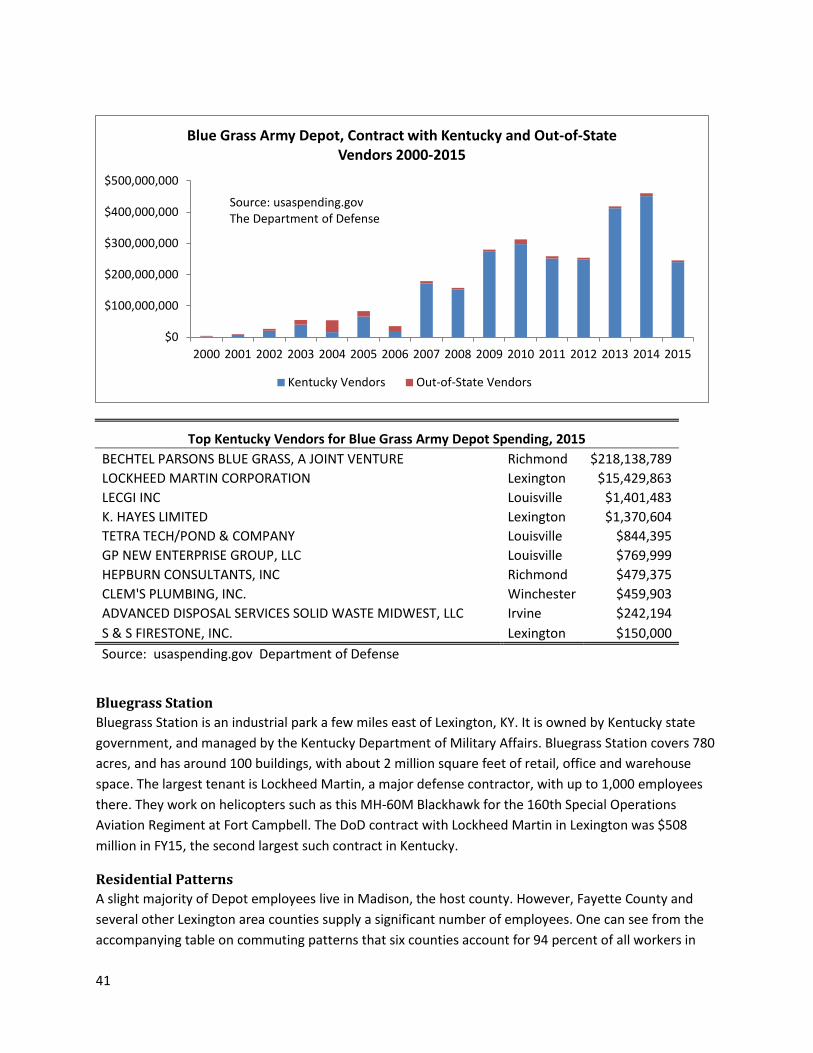
41
Top Kentucky Vendors for Blue Grass Army Depot Spending, 2015 BECHTEL PARSONS BLUE GRASS, A JOINT VENTURE Richmond $218,138,789 LOCKHEED MARTIN CORPORATION Lexington $15,429,863 LECGI INC Louisville $1,401,483 K. HAYES LIMITED Lexington $1,370,604 TETRA TECH/POND & COMPANY Louisville $844,395 GP NEW ENTERPRISE GROUP, LLC Louisville $769,999 HEPBURN CONSULTANTS, INC Richmond $479,375 CLEM'S PLUMBING, INC. Winchester $459,903 ADVANCED DISPOSAL SERVICES SOLID WASTE MIDWEST, LLC Irvine $242,194 S & S FIRESTONE, INC. Lexington $150,000 Source: usaspending.gov Department of Defense
Bluegrass Station Bluegrass Station is an industrial park a few miles east of Lexington, KY. It is owned by Kentucky state government, and managed by the Kentucky Department of Military Affairs. Bluegrass Station covers 780 acres, and has around 100 buildings, with about 2 million square feet of retail, office and warehouse space. The largest tenant is Lockheed Martin, a major defense contractor, with up to 1,000 employees there. They work on helicopters such as this MH-60M Blackhawk for the 160th Special Operations Aviation Regiment at Fort Campbell. The DoD contract with Lockheed Martin in Lexington was $508 million in FY15, the second largest such contract in Kentucky.
Residential Patterns A slight majority of Depot employees live in Madison, the host county. However, Fayette County and several other Lexington area counties supply a significant number of employees. One can see from the accompanying table on commuting patterns that six counties account for 94 percent of all workers in
$0
$100,000,000
$200,000,000
$300,000,000
$400,000,000
$500,000,000
2000 2001 2002 2003 2004 2005 2006 2007 2008 2009 2010 2011 2012 2013 2014 2015
Blue Grass Army Depot, Contract with Kentucky and Out-of-State Vendors 2000-2015
Kentucky Vendors Out-of-State Vendors
Source: usaspending.gov The Department of Defense
42
Madison County. The link with Lexington is clear, given that it supplies the largest number of nonresident workers to Madison. Rockcastle County is next, and together with Madison defines the Richmond Micropolitan Statistical Area. Estill, Jackson, and Garrard counties are not part of any metropolitan or micropolitan area, yet clearly supply a lot of workers to Madison County.
Bluegrass Station is in Fayette County and has contract links to BGAD. Since the Lexington and Richmond market areas are adjacent and intimately linked through industrial vendors and employee commuting, one can think of the combined region as the primary impact area for changes in activity at BGAD or Bluegrass Station: Richmond micropolitan statistical area (Madison and Rockcastle counties), the three more rural counties (Estill, Jackson, Garrard), and the Lexington metropolitan statistical area (Bourbon, Clark, Fayette, Jessamine, Scott and Woodford counties).
Economic and Fiscal Impacts of Changes in Military Activity Military activity has a direct and quantifiable impact where dollars are first received - soldiers’ pay, pension checks, defense contracts awarded, and the like. However, the total economic impact is significantly greater. Soldiers and civilians working at the installations spend much of their military pay in surrounding local economies. The installations spend millions with local vendors for maintenance, utilities, food, and supplies. Kentucky defense contractors use local subcontractors to perform some of the work. Their employees spend their military-induced incomes throughout the region. And much of the income of all of these workers and retirees ends up in the pockets of grocery stores, restaurants, car dealerships, hospitals, law firms, banks, insurance companies, and construction firms, all of whom re-spend the dollars.
Economists have developed models to estimate the spinoff effects of changes in activity for any industry in a region. The most popular impact models are called input-output models, and these are capable of predicting the effects of changes in activity for any of 500 local industries, as well as household and other spending. These models are the basis for economic multipliers, commonly used to predict the additional inter-industry and household spending impacts of a change in activity in, for example, the local military sector. We have developed such models for regional economies around Kentucky, and use them to provide illustrative impact statements. In this section, we describe the models and then use them to make some estimates of the impact of recent changes in military activity.
43
Caveats about Economic Impact Statements
Some people believe it is valid to treat all federal spending in Kentucky as new dollars that create additional multiplier effects throughout the state. Thus if the federal government spent $2 billion on military payrolls in Kentucky, and models predict a multiplier of 1.5, the total payroll impact would be $3 billion. This is not a defensible exercise, for several reasons. First, treating the federal spending as new dollars to Kentucky ignores where the dollars come from. Kentuckians pay federal taxes to support the military, and to be consistent one would have to take account of the negative impact of tax dollars flowing out of the state. For tax year 2013, Kentuckians paid $10.2 billion in individual income taxes to the federal government.* This amounts to 0.83 percent of all individual income tax payments to the federal government. Applying that percentage to the 607.8 billion in Department of Defense expenditures in 2013 implies that Kentuckians paid for about $5.1 billion of that.** So, to analyze the economic impact of the total spending, one should examine the net of what comes in minus what goes out. Second, there are inherent limitations in our regional impact models that prevent making reliable predictions from very large changes in industrial activity. Regional input-output models, which are the primary tool for impact studies, represent well the linkages among industries and can predict how modest changes in one industry ripple through other industries and across households. But when major changes occur, the static nature of the models makes the tool inadequate to answer the question. For example, if an installation were lost as a result of base realignment and closure, regional input-output models could predict the immediate annual loss of jobs and payroll in the region. But they could not predict the dynamic economic pattern of events that would follow. How many military people would choose to stay in the region, starting other businesses? What would happen to regional wage rates, and how would that impact local business hiring? What would happen to home prices, and how would that impact regional affordability? How might a massive military complex be redeveloped, as an industrial park, a civilian city, a resort? We simply do not have the tools to accurately predict these dynamic changes. Thus, simply applying economic multipliers to huge economic changes is not defensible.
* See IRS Statistics of Income, Table 2. Individual Income and Tax Data, by State .
** See Economic Report of the President, 2015, Table B-21 For federal defense expenditures by fiscal year.
44
The Military Production Process The “production process” at Fort Campbell and Fort Knox primarily involves training soldiers and managing information. Soldiers use vehicles, fire weapons, drill on practice landscapes, learn military doctrine and use traditional classroom materials to train for the battlefield. The vehicles, weapons, computers and books are supplied by the Department of Defense, which in turn acquires these from the private sector through central purchasing. The US Army Human Resources Command at Fort Knox needs telecommunications and computer equipment, software, office furniture and supplies, utilities and travel support.
Some major purchases are handled centrally by the Defense Department and some are handled by the installation procurement office. While companies in the Fort Campbell and Fort Knox region are able to bid on these requirements, there is no real advantage to proximity except for purchases of high frequency (utilities, building maintenance services) and perishable items (food service). Of course, major defense contractors maintain offices and staff on the installation to manage projects with the military. Active duty military personnel receive a basic monthly salary and, except those living in barracks, and also receive basic allowances for housing and subsistence. Soldiers in barracks receive housing and meals directly from the Army. Using some reasonable assumptions about the mixture of enlistees, officers, dependents, and rank, we estimate that these allowances add on average 38 percent to the basic pay of military personnel.
Except for the solider living in barracks, military personnel can spend their basic allowance for housing (BAH) on or off installation. Housing operations on Fort Knox and Fort Campbell are carried out today through a public-private partnership made possible by the Military Housing Privatization Initiative. MHPI is a tool to help the military improve its installation housing inventory in an efficient and expedient manner through private sector financing, expertise and innovation. For example, Lendlease is the private sector "partner" at Fort Campbell and Fort Knox. The homes are on federal property and are not liable for property taxes to state and local government. The Lendlease employees are private sector civilians and liable for state income taxes on their wages and salaries.
Similarly, the Army and Air Force Exchange Services (AAFES) provides merchandise and services to active duty and retired military personnel and their families. This includes the installation exchange, where members can purchase food, alcohol, clothing, and supplies at an average 20 percent discount from market prices. AAFES also runs gasoline stations and fast food restaurants. Net earnings from the sales are distributed back to Army Morale, Welfare and Recreation (MWR), which in turn provides other installation services like child care, bowling alleys, golf courses, libraries, gyms, full service restaurants and hotels. Members pay for these services, but prices are generally below those in the private market.
The major organizations (AAFES, MWR) providing services on site are called non-appropriated funds (NAF), since their financial viability is not guaranteed directly by the federal government. They charge members for goods and services, and use the funds to pay for materials, facilities, and labor. Twenty-
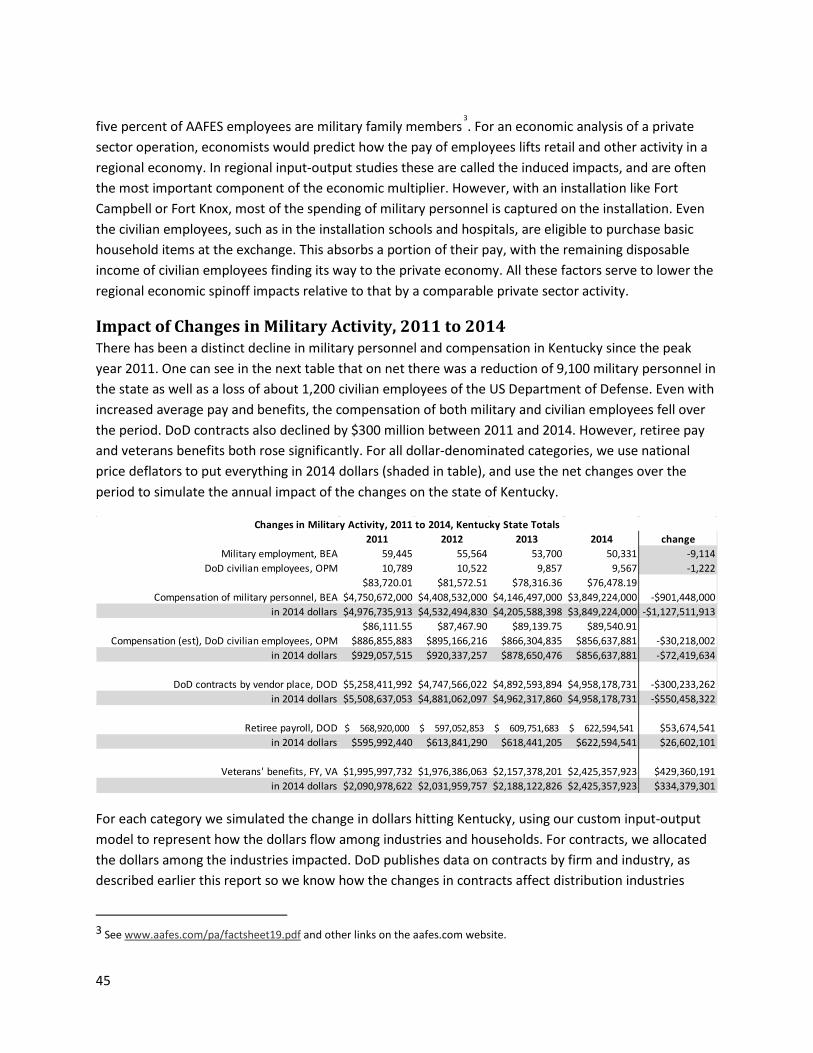
45
five percent of AAFES employees are military family members3. For an economic analysis of a private
sector operation, economists would predict how the pay of employees lifts retail and other activity in a regional economy. In regional input-output studies these are called the induced impacts, and are often the most important component of the economic multiplier. However, with an installation like Fort Campbell or Fort Knox, most of the spending of military personnel is captured on the installation. Even the civilian employees, such as in the installation schools and hospitals, are eligible to purchase basic household items at the exchange. This absorbs a portion of their pay, with the remaining disposable income of civilian employees finding its way to the private economy. All these factors serve to lower the regional economic spinoff impacts relative to that by a comparable private sector activity.
Impact of Changes in Military Activity, 2011 to 2014 There has been a distinct decline in military personnel and compensation in Kentucky since the peak year 2011. One can see in the next table that on net there was a reduction of 9,100 military personnel in the state as well as a loss of about 1,200 civilian employees of the US Department of Defense. Even with increased average pay and benefits, the compensation of both military and civilian employees fell over the period. DoD contracts also declined by $300 million between 2011 and 2014. However, retiree pay and veterans benefits both rose significantly. For all dollar-denominated categories, we use national price deflators to put everything in 2014 dollars (shaded in table), and use the net changes over the period to simulate the annual impact of the changes on the state of Kentucky.
For each category we simulated the change in dollars hitting Kentucky, using our custom input-output model to represent how the dollars flow among industries and households. For contracts, we allocated the dollars among the industries impacted. DoD publishes data on contracts by firm and industry, as described earlier this report so we know how the changes in contracts affect distribution industries
3 See www.aafes.com/pa/factsheet19.pdf and other links on the aafes.com website.
2011 2012 2013 2014 changeMilitary employment, BEA 59,445 55,564 53,700 50,331 -9,114
DoD civilian employees, OPM 10,789 10,522 9,857 9,567 -1,222$83,720.01 $81,572.51 $78,316.36 $76,478.19
Compensation of military personnel, BEA $4,750,672,000 $4,408,532,000 $4,146,497,000 $3,849,224,000 -$901,448,000in 2014 dollars $4,976,735,913 $4,532,494,830 $4,205,588,398 $3,849,224,000 -$1,127,511,913
$86,111.55 $87,467.90 $89,139.75 $89,540.91Compensation (est), DoD civilian employees, OPM $886,855,883 $895,166,216 $866,304,835 $856,637,881 -$30,218,002
in 2014 dollars $929,057,515 $920,337,257 $878,650,476 $856,637,881 -$72,419,634
DoD contracts by vendor place, DOD $5,258,411,992 $4,747,566,022 $4,892,593,894 $4,958,178,731 -$300,233,262in 2014 dollars $5,508,637,053 $4,881,062,097 $4,962,317,860 $4,958,178,731 -$550,458,322
Retiree payroll, DOD 568,920,000$ 597,052,853$ 609,751,683$ 622,594,541$ $53,674,541in 2014 dollars $595,992,440 $613,841,290 $618,441,205 $622,594,541 $26,602,101
Veterans' benefits, FY, VA $1,995,997,732 $1,976,386,063 $2,157,378,201 $2,425,357,923 $429,360,191in 2014 dollars $2,090,978,622 $2,031,959,757 $2,188,122,826 $2,425,357,923 $334,379,301
Changes in Military Activity, 2011 to 2014, Kentucky State Totals
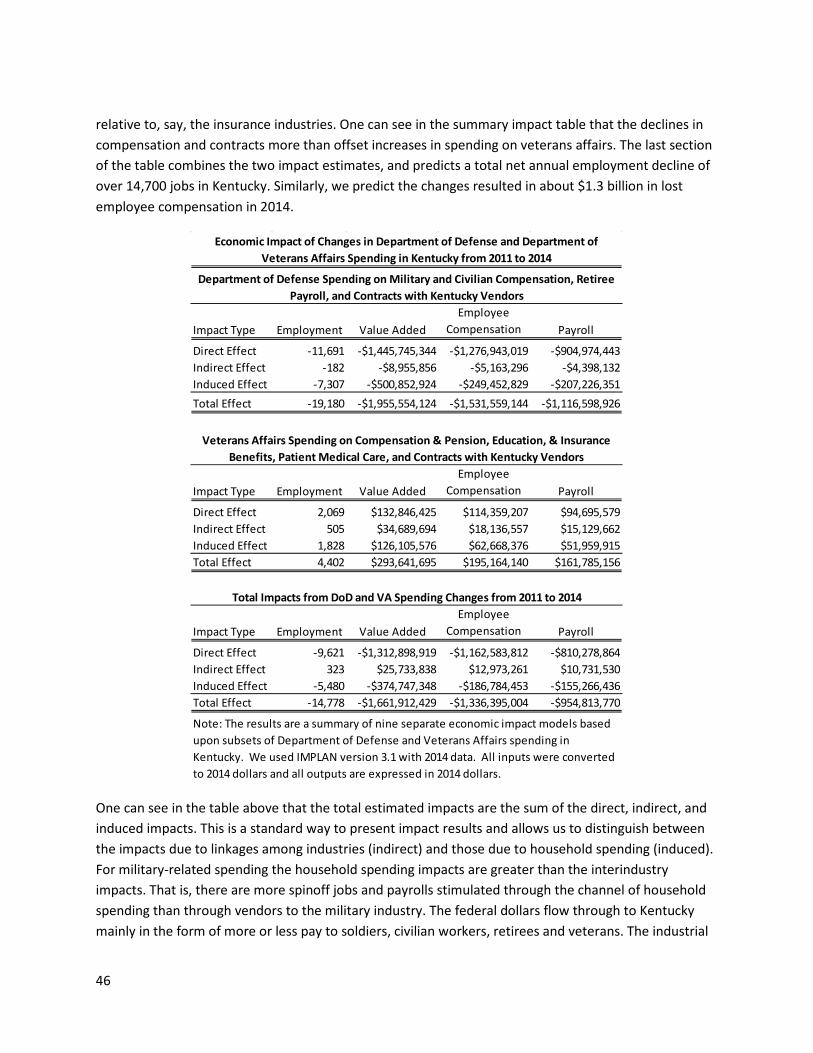
46
relative to, say, the insurance industries. One can see in the summary impact table that the declines in compensation and contracts more than offset increases in spending on veterans affairs. The last section of the table combines the two impact estimates, and predicts a total net annual employment decline of over 14,700 jobs in Kentucky. Similarly, we predict the changes resulted in about $1.3 billion in lost employee compensation in 2014.
One can see in the table above that the total estimated impacts are the sum of the direct, indirect, and induced impacts. This is a standard way to present impact results and allows us to distinguish between the impacts due to linkages among industries (indirect) and those due to household spending (induced). For military-related spending the household spending impacts are greater than the interindustry impacts. That is, there are more spinoff jobs and payrolls stimulated through the channel of household spending than through vendors to the military industry. The federal dollars flow through to Kentucky mainly in the form of more or less pay to soldiers, civilian workers, retirees and veterans. The industrial
Impact Type Employment Value AddedEmployee
Compensation Payroll
Direct Effect -11,691 -$1,445,745,344 -$1,276,943,019 -$904,974,443Indirect Effect -182 -$8,955,856 -$5,163,296 -$4,398,132Induced Effect -7,307 -$500,852,924 -$249,452,829 -$207,226,351Total Effect -19,180 -$1,955,554,124 -$1,531,559,144 -$1,116,598,926
Impact Type Employment Value AddedEmployee
Compensation Payroll
Direct Effect 2,069 $132,846,425 $114,359,207 $94,695,579Indirect Effect 505 $34,689,694 $18,136,557 $15,129,662Induced Effect 1,828 $126,105,576 $62,668,376 $51,959,915Total Effect 4,402 $293,641,695 $195,164,140 $161,785,156
Impact Type Employment Value AddedEmployee
Compensation Payroll
Direct Effect -9,621 -$1,312,898,919 -$1,162,583,812 -$810,278,864Indirect Effect 323 $25,733,838 $12,973,261 $10,731,530Induced Effect -5,480 -$374,747,348 -$186,784,453 -$155,266,436Total Effect -14,778 -$1,661,912,429 -$1,336,395,004 -$954,813,770
Veterans Affairs Spending on Compensation & Pension, Education, & Insurance Benefits, Patient Medical Care, and Contracts with Kentucky Vendors
Total Impacts from DoD and VA Spending Changes from 2011 to 2014
Department of Defense Spending on Military and Civilian Compensation, Retiree Payroll, and Contracts with Kentucky Vendors
Economic Impact of Changes in Department of Defense and Department of Veterans Affairs Spending in Kentucky from 2011 to 2014
Note: The results are a summary of nine separate economic impact models based upon subsets of Department of Defense and Veterans Affairs spending in Kentucky. We used IMPLAN version 3.1 with 2014 data. All inputs were converted to 2014 dollars and all outputs are expressed in 2014 dollars.
47
“product” is primarily a service - a more ready military force. Contrast the military industry to, say, automobile production, where there are wide and deep linkages to suppliers of parts, and the workforce compensation share of the total value of a car is much smaller. It is common that the indirect portion of an economic impact study is greater than the induced portion in manufacturing industries.
Regional Issues When military activity increases or decreases at one of the major installations in Kentucky, the primary area of impact is the county hosting the installation, followed by adjacent and nearby counties that supply workers and sell retail items to soldiers and civilian employees. We have rich data from the Census Bureau on the place of residence and place of work of people, by county and by industry. We use these to define the respective impact areas, and then to build models that predict the linkages of military activity to industries in the surrounding area.
For each region we model the impact of three scenarios. First, a change of one thousand uniformed military employees, second, a change of one hundred federal Department of Defense civilian employees, and third, a change of ten million dollars in DoD contracts to Kentucky vendors. We model different numbers of uniformed and civilian jobs because there are over five times more uniformed military employees in Kentucky than military civilian employees and we wanted the impacts to comparable in scope. Our procurement contract change models, rather than arbitrarily choosing industries that are affected, assume that the change in spending reflects the same industry distribution of spending that occurred in fiscal year 2015 in each region.
Fort Campbell Region Fort Campbell straddles the Kentucky-Tennessee border, with the majority of the land area in Tennessee, but with the headquarters on the Kentucky side. Employment at the installation is counted as being located in Christian County, Kentucky. A majority of federal employees live in Montgomery County TN, and together with Christian County account for over 95 percent of federal government employees, indicating a very tight commuting shed for the installation. Stewart County, TN and Trigg County, KY supplied another 2 percent of employees. These two counties, along with Montgomery and Christian, make up the Clarksville-Hopkinsville, TN-KY metropolitan statistical area.
The Clarksville-Hopkinsville MSA then is a good geographic choice for studying the regional economic impacts of developments at Fort Campbell. Military and civilian workers are purchasing everyday items in the local metropolitan economy and many of the supplies to the installation are also obtained from local businesses. Our input-output model is able to predict what and how much must be imported from outside the region to satisfy the demands of local industries and consumers.
In the Fort Campbell region, a change of 1,000 uniformed employees would result in an additional change of about 370 jobs in the private sector and about $10.4 million in compensation. A change of 100 civilian employees would impact another 33 jobs with slightly less than $1 million in compensation. For these changes, the impact is through household spending so there are no indirect, or business-to-business, impacts. Of course, a change of 1,000 soldiers or 100 civilians from the base might very well
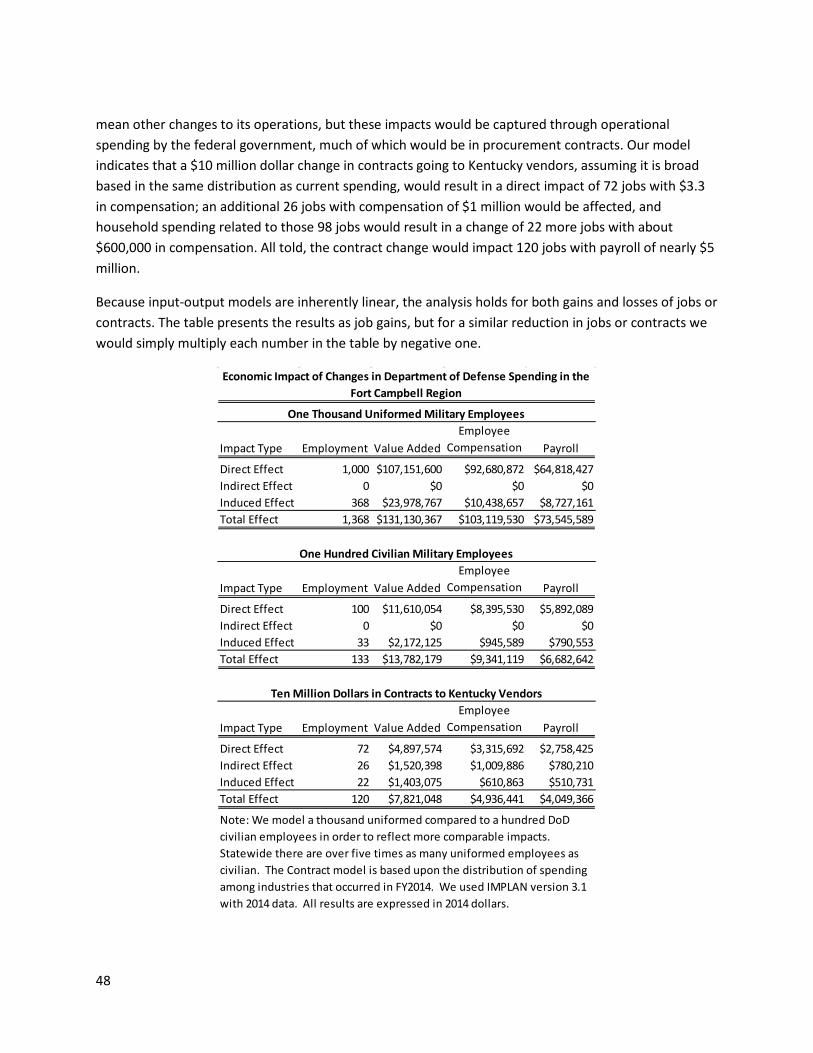
48
mean other changes to its operations, but these impacts would be captured through operational spending by the federal government, much of which would be in procurement contracts. Our model indicates that a $10 million dollar change in contracts going to Kentucky vendors, assuming it is broad based in the same distribution as current spending, would result in a direct impact of 72 jobs with $3.3 in compensation; an additional 26 jobs with compensation of $1 million would be affected, and household spending related to those 98 jobs would result in a change of 22 more jobs with about $600,000 in compensation. All told, the contract change would impact 120 jobs with payroll of nearly $5 million.
Because input-output models are inherently linear, the analysis holds for both gains and losses of jobs or contracts. The table presents the results as job gains, but for a similar reduction in jobs or contracts we would simply multiply each number in the table by negative one.
Impact Type Employment Value AddedEmployee
Compensation Payroll
Direct Effect 1,000 $107,151,600 $92,680,872 $64,818,427Indirect Effect 0 $0 $0 $0Induced Effect 368 $23,978,767 $10,438,657 $8,727,161Total Effect 1,368 $131,130,367 $103,119,530 $73,545,589
Impact Type Employment Value AddedEmployee
Compensation Payroll
Direct Effect 100 $11,610,054 $8,395,530 $5,892,089Indirect Effect 0 $0 $0 $0Induced Effect 33 $2,172,125 $945,589 $790,553Total Effect 133 $13,782,179 $9,341,119 $6,682,642
Impact Type Employment Value AddedEmployee
Compensation Payroll
Direct Effect 72 $4,897,574 $3,315,692 $2,758,425Indirect Effect 26 $1,520,398 $1,009,886 $780,210Induced Effect 22 $1,403,075 $610,863 $510,731Total Effect 120 $7,821,048 $4,936,441 $4,049,366
Economic Impact of Changes in Department of Defense Spending in the Fort Campbell Region
One Thousand Uniformed Military Employees
One Hundred Civilian Military Employees
Ten Million Dollars in Contracts to Kentucky Vendors
Note: We model a thousand uniformed compared to a hundred DoD civilian employees in order to reflect more comparable impacts. Statewide there are over five times as many uniformed employees as civilian. The Contract model is based upon the distribution of spending among industries that occurred in FY2014. We used IMPLAN version 3.1 with 2014 data. All results are expressed in 2014 dollars.
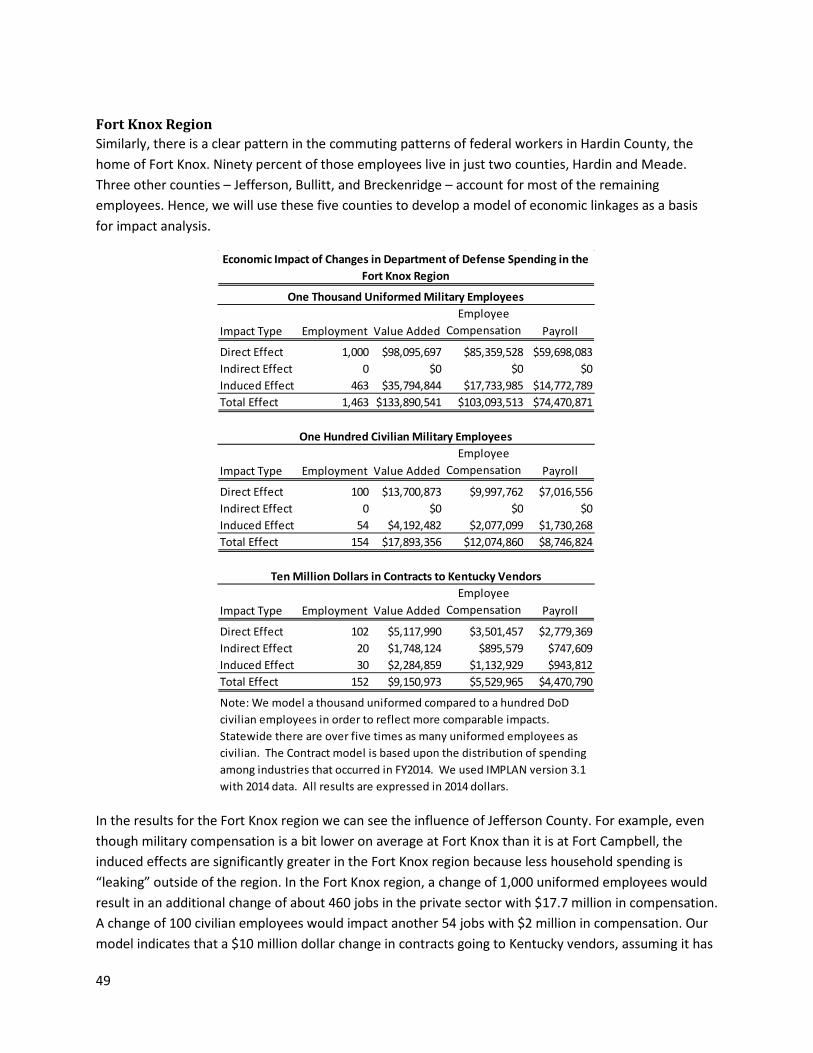
49
Fort Knox Region Similarly, there is a clear pattern in the commuting patterns of federal workers in Hardin County, the home of Fort Knox. Ninety percent of those employees live in just two counties, Hardin and Meade. Three other counties – Jefferson, Bullitt, and Breckenridge – account for most of the remaining employees. Hence, we will use these five counties to develop a model of economic linkages as a basis for impact analysis.
In the results for the Fort Knox region we can see the influence of Jefferson County. For example, even though military compensation is a bit lower on average at Fort Knox than it is at Fort Campbell, the induced effects are significantly greater in the Fort Knox region because less household spending is “leaking” outside of the region. In the Fort Knox region, a change of 1,000 uniformed employees would result in an additional change of about 460 jobs in the private sector with $17.7 million in compensation. A change of 100 civilian employees would impact another 54 jobs with $2 million in compensation. Our model indicates that a $10 million dollar change in contracts going to Kentucky vendors, assuming it has
Impact Type Employment Value AddedEmployee
Compensation Payroll
Direct Effect 1,000 $98,095,697 $85,359,528 $59,698,083Indirect Effect 0 $0 $0 $0Induced Effect 463 $35,794,844 $17,733,985 $14,772,789Total Effect 1,463 $133,890,541 $103,093,513 $74,470,871
Impact Type Employment Value AddedEmployee
Compensation Payroll
Direct Effect 100 $13,700,873 $9,997,762 $7,016,556Indirect Effect 0 $0 $0 $0Induced Effect 54 $4,192,482 $2,077,099 $1,730,268Total Effect 154 $17,893,356 $12,074,860 $8,746,824
Impact Type Employment Value AddedEmployee
Compensation Payroll
Direct Effect 102 $5,117,990 $3,501,457 $2,779,369Indirect Effect 20 $1,748,124 $895,579 $747,609Induced Effect 30 $2,284,859 $1,132,929 $943,812Total Effect 152 $9,150,973 $5,529,965 $4,470,790
Economic Impact of Changes in Department of Defense Spending in the Fort Knox Region
One Thousand Uniformed Military Employees
One Hundred Civilian Military Employees
Ten Million Dollars in Contracts to Kentucky Vendors
Note: We model a thousand uniformed compared to a hundred DoD civilian employees in order to reflect more comparable impacts. Statewide there are over five times as many uniformed employees as civilian. The Contract model is based upon the distribution of spending among industries that occurred in FY2014. We used IMPLAN version 3.1 with 2014 data. All results are expressed in 2014 dollars.
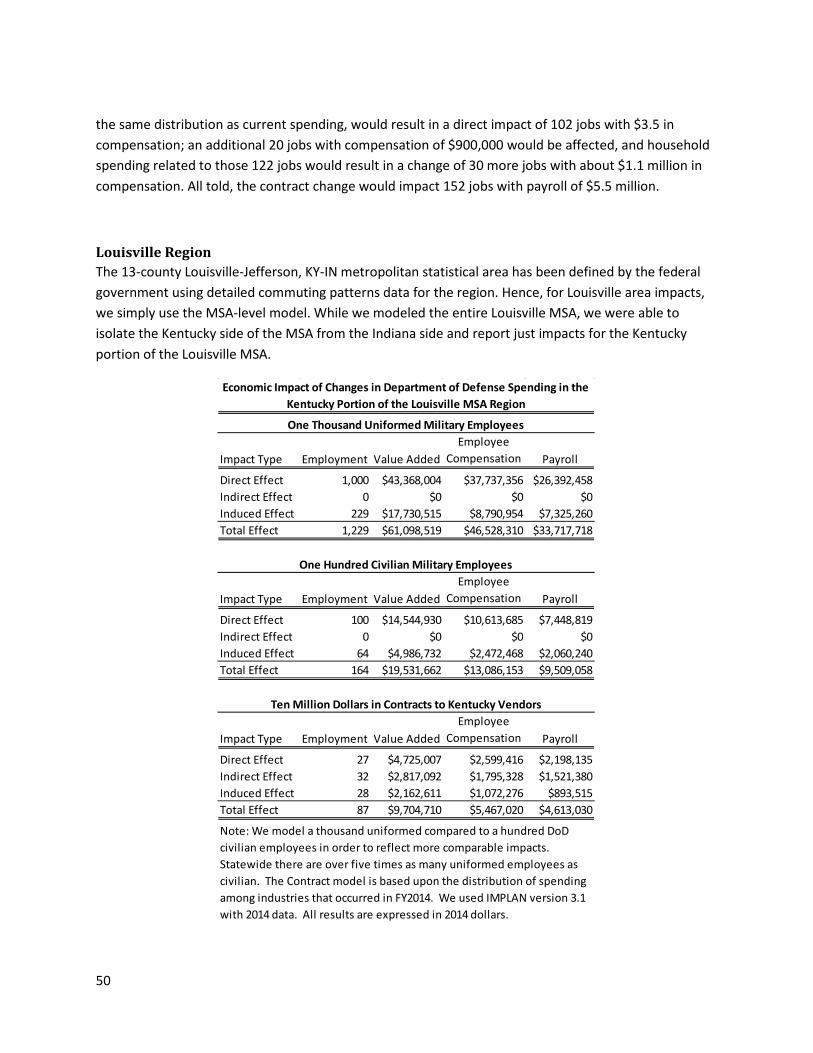
50
the same distribution as current spending, would result in a direct impact of 102 jobs with $3.5 in compensation; an additional 20 jobs with compensation of $900,000 would be affected, and household spending related to those 122 jobs would result in a change of 30 more jobs with about $1.1 million in compensation. All told, the contract change would impact 152 jobs with payroll of $5.5 million.
Louisville Region The 13-county Louisville-Jefferson, KY-IN metropolitan statistical area has been defined by the federal government using detailed commuting patterns data for the region. Hence, for Louisville area impacts, we simply use the MSA-level model. While we modeled the entire Louisville MSA, we were able to isolate the Kentucky side of the MSA from the Indiana side and report just impacts for the Kentucky portion of the Louisville MSA.
Impact Type Employment Value AddedEmployee
Compensation Payroll
Direct Effect 1,000 $43,368,004 $37,737,356 $26,392,458Indirect Effect 0 $0 $0 $0Induced Effect 229 $17,730,515 $8,790,954 $7,325,260Total Effect 1,229 $61,098,519 $46,528,310 $33,717,718
Impact Type Employment Value AddedEmployee
Compensation Payroll
Direct Effect 100 $14,544,930 $10,613,685 $7,448,819Indirect Effect 0 $0 $0 $0Induced Effect 64 $4,986,732 $2,472,468 $2,060,240Total Effect 164 $19,531,662 $13,086,153 $9,509,058
Impact Type Employment Value AddedEmployee
Compensation Payroll
Direct Effect 27 $4,725,007 $2,599,416 $2,198,135Indirect Effect 32 $2,817,092 $1,795,328 $1,521,380Induced Effect 28 $2,162,611 $1,072,276 $893,515Total Effect 87 $9,704,710 $5,467,020 $4,613,030
Economic Impact of Changes in Department of Defense Spending in the Kentucky Portion of the Louisville MSA Region
One Thousand Uniformed Military Employees
One Hundred Civilian Military Employees
Ten Million Dollars in Contracts to Kentucky Vendors
Note: We model a thousand uniformed compared to a hundred DoD civilian employees in order to reflect more comparable impacts. Statewide there are over five times as many uniformed employees as civilian. The Contract model is based upon the distribution of spending among industries that occurred in FY2014. We used IMPLAN version 3.1 with 2014 data. All results are expressed in 2014 dollars.
51
Since most of the uniformed military employees in Louisville are members of the National Guard, and some are part-time, their average compensation is not nearly as high as their counterparts at Fort Campbell and Fort Knox. As such, their impact on the surrounding community is not as great comparatively. A change of 1,000 uniformed employees in Louisville would impact an additional 229 jobs with compensation of $8.8 million. On the other hand, civilian DoD employees in Louisville are very well compensated, so the impact of 100 civilian employees is relatively greater; 64 additional jobs would be affected, with total compensation of nearly $2.5 million. In Louisville the $10 million in contracts is heavily weighted towards insurance carriers, which requires far fewer jobs to generate $10 million in sales than do the industries receiving the bulk of the contracts at the two Army installations. So the direct effect of the change in Louisville would be just 27 jobs, but since average pay would be very good they would result in $2.6 million in compensation. The business-to-business spending impact would be 32 jobs with $1.8 million in compensation, while the household spending would affect another 28 jobs with a further $1.1 million in compensation.
Blue Grass Army Depot (BGAD) and Bluegrass Station The Blue Grass Army Depot is located in Richmond Kentucky, just a few miles south of Eastern Kentucky University. A slight majority of Depot employees live in Madison, the host county. However, Fayette County and several other Lexington area counties supply a significant number of employees. Bluegrass Station is in Fayette County and has contract links to BGAD. Since the Lexington and Richmond market areas are adjacent and intimately linked through industrial vendors and employee commuting, we combine the two areas for our impact analyses. In particular, we combine into one region the Richmond micropolitan statistical area (Madison and Rockcastle counties) with the Lexington metropolitan statistical area (Bourbon, Clark, Fayette, Jessamine, Scott and Woodford counties).
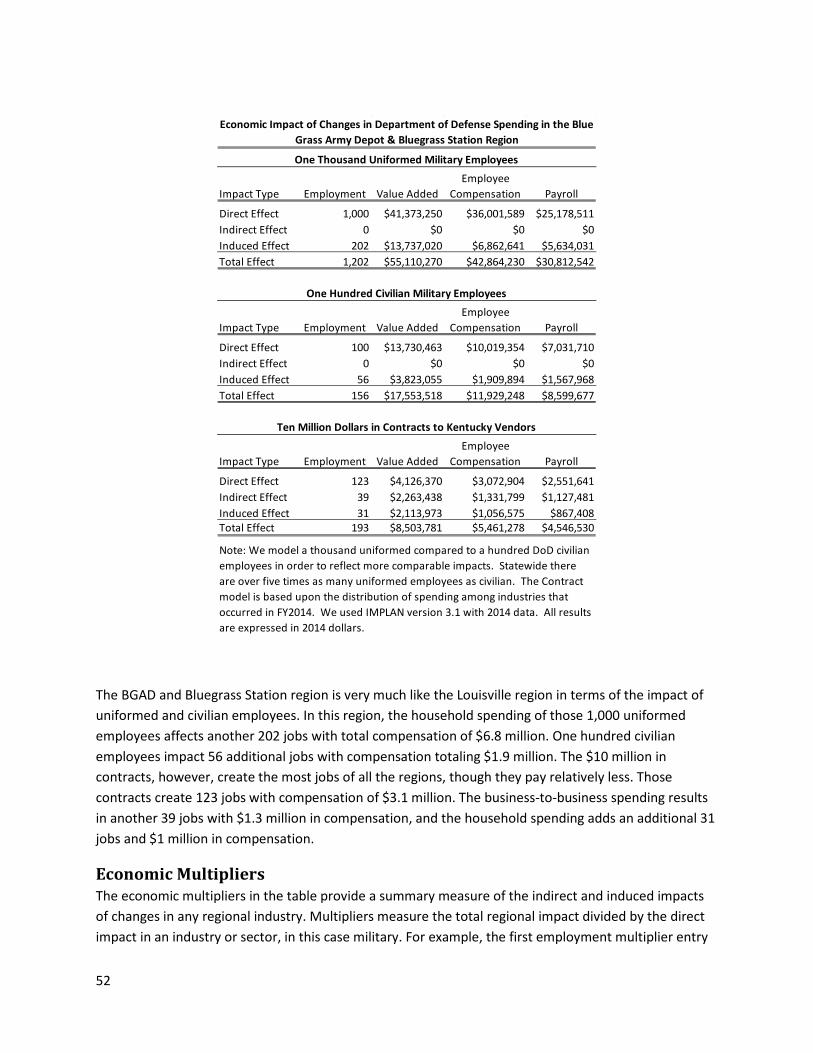
52
The BGAD and Bluegrass Station region is very much like the Louisville region in terms of the impact of uniformed and civilian employees. In this region, the household spending of those 1,000 uniformed employees affects another 202 jobs with total compensation of $6.8 million. One hundred civilian employees impact 56 additional jobs with compensation totaling $1.9 million. The $10 million in contracts, however, create the most jobs of all the regions, though they pay relatively less. Those contracts create 123 jobs with compensation of $3.1 million. The business-to-business spending results in another 39 jobs with $1.3 million in compensation, and the household spending adds an additional 31 jobs and $1 million in compensation.
Economic Multipliers The economic multipliers in the table provide a summary measure of the indirect and induced impacts of changes in any regional industry. Multipliers measure the total regional impact divided by the direct impact in an industry or sector, in this case military. For example, the first employment multiplier entry
Impact Type Employment Value AddedEmployee
Compensation Payroll
Direct Effect 1,000 $41,373,250 $36,001,589 $25,178,511Indirect Effect 0 $0 $0 $0Induced Effect 202 $13,737,020 $6,862,641 $5,634,031Total Effect 1,202 $55,110,270 $42,864,230 $30,812,542
Impact Type Employment Value AddedEmployee
Compensation Payroll
Direct Effect 100 $13,730,463 $10,019,354 $7,031,710Indirect Effect 0 $0 $0 $0Induced Effect 56 $3,823,055 $1,909,894 $1,567,968Total Effect 156 $17,553,518 $11,929,248 $8,599,677
Impact Type Employment Value AddedEmployee
Compensation Payroll
Direct Effect 123 $4,126,370 $3,072,904 $2,551,641Indirect Effect 39 $2,263,438 $1,331,799 $1,127,481Induced Effect 31 $2,113,973 $1,056,575 $867,408Total Effect 193 $8,503,781 $5,461,278 $4,546,530
Economic Impact of Changes in Department of Defense Spending in the Blue Grass Army Depot & Bluegrass Station Region
One Thousand Uniformed Military Employees
One Hundred Civilian Military Employees
Ten Million Dollars in Contracts to Kentucky Vendors
Note: We model a thousand uniformed compared to a hundred DoD civilian employees in order to reflect more comparable impacts. Statewide there are over five times as many uniformed employees as civilian. The Contract model is based upon the distribution of spending among industries that occurred in FY2014. We used IMPLAN version 3.1 with 2014 data. All results are expressed in 2014 dollars.
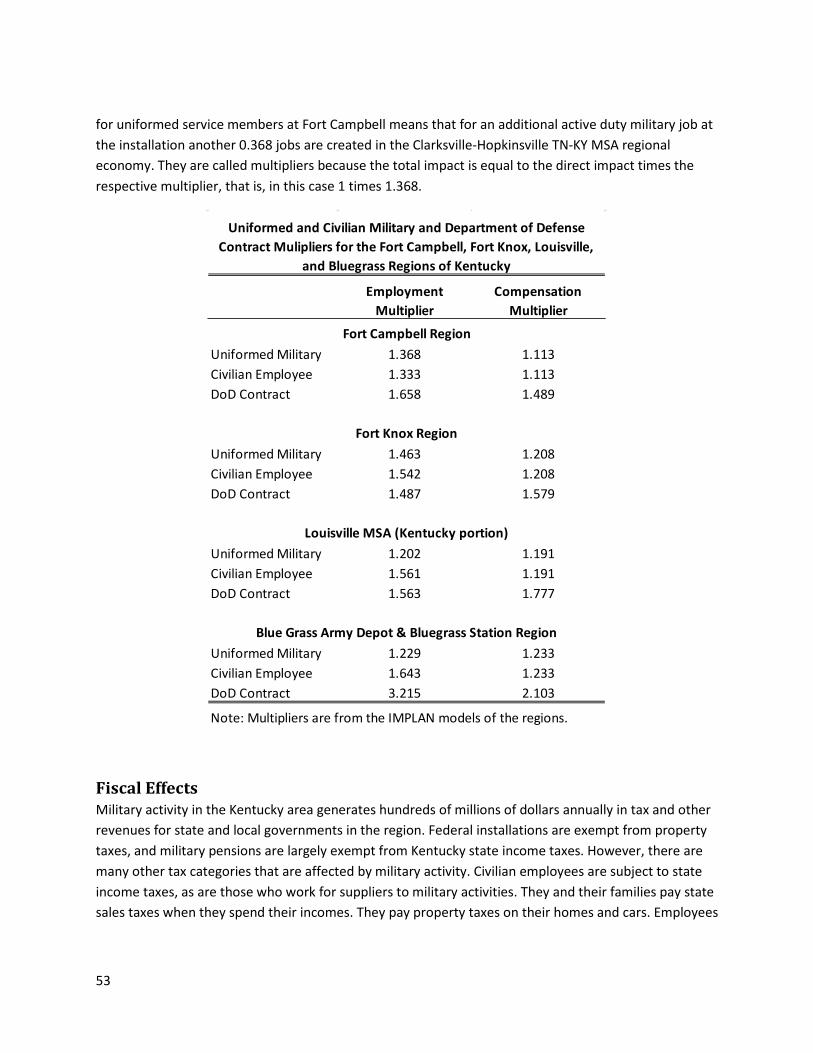
53
for uniformed service members at Fort Campbell means that for an additional active duty military job at the installation another 0.368 jobs are created in the Clarksville-Hopkinsville TN-KY MSA regional economy. They are called multipliers because the total impact is equal to the direct impact times the respective multiplier, that is, in this case 1 times 1.368.
Fiscal Effects Military activity in the Kentucky area generates hundreds of millions of dollars annually in tax and other revenues for state and local governments in the region. Federal installations are exempt from property taxes, and military pensions are largely exempt from Kentucky state income taxes. However, there are many other tax categories that are affected by military activity. Civilian employees are subject to state income taxes, as are those who work for suppliers to military activities. They and their families pay state sales taxes when they spend their incomes. They pay property taxes on their homes and cars. Employees
Employment Multiplier
Compensation Multiplier
Uniformed Military 1.368 1.113Civilian Employee 1.333 1.113DoD Contract 1.658 1.489
Uniformed Military 1.463 1.208Civilian Employee 1.542 1.208DoD Contract 1.487 1.579
Uniformed Military 1.202 1.191Civilian Employee 1.561 1.191DoD Contract 1.563 1.777
Uniformed Military 1.229 1.233Civilian Employee 1.643 1.233DoD Contract 3.215 2.103
Note: Multipliers are from the IMPLAN models of the regions.
Uniformed and Civilian Military and Department of Defense Contract Mulipliers for the Fort Campbell, Fort Knox, Louisville,
and Bluegrass Regions of Kentucky
Fort Campbell Region
Fort Knox Region
Louisville MSA (Kentucky portion)
Blue Grass Army Depot & Bluegrass Station Region
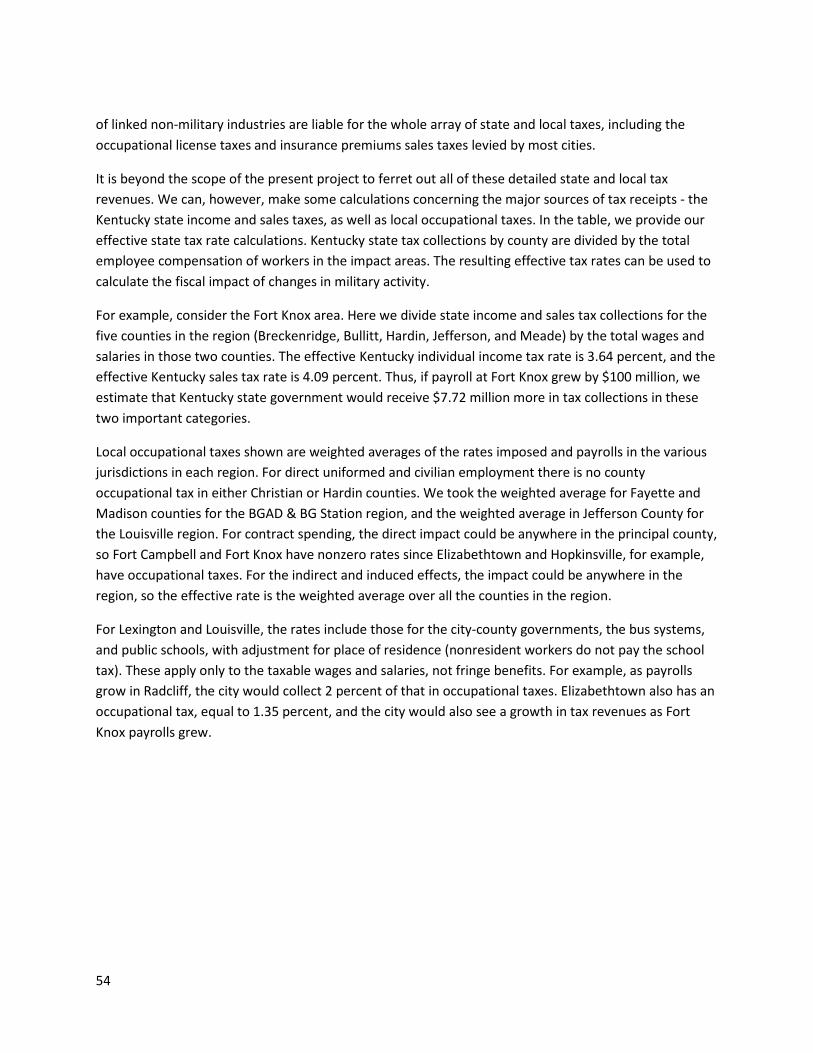
54
of linked non-military industries are liable for the whole array of state and local taxes, including the occupational license taxes and insurance premiums sales taxes levied by most cities.
It is beyond the scope of the present project to ferret out all of these detailed state and local tax revenues. We can, however, make some calculations concerning the major sources of tax receipts - the Kentucky state income and sales taxes, as well as local occupational taxes. In the table, we provide our effective state tax rate calculations. Kentucky state tax collections by county are divided by the total employee compensation of workers in the impact areas. The resulting effective tax rates can be used to calculate the fiscal impact of changes in military activity.
For example, consider the Fort Knox area. Here we divide state income and sales tax collections for the five counties in the region (Breckenridge, Bullitt, Hardin, Jefferson, and Meade) by the total wages and salaries in those two counties. The effective Kentucky individual income tax rate is 3.64 percent, and the effective Kentucky sales tax rate is 4.09 percent. Thus, if payroll at Fort Knox grew by $100 million, we estimate that Kentucky state government would receive $7.72 million more in tax collections in these two important categories.
Local occupational taxes shown are weighted averages of the rates imposed and payrolls in the various jurisdictions in each region. For direct uniformed and civilian employment there is no county occupational tax in either Christian or Hardin counties. We took the weighted average for Fayette and Madison counties for the BGAD & BG Station region, and the weighted average in Jefferson County for the Louisville region. For contract spending, the direct impact could be anywhere in the principal county, so Fort Campbell and Fort Knox have nonzero rates since Elizabethtown and Hopkinsville, for example, have occupational taxes. For the indirect and induced effects, the impact could be anywhere in the region, so the effective rate is the weighted average over all the counties in the region.
For Lexington and Louisville, the rates include those for the city-county governments, the bus systems, and public schools, with adjustment for place of residence (nonresident workers do not pay the school tax). These apply only to the taxable wages and salaries, not fringe benefits. For example, as payrolls grow in Radcliff, the city would collect 2 percent of that in occupational taxes. Elizabethtown also has an occupational tax, equal to 1.35 percent, and the city would also see a growth in tax revenues as Fort Knox payrolls grew.
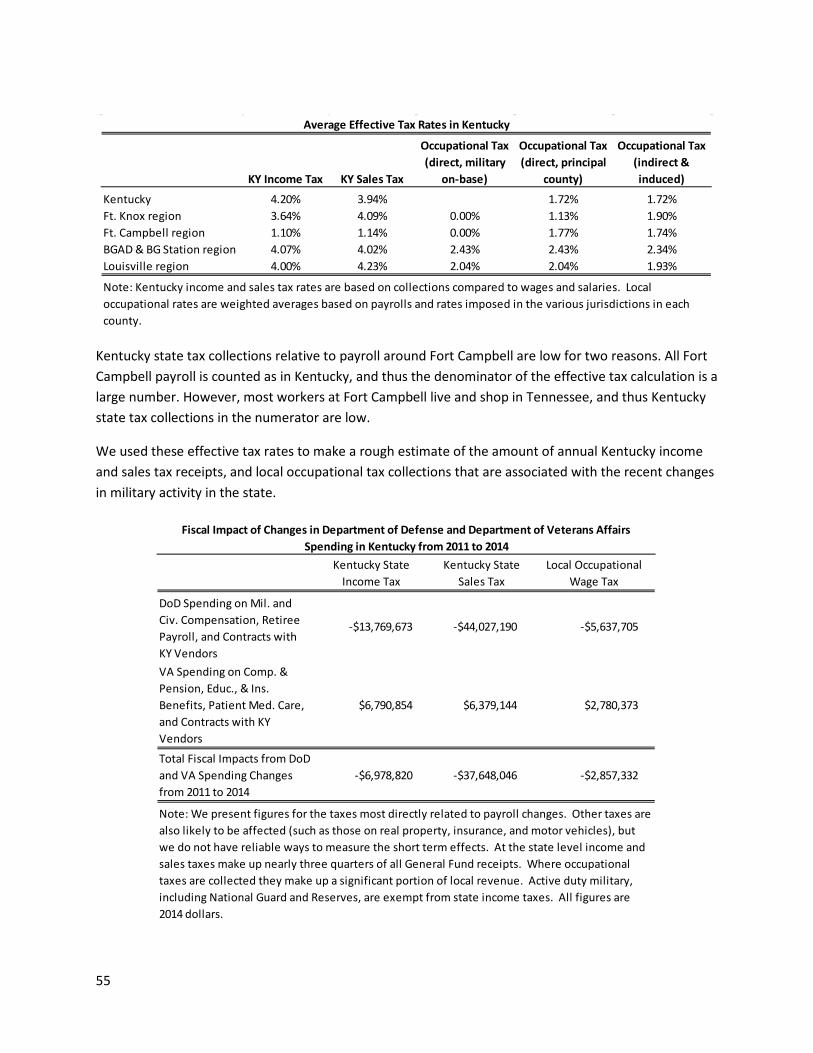
55
Kentucky state tax collections relative to payroll around Fort Campbell are low for two reasons. All Fort Campbell payroll is counted as in Kentucky, and thus the denominator of the effective tax calculation is a large number. However, most workers at Fort Campbell live and shop in Tennessee, and thus Kentucky state tax collections in the numerator are low.
We used these effective tax rates to make a rough estimate of the amount of annual Kentucky income and sales tax receipts, and local occupational tax collections that are associated with the recent changes in military activity in the state.
KY Income Tax KY Sales Tax
Occupational Tax (direct, military
on-base)
Occupational Tax (direct, principal
county)
Occupational Tax (indirect & induced)
Kentucky 4.20% 3.94% 1.72% 1.72%Ft. Knox region 3.64% 4.09% 0.00% 1.13% 1.90%Ft. Campbell region 1.10% 1.14% 0.00% 1.77% 1.74%BGAD & BG Station region 4.07% 4.02% 2.43% 2.43% 2.34%Louisville region 4.00% 4.23% 2.04% 2.04% 1.93%
Average Effective Tax Rates in Kentucky
Note: Kentucky income and sales tax rates are based on collections compared to wages and salaries. Local occupational rates are weighted averages based on payrolls and rates imposed in the various jurisdictions in each county.
Kentucky State Income Tax
Kentucky State Sales Tax
Local Occupational Wage Tax
DoD Spending on Mil. and Civ. Compensation, Retiree Payroll, and Contracts with KY Vendors
-$13,769,673 -$44,027,190 -$5,637,705
VA Spending on Comp. & Pension, Educ., & Ins. Benefits, Patient Med. Care, and Contracts with KY Vendors
$6,790,854 $6,379,144 $2,780,373
Total Fiscal Impacts from DoD and VA Spending Changes from 2011 to 2014
-$6,978,820 -$37,648,046 -$2,857,332
Fiscal Impact of Changes in Department of Defense and Department of Veterans Affairs Spending in Kentucky from 2011 to 2014
Note: We present figures for the taxes most directly related to payroll changes. Other taxes are also likely to be affected (such as those on real property, insurance, and motor vehicles), but we do not have reliable ways to measure the short term effects. At the state level income and sales taxes make up nearly three quarters of all General Fund receipts. Where occupational taxes are collected they make up a significant portion of local revenue. Active duty military, including National Guard and Reserves, are exempt from state income taxes. All figures are 2014 dollars.
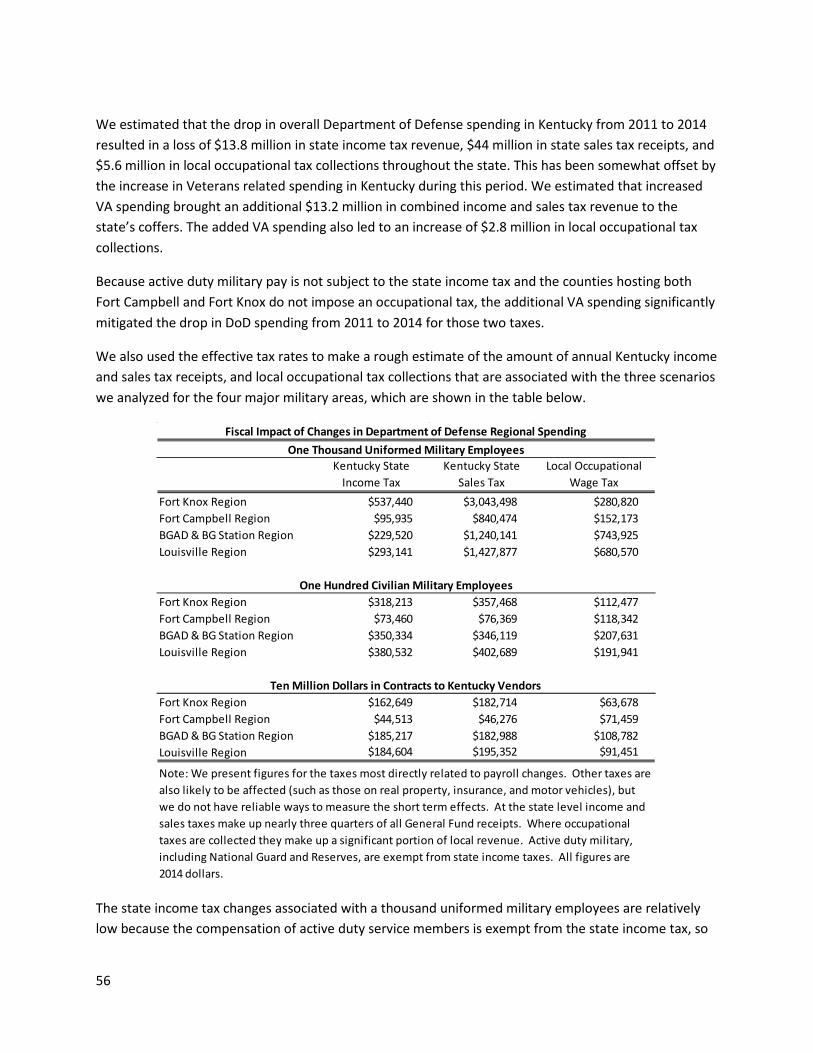
56
We estimated that the drop in overall Department of Defense spending in Kentucky from 2011 to 2014 resulted in a loss of $13.8 million in state income tax revenue, $44 million in state sales tax receipts, and $5.6 million in local occupational tax collections throughout the state. This has been somewhat offset by the increase in Veterans related spending in Kentucky during this period. We estimated that increased VA spending brought an additional $13.2 million in combined income and sales tax revenue to the state’s coffers. The added VA spending also led to an increase of $2.8 million in local occupational tax collections.
Because active duty military pay is not subject to the state income tax and the counties hosting both Fort Campbell and Fort Knox do not impose an occupational tax, the additional VA spending significantly mitigated the drop in DoD spending from 2011 to 2014 for those two taxes.
We also used the effective tax rates to make a rough estimate of the amount of annual Kentucky income and sales tax receipts, and local occupational tax collections that are associated with the three scenarios we analyzed for the four major military areas, which are shown in the table below.
The state income tax changes associated with a thousand uniformed military employees are relatively low because the compensation of active duty service members is exempt from the state income tax, so
Kentucky State Income Tax
Kentucky State Sales Tax
Local Occupational Wage Tax
Fort Knox Region $537,440 $3,043,498 $280,820Fort Campbell Region $95,935 $840,474 $152,173BGAD & BG Station Region $229,520 $1,240,141 $743,925Louisville Region $293,141 $1,427,877 $680,570
Fort Knox Region $318,213 $357,468 $112,477Fort Campbell Region $73,460 $76,369 $118,342BGAD & BG Station Region $350,334 $346,119 $207,631Louisville Region $380,532 $402,689 $191,941
Fort Knox Region $162,649 $182,714 $63,678Fort Campbell Region $44,513 $46,276 $71,459BGAD & BG Station Region $185,217 $182,988 $108,782Louisville Region $184,604 $195,352 $91,451
Ten Million Dollars in Contracts to Kentucky Vendors
Note: We present figures for the taxes most directly related to payroll changes. Other taxes are also likely to be affected (such as those on real property, insurance, and motor vehicles), but we do not have reliable ways to measure the short term effects. At the state level income and sales taxes make up nearly three quarters of all General Fund receipts. Where occupational taxes are collected they make up a significant portion of local revenue. Active duty military, including National Guard and Reserves, are exempt from state income taxes. All figures are 2014 dollars.
Fiscal Impact of Changes in Department of Defense Regional SpendingOne Thousand Uniformed Military Employees
One Hundred Civilian Military Employees
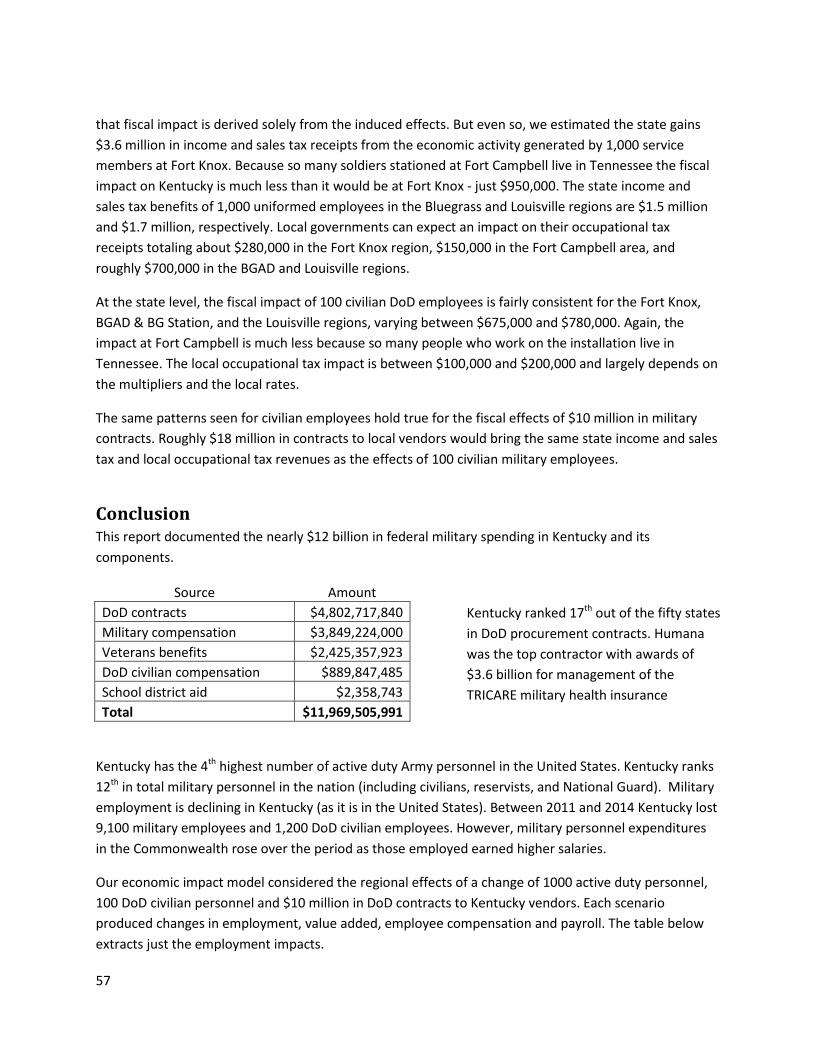
57
that fiscal impact is derived solely from the induced effects. But even so, we estimated the state gains $3.6 million in income and sales tax receipts from the economic activity generated by 1,000 service members at Fort Knox. Because so many soldiers stationed at Fort Campbell live in Tennessee the fiscal impact on Kentucky is much less than it would be at Fort Knox - just $950,000. The state income and sales tax benefits of 1,000 uniformed employees in the Bluegrass and Louisville regions are $1.5 million and $1.7 million, respectively. Local governments can expect an impact on their occupational tax receipts totaling about $280,000 in the Fort Knox region, $150,000 in the Fort Campbell area, and roughly $700,000 in the BGAD and Louisville regions.
At the state level, the fiscal impact of 100 civilian DoD employees is fairly consistent for the Fort Knox, BGAD & BG Station, and the Louisville regions, varying between $675,000 and $780,000. Again, the impact at Fort Campbell is much less because so many people who work on the installation live in Tennessee. The local occupational tax impact is between $100,000 and $200,000 and largely depends on the multipliers and the local rates.
The same patterns seen for civilian employees hold true for the fiscal effects of $10 million in military contracts. Roughly $18 million in contracts to local vendors would bring the same state income and sales tax and local occupational tax revenues as the effects of 100 civilian military employees.
Conclusion This report documented the nearly $12 billion in federal military spending in Kentucky and its components.
Source Amount DoD contracts $4,802,717,840 Military compensation $3,849,224,000 Veterans benefits $2,425,357,923 DoD civilian compensation $889,847,485 School district aid $2,358,743 Total $11,969,505,991
Kentucky has the 4th highest number of active duty Army personnel in the United States. Kentucky ranks 12th in total military personnel in the nation (including civilians, reservists, and National Guard). Military employment is declining in Kentucky (as it is in the United States). Between 2011 and 2014 Kentucky lost 9,100 military employees and 1,200 DoD civilian employees. However, military personnel expenditures in the Commonwealth rose over the period as those employed earned higher salaries.
Our economic impact model considered the regional effects of a change of 1000 active duty personnel, 100 DoD civilian personnel and $10 million in DoD contracts to Kentucky vendors. Each scenario produced changes in employment, value added, employee compensation and payroll. The table below extracts just the employment impacts.
Kentucky ranked 17th out of the fifty states in DoD procurement contracts. Humana was the top contractor with awards of $3.6 billion for management of the TRICARE military health insurance
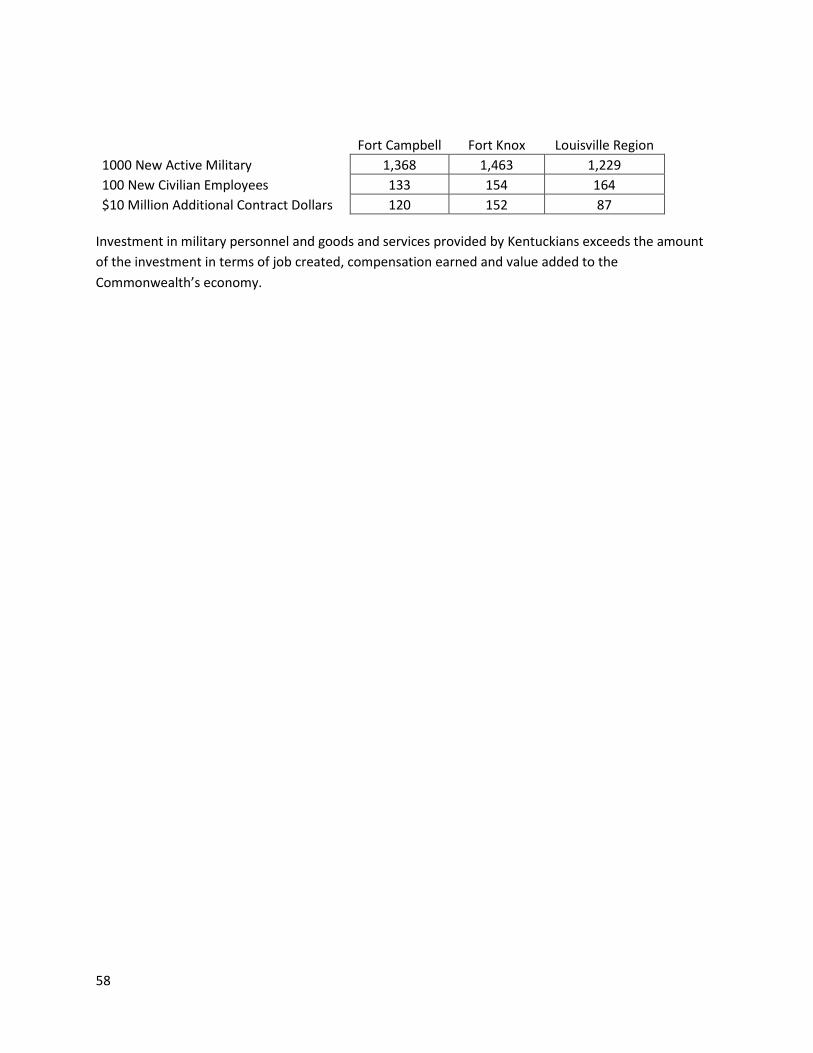
58
Fort Campbell Fort Knox Louisville Region
1000 New Active Military 1,368 1,463 1,229 100 New Civilian Employees 133 154 164 $10 Million Additional Contract Dollars 120 152 87
Investment in military personnel and goods and services provided by Kentuckians exceeds the amount of the investment in terms of job created, compensation earned and value added to the Commonwealth’s economy.