Embed Size (px)
Citation preview
Economic InformationBulletinNumber 38
June 2008
United States Department of Agriculture
Economic Research Service
James M. MacDonald
The Economic Organizationof U.S. Broiler Production
ww
w.er
s.usda.gov
You can find additional information about ERS publications, databases, and other products at our website.
Visit Our Website To Learn More!
National Agricultural LibraryCataloging Record:
The U.S. Department of Agriculture (USDA) prohibits discrimination in all its programs and activities on the basis of race, color, national origin, age, disability, and, where applicable, sex, marital status, familial status, parental status, religion, sexual orientation, genetic information, political beliefs, reprisal, or because all or a part of an individual's income is derived from any public assistance program. (Not all prohibited bases apply to all programs.) Persons with disabilities who require alternative means for communication of program information (Braille, large print, audiotape, etc.) should contact USDA's TARGET Center at (202) 720-2600 (voice and TDD).
To file a complaint of discrimination write to USDA, Director, Office of Civil Rights, 1400 Independence Avenue, S.W., Washington, D.C. 20250-9410 or call (800) 795-3272 (voice) or (202) 720-6382 (TDD). USDA is an equal opportunity provider and employer.
MacDonald, James M.The economic organization of U.S. broiler production.
(Economic information bulletin ; no. 38)
1. Poultry industry—United States.
2. Broilers (Poultry)—Economic aspects—United States.
3. Farm income—United States.
I. United States. Dept. of Agriculture. Economic Research Service. II. Title.
HD9437.U62
www.ers.usda.gov
Photo credit: Larry Rana, USDA.Recommended format for citation:MacDonald, James M. The Economic Organization of U.S.Broiler Production, Economic Information Bulletin No. 38. Economic Research Service, U.S. Dept. of Agriculture. June 2008.
United StatesDepartmentof Agriculture
www.ers.usda.gov
A Report from the Economic Research Service
Abstract
Broiler production in the United States is coordinated almost entirely through systems of production contracts, in which a grower’s compensation is based, in part, on how the grower’s performance compares with that of other growers. The industry is undergoing a gradual structural change as production shifts to larger broiler enterprises that provide larger shares of an operator’s household income. Larger enterprises require substantially larger investments in broiler housing, and new or retrofi tted houses are also an important source of productivity growth in the industry. This report, based on a large and repre-sentative survey of broiler operations, describes the industry’s organization, housing features, contract design, fees and enterprise cost structures, and farm and household fi nances.
Keywords: broilers, chickens, production contracts, broiler grower fi nancial perfor-mance, chicken housing, chicken litter, poultry
Acknowledgments
Special thanks for helpful comments and advice from those in government, academia, and industry, including Bill McBride, Dave Harvey, Bob Hoppe, Penni Korb, Joe Moore, Gary McBryde, John Rollins, Milt Madison and Dania Ferguson from the U.S. Department of Agriculture; Tom Vukina of North Carolina State University; H.L. Goodwin of the University of Arkansas; Dan Cunningham of the University of Georgia; Doug Parker of the University of Maryland; Bill Roenigk of the National Chicken Council; Kenny Bounds of MidAtlantic Farm Credit; and members of the Growers Committee of Delmarva Poultry Industries (DPI). Angela Anderson and Cynthia A. Ray of ERS provided editing and design support for the manuscript.
James M. MacDonald
The Economic Organizationof U.S. Broiler Production
EconomicInformationBulletinNumber 38
June 2008
iiThe Economic Organization of U.S. Broiler Production / EIB-38
Economic Research Service/USDA
Contents
Summary. . . . . . . . . . . . . . . . . . . . . . . . . . . . . . . . . . . . . . . . . . . . . . . . . . . iii
Introduction . . . . . . . . . . . . . . . . . . . . . . . . . . . . . . . . . . . . . . . . . . . . . . . . . 1 Challenges Facing the Industry. . . . . . . . . . . . . . . . . . . . . . . . . . . . . . . . . 4 Conducting a Broiler Version of the ARMS. . . . . . . . . . . . . . . . . . . . . . . 5
How Production Is Organized . . . . . . . . . . . . . . . . . . . . . . . . . . . . . . . . . . 7 Housing . . . . . . . . . . . . . . . . . . . . . . . . . . . . . . . . . . . . . . . . . . . . . . . . . . . 7 Entry and Experience in Broiler Production . . . . . . . . . . . . . . . . . . . . . . 10 How Large Are Broiler Operations?. . . . . . . . . . . . . . . . . . . . . . . . . . . . 10
Production Contracts. . . . . . . . . . . . . . . . . . . . . . . . . . . . . . . . . . . . . . . . . 13 Contracts and Competing Integrators . . . . . . . . . . . . . . . . . . . . . . . . . . . 13 Fees Paid in Production Contracts . . . . . . . . . . . . . . . . . . . . . . . . . . . . . 14 Expenses on Broiler Operations . . . . . . . . . . . . . . . . . . . . . . . . . . . . . . . 17
Litter Management Practices . . . . . . . . . . . . . . . . . . . . . . . . . . . . . . . . . . 18
Farm Operators and Their Households. . . . . . . . . . . . . . . . . . . . . . . . . . 19
Farm Business Finances . . . . . . . . . . . . . . . . . . . . . . . . . . . . . . . . . . . . . . 21 Organizing the Information. . . . . . . . . . . . . . . . . . . . . . . . . . . . . . . . . . . 21 Net Farm Income . . . . . . . . . . . . . . . . . . . . . . . . . . . . . . . . . . . . . . . . . . 21 Tracking How Net Income Flows to Operator Households . . . . . . . . . . 23
Farm Household Income . . . . . . . . . . . . . . . . . . . . . . . . . . . . . . . . . . . . . . 24
Conclusions . . . . . . . . . . . . . . . . . . . . . . . . . . . . . . . . . . . . . . . . . . . . . . . . . 25
References . . . . . . . . . . . . . . . . . . . . . . . . . . . . . . . . . . . . . . . . . . . . . . . . . . 26
iiiThe Economic Organization of U.S. Broiler Production / EIB-38
Economic Research Service/USDA
Summary
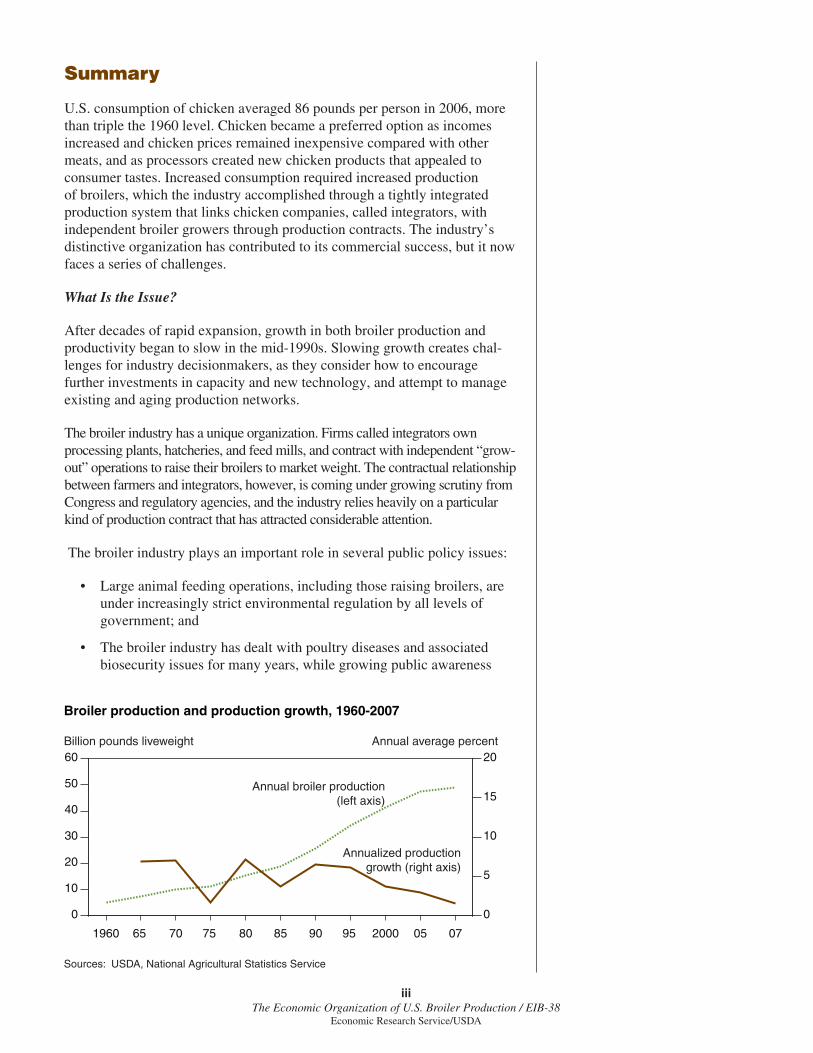
U.S. consumption of chicken averaged 86 pounds per person in 2006, more than triple the 1960 level. Chicken became a preferred option as incomes increased and chicken prices remained inexpensive compared with other meats, and as processors created new chicken products that appealed to consumer tastes. Increased consumption required increased production of broilers, which the industry accomplished through a tightly integrated production system that links chicken companies, called integrators, with independent broiler growers through production contracts. The industry’s distinctive organization has contributed to its commercial success, but it now faces a series of challenges.
What Is the Issue?
After decades of rapid expansion, growth in both broiler production and productivity began to slow in the mid-1990s. Slowing growth creates chal-lenges for industry decisionmakers, as they consider how to encourage further investments in capacity and new technology, and attempt to manage existing and aging production networks.
The broiler industry has a unique organization. Firms called integrators own processing plants, hatcheries, and feed mills, and contract with independent “grow-out” operations to raise their broilers to market weight. The contractual relationship between farmers and integrators, however, is coming under growing scrutiny from Congress and regulatory agencies, and the industry relies heavily on a particular kind of production contract that has attracted considerable attention.
The broiler industry plays an important role in several public policy issues:
• Large animal feeding operations, including those raising broilers, are under increasingly strict environmental regulation by all levels of government; and
• The broiler industry has dealt with poultry diseases and associated biosecurity issues for many years, while growing public awareness
Broiler production and production growth, 1960-2007
Sources: USDA, National Agricultural Statistics Service
Billion pounds liveweight Annual average percent
1960 65 70 75 80 85 90 95 2000 05 07
0
10
20
30
40
50
60
0
5
10
15
20
Annual broiler production(left axis)
Annualized productiongrowth (right axis)
ivThe Economic Organization of U.S. Broiler Production / EIB-38
Economic Research Service/USDA
of such threats plays an increasingly important role in industry and public policy planning.
What Did the Study Find?
Other industries use production contracts, but the broiler industry is distin-guished by the dominance of such contracts and the methods by which growers are paid. Almost all broiler growers’ contracts base the compensa-tion on how each grower’s performance compares with that of others.
Beyond that feature, however, contracts are far from uniform. Contracts can include other terms that tie base payments to actions that affect grower costs or that assign some expense or revenue categories to either the grower or the inte-grator. Contracts also cover a wide range of specifi ed durations, from just over a month to 15 years. Variations in contract design likely follow from differ-ences in grower location, size, and type of broiler housing, but the wide varia-tion in terms and payments makes it diffi cult for growers to evaluate contracts.
The industry’s organization has contributed to its commercial success. High rates of productivity growth, along with new product innovation, led to high growth rates for chicken production, domestic consumption, and exports. Growth in production slowed noticeably, however, after the mid-1990s. With slower production growth, investment in new housing also slowed. New housing embodies new technology, so slowing investment can hinder future productivity growth, unless older houses can be effectively retrofi tted with newer equipment. Integrators are requiring such retrofi tting for some opera-tions as a condition of extending their contract. For newer and larger opera-tions, integrators are offering contracts of longer duration to induce them to continue to invest in new technology.
Broiler production is gradually shifting to larger operations, a trend common to most agricultural commodities. For operators of small broiler enterprises, off-farm income is the primary source of the household’s income, and the broiler enterprise provides a modest amount of additional income. For larger operations, the broiler enterprise typically is the primary source of the household’s income. As a result, operators of larger enterprises may be more sensitive to the income risks arising from energy price fl uctuations and contract settlements. Contract features may need to be redesigned to adjust for differing risk exposures faced by growers.
Larger operations may realize scale economies in production, but they also concentrate poultry litter in localized areas. Litter is bedding material, such as wood shavings, sawdust, or straw, that is spread on the fl oors of broiler houses. When it is removed, it consists mostly of poultry manure, along with the original bedding, feathers, and spilled feed. In 2006, about 40 percent of used litter was spread on the farm’s fi elds, while the rest was removed from broiler operations for fi eld application elsewhere or for processing. There was enough of a market for litter in 2006 to allow growers to sell about a third of the litter removed from farms, but farmers had to give away the rest or pay to have it removed. Litter disposal remains a major issue confronting the industry.
vThe Economic Organization of U.S. Broiler Production / EIB-38
Economic Research Service/USDA
How Was the Study Conducted?
The analysis relies on data drawn from a large-scale representative survey of producers, conducted as part of the annual Agricultural Resource Management Survey (ARMS), which is the U.S. Department of Agriculture’s primary source of information on the fi nancial condition of farm businesses and households and farm production practices.
Two ARMS versions collect fi nancial and production information for all types of farms, but other versions target specifi c commodities and collect additional information on production practices, fi nancial performance, and contractual relationships for those commodity enterprises. ARMS included a broiler version for the fi rst time in the survey conducted early in 2007, with a focus on performance during 2006. The survey’s target population consisted of all operations that produced broilers for meat and had at least 1,000 broilers onsite at any time during 2006, in the 17 States that accounted for 94 percent of U.S. broiler production. Analyses in this report are based on responses received from 1,568 operations, out of 2,100 originally selected for the survey.
1The Economic Organization of U.S. Broiler Production / EIB-38
Economic Research Service/USDA
Introduction
This report describes the organization and economics of broiler production in 2006. Broilers, young chickens bred for meat, account for nearly all chicken meat and most poultry meat produced in the United States.1 The broiler industry’s processes are tightly controlled by fi rms called integrators, who operate processing plants, feed mills, and hatcheries, and who contract with farmers to grow broiler chicks to market weight. This report focuses on farms in the production or grow-out stage and their commercial relationship with integrators.2
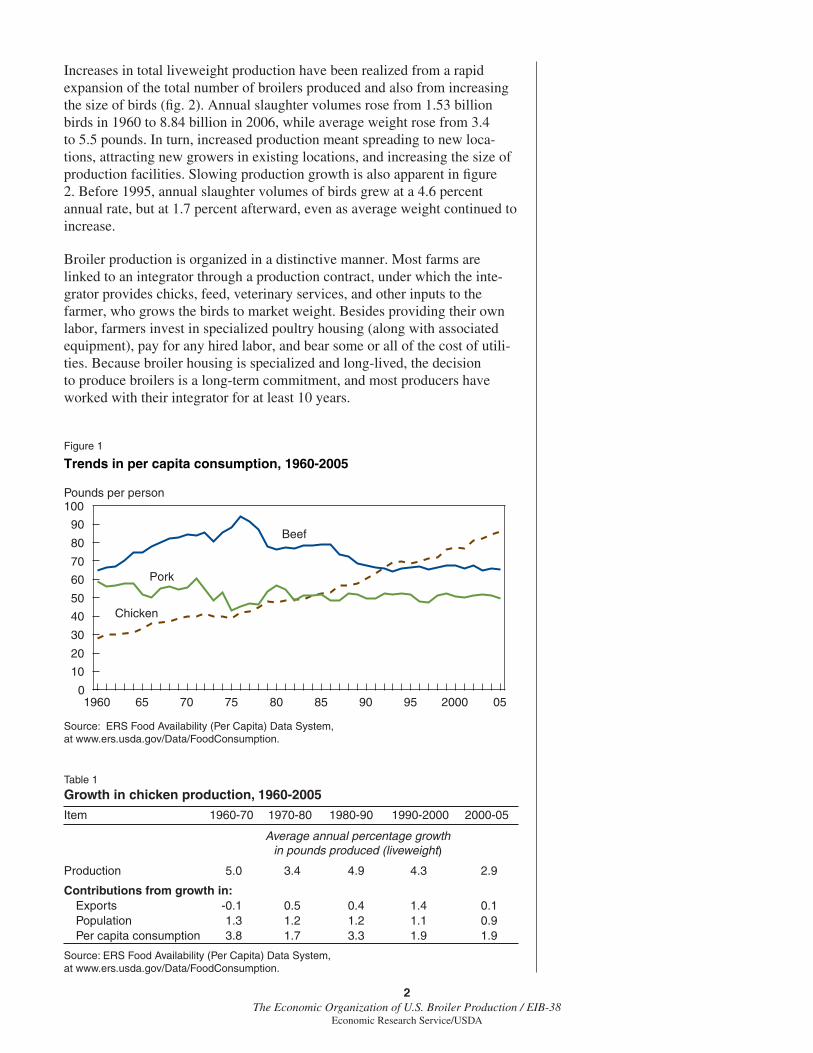
Broiler production grew rapidly for many years, fueled by powerful shifts in consumption patterns. In 1960, Americans consumed about 28 pounds of chicken per person, compared to nearly 60 pounds of pork and 65 pounds of beef (fi g. 1). Chicken consumption rose steadily in the ensuing decades, reaching 87 pounds per person in 2006, while per capita beef consumption remained virtually unchanged from its 1960 value and pork consumption declined. Increasing chicken consumption refl ected changes in consumer preferences, the introduction of many new chicken-based retail products, and declining relative prices for chicken.
Between 1960 and 2006, poultry prices rose by 2.7 percent per year while prices for all food rose by 4.2 percent per year, according to the Consumer Price Index (CPI). As a result, retail poultry became cheaper compared with other foods, encouraging a shift to poultry. Other price data indicate that rapid productivity growth was at the heart of poultry’s superior price perfor-mance. Prices for prepared feeds, the major input used by poultry producers, rose by 2.5 percent per year during the same period, but wholesale broiler prices rose by just 1.3 percent per year as the industry found ways to increase feed effi ciency.3
Per capita consumption increases of 2-4 percent per year, when combined with U.S. population growth of about 1 percent per year, provided the industry with substantial increases in demand over a long period. International markets provided a third source of demand growth, with increased chicken exports accounting for about a third of the total growth in production during the 1990s. Table 1 divides the growth in production into three parts—expanded exports, population, and consumption—and shows how changes in each affected the industry’s production growth.
Overall production growth slowed sharply after 2000. While per capita consumption continued to grow at 1.9 percent per year, the contribution of population growth fell in comparison to earlier years and export growth fell sharply (table 1). Changes in exchange rates can affect the competitiveness of U.S. exports, and growth in foreign incomes can be an important force. In the near future, a declining dollar, combined with income growth in Asia, may boost export growth again.
1Other chickens include capons and stewing hens, but broilers accounted for almost 99 percent of ready-to-cook chicken production in 2006, and chicken in turn accounted for 86 percent of all poultry production, with turkey taking up most of the remainder.
2The report does not cover breeder broiler or pullet operations that produce eggs for hatcheries.
3Using Producer Price Index (PPI) data.
2The Economic Organization of U.S. Broiler Production / EIB-38
Economic Research Service/USDA
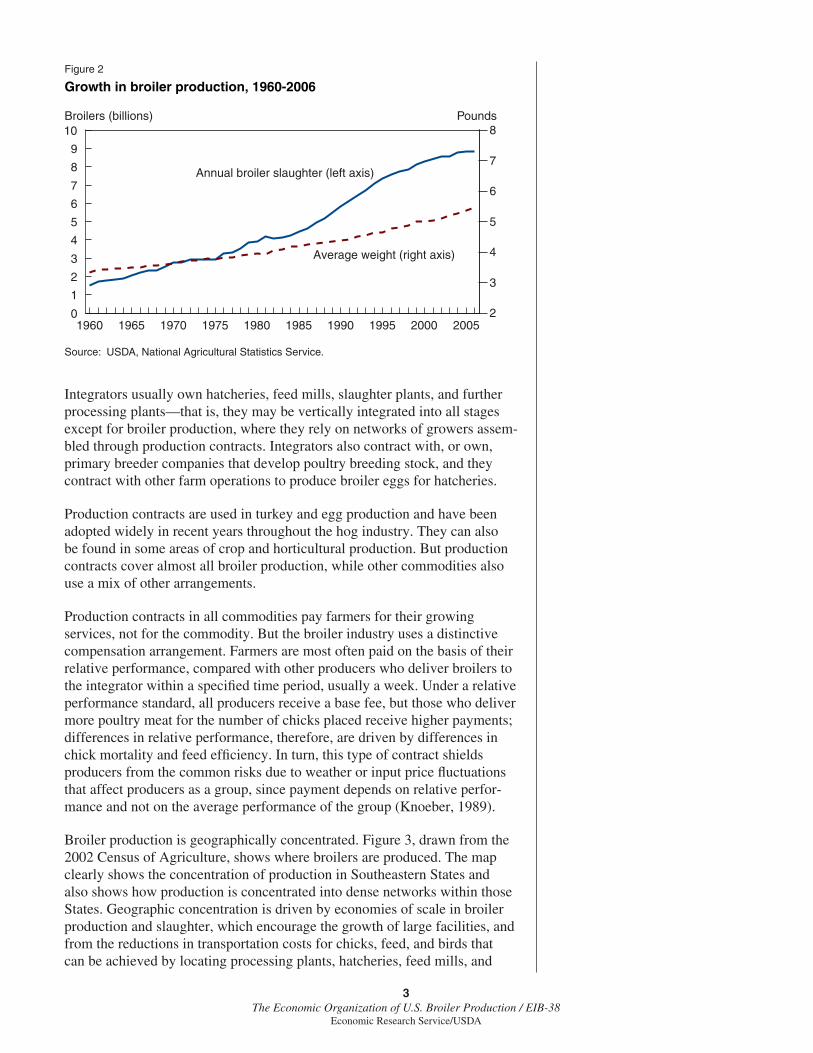
Increases in total liveweight production have been realized from a rapid expansion of the total number of broilers produced and also from increasing the size of birds (fi g. 2). Annual slaughter volumes rose from 1.53 billion birds in 1960 to 8.84 billion in 2006, while average weight rose from 3.4 to 5.5 pounds. In turn, increased production meant spreading to new loca-tions, attracting new growers in existing locations, and increasing the size of production facilities. Slowing production growth is also apparent in fi gure 2. Before 1995, annual slaughter volumes of birds grew at a 4.6 percent annual rate, but at 1.7 percent afterward, even as average weight continued to increase.
Broiler production is organized in a distinctive manner. Most farms are linked to an integrator through a production contract, under which the inte-grator provides chicks, feed, veterinary services, and other inputs to the farmer, who grows the birds to market weight. Besides providing their own labor, farmers invest in specialized poultry housing (along with associated equipment), pay for any hired labor, and bear some or all of the cost of utili-ties. Because broiler housing is specialized and long-lived, the decision to produce broilers is a long-term commitment, and most producers have worked with their integrator for at least 10 years.
Figure 1
Trends in per capita consumption, 1960-2005
Source: ERS Food Availability (Per Capita) Data System,at www.ers.usda.gov/Data/FoodConsumption.
1960 65 70 75 80 85 90 95 2000 050
10
20
30
40
50
60
70
80
90
100
Chicken
Beef
Pork
Pounds per person
Table 1
Growth in chicken production, 1960-2005
Item 1960-70 1970-80 1980-90 1990-2000 2000-05
Average annual percentage growth in pounds produced (liveweight)
Production 5.0 3.4 4.9 4.3 2.9
Contributions from growth in: Exports -0.1 0.5 0.4 1.4 0.1 Population 1.3 1.2 1.2 1.1 0.9 Per capita consumption 3.8 1.7 3.3 1.9 1.9
Source: ERS Food Availability (Per Capita) Data System, at www.ers.usda.gov/Data/FoodConsumption.
3The Economic Organization of U.S. Broiler Production / EIB-38
Economic Research Service/USDA
Integrators usually own hatcheries, feed mills, slaughter plants, and further processing plants—that is, they may be vertically integrated into all stages except for broiler production, where they rely on networks of growers assem-bled through production contracts. Integrators also contract with, or own, primary breeder companies that develop poultry breeding stock, and they contract with other farm operations to produce broiler eggs for hatcheries.
Production contracts are used in turkey and egg production and have been adopted widely in recent years throughout the hog industry. They can also be found in some areas of crop and horticultural production. But production contracts cover almost all broiler production, while other commodities also use a mix of other arrangements.
Production contracts in all commodities pay farmers for their growing services, not for the commodity. But the broiler industry uses a distinctive compensation arrangement. Farmers are most often paid on the basis of their relative performance, compared with other producers who deliver broilers to the integrator within a specifi ed time period, usually a week. Under a relative performance standard, all producers receive a base fee, but those who deliver more poultry meat for the number of chicks placed receive higher payments; differences in relative performance, therefore, are driven by differences in chick mortality and feed effi ciency. In turn, this type of contract shields producers from the common risks due to weather or input price fl uctuations that affect producers as a group, since payment depends on relative perfor-mance and not on the average performance of the group (Knoeber, 1989).
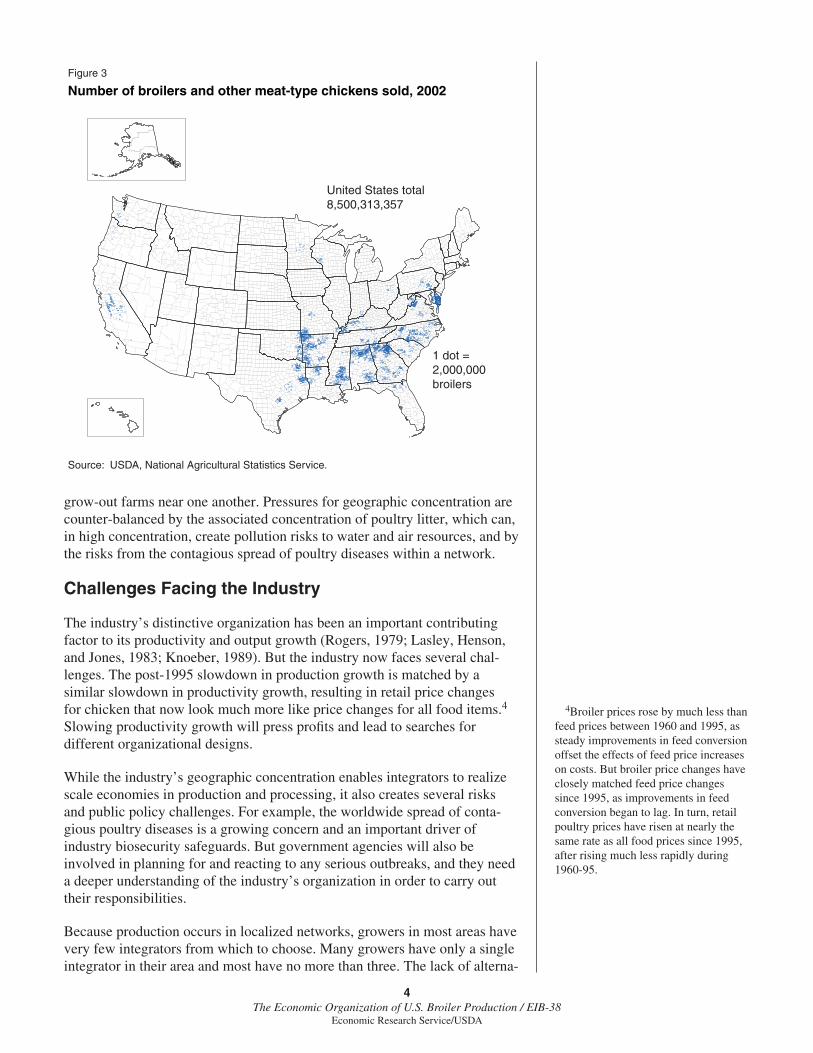
Broiler production is geographically concentrated. Figure 3, drawn from the 2002 Census of Agriculture, shows where broilers are produced. The map clearly shows the concentration of production in Southeastern States and also shows how production is concentrated into dense networks within those States. Geographic concentration is driven by economies of scale in broiler production and slaughter, which encourage the growth of large facilities, and from the reductions in transportation costs for chicks, feed, and birds that can be achieved by locating processing plants, hatcheries, feed mills, and
Figure 2
Growth in broiler production, 1960-2006
Source: USDA, National Agricultural Statistics Service.
Broilers (billions) Pounds
1960 1965 1970 1975 1980 1985 1990 1995 2000 20050
1
2
3
4
5
6
7
8
9
10
2
3
4
5
6
7
8
Annual broiler slaughter (left axis)
Average weight (right axis)
4The Economic Organization of U.S. Broiler Production / EIB-38
Economic Research Service/USDA
grow-out farms near one another. Pressures for geographic concentration are counter-balanced by the associated concentration of poultry litter, which can, in high concentration, create pollution risks to water and air resources, and by the risks from the contagious spread of poultry diseases within a network.
Challenges Facing the Industry
The industry’s distinctive organization has been an important contributing factor to its productivity and output growth (Rogers, 1979; Lasley, Henson, and Jones, 1983; Knoeber, 1989). But the industry now faces several chal-lenges. The post-1995 slowdown in production growth is matched by a similar slowdown in productivity growth, resulting in retail price changes for chicken that now look much more like price changes for all food items.4
Slowing productivity growth will press profi ts and lead to searches for different organizational designs.
While the industry’s geographic concentration enables integrators to realize scale economies in production and processing, it also creates several risks and public policy challenges. For example, the worldwide spread of conta-gious poultry diseases is a growing concern and an important driver of industry biosecurity safeguards. But government agencies will also be involved in planning for and reacting to any serious outbreaks, and they need a deeper understanding of the industry’s organization in order to carry out their responsibilities.
Because production occurs in localized networks, growers in most areas have very few integrators from which to choose. Many growers have only a single integrator in their area and most have no more than three. The lack of alterna-
4Broiler prices rose by much less than feed prices between 1960 and 1995, as steady improvements in feed conversion offset the effects of feed price increases on costs. But broiler price changes have closely matched feed price changes since 1995, as improvements in feed conversion began to lag. In turn, retail poultry prices have risen at nearly the same rate as all food prices since 1995, after rising much less rapidly during 1960-95.
Figure 3
Number of broilers and other meat-type chickens sold, 2002
Source: USDA, National Agricultural Statistics Service.
United States total8,500,313,357
1 dot = 2,000,000broilers
5The Economic Organization of U.S. Broiler Production / EIB-38
Economic Research Service/USDA
tives has led to controversy over production contracts and to legislative and regulatory proposals to regulate them.
Finally, high geographic concentrations of broiler litter can create increased risks of water and air pollution from excessive applications of the nitrogen and phosphorous in litter. Concerns over those risks have led to expanded regulatory intervention, expanded funding under USDA conservation programs, and public and private sector searches for solutions.
This report is designed to provide an overview of the industry’s organiza-tion and economics, so as to provide objective and reliable background information. Our data are drawn from a large-scale representative survey of producers conducted early in 2007. The survey is part of the Agricultural Resource Management Survey (ARMS), an annual survey of U.S. farms that serves as the U.S. Department of Agriculture’s primary source of infor-mation on the fi nancial conditions and production practices of farm busi-nesses and the well-being of farm households. ARMS has several versions. Two—a short version distributed by mail and a personally enumerated longer version—focus on all types of farms. Broiler operations do appear in those versions and some prior Economic Research Service (ERS) studies have used that data (Perry, Banker, and Green, 1999; MacDonald and Korb, 2008).
Other survey versions (up to three each year), which are also personally enumerated, focus on producers of selected commodities and include detailed questions on commodity production practices, as well as contractual and marketing relationships. A broiler version was included, for the fi rst time, in an ARMS conducted in early 2007; the questions focused on performance during 2006.
Conducting a Broiler Version of the ARMS
The survey focused on commercial producers of broilers grown for meat. Therefore, a sample was drawn from a target population consisting of all operations that produced broilers for meat and had at least 1,000 broilers onsite at any time during 2006. The sample defi nition excluded operations that raise broilers for show or private consumption, as well as egg-laying, hatchery, and broiler breeder operations. To conduct the survey effi ciently, standard practice for commodity-specifi c ARMS versions is to limit the sample to major production States—in this case, 17 States that account for 94 percent of U.S. broiler production.5
ARMS samples are randomly selected from a list of operations compiled from the Census of Agriculture, commercial databases, and USDA program databases. In June 2006, sample farms were screened for continued operation during ARMS survey Phase I. The questionnaire was fi nalized in November 2006, and survey enumerators conducted their interviews in February and March 2007. Of 2,100 operations targeted for interviews for the broiler version, 1,602 usable survey responses were received. Some respondents were still in farming, but did not produce broilers for meat during 2006, leaving 1,568 broiler producers for analysis (a 75-percent response rate). Most of this report focuses on the 1,546 operations that reported having a production contract for broilers (22 were independents, processor-owned, or did not respond to the question).
5We used the 2002 Census of Agricul-ture to identify the States: Alabama, Ar-kansas, California, Delaware, Georgia, Kentucky, Louisiana, Maryland, Missis-sippi, Missouri, North Carolina, Okla-homa, Pennsylvania, South Carolina, Tennessee, Texas, and Virginia. A focus on commercial producers of broilers raised for meat provides a large sample of similar operations for analysis.
6The Economic Organization of U.S. Broiler Production / EIB-38
Economic Research Service/USDA
To obtain more reliable estimates, some farms have a higher probability of sample selection. For example, larger operations are more likely to be selected for interviews than smaller, and selection probabilities also vary across geographic areas. Each sample farm represents a number of other farms from a similar geographic location and size class. These weights (the number of farms that each sample point represents) range from 3 to 40 farms. When sample observations are weighted to refl ect their varying selection probabilities, population estimates for production and other industry charac-teristics can be generated.
7The Economic Organization of U.S. Broiler Production / EIB-38
Economic Research Service/USDA
How Production Is Organized
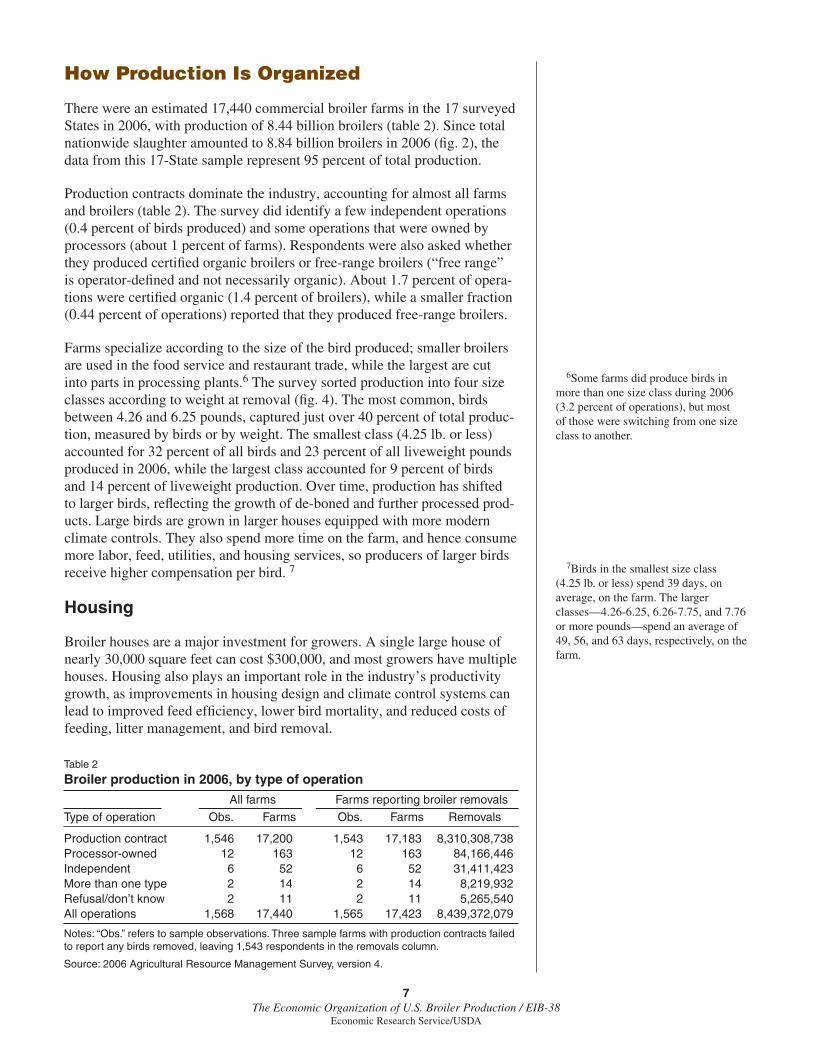
There were an estimated 17,440 commercial broiler farms in the 17 surveyed States in 2006, with production of 8.44 billion broilers (table 2). Since total nationwide slaughter amounted to 8.84 billion broilers in 2006 (fi g. 2), the data from this 17-State sample represent 95 percent of total production.
Production contracts dominate the industry, accounting for almost all farms and broilers (table 2). The survey did identify a few independent operations (0.4 percent of birds produced) and some operations that were owned by processors (about 1 percent of farms). Respondents were also asked whether they produced certifi ed organic broilers or free-range broilers (“free range” is operator-defi ned and not necessarily organic). About 1.7 percent of opera-tions were certifi ed organic (1.4 percent of broilers), while a smaller fraction (0.44 percent of operations) reported that they produced free-range broilers.
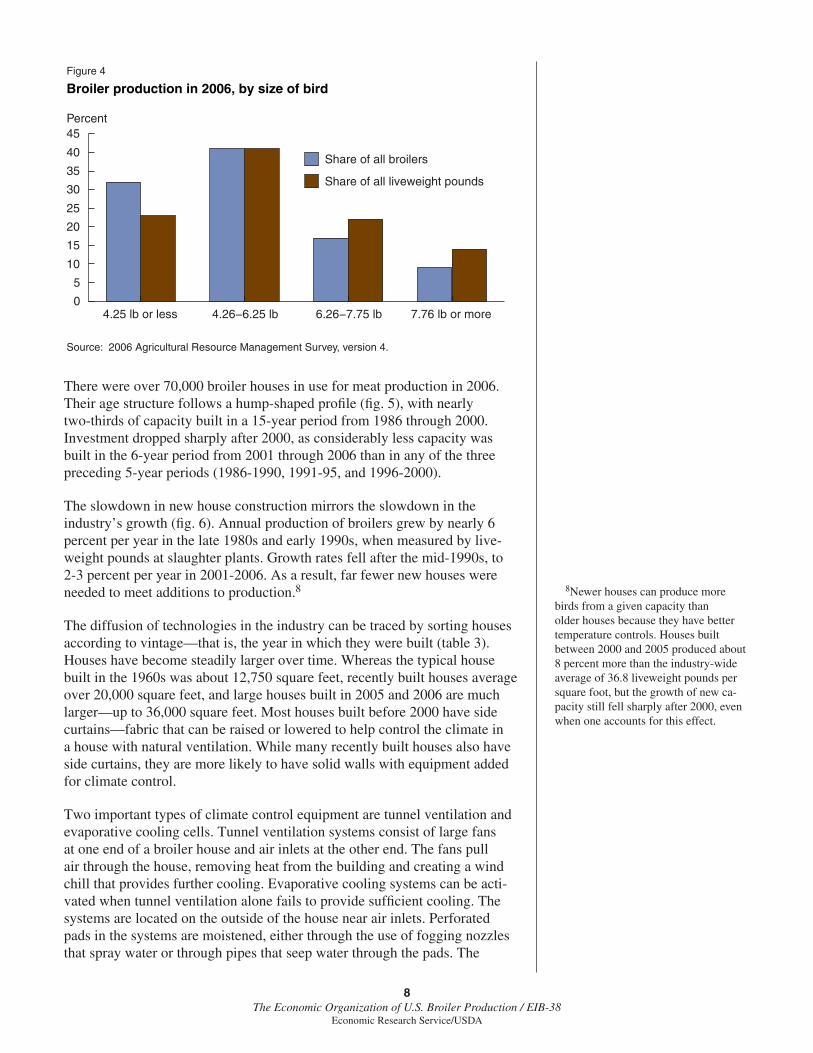
Farms specialize according to the size of the bird produced; smaller broilers are used in the food service and restaurant trade, while the largest are cut into parts in processing plants.6 The survey sorted production into four size classes according to weight at removal (fi g. 4). The most common, birds between 4.26 and 6.25 pounds, captured just over 40 percent of total produc-tion, measured by birds or by weight. The smallest class (4.25 lb. or less) accounted for 32 percent of all birds and 23 percent of all liveweight pounds produced in 2006, while the largest class accounted for 9 percent of birds and 14 percent of liveweight production. Over time, production has shifted to larger birds, refl ecting the growth of de-boned and further processed prod-ucts. Large birds are grown in larger houses equipped with more modern climate controls. They also spend more time on the farm, and hence consume more labor, feed, utilities, and housing services, so producers of larger birds receive higher compensation per bird. 7
Housing
Broiler houses are a major investment for growers. A single large house of nearly 30,000 square feet can cost $300,000, and most growers have multiple houses. Housing also plays an important role in the industry’s productivity growth, as improvements in housing design and climate control systems can lead to improved feed effi ciency, lower bird mortality, and reduced costs of feeding, litter management, and bird removal.
6Some farms did produce birds in more than one size class during 2006 (3.2 percent of operations), but most of those were switching from one size class to another.
7Birds in the smallest size class (4.25 lb. or less) spend 39 days, on average, on the farm. The larger classes—4.26-6.25, 6.26-7.75, and 7.76 or more pounds—spend an average of 49, 56, and 63 days, respectively, on the farm.
Table 2
Broiler production in 2006, by type of operation
All farms Farms reporting broiler removals
Type of operation Obs. Farms Obs. Farms Removals
Production contract 1,546 17,200 1,543 17,183 8,310,308,738Processor-owned 12 163 12 163 84,166,446Independent 6 52 6 52 31,411,423More than one type 2 14 2 14 8,219,932Refusal/don’t know 2 11 2 11 5,265,540All operations 1,568 17,440 1,565 17,423 8,439,372,079
Notes: “Obs.” refers to sample observations. Three sample farms with production contracts failed to report any birds removed, leaving 1,543 respondents in the removals column.
Source: 2006 Agricultural Resource Management Survey, version 4.
8The Economic Organization of U.S. Broiler Production / EIB-38
Economic Research Service/USDA
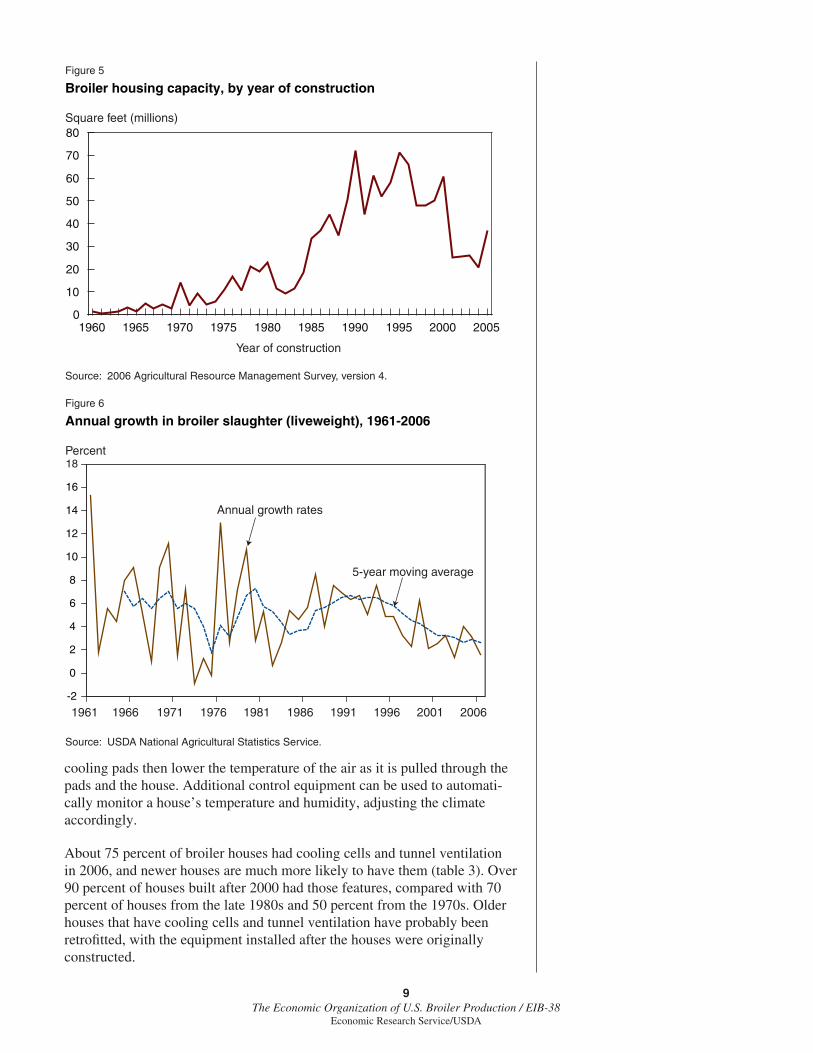
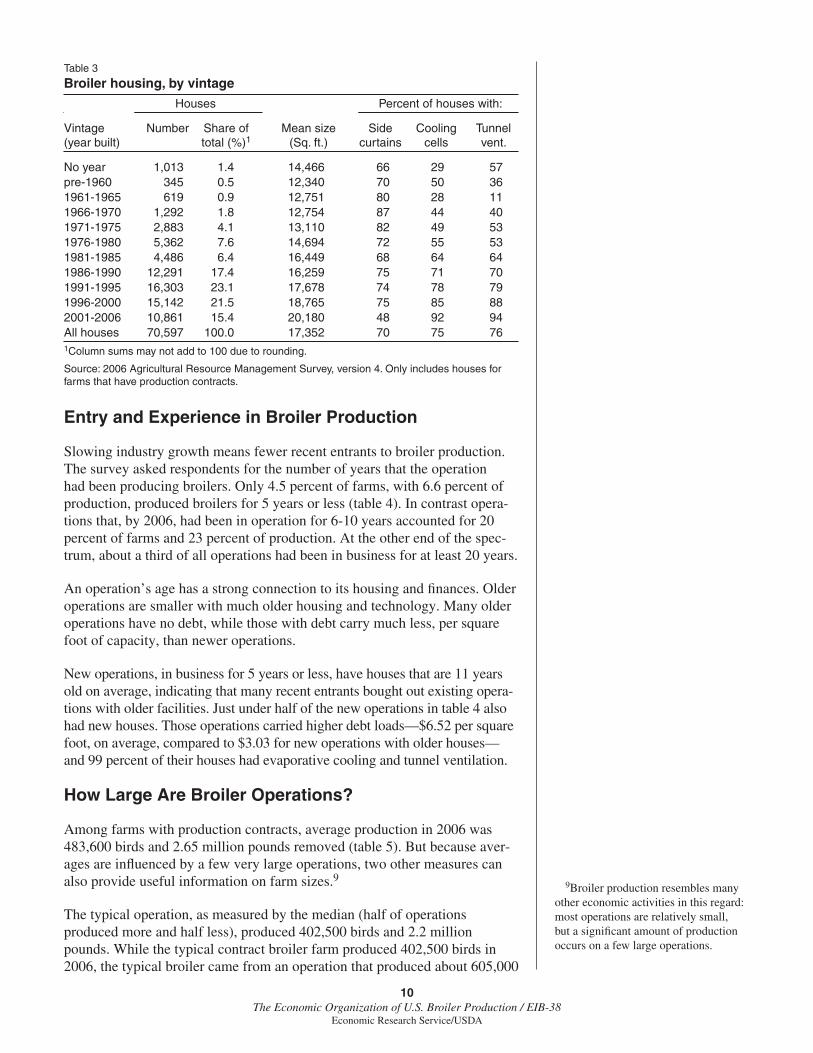
There were over 70,000 broiler houses in use for meat production in 2006. Their age structure follows a hump-shaped profi le (fi g. 5), with nearly two-thirds of capacity built in a 15-year period from 1986 through 2000. Investment dropped sharply after 2000, as considerably less capacity was built in the 6-year period from 2001 through 2006 than in any of the three preceding 5-year periods (1986-1990, 1991-95, and 1996-2000).
The slowdown in new house construction mirrors the slowdown in the industry’s growth (fi g. 6). Annual production of broilers grew by nearly 6 percent per year in the late 1980s and early 1990s, when measured by live-weight pounds at slaughter plants. Growth rates fell after the mid-1990s, to 2-3 percent per year in 2001-2006. As a result, far fewer new houses were needed to meet additions to production.8
The diffusion of technologies in the industry can be traced by sorting houses according to vintage—that is, the year in which they were built (table 3). Houses have become steadily larger over time. Whereas the typical house built in the 1960s was about 12,750 square feet, recently built houses average over 20,000 square feet, and large houses built in 2005 and 2006 are much larger—up to 36,000 square feet. Most houses built before 2000 have side curtains—fabric that can be raised or lowered to help control the climate in a house with natural ventilation. While many recently built houses also have side curtains, they are more likely to have solid walls with equipment added for climate control.
Two important types of climate control equipment are tunnel ventilation and evaporative cooling cells. Tunnel ventilation systems consist of large fans at one end of a broiler house and air inlets at the other end. The fans pull air through the house, removing heat from the building and creating a wind chill that provides further cooling. Evaporative cooling systems can be acti-vated when tunnel ventilation alone fails to provide suffi cient cooling. The systems are located on the outside of the house near air inlets. Perforated pads in the systems are moistened, either through the use of fogging nozzles that spray water or through pipes that seep water through the pads. The
8Newer houses can produce more birds from a given capacity than older houses because they have better temperature controls. Houses built between 2000 and 2005 produced about 8 percent more than the industry-wide average of 36.8 liveweight pounds per square foot, but the growth of new ca-pacity still fell sharply after 2000, even when one accounts for this effect.
Figure 4
Broiler production in 2006, by size of bird
Source: 2006 Agricultural Resource Management Survey, version 4.
4.25 lb or less 4.26−6.25 lb 6.26−7.75 lb 7.76 lb or more0
5
10
15
20
25
30
35
40
45
Share of all broilers
Share of all liveweight pounds
Percent
9The Economic Organization of U.S. Broiler Production / EIB-38
Economic Research Service/USDA
cooling pads then lower the temperature of the air as it is pulled through the pads and the house. Additional control equipment can be used to automati-cally monitor a house’s temperature and humidity, adjusting the climate accordingly.
About 75 percent of broiler houses had cooling cells and tunnel ventilation in 2006, and newer houses are much more likely to have them (table 3). Over 90 percent of houses built after 2000 had those features, compared with 70 percent of houses from the late 1980s and 50 percent from the 1970s. Older houses that have cooling cells and tunnel ventilation have probably been retrofi tted, with the equipment installed after the houses were originally constructed.
Figure 5
Broiler housing capacity, by year of construction
Source: 2006 Agricultural Resource Management Survey, version 4.
Square feet (millions)
1960 1965 1970 1975 1980 1985 1990 1995 2000 20050
10
20
30
40
50
60
70
80
Year of construction
Figure 6
Annual growth in broiler slaughter (liveweight), 1961-2006
Source: USDA National Agricultural Statistics Service.
Percent
Annual growth rates
5-year moving average
-2
0
2
4
6
8
10
12
14
16
18
1961 1966 1971 1976 1981 1986 1991 1996 2001 2006
10The Economic Organization of U.S. Broiler Production / EIB-38
Economic Research Service/USDA
Entry and Experience in Broiler Production
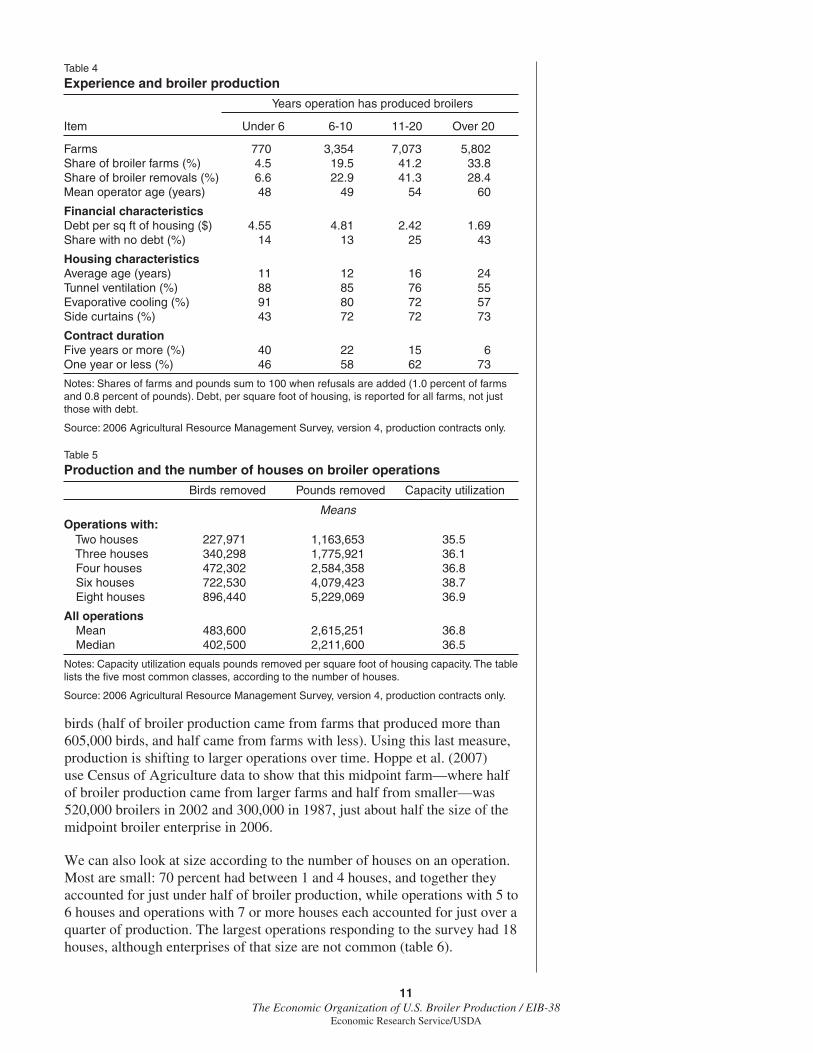
Slowing industry growth means fewer recent entrants to broiler production. The survey asked respondents for the number of years that the operation had been producing broilers. Only 4.5 percent of farms, with 6.6 percent of production, produced broilers for 5 years or less (table 4). In contrast opera-tions that, by 2006, had been in operation for 6-10 years accounted for 20 percent of farms and 23 percent of production. At the other end of the spec-trum, about a third of all operations had been in business for at least 20 years.
An operation’s age has a strong connection to its housing and fi nances. Older operations are smaller with much older housing and technology. Many older operations have no debt, while those with debt carry much less, per square foot of capacity, than newer operations.
New operations, in business for 5 years or less, have houses that are 11 years old on average, indicating that many recent entrants bought out existing opera-tions with older facilities. Just under half of the new operations in table 4 also had new houses. Those operations carried higher debt loads—$6.52 per square foot, on average, compared to $3.03 for new operations with older houses—and 99 percent of their houses had evaporative cooling and tunnel ventilation.
How Large Are Broiler Operations?
Among farms with production contracts, average production in 2006 was 483,600 birds and 2.65 million pounds removed (table 5). But because aver-ages are infl uenced by a few very large operations, two other measures can also provide useful information on farm sizes.9
The typical operation, as measured by the median (half of operations produced more and half less), produced 402,500 birds and 2.2 million pounds. While the typical contract broiler farm produced 402,500 birds in 2006, the typical broiler came from an operation that produced about 605,000
9Broiler production resembles many other economic activities in this regard: most operations are relatively small, but a signifi cant amount of production occurs on a few large operations.
Table 3
Broiler housing, by vintage
Houses Percent of houses with:
Vintage Number Share of Mean size Side Cooling Tunnel (year built) total (%)1 (Sq. ft.) curtains cells vent.
No year 1,013 1.4 14,466 66 29 57pre-1960 345 0.5 12,340 70 50 361961-1965 619 0.9 12,751 80 28 111966-1970 1,292 1.8 12,754 87 44 401971-1975 2,883 4.1 13,110 82 49 531976-1980 5,362 7.6 14,694 72 55 531981-1985 4,486 6.4 16,449 68 64 641986-1990 12,291 17.4 16,259 75 71 701991-1995 16,303 23.1 17,678 74 78 791996-2000 15,142 21.5 18,765 75 85 882001-2006 10,861 15.4 20,180 48 92 94All houses 70,597 100.0 17,352 70 75 761Column sums may not add to 100 due to rounding.
Source: 2006 Agricultural Resource Management Survey, version 4. Only includes houses for farms that have production contracts.
11The Economic Organization of U.S. Broiler Production / EIB-38
Economic Research Service/USDA
birds (half of broiler production came from farms that produced more than 605,000 birds, and half came from farms with less). Using this last measure, production is shifting to larger operations over time. Hoppe et al. (2007) use Census of Agriculture data to show that this midpoint farm—where half of broiler production came from larger farms and half from smaller—was 520,000 broilers in 2002 and 300,000 in 1987, just about half the size of the midpoint broiler enterprise in 2006.
We can also look at size according to the number of houses on an operation. Most are small: 70 percent had between 1 and 4 houses, and together they accounted for just under half of broiler production, while operations with 5 to 6 houses and operations with 7 or more houses each accounted for just over a quarter of production. The largest operations responding to the survey had 18 houses, although enterprises of that size are not common (table 6).
Table 4
Experience and broiler production
Years operation has produced broilers
Item Under 6 6-10 11-20 Over 20
Farms 770 3,354 7,073 5,802Share of broiler farms (%) 4.5 19.5 41.2 33.8Share of broiler removals (%) 6.6 22.9 41.3 28.4Mean operator age (years) 48 49 54 60
Financial characteristics Debt per sq ft of housing ($) 4.55 4.81 2.42 1.69Share with no debt (%) 14 13 25 43
Housing characteristics Average age (years) 11 12 16 24Tunnel ventilation (%) 88 85 76 55Evaporative cooling (%) 91 80 72 57Side curtains (%) 43 72 72 73
Contract duration Five years or more (%) 40 22 15 6One year or less (%) 46 58 62 73
Notes: Shares of farms and pounds sum to 100 when refusals are added (1.0 percent of farms and 0.8 percent of pounds). Debt, per square foot of housing, is reported for all farms, not just those with debt.
Source: 2006 Agricultural Resource Management Survey, version 4, production contracts only.
Table 5
Production and the number of houses on broiler operations
Birds removed Pounds removed Capacity utilization
MeansOperations with: Two houses 227,971 1,163,653 35.5 Three houses 340,298 1,775,921 36.1 Four houses 472,302 2,584,358 36.8 Six houses 722,530 4,079,423 38.7 Eight houses 896,440 5,229,069 36.9
All operations Mean 483,600 2,615,251 36.8 Median 402,500 2,211,600 36.5
Notes: Capacity utilization equals pounds removed per square foot of housing capacity. The table lists the fi ve most common classes, according to the number of houses.
Source: 2006 Agricultural Resource Management Survey, version 4, production contracts only.
12The Economic Organization of U.S. Broiler Production / EIB-38
Economic Research Service/USDA
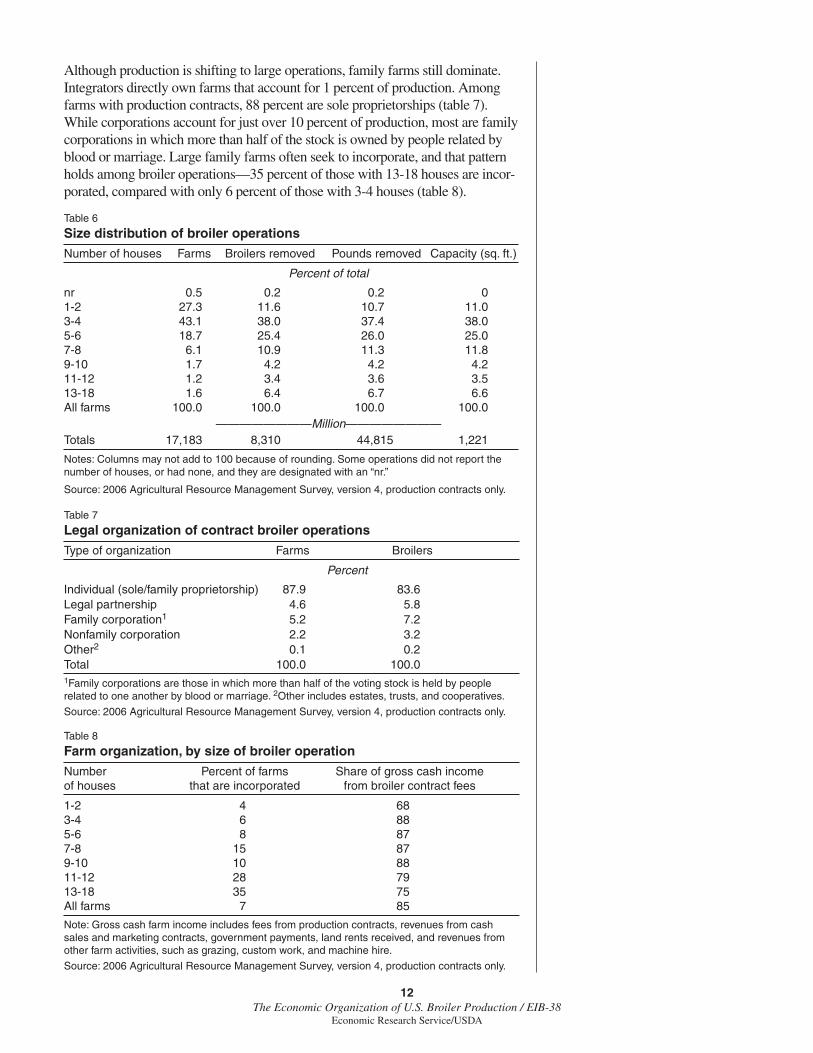
Although production is shifting to large operations, family farms still dominate. Integrators directly own farms that account for 1 percent of production. Among farms with production contracts, 88 percent are sole proprietorships (table 7). While corporations account for just over 10 percent of production, most are family corporations in which more than half of the stock is owned by people related by blood or marriage. Large family farms often seek to incorporate, and that pattern holds among broiler operations—35 percent of those with 13-18 houses are incor-porated, compared with only 6 percent of those with 3-4 houses (table 8).
Table 6
Size distribution of broiler operations
Number of houses Farms Broilers removed Pounds removed Capacity (sq. ft.)
Percent of total
nr 0.5 0.2 0.2 01-2 27.3 11.6 10.7 11.03-4 43.1 38.0 37.4 38.05-6 18.7 25.4 26.0 25.07-8 6.1 10.9 11.3 11.89-10 1.7 4.2 4.2 4.211-12 1.2 3.4 3.6 3.513-18 1.6 6.4 6.7 6.6All farms 100.0 100.0 100.0 100.0 ————————Million————————Totals 17,183 8,310 44,815 1,221
Notes: Columns may not add to 100 because of rounding. Some operations did not report the number of houses, or had none, and they are designated with an “nr.”
Source: 2006 Agricultural Resource Management Survey, version 4, production contracts only.
Table 7
Legal organization of contract broiler operations
Type of organization Farms Broilers
Percent
Individual (sole/family proprietorship) 87.9 83.6Legal partnership 4.6 5.8Family corporation1 5.2 7.2Nonfamily corporation 2.2 3.2Other2 0.1 0.2Total 100.0 100.01Family corporations are those in which more than half of the voting stock is held by people related to one another by blood or marriage. 2Other includes estates, trusts, and cooperatives.
Source: 2006 Agricultural Resource Management Survey, version 4, production contracts only.
Table 8
Farm organization, by size of broiler operation
Number Percent of farms Share of gross cash incomeof houses that are incorporated from broiler contract fees
1-2 4 683-4 6 885-6 8 877-8 15 879-10 10 8811-12 28 7913-18 35 75All farms 7 85
Note: Gross cash farm income includes fees from production contracts, revenues from cash sales and marketing contracts, government payments, land rents received, and revenues from other farm activities, such as grazing, custom work, and machine hire.
Source: 2006 Agricultural Resource Management Survey, version 4, production contracts only.
13The Economic Organization of U.S. Broiler Production / EIB-38
Economic Research Service/USDA
Production Contracts
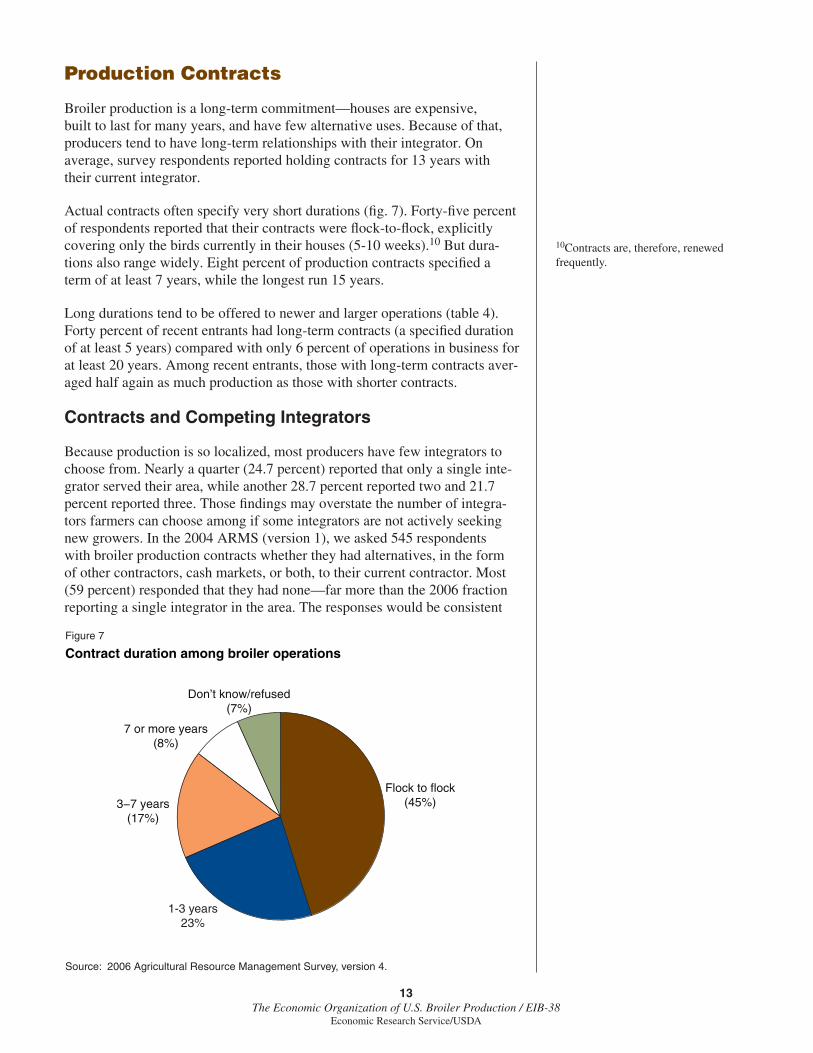
Broiler production is a long-term commitment—houses are expensive, built to last for many years, and have few alternative uses. Because of that, producers tend to have long-term relationships with their integrator. On average, survey respondents reported holding contracts for 13 years with their current integrator.
Actual contracts often specify very short durations (fi g. 7). Forty-fi ve percent of respondents reported that their contracts were fl ock-to-fl ock, explicitly covering only the birds currently in their houses (5-10 weeks).10 But dura-tions also range widely. Eight percent of production contracts specifi ed a term of at least 7 years, while the longest run 15 years.
Long durations tend to be offered to newer and larger operations (table 4). Forty percent of recent entrants had long-term contracts (a specifi ed duration of at least 5 years) compared with only 6 percent of operations in business for at least 20 years. Among recent entrants, those with long-term contracts aver-aged half again as much production as those with shorter contracts.
Contracts and Competing Integrators
Because production is so localized, most producers have few integrators to choose from. Nearly a quarter (24.7 percent) reported that only a single inte-grator served their area, while another 28.7 percent reported two and 21.7 percent reported three. Those fi ndings may overstate the number of integra-tors farmers can choose among if some integrators are not actively seeking new growers. In the 2004 ARMS (version 1), we asked 545 respondents with broiler production contracts whether they had alternatives, in the form of other contractors, cash markets, or both, to their current contractor. Most (59 percent) responded that they had none—far more than the 2006 fraction reporting a single integrator in the area. The responses would be consistent
10Contracts are, therefore, renewed frequently.
Figure 7
Contract duration among broiler operations
Source: 2006 Agricultural Resource Management Survey, version 4.
Flock to flock(45%)3−7 years
(17%)
7 or more years(8%)
Don’t know/refused(7%)
1-3 years23%
14The Economic Organization of U.S. Broiler Production / EIB-38
Economic Research Service/USDA
with one another if some integrators, particularly those in areas with 2 or 3, were not recruiting growers.
Integrators will not necessarily be able to exercise market power, even if there are only one or two in an area, because the competition for growers depends on more than just the number of integrators in a market. Integrators must recruit growers away from other activities, such as producing other commodities on the farm or working off the farm. Those outside options for growers set limits on the degree to which integrators can impose low fees on growers. There is little empirical evidence, however, of the effects of inte-grator concentration on grower returns.
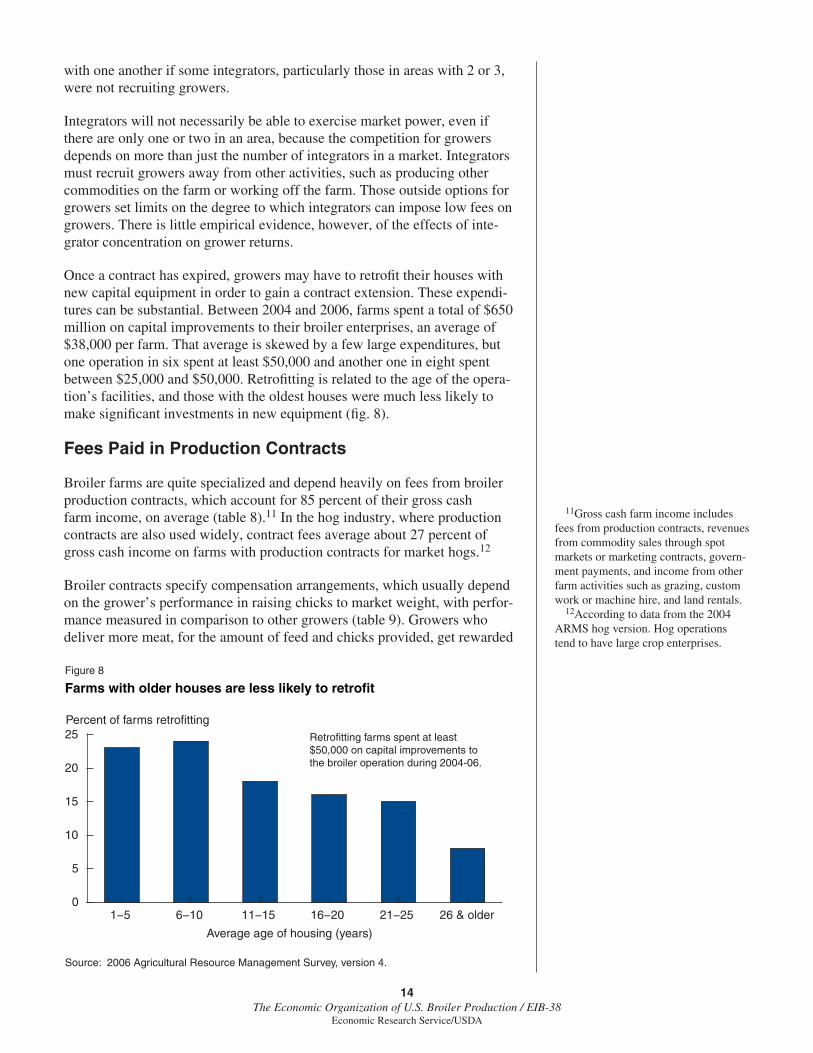
Once a contract has expired, growers may have to retrofi t their houses with new capital equipment in order to gain a contract extension. These expendi-tures can be substantial. Between 2004 and 2006, farms spent a total of $650 million on capital improvements to their broiler enterprises, an average of $38,000 per farm. That average is skewed by a few large expenditures, but one operation in six spent at least $50,000 and another one in eight spent between $25,000 and $50,000. Retrofi tting is related to the age of the opera-tion’s facilities, and those with the oldest houses were much less likely to make signifi cant investments in new equipment (fi g. 8).
Fees Paid in Production Contracts
Broiler farms are quite specialized and depend heavily on fees from broiler production contracts, which account for 85 percent of their gross cash farm income, on average (table 8).11 In the hog industry, where production contracts are also used widely, contract fees average about 27 percent of gross cash income on farms with production contracts for market hogs.12
Broiler contracts specify compensation arrangements, which usually depend on the grower’s performance in raising chicks to market weight, with perfor-mance measured in comparison to other growers (table 9). Growers who deliver more meat, for the amount of feed and chicks provided, get rewarded
11Gross cash farm income includes fees from production contracts, revenues from commodity sales through spot markets or marketing contracts, govern-ment payments, and income from other farm activities such as grazing, custom work or machine hire, and land rentals. 12According to data from the 2004 ARMS hog version. Hog operations tend to have large crop enterprises.
Figure 8
Farms with older houses are less likely to retrofit
Source: 2006 Agricultural Resource Management Survey, version 4.
Average age of housing (years)
1−5 6−10 11−15 16−20 21−25 26 & older0
5
10
15
20
25Percent of farms retrofitting
Retrofitting farms spent at least $50,000 on capital improvements to the broiler operation during 2004-06.
15The Economic Organization of U.S. Broiler Production / EIB-38
Economic Research Service/USDA
under the relative performance design of contract compensation. In turn, that depends on feed effi ciency and mortality. Other factors may infl uence contract payments. Some contracts adjust compensation for energy prices, market prices of broilers, or local catastrophes. Furthermore, pricing sched-ules may vary across locations, depending on the amount of competition that an integrator faces in attracting growers. But relative performance has a powerful effect on compensation, and the strongest performers can be paid 50 percent more per pound than the weakest.
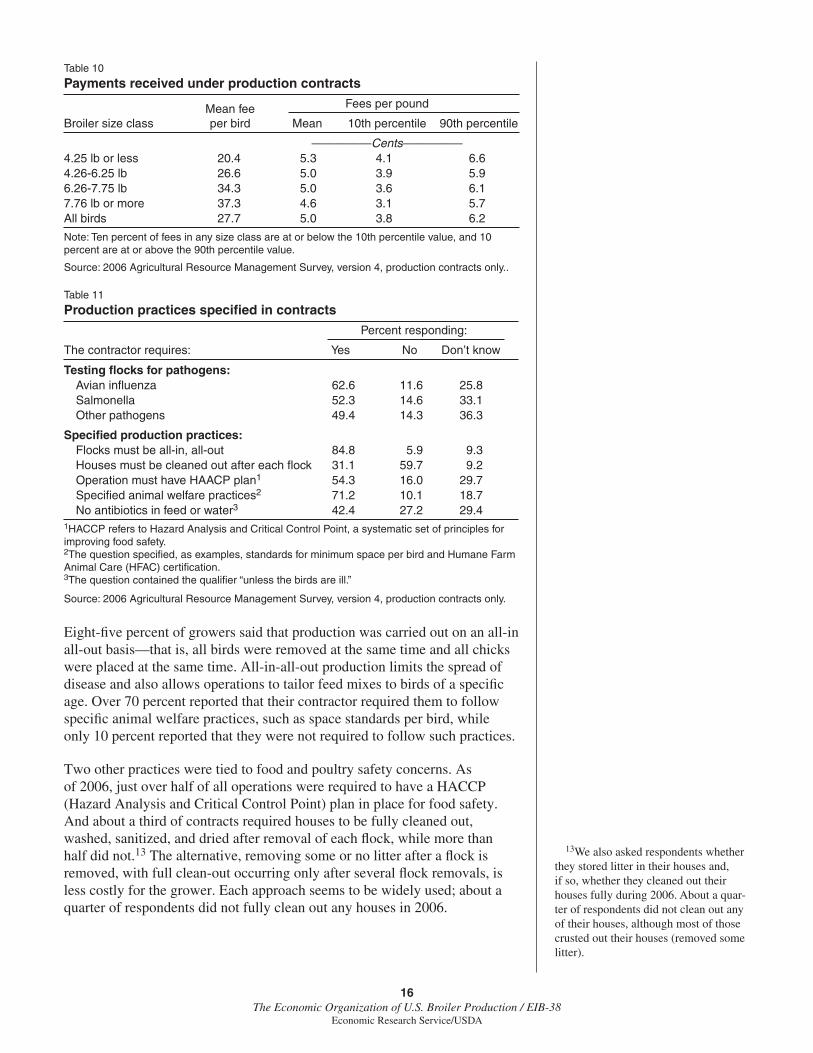
Fees received under production contracts vary with the size of the bird produced (table 10). Operations that produce larger birds receive more per bird—37 cents, on average in the largest size class, compared with 20 cents in the smallest. But larger birds also cost growers more, because they have longer production cycles, thus using more energy, labor, and housing services. For that reason, fees are better analyzed on a per pound basis, where they average about 5 cents (liveweight), with average fees falling slightly as bird sizes increase. Because fees can vary widely with relative performance, the 10th and 90th percentile values for fees are also reported in table 10. This “interdecile range” captures the variation in fees around the average (10 percent of growers receive fees that are at or below the 10th percentile value, and 10 percent receive fees that are at or above the 90th percentile value). While average fees cluster around 5 cents per pound, fees at the 10th percen-tile can fall to 3 and 4 cents per pound (varying with bird size), while fees at the 90th percentile cluster around 6 cents per pound. Some of the variation may refl ect differences in relative performance among producers, but the variation can refl ect other elements of contracting as well. For example, inte-grators in some areas bear at least part of utility or litter expenses, and fees will be lower in those areas.
Contracts may require growers to carry out certain production practices, and some of those requirements may affect grower costs and fees. The survey asked about several practices that related to testing of fl ocks for avian infl u-enza, salmonella, and other pathogens (table 11). Few respondents (11.6 to 14.3 percent) asserted that such testing was not required, but many reported that they did not know (25.8 to 36.3 percent). Because some tests may be conducted by the integrator, the “don’t know” response is reasonable and informative. Over 40 percent of operations reported that growth-promoting antibiotics were not used in their feed; in this case as well, it is not surprising to see a high fraction of “don’t knows” (29.4 percent), since feed is provided by the integrator.
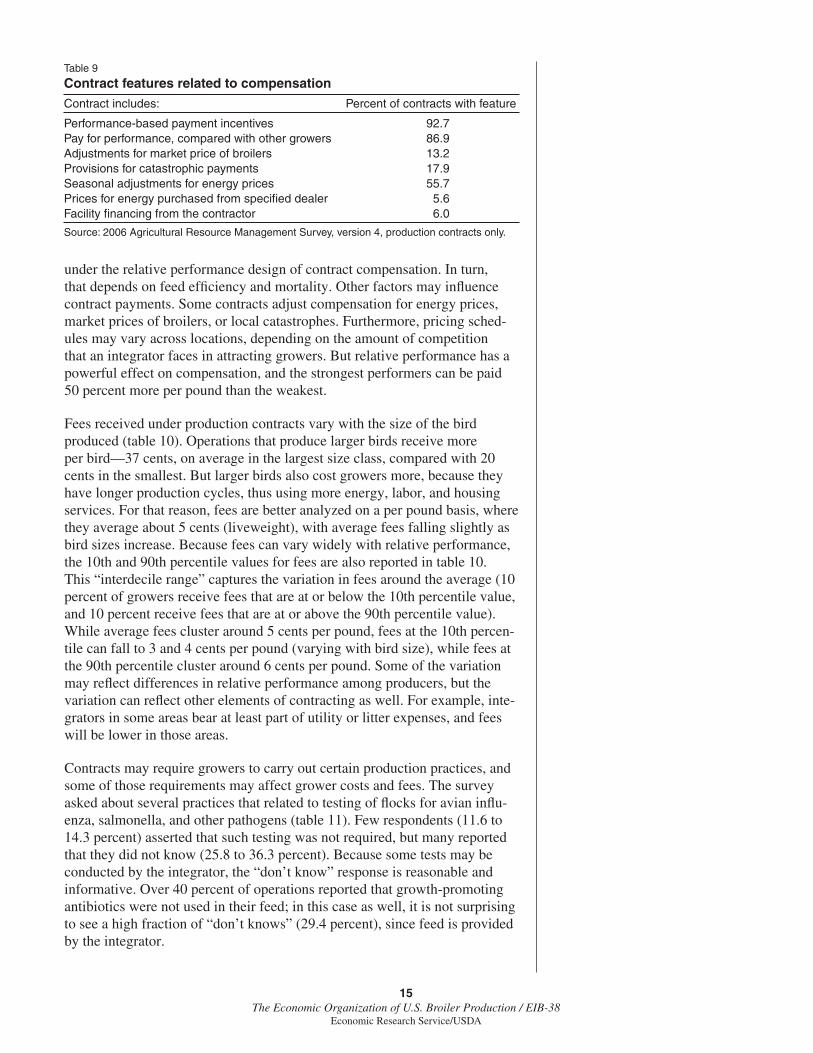
Table 9
Contract features related to compensation
Contract includes: Percent of contracts with feature
Performance-based payment incentives 92.7Pay for performance, compared with other growers 86.9Adjustments for market price of broilers 13.2Provisions for catastrophic payments 17.9Seasonal adjustments for energy prices 55.7Prices for energy purchased from specifi ed dealer 5.6Facility fi nancing from the contractor 6.0
Source: 2006 Agricultural Resource Management Survey, version 4, production contracts only.
16The Economic Organization of U.S. Broiler Production / EIB-38
Economic Research Service/USDA
Eight-fi ve percent of growers said that production was carried out on an all-in all-out basis—that is, all birds were removed at the same time and all chicks were placed at the same time. All-in-all-out production limits the spread of disease and also allows operations to tailor feed mixes to birds of a specifi c age. Over 70 percent reported that their contractor required them to follow specifi c animal welfare practices, such as space standards per bird, while only 10 percent reported that they were not required to follow such practices.
Two other practices were tied to food and poultry safety concerns. As of 2006, just over half of all operations were required to have a HACCP (Hazard Analysis and Critical Control Point) plan in place for food safety. And about a third of contracts required houses to be fully cleaned out, washed, sanitized, and dried after removal of each fl ock, while more than half did not.13 The alternative, removing some or no litter after a fl ock is removed, with full clean-out occurring only after several fl ock removals, is less costly for the grower. Each approach seems to be widely used; about a quarter of respondents did not fully clean out any houses in 2006.
13We also asked respondents whether they stored litter in their houses and, if so, whether they cleaned out their houses fully during 2006. About a quar-ter of respondents did not clean out any of their houses, although most of those crusted out their houses (removed some litter).
Table 10
Payments received under production contracts
Mean fee Fees per pound
Broiler size class per bird Mean 10th percentile 90th percentile
—————Cents—————4.25 lb or less 20.4 5.3 4.1 6.64.26-6.25 lb 26.6 5.0 3.9 5.96.26-7.75 lb 34.3 5.0 3.6 6.17.76 lb or more 37.3 4.6 3.1 5.7All birds 27.7 5.0 3.8 6.2
Note: Ten percent of fees in any size class are at or below the 10th percentile value, and 10 percent are at or above the 90th percentile value.
Source: 2006 Agricultural Resource Management Survey, version 4, production contracts only..
Table 11
Production practices specifi ed in contracts
Percent responding:
The contractor requires: Yes No Don’t know
Testing fl ocks for pathogens: Avian infl uenza 62.6 11.6 25.8 Salmonella 52.3 14.6 33.1 Other pathogens 49.4 14.3 36.3
Specifi ed production practices: Flocks must be all-in, all-out 84.8 5.9 9.3 Houses must be cleaned out after each fl ock 31.1 59.7 9.2 Operation must have HAACP plan1 54.3 16.0 29.7 Specifi ed animal welfare practices2 71.2 10.1 18.7 No antibiotics in feed or water3 42.4 27.2 29.41HACCP refers to Hazard Analysis and Critical Control Point, a systematic set of principles for improving food safety. 2The question specifi ed, as examples, standards for minimum space per bird and Humane Farm Animal Care (HFAC) certifi cation. 3The question contained the qualifi er “unless the birds are ill.”
Source: 2006 Agricultural Resource Management Survey, version 4, production contracts only.
17The Economic Organization of U.S. Broiler Production / EIB-38
Economic Research Service/USDA
Expenses on Broiler Operations
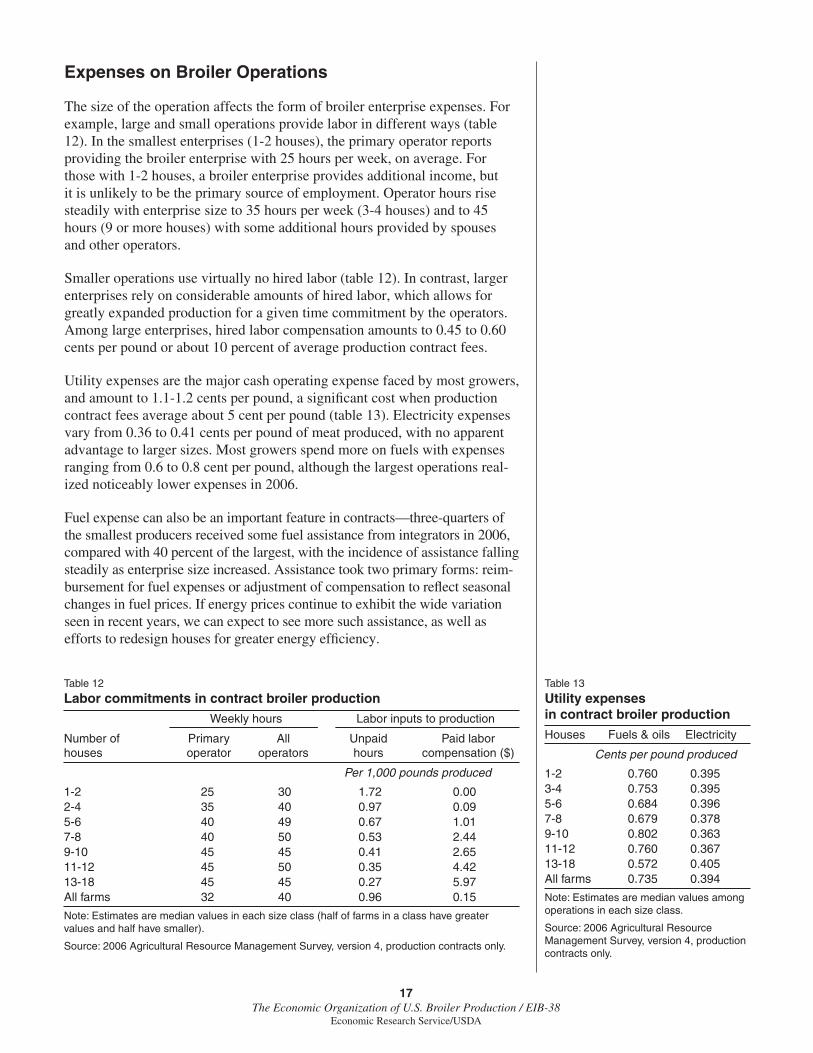
The size of the operation affects the form of broiler enterprise expenses. For example, large and small operations provide labor in different ways (table 12). In the smallest enterprises (1-2 houses), the primary operator reports providing the broiler enterprise with 25 hours per week, on average. For those with 1-2 houses, a broiler enterprise provides additional income, but it is unlikely to be the primary source of employment. Operator hours rise steadily with enterprise size to 35 hours per week (3-4 houses) and to 45 hours (9 or more houses) with some additional hours provided by spouses and other operators.
Smaller operations use virtually no hired labor (table 12). In contrast, larger enterprises rely on considerable amounts of hired labor, which allows for greatly expanded production for a given time commitment by the operators. Among large enterprises, hired labor compensation amounts to 0.45 to 0.60 cents per pound or about 10 percent of average production contract fees.
Utility expenses are the major cash operating expense faced by most growers, and amount to 1.1-1.2 cents per pound, a signifi cant cost when production contract fees average about 5 cent per pound (table 13). Electricity expenses vary from 0.36 to 0.41 cents per pound of meat produced, with no apparent advantage to larger sizes. Most growers spend more on fuels with expenses ranging from 0.6 to 0.8 cent per pound, although the largest operations real-ized noticeably lower expenses in 2006.
Fuel expense can also be an important feature in contracts—three-quarters of the smallest producers received some fuel assistance from integrators in 2006, compared with 40 percent of the largest, with the incidence of assistance falling steadily as enterprise size increased. Assistance took two primary forms: reim-bursement for fuel expenses or adjustment of compensation to refl ect seasonal changes in fuel prices. If energy prices continue to exhibit the wide variation seen in recent years, we can expect to see more such assistance, as well as efforts to redesign houses for greater energy effi ciency.
Table 12
Labor commitments in contract broiler production
Weekly hours Labor inputs to production
Number of Primary All Unpaid Paid laborhouses operator operators hours compensation ($)
Per 1,000 pounds produced
1-2 25 30 1.72 0.002-4 35 40 0.97 0.095-6 40 49 0.67 1.017-8 40 50 0.53 2.449-10 45 45 0.41 2.6511-12 45 50 0.35 4.4213-18 45 45 0.27 5.97All farms 32 40 0.96 0.15
Note: Estimates are median values in each size class (half of farms in a class have greater values and half have smaller).
Source: 2006 Agricultural Resource Management Survey, version 4, production contracts only.
Table 13
Utility expenses in contract broiler production
Houses Fuels & oils Electricity
Cents per pound produced
1-2 0.760 0.3953-4 0.753 0.3955-6 0.684 0.3967-8 0.679 0.3789-10 0.802 0.36311-12 0.760 0.36713-18 0.572 0.405All farms 0.735 0.394
Note: Estimates are median values among operations in each size class.
Source: 2006 Agricultural Resource Management Survey, version 4, production contracts only.
18The Economic Organization of U.S. Broiler Production / EIB-38
Economic Research Service/USDA
Litter Management Practices
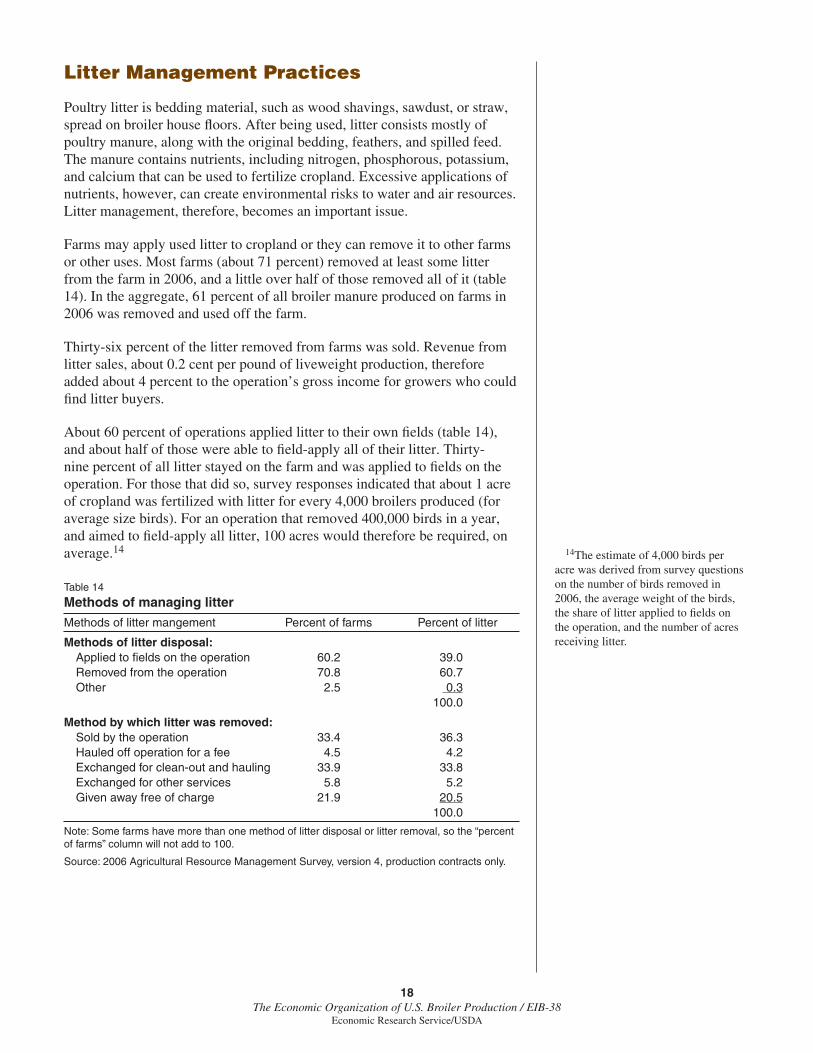
Poultry litter is bedding material, such as wood shavings, sawdust, or straw, spread on broiler house fl oors. After being used, litter consists mostly of poultry manure, along with the original bedding, feathers, and spilled feed. The manure contains nutrients, including nitrogen, phosphorous, potassium, and calcium that can be used to fertilize cropland. Excessive applications of nutrients, however, can create environmental risks to water and air resources. Litter management, therefore, becomes an important issue.
Farms may apply used litter to cropland or they can remove it to other farms or other uses. Most farms (about 71 percent) removed at least some litter from the farm in 2006, and a little over half of those removed all of it (table 14). In the aggregate, 61 percent of all broiler manure produced on farms in 2006 was removed and used off the farm.
Thirty-six percent of the litter removed from farms was sold. Revenue from litter sales, about 0.2 cent per pound of liveweight production, therefore added about 4 percent to the operation’s gross income for growers who could fi nd litter buyers.
About 60 percent of operations applied litter to their own fi elds (table 14), and about half of those were able to fi eld-apply all of their litter. Thirty-nine percent of all litter stayed on the farm and was applied to fi elds on the operation. For those that did so, survey responses indicated that about 1 acre of cropland was fertilized with litter for every 4,000 broilers produced (for average size birds). For an operation that removed 400,000 birds in a year, and aimed to fi eld-apply all litter, 100 acres would therefore be required, on average.14 14The estimate of 4,000 birds per
acre was derived from survey questions on the number of birds removed in 2006, the average weight of the birds, the share of litter applied to fi elds on the operation, and the number of acres receiving litter.
Table 14
Methods of managing litter
Methods of litter mangement Percent of farms Percent of litter
Methods of litter disposal: Applied to fi elds on the operation 60.2 39.0 Removed from the operation 70.8 60.7 Other 2.5 0.3 100.0
Method by which litter was removed: Sold by the operation 33.4 36.3 Hauled off operation for a fee 4.5 4.2 Exchanged for clean-out and hauling 33.9 33.8 Exchanged for other services 5.8 5.2 Given away free of charge 21.9 20.5 100.0
Note: Some farms have more than one method of litter disposal or litter removal, so the “percent of farms” column will not add to 100.
Source: 2006 Agricultural Resource Management Survey, version 4, production contracts only.
19The Economic Organization of U.S. Broiler Production / EIB-38
Economic Research Service/USDA
Farm Operators and Their Households
Farm operators make day-to-day management decisions for the farm. Until a few years ago, USDA surveys gathered information on only one operator (the primary operator) for a farm. But many farms have more than one operator, and ARMS now asks for the number of operators on a farm and a limited amount of personal information for up to three operators. The survey also gathers demographic and fi nancial information on the primary operator’s household, because important farm business and household fi nancial deci-sions may be linked.
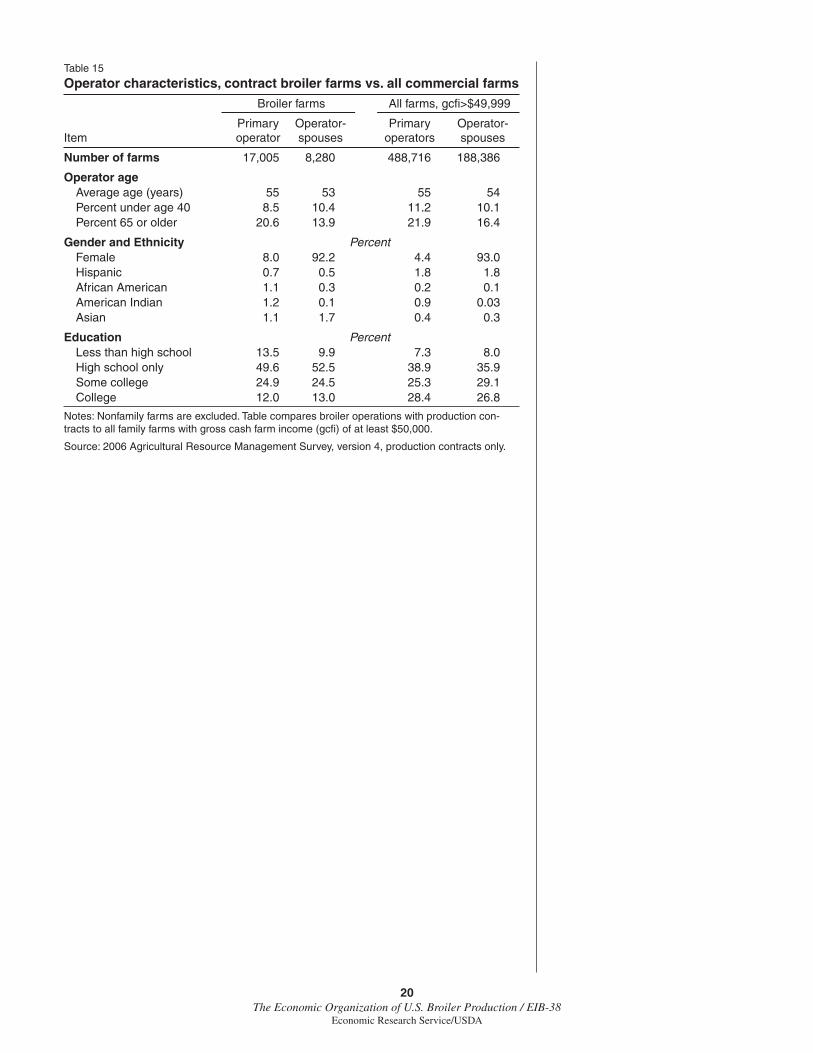
We summarize operator characteristics for family owned and operated broiler farms in table 15 and compare them to operators of all family farms with at least $50,000 in gross cash farm income. Many farms, as defi ned in USDA statistics, are extremely small, with very little farming activity or income derived from farming. Almost all commercial broiler operations meet the $50,000 sales cutoff, so this cutoff was chosen as a useful comparison.
The typical operator was a white male in his 50s whose formal education ended after completing high school (table 15)—much like other farm opera-tors. Operators of broiler farms differed from other operators in two impor-tant dimensions: more of them were women and fewer of them had graduated from college.
Eight percent of broiler primary operators were women, compared with just over 4 percent of all commercial farms, but this only captures part of the story. Most spouse-operators were women, and respondents usually report the male as the primary operator when a husband and wife each operate the farm. When we survey all operators of the farm, 54 percent of broiler farms reported having at least one female operator, compared with 36 percent of all commercial farms.
Survey respondents were asked for the highest level of formal education that they completed and given four response categories—less than high school, completed high school, completed some college, and a college degree. More than 50 percent of commercial farm operators had completed at least some college education and less than 10 percent did not complete high school. Over 60 percent of broiler farm operators had no more than a high school diploma and 12 percent completed college, compared with 28 percent of all commercial farm operators.
20The Economic Organization of U.S. Broiler Production / EIB-38
Economic Research Service/USDA
Table 15
Operator characteristics, contract broiler farms vs. all commercial farms
Broiler farms All farms, gcfi >$49,999
Primary Operator- Primary Operator-Item operator spouses operators spouses
Number of farms 17,005 8,280 488,716 188,386
Operator age Average age (years) 55 53 55 54 Percent under age 40 8.5 10.4 11.2 10.1 Percent 65 or older 20.6 13.9 21.9 16.4
Gender and Ethnicity Percent Female 8.0 92.2 4.4 93.0 Hispanic 0.7 0.5 1.8 1.8 African American 1.1 0.3 0.2 0.1 American Indian 1.2 0.1 0.9 0.03 Asian 1.1 1.7 0.4 0.3
Education Percent Less than high school 13.5 9.9 7.3 8.0 High school only 49.6 52.5 38.9 35.9 Some college 24.9 24.5 25.3 29.1 College 12.0 13.0 28.4 26.8
Notes: Nonfamily farms are excluded. Table compares broiler operations with production con-tracts to all family farms with gross cash farm income (gcfi ) of at least $50,000.
Source: 2006 Agricultural Resource Management Survey, version 4, production contracts only.
21The Economic Organization of U.S. Broiler Production / EIB-38
Economic Research Service/USDA
Farm Business Finances
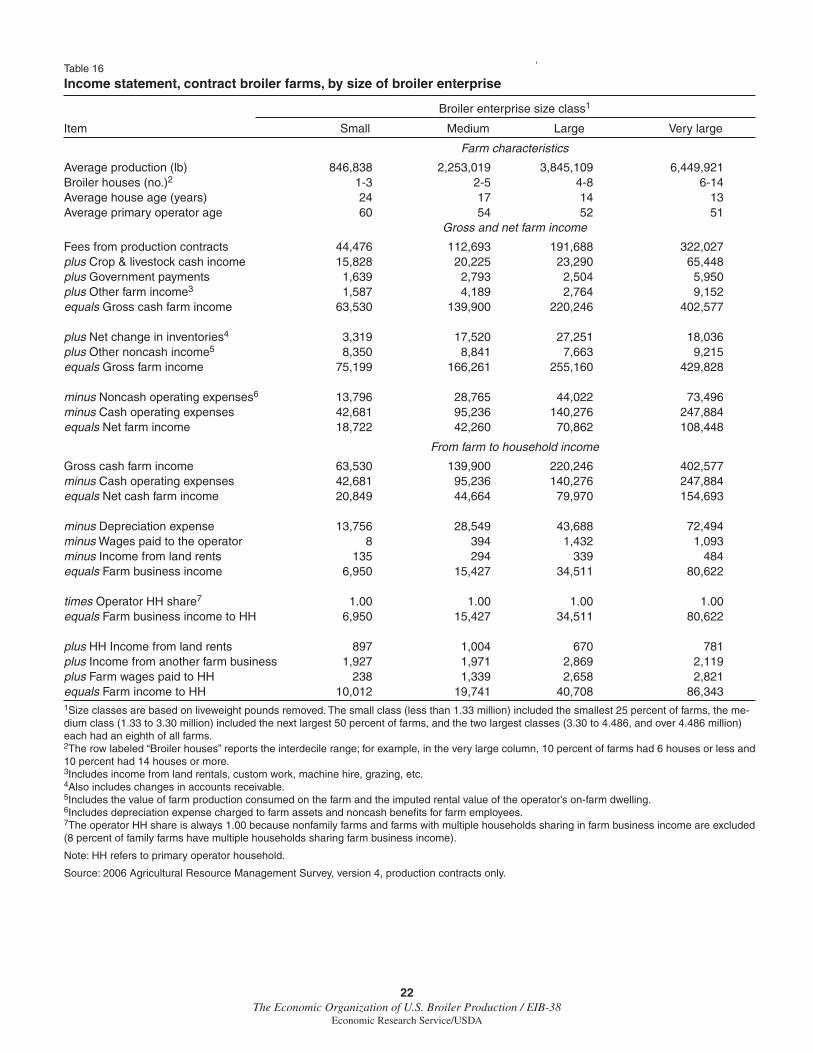
ARMS collects information on farm businesses and the households of prin-cipal operators, thereby allowing users to see the links between business and household fi nances—indeed this is a primary and unique advantage of the survey. In table 16, farm-level fi nancial data, including revenues, expense, and returns are presented for four size classes of broiler enterprises.
Organizing the Information
The data are organized into three panels. The top panel provides informa-tion on broiler enterprise characteristics for the farms in each size class. The middle panel identifi es the operation’s sources of gross income and then derives net farm income from gross income and operating expenses. The bottom panel shows how net income from the farm business fl ows to the principal operator’s household.
“Small” operations include broiler enterprises with less than 1.33 million liveweight pounds removed in 2006—the smallest 25 percent of opera-tions. Most of those farms had 1-3 broiler houses and average production was 846,838 pounds. The “medium” class includes enterprises with between 1.33 and 3.30 million pounds removed (50 percent of all operations). Most of them had 2-5 houses. The largest 25 percent of broiler operations were divided into two equal-size classes because that group covered a wide range of enterprise sizes. The “large” class had between 3.30 and 4.49 million pounds of liveweight production, usually in 4-8 houses, while the “very large” had more than 4.49 million pounds of liveweight production. Some of the very largest operations had 18 houses, but the interdecile range (10th to 90th percentile) was 6-14.
The four classes show distinct age patterns—small enterprises have older houses (24 years, on average) and older operators (60 years), while very large operations tend to have the newest houses and the youngest operators (table 16).
Some farms, including a sixth of the very large operations, have multiple households sharing the net income from the farm, either because of partner-ships or because some of the farm’s equity holders are not part of the primary operator’s household. We excluded those farms from the fi nancial analyses in order to simplify the analysis of farm business fi nances and the linkage to households. Exclusion has no substantive effect on the fi ndings presented in table 17, but it had some impact on the estimates in table 16.15
Net Farm Income
The middle panel of table 16 summarizes gross and net income for the farms. Gross cash farm income is the sum of fees from production contracts, revenues from cash sales and marketing contracts, government payments, and other farm income. Fees from production contracts account for most of gross cash farm income—70 percent in the small class, where some farms are diversifi ed into signifi cant production of other commodities and 80 percent or more in the other classes.
15Mean values of two measures (farm business income to the house-hold and farm income to the house-hold) would be lower if we included operations with multiple households in the calculations.
22The Economic Organization of U.S. Broiler Production / EIB-38
Economic Research Service/USDA
Table 16
Income statement, contract broiler farms, by size of broiler enterprise
Broiler enterprise size class1
Item Small Medium Large Very large
Farm characteristics
Average production (lb) 846,838 2,253,019 3,845,109 6,449,921Broiler houses (no.)2 1-3 2-5 4-8 6-14Average house age (years) 24 17 14 13Average primary operator age 60 54 52 51 Gross and net farm income
Fees from production contracts 44,476 112,693 191,688 322,027plus Crop & livestock cash income 15,828 20,225 23,290 65,448plus Government payments 1,639 2,793 2,504 5,950plus Other farm income3 1,587 4,189 2,764 9,152equals Gross cash farm income 63,530 139,900 220,246 402,577 plus Net change in inventories4 3,319 17,520 27,251 18,036plus Other noncash income5 8,350 8,841 7,663 9,215equals Gross farm income 75,199 166,261 255,160 429,828 minus Noncash operating expenses6 13,796 28,765 44,022 73,496minus Cash operating expenses 42,681 95,236 140,276 247,884equals Net farm income 18,722 42,260 70,862 108,448
From farm to household income
Gross cash farm income 63,530 139,900 220,246 402,577minus Cash operating expenses 42,681 95,236 140,276 247,884equals Net cash farm income 20,849 44,664 79,970 154,693 minus Depreciation expense 13,756 28,549 43,688 72,494minus Wages paid to the operator 8 394 1,432 1,093minus Income from land rents 135 294 339 484equals Farm business income 6,950 15,427 34,511 80,622 times Operator HH share7 1.00 1.00 1.00 1.00equals Farm business income to HH 6,950 15,427 34,511 80,622 plus HH Income from land rents 897 1,004 670 781plus Income from another farm business 1,927 1,971 2,869 2,119plus Farm wages paid to HH 238 1,339 2,658 2,821equals Farm income to HH 10,012 19,741 40,708 86,3431Size classes are based on liveweight pounds removed. The small class (less than 1.33 million) included the smallest 25 percent of farms, the me-dium class (1.33 to 3.30 million) included the next largest 50 percent of farms, and the two largest classes (3.30 to 4.486, and over 4.486 million) each had an eighth of all farms. 2The row labeled “Broiler houses” reports the interdecile range; for example, in the very large column, 10 percent of farms had 6 houses or less and 10 percent had 14 houses or more. 3Includes income from land rentals, custom work, machine hire, grazing, etc. 4Also includes changes in accounts receivable. 5Includes the value of farm production consumed on the farm and the imputed rental value of the operator’s on-farm dwelling. 6Includes depreciation expense charged to farm assets and noncash benefi ts for farm employees. 7The operator HH share is always 1.00 because nonfamily farms and farms with multiple households sharing in farm business income are excluded (8 percent of family farms have multiple households sharing farm business income).
Note: HH refers to primary operator household.
Source: 2006 Agricultural Resource Management Survey, version 4, production contracts only.
23The Economic Organization of U.S. Broiler Production / EIB-38
Economic Research Service/USDA
Gross farm income combines gross cash farm income with noncash income. In turn, noncash income includes the net change in inventories and accounts receivable, as well as the imputed rental value of the operator’s home if it is part of the farming operation. On average, farms in each class reported substantial increases (equivalent to 5-10 percent of gross cash farm income) in inventories and accounts receivable in 2006. Industry production continues to grow, and we would expect growing industries to exhibit growing accounts receivable. Farms with crop operations could also have kept some production in storage at the end of 2006, leading to increased inventories in anticipation of rising crop prices.
Net farm income subtracts cash and noncash operating expenses from gross farm income, and net cash farm income subtracts cash operating expenses from gross cash farm income. Cash operating expenses typically amount to 60-67 percent of gross cash farm income and average depreciation expenses, which account for almost all noncash operating expenses, amount to 30-32 percent of cash operating expenses. Net farm income is the difference between gross farm income and operating expenses, and it amounts to 25-27 percent of gross farm income in each size class.
Net farm income, however, varies widely among broiler operations, where a quarter of farms experience losses—negative net farm income. Poor productive performance may be one source of negative net income since, on average, operations with negative net farm income receive fees of 4.8 cents per pound, compared with 5.1 cent per pound for those with positive net income. Depreciation is a more important factor explaining differences in net income. On farms with negative net farm income, depreciation expenses account for 39 percent of gross income, on average, compared with 13 percent for other operations. Farms with recent major capital expenditures will usually record substantial depreciation expenses, often large enough to generate negative net farm incomes. Correspondingly, older operations with fully depreciated assets rarely report negative net incomes.
Tracking How Net Income Flows to Operator Households
The lower panel of table 16 shows how the fl ow of net income from the farm to the household is derived from the farm business’s fi nancial statement. In this case, the calculation starts with gross and net cash income (noncash income—changes in accounts receivable and inventory and the imputed rental value of operator housing—is not included). Depreciation expenses are deducted from net cash income when calculating farm income to the house-hold.16 Finally, note that farm income to the household also includes income from other farming activities, such as wages from working on other farms or income from another farm business. Most farm operator households do not have these sources of income, but some do.
The last row of the table reports farm income to the household. Note that it is considerably different from net cash farm income, primarily because of depreciation expenses. It also differs considerably from net farm income due to the exclusion of noncash income from farm income to the household.
16This step is consistent with the prac-tice followed in nationwide household income surveys, such as the Current Population Survey, and allows for com-parisons of household incomes between farm and nonfarm households.
24The Economic Organization of U.S. Broiler Production / EIB-38
Economic Research Service/USDA
Farm Household Income
The last line of table 16 provides the farm component of household income for the primary operator’s household. Note that it combines income from the farm business, the household’s income from rentals of farm land, farm wages paid to household members, and income fl owing to household members from ownership interests in other farm business.
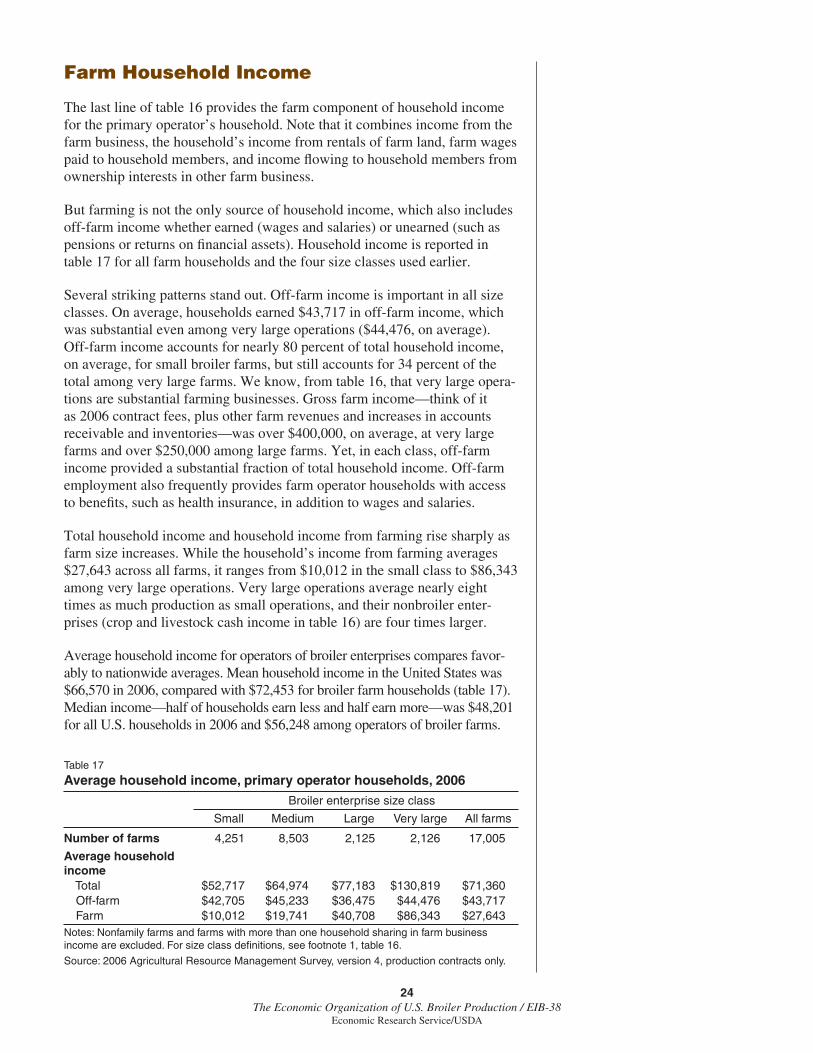
But farming is not the only source of household income, which also includes off-farm income whether earned (wages and salaries) or unearned (such as pensions or returns on fi nancial assets). Household income is reported in table 17 for all farm households and the four size classes used earlier.
Several striking patterns stand out. Off-farm income is important in all size classes. On average, households earned $43,717 in off-farm income, which was substantial even among very large operations ($44,476, on average). Off-farm income accounts for nearly 80 percent of total household income, on average, for small broiler farms, but still accounts for 34 percent of the total among very large farms. We know, from table 16, that very large opera-tions are substantial farming businesses. Gross farm income—think of it as 2006 contract fees, plus other farm revenues and increases in accounts receivable and inventories—was over $400,000, on average, at very large farms and over $250,000 among large farms. Yet, in each class, off-farm income provided a substantial fraction of total household income. Off-farm employment also frequently provides farm operator households with access to benefi ts, such as health insurance, in addition to wages and salaries.
Total household income and household income from farming rise sharply as farm size increases. While the household’s income from farming averages $27,643 across all farms, it ranges from $10,012 in the small class to $86,343 among very large operations. Very large operations average nearly eight times as much production as small operations, and their nonbroiler enter-prises (crop and livestock cash income in table 16) are four times larger.
Average household income for operators of broiler enterprises compares favor-ably to nationwide averages. Mean household income in the United States was $66,570 in 2006, compared with $72,453 for broiler farm households (table 17). Median income—half of households earn less and half earn more—was $48,201 for all U.S. households in 2006 and $56,248 among operators of broiler farms.
Table 17
Average household income, primary operator households, 2006
Broiler enterprise size class
Small Medium Large Very large All farms
Number of farms 4,251 8,503 2,125 2,126 17,005
Average household income Total $52,717 $64,974 $77,183 $130,819 $71,360 Off-farm $42,705 $45,233 $36,475 $44,476 $43,717 Farm $10,012 $19,741 $40,708 $86,343 $27,643Notes: Nonfamily farms and farms with more than one household sharing in farm business income are excluded. For size class defi nitions, see footnote 1, table 16.
Source: 2006 Agricultural Resource Management Survey, version 4, production contracts only.
25The Economic Organization of U.S. Broiler Production / EIB-38
Economic Research Service/USDA
Conclusions
The broiler industry is organized in a unique manner. Almost all broiler production is carried out on contract grow-out operations that are linked to integrators through production contracts. Most grow-out operations are paid through a relative-performance compensation scheme in which contract fees depend, in part, on the grower’s production performance relative to other growers. This organization model may be one reason for the industry’s commercial success, as evidenced by high growth rates of poultry produc-tion, rapid productivity growth, and falling relative prices.
Although most contracts include a relative performance design, they are far from uniform. Contracts can include other terms that tie base payments to actions that affect grower costs or that assign some expense or revenue categories to either the grower or the integrator. Contracts also cover a wide range of specifi ed durations from just over a month to 15 years. Variations in contract design likely follow from differences in grower location, size, and housing, but substantial variation in terms and payments make it diffi cult for growers to evaluate contracts.
While the survey captures a single year of data, the bottom panel of table 16 provides a signal of changes in the industry. The smallest size class of farms have signifi cantly older houses, on average, and older operators as well. The industry is shifting away from a reliance on smaller operations and toward larger opera-tions whose household income is more closely tied to the broiler enterprise.
The size shift is not as pronounced as the changes occurring in hog or dairy production, where very rapid shifts to much larger operations have occurred in recent years (Hoppe et al., 2007). Most broiler production still occurs on relatively small farms, as measured by gross income, and the shifts that have occurred have been more gradual.
Because newer operations are larger, they typically have a more substantial investment in housing and associated equipment. In turn, the households that own and run those operations are more reliant on the income from the broiler enterprise, and hence more sensitive to the income risks arising from energy price fl uctuations and contract settlements in the broiler enterprise. New large operations typically receive longer term contracts from integrators, along with the greater assurance that longer contracts may bring, but contract compensation and reimbursement features may also need to be redesigned to handle the differing risk exposures that those larger farms face.
During the 1990s, U.S. broiler production grew at rates of about 6 percent per year, but since 2000 growth rates have decreased by half to about 3 percent per year. With slower growth, fewer new houses have been constructed and relatively few new operations have entered into production. The industry’s rapid productivity growth has been driven, in large part, by improved poultry genetics, but also by steady improvements in structures, equipment, and production practices. These improvements, taken together, have led to greater feed effi ciency, lower mortality, and more intensive use of capital and labor services—essentially, raising the output of broiler meat that can be achieved for given inputs of feed, fuel, capital, and labor inputs. Slowing investment in new housing could reduce the industry’s productivity growth and, in turn, limit any price advantages over other meats.
26The Economic Organization of U.S. Broiler Production / EIB-38
Economic Research Service/USDA
References
Hoppe, Robert A., Penni Korb, Erik J. O’Donoghue, and David E. Banker. Structure and Finances of U.S Farms: Family Farm Report, 2007 Edition, Economic Information Bulletin No. 24, U.S. Department of Agriculture, Economic Research Service, June 2007.
Knoeber, Charles R. “A Real Game of Chicken: Contracts, Tournaments, and the Production of Broilers,” Journal of Law, Economics, and Organization, 5 (Fall, 1989):271-92.
Lasley, Floyd A., William L. Henson, and Harold B. Jones. The U.S. Poultry Industry: Changing Economics and Structure, Agricultural Economic Report No. 502, U.S. Department of Agriculture, Economic Research Service, February 1983.
MacDonald, James, and Penni Korb. Agricultural Contracting Update: Contracts in 2005, Economic Information Bulletin No. 35, U.S. Department of Agriculture, Economic Research Service, April 2008.
Ollinger, Michael, James MacDonald, and Milton Madison. Structural Change in U.S. Chicken and Turkey Slaughter, Agricultural Economic Report No. 787, U.S. Department of Agriculture, Economic Research Service, September 2000.
Perry, Janet, David Banker, and Robert Green. Broiler Farms’ Organization, Management, and Performance, Agricultural Information Bulletin No. 748, U.S. Department of Agriculture, Economic Research Service, March 1999.
Rogers, George B. “Poultry and Eggs,” Another Revolution in U.S. Farming? Lyle B. Schertz, ed., Agricultural Economic Report No. 441, U.S. Department of Agriculture, Economic Research Service, April 1979.
Rogers, Richard T. “Broilers: Differentiating a Commodity,” Industry Studies, 3rd Edition, Larry L. Duetsch, ed., Armonk, NY, M.E. Sharpe, 2002.
U.S. Department of Agriculture. Grain Inspection, Packers and Stockyards Administration. Assessment of the Cattle, Hog, and Poultry Industries, April 2005.