Embed Size (px)
Citation preview
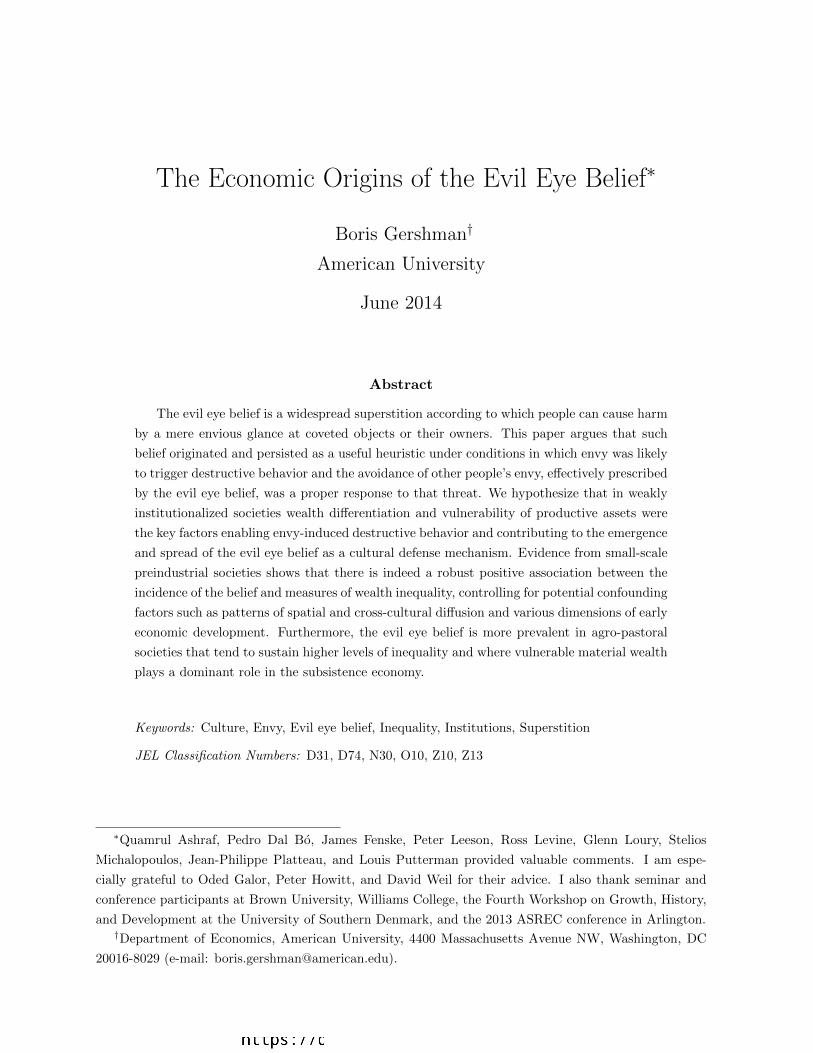
The Economic Origins of the Evil Eye Belief∗
Boris Gershman†
American University
June 2014
Abstract
The evil eye belief is a widespread superstition according to which people can cause harm
by a mere envious glance at coveted objects or their owners. This paper argues that such
belief originated and persisted as a useful heuristic under conditions in which envy was likely
to trigger destructive behavior and the avoidance of other people’s envy, effectively prescribed
by the evil eye belief, was a proper response to that threat. We hypothesize that in weakly
institutionalized societies wealth differentiation and vulnerability of productive assets were
the key factors enabling envy-induced destructive behavior and contributing to the emergence
and spread of the evil eye belief as a cultural defense mechanism. Evidence from small-scale
preindustrial societies shows that there is indeed a robust positive association between the
incidence of the belief and measures of wealth inequality, controlling for potential confounding
factors such as patterns of spatial and cross-cultural diffusion and various dimensions of early
economic development. Furthermore, the evil eye belief is more prevalent in agro-pastoral
societies that tend to sustain higher levels of inequality and where vulnerable material wealth
plays a dominant role in the subsistence economy.
Keywords: Culture, Envy, Evil eye belief, Inequality, Institutions, Superstition
JEL Classification Numbers: D31, D74, N30, O10, Z10, Z13
∗Quamrul Ashraf, Pedro Dal Bo, James Fenske, Peter Leeson, Ross Levine, Glenn Loury, Stelios
Michalopoulos, Jean-Philippe Platteau, and Louis Putterman provided valuable comments. I am espe-
cially grateful to Oded Galor, Peter Howitt, and David Weil for their advice. I also thank seminar and
conference participants at Brown University, Williams College, the Fourth Workshop on Growth, History,
and Development at the University of Southern Denmark, and the 2013 ASREC conference in Arlington.†Department of Economics, American University, 4400 Massachusetts Avenue NW, Washington, DC
20016-8029 (e-mail: [email protected]).
1 Introduction
Over the recent years culture has been argued to be one of the key determinants of economic
outcomes.1 Although early empirical research treated culture as an explanatory variable,
increasing effort is being devoted to understanding how economic and environmental con-
straints, interacting with institutions and history, shaped certain cultural characteristics.2
This paper adds to the literature by investigating the origins of a particular cultural phe-
nomenon known as the evil eye belief.
The evil eye belief is a widespread superstition according to which people can cause
harm by a mere envious glance at coveted objects or their owners. In other words, it is a
belief in the supernatural destructive force of envy projected through the eyes of the envier.
Deeply ingrained in certain societies and transmitted through centuries, the evil eye belief
is still actively present around the world. According to a 2009 survey conducted by the
Pew Forum on Religion and Public Life, 16% of Americans believe in the “evil eye, or that
certain people can cast curses or spells that cause harm.”3 So do over 42% of respondents
in a 2008–2009 survey conducted in Sub-Saharan Africa, with a substantial variation across
nineteen participating countries. The latest study, carried out in 2011–2012 among Muslim
populations of 24 countries, reveals that the belief is especially widespread in the Middle
East and North Africa, with prevalence rates as high as 90% in Tunisia.4
As documented in the next section, the fear of the “evil eye” can have real adverse
effects on the economic activity by hampering incentives to invest and accumulate wealth
and leading to other types of unproductive behavior such as concealment of assets. Thus,
it is important to understand the origins of the belief and the socioeconomic conditions
that may contribute to its persistence.
1See various chapters in Platteau and Peccoud (2010) and Benhabib et al. (2011) for an overview.2Alesina et al. (2013) link contemporary attitudes to female labor force participation and gender inequal-
ity to the historical use of plough in agriculture; Nunn and Wantchekon (2011) show that contemporary
variation in trust levels across African ethnicities is associated with the historical intensity of slave trade;
Durante (2010) traces the origins of social trust in European regions to climatic variability; Michalopoulos
et al. (2012) relate the adoption of Islam to inequality in agricultural endowments. The role of basic nat-
ural environment in shaping culture has been explored extensively in anthropological research, see Harris
(1977) for one of the classic contributions.3The broad interpretation of the evil eye belief used in the survey does not allow to clearly distinguish
it from beliefs in witchcraft and sorcery. Hence, these motivating data should be treated with caution.
Further details on all cited surveys are available at http://pewforum.org.4In an independent survey by Gallup Pakistan in 2010, 57% of local respondents claimed to believe
in the evil eye. Furthermore, 43% of them pointed out envy as the major force behind doing magic on
someone, see http://www.gallup.com.pk for a summary of results.
1
In search for the origins of the evil eye belief this paper employs the well-known approach
to culture as a set of useful heuristics, or rules of thumb, that have evolved to facilitate
decision making in a complex and uncertain environment.5 Specifically, we argue that
the evil eye belief emerged and spread through cross-cultural contact as a useful rule of
thumb prescribing envy-avoidance behavior that limits exposure to other people’s harmful
envy-motivated actions. Using a simple framework of production in the presence of envy
we derive the conditions under which envy-avoidance is the rational response to the threat
of destructive envy. These intuitive conditions include high wealth inequality, ease and
effectiveness of envious “retaliation,” and the strength of invidious comparisons. In the
real world of boundedly rational people acting under uncertainty and costly information
acquisition, the evil eye belief acts as a useful guide to envy-avoidance behavior in an
environment that enables destructive envy. In the context of simple traditional societies, in
which the belief was born thousands of years ago, wealth inequality, along with vulnerability
and visibility of main productive assets, are the key features of such an environment.
We explore these predictions using the Standard Cross-Cultural Sample (SCCS), a
dataset on 186 well-described preindustrial societies around the world. The data show
that the incidence of the evil eye belief across these societies is indeed positively and sig-
nificantly associated with measures of wealth inequality. This finding is robust to the
inclusion of potential confounding factors such as spatial and cross-cultural diffusion, var-
ious dimensions of economic development, exposure to “classical” religion (Christianity,
Islam, Buddhism, and Hinduism), and continental fixed effects. As expected, the pattern
is stronger in societies with weaker institutions.
To provide further evidence in favor of the main hypothesis, we explore the relationship
between the prevalence of the evil eye belief and the subsistence mode of production. The
belief turns out to be more widespread in agricultural and pastoral societies which rely more
on visible and vulnerable material wealth and sustain higher levels of inequality compared
to foragers and horticulturalists (Borgerhoff Mulder et al., 2009).
Altogether, the empirical analysis is consistent with the view of the evil eye belief as a
useful cultural response in an environment conducive to destructive manifestations of envy.
The rest of the paper is organized as follows. Next section examines the relationship
between the evil eye belief and the fear of envy in light of ethnographic case studies from
5This approach has been advanced by anthropologists (Richerson and Boyd, 2005) and psychologists
(Gigerenzer, 2008) and recently used by economists to explain the origins and persistence of culture, see
Nunn (2012) for an overview. The idea about functional significance of superstitions and magical practices
goes back to the pioneering writings of Bronis law Malinowski based on his fieldwork among the Trobriand
islanders.
2
around the world. Section 3 provides a conceptual framework for understanding the emer-
gence and persistence of the belief. Section 4 conducts the empirical analysis. Section 5
concludes. Appendices contain a model of the rational fear of envy, detailed description of
the data, and additional robustness checks.
2 Evil eye belief as the fear of envy
An analysis of the anthropological literature on the evil eye belief in various societies
suggests that its common root is the fear of other people’s envy. Envious gaze is believed
to cause misfortunes manifested, among other things, in the damage to property (such as
farm animals or shelter), production outcomes (such as crops), and health of the subject
of envy. Numerous ethnographic studies reveal the following key regularities: 1) the evil
eye belief reflects the fear of destructive envy which arises from inequality of economic
outcomes; 2) the fear of the evil eye affects real economic decisions by discouraging effort,
wealth accumulation, and upward mobility and encouraging unproductive practices such
as concealment of wealth. The fear of envious glances is consistent with the notion that
people perceive their own relative standing through observation of other people’s material
wealth which may trigger envious feelings.6
Anecdotal evidence on the adverse effects of the evil eye belief comes from across the
globe. In Nac.aawy, an Egyptian village, “the harmful effects of the envious glance are
accepted as an article of faith” (Ghosh, 1983). Livestock, the main object of envy, and the
main measure of wealth in the community, is kept in the recesses of the house to avoid
the evil eye. Similarly, to avoid the envy of neighbors, villagers of a Teneek community
in Mexico “weave the agave fibers in the darkness of their houses” (de Vidas, 2007). The
fear of envy also makes them reject lucrative jobs and leave some ripe oranges on the trees
to rot. In Tzintzuntzan, also in Mexico, villagers refuse to install glass windows in their
houses fearing to attract envious looks (Foster, 1972). In Caixa de Agua, Brazil, “envy
dries crops, slays cattle, fells trees, pollutes food and water, causes houses to collapse, and
can even kill small children” (Ansell, 2009). The fear of olho grande (the Brazilian name
for the evil eye) makes the relatively rich peasants conceal or degrade the worth of their
wealth. Back in the Old World, an Indian villager refuses to use a new fertilizer for the fear
6In many languages the expressions for “evil eye,” “to see,” and “envy” are closely related. In Arabic,
for example, the “evil eye” is ayn al-h. asud literally meaning “the eye of envy.” The Latin word invidia
from which the English “envy” stems, derives from videre, “to see.” Similarly, the Russian word for “envy,”
zavist’, derives from the root of the verb videt’, “to see.”
3
of nazar lagna (the Urdu name for the evil eye) in case the innovation delivers an especially
good harvest (Schoeck, 1969). Similar fears and behaviors were also documented among
the Bedouin tribes of Negev desert (Abu-Rabia, 2005), Galician villagers in Spain (Lison-
Tolosana, 1973), and in Slovak-American communities of Western Pennsylvania (Stein,
1974). This body of ethnographic evidence highlights how the evil eye belief essentially
enforces envy-avoidance behavior in different forms.
Most anthropological studies of the evil eye belief emphasize its deep connection to the
underlying socioeconomic relations in a community. For instance, Schoeck (1981) classifies
the evil eye belief as a “realistic fear” which “reveals man’s deep knowledge that, no matter
what our station in life, what our fortune or assets, there will always be someone who is
less favored by life. And he is a potential enemy.” Reminick (1974) in his study of the
evil eye belief among the Amhara of Ethiopia suggests that there is a “social context”
behind the belief and associated symbolic behaviors. Spooner (1970) considers it to be “an
institutionalized psychological idiom for the personalization, or simply the personification
of misfortune, in particular insofar as misfortune, or fear of it, may relate to the fear of
outsiders and their envy.” Wolf (1955) and Foster (1972) view the evil eye belief, along
with witchcraft, sorcery, and gossip, as part of “institutionalized envy” which is a set of
cultural indicators of the existence of envy in a community. Roberts (1976) looks at the evil
eye belief through the lens of “conflict enculturation” theory according to which conflicts
that are pervasive in society become part of expressive culture.
This paper offers a complementary theory based on the view of cultural norms as useful
heuristics guiding behavior in an uncertain environment. Our approach also addresses a
commonly raised objection to the envy basis of the evil eye belief, which is that, while envy
is a universal phenomenon, the evil eye belief is not. As the framework of the following
section demonstrates, existence of envy per se does not imply the optimality of envy-
avoidance behavior: destructive envy and the fear of it are only activated once wealth
inequality surpasses a certain “tolerance threshold” that depends, in particular, on the
visibility and vulnerability of productive assets, as well as institutional infrastructure.
3 Conceptual framework
Since the evil eye belief is rooted in the fear of envy, in order to trace its origins one has
to characterize the environment in which envy-avoidance behavior, prescribed by the evil
eye belief, is a proper response to the danger of envy-motivated aggression. Generally
speaking, envy can be constructive and destructive, that is, people can satisfy it by either
4
catching up with others or bringing them down. As formally demonstrated in Gershman
(2014a), these two sides of envy lead to qualitatively different equilibria depending on the
underlying economic and institutional environment.
A simple game-theoretic model sketched in appendix A helps to pin down the conditions
that enable destructive envy and make envy-avoidance behavior optimal in a perfect full-
information world. In this model, two individuals who have unequal initial endowments of
wealth engage in a productive activity. Unequal production outcomes cause envy on part
of the relatively poor individual who can then exert costly effort to assuage his feelings
by harming the other individual. The game gives rise to two types of equilibria. In
the “no fear” equilibrium, both individuals work peacefully and the resulting inequality
of outcomes is not high enough to trigger envy-motivated destructive behavior. In the
alternative “fear of envy” equilibrium, the wealthier individual anticipates envy-motivated
retaliation and limits his productive effort in order to avoid it. Thus, in this case envy-
avoidance behavior in the form of underproduction is the optimal response to the prospect
of envious retaliation.
The conditions under which the fear of envy equilibrium emerges are intuitive: high
inequality, ease or effectiveness of envy-motivated retaliation, and the degree of enviousness
itself. In the empirical analysis of the following section, we use measures of inequality to
explain the variation in the prevalence of the evil eye belief in small-scale societies around
the world. In addition, we explore the connection between the prevalence of the evil eye
belief and subsistence production mode. As detailed in section 4.3, agro-pastoralists rely
heavily on material wealth, such as tools, animals, and farm land, for subsistence, while
for other production modes non-material wealth such as health, strength, and skills is
more important. On the one hand, the reliance on material wealth tends to sustain higher
inequality across generations (Borgerhoff Mulder et al., 2009). On the other hand, material
wealth is both more visible and easily destructible which raises, respectively, the intensity
of social comparisons and the effectiveness of envious retaliation. All of these factors enable
destructive envy thus making envy-avoidance behavior appropriate. Hence, we expect to
see higher incidence of the evil eye belief in agro-pastoral societies.
Although the model of appendix A does not formalize the emergence of the evil eye
superstition, it highlights the characteristics that would make it a useful heuristic device
in the real world. As established by social scientists, individuals often recur to “fast and
frugal” heuristics for “guessing the right thing to do in a complex and variable environment”
(Richerson and Boyd, 2005, p. 119). Indeed, if information is imperfect and learning
through experimentation is costly, simple norms approximating rational behavior may
5
be adaptive and become encoded in culture (Nunn, 2012). In the context of the above
framework, there are several dimensions that may complicate fully rational behavior in the
real imperfect-information world. For example, individuals may not know each other’s cost
functions and preferences making it difficult to calculate the exact optimal response.
In his work on traditional societies Diamond (2012, ch. 8) points out that behavioral
rules that minimize risks in a dangerous environment are often worth following even if
they seem overcautious. Under conditions in which envy leads to conflict, erring on the
side of caution, that is, underinvesting, may be preferable to running a risk of inciting
envy-motivated aggression. Hence, a belief that a mere envious glance can cause damage
becomes a winning strategy that, despite being too conservative in certain cases, allows to
avoid severe conflict and major risk posed by the envy of others.7
Scheibe and Sarbin (1965) argued that under conditions of uncertainty “extralogical
propositions, such as superstitions, are necessary guides to action.” Indeed, the evil eye
belief is based on the fear of a supernatural destructive force of envy rather than rational
fear of envious retaliation by neighbors. One possible explanation is that the latter is more
likely to trigger accusations and costly open hostility. Hence, the idea that a neighbor is a
potential enemy intentionally destroying other people’s possessions is replaced by a belief
in the supernatural destructive power of an envious glance that cannot be controlled. As
a result, given the imperfect information about the real cause of a misfortune, the evil
eye belief provides both an explanation and a rough guide to preemptive action (envy-
avoidance) without escalating open conflict and direct accusations.8
The approach to the evil eye belief offered in this paper is related to Peter Leeson’s
research on the “law and economics of superstition.” He argues that, in the absence of
modern legal infrastructure and secure property rights, certain superstitions can fill in that
institutional gap, even if imperfectly, and thus are socially useful. Examples include me-
dieval judicial ordeals in Europe (Leeson, 2012), trial by poison ingestion in Liberia (Leeson
and Coyne, 2012), and even the practice of human sacrifice in some societies (Leeson, 2014).
The latter paper argues that human sacrifice is in fact a primitive technology of property
rights protection. Specifically, “conspicuous destruction” of wealth by way of exchang-
7Foster and Kokko (2009) construct a simple evolutionary model in which natural selection may favor
superstitious strategies that lump non-causal associations with causal ones. Beck and Forstmeier (2005)
argue that, although superstitious behavior itself may not be adaptive, it is an inevitable by-product of
an adaptive learning strategy.8In contrast, witchcraft beliefs view misfortunes as malevolent acts (driven by envy, among other things)
and thus are more hostile by nature. Open accusations of witchcraft often lead to conflict entailing severe
sanctions and eroding social capital (Gershman, 2014b).
6
ing valuable property for humans that are subsequently sacrificed makes the community
poorer. This reduces the expected payoff from plundering and protects the community from
external predation. Envy-avoidance behavior such as underinvestment and concealment of
wealth, prescribed by the evil eye belief, is a less cruel and spectacular way to achieve a
similar goal within community, that is, reduce the likelihood of (envy-motivated) destruc-
tion. As in Leeson’s work, one of the key ingredients to the story is the absence of effective
government and formal protection of property rights which makes informal substitutes for
such protection useful. In the sample used in the empirical analysis of the next section
most societies are traditional communities lacking modern institutions. Yet we attempt to
explore the interaction between inequality and rough measures of basic institutions to see
whether in weakly institutionalized environments the connection between inequality and
the incidence of the evil eye belief is stronger.9
Culture and superstitions in particular tend to persist over time, especially if the so-
cioeconomic environment makes them socially valuable.10 An additional mechanism of
persistence is provided by Fudenberg and Levine (2006) who take a formal game-theoretic
approach to superstitions using the concept of self-confirming equilibrium. In particular,
they call the objectively false beliefs about the off-equilibrium actions “superstitions” and
show that such beliefs can persist for a long time if they prevent actions that could pro-
vide new information to disconfirm prior beliefs (see also Fudenberg and Levine, 2009).
From the standpoint of the fear of envy theory and its connection to the evil eye belief, if
individuals believe that an envious glance can cause real harm, they underinvest thereby
avoiding destructive envy and generating no data to disconfirm their prior belief. Further-
more, if the source of destruction is not perfectly observable, the evil eye belief is more
likely to persist in an environment enabling destructive envy. If an individual decides to
experiment and invest full effort, he is more likely to suffer from envious retaliation in such
environment. Hence, believing in the evil eye becomes an adaptive strategy that allows
believers to avoid envy-motivated aggression. The concept of self-confirmation also shows
that cultural rules and customs may persist over time even when they are no longer useful.
9The interaction between institutions and culture is also explored in the work by Grosjean (2014) on
the culture of violence in the U.S. She argues that such culture was brought by the Scottish and Irish
immigrants but persisted only in the U.S. South, where low institutional quality made the “culture of
honor” an adaptive trait.10For excellent literature reviews on cultural persistence see Bisin and Verdier (2011) and Nunn (2012).
For an anthropologist’s perspective see Chibnik (1981).
7
4 Evidence
4.1 Data
To empirically investigate the economic origins of the evil eye belief we resort to the
Standard Cross-Cultural Sample, a “representative sample of the world’s known and well
described cultures, 186 in number, each “pinpointed” to the smallest identifiable subgroup
of the society in question at a specific point in time” (Murdock and White, 1969). The
SCCS is a subsample from a broader dataset, the Ethnographic Atlas (EA), which includes
1167 societies (Murdock, 1967). One of the motivations for creating the SCCS was to con-
struct a sample spanning a wide range of diverse societies all around the world documented
at a time of maximum cultural independence, in order to alleviate the problem of spatial
correlation crucial for sound statistical analysis. The SCCS covers preindustrial societies,
from foragers like the Hadza people of the central Rift Valley in Africa to technologically
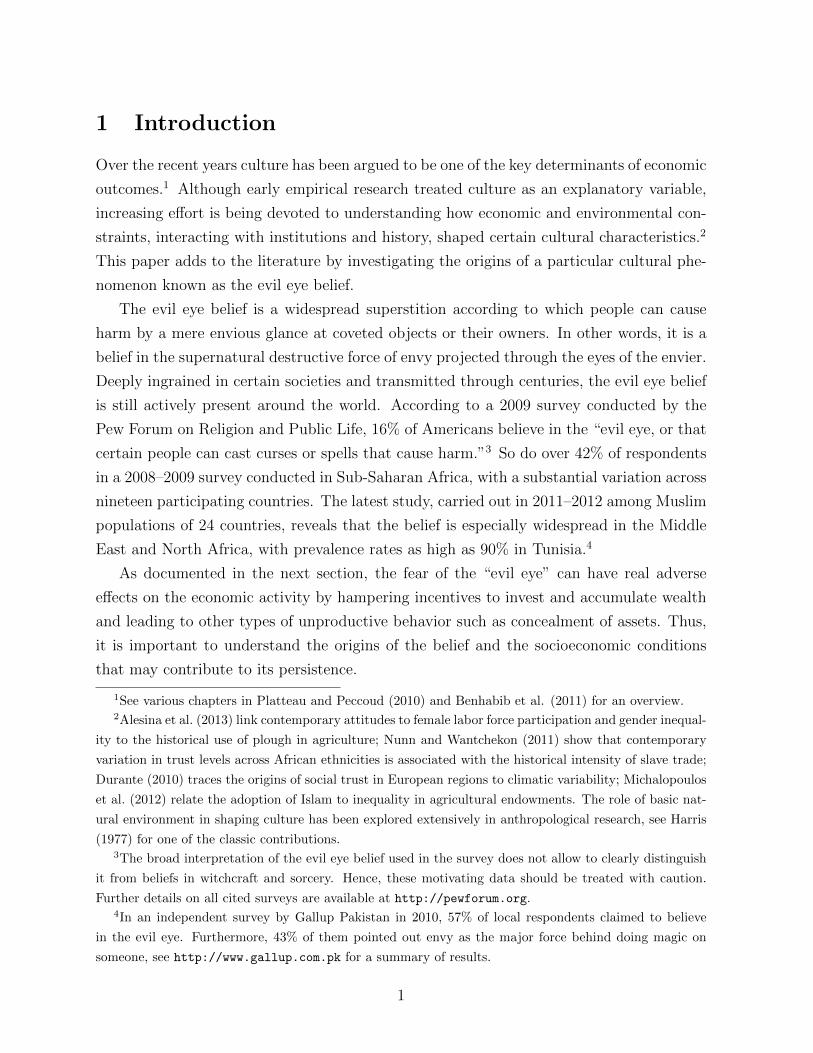
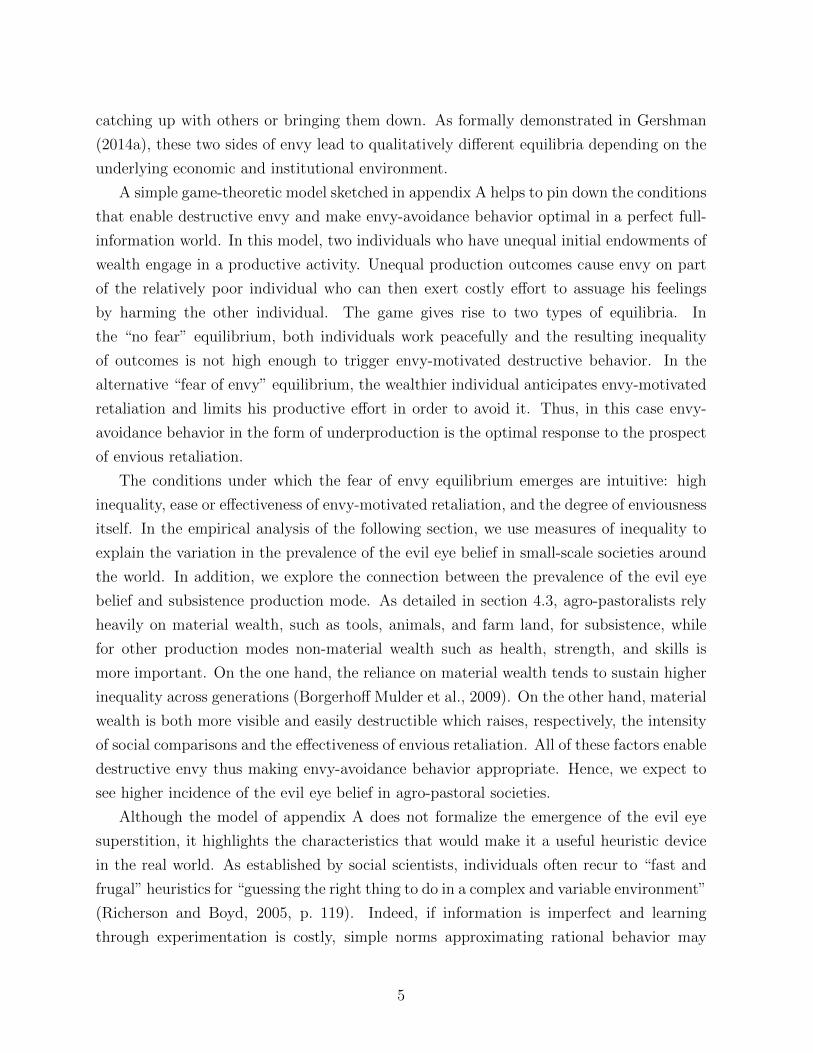
advanced agriculturalists like the Basques of the Iberian Peninsula (see figure 1 for exact
geographic locations).11
The original publication by Murdock and White was substantially expanded in the fol-
lowing years accumulating a wealth of coded data (around 2,000 variables) on subsistence
economy and cultural characteristics of the SCCS societies. Heavily used by anthropolo-
gists, the SCCS and the EA data are increasingly employed by economists, recent examples
being Baker (2008) on the transition to agriculture, Fenske (2013; 2014) and Michalopoulos
and Papaioannou (2013) on pre-colonial African institutions, Alesina et al. (2013) on the
origins of gender roles, and Giuliano and Nunn (2013) on the transmission of democracy.
The dependent variable of interest is the presence of the evil eye belief as coded for
the SCCS by Roberts (1976) according to the following ordinal scale: incontrovertibly ab-
sent (1), almost certainly absent (2), probably absent (3), possibly absent (4), possibly
present (5), probably present (6), almost certainly present (7), incontrovertibly present
(8).12 Roberts also suggested a binary measure by separating the first four categories (ab-
sent) from the last four (present). According to this last measure, the evil eye belief was
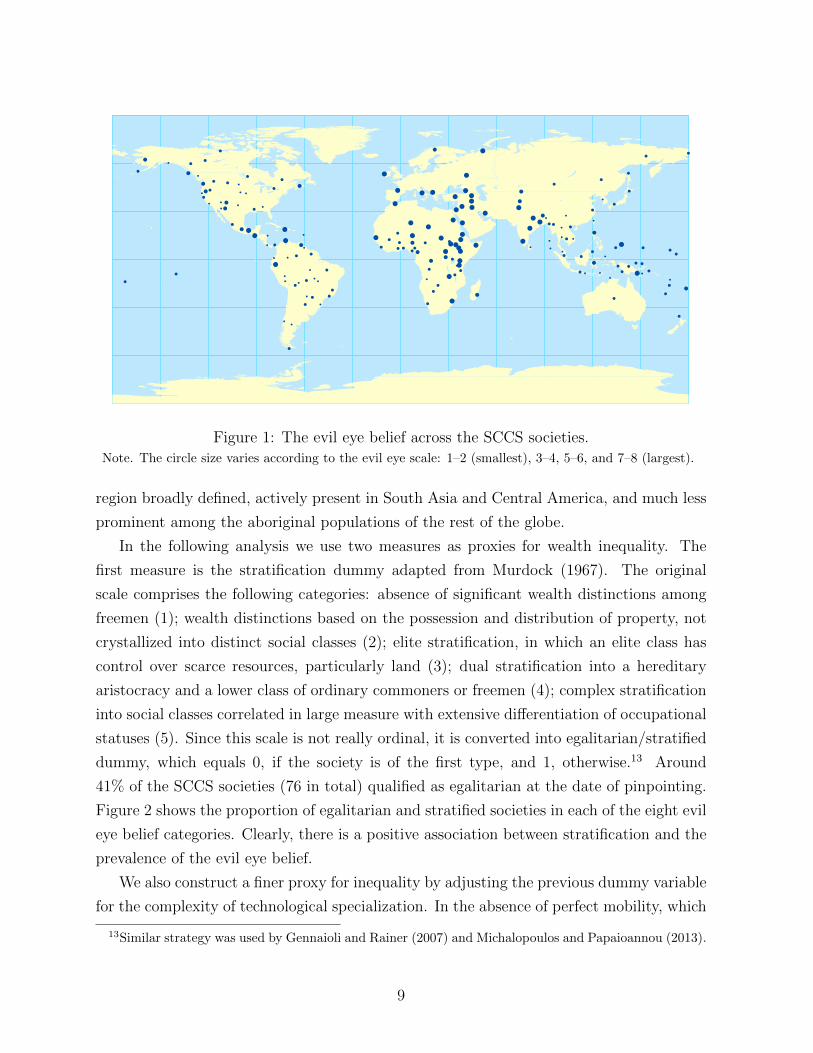
present in 36% of societies (67 in total) at the date of pinpointing. The geographical distri-
bution of the belief is represented in figure 1. It is ubiquitous in the Circum-Mediterranean
11The mean pinpointing date is 1853, although it moves closer to 1900 when ancient empires like the
Romans and the Babylonians are dropped. The main results are based on the full sample of 186 societies,
but they are robust to omitting the twelve cultures pinpointed before 1800, see section 4.4. The breakdown
of the SCCS by pinpointing date is given in table C.1 of appendix C.12The coding was done on the basis of published sources on each society.
8
! !
!!!
!!
!!
!!
!
!
!
!
!!
! !
!
!
!!
!!
!
!
!
!
!
!
!
!
!
!
!
! !
!!
!
!
!
!!
!
!
!
!
!
!
!
!
!
!
!
!
!
!
!!
!
!
!
!
!
!
!
!!
!!
!!
!
! !!
! !
!
!
!
!
!
!
!!
!
!
!
!
!
!
!
!
!
!
!
!
!
!
! !!
!
!
!
!
!! !
!
!
!
!
!
!!
!!
!
!
!
!
!
!
!!
!
!
! !
!
!
!
!
!
!
!
!
!
!!
!
!!
!
!
!
!
!
!
!
!
!
!
!
!
!
!
!
!
! !
!!
!
!
!
!
!
!
!
!!
!
!!
!!
!
!
!
!
!
Figure 1: The evil eye belief across the SCCS societies.Note. The circle size varies according to the evil eye scale: 1–2 (smallest), 3–4, 5–6, and 7–8 (largest).
region broadly defined, actively present in South Asia and Central America, and much less
prominent among the aboriginal populations of the rest of the globe.
In the following analysis we use two measures as proxies for wealth inequality. The
first measure is the stratification dummy adapted from Murdock (1967). The original
scale comprises the following categories: absence of significant wealth distinctions among
freemen (1); wealth distinctions based on the possession and distribution of property, not
crystallized into distinct social classes (2); elite stratification, in which an elite class has
control over scarce resources, particularly land (3); dual stratification into a hereditary
aristocracy and a lower class of ordinary commoners or freemen (4); complex stratification
into social classes correlated in large measure with extensive differentiation of occupational
statuses (5). Since this scale is not really ordinal, it is converted into egalitarian/stratified
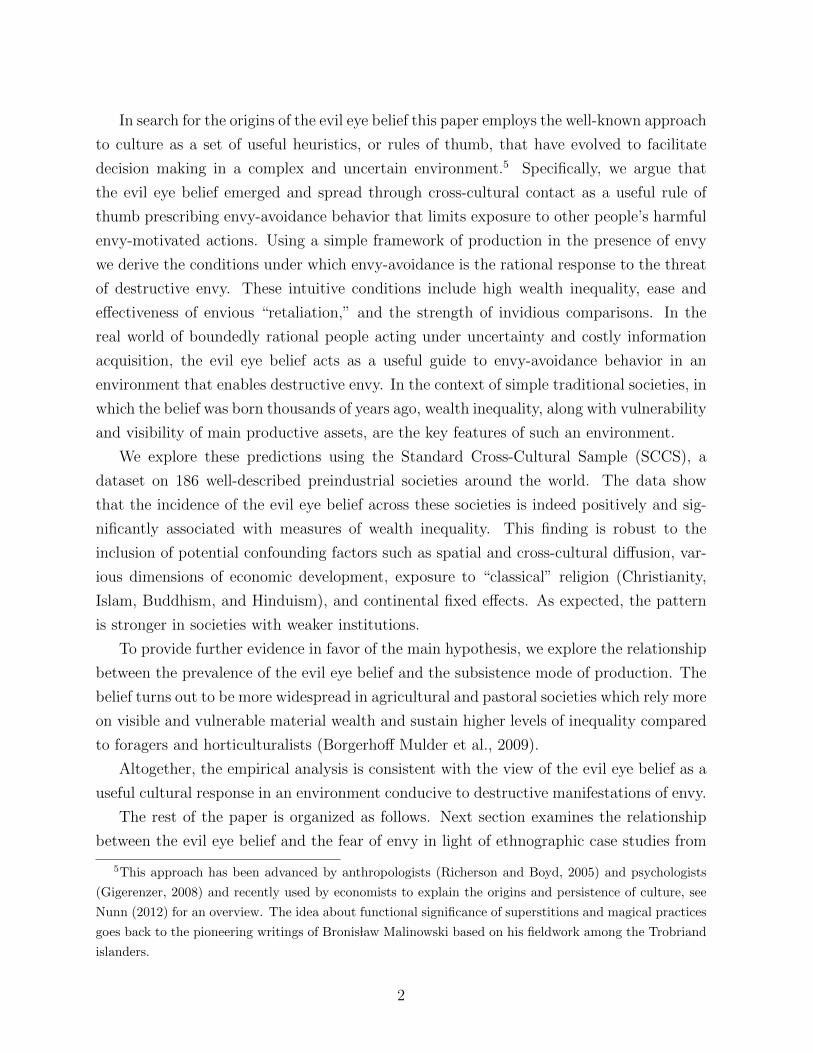
dummy, which equals 0, if the society is of the first type, and 1, otherwise.13 Around
41% of the SCCS societies (76 in total) qualified as egalitarian at the date of pinpointing.
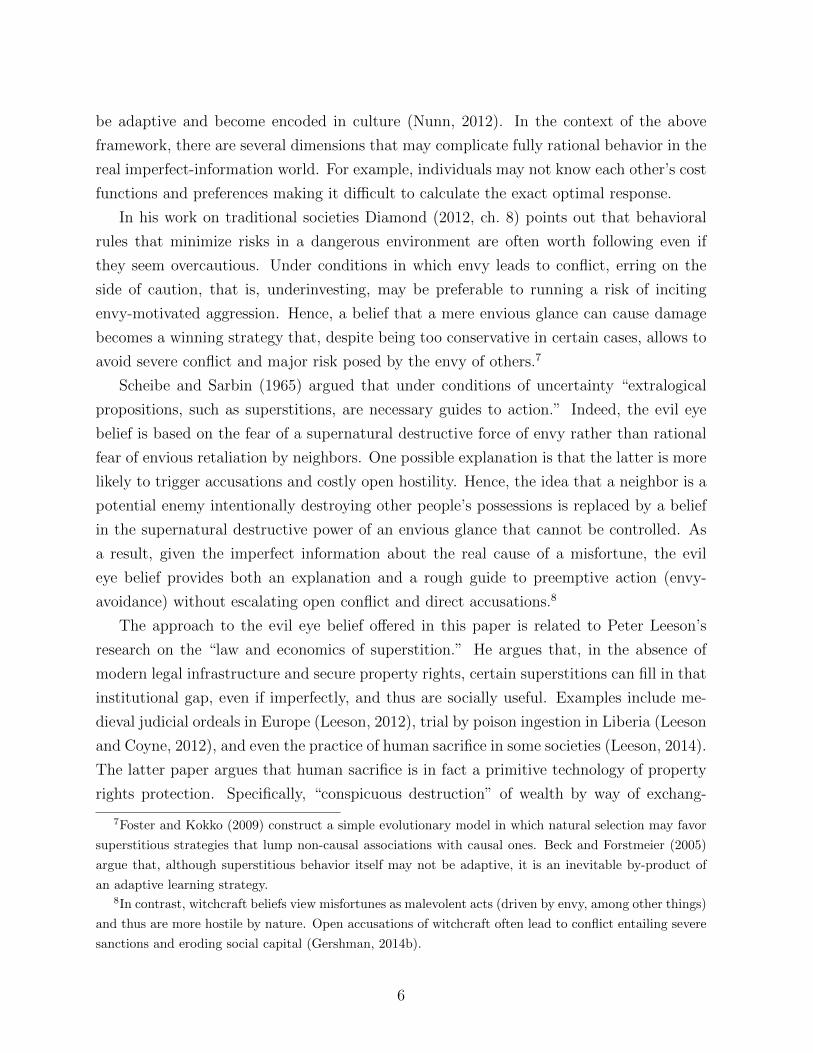
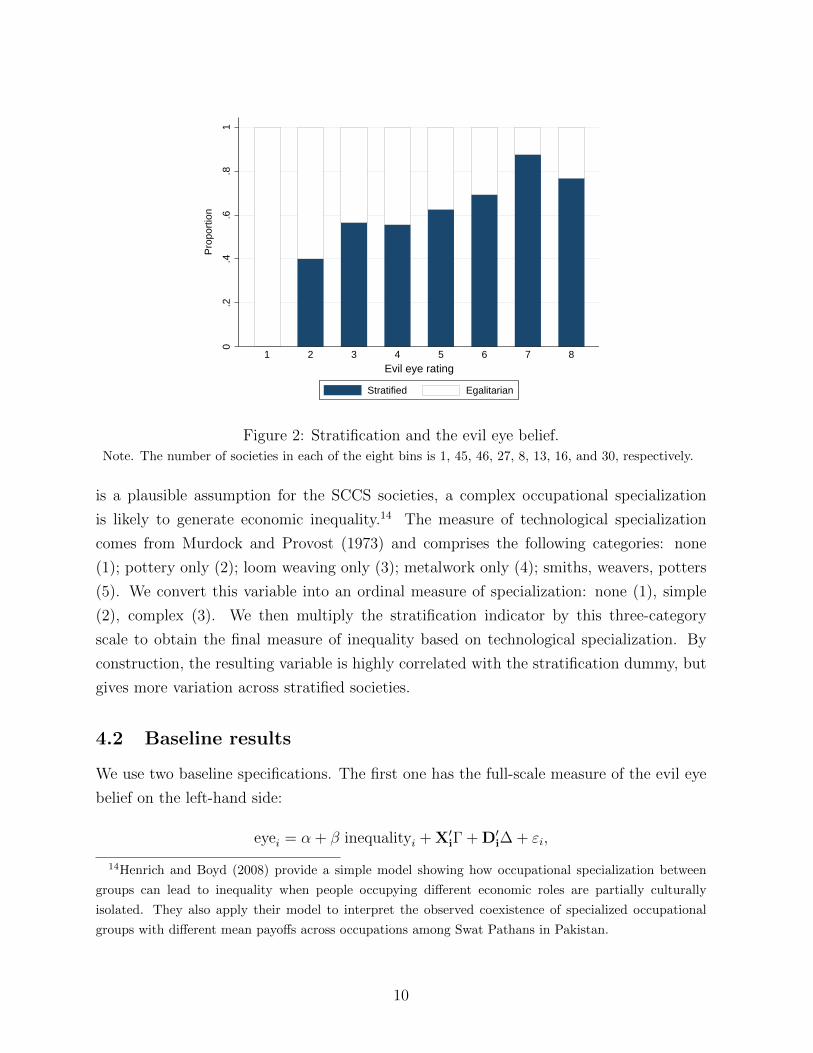
Figure 2 shows the proportion of egalitarian and stratified societies in each of the eight evil
eye belief categories. Clearly, there is a positive association between stratification and the
prevalence of the evil eye belief.
We also construct a finer proxy for inequality by adjusting the previous dummy variable
for the complexity of technological specialization. In the absence of perfect mobility, which
13Similar strategy was used by Gennaioli and Rainer (2007) and Michalopoulos and Papaioannou (2013).
9
0.2
.4.6
.81
Pro
port
ion
1 2 3 4 5 6 7 8Evil eye rating
Stratified Egalitarian
Figure 2: Stratification and the evil eye belief.Note. The number of societies in each of the eight bins is 1, 45, 46, 27, 8, 13, 16, and 30, respectively.
is a plausible assumption for the SCCS societies, a complex occupational specialization
is likely to generate economic inequality.14 The measure of technological specialization
comes from Murdock and Provost (1973) and comprises the following categories: none
(1); pottery only (2); loom weaving only (3); metalwork only (4); smiths, weavers, potters
(5). We convert this variable into an ordinal measure of specialization: none (1), simple
(2), complex (3). We then multiply the stratification indicator by this three-category
scale to obtain the final measure of inequality based on technological specialization. By
construction, the resulting variable is highly correlated with the stratification dummy, but
gives more variation across stratified societies.
4.2 Baseline results
We use two baseline specifications. The first one has the full-scale measure of the evil eye
belief on the left-hand side:
eyei = α + β inequalityi + X′iΓ + D′i∆ + εi,
14Henrich and Boyd (2008) provide a simple model showing how occupational specialization between
groups can lead to inequality when people occupying different economic roles are partially culturally
isolated. They also apply their model to interpret the observed coexistence of specialized occupational
groups with different mean payoffs across occupations among Swat Pathans in Pakistan.
10
where i corresponds to an SCCS society, eye is the measure of the evil eye belief on
the ordinal 1–8 scale, inequality is one of the two proxies for wealth inequality, X′ is a
vector of control variables, D′ is a vector of continental dummies and ε is the society-level
idiosyncratic component. The coefficient of interest, β, relates inequality and the incidence
of the evil eye belief after partialling out the effects of X and D. According to the fear of
envy theory, β is expected to be positive. The model is estimated via OLS.15 The second
specification is the binary choice model (probit) with the absent/present dummy on the
left-hand side:
P{bieyei = 1|inequalityi,X′i,D
′i} = Φ(α + β inequalityi + X′iΓ + D′i∆),
where bieye is the indicator of the presence of the evil eye belief and Φ is the CDF of
standard normal distribution. This model is estimated via maximum likelihood (ML).
The set of control variables covers three main groups which are incorporated in the
estimation one by one.16 The first group includes variables that capture possible spatial
diffusion of the belief. Some ethnographers hypothesize that the evil eye belief originated
in the Circum-Mediterranean area, presumably in Mesopotamia, where the first references
to it were documented in cuneiform texts (Thomsen, 1992), and then spread throughout
the region and beyond. This is corroborated by figure 1 which indicates active presence of
the belief in that region. Early scholars claimed that societies all over the world might have
had an indigenous evil eye belief. In their classical works Seligmann (1910) and Elworthy
(1895) call it, respectively, the “superstition of all times and people” and “ancient and
widespread superstition.” Yet the data clearly reject the universality hypothesis, and the
framework of section 3 provides a possible explanation for this. The middle ground in
the debate is that the observed world distribution is a combination of indigenous and
“acquired” beliefs.17
The working hypothesis of the following analysis is that, even if the evil eye belief is
not indigenous in a given society, it was more likely to have been adopted as a result of
cross-cultural contact if the recipient society is unequal, that is, if the belief is relevant
given the underlying socioeconomic conditions.
To account for spatial diffusion from Mesopotamia we control for the (great circle)
distance from each society in the Old World to ancient Babylon. For the New World, we
15Ordered probit results are qualitatively similar, see tables D.1 and D.2 in appendix D.16Descriptive statistics and detailed description of all variables may be found in appendices B and C.17In his work on Aztec folk medicine Ortiz de Montellano (1989) points out that, albeit the evil eye
belief could have been brought to Mesoamerica by the Europeans, the presence of a similar local belief,
ihiyotl, facilitated its adoption.
11
control for the distance of each society to the location of Tenochtitlan, capital of the Aztec
empire that historically could have been the first SCCS society to acquire the evil eye belief
from Spaniards. Furthermore, distance to coastline may proxy for the ease of contact with
other cultures and is included as a control variable.18 All distances are measured in thou-
sands of kilometers. Apart from these distance controls, all specifications use continental
fixed effects for Africa, Eurasia, Oceania, North America and South America (see table
C.1 for the breakdown of the SCCS by continent).19
Tables 1 and 2 show the estimation results controlling for this first group of “spatial”
controls. The coefficient estimates on two inequality measures are highly economically and
statistically significant. According to the estimates in table 2, controlling for distances and
continental dummies, a stratified society is, on average, 19 percentage points more likely
to possess the evil eye belief. Similarly, taking the estimate from column (6) in table 1, a
one-step-ahead move on the specialization scale increases the evil eye belief rating by an
average of 0.35, while a jump from egalitarian society (0) to the unequal one with complex
specialization (3) would mean an increase by more than 1 unit.
The distance measures themselves are significant and substantial in magnitude, espe-
cially the distance to Babylon, the alleged place of origin of the belief in the Old World.
Note, however, that these distances are likely to capture effects far beyond the spatial dif-
fusion of the belief via cross-cultural interactions. The historical homelands of Babylonians
and Aztecs were the cradles of the Neolithic Revolutions in the Old and the New World,
respectively (Diamond and Bellwood, 2003). As discussed in more detail below, agricul-
tural revolution and domestication of animals were important forces leading to economic
complexity in general and wealth differentiation in particular. Hence, the included dis-
tances measure geographical proximity to ancient technological frontiers and may partially
capture the effects that should be attributed to inequality rather than spatial diffusion.
Economic development. Social stratification is often viewed as one of the by-products
of early economic development (see, e.g., Johnson and Earle, 1987). Ideally, one would
want to isolate the role of wealth inequality and show that it is this particular dimension
of development that is triggering the emergence or adoption of the evil eye belief. Thus,
we control for a host of variables that were argued to be proximate correlates of early
18For Africa, it is also a good proxy for involvement in slave trade (Nunn and Wantchekon, 2011) through
which the transmission of belief might have occurred.19In section 4.4 we address the problem of cross-cultural diffusion in a more rigorous way by estimating
spatial lag models. We also provide alternative estimates of standard errors that account for potential
spatial autocorrelation. As it turns out, regular White’s robust standard errors are the most conservative
in the majority of cases and hence, are reported in all tables by default.
12
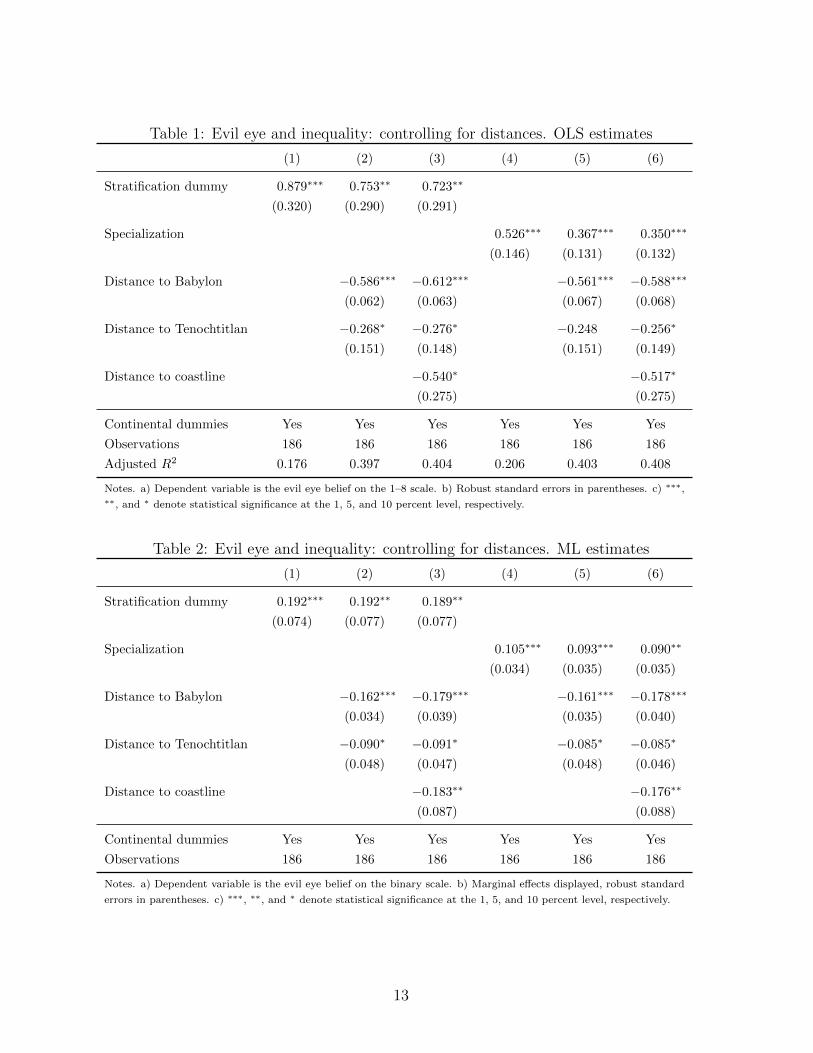
Table 1: Evil eye and inequality: controlling for distances. OLS estimates
(1) (2) (3) (4) (5) (6)
Stratification dummy 0.879∗∗∗ 0.753∗∗ 0.723∗∗
(0.320) (0.290) (0.291)
Specialization 0.526∗∗∗ 0.367∗∗∗ 0.350∗∗∗
(0.146) (0.131) (0.132)
Distance to Babylon −0.586∗∗∗ −0.612∗∗∗ −0.561∗∗∗ −0.588∗∗∗
(0.062) (0.063) (0.067) (0.068)
Distance to Tenochtitlan −0.268∗ −0.276∗ −0.248 −0.256∗
(0.151) (0.148) (0.151) (0.149)
Distance to coastline −0.540∗ −0.517∗
(0.275) (0.275)
Continental dummies Yes Yes Yes Yes Yes Yes
Observations 186 186 186 186 186 186
Adjusted R2 0.176 0.397 0.404 0.206 0.403 0.408
Notes. a) Dependent variable is the evil eye belief on the 1–8 scale. b) Robust standard errors in parentheses. c) ∗∗∗,∗∗, and ∗ denote statistical significance at the 1, 5, and 10 percent level, respectively.
Table 2: Evil eye and inequality: controlling for distances. ML estimates
(1) (2) (3) (4) (5) (6)
Stratification dummy 0.192∗∗∗ 0.192∗∗ 0.189∗∗
(0.074) (0.077) (0.077)
Specialization 0.105∗∗∗ 0.093∗∗∗ 0.090∗∗
(0.034) (0.035) (0.035)
Distance to Babylon −0.162∗∗∗ −0.179∗∗∗ −0.161∗∗∗ −0.178∗∗∗
(0.034) (0.039) (0.035) (0.040)
Distance to Tenochtitlan −0.090∗ −0.091∗ −0.085∗ −0.085∗
(0.048) (0.047) (0.048) (0.046)
Distance to coastline −0.183∗∗ −0.176∗∗
(0.087) (0.088)
Continental dummies Yes Yes Yes Yes Yes Yes
Observations 186 186 186 186 186 186
Notes. a) Dependent variable is the evil eye belief on the binary scale. b) Marginal effects displayed, robust standard
errors in parentheses. c) ∗∗∗, ∗∗, and ∗ denote statistical significance at the 1, 5, and 10 percent level, respectively.
13
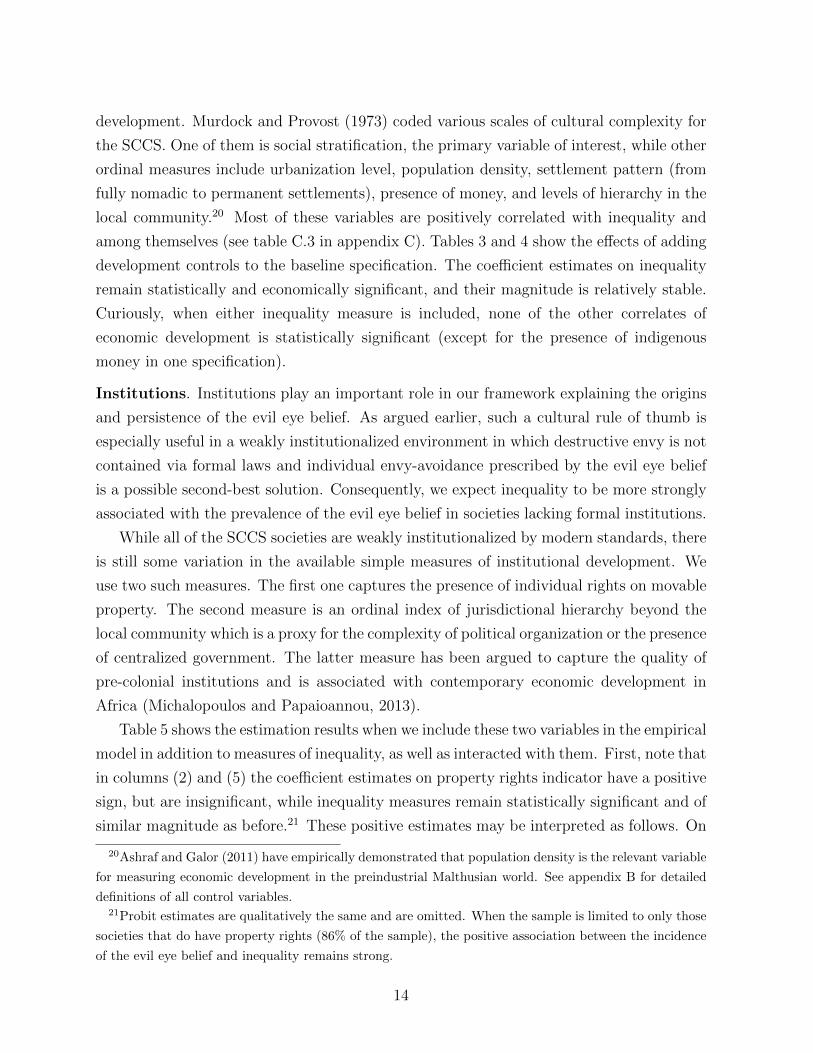
development. Murdock and Provost (1973) coded various scales of cultural complexity for
the SCCS. One of them is social stratification, the primary variable of interest, while other
ordinal measures include urbanization level, population density, settlement pattern (from
fully nomadic to permanent settlements), presence of money, and levels of hierarchy in the
local community.20 Most of these variables are positively correlated with inequality and
among themselves (see table C.3 in appendix C). Tables 3 and 4 show the effects of adding
development controls to the baseline specification. The coefficient estimates on inequality
remain statistically and economically significant, and their magnitude is relatively stable.
Curiously, when either inequality measure is included, none of the other correlates of
economic development is statistically significant (except for the presence of indigenous
money in one specification).
Institutions. Institutions play an important role in our framework explaining the origins
and persistence of the evil eye belief. As argued earlier, such a cultural rule of thumb is
especially useful in a weakly institutionalized environment in which destructive envy is not
contained via formal laws and individual envy-avoidance prescribed by the evil eye belief
is a possible second-best solution. Consequently, we expect inequality to be more strongly
associated with the prevalence of the evil eye belief in societies lacking formal institutions.
While all of the SCCS societies are weakly institutionalized by modern standards, there
is still some variation in the available simple measures of institutional development. We
use two such measures. The first one captures the presence of individual rights on movable
property. The second measure is an ordinal index of jurisdictional hierarchy beyond the
local community which is a proxy for the complexity of political organization or the presence
of centralized government. The latter measure has been argued to capture the quality of
pre-colonial institutions and is associated with contemporary economic development in
Africa (Michalopoulos and Papaioannou, 2013).
Table 5 shows the estimation results when we include these two variables in the empirical
model in addition to measures of inequality, as well as interacted with them. First, note that
in columns (2) and (5) the coefficient estimates on property rights indicator have a positive
sign, but are insignificant, while inequality measures remain statistically significant and of
similar magnitude as before.21 These positive estimates may be interpreted as follows. On
20Ashraf and Galor (2011) have empirically demonstrated that population density is the relevant variable
for measuring economic development in the preindustrial Malthusian world. See appendix B for detailed
definitions of all control variables.21Probit estimates are qualitatively the same and are omitted. When the sample is limited to only those
societies that do have property rights (86% of the sample), the positive association between the incidence
of the evil eye belief and inequality remains strong.
14
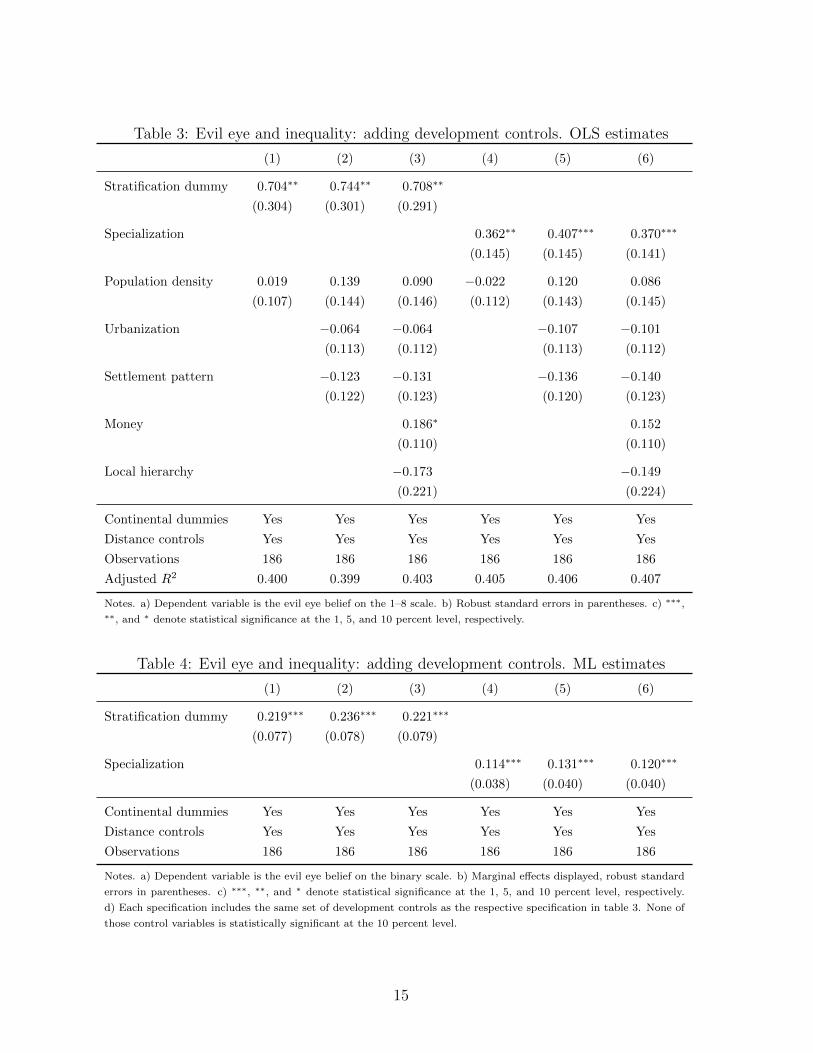
Table 3: Evil eye and inequality: adding development controls. OLS estimates
(1) (2) (3) (4) (5) (6)
Stratification dummy 0.704∗∗ 0.744∗∗ 0.708∗∗
(0.304) (0.301) (0.291)
Specialization 0.362∗∗ 0.407∗∗∗ 0.370∗∗∗
(0.145) (0.145) (0.141)
Population density 0.019 0.139 0.090 −0.022 0.120 0.086
(0.107) (0.144) (0.146) (0.112) (0.143) (0.145)
Urbanization −0.064 −0.064 −0.107 −0.101
(0.113) (0.112) (0.113) (0.112)
Settlement pattern −0.123 −0.131 −0.136 −0.140
(0.122) (0.123) (0.120) (0.123)
Money 0.186∗ 0.152
(0.110) (0.110)
Local hierarchy −0.173 −0.149
(0.221) (0.224)
Continental dummies Yes Yes Yes Yes Yes Yes
Distance controls Yes Yes Yes Yes Yes Yes
Observations 186 186 186 186 186 186
Adjusted R2 0.400 0.399 0.403 0.405 0.406 0.407
Notes. a) Dependent variable is the evil eye belief on the 1–8 scale. b) Robust standard errors in parentheses. c) ∗∗∗,∗∗, and ∗ denote statistical significance at the 1, 5, and 10 percent level, respectively.
Table 4: Evil eye and inequality: adding development controls. ML estimates
(1) (2) (3) (4) (5) (6)
Stratification dummy 0.219∗∗∗ 0.236∗∗∗ 0.221∗∗∗
(0.077) (0.078) (0.079)
Specialization 0.114∗∗∗ 0.131∗∗∗ 0.120∗∗∗
(0.038) (0.040) (0.040)
Continental dummies Yes Yes Yes Yes Yes Yes
Distance controls Yes Yes Yes Yes Yes Yes
Observations 186 186 186 186 186 186
Notes. a) Dependent variable is the evil eye belief on the binary scale. b) Marginal effects displayed, robust standard
errors in parentheses. c) ∗∗∗, ∗∗, and ∗ denote statistical significance at the 1, 5, and 10 percent level, respectively.
d) Each specification includes the same set of development controls as the respective specification in table 3. None of
those control variables is statistically significant at the 10 percent level.
15
the one hand, the presence of individual property rights is contributing to the existence
of substantial wealth inequality, as corroborated by the positive correlation between the
respective variables (see table C.3 in appendix C). On the other hand, the recognition
of individual property rights per se may enable social comparisons (Davidson, 2009), as
opposed to the situation, in which property is common, and so, there is less reason for
envy. As shown in panel (b) of table 5, similar pattern of results applies to the political
centralization index.
Interestingly, the coefficient estimates on interaction terms are negative in all cases,
although not precisely estimated. This is consistent with the idea that inequality is more
likely to trigger destructive envy in a weakly institutionalized environment. Hence, the
relationship between the prevalence of the evil eye belief and inequality is stronger in
societies in which property rights are absent and there is less political centralization.
Classical religion. It is important to note how classical religion (Christianity, Islam,
Buddhism, and Hinduism), a common object of research in recent literature on the eco-
nomics of culture, fits into present analysis. The evil eye belief predates all major classical
religions. Moreover, it was firmly incorporated into the main religious texts of Christianity,
Islam, and Hinduism, as well as associated broader cultures.22
On the one hand, this implies mechanically that the diffusion of these classical religions
throughout the world could have automatically contributed to the diffusion of the evil
eye belief as their integral part. On the other hand, perhaps more importantly, there
was a reason in the first place for incorporating this superstition in a collection of beliefs
and behavioral rules dictated by religious teachings. This is perfectly consistent with the
conceptual framework of the previous section: as long as destructive envy is a real threat
and the evil eye belief represents a beneficial rule-of-thumb for envy-avoidance behavior,
it becomes naturally integrated into a broad set of useful practices. This goes in line with
the fact that envy features prominently as a major vice in both Judeo-Christian tradition
(recall the Tenth Commandment and the seven deadly sins) and Islam (in which “hasad,”
destructive envy, is condemned as an evil and dangerous emotion). Not surprisingly, all
societies in the SCCS, classified by Korotayev (2004) as “deeply” Islamic, Christian, or
Hinduist, do possess the evil eye belief as part of their culture.
22See Elliott (1994) for biblical references, Gachter (1998) for the presence of the evil eye belief in
Hinduism, and the Pew Forum report “The World’s Muslims: Unity and Diversity” on Islam, available at
http://www.pewforum.org/Muslim/the-worlds-muslims-unity-and-diversity.aspx.
16
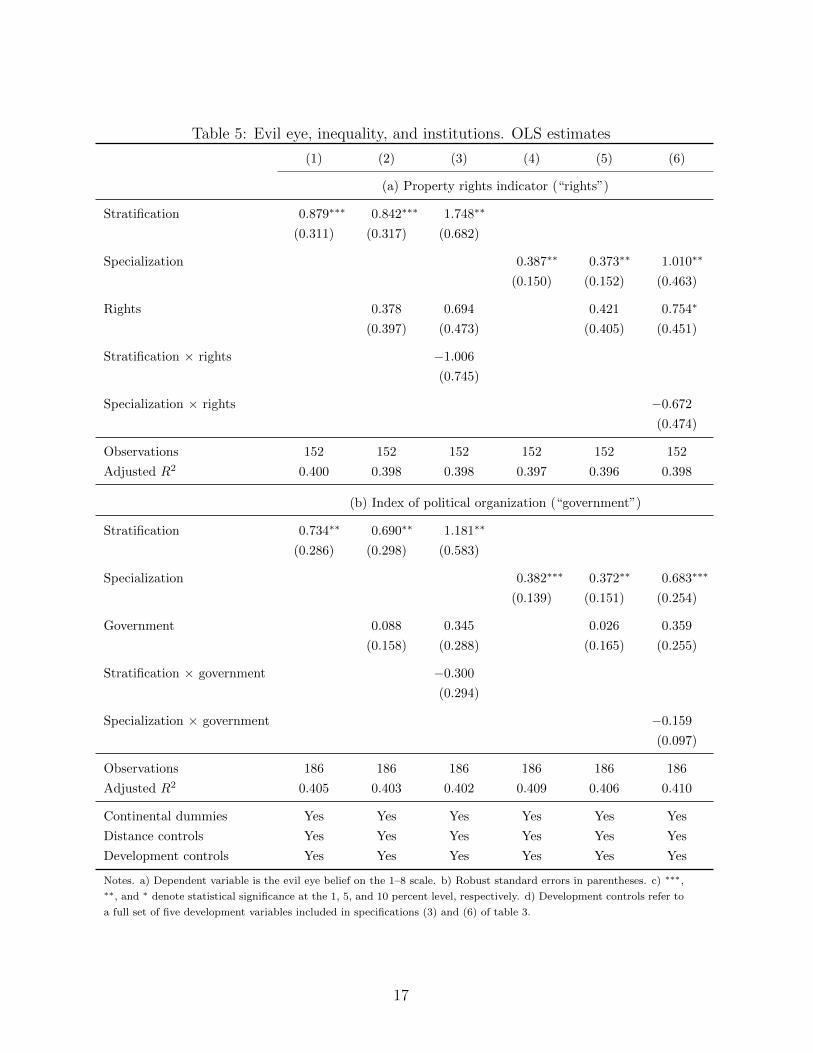
Table 5: Evil eye, inequality, and institutions. OLS estimates
(1) (2) (3) (4) (5) (6)
(a) Property rights indicator (“rights”)
Stratification 0.879∗∗∗ 0.842∗∗∗ 1.748∗∗
(0.311) (0.317) (0.682)
Specialization 0.387∗∗ 0.373∗∗ 1.010∗∗
(0.150) (0.152) (0.463)
Rights 0.378 0.694 0.421 0.754∗
(0.397) (0.473) (0.405) (0.451)
Stratification × rights −1.006
(0.745)
Specialization × rights −0.672
(0.474)
Observations 152 152 152 152 152 152
Adjusted R2 0.400 0.398 0.398 0.397 0.396 0.398
(b) Index of political organization (“government”)
Stratification 0.734∗∗ 0.690∗∗ 1.181∗∗
(0.286) (0.298) (0.583)
Specialization 0.382∗∗∗ 0.372∗∗ 0.683∗∗∗
(0.139) (0.151) (0.254)
Government 0.088 0.345 0.026 0.359
(0.158) (0.288) (0.165) (0.255)
Stratification × government −0.300
(0.294)
Specialization × government −0.159
(0.097)
Observations 186 186 186 186 186 186
Adjusted R2 0.405 0.403 0.402 0.409 0.406 0.410
Continental dummies Yes Yes Yes Yes Yes Yes
Distance controls Yes Yes Yes Yes Yes Yes
Development controls Yes Yes Yes Yes Yes Yes
Notes. a) Dependent variable is the evil eye belief on the 1–8 scale. b) Robust standard errors in parentheses. c) ∗∗∗,∗∗, and ∗ denote statistical significance at the 1, 5, and 10 percent level, respectively. d) Development controls refer to
a full set of five development variables included in specifications (3) and (6) of table 3.
17
To the extent that both the evil eye belief and some religious norms are driven by conflict
related to inequality, it is hard to separate the two in the empirical analysis.23 It is still
instructive to look at the earlier baseline specifications while controlling for the presence of
classical religion. First, based on earlier considerations one should expect classical religion
to be positively related to the evil eye belief. Second, within a group of societies that were
not heavily influenced by classical religions, more unequal ones should be more likely to
have the evil eye belief.
These predictions are corroborated by estimates in table 6. Models in columns (1) and
(2) include the detailed classification of the SCCS societies into seven categories: tradi-
tional religion (116 observations), deep islamization (19), superficial islamization (7), deep
christianization (6), superficial christianization (24), Buddhism (10), and Hinduism (4).
Compared to the baseline results, the coefficient estimates on inequality proxies are some-
what smaller while remaining statistically significant at the 5 percent level. Furthermore,
as expected, being profoundly affected by one of the three classical religions (Islam, Chris-
tianity, and Hinduism) is strongly positively correlated with the prevalence of the evil eye
belief. Buddhist influence seems to operate in the opposite way, although the coefficient
estimate is only weakly significant. Superficial exposure to either Islam or Christianity does
not yield statistically significant differences compared to traditional religion (although the
associated point estimates are positive). In columns (3) and (4) we employ an aggregated
version of the classification by lumping deeply or superficially islamized societies in one
group and deeply or superficially christianized societies in another. It seems that exposure
to Islam is more strongly associated with the evil eye belief, relative to Christianity. Fi-
nally, in columns (5) and (6) we drop the societies classified as heavily exposed to either
of the four classical religions. Within this group of societies practicing traditional religions
the inequality measures are strongly positively associated with the incidence of the evil eye
belief, and the corresponding point estimates are close to the baseline from table 3.
Environmental volatility. An important function of many supernatural beliefs is to
explain misfortunes. To the extent that more volatile and risky environment generates
more misfortunes to be explained, it might contribute to the emergence and diffusion of
superstitions such as the evil eye belief, while at the same time producing higher inequality
due to idiosyncratic wealth shocks. To address this potential issue we control for two
proxies of environmental volatility available in the SCCS: pathogen stress, which captures
23For example, in a recent paper, Michalopoulos et al. (2012) argue that Islam emerged in response to a
conflict environment caused by unequal regional agricultural endowments and offered economic and moral
rules addressing wealth inequality and fostering undisrupted trade.
18
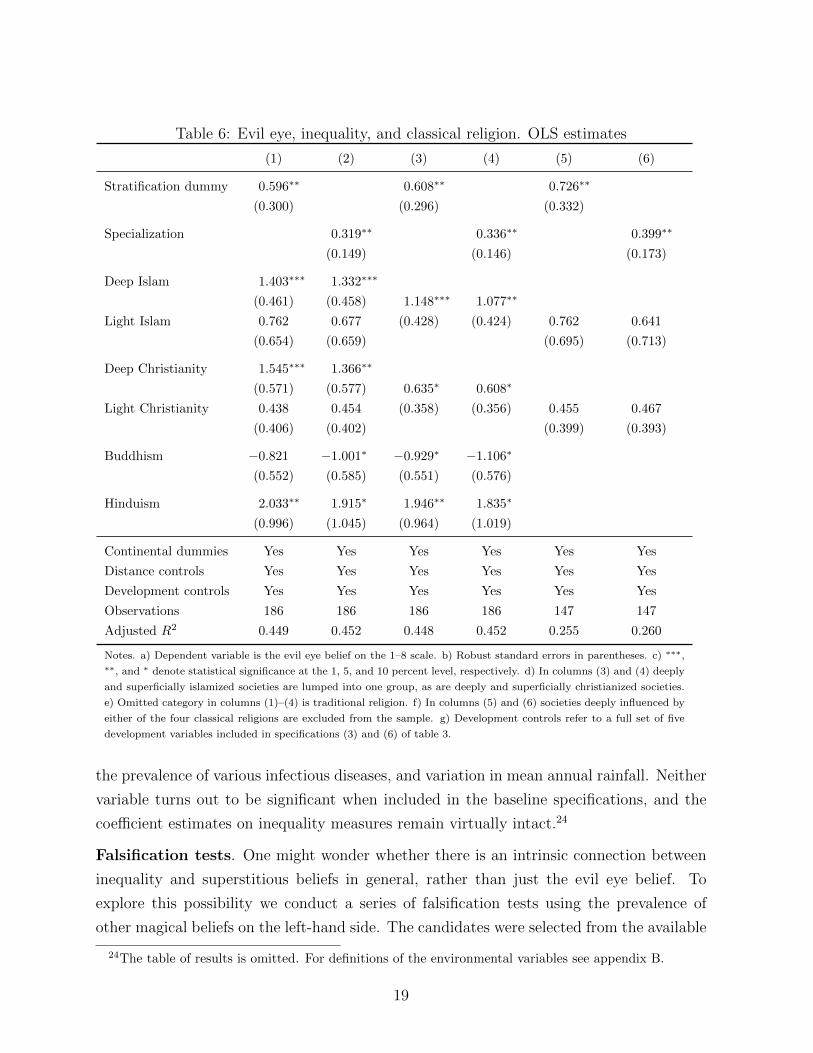
Table 6: Evil eye, inequality, and classical religion. OLS estimates
(1) (2) (3) (4) (5) (6)
Stratification dummy 0.596∗∗ 0.608∗∗ 0.726∗∗
(0.300) (0.296) (0.332)
Specialization 0.319∗∗ 0.336∗∗ 0.399∗∗
(0.149) (0.146) (0.173)
Deep Islam 1.403∗∗∗ 1.332∗∗∗
(0.461) (0.458) 1.148∗∗∗ 1.077∗∗
Light Islam 0.762 0.677 (0.428) (0.424) 0.762 0.641
(0.654) (0.659) (0.695) (0.713)
Deep Christianity 1.545∗∗∗ 1.366∗∗
(0.571) (0.577) 0.635∗ 0.608∗
Light Christianity 0.438 0.454 (0.358) (0.356) 0.455 0.467
(0.406) (0.402) (0.399) (0.393)
Buddhism −0.821 −1.001∗ −0.929∗ −1.106∗
(0.552) (0.585) (0.551) (0.576)
Hinduism 2.033∗∗ 1.915∗ 1.946∗∗ 1.835∗
(0.996) (1.045) (0.964) (1.019)
Continental dummies Yes Yes Yes Yes Yes Yes
Distance controls Yes Yes Yes Yes Yes Yes
Development controls Yes Yes Yes Yes Yes Yes
Observations 186 186 186 186 147 147
Adjusted R2 0.449 0.452 0.448 0.452 0.255 0.260
Notes. a) Dependent variable is the evil eye belief on the 1–8 scale. b) Robust standard errors in parentheses. c) ∗∗∗,∗∗, and ∗ denote statistical significance at the 1, 5, and 10 percent level, respectively. d) In columns (3) and (4) deeply
and superficially islamized societies are lumped into one group, as are deeply and superficially christianized societies.
e) Omitted category in columns (1)–(4) is traditional religion. f) In columns (5) and (6) societies deeply influenced by
either of the four classical religions are excluded from the sample. g) Development controls refer to a full set of five
development variables included in specifications (3) and (6) of table 3.
the prevalence of various infectious diseases, and variation in mean annual rainfall. Neither
variable turns out to be significant when included in the baseline specifications, and the
coefficient estimates on inequality measures remain virtually intact.24
Falsification tests. One might wonder whether there is an intrinsic connection between
inequality and superstitious beliefs in general, rather than just the evil eye belief. To
explore this possibility we conduct a series of falsification tests using the prevalence of
other magical beliefs on the left-hand side. The candidates were selected from the available
24The table of results is omitted. For definitions of the environmental variables see appendix B.
19
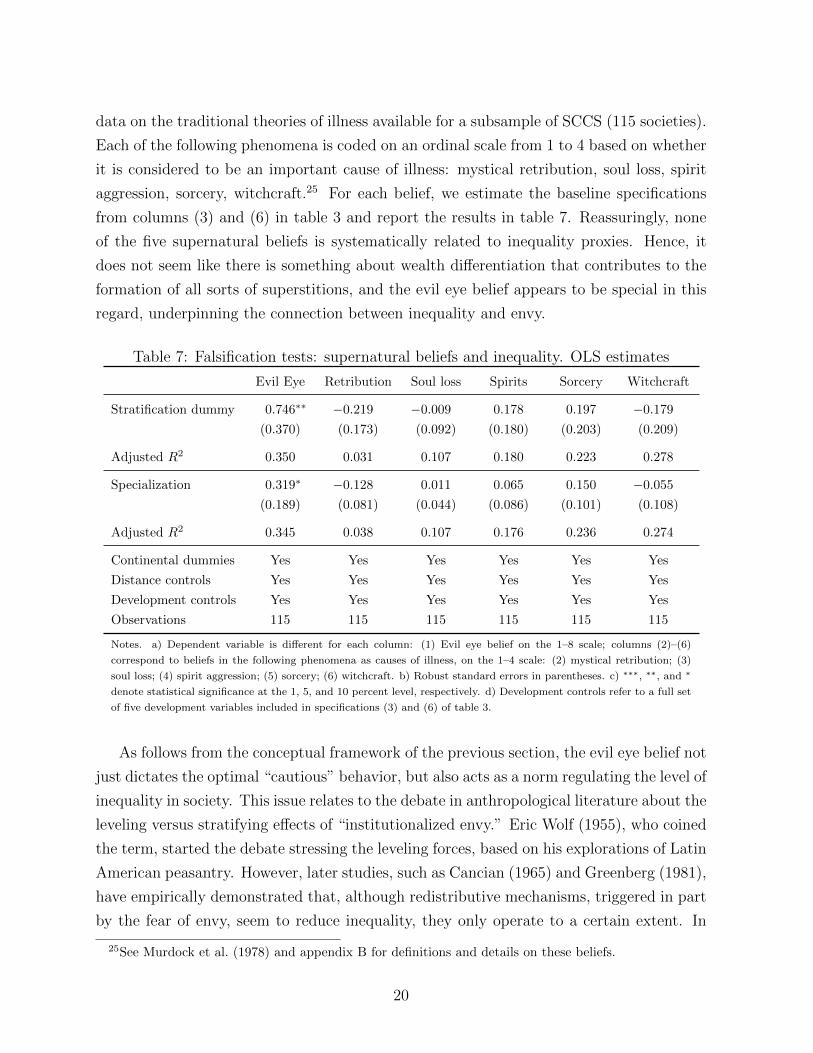
data on the traditional theories of illness available for a subsample of SCCS (115 societies).
Each of the following phenomena is coded on an ordinal scale from 1 to 4 based on whether
it is considered to be an important cause of illness: mystical retribution, soul loss, spirit
aggression, sorcery, witchcraft.25 For each belief, we estimate the baseline specifications
from columns (3) and (6) in table 3 and report the results in table 7. Reassuringly, none
of the five supernatural beliefs is systematically related to inequality proxies. Hence, it
does not seem like there is something about wealth differentiation that contributes to the
formation of all sorts of superstitions, and the evil eye belief appears to be special in this
regard, underpinning the connection between inequality and envy.
Table 7: Falsification tests: supernatural beliefs and inequality. OLS estimates
Evil Eye Retribution Soul loss Spirits Sorcery Witchcraft
Stratification dummy 0.746∗∗ −0.219 −0.009 0.178 0.197 −0.179
(0.370) (0.173) (0.092) (0.180) (0.203) (0.209)
Adjusted R2 0.350 0.031 0.107 0.180 0.223 0.278
Specialization 0.319∗ −0.128 0.011 0.065 0.150 −0.055
(0.189) (0.081) (0.044) (0.086) (0.101) (0.108)
Adjusted R2 0.345 0.038 0.107 0.176 0.236 0.274
Continental dummies Yes Yes Yes Yes Yes Yes
Distance controls Yes Yes Yes Yes Yes Yes
Development controls Yes Yes Yes Yes Yes Yes
Observations 115 115 115 115 115 115
Notes. a) Dependent variable is different for each column: (1) Evil eye belief on the 1–8 scale; columns (2)–(6)
correspond to beliefs in the following phenomena as causes of illness, on the 1–4 scale: (2) mystical retribution; (3)
soul loss; (4) spirit aggression; (5) sorcery; (6) witchcraft. b) Robust standard errors in parentheses. c) ∗∗∗, ∗∗, and ∗
denote statistical significance at the 1, 5, and 10 percent level, respectively. d) Development controls refer to a full set
of five development variables included in specifications (3) and (6) of table 3.
As follows from the conceptual framework of the previous section, the evil eye belief not
just dictates the optimal “cautious” behavior, but also acts as a norm regulating the level of
inequality in society. This issue relates to the debate in anthropological literature about the
leveling versus stratifying effects of “institutionalized envy.” Eric Wolf (1955), who coined
the term, started the debate stressing the leveling forces, based on his explorations of Latin
American peasantry. However, later studies, such as Cancian (1965) and Greenberg (1981),
have empirically demonstrated that, although redistributive mechanisms, triggered in part
by the fear of envy, seem to reduce inequality, they only operate to a certain extent. In
25See Murdock et al. (1978) and appendix B for definitions and details on these beliefs.
20
fact, redistribution can even enhance stratification, not in terms of wealth differences, but
through status and power acquired by the relatively rich individuals via sharing.26
To the extent that the evil eye belief acts as “leveler,” the estimates reported above
provide a lower bound for the coefficient on inequality. This “reverse causality” concern
is partly alleviated since the employed measures of inequality are rather coarse: despite
the plausible leveling properties of the belief, it is unlikely to render a stratified society
egalitarian. To further mitigate this issue while also providing additional evidence on
the fundamental correlates of the evil eye belief, the following subsection explores the
relationship between the evil eye belief and the subsistence production mode. As explained
below, the mode of production represents the technological basis of wealth distribution in
society, and its choice is unlikely to be affected by the presence of the evil eye belief.
4.3 Production mode, inequality, and the evil eye belief
Social stratification is intimately linked to the type of subsistence economy, the two ex-
tremes being egalitarian foragers and highly stratified technologically advanced agricul-
tural societies. An ambitious interdisciplinary project recently undertaken by a group of
researchers employed individual-level data from small-scale societies to demonstrate that
the production mode is systematically related to inequality and intergenerational transmis-
sion of wealth (Borgerhoff Mulder et al., 2009).27 The latter were shown to be substantial
in pastoral and agricultural societies but modest among foragers and horticulturalists.
The key mechanism behind this result relies on the importance of different wealth types
across production modes. Material wealth (such as livestock and land) is relatively more
important in agro-pastoral economies and is at the same time easily transmitted from
parents to children, conditional on rules of inheritance. In contrast, human capital (such
as somatic wealth and skills) and social capital (such as network ties) are relatively more
important in foraging and horticultural societies and are harder to transmit vertically.
Higher rate of intergenerational transmission implies that random shocks to family wealth
are more persistent, counteracting the tendency to mean reversion and raising the steady-
state level of inequality. Note that technology (differential importance of wealth types) and
institutions (rules of inheritance and redistributive norms) both contribute to differences
in intergenerational mobility and inequality. Thus, we use production mode as a “deep”
determinant of inequality that is unlikely to be affected by the evil eye belief.
26For an excellent analysis of traditional redistributive norms in Sub-Saharan Africa see Platteau (2014).27For a detailed description of methodology and results of this study see the February 2010 issue of
Current Anthropology (volume 51, number 1).
21
First, we investigate the link between inequality and production mode across cultures
to confirm the general finding of Borgerhoff Mulder et al. (2009). Available data allow to
do this not just for the SCCS, but also for a larger sample in the Ethnographic Atlas which
nests SCCS.28 For the SCCS, we use the variable “Subsistence Economy: Dominant Mode”
which comprises the following categories: advanced agriculture (56 societies), horticulture
(18), simple or shifting cultivation (51), domestic animals (15), exchange (1), fishing (17),
gathering (13), and hunting (15). Following the definitional guidelines in Borgerhoff Mulder
et al. (2009), we combine the second and third groups in one, “horticulturalists,” and also
lump together the last 4 groups as “foragers” to obtain a similar four-way classification.29
For the EA the four-way classification is constructed based on the variables measuring
percentage dependence of the economy on gathering, hunting, fishing, animal husbandry,
and agriculture, together with the data on the intensity of agriculture. The cases, for which
the type of agriculture is unknown or several types of subsistence contribute equally, were
omitted from the sample, to be consistent with the SCCS regressions.30 Otherwise, the
type of subsistence economy was defined based on the most important contributing mode
of production (50 percent and higher of the total).
To control for rules of inheritance we employ a categorical variable capturing the dis-
tribution of inheritance of land and movable property. The categories are as follows: no
rights on land/movables, equal or relatively equal distribution, exclusive transfer (which
comprises transfer to the “best qualified” individual, ultimogeniture, and primogeniture).
Data on inheritance rules for movables and land are only available for subsamples of the
SCCS (145 and 151 observations, respectively) and the EA (752 and 680 observations,
respectively).31 The estimates are reported based on unified samples for which all of the
relevant data are available.
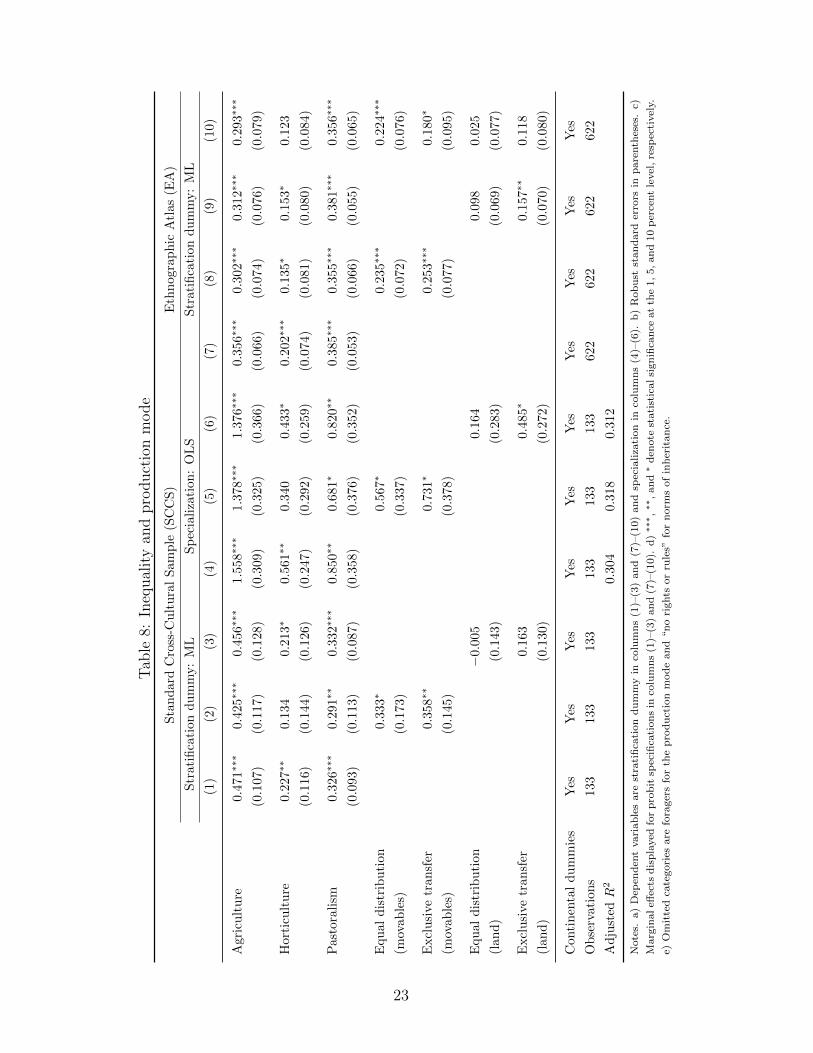
As follows from columns (1)–(6) of table 8, evidence from the SCCS supports the main
finding of Borgerhoff Mulder et al. (2009): agricultural and pastoral societies are on average
more unequal compared to horticulturalists and foragers, where the latter category is taken
as baseline. When stratification dummy is used as a measure of inequality, the formal test
cannot reject the null that agriculture and pastoralism contribute equally to stratification.
However, agricultural societies tend to be more technologically specialized compared to
pastoral societies. Horticulturalists are closer to the omitted group of foragers, implying
28The only measure of inequality available in the EA is class stratification.29One society in the “exchange” category are the Manus islanders, with fishing as secondary mode.30Inclusion of these two categories as separate classes does not qualitatively alter the results. See figure
C.1 in appendix C for the breakdown of both samples by subsistence production mode.31See figure C.2 in appendix C for the breakdown of SCCS and EA societies based on this variable.
22
Tab
le8:
Ineq
ual
ity
and
pro
duct
ion
mode
Sta
nd
ard
Cro
ss-C
ult
ura
lSam
ple
(SC
CS
)E
thn
ogra
ph
icA
tlas
(EA
)
Str
atifi
cati
ond
um
my:
ML
Sp
ecia
liza
tion
:O
LS
Str
ati
fica
tion
du
mm
y:
ML
(1)
(2)
(3)
(4)
(5)
(6)
(7)
(8)
(9)
(10)
Agr
icu
ltu
re0.4
71∗∗∗
0.42
5∗∗∗
0.456∗∗∗
1.558∗∗∗
1.3
78∗∗∗
1.376∗∗∗
0.356∗∗∗
0.302∗∗∗
0.3
12∗∗∗
0.293∗∗∗
(0.1
07)
(0.1
17)
(0.1
28)
(0.3
09)
(0.3
25)
(0.3
66)
(0.0
66)
(0.0
74)
(0.0
76)
(0.0
79)
Hor
ticu
ltu
re0.2
27∗∗
0.13
40.2
13∗
0.561∗∗
0.3
40
0.4
33∗
0.202∗∗∗
0.135∗
0.1
53∗
0.123
(0.1
16)
(0.1
44)
(0.1
26)
(0.2
47)
(0.2
92)
(0.2
59)
(0.0
74)
(0.0
81)
(0.0
80)
(0.0
84)
Pas
tora
lism
0.3
26∗∗∗
0.29
1∗∗
0.332∗∗∗
0.850∗∗
0.6
81∗
0.820∗∗
0.385∗∗∗
0.3
55∗∗∗
0.3
81∗∗∗
0.356∗∗∗
(0.0
93)
(0.1
13)
(0.0
87)
(0.3
58)
(0.3
76)
(0.3
52)
(0.0
53)
(0.0
66)
(0.0
55)
(0.0
65)
Equ
ald
istr
ibu
tion
0.3
33∗
0.5
67∗
0.235∗∗∗
0.224∗∗∗
(mov
able
s)(0.1
73)
(0.3
37)
(0.0
72)
(0.0
76)
Excl
usi
vetr
ansf
er0.
358∗∗
0.7
31∗
0.253∗∗∗
0.180∗
(mov
able
s)(0.1
45)
(0.3
78)
(0.0
77)
(0.0
95)
Equ
ald
istr
ibu
tion
−0.
005
0.164
0.098
0.025
(lan
d)
(0.1
43)
(0.2
83)
(0.0
69)
(0.0
77)
Excl
usi
vetr
ansf
er0.
163
0.485∗
0.1
57∗∗
0.1
18
(lan
d)
(0.1
30)
(0.2
72)
(0.0
70)
(0.0
80)
Con
tin
enta
ld
um
mie
sY
esY
esY
esY
esY
esY
esY
esY
esY
esY
es
Ob
serv
atio
ns
133
133
133
133
133
133
622
622
622
622
Ad
just
edR
20.
304
0.3
18
0.3
12
Note
s.a)
Dep
end
ent
vari
ab
les
are
stra
tifi
cati
on
du
mm
yin
colu
mn
s(1
)–(3
)an
d(7
)–(1
0)
an
dsp
ecia
liza
tion
inco
lum
ns
(4)–
(6).
b)
Rob
ust
stan
dard
erro
rsin
pare
nth
eses
.c)
Marg
inaleff
ects
dis
pla
yed
for
pro
bit
spec
ifica
tion
sin
colu
mn
s(1
)–(3
)an
d(7
)–(1
0).
d)∗∗∗,∗∗
,an
d∗
den
ote
stati
stic
alsi
gn
ifica
nce
at
the
1,
5,
an
d10
per
cent
level
,re
spec
tivel
y.
e)O
mit
ted
cate
gori
esare
fora
ger
sfo
rth
ep
rod
uct
ion
mod
ean
d“n
ori
ghts
or
rule
s”fo
rn
orm
sof
inh
erit
an
ce.
23
that the simplest cultivation technology does not yield a substantial increase in inequality.
The rules of inheritance are also important correlates of inequality, consistent with the
analysis of Borgerhoff Mulder et al. (2009). Rules that lead to more unequal distribution
of inheritance are associated with higher stratification and specialization. Moreover, rules
regulating the inheritance of movable property seem to be more important that those
involving land. Columns (7)–(10) of table 8 support the above results in a broader sample
of the Ethnographic Atlas.
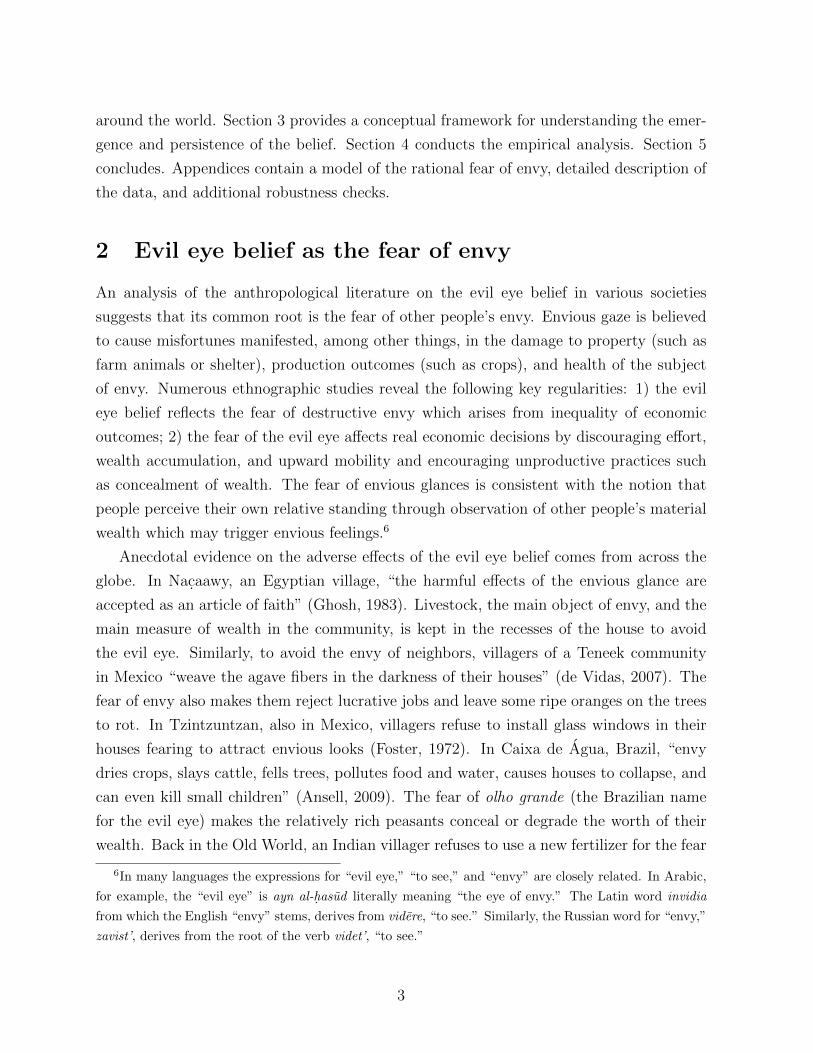
To the extent that production mode differentially affects the degree of inequality in
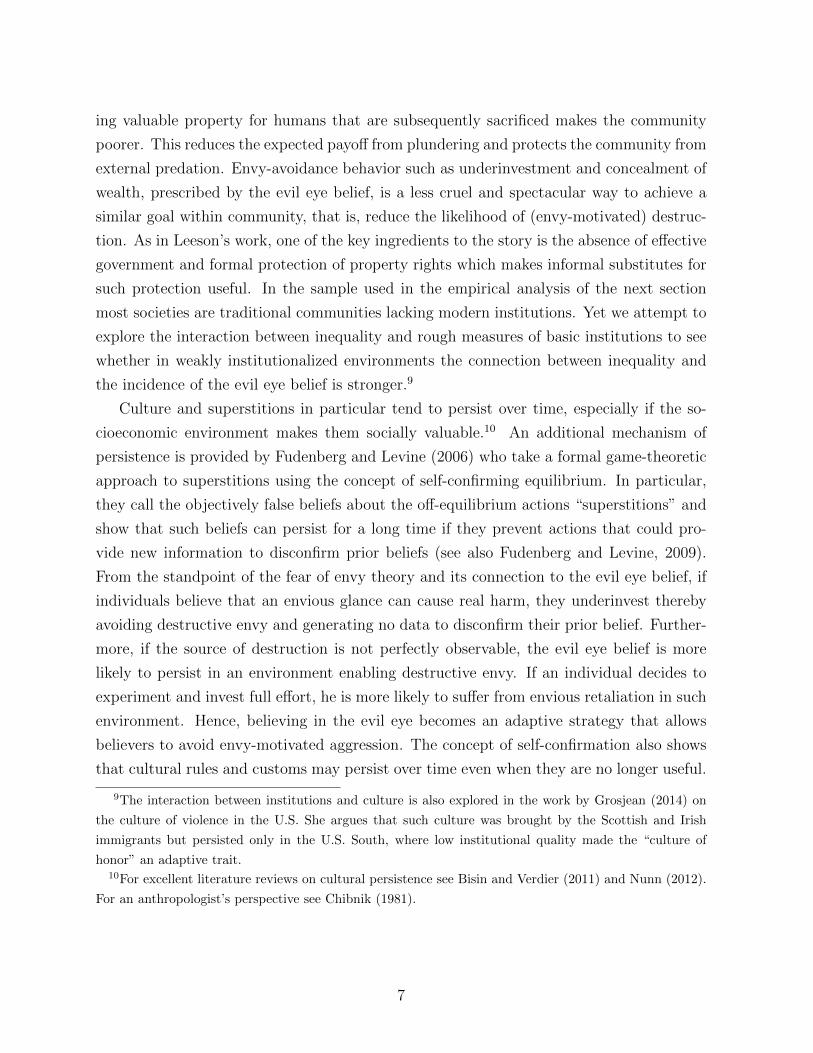
society, the evil eye belief should be more prevalent in agro-pastoral societies. Figure 3
and table 9 are consistent with this statement. That is, the incidence of the belief is
substantially higher if the subsistence production mode is technologically more prone to
perpetuate inequality.
Table 9 reveals several other patterns. First, the inclusion of distance controls makes
a difference. This is not surprising, since, as mentioned above, they are good proxies for
the diffusion of agriculture and domestication of animals, apart from the evil eye belief.
Second, when inequality measures are included along with the production mode, they
lose in magnitude, as expected. Nevertheless, stratification dummy remains marginally
significant, while specialization remains significant at the 5 percent level.
On the one hand, this means that the link between inequality and the incidence of the
evil eye belief is present even conditional on the mode of production, which is reassuring.
On the other hand, the fact that “unequal” production modes seem to matter after con-
trolling for finer measures of inequality may indicate that some of their other features are
important. The conceptual framework of section 3 yields two possible explanations. First,
material wealth which is more important in agro-pastoral societies is also highly visible and
thus, is more likely to trigger comparisons and destructive envy. Second, material wealth
such as livestock and crops is also highly vulnerable, making envious retaliation easier and
the fear of destructive envy more pronounced. Hence, all three factors enabling destructive
envy and the fear of it (inequality, strength of comparisons, and the ease of retaliation)
seem to be more prominent in agro-pastoral societies and may be jointly driving the main
finding of this exercise.
4.4 Robustness checks
In this section two types of robustness checks are carried out. First, the sample is trimmed
in different ways to make sure the results are not sensitive to the inclusion of specific
observations. Second, in order to deal in a more comprehensive way with the problem of
24
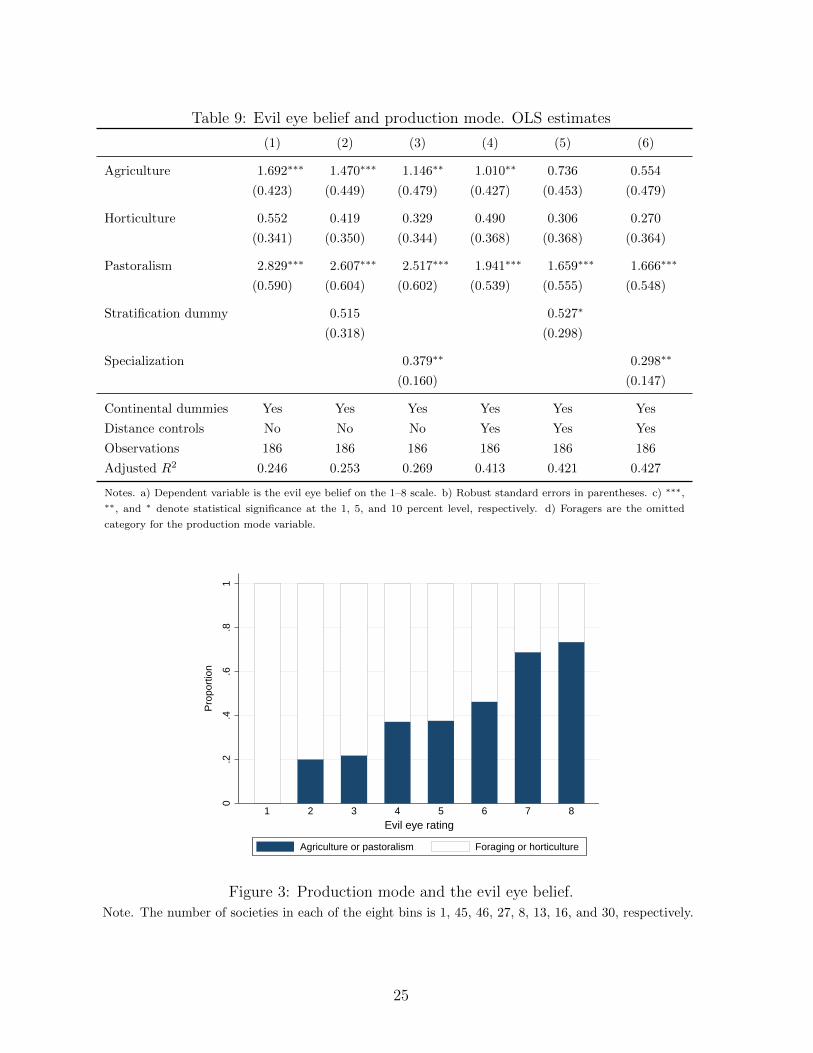
Table 9: Evil eye belief and production mode. OLS estimates
(1) (2) (3) (4) (5) (6)
Agriculture 1.692∗∗∗ 1.470∗∗∗ 1.146∗∗ 1.010∗∗ 0.736 0.554
(0.423) (0.449) (0.479) (0.427) (0.453) (0.479)
Horticulture 0.552 0.419 0.329 0.490 0.306 0.270
(0.341) (0.350) (0.344) (0.368) (0.368) (0.364)
Pastoralism 2.829∗∗∗ 2.607∗∗∗ 2.517∗∗∗ 1.941∗∗∗ 1.659∗∗∗ 1.666∗∗∗
(0.590) (0.604) (0.602) (0.539) (0.555) (0.548)
Stratification dummy 0.515 0.527∗
(0.318) (0.298)
Specialization 0.379∗∗ 0.298∗∗
(0.160) (0.147)
Continental dummies Yes Yes Yes Yes Yes Yes
Distance controls No No No Yes Yes Yes
Observations 186 186 186 186 186 186
Adjusted R2 0.246 0.253 0.269 0.413 0.421 0.427
Notes. a) Dependent variable is the evil eye belief on the 1–8 scale. b) Robust standard errors in parentheses. c) ∗∗∗,∗∗, and ∗ denote statistical significance at the 1, 5, and 10 percent level, respectively. d) Foragers are the omitted
category for the production mode variable.
0.2
.4.6
.81
Pro
port
ion
1 2 3 4 5 6 7 8Evil eye rating
Agriculture or pastoralism Foraging or horticulture
Figure 3: Production mode and the evil eye belief.Note. The number of societies in each of the eight bins is 1, 45, 46, 27, 8, 13, 16, and 30, respectively.
25
spatial autocorrelation we provide robust estimates of standard errors and estimate the
spatial lag specifications of the baseline model using two alternative weights matrices.
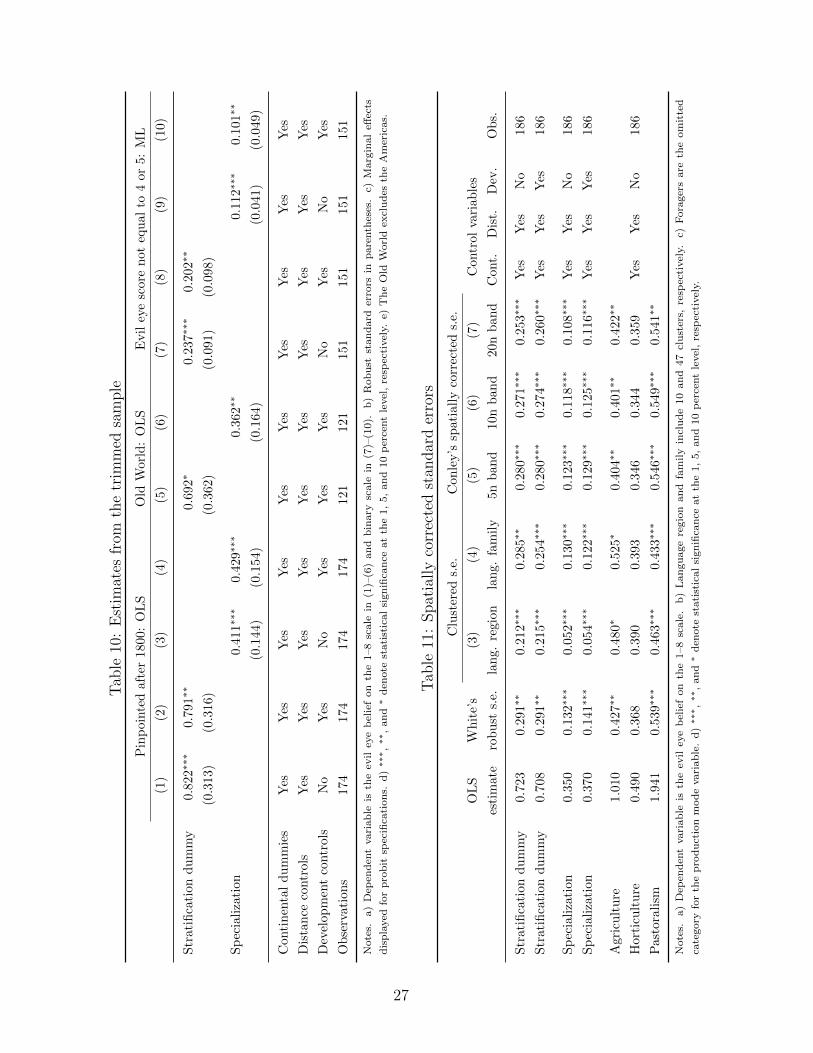
Trimming the sample. The results are shown in table 10. Columns (1)–(4) present the
estimates when societies pinpointed before 1800 are dropped from the sample, which leaves
out cultures described based on historical documents or diaries of travelers rather than
anthropological evidence. This restriction effectively reduces the sample by 12 observations
and arguably increases comparability and reliability of the data.32 In columns (5)–(6) the
model is estimated only for the Old World, leaving out the Americas thereby trimming the
sample by 65 observations. Finally, in columns (7)–(10) we drop observations for which the
evil eye belief rating is equal to 4 (“possibly absent”) and 5 (“possibly present”), that is,
the cases in which uncertainty about deciding on the presence or absence of the belief is the
highest. Thus, in columns (7)–(10) the evil eye belief is absent for societies with rating 1–3
and present in societies with rating 6–8. Comparison with the baseline regression tables
shows that the results are robust to all trimming strategies and are not driven by outliers.
Spatial autocorrelation. Although the original sampling strategy of Murdock and White
(1969) aimed at reducing the spatial dependence of observations, it still remains an issue
in the SCCS (Eff, 2004). We follow several strategies to demonstrate the robustness of
baseline results to this potential problem. First, continental dummies and distance controls
are included in all specifications. Second, we report the standard errors adjusted for spatial
correlation in table 11. In columns (3)–(4) clustered standard errors are shown. To account
for potential interdependencies in the error terms across societies we cluster the standard
errors at one of two levels: language region and language family. Language region is a
coarse measure of common language origin that comprises 10 categories, while language
family is a finer subdivision into 47 categories (Burton, 1999).33
Columns (5)–(7) show the standard errors corrected using the methodology of Conley
(1999) that does not impose an a priori structure on the type of spatial dependence.
Specifically, asymptotic covariance matrices are estimated as weighted averages of sample
autocovariances, where the weight for each term is the product of weight functions in
each dimension that decline linearly and are zero beyond specified cutoff distances. To
32Specifically, the following cultures are dropped (date of pinpointing in parentheses): Babylonians (1750
B.C.), Hebrews (621 B.C.), Romans (110), Khmer (1292), Aztec (1520), Inca (1530), Tupinamba (1550),
Huron (1634), Callinago (1650), Micmac (1650), Natchez (1718), Abipon (1750). Another strategy is to
include the date of pinpointing explicitly as an additional regressor. This does not change any of the
reported results, and the new regressor itself turns out insignificant in all baseline specifications.33Clustering at the continental level yields qualitatively similar results which are not reported.
26
Tab
le10
:E
stim
ates
from
the
trim
med
sam
ple
Pin
poi
nte
daf
ter
1800:
OL
SO
ldW
orl
d:
OL
SE
vil
eye
score
not
equ
al
to4
or
5:
ML
(1)
(2)
(3)
(4)
(5)
(6)
(7)
(8)
(9)
(10)
Str
atifi
cati
ond
um
my
0.8
22∗∗∗
0.79
1∗∗
0.692∗
0.237∗∗∗
0.2
02∗∗
(0.3
13)
(0.3
16)
(0.3
62)
(0.0
91)
(0.0
98)
Sp
ecia
liza
tion
0.4
11∗∗∗
0.4
29∗∗∗
0.362∗∗
0.112∗∗∗
0.101∗∗
(0.1
44)
(0.1
54)
(0.1
64)
(0.0
41)
(0.0
49)
Con
tin
enta
ld
um
mie
sY
esY
esY
esY
esY
esY
esY
esY
esY
esY
es
Dis
tan
ceco
ntr
ols
Yes
Yes
Yes
Yes
Yes
Yes
Yes
Yes
Yes
Yes
Dev
elop
men
tco
ntr
ols
No
Yes
No
Yes
Yes
Yes
No
Yes
No
Yes
Ob
serv
atio
ns
174
174
174
174
121
121
151
151
151
151
Note
s.a)
Dep
end
ent
vari
ab
leis
the
evil
eye
bel
ief
on
the
1–8
scale
in(1
)–(6
)an
db
inary
scale
in(7
)–(1
0).
b)
Rob
ust
stan
dard
erro
rsin
pare
nth
eses
.c)
Marg
inal
effec
ts
dis
pla
yed
for
pro
bit
spec
ifica
tion
s.d
)∗∗∗,∗∗
,an
d∗
den
ote
stati
stic
al
sign
ifica
nce
at
the
1,
5,
an
d10
per
cent
level
,re
spec
tivel
y.e)
The
Old
Worl
dex
clu
des
the
Am
eric
as.
Tab
le11
:Spat
ially
corr
ecte
dst
andar
der
rors
Clu
ster
eds.
e.C
on
ley’s
spati
all
yco
rrec
ted
s.e.
OL
SW
hit
e’s
(3)
(4)
(5)
(6)
(7)
Contr
ol
vari
ab
les
esti
mat
ero
bu
sts.
e.la
ng.
regio
nla
ng.
fam
ily
5n
ban
d10n
ban
d20n
ban
dC
ont.
Dis
t.D
ev.
Ob
s.
Str
atifi
cati
ond
um
my
0.72
30.2
91∗∗
0.212∗∗∗
0.285∗∗
0.2
80∗∗∗
0.271∗∗∗
0.253∗∗∗
Yes
Yes
No
186
Str
atifi
cati
ond
um
my
0.70
80.2
91∗∗
0.215∗∗∗
0.254∗∗∗
0.280∗∗∗
0.274∗∗∗
0.260∗∗∗
Yes
Yes
Yes
186
Sp
ecia
liza
tion
0.3
500.1
32∗∗∗
0.052∗∗∗
0.130∗∗∗
0.123∗∗∗
0.118∗∗∗
0.1
08∗∗∗
Yes
Yes
No
186
Sp
ecia
liza
tion
0.3
700.1
41∗∗∗
0.054∗∗∗
0.122∗∗∗
0.129∗∗∗
0.125∗∗∗
0.1
16∗∗∗
Yes
Yes
Yes
186
Agr
icu
ltu
re1.0
100.4
27∗∗
0.480∗
0.525∗
0.404∗∗
0.401∗∗
0.4
22∗∗
Hor
ticu
ltu
re0.
490
0.3
680.
390
0.393
0.3
46
0.3
44
0.3
59
Yes
Yes
No
186
Pas
tora
lism
1.9
410.5
39∗∗∗
0.463∗∗∗
0.433∗∗∗
0.546∗∗∗
0.549∗∗∗
0.5
41∗∗
Note
s.a)
Dep
end
ent
vari
ab
leis
the
evil
eye
bel
ief
on
the
1–8
scale
.b
)L
an
gu
age
regio
nan
dfa
mily
incl
ud
e10
an
d47
clu
ster
s,re
spec
tivel
y.c)
Fora
ger
sare
the
om
itte
d
cate
gory
for
the
pro
du
ctio
nm
od
evari
ab
le.
d)∗∗∗,∗∗
,an
d∗
den
ote
stati
stic
al
sign
ifica
nce
at
the
1,
5,
an
d10
per
cent
level
,re
spec
tivel
y.
27
define these cutoffs we first use the Mercator projection to get the coordinates for each
SCCS society on the Euclidean plane. We then compute an average distance band which
“forces” each society to have a certain minimal number of neighbors within that band. This
distance band is then used as cutoff in each dimension to calculate the spatially corrected
standard errors. Specifically, in column (5) it is the average distance band that covers at
least 5 neighbors for each society, while in columns (6) and (7) the number of neighbors
is increased to 10 and 20, respectively. In general, table 11 reveals that adjustment of
standard errors for potential spatial autocorrelation does not change the qualitative results
and, in fact, White’s robust standard errors reported throughout the paper turn out to be
the most conservative in the majority of cases.
Finally, it is possible that distance controls do not fully account for the direct cross-
cultural transmission of the belief. To explore the transmission mechanism more closely
we estimate the following spatial lag specification of the model:34
eye = αS + ρSWeye + βS inequality + XΓS + D∆S + εS,
where eye and inequality now denote the vectors of observations for these two variables,
X and D are matrices of control variables and continental dummies, W is the (row stan-
dardized) spatial weights matrix, Weye is the spatial lag of the evil eye belief variable and
the subscript S stands for “spatial.” To proceed one has to specify the spatial weights
matrix W. We use two alternative matrices. The first one, WG, is based on geographical
(great circle) distances between societies. In particular, each entry of the matrix is the
(row standardized) squared inverse of the distance between corresponding societies. The
second matrix, WL, is based on phylogenetic distances between societies. This matrix of
proximity between languages spoken by the SCCS societies was constructed by Eff (2008)
based on the data from Ethnologue. The proximity between each pair of languages is calcu-
lated as the distance from the panhuman root of the language tree to the nearest common
ancestor of those two languages.35 These distance matrices are designed to account for the
effects of descent and cultural borrowing on the incidence of the evil eye belief. The spatial
lag models are estimated via maximum likelihood (Anselin and Hudak, 1992).
Table 12 shows the estimation results. In panel A the spatial weights matrix is based
on geographic distances, while in panel B it is based on phylogenetic distances. In all
specifications, apart from column (5), the spatial lag of the evil eye belief is insignificant,
34Estimation of the spatial error model yields very similar results. The spatial lag model seems more
appropriate given the possibility of direct transmission through cross-cultural contact.35See Eff (2008) for details. The matrix is available for download in Excel format at Anthon Eff’s
website: http://www.mtsu.edu/~eaeff/downloads/SCCSprox.xls.
28
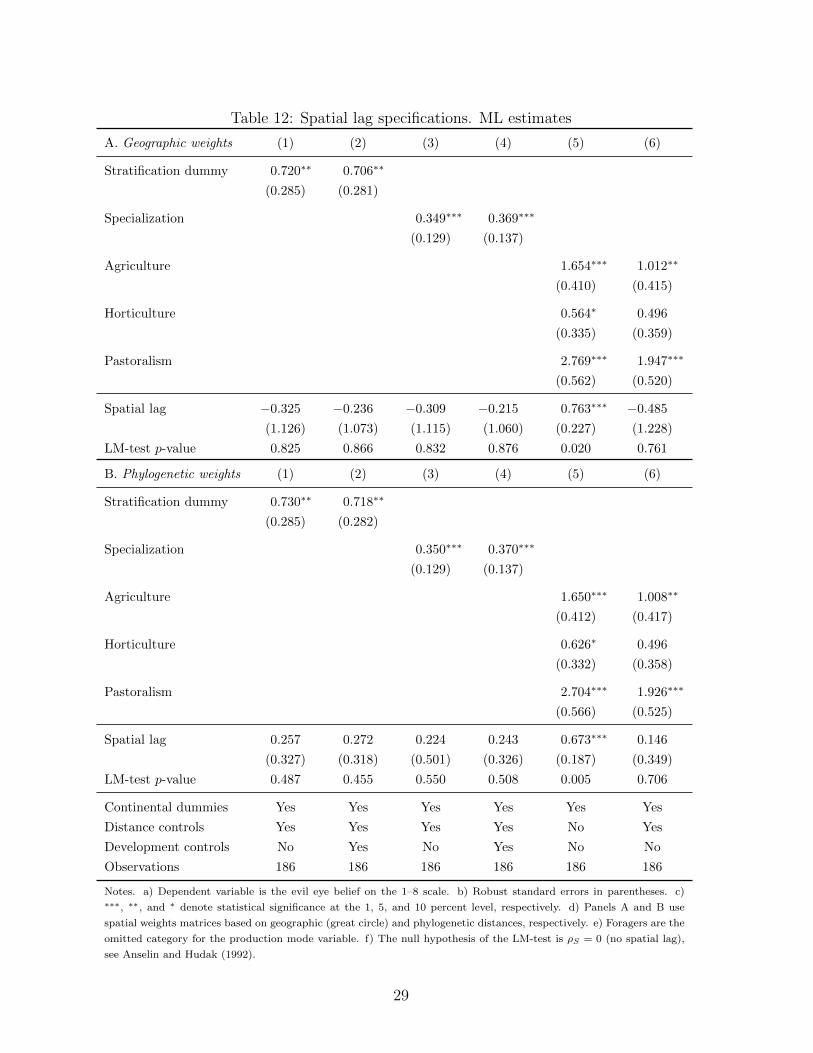
Table 12: Spatial lag specifications. ML estimates
A. Geographic weights (1) (2) (3) (4) (5) (6)
Stratification dummy 0.720∗∗ 0.706∗∗
(0.285) (0.281)
Specialization 0.349∗∗∗ 0.369∗∗∗
(0.129) (0.137)
Agriculture 1.654∗∗∗ 1.012∗∗
(0.410) (0.415)
Horticulture 0.564∗ 0.496
(0.335) (0.359)
Pastoralism 2.769∗∗∗ 1.947∗∗∗
(0.562) (0.520)
Spatial lag −0.325 −0.236 −0.309 −0.215 0.763∗∗∗ −0.485
(1.126) (1.073) (1.115) (1.060) (0.227) (1.228)
LM-test p-value 0.825 0.866 0.832 0.876 0.020 0.761
B. Phylogenetic weights (1) (2) (3) (4) (5) (6)
Stratification dummy 0.730∗∗ 0.718∗∗
(0.285) (0.282)
Specialization 0.350∗∗∗ 0.370∗∗∗
(0.129) (0.137)
Agriculture 1.650∗∗∗ 1.008∗∗
(0.412) (0.417)
Horticulture 0.626∗ 0.496
(0.332) (0.358)
Pastoralism 2.704∗∗∗ 1.926∗∗∗
(0.566) (0.525)
Spatial lag 0.257 0.272 0.224 0.243 0.673∗∗∗ 0.146
(0.327) (0.318) (0.501) (0.326) (0.187) (0.349)
LM-test p-value 0.487 0.455 0.550 0.508 0.005 0.706
Continental dummies Yes Yes Yes Yes Yes Yes
Distance controls Yes Yes Yes Yes No Yes
Development controls No Yes No Yes No No
Observations 186 186 186 186 186 186
Notes. a) Dependent variable is the evil eye belief on the 1–8 scale. b) Robust standard errors in parentheses. c)∗∗∗, ∗∗, and ∗ denote statistical significance at the 1, 5, and 10 percent level, respectively. d) Panels A and B use
spatial weights matrices based on geographic (great circle) and phylogenetic distances, respectively. e) Foragers are the
omitted category for the production mode variable. f) The null hypothesis of the LM-test is ρS = 0 (no spatial lag),
see Anselin and Hudak (1992).
29
and the estimates of interest are very close to those reported earlier. Column (5) is the
only specification in table 12 which does not include distance controls. Hence, the analysis
implies that the inclusion of distance controls effectively takes care of spatial dependence,
at least as captured by the spatial lag specifications with two alternative weights matrices.
5 Concluding remarks
This paper contributes to the growing literature on the economic origins of culture by
constructing a framework for understanding a particular cultural phenomenon, the evil eye
belief. We argue that this superstition emerged and persisted as a useful rule of thumb
approximating rational envy-avoidance behavior under conditions in which destructive envy
is a real threat, that is, when wealth inequality is high and formal institutions enforcing
property rights are missing.
Evidence from the Standard Cross-Cultural Sample supports the main theoretical pre-
diction. The incidence of the evil eye belief is substantially higher in unequal, technolog-
ically specialized societies. This result is robust to measures of spatial and cross-cultural
diffusion, indicators of cultural complexity, exposure to classical religion, and continental
dummies. The connection between the evil eye belief and inequality is stronger in weakly
institutionalized societies. Furthermore, the evil eye belief is more likely to be found in
agro-pastoral societies that sustain higher levels of inequality and rely more on visible and
vulnerable material wealth compared to foragers and horticulturalists. We find no evidence
that inequality is systematically related to any other supernatural beliefs which are not
explicitly connected to the notion of destructive envy.
Overall, this paper offers a novel link between early economic development and cul-
ture through the emotion of envy. Wealth differentiation contributed to the emergence of
envy-avoidance culture which has been useful in a weakly institutionalized environment.
Curiously, since culture tends to persists even after the relevant underlying conditions
change, in parts of the modern world where it is no longer useful, the evil eye belief may
plausibly act as a brake on economic development by discouraging wealth accumulation
and social mobility.
30
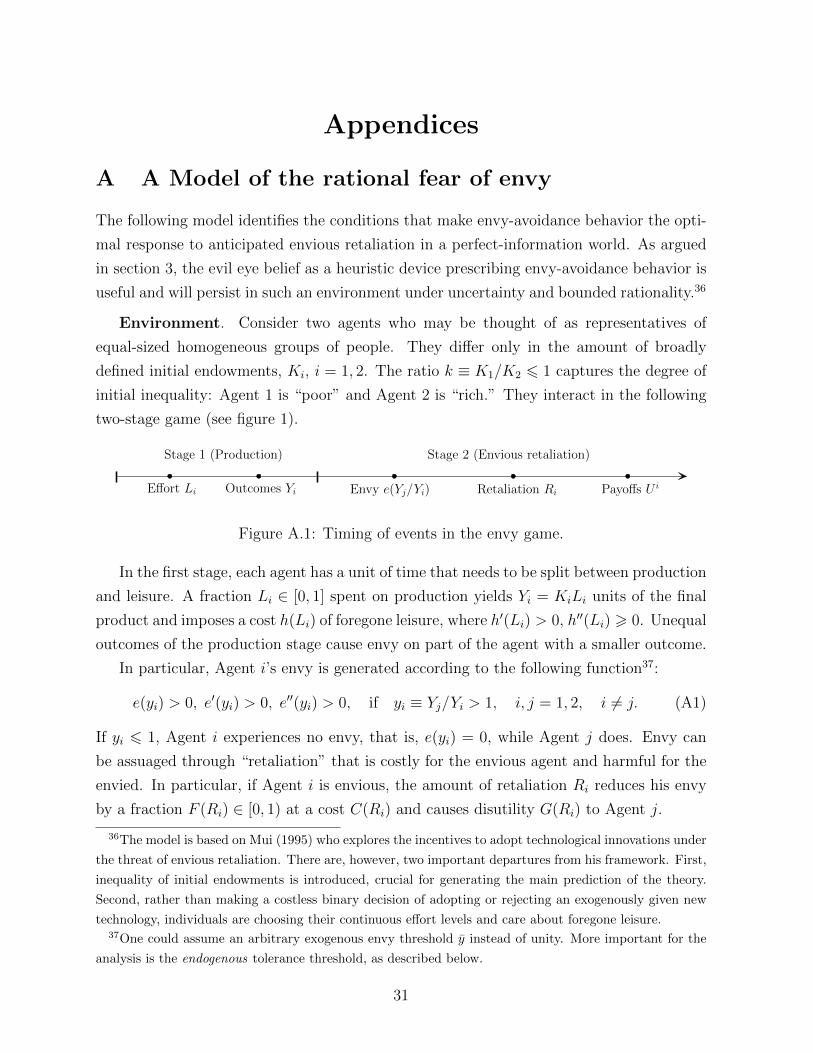
Appendices
A A Model of the rational fear of envy
The following model identifies the conditions that make envy-avoidance behavior the opti-
mal response to anticipated envious retaliation in a perfect-information world. As argued
in section 3, the evil eye belief as a heuristic device prescribing envy-avoidance behavior is
useful and will persist in such an environment under uncertainty and bounded rationality.36
Environment. Consider two agents who may be thought of as representatives of
equal-sized homogeneous groups of people. They differ only in the amount of broadly
defined initial endowments, Ki, i = 1, 2. The ratio k ≡ K1/K2 6 1 captures the degree of
initial inequality: Agent 1 is “poor” and Agent 2 is “rich.” They interact in the following
two-stage game (see figure 1).
Effort Li Outcomes Yi
Stage 1 (Production)
Envy e(Yj/Yi) Retaliation Ri Payoffs U i
Stage 2 (Envious retaliation)
Figure A.1: Timing of events in the envy game.
In the first stage, each agent has a unit of time that needs to be split between production
and leisure. A fraction Li ∈ [0, 1] spent on production yields Yi = KiLi units of the final
product and imposes a cost h(Li) of foregone leisure, where h′(Li) > 0, h′′(Li) > 0. Unequal
outcomes of the production stage cause envy on part of the agent with a smaller outcome.
In particular, Agent i’s envy is generated according to the following function37:
e(yi) > 0, e′(yi) > 0, e′′(yi) > 0, if yi ≡ Yj/Yi > 1, i, j = 1, 2, i 6= j. (A1)
If yi 6 1, Agent i experiences no envy, that is, e(yi) = 0, while Agent j does. Envy can
be assuaged through “retaliation” that is costly for the envious agent and harmful for the
envied. In particular, if Agent i is envious, the amount of retaliation Ri reduces his envy
by a fraction F (Ri) ∈ [0, 1) at a cost C(Ri) and causes disutility G(Ri) to Agent j.
36The model is based on Mui (1995) who explores the incentives to adopt technological innovations under
the threat of envious retaliation. There are, however, two important departures from his framework. First,
inequality of initial endowments is introduced, crucial for generating the main prediction of the theory.
Second, rather than making a costless binary decision of adopting or rejecting an exogenously given new
technology, individuals are choosing their continuous effort levels and care about foregone leisure.37One could assume an arbitrary exogenous envy threshold y instead of unity. More important for the
analysis is the endogenous tolerance threshold, as described below.
31
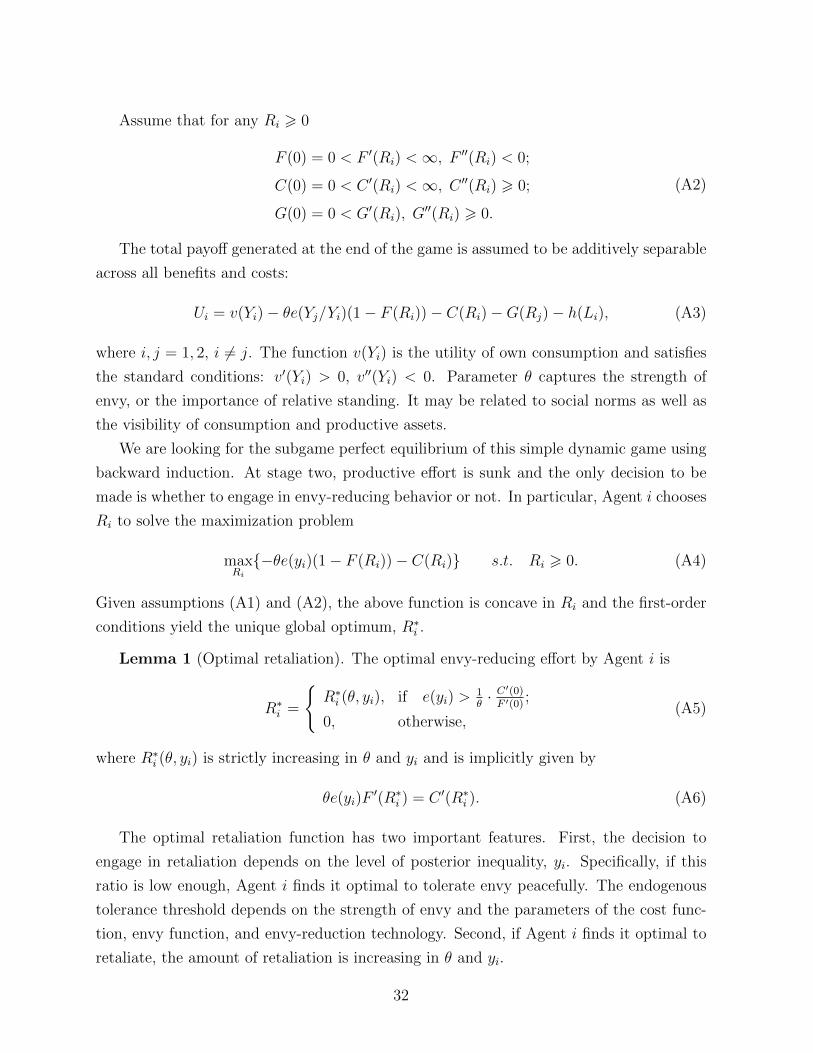
Assume that for any Ri > 0
F (0) = 0 < F ′(Ri) <∞, F ′′(Ri) < 0;
C(0) = 0 < C ′(Ri) <∞, C ′′(Ri) > 0;
G(0) = 0 < G′(Ri), G′′(Ri) > 0.
(A2)
The total payoff generated at the end of the game is assumed to be additively separable
across all benefits and costs:
Ui = v(Yi)− θe(Yj/Yi)(1− F (Ri))− C(Ri)−G(Rj)− h(Li), (A3)
where i, j = 1, 2, i 6= j. The function v(Yi) is the utility of own consumption and satisfies
the standard conditions: v′(Yi) > 0, v′′(Yi) < 0. Parameter θ captures the strength of
envy, or the importance of relative standing. It may be related to social norms as well as
the visibility of consumption and productive assets.
We are looking for the subgame perfect equilibrium of this simple dynamic game using
backward induction. At stage two, productive effort is sunk and the only decision to be
made is whether to engage in envy-reducing behavior or not. In particular, Agent i chooses
Ri to solve the maximization problem
maxRi
{−θe(yi)(1− F (Ri))− C(Ri)} s.t. Ri > 0. (A4)
Given assumptions (A1) and (A2), the above function is concave in Ri and the first-order
conditions yield the unique global optimum, R∗i .
Lemma 1 (Optimal retaliation). The optimal envy-reducing effort by Agent i is
R∗i =
{R∗i (θ, yi), if e(yi) >
1θ· C′(0)
F ′(0);
0, otherwise,(A5)
where R∗i (θ, yi) is strictly increasing in θ and yi and is implicitly given by
θe(yi)F′(R∗i ) = C ′(R∗i ). (A6)
The optimal retaliation function has two important features. First, the decision to
engage in retaliation depends on the level of posterior inequality, yi. Specifically, if this
ratio is low enough, Agent i finds it optimal to tolerate envy peacefully. The endogenous
tolerance threshold depends on the strength of envy and the parameters of the cost func-
tion, envy function, and envy-reduction technology. Second, if Agent i finds it optimal to
retaliate, the amount of retaliation is increasing in θ and yi.
32
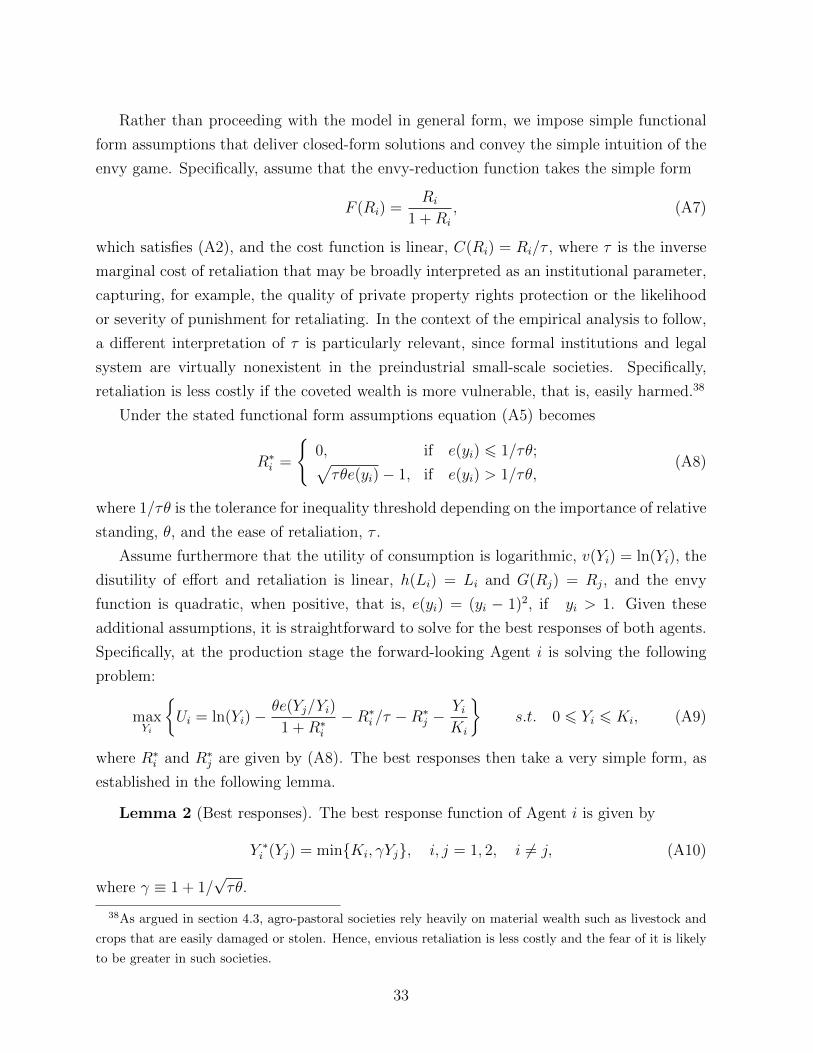
Rather than proceeding with the model in general form, we impose simple functional
form assumptions that deliver closed-form solutions and convey the simple intuition of the
envy game. Specifically, assume that the envy-reduction function takes the simple form
F (Ri) =Ri
1 +Ri
, (A7)
which satisfies (A2), and the cost function is linear, C(Ri) = Ri/τ , where τ is the inverse
marginal cost of retaliation that may be broadly interpreted as an institutional parameter,
capturing, for example, the quality of private property rights protection or the likelihood
or severity of punishment for retaliating. In the context of the empirical analysis to follow,
a different interpretation of τ is particularly relevant, since formal institutions and legal
system are virtually nonexistent in the preindustrial small-scale societies. Specifically,
retaliation is less costly if the coveted wealth is more vulnerable, that is, easily harmed.38
Under the stated functional form assumptions equation (A5) becomes
R∗i =
{0, if e(yi) 6 1/τθ;√τθe(yi)− 1, if e(yi) > 1/τθ,
(A8)
where 1/τθ is the tolerance for inequality threshold depending on the importance of relative
standing, θ, and the ease of retaliation, τ .
Assume furthermore that the utility of consumption is logarithmic, v(Yi) = ln(Yi), the
disutility of effort and retaliation is linear, h(Li) = Li and G(Rj) = Rj, and the envy
function is quadratic, when positive, that is, e(yi) = (yi − 1)2, if yi > 1. Given these
additional assumptions, it is straightforward to solve for the best responses of both agents.
Specifically, at the production stage the forward-looking Agent i is solving the following
problem:
maxYi
{Ui = ln(Yi)−
θe(Yj/Yi)
1 +R∗i−R∗i /τ −R∗j −
YiKi
}s.t. 0 6 Yi 6 Ki, (A9)
where R∗i and R∗j are given by (A8). The best responses then take a very simple form, as
established in the following lemma.
Lemma 2 (Best responses). The best response function of Agent i is given by
Y ∗i (Yj) = min{Ki, γYj}, i, j = 1, 2, i 6= j, (A10)
where γ ≡ 1 + 1/√τθ.
38As argued in section 4.3, agro-pastoral societies rely heavily on material wealth such as livestock and
crops that are easily damaged or stolen. Hence, envious retaliation is less costly and the fear of it is likely
to be greater in such societies.
33
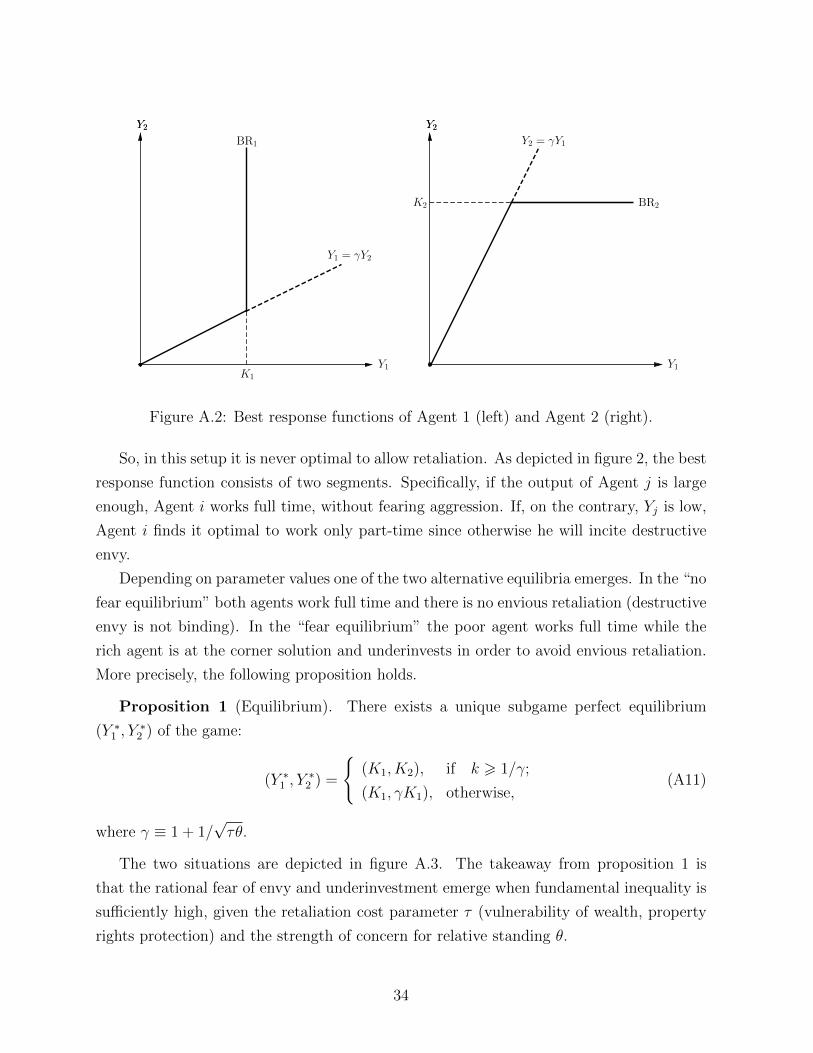
BR1
Y2
Y1 = γY2
K1
Y2
Y1
BR2K2
Y2 = γY1
Y2Y2
Y1
Figure A.2: Best response functions of Agent 1 (left) and Agent 2 (right).
So, in this setup it is never optimal to allow retaliation. As depicted in figure 2, the best
response function consists of two segments. Specifically, if the output of Agent j is large
enough, Agent i works full time, without fearing aggression. If, on the contrary, Yj is low,
Agent i finds it optimal to work only part-time since otherwise he will incite destructive
envy.
Depending on parameter values one of the two alternative equilibria emerges. In the “no
fear equilibrium” both agents work full time and there is no envious retaliation (destructive
envy is not binding). In the “fear equilibrium” the poor agent works full time while the
rich agent is at the corner solution and underinvests in order to avoid envious retaliation.
More precisely, the following proposition holds.
Proposition 1 (Equilibrium). There exists a unique subgame perfect equilibrium
(Y ∗1 , Y∗
2 ) of the game:
(Y ∗1 , Y∗
2 ) =
{(K1, K2), if k > 1/γ;
(K1, γK1), otherwise,(A11)
where γ ≡ 1 + 1/√τθ.
The two situations are depicted in figure A.3. The takeaway from proposition 1 is
that the rational fear of envy and underinvestment emerge when fundamental inequality is
sufficiently high, given the retaliation cost parameter τ (vulnerability of wealth, property
rights protection) and the strength of concern for relative standing θ.
34
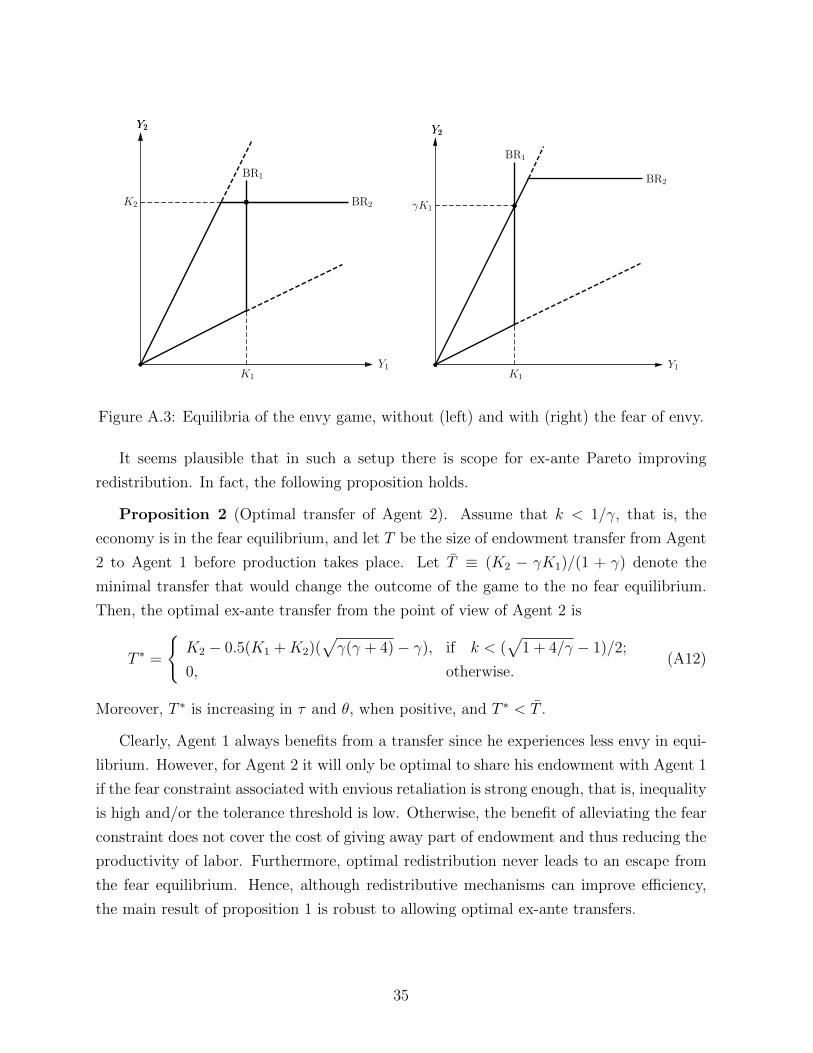
BR1
Y2
K1
K2 BR2
Y2
Y1
BR1
Y2
K1
γK1
BR2
Y2
Y1
Figure A.3: Equilibria of the envy game, without (left) and with (right) the fear of envy.
It seems plausible that in such a setup there is scope for ex-ante Pareto improving
redistribution. In fact, the following proposition holds.
Proposition 2 (Optimal transfer of Agent 2). Assume that k < 1/γ, that is, the
economy is in the fear equilibrium, and let T be the size of endowment transfer from Agent
2 to Agent 1 before production takes place. Let T ≡ (K2 − γK1)/(1 + γ) denote the
minimal transfer that would change the outcome of the game to the no fear equilibrium.
Then, the optimal ex-ante transfer from the point of view of Agent 2 is
T ∗ =
{K2 − 0.5(K1 +K2)(
√γ(γ + 4)− γ), if k < (
√1 + 4/γ − 1)/2;
0, otherwise.(A12)
Moreover, T ∗ is increasing in τ and θ, when positive, and T ∗ < T .
Clearly, Agent 1 always benefits from a transfer since he experiences less envy in equi-
librium. However, for Agent 2 it will only be optimal to share his endowment with Agent 1
if the fear constraint associated with envious retaliation is strong enough, that is, inequality
is high and/or the tolerance threshold is low. Otherwise, the benefit of alleviating the fear
constraint does not cover the cost of giving away part of endowment and thus reducing the
productivity of labor. Furthermore, optimal redistribution never leads to an escape from
the fear equilibrium. Hence, although redistributive mechanisms can improve efficiency,
the main result of proposition 1 is robust to allowing optimal ex-ante transfers.
35
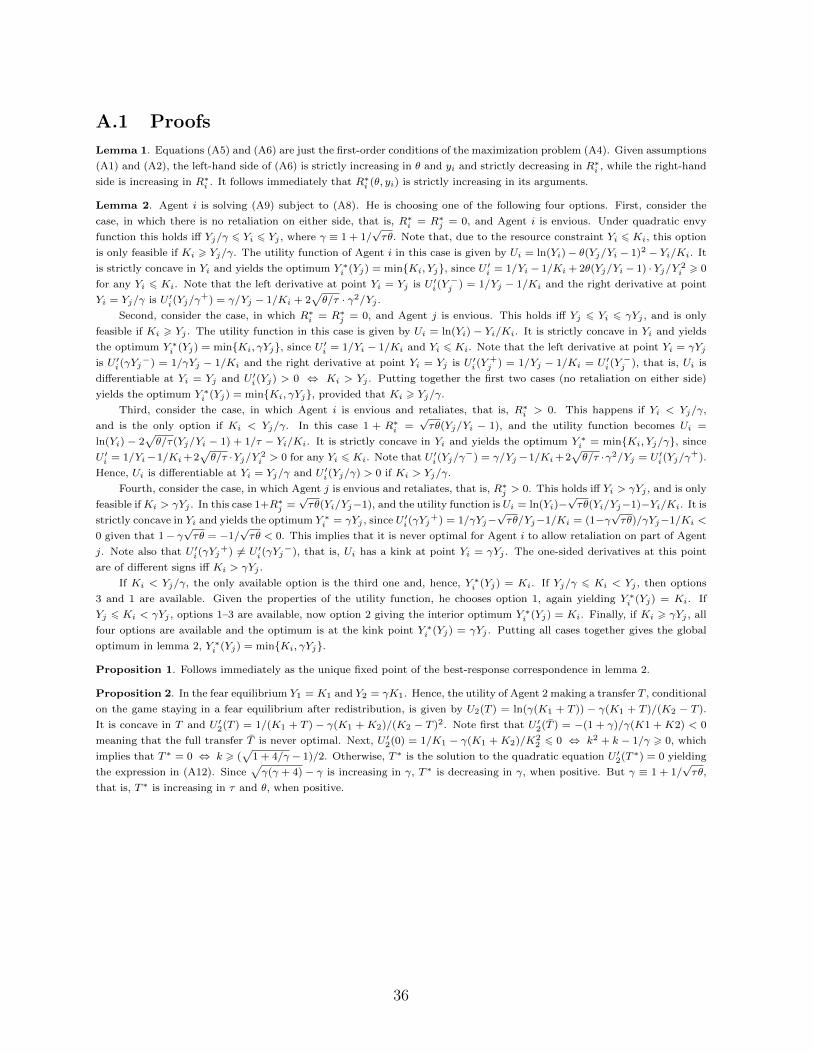
A.1 Proofs
Lemma 1. Equations (A5) and (A6) are just the first-order conditions of the maximization problem (A4). Given assumptions
(A1) and (A2), the left-hand side of (A6) is strictly increasing in θ and yi and strictly decreasing in R∗i , while the right-hand
side is increasing in R∗i . It follows immediately that R∗i (θ, yi) is strictly increasing in its arguments.
Lemma 2. Agent i is solving (A9) subject to (A8). He is choosing one of the following four options. First, consider the
case, in which there is no retaliation on either side, that is, R∗i = R∗j = 0, and Agent i is envious. Under quadratic envy
function this holds iff Yj/γ 6 Yi 6 Yj , where γ ≡ 1 + 1/√τθ. Note that, due to the resource constraint Yi 6 Ki, this option
is only feasible if Ki > Yj/γ. The utility function of Agent i in this case is given by Ui = ln(Yi)− θ(Yj/Yi − 1)2 − Yi/Ki. It
is strictly concave in Yi and yields the optimum Y ∗i (Yj) = min{Ki, Yj}, since U ′i = 1/Yi − 1/Ki + 2θ(Yj/Yi − 1) · Yj/Y 2i > 0
for any Yi 6 Ki. Note that the left derivative at point Yi = Yj is U ′i(Y−j ) = 1/Yj − 1/Ki and the right derivative at point
Yi = Yj/γ is U ′i(Yj/γ+) = γ/Yj − 1/Ki + 2
√θ/τ · γ2/Yj .
Second, consider the case, in which R∗i = R∗j = 0, and Agent j is envious. This holds iff Yj 6 Yi 6 γYj , and is only
feasible if Ki > Yj . The utility function in this case is given by Ui = ln(Yi) − Yi/Ki. It is strictly concave in Yi and yields
the optimum Y ∗i (Yj) = min{Ki, γYj}, since U ′i = 1/Yi − 1/Ki and Yi 6 Ki. Note that the left derivative at point Yi = γYj
is U ′i(γYj−) = 1/γYj − 1/Ki and the right derivative at point Yi = Yj is U ′i(Y
+j ) = 1/Yj − 1/Ki = U ′i(Y
−j ), that is, Ui is
differentiable at Yi = Yj and U ′i(Yj) > 0 ⇔ Ki > Yj . Putting together the first two cases (no retaliation on either side)
yields the optimum Y ∗i (Yj) = min{Ki, γYj}, provided that Ki > Yj/γ.
Third, consider the case, in which Agent i is envious and retaliates, that is, R∗i > 0. This happens if Yi < Yj/γ,
and is the only option if Ki < Yj/γ. In this case 1 + R∗i =√τθ(Yj/Yi − 1), and the utility function becomes Ui =
ln(Yi) − 2√θ/τ(Yj/Yi − 1) + 1/τ − Yi/Ki. It is strictly concave in Yi and yields the optimum Y ∗i = min{Ki, Yj/γ}, since
U ′i = 1/Yi−1/Ki +2√θ/τ ·Yj/Y 2
i > 0 for any Yi 6 Ki. Note that U ′i(Yj/γ−) = γ/Yj−1/Ki +2
√θ/τ ·γ2/Yj = U ′i(Yj/γ
+).
Hence, Ui is differentiable at Yi = Yj/γ and U ′i(Yj/γ) > 0 if Ki > Yj/γ.
Fourth, consider the case, in which Agent j is envious and retaliates, that is, R∗j > 0. This holds iff Yi > γYj , and is only
feasible ifKi > γYj . In this case 1+R∗j =√τθ(Yi/Yj−1), and the utility function is Ui = ln(Yi)−
√τθ(Yi/Yj−1)−Yi/Ki. It is
strictly concave in Yi and yields the optimum Y ∗i = γYj , since U ′i(γYj+) = 1/γYj−
√τθ/Yj−1/Ki = (1−γ
√τθ)/γYj−1/Ki <
0 given that 1− γ√τθ = −1/
√τθ < 0. This implies that it is never optimal for Agent i to allow retaliation on part of Agent
j. Note also that U ′i(γYj+) 6= U ′i(γYj
−), that is, Ui has a kink at point Yi = γYj . The one-sided derivatives at this point
are of different signs iff Ki > γYj .
If Ki < Yj/γ, the only available option is the third one and, hence, Y ∗i (Yj) = Ki. If Yj/γ 6 Ki < Yj , then options
3 and 1 are available. Given the properties of the utility function, he chooses option 1, again yielding Y ∗i (Yj) = Ki. If
Yj 6 Ki < γYj , options 1–3 are available, now option 2 giving the interior optimum Y ∗i (Yj) = Ki. Finally, if Ki > γYj , all
four options are available and the optimum is at the kink point Y ∗i (Yj) = γYj . Putting all cases together gives the global
optimum in lemma 2, Y ∗i (Yj) = min{Ki, γYj}.
Proposition 1. Follows immediately as the unique fixed point of the best-response correspondence in lemma 2.
Proposition 2. In the fear equilibrium Y1 = K1 and Y2 = γK1. Hence, the utility of Agent 2 making a transfer T , conditional
on the game staying in a fear equilibrium after redistribution, is given by U2(T ) = ln(γ(K1 + T )) − γ(K1 + T )/(K2 − T ).
It is concave in T and U ′2(T ) = 1/(K1 + T ) − γ(K1 + K2)/(K2 − T )2. Note first that U ′2(T ) = −(1 + γ)/γ(K1 + K2) < 0
meaning that the full transfer T is never optimal. Next, U ′2(0) = 1/K1 − γ(K1 +K2)/K22 6 0 ⇔ k2 + k − 1/γ > 0, which
implies that T ∗ = 0 ⇔ k > (√
1 + 4/γ − 1)/2. Otherwise, T ∗ is the solution to the quadratic equation U ′2(T ∗) = 0 yielding
the expression in (A12). Since√γ(γ + 4) − γ is increasing in γ, T ∗ is decreasing in γ, when positive. But γ ≡ 1 + 1/
√τθ,
that is, T ∗ is increasing in τ and θ, when positive.
36
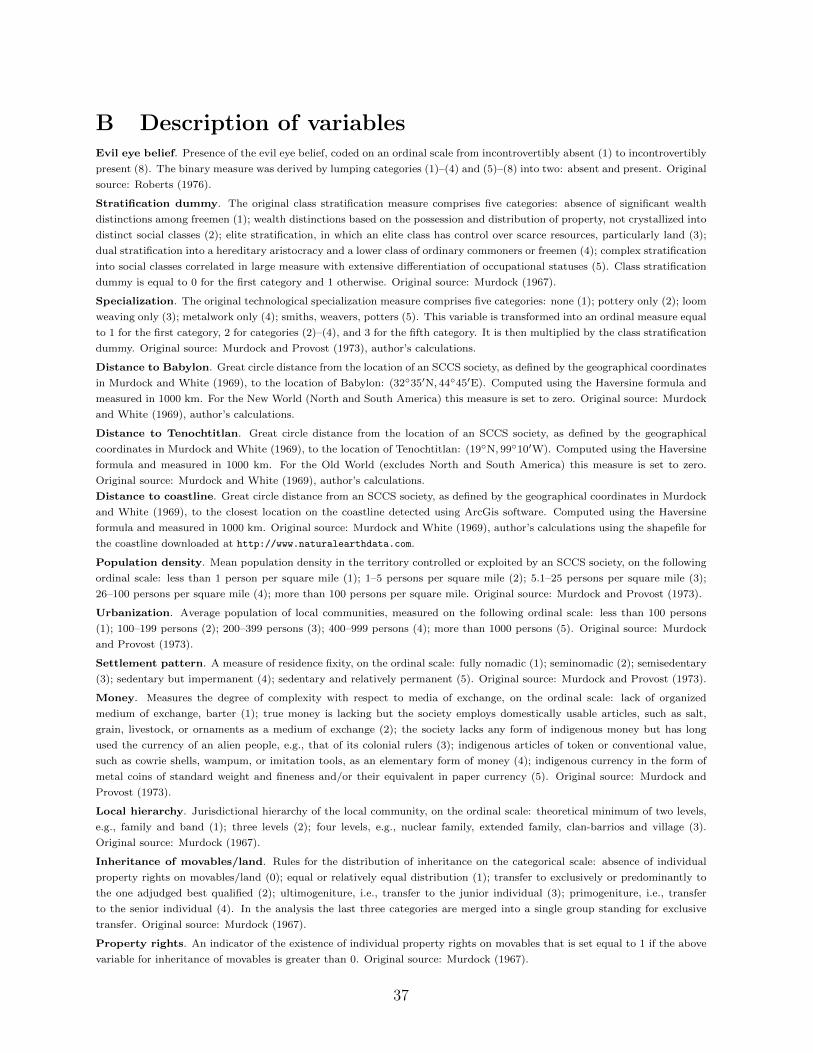
B Description of variablesEvil eye belief. Presence of the evil eye belief, coded on an ordinal scale from incontrovertibly absent (1) to incontrovertibly
present (8). The binary measure was derived by lumping categories (1)–(4) and (5)–(8) into two: absent and present. Original
source: Roberts (1976).
Stratification dummy. The original class stratification measure comprises five categories: absence of significant wealth
distinctions among freemen (1); wealth distinctions based on the possession and distribution of property, not crystallized into
distinct social classes (2); elite stratification, in which an elite class has control over scarce resources, particularly land (3);
dual stratification into a hereditary aristocracy and a lower class of ordinary commoners or freemen (4); complex stratification
into social classes correlated in large measure with extensive differentiation of occupational statuses (5). Class stratification
dummy is equal to 0 for the first category and 1 otherwise. Original source: Murdock (1967).
Specialization. The original technological specialization measure comprises five categories: none (1); pottery only (2); loom
weaving only (3); metalwork only (4); smiths, weavers, potters (5). This variable is transformed into an ordinal measure equal
to 1 for the first category, 2 for categories (2)–(4), and 3 for the fifth category. It is then multiplied by the class stratification
dummy. Original source: Murdock and Provost (1973), author’s calculations.
Distance to Babylon. Great circle distance from the location of an SCCS society, as defined by the geographical coordinates
in Murdock and White (1969), to the location of Babylon: (32◦35′N, 44◦45′E). Computed using the Haversine formula and
measured in 1000 km. For the New World (North and South America) this measure is set to zero. Original source: Murdock
and White (1969), author’s calculations.
Distance to Tenochtitlan. Great circle distance from the location of an SCCS society, as defined by the geographical
coordinates in Murdock and White (1969), to the location of Tenochtitlan: (19◦N, 99◦10′W). Computed using the Haversine
formula and measured in 1000 km. For the Old World (excludes North and South America) this measure is set to zero.
Original source: Murdock and White (1969), author’s calculations.
Distance to coastline. Great circle distance from an SCCS society, as defined by the geographical coordinates in Murdock
and White (1969), to the closest location on the coastline detected using ArcGis software. Computed using the Haversine
formula and measured in 1000 km. Original source: Murdock and White (1969), author’s calculations using the shapefile for
the coastline downloaded at http://www.naturalearthdata.com.
Population density. Mean population density in the territory controlled or exploited by an SCCS society, on the following
ordinal scale: less than 1 person per square mile (1); 1–5 persons per square mile (2); 5.1–25 persons per square mile (3);
26–100 persons per square mile (4); more than 100 persons per square mile. Original source: Murdock and Provost (1973).
Urbanization. Average population of local communities, measured on the following ordinal scale: less than 100 persons
(1); 100–199 persons (2); 200–399 persons (3); 400–999 persons (4); more than 1000 persons (5). Original source: Murdock
and Provost (1973).
Settlement pattern. A measure of residence fixity, on the ordinal scale: fully nomadic (1); seminomadic (2); semisedentary
(3); sedentary but impermanent (4); sedentary and relatively permanent (5). Original source: Murdock and Provost (1973).
Money. Measures the degree of complexity with respect to media of exchange, on the ordinal scale: lack of organized
medium of exchange, barter (1); true money is lacking but the society employs domestically usable articles, such as salt,
grain, livestock, or ornaments as a medium of exchange (2); the society lacks any form of indigenous money but has long
used the currency of an alien people, e.g., that of its colonial rulers (3); indigenous articles of token or conventional value,
such as cowrie shells, wampum, or imitation tools, as an elementary form of money (4); indigenous currency in the form of
metal coins of standard weight and fineness and/or their equivalent in paper currency (5). Original source: Murdock and
Provost (1973).
Local hierarchy. Jurisdictional hierarchy of the local community, on the ordinal scale: theoretical minimum of two levels,
e.g., family and band (1); three levels (2); four levels, e.g., nuclear family, extended family, clan-barrios and village (3).
Original source: Murdock (1967).
Inheritance of movables/land. Rules for the distribution of inheritance on the categorical scale: absence of individual
property rights on movables/land (0); equal or relatively equal distribution (1); transfer to exclusively or predominantly to
the one adjudged best qualified (2); ultimogeniture, i.e., transfer to the junior individual (3); primogeniture, i.e., transfer
to the senior individual (4). In the analysis the last three categories are merged into a single group standing for exclusive
transfer. Original source: Murdock (1967).
Property rights. An indicator of the existence of individual property rights on movables that is set equal to 1 if the above
variable for inheritance of movables is greater than 0. Original source: Murdock (1967).
37
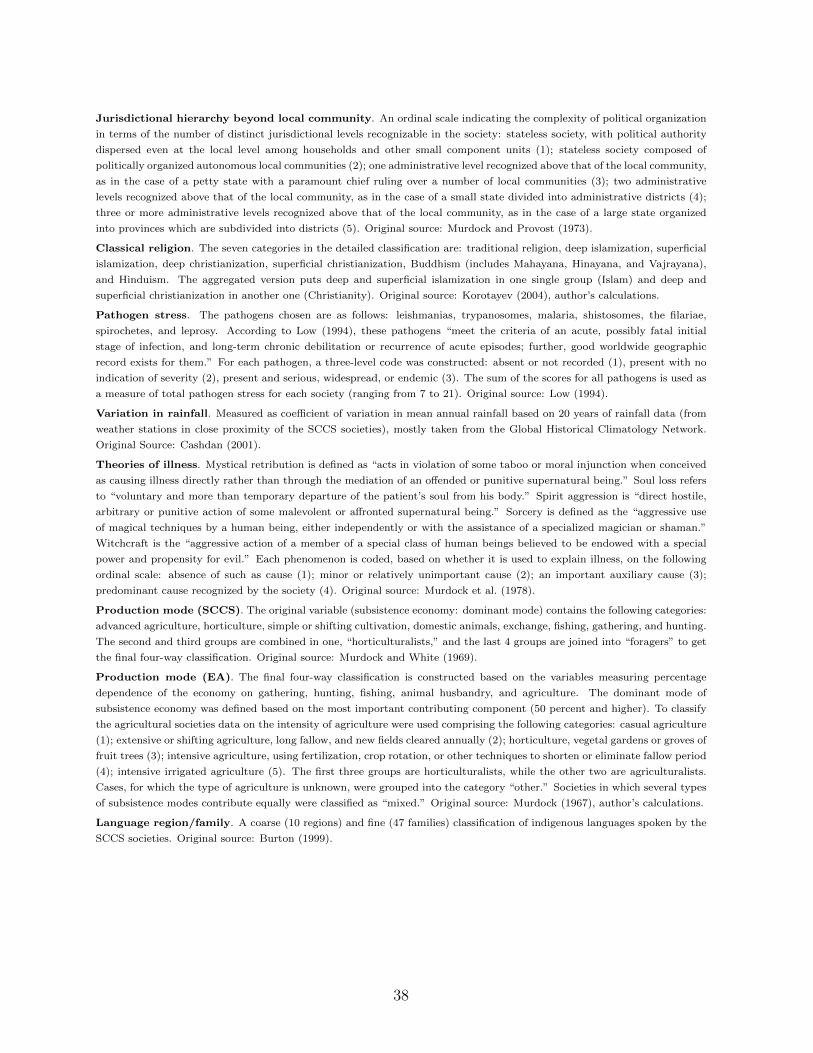
Jurisdictional hierarchy beyond local community. An ordinal scale indicating the complexity of political organization
in terms of the number of distinct jurisdictional levels recognizable in the society: stateless society, with political authority
dispersed even at the local level among households and other small component units (1); stateless society composed of
politically organized autonomous local communities (2); one administrative level recognized above that of the local community,
as in the case of a petty state with a paramount chief ruling over a number of local communities (3); two administrative
levels recognized above that of the local community, as in the case of a small state divided into administrative districts (4);
three or more administrative levels recognized above that of the local community, as in the case of a large state organized
into provinces which are subdivided into districts (5). Original source: Murdock and Provost (1973).
Classical religion. The seven categories in the detailed classification are: traditional religion, deep islamization, superficial
islamization, deep christianization, superficial christianization, Buddhism (includes Mahayana, Hinayana, and Vajrayana),
and Hinduism. The aggregated version puts deep and superficial islamization in one single group (Islam) and deep and
superficial christianization in another one (Christianity). Original source: Korotayev (2004), author’s calculations.
Pathogen stress. The pathogens chosen are as follows: leishmanias, trypanosomes, malaria, shistosomes, the filariae,
spirochetes, and leprosy. According to Low (1994), these pathogens “meet the criteria of an acute, possibly fatal initial
stage of infection, and long-term chronic debilitation or recurrence of acute episodes; further, good worldwide geographic
record exists for them.” For each pathogen, a three-level code was constructed: absent or not recorded (1), present with no
indication of severity (2), present and serious, widespread, or endemic (3). The sum of the scores for all pathogens is used as
a measure of total pathogen stress for each society (ranging from 7 to 21). Original source: Low (1994).
Variation in rainfall. Measured as coefficient of variation in mean annual rainfall based on 20 years of rainfall data (from
weather stations in close proximity of the SCCS societies), mostly taken from the Global Historical Climatology Network.
Original Source: Cashdan (2001).
Theories of illness. Mystical retribution is defined as “acts in violation of some taboo or moral injunction when conceived
as causing illness directly rather than through the mediation of an offended or punitive supernatural being.” Soul loss refers
to “voluntary and more than temporary departure of the patient’s soul from his body.” Spirit aggression is “direct hostile,
arbitrary or punitive action of some malevolent or affronted supernatural being.” Sorcery is defined as the “aggressive use
of magical techniques by a human being, either independently or with the assistance of a specialized magician or shaman.”
Witchcraft is the “aggressive action of a member of a special class of human beings believed to be endowed with a special
power and propensity for evil.” Each phenomenon is coded, based on whether it is used to explain illness, on the following
ordinal scale: absence of such as cause (1); minor or relatively unimportant cause (2); an important auxiliary cause (3);
predominant cause recognized by the society (4). Original source: Murdock et al. (1978).
Production mode (SCCS). The original variable (subsistence economy: dominant mode) contains the following categories:
advanced agriculture, horticulture, simple or shifting cultivation, domestic animals, exchange, fishing, gathering, and hunting.
The second and third groups are combined in one, “horticulturalists,” and the last 4 groups are joined into “foragers” to get
the final four-way classification. Original source: Murdock and White (1969).
Production mode (EA). The final four-way classification is constructed based on the variables measuring percentage
dependence of the economy on gathering, hunting, fishing, animal husbandry, and agriculture. The dominant mode of
subsistence economy was defined based on the most important contributing component (50 percent and higher). To classify
the agricultural societies data on the intensity of agriculture were used comprising the following categories: casual agriculture
(1); extensive or shifting agriculture, long fallow, and new fields cleared annually (2); horticulture, vegetal gardens or groves of
fruit trees (3); intensive agriculture, using fertilization, crop rotation, or other techniques to shorten or eliminate fallow period
(4); intensive irrigated agriculture (5). The first three groups are horticulturalists, while the other two are agriculturalists.
Cases, for which the type of agriculture is unknown, were grouped into the category “other.” Societies in which several types
of subsistence modes contribute equally were classified as “mixed.” Original source: Murdock (1967), author’s calculations.
Language region/family. A coarse (10 regions) and fine (47 families) classification of indigenous languages spoken by the
SCCS societies. Original source: Burton (1999).
38
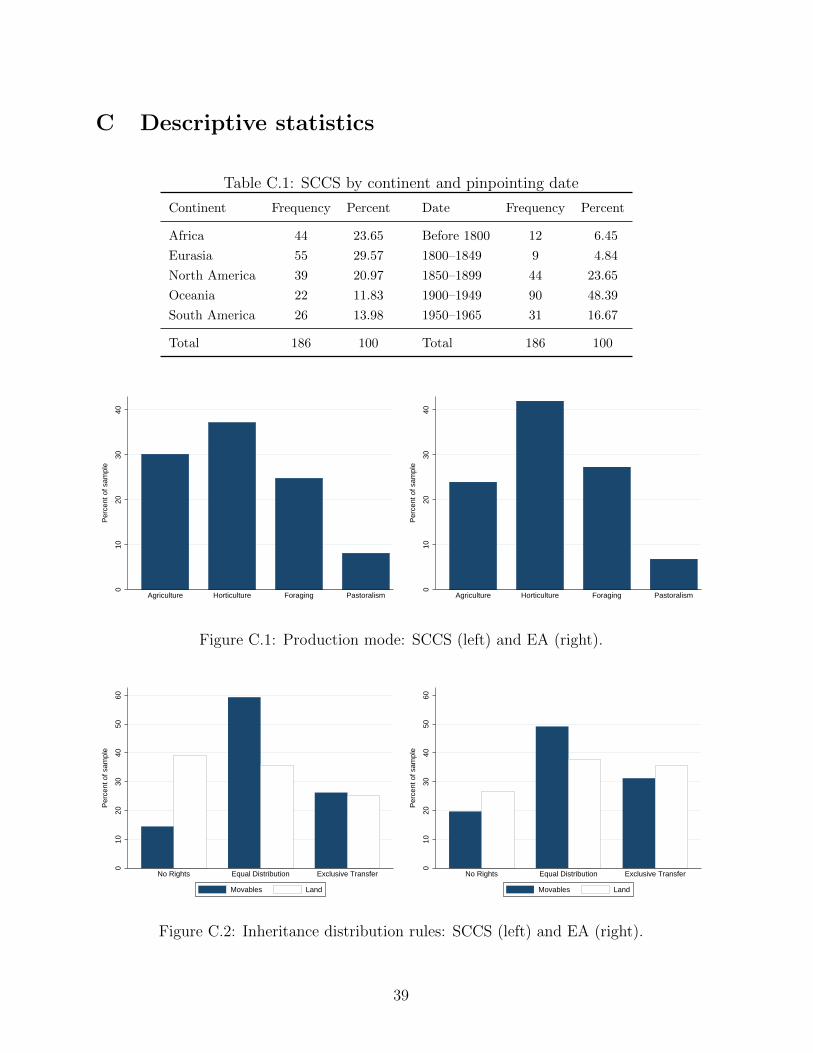
C Descriptive statistics
Table C.1: SCCS by continent and pinpointing date
Continent Frequency Percent Date Frequency Percent
Africa 44 23.65 Before 1800 12 6.45
Eurasia 55 29.57 1800–1849 9 4.84
North America 39 20.97 1850–1899 44 23.65
Oceania 22 11.83 1900–1949 90 48.39
South America 26 13.98 1950–1965 31 16.67
Total 186 100 Total 186 100
010
2030
40
Per
cent
of s
ampl
e
Agriculture Horticulture Foraging Pastoralism
010
2030
40
Per
cent
of s
ampl
e
Agriculture Horticulture Foraging Pastoralism
Figure C.1: Production mode: SCCS (left) and EA (right).
010
2030
4050
60
Per
cent
of s
ampl
e
No Rights Equal Distribution Exclusive Transfer
Movables Land
010
2030
4050
60
Per
cent
of s
ampl
e
No Rights Equal Distribution Exclusive Transfer
Movables Land
Figure C.2: Inheritance distribution rules: SCCS (left) and EA (right).
39
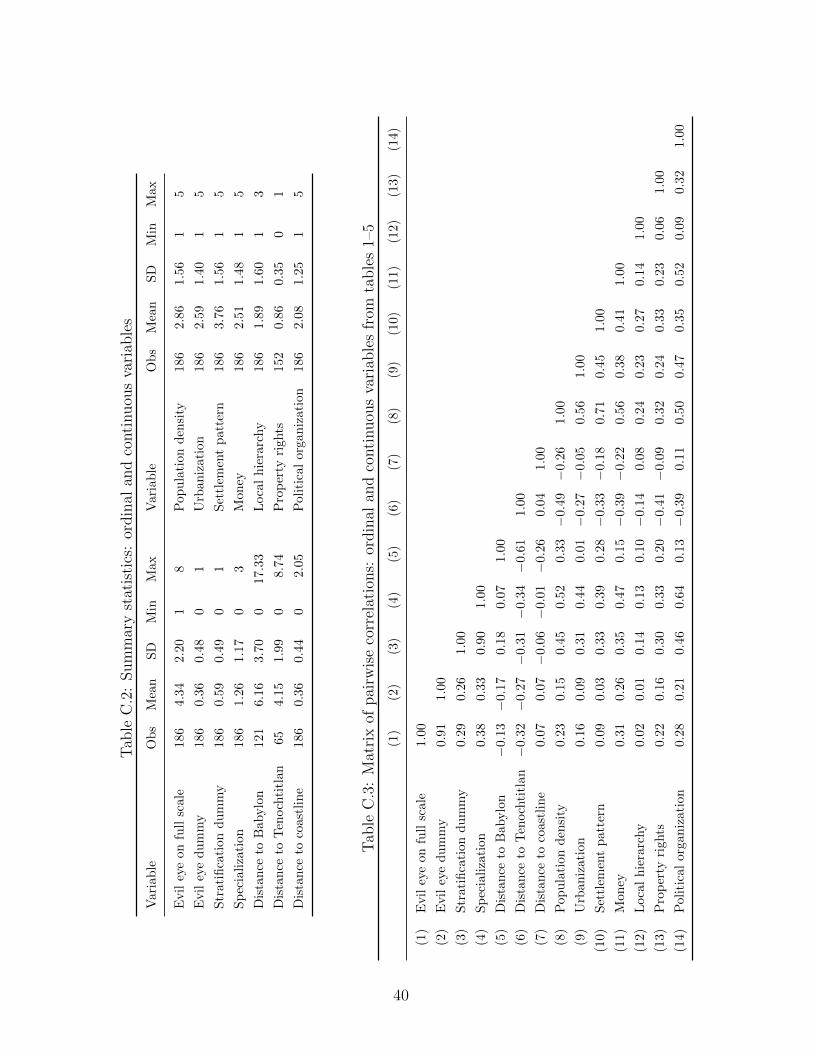
Tab
leC
.2:
Sum
mar
yst
atis
tics
:or
din
alan
dco
nti
nuou
sva
riab
les
Var
iab
leO
bs
Mea
nS
DM
inM
ax
Vari
ab
leO
bs
Mea
nS
DM
inM
ax
Evil
eye
onfu
llsc
ale
186
4.34
2.2
01
8P
op
ula
tion
den
sity
186
2.8
61.5
61
5
Evil
eye
du
mm
y18
60.
360.4
80
1U
rban
izati
on
186
2.5
91.4
01
5
Str
atifi
cati
ond
um
my
186
0.59
0.4
90
1S
ettl
emen
tp
att
ern
186
3.7
61.5
61
5
Sp
ecia
liza
tion
186
1.26
1.1
70
3M
on
ey186
2.5
11.4
81
5
Dis
tan
ceto
Bab
ylo
n12
16.
163.7
00
17.3
3L
oca
lh
iera
rchy
186
1.8
91.6
01
3
Dis
tan
ceto
Ten
och
titl
an65
4.15
1.9
90
8.7
4P
rop
erty
rights
152
0.8
60.3
50
1
Dis
tan
ceto
coas
tlin
e18
60.
360.4
40
2.0
5P
oli
tica
lorg
aniz
ati
on
186
2.0
81.2
51
5
Tab
leC
.3:
Mat
rix
ofpai
rwis
eco
rrel
atio
ns:
ordin
alan
dco
nti
nuou
sva
riab
les
from
table
s1–
5
(1)
(2)
(3)
(4)
(5)
(6)
(7)
(8)
(9)
(10)
(11)
(12)
(13)
(14)
(1)
Evil
eye
onfu
llsc
ale
1.0
0
(2)
Evil
eye
du
mm
y0.
911.0
0
(3)
Str
atifi
cati
ond
um
my
0.2
90.2
61.0
0
(4)
Sp
ecia
liza
tion
0.38
0.3
30.9
01.0
0
(5)
Dis
tan
ceto
Bab
ylo
n−
0.13−
0.1
70.1
80.0
71.0
0
(6)
Dis
tan
ceto
Ten
och
titl
an−
0.32−
0.2
7−
0.3
1−
0.3
4−
0.6
11.
00
(7)
Dis
tan
ceto
coas
tlin
e0.0
70.0
7−
0.0
6−
0.0
1−
0.2
60.
04
1.00
(8)
Pop
ula
tion
den
sity
0.23
0.1
50.4
50.5
20.3
3−
0.49−
0.26
1.00
(9)
Urb
aniz
atio
n0.
160.0
90.3
10.4
40.0
1−
0.27−
0.05
0.56
1.00
(10)
Set
tlem
ent
pat
tern
0.09
0.0
30.3
30.3
90.2
8−
0.33−
0.18
0.71
0.45
1.00
(11)
Mon
ey0.
310.2
60.3
50.4
70.1
5−
0.39−
0.22
0.56
0.38
0.41
1.00
(12)
Loca
lh
iera
rchy
0.02
0.0
10.1
40.1
30.1
0−
0.14
0.08
0.24
0.23
0.27
0.14
1.0
0
(13)
Pro
per
tyri
ghts
0.22
0.1
60.3
00.3
30.2
0−
0.41−
0.09
0.32
0.24
0.33
0.23
0.0
61.0
0
(14)
Pol
itic
alor
gan
izat
ion
0.2
80.2
10.4
60.6
40.1
3−
0.39
0.11
0.50
0.47
0.35
0.52
0.0
90.3
21.0
0
40
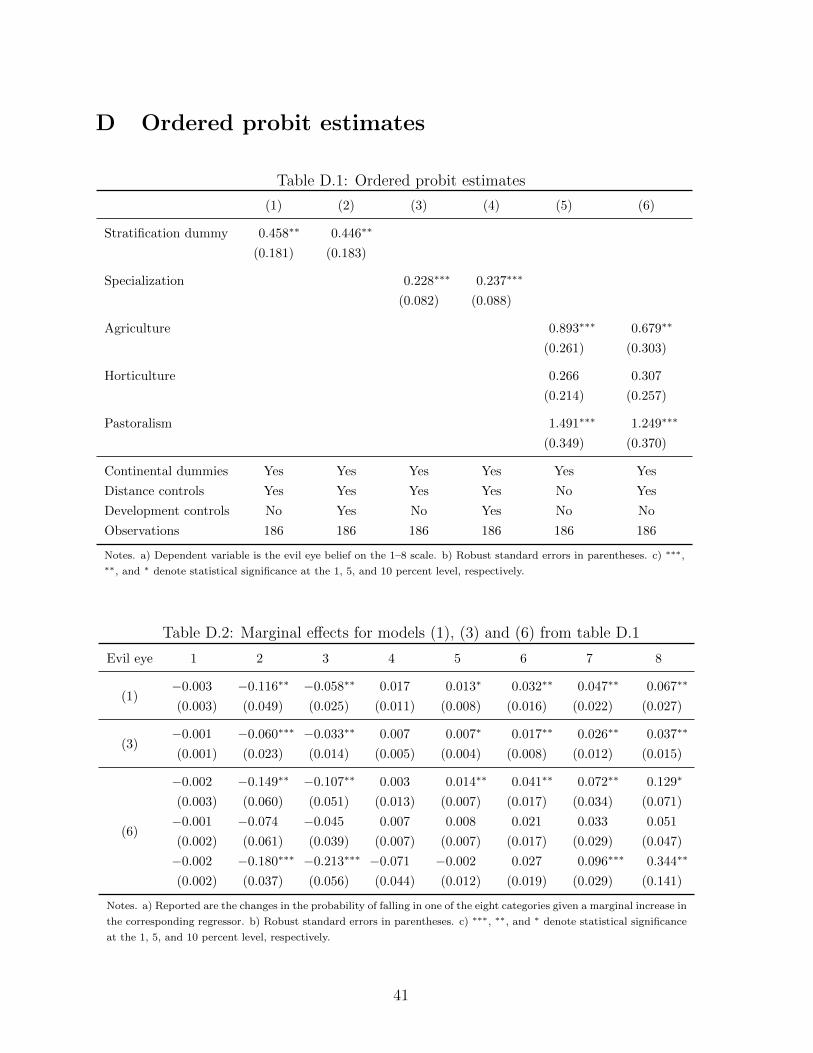
D Ordered probit estimates
Table D.1: Ordered probit estimates
(1) (2) (3) (4) (5) (6)
Stratification dummy 0.458∗∗ 0.446∗∗
(0.181) (0.183)
Specialization 0.228∗∗∗ 0.237∗∗∗
(0.082) (0.088)
Agriculture 0.893∗∗∗ 0.679∗∗
(0.261) (0.303)
Horticulture 0.266 0.307
(0.214) (0.257)
Pastoralism 1.491∗∗∗ 1.249∗∗∗
(0.349) (0.370)
Continental dummies Yes Yes Yes Yes Yes Yes
Distance controls Yes Yes Yes Yes No Yes
Development controls No Yes No Yes No No
Observations 186 186 186 186 186 186
Notes. a) Dependent variable is the evil eye belief on the 1–8 scale. b) Robust standard errors in parentheses. c) ∗∗∗,∗∗, and ∗ denote statistical significance at the 1, 5, and 10 percent level, respectively.
Table D.2: Marginal effects for models (1), (3) and (6) from table D.1
Evil eye 1 2 3 4 5 6 7 8
(1)−0.003 −0.116∗∗ −0.058∗∗ 0.017 0.013∗ 0.032∗∗ 0.047∗∗ 0.067∗∗
(0.003) (0.049) (0.025) (0.011) (0.008) (0.016) (0.022) (0.027)
(3)−0.001 −0.060∗∗∗ −0.033∗∗ 0.007 0.007∗ 0.017∗∗ 0.026∗∗ 0.037∗∗
(0.001) (0.023) (0.014) (0.005) (0.004) (0.008) (0.012) (0.015)
(6)
−0.002 −0.149∗∗ −0.107∗∗ 0.003 0.014∗∗ 0.041∗∗ 0.072∗∗ 0.129∗
(0.003) (0.060) (0.051) (0.013) (0.007) (0.017) (0.034) (0.071)
−0.001 −0.074 −0.045 0.007 0.008 0.021 0.033 0.051
(0.002) (0.061) (0.039) (0.007) (0.007) (0.017) (0.029) (0.047)
−0.002 −0.180∗∗∗ −0.213∗∗∗ −0.071 −0.002 0.027 0.096∗∗∗ 0.344∗∗
(0.002) (0.037) (0.056) (0.044) (0.012) (0.019) (0.029) (0.141)
Notes. a) Reported are the changes in the probability of falling in one of the eight categories given a marginal increase in
the corresponding regressor. b) Robust standard errors in parentheses. c) ∗∗∗, ∗∗, and ∗ denote statistical significance
at the 1, 5, and 10 percent level, respectively.
41
References
Abu-Rabia, Aref, “The Evil Eye and Cultural Beliefs Among the Bedouin Tribes of the
Negev, Middle East,” Folklore, December 2005, 116 (3), 241–254.
Alesina, Alberto, Paola Giuliano, and Nathan Nunn, “On the Origins of Gender
Roles: Women and the Plough,” Quarterly Journal of Economics, May 2013, 128 (2),
469–530.
Anselin, Luc and Sheri Hudak, “Spatial Econometrics in Practice: A Review of Soft-
ware Options,” Regional Science and Urban Economics, September 1992, 22 (3), 509–
536.
Ansell, Aaron, “‘But the Winds Will Turn Against You’: An Analysis of Wealth Forms
and the Discursive Space of Development in Northeast Brazil,” American Ethnologist,
February 2009, 36 (1), 96–109.
Ashraf, Quamrul and Oded Galor, “Dynamics and Stagnation in the Malthusian
Epoch,” American Economic Review, August 2011, 101 (5), 2003–2041.
Baker, Matthew, “A Structural Model of the Transition to Agriculture,” Journal of
Economic Growth, December 2008, 13 (4), 257–292.
Beck, Jan and Wolfgang Forstmeier, “Superstition and Belief as Inevitable By-
products of an Adaptive Learning Strategy,” Human Nature, Spring 2005, 18 (1),
35–46.
Benhabib, Jess, Alberto Bisin, and Matthew Jackson, eds, Handbook of Social
Economics, Vol. 1, Elsevier, 2011.
Bisin, Alberto and Thierry Verdier, “The Economics of Cultural Transmission and
Socialization,” in Jess Benhabib, Alberto Bisin, and Matthew Jackson, eds., Handbook
of Social Economics, Vol. 1, Elsevier, 2011, chapter 9, pp. 339–416.
Borgerhoff Mulder, Monique, et al., “Intergenerational Wealth Transmission and the
Dynamics of Inequality in Small-Scale Societies,” Science, October 2009, 326 (682),
682–688.
Burton, Michael L., “Language and Region Codes for the Standard Cross-Cultural
Sample,” Cross-Cultural Research, February 1999, 33 (1), 63–83.
42
Cancian, Frank, Economics and Prestige in a Maya Community, Stanford, CA: Stanford
University Press, 1965.
Cashdan, Elizabeth, “Ethnic Diversity and Its Environmental Determinants: Effects
of Climate, Pathogens, and Habitat Diversity,” American Anthropologist, December
2001, 103 (4), 968–991.
Chibnik, Michael, “The Evolution of Cultural Rules,” Journal of Anthropological Re-
search, Autumn 1981, 37 (3), 256–268.
Conley, Timothy G., “GMM estimation with cross sectional dependence,” Journal of
Econometrics, September 1999, 92 (1), 1–45.
Davidson, Nestor M., “Property and Relative Status,” Michigan Law Review, March
2009, 107 (5), 757–817.
de Vidas, Anath Ariel, “The Symbolic and Ethnic Aspects of Envy among a Teneek
Community (Mexico),” Journal of Anthropological Research, Summer 2007, 63 (2),
215–237.
Diamond, Jared, The World Until Yesterday: What Can We Learn from Traditional
Societies?, Viking, 2012.
and Peter Bellwood, “Farmers and Their Languages: The First Expansions,”
Science, April 2003, 300 (597), 597–603.
Durante, Ruben, “Risk, Cooperation and the Economic Origins of Social Trust: An Em-
pirical Investigation,” 2010. Working Paper, Sciences Po, Department of Economics.
Eff, Ellis A., “Does Mr. Galton Still Have a Problem? Autocorrelation in the Standard
Cross-Cultural Sample,” World Cultures, 2004, 15 (2), 153–170.
, “Weight Matrices for Cultural Proximity: Deriving Weights from a Language Phy-
logeny,” Structure and Dynamics, 2008, 3 (2), 1–15.
Elliott, John H., “The Evil Eye and the Sermon On the Mount,” Biblical Interpretation,
1994, 2 (1), 51–84.
Elworthy, Frederick Thomas, The Evil Eye. An Account of This Ancient and
Widespread Superstition, London: John Murray, Albemarle Street, 1895.
43
Fenske, James, “Does Land Abundance Explain African Institutions?,” Economic Jour-
nal, December 2013, 123 (573), 13631390.
, “Ecology, Trade and States in Pre-Colonial Africa,” Journal of the European Eco-
nomic Association, June 2014, 12 (3), 612640.
Foster, George, “The Anatomy of Envy: A Study in Symbolic Behavior,” Current An-
thropology, April 1972, 13 (2), 165–202.
Foster, Kevin R. and Hanna Kokko, “The Evolution of Superstitious and Superstition-
like Behaviour,” Proceedings of the Royal Society B, 2009, 276, 31–37.
Fudenberg, Drew and David K. Levine, “Superstition and Rational Learning,” Amer-
ican Economic Review, June 2006, 96 (3), 630–651.
and , “Self-confirming Equilibrium and the Lucas Critique,” Journal of Eco-
nomic Theory, November 2009, 144 (6), 2354–2371.
Gachter, Othmar, “Evil and Suffering in Hinduism,” Anthropos, 1998, 93, 393–403.
Gennaioli, Nicola and Ilia Rainer, “The Modern Impact of Precolonial Centralization
in Africa,” Journal of Economic Growth, September 2007, 12 (3), 185–234.
Gershman, Boris, “The Two Sides of Envy,” February 2014. Working Paper, American
University.
, “Witchcraft Beliefs and the Erosion of Trust: Evidence from Sub-Saharan Africa,”
July 2014. Working paper, American University.
Ghosh, Amitav, “The Relations of Envy in an Egyptian Village,” Ethnology, July 1983,
22 (3), 211–223.
Gigerenzer, Gerd, Gut Feelings: The Intelligence of the Unconscious, Penguin, 2008.
Giuliano, Paola and Nathan Nunn, “The Transmission of Democracy: From the
Village to the Nation-State,” American Economic Review Papers and Proceedings,
May 2013, 103 (3), 86–92.
Greenberg, James B., Santiago’s Sword: Chatino Peasant Religion and Economics,
Berkeley and Los Angeles: University of California Press, 1981.
44
Grosjean, Pauline, “A History of Violence: The Culture of Honor and Homicide in the
U.S. South,” Journal of the European Economic Association, 2014, forthcoming.
Harris, Marvin, Cannibals and Kings: The Origins of Cultures, New York: Random
House, 1977.
Henrich, Joseph and Robert Boyd, “Division of Labor, Economic Specialization, and
the Evolution of Social Stratification,” Current Anthropology, August 2008, 49 (4),
715–724.
Johnson, Allen W. and Timothy Earle, The Evolution of Human Societies: From
Foraging Group to Agrarian State, Stanford, CA: Stanford University Press, 1987.
Korotayev, Andrey, World Religions And Social Evolution Of The Old World Oikumene
Civilizations: A Cross-cultural Perspective, Edwin Mellen Press, 2004.
Leeson, Peter T., “Ordeals,” Journal of Law and Economics, August 2012, 55 (3), 691–
714.
, “Human Sacrifice,” Review of Behavioral Economics, 2014, 1 (1–2), 137–165.
and Christopher J. Coyne, “Sassywood,” Journal of Comparative Economics,
November 2012, 40 (4), 608–620.
Lison-Tolosana, Carmelo, “Some Aspects of Moral Structure in Galician Hamlets,”
American Anthropologist, June 1973, 75 (3), 823–834.
Low, Bobbi S., “Pathogen Intensity Cross-Culturally,” World Cultures, 1994, 8 (1), 24–
34.
Michalopoulos, Stelios, Alireza Naghavi, and Giovanni Prarolo, “Trade and Ge-
ography in the Origins and Spread of Islam,” October 2012. NBER Working Paper
18438.
and Elias Papaioannou, “Pre-Colonial Ethnic Institutions and Contemporary
African Development,” Econometrica, January 2013, 81 (1), 113–152.
Mui, Vai-Lam, “The Economics of Envy,” Journal of Economic Behavior & Organization,
May 1995, 26 (3), 311–336.
Murdock, George P., Ethnographic Atlas, Pittsburgh, PA: University of Pittsburgh
Press, 1967.
45
and Caterina Provost, “Measurement of Cultural Complexity,” Ethnology, October
1973, 12 (4), 379–392.
and Douglas R. White, “Standard Cross-Cultural Sample,” Ethnology, October
1969, 8 (4), 329–369.
, Suzanne F. Wilson, and Violetta Frederick, “World Distribution of Theories
of Illness,” Ethnology, October 1978, 17 (4), 449–470.
Nunn, Nathan, “Culture and the Historical Process,” Economic History of Developing
Regions, 2012, 27, S108–S126.
and Leonard Wantchekon, “The Slave Trade and the Origins of Mistrust in
Africa,” American Economic Review, December 2011, 101 (7), 3221–3252.
Ortiz de Montellano, Bernard, “Syncretism in Mexican and Mexican-American Folk
Medicine,” in “Discovering the Americas: 1992 Lecture Series,” University of Mary-
land, College Park, 1989.
Platteau, Jean-Philippe, “Redistributive Pressures in Sub-Saharan Africa: Causes,
Consequences, and Coping Strategies,” in E. Akyeampong, R. Bates, N. Nunn, and
J. Robinson, eds., African Development in Historical Perspective, Cambridge Univer-
sity Press, 2014.
and Robert Peccoud, eds, Culture, Institutions, and Development: New Insights
Into an Old Debate, Routledge, 2010.
Reminick, Ronald A., “The Evil Eye Belief Among the Amhara of Ethiopia,” Ethnology,
July 1974, 13 (3), 279–291.
Richerson, Peter J. and Robert Boyd, Not by Genes Alone: How Culture Transformed
Human Evolution, Chicago: University of Chicago Press, 2005.
Roberts, John M., “Belief in the Evil Eye in World Perspective,” in Clarence Maloney,
ed., The Evil Eye, New York: Columbia University Press, 1976.
Scheibe, Karl E. and Theodore R. Sarbin, “Towards a Theoretical Conceptualisation
of Superstition,” The British Journal for the Philosophy of Science, August 1965, 16
(62), 143–158.
Schoeck, Helmut, Envy: A Theory of Social Behavior, New York: Harcourt, Brace, and
World, 1969.
46
, “The Evil Eye: Forms and Dynamics of a Universal Superstition,” in Alan Dundes,
ed., The Evil Eye: A Folklore Casebook, New York: Garland Publishing, 1981, pp. 192–
200.
Seligmann, S., Der Bose Blick und Verwandtes, Berlin: Verlag von Hermann Barsdorf,
1910.
Spooner, Brian, “The Evil Eye in the Middle East,” in Mary Douglas, ed., Witchcraft
Confessions and Accusations, London: Tavistock Publications, 1970, chapter 15,
pp. 311–319.
Stein, Howard F., “Envy and the Evil Eye Among Slovak-Americans: An Essay in the
Psychological Ontogeny of Belief and Ritual,” Ethos, Spring 1974, 2 (1), 15–46.
Thomsen, Marie-Louise, “The Evil Eye in Mesopotamia,” Journal of Near Eastern
Studies, January 1992, 51 (1), 19–32.
Wolf, Eric R., “Types of Latin American Peasantry: A Preliminary Discussion,” Amer-
ican Anthropologist, June 1955, 57 (3, Part 1), 452–471.
47