Embed Size (px)
Citation preview

Research Seminar in Quantitative Economics
The Economic Outlook for Washtenaw County, 2021–2023Washtenaw Economic Club
2021 Event SeriesMarch 25, 2021
Jacob BurtonTina Dhariwal
Gabriel EhrlichDonald Grimes
Owen KayMichael McWilliams

The Distribution of Prosperity in Washtenaw County before COVID-19

Average Adjusted Three-Person Equivalent Household Income,Michigan and Washtenaw County
RSQE: March 2021

Washtenaw County PUMA Regions
RSQE: March 2021

Average Three-Person Equivalent Household Income,Washtenaw County PUMAs
RSQE: March 2021

Population in Lower-, Middle-, and Upper Income Households by Race and Ethnicity, Washtenaw County, 2019
RSQE: March 2021
Lower Income Population Middle Income Population Upper Income Population
All Race/Ethnicity 24% 45% 32%Hispanic 35% 44% 21%Non-Hispanic Asian 25% 37% 39%Non-Hispanic Black 35% 47% 18%Non-Hispanic White 20% 46% 35%Note: some totals do not sum to 100 percent because of rounding.

Current State of Washtenaw’s Economy

New Cases of COVID-19 in Washtenaw County
RSQE: March 2021
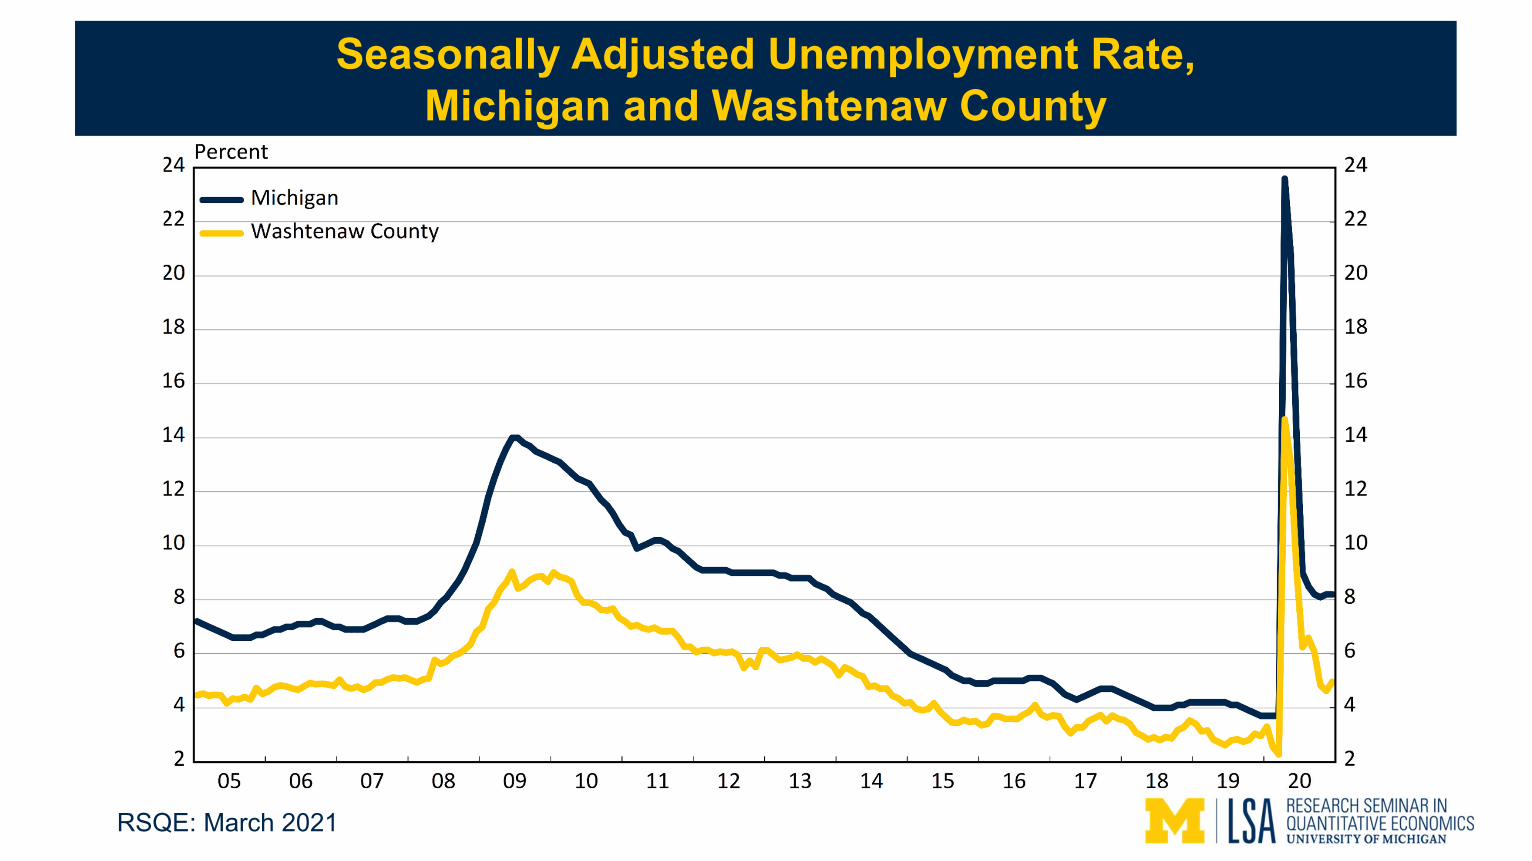
Seasonally Adjusted Unemployment Rate,Michigan and Washtenaw County
RSQE: March 2021

Small Business Closures, Michigan and Washtenaw County
RSQE: March 2021

U.S. Economic Outlook
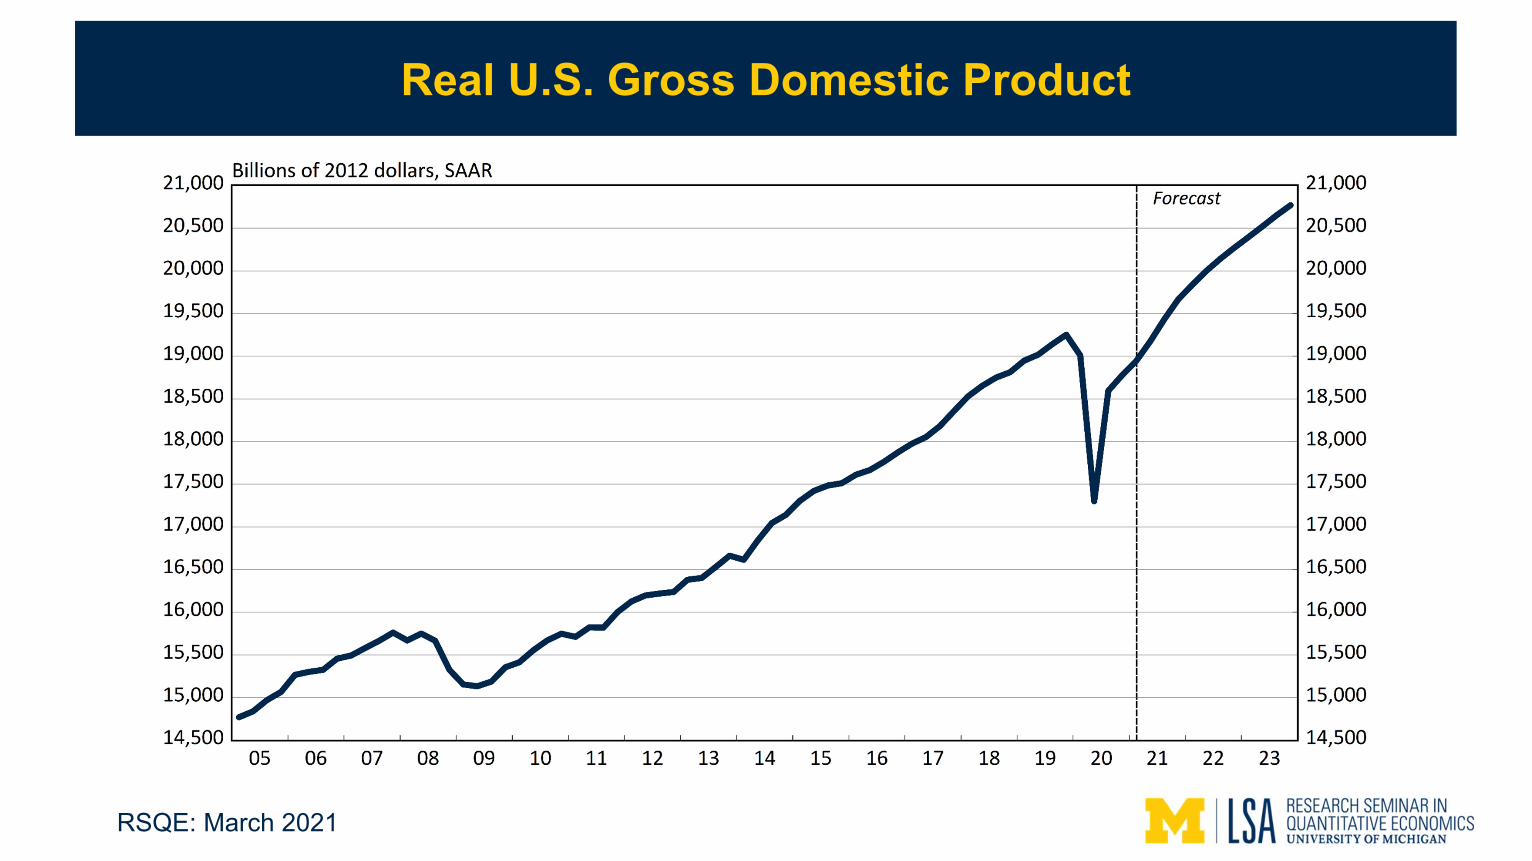
Real U.S. Gross Domestic Product
RSQE: March 2021

Total U.S. vs. Detroit Three Light Vehicle Sales
RSQE: March 2021

Forecast Review

Review of Last Year’s Forecast
RSQE: March 2021
Forecast 2020
Actual 2020
Payroll employment growth -6.5% -7.4%Unemployment rate 8.4% 6.5%Consumer inflation rate 0.5% 1.0%

Q&A for Session I
RSQE: March 2021
Alex WestAnn Arbor SPARKDirector of Research
Submit questions to Alex in the chat panel

Washtenaw County Economic Outlook

Seasonally Adjusted Unemployment Rates for Michigan and Washtenaw County
RSQE: March 2021

Seasonally Adjusted Employment Indices for Michigan and Washtenaw County
RSQE: March 2021

Industry Detail

The Recovery of Payroll Jobs in Washtenaw County
RSQE: March 2021
Estimate 2020 '19–'20 '20–'21 '21–'22 '22–'23 '20–'23
Average Annual
Wage 2019
Total Jobs (Number of Jobs) 202,269 -16,207 4,266 9,882 4,907 19,056 $61,276(Annual percent change) (-7.4%) (2.1%) (4.8%) (2.3%)
Private Sector 122,409 -13,694 4,434 7,100 3,320 14,853 $58,795
Total Government 79,861 -2,512 -168 2,783 1,588 4,203 $65,375
State Government 64,574 -1,960 -10 2,279 1,362 3,631 $66,408
Forecast Employment Change

Industries that Gained Jobs in 2020
RSQE: March 2021
Estimate 2020 '19–'20 '20–'21 '21–'22 '22–'23 '20–'23
Average Annual
Wage 2019
Management of Companies & Enterprises 1,397 67 22 101 46 169 $166,914
Utilities 428 5 5 3 2 9 $155,132
Information 5,033 247 35 77 49 162 $105,829
Transportation & Warehousing 3,683 159 297 211 200 709 $67,704
Forecast Employment Change
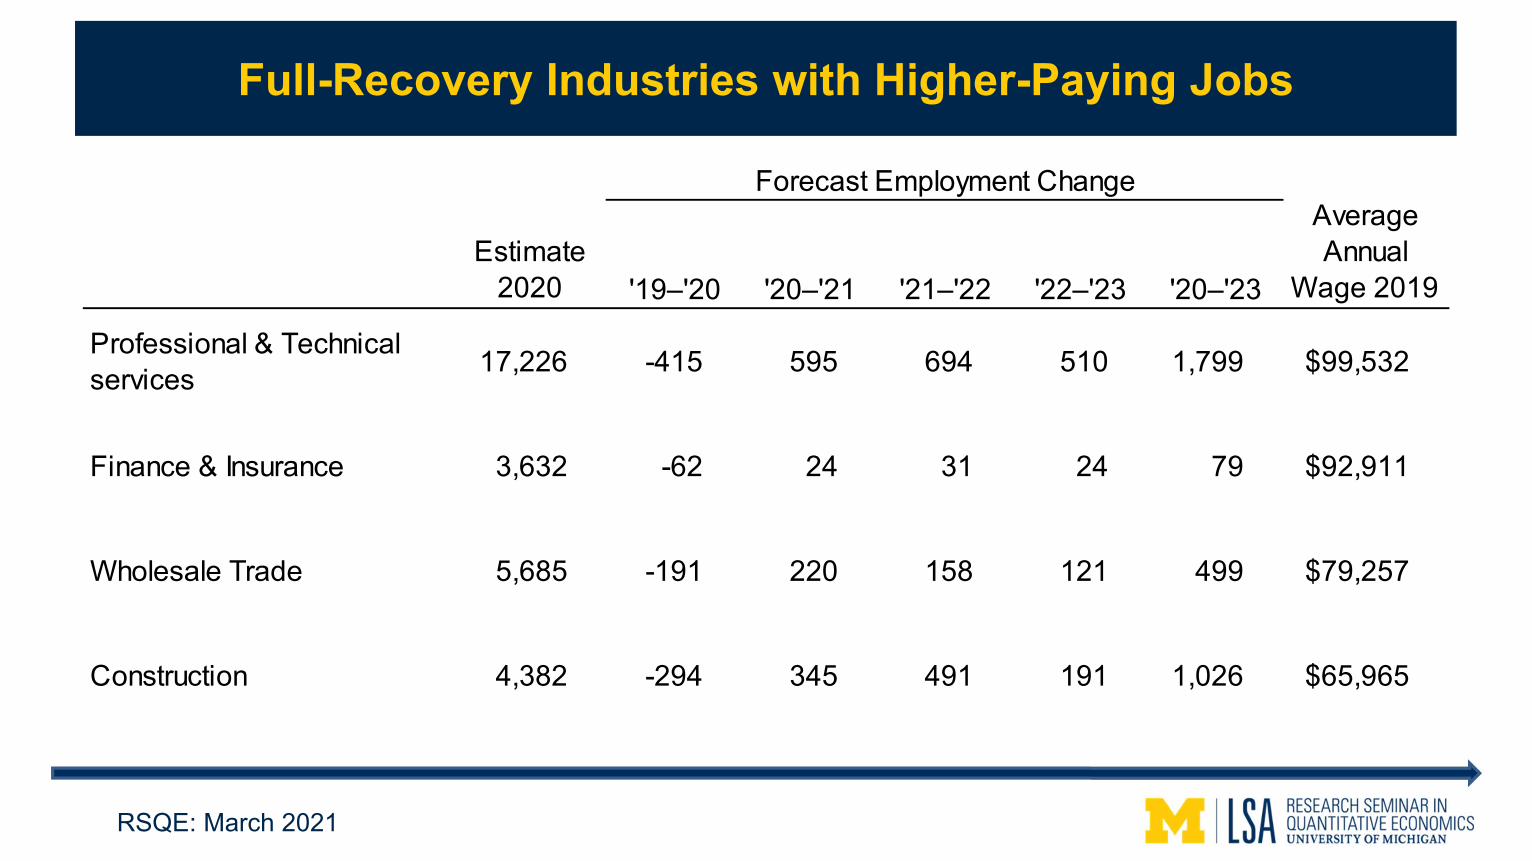
Full-Recovery Industries with Higher-Paying Jobs
RSQE: March 2021
Estimate 2020 '19–'20 '20–'21 '21–'22 '22–'23 '20–'23
Average Annual
Wage 2019
Professional & Technical services 17,226 -415 595 694 510 1,799 $99,532
Finance & Insurance 3,632 -62 24 31 24 79 $92,911
Wholesale Trade 5,685 -191 220 158 121 499 $79,257
Construction 4,382 -294 345 491 191 1,026 $65,965
Forecast Employment Change

Full-Recovery Industries with Lower-Paying Jobs
RSQE: March 2021
Estimate 2020 '19–'20 '20–'21 '21–'22 '22–'23 '20–'23
Average Annual
Wage 2019
Private Health & Social services 23,593 -1,251 664 1,118 467 2,248 $56,997
Real Estate & Rental 2,327 -185 65 133 75 272 $52,246
Natural Resources & Mining 255 -29 12 14 6 32 $32,078
Arts & Recreation 1,682 -833 312 595 296 1,203 $23,021
Forecast Employment Change

Incomplete-Recovery Industries
RSQE: March 2021
Estimate 2020 '19–'20 '20–'21 '21–'22 '22–'23 '20–'23
Average Annual
Wage 2019Accomodation & Food Services 11,124 -4,461 476 2,099 735 3,309 $21,008
Retail Trade 14,129 -1,657 335 225 80 639 $32,476
Other Services 4,346 -783 242 156 69 467 $33,846
Private Education 2,808 -458 148 223 48 419 $36,761
Administrative Support & Waste Management 8,327 -946 245 347 112 703 $38,039
Transportation Equipment Manufacturing 3,604 -1,080 193 206 142 541 $66,126
Other Manufacturing 8,395 -1,530 201 219 148 568 $67,216
Forecast Employment Change

A table is in the full report, which will be posted on RSQE’s and WCC’s websites this afternoon
Generally, industries that gained the most jobs from 2015 to 2019 are forecast to gain the most jobs during 2021–23 as well
We expect Washtenaw County’s pattern of job creation over the next three years to look a lot like it did before the pandemic
Private Sector Industries with the Greatest Job Gains in Washtenaw County, Recent History and Forecast
RSQE: March 2021
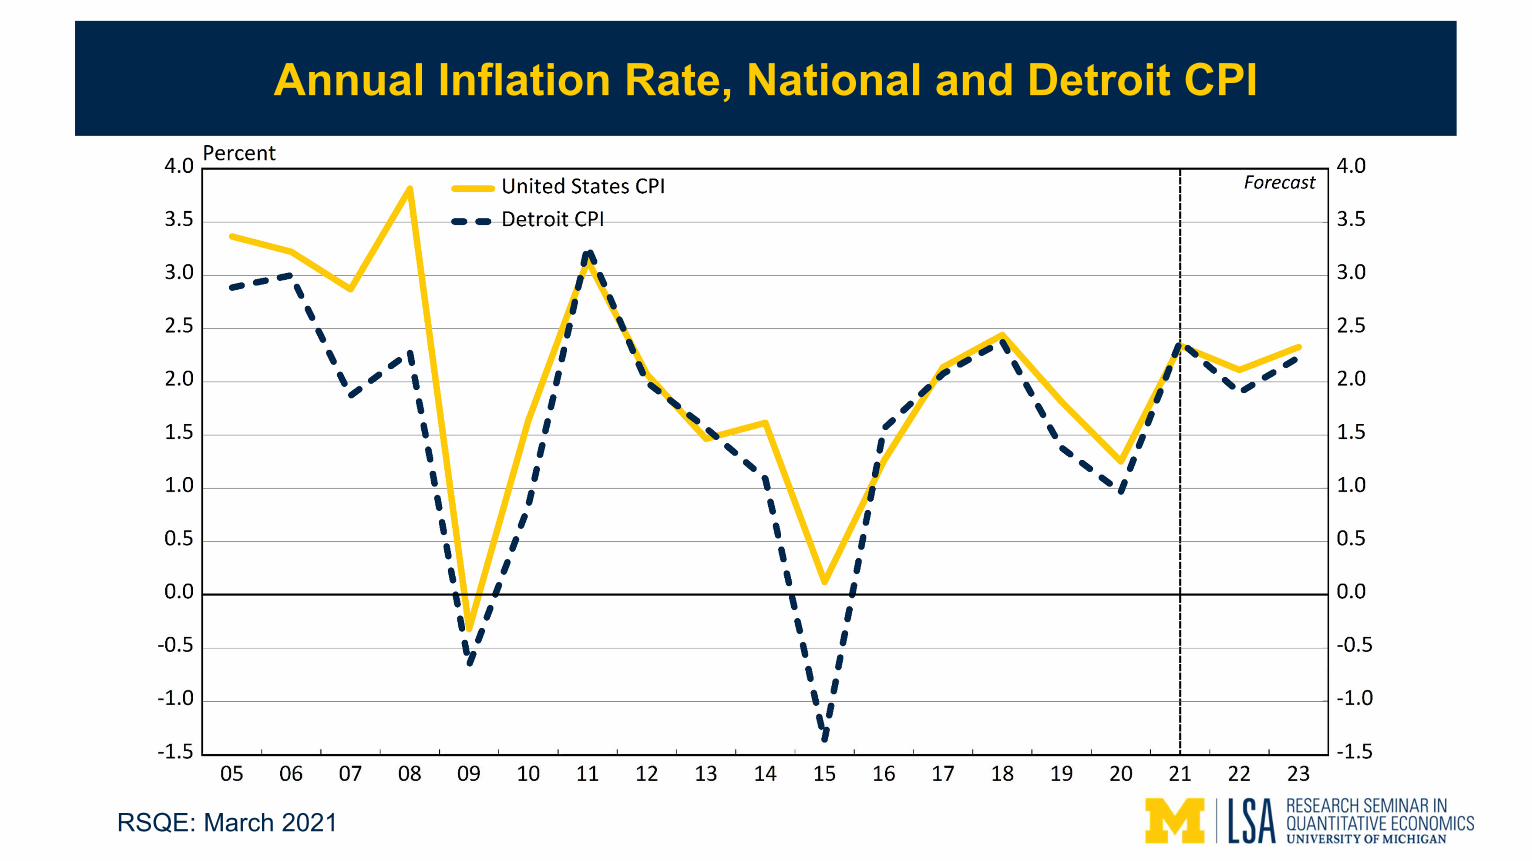
Annual Inflation Rate, National and Detroit CPI
RSQE: March 2021

Average Real Wage in Michigan and Washtenaw County
RSQE: March 2021

Average Real Wage in Washtenaw County by Industry Groupings
RSQE: March 2021

Washtenaw County Employment by Industry Groupings
RSQE: March 2021

Q&A for Session II
RSQE: March 2021
Alex WestAnn Arbor SPARKDirector of Research
Submit questions to Alex in the chat panel