Embed Size (px)
Citation preview

The economics of 3D Printing:A total cost perspective
Project Report
www.digits2widgets.com
D2W
EPSRC Centre for Innovative Manufacturing in Additive Manufacturing
2
The economics of 3DP: A total cost perspective – Project Report
2
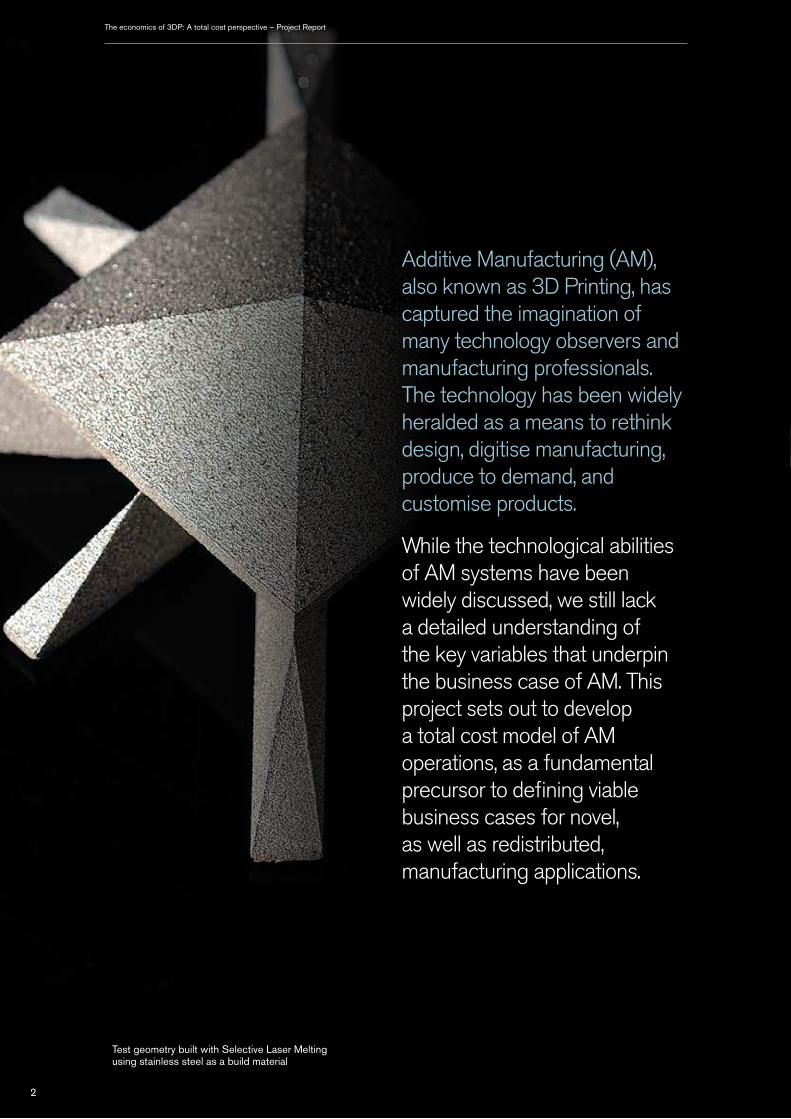
Test geometry built with Selective Laser Melting using stainless steel as a build material
Additive Manufacturing (AM), also known as 3D Printing, has captured the imagination of many technology observers and manufacturing professionals. The technology has been widely heralded as a means to rethink design, digitise manufacturing, produce to demand, and customise products.
While the technological abilities of AM systems have been widely discussed, we still lack a detailed understanding of the key variables that underpin the business case of AM. This project sets out to develop a total cost model of AM operations, as a fundamental precursor to defining viable business cases for novel, as well as redistributed, manufacturing applications.

EPSRC Centre for Innovative Manufacturing in Additive Manufacturing
3
The economics of 3DP: A total cost perspective – Project Report
3
Executive summary by Dr Martin Baumers, Prof Matthias Holweg and Jonathan Rowley
AM processes are generally associated with two advantages over conventional manufacturing techniques. Firstly, they avoid many of the tooling-related constraints on the geometries that can be achieved through conventional manufacturing processes. Secondly, AM allows the efficient creation of products in very low volumes, down to a single unit, enabling the manufacture of customised or highly differentiated products.
The technological opportunities that AM presents are not in question. We do however still lack a fundamental understanding of the economics that underpin the application of this technology, which is a fundamental precursor to developing a business case for its application. In this report we present the findings of a project aiming to develop our understanding of the underlying economics of AM 1.
It is frequently claimed that the generic advantages associated with AM will lead to flourishing supply chain innovation challenging the existing paradigm of centralised mass manufacturing. However, the successful and meaningful adoption of AM will depend on a favourable business case of which, at present, key aspects are not fully measured and understood. This underlying research addresses the identified gap.
As a central element for making the business case towards AM adoption, existing costing approaches have largely focused on capital investments and consumables, with an emphasis on build materials. Analyses of such “well-structured costs” have observed that utilising the available machine capacity forms a prerequisite for efficient operations. This is also a core principle of traditional manufacturing, which is directed at achieving economies of scale and, as a result, has led to the formation of global supply chains in many industries.
This stands in contrast to AM, where the underlying reason for the different requirements towards full utilisation is that the technology is inherently parallel, allowing the contemporaneous deposition of multiple geometries. Moreover, existing analyses of AM resource consumption have largely ignored hidden or so-called “ill-structured” costs relating to build failure, part rejection and ancillary manual processes, such as support removal and surface finishing. This omission has come at the expense of industrial applicability, also leading to a lack of realistic decision tools for the support of AM technology adoption which are an essential prerequisite for successful diffusion.
Over the duration of this project, we set out to develop new methodologies and conducted a series of experiments to build up a body of data supporting a realistic and comprehensive costing model. Overall, 20 build experiments were carried out on state-of-the-art polymeric Laser Sintering (LS) and metallic Selective Laser Melting (SLM) platforms.
As polymeric LS constitutes one of the most commonly adopted technologies for the additive manufacture of end-use components and is capable of delivering useful material properties, the project has concentrated on LS in its experimental work. The key methodologies employed in the analysis of LS, together with reached results, are presented in this report.
We have identified three aspects that have proven to be of special significance for the formulation of the total cost perspective for AM:
• it is known that the unit cost achievable with LS is dependent on the degree of build volume utilisation. This relationship underlies the approach taken in this project;
• AM processes do not operate in isolation. They are embedded in a sequence of ancillary process steps that can, as the project has identified, be adequately captured through process mapping;
• at the current state of technology, AM processes are prone to build failure events of various sorts, which all have a detrimental effect on cost and thus need to be incorporated in any costing model.
We further demonstrate that there is a relationship between the quantity of parts included within a build volume and the resulting unit cost. We show that sub-normal machine utilisation leads to higher unit cost, as one would expect. We also show that once the process operates at technical efficiency (optimal build space utilisation) there are no cost benefits from repeating the build process.
Based on the experimental results we develop a total cost model that accommodates both manual process inputs and interventions as well as the risk of build failure. The methodology developed within this project thus provides the basis upon which any economic case for AM, associated network effects, and potentially redistributed manufacturing can be built.
1 This report is based on the findings of the project “The enabling role of 3D Printing in redistributed manufacturing: a total cost model”, which was funded through the 3DP-RDM network, and aims to develop a fresh and realistic perspective on the full cost of operating AM technology. We cordially thank the Bit-by-Bit project team at the University of Cambridge and the 3DP-RDM network for their funding and support. We acknowledge the contributions of the technical staff at the 3D Printing Research Group at the University of Nottingham, with special thanks to Joe White for expertly carrying out the required build experiments.

EPSRC Centre for Innovative Manufacturing in Additive Manufacturing
4
Laser Sintering: a technological baseline
The economics of 3DP: A total cost perspective – Project Report
4
The term Additive Manufacturing is an umbrella term encompassing a variety of different technological approaches to the additive, and normally layer-by-layer, deposition of build material. The operating principles behind these approaches range from the selective thermal fusion of particles held in a powder bed to the exposure to UV radiation of photoreactive monomer resins contained in a vat.
This degree of technological variety has led to considerable difficulties in assessing the viability of business adoption of AM technology for particular manufacturing applications. Phrased in the language of operations management, the conversion mechanisms with which alternative AM technology variants create product outputs from raw material inputs differ considerably. Research has shown that this applies in particular to build time estimation, process energy consumption modelling and cost estimation.
It has been noted by technology observers that the technology variant Laser Sintering (LS) is one of the most commonly adopted AM technology variants for the manufacture of end-use products. Additionally, LS is capable of generating parts and products with useful mechanical properties. For these reasons, it was decided to position this research on LS as a baseline technology, with additional build experiments conducted on its metallic counterpart, Selective Laser Melting (SLM).
The LS process operates by feeding polymer powder into an internal build volume and then spreading it in a fine layer over the build area, which is located over a vertically moveable build platform. After preheating the build material to a suitable temperature below the melting point, a CO2 laser system is used to deflect a laser beam to selectively melt the deposited powder material. Once the exposure process is complete, the build platform indexes down by one increment and the cycle repeats. Upon completion of all layers and sufficient cool down, the build volume can be removed from the machine for unpacking.
The most commonly employed build material in LS is a polyamide 12-type powder (nylon). Among many other uses, components built in this material via LS have been used in aerospace applications, automotive and medical products. As with many AM technologies, LS is also frequently used in prototyping applications.
By selectively building up material within a bed of unprocessed powder, relatively few geometric restrictions apply to LS. Additionally, support structures are not required and geometries can be distributed in the build volume in three dimensions. These aspects result in a highly parallel process, allowing the manufacture of multiple, potentially entirely unrelated, components within individual build operations.
EOSINT P100
System manufacturer EOS GmbH
Process type Laser Sintering
Energy deposition CO2 laser, 30W
Usable build volume size (X / Y / Z) 260 / 210 / 330 mm
Process atmosphere N2
N2 source N2 generator, internal power supply
Heater type IR and resistance
Melting temperature ~173 ºC
Build material PA2200, Polyamide 12-type thermoplastic
Used layer thickness 100 μm
Support structures Not required
Table 1: Key characteristics of the investigated LS system

EPSRC Centre for Innovative Manufacturing in Additive Manufacturing
5
An EOS P100 Laser Sintering system at the University of Nottingham
The economics of 3DP: A total cost perspective – Project Report
5

EPSRC Centre for Innovative Manufacturing in Additive Manufacturing
6
Experiments
To create a body of data for the systematic analysis of the total costs associated with AM, it was decided to conduct a series of build experiments on a state-of-the-art polymeric EOSINT P100 system, with additional build experiments performed on a metallic Renishaw SLM250 platform. Both machines are located at the 3D Printing Research Group (3DPRG) at the University of Nottingham.
The main series of build experiments on the polymeric LS platform comprises ten builds designed to reflect machine operation at full capacity and four builds at lower levels of build utilisation. As LS allows the utilisation of the entire build volume (with a usable Z-height of 330 mm), running the system at full capacity results in very extensive builds. To generate a useful number of repetitions, the project partners decided to limit the available machine capacity to a horizontal ‘slice’ of the build volume with a Z-height of 30 mm. A computational build volume packing algorithm employing a combined front-bottom-left and barymetric packing heuristic was used to populate the build space available in each full build experiment. To estimate the time and resource consumption at full capacity (using the full available Z-height of 330 mm), the experimental results were then subject to an extrapolation procedure.
Test geometries manufactured during the project using Laser Sintering.
The economics of 3DP: A total cost perspective – Project Report
6

EPSRC Centre for Innovative Manufacturing in Additive Manufacturing
7
The economics of 3DP: A total cost perspective – Project Report
7
The performed build experiments are based on a test geometry that was modified for this project. With overall dimensions of 103 mm × 99 mm × 24 mm, its spider-like shape was chosen because of its relatively large footprint in the X/Y dimensions to limit overall packing density to realistic levels. Additionally, each build experiment contained a number of tensile specimens for the analysis of material properties. Figure 1 illustrates the full build configuration in extrapolated form, using up the available Z-Height and resulting in a net build volume utilisation ratio of approximately 10%, which corresponds to running the machine at full capacity.
A key premise of the approach taken in this project is to extend the consideration of AM process economics beyond the core manufacturing step taking place within the LS machine. To establish this more complete view, a structured representation of the work flow encountered in LS was developed by the project partners. This chain of process steps is shown in the form of a process map in Figure 2. Effectively splitting the operation of AM systems into a chain of discrete operations, the process map was then translated into spreadsheet form for the collection of relevant data points from build experiments.
By consistently viewing the AM process as a sequence of discrete operations, it is possible to accommodate the cost impact of build failure and other types of deviation from normal machine operation. To additionally investigate quality characteristics of the manufactured parts, each test geometry was subject to three different procedures:
• a visual inspection for artefacts resulting from errors in the deposition process;
• measurement of part dimensions to check for deviation in size;
• destructive testing of tensile specimens to assess deposited material properties (acc. to ISO 527-2:1996).
Beyond the experiments on the LS system, which are in the focus of this report, three additional build experiments were performed on the metallic SLM platform, confirming the applicability of the data collection methodology and the concept of process maps.
330mm
210mm260mm
File preparation
(R1)
Build set up on control system (R2)
Machine preparation
(R3)
Build release (R4)
Build process
Machine supervision
(R5)
Build volume removal, clean up
(R6)
Post build procedures
(S1)
Unpacking and powder
handling (S2)
Shot blasting
(U1)
Part washing
(U2)
Commission parts /
packing (S3)
Outright build
failureYes No
Start
End
Figure 1: Process model at full capacity utilisation
Figure 2: Generic process map surrounding the core LS process

EPSRC Centre for Innovative Manufacturing in Additive Manufacturing
8
Results
This section provides an overview of experimental results, model specification and presents of the developed total cost model for the investigated EOSINT P100 LS system.
Including an additional build to replace rejected test geometries, a total of 63 test geometries and 56 tensile specimens were manufactured with a total nominal volume of 2521 cm³. Over the course of the experiments, a total of 13.09 kg of virgin PA2200 powder was introduced to the machine. The material was purchased from the system vendor at a price of £45.05 per kg. In the series of build experiments, the EOSINT P100 system was run at factory settings and configured to a layer thickness of 100 μm.
The series of planned build experiments comprised 14 builds. Of these 14 experiments, 10 builds reflect system operation at full capacity, fully using the 30 mm ‘slice’ of build volume space. The application of an automatic build volume packing algorithm resulted in the insertion of five test geometries into the available band of build volume space. The remaining four build experiments reflect build configurations with sub-normal levels of build volume utilisation.
However, due to two outright build failure events directly affecting the series of experiments, and the requirement to carry out one additional build to replace rejected test geometries, 17 build experiments were required in total on this machine. Table 2 summarises key aspects of this campaign of build experiments.
The economics of 3DP: A total cost perspective – Project Report
8
Close-up image of the test geometry showing surface detail.

EPSRC Centre for Innovative Manufacturing in Additive Manufacturing
9
The economics of 3DP: A total cost perspective – Project Report
Experiment no. 1 2 3 4 5 6 7 8
Type Planned Planned Planned Planned Planned Planned Planned Repeat build
Capacity utilisation Full Partial Partial Partial Partial Full Full Full
Number of test geometries included
5 1 2 3 4 5 5 5
Build result Success Success Success Success Success Success Failure Success
Total Z-height (including blank layers
and tensile bars)39.1 mm 35.6 mm 35.6 mm 35.6 mm 35.6 mm 39.1 mm 39.1 mm 39.1 mm
Warm up time (incl. deposition of blank
layers and tensile bars)234 min 204 min 232 min 206 min 204 min 234 min 207 min 190 min
Net normal build time 149 min 106 min 112 min 121 min 132 min 149 min 15 min 150 min
Cool down time 900 min 600 min 1020 min 840 min 600 min 600 min N/A 840 min
Total build time 1283 min 910 min 1364 min 1167 min 936 min 984 min N/A 1180 min
Table 2: Summary of the build experiments on the EOSINT P100
Experiment no. 9 10 11 12 13 14 15 16 17
Type Planned Planned PlannedRepeat build
Planned Planned Planned PlannedAdditional
build
Capacity utilisation Full Full Full Full Full Full Full Full Partial
Number of test geometries included
5 5 5 5 5 5 5 5 3
Build result Success Success Failure Success Success Success Success Success Success
Total Z-height (including blank layers
and tensile bars)39.1 mm 39.1 mm 39.1 mm 39.1 mm 39.1 mm 39.1 mm 39.1 mm 39.1 mm 35.6 mm
Warm up time (incl. deposition of blank
layers and tensile bars)206 min 234 min 164 min 233 min 204 min 199 min 206 min 165 min
Not measured
Net normal build time 152 min 152 min 70 min 148 min 149 min 151 min 150 min 148 minNot
measured
Cool down time 960 min 900 min N/A 720 min 960 min 1080 min 960 min 780 minNot
measured
Total build time 1318 min 1286 min N/A 1101 min 1313 min 1430 min 1316 min 1093 minNot
measured
9

EPSRC Centre for Innovative Manufacturing in Additive Manufacturing
10
The economics of 3DP: A total cost perspective – Project Report
10
Effectively, this work adds two additional aspects to the existing perception of LS as a parallel manufacturing technology requiring the utilisation of available build space. Firstly, LS is viewed as embedded in a chain of discrete process steps incurring additional labour expenses, as shown in Figure 2. Secondly, some elements in this chain need to be subject to the consequences of build failure.
After completion of the build experiments, the next step within the project was therefore the construction of a unit cost model capable of reflecting the cost characteristics of the process itself, as well as the observed risk of build failure (which is discussed in detail in the following section) present in the process map of LS. Thus, as an initial step, the cost model for an LS build, CostBuild, can be summarised as follows:
Indirect cost Labour cost
Production overhead rate £4.53 / h Full annual labour costs £32,420 / year
Admin overhead rate £0.31 / h Working days net of holiday 228 days
Total hours worked per year 1653 h
Machine purchase £140,500 Labour cost rate (ĊLabour) £19.61 / h
Depreciation period 8 years
Annual operating time 5,000 h Direct cost data
Estimated maintenance and consumables £8,516 / year Raw material price £45.05 / kg
Total machine cost rate £5.22 / h Material density, as deposited 0.93 g / cm³
Energy price £0.02 / MJ
Total indirect cost rate (ĊIndirect) £10.06 / h Fixed energy consumption per build 25.23 MJ
Energy consumption rate 1,407.50 J / s
Table 3: Elements of the unit cost model
where P(N) is a function describing the cumulative probability of build failure after the deposition of N layers, ĊIndirect is the indirect cost rate incurred during machine operation, TBuild is the core LS build time including warm up and cool down, CDirect is an estimate of all indirect costs incurred for raw material and energy, ĊLabour is the labour cost rate, Ri are the durations attributable per build of all i process elements in the process map subject to
the risk of build failure, Sj are the durations attributable per build of all j process elements not subject to the risk of this, Uk are the durations that arise per part of k such elements and n is the total number of product geometries included in the build. Following this, the model can be broken down to the unit cost level, CostUnit, by attaching a constant, geometry-determined probability of post-build part rejection, preject, which arises on the unit level:
By inserting (1) into (2) and rearranging, the new total cost model incorporating risk of failure and ancillary process elements can be expressed as a sum of
elements relating to the core build activity, process chain elements subject to risk of build failure and elements not affected by this risk:
As can be seen from this specification, the sum of all indirect and direct costs associated with the build activity reflects the cost of the core AM process. This model is based on an indirect cost rate consisting of production overheads, administrative overheads and total machine costs, including depreciation, consumables and maintenance.
The direct cost estimate captures all expenditures for material inserted into the system and energy consumed through the process. The labour cost estimate represents the costs incurred by the technician executing the build experiments. Table 3 summarises the elements flowing into the core process part of the total cost model.
(1)
(2)
(3)

11
As the central result of the model, Figure 3 plots unit cost estimates against the quantity of test geometries contained in build processes. The ‘sawtooth’ characteristic of the unit cost curves forms an artefact of the extrapolation procedure and should thus be ignored.
Importantly, Figure 3 shows unit cost behaviour across the entire range of capacity utilisation, from highly inefficient configurations with individual units in the build volume (grey area) to the fully packed build configurations shown in Figure 1. The degree of capacity utilisation is expressed in terms of the build volume utilisation ratio which is obtained by dividing the total volume of part geometry included in the build by the volume of the useful build volume cuboid, as presented in Table 1. In multi-part builds on LS systems, build volume utilisation ratios typically range from 5% to 10% in practise. It should be noted that other criteria are available for the evaluation of AM capacity utilisation, for example those based on bounding boxes rather than net geometry. As shown, in the model including risk of build failure, unit cost decreases rapidly initially but then begins to rise slightly as capacity utilisation nears its maximum, as illustrated in Figure 1. This is due to increases of the expected cost of build failure overpowering cost benefits of improved capacity utilisation. As also shown, this behaviour is absent in the unit cost model excluding risk of build failure.
At full capacity utilisation, corresponding to a build volume utilisation ratio of approximately 9.11%, the preliminary results suggest that the total specific cost of operating the investigated EOSINT P100 system amounts to £0.89 per cm³ of part geometry deposited. However, through the presence of risk of build failure at the measured level, the lowest specific cost is observed in a configuration with a capacity utilisation rate of 6.62%, at £0.84 per cm³ deposited.
Figure 4 breaks down the total cost of two builds to their constituent elements at these levels of capacity utilisation (9.11% and 6.62%). The total cost is separated into the direct costs of build materials and energy, labour costs and indirect costs, which include machine depreciation, maintenance, consumables and overheads. Costs associated with the risk of build failure, potentially incurred through the repetition of process elements, are shown as risk-related costs. Additionally, it is noteworthy that the highest build rate, 36.47 cm³ per h of machine operation (excluding tensile specimens), was achieved at full capacity, corresponding to 9.11% build volume utilisation.
Figure 4: Breakdown of the total costs of the build at utilisation ratios of 9.11% (left) and 6.62% (right)
Figure 3: Unit cost model versus capacity utilisation
Risk-related costs, £553.18
Labour costs, £61.20 Indirect
process costs, £452.56
Direct costs, £391.19
Risk-related costs, £288.22
Direct costs, £285.12
Indirect process costs, £377.16
Labour costs, £49.24
Material costs, £388.23
Energy costs, £2.96
Energy costs, £2.28
Material costs, £282.84
0%
1%
2%
3%
4%
5%
6%
7%
8%
9%
10%
£0
£10
£20
£30
£40
£50
£60
£70
5 10 15 20 25 30 35 40 45 50 55
Quantity of units in the build
Total unit cost estimate (with failure and rejection) Total unit cost estimate (without failure and rejection)
Build volume utilisation ratio
* in the used model, a ratio of 9.11% corresponds to full capacity utilisation, as shown in Figure 1
Tota
l uni
t co
st p
er t
est
geom
etry
, in
£
Build
vol
ume
utili
satio
n ra
tio*
Inef
ficie
nt m
achi
ne o
pera
tion
due
to u
nfill
ed la
yers
The economics of 3DP: A total cost perspective – Project Report
0%
1%
2%
3%
4%
5%
6%
7%
8%
9%
10%
£0
£10
£20
£30
£40
£50
£60
£70
5 10 15 20 25 30 35 40 45 50 55
Quantity of units in the build
Total unit cost estimate (with failure and rejection) Total unit cost estimate (without failure and rejection)
Build volume utilisation ratio
* in the used model, a ratio of 9.11% corresponds to full capacity utilisation, as shown in Figure 1
Tota
l uni
t co
st p
er t
est
geom
etry
, in
£
Build
vol
ume
utili
satio
n ra
tio*
Inef
ficie
nt m
achi
ne o
pera
tion
due
to u
nfill
ed la
yers

EPSRC Centre for Innovative Manufacturing in Additive Manufacturing
12
The economics of 3DP: A total cost perspective – Project Report
12
A systematic look at build failure modes
Underlining the importance of deviation from normal machine operation for the assessment of AM process economics, the build experiments performed for this feasibility study resulted in a spectrum of build failure events. It is the ambition of this research to provide a structure for the classification of such events and to propose a pathway for their inclusion in studies of AM cost performance. Three different failure modes were identified.
Failure mode 1: Outright build failure
The first, and arguably most serious, mode of process failure encountered is outright build failure. In this case, at some point during machine operation an unforeseen event occurs that leads to the premature stoppage of the build process. In this research, a simplifying assumption is made that all products contained in the build volume are written off as a consequence of this termination. In the context of the build experiments, four outright build failures were recorded, two during the actual build experiments (as shown in Table 2), and two in adjacent builds.
Failure mode 2: Post-build part rejection
The second mode of build failure relates to the rejection of individual parts after completion of the build process. Such events occur for example if foreign objects are present in the build volume and disturb the deposition process, or if there is excessive part deformation due to inadequate cool down procedures. The manufactured test geometries were visually and dimensionally assessed for this failure mode. In total, four test geometries were rejected post-build. One such rejection was deemed correctable so only three replacement parts were manufactured. Failure mode 3: Material failure
The final failure mode investigates the classical manufacturing defect of non-conformance to material specification. This aspect is investigated in terms of variation in material mechanical properties exhibited by tensile coupons included in each build experiment. As all assessed test coupons, 56 in total, satisfied the requirements, this failure model was ignored in the resulting cost model. This result indicates process stability from a materials standpoint.
Close-up image of the result of a build failure event.

EPSRC Centre for Innovative Manufacturing in Additive Manufacturing
13
The economics of 3DP: A total cost perspective – Project Report
13
Table 4: Identified modes of build failure
Failure mode 1. Outright build failure 2. Post-build part rejection 3. Material failure
ConsequenceLoss of entire build, all contained parts are
written offLoss of individual parts
Loss of entire build, all contained parts are written off
Number of occurences 4 events 4 parts None
Model elementProbability of build failure as a function of
cumulative number of depositable layers (N)Constant probability of part rejection
due to identical test geometriesN/A
SpecificationCumulative distribution function (CDF) P(N)
of normal distribution with mean μ and standard deviation σ
Fixed probability of rejection preject N/A
Estimated parameters μ = 4040.75, σ = 3267.95 preject = 0.07 N/A
Following the identification of build failure modes, it was possible to associate such events with elements of the total cost model. As implicit in the process map, shown in Figure 2, the consequences arising from outright build failure affect only a subset of elements of the overall AM process chain.
As all process failure occurring in the experimental part of this work arose during material deposition within the core AM process, it was assumed that the probability of outright build failure is determined by the number of consecutively completed layers, possibly across multiple successive builds. In order to incorporate this aspect into the cost model, it was further assumed that the cumulative number of successfully depositable layers until build failure, N, follows the normal distribution. Analysis of four outright failure events, which is a very limited number of observations, allowed the estimation of the distribution mean at 4041 consecutively deposited layers and a standard deviation of 3268. On this basis, a cumulative distribution function P(N | μ,σ) was formulated, allowing the determination of the probability of build failure as a function of the number of depositable layers.
A further qualification that must be stated is that this research treats the probabilistic term of outright build failure P(N | μ,σ) as unrelated to the product geometry contained within the build and as independent of the risk of part rejection preject occurring after the build has been completed. This also implies that the effect of location within the available build volume on part quality, and hence risk of rejection, is ignored. All of these aspects form necessary simplifications at this point in time, but should be subject to further research into the nature of build failure modes.
14
Learning effects
14
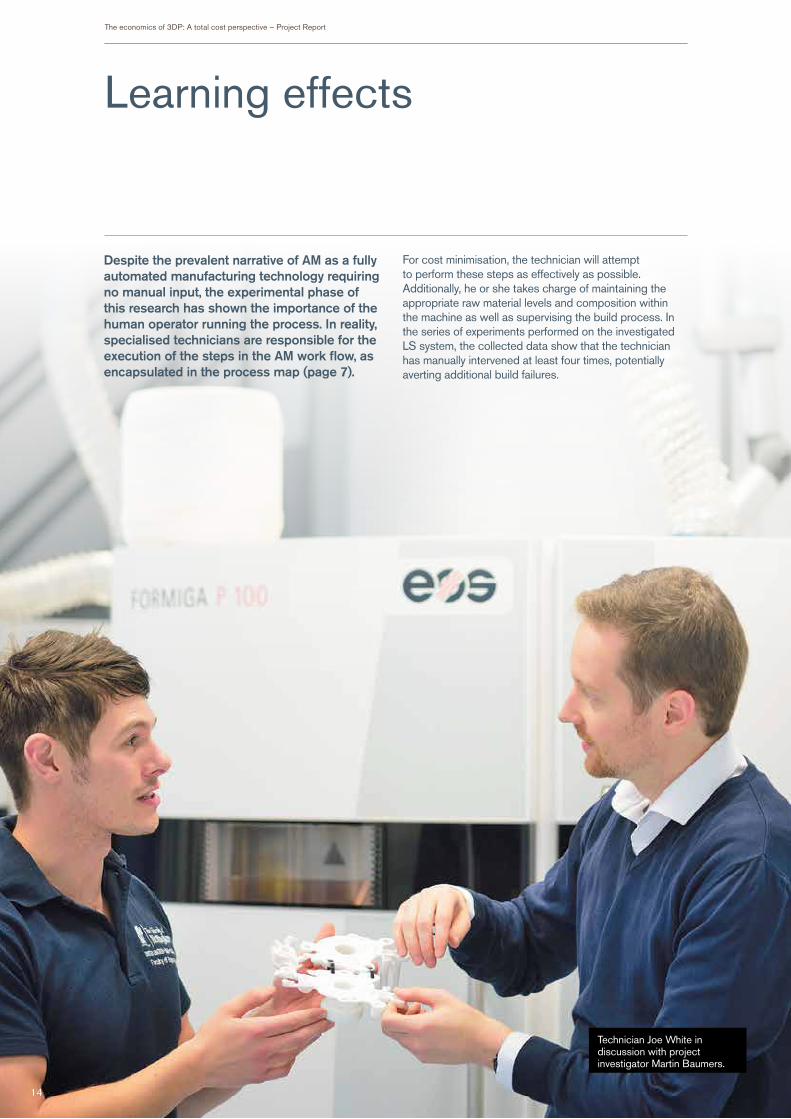
Despite the prevalent narrative of AM as a fully automated manufacturing technology requiring no manual input, the experimental phase of this research has shown the importance of the human operator running the process. In reality, specialised technicians are responsible for the execution of the steps in the AM work flow, as encapsulated in the process map (page 7).
For cost minimisation, the technician will attempt to perform these steps as effectively as possible. Additionally, he or she takes charge of maintaining the appropriate raw material levels and composition within the machine as well as supervising the build process. In the series of experiments performed on the investigated LS system, the collected data show that the technician has manually intervened at least four times, potentially averting additional build failures.
The economics of 3DP: A total cost perspective – Project Report
Technician Joe White in discussion with project investigator Martin Baumers.

EPSRC Centre for Innovative Manufacturing in Additive Manufacturing
15
The economics of 3DP: A total cost perspective – Project Report
Figure 5: Makespan of ten identical experiments
1600
1400
1200
1000
800
600
400
200
0
Experiment 1
Experiment 6
Experiment 8
Experiment 9
Experiment 10
Experiment 12
Experiment 13
Experiment 14
Experiment 15
Experiment 16
Mak
espa
n, in
min
15
ConclusionAM technologies represent a significant opportunity to develop products that previously could not be manufactured, an opportunity to make existing products better, and to customise products to specific needs. The economic case for adopting AM technologies, however, is as yet poorly understood.
To address this gap, we have developed a total cost model for AM processes and measured its key variables in a series of experiments. As machine technology advances and aspects such as process stability and material cost improve further, the economic case for AM is likely to improve. The value of the parameters in our model are thus likely to change over time, however the model itself will remain valid.
Beyond presenting a comprehensive picture of the process economics of LS, we have furthermore shown that AM technologies indeed allow for the cost-efficient creation of product variety. Traditional manufacturing assumes that one can exploit learning curve effects (process improvement) by repeating the process. In our experiments we have shown that – once the technology is utilised effectively in terms of build volume utilisation - AM processes do not benefit from repetition. The unit costs do not decrease in relation to the repetition of the manufacturing process.
In other words, a central characteristic of traditional manufacturing is indeed absent in AM processes, which provides strong empirical evidence for one of the key claims underpinning the economics of AM technology: variety can be produced at zero marginal cost.
Aside from the direct involvement with machine operation, the technician also performs a production planning function, pooling build requirements to determine build configurations and specifying support structures where necessary. In some cases, the technician has additional discretion in scheduling the machine and deciding the length of the cool down procedure.
An interesting result from this project relates to the technician’s productivity. This aspect can be surveyed by comparing the total process chain duration (makespan) for each of the ten identical build experiments that were carried out for this research, as summarised in Table 2.
A chart of these durations in chronological order, as drawn in Figure 5, does not exhibit a negative tendency that would be associated with improvements in productivity, or learning, over time. The insight from this result is that repetition does not appear to have an immediate effect on the makespan.
At the current stage, this may serve as an early indication of the potential absence of learning effects. However, this aspect may also be explained by the fact that the technicians operating the investigated systems are usually qualified expert operators with several years of experience and extensive training.

Martin BaumersAssistant Professor of Additive Manufacturing ManagementAdditive Manufacturing and 3D Printing Research GroupFaculty of Engineering The University of NottinghamNG7 2RD
t: +44 (0)115 951 3877e: [email protected]: www.nottingham.ac.uk/3dprg
Matthias HolwegProfessor of Operations ManagementSaïd Business SchoolUniversity of OxfordPark End StreetOxfordOX1 1HP
t: +44 (0)1865 614675e: [email protected]: www.sbs.ox.ac.uk
Jonathan RowleyDesign DirectorDigits2Widgets61 – 63 Rochester PlaceLondonNW1 9JU
t: +44 (0)20 3697 7969e: [email protected]: www.digits2widgets.com