Embed Size (px)
Citation preview
THE ECONOMICS OF AN ALTERNATIVE BIO-ENERGY FEEDSTOCK – THE CASE OF
JATROPHA CURCAS
By
MENG Y TEE
B.S., Kansas State University, 1997
A THESIS
Submitted in partial fulfillment of the requirements
for the degree
MASTER OF AGRIBUSINESS
Department of Agricultural Economics
College of Agriculture
KANSAS STATE UNIVERSITY
Manhattan, Kansas
2009
Approved by:
Major Professor
Dr. Vincent Amanor-Boadu
ABSTRACT
Biofuels such as ethanol and biodiesel are looked upon as the future source of alternative
energy. These biofuels will supplement the needs of the ever increasing demand for fuel.
Bio-energy feedstock is in high demand and current bio-crude oil prices such as soybeans
and palm oil are higher than fossil fuel crude oil prices. Unless the price of fossil fuel crude
oil increases beyond that, it would not be economically viable to produce biofuels from
these feedstock.
Jatropha curcas has been touted as the future of biodiesel. The seeds from the Jatropha
curcas are crushed and processed using transesterification. The product of the chemical
reaction results in bio-oil and glycerin.
The objective of this paper is to study the economics of Jatropha curcas as an alternative
bio-energy feedstock. Comparisons are done on Jatropha curcas oil, soybean oil, and palm
oil. The Jatropha curcas industry is at its infancy, and crude Jatropha curcas oil is either
not available in the open market or extremely difficult to find in any significant amount.
However, soybean oil and crude palm oil are traded commodities and their prices are
dependent on their demand and supply pressures. Given these conditions, the approach
adopted here involved the establishment of a vertically integrated company that grows and
harvests the Jatropha curcas feedstock and crushes the seeds to obtain the crude oil, and
finally processes it to obtain biodiesel and glycerin.

The financial analysis provided results that indicate that the Jatropha curcas has the
potential to be a successful feedstock. The conclusion after conducting net present value
comparisons shows that the price per kilogram of the Jatropha curcas seed would be the
determining factor in the success of this bio-fuel feedstock. As more work goes into the
genetic selection of Jatropha curcas for high yield varieties, the feedstock’s potential
increases and its potential as a solution to the search for the competitive sources of
biodiesel becomes more real.

iv
TABLE OF CONTENTS
List of Figures ......................................................................................................................... vi
List of Tables ......................................................................................................................... vii
Acknowledgments ................................................................................................................ viii
CHAPTER 1: INTRODUCTION ......................................................................................... 1
1.1 Introduction .................................................................................................................. 1
1.2 Research problem and research question ..................................................................... 3
1.3 Objectives ..................................................................................................................... 4
1.4 Methods ........................................................................................................................ 4
1.5 Thesis Outline ............................................................................................................... 5
CHAPTER 2: LITERATURE REVIEW ............................................................................ 6
2.1 Jatropha Curcas and its Uses ...................................................................................... 6
2.2 Chemistry and Toxicity .............................................................................................. 11
2.3 Diesel .......................................................................................................................... 12
2.4 Biodiesel ..................................................................................................................... 15
2.5 Bio-fuel Feedstock Comparisons ............................................................................... 18
CHAPTER 3: DATA, ASSUMPTIONS, METHODS, HYPOTHESES AND
MODELS ............................................................................................................................... 27
3.1 Introduction ................................................................................................................ 27
3.2 Net Present Value (NPV) and Internal Rate of Return (IRR) ................................... 27
3.3 Data ............................................................................................................................. 28
3.4 Assumptions ............................................................................................................... 29
3.5 Hypothesis .................................................................................................................. 34
CHAPTER 4: DATA AND RESULTS .............................................................................. 35
4.1 Data ............................................................................................................................. 35
4.2 Feedstock Production ................................................................................................. 35
4.2.1 Soybean Feedstock Production ......................................................................... 35 4.2.2 Jatropha Curcas Feedstock Production ............................................................. 36 4.2.3 Oil Palm Feedstock Production ........................................................................ 38
v
4.3 Results- Biodiesel Production .................................................................................... 39
4.3.1 Soybeans – Biodiesel Production ..................................................................... 39 4.3.2 Oil Palm - Biodiesel Production ....................................................................... 41 4.3.3 Jatropha Curcas - Biodiesel Production ........................................................... 42
4.4 NPV Results and Analysis ......................................................................................... 44
4.4.1 Sensitivity Analyses .......................................................................................... 47 4.4.2 Effect of Seed Cost on NPV ............................................................................. 48
CHAPTER 5: SUMMARY AND CONCLUSIONS ........................................................ 50
REFERENCES ..................................................................................................................... 53
APPENDIX 1: Jatropha curcas Planting Schedule........................................................... 57
APPENDIX 2: Soybean Feedstock Production Data 1997 - 2010 .................................. 58
APPENDIX 3: GRYE Jatropha curcas Feedstock Production Data .............................. 59
APPENDIX 4: 50,000 Hectare Jatropha curcas Feedstock Production ........................ 60
APPENDIX 5: Jatropha curcas Biodiesel Data ................................................................. 61
APPENDIX 6: Conversions ................................................................................................. 62
APPENDIX 7: Jatropha curcas Yield ................................................................................. 63
APPENDIX 8: Palm Oil Feedstock Production Data ...................................................... 64
APPENDIX 9: Soybean Monthly Biodiesel Data ............................................................. 65
APPENDIX 10: Crude Soybean Oil, Crude Palm Oil, and Crude Oil (Fossil)
Historical Prices – 25 years (Monthly) from October 1984 to September 2009 ........... 66
APPENDIX 11: Soybean Biodiesel Data ........................................................................... 67
APPENDIX 12: Jatropha curcas Biodiesel Data Year 1 to Year 5 from GRYE
(Philippines) ........................................................................................................................... 68
APPENDIX 13: Palm Oil Biodiesel Data ........................................................................... 69
APPENDIX 14: Summary of Biodiesel Production, Annual Profits/(Loss) and NPV
Using Jatropha curcas, Oil Palm, and Soybeans at 30 million gallons per year
Production ............................................................................................................................. 70
vi
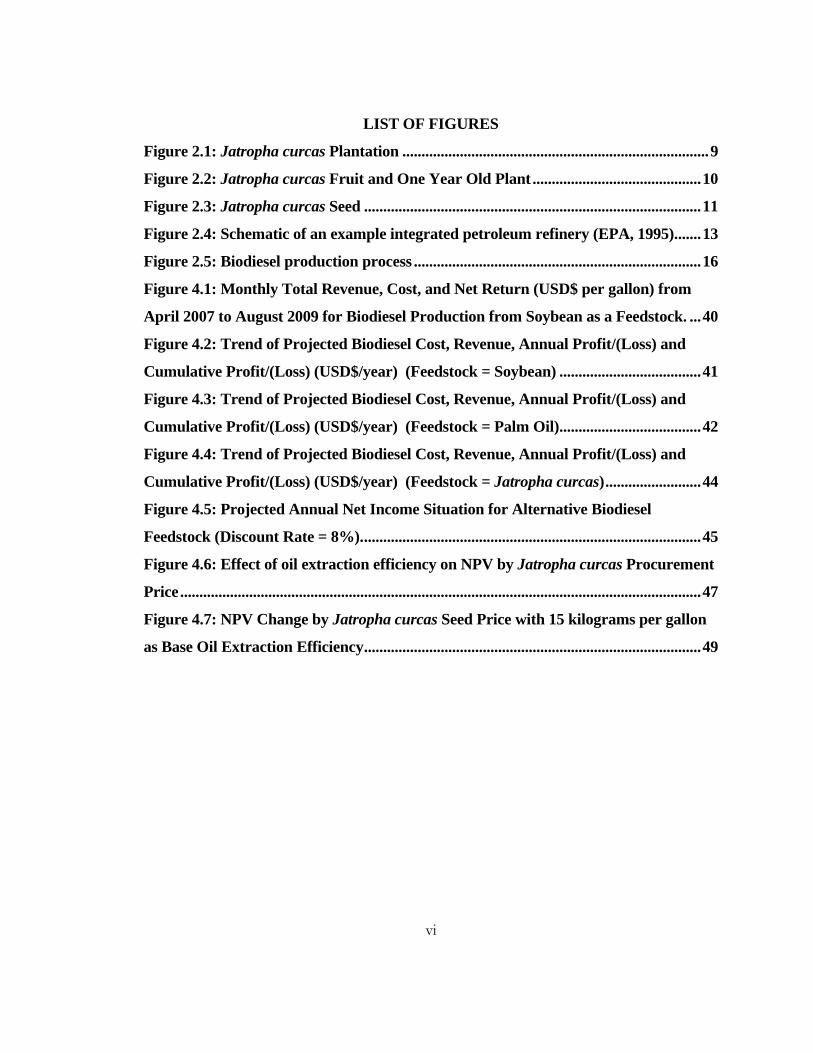
LIST OF FIGURES
Figure 2.1: Jatropha curcas Plantation ................................................................................ 9
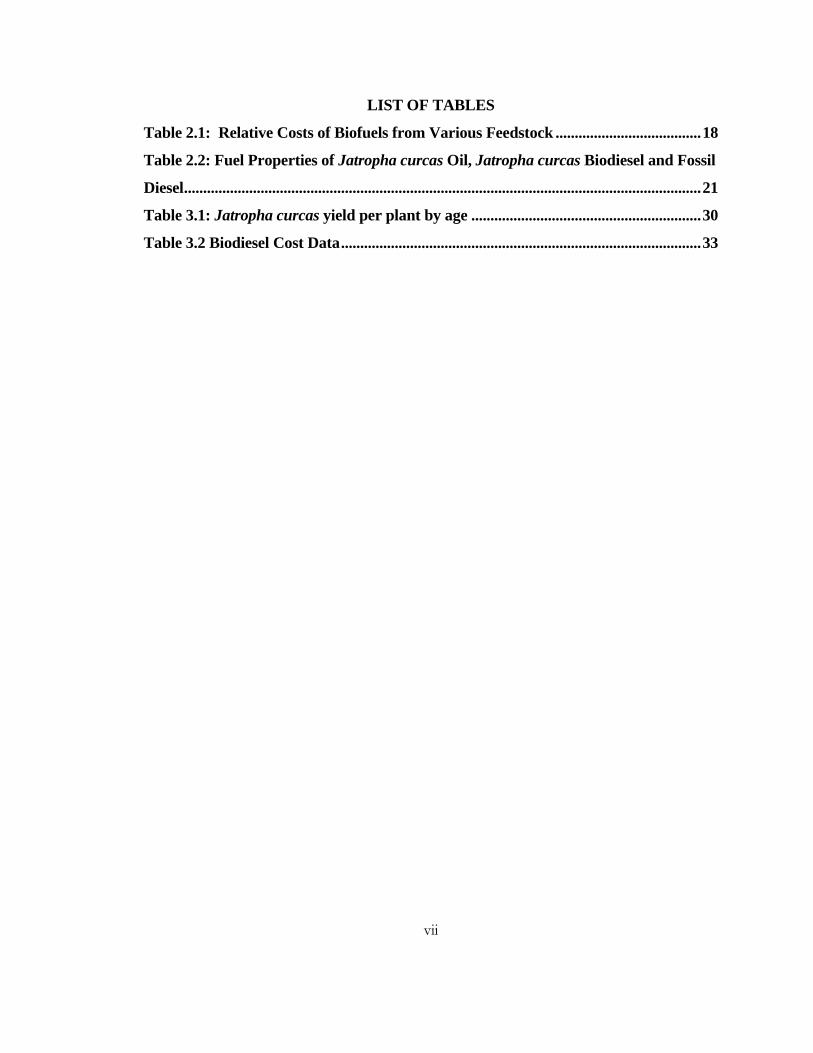
Figure 2.2: Jatropha curcas Fruit and One Year Old Plant ............................................ 10
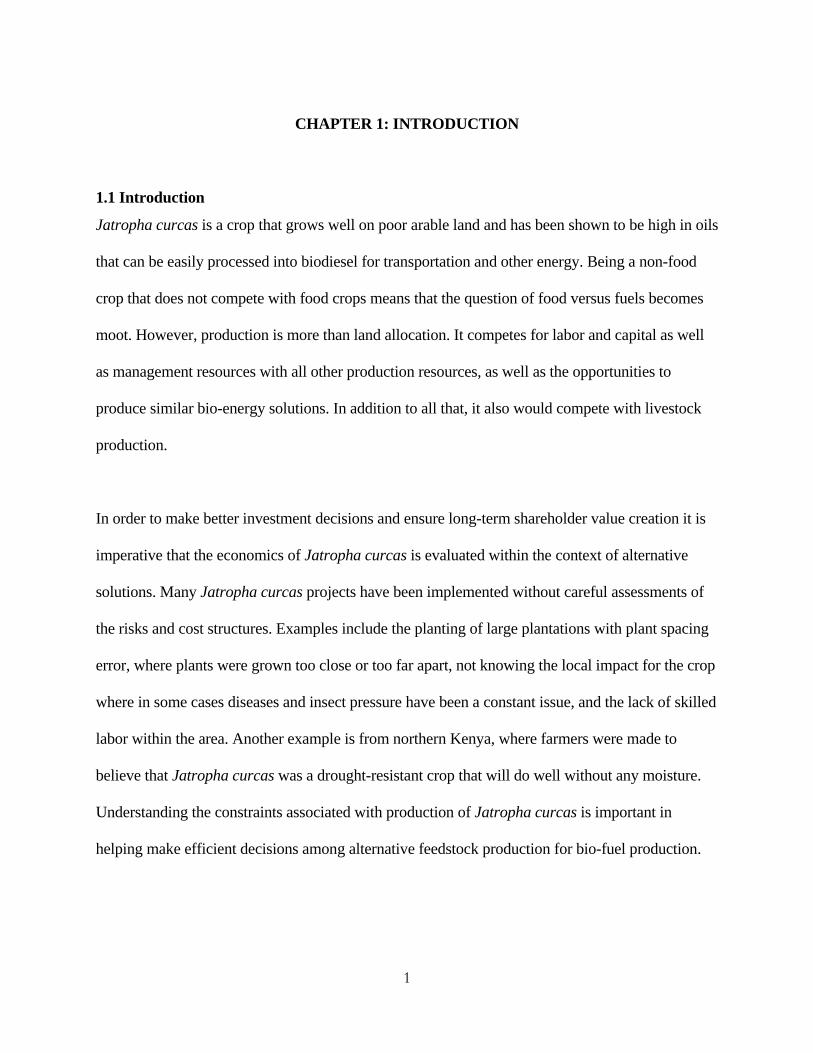
Figure 2.3: Jatropha curcas Seed ........................................................................................ 11
Figure 2.4: Schematic of an example integrated petroleum refinery (EPA, 1995). ...... 13
Figure 2.5: Biodiesel production process ........................................................................... 16
Figure 4.1: Monthly Total Revenue, Cost, and Net Return (USD$ per gallon) from
April 2007 to August 2009 for Biodiesel Production from Soybean as a Feedstock. ... 40
Figure 4.2: Trend of Projected Biodiesel Cost, Revenue, Annual Profit/(Loss) and
Cumulative Profit/(Loss) (USD$/year) (Feedstock = Soybean) ..................................... 41
Figure 4.3: Trend of Projected Biodiesel Cost, Revenue, Annual Profit/(Loss) and
Cumulative Profit/(Loss) (USD$/year) (Feedstock = Palm Oil) ..................................... 42
Figure 4.4: Trend of Projected Biodiesel Cost, Revenue, Annual Profit/(Loss) and
Cumulative Profit/(Loss) (USD$/year) (Feedstock = Jatropha curcas) ......................... 44
Figure 4.5: Projected Annual Net Income Situation for Alternative Biodiesel
Feedstock (Discount Rate = 8%). ........................................................................................ 45
Figure 4.6: Effect of oil extraction efficiency on NPV by Jatropha curcas Procurement
Price ........................................................................................................................................ 47
Figure 4.7: NPV Change by Jatropha curcas Seed Price with 15 kilograms per gallon
as Base Oil Extraction Efficiency ........................................................................................ 49
vii
LIST OF TABLES
Table 2.1: Relative Costs of Biofuels from Various Feedstock ...................................... 18
Table 2.2: Fuel Properties of Jatropha curcas Oil, Jatropha curcas Biodiesel and Fossil
Diesel ....................................................................................................................................... 21
Table 3.1: Jatropha curcas yield per plant by age ............................................................ 30
Table 3.2 Biodiesel Cost Data .............................................................................................. 33

viii
ACKNOWLEDGMENTS The MAB program at Kansas State University provided the opportunity for me to return to
my Alma Mater once again to further my education and knowledge. It took me a good 2
years before I decided to take the challenge to pursue K-State’s Masters in Agribusiness
program. My greatest appreciation to Lynnette and Mary for being persistent and following
up with me to start the program during those 2 years.
I wish to thank the MAB staff and faculty and especially Dr. Vincent Amanor-Boadu for
the support and efforts for the last three years. During that time, it was a pleasure working
with everyone in the MAB family. The challenges faced included lots of late nights and
early mornings, juggling time with family-work-studies, and for me, a near fatal blood
infection. If not for the MAB family of staff, faculty, and classmates helping out for the
time lost while I was recovering, I would not have been able to complete this program.
To Rick…a lifelong friend gained. Indeed an honor. Thank you for keeping me on track
with the program. It would have been difficult to stay up late working on assignments or
waking up early for class if not for another California guy “bugging” me to stay awake or
to wake up early.
To my dear parents, for always being so caring and encouraging, despite the distance – you
both managed to provide the peace of mind for me to take on this challenge.

ix
To my wonderful wife, Mag (also a Wildcat), who has been so patient and supportive –
love you lots. Thank you for being so strong when I was down with the blood infection,
and for caring for me when I wasn’t able to. To baby Zara – you have been such a good
baby, you slept well, ate well, hardly cried during the nights. You definitely took the stress
away – not just taking care of you but stress from everything else.
1
CHAPTER 1: INTRODUCTION
1.1 Introduction
Jatropha curcas is a crop that grows well on poor arable land and has been shown to be high in oils
that can be easily processed into biodiesel for transportation and other energy. Being a non-food
crop that does not compete with food crops means that the question of food versus fuels becomes
moot. However, production is more than land allocation. It competes for labor and capital as well
as management resources with all other production resources, as well as the opportunities to
produce similar bio-energy solutions. In addition to all that, it also would compete with livestock
production.
In order to make better investment decisions and ensure long-term shareholder value creation it is
imperative that the economics of Jatropha curcas is evaluated within the context of alternative
solutions. Many Jatropha curcas projects have been implemented without careful assessments of
the risks and cost structures. Examples include the planting of large plantations with plant spacing
error, where plants were grown too close or too far apart, not knowing the local impact for the crop
where in some cases diseases and insect pressure have been a constant issue, and the lack of skilled
labor within the area. Another example is from northern Kenya, where farmers were made to
believe that Jatropha curcas was a drought-resistant crop that will do well without any moisture.
Understanding the constraints associated with production of Jatropha curcas is important in
helping make efficient decisions among alternative feedstock production for bio-fuel production.

2
Bio-fuel refers to fuel derived from renewable biological feedstock such as biomass from living
plants, animals and/or their by-products. Traditional bio-fuel consists of animal dung, wood, saw
dust and charcoal. These have been limited to producing cooking energy and home heating and
continue to be important sources of energy in Africa and Asia, providing between 70 and 90
percent of rural energy (Kgathi and Zhou, 1995, Ramachandra et al., 2004). New biofuels are
being explored today for transportation and other uses, and these include energy from ethanol and
bio-diesel. In recent decades, modern biofuels have become important sources of electricity and
transport fuels in some parts of the world.
The seed of Jatropha curcas is the source of oil in the plant. This oil can be processed into
biodiesel and its by-products processed into fuel pellets, fertilizer and soap products (glycerin).
However, if Jatropha curcas is to be used as a source of bio-fuel successfully, then it has to be
done responsibly. As a new feedstock, and given its agronomic flexibility in growing areas and
requirements, its success will depend on careful assessment of its potential against competing
feedstock and in the education of its supply chain from farmers to oil executives.
The use of food-based feedstock (e.g., corn and soybean) to produce biofuels such as ethanol and
bio-diesel has become increasingly controversial. For example, it has been argued that the increase
in corn prices in the last few years was due to the increased demand created by ethanol, and this
price increase contributed to increasing food security risks in poor countries. However, there are
counter arguments that the increase in commodity food prices was not caused by the derived
demand for commodities by bio-fuel producers but simply due to the absurdly high prices of
petroleum and the natural economic pressures that cause prices to go up.
3
It is possible to eliminate, or at least reduce, the connection between the pursuit of alternative
energy sources and the food price fluctuations by searching for and introducing alternative
feedstock that are non-food. Such is the case with Jatropha curcas. Being a non-food product
which does well on poor lands and in low moisture environments, it has the potential to be a
successful alternative to soybean oil, rapeseed oil, palm oil, castor oil, and cotton seed oil that are
the primary feedstock in biodiesel production.
1.2 Research problem and research question
As a result of the controversy surrounding the use of food products in the production of bio-energy,
many investors are jumping on the non-food sources of bio-fuel feedstock without careful
assessment of their economic feasibility. This feasibility stretches from production economics
through logistics and processing economics. It also encompasses the use economics, in the sense
that the assumption of equal energy potential of products from all feedstock sources may be false,
and hence must be evaluated. Additionally, there is a need for assessment of the organizations’
structures to support the effective exploitation of an alternative feedstock.
Being a new feedstock, Jatropha curcas suffers from this lack of adequate information on its
economics as a bio-fuel feedstock. This is, therefore, the problem that this research seeks to
address, i.e., provide more information on the economics of Jatropha curcas as an alternative
feedstock in the bio-fuel marketplace. The research question is as follows: What are the net
economic advantages of Jatropha curcas over other feedstock for biodiesel production and are
they large enough to warrant investment?

4
1.3 Objectives
The overall objective of this research is to conduct an economic analysis of Jatropha curcas as an
alternative biodiesel feedstock. The specific objectives are as follows:
a) Evaluate the physical characteristics of Jatropha curcas and compare them to its principal
feedstock competitors.
b) Analyze the economics of producing biodiesel from Jatropha curcas and compare it to that
of selected alternative feedstock – oil palm and soybean.
1.4 Methods
The principal method for this thesis is Net Present Value (NPV) analysis, from primary production
through processing to distribution levels of the supply chain. The analysis is based on the end-use
value of the biodiesel produced. The research uses secondary sources and knowledgeable people in
the industry are interviewed for critical perspectives on the Jatropha curcas as well as the biodiesel
industry.
Econometric analysis is employed to determine the effect of certain production variables on the
economic viability of Jatropha curcas vis-à-vis oil palm. This method allows for the assessment
of the extent to which specific product characteristics and production variables create economic
opportunities for alternative feedstock materials.
5
1.5 Thesis Outline
The next chapter presents the literature review encompassing discussion of what Jatropha curcas
is, its agronomy, chemistry, and other scientific characteristics of Jatropha curcas compared to
regular diesel as well as an overview of the diesel market.
In Chapter 3, the data, methods, models and hypotheses are, presented and discussed. The results
of the analyses are presented and discussed in Chapter 4, and the final chapter focuses on providing
a summary of the study, conclusions emanating from it and some recommendations on how to
effectively introduce Jatropha curcas as an alternative feedstock in biodiesel production.
6
CHAPTER 2: LITERATURE REVIEW
In this chapter, an overview of the biodiesel market is presented, with specific focus on feedstock
going into the production of renewable fuel products. The characteristics and agronomy of
Jatropha curcas are also presented. The chapter also reviews the studies that have thus far been
conducted on the economics of bio-fuel production, focusing on biodiesel products from feedstock
such as soybean and palm oil.
2.1 Jatropha Curcas and its Uses
Jatropha curcas is a perennial plant belonging to the Euphorbiaceae family. It is commonly
known as the physic nut. More common plants in the euphorbiaceae family include the rubber tree
(hevea brasiliensis), cassava, castor oil plant, and the poinsettia plant. Jatropha curcas is native to
Central America and the Caribbean. It has always been looked upon as a multipurpose plant that is
drought resistant. Among the most common function of the Jatropha curcas is its use as fencing as
it prevents animals from getting through when planted close together. If carefully planted,
Jatropha curcas hedges not only protect gardens from hungry livestock but also reduce damage
and erosion from wind and water (Henning, 1998).
According to Ochse (1980), "the young leaves may be safely eaten, steamed or stewed." They are
favored for cooking with goat meat, said to counteract the peculiar smell. Though purgative, the
nuts are sometimes roasted and eaten, a risk taken even with the knowledge of its toxicity. In India,
pounded leaves are applied near horses' eyes to repel flies. The oil has been used for illumination,
soap, candles, adulteration of olive oil, and making Turkey red oil. Nuts can be strung on grass and
7
burned like candlenuts (Watt and Breyer-Brandwijk, 1962). Mexicans grow the shrub as a host for
the lac insect or more commonly known as mealy bug. The secretions produced by the insect and
the plant is then harvested and processed to obtain varnish or shellac type material. Ashes of the
burned root are used as a salt substitute (Morton, 1981). Agaceta et al. (1981) conclude that it has
strong molluscicidal activity. Duke and Wain (1981) list it for homicide, piscicide, and raticide as
well. The latex was strongly inhibitory to watermelon mosaic virus (Tewari and Shukla, 1982).
The bark may be used as a fish poison (Watt and Breyer-Brandwijk, 1962). In South Sudan, the
seed as well as the fruit is used as a contraceptive (List and Horhammer, 1969–1979) and its sap
stains linen, and can, therefore, be used for marking (Mitchell and Rook, 1979).
According to Hartwell (1971), the extracts of Jatropha curcas are used in folk remedies for cancer.
Reported to be abortifacient, anodyne, antiseptic, cicatrizant, depurative, diuretic, emetic,
hemostat, lactagogue, narcotic, purgative, rubefacient, styptic, vermifuge, and vulnerary, physic
nut is a folk remedy for alopecia, anasorca, ascites, burns, carbuncles, convulsions, cough,
dermatitis, diarrhea, dropsy, dysentery, dyspepsia, eczema, erysipelas, fever, gonorrhea, hernia,
incontinence, inflammation, jaundice, neuralgia, paralysis, parturition, pleurisy, pneumonia, rash,
rheumatism, scabies, sciatica, sores, stomachache, syphilis, tetanus, thrush, tumors, ulcers, uterosis,
whitlows, yaws, and yellow fever (Duke and Wain, 1981; List and Horhammer, 1969–1979). Its
latex may be applied topically to bee and wasp stings (Watt and Breyer-Brandwijk, 1962). It also
has specific use in different cultures. For example, Mauritians massage ascitic limbs with the oil
and Cameroonians apply the leaf decoction in arthritis (Watt and Breyer-Brandwijk, 1962).
Colombians drink the leaf decoction for venereal disease (Morton, 1981) while Bahamans drink
the decoction for heartburn. Costa Ricans poultice leaves onto erysipelas and splenosis and
8
Guatemalans place heated leaves on the breast as a lactagogue. Cubans apply the latex to toothache
while Colombians and Costa Ricans apply the latex to burns, hemorrhoids, ringworm, and ulcers.
Barbadians use the leaf tea for marasmus, Panamanians use it for jaundice and Venezuelans take
the root decoction for dysentery (Morton, 1981).
Jatropha curcas seeds are used also for dropsy, gout, paralysis, and skin ailments (Watt and
Breyer-Brandwijk, 1962). While its leaves are regarded as antiparasitic, applied to scabies;
rubefacient for paralysis, rheumatism; also applied to hard tumors (Hartwell, 1971). Perry (1980)
reports that its latex is used to dress sores and ulcers and inflamed tongues while its seed is viewed
as aperient; the seed oil emetic, laxative, purgative, for skin ailments. Root is used in decoction as a
mouthwash for bleeding gums and toothache. Otherwise used for eczema, ringworm, and scabies
(Perry, 1980; Duke and Ayensu, 1984). Four antitumor compounds, including jatropham and
jatrophone, are reported from other species of Jatropha (Duke and Ayensu, 1984). The crop is
homeopathically used for cold sweats, colic, collapse, cramps, cyanosis, diarrhea, leg cramps.
2.2 Agronomy of the Jatropha curcas
The Jatropha curcas is a small tree with a gray bark which releases white watery latex when cut.
Under perfect conditions the plant might grow to a height of 20 to 30 feet, but most commonly the
plant would grow to 9 to 15 feet. The fruits may produce several crops during the year if conditions
are right. The inflorescences yield a bunch of 10 or more ovoid fruits which have a fleshy exocarp
which turns yellow and dries, the fruit matures and so does the seed. There are three to four seeds
in the fruit and would eventually mature to dark oblong shaped seeds.
9
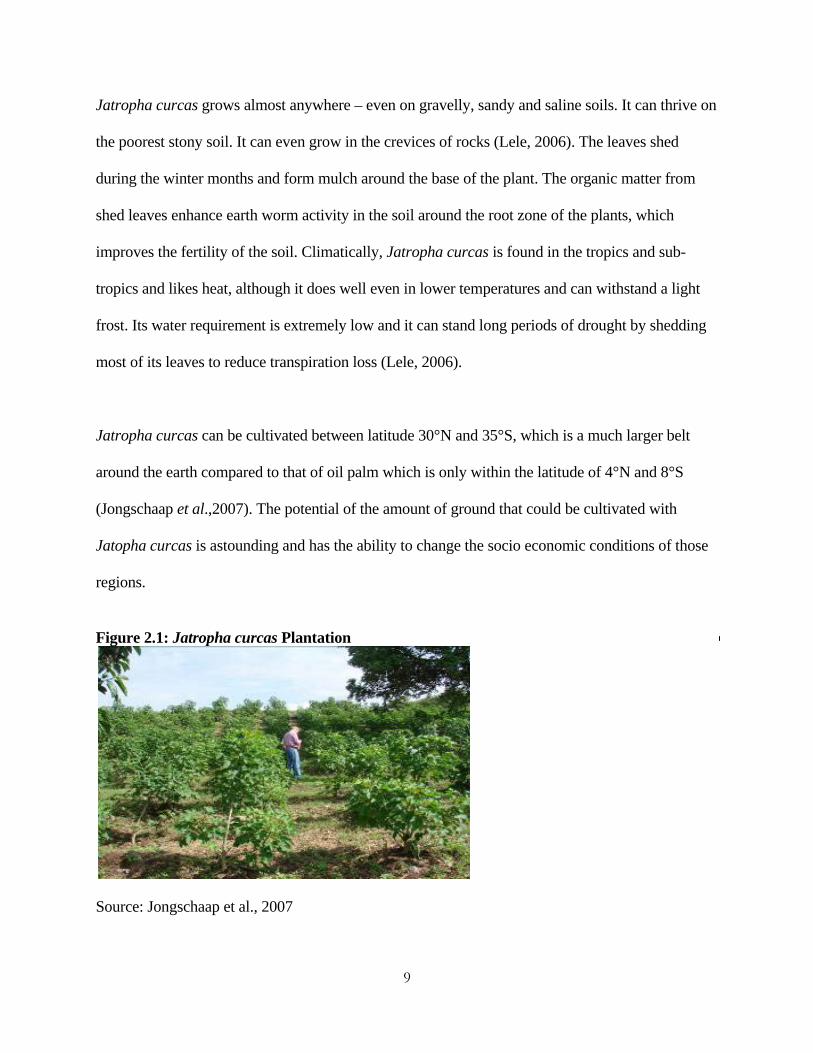
Jatropha curcas grows almost anywhere – even on gravelly, sandy and saline soils. It can thrive on
the poorest stony soil. It can even grow in the crevices of rocks (Lele, 2006). The leaves shed
during the winter months and form mulch around the base of the plant. The organic matter from
shed leaves enhance earth worm activity in the soil around the root zone of the plants, which
improves the fertility of the soil. Climatically, Jatropha curcas is found in the tropics and sub-
tropics and likes heat, although it does well even in lower temperatures and can withstand a light
frost. Its water requirement is extremely low and it can stand long periods of drought by shedding
most of its leaves to reduce transpiration loss (Lele, 2006).
Jatropha curcas can be cultivated between latitude 30°N and 35°S, which is a much larger belt
around the earth compared to that of oil palm which is only within the latitude of 4°N and 8°S
(Jongschaap et al.,2007). The potential of the amount of ground that could be cultivated with
Jatopha curcas is astounding and has the ability to change the socio economic conditions of those
regions.
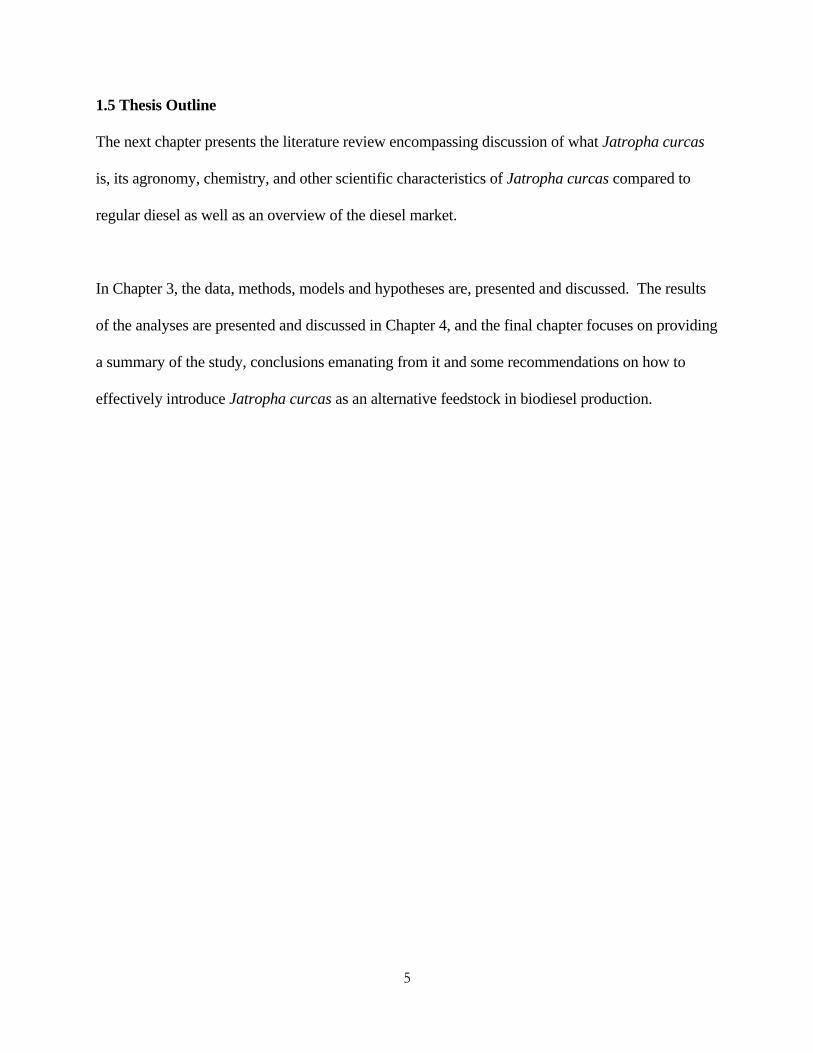
Figure 2.1: Jatropha curcas Plantation
Source: Jongschaap et al., 2007
10
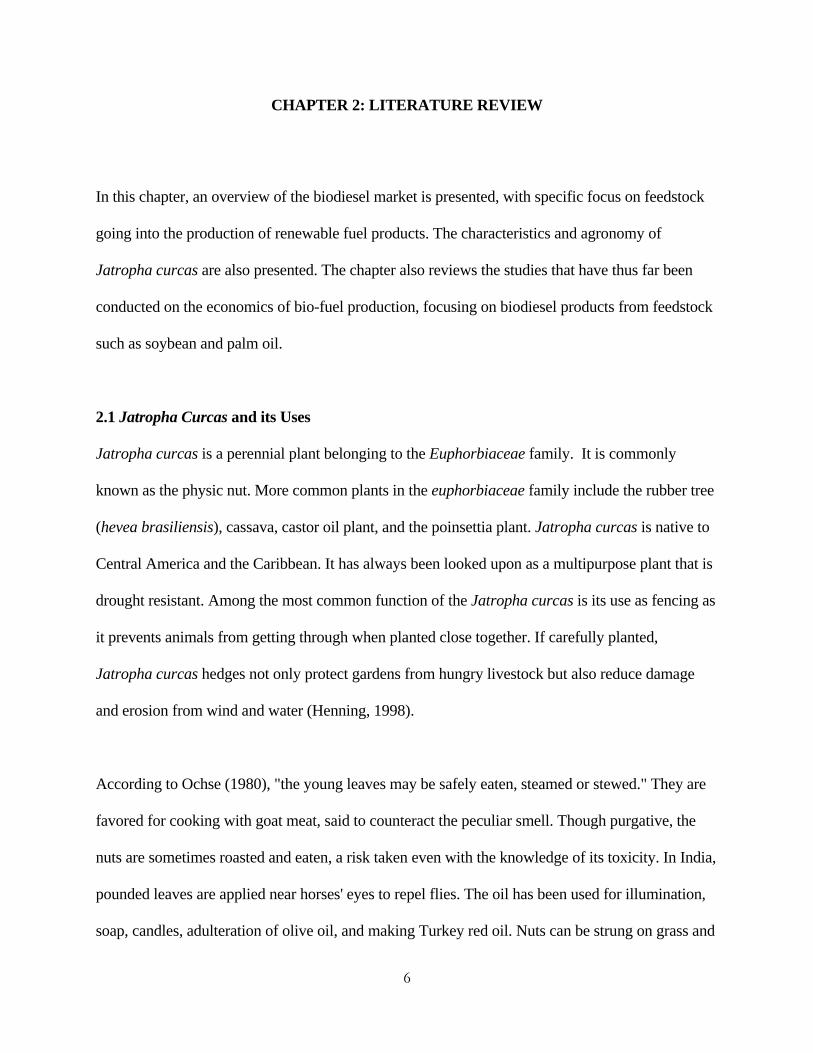
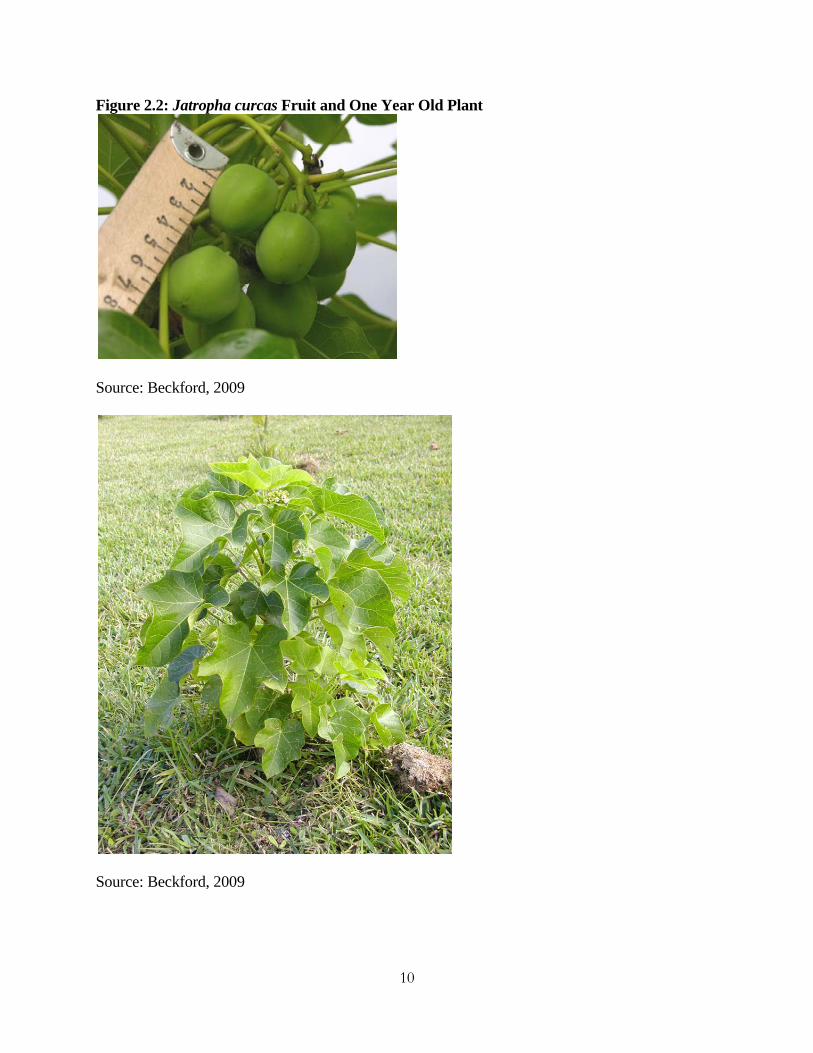
Figure 2.2: Jatropha curcas Fruit and One Year Old Plant
Source: Beckford, 2009
Source: Beckford, 2009

11
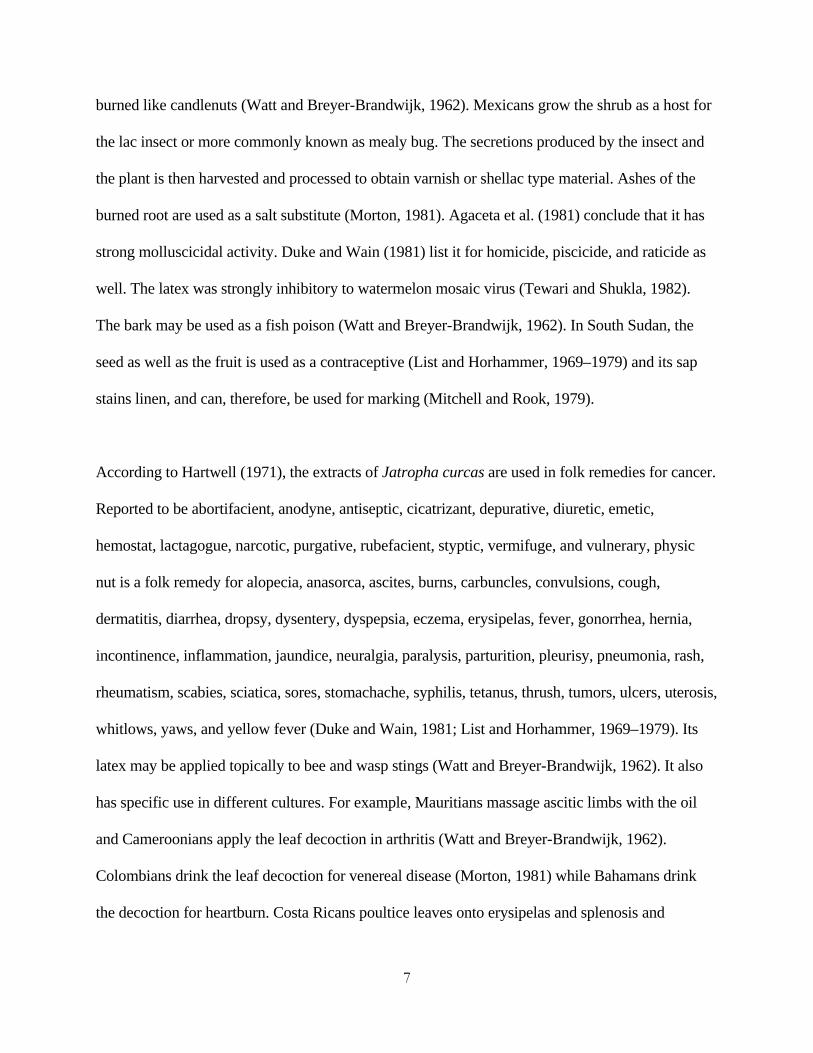
Figure 2.3: Jatropha curcas Seed
Source: Jongschaap et al., 2007
2.2 Chemistry and Toxicity
Per 100 g, the Jatopha curcas seed is reported to contain 6.6 g H2O, 18.2 g protein, 38.0 g fat, 33.5
g total carbohydrate, 15.5 g fiber, and 4.5 g ash (Duke and Atchley, 1983). Leaves, which show
anti leukemic activity, contain -amyrin, -sitosterol, stigmasterol, and campesterol, 7-keto--
sitosterol, stigmast-5-ene-3-, 7--diol, and stigmast-5-ene-3 , 7 -diol (Morton, 1981). Leaves
contain isovitexin and vitexin. From the nut, saccharose, raffinose, stachyose, glucose, fructose,
galactose, protein, and an oil, largely of oleic- and linoleic-acids (List and Horhammer, 1969–
1979), curcasin, arachidic-, linoleic-, myristic-, oleic-, palmitic-, and stearic-acids are also reported
(Perry, 1980).
The poisoning is an irritant, with acute abdominal pain and nausea about 1/2 hour following
ingestion. Diarrhea and nausea continue but are not usually serious. Depression and collapse may
occur, especially in children. Two seeds are strong purgative. Four to five seeds are said to have
caused death, but the roasted seed is said to be nearly innocuous. Bark, fruit, leaf, root, and wood
are all reported to contain HCN (Hydrogen Cyanide) (Watt and Breyer-Brandwijk, 1962). Seeds
contain the dangerous toxalbumin curcin, rendering them potentially fatally toxic.
12
2.3 Diesel
The "crude oil" pumped out of the ground is a black liquid called petroleum. This liquid contains
aliphatic hydrocarbons, or hydrocarbons. The carbon atoms link together in chains of different
lengths. Hydrocarbon molecules of different lengths have different properties and behaviors. For
example, methane, a gaseous molecule, is a chain with just one carbon atom in it (CH4) and is the
lightest chain. Methane is a gas so light that it floats like helium. As the chains get longer, they get
heavier. The first four chains -- CH4 (methane), C2H6 (ethane), C3H8 (propane) and C4H10 (butane)
-- are all gases, and they boil at -161, -88, -46 and -1 degrees F, respectively (-107, -67, -43 and -18
degrees C). The chains up through C18H32 or so are all liquids at room temperature, and the chains
above C19 are all solids at room temperature (HowStuffWorks.com, 2009).
Diesel fuel is about 18 percent heavier than gasoline and consists mainly of hydrocarbons that
range from C10 to C24. Gasoline, on the other hand, is usually in the C7 to C11 range, while
kerosene, used for jet engine fuel, is in the C12 to C15 range.
The petroleum refining industry converts crude oil into more than 2500 refined products,
including liquefied petroleum gas, gasoline, kerosene, aviation fuel, diesel fuel, fuel oils,
lubricating oils, and feedstock for the petrochemical industry. Petroleum refinery activities start
with receipt of crude for storage at the refinery, include all petroleum handling and refining
operations, and they terminate with storage preparatory to shipping the refined products from the
refinery. The petroleum refining industry employs a wide variety of processes. A refinery’s
processing flow is largely determined by the composition of the crude oil feedstock and the
chosen slate of petroleum products. The example refinery flow scheme presented in Figure 2.4
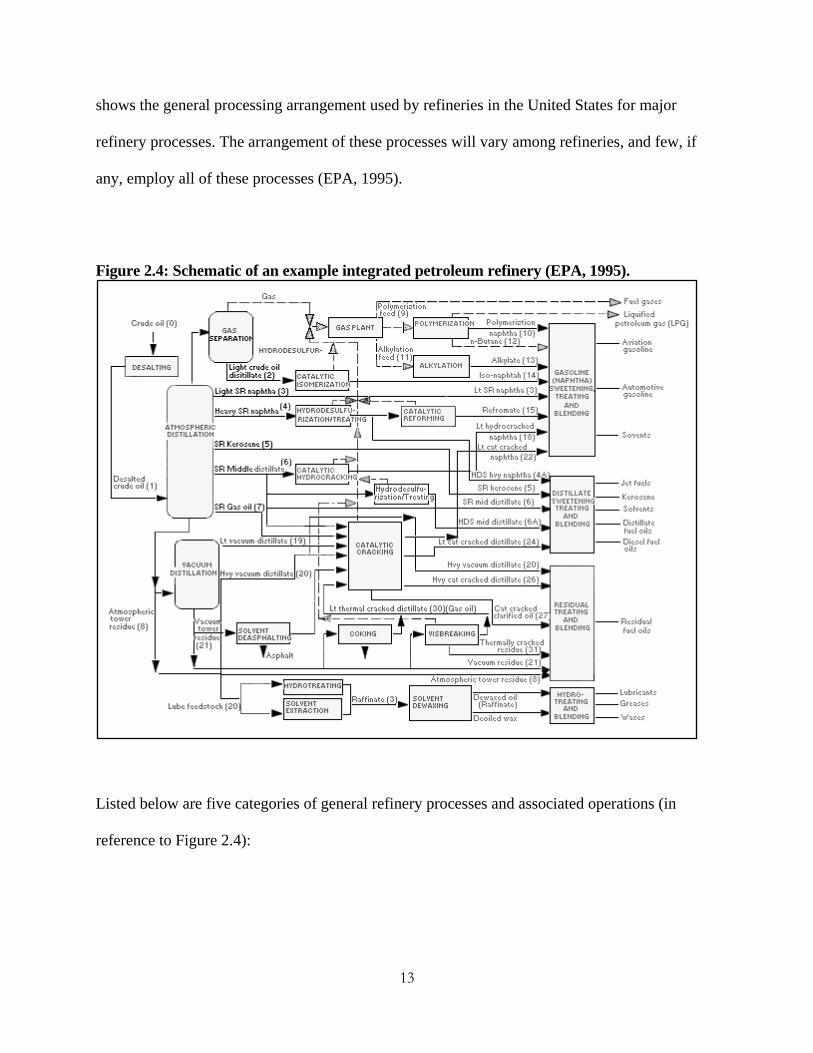
13
shows the general processing arrangement used by refineries in the United States for major
refinery processes. The arrangement of these processes will vary among refineries, and few, if
any, employ all of these processes (EPA, 1995).
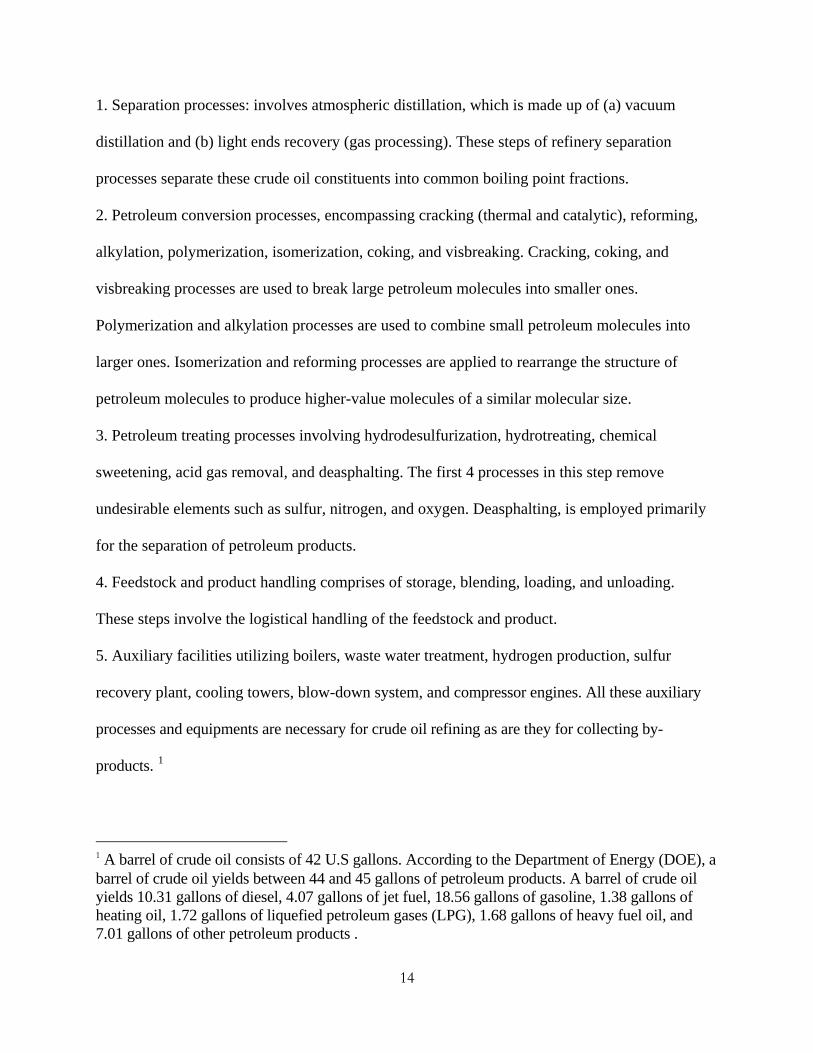
Figure 2.4: Schematic of an example integrated petroleum refinery (EPA, 1995).
Listed below are five categories of general refinery processes and associated operations (in
reference to Figure 2.4):
14
1. Separation processes: involves atmospheric distillation, which is made up of (a) vacuum
distillation and (b) light ends recovery (gas processing). These steps of refinery separation
processes separate these crude oil constituents into common boiling point fractions.
2. Petroleum conversion processes, encompassing cracking (thermal and catalytic), reforming,
alkylation, polymerization, isomerization, coking, and visbreaking. Cracking, coking, and
visbreaking processes are used to break large petroleum molecules into smaller ones.
Polymerization and alkylation processes are used to combine small petroleum molecules into
larger ones. Isomerization and reforming processes are applied to rearrange the structure of
petroleum molecules to produce higher-value molecules of a similar molecular size.
3. Petroleum treating processes involving hydrodesulfurization, hydrotreating, chemical
sweetening, acid gas removal, and deasphalting. The first 4 processes in this step remove
undesirable elements such as sulfur, nitrogen, and oxygen. Deasphalting, is employed primarily
for the separation of petroleum products.
4. Feedstock and product handling comprises of storage, blending, loading, and unloading.
These steps involve the logistical handling of the feedstock and product.
5. Auxiliary facilities utilizing boilers, waste water treatment, hydrogen production, sulfur
recovery plant, cooling towers, blow-down system, and compressor engines. All these auxiliary
processes and equipments are necessary for crude oil refining as are they for collecting by-
products. 1
1 A barrel of crude oil consists of 42 U.S gallons. According to the Department of Energy (DOE), a barrel of crude oil yields between 44 and 45 gallons of petroleum products. A barrel of crude oil yields 10.31 gallons of diesel, 4.07 gallons of jet fuel, 18.56 gallons of gasoline, 1.38 gallons of heating oil, 1.72 gallons of liquefied petroleum gases (LPG), 1.68 gallons of heavy fuel oil, and 7.01 gallons of other petroleum products .

15
2.4 Biodiesel
Biodiesel is obtained from the transesterification of vegetable oils. While this process has been
around since early 1800s and the first biodiesel was obtained from peanut oil, the first use in an
internal combustion engine was not until the Paris World Fair in 1900 (Nitske and Wilson, 1965).
Biodiesel is actually very simple to make. It is made by chemically altering the molecular structure
of any organic oil through the use of a chemical catalyst and an alcohol.
Technological improvements and better understanding of the transesterification processes have led
to improvements in efficiency in the production of biodiesel. The raw materials options for its
production have changed and increased.
The search for carbon neutral inputs makes the biodiesel increases the importance of plant sources
of feedstock, such as vegetables, because they release no more than the amount of carbon they
have and planting them absorbs the carbon again. Furthermore, their emissions are said to be
reduced by 60 percent compared to fossil-based diesel oil (Stockmangrassfarmer.com).
Virgin oil is vegetable oil that is usually grown and processed to produce biodiesel. Among the
types of virgin oils are soybean oil, rapeseed oil, mustard seed oil, algal oil, palm oil, and Jathropa
curcas oil. Recycled oil that had been used by restaurants as cooking oils can also be used to make
biodiesel. Yellow grease can also be used and it consists of used restaurant grease and animal fats.
16
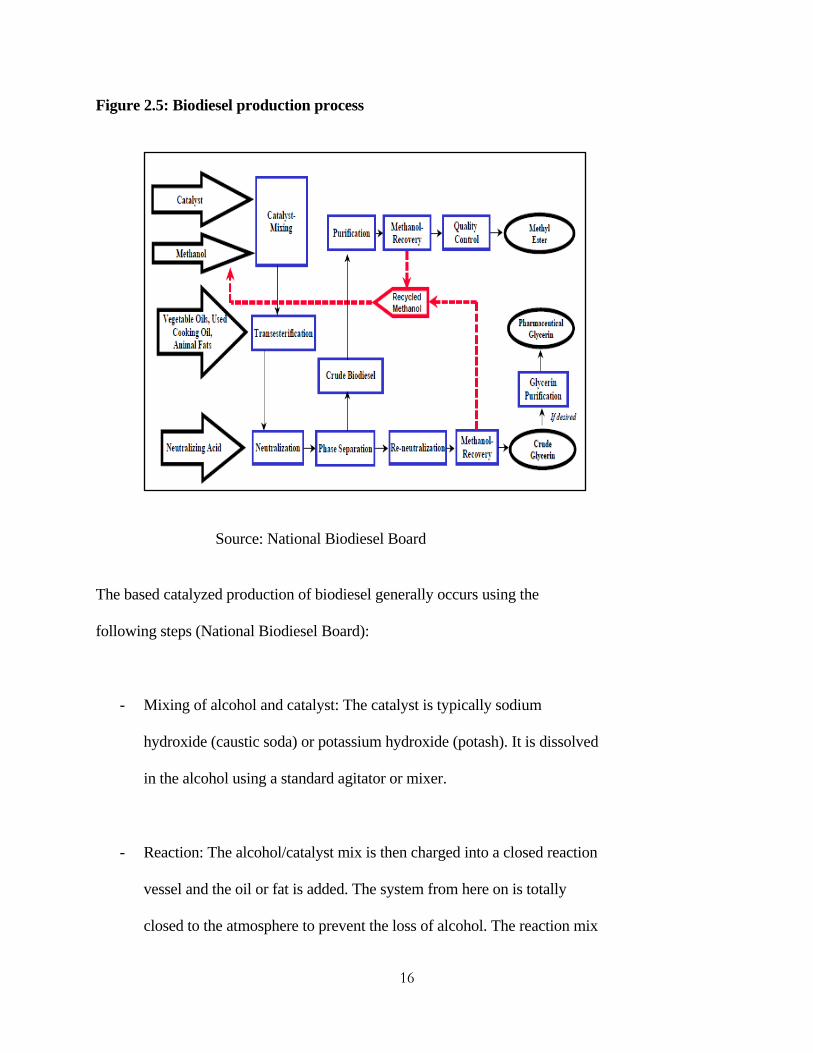
Figure 2.5: Biodiesel production process
Source: National Biodiesel Board
The based catalyzed production of biodiesel generally occurs using the
following steps (National Biodiesel Board):
- Mixing of alcohol and catalyst: The catalyst is typically sodium
hydroxide (caustic soda) or potassium hydroxide (potash). It is dissolved
in the alcohol using a standard agitator or mixer.
- Reaction: The alcohol/catalyst mix is then charged into a closed reaction
vessel and the oil or fat is added. The system from here on is totally
closed to the atmosphere to prevent the loss of alcohol. The reaction mix

17
is kept just above the boiling point of the alcohol (around 160°𝐹𝐹) to
speed up the reaction. Excess alcohol is normally used to ensure
complete conversion of the fat or oil to esters.
- Separation: Once the reaction is complete, two major products exist:
Glycerin and Biodiesel. Each has a substantial amount of the excess
methanol that was used in the reaction. The reacted mixture is
sometimes neutralized (if needed). The glycerin and biodiesel can be
separated by gravity with glycerin being drawn off the bottom of the
vessel. A centrifuge can also be used.
- Alcohol Removal: Once both the products are separated, then the excess
alcohol in each phase is removed with a flash evaporation process or
distillation. It is then re-used.
- Glycerin Neutralization: The glycerin by-product contains unused
catalyst and soaps that are neutralized with an acid and sent top storage
as crude glycerin. In some cases the salt formed during this phase is
recovered for use as fertilizer. In more sophisticated operations, the
glycerin is distilled to99% or higher purity and sold into the cosmetic
and pharmaceutical markets.
18
- Methyl Ester Wash: Once separated from the glycerin, the biodiesel is
sometimes purified by washing gently with warm water to remove
residual catalyst or soaps, dried and sent to storage. In some processes
this step is not needed. This is normally the end of the production
process resulting n a clear amber-yellow liquid with a viscosity similar
to petro-diesel. In some systems the biodiesel is distilled in an additional
step to remove small amounts of color bodies to produce a colorless
biodiesel.
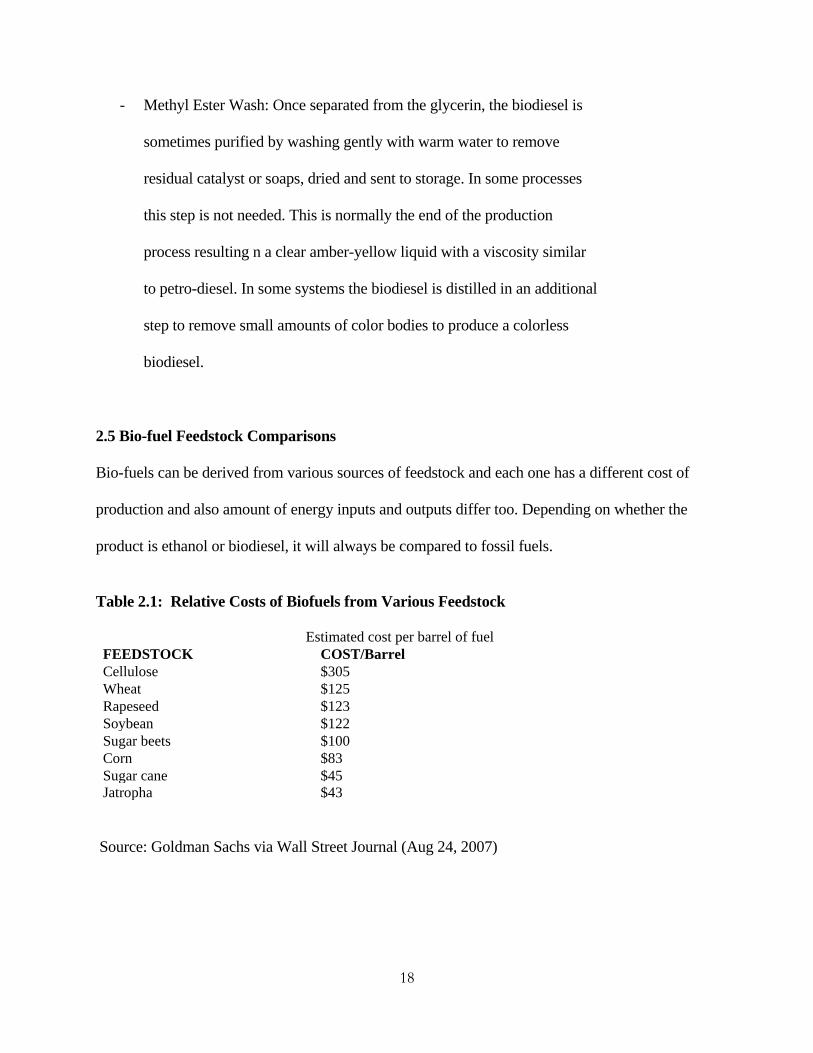
2.5 Bio-fuel Feedstock Comparisons
Bio-fuels can be derived from various sources of feedstock and each one has a different cost of
production and also amount of energy inputs and outputs differ too. Depending on whether the
product is ethanol or biodiesel, it will always be compared to fossil fuels.
Table 2.1: Relative Costs of Biofuels from Various Feedstock
Estimated cost per barrel of fuel FEEDSTOCK COST/Barrel
Cellulose $305 Wheat
$125
Rapeseed $123 Soybean
$122
Sugar beets $100 Corn
$83
Sugar cane $45 Jatropha
$43
Source: Goldman Sachs via Wall Street Journal (Aug 24, 2007)
19
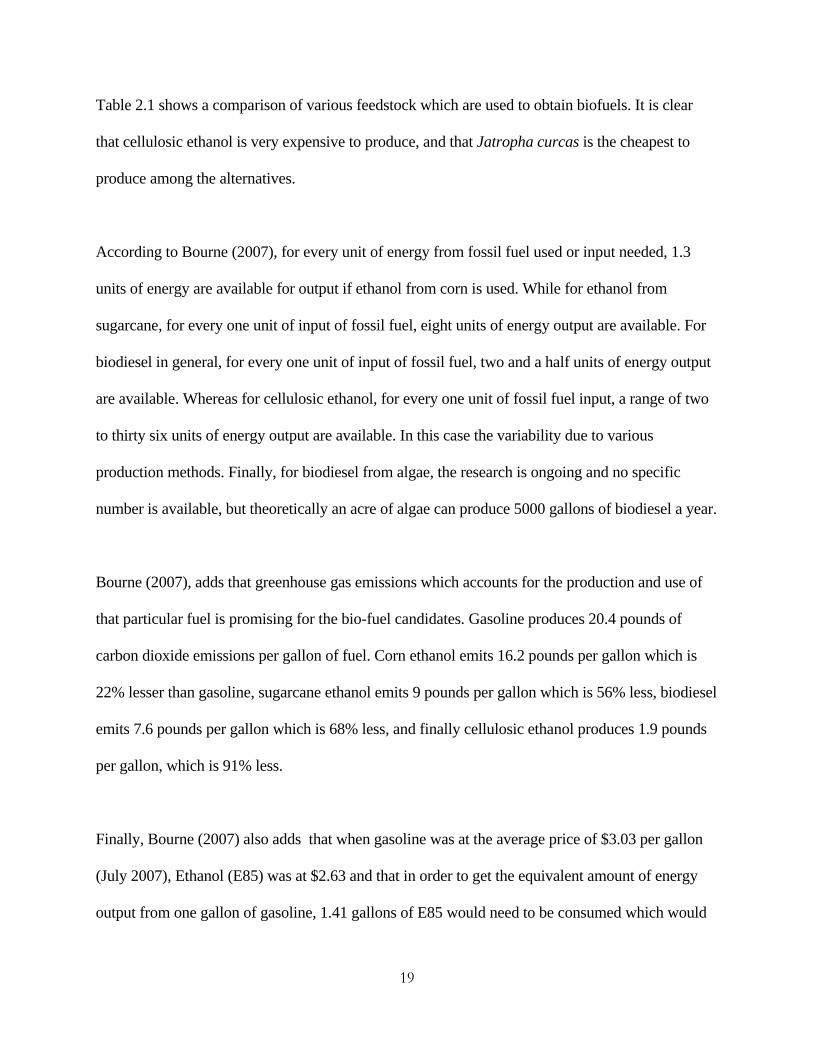
Table 2.1 shows a comparison of various feedstock which are used to obtain biofuels. It is clear
that cellulosic ethanol is very expensive to produce, and that Jatropha curcas is the cheapest to
produce among the alternatives.
According to Bourne (2007), for every unit of energy from fossil fuel used or input needed, 1.3
units of energy are available for output if ethanol from corn is used. While for ethanol from
sugarcane, for every one unit of input of fossil fuel, eight units of energy output are available. For
biodiesel in general, for every one unit of input of fossil fuel, two and a half units of energy output
are available. Whereas for cellulosic ethanol, for every one unit of fossil fuel input, a range of two
to thirty six units of energy output are available. In this case the variability due to various
production methods. Finally, for biodiesel from algae, the research is ongoing and no specific
number is available, but theoretically an acre of algae can produce 5000 gallons of biodiesel a year.
Bourne (2007), adds that greenhouse gas emissions which accounts for the production and use of
that particular fuel is promising for the bio-fuel candidates. Gasoline produces 20.4 pounds of
carbon dioxide emissions per gallon of fuel. Corn ethanol emits 16.2 pounds per gallon which is
22% lesser than gasoline, sugarcane ethanol emits 9 pounds per gallon which is 56% less, biodiesel
emits 7.6 pounds per gallon which is 68% less, and finally cellulosic ethanol produces 1.9 pounds
per gallon, which is 91% less.
Finally, Bourne (2007) also adds that when gasoline was at the average price of $3.03 per gallon
(July 2007), Ethanol (E85) was at $2.63 and that in order to get the equivalent amount of energy
output from one gallon of gasoline, 1.41 gallons of E85 would need to be consumed which would

20
bring the dollar value to $3.71. Cane ethanol in order to match Brazil’s average retail price of
$4.91 for 1 gallon of gasoline with 25% ethanol mixed in, would require 1.26 gallons of cane
ethanol to produce the equivalent amount of energy which would bring the value to $3.88 which is
still substantially lower than the gasoline-ethanol mix. In Germany, the biodiesel is sold at a higher
price than the fossil fuel diesel. In June 2007, the average price was $6.15 a gallon for fossil fuel
diesel and $6.80 for biodiesel. To produce the equivalent amount of energy of 1 gallon of fossil
fuel diesel, 1.01 gallons of biodiesel is required at a value of $6.73.
The purpose of developing these products is to use them as fuel in internal combustion engines.
But these engines are not well-suited for burning oil directly. The high viscosity of the oil causes
coking of the injectors on the pistons and on the engine head which causes incomplete combustion
of fuel. This leads to excessive carbon deposits on the pistons, eventually causing excessive wear
on the engine. Therefore, the Jatropha curcas oil, like all the other oils, has to be processed into
biodiesel through the transesterification process discussed above.
There are three important variables to focus on in processing oil into diesel: flash point, caloric
value and cloud point. For efficient energy release, the fuel must have a low flash point and cloud
point and high caloric value. Table 2.2 illustrates the differences between fossil diesel and
Jatropha curcas oil and biodiesel, soybean biodiesel, and palm oil biodiesel. It shows that fossil
diesel has higher caloric value, and the lowest flash and cloud point (except for soybean biodiesel)
compared to Jatropha curcas oil, Jatropha curcas biodiesel, soybean biodiesel and palm oil
biodiesel. However, Jatropha curcas biodiesel is not too different from fossil diesel where the
density, viscosity, and caloric value are very much similar. The cloud point is not too far off
compared to fossil diesel while the flashpoint is 125°C higher. The implication is that Jatropha
21
curcas oil can possibly replace fossil diesel and could also be blended with fossil diesel to have
caloric value, cloud and flash point properties that are more suitable. The same can be said of
soybean biodiesel and palm oil biodiesel. The conclusion here is that, all three sources of
feedstock, soybean, palm oil and Jatropha curcas are suitable replacements or complements for
fossil diesel.
Table 2.2: Fuel Properties of Jatropha curcas Oil, Jatropha curcas Biodiesel and Fossil Diesel
Properties Jatropha curcas Oil
Jatropha curcas Biodiesel
Soybean Biodiesel
Palm Oil Biodiesel Fossil Diesel
Density, g/ml 0.920 0.865 0.880 0.870 0.841 Viscosity @ 40
oC, Cst
3.5 5.2 1.9 to 6 4.4 4.5
Calorific value, MJ/kg 39.7 39.2 32 37.8 42.0
Flash point, oC 240 175 130 182 50
Cloud point, oC 16 13 -1 15.2 9
Sources: Ramesh et al. (Jatropha Curcas and fossil diesel), Mekalilie et al. (Soybean), and journeytoforever.org (Palm Oil)
2.6 Bio-fuel Geo-politics
The European Union (EU) has been very critical of the United States in recent months for
exporting subsidized biodiesel to the EU. This act, according to the EU Commission, has
contributed to the “killing off” of biodiesel producers in Europe.
Germany has recently removed all subsidies for biodiesel production, causing its local biodiesel
producers to be un-competitive against the US imports. At the other end of the spectrum, Spain,
another EU nation continues to have subsidies, but local producers there too are unable to compete
as loop holes in the current biodiesel system allows imports to receive subsidies too. This has

22
created a general dissatisfaction that US biodiesel producers are getting “double” subsidies thus
creating unfair competition.
European Trade Commissioner to the US, John Bruton (bioenergy-business.com) is quoted as
saying,
"What we are witnessing here is US taxpayers effectively subsidizing European
motorists to the tune of around $300m last year, and that figure is set to be even
higher this year - all while Americans themselves are suffering at the pump"
(bioenergy-business.com).
The United States has been subsidizing biodiesel production at USD$1.00 per gallon for blended
biodiesel. This has caused another issue where countries such as Malaysia and Indonesia have been
exporting their biodiesel, predominantly palm oil, to the US and blending them with petroleum
diesel in the US to qualify for the subsidies and then exporting the blended fuel to Europe to collect
the EU subsidy. This has made it even more difficult for EU biodiesel producers to be competitive.
The European Biodiesel Board (EBB) says that the fuel can be sold in the EU for less than EU
producers pay for their raw materials (bioenergy-business.com).
The European Commission has threatened to bring the issue to the World Trade Organization
(WTO) and has also threatened legal action. There have also been proposals that subsidies for
biodiesel into EU nations be removed for already subsidized imported biodiesel.
23
Argentina is another country that has been benefiting from these subsidies. The Argentinean
biodiesel producers have also jumped on the bandwagon of getting its own subsidies and also
double subsidies from the EU.
Loop holes in the trade agreements have been taken advantage off to the dismay of the European
biodiesel producers. Measures were taken by the US Congress to change the Energy bill in regards
to biodiesel, but when the Energy Bill was signed by President Bush, the biodiesel trade and
subsidy remedies were left out. The problem continues and while the biodiesel subsidies are
expiring by the end of 2008, it is expected to be extended (grainet.com).
The EU is currently working on setting trade barriers and regulations in relation to biodiesel.
Limiting subsidies and setting environmental limits on the bio-diesel products are possibilities. The
EU currently is looking into biodiesel producing countries, and is now stating that they might ban
biodiesel that is produced by raw materials that could cause environmental issues such as
deforestation to grow biodiesel crops.
At present, biodiesel production has an issue where the low cost supply of raw materials is not
easily available. In the US, the raw materials available are not cost effective. For example, soybean
is among the largest source of feedstock for biodiesel in the US, but according to Hoffstrand and
Johanns (2009), based on their biodiesel cost data, soybean biodiesel is not cost effective unless
government subsidies and in place. Currently, algae is said to have the greatest potential to be the
largest source of biodiesel raw material (biodieselfuelonline.com), but that has yet to be proven as
to production and also costs involved. Work is currently being done on Jathropa curcas as a
24
possible low cost material. There is another issue where biofuels made from world's dominant
energy crops, including corn, soy, and oil palm, may have worse environment impacts than
conventional fossil fuels, reports a study published in the journal Science (news.mongabay.com).
The EU can also impose tariffs and quotas on imported biodiesel that are heavily subsidized. Of
course this could possibly cause other trade issues, but could also create a comparative advantage
where each trade group could effectively gain from this issue. As an example, maybe a possibility
would be for the EU to try to get more bananas from the Americas as part of the bargaining
process.
WTO negotiations generally take a long time to materialize and possible preferential trade
agreements between these countries would probably happen in order to solve this issue. As these
geo-political issues are discussed and decided on, the work towards a source of feedstock for
biofuel continues. Jatropha curcas has been marketed and publicized heavily as the future of bio-
diesel with very little thought or planning in the agronomy and logistical issues involved.
Currently, the second wave of Jatropha curcas investors is moving in with more research and
information and with the hope and perseverance that this time it will be more successful. There is
no doubt that subsidies do help, but it would be so very helpful for this very young industry that the
countries involved with or whom are within their political influence to work out the geo-political
issues to help start an industry that could very well change the political climate around the world.
25
2.7 Bio-fuel Economics As the world’s population become more dependent on the motorized vehicle and with markets
such as India and China grows, so does the demand for fuel. Biofuels will play a critical role in
providing the supply with the increased demands. The use of biofuels is not new but just needs to
be streamlined in terms of production and logistics. The production of biofuels will also in turn
take advantage of the earth’s most valuable assets, its population and land availability. Creating
and taking advantage of human skills such as farming would be a socio economic event where
villages to countries can be more independent. With large swaths of land currently with poor arable
soil, with its millions of inhabitants in these areas, such a crop such as Jatropha curcas would be
able to provide a significant socio economic impact.
All these need for other forms or sources of energy and with bio-fuel being one of the major
candidates, the processes used and capital spent may not always be necessarily financially viable.
According to Tao and Aden (2009), with the current process economics for commercial bio-fuels
for corn ethanol, sugarcane ethanol, and soybean biodiesel, the feedstock cost is a major
contributor to the overall production cost, while the overall capital costs are not particularly large
when compared to other processes or industries. Tao and Aden (2009) also added that future
biofuels that require cellulosic processes and other advanced biofuels processes, such as butanol,
would not only still face the high cost of feedstock but also the high capital costs needed for the
deconstruction of these materials.

26
2.8 Summary
Whether ethanol or biodiesel is used, it is a move in the right direction. The ever changing climate
and the constant degradation of the environment, provides us with a choice to look at greener ways
to power our engines. Hydro power has been used. Solar and wind power has also been used and
getting popular. However, the majority of our power plants and from the smallest of engines to the
largest, fuel is needed. Bio-fuel will not completely replace the fossil fuels, as of yet, but will
definitely complement our current resources.
27
CHAPTER 3: DATA, ASSUMPTIONS, METHODS, HYPOTHESES AND MODELS
3.1 Introduction
The purpose of this chapter is to present the data used in this study and present the overview of the
methods applied to address the objectives. The chapter also presents the models used in the
analysis and provides the hypotheses that are tested from the analyses. Scenarios are evaluated to
compare soybean, palm oil and Jatropha curcas. The comparisons involve farm level production
to biodiesel processing for Jatropha curcas, and biodiesel processing with crude vegetable oil for
soybeans and palm oil. The financial statements of the scenarios will be evaluated. These financial
numbers are obtained from secondary sources and especially for Jatropha curcas, there will be
some assumptions made. Soybean oil and palm oil prices will be obtained from the market, and as
for Jatropha curcas, since it is not a commodity as of yet, I will be using data from secondary
sources.
3.2 Net Present Value (NPV) and Internal Rate of Return (IRR)
Net Present Value is a financial tool that indicates how much value an investment or project adds
to a firm. It is the present value of a series of cash flows and it is a method where the time value of
money is used to appraise long-term projects. This ensures that the investor incorporates the time
effect on the value of money into the analysis of the investment. The difference between a
project’s present value of cash inflows and outflows generated and its cost of the initial investment
is its Net Present Value (NPV). Companies can best help their shareholders by investing in
projects with a positive NPV and rejecting those with a negative NPV (Brealey, Myers and Allen
2006). Another financial tool that can be used is Internal Rate of Return (IRR). The IRR of an
28
investment is the discount rate, r, which causes NPV to equal zero. The same equation below can
be used to solve for the discount rate, r. A project with a substantially higher IRR value than other
options would still provide a much better chance of strong growth. It can also be explained as the
interest rate at which the costs of the investment lead to the benefits of the investment.
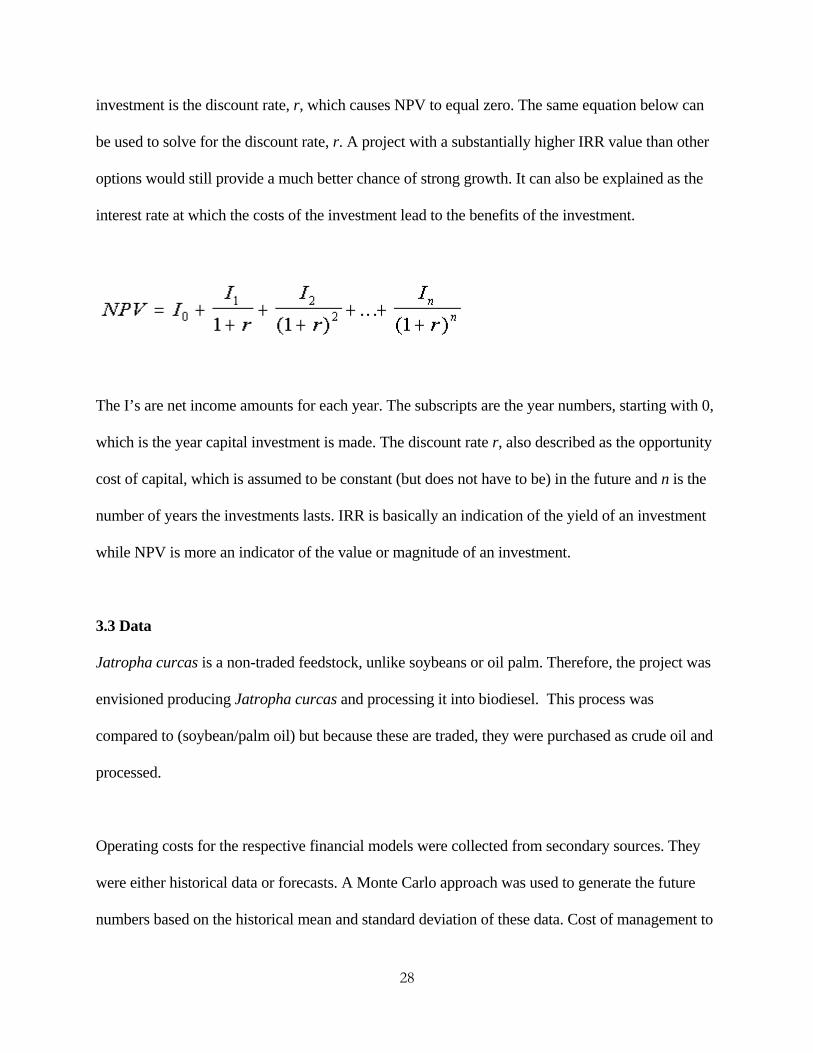
The I’s are net income amounts for each year. The subscripts are the year numbers, starting with 0,
which is the year capital investment is made. The discount rate r, also described as the opportunity
cost of capital, which is assumed to be constant (but does not have to be) in the future and n is the
number of years the investments lasts. IRR is basically an indication of the yield of an investment
while NPV is more an indicator of the value or magnitude of an investment.
3.3 Data
Jatropha curcas is a non-traded feedstock, unlike soybeans or oil palm. Therefore, the project was
envisioned producing Jatropha curcas and processing it into biodiesel. This process was
compared to (soybean/palm oil) but because these are traded, they were purchased as crude oil and
processed.
Operating costs for the respective financial models were collected from secondary sources. They
were either historical data or forecasts. A Monte Carlo approach was used to generate the future
numbers based on the historical mean and standard deviation of these data. Cost of management to
29
general labor was used in the financial analysis for both models, but here too some assumptions
were used within a random range to provide for cost of living increases. A simulation of the
production of Jatropha Curcas feedstock over a period of 34 years was applied. The reason 34
years was used for Jatropha curcas was for the initial gradual planting per year for up to five years
and arriving at full production from year nine onwards, and the removal of older less productive
plants from year 26 onwards to which the complete planting cycle ends at year 30 but gets back in
full production from year 34 onwards (Appendix 1). A total area of one hectare was used to look at
production values for soybeans, oil palm and Jatropha curcas. For Jatropha curcas, the one
hectare data was then increased to 50,000 hectares which was used for the sake of simulation.
Historical data (from 1997 to 2008) on soybeans were obtained from USDA and used as the
foundation data for the analysis while oil palm information were obtained from the Malaysian
Palm Oil Board (Azman, 2003) (Appendix 2).
The biodiesel processing data and costs was obtained from Hofstrand and Johanns (2009), and was
presented as per the sources. Since the biodiesel data provided by Iowa State University (Hofstrand
and Johanns, 2009), is of a 30 million gallon biodiesel processing facility, with all the costs
involved included, the same operational capacity was used for the analysis in this thesis.
3.4 Assumptions
At the farm level, soybean is farmed and produced annually, while Jatropha curcas, once planted
will not produce or more accurately is not harvestable in the first year. The first harvest begins
from Year 2 onwards and will reach its maximum yield capacity from Year 5 onwards. This
information is very varied, and many claims are out there stating that the yield of the plant is very
30
high. However, there are also claims that the yield is also very low. Because Jatropha curcas has
only recently received significant research attention, this situation is not unexpected because of
variability in measurements and, agronomic and horticultural conditions. For this research, yield
data are assumed to be stochastic with a mean of 6382 kilograms per hectare and a standard
deviation of 3037 kilograms per hectare (from Year 2 onwards). The basis of the numbers used is
the United Nation’s (2007) study on Jatropha curcas as a source of liquid bio-fuel in the Sub-
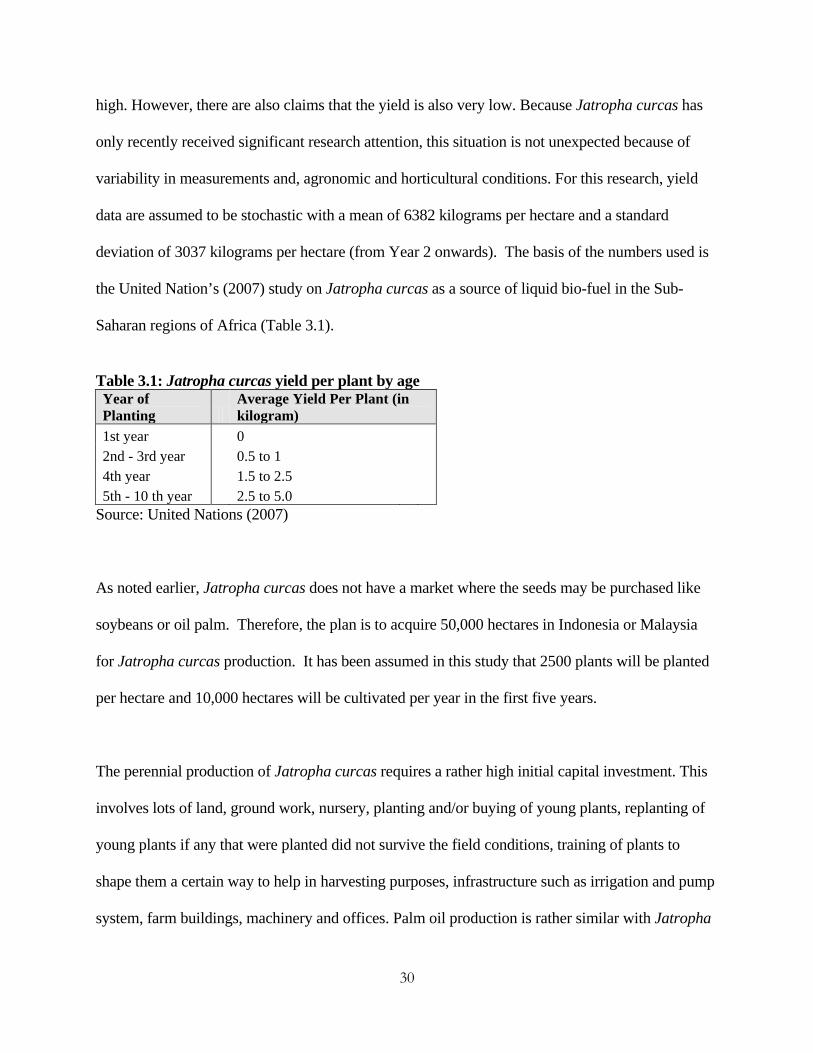
Saharan regions of Africa (Table 3.1).
Table 3.1: Jatropha curcas yield per plant by age Year of Planting
Average Yield Per Plant (in kilogram)
1st year 0
2nd - 3rd year 0.5 to 1
4th year 1.5 to 2.5
5th - 10 th year 2.5 to 5.0
Source: United Nations (2007)
As noted earlier, Jatropha curcas does not have a market where the seeds may be purchased like
soybeans or oil palm. Therefore, the plan is to acquire 50,000 hectares in Indonesia or Malaysia
for Jatropha curcas production. It has been assumed in this study that 2500 plants will be planted
per hectare and 10,000 hectares will be cultivated per year in the first five years.
The perennial production of Jatropha curcas requires a rather high initial capital investment. This
involves lots of land, ground work, nursery, planting and/or buying of young plants, replanting of
young plants if any that were planted did not survive the field conditions, training of plants to
shape them a certain way to help in harvesting purposes, infrastructure such as irrigation and pump
system, farm buildings, machinery and offices. Palm oil production is rather similar with Jatropha
31
curcas with high initial capital investments with no income the first few years while soybean
would still require the capital investment of machinery, land, and management, the income starts
the same year and repeats annually.
The cost of production for Jatropha curcas were sourced from Green Gold Ray Energies,
Incorporated (GRYE). GRYE operates as a biodiesel, green technology, and alternative-renewable
energy company in the Philippines and the United States. It primarily engages in the manufacture
of biodiesel and alternative renewable fuel derived from Jatropha curcas. The company’s product
portfolio includes biodiesel oil and biofuels. It is also cultivating agricultural oil-based mineral
resources from sugarcane, coconut, Jatropha curcas, sweet sorghum, and other crops. GRYE was
incorporated in 1982 and is based in Corpus Christi, Texas. GRYE indicates that production costs
per hectare is at USD$92.57. A stochastic factor is incorporated into this to yield the costs
employed in the estimations and the analyses (Appendix 3). For example, the total operating costs
from Years 7 to 10, a range of USD$34 to USD$50 per hectare is used, and from years 11 to 16 it
ranges from USD$38 to USD$54, and from years 17 to 25 the range is from USD$42 to USD$58
per hectare. As for overhead costs, it ranges from USD$60 to USD$80, USD$64 to USD$84, and
USD$68 to USD$88 respectively. This brings the total production costs to between USD$114 to
USD$128, USD$112 to USD$135 and USD$96 to USD$782 (replanting starts again after 25
years) respectively. In the first year, the initial cost of custom operations of $700 per hectare is
sourced from Lele (2006). This brings the total production cost for the first year to USD$782,
where the production cost of USD$92 is incorporated into the total. From Year 2 to 6, production
costs were sourced from GRYE.
32
In the 50,000 hectare estimation for Jatropha curcas, for the first 5 years, according to the total
hectares planted that year and in this case 10,000 hectares a year, will cost between the range of
USD$600 per hectare to USD$1500 per hectare. This will repeat again in the reverse from years 26
to 30 as removal of the older plants begins. However, between years 26 to 30 the cost is doubled as
the action of planting and re-planting is happening in tandem (Appendix 1). From Year 5 onwards,
plants that are five years and older will have higher yields than younger plants. For example, it is
assumed yield ranges from two kilograms to five kilograms for this group of plants (Appendix 4).
The biodiesel price data is from Iowa State University over a period from April 2007 and August
2009. The mean is $4.64 per gallon and the standard deviation is $2.83. The biodiesel cost data is
obtained from Iowa State University. The price of soybean oil and crude palm oil is from historical
data. Assumptions include the production capacity, where Jatropha curcas is dependent on the
50,000 hectare plantation and production fluctuates while soybean oil and palm oil is operated at
maximum capacity of 30 million gallon per year. The cost data is shown in Table 3.2:

33
Table 3.2 Biodiesel Cost Data Fixed Costs Cost per Gallon (¢/gallon) Depreciation 0.00 Interest 6.46 Labor & Management 5.37 Marketing & Procurement 4.00 Property Taxes, Insurance, etc. 1.17 Total Fixed Costs 17.00 Other Variable Costs Chemicals Chemicals and Ingredients 5.7 Total Chemical Cost 5.7 Other Direct Costs Repairs & Maintenance 12.11 Transportation 10 Container 5 Water 0.7 Electricity 3 Other 3 Total Other Costs 33.81 Total Other Variable Cost 39.51
Source: Iowa State University (Hofstrand and Johanns, 2009)
In addition to the chemicals and ingredients cost (USD$0.057 per gallon), other production costs
include feedstock, natural gas, and methanol.
Iowa State University cost data is also used with Jatropha curcas biodiesel simulation. In addition
to that, the other assumptions include the price of the feedstock, the crushing cost at 8 percent of
the variable cost, the startup cost of USD$47 million (USD$17 million in Year 0 and USD$30
million in Year 1) and the initial start up cost of the plantation is absorbed by the processing
division (Appendix 5). The crushing cost at 8 percent was obtained from industry experts that did

34
not want to be referenced and the startup capital cost of USD$47 million was available from
Hofstrand and Johanns (2009).
Some specific conversions will be used, and is summarized in Appendix 6. Standard unit
conversions are used and as for soybeans and Jatropha curcas, the conversions were from
secondary sources. More specifically, 1 bushel of soybeans is converted to 1.49 gallons of
biodiesel (Iowa State University) or 27.22 kilograms of soybeans to 1.49 gallons of biodiesel or
18.27 kilograms of soybeans to 1 gallon of biodiesel. It is assumed that a gallon of Jatropha curcas
oil may be produced from between 9.46 kilograms to 15.14 kilograms of Jatropha curcas seeds.
This range is defined by GRYE’s and jatrophacurcasplantations.com out of Australia claims My
research indicates that 1 gallon of Jatropha curcas oil is equivalent to 0.8 gallons (Lele, 2006) of
biodiesel whereas 1 gallon of soybean oil is processed to 1 gallon (Hofstrand and Johanns, 2009)
of biodiesel but due to insufficient sources for credible conversion for Jatropha curcas, we will use
the same conversion as soybean oil.. The price information of Jatropha curcas seed is sourced
from GRYE at USD$0.04 per kilogram and simulated to USD$0.20 per kilogram.
3.5 Hypothesis
The purpose of the thesis is to evaluate the economic and financial feasibility of producing
biodiesel from Jatropha curcas and compare them with similar analyses conducted on soybeans
and oil palm. To this end, the hypothesis that Jatropha curcas presents a higher NPV than the
alternatives is proposed. This hypothesis is based on the fact that Jatropha curcas is a non-food
product and hence does not command the high food prices. Additionally, it is argued that its higher
oil yield offers it a production advantage.
35
CHAPTER 4: DATA AND RESULTS
4.1 Data
In this chapter, the results from the analyses proposed in Chapter 3 are presented using the data
described above. The results encompass feedstock production of soybean, Jatropha curcas, and
oil palm which then leads to the biodiesel production originating from these sources of feedstock.
4.2 Feedstock Production
The production of feedstock between soybean, Jatropha curcas, and oil palm were varied.
Soybean is an annual crop, while Jatropha curcas and oil palm is a perennial crop. The data
showed the annual cost of production for soybeans which also brought in the income for that year
and for oil palm the data presented the production of a mature plantation that had trees that were
maximum in yield. As for Jatropha curcas, the data encompassed the implementation of the
plantation and the consequent years of production.
4.2.1 Soybean Feedstock Production
Data from the USDA indicated that in 2008 the average soybean producer had a yield of about
2863.35 kilogram per hectare. This translates to the gross revenue of $1103.18 per hectare. The
total operating costs was at $329.42 per hectare. Operating costs consists of seeds, fertilizer,
chemicals, custom operations, fuel, lube, electricity, repairs, purchased irrigation water and interest
on the operating capital. While the allocated overhead costs, which consist of hired labor,
opportunity cost of unpaid labor, capital recovery of machinery and equipment, opportunity cost of
land, taxes, insurance, and general farm overhead, came to a total of $622.09 per hectare. With the
operating costs and overhead costs combined, the net value of soybean production calculated to
36
$151.67 per hectare (Appendix 2). Data from the USDA, which did not include government
subsidies, indicated that from 1997 to 2008, soybean farmers averaged a loss of USD$36.87 per
hectare (Appendix 2).
4.2.2 Jatropha Curcas Feedstock Production
Because it is a new initiative, the Jatropha curcas production involves capital investments for
production of seeds which is the feedstock for the oil production. These investments have been
assumed in Chapter 3 to last more than 25 years. For Jatropha curcas, the producer or plantation
company would have to invest in a large amount of capital into the initial investment to start a
Jatropha curcas plantation. Once completed, the Jatropha curcas plant will remain there for up to
40 years, but for the purpose of harvesting from efficiently producing trees, we will harvest the
plants for up to 25 years. The assumed maximum yield is achieved from 5 to 10 years of its life.
This yield would continue on till an expected age of 25 years after which the yield is said to
gradually decrease.
According to Green Gold Ray Energies, Inc. in the Philippines (GRYE), the annual cost of the
plantation is about $92.57 per hectare. Refer to Appendix 3 where it states that the plantation cost
is $92,570 per 1000 hectares. As mentioned earlier, the initial setup cost for the Jatropha curcas
plantation would require capital. Lele (2006), states that it would require about 30,000 rupees
(~USD$700) per hectare for the setup year. At best estimation, for the first year, with no revenue,
the initial setup cost would be estimated at $782.60 per hectare. One thousand hectares would cost
$782,600.00. As the value of production increases over the coming years, the expected Return on
Investment (ROI) would begin between the fifth and sixth year. At the tenth year, the gross value
of production less total costs would be estimated at $381.60 per hectare or $381,600.00 per 1000
37
hectares. This would, of course with fluctuations depending on weather, price, and other factors,
maintain till the trees reach the age of 25 years. The assumptions made with references:
1) Plantation Cost of minimum USD$92.57 per hectare (Appendix 3)
2) Harvesting yield begins on the second year of production at 2500 kilograms per hectare to a
maximum yield of 12,500 kilograms per hectare from the 5th year onwards (Appendix 7)
3) 2500 plants per hectare.
4) The yield expectations as per quoted by United Nations study (2007). Also refer to Table
3.1.
5) Seed price ex-farm to refinery is at $0.04 per kilogram (Appendix 3).
However, as we extrapolate the Jatropha curcas data to a higher number of hectares, the scenario
changes. It is easy and straightforward when we look at the one hectare production numbers, but as
the acreage significantly increased, so does the complexity of the planting schedule and production
numbers. For the sake of simulating a large plantation, 50,000 hectares is used. When a production
this large is undertaken, all 50,000 hectares cannot be planted in a single year. A 5 year planting
schedule will be used, where 10,000 hectares would be planted every single year for the next 5
years, and replanting would start again from years 26 to 30 where 25 year old plants would be
removed and replanted with a fresh start of trees at a rate of 10,000 hectares each. Which means
the cost of custom operations, which includes planting and removal, would double when compared
to the first 5 years. Yield too is not so straightforward with such a big plantation. The yield for the
first 8 years would gradually increase until all the plants in the plantation are 5 years or older
which is planned for the 9th year. As the plants mature and reaches maximum production, the yield
is set to fluctuate between two kilograms to five kilograms per plant per year. At year 26, the
38
removal and replanting begins for another five years and reaches maximum production again in
year 34 for another cycle of maximum yield (Appendix 1).
The production results indicate that, the annual profit/(loss) for the first five years will be negative
and only in the sixth year a positive profit/(loss) of USD$1,580,000 is achieved. At the end of year
34, even with double production costs from years 26 to 30 and a loss of yield from years 26 to 33,
the annual profit/(loss) at year 34 is at USD$2,275,000 and the net accumulated profit/(loss) over
the 34 years would bring in USD$107,590,000 (Appendix 4).
4.2.3 Oil Palm Feedstock Production
Oil palm plantations are set up with long term in mind. It is similar to that of Jatropha curcas
plantations. According to Azman (2003), smallholders and the estate sector were compared, and
showed that the smallholders had costs of USD$506.42 per hectare and a net income of
USD$346.22 per hectare while estate holders had costs of USD$649.61 and due to higher yields
had a net income of USD$388.62 per hectare. The data is then used for 50,000 hectares, the net
income of estate holders adds up to over USD$19 million per year (Appendix 8). These data is
based on a fixed yield per hectare on established plantations and based on the given prices. We will
use the estate holder’s income to compare with Jatropha curcas plantation income and upon
comparing the data, it indicates that Jatropha curcas has the ability to match oil palm, if the yield
does not fluctuate greatly and if the price continues to increase, it would be as good or better
investment than oil palm.
39
4.3 Results- Biodiesel Production
As mentioned in Chapter 3, the comparisons are that of Jatropha curcas seed being bought in and
crushed and finally processed while soybean oil and crude palm oil are purchased to be processed
to biodiesel.
4.3.1 Soybeans – Biodiesel Production
Data obtained from Iowa State University (Hofstrand and Johanns, 2009), from April 2007 to
August 2009, indicates that at varied prices of biodiesel, the revenue for a 30 million gallons per
year biodiesel facility, ranged from as low as USD$2.71 per gallon to USD$5.54 per gallon. The
total cost of production varied from USD$2.75 per gallon to as high as USD$5.42 per gallon. The
net return per gallon after all costs ranged from as low as at a loss of USD$0.37 per gallon to a
profit of USD$0.18 per gallon (Figure 4.1).
40
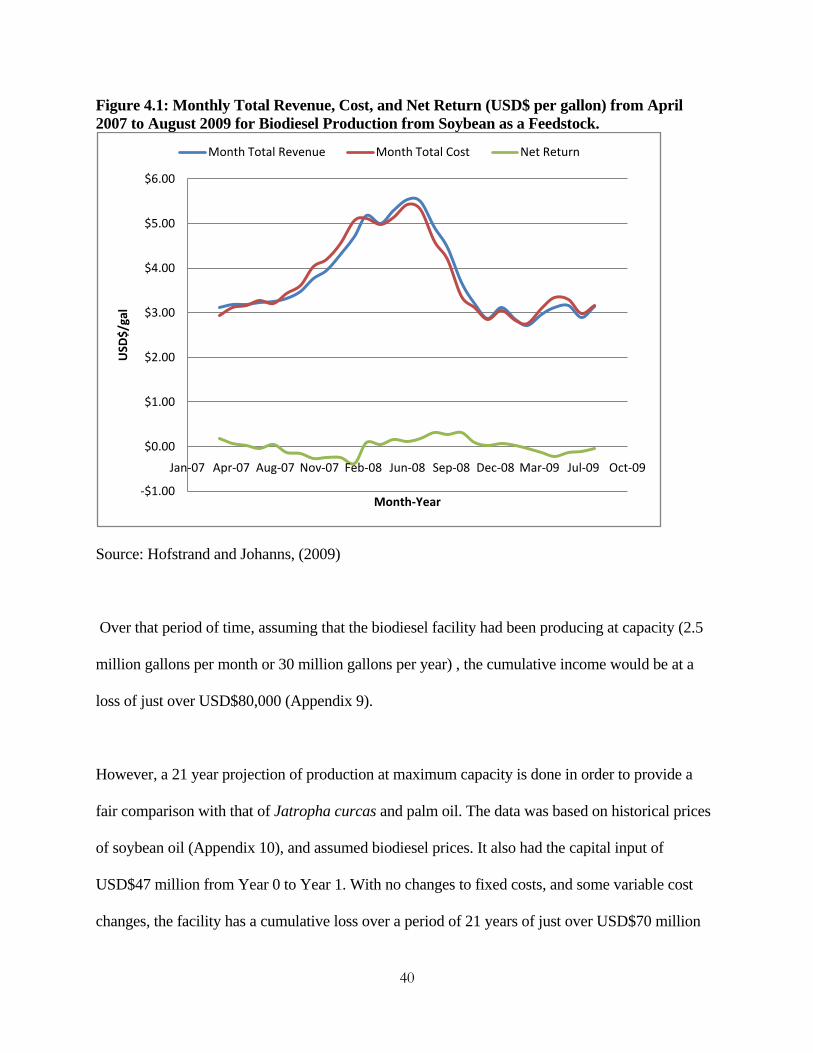
Figure 4.1: Monthly Total Revenue, Cost, and Net Return (USD$ per gallon) from April 2007 to August 2009 for Biodiesel Production from Soybean as a Feedstock.
Source: Hofstrand and Johanns, (2009)
Over that period of time, assuming that the biodiesel facility had been producing at capacity (2.5
million gallons per month or 30 million gallons per year) , the cumulative income would be at a
loss of just over USD$80,000 (Appendix 9).
However, a 21 year projection of production at maximum capacity is done in order to provide a
fair comparison with that of Jatropha curcas and palm oil. The data was based on historical prices
of soybean oil (Appendix 10), and assumed biodiesel prices. It also had the capital input of
USD$47 million from Year 0 to Year 1. With no changes to fixed costs, and some variable cost
changes, the facility has a cumulative loss over a period of 21 years of just over USD$70 million
-$1.00
$0.00
$1.00
$2.00
$3.00
$4.00
$5.00
$6.00
Jan-07 Apr-07 Aug-07 Nov-07 Feb-08 Jun-08 Sep-08 Dec-08 Mar-09 Jul-09 Oct-09
USD
$/ga
l
Month-Year
Month Total Revenue Month Total Cost Net Return
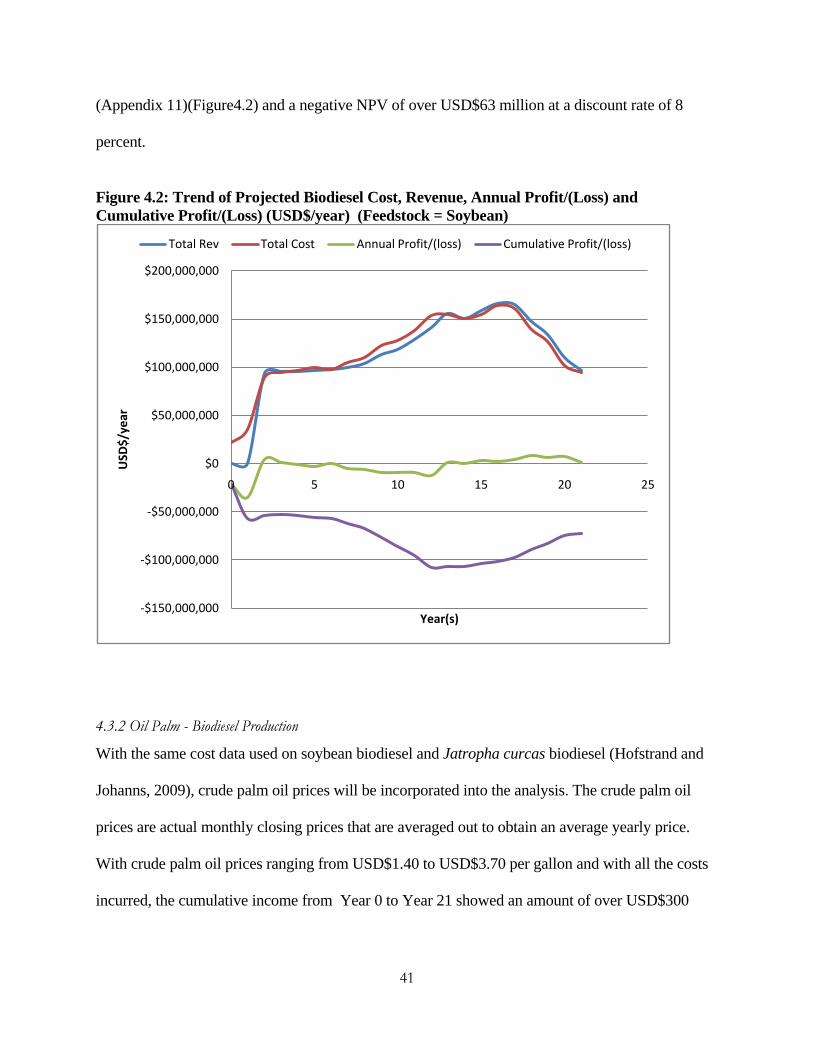
41
(Appendix 11)(Figure4.2) and a negative NPV of over USD$63 million at a discount rate of 8
percent.
Figure 4.2: Trend of Projected Biodiesel Cost, Revenue, Annual Profit/(Loss) and Cumulative Profit/(Loss) (USD$/year) (Feedstock = Soybean)
4.3.2 Oil Palm - Biodiesel Production
With the same cost data used on soybean biodiesel and Jatropha curcas biodiesel (Hofstrand and
Johanns, 2009), crude palm oil prices will be incorporated into the analysis. The crude palm oil
prices are actual monthly closing prices that are averaged out to obtain an average yearly price.
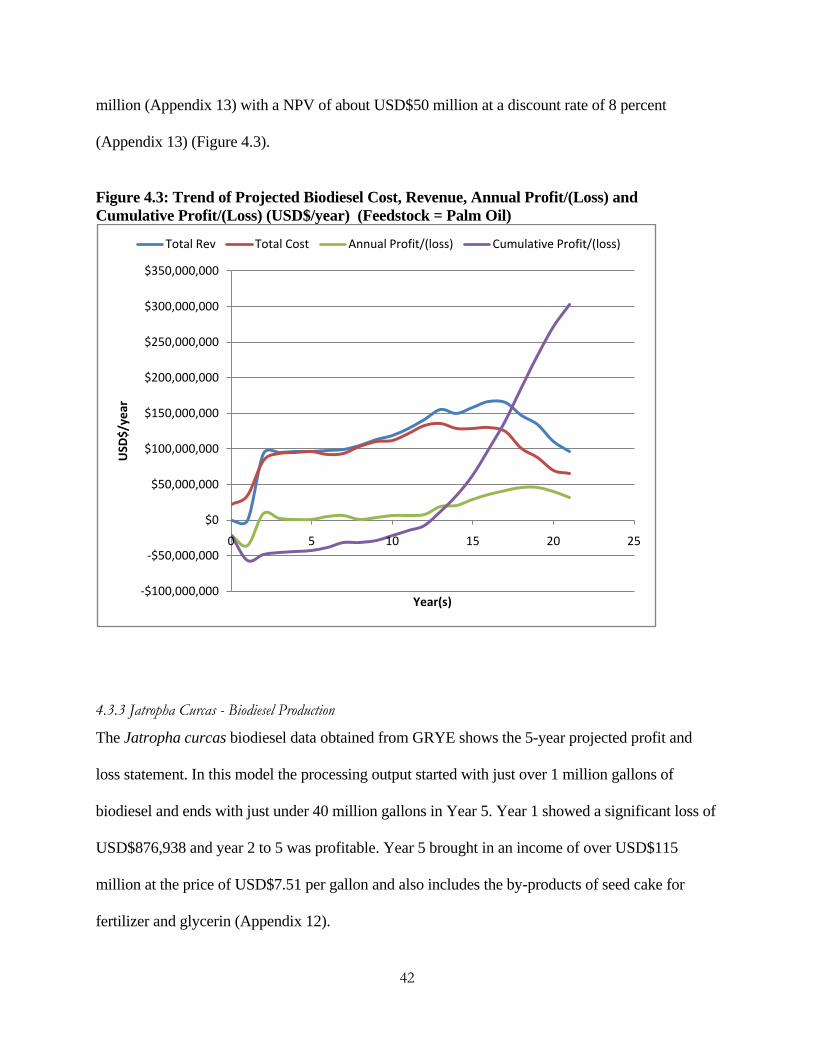
With crude palm oil prices ranging from USD$1.40 to USD$3.70 per gallon and with all the costs
incurred, the cumulative income from Year 0 to Year 21 showed an amount of over USD$300
-$150,000,000
-$100,000,000
-$50,000,000
$0
$50,000,000
$100,000,000
$150,000,000
$200,000,000
0 5 10 15 20 25
USD
$/ye
ar
Year(s)
Total Rev Total Cost Annual Profit/(loss) Cumulative Profit/(loss)
42
million (Appendix 13) with a NPV of about USD$50 million at a discount rate of 8 percent
(Appendix 13) (Figure 4.3).
Figure 4.3: Trend of Projected Biodiesel Cost, Revenue, Annual Profit/(Loss) and Cumulative Profit/(Loss) (USD$/year) (Feedstock = Palm Oil)
4.3.3 Jatropha Curcas - Biodiesel Production
The Jatropha curcas biodiesel data obtained from GRYE shows the 5-year projected profit and
loss statement. In this model the processing output started with just over 1 million gallons of
biodiesel and ends with just under 40 million gallons in Year 5. Year 1 showed a significant loss of
USD$876,938 and year 2 to 5 was profitable. Year 5 brought in an income of over USD$115
million at the price of USD$7.51 per gallon and also includes the by-products of seed cake for
fertilizer and glycerin (Appendix 12).
-$100,000,000
-$50,000,000
$0
$50,000,000
$100,000,000
$150,000,000
$200,000,000
$250,000,000
$300,000,000
$350,000,000
0 5 10 15 20 25
USD
$/ye
ar
Year(s)
Total Rev Total Cost Annual Profit/(loss) Cumulative Profit/(loss)

43
However, Jatropha curcas data was not the same. As discussed previously, the assumption that
Jatropha curcas seed was purchased as an internal transfer from the plantation by the processing
plant, a vertically integrated company, at the internal transfer seed feedstock price of USD$0.04 to
USD$0.20 per kilogram and with the seed oil efficiency between 9 kilograms to 15 kilograms of
seed to a gallon of oil. These two variables and its ranges will be used for the NPV analysis.
For comparison, an assumed base of USD$0.10 per kilogram of seed and 15 kilograms of seed to a
gallon of oil is used. The yield transferred from the plantation, was simulated 20 times using the
Monte Carlo method with yields per plant ranging from two to five kilograms per tree. This
assumption is only used on plants that were five years old or older. With the assumed base, over a
period of Year 0 to Year 21, with the first years absorbing losses from the plantation and the capital
expenditure of the processing facility, the Jatropha curcas biodiesel facility would have had a
cumulative profit of just over USD$700 million with a NPV of over USD$164 million and IRR of
18% at a discount rate of 8 percent (Appendix 5) (Figure 4.4).

44
Figure 4.4: Trend of Projected Biodiesel Cost, Revenue, Annual Profit/(Loss) and Cumulative Profit/(Loss) (USD$/year) (Feedstock = Jatropha curcas)
4.4 NPV Results and Analysis
A summary of the results are presented in Appendix 14 where it shows the biodiesel data for
soybean, palm oil and Jatropha curcas as the source of feedstock. From Year 0 to Year 1, the
capital inputs of a total of USD$47 million were included and for Jatropha curcas the added cost
from the losses of the plantation division. The results showed that at a fixed discount rate of 8
percent and Jatropha curcas extraction rate of 15 kilograms of seed per gallon of oil and
USD$0.10 per kilogram of seed, soybeans as a feedstock is not a feasible option since its NPV is
negative. However, both palm oil and Jatopha curcas are feasible feedstock options because of
their positive NPVs. The analyses show that the NPV for soybean over the 21-year time frame was
–USD$63 million while that of oil palm was USD$52 million and finally Jatropha curcas posted
-$200,000,000
-$100,000,000
$0
$100,000,000
$200,000,000
$300,000,000
$400,000,000
$500,000,000
$600,000,000
$700,000,000
$800,000,000
0 5 10 15 20 25
USD
$/ye
ar
Year(s)
Total Rev Total Cost Annual Profit/(loss) Cumulative Profit/(loss)
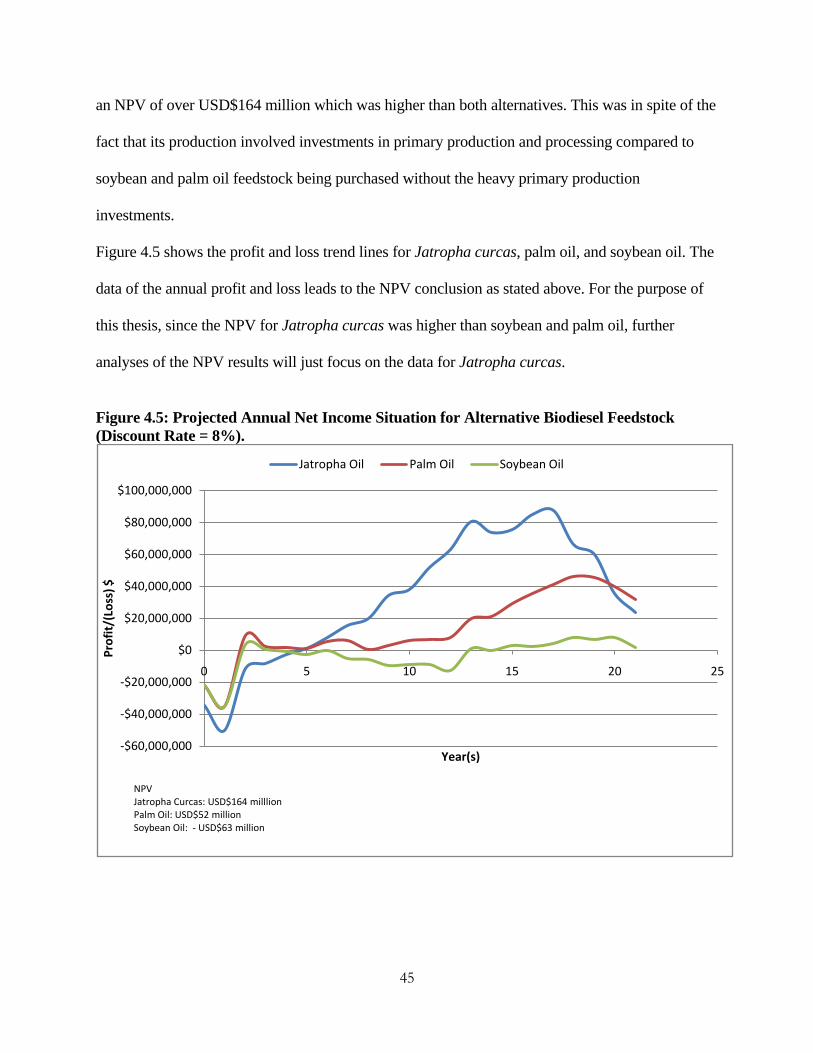
45
an NPV of over USD$164 million which was higher than both alternatives. This was in spite of the
fact that its production involved investments in primary production and processing compared to
soybean and palm oil feedstock being purchased without the heavy primary production
investments.
Figure 4.5 shows the profit and loss trend lines for Jatropha curcas, palm oil, and soybean oil. The
data of the annual profit and loss leads to the NPV conclusion as stated above. For the purpose of
this thesis, since the NPV for Jatropha curcas was higher than soybean and palm oil, further
analyses of the NPV results will just focus on the data for Jatropha curcas.
Figure 4.5: Projected Annual Net Income Situation for Alternative Biodiesel Feedstock (Discount Rate = 8%).
-$60,000,000
-$40,000,000
-$20,000,000
$0
$20,000,000
$40,000,000
$60,000,000
$80,000,000
$100,000,000
0 5 10 15 20 25
Prof
it/(L
oss)
$
Year(s)
Jatropha Oil Palm Oil Soybean Oil
NPVJatropha Curcas: USD$164 milllionPalm Oil: USD$52 millionSoybean Oil: - USD$63 million

46
As expected, oil extraction efficiency influences the profitability and feasibility of the processing
facility. Additionally, the cost of seeds also influences the results. Figure 4.6 shows the results of
sensitivity of the NPV model to feedstock price given oil extraction efficiency for Jatropha curcas
at a constant discount rate of 8 percent. The results indicate that the project becomes infeasible if
the Jatropha curcas seed price exceeds $0.16 per kilogram and oil extraction rate goes above 16
kilogram of seed per gallon of oil. This implies that management of the Jatropha curcas plant
must pay careful attention to the cost of production of seeds and their oil extraction efficiency - the
lower their cost of seeds and the higher their oil extraction efficiency, the more profitable their
operations. Given that they have full control on their feedstock compared to soy or oil palm, this
strategic effort must help them focus in enhancing their competitive position in the biodiesel
market.
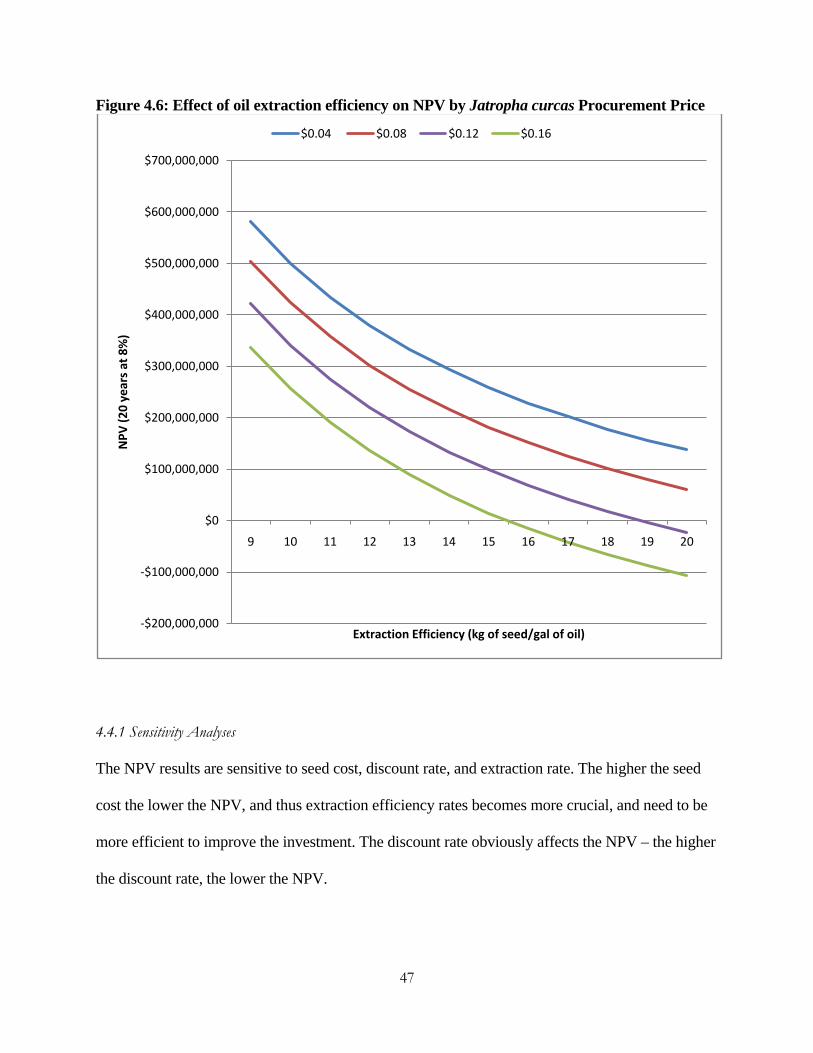
47
Figure 4.6: Effect of oil extraction efficiency on NPV by Jatropha curcas Procurement Price
4.4.1 Sensitivity Analyses
The NPV results are sensitive to seed cost, discount rate, and extraction rate. The higher the seed
cost the lower the NPV, and thus extraction efficiency rates becomes more crucial, and need to be
more efficient to improve the investment. The discount rate obviously affects the NPV – the higher
the discount rate, the lower the NPV.
-$200,000,000
-$100,000,000
$0
$100,000,000
$200,000,000
$300,000,000
$400,000,000
$500,000,000
$600,000,000
$700,000,000
9 10 11 12 13 14 15 16 17 18 19 20
NPV
(20
year
s at 8
%)
Extraction Efficiency (kg of seed/gal of oil)
$0.04 $0.08 $0.12 $0.16

48
The foregoing analyses have been conducted under specific assumptions about discount rates,
extraction rates and seed costs. However, these are all subject to change. For example, the
macroeconomic environment can have direct effect on the cost of capital, affecting the interest rate
and production costs will directly affect the internal transfer price for Jatropha curcas seeds from
the farm to the biodiesel processing plant. Based on the reality of these potential changes, the
sensitivity of the foregoing results to changes in these variables are presented and discussed. The
reference point for the ensuing sensitivity analyses is the discount rate, seed cost and extraction
efficiency used in the base analysis.
4.4.2 Effect of Seed Cost on NPV
To evaluate the benefits of focusing on these transfer seed price and extraction efficiency, Figure
4.7 presents the change in performance (NPV) given changes in seed costs for different extraction
efficiencies. This indicates that a high extraction efficiency and low seed price positively affects
the NPV. This is obvious at the point when the extraction efficiency was poor at 19 kilograms of
seed per gallon of oil, the NPV was low and continues to get worse as price continues to increase.
In this case, USD$0.12 was the limit of feasibility of the project if the extraction efficiency was at
19 kilograms of seed per gallon of oil.
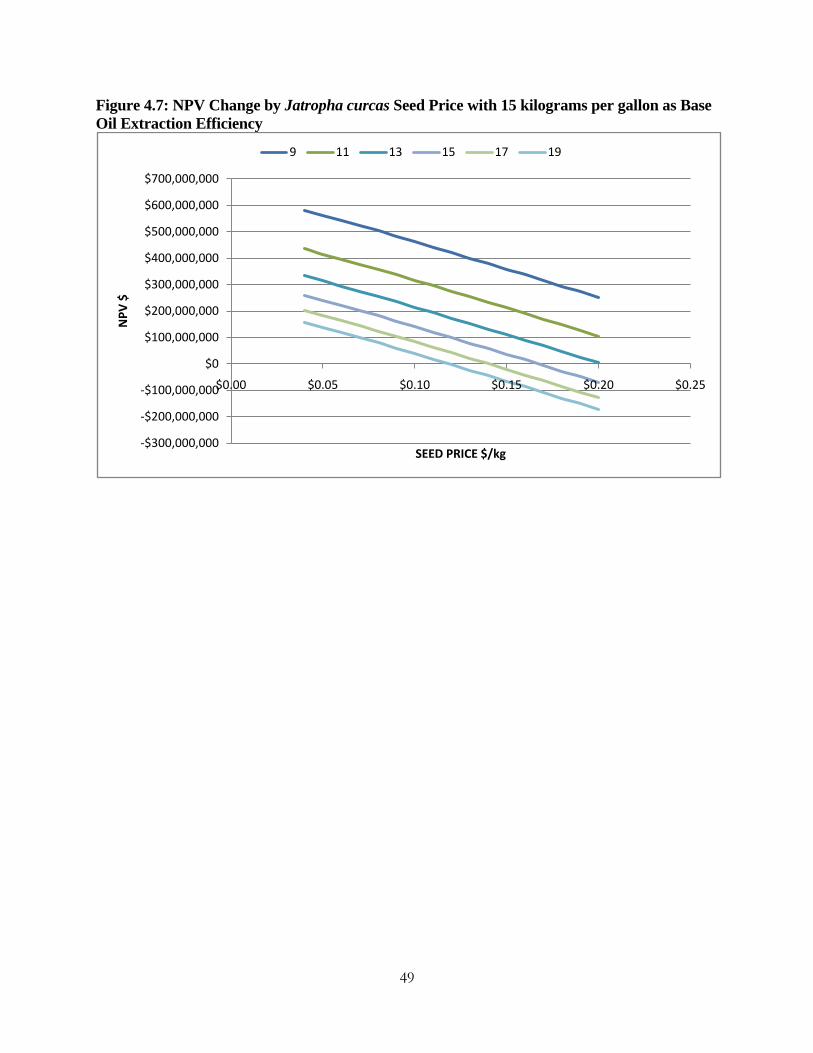
49
Figure 4.7: NPV Change by Jatropha curcas Seed Price with 15 kilograms per gallon as Base Oil Extraction Efficiency
-$300,000,000
-$200,000,000
-$100,000,000
$0
$100,000,000
$200,000,000
$300,000,000
$400,000,000
$500,000,000
$600,000,000
$700,000,000
$0.00 $0.05 $0.10 $0.15 $0.20 $0.25
NPV
$
SEED PRICE $/kg
9 11 13 15 17 19
50
CHAPTER 5: SUMMARY AND CONCLUSIONS
Biofuels, particularly biodiesel will possibly be an integral source of energy in the near future.
European nations have already been aggressively using biodiesel and it will not be long before the
rest of the world catches up. It would most likely not replace fossil fuels, but would complement
the existing sources of fuel.
This thesis compares the two available feedstock, soybean and palm oil, to the Jatropha curcas oil.
It begins with the farming side where soybean is farmed annually, and oil palm and Jatropha
curcas is farmed perennially with long term plantations in mind. Data is presented to show the
difference in profitability for the farming sector. The results can be summarized to that of soybean
being the least profitable (unless government subsidies are involved), and with palm oil and
Jatropha curcas the profitability is substantial and sustainable. Due to soybean oil and crude palm
oil being traded, the biodiesel processing part of the enterprise will purchase these bio crude oils
and process them to biodiesel. However, the Jatropha curcas processing would procure the seeds
from the plantation as an internal transfer of a vertically integrated company, crushes the seed to
get the crude oil, and finally processing the Jatropha curcas crude oil to biodiesel. The profitability
for processing of the soybean oil again does not show any great profitability and unless
government subsidies are used, it is not a sustainable enterprise. The biodiesel processing for both
palm oil and Jatropha curcas show profitability. Jatropha curcas being the better investment even
though it had crushing costs and losses absorbed from the plantation division.
Net Present Value (NPV) analysis for bio-fuel production was conducted on all three feedstock –
soybean, palm oil, and Jatropha curcas at a discount rate of 8 percent and it clearly shows that

51
Jatropha curcas and palm oil were consistent on the profitability and thus a positive NPV,
USD$164 million and USD$52 million respectively, while soybean although profitable in some
years was not as consistent and thus a negative NPV at –USD$63 million (Figure 4.5).
Net Present Value (NPV) analysis was also conducted on the Jatropha curcas biodiesel financial
data with a fixed extraction efficiency of 15 kilograms of seed per gallon of oil, and although the
data shows that price of seed and extraction efficiency may be the determining factor for the
success of this new feedstock, continued research into newer higher yielding varieties will help
compensate for the increasing prices of the Jatropha curcas feedstock and other variable and fixed
costs. Figure 4.7 shows that at the extraction efficiency of 15 kilograms of seed per gallon of oil,
the price of seed can go no higher than USD$0.165 per kilogram of seed.
This thesis does not fully show the potential of Jatropha curcas. In the time of writing this thesis,
Jatropha curcas processing for biodiesel has turned out several other by-products other than
glycerin. The seed cake can be used to obtain fertilizer, bio-gas, and animal feedstock (after
processing). The fertilizer and bio-gas products have been said to be very promising and if that is
true, then Jatropha curcas biodiesel may one day be the by-product. Future research is needed in
these areas and analyzed to show the greater potential of Jatropha curcas.
In conclusion, NPV and IRR analyses suggested that Jatropha curcas is a feasible feedstock in the
production of biodiesel and potentially more profitable than both soy and oil palm as feedstock
alternatives. The results may help guide investments in the Jatropha curcas industry with careful
attention to cost of production of Jatropha curcas seeds and the extraction technology that is
adopted at the oil processing stage of biodiesel manufacturing. The research did not incorporate
52
the potential social benefits from the development of a Jatropha curcas project into the analysis
(employment, economic development, new industries, etc.) for a country such as Indonesia or
Malaysia. It also did not identify some of the inherent challenges and opportunities in breeding,
multiplication and crop production husbandry. These must all be analyzed by future research in
order to develop a more complete economic picture of this feedstock. But in the end, the research
shows that there is indeed a feedstock that can contribute to addressing the current energy
challenges facing the global market without sacrificing food products that meet the nutrition and
food security needs of a majority of the globe’s population who live in poor countries.

53
REFERENCES
Agaceta, L.M., Dumag, P.U., and Batolos, J.A.,“ Studies on the control of snail vectors of fascioliasis: Molluscicidal activity of some indigenous plants”. In: Bureau of Animal Industry, Manila, Philippines, NSDB Technology Journal: Abstracts on Tropical Agriculture 7 (1981). 38008; 6: 2: 30–34.
Azman Ismael, Mohd. Arif Simeh, and M. Mohd. Noor, “The production Cost of Oil Palm Fresh
Fruit Bunches: the case of independent Smallholders in Johor”, Malaysian Palm Oil Board 2003.
Beckford, R.,”Competitiveness of Jatropha, Utilization Routes, and Ecological Effects” ,University
of Florida, IFAS Extension, Jatropha World Conference, Miami, Florida, 2009. Bioenergy Business, January 16, 2008, “EU ambassador hits out at US subsidy for biodiesel
exports”, http://www.bioenergy-business.com/index.cfm?section=lead&action=view&id=11007
Biodieselnow, “The Basics of Biodiesel Production 101”,
http://www.biodieselnow.com/blogs/methods/archive/2007/01/27/the-basics-of-biodiesel-production-101.aspx
Biodiesel Fuel Online, http://www.biodieselfuelonline.com/Biodiesel_Algae.html
Bourne, J.K., “Green Dreams”, National Geographic, October 2007: 38-59 Cynthia Ann Peterson. "Jatropha: The next big thing in bio-fuel?" Malaysian Business,
1 Apr. 2008 Duke, J.A. and Atchley, A.A. Proximate analysis. In: Christie, B.R. (ed.), “The handbook of plant
science in agriculture”. CRC Press, Inc. (1984), Boca Raton, FL. Duke, J.A. and Ayensu, E.S. “Medicinal plants of China”. Reference Publications (1985), Inc.
Algonac, MI. Duke, J.A. and Wain, K.K.,” Medicinal plants of the world”, 1981. Department of Energy, http://tonto.eia.doe.gov/energyexplained/index.cfm?page=oil_home EPA.GOV (1995), http://www.epa.gov/ttn/chief/ap42/ch05/final/c05s01.pdf Grainnet, “European Biodiesel Board Threatens Legal Action Against US Biodiesel Subsidies”,
http://grainnet.com/articles/European_Biodiesel_Board_Threatens_Legal_Action_Against_U_S__Biodiesel_Subsidies-49733.html, October 23, 2007.

54
Hartwell, J.L. “Plants used against cancer. A survey”. Lloydia (1971), 30-34.
Henning R.K. (1998) Use of jatropha curcas L:A household perspective and its contribution to rural employment creation. Experiences of the Jatropha Project in Mali, West Africa, 1987 to 1997
Hofstrand, D., Johanns, A., Ag Marketing Resource, Biodiesel Profitability, Iowa State University,
University Extension, 2009 HowStuffWorks.com. “What's the difference between gasoline, kerosene, diesel, etc?" 01 April
2000. http://auto.howstuffworks.com/fuel-efficiency/alternative-fuels/question105.htm> 11 July 2009.
Imelda V Abano. "FOOD VERSUS FUEL IN THE PHILIPPINES", Contemporary Review
1 Jul 2008: 151-153. INFORM. “Consequences of jatropha emphasis in Myanmar/Burma”, International News On Fats,
Oils, and other Related Materials: (1 Jun 2008): 386-387 Jongschaap, R.E.E., W.J.Corre, P.S. Bindraban and W.A.Brandenburg, 2007. Claims and Facts on
Jatropha Curcas L. Global Jatropha Curcas evaluation, breeding and propagation programme. Plant Research International B.V., Wageningen, the Netherlands, Report 158,
Journeytoforever.org, “Oil yields and characteristics”,
http://www.journeytoforever.org/biodiesel_yield2.html#fuelfats Kgathi,D.L. and Zhou, P.,” Bio-fuel use assessments in Africa: implications for greenhouse gas
emissions and mitigation strategies”. Environmental Monitoring and Assessment 38 (1995), 253-269.
Kondor, L., BioDiesel Technologies GmbH, Vienna, Austria. Asia Biodiesel Conference , Singapore, 13-14 November 2007 Lele, S.,”Biodiesel and Jatropha Cultivation”, Agrobios (2006), India. List, P.H., Horhammer, L. “Hager's handbuch der pharmazeutischen praxis”, vols 2–6. Springer-
Verlag (1969–1979), Berlin. Little, E.L., Jr., Woodbury, R.O.,Wadsworth, F.H. “Trees of Puerto Rico and the Virgin Islands”,
vol. 2. Ag. Handbook 449 (1974) , USDA, Washington, DC. Mekalilie, B.B.,Bhattacharya,T.K.,Mohammed,H.I., “Studies on compatible fuel properties of
soybean ethyl ester and its blends with diesel for fuel use in compression ignition engines”, http://www.sustech.edu/staff_publications/file.pdf
Mitchell, J.C., Rook, A. “Botanical dermatology”, Greenglass Ltd. (1979)., Vancouver.
55
Morton, J.F.,”Atlas of medicinal plants of middle America. Bahamas to Yucatan”. C.C. Thomas (1981), Springfield, IL.
Magretta, J., “Why business models matter”, Harvard Business Review, May 2002 Mongabay.com,”EU may ban palm oil biodiesel”, January 15, 2008,
http://news.mongabay.com/2008/0115-biofuels.html National Biodiesel Board, http://www.biodiesel.org/pdf_files/fuelfactsheets/prod_quality.pdf Nitske, W.R., and C.M. Wilson, “Rudolf Diesel, Pioneer of the Age of Power”,
University of Oklahoma Press, Norman, Oklahoma, 1965. Ochse, J.J.,”Vegetables of the Dutch East Indies”, (1931) Reprinted 1980. A. Asher & Co., B.V.
Amsterdam. Perry, L.M.,”Medicinal plants of east and southeast Asia”. MIT Press (1980)., Cambridge.
Peterson, C.A. "Jatropha: The next big thing in bio-fuel?" Malaysian Business, 1 Apr. 2008: 27.
Ramachandra, T.V., Krishna, S.V. and Shruthi, B.V., “Decision support system to assess regional biomass energy potential”. International Journal of Green Energy 1 (2004), 407-428.
Ramesh, A.*, Samapathrajan, A.,Venkatachalam, P., Production of biodiesel from jatropha curcas
oil by using pilot biodiesel plant, Agrl. Engg. College & Research Institute Tamil Nadu Agricultural University Coimbatore, Tamil Nadu, India
Stockmangrassfarmer.net,”Bio-fuel subsidies actually subsidize confinement stocker cattle production”. http:/stockmangrassfarmer.net/cgi-bin/page.cgi?id=671 Studenmund, A., “Using Econometrics: A practical guide”. New York: Addison-Wesley, 2006 Tao, L., Aden,A., “The economics of current and future bio-fuels”. NREL report, In Vitro
Cell.Dev.Biol, The society for In Vitro Biology, 45:199-217, 2009
Tatsuji Koizumi and Keiji Ohga, "Biofuels Polices in Asia: Trade effects on World Agricultural
and Biofuels Trade," presentation at the 2007 Agricultural Forum, Arlington, Virginia, March 2007.
Tewari, J.P. and Shukla, I.K.” Inhibition of infectivity of 2 strains of watermelon mosaic virus by
latex of some angiosperms”,. Geobios. Jodhpur, India. 9(3) (1982).:124–126. United Nations, “Small Scale Production and Use of Liquid Biofuels in Sub-Saharan Africa:
Perspective for Sustainable Development,” May 2007

56
Watt, J.M. and Breyer-Brandwijk, M.G. “The medicinal and poisonous plants of southern and eastern Africa”, 2nd ed. E.&S. Livingstone, Ltd. (1962), Edinburgh and London.
Wisegeek.com, . “What is diesel fuel?”,
http://wisegeek.com/what-is-diesel-fuel.htm
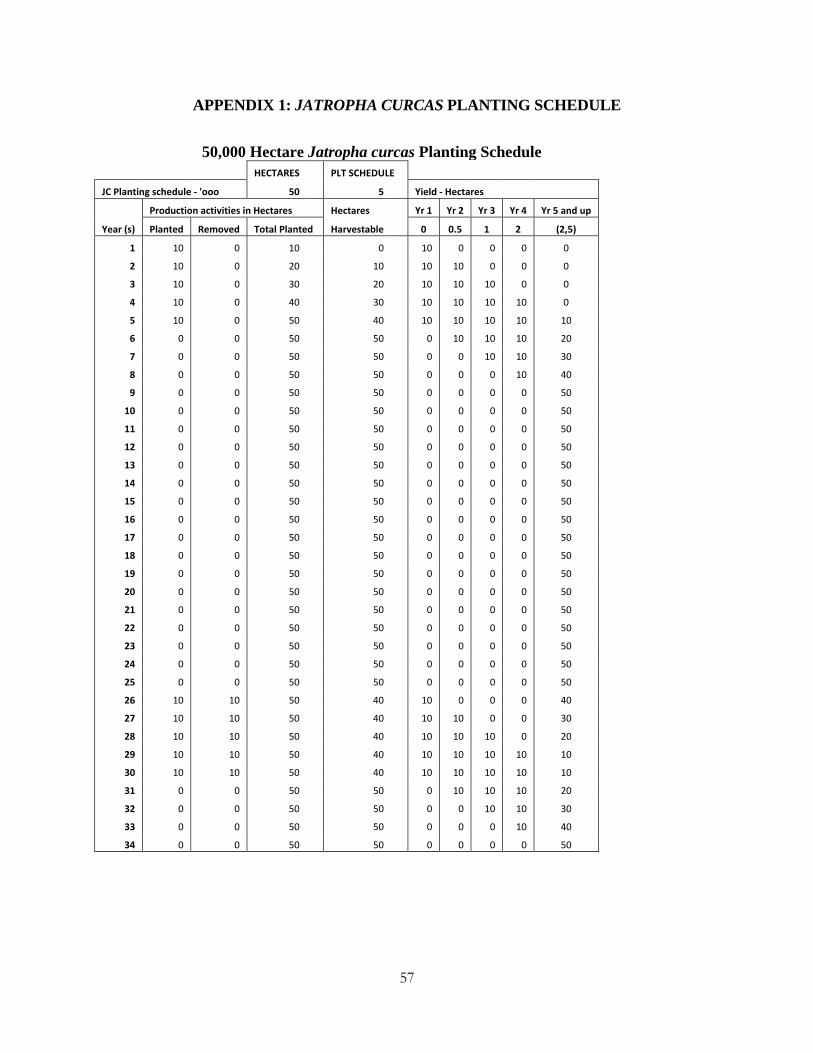
57
APPENDIX 1: JATROPHA CURCAS PLANTING SCHEDULE
50,000 Hectare Jatropha curcas Planting Schedule
HECTARES PLT SCHEDULE
JC Planting schedule - 'ooo 50 5 Yield - Hectares
Production activities in Hectares Hectares Yr 1 Yr 2 Yr 3 Yr 4 Yr 5 and up
Year (s) Planted Removed Total Planted Harvestable 0 0.5 1 2 (2,5)
1 10 0 10
0 10 0 0 0 0
2 10 0 20
10 10 10 0 0 0
3 10 0 30
20 10 10 10 0 0
4 10 0 40
30 10 10 10 10 0
5 10 0 50
40 10 10 10 10 10
6 0 0 50
50 0 10 10 10 20
7 0 0 50
50 0 0 10 10 30
8 0 0 50
50 0 0 0 10 40
9 0 0 50
50 0 0 0 0 50
10 0 0 50
50 0 0 0 0 50
11 0 0 50
50 0 0 0 0 50
12 0 0 50
50 0 0 0 0 50
13 0 0 50
50 0 0 0 0 50
14 0 0 50
50 0 0 0 0 50
15 0 0 50
50 0 0 0 0 50
16 0 0 50
50 0 0 0 0 50
17 0 0 50
50 0 0 0 0 50
18 0 0 50
50 0 0 0 0 50
19 0 0 50
50 0 0 0 0 50
20 0 0 50
50 0 0 0 0 50
21 0 0 50
50 0 0 0 0 50
22 0 0 50
50 0 0 0 0 50
23 0 0 50
50 0 0 0 0 50
24 0 0 50
50 0 0 0 0 50
25 0 0 50
50 0 0 0 0 50
26 10 10 50
40 10 0 0 0 40
27 10 10 50
40 10 10 0 0 30
28 10 10 50
40 10 10 10 0 20
29 10 10 50
40 10 10 10 10 10
30 10 10 50
40 10 10 10 10 10
31 0 0 50
50 0 10 10 10 20
32 0 0 50
50 0 0 10 10 30
33 0 0 50
50 0 0 0 10 40
34 0 0 50 50 0 0 0 0 50

58
APPENDIX 2: SOYBEAN FEEDSTOCK PRODUCTION DATA 1997 - 2010
Source: Economic Research Service, U.S. Department of Agriculture,http://www.ers.usda.gov/data/costsandreturns/testpick.htm
U.S. soybean production costs and returns per planted hectare, excluding Government payments, 1997-2008 with 2009 and 2010 forecasts
Forecast Forecast Item 1997 1998 1999 2000 2001 2002 2003 2004 2005 2006 2007 2008 2009 2010
dollars per planted hectare dollars per planted hectare dollars per planted hectareGross value of production
Primary product: Soybeans 694.89 551.45 439.84 450.83 441.36 513.97 576.91 626.29 653.76 629.71 886.45 1103.18 ` Total, gross value of production 694.89 551.45 439.84 450.83 441.36 513.97 576.91 626.29 653.76 629.71 886.45 1103.18
Operating costs:
Seed 48.73 50.56 47.57 47.39 55.82 62.89 67.75 73.41 80.60 79.81 98.26 109.59 143.52 155.99 Ferti l izer 19.77 19.77 19.67 19.45 20.56 16.78 18.26 19.99 24.86 32.25 41.60 74.17 60.71 65.98 Soil conditioners 0.25 0.25 0.25 0.35 0.27 0.27 0.30 0.32 0.32 Manure 2.13 1.98 1.95 2.08 2.69 0.99 1.14 1.19 1.48 Chemicals 65.16 65.85 61.48 55.15 56.56 42.30 41.81 39.71 33.58 35.73 36.76 40.27 43.17 44.43 Custom operations 14.46 14.43 14.48 14.68 15.15 15.22 15.62 15.76 16.48 14.85 16.09 16.20 16.51 17.10 Fuel, lube, and electricity 17.64 14.75 14.58 21.25 21.47 17.25 21.57 23.33 33.66 33.38 37.62 49.76 34.15 40.28 Repairs 23.23 23.70 24.19 25.13 26.17 24.12 24.14 26.44 27.90 29.16 30.54 31.90 32.32 33.21 Purchased irrigation water 0.12 0.12 0.12 0.15 0.15 0.30 0.30 0.32 0.32 0.27 0.28 0.30 0.27 0.30 Interest on operating capital 4.89 4.60 4.32 5.34 3.36 1.51 1.01 1.58 3.71 5.36 5.85 7.22 1.51 4.32 Total, operating costs 196.37 196.00 188.61 190.96 202.20 181.62 191.90 202.05 222.91 230.82 267.00 329.42 332.15 361.61
Allocated overhead:
Hired labor 4.79 4.89 4.97 5.02 5.04 4.55 4.69 5.04 5.02 4.40 5.55 6.42 6.60 6.77 Opportunity cost of unpaid labor 43.56 44.75 45.61 48.16 49.84 38.52 39.81 39.83 41.44 37.56 46.47 51.99 53.42 54.71 Capital recovery of machinery and equipment 122.59 125.18 127.45 132.47 137.76 106.99 107.32 117.35 123.97 149.20 183.15 205.05 217.84 225.03 Opportunity cost of land (rental rate) 189.62 191.90 197.04 197.98 202.57 199.51 202.45 207.27 214.19 212.93 259.88 287.29 298.55 306.87 Taxes and insurance 16.70 17.03 16.73 17.32 17.64 13.99 14.33 14.46 14.97 19.60 24.01 26.71 29.48 31.51 General farm overhead 33.80 31.97 34.92 35.98 37.49 28.10 28.81 29.31 30.81 32.67 40.21 44.62 45.79 47.05 Total, allocated overhead 411.08 415.72 426.72 436.92 450.34 391.65 397.41 413.25 430.40 456.34 559.27 622.09 651.68 671.94
Total costs l isted 607.45 611.72 615.33 627.88 652.54 573.27 589.31 615.30 653.31 687.16 826.27 951.51 398.15 418.27
Value of production less total costs l isted 87.45 -60.27 -175.49 -177.05 -211.18 -59.30 -12.40 10.99 0.46 -57.45 60.18 151.67Value of production less operating costs 498.52 355.45 251.23 259.88 239.16 332.35 385.01 424.24 430.85 398.89 619.45 773.76
Supporting information: Yield (bushels per planted hectare) 106.25 106.25 98.84 101.31 106.35 98.84 87.94 111.84 115.10 113.67 111.55 105.23 Price (dollars per bushedl at harvest) 6.54 5.19 4.45 4.45 4.15 5.20 6.56 5.60 5.68 5.54 7.95 10.48 Enterprise size (planted hectares) 1/ 543.62 543.62 543.62 543.62 543.62 662.23 662.23 662.23 662.23 748.71 748.71 748.71 Production practices: 1/ Irrigated (percent) 5 5 5 5 5 9 9 9 9 9 9 9 Dryland (percent) 95 95 95 95 95 91 91 91 91 91 91 91
HECTARES PLANTED
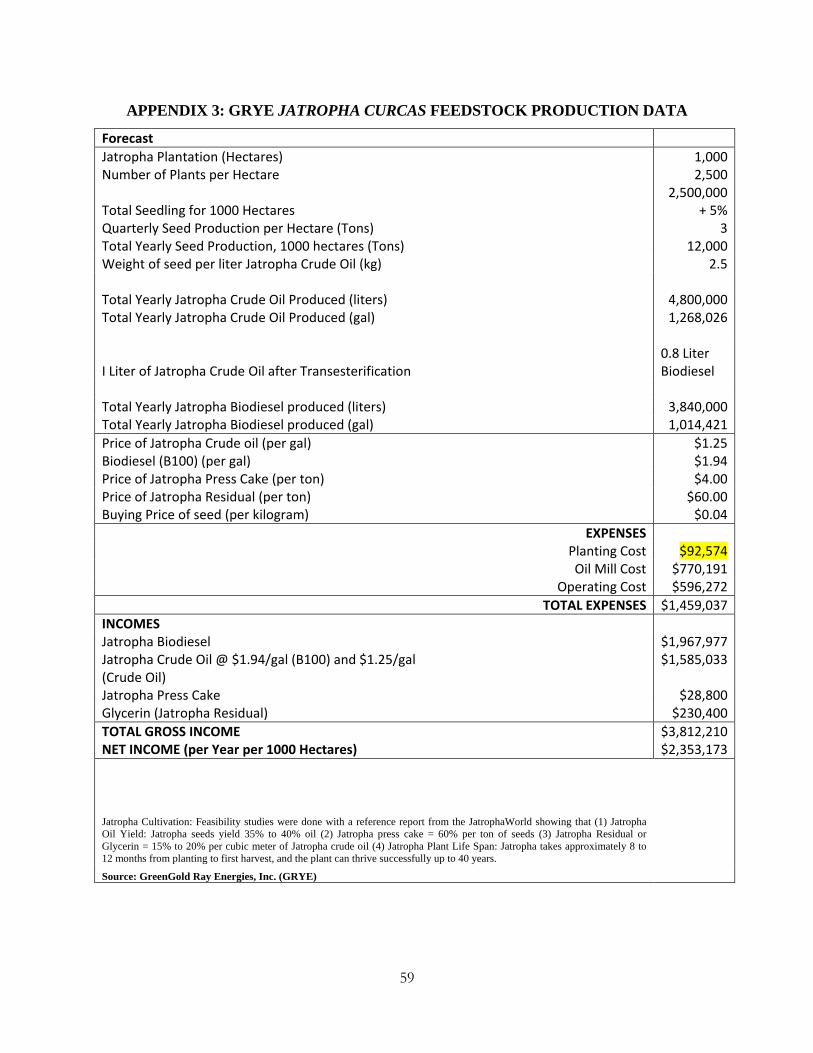
59
APPENDIX 3: GRYE JATROPHA CURCAS FEEDSTOCK PRODUCTION DATA
Forecast Jatropha Plantation (Hectares) 1,000 Number of Plants per Hectare 2,500
Total Seedling for 1000 Hectares 2,500,000
+ 5% Quarterly Seed Production per Hectare (Tons) 3 Total Yearly Seed Production, 1000 hectares (Tons) 12,000 Weight of seed per liter Jatropha Crude Oil (kg) 2.5 Total Yearly Jatropha Crude Oil Produced (liters) 4,800,000 Total Yearly Jatropha Crude Oil Produced (gal) 1,268,026
I Liter of Jatropha Crude Oil after Transesterification 0.8 Liter Biodiesel
Total Yearly Jatropha Biodiesel produced (liters) 3,840,000 Total Yearly Jatropha Biodiesel produced (gal) 1,014,421 Price of Jatropha Crude oil (per gal) $1.25 Biodiesel (B100) (per gal) $1.94 Price of Jatropha Press Cake (per ton) $4.00 Price of Jatropha Residual (per ton) $60.00 Buying Price of seed (per kilogram) $0.04
EXPENSES Planting Cost $92,574 Oil Mill Cost $770,191
Operating Cost $596,272 TOTAL EXPENSES $1,459,037
INCOMES Jatropha Biodiesel $1,967,977 Jatropha Crude Oil @ $1.94/gal (B100) and $1.25/gal $1,585,033 (Crude Oil) Jatropha Press Cake $28,800 Glycerin (Jatropha Residual) $230,400 TOTAL GROSS INCOME $3,812,210 NET INCOME (per Year per 1000 Hectares) $2,353,173
Jatropha Cultivation: Feasibility studies were done with a reference report from the JatrophaWorld showing that (1) Jatropha Oil Yield: Jatropha seeds yield 35% to 40% oil (2) Jatropha press cake = 60% per ton of seeds (3) Jatropha Residual or Glycerin = 15% to 20% per cubic meter of Jatropha crude oil (4) Jatropha Plant Life Span: Jatropha takes approximately 8 to 12 months from planting to first harvest, and the plant can thrive successfully up to 40 years. Source: GreenGold Ray Energies, Inc. (GRYE)
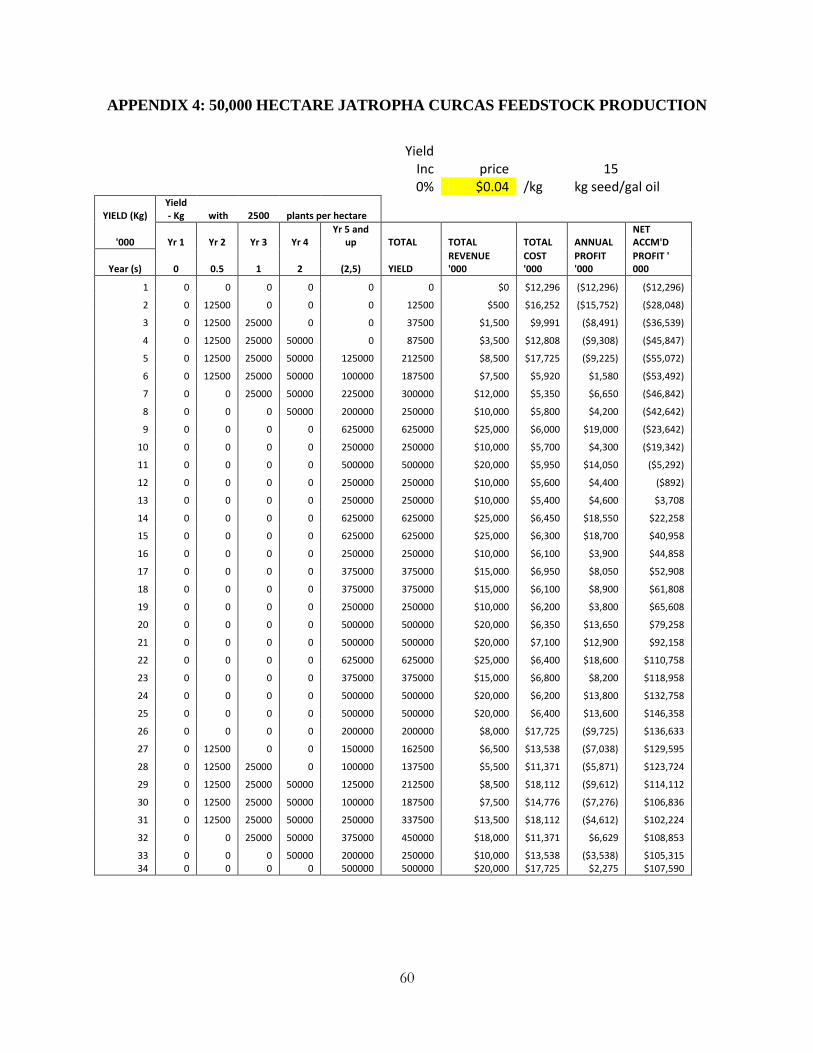
60
APPENDIX 4: 50,000 HECTARE JATROPHA CURCAS FEEDSTOCK PRODUCTION
Yield Inc price
15
0% $0.04 /kg kg seed/gal oil
YIELD (Kg) Yield - Kg with 2500 plants per hectare
'000 Yr 1 Yr 2 Yr 3 Yr 4
Yr 5 and up TOTAL TOTAL TOTAL ANNUAL
NET ACCM'D
Year (s) 0 0.5 1 2 (2,5) YIELD REVENUE '000
COST '000
PROFIT '000
PROFIT ' 000
1 0 0 0 0 0 0 $0 $12,296 ($12,296) ($12,296)
2 0 12500 0 0 0 12500 $500 $16,252 ($15,752) ($28,048)
3 0 12500 25000 0 0 37500 $1,500 $9,991 ($8,491) ($36,539)
4 0 12500 25000 50000 0 87500 $3,500 $12,808 ($9,308) ($45,847)
5 0 12500 25000 50000 125000 212500 $8,500 $17,725 ($9,225) ($55,072)
6 0 12500 25000 50000 100000 187500 $7,500 $5,920 $1,580 ($53,492)
7 0 0 25000 50000 225000 300000 $12,000 $5,350 $6,650 ($46,842)
8 0 0 0 50000 200000 250000 $10,000 $5,800 $4,200 ($42,642)
9 0 0 0 0 625000 625000 $25,000 $6,000 $19,000 ($23,642)
10 0 0 0 0 250000 250000 $10,000 $5,700 $4,300 ($19,342)
11 0 0 0 0 500000 500000 $20,000 $5,950 $14,050 ($5,292)
12 0 0 0 0 250000 250000 $10,000 $5,600 $4,400 ($892)
13 0 0 0 0 250000 250000 $10,000 $5,400 $4,600 $3,708
14 0 0 0 0 625000 625000 $25,000 $6,450 $18,550 $22,258
15 0 0 0 0 625000 625000 $25,000 $6,300 $18,700 $40,958
16 0 0 0 0 250000 250000 $10,000 $6,100 $3,900 $44,858
17 0 0 0 0 375000 375000 $15,000 $6,950 $8,050 $52,908
18 0 0 0 0 375000 375000 $15,000 $6,100 $8,900 $61,808
19 0 0 0 0 250000 250000 $10,000 $6,200 $3,800 $65,608
20 0 0 0 0 500000 500000 $20,000 $6,350 $13,650 $79,258
21 0 0 0 0 500000 500000 $20,000 $7,100 $12,900 $92,158
22 0 0 0 0 625000 625000 $25,000 $6,400 $18,600 $110,758
23 0 0 0 0 375000 375000 $15,000 $6,800 $8,200 $118,958
24 0 0 0 0 500000 500000 $20,000 $6,200 $13,800 $132,758
25 0 0 0 0 500000 500000 $20,000 $6,400 $13,600 $146,358
26 0 0 0 0 200000 200000 $8,000 $17,725 ($9,725) $136,633
27 0 12500 0 0 150000 162500 $6,500 $13,538 ($7,038) $129,595
28 0 12500 25000 0 100000 137500 $5,500 $11,371 ($5,871) $123,724
29 0 12500 25000 50000 125000 212500 $8,500 $18,112 ($9,612) $114,112
30 0 12500 25000 50000 100000 187500 $7,500 $14,776 ($7,276) $106,836
31 0 12500 25000 50000 250000 337500 $13,500 $18,112 ($4,612) $102,224
32 0 0 25000 50000 375000 450000 $18,000 $11,371 $6,629 $108,853
33 0 0 0 50000 200000 250000 $10,000 $13,538 ($3,538) $105,315 34 0 0 0 0 500000 500000 $20,000 $17,725 $2,275 $107,590

61
APPENDIX 5: JATROPHA CURCAS BIODIESEL DATA
8%
FROM 50 K Plantation 30 mil capacity
$0.10 15
kg per gal Biodiesel Glycerin price per Kg
kg seed/gal oil
Year Yield 15 Price Biodiesel Price Total Variable Total Fixed Annual Cumulative
gal Per Gal Rev Per Gal Rev Cost Cost Profit/(loss) Profit/(loss)
-1 0 0 $0 $0 $0 $0 $0 $34,394,750 -$34,394,750 -$34,394,750
0 0 0 $0 $0 $0 $0 $0 $50,100,750 -$50,100,750 -$84,495,500
1 0 0 $3.09 $0 $0.03 $0 $0 $11,339,750 -$11,339,750 -$95,835,250
2 12,500,000 833,333 $3.16 $2,631,250 $0.03 $2,653,750 $1,851,831 $9,156,750 -$8,354,831 -
$104,190,081
3 37,500,000 2,500,000 $3.17 $7,912,500 $0.03 $7,980,000 $5,566,265 $5,098,750 -$2,685,015 -
$106,875,095
4 87,500,000 5,833,333 $3.20 $18,652,083 $0.03 $18,809,583 $12,934,037 $5,098,750 $776,796 -
$106,098,299
5 186,250,000 12,416,667 $3.22 $39,981,667 $0.03 $40,316,917 $27,464,374 $5,098,750 $7,753,793 -$98,344,506
6 275,000,000 18,333,333 $3.29 $60,339,583 $0.03 $60,834,583 $40,562,541 $5,098,750 $15,173,293 -$83,171,213
7 318,750,000 21,250,000 $3.44 $73,126,563 $0.03 $73,700,313 $48,834,387 $5,098,750 $19,767,176 -$63,404,038
8 410,000,000 27,333,333 $3.74 $102,281,333 $0.03 $103,019,333 $63,976,161 $5,098,750 $33,944,422 -$29,459,616
9 418,750,000 27,916,667 $3.92 $109,468,229 $0.03 $110,221,979 $67,031,041 $5,098,750 $38,092,188 $8,632,572
10 450,000,000 30,000,000 $4.28 $128,325,000 $0.03 $129,135,000 $71,990,266 $5,098,750 $52,045,984 $60,678,557
11 437,500,000 29,166,667 $4.68 $136,427,083 $0.03 $137,214,583 $68,897,581 $5,098,750 $63,218,252 $123,896,809
12 450,000,000 30,000,000 $5.16 $154,912,500 $0.03 $155,722,500 $70,190,824 $5,098,750 $80,432,926 $204,329,734
13 437,500,000 29,166,667 $4.98 $145,213,542 $0.03 $146,001,042 $67,365,248 $5,098,750 $73,537,043 $277,866,778
14 406,250,000 27,083,333 $5.26 $142,350,000 $0.03 $143,081,250 $62,277,305 $5,098,750 $75,705,195 $353,571,973
15 418,750,000 27,916,667 $5.51 $153,820,833 $0.03 $154,574,583 $64,647,825 $5,098,750 $84,828,009 $438,399,981
16 437,500,000 29,166,667 $5.47 $159,468,750 $0.03 $160,256,250 $67,668,189 $5,098,750 $87,489,311 $525,889,293
17 412,500,000 27,500,000 $4.88 $134,117,500 $0.03 $134,860,000 $63,682,932 $5,098,750 $66,078,318 $591,967,611
18 450,000,000 30,000,000 $4.43 $132,975,000 $0.03 $133,785,000 $68,918,897 $5,098,750 $59,767,353 $651,734,963
19 437,500,000 29,166,667 $3.65 $106,312,500 $0.03 $107,100,000 $66,307,142 $5,098,750 $35,694,108 $687,429,071
20 450,000,000 30,000,000 $3.19 $95,737,500 $0.03 $96,547,500 $67,816,374 $5,098,750 $23,632,376 $711,061,447
IRR 18%
NPV $164,358,919
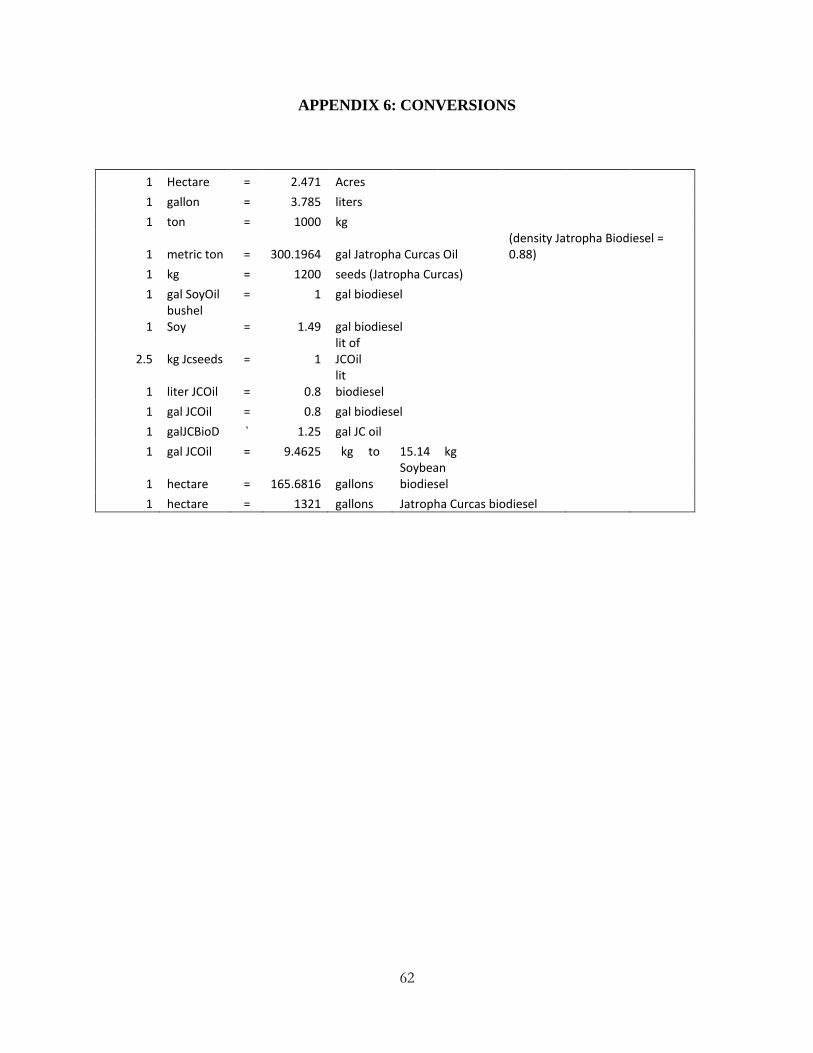
62
APPENDIX 6: CONVERSIONS
1 Hectare = 2.471 Acres 1 gallon = 3.785 liters
1 ton = 1000 kg
1 metric ton = 300.1964 gal Jatropha Curcas Oil (density Jatropha Biodiesel = 0.88)
1 kg = 1200 seeds (Jatropha Curcas)
1 gal SoyOil = 1 gal biodiesel
1 bushel Soy = 1.49 gal biodiesel
2.5 kg Jcseeds = 1 lit of JCOil
1 liter JCOil = 0.8 lit biodiesel
1 gal JCOil = 0.8 gal biodiesel
1 galJCBioD ` 1.25 gal JC oil
1 gal JCOil = 9.4625 kg to 15.14 kg
1 hectare = 165.6816 gallons Soybean biodiesel
1 hectare = 1321 gallons Jatropha Curcas biodiesel
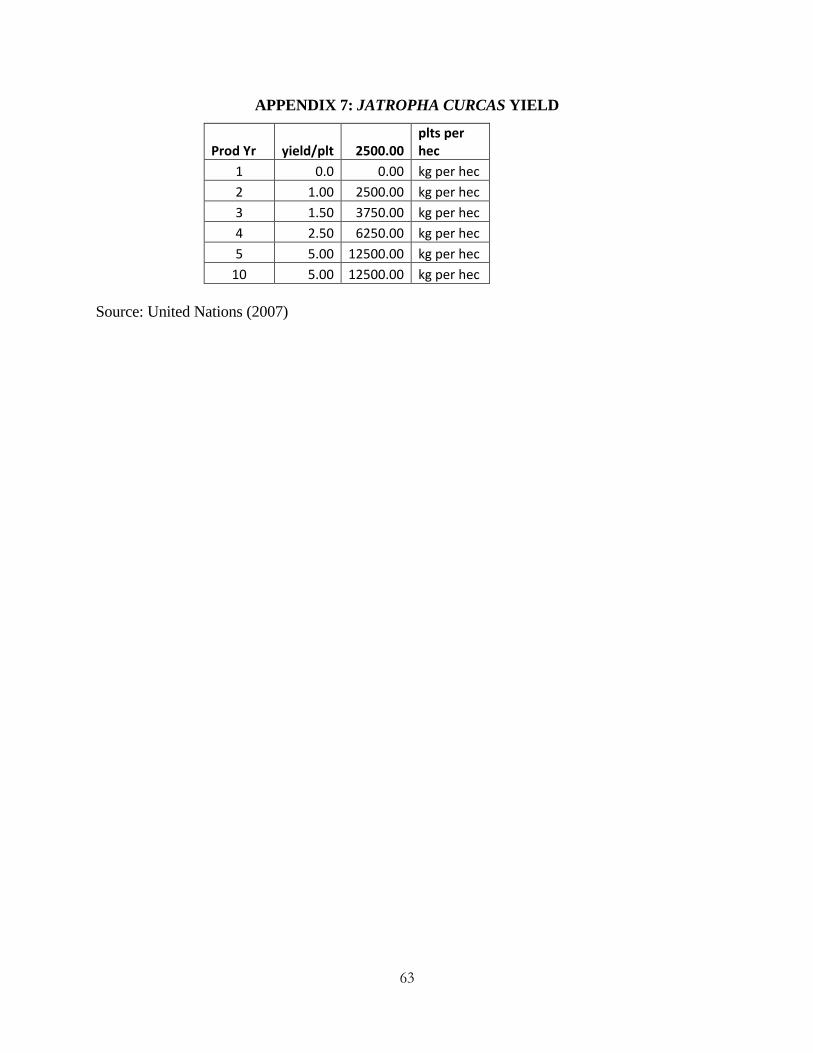
63
APPENDIX 7: JATROPHA CURCAS YIELD
Prod Yr yield/plt 2500.00 plts per hec
1 0.0 0.00 kg per hec 2 1.00 2500.00 kg per hec 3 1.50 3750.00 kg per hec 4 2.50 6250.00 kg per hec 5 5.00 12500.00 kg per hec
10 5.00 12500.00 kg per hec Source: United Nations (2007)
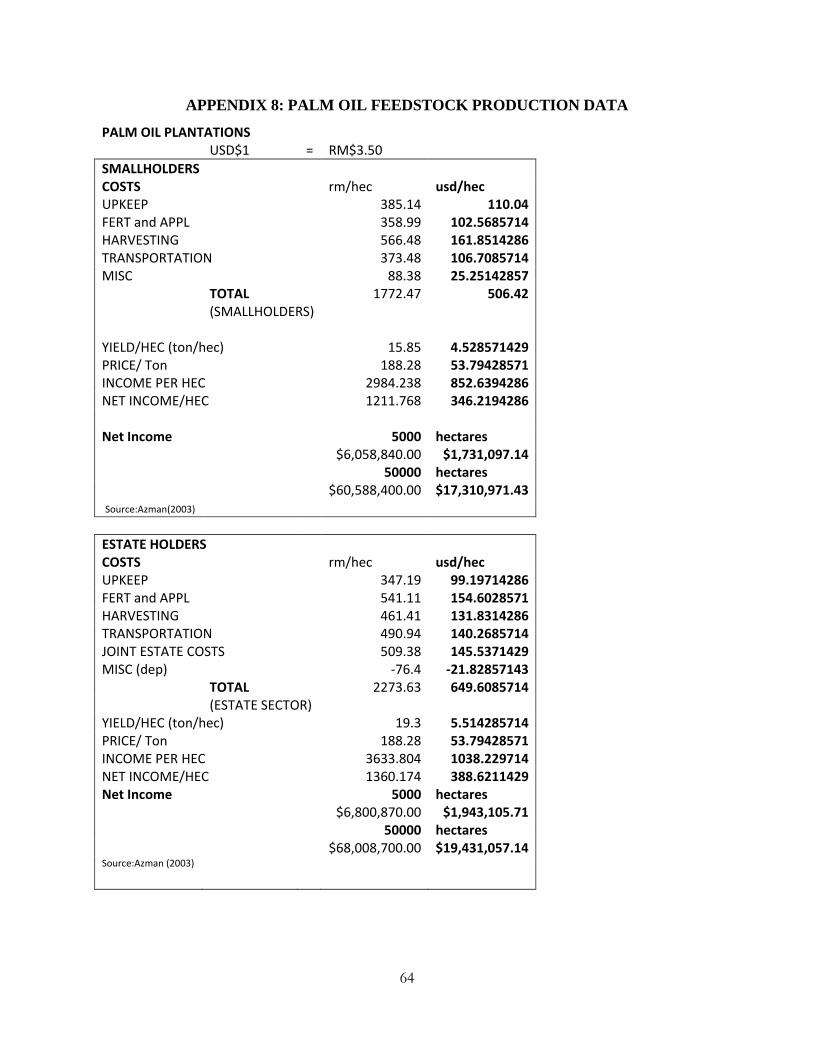
64
APPENDIX 8: PALM OIL FEEDSTOCK PRODUCTION DATA
PALM OIL PLANTATIONS
USD$1 = RM$3.50
SMALLHOLDERS COSTS
rm/hec usd/hec
UPKEEP
385.14 110.04 FERT and APPL
358.99 102.5685714
HARVESTING
566.48 161.8514286 TRANSPORTATION
373.48 106.7085714
MISC
88.38 25.25142857 TOTAL
1772.47 506.42
(SMALLHOLDERS)
YIELD/HEC (ton/hec) 15.85 4.528571429 PRICE/ Ton
188.28 53.79428571
INCOME PER HEC
2984.238 852.6394286 NET INCOME/HEC
1211.768 346.2194286
Net Income
5000 hectares
$6,058,840.00 $1,731,097.14
50000 hectares
$60,588,400.00 $17,310,971.43 Source:Azman(2003)
ESTATE HOLDERS COSTS
rm/hec usd/hec
UPKEEP
347.19 99.19714286 FERT and APPL
541.11 154.6028571
HARVESTING
461.41 131.8314286 TRANSPORTATION
490.94 140.2685714
JOINT ESTATE COSTS 509.38 145.5371429 MISC (dep)
-76.4 -21.82857143
TOTAL
2273.63 649.6085714 (ESTATE SECTOR)
YIELD/HEC (ton/hec) 19.3 5.514285714 PRICE/ Ton
188.28 53.79428571
INCOME PER HEC
3633.804 1038.229714 NET INCOME/HEC
1360.174 388.6211429
Net Income
5000 hectares
$6,800,870.00 $1,943,105.71
50000 hectares
$68,008,700.00 $19,431,057.14
Source:Azman (2003)
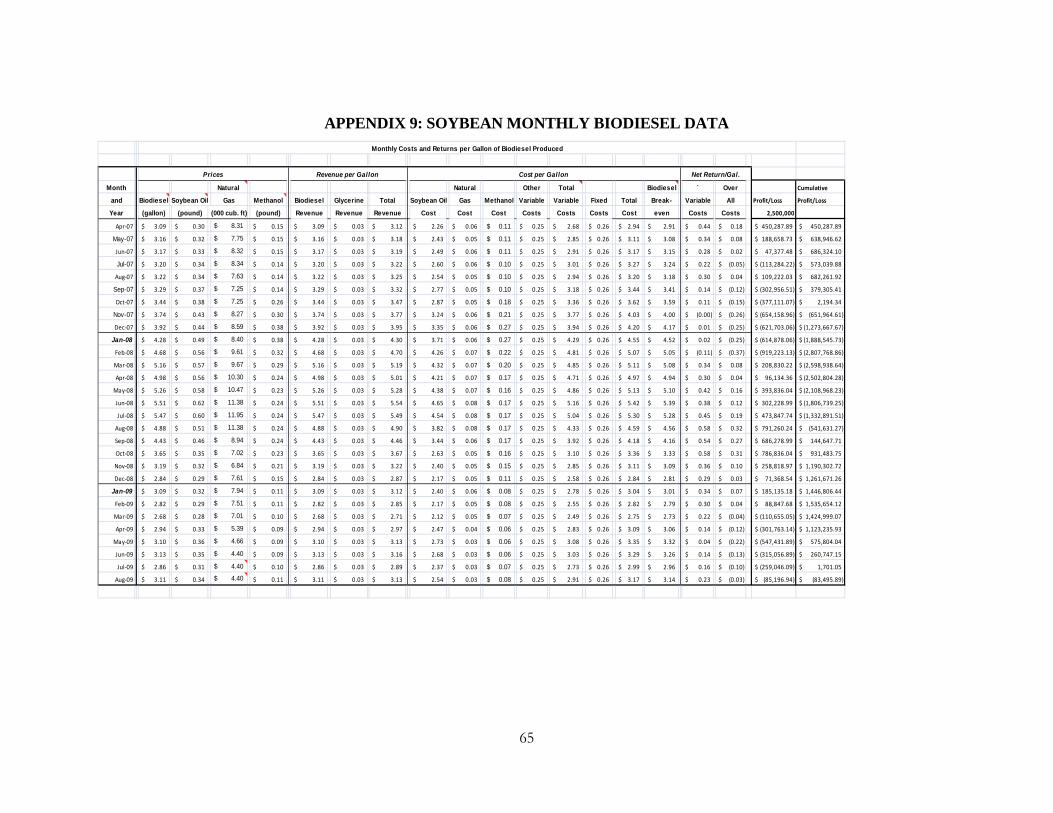
65
APPENDIX 9: SOYBEAN MONTHLY BIODIESEL DATA
Month Natural Natural Other Total Biodiesel ` Over Cumulative
and Biodiesel Soybean Oil Gas Methanol Biodiesel Glycerine Total Soybean Oil Gas Methanol Variable Variable Fixed Total Break- Variable All Profit/Loss Profit/Loss
Year (gallon) (pound) (000 cub. ft) (pound) Revenue Revenue Revenue Cost Cost Cost Costs Costs Costs Cost even Costs Costs 2,500,000
Apr-07 3.09$ 0.30$ $ 8.31 0.15$ 3.09$ 0.03$ 3.12$ 2.26$ 0.06$ 0.11$ 0.25$ 2.68$ 0.26$ 2.94$ 2.91$ 0.44$ 0.18$ 450,287.89$ 450,287.89$
May-07 3.16$ 0.32$ $ 7.75 0.15$ 3.16$ 0.03$ 3.18$ 2.43$ 0.05$ 0.11$ 0.25$ 2.85$ 0.26$ 3.11$ 3.08$ 0.34$ 0.08$ 188,658.73$ 638,946.62$
Jun-07 3.17$ 0.33$ $ 8.32 0.15$ 3.17$ 0.03$ 3.19$ 2.49$ 0.06$ 0.11$ 0.25$ 2.91$ 0.26$ 3.17$ 3.15$ 0.28$ 0.02$ 47,377.48$ 686,324.10$
Jul-07 3.20$ 0.34$ $ 8.34 0.14$ 3.20$ 0.03$ 3.22$ 2.60$ 0.06$ 0.10$ 0.25$ 3.01$ 0.26$ 3.27$ 3.24$ 0.22$ (0.05)$ (113,284.22)$ 573,039.88$
Aug-07 3.22$ 0.34$ $ 7.63 0.14$ 3.22$ 0.03$ 3.25$ 2.54$ 0.05$ 0.10$ 0.25$ 2.94$ 0.26$ 3.20$ 3.18$ 0.30$ 0.04$ 109,222.03$ 682,261.92$
Sep-07 3.29$ 0.37$ $ 7.25 0.14$ 3.29$ 0.03$ 3.32$ 2.77$ 0.05$ 0.10$ 0.25$ 3.18$ 0.26$ 3.44$ 3.41$ 0.14$ (0.12)$ (302,956.51)$ 379,305.41$
Oct-07 3.44$ 0.38$ $ 7.25 0.26$ 3.44$ 0.03$ 3.47$ 2.87$ 0.05$ 0.18$ 0.25$ 3.36$ 0.26$ 3.62$ 3.59$ 0.11$ (0.15)$ (377,111.07)$ 2,194.34$
Nov-07 3.74$ 0.43$ $ 8.27 0.30$ 3.74$ 0.03$ 3.77$ 3.24$ 0.06$ 0.21$ 0.25$ 3.77$ 0.26$ 4.03$ 4.00$ (0.00)$ (0.26)$ (654,158.96)$ (651,964.61)$
Dec-07 3.92$ 0.44$ $ 8.59 0.38$ 3.92$ 0.03$ 3.95$ 3.35$ 0.06$ 0.27$ 0.25$ 3.94$ 0.26$ 4.20$ 4.17$ 0.01$ (0.25)$ (621,703.06)$ (1,273,667.67)$
Jan-08 4.28$ 0.49$ $ 8.40 0.38$ 4.28$ 0.03$ 4.30$ 3.71$ 0.06$ 0.27$ 0.25$ 4.29$ 0.26$ 4.55$ 4.52$ 0.02$ (0.25)$ (614,878.06)$ (1,888,545.73)$
Feb-08 4.68$ 0.56$ $ 9.61 0.32$ 4.68$ 0.03$ 4.70$ 4.26$ 0.07$ 0.22$ 0.25$ 4.81$ 0.26$ 5.07$ 5.05$ (0.11)$ (0.37)$ (919,223.13)$ (2,807,768.86)$
Mar-08 5.16$ 0.57$ $ 9.67 0.29$ 5.16$ 0.03$ 5.19$ 4.32$ 0.07$ 0.20$ 0.25$ 4.85$ 0.26$ 5.11$ 5.08$ 0.34$ 0.08$ 208,830.22$ (2,598,938.64)$
Apr-08 4.98$ 0.56$ $ 10.30 0.24$ 4.98$ 0.03$ 5.01$ 4.21$ 0.07$ 0.17$ 0.25$ 4.71$ 0.26$ 4.97$ 4.94$ 0.30$ 0.04$ 96,134.36$ (2,502,804.28)$
May-08 5.26$ 0.58$ $ 10.47 0.23$ 5.26$ 0.03$ 5.28$ 4.38$ 0.07$ 0.16$ 0.25$ 4.86$ 0.26$ 5.13$ 5.10$ 0.42$ 0.16$ 393,836.04$ (2,108,968.23)$
Jun-08 5.51$ 0.62$ $ 11.38 0.24$ 5.51$ 0.03$ 5.54$ 4.65$ 0.08$ 0.17$ 0.25$ 5.16$ 0.26$ 5.42$ 5.39$ 0.38$ 0.12$ 302,228.99$ (1,806,739.25)$
Jul-08 5.47$ 0.60$ $ 11.95 0.24$ 5.47$ 0.03$ 5.49$ 4.54$ 0.08$ 0.17$ 0.25$ 5.04$ 0.26$ 5.30$ 5.28$ 0.45$ 0.19$ 473,847.74$ (1,332,891.51)$
Aug-08 4.88$ 0.51$ $ 11.38 0.24$ 4.88$ 0.03$ 4.90$ 3.82$ 0.08$ 0.17$ 0.25$ 4.33$ 0.26$ 4.59$ 4.56$ 0.58$ 0.32$ 791,260.24$ (541,631.27)$
Sep-08 4.43$ 0.46$ $ 8.94 0.24$ 4.43$ 0.03$ 4.46$ 3.44$ 0.06$ 0.17$ 0.25$ 3.92$ 0.26$ 4.18$ 4.16$ 0.54$ 0.27$ 686,278.99$ 144,647.71$
Oct-08 3.65$ 0.35$ $ 7.02 0.23$ 3.65$ 0.03$ 3.67$ 2.63$ 0.05$ 0.16$ 0.25$ 3.10$ 0.26$ 3.36$ 3.33$ 0.58$ 0.31$ 786,836.04$ 931,483.75$
Nov-08 3.19$ 0.32$ $ 6.84 0.21$ 3.19$ 0.03$ 3.22$ 2.40$ 0.05$ 0.15$ 0.25$ 2.85$ 0.26$ 3.11$ 3.09$ 0.36$ 0.10$ 258,818.97$ 1,190,302.72$
Dec-08 2.84$ 0.29$ $ 7.61 0.15$ 2.84$ 0.03$ 2.87$ 2.17$ 0.05$ 0.11$ 0.25$ 2.58$ 0.26$ 2.84$ 2.81$ 0.29$ 0.03$ 71,368.54$ 1,261,671.26$
Jan-09 3.09$ 0.32$ $ 7.94 0.11$ 3.09$ 0.03$ 3.12$ 2.40$ 0.06$ 0.08$ 0.25$ 2.78$ 0.26$ 3.04$ 3.01$ 0.34$ 0.07$ 185,135.18$ 1,446,806.44$
Feb-09 2.82$ 0.29$ $ 7.51 0.11$ 2.82$ 0.03$ 2.85$ 2.17$ 0.05$ 0.08$ 0.25$ 2.55$ 0.26$ 2.82$ 2.79$ 0.30$ 0.04$ 88,847.68$ 1,535,654.12$
Mar-09 2.68$ 0.28$ $ 7.01 0.10$ 2.68$ 0.03$ 2.71$ 2.12$ 0.05$ 0.07$ 0.25$ 2.49$ 0.26$ 2.75$ 2.73$ 0.22$ (0.04)$ (110,655.05)$ 1,424,999.07$
Apr-09 2.94$ 0.33$ $ 5.39 0.09$ 2.94$ 0.03$ 2.97$ 2.47$ 0.04$ 0.06$ 0.25$ 2.83$ 0.26$ 3.09$ 3.06$ 0.14$ (0.12)$ (301,763.14)$ 1,123,235.93$
May-09 3.10$ 0.36$ $ 4.66 0.09$ 3.10$ 0.03$ 3.13$ 2.73$ 0.03$ 0.06$ 0.25$ 3.08$ 0.26$ 3.35$ 3.32$ 0.04$ (0.22)$ (547,431.89)$ 575,804.04$
Jun-09 3.13$ 0.35$ $ 4.40 0.09$ 3.13$ 0.03$ 3.16$ 2.68$ 0.03$ 0.06$ 0.25$ 3.03$ 0.26$ 3.29$ 3.26$ 0.14$ (0.13)$ (315,056.89)$ 260,747.15$
Jul-09 2.86$ 0.31$ $ 4.40 0.10$ 2.86$ 0.03$ 2.89$ 2.37$ 0.03$ 0.07$ 0.25$ 2.73$ 0.26$ 2.99$ 2.96$ 0.16$ (0.10)$ (259,046.09)$ 1,701.05$
Aug-09 3.11$ 0.34$ $ 4.40 0.11$ 3.11$ 0.03$ 3.13$ 2.54$ 0.03$ 0.08$ 0.25$ 2.91$ 0.26$ 3.17$ 3.14$ 0.23$ (0.03)$ (85,196.94)$ (83,495.89)$
Monthly Costs and Returns per Gallon of Biodiesel Produced
Prices Revenue per Gallon Cost per Gallon Net Return/Gal.
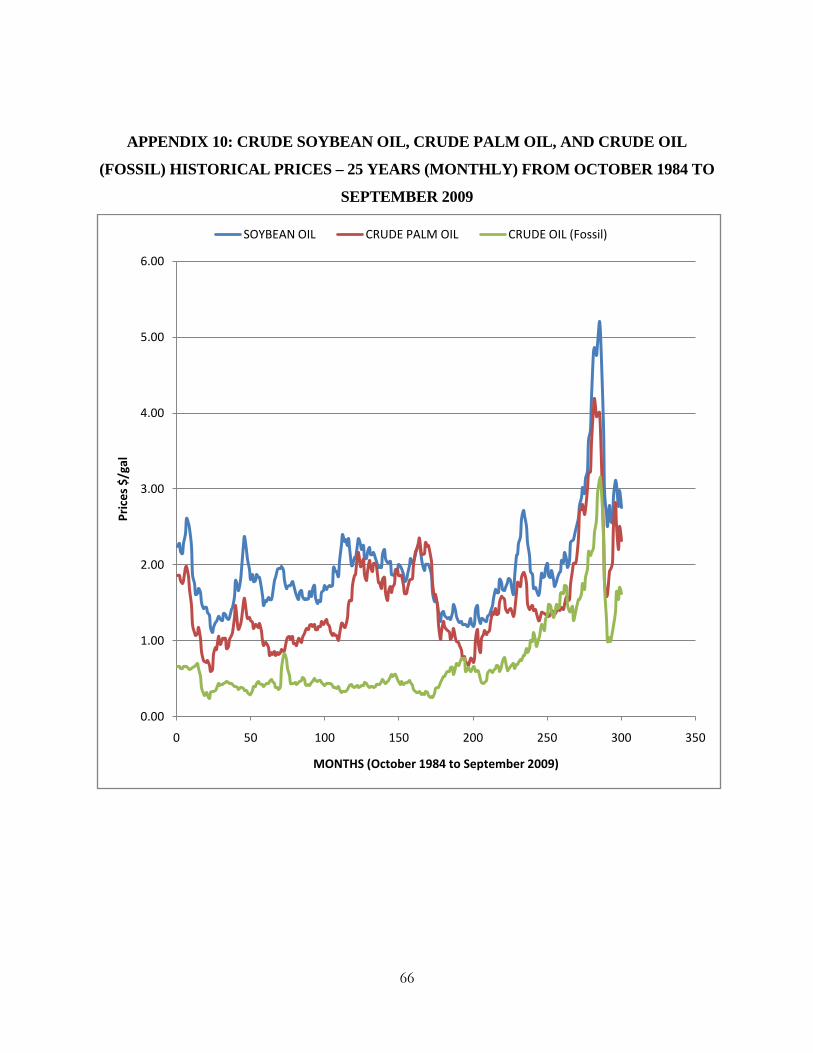
66
APPENDIX 10: CRUDE SOYBEAN OIL, CRUDE PALM OIL, AND CRUDE OIL
(FOSSIL) HISTORICAL PRICES – 25 YEARS (MONTHLY) FROM OCTOBER 1984 TO
SEPTEMBER 2009
0.00
1.00
2.00
3.00
4.00
5.00
6.00
0 50 100 150 200 250 300 350
Pric
es $
/gal
MONTHS (October 1984 to September 2009)
SOYBEAN OIL CRUDE PALM OIL CRUDE OIL (Fossil)
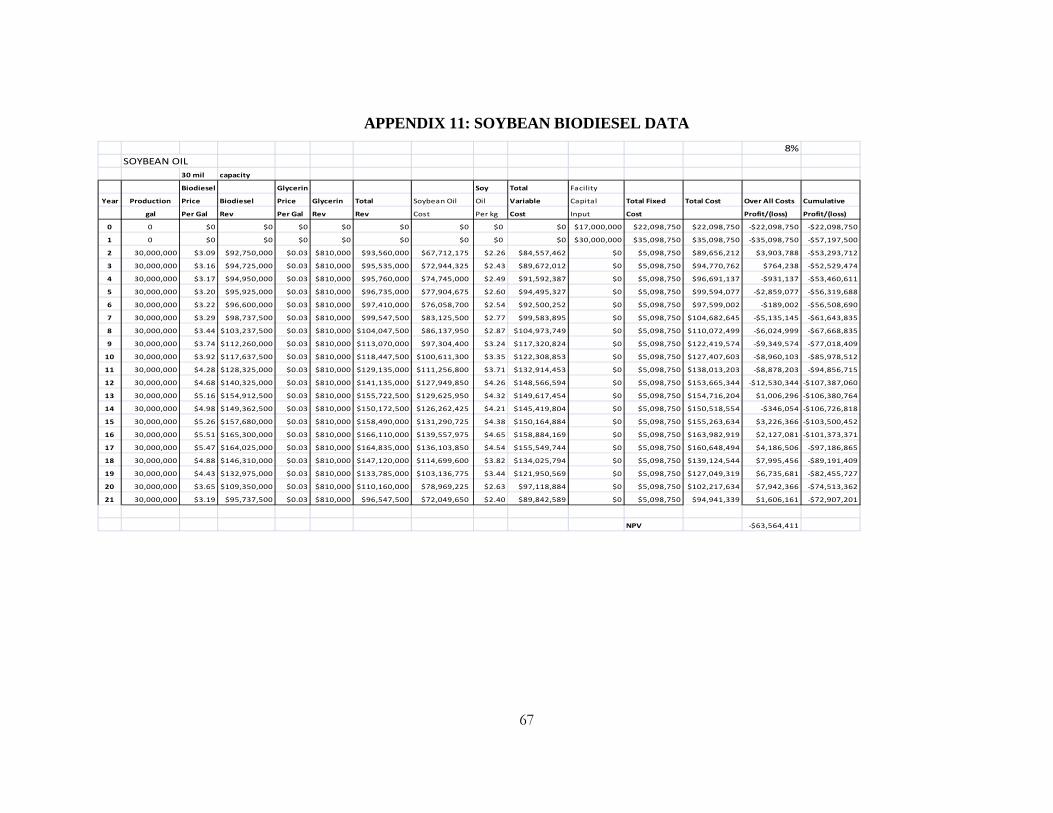
67
APPENDIX 11: SOYBEAN BIODIESEL DATA
8%SOYBEAN OIL
30 mil capacity
Biodiesel Glycerin Soy Total Facility
Year Production Price Biodiesel Price Glycerin Total Soybean Oil Oil Variable Capital Total Fixed Total Cost Over All Costs Cumulative
gal Per Gal Rev Per Gal Rev Rev Cost Per kg Cost Input Cost Profit/(loss) Profit/(loss)
0 0 $0 $0 $0 $0 $0 $0 $0 $0 $17,000,000 $22,098,750 $22,098,750 -$22,098,750 -$22,098,750
1 0 $0 $0 $0 $0 $0 $0 $0 $0 $30,000,000 $35,098,750 $35,098,750 -$35,098,750 -$57,197,500
2 30,000,000 $3.09 $92,750,000 $0.03 $810,000 $93,560,000 $67,712,175 $2.26 $84,557,462 $0 $5,098,750 $89,656,212 $3,903,788 -$53,293,712
3 30,000,000 $3.16 $94,725,000 $0.03 $810,000 $95,535,000 $72,944,325 $2.43 $89,672,012 $0 $5,098,750 $94,770,762 $764,238 -$52,529,474
4 30,000,000 $3.17 $94,950,000 $0.03 $810,000 $95,760,000 $74,745,000 $2.49 $91,592,387 $0 $5,098,750 $96,691,137 -$931,137 -$53,460,611
5 30,000,000 $3.20 $95,925,000 $0.03 $810,000 $96,735,000 $77,904,675 $2.60 $94,495,327 $0 $5,098,750 $99,594,077 -$2,859,077 -$56,319,688
6 30,000,000 $3.22 $96,600,000 $0.03 $810,000 $97,410,000 $76,058,700 $2.54 $92,500,252 $0 $5,098,750 $97,599,002 -$189,002 -$56,508,690
7 30,000,000 $3.29 $98,737,500 $0.03 $810,000 $99,547,500 $83,125,500 $2.77 $99,583,895 $0 $5,098,750 $104,682,645 -$5,135,145 -$61,643,835
8 30,000,000 $3.44 $103,237,500 $0.03 $810,000 $104,047,500 $86,137,950 $2.87 $104,973,749 $0 $5,098,750 $110,072,499 -$6,024,999 -$67,668,835
9 30,000,000 $3.74 $112,260,000 $0.03 $810,000 $113,070,000 $97,304,400 $3.24 $117,320,824 $0 $5,098,750 $122,419,574 -$9,349,574 -$77,018,409
10 30,000,000 $3.92 $117,637,500 $0.03 $810,000 $118,447,500 $100,611,300 $3.35 $122,308,853 $0 $5,098,750 $127,407,603 -$8,960,103 -$85,978,512
11 30,000,000 $4.28 $128,325,000 $0.03 $810,000 $129,135,000 $111,256,800 $3.71 $132,914,453 $0 $5,098,750 $138,013,203 -$8,878,203 -$94,856,715
12 30,000,000 $4.68 $140,325,000 $0.03 $810,000 $141,135,000 $127,949,850 $4.26 $148,566,594 $0 $5,098,750 $153,665,344 -$12,530,344 -$107,387,060
13 30,000,000 $5.16 $154,912,500 $0.03 $810,000 $155,722,500 $129,625,950 $4.32 $149,617,454 $0 $5,098,750 $154,716,204 $1,006,296 -$106,380,764
14 30,000,000 $4.98 $149,362,500 $0.03 $810,000 $150,172,500 $126,262,425 $4.21 $145,419,804 $0 $5,098,750 $150,518,554 -$346,054 -$106,726,818
15 30,000,000 $5.26 $157,680,000 $0.03 $810,000 $158,490,000 $131,290,725 $4.38 $150,164,884 $0 $5,098,750 $155,263,634 $3,226,366 -$103,500,452
16 30,000,000 $5.51 $165,300,000 $0.03 $810,000 $166,110,000 $139,557,975 $4.65 $158,884,169 $0 $5,098,750 $163,982,919 $2,127,081 -$101,373,371
17 30,000,000 $5.47 $164,025,000 $0.03 $810,000 $164,835,000 $136,103,850 $4.54 $155,549,744 $0 $5,098,750 $160,648,494 $4,186,506 -$97,186,865
18 30,000,000 $4.88 $146,310,000 $0.03 $810,000 $147,120,000 $114,699,600 $3.82 $134,025,794 $0 $5,098,750 $139,124,544 $7,995,456 -$89,191,409
19 30,000,000 $4.43 $132,975,000 $0.03 $810,000 $133,785,000 $103,136,775 $3.44 $121,950,569 $0 $5,098,750 $127,049,319 $6,735,681 -$82,455,727
20 30,000,000 $3.65 $109,350,000 $0.03 $810,000 $110,160,000 $78,969,225 $2.63 $97,118,884 $0 $5,098,750 $102,217,634 $7,942,366 -$74,513,362
21 30,000,000 $3.19 $95,737,500 $0.03 $810,000 $96,547,500 $72,049,650 $2.40 $89,842,589 $0 $5,098,750 $94,941,339 $1,606,161 -$72,907,201
NPV -$63,564,411
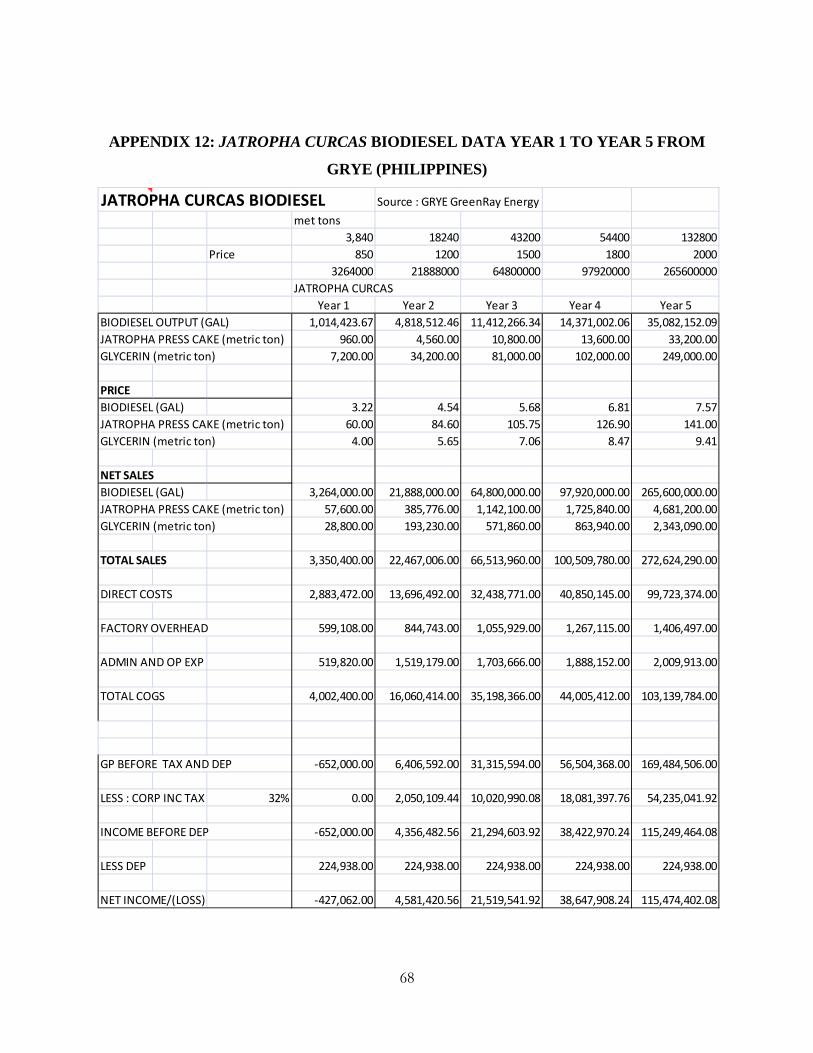
68
APPENDIX 12: JATROPHA CURCAS BIODIESEL DATA YEAR 1 TO YEAR 5 FROM
GRYE (PHILIPPINES)
JATROPHA CURCAS BIODIESEL Source : GRYE GreenRay Energymet tons
3,840 18240 43200 54400 132800Price 850 1200 1500 1800 2000
3264000 21888000 64800000 97920000 265600000JATROPHA CURCAS
Year 1 Year 2 Year 3 Year 4 Year 5BIODIESEL OUTPUT (GAL) 1,014,423.67 4,818,512.46 11,412,266.34 14,371,002.06 35,082,152.09JATROPHA PRESS CAKE (metric ton) 960.00 4,560.00 10,800.00 13,600.00 33,200.00GLYCERIN (metric ton) 7,200.00 34,200.00 81,000.00 102,000.00 249,000.00
PRICEBIODIESEL (GAL) 3.22 4.54 5.68 6.81 7.57JATROPHA PRESS CAKE (metric ton) 60.00 84.60 105.75 126.90 141.00GLYCERIN (metric ton) 4.00 5.65 7.06 8.47 9.41
NET SALESBIODIESEL (GAL) 3,264,000.00 21,888,000.00 64,800,000.00 97,920,000.00 265,600,000.00JATROPHA PRESS CAKE (metric ton) 57,600.00 385,776.00 1,142,100.00 1,725,840.00 4,681,200.00GLYCERIN (metric ton) 28,800.00 193,230.00 571,860.00 863,940.00 2,343,090.00
TOTAL SALES 3,350,400.00 22,467,006.00 66,513,960.00 100,509,780.00 272,624,290.00
DIRECT COSTS 2,883,472.00 13,696,492.00 32,438,771.00 40,850,145.00 99,723,374.00
FACTORY OVERHEAD 599,108.00 844,743.00 1,055,929.00 1,267,115.00 1,406,497.00
ADMIN AND OP EXP 519,820.00 1,519,179.00 1,703,666.00 1,888,152.00 2,009,913.00
TOTAL COGS 4,002,400.00 16,060,414.00 35,198,366.00 44,005,412.00 103,139,784.00
GP BEFORE TAX AND DEP -652,000.00 6,406,592.00 31,315,594.00 56,504,368.00 169,484,506.00
LESS : CORP INC TAX 32% 0.00 2,050,109.44 10,020,990.08 18,081,397.76 54,235,041.92
INCOME BEFORE DEP -652,000.00 4,356,482.56 21,294,603.92 38,422,970.24 115,249,464.08
LESS DEP 224,938.00 224,938.00 224,938.00 224,938.00 224,938.00
NET INCOME/(LOSS) -427,062.00 4,581,420.56 21,519,541.92 38,647,908.24 115,474,402.08

69
APPENDIX 13: PALM OIL BIODIESEL DATA
8%PALM OIL
30 mil capacity
Biodiesel Glycerin Facility
Year Production Price Biodiesel Price Glycerin Total Palm Oil Palm oil Variable Capital Total Fixed Total Over All Costs Cumulative
gal Per Gal Rev Per Gal Rev Rev Cost Per kg Cost Input Cost Cost Profit/(loss) Profit/(loss)
0 0 $0 $0 $0 $0 $0 $0 $0 $17,000,000 $22,098,750 $22,098,750 -$22,098,750 -$22,098,750
1 0 $0 $0 $0 $0 $0 $0 $0 $30,000,000 $35,098,750 $35,098,750 -$35,098,750 -$57,197,500
2 30,000,000 $3.09 $92,750,000 $0.03 $810,000 $93,560,000 $62,398,947 $2.08 $79,244,234 $0 $5,098,750 $84,342,984 $9,217,016 -$47,980,484
3 30,000,000 $3.16 $94,725,000 $0.03 $810,000 $95,535,000 $71,604,921 $2.39 $88,332,608 $0 $5,098,750 $93,431,358 $2,103,642 -$45,876,841
4 30,000,000 $3.17 $94,950,000 $0.03 $810,000 $95,760,000 $72,359,033 $2.41 $89,206,420 $0 $5,098,750 $94,305,170 $1,454,830 -$44,422,011
5 30,000,000 $3.20 $95,925,000 $0.03 $810,000 $96,735,000 $73,909,798 $2.46 $90,500,450 $0 $5,098,750 $95,599,200 $1,135,800 -$43,286,211
6 30,000,000 $3.22 $96,600,000 $0.03 $810,000 $97,410,000 $70,534,661 $2.35 $86,976,213 $0 $5,098,750 $92,074,963 $5,335,037 -$37,951,175
7 30,000,000 $3.29 $98,737,500 $0.03 $810,000 $99,547,500 $72,044,820 $2.40 $88,503,214 $0 $5,098,750 $93,601,964 $5,945,536 -$32,005,639
8 30,000,000 $3.44 $103,237,500 $0.03 $810,000 $104,047,500 $79,671,991 $2.66 $98,507,791 $0 $5,098,750 $103,606,541 $440,959 -$31,564,680
9 30,000,000 $3.74 $112,260,000 $0.03 $810,000 $113,070,000 $84,822,193 $2.83 $104,838,618 $0 $5,098,750 $109,937,368 $3,132,632 -$28,432,047
10 30,000,000 $3.92 $117,637,500 $0.03 $810,000 $118,447,500 $85,412,915 $2.85 $107,110,468 $0 $5,098,750 $112,209,218 $6,238,282 -$22,193,766
11 30,000,000 $4.28 $128,325,000 $0.03 $810,000 $129,135,000 $95,426,176 $3.18 $117,083,829 $0 $5,098,750 $122,182,579 $6,952,421 -$15,241,345
12 30,000,000 $4.68 $140,325,000 $0.03 $810,000 $141,135,000 $107,267,677 $3.58 $127,884,421 $0 $5,098,750 $132,983,171 $8,151,829 -$7,089,516
13 30,000,000 $5.16 $154,912,500 $0.03 $810,000 $155,722,500 $110,879,683 $3.70 $130,871,187 $0 $5,098,750 $135,969,937 $19,752,563 $12,663,047
14 30,000,000 $4.98 $149,362,500 $0.03 $810,000 $150,172,500 $104,752,035 $3.49 $123,909,414 $0 $5,098,750 $129,008,164 $21,164,336 $33,827,384
15 30,000,000 $5.26 $157,680,000 $0.03 $810,000 $158,490,000 $105,075,916 $3.50 $123,950,075 $0 $5,098,750 $129,048,825 $29,441,175 $63,268,558
16 30,000,000 $5.51 $165,300,000 $0.03 $810,000 $166,110,000 $106,000,188 $3.53 $125,326,381 $0 $5,098,750 $130,425,131 $35,684,869 $98,953,427
17 30,000,000 $5.47 $164,025,000 $0.03 $810,000 $164,835,000 $99,218,975 $3.31 $118,664,869 $0 $5,098,750 $123,763,619 $41,071,381 $140,024,807
18 30,000,000 $4.88 $146,310,000 $0.03 $810,000 $147,120,000 $76,549,192 $2.55 $95,875,386 $0 $5,098,750 $100,974,136 $46,145,864 $186,170,672
19 30,000,000 $4.43 $132,975,000 $0.03 $810,000 $133,785,000 $64,490,159 $2.15 $83,303,953 $0 $5,098,750 $88,402,703 $45,382,297 $231,552,969
20 30,000,000 $3.65 $109,350,000 $0.03 $810,000 $110,160,000 $47,025,685 $1.57 $65,175,345 $0 $5,098,750 $70,274,095 $39,885,905 $271,438,874
21 30,000,000 $3.19 $95,737,500 $0.03 $810,000 $96,547,500 $41,872,583 $1.40 $59,665,522 $0 $5,098,750 $64,764,272 $31,783,228 $303,222,102
IRR 14%
NPV $52,558,172
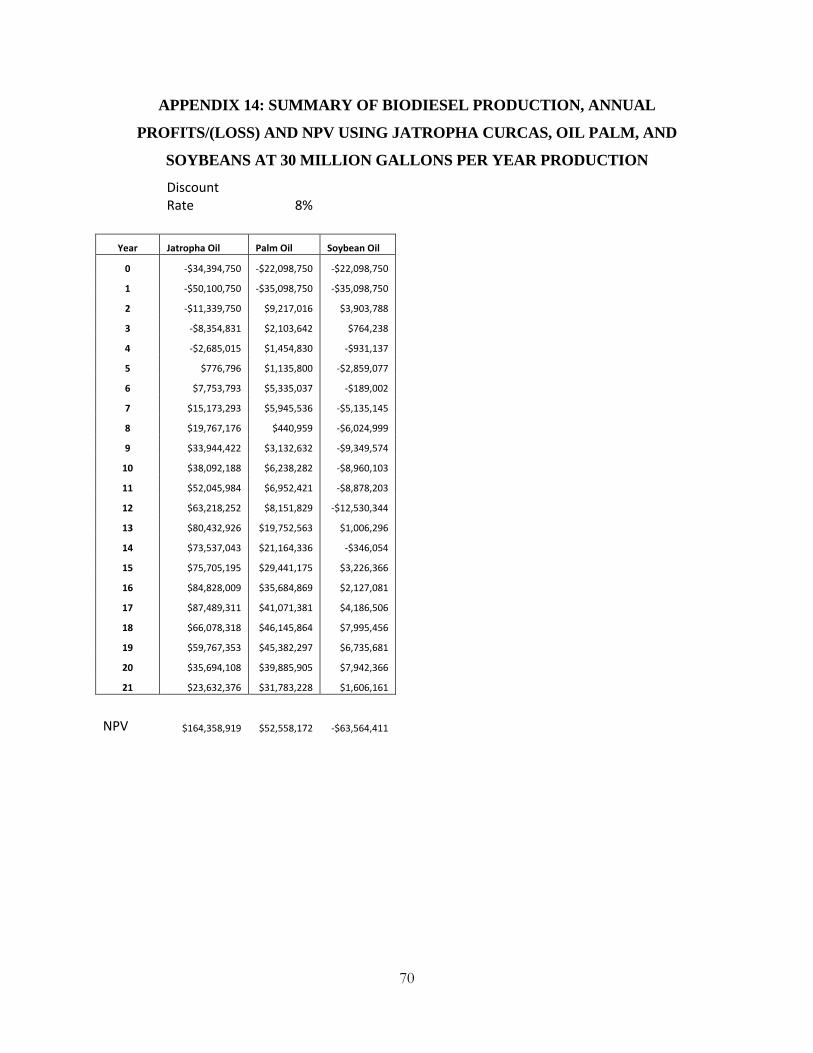
70
APPENDIX 14: SUMMARY OF BIODIESEL PRODUCTION, ANNUAL
PROFITS/(LOSS) AND NPV USING JATROPHA CURCAS, OIL PALM, AND
SOYBEANS AT 30 MILLION GALLONS PER YEAR PRODUCTION
Discount Rate 8%
Year Jatropha Oil Palm Oil Soybean Oil
0 -$34,394,750 -$22,098,750 -$22,098,750
1 -$50,100,750 -$35,098,750 -$35,098,750
2 -$11,339,750 $9,217,016 $3,903,788
3 -$8,354,831 $2,103,642 $764,238
4 -$2,685,015 $1,454,830 -$931,137
5 $776,796 $1,135,800 -$2,859,077
6 $7,753,793 $5,335,037 -$189,002
7 $15,173,293 $5,945,536 -$5,135,145
8 $19,767,176 $440,959 -$6,024,999
9 $33,944,422 $3,132,632 -$9,349,574
10 $38,092,188 $6,238,282 -$8,960,103
11 $52,045,984 $6,952,421 -$8,878,203
12 $63,218,252 $8,151,829 -$12,530,344
13 $80,432,926 $19,752,563 $1,006,296
14 $73,537,043 $21,164,336 -$346,054
15 $75,705,195 $29,441,175 $3,226,366
16 $84,828,009 $35,684,869 $2,127,081
17 $87,489,311 $41,071,381 $4,186,506
18 $66,078,318 $46,145,864 $7,995,456
19 $59,767,353 $45,382,297 $6,735,681
20 $35,694,108 $39,885,905 $7,942,366
21 $23,632,376 $31,783,228 $1,606,161
NPV $164,358,919 $52,558,172 -$63,564,411