Embed Size (px)
Citation preview

The Economics of Football
Stephen DobsonSchool of Management and Economics,The Queen’s University of Belfast
and John GoddardDepartment of Economics,University of Wales Swansea

The Pitt Building,Trumpington Street, Cambridge, United Kingdom
The Edinburgh Building, Cambridge CB2 2RU, UK40 West 20th Street, New York, NY 10011-4211, USA10 Stamford Road, Oakleigh,VIC 3166, AustraliaRuiz de Alarcón 13, 28014 Madrid, SpainDock House,The Waterfront, Cape Town 8001, South Africa
http://www.cambridge.org
© Stephen Dobson and John Goddard 2001
This book is in copyright. Subject to statutory exception and to the provisions of relevant collective licensing agreements,no reproduction of any part may take place without the written permission of Cambridge University Press.
First published 2001
Printed in the United Kingdom at the University Press, Cambridge
Typeface Plantin MT 10/13 pt System QuarkXPress™ []
A catalogue record for this book is available from the British Library
Library of Congress Cataloguing in Publication data
Dobson, Stephen.The economics of football / Stephen Dobson, John Goddard.
p. cm.Include bibliographical references and index.ISBN 0 521 66158 71. Soccer – Economic aspects – Great Britain. 2. Soccer – Great Britain – France.I. Goddard, John. II.Title.GV943.3.D63 2001338.4�3796334�0941–dc21 2001018128
ISBN 0 521 66158 7 hardback

Contents
List of figures page ixList of tables xiPreface xvAcknowledgements xviii
1 Introduction 11.1 The economics of team sports: three seminal contributions and the
subsequent development of the subject 31.2 Outline of this volume 111.3 The use of econometrics in this volume 16
2 Professional football: historical development and economic structure 22
2.1 The commercial structure of Europe’s ‘big five’ football leagues 242.2 The English football league: competitive structure and team
performance 382.3 Match attendances 562.4 Admission prices and gate revenues 712.5 English football and the broadcasting media 802.6 Other sources of revenue and cross-subsidy 872.7 Football’s labour market: players’ wages and the transfer system 902.8 The historical development of professional football: international
comparisons 1012.9 Convergence and divergence in the league gate revenues of English
football clubs 1092.10 Conclusion 123
3 Competitive balance and uncertainty of outcome 1253.1 Economic theory of competitive balance in sports leagues 1263.2 Patterns in football league match results 1503.3 Modelling and forecasting match results 1673.4 Conclusion 187
4 The labour and transfer markets 1894.1 Player mobility, migration and career structure in the English league 1914.2 Patterns of international migration for professional footballers 2034.3 The earnings of professional footballers 2094.4 Determinants of players’ compensation: empirical evidence 2214.5 The football transfer market 2274.6 Conclusion 236
vii

5 The contribution of the football manager 2405.1 The role of the football manager 2425.2 Measuring the managerial contribution: the production frontier approach 2455.3 Measuring managerial efficiency in English football 2525.4 Conclusion 262
6 Managerial change and team performance 2646.1 Patterns of managerial change in English football 2656.2 Determinants of managerial change: evidence from North American
team sports 2806.3 Specification of job-departure hazard functions 2846.4 Hazard functions for English managers: duration measured in seasons 2866.5 Hazard functions for English managers: duration measured in matches 2966.6 The effect of managerial change on team performance: evidence from
North American team sports 3036.7 Managerial succession effects in English football: performance measured
by season 3066.8 Managerial succession effects in English football: performance measured
by match 3096.9 Conclusion 314
7 The demand for football attendance 3177.1 Econometric analysis of football attendances 3187.2 Case studies in the sociology of football attendance: FC Barcelona, and
Celtic and Rangers 3357.3 Modelling the demand for attendance at English league football,
1947–1997 3427.4 Conclusion 371
8 Information transmission and efficiency: share prices andfixed-odds betting 373
8.1 Ownership, finance and English football’s stock market boom 3758.2 Football team performance and share price movements: an event study 3818.3 Efficiency of prices in the fixed-odds betting market 3978.4 Conclusion 416
9 Professional football: current issues and future prospects 4189.1 Sources of competitive imbalance in English football 4199.2 The future of professional football 4259.3 Conclusion 439
List of references 440Index 452
viii Contents
Figures
2.1 Average home league attendances, first-division clubs, fiveEuropean leagues, 2000 season page 25
2.2 Nationalities of all squad players of first-division clubs, fiveEuropean leagues, end of 1999 season 33
2.3 Percentage shares in aggregate performance of clubs inGroups 1 to 5 54
2.4 Percentage shares in aggregate attendance of clubs inGroups 1 to 5 60
2.5 Trends in average home-league attendances, selected clubs,four European leagues 61
2.6 Percentage shares in aggregate gate revenue of clubs inGroups 1 to 5 78
2.7 Cross-sectional relationships between revenue and growthand implications for the time-path of revenue 113
2.8 Time-path of revenue under conditional beta convergence 1142.9 Calculation of Gini coefficient using football club revenue
data 1163.1 Competitive balance under reserve clause and under free
agency 1353.2 Implications for competitive balance of a salary cap 1383.3 Implications for competitive balance of revenue sharing 1393.4 Derivation of teams’ iso-profit curves, open model 1423.5 Competitive balance under profit and revenue maximising
assumptions, open model 1443.6 Standard normal probability density function 1733.7 Implications of shifts in the mean of the standard normal
probability density function 1754.1 Optimum investment in playing talent, rank-order
tournament model 2195.1 Deterministic production frontier 2475.2 Stochastic production frontiers 2496.1 Distribution of complete managerial spells, by duration,
1973–1999, all departures 277
ix

6.2 Distribution of complete managerial spells, by duration,1973–1999, involuntary departures 278
6.3 Distribution of complete managerial spells, by duration,1973–1999, voluntary departures 279
6.4 Estimated stochastic production frontiers, 1973 and 1999seasons 288
7.1 Trends in league attendance and performance, selected English clubs 356
8.1 Trends in index value of logarithmic share price: BoltonWanderers 395
8.2 Trends in index value of logarithmic share price: CharltonAthletic 396
8.3 Trends in index value of logarithmic share price: ManchesterUnited 398
8.4 Trends in index value of logarithmic share price: NewcastleUnited 399
x List of figures

Tables
2.1 Nationalities of squad players at first-division clubs, fiveEuropean leagues, summer 1999 page 32
2.2 Highest-paid players, five European leagues, 1999 362.3 World record transfers and 12 highest transfers, summer
2000 372.4 Most successful English league teams in league and cup
competition, 1920–1999 442.5 Most successful teams in league competition, European
comparisons, 1946–1999 462.6 League championship dominance, European comparisons,
1940s–1999 502.7 Group definitions 522.8 English league attendances, aggregate and by division,
1922–1999 572.9 Aggregate revenues and costs, Premier League and Football
League clubs, 1999 season 712.10 Financial and employment data, top six Premier League
clubs and divisional averages, 1999 season 722.11 English league admission prices, 1926–1999 742.12 English league gate revenues, 1926–1999 762.13 Shirt sponsorship contracts, Premier League clubs, 2000
season 882.14 Gross expenditure on transfers between English league
member clubs, 1973–1999 942.15 Revenue, wages and salaries and net transfer expenditure,
1994–1999 972.16 Net transfer expenditure within the English league,
1973–1999 1002.17 Average league attendances, French First Division,
1981–2000 1042.18 Convergence in gate revenues from English league matches,
1926–1997 117
xi

3.1 Percentages of home wins, draws and away wins and averagenumber of goals scored by home and away teams per season,English league, 1973–1999 151
3.2 Percentages of home wins, draws and away wins and averagenumber of goals scored by home and away teams per season,European comparisons, 1973–1999 152
3.3 Joint and marginal percentage distributions of goals scoredby home and away teams, English league, 1973–1981 154
3.4 Joint and marginal percentage distributions of goals scoredby home and away teams, English league, 1982–1990 154
3.5 Joint and marginal percentage distributions of goals scoredby home and away teams, English league, 1991–1999 155
3.6 Percentage distributions of goals scored by home team,conditional on the number of goals scored by away team,English league, 1991–1999 156
3.7 Percentage distributions of goals scored by away team,conditional on the number of goals scored by home team,English league, 1991–1999 157
3.8 Long runs of consecutive results, English league, 1973–1999 1593.9 Probabilities of home win conditional on recent results 1603.10 Probabilities of home loss conditional on recent results 1613.11 Probabilities of away win conditional on recent results 1623.12 Probabilities of away loss conditional on recent results 1633.13 Actual and expected numbers of unbeaten and win-less
spells and spells of consecutive wins and losses, of variousdurations 168
3.14 Ordered probit estimation of match results forecasting model,1973–1999 and 1989–1998 180
3.15 Match results forecasting model’s predicted results andactual results 183
3.16 24-month playing records of Middlesbrough and Arsenalup to 24 April 1999 184
3.17 Part-calculation of for Middlesbrough v. Arsenal (1) 184
3.18 Part-calculation of for Middlesbrough v. Arsenal (2) 185
3.19 Premier League table on the morning of 24 April 1999 1864.1 Percentage distribution of all players, by age, 31 May 1979
or 1999 1924.2 Average age of players, by birthplace and division, 31 May
1979 or 1999 1934.3 Percentage distribution of all players, by month of birth,
1979 or 1999 194
y*i, j
y*i, j
xii List of tables
4.4 Percentage distribution of all players, by birthplace, 1979or 1999 194
4.5 Percentage distribution of players born in England andWales, by birthplace, and population comparisons, 1979or 1999 195
4.6 Percentage distribution of players’ first clubs, by region,1979 or 1999 196
4.7 Most frequent first clubs: top 20, 1979 or 1999 1974.8 Percentages of players whose first club and whose current
club is in their region of birth, 1979 or 1999 1984.9 Distribution of players, by birthplace, selected first clubs,
1979 or 1999 1994.10 Percentage distribution of players, by duration of present
spell at present club, 1979 or 1999 2004.11 Percentage distribution of players, by number of clubs
(past and present) in England and Wales, 1979 or 1999 2014.12 Distribution of players who joined present club by transfer
from another club in England and Wales, by division ofcurrent club (in May 1979 or 1999) and division ofprevious club at time of departure 202
4.13 Analysis of home countries and countries of employment,Euro 2000 squad players 207
4.14 Permanent and temporary transfers, 1973–1996 2334.15 Variable definitions 2354.16 Summary statistics for selected variables 2364.17 Estimated model for determinants of transfer fees 2375.1 Fixed effects, random effects and maximum likelihood
estimates of production frontier, Premier League,1993–1998 257
5.2 Summary statistics for manager efficiency scores 2585.3 Managers with highest efficiency scores in production
frontier estimations 2606.1 Managerial spells ranked by duration in matches, top 50 2666.2 Managerial spells ranked by win ratio, top 50 2686.3 Managerial spells ranked by adjusted win ratio, top 50 2706.4 Managerial departures, by season, 1973–1999 2746.5 Managerial departures, by month and by division,
1973–1999 2756.6 Complete managerial spells, by duration (matches),
summary statistics 2766.7 Playing seasons ranked by efficiency score obtained from
estimation of (6.3): top 50 and bottom 10 290
List of tables xiii

6.8 Distribution of complete and right-censored managerialspells, by duration (in seasons) and crude estimates of thesurvivor, distribution, probability and hazard functions 293
6.9 Involuntary and voluntary manager job-departure hazardfunctions: duration in seasons 294
6.10 Distribution of complete and right-censored managerialspells, by duration (in matches) and crude estimates of thesurvivor, distribution, probability and hazard functions 299
6.11 Involuntary and voluntary managerial job-departurehazard functions: duration in matches 300
6.12 Relationship between managerial succession andperformance, measured by season 308
6.13 Relationship between managerial succession andperformance, measured by match 312
7.1 Average capacity utilisation, 1974–1999 3227.2 Attendance model, first-stage estimation results 3487.3 Attendance model, second-stage estimation results 3698.1 Date and method of flotation and share price returns from
flotation to December 1999, floated English clubs 3788.2 Estimation results for determinants of share price returns,
pooled model 3908.3 Estimation results for determinants of share price returns,
individual models (1) 3928.4 Estimation results for determinants of share price returns,
individual models (2) 4068.5 Bookmakers’ implicit match result probabilities, descriptive
statistics 4068.6 Match results forecasting model’s evaluated match result
probabilities, descriptive statistics 4088.7 Average returns from £1 bets, long, medium and short odds 4118.8 Average returns from £1 bets placed on forecasting model’s
prediction for each match 4128.9 Average returns from £1 bets based on the outcome of each
match with the highest expected return, according to theforecasting model (bets ranked in descending order ofexpected return) 412
8.10 Average returns from every possible £1 bet (bets ranked indescending order of expected return according to forecastingmodel) 412
8.11 Fixed-odds betting on Premier League fixtures: 24 April1999 415
xiv List of tables

1 Introduction
Academic interest in the economics of professional team sports datesback as far as the mid-1950s. Since then, many books and journal articleshave been written on the subject. Much of the academic literature origi-nates in the USA. In common with trends that are evident throughout thesubject discipline of economics, research on the economics of sport hasbecome increasingly sophisticated, both theoretically and in its use ofeconometric methodology, especially in recent times. Papers on the eco-nomics of sport now appear regularly in many of the leading economicsjournals, and most economists would agree that in view of its social, cul-tural and economic importance, professional sport is a legitimate area ofinterest for both theoretical and empirical researchers. Indeed, manywould argue that the unique configurations of individual and team incen-tives, and the interactions between co-operative and competitive modesof behaviour that professional team sports tend to generate, make thisparticularly fertile territory in which to explore the perennial questionsabout incentives, effort, risk and reward which lie at the heart of all areasof economic inquiry.
This volume makes a contribution to the burgeoning literature on theeconomics of team sports by providing the first comprehensive survey ofresearch that is focused on professional football at club level. A survey ofthe economics of professional football seems appropriate at the presenttime, if not long overdue. The spectacular recent increase in the size offootball’s audience is, of course, a strong motivating factor. Such a surveywill recognise and reflect not only football’s global popularity at the startof the twenty-first century, but also the special historical significance ofEngland as the original birthplace of the sport. Club football played in theEnglish Premier League and Football League provides the laboratory formost of the original, empirical research that is reported in this volume.
Each chapter of this volume concentrates on a particular aspect of theeconomics of professional football.The previous theoretical and empiri-cal literature that is relevant to each topic is reviewed, and new and origi-nal empirical analyses are presented. The sections that describe the
1

existing literature aim to convey an impression of the breadth and depthof previous academic research into the economics of professional teamsports. Much has been written already about football, and very muchmore has been written about other sports, especially in the USA whereattention naturally tends to focus on sports such as baseball, basketballand (American) football. Though football is the main subject of thisvolume, due attention and emphasis is devoted to insights that have beenobtained from research into other sports, wherever these turn out to be ofwider relevance.
As already emphasised, anyone who reads the academic literature onthe economics of sport cannot fail to be struck by the sheer volume ofcolumn inches that has been devoted to this topic. Of all the articles thathave been published, however, there are perhaps a few that have had aparticularly important influence in shaping the research agenda for theeconomics of team sports in general, and for the economics of football inparticular. Many of the ideas contained in these articles are as relevant toresearchers today as they were when the articles concerned were origi-nally published. In this introductory chapter, three such articles are high-lighted and reviewed in some detail. There is, of course, an element ofsubjectivity in choosing such a small number of articles out of the manyexcellent ones that have been published. Even so, a consensus seems tohave evolved that regards the articles by Simon Rottenberg (1956) andWalter Neale (1964) as fundamental to the subsequent development ofresearch on team sports in general. Both articles address various eco-nomic implications of the structural features of the markets within whichprofessional sports teams operate.The article by Peter Sloane (1971) hasalso had a major influence on the developing the research agenda, espe-cially in respect of the economics of football. In section 1.1, the principalcontributions of each of these articles are reviewed in turn, and the subse-quent development of the economics of team sports as an academic disci-pline is outlined. The aim of section 1.1 is to place the research that isreported in the rest of this volume into its proper context.This is followedin section 1.2 by a summary of the contents of each of the following chap-ters, and in section 1.3 by an outline of the use of econometric methods inthe empirical investigations that are reported in this volume.
2 The Economics of Football

1.1 The economics of team sports: three seminal contri-butions and the subsequent development of the subject
Rottenberg:‘The baseball players’ labor market’, Journal of PoliticalEconomy, 1956
Rottenberg is widely credited with writing the first academic analysis ofthe economics of professional team sports.The paper was written at a timewhen US professional baseball players’ contracts included a reserveclause. Once he signed his first one-year contract with a team in organisedbaseball, a player ceased to be a free agent. On expiry of his present con-tract, his team retained the option to renew his contract for another year.1
This served to limit players’ freedom of movement, by binding them totheir present employers. Effectively, the reserve clause created a mono-psony in the players’ labour market: each contracted player could nego-tiate with only one potential buyer of his services.The baseball authoritiesdefended the reserve clause on the grounds that it was necessary to ensurean equal distribution of playing talent among opposing teams.Without thereserve clause, the rich teams (with the largest potential markets) wouldoutbid the poorer ones for the best available players.This would tend toreduce uncertainty of outcome and spectator interest in the league com-petition as a whole, and depress the attendances and revenues of all teams.
Rottenberg’s contribution was to argue that free agency in the players’labour market would not necessarily lead to a concentration of the bestplayers in the richest teams. In other words, a reserve clause was not anecessary condition to ensure competitive balance. Professional teamsports are intrinsically different from other businesses, in which a firm islikely to prosper if it can eliminate competition and establish a position asa monopoly supplier. In sports, it does not pay a rich team to accumulatestar players to the extent that (sporting) competition is greatly dimin-ished, because of the joint nature of ‘production’ in sports. Consequently,a team that attempts to accumulate all of the best available playing talentwill find at some stage that diminishing returns begin to set in: ‘In base-ball no team can be successful unless its competitors also survive andprosper sufficiently so that the differences in the quality of play amongteams are not “too great.” . . .At some point, therefore, a first star player isworth more to poor team B than, say, a third star to rich team A. At thispoint, B is in a position to bid players away from A in the market’(Rottenberg, 1956, pp. 254, 255).
Introduction 3
11 This was subject only to a rule that prevented the wage being cut by more than 25 percent in any one year if the team was in one of the major leagues.

If teams are rational profit maximisers, the distribution of playingtalent among the teams should be reasonably even. Neither a reserveclause nor explicit collusion is necessary in order to bring about thisresult. It is in each team’s self-interest to ensure that it does not becometoo strong relative to its competitors: ‘It follows that players will be dis-tributed among teams so that they are put to their most “productive” use;each will play for the team that is able to get the highest return from hisservices. But this is exactly the result which would be yielded by a freemarket’ (Rottenberg, 1956, p. 256).
A reserve clause will therefore deliver roughly the same distribution ofplaying talent among teams as free agency. Whether players are freeagents or not, the distribution of playing talent is determined by theincentive to maximise the capitalised value of the services supplied byindividual players. If there is another team for which this capitalised valuewould be higher than it is for the player’s present team, then there is aprice at which it is advantageous for both teams to trade the player’s con-tract.
Rottenberg also discusses the implications of the reserve clause, andthe monopsony power it confers on teams as buyers of playing services,for players’ salaries. Each player’s reservation wage (the minimum wagehe would accept to play baseball) is determined primarily by the nexthighest wage he could earn outside baseball adjusted to reflect his valua-tion of the non-pecuniary costs and benefits of playing baseball.Althoughtheoretically the team has the contractual power to impose the reserva-tion wage on all players, Rottenberg notes that in practice this does notseem to happen. Many players earn far more from baseball than theycould in alternative employment.This is attributed to the fact that playersas well as teams have bargaining power in wage negotiations: in anextreme case, a player can simply threaten to withdraw his services. If aplayer’s reservation wage is $10,000, but he is worth $20,000 to his team,then a wage anywhere between $10,000 and $20,000 is possible, depend-ing on the ‘shrewdness and guile of the parties in devising their bargainingstrategies’ (Rottenberg, 1956, p. 253). Competition among sellers,however, imposes limitations on players’ bargaining power. A star playerworth $40,000 to his team cannot extract a wage beyond $30,000 if alesser player worth $20,000 is willing to accept a wage of $10,000 to fillthe same position.
The main effect of the reserve clause is that players receive salariesbelow their value to the team that employs them. In other words, it tendsto direct rents away from players and towards teams.The reserve clausedoes not achieve its stated aim of influencing the allocation of playingtalent between teams. Rottenberg concludes by considering several
4 The Economics of Football

alternative regimes that might produce a more or less equal distributionof playing talent between teams with free agency in the players’ labourmarket.These include:• Revenue pooling. If all revenues are shared equally, teams have no pecu-
niary incentive to spend on players to enhance their own performanceand revenue. An equal distribution of mediocre playing talent is themost likely outcome.
• Salary capping. The effect of a salary cap on the distribution of talentwill depend on the extent to which teams can circumvent it by offeringplayers non-pecuniary rewards.
• Allocating multiple team franchises in large cities. If reasonable equalitybetween each team’s potential market size can be achieved, this isexpected to create a more equal distribution of playing talent.
Neale:‘The peculiar economics of professional sports’, QuarterlyJournal of Economics, 1964
Neale’s analysis begins by emphasising the joint nature of production inprofessional sports. Heavyweight boxing is used as an example to intro-duce what Neale calls the ‘Louis Schmelling Paradox’. World championJoe Louis’ earnings were higher if there was an evenly matched contenderavailable for him to fight than if the nearest contender was relatively weak.The same point applies also in baseball. ‘Suppose the Yankees used theirwealth to buy up not only all the good players but also all of the teams inthe American League: no games, no receipts, no Yankees. When, for abrief period in the late fifties, the Yankees lost the championship andopened the possibility of a non-Yankee World Series they found them-selves – anomalously – facing sporting disgrace and bigger crowds’(Neale, 1964, p. 2).
Does this imply that professional sport is an industry in which mono-poly is less profitable than competition, contradicting what we teach stu-dents and what they can read in any Principles text? Neale addresses thisparadox by distinguishing between ‘sporting’ and ‘economic’ competi-tion. Sporting competition is more profitable than sporting monopoly forthe reasons outlined above, but sporting competition is not the same aseconomic competition. Similarly, although in law the sports team is a firm(which may be motivated by profit), it is not a firm in the economist’ssense. A single team cannot supply the entire market; if it did it wouldhave no one to play. Teams must co-operate with each other to produceindividual matches and a viable league competition, so there is joint pro-duction. The league’s organising body exerts strict controls over a widerange of matters including competition rules and schedules, player
Introduction 5

mobility and the entry and exit of clubs. In short, the league rather thanthe individual team is the ‘firm’ in the economist’s sense. A sports leagueshould be regarded as analogous to a multi-plant firm, in which the indi-vidual teams are ‘plants’, subject to decisions which are taken and imple-mented collectively at league level.
If the sports league is the ‘firm’ in the economic sense, this raises thequestion as to why it is unusual to observe direct competition betweenrival leagues operating within the same sport. Although the NationalLeague and American League do operate simultaneously in baseball,analytically they should be regarded as one larger ‘multi-league’ firm,since they come together at the end of each season to produce the WorldSeries. Geographical division is a more common form of segmentationthough, according to Neale, one that is inherently unstable.Where directcompetition is prevented by geography, profit incentives tend to promoteenlargement and the elimination of geographical boundaries.2
Competition between different sports is more common than competitionbetween rival leagues within the same sport, though segmentation basedon nation, region, season of the year or even social class are stillcommon.3 All such forms of segmentation tend to inhibit directhead-to-head competition.
Neale suggests that the general lack of competition between sportsleagues arises because the cost and demand characteristics of the marketfor professional team sports tend to create conditions of natural monop-oly, making it efficient for a single league to supply the entire market. Onthe cost side, Neale suggests that the long-run average cost curve is prob-ably horizontal. Although an increase in the scale of production mightentail the use of less efficient playing inputs, raising average costs, thistends to be offset by an ‘enthusiasm effect’. If the sport operates on alarger scale, public enthusiasm encourages more people to take upplaying, eventually raising the supply of players at the highest level. Tosome extent, the enthusiasm effect makes supply and demand inter-dependent: if more people play the sport, more will also want to attendmatches at the professional level. Finally, the existence of rival leagueswould effectively break the monopsony power of teams as buyers of
6 The Economics of Football
12 This observation seems to be borne out by recent changes in the structure of competi-tion in European football.
13 Traditionally, English cricket and rugby union were upper- or middle-class sports, whilefootball and rugby league were working-class sports. More recently, the class divisionsmay have become more blurred, but have not disappeared altogether. Cricket is playedonly in summer; rugby league switched from a winter to a summer calendar in the late1990s; football and rugby union are still played in winter. Rugby league still has a strongregional identity centred on Lancashire and Yorkshire. Cricket is popular throughoutEngland, but very much a minority sport in Scotland.

playing services, enhancing players’ bargaining power in wage negotia-tions. This would tend to make costs higher than they are when oneleague operates as a monopoly supplier.
On the demand side, Neale suggests that baseball teams produce anumber of streams of utility: directly for spectators who buy tickets forseats in the stadium and for television viewers who watch the match athome; and indirectly for everyone who enjoys following the champion-ship race as it unfolds.The closer the competition, the greater is the indi-rect effect. For newspapers and television companies in particular, theindirect effect is a marketable commodity that helps sell more of theirproduct.The size of the indirect effect depends on the scale and univer-sality of the championship, and is therefore maximised when the league isa monopoly supplier. Overall ‘it is clear that professional sports are anatural monopoly, marked by definite peculiarities both in the structureand in the functioning of their markets’ (Neale, 1964, p. 14).
An important implication is that the peculiar economic characteristicsof professional sports leagues and their constituent teams should be rec-ognised by legislatures, by the courts and by the general public, wheneverpractices such as collective decision making or other (apparently) anti-competitive modes of behaviour come under scrutiny.
Sloane:‘The economics of professional football: the football club as autility maximiser’, Scottish Journal of Political Economy, 1971
Sloane’s paper questions Neale’s conclusion that the league rather thanthe individual team or club is the relevant ‘firm’ (or decision making unit)in professional team sports. In the case of English football, for example,the sport’s governing bodies merely set the rules within which clubs canfreely operate. Most economic decisions, such as how much money tospend on stadium development and how many players to employ, aremade by the clubs. Although the total quantity of ‘output’ (the number ofmatches played by each club) is regulated, this clearly reflects the clubs’common interest. In cartels, it is not unusual for firms to reach joint deci-sions concerning price or production, but this does not imply that thecartel should be elevated to the theoretical status of a ‘firm’. In short,Sloane suggests that Neale’s argument tends to overemphasise mutualinterdependence. ‘The fact that clubs together produce a joint product isneither a necessary nor a sufficient condition for analysing the industry asthough the league was a firm’ (Sloane, 1971, p. 128).
Having argued that the club is the relevant economic decision maker,Sloane goes on to raise a number of important questions concerning theobjectives of sports clubs. Implicit in the reasoning of both Rottenberg
Introduction 7

and Neale is an assumption of profit maximisation. Despite the ‘peculiar-ities’ of sports economics elucidated by Neale, the behaviour of profes-sional sports teams is analysed within a very conventional analyticalframework. While this may be reasonable in the case of US professionalteam sports, where many teams do have an established track record ofprofitability, Sloane suggests that it may not be universally applicable.Through most of the history of English football, profit making clubs havebeen very much the exception and not the rule. Chairmen and directorswith a controlling interest in football clubs are usually individuals whohave achieved success in business in other fields.Their motives for invest-ing may include a desire for power or prestige, or simple sporting enthu-siasm: a wish to see the local club succeed on the field of play. In manycases, profit or pecuniary gain seems unlikely to be a significant motivat-ing factor. If so, it may be sensible to view the objective of the football clubas one of utility maximisation subject to a financial solvency constraint.The financial solvency constraint recognises that the benevolence of anychairman or director must reach its limit at some point.
Non-profit maximising models of the firm had received considerableattention in the economics literature during the decade prior to the publi-cation of Sloane’s article. ‘A major drawback to the general introductionof the utility maximisation assumption in the theory of the firm is that itmay be rationalised so that it is consistent with almost any type of behavi-our and therefore tends to lack operational significance’ (Sloane, 1971, p.133).
In the case of football clubs, however, it is not too difficult to identifyseveral plausible and easily quantifiable objectives. Sloane suggests thefollowing:• Profit. Sloane’s expectation that profit is not the sole or even the most
important objective does not preclude its inclusion as one of a numberof arguments in the utility function.
• Security. Simple survival may be a major objective for many clubs.Decisions (concerning, for example, sales of players) may aim more atensuring security than at maximising playing success.
• Attendance or revenue. A capacity crowd enhances atmosphere and asense of occasion, and may in itself be seen as a measure of success.Recently, an increasing willingness to charge whatever ticket prices themarket will bear suggests that revenue (or profit) carry a heavier weightin the utility function than in earlier periods, when it was usual to chargethe same price for all matches, irrespective of the level of demand.
• Playing success.This is probably the most important objective of all, andone to which chairmen, directors, managers, players and spectators canall subscribe.
8 The Economics of Football
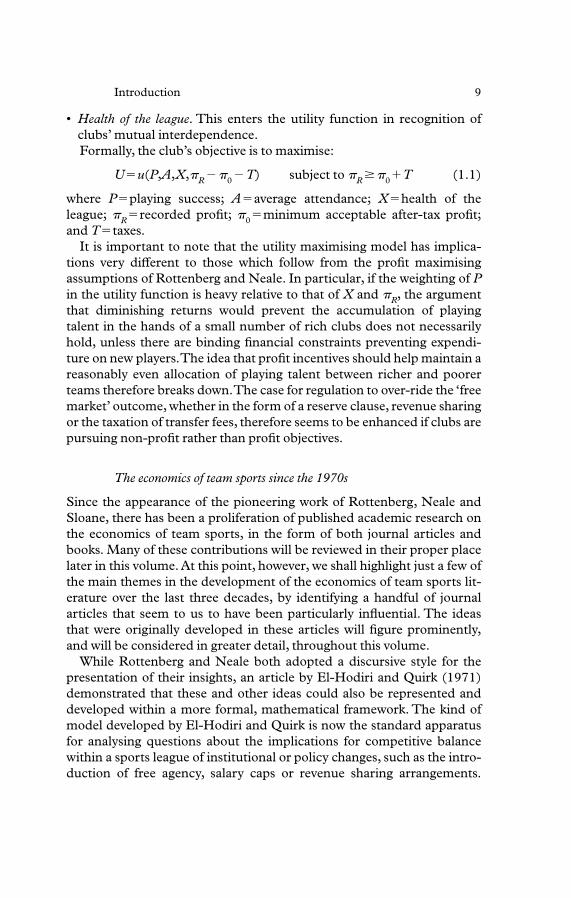
• Health of the league. This enters the utility function in recognition ofclubs’ mutual interdependence.Formally, the club’s objective is to maximise:
U�u(P,A,X,�R ��0 �T) subject to �R ��0�T (1.1)
where P�playing success; A�average attendance; X�health of theleague; �R�recorded profit; �0�minimum acceptable after-tax profit;and T�taxes.
It is important to note that the utility maximising model has implica-tions very different to those which follow from the profit maximisingassumptions of Rottenberg and Neale. In particular, if the weighting of Pin the utility function is heavy relative to that of X and �R, the argumentthat diminishing returns would prevent the accumulation of playingtalent in the hands of a small number of rich clubs does not necessarilyhold, unless there are binding financial constraints preventing expendi-ture on new players.The idea that profit incentives should help maintain areasonably even allocation of playing talent between richer and poorerteams therefore breaks down.The case for regulation to over-ride the ‘freemarket’ outcome, whether in the form of a reserve clause, revenue sharingor the taxation of transfer fees, therefore seems to be enhanced if clubs arepursuing non-profit rather than profit objectives.
The economics of team sports since the 1970s
Since the appearance of the pioneering work of Rottenberg, Neale andSloane, there has been a proliferation of published academic research onthe economics of team sports, in the form of both journal articles andbooks. Many of these contributions will be reviewed in their proper placelater in this volume. At this point, however, we shall highlight just a few ofthe main themes in the development of the economics of team sports lit-erature over the last three decades, by identifying a handful of journalarticles that seem to us to have been particularly influential. The ideasthat were originally developed in these articles will figure prominently,and will be considered in greater detail, throughout this volume.
While Rottenberg and Neale both adopted a discursive style for thepresentation of their insights, an article by El-Hodiri and Quirk (1971)demonstrated that these and other ideas could also be represented anddeveloped within a more formal, mathematical framework. The kind ofmodel developed by El-Hodiri and Quirk is now the standard apparatusfor analysing questions about the implications for competitive balancewithin a sports league of institutional or policy changes, such as the intro-duction of free agency, salary caps or revenue sharing arrangements.
Introduction 9

Nearly a quarter of a century later, and with the benefit of hindsight afterwitnessing a number of attempts at introducing such changes by theNorth American sports governing bodies in the interim, Fort and Quirk(1995) and Vrooman (1995) provided a compelling demonstration of theusefulness of this framework for policy analysis in team sports.
Sports economists have often claimed that an abundance of easilyaccessible data on the characteristics and performance of individual per-sonnel makes professional team sports an ideal laboratory for the empiri-cal scrutiny of economic theories and hypotheses that might provedifficult to test elsewhere. An article by Scully (1974), which investigatedthe relationship between the performance of individual players in USMajor League Baseball and their compensation, provides a classicexample of a contribution of this kind. Scully’s motivation was to demon-strate that severe restrictions on the rights of the players to sell their ser-vices in the labour market (in the form of the reserve clause) led toexploitation perpetrated by the teams as employers, in the sense that indi-vidual players’ wages were systematically below their contributions totheir teams’ revenue-earning capability. But the applicability of Scully’smethods and the relevance of his findings went much further than this.Identifying the links between pay, productivity and human capital is a taskof central importance towards achieving a much broader understandingof how labour markets work, as well as insights into specific issues such asinequality and discrimination in opportunity and compensation.
Developments elsewhere in the field of economics are also capable ofproviding valuable insights into the economics of sports.Two such exam-ples are articles by Rosen (1981) on the economics of superstars, and byLazear and Rosen (1981) on the earnings of chief executives in large cor-porations. Both provide insights into an issue of major controversy in thepublic debate about the economics of sports: the massively inflated earn-ings of the leading stars. Rosen demonstrated how in certain professionsthe technological conditions of supply create markets in which the topperformers can service very large audiences at little or no incrementalcost to themselves as the audience size increases.The outcome is that theextra compensation of the top performers (in comparison with slightlyless talented rivals) is hugely disproportionate to their extra talent. Filmstars and musicians are obvious examples, but the model is relevant tosports stars as well. Lazear and Rosen likened the high earnings of chiefexecutives to a lavish first prize in a tournament.The possibility of emerg-ing as a future prize winner provides incentives for others to strive forsuccess early in their careers, with obvious benefits for the productivity ofthe workforce as a whole. The internal labour market of a sports team,with its squad of aspiring youngsters competing for first-team places that
10 The Economics of Football

may eventually enable them to acquire superstar status, may resemblethat of a corporation in this respect.
For most of the 1970s and 1980s, research into the economics of foot-ball specifically (as opposed to team sports in general) focused mainly onidentifying the demand for attendance at football matches. An article byHart, Hutton and Sharot (1975) was an early forerunner of a number ofother UK demand studies that appeared over the course of the next twodecades. For a broader perspective, one could also consult books andother works published by social historians (such as Walvin, 1975), sociol-ogists (Dunning, Murphy and Williams, 1988; Guilianotti, 1999), orgeographers (Bale, 1992). During the 1990s, however, the range of foot-ball-related issues attracting the interest of British and other Europeaneconomists increased rapidly. Recent years have seen the publication ofarticles on topics as diverse as the settlement of transfer fees for footballplayers moving between clubs; the implications of the creation of aEuropean league for competitive balance in domestic and European foot-ball; the performance and job security of football managers; and discrim-ination against black players in football’s labour market. If the presentvolume makes even a small contribution towards disseminating knowl-edge and stimulating interest in this relatively new, exciting and rapidlyexpanding area of theoretical and empirical research, then it will haveachieved one of its most important objectives.
1.2 Outline of this volume
This section contains a brief outline of the contents of each of the follow-ing chapters of this volume. Chapter 2 provides an overview of the histor-ical development of English football as a business, and looks in somedetail at football’s present-day commercial structure. The chapter alsodraws comparisons between the historical development and commercialstructure of club football in England and in a number of other countries,including several in mainland Europe as well as Japan. Recent changes inthe economic and financial structure of professional football in Englandand elsewhere have raised widespread concern about the implications ofgrowing economic disparities between clubs operating at different levelswithin the league. As seen above, economists studying professional teamsports have for many years been aware of the link between the distributionof resources among the members of sports leagues, and the degree ofcompetitive balance. Explicit or implicit types of cross-subsidy and regu-lations restricting free economic competition in both the product andplayers’ labour markets have been a pervasive feature of the history ofEnglish football.The retain-and-transfer system, the maximum wage, the
Introduction 11

minimum admission price and gate and television revenue sharing aresome of the most prominent measures of this kind, all of which aredescribed in chapter 2.The chapter concludes by reporting an empiricalinvestigation in which a number of standard economic measures of con-vergence, divergence and inequality are applied to an English club-levelleague gate revenues data set.
Competitive balance and uncertainty of outcome are the main themesof chapter 3. Following Rottenberg, a number of US economists havedeveloped theoretical models of competitive balance in sports leaguecompetition, which formalise some of Rottenberg’s original insights, andpermit exploration of a number of other policy issues. Naturally, the USliterature on this topic has developed primarily with North American pro-fessional team sports in mind. Chapter 3 begins with a description of theNorth American model for the organisation and regulation of profes-sional team sports. A number of features which differ significantly fromtheir counterparts in the British or European model are highlighted.Thechapter then reviews the main findings of the US literature, and considerstheir relevance for the case of English football. Two key assumptions ofthe US literature in particular seem questionable if these models areapplied directly to European football. Following Sloane, the first is theassumption that team owners are motivated solely by profit.The second isthe assumption that playing talent is drawn from a pool whose total size isfixed. Especially since the Bosman ruling in 1995 (see chapter 2),European football labour markets have been open rather than closed,with players frequently hired from outside the domestic league. Inchapter 3 the competitive balance model is adapted for English footballby introducing behavioural assumptions other than profit maximisation,and by treating the labour market as open.
Closely balanced competition is important because it maximisesuncertainty of outcome or unpredictability: an essential characteristic ofany sports contest. The empirical sections of chapter 3 examine theextent to which individual match results in English football are predict-able or unpredictable. Patterns and trends in English league matchresults and goal scoring records since the 1970s are identified and com-pared with equivalent data from a number of other European leagues.The main long-term trend in the data is a progressive improvement in theperformance of away teams, and a corresponding decline in the impor-tance of home advantage. Analysis of sequences of match results revealsevidence of a negative ‘persistence’ effect: a recent run of good resultsappears to create either pressure or complacency, increasing the risk thatthe next result will be bad. Chapter 3 concludes by developing a statisti-cal model that processes the patterns in sequences of past match results,
12 The Economics of Football

in order to assess probable outcomes and provide forecasts for futureresults.
Professional football players are the main focus of attention in chapter4. The chapter starts by presenting a descriptive profile of various per-sonal and career characteristics of the players who turned out most regu-larly for their clubs in English league matches played during the 1979 and1999 seasons.The analysis helps identify a number of significant changesto the composition of English football’s regular labour force that havetaken place over the last 20 years.This is followed by a more general inves-tigation of patterns of international migration among professional foot-ballers, which draws on the findings of previous sociological research.
Chapter 4 then goes on to consider the determinants of players’ com-pensation.While the earnings of some superstar players are now a causeof major controversy, above-inflation increases in players’ wages, espe-cially at the highest level, have been a permanent feature of English foot-ball since the abolition of the maximum wage in the early 1960s. Chapter4 considers some theoretical explanations for the extremely high earningsof the top superstars in sports and in similar fields such as film, music andpublishing. Scarcity of supply of the highest talent, together with the verylarge audience reach of the top performers, are important factors whichhelp to explain highly skewed earnings distributions. Another importantaspect of footballers’ compensation is the fact that wage structures areoften extremely hierarchical, and players who are perhaps only a smallfraction better than others frequently earn several times as much. Byregarding the massive salaries of the top players as equivalent to a gener-ous first prize in a tournament, encouraging all players to contributemaximum effort to the team’s cause in an attempt to become the nextprize winner, the rank-order tournament model provides one plausibleexplanation for observed wage differentials. Finally, chapter 4 concludeswith an empirical investigation of the English football transfer market.The trading of players for cash is a feature of professional football world-wide, though one that is currently subject to the intense scrutiny ofEuropean legislators.The empirical model presented in chapter 4 showshow transfer fees are influenced by the characteristics of the players con-cerned, and of the buying and selling clubs.
Rottenberg considered briefly the nature of the production process inteam sports, suggesting that the output of the club could be measured interms of its attendance. Other researchers have taken up his idea of a teamproduction function, but have typically employed team performancemeasures (such as win ratio), rather than attendance, as a measure ofoutput. There have been numerous team production function studiesbased on North American sports such as baseball and basketball, in
Introduction 13

which many dimensions of playing skill are quantifiable, making it easy tomeasure individual productivity. But in American football and (associa-tion) football, there is greater interaction among the player inputs, so themeasurement of productivity is more problematic. Chapter 5 includes areview of the empirical literature on team production functions, anddescribes the task of modelling team production in football.
An interesting application of the team production function approach isin quantifying the contribution of the manager to the team’s perfor-mance. Typically, the managerial input is measured as part of a residualthat is obtained after controlling for the players’ contribution to perfor-mance. Having controlled for team quality, the variation in performancethat remains unexplained is attributed either to the manager or to luckand other random factors. Chapter 5 concludes by describing somerecent research which estimates team production functions using Englishfootball data, and uses them to obtain efficiency scores for footballmanagers.
The measurement of managerial efficiency forms only one part of theresearch agenda on the role of managers in team sports. Sociologists andeconomists have also examined the link between team performance andthe security of the manager’s job tenure, and the effect of a change ofmanager on the subsequent performance of the team. This literature,which is reviewed in chapter 6, contributes to a broader research pro-gramme that is concerned with the two-way link between organisationalperformance and the managerial contribution.
Chapter 6 goes on to present some new empirical results for Englishfootball managers. Chronic job insecurity is undoubtedly one of thedefining characteristics of the football manager’s position. An importantaim of the empirical analysis in chapter 6 is to quantify the factors that aremost likely to trigger a change of manager, including match results overthe short term, longer-term team performance measures and various per-sonal and human capital attributes of the manager himself. Of course,changing the manager is a rational decision for club owners to take if it islikely to lead to an improvement in fortune under a new incumbent.Opinion as to the average effect on team performance of a change ofmanager seems to be quite mixed.The empirical results for English foot-ball presented in chapter 6 suggest that while a change of manager oftenhas a disruptive effect that makes matters worse in the short term, in thelonger term teams that change managers seem to recover faster from a runof poor results than teams that retain their manager following a poor run.
Until quite recently, the economic analysis of football was concernedalmost exclusively with the determinants of demand, or with the statisti-cal modelling of match and season attendances. Even in the present-day
14 The Economics of Football
world of highly lucrative television contracts, merchandising and spon-sorship, gate revenues still constitute a significant proportion of the totalrevenues of most football clubs. Furthermore, spectators who attendmatches in person are not just passive consumers.Their presence contrib-utes in a fundamental way to the quality of the product, by generatingatmosphere and a sense of occasion. Most spectators also seek toinfluence match outcomes though the effects of vocal encouragement andcriticism of players, managers and match officials. For these reasons, aswell as the ‘enthusiasm effect’ suggested by Neale, supply and demandare really interdependent.
Identifying the causes of variations in attendances, from season toseason and from match to match, is therefore the main objective ofchapter 7.The chapter reviews the empirical literature on the demand forfootball attendance, highlighting some of the main problems of modelspecification, estimation and interpretation encountered by researchersin this area. Sociological case studies from Spain and Scotland are alsoused to illustrate the impact of broader social or cultural influences onpatterns of demand for football attendance. Chapter 7 concludes by pre-senting an empirical analysis of English club-level attendances during thepost-Second World War period. The analysis shows the effects on atten-dances of factors such as short-term loyalty, team performance andadmission prices. It also investigates the relationship between varioussocio-economic, demographic and football-related characteristics of eachclub and its home town, and average attendances over the long term.
Neoclassical economics predicts that unco-ordinated interactionsbetween large numbers of self-interested buyers and sellers operating infree, unregulated markets can normally be relied upon to deliver anefficient allocation of scarce resources. A key assumption is that all rele-vant information about the prices and characteristics of goods and ser-vices is transmitted rapidly and accurately among all participants in therelevant market. Chapter 8 presents two case studies, which focus on theefficiency with which relevant information about the performance offootball teams on the field of play is impounded into the prices at whichtrade takes place in particular markets.
The first case study concerns the secondary market for trade in theshares of football clubs quoted on the London Stock Exchange (LSE).Following a description of the historical evolution of present-day struc-tures of ownership and control in English club football, the empiricalinvestigation seeks to quantify the extent to which major events that takeplace on the field of play, such as European qualification and elimination,or domestic promotion and relegation, carry implications for the shareprices of football clubs that are floated on the LSE. If new information
Introduction 15

about team performance is transmitted and absorbed by the marketsrapidly, a direct link between fluctuations in fortunes on the field of playand variations in share prices should be discernible empirically. Thesecond case study in chapter 8 concerns the market for fixed-odds bettingon the results of football matches.The main objective here is to establishwhether a high-street bookmaker’s published odds reflect all informationthat is relevant to predicting the match outcome.
This volume concludes in chapter 9 with a discussion of some of themajor policy issues concerning football’s future development as a sportand as a business that are currently facing the sport’s governing bodies,club owners, broadcasters, sponsors and legislators. Among the policyissues considered, with the aid of the economic analysis presented in pre-vious chapters of this volume, are the proposals for the formation of aEuropean Super League; rocketing inflation in players’ wages; plans toreform or even abolish the players’ transfer market; the prospects for thesurvival of the smaller clubs; and the future of football’s relationship withthe broadcasting media. In one way or another, decisions concerning allsuch matters impinge upon what is surely the most fundamental issue inthe economics of team sports: the need to maintain competitive balance.Forty-five years on, this is one issue that is still as relevant today as it wasat the time Rottenberg’s original ground-breaking article was published.
1.3 The use of econometrics in this volume
As indicated above, chapters 2–8 of this volume report the results of newempirical investigations of a number of the key topics that are covered ineach chapter. Regression analysis, in various guises, is the main empiricaltechnique used in these investigations. For readers who are familiar witheconometrics, in the empirical sections of this volume we have attemptedto strike a reasonable balance between the objectives of technical rigourand accessibility.With accessibility in mind, we have chosen not to burdenthe text with lengthy technical discussions about model specification orestimation issues.We have also chosen not to extend the tables of empiri-cal results (many of which are already large) by including extensive list-ings of diagnostic test statistics. Readers who are interested or concernedabout such matters should consult the relevant journal articles cited inthe text, where the various technical issues are given proper emphasis andattention.
For the benefit of readers who are unfamiliar with econometrics, thepresentation of the empirical results in this volume has been confined tospecific sections within each chapter. These sections can be skipped
16 The Economics of Football

without prejudicing understanding of the material contained elsewhere.Readers who skip the empirical sections will find a concise and com-pletely non-technical summary of the main empirical findings in the con-cluding sections of each chapter. For readers without a background instatistics or econometrics who do wish to read the empirical sections, therest of this sub-section provides a brief, non-technical description of thebasics of regression analysis, and introduces some of the main terminol-ogy and jargon. Readers with an econometrics background are invited toskip the rest of section 1.3 and proceed directly to chapter 2.
Most econometric studies seek either to explain observed facts aboutthe real world, or to construct a model that can predict the outcome ofevents that have not yet occurred.This volume includes examples of bothtypes of econometric investigation.Typically, a regression model takes thefollowing form:
yi��1��2x2i��3x3i�. . .��kxki�ui (1.2)
The definitions of variables and symbols used in (1.2) are as follows:yi is the dependent variablex2i, x3i, . . . , xki are the independent or explanatory variablesui is the error term�1, �2, �3, . . . , �k are the regression coefficients.
The dependent variable yi is the variable whose behaviour the modelseeks either to explain or to predict.The independent variables x2i, x3i, . . . ,xki are other variables thought to influence or determine yi. Thecoefficients �2, �3, . . . , �k identify the impact on yi of small changes in thevalues of each of x2i , x3i , . . . , xki respectively. For example, if x2i increasesby one unit while all other variables in (1.2) are held constant, the numer-ical adjustment to the value of yi is given by the coefficient �2. The oneremaining coefficient, �1, allows for the scaling of the dependent andindependent variables; in most (but not all) regression models �1 does nothave any important interpretation.4 Finally the error term ui allows forany variation in the dependent variable that is not accounted for by corre-sponding variation in the independent variables. In most regressionmodels, the value taken by the error term is assumed to be purelyrandom. For purposes of statistical inference (see below) it is often useful
Introduction 17
14 Occasionally, other notational conventions are used in an expression such as (1.2).Different symbols may be used for both variables and coefficients. It is sometimes con-venient to write an expression such as (1.2) more concisely using matrix notation, i.e. yi���xi�ui , where ���(�1 �2 . . . �k) and x�i�(1 x2i . . . xki). Alternatively it is sometimesconvenient to use variable names rather than ys and xs, i.e. DEPVAR��1��2 INDVAR2�. . .��kINDVARk�ERROR, where the names actually used describe the variables.

to assume that the error term follows some specific probability distribu-tion, such as the normal distribution.
The ‘i’-subscripts on the variables yi, x2i, x3i, . . . , xki and ui in (1.2) indi-cate that the relationship between the independent variables and thedependent variable holds over a number of observations contained withina sample of data.The observations are indexed over i�1 . . . N, where N isthe total number of observations.5 The sample therefore comprises Ncomplete sets of observed numerical values of x2i, x3i, . . . , xki and yi.Thenumerical values of the coefficients �1,�2, �3, . . . , �k are all unknown, andthe purpose of the regression analysis is to process the data in order toobtain the best possible numerical estimates of these coefficients. Thechoice of estimation method depends on the specification of the model.Estimation methods used in this volume (and referred to in the text)include Ordinary Least Squares (OLS), Generalised Least Squares(GLS), Weighted Least Squares (WLS), Fixed Effects and RandomEffects (FE and RE), Maximum Likelihood (ML) and SeeminglyUnrelated Regressions estimation (SUR). Estimated regressioncoefficients are usually denoted , , , . . . , , to distinguish themfrom the corresponding true (but unknown) coefficients �1, �2, �3, . . . ,�k.
Once a regression model has been estimated, the signs and numericalmagnitudes of the estimated coefficients convey information about thedirection and strength of the relationship between each independent vari-able and the dependent variable. Because the estimated coefficients arebased on a limited sample of data, there is always a suspicion of impreci-sion or unreliability attached to them. For this reason, estimationmethods for regression coefficients provide a standard error with eachcoefficient estimate.The standard error reflects the reliability of the esti-mate: the smaller the standard error, the greater the reliability. It can alsobe used to construct a confidence interval for the true value of thecoefficient. A confidence interval is simply a range of likely values for thetrue coefficient located on either side of the estimated coefficient.We canclaim that the true coefficient should lie somewhere within this range,subject only to a small (and specified) probability of being wrong.
The ratio of an estimated coefficient to its standard error, usuallyknown as a z-statistic or t-statistic (depending on which type of regressionmodel is being used), provides a convenient method for assessing whetherthe estimation has succeeded in identifying a relationship that is reliable
bkb3b2b1
18 The Economics of Football
15 In cases where data are observed over a number of different time periods, ‘t’-subscriptsare used instead of ‘i’-subscripts in order to denote time. For data with both a cross-sec-tional and a time series dimension, variables may be indexed using both ‘i ’- and ‘t’-sub-scripts.

in a statistical sense. This is one of the main tasks of statistical inference.The z-statistic (or t-statistic) for the coefficient estimate is calculatedas z� /se( ) where se( ) is ’s standard error. If the absolute value ofthe z-statistic exceeds a certain critical value, we say that is statisticallysignificant or significantly different from zero. This means that we havesufficient statistical evidence to reject the null hypothesis that the true valueof the coefficient �2 is zero, in favour of the alternative hypothesis that �2 isnon-zero. In this case the null and alternative hypotheses would bewritten H0:�2�0 and H1:�20.This is an example of a two-tail hypothe-sis test. Another possibility is a one-tail test, in which the null and alterna-tive hypotheses might take the form H0:�20 and H1:�2�0, respectively.Whenever a hypothesis test is carried out, it is usual to quote an accompa-nying significance level, such as 1, 5 or 10 per cent.This expresses the prob-ability that the test may cause us to draw a wrong inference by rejecting anull hypothesis that is actually true.With a significance level of 5 per cent,if �2 really were zero the test would run a 5 per cent risk of incorrectlyconcluding that �2 is non-zero. The smaller the significance level thegreater the confidence we can have in any inference that an estimatedcoefficient is statistically significant, and that the true coefficient is there-fore different from zero.
If the purpose of a regression analysis is explanation, then by followingthe procedures outlined above, we may be able to infer (with only a smallrisk of making a mistake) that �2 is non-zero. If so, then according to (1.2)we have shown that the independent variable x2i does have an effect on thedependent variable yi. In other words, some of the variation in yi has beenexplained by corresponding variation in x2i. The estimated coefficients,standard errors and z- or t-statistics are therefore of considerable interest:they show which independent variables are important in explaining thebehaviour of the dependent variable. Consequently, much of the discus-sion of the empirical results in this volume concentrates on this aspect ofthe estimated regression models.
If the purpose of the regression analysis is prediction, the estimatedcoefficients, standard errors and z- or t-statistics are important, becausethey enable us to determine which independent variables should beincluded in the model that is to be used to generate the best possible pre-diction. In order to obtain a prediction, we need a set of values for all ofthe independent variables for an out-of-sample observation. These aresubstituted into the estimated model (already estimated using the in-sample data), so as to produce a prediction for the out-of-sample value ofthe dependent variable.
The linear regression model, also known as the multiple regression model, isprobably the best known and most widely used type of regression model.
b2
b2b2b2b2
b2
Introduction 19
It is used in most situations where the dependent variable is continuous,and can take any numerical value. The linear regression model isemployed a number of times in this volume: in chapter 2, to estimatemodels of convergence in football club gate revenues; in chapter 4, to esti-mate a model that explains transfer fees in terms of player and club char-acteristics; in chapter 6, to estimate the effect of a change of manager onteam performance during the season after the change takes place; inchapter 7, to estimate models that explain variations in match atten-dances; and in chapter 8, to estimate models that explain movements infootball club share prices.
Not all data, however, are amenable to analysis using the linear regres-sion model.A model capable of predicting match results, for example, hasa discrete or qualitative dependent variable, which can take only one ofthree non-numerical values: ‘win’, ‘draw’ or ‘lose’. The ordered probitmodel, one of a broader class of discrete choice models, is the appropriateregression model to use in this case. This type of model is estimated forthe first time in chapter 3, and is employed again in chapters 6 and 8. Asecond example arises when the relationship between measurable teaminputs (playing talent or financial resources) and team performance isconsidered. In estimating this relationship, it is useful to be able todecompose the error term (the variation in team performance that cannotbe explained by variations in the measurable inputs) into two parts: onereflecting the manager’s contribution to performance, and the otherreflecting random influences or luck. In chapters 5 and 6 stochastic frontieranalysis is used to specify a regression model that has a special error termwith the required structure. A final example arises when we seek to iden-tify the factors most important in triggering the decision to terminate amanager’s appointment. In this case the dependent variable in the regres-sion model is an indicator variable, which takes the form yi�0 if themanager was retained and yi�1 if the manager was removed after match iwas played. In chapter 6 yet another type of regression model is needed toestimate what are known as job-departure hazard functions for footballmanagers.
In the space available in section 1.3, it has been possible to provideonly a brief and highly selective outline of some of the basics of regres-sion analysis. Readers who wish to discover more are strongly encour-aged to explore one or more of the excellent econometrics texts that arecurrently available. In teaching econometrics to undergraduates andpostgraduates for a number of years, the authors have found the texts byGujarati (1995), Kennedy (1998), Pindyck and Rubinfeld (1998) andGreene (1999) to be especially helpful. Gujarati and Pindyck andRubinfeld both provide a detailed and comprehensive beginner’s guide
20 The Economics of Football

to econometrics, while Kennedy explains the terminology of economet-rics in a clear, succinct and non-technical manner. Greene, meanwhile,offers a more advanced treatment, including full technical details of alarge number of more highly specialised econometric models and estima-tion techniques.
Introduction 21