Embed Size (px)
Citation preview
HOUSE OF LORDS
Economic Affairs Committee
1st Report of Session 2014‒15
The Economics of High Speed 2
Ordered to be printed 10 March 2015 and published 25 March 2015
Published by the Authority of the House of Lords
London : The Stationery Office Limited £price
HL Paper 134
Select Committee on Economic Affairs The Economic Affairs Committee is appointed by the House of Lords in each session “to consider economic affairs”.
Membership The Members of the Select Committee on Economic Affairs are: Baroness Blackstone Lord Carrington of Fulham Lord Griffiths of Fforestfach Lord Hollick (Chairman) Lord Lawson of Blaby Lord May of Oxford Lord McFall of Alcluith Lord Monks Lord Rowe-Beddoe Lord Shipley Lord Skidelsky Lord Smith of Clifton Baroness Wheatcroft
Declaration of interests See Appendix 1
A full list of Members’ interests can be found in the Register of Lords’ Interests: http://www.parliament.uk/mps-lords-and-offices/standards-and-interests/register-of-lords-interests
Publications All publications of the Committee are available at: http://www.parliament.uk/hleconomicaffairs
Parliament Live Live coverage of debates and public sessions of the Committee’s meetings are available at: http://www.parliamentlive.tv
Further information Further information about the House of Lords and its Committees, including guidance to witnesses, details of current inquiries and forthcoming meetings is available at: http://www.parliament.uk/business/lords
Committee staff The staff who worked on this inquiry were Robert Whiteway (Clerk), Ben McNamee (Policy Analyst), Stephanie Johnson (Committee Assistant) and Oswin Taylor (Committee Assistant).
Contact details All correspondence should be addressed to the Clerk of the Economic Affairs Committee, Committee Office, House of Lords, London SW1A 0PW. Telephone 020 7219 5358. Email [email protected]
CONTENTS
Page
Summary 5
Our main conclusions and recommendations 6
Chapter 1: An introduction to High Speed 2 9 “This is the age of the train” 9 What is High Speed 2? 10 The reasons for building HS2 10 Should HS2 be part of a wider plan? 12
Chapter 2: The cost of HS2 15 Cost of construction 15 Cost of complementary projects 20 The effect of speed on the cost 21 Cost of disruption 23 Expected net cost of HS2 to the Government 24 Chapter 2: Conclusions and recommendations 27
Chapter 3: Demand and fares modelling 28 How demand is modelled 28 Forecast demand—‘without HS2 scenario’ 29 Forecast demand—‘with HS2 scenario’ 36 Demand forecasts for other high speed railways 37 Level of fares on HS2 38 Chapter 3: Conclusions and recommendations 41
Chapter 4: Capacity 42 Explanation of the capacity problem in the Strategic Case 42 Overcrowding on long-distance services 45 Overcrowding on commuter services 54 Space for commuter and freight train paths 58 Chapter 4: Conclusions and recommendations 60
Chapter 5: Alternatives to provide capacity 61 The Government’s assessment of other ways to increase capacity 61 Other alternative solutions to the capacity problem 68 Have the Government considered all the options? 71 Has the Government properly considered the alternatives to provide additional capacity? 72 Chapter 5: Conclusions and recommendations 73
Chapter 6: Will HS2 stimulate economic growth? 74 How is the economic impact of HS2 assessed in the Economic Case? 74 Does transport infrastructure stimulate growth? 75 How will HS2 affect economic activity in the UK? 77 How can the benefits of HS2 be maximised? 85 The effect of HS2 on freight 89 Chapter 6: Conclusions and recommendations 92
Chapter 7: Is HS2 the best way to stimulate economic growth in the north of England? 93 Improving regional connectivity 93 Building HS2 from north to south? 98 The importance of investment in infrastructure outside London 98 Chapter 7: Conclusions and recommendations 99
Chapter 8: Estimating the benefits of HS2 100 Cost-benefit analysis of HS2 100 The transport user benefits of HS2 105 Values of travel time savings 105 Business travel on HS2 112 Chapter 8: Conclusions and recommendations 119
Chapter 9: The questions for Government 120
Appendix 1: List of Members and declarations of interest 122
Appendix 2: List of witnesses 123
Appendix 3: Call for evidence 129
Appendix 4: List of correspondence 131 Evidence is published online at http://www.parliament.uk/hleconomicaffairs and available for inspection at the Parliamentary Archives (020 7219 3074). Q in footnotes refers to a question in oral evidence.
THE ECONOMICS OF HIGH SPEED 2 5
SUMMARY
The construction of High Speed 2—a railway estimated to cost £50 billion—will be one of the most expensive infrastructure projects ever undertaken in the UK. The Government has yet to make a convincing case for proceeding with the project.
We fully support investment in rail infrastructure and welcome the Government’s commitment to it. But the project has to be developed against a background of financial restraint and it is not at all clear that HS2 represents the best, most cost-effective solution to the problems it is intended to solve.
The Government’s two declared objectives for the project are to increase capacity on the railway to meet long-term demand and to rebalance the economy by stimulating growth in the north of England. But the scale of the alleged capacity problem is unclear and the Government has not demonstrated that HS2 is the most effective way of achieving the desired rebalancing of the economy.
On capacity, published statistics on current rail usage do not suggest that there is an overcrowding problem on long-distance trains, either now or in the near future. On stimulating growth, the Government has not considered whether this could be better achieved by investing in improving regional links between northern cities.
The Government claims that the biggest beneficiaries of the project will be business travellers, yet the evidence used to calculate the magnitude of this benefit (an estimated £40.5 billion) is out-of-date and unconvincing. Neither are we convinced why, if business travellers were the biggest beneficiaries from the project, they should not contribute more to the cost by paying higher fares.
Before spending more taxpayers’ money on this project, we believe that Government should answer the questions raised in this report. It needs to demonstrate that HS2 is the most effective way of achieving the declared objectives of the project and, if it is not, then the plan needs to change. The lengthy passage of the enabling legislation for the first phase of the construction provides an opportunity to examine the case for HS2. There should be no embarrassment in being prepared to revise the project: the objectives and cost are too important.
6 THE ECONOMICS OF HIGH SPEED 2
OUR MAIN CONCLUSIONS AND RECOMMENDATIONS
National transport plan
1. An investment decision on the scale of HS2 should have been made with reference to a co-ordinated transport plan for passenger and freight traffic across all modes of transport. Such a plan could have given full consideration to how all areas of Great Britain and all transport users would be affected by the project.
The cost of HS2
2. HS2 is an expensive project. The construction of the railway and purchase of rolling stock is estimated to cost up to £50 billion at 2011 prices, including contingency. The net cost to the taxpayer is expected to be £31.5 billion at 2011 prices over 60 years. If complementary projects to connect HS2 to existing transport networks are taken into account, the final cost would be even higher.
3. If a new railway is required, the costs could be reduced, for example by constructing it to run at a slower speed—say at the same speed as the French TGV—and by reducing the cost of construction closer to French levels.
Who will pay for HS2?
4. Business travellers are forecast to derive the most benefit from the project (70 per cent of the net transport benefits). Passengers could be charged higher fares for travelling on HS2 to recoup more of the costs and reduce the burden on the taxpayer, especially since many taxpayers would derive no benefit from the project.
Demand and capacity
5. The Government’s principal justification for building HS2 is to provide capacity to meet long-term rail demand. Inadequate information on rail usage and demand modelling makes it difficult to determine whether this is correct. Overcrowding appears to be caused by commuter traffic, not long-distance traffic, and is exacerbated by inflexible pricing.
Lack of consideration of alternative rail investment
6. It is impossible to agree with the Government that HS2 is the only solution to increase capacity on the rail network. Additional capacity could be provided by incremental improvements to the existing network, a new conventional railway line, or a new high-speed line (of which HS2 is only one option). These options have not been assessed equally, with only HS2 receiving serious consideration by the Government.
Effect on the UK economy
7. We do not believe that the Government has shown that HS2 is the best way of stimulating growth in the country. While investment outside London is long overdue, evidence and experience from other countries has suggested that London would be the biggest beneficiary of a project such as HS2.
THE ECONOMICS OF HIGH SPEED 2 7
8. Nor has the Government considered the opportunity cost of spending £50 billion at 2011 prices on this single railway. How much could be achieved if that money were invested differently?
Prioritisation
9. The evidence we have heard suggests that investment in regional transport links between cities outside London could be more likely to generate significant growth in the north than HS2. The Government should consider whether improving trans-Pennine links, or building the northern legs of HS2 first, are higher priorities than the southern leg of HS2.
Lack of evidence
10. The cost-benefit analysis for HS2 relies on evidence that is out-of-date and unconvincing. The Government needs to provide fresh, compelling evidence that HS2 will deliver the benefits it claims.
Conclusion
11. We welcome the objectives the Government has set. We fully support investment in UK rail infrastructure. But the Government has not made a convincing case for why this particular project should go ahead. The analysis presented to justify the project is seriously deficient.
12. The slow progress of the High Speed Rail (London–West Midlands) Bill through Parliament provides an opportunity for the new Government following the 2015 General Election to review the conclusions of this report and the questions that arise from it.
13. In the final chapter of our report we list the questions that the new Government should consider. The Government must answer these questions before the High Speed Rail Bill completes its passage through Parliament.
8 THE ECONOMICS OF HIGH SPEED 2
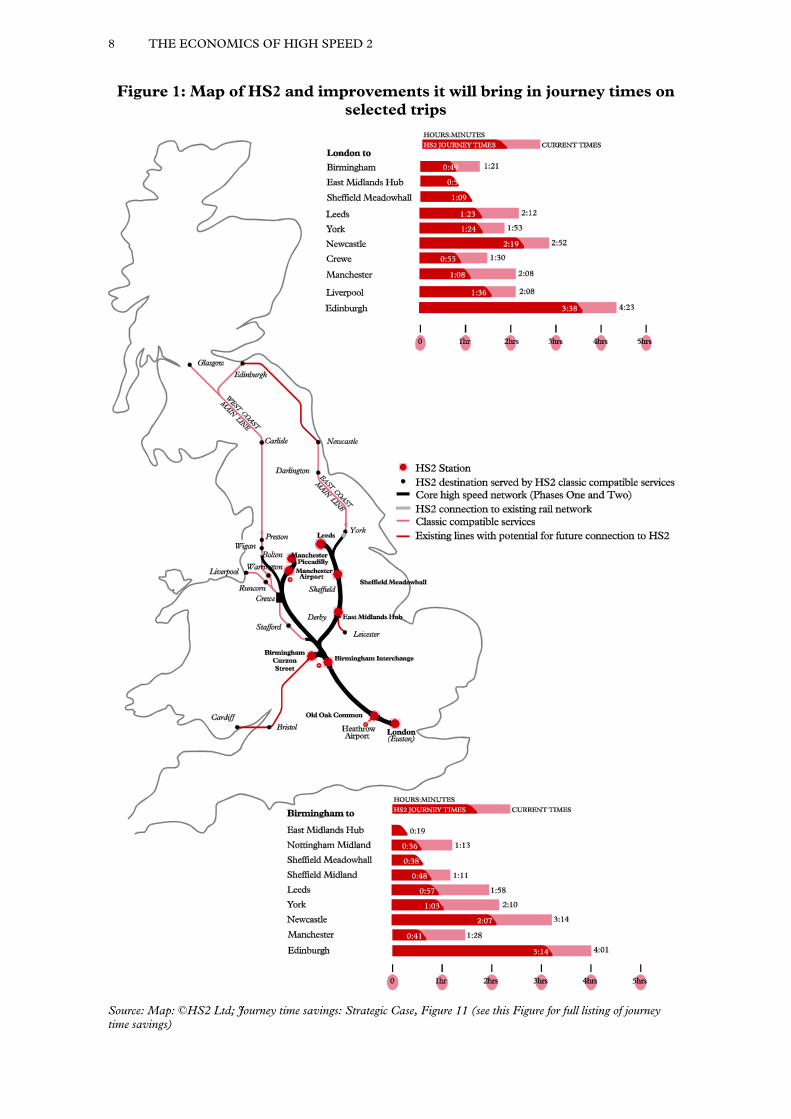
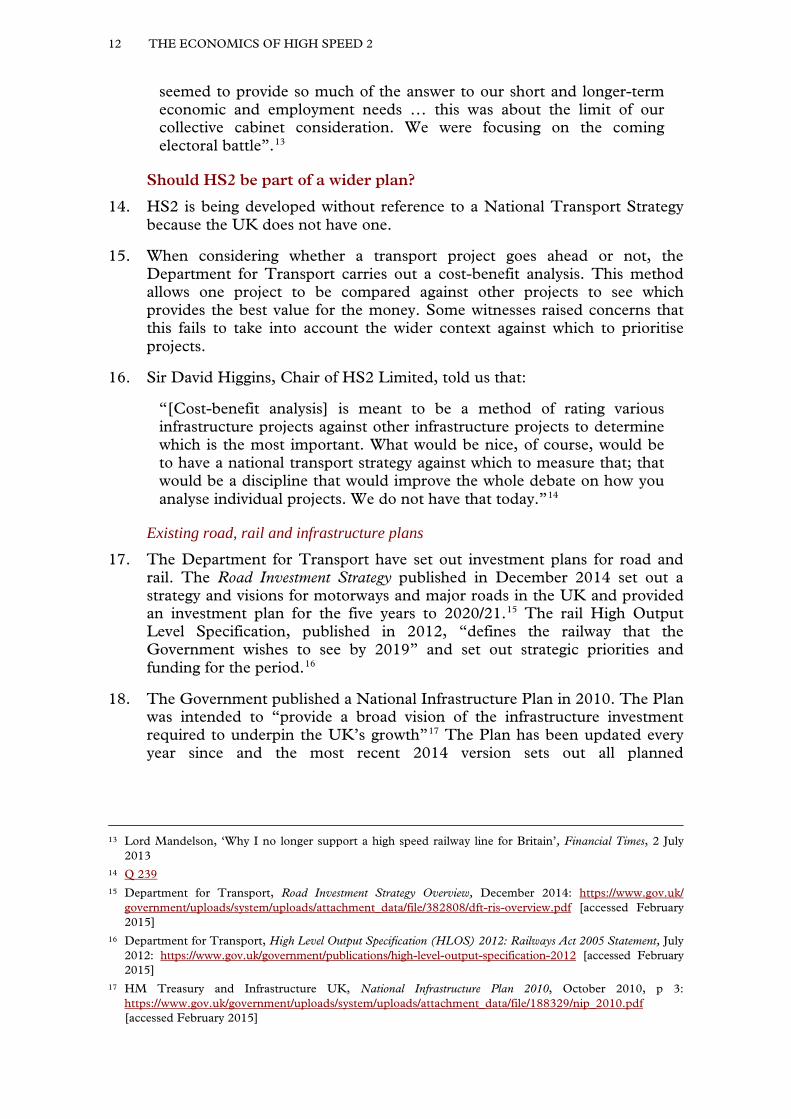
Figure 1: Map of HS2 and improvements it will bring in journey times on selected trips
Source: Map: ©HS2 Ltd; Journey time savings: Strategic Case, Figure 11 (see this Figure for full listing of journey time savings)
The Economics of High Speed 2
CHAPTER 1: AN INTRODUCTION TO HIGH SPEED 2
“This is the age of the train”
“The train can whisk you to your destination at speeds up to 125 mph in air conditioned comfort. With special ergonomically designed seats it allows you to forget you ever suffered from cramp and back ache. And instead of admiring the boot of the car in front you can admire the scenery. If you’ve work to catch up on before a meeting, the train is the ideal place to do it. And after the meeting, instead of the long drive home, you can start to unwind.”1
1. In the late 1970s and early 1980s, Britain had one of the “most exciting” inter-city schedules anywhere in the world: “Only Japan could seriously rival Britain for the sheer number of trains operated at 200 kilometres per hour (125 mph), then regarded as the threshold for high-speed operation.”2 This was the result of the InterCity 125, first introduced by British Rail in 1976. It was viewed as an immediate success.3 An advertising campaign from British Rail proudly declared that “This is the age of the train.”
2. Since that age, other countries have caught up. In September 1981, two months before the advertisement quoted above appeared in The Times, President Mitterand inaugurated the Train à Grande Vitesse (TGV), the French high speed train which covered the 260 miles between Paris and Lyon at a top speed of 260 kilometres per hour (160 mph). France has built a further nine lines and the network today spans over 2000 kilometres with a maximum speed of 320 kilometres per hour (200 mph). Four further lines are under construction. Germany, Italy and Spain also have intercity rail networks capable of speeds of 300 kilometres per hour (185 mph). Other countries including China, South Korea and the United States are building new high speed lines.
3. In January 2012 the Government committed itself to building High Speed 2, a railway designed for speeds of up to 400 kilometres an hour (250 mph). Is there substance to the claims of some critics that High Speed 2 is merely a costly vanity project; ‘who has the fastest train’ a proxy for the “global race”?4 Or are the British Chambers of Commerce right to be concerned that:
1 ‘15 minutes after the meeting started is no time to wish you’d taken the train’, The Times, 3 November 1981 (advertisement)
2 Railway-technology.com, Biting the British Bullet, September 2007: http://www.railway-technology.com/features/feature1217 [accessed February 2015]
3 Matthew Engel, Eleven Minutes Late, 1st edition (London: Macmillan, 2009), p 230 4 The Prime Minister said in July 2013 that fast and efficient transport infrastructure such as HS2 was
required “if we want to be a winner in… the global race.” Speech at Bentley Motors, Crewe, 23 July 2013: https://www.gov.uk/government/speeches/bentley-motors-qa-with-the-prime-minister-as-1000-new-jobs-announced [accessed February 2015]
10 THE ECONOMICS OF HIGH SPEED 2
“A U-turn on HS2 would be a turning point for the UK economy. It would be a signal that Britain has a poverty of national ambition, satisfied with third-rate infrastructure, and unable to make the most basic of decisions to support economic growth”?5
What is High Speed 2?
4. High Speed 2 (HS2) is the Government’s proposal for a new railway line that will run from London via Birmingham to Manchester and Leeds, to be built in two phases:
• Phase One: London Euston to a new station at Birmingham Curzon Street via Old Oak Common in West London and Birmingham International, serving Birmingham Airport, connecting to the West Coast Main Line north of Birmingham.
• Phase Two: The line will be extended north in two legs, one to Manchester Piccadilly (“Western leg”) and one to a new station in Leeds (“Eastern leg”). Intermediate stations are proposed at Manchester Airport and Crewe on the Western leg; the East Midlands and Sheffield Meadowhall on the Eastern leg.
5. HS2 will be connected to the existing rail network6 which means that some trains (known as “classic compatible” trains) will be able to use the HS2 line to provide direct services from London to Glasgow and Edinburgh via the Western leg, and Newcastle via the Eastern Leg (passengers travelling to Edinburgh on the Eastern leg would be required to change at Newcastle).7 Figure 1 above illustrates the HS2 line, lines that could provide classic compatible services, and existing lines with the capability for future connection to HS2.
6. The Government has set up HS2 Limited (HS2 Ltd) as the company responsible for developing and promoting the project. The High Speed Rail (London–West Midlands) Bill, currently being considered by a Select Committee of the House of Commons, would confer the powers on HS2 Ltd to build Phase One of the railway. The Select Committee provides individuals and bodies directly and specially affected by the Bill with the opportunity to object to the Bill’s specific provisions and to seek its amendment. Phase Two would require Parliamentary approval through a separate Act.
The reasons for building HS2
7. The Government’s Strategic Case for HS2, published in October 2013, states that the objectives of the project are to:
• “Provide sufficient capacity to meet long term demand, and to improve resilience and reliability across the network; and
5 Written evidence from the British Chambers of Commerce (EHS0045) 6 The Western leg will connect to the West Coast Main Line north of Manchester and the Eastern leg to the
East Coast Main Line near York. 7 Trains running only on HS2 track only would be higher, longer and wider than trains in use in Britain
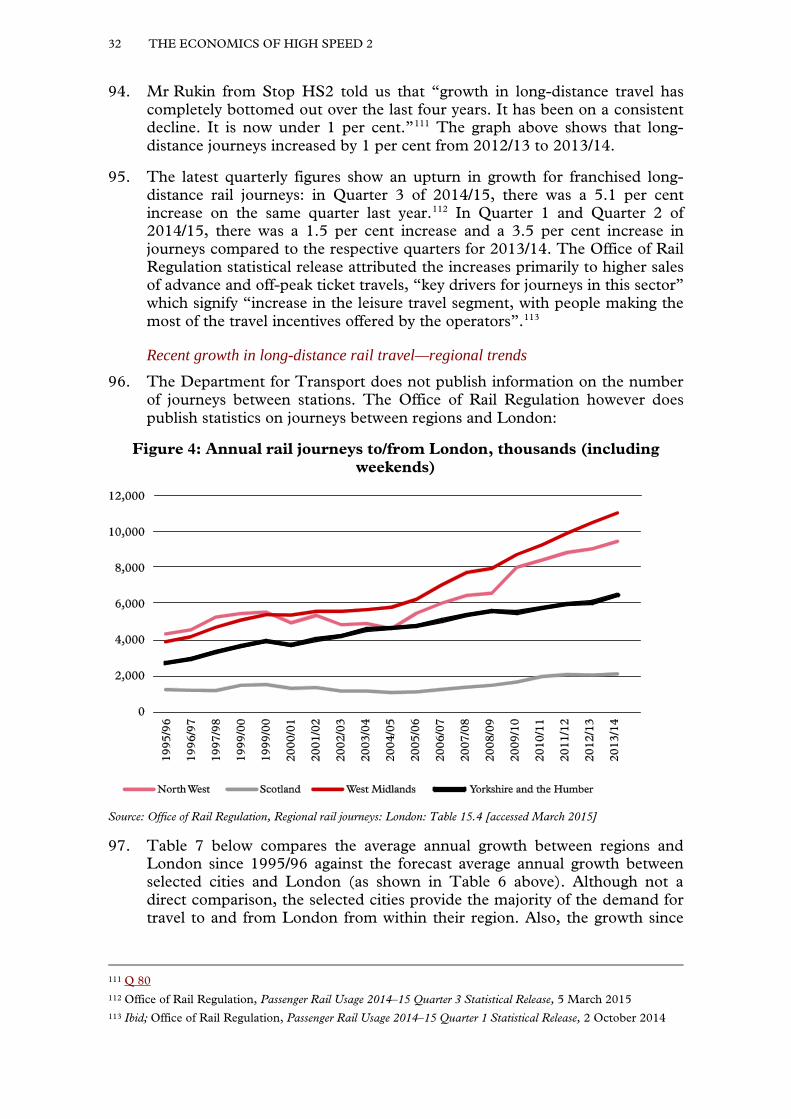
today. They could accommodate up to 1,100 passengers.
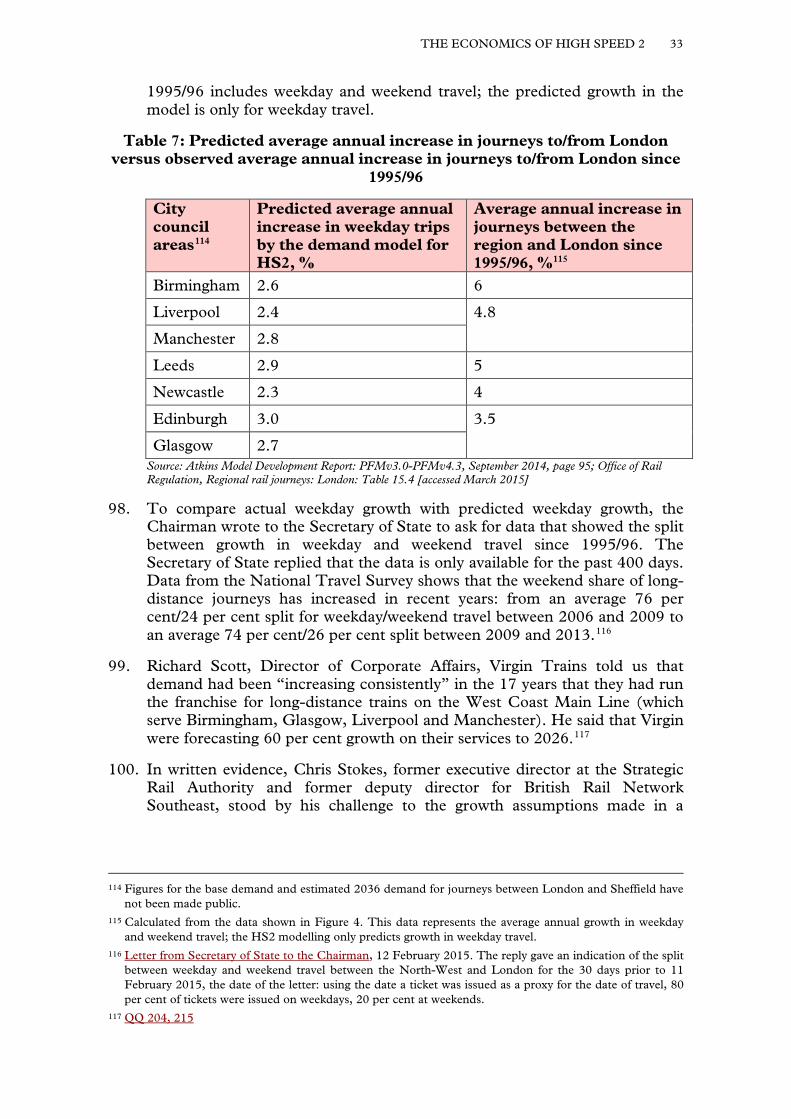
THE ECONOMICS OF HIGH SPEED 2 11
• Improve connectivity by delivering better journey times and making travel easier.”8
8. Capacity and connectivity drive economic growth, claims the Strategic Case.9
9. We are fully supportive of investment in UK infrastructure and, in principle, high speed rail. We agree that the Government’s should invest in the UK’s rail network. In this report we assess whether the Government has made a convincing case that their specific plan for HS2 is the right investment to make at this time and at this cost. We question whether alternative investments have been adequately considered.
Has there been a consistent story on the reasons for building HS2? 10. We heard evidence that the Government’s explanations for why it is building
HS2 have not always been consistent. Dr Richard Wellings, Deputy Editorial Director and Head of Transport, Institute for Economic Affairs said he “found it highly suspect how the case has changed over time”:
“It was supposed to be an alternative to Heathrow expansion … Then it became all about the time savings; then it was about capacity. Now it is all about rebalancing the economy and bridging the north-south divide, which just shows it is politically driven or, if you like, PR-driven.” 10
11. The Department for Transport insisted that the case for HS2 had always been about capacity and generating growth. David Prout, Director-General of HS2 Group at the Department for Transport, denied the case had changed over time: “the [Labour Government’s] 2010 Command Paper, which first set out the strategic case, identified the need to provide a step change in capacity and improve connectivity in order to support growth and help re-balance the economy.”11
12. Announcing the Conservative Party’s support for high speed rail at the Party Conference in 2008, Rt Hon. Theresa Villiers MP, then Shadow Secretary of State for Transport, listed three main benefits of high speed rail: relieving overcrowding, generating “huge economic benefits” and closing the north-south divide.12
13. Lord Mandelson, in his article ‘Why I no longer support a high speed railway line for Britain’ for the Financial Times in 2013, said that when the Labour Government decided to back HS2, the decision was “partly politically driven.” He told readers to remember the context:
“We were emerging, or so we hoped, from the worst financial crisis of our lifetimes. We were on the eve of a general election and keen to paint an upbeat view of the future. Such publicly built infrastructure projects
8 Department for Transport, The Strategic Case for HS2, October 2013, p 18: https://www.gov.uk/government/uploads/system/uploads/attachment_data/file/260525/strategic-case.pdf [accessed February 2015]
9 Strategic Case, p 1 10 Q 98 11 Letter from David Prout to the Chairman, 7 November 2014 12 Rt Hon. Theresa Villiers MP, Speech to Conservative Party Conference, Monday 29 September 2008:
http://www.conservativehome.com/transport/2008/09/tories-promise-2.html [accessed March 2015]
12 THE ECONOMICS OF HIGH SPEED 2
seemed to provide so much of the answer to our short and longer-term economic and employment needs … this was about the limit of our collective cabinet consideration. We were focusing on the coming electoral battle”.13
Should HS2 be part of a wider plan?
14. HS2 is being developed without reference to a National Transport Strategy because the UK does not have one.
15. When considering whether a transport project goes ahead or not, the Department for Transport carries out a cost-benefit analysis. This method allows one project to be compared against other projects to see which provides the best value for the money. Some witnesses raised concerns that this fails to take into account the wider context against which to prioritise projects.
16. Sir David Higgins, Chair of HS2 Limited, told us that:
“[Cost-benefit analysis] is meant to be a method of rating various infrastructure projects against other infrastructure projects to determine which is the most important. What would be nice, of course, would be to have a national transport strategy against which to measure that; that would be a discipline that would improve the whole debate on how you analyse individual projects. We do not have that today.”14
Existing road, rail and infrastructure plans 17. The Department for Transport have set out investment plans for road and
rail. The Road Investment Strategy published in December 2014 set out a strategy and visions for motorways and major roads in the UK and provided an investment plan for the five years to 2020/21.15 The rail High Output Level Specification, published in 2012, “defines the railway that the Government wishes to see by 2019” and set out strategic priorities and funding for the period.16
18. The Government published a National Infrastructure Plan in 2010. The Plan was intended to “provide a broad vision of the infrastructure investment required to underpin the UK’s growth”17 The Plan has been updated every year since and the most recent 2014 version sets out all planned
13 Lord Mandelson, ‘Why I no longer support a high speed railway line for Britain’, Financial Times, 2 July 2013
14 Q 239 15 Department for Transport, Road Investment Strategy Overview, December 2014: https://www.gov.uk/
government/uploads/system/uploads/attachment_data/file/382808/dft-ris-overview.pdf [accessed February 2015]
16 Department for Transport, High Level Output Specification (HLOS) 2012: Railways Act 2005 Statement, July 2012: https://www.gov.uk/government/publications/high-level-output-specification-2012 [accessed February 2015]
17 HM Treasury and Infrastructure UK, National Infrastructure Plan 2010, October 2010, p 3: https://www.gov.uk/government/uploads/system/uploads/attachment_data/file/188329/nip_2010.pdf [accessed February 2015]
THE ECONOMICS OF HIGH SPEED 2 13
infrastructure investments, including transport.18 Lord Deighton, Commercial Secretary to the Treasury, described the evolution of the plan in the House of Lords Chamber:
“At the beginning, it was a little more like a list of projects, but now it is a plan and is underpinned by a clear strategy. We have a road investment strategy: it is the road investment strategy which drove the list of projects which then enabled us to put a five-year funding plan in place.”
He continued that the “next step is to develop a plan that addresses the UK’s infrastructure needs in the much longer term.”19
A combined plan for road and rail? 19. Professor Stephen Glaister, Emeritus Professor of Transport and
Infrastructure, Imperial College London, noted the publication of the 2014 infrastructure plan but said it did not consider:
“what the national needs are in surface transport and how conventional rail, high-speed rail and road contribute to those needs … there is never a discussion about how the options of spending more on roads and less on railways, or more on railways and less on roads, have been evaluated.”20
20. These concerns were recently echoed by the House of Commons Public Accounts Committee. In their January 2015 report, the Committee said that the Department for Transport “still lacks a clear strategic plan for the rail network…the Department should set out a long term strategy covering the next 30 years for transport infrastructure in the UK, and use this strategy to inform decisions about investment priorities.”21
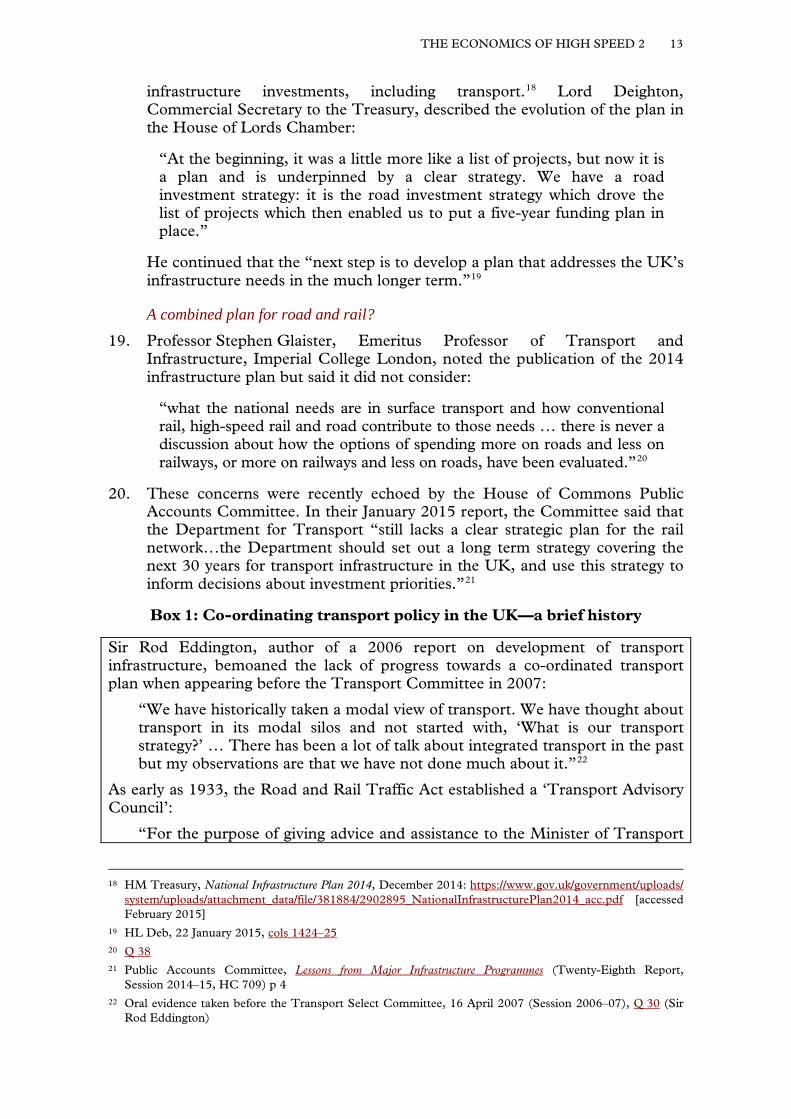
Box 1: Co-ordinating transport policy in the UK—a brief history
Sir Rod Eddington, author of a 2006 report on development of transport infrastructure, bemoaned the lack of progress towards a co-ordinated transport plan when appearing before the Transport Committee in 2007:
“We have historically taken a modal view of transport. We have thought about transport in its modal silos and not started with, ‘What is our transport strategy?’ … There has been a lot of talk about integrated transport in the past but my observations are that we have not done much about it.”22
As early as 1933, the Road and Rail Traffic Act established a ‘Transport Advisory Council’:
“For the purpose of giving advice and assistance to the Minister of Transport
18 HM Treasury, National Infrastructure Plan 2014, December 2014: https://www.gov.uk/government/uploads/ system/uploads/attachment_data/file/381884/2902895_NationalInfrastructurePlan2014_acc.pdf [accessed February 2015]
19 HL Deb, 22 January 2015, cols 1424–25 20 Q 38 21 Public Accounts Committee, Lessons from Major Infrastructure Programmes (Twenty-Eighth Report,
Session 2014–15, HC 709) p 4 22 Oral evidence taken before the Transport Select Committee, 16 April 2007 (Session 2006–07), Q 30 (Sir
Rod Eddington)
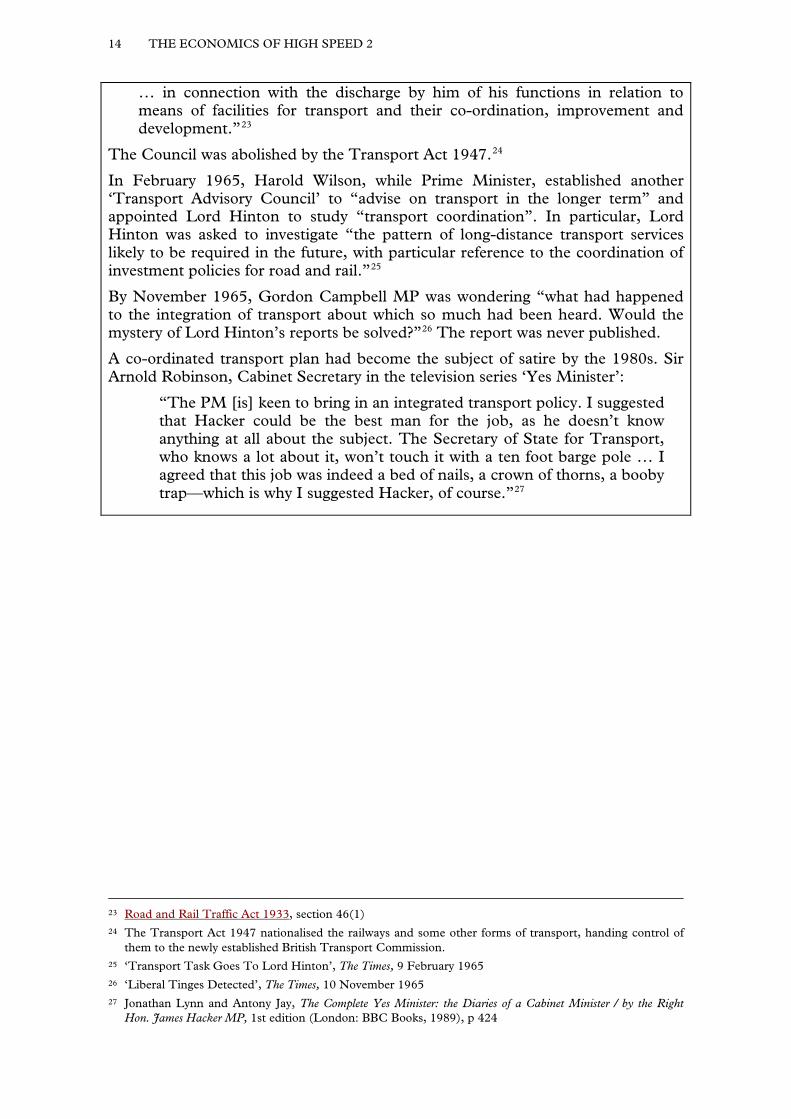
14 THE ECONOMICS OF HIGH SPEED 2
… in connection with the discharge by him of his functions in relation to means of facilities for transport and their co-ordination, improvement and development.”23
The Council was abolished by the Transport Act 1947.24
In February 1965, Harold Wilson, while Prime Minister, established another ‘Transport Advisory Council’ to “advise on transport in the longer term” and appointed Lord Hinton to study “transport coordination”. In particular, Lord Hinton was asked to investigate “the pattern of long-distance transport services likely to be required in the future, with particular reference to the coordination of investment policies for road and rail.”25
By November 1965, Gordon Campbell MP was wondering “what had happened to the integration of transport about which so much had been heard. Would the mystery of Lord Hinton’s reports be solved?”26 The report was never published.
A co-ordinated transport plan had become the subject of satire by the 1980s. Sir Arnold Robinson, Cabinet Secretary in the television series ‘Yes Minister’:
“The PM [is] keen to bring in an integrated transport policy. I suggested that Hacker could be the best man for the job, as he doesn’t know anything at all about the subject. The Secretary of State for Transport, who knows a lot about it, won’t touch it with a ten foot barge pole … I agreed that this job was indeed a bed of nails, a crown of thorns, a booby trap—which is why I suggested Hacker, of course.”27
23 Road and Rail Traffic Act 1933, section 46(1) 24 The Transport Act 1947 nationalised the railways and some other forms of transport, handing control of
them to the newly established British Transport Commission. 25 ‘Transport Task Goes To Lord Hinton’, The Times, 9 February 1965 26 ‘Liberal Tinges Detected’, The Times, 10 November 1965 27 Jonathan Lynn and Antony Jay, The Complete Yes Minister: the Diaries of a Cabinet Minister / by the Right
Hon. James Hacker MP, 1st edition (London: BBC Books, 1989), p 424
THE ECONOMICS OF HIGH SPEED 2 15
CHAPTER 2: THE COST OF HS2
Cost of construction
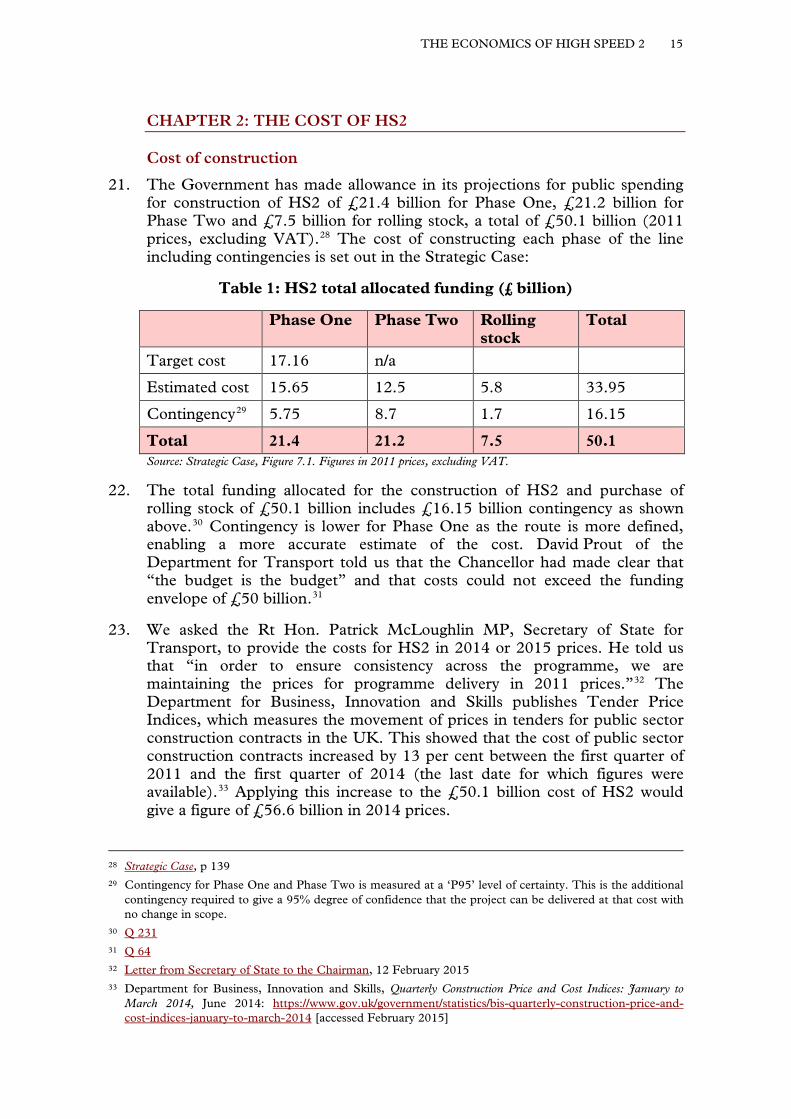
21. The Government has made allowance in its projections for public spending for construction of HS2 of £21.4 billion for Phase One, £21.2 billion for Phase Two and £7.5 billion for rolling stock, a total of £50.1 billion (2011 prices, excluding VAT).28 The cost of constructing each phase of the line including contingencies is set out in the Strategic Case:
Table 1: HS2 total allocated funding (£ billion)
Phase One Phase Two Rolling stock
Total
Target cost 17.16 n/a
Estimated cost 15.65 12.5 5.8 33.95
Contingency29 5.75 8.7 1.7 16.15
Total 21.4 21.2 7.5 50.1 Source: Strategic Case, Figure 7.1. Figures in 2011 prices, excluding VAT.
22. The total funding allocated for the construction of HS2 and purchase of rolling stock of £50.1 billion includes £16.15 billion contingency as shown above.30 Contingency is lower for Phase One as the route is more defined, enabling a more accurate estimate of the cost. David Prout of the Department for Transport told us that the Chancellor had made clear that “the budget is the budget” and that costs could not exceed the funding envelope of £50 billion.31
23. We asked the Rt Hon. Patrick McLoughlin MP, Secretary of State for Transport, to provide the costs for HS2 in 2014 or 2015 prices. He told us that “in order to ensure consistency across the programme, we are maintaining the prices for programme delivery in 2011 prices.”32 The Department for Business, Innovation and Skills publishes Tender Price Indices, which measures the movement of prices in tenders for public sector construction contracts in the UK. This showed that the cost of public sector construction contracts increased by 13 per cent between the first quarter of 2011 and the first quarter of 2014 (the last date for which figures were available).33 Applying this increase to the £50.1 billion cost of HS2 would give a figure of £56.6 billion in 2014 prices.
28 Strategic Case, p 139 29 Contingency for Phase One and Phase Two is measured at a ‘P95’ level of certainty. This is the additional
contingency required to give a 95% degree of confidence that the project can be delivered at that cost with no change in scope.
30 Q 231 31 Q 64 32 Letter from Secretary of State to the Chairman, 12 February 2015 33 Department for Business, Innovation and Skills, Quarterly Construction Price and Cost Indices: January to
March 2014, June 2014: https://www.gov.uk/government/statistics/bis-quarterly-construction-price-and-cost-indices-january-to-march-2014 [accessed February 2015]
16 THE ECONOMICS OF HIGH SPEED 2
24. We note that Mr Prout told us that costs of construction could not exceed the funding envelope of £50 billion. It is not clear whether this refers to the costs in 2011 prices and the funding envelope will expand with inflation, or whether the cost should not exceed £50 billion in absolute terms. The Government should make clear whether the absolute limit for the construction of HS2 will increase in line with inflation.
25. Rt Hon. Lord Adonis, former Secretary of State for Transport, argued that HS2 was not a £50 billion project but “a £28 billion project with a 50% contingency”;34 he suggested that quoting the cost as £50 billion was misleading. Sir David Higgins, Chairman of HS2 Ltd, cautioned however that while “you should not assume that contingency will be spent”, it was included for a reason and he did not want to “suddenly declare that I had found savings.” He noted that use of contingencies would be “rigorously enforced” in the same way that it had been for the Olympics35 and Crossrail projects. In the case of the Olympics:
“It was very clearly set out what those contingencies were, force-majeure risks or government taxation policy, or whatever … in the end £1 billion of that contingency was never spent on the delivery of the venues and the infrastructure.”36
Box 2: What is the cost of HS2?
In this report we refer to two figures for the cost of HS2:
• £50.1 billion: This figure refers to the expected cost to construct HS2 in 2011 prices and purchase rolling stock (see Table 1) including all contingency.
• £31.5 billion: This figure refers to the net cost of HS2 to the Government of HS2 after 60 years of operation of the full line and includes the cost of construction, operating costs and revenue. The figure is derived by adding the capital cost (£40.5 billion) to the operating cost (£22.1 billion) and subtracting the expected revenue income (£31.1 billion). These figures are present value figures and have been discounted as is standard practice to reflect that people prefer to receive goods and services now rather than later.
Is £50 billion a realistic estimate? 26. Some witnesses expressed scepticism that the cost of constructing HS2 could
be kept within £50 billion (2011 prices). Professor Stephen Glaister noted that “There are lots of things that may happen between now and Royal Assent to the hybrid Bill that will change these numbers, typically, I suspect, adversely.”37 Dr Richard Wellings of the Institute of Economic Affairs, also thought there was a “massive cost risk” because of “interest group pressures” leading to changes to routes and increases in cost. He estimated that HS2 would cost a total of £80 billion, which took account of other factors
34 Q 117 35 Sir David was Chief Executive of the Olympic Delivery Authority from 2005 to 2010. 36 Q 236 37 Q 42
THE ECONOMICS OF HIGH SPEED 2 17
including “the economic activity that is suppressed by the extra taxation needs flowing from HS2”.38
27. The Secretary of State told us that the Department for Transport had proved it could deliver projects without cost overruns: “Crossrail has been a fantastic achievement; it has been delivered on budget and within the estimations for the next two years on time. That has shown that we have some tremendous advantages in the delivery on costs.”39 Sir David Higgins and Simon Kirby, Chief Executive of HS2 Ltd, were brought in to ensure that the project was delivered successfully.
28. Sir David Higgins agreed that “HS2 is a lot of money. We have to prove that we spend it very wisely.” He said that the Construction Leadership Council, which he co-chaired, had set itself the objective to be achieved by 2025 of “reducing both the time of construction and the cost of construction, in each case by 25 per cent in real terms”.40 Lord Deighton said that Sir David Higgins had been given the task of looking at how to reduce the cost of construction of HS2, including by learning from examples from abroad.41
Redevelopment of Euston station 29. Several witnesses used the progress of plans for the redevelopment of Euston
station as an example of how costs were already at risk of running over budget, although no money has yet been spent on the redevelopment. HS2 Action Alliance told us that there had been reports that the estimated cost of the redevelopment of Euston had risen to £7 billion from the £2 billion quoted in the Economic Case for HS2.42 Mr Prout said that the development of Euston was not over budget:
“We are simply taking time to reflect on what we are proposing to make sure that what we are doing forms part of a bigger jigsaw puzzle for the whole of Euston station if a decision is taken in due course to rebuild the rest of the station.”43
30. An HS2 station at Old Oak Common, located in West London three miles west of Paddington station, has been proposed as part of plans for HS2 to provide an interchange between HS2 and Crossrail. It has been suggested that the possibility of overruns at Euston has led to consideration of terminating HS2 at Old Oak Common.44 This would avoid the cost of developing Euston station and of a tunnel from Old Oak Common to Euston. When we put this suggestion to Mr Prout he said that terminating at a central London station was “an essential part of driving demand on HS2. The capital investment required would not justify terminating [at] a station out at Old Oak Common.”45 Alison Munro, Managing Director of
38 Q 91 39 Q 231 40 QQ 236, 237 41 Q 231 42 Written evidence from HS2 Action Alliance (EHS0037) 43 Q 231 44 ‘HS2 “slowly dying” as Euston terminus plan grinds to a halt’, Daily Telegraph, 22 November 2014 45 Q 77
18 THE ECONOMICS OF HIGH SPEED 2
Development, HS2 Ltd, said that one-third of HS2 passengers travelling to London would choose to use Old Oak Common so “If you stopped the trains at Old Oak Common that would be a disbenefit to two-thirds of people.”46
31. The Government should estimate the overall reduction of cost to HS2 of terminating the line at Old Oak Common (in the London Borough of Hammersmith and Fulham), including any necessary redesign of the station at Old Oak Common to make this possible, and calculate the effect on the cost benefit analysis.
32. We consider other options for the terminus in London in Chapter 6.
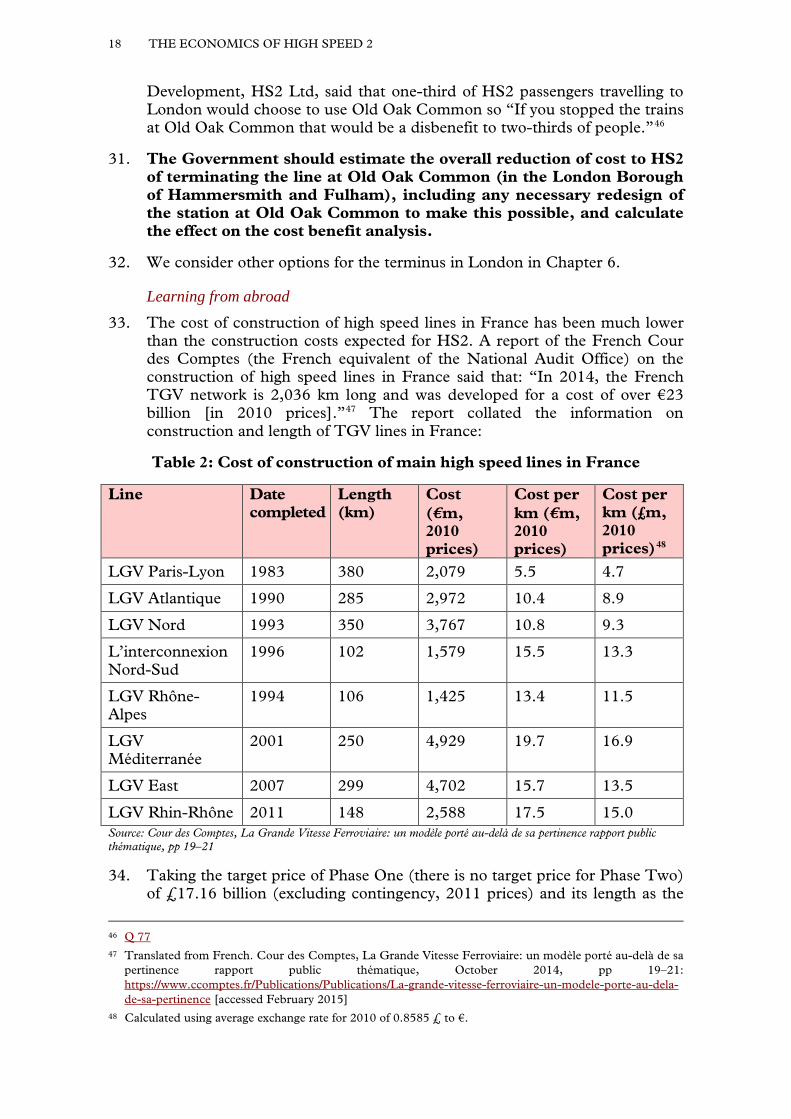
Learning from abroad 33. The cost of construction of high speed lines in France has been much lower
than the construction costs expected for HS2. A report of the French Cour des Comptes (the French equivalent of the National Audit Office) on the construction of high speed lines in France said that: “In 2014, the French TGV network is 2,036 km long and was developed for a cost of over €23 billion [in 2010 prices].”47 The report collated the information on construction and length of TGV lines in France:
Table 2: Cost of construction of main high speed lines in France
Line Date completed
Length (km)
Cost (€m, 2010 prices)
Cost per km (€m, 2010 prices)
Cost per km (£m, 2010 prices)48
LGV Paris-Lyon 1983 380 2,079 5.5 4.7
LGV Atlantique 1990 285 2,972 10.4 8.9
LGV Nord 1993 350 3,767 10.8 9.3
L’interconnexion Nord-Sud
1996 102 1,579 15.5 13.3
LGV Rhône-Alpes
1994 106 1,425 13.4 11.5
LGV Méditerranée
2001 250 4,929 19.7 16.9
LGV East 2007 299 4,702 15.7 13.5
LGV Rhin-Rhône 2011 148 2,588 17.5 15.0 Source: Cour des Comptes, La Grande Vitesse Ferroviaire: un modèle porté au-delà de sa pertinence rapport public thématique, pp 19–21
34. Taking the target price of Phase One (there is no target price for Phase Two) of £17.16 billion (excluding contingency, 2011 prices) and its length as the
46 Q 77 47 Translated from French. Cour des Comptes, La Grande Vitesse Ferroviaire: un modèle porté au-delà de sa
pertinence rapport public thématique, October 2014, pp 19–21: https://www.ccomptes.fr/Publications/Publications/La-grande-vitesse-ferroviaire-un-modele-porte-au-dela-de-sa-pertinence [accessed February 2015]
48 Calculated using average exchange rate for 2010 of 0.8585 £ to €.
THE ECONOMICS OF HIGH SPEED 2 19
commonly reported 192 kilometres, HS2 Phase One will cost around £90 million per kilometre.
35. Mr Prout told us that for HS2 the Government have targeted cost of “£43 million per mile”.49 The cost of construction for HS1 (the Channel Tunnel to Kings Cross link) in 2011 prices was £37.6 million per mile.50 A direct comparison with costs in other countries such as France is not straightforward as HS2 requires expensive tunnelling and includes the cost of a new station at Birmingham and renovation of Euston station while no stations are included in the French costs. Sir David Higgins suggested to the House of Commons Transport Select Committee that the UK could not “hide behind the idea that our country is much more densely populated than France” as the reason for why it was more expensive to build high speed lines in the UK.51
36. We asked Sir David Higgins why costs of construction were lower in France and what could be learned from experiences abroad to reduce the cost of constructing HS2. He told us that access to the track and planning constraints were “the reason the costs here are substantially higher.” Sir David said that a team had considered the lessons from the construction of the Tours to Bordeaux TGV line in France. They had found that “rigorous planning, just in time construction where you look at the logistics and you plan for that in advance, can deliver substantial savings in all construction sectors.”52
37. The expected cost of construction per mile of HS2 is up to nine times higher than the cost of constructing high speed lines in France. This is too high. Were HS2 proceeded with, we welcome the Government’s and Sir David Higgins’ commitment to learning from international examples to reduce this cost.
The UK construction industry 38. The state of the UK railway construction industry was also cited by
Sir David as a reason why constructing railway lines in the UK was so expensive. He described the industry as “fragmented, low-cost, low-margin, buying on the lowest common denominator, not investing in long-term skills”. This was in contrast to “the big Spanish, German or French multidiscipline contractor companies that have strong revenue streams from owning airports or telecommunications companies” who invested in research and development and skills.53
39. The Department for Transport acknowledged in their written evidence that the UK had “a skills gap in railway engineering and advanced construction” and that a recent report had identified “a need to substantially increase the supply of engineers in the UK.” They said that an HS2 skills college would
49 Q 231 50 Q 231 51 Oral evidence taken before Transport Select Committee, 17 November 2014 (Session 2014–15), Q 20 (Sir
David Higgins) 52 Q 236 53 Q 253
20 THE ECONOMICS OF HIGH SPEED 2
be set up to complement existing work to meet the skills gaps and help to deliver a UK workforce equipped for the future.54
40. HS2 Ltd told us in written evidence how this college would focus on “designing and delivering the high level skills needed for high speed rail, and other major engineering projects of the future.” They said that their contractors had already given more than 700 graduate trainees or apprentices the experience of working on HS2 and expected that HS2 would lead to a further 2,000 apprenticeships in construction alone. This would “create a lasting legacy for the UK as a country that can deliver major infrastructure projects.” 55
41. Other witnesses were not so confident that UK industry would be the main beneficiary of the construction of HS2. HS2 Action Alliance said that as the UK had “no indigenous high speed rail industry” much of the technology required for the railway would be imported from foreign manufacturers.56 William Avery, a private individual, agreed that “the UK construction industry is reaching full capacity so the only effect of HS2 will be the importation of resources to achieve the construction and mostly focused in the south east which needs it the least.”57
42. We are concerned to learn that the UK construction industry does not have the capability to deliver a project of the scale of HS2. A national transport strategy that envisages steady investment in the UK’s transport infrastructure, whatever the project, may help the UK develop a construction industry capable of delivering large infrastructure projects and competing internationally.
Cost of complementary projects
43. HS2 could prompt a number of complementary transport projects designed to maximise the benefits of HS2, which are not included within the anticipated cost. Witnesses suggested that these projects meant that the budget that would be funded by the Government and local authorities would be far higher than the funding announced for the construction of HS2.
Crossrail 2 44. Crossrail 2 (a new line proposed to run from north to south across London)
was cited as a project which was separate from HS2 but would be required if HS2 was built. Michèle Dix, Managing Director, Planning, at Transport for London, told us that Crossrail 2 “needs to be in place before phase two of HS2 is completed” as “we will need additional Underground capacity in the form of Crossrail 2 to help with that dispersal.” However, she made clear that Crossrail 2 was needed regardless of HS2, so was being progressed independently. The total cost of Crossrail 2 was expected to be £27 billion including rolling stock and contingency.58
54 Written evidence from the Department for Transport (EHS0021) 55 Written evidence from HS2 Ltd (EHS0057) 56 Written evidence from HS2 Action Alliance (EHS0037) 57 Written evidence from William Avery (EHS0014) 58 QQ 192, 193
THE ECONOMICS OF HIGH SPEED 2 21
Other complementary projects 45. Mr Prout told us that the costs for HS2 included “All the infrastructure that
is required to allow HS2 to run on the dedicated line and the train-service specifications for the classic lines” and deliver all of the economic benefits set out in the economic case.59 In response to our question about what the total cost of HS2 and all complementary projects would be, Lord Deighton said that:
“The existing justification of the business [case] is based on what is in the budget. When we talk about all these other things we are simply saying, ‘We have a strategy. HS2 is part of the strategy. There will be many other components to the strategy that will need funding too’, and it clearly makes sense when you spend money in the future to link it to the things you already have. So I think it is slightly dangerous to try to create an accumulated cost.”60
46. Rt Hon. Cheryl Gillan MP, Member of Parliament for Chesham and Amersham, told us that “the cost of regional economic and transport spending necessary to realise the wider benefits should also be included in the BCR [benefit-cost ratio] but it is not.”61 Councillor Martin Tett, Leader of Buckinghamshire County Council and speaking on behalf of the 51M Alliance, said that “If you just substitute for ‘realising the benefits’, ‘additional costs because of’, then you actually have the reality behind it.”62
47. Other witnesses noted that these additional projects brought their own benefits which were not included within the cost-benefit analysis of HS2. Jim Steer of transport consultancy Steer Davis Gleave said that “all of this will also bring its own benefits … You need a really efficient, bigger-capacity transport system, which is what HS2 provides, and you need these other things too; they create joint benefits.”63 Professor Roger Vickerman, Professor of European Economics, University of Kent, acknowledged that defining how to classify the costs and benefits of these related projects was problematic: “how much of that is part of the cost of the project and how much is the benefits?”64
The effect of speed on the cost
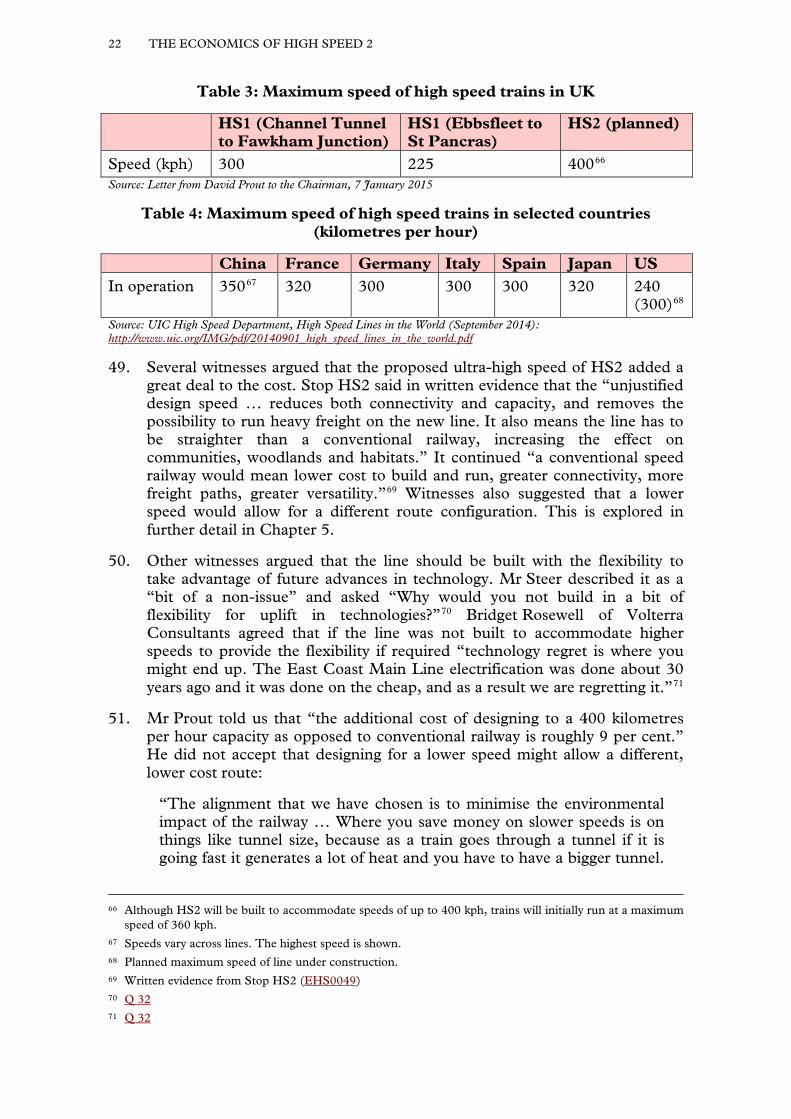
48. HS2 will be built to accommodate trains travelling at a maximum speed of 400 kilometres per hour (250 mph), although it is initially expected that trains will only run at a maximum of 360 kph (225 mph) on the line. This compares to a maximum speed of 300 kph (185 mph) on HS1.65 Tables 3 and 4 shows the maximum speed of high speed trains in the UK and other countries.
59 Q 231 60 Q 235 61 Written evidence from Cheryl Gillan MP (EHS0040) 62 Q 91 63 Q 31 64 Q 1 65 Letter from David Prout to the Chairman, 7 January 2015
22 THE ECONOMICS OF HIGH SPEED 2
Table 3: Maximum speed of high speed trains in UK
HS1 (Channel Tunnel to Fawkham Junction)
HS1 (Ebbsfleet to St Pancras)
HS2 (planned)
Speed (kph) 300 225 40066 Source: Letter from David Prout to the Chairman, 7 January 2015
Table 4: Maximum speed of high speed trains in selected countries (kilometres per hour)
China France Germany Italy Spain Japan US In operation 35067 320 300 300 300 320 240
(300)68 Source: UIC High Speed Department, High Speed Lines in the World (September 2014): http://www.uic.org/IMG/pdf/20140901_high_speed_lines_in_the_world.pdf
49. Several witnesses argued that the proposed ultra-high speed of HS2 added a great deal to the cost. Stop HS2 said in written evidence that the “unjustified design speed … reduces both connectivity and capacity, and removes the possibility to run heavy freight on the new line. It also means the line has to be straighter than a conventional railway, increasing the effect on communities, woodlands and habitats.” It continued “a conventional speed railway would mean lower cost to build and run, greater connectivity, more freight paths, greater versatility.”69 Witnesses also suggested that a lower speed would allow for a different route configuration. This is explored in further detail in Chapter 5.
50. Other witnesses argued that the line should be built with the flexibility to take advantage of future advances in technology. Mr Steer described it as a “bit of a non-issue” and asked “Why would you not build in a bit of flexibility for uplift in technologies?”70 Bridget Rosewell of Volterra Consultants agreed that if the line was not built to accommodate higher speeds to provide the flexibility if required “technology regret is where you might end up. The East Coast Main Line electrification was done about 30 years ago and it was done on the cheap, and as a result we are regretting it.”71
51. Mr Prout told us that “the additional cost of designing to a 400 kilometres per hour capacity as opposed to conventional railway is roughly 9 per cent.” He did not accept that designing for a lower speed might allow a different, lower cost route:
“The alignment that we have chosen is to minimise the environmental impact of the railway … Where you save money on slower speeds is on things like tunnel size, because as a train goes through a tunnel if it is going fast it generates a lot of heat and you have to have a bigger tunnel.
66 Although HS2 will be built to accommodate speeds of up to 400 kph, trains will initially run at a maximum speed of 360 kph.
67 Speeds vary across lines. The highest speed is shown. 68 Planned maximum speed of line under construction. 69 Written evidence from Stop HS2 (EHS0049) 70 Q 32 71 Q 32
THE ECONOMICS OF HIGH SPEED 2 23
But I do not accept the premise that you would necessarily have a different alignment.”72
52. Sir David Higgins explained to us that considerable work had been undertaken to ensure that design changes were made when accommodating a lower maximum speed would lead to savings:
“The tunnels will not be designed for 400 kilometres per hour, or areas where there is a premium cost on doing that in terms of the tunnel. They will be designed for 360; some of the approaches and the curves as we go into particularly the Eastern leg of phase 2 will not be designed for 400; it would just be too expensive.”73
53. Sir David Higgins did not agree that substantial further savings could be made by reducing the maximum design speed: “I have heard all the stories that we can save a huge amount of money—9 per cent of the whole project cost—by cutting the speed down by 50 kilometres an hour. The answer is that I do not believe that; I do not believe you can save that money.”74
54. The Government should review opportunities to reduce the cost of constructing HS2 through a change in the design of the scheme to one with a lower maximum speed—such as that used on continental railways—and publish the results of this exercise. This should include an assessment of the effect a lower speed would have on journey times, which is likely to be small.
Cost of disruption
55. Witnesses suggested that the cost of constructing HS2 did not include the cost of disruption caused by the building of HS2. This could include the disruption to passengers from stations under development, delays to road users because of the major construction work required, and connecting HS2 to the existing network.
56. Joe Rukin of Stop HS2 said that “HS2 Ltd completely ignores the disruption that HS2 will cause, even on the railways”.75 He said that HS2 would cause “massive disruption for everywhere that has trains coming into Euston” and at locations where the HS2 track would cross the West Coast Main Line.76 Professor Henry Overman, Professor of Economic Geography, London School of Economics, argued that the monetary cost of disruption through building HS2 should have taken into account.77
57. Paul Plummer, Group Strategy Director, Rail Delivery Group and Network Rail, wrote to the Chairman explaining how disruption had been calculated for the strategic alternatives to HS2:
72 Q 232 73 Q 237 74 Q 237 75 Q 81 76 Q 81 77 Q 56
24 THE ECONOMICS OF HIGH SPEED 2
“The investigation of Strategic Alternatives conducted by Network Rail in 2013 included an allowance for disruption averaging 10% of the cost of each scheme. This was an estimate based on potential payments that might be incurred under Schedule 4 of the track access contracts between Network Rail and train operators. This sets out the compensation arrangements for both fare revenue losses and costs such as those associated with running replacement buses.”
58. He noted, however, that this method of calculating the costs disruption was based on experience of projects lasting “weeks or months rather than the years required for the construction of schemes required to deliver the strategic alternatives.” He said that the damage to the rail brand caused by years of weekend closures was not easily assessed and the calculations did not take account of the economic effect of the disruption felt by cities on affected routes. 78
59. When asked about the cost of disruption for HS2, the Secretary of State told us that “There will be some disruption in certain areas while HS2 is being built, certainly, but nowhere in the lines of the amount of disruption would that be required for an upgrading of the West Coast.”79
60. The Secretary of State clarified in a letter to the Chairman that “HS2 cost estimates include an allowance for disruption”. He explained that the detailed information required to apply the method of assessing disruption used by the Office of Rail Regulation was not held at the time of writing the business case: “Instead we have adopted an approach which approximates the ORR methodology, recognising interactions between construction of the infrastructure and the existing rail network.”80 He noted that a qualitative assessment of disruption was included in the Strategic Case. This is considered in Chapter 5.
61. The Government should make clear the full cost of disruption as a result of HS2 by publishing the expected costs of disruption from building HS2 separate from the overall construction cost, and the monetary value of disruption to rail passengers and road users caused by the construction.
Expected net cost of HS2 to the Government
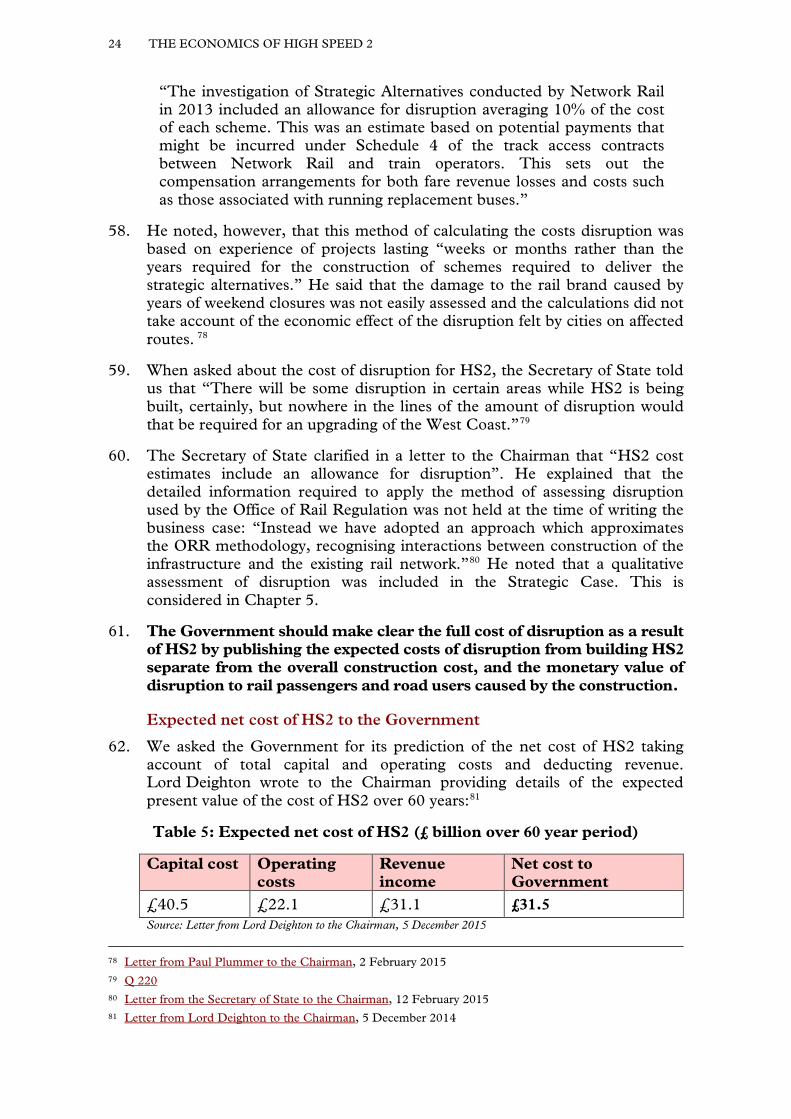
62. We asked the Government for its prediction of the net cost of HS2 taking account of total capital and operating costs and deducting revenue. Lord Deighton wrote to the Chairman providing details of the expected present value of the cost of HS2 over 60 years:81
Table 5: Expected net cost of HS2 (£ billion over 60 year period)
Capital cost Operating costs
Revenue income
Net cost to Government
£40.5 £22.1 £31.1 £31.5 Source: Letter from Lord Deighton to the Chairman, 5 December 2015
78 Letter from Paul Plummer to the Chairman, 2 February 2015 79 Q 220 80 Letter from the Secretary of State to the Chairman, 12 February 2015 81 Letter from Lord Deighton to the Chairman, 5 December 2014
THE ECONOMICS OF HIGH SPEED 2 25
63. Lord Deighton also explained that HS2 was expected to generate an additional premium to the taxpayer of around £0.3 billion a year: “This comprises an operating surplus for HS2 services of around £2.8 billion and an additional subsidy of classic services of around £2.5 billion (owing to classic customers moving over to HS2).”82
64. We asked the Secretary of State and Lord Deighton whether the £0.3 billion annual premium could be considered as contributing towards the paying off of the £31.5 billion net cost of HS2. Mr Prout wrote to the Chairman following our evidence session and explained that the two figures were not directly comparable because the revenues which contribute to the net cost calculation “are significantly discounted compared to the construction costs incurred earlier in the appraisal period.”83 The prediction of a £0.3 billion operating annual premium therefore does not take account of repaying the capital cost of building HS2.
Who will pay for HS2? 65. The Government has committed to reducing the dependence of the rail
network on public subsidy. The 2012 command paper, Reforming our Railways, said that: “We must also help to reduce the demand on taxpayer subsidy, ensuring that the railways are financially sustainable in the longer term and can contribute towards the country’s economic growth and environmental goals.”84
66. The Office of Rail Regulation report, 2013–14 Annual Statistical Release: Rail Finance, described how “Government support to the rail industry increased in 2013–14 for the third year in succession but remains lower than the highest level of Government support which was during 2006–07.”85 The total level of Government support for the rail industry in 2013/14 was £5.3 billion. The highest level of support was £6.3 billion in 2006/07.86
67. The net cost of HS2 to the Government will be met by the taxpayer, but business travellers are forecast to derive the most benefit from the project (70 per cent of the net transport benefits—see Chapter 8). Some witnesses suggested those who benefitted from HS2 should pay for the cost of its construction. Stephen Plowden, a private individual, said that “Business or other travellers who valued the time they would save by switching from conventional rail to HS2 should also pay for it themselves.”87 Aberdeen and Grampian Chambers of Commerce noted that “some regions will see greater economic benefits from HS2 than others. Nevertheless, tax revenues from businesses in Aberdeen and Grampian will disproportionately help pay for the project.”88
82 Ibid. 83 Letter from David Prout to the Chairman, 7 January 2015 84 Department for Transport, Reforming Our Railways: Putting Customers First, March 2012 (Cm 8313), p 11 85 Office of Rail Regulation, 2013–14 Annual Statistical Release: Rail Finance, August 2014, p 5:
http://orr.gov.uk/__data/assets/pdf_file/0007/14497/rail-finance-statistical-release-2013–14.pdf [accessed February 2015]
86 Ibid., p 7 87 Written evidence from Stephen Plowden (EHS0073) 88 Written evidence from Aberdeen and Grampian Chambers of Commerce (EHS0022)
26 THE ECONOMICS OF HIGH SPEED 2
68. Ticket pricing would be one way in which the cost of HS2 could be shifted to the users, by charging premium prices to recoup costs. We consider in Chapter 3 the Government’s assumption that fares on HS2 should be in line with fares on the rest of the network.
69. The Government should explain how the £31.5 billion net cost to the taxpayer of building and running HS2 can be reconciled with their objective of making rail less dependent on public subsidy.
70. The Government should consider the fairness of the large taxpayer subsidy required to fund the construction of HS2 as many taxpayers will derive no benefit from the project. The Government should look for opportunities to reduce the burden on the taxpayer, including by charging higher prices so those that receive the benefits of HS2 pay for more of the cost of its construction.
THE ECONOMICS OF HIGH SPEED 2 27
Chapter 2: Conclusions and recommendations
71. The Government should make clear whether the absolute limit for the construction of HS2 will increase in line with inflation. (Paragraph 24)
72. The Government should estimate the overall reduction of cost to HS2 of terminating the line at Old Oak Common (in the London Borough of Hammersmith and Fulham), including any necessary redesign of the station at Old Oak Common to make this possible, and calculate the effect on the cost benefit analysis. (Paragraph 31)
73. The expected cost of construction per mile of HS2 is up to nine times higher than the cost of constructing high speed lines in France. This is too high. Were HS2 proceeded with, we welcome the Government’s and Sir David Higgins’ commitment to learning from international examples to reduce this cost. (Paragraph 37)
74. We are concerned to learn that the UK construction industry does not have the capability to deliver a project of the scale of HS2. A national transport strategy that envisages steady investment in the UK’s transport infrastructure, whatever the project, may help the UK develop a construction industry capable of delivering large infrastructure projects and competing internationally. (Paragraph 42)
75. The Government should review opportunities to reduce the cost of constructing HS2 through a change in the design of the scheme to one with a lower maximum speed—such as that used on continental railways—and publish the results of this exercise. This should include an assessment of the effect a lower speed would have on journey times, which is likely to be small. (Paragraph 54)
76. The Government should make clear the full cost of disruption as a result of HS2 by publishing the expected costs of disruption from building HS2 separate from the overall construction cost, and the monetary value of disruption to rail passengers and road users caused by the construction. (Paragraph 61)
77. The Government should explain how the £31.5 billion net cost to the taxpayer of building and running HS2 can be reconciled with their objective of making rail less dependent on public subsidy. (Paragraph 69)
78. The Government should consider the fairness of the large taxpayer subsidy required to fund the construction of HS2 as many taxpayers will derive no benefit from the project. The Government should look for opportunities to reduce the burden on the taxpayer, including by charging higher prices so those that receive the benefits of HS2 pay for more of the cost of its construction. (Paragraph 70)
28 THE ECONOMICS OF HIGH SPEED 2
CHAPTER 3: DEMAND AND FARES MODELLING
79. The Strategic Case stated that “the modelling set out in the economic case for HS2, published alongside this document, shows that there is a long term demand for additional capacity on our north-south railways.”89 This Chapter explains that modelling and compares the long-term demand forecasts to recent trends. It also examines why the modelling assumes that fares on HS2 will be the same as on the existing railway and looks at demand forecasts for HS1 and the Train à Grande Vitesse (TGV) in France. The next Chapter considers the extent to which additional capacity is required.
How demand is modelled
80. Travel demand forecasts are prepared using an ‘elasticity based model’. This approach seeks to determine a statistical relationship between observed demand for transport and factors that affect the demand. The relationship between these factors and demand are determined from previous experience and research.
81. The model described in the Economic Case for HS2, developed by HS2 Ltd on behalf of the Government and published in October 2013, splits Great Britain into 235 “zones”. Using travel statistics, it models the demand for journeys between each zone by road, rail and air (for the purposes of the model the base year is 2010). Using the historic rate of demand growth for each mode of transport, and other factors such as GDP growth and population changes90, the model predicts future demand for each mode of transport between each zone in two scenarios: without HS2 and with HS2.91
82. The Department for Transport requires demand forecasts to be capped at some point in the future as “it is not reasonable to expect rail demand to grow indefinitely”.92 The cap is reached when the model predicts that the number of long-distance rail journeys over 100 miles nationwide reaches 290,146 a day.93 Professor Mackie, Emeritus Professor, Institute for Transport Studies, told us that “it is a bit of an arbitrary assumption when you cut growth off. However, it is better to have a cap than not to have a cap, because there are limits to forecasting”.94
83. The rest of this chapter looks at the forecasts in the ‘without HS2 scenario’ and the ‘with HS2 scenario’. These forecasts are central to the economic case
89 Strategic Case, p 74 90 The model considers 14 factors: population growth, employment growth, GDP growth, National Rail
fares, London Underground fares, car ownership, car journey times, car fuel prices, bus and coach fares, bus and coach journey times, bus and coach frequency, domestic air fares, domestic air frequency and domestic air passengers.
91 The factors are adjusted for each zone-to-zone forecast; for example the forecast for journeys between London and Manchester will take account of local conditions such as expected population increases in both areas.
92 HS2 Ltd, The Economic Case for HS2, October 2013, p 32: http://assets.hs2.org.uk/sites/default/ files/inserts/S%26A%201_Economic%20case_0.pdf [accessed February 2015]
93 HS2 Ltd, The Economic Case for HS2 PFMv4.3: Assumptions Report, October 2013, p 8: http://webarchive.nationalarchives.gov.uk/20141027142236/http://assets.hs2.org.uk/sites/default/files/inserts/SA%2020_PFM%20assumptions%20report_V3_0.pdf [accessed February 2015]
94 Q 4
THE ECONOMICS OF HIGH SPEED 2 29
for HS2: the forecast increase in long-term demand for rail travel without HS2 supports the argument that extra railway capacity is needed; the forecast number of passengers that will use HS2 provides the basis for estimating the economic benefits of the new railway.
Forecast demand—‘without HS2 scenario’
84. The model predicts that without HS2, the number of long-distance rail journeys over 100 miles will reach 290,146 trips a day (the ‘demand cap’) in 2036. This equates to an average annual increase of 2.2 per cent across all the zone-to-zone pairings in the model that are over 100 miles.
85. The 2.2 per cent figure is an average; some zone-to-zone forecasts are higher, some are lower. The Economic Case does not include information on individual zone-to-zone forecasts but a report by Atkins95, describing the development of the most recent version of the demand model, lists some of the relevant ones for HS2:96
Table 6: Average number of weekday rail trips97 and growth between London and city council areas without HS2, as predicted by the demand modelling
Zone-to-zone movements 2010 demand
2036 demand
Average annual increase, %98
Birmingham–Central London 7,000 13,700 2.6
Manchester–Central London 6,600 13,500 2.8
Leeds–Central London 4,200 8,800 2.9
Liverpool–Central London 2,600 4,800 2.4
Newcastle–Central London 2,300 4,200 2.3
Edinburgh–Central London 2,100 4,500 3.0
Glasgow–Central London 1,100 2,200 2.7 Source: Atkins Model Development Report: PFMv3.0-PFMv4.3, September 2014, page 95
The demand forecasts are “conservative”—the Government 86. The Economic Case compared the average annual growth to recent trends:
“The very strong growth in demand for journeys on long-distance rail operators’ services since 1994 … has equated to an average year-on-year growth rate over the past 18 years of 4.9%”. It continued that “the assumed
95 Atkins were appointed to develop a “demand forecasting framework” for HS2 in 2009. Since then, the model has been updated a number of times, the latest version (version 4.3) being developed for use in the 2013 Strategic Case.
96 The Secretary of State provided the same zone-to-zone movements to the Chairman in a letter on 14 December 2014. We have however used the figures from the Atkins report here as these are the inputs used in the latest demand model; the figures given by the Secretary of State (which showed higher zone-to-zone movements in the base year and forecast year) were inputs from an earlier version of the model in 2012.
97 The total number of trips in both directions. 98 The average annual increase implied by the 2036 figures is our calculation.
30 THE ECONOMICS OF HIGH SPEED 2
rate of growth of demand … at an average of 2.2% per annum from 2010 to 2036 … is lower than the recent trend.”99
87. Mr Prout of the Department for Transport said that if you compare the demand forecasts to the historic trend over the last 20 years, “they are reasonable. They are possibly an under-estimate … The population will go on increasing at 5 million every 10 years, but we cap demand in 2036.”100 He described the forecasts as a “conservative estimate”.101 Ms Munro of HS2 Ltd explained that:
“If you look at the number of [annual long-distance rail] trips that people make in the future, on our forecasts that increases from 2.1 at the moment to about 2.9, so we are not talking of a massive change in the way that individual people behave.”102
88. We note that the increase described by Ms Munro equates to a 38 per cent rise in the average number of long-distance rail trips per person per year. This is a substantial increase by any standard. The Secretary of State said “history and recent precedent shows that it [growth in demand] has been far in excess of … 2.5 per cent.” He described the forecasts as “a very conservative estimate about future growth.”103 This is not borne out by Figure 3.
The demand forecasts appear believable—academic witnesses 89. Professor Tony Venables, BP Professor of Economics, University of Oxford,
thought the forecast demand “does not seem to me to be grossly inflated at all.”104 Professor Chris Nash of the Institute for Transport Studies said that the “best estimate is that the sort of growth that we have had in the last 20 years will continue.”105 Professor Mackie said that he did not find the input assumptions as “completely outside the plausible ballpark.”106
90. Professor Dan Graham, Professor of Statistical Modelling, Imperial College London, believed that “you could construct an argument to say it is too high, you could construct one to say it is too low.”107 Professor Glaister told us that the forecast “does not look unreasonable, but whether it is the best estimate, I could not say.”108
Recent growth in long-distance rail travel—national trends 91. The Economic Case stated that the average year-on-year growth rate from 1994
to 2012 for journeys on long-distance rail services was 4.9 per cent. It said that long-distance rail has grown “particularly rapidly and consistently since 2004.”109
99 Economic Case, p 31 100 Q 67 101 Q 222 102 Q 67 103 QQ 218, 222 104 Q 21 105 Q 101 106 Q 4 107 Q 21 108 Q 45 109 Economic Case, p 30
THE ECONOMICS OF HIGH SPEED 2 31
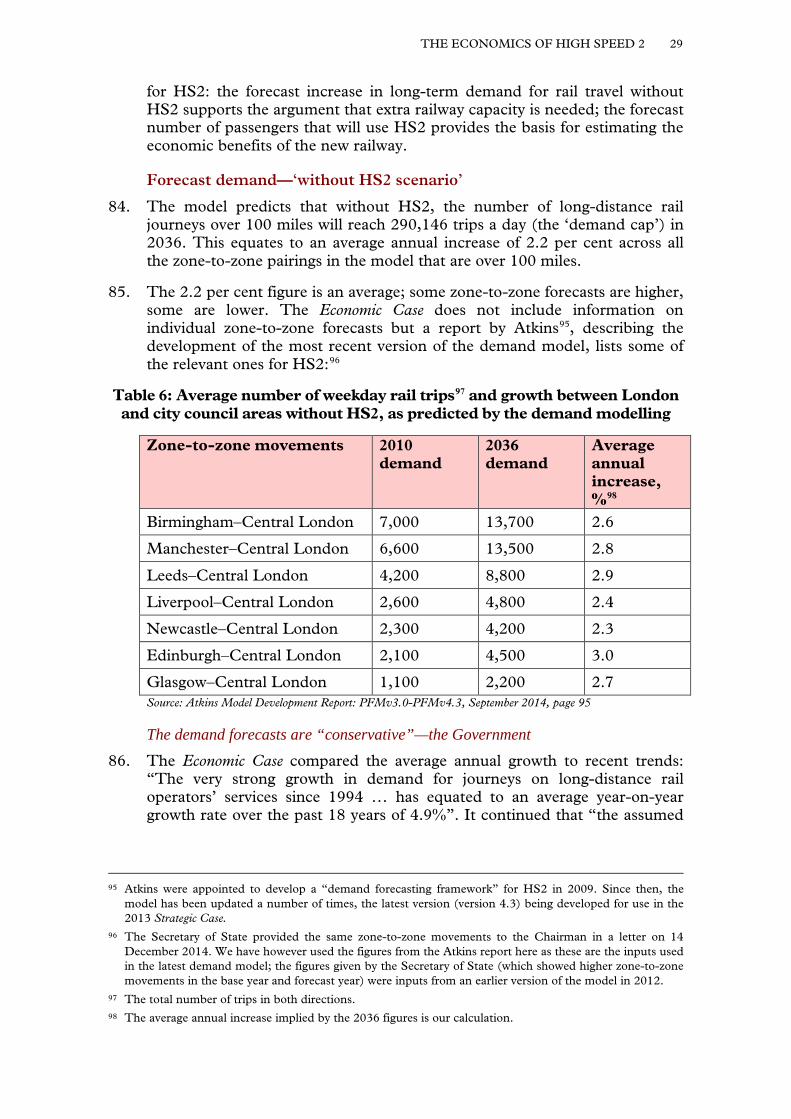
92. The Office of Rail Regulation’s website provides statistics for long-distance rail journeys going back to 2002/03. These statistics show that the number of journeys on franchised long-distance train operators increased from 77.2 million journeys per year in 2002/03 to 129 million journeys per year in 2013/14:110
Figure 2: Passenger journeys on franchised long-distance rail operators, millions
Source: Office of Rail Regulation Data Portal, Passenger journeys by sector: Table 12.6 [accessed March 2015]
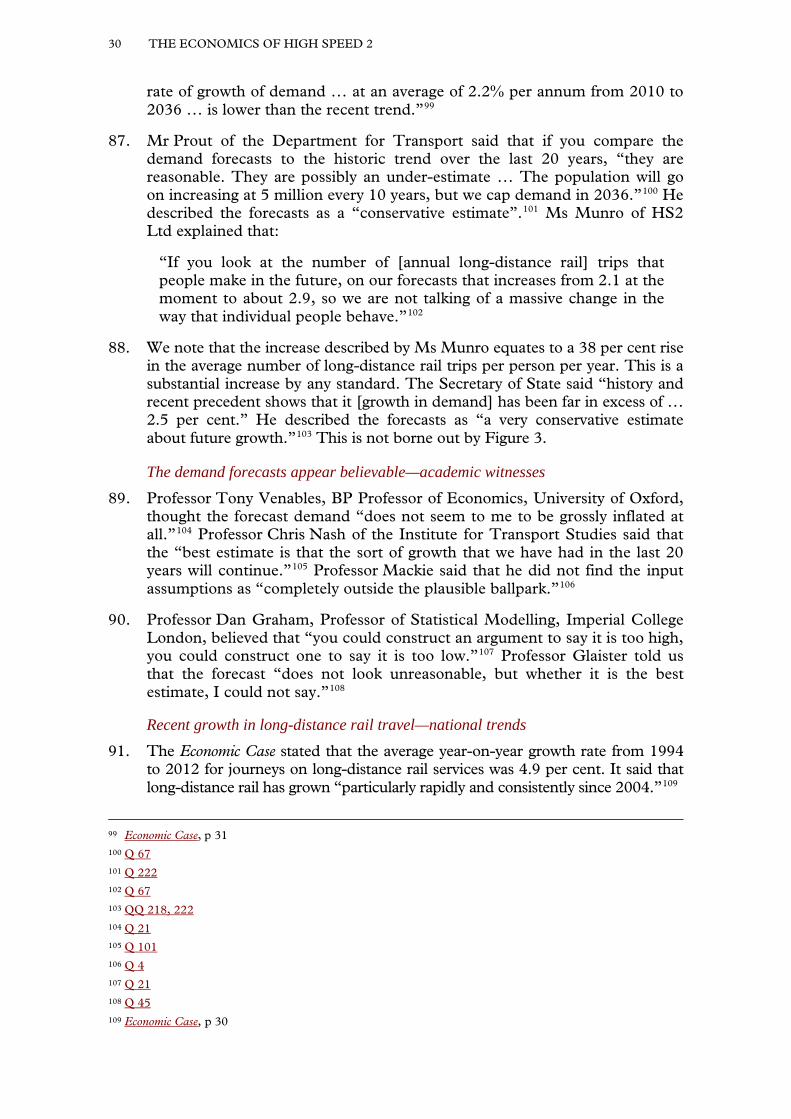
93. This equates to an average annual increase of 4.8 per cent. The following graph shows the year-on-year percentage increase in long-distance rail journeys:
Figure 3: Year-on-year percentage increase in journeys on franchised long-distance rail operators
Source: Office of Rail Regulation Data Portal, Passenger journeys by sector: Table 12.6 [accessed March 2015]
110 The journey numbers are taken from ticket sales data. Office of Rail Regulation Passenger Rail Usage, December 2014: http://orr.gov.uk/__data/assets/pdf_file/0007/15397/passenger-rail-usage-quality-report-2014–15-q2.pdf [accessed February 2015]
32 THE ECONOMICS OF HIGH SPEED 2
94. Mr Rukin from Stop HS2 told us that “growth in long-distance travel has completely bottomed out over the last four years. It has been on a consistent decline. It is now under 1 per cent.”111 The graph above shows that long-distance journeys increased by 1 per cent from 2012/13 to 2013/14.
95. The latest quarterly figures show an upturn in growth for franchised long-distance rail journeys: in Quarter 3 of 2014/15, there was a 5.1 per cent increase on the same quarter last year.112 In Quarter 1 and Quarter 2 of 2014/15, there was a 1.5 per cent increase and a 3.5 per cent increase in journeys compared to the respective quarters for 2013/14. The Office of Rail Regulation statistical release attributed the increases primarily to higher sales of advance and off-peak ticket travels, “key drivers for journeys in this sector” which signify “increase in the leisure travel segment, with people making the most of the travel incentives offered by the operators”.113
Recent growth in long-distance rail travel—regional trends 96. The Department for Transport does not publish information on the number
of journeys between stations. The Office of Rail Regulation however does publish statistics on journeys between regions and London:
Figure 4: Annual rail journeys to/from London, thousands (including weekends)
Source: Office of Rail Regulation, Regional rail journeys: London: Table 15.4 [accessed March 2015]
97. Table 7 below compares the average annual growth between regions and London since 1995/96 against the forecast average annual growth between selected cities and London (as shown in Table 6 above). Although not a direct comparison, the selected cities provide the majority of the demand for travel to and from London from within their region. Also, the growth since
111 Q 80 112 Office of Rail Regulation, Passenger Rail Usage 2014–15 Quarter 3 Statistical Release, 5 March 2015 113 Ibid; Office of Rail Regulation, Passenger Rail Usage 2014–15 Quarter 1 Statistical Release, 2 October 2014
THE ECONOMICS OF HIGH SPEED 2 33
1995/96 includes weekday and weekend travel; the predicted growth in the model is only for weekday travel.
Table 7: Predicted average annual increase in journeys to/from London versus observed average annual increase in journeys to/from London since
1995/96
City council areas114
Predicted average annual increase in weekday trips by the demand model for HS2, %
Average annual increase in journeys between the region and London since 1995/96, %115
Birmingham 2.6 6
Liverpool 2.4 4.8
Manchester 2.8
Leeds 2.9 5
Newcastle 2.3 4
Edinburgh 3.0 3.5
Glasgow 2.7 Source: Atkins Model Development Report: PFMv3.0-PFMv4.3, September 2014, page 95; Office of Rail Regulation, Regional rail journeys: London: Table 15.4 [accessed March 2015]
98. To compare actual weekday growth with predicted weekday growth, the Chairman wrote to the Secretary of State to ask for data that showed the split between growth in weekday and weekend travel since 1995/96. The Secretary of State replied that the data is only available for the past 400 days. Data from the National Travel Survey shows that the weekend share of long-distance journeys has increased in recent years: from an average 76 per cent/24 per cent split for weekday/weekend travel between 2006 and 2009 to an average 74 per cent/26 per cent split between 2009 and 2013.116
99. Richard Scott, Director of Corporate Affairs, Virgin Trains told us that demand had been “increasing consistently” in the 17 years that they had run the franchise for long-distance trains on the West Coast Main Line (which serve Birmingham, Glasgow, Liverpool and Manchester). He said that Virgin were forecasting 60 per cent growth on their services to 2026.117
100. In written evidence, Chris Stokes, former executive director at the Strategic Rail Authority and former deputy director for British Rail Network Southeast, stood by his challenge to the growth assumptions made in a
114 Figures for the base demand and estimated 2036 demand for journeys between London and Sheffield have not been made public.
115 Calculated from the data shown in Figure 4. This data represents the average annual growth in weekday and weekend travel; the HS2 modelling only predicts growth in weekday travel.
116 Letter from Secretary of State to the Chairman, 12 February 2015. The reply gave an indication of the split between weekday and weekend travel between the North-West and London for the 30 days prior to 11 February 2015, the date of the letter: using the date a ticket was issued as a proxy for the date of travel, 80 per cent of tickets were issued on weekdays, 20 per cent at weekends.
117 QQ 204, 215
34 THE ECONOMICS OF HIGH SPEED 2
December 2012 article in Modern Railways.118 In the article, he offered a “cautious hypothesis” on recent growth on the West Coast Main Line:
• “Recent high growth has been driven by a step change following completion of the [West Coast Main Line] upgrade in December 2008”;
• “There has been a one-off modal shift, especially from air to rail in the Manchester-London market”;
• “There has been significant growth in off-peak and weekend travel, but the business market is saturated”;
• “Rail has a high mode share to central London, so future growth is dependent on growth in total travel demand, not mode shift”.119
Developments in technology and working practices 101. The demand forecasts were criticised for not taking into account
developments in technology and working practices that may reduce demand for rail travel. Dr Wellings said that “the possible impact of disruptive technology is an enormous risk.”120 Councillor Tett of the 51M alliance thought the forecasts contained “little or no assumption about the growth of new technology”.121 Other witnesses felt that technological developments would be complementary to rail travel. The effects of high-speed broadband and driverless cars were the two main developments mentioned by witnesses.
High-speed broadband 102. Tonge & Breedon HS2 Action Group thought that as “electronic systems of
work and work behaviour will continue to evolve so that the concept of physical travel … will be out-dated.”122 Dr Wellings told us that “teleworking and remote meetings” could reduce demand for rail.123
103. Professor Nash however thought that “there is no evidence of improved communications reducing demand for travel” adding that “if anything demand is growing faster, not slower.”124 Professor Vickerman said that the evidence was “generally that travel and other communications are complements rather than substitutes”, citing the ease with which travel can now be booked online.125 Lord Adonis similarly saw high speed broadband as “complementary” to rail travel: “it is not an alternative. The evidence is that superfast broadband does indeed generate more local working and home-working, but it does not stifle growth in demand for travel.”126
118 Written evidence from Chris Stokes (EHS0105) 119 ‘The Case Against HS2’, Modern Railways, December 2012. 120 Q 92 121 Q 92 122 Written evidence from Tonge & Breedon HS2 Action Group (EHS0012) 123 Q 92 124 Q 102 125 Written evidence from Professor Vickerman (EHS0025) 126 Q 113
THE ECONOMICS OF HIGH SPEED 2 35
104. Mr Scott from Virgin Trains believed demand would continue to increase: “it may be dented if we have a superfast broadband network everywhere, but people will still need to get to work, will still need to do business deals face-to-face and will still need to go to football matches.”127 Mike Blackburn representing the North-West Business Leadership Team said that:
“Businesses still need to communicate and connect. You still need to get your goods and services to market and there is nothing like a face-to-face conversation. You can do that by video conference, but more effectively you will do it by collaboration and face-to-face—and the combination of the two.”128
Driverless cars 105. Several witnesses said that the effect that the development of driverless cars
would have on rail demand had not been considered by the Government. Bruce Weston from HS2 Action Alliance told us that “if people found that they could work and do what they wanted as the car whisked them along to wherever they wanted to go, the trends that we have been looking at are going to see a reversal.”129 Mr Stokes thought this was a possibility but also saw how driverless cars could complement rail:
“the potential widespread adoption of driverless cars is likely to have a dramatic impact on transport patterns—it may de-stress door to door travel, reducing rail use, or may prove to be complementary to rail use, by providing easy access to stations.”130
106. The Society of Motor Manufacturers and Traders (SMMT) told us that the Automotive Council was targeting mainstream introduction of autonomous vehicles from 2020, noting “autonomous features are already a readily available aspect of many new vehicles on the UK’s roads today.”131
107. The SMMT said that it was “too early to be able to predict the impact of increased connectivity and the introduction of autonomous vehicles on road or public transport”. They noted how changing driving trends and models of vehicle ownership and “the concept of purchasing mobility rather than the traditional concept of purchasing vehicles demonstrates the growing interconnectedness of transport, reflecting the needs of travellers and drivers.” It was uncertain whether these trends would reduce the number of vehicles on the road, but it was “clear that opportunities will be created by the introduction of connected vehicles across all sectors.”132
108. When we asked whether driverless cars had been taken account of in the Government’s forecasts, the Secretary of State replied that “what we have
127 Q 215. Demand caused by football matches is considered further in Chapter 4. 128 Q 144 129 Q 80 130 Written evidence from Chris Stokes (EHS0105) 131 Written evidence from the Society of Motor Manufacturers and Traders (EHS0106) 132 Written evidence from the Society of Motor Manufacturers and Traders (EHS0106)
36 THE ECONOMICS OF HIGH SPEED 2
factored in is what we have seen happen … but exactly what the transport picture will be in 25 years’ time is anyone’s guess.”133
109. Partial information on current railway usage, as well as uncertainty about future technological developments in automotive transport and working habits, makes it difficult to assess the plausibility of the Department’s forecasts of future demand for long-distance rail travel.
Forecast demand—‘with HS2 scenario’
110. The model predicts the effect HS2 will have on demand for road, rail and air between the 235 zones. As well as predicting the number of people who will switch to HS2 from existing modes of transport, the model also predicts the number of new journeys generated by the existence of HS2. The comparison between the ‘without HS2 scenario’ and the ‘with HS2 scenario’ allows the benefits of the project to be assessed. The calculation of the expected benefits of HS2 are considered in Chapter 8.
111. Neither the Economic Case nor the supporting documentation published contains the number of passengers the model assumes will use HS2. It is also not clear how the model predicts which passengers will switch from existing transport modes to HS2 (see Box 3 for an example). We do know that the model assumes that fares on HS2 are the same as on the existing railway; it is unable to model the effect on demand for HS2 if there are differential fares.
112. The rest of this chapter looks at whether demand forecasts for other high speed railways proved to be accurate and considers the assumption about fares on HS2.
Box 3: Access to HS2 stations in the demand model
Some of the proposed HS2 stations, for example Birmingham and Sheffield, are not next to the existing city centre station. Some witnesses thought that the model had not taken proper account of this possible time penalty and therefore the predicted number of passengers who will switch to HS2 was too high. Councillor Tett said that “people who travel do not live in the city centre of Manchester … Most of those journey-time savings, on which they predicate so much of the demand, are completely nullified when you look at where people actually live”. Dr Nigel Shepperson, a private individual, wrote that the “business case is flawed because it is not based on real door-to-door journeys … existence of local stations [from the Birmingham area] with direct services to London are likely to outweigh any benefit of a high speed line.”134
Professor Glaister thought that a “good attempt” was made at modelling this time penalty in the Economic Case.135 The model allows for a passenger being less likely to choose HS2 over an alternative if the former involves an additional walk or transfer. However, there is relatively little experience of modelling this effect for long-distance passengers. Professor Vickerman said “it is a very tricky issue … because you are dealing with a very large spread of areas over which people are being funnelled.”136
133 Q 222 134 Written evidence from Dr Nigel Shepperson (EHS0019) 135 Q 39 136 Q 3
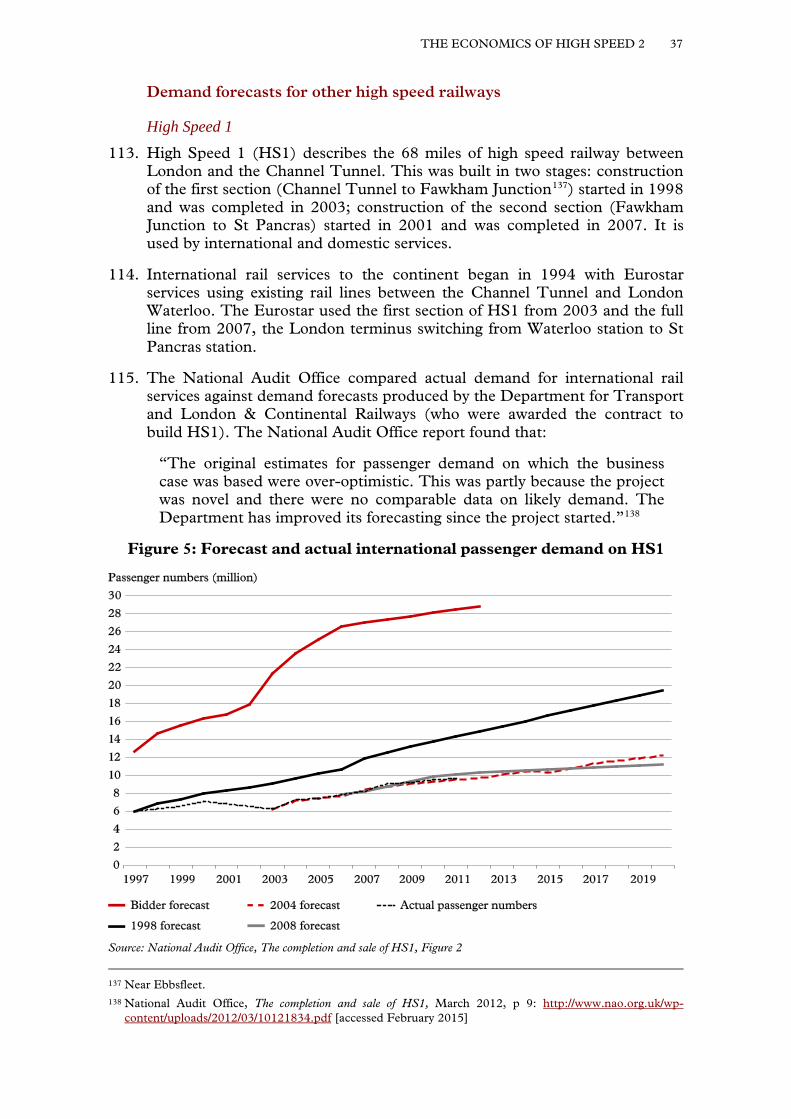
THE ECONOMICS OF HIGH SPEED 2 37
Demand forecasts for other high speed railways
High Speed 1 113. High Speed 1 (HS1) describes the 68 miles of high speed railway between
London and the Channel Tunnel. This was built in two stages: construction of the first section (Channel Tunnel to Fawkham Junction137) started in 1998 and was completed in 2003; construction of the second section (Fawkham Junction to St Pancras) started in 2001 and was completed in 2007. It is used by international and domestic services.
114. International rail services to the continent began in 1994 with Eurostar services using existing rail lines between the Channel Tunnel and London Waterloo. The Eurostar used the first section of HS1 from 2003 and the full line from 2007, the London terminus switching from Waterloo station to St Pancras station.
115. The National Audit Office compared actual demand for international rail services against demand forecasts produced by the Department for Transport and London & Continental Railways (who were awarded the contract to build HS1). The National Audit Office report found that:
“The original estimates for passenger demand on which the business case was based were over-optimistic. This was partly because the project was novel and there were no comparable data on likely demand. The Department has improved its forecasting since the project started.”138
Figure 5: Forecast and actual international passenger demand on HS1
Source: National Audit Office, The completion and sale of HS1, Figure 2
137 Near Ebbsfleet. 138 National Audit Office, The completion and sale of HS1, March 2012, p 9: http://www.nao.org.uk/wp-
content/uploads/2012/03/10121834.pdf [accessed February 2015]
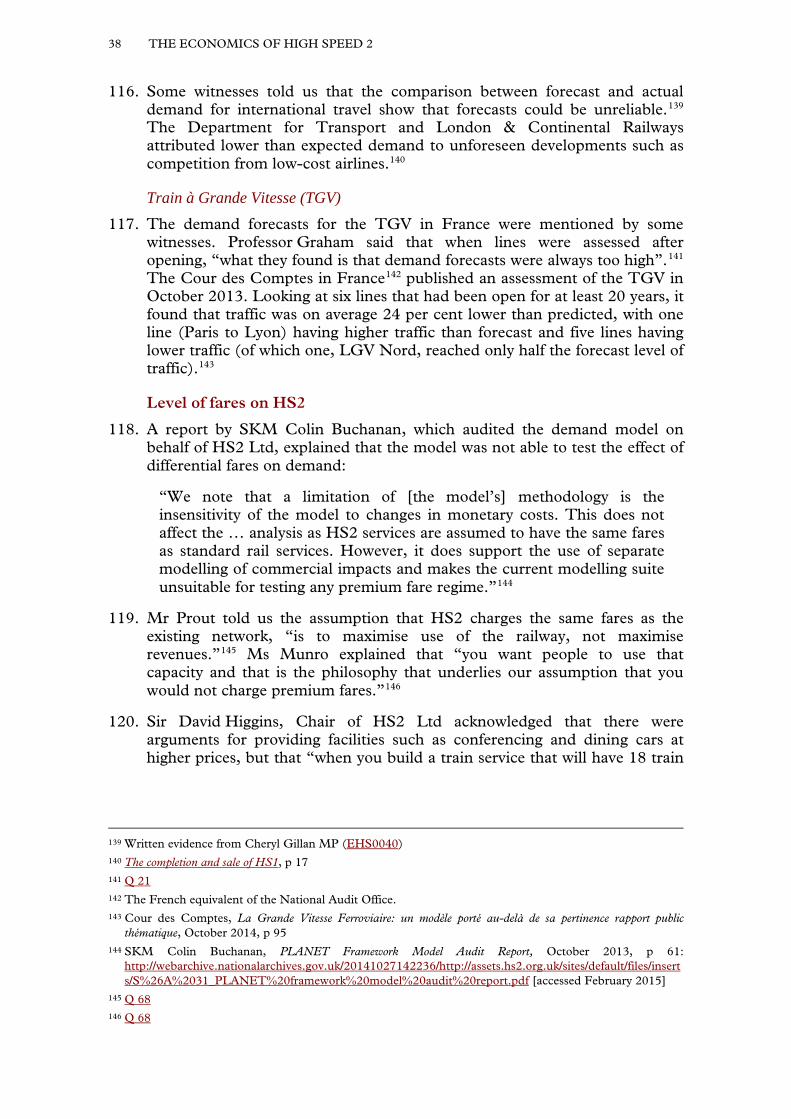
38 THE ECONOMICS OF HIGH SPEED 2
116. Some witnesses told us that the comparison between forecast and actual demand for international travel show that forecasts could be unreliable.139 The Department for Transport and London & Continental Railways attributed lower than expected demand to unforeseen developments such as competition from low-cost airlines.140
Train à Grande Vitesse (TGV) 117. The demand forecasts for the TGV in France were mentioned by some
witnesses. Professor Graham said that when lines were assessed after opening, “what they found is that demand forecasts were always too high”.141 The Cour des Comptes in France142 published an assessment of the TGV in October 2013. Looking at six lines that had been open for at least 20 years, it found that traffic was on average 24 per cent lower than predicted, with one line (Paris to Lyon) having higher traffic than forecast and five lines having lower traffic (of which one, LGV Nord, reached only half the forecast level of traffic).143
Level of fares on HS2
118. A report by SKM Colin Buchanan, which audited the demand model on behalf of HS2 Ltd, explained that the model was not able to test the effect of differential fares on demand:
“We note that a limitation of [the model’s] methodology is the insensitivity of the model to changes in monetary costs. This does not affect the … analysis as HS2 services are assumed to have the same fares as standard rail services. However, it does support the use of separate modelling of commercial impacts and makes the current modelling suite unsuitable for testing any premium fare regime.”144
119. Mr Prout told us the assumption that HS2 charges the same fares as the existing network, “is to maximise use of the railway, not maximise revenues.”145 Ms Munro explained that “you want people to use that capacity and that is the philosophy that underlies our assumption that you would not charge premium fares.”146
120. Sir David Higgins, Chair of HS2 Ltd acknowledged that there were arguments for providing facilities such as conferencing and dining cars at higher prices, but that “when you build a train service that will have 18 train
139 Written evidence from Cheryl Gillan MP (EHS0040) 140 The completion and sale of HS1, p 17 141 Q 21 142 The French equivalent of the National Audit Office. 143 Cour des Comptes, La Grande Vitesse Ferroviaire: un modèle porté au-delà de sa pertinence rapport public
thématique, October 2014, p 95 144 SKM Colin Buchanan, PLANET Framework Model Audit Report, October 2013, p 61:
http://webarchive.nationalarchives.gov.uk/20141027142236/http://assets.hs2.org.uk/sites/default/files/inserts/S%26A%2031_PLANET%20framework%20model%20audit%20report.pdf [accessed February 2015]
145 Q 68 146 Q 68
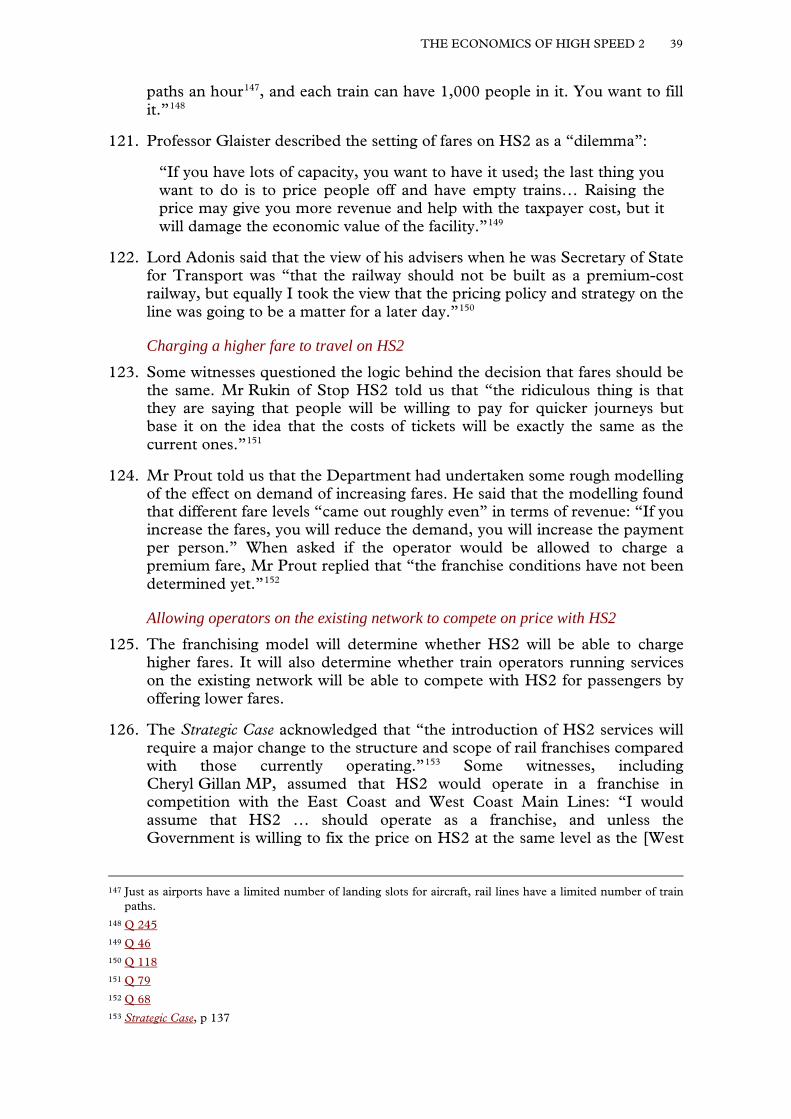
THE ECONOMICS OF HIGH SPEED 2 39
paths an hour147, and each train can have 1,000 people in it. You want to fill it.”148
121. Professor Glaister described the setting of fares on HS2 as a “dilemma”:
“If you have lots of capacity, you want to have it used; the last thing you want to do is to price people off and have empty trains… Raising the price may give you more revenue and help with the taxpayer cost, but it will damage the economic value of the facility.”149
122. Lord Adonis said that the view of his advisers when he was Secretary of State for Transport was “that the railway should not be built as a premium-cost railway, but equally I took the view that the pricing policy and strategy on the line was going to be a matter for a later day.”150
Charging a higher fare to travel on HS2 123. Some witnesses questioned the logic behind the decision that fares should be
the same. Mr Rukin of Stop HS2 told us that “the ridiculous thing is that they are saying that people will be willing to pay for quicker journeys but base it on the idea that the costs of tickets will be exactly the same as the current ones.”151
124. Mr Prout told us that the Department had undertaken some rough modelling of the effect on demand of increasing fares. He said that the modelling found that different fare levels “came out roughly even” in terms of revenue: “If you increase the fares, you will reduce the demand, you will increase the payment per person.” When asked if the operator would be allowed to charge a premium fare, Mr Prout replied that “the franchise conditions have not been determined yet.”152
Allowing operators on the existing network to compete on price with HS2 125. The franchising model will determine whether HS2 will be able to charge
higher fares. It will also determine whether train operators running services on the existing network will be able to compete with HS2 for passengers by offering lower fares.
126. The Strategic Case acknowledged that “the introduction of HS2 services will require a major change to the structure and scope of rail franchises compared with those currently operating.”153 Some witnesses, including Cheryl Gillan MP, assumed that HS2 would operate in a franchise in competition with the East Coast and West Coast Main Lines: “I would assume that HS2 … should operate as a franchise, and unless the Government is willing to fix the price on HS2 at the same level as the [West
147 Just as airports have a limited number of landing slots for aircraft, rail lines have a limited number of train paths.
148 Q 245 149 Q 46 150 Q 118 151 Q 79 152 Q 68 153 Strategic Case, p 137
40 THE ECONOMICS OF HIGH SPEED 2
and East Coast Main Lines] (which would seem unlikely) that there will be price competition.”154
127. 20 Miles More however argued that a franchise model that allowed competition between HS2 and the West and East Coast Main Lines could lead to a reduction in services and higher fares in some areas. They suggested an alternative franchise model where “the [HS2] operator would be responsible for delivering a predetermined level of service and fares with payment on the basis of key performance indicators.”155
128. The Government should undertake further modelling of the effect of charging premium fares for HS2 services and the effect of competition from other operators on demand forecasts for the new high speed railway. The results of this work would increase understanding of the implications for the funding of HS2.
154 Written Evidence from Cheryl Gillan MP (EHS0040) 155 Written evidence from 20 Miles More (EHS0051)

THE ECONOMICS OF HIGH SPEED 2 41
Chapter 3: Conclusions and recommendations
129. Partial information on current railway usage, as well as uncertainty about future technological developments in automotive transport and working habits, makes it difficult to assess the plausibility of the Department’s forecasts of future demand for long-distance rail travel. (Paragraph 109)
130. The Government should undertake further modelling of the effect of charging premium fares for HS2 services and the effect of competition from other operators on demand forecasts for the new high speed railway. The results of this work would increase understanding of the implications for the funding of HS2. (Paragraph 128)
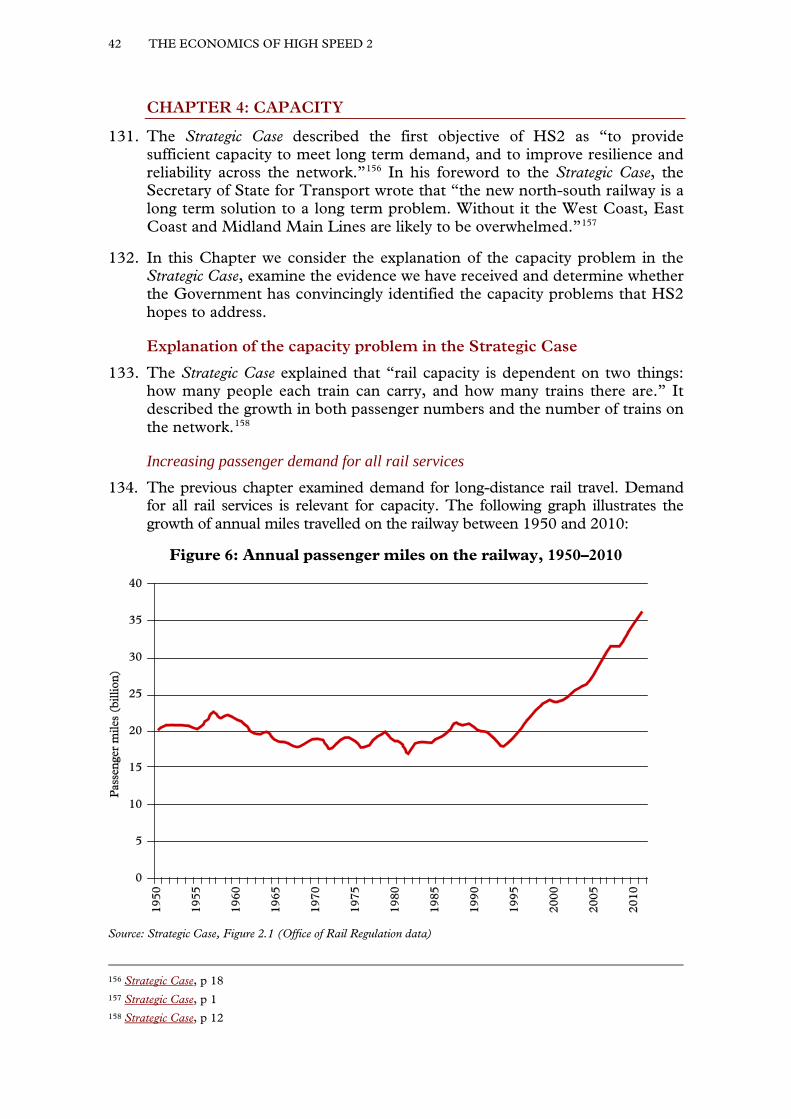
42 THE ECONOMICS OF HIGH SPEED 2
CHAPTER 4: CAPACITY
131. The Strategic Case described the first objective of HS2 as “to provide sufficient capacity to meet long term demand, and to improve resilience and reliability across the network.”156 In his foreword to the Strategic Case, the Secretary of State for Transport wrote that “the new north-south railway is a long term solution to a long term problem. Without it the West Coast, East Coast and Midland Main Lines are likely to be overwhelmed.”157
132. In this Chapter we consider the explanation of the capacity problem in the Strategic Case, examine the evidence we have received and determine whether the Government has convincingly identified the capacity problems that HS2 hopes to address.
Explanation of the capacity problem in the Strategic Case
133. The Strategic Case explained that “rail capacity is dependent on two things: how many people each train can carry, and how many trains there are.” It described the growth in both passenger numbers and the number of trains on the network.158
Increasing passenger demand for all rail services 134. The previous chapter examined demand for long-distance rail travel. Demand
for all rail services is relevant for capacity. The following graph illustrates the growth of annual miles travelled on the railway between 1950 and 2010:
Figure 6: Annual passenger miles on the railway, 1950–2010
Source: Strategic Case, Figure 2.1 (Office of Rail Regulation data)
156 Strategic Case, p 18 157 Strategic Case, p 1 158 Strategic Case, p 12
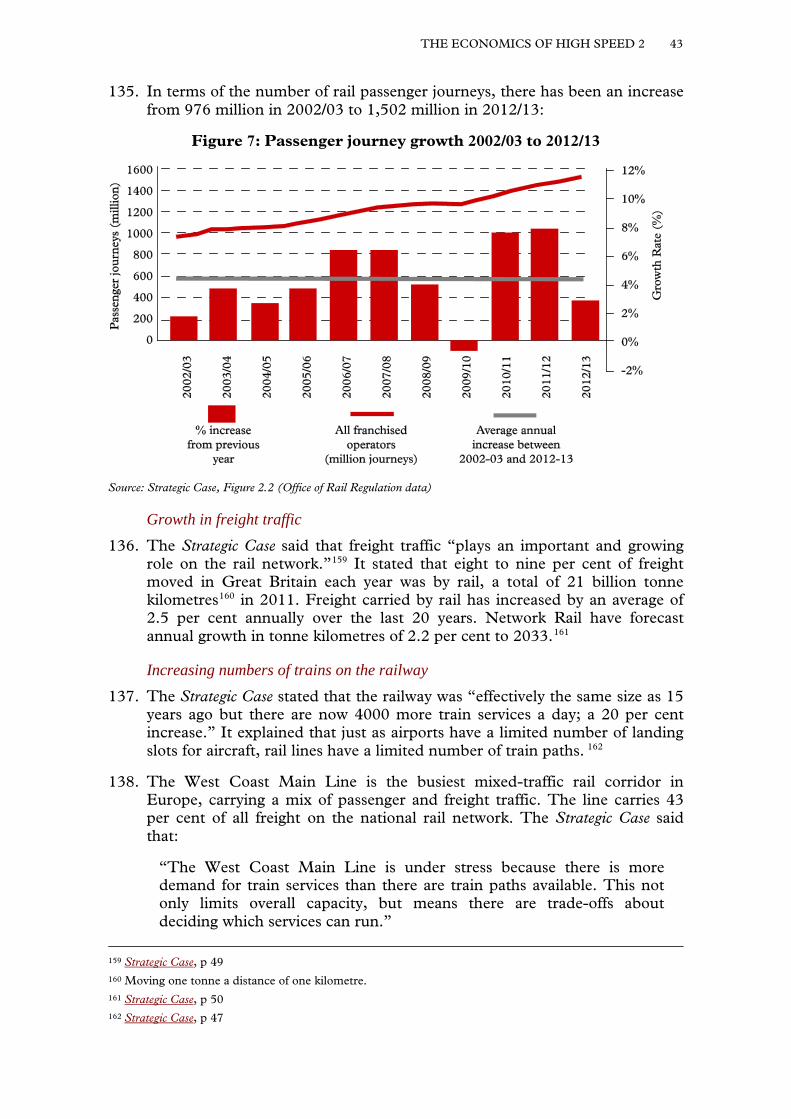
THE ECONOMICS OF HIGH SPEED 2 43
135. In terms of the number of rail passenger journeys, there has been an increase from 976 million in 2002/03 to 1,502 million in 2012/13:
Figure 7: Passenger journey growth 2002/03 to 2012/13
Source: Strategic Case, Figure 2.2 (Office of Rail Regulation data)
Growth in freight traffic 136. The Strategic Case said that freight traffic “plays an important and growing
role on the rail network.”159 It stated that eight to nine per cent of freight moved in Great Britain each year was by rail, a total of 21 billion tonne kilometres160 in 2011. Freight carried by rail has increased by an average of 2.5 per cent annually over the last 20 years. Network Rail have forecast annual growth in tonne kilometres of 2.2 per cent to 2033.161
Increasing numbers of trains on the railway 137. The Strategic Case stated that the railway was “effectively the same size as 15
years ago but there are now 4000 more train services a day; a 20 per cent increase.” It explained that just as airports have a limited number of landing slots for aircraft, rail lines have a limited number of train paths. 162
138. The West Coast Main Line is the busiest mixed-traffic rail corridor in Europe, carrying a mix of passenger and freight traffic. The line carries 43 per cent of all freight on the national rail network. The Strategic Case said that:
“The West Coast Main Line is under stress because there is more demand for train services than there are train paths available. This not only limits overall capacity, but means there are trade-offs about deciding which services can run.”
159 Strategic Case, p 49 160 Moving one tonne a distance of one kilometre. 161 Strategic Case, p 50 162 Strategic Case, p 47
44 THE ECONOMICS OF HIGH SPEED 2
139. It continued that, once trains (whether passenger or freight) are lengthened to the limits that the infrastructure will allow, “further capacity can only be provided by running extra trains. This is why the question of train paths is crucial.” Although there is additional capacity in some parts of the north, “the scope for further services to be introduced on the southern part of the West Coast Main Line is now very limited.”163
Crowding on trains 140. The Strategic Case said that despite train lengthening and additional services
increasing capacity in recent years, 40 per cent of trains at Euston in the morning and evening peak periods already have passengers standing.164 It said that, on commuter services leaving Euston during the final hour of the evening peak, on average there were 120 passengers for every 100 seats:
“With additional train services increasingly difficult to accommodate, additional demand is being met by train lengthening. The busiest peak services already have the longest trains the network can readily accommodate … even at only half the recent rate of growth capacity there will be a severe problem by the mid-2020s. Crowding levels will be untenable.”165
How will HS2 provide additional capacity? 141. According to the Strategic Case:
“By building a new north-south high speed railway, HS2 provides a step change in capacity that can meet demand for the long term. While HS2 itself provides additional intercity capacity, the released capacity on the classic network allows for new commuter and freight services.”
It explained that HS2 will be capable of providing 14 trains per hour in each direction for intercity travel, rising to 18 trains when the full network is completed. 166
The latest view from the Department for Transport and the industry 142. Mr Prout of the Department for Transport told us that:
“There are basically two major issues in terms of capacity that HS2 is dealing with. One is long-distance capacity, and that is a question of not just seats on trains but of train paths … The other problem is commuter capacity, and there the overcrowding on commuter trains is much worse than it is on long-distance trains … [HS2] deals with these two issues, long distance and commuter, and in both respects creates additional capacity.”167
163 Strategic Case, pp 12, 13, 55 164 The Strategic Case did not indicate whether passengers were standing on commuter or long-distance
trains. 165 Strategic Case, p 64 166 Strategic Case, pp 24, 89 167 Q 66
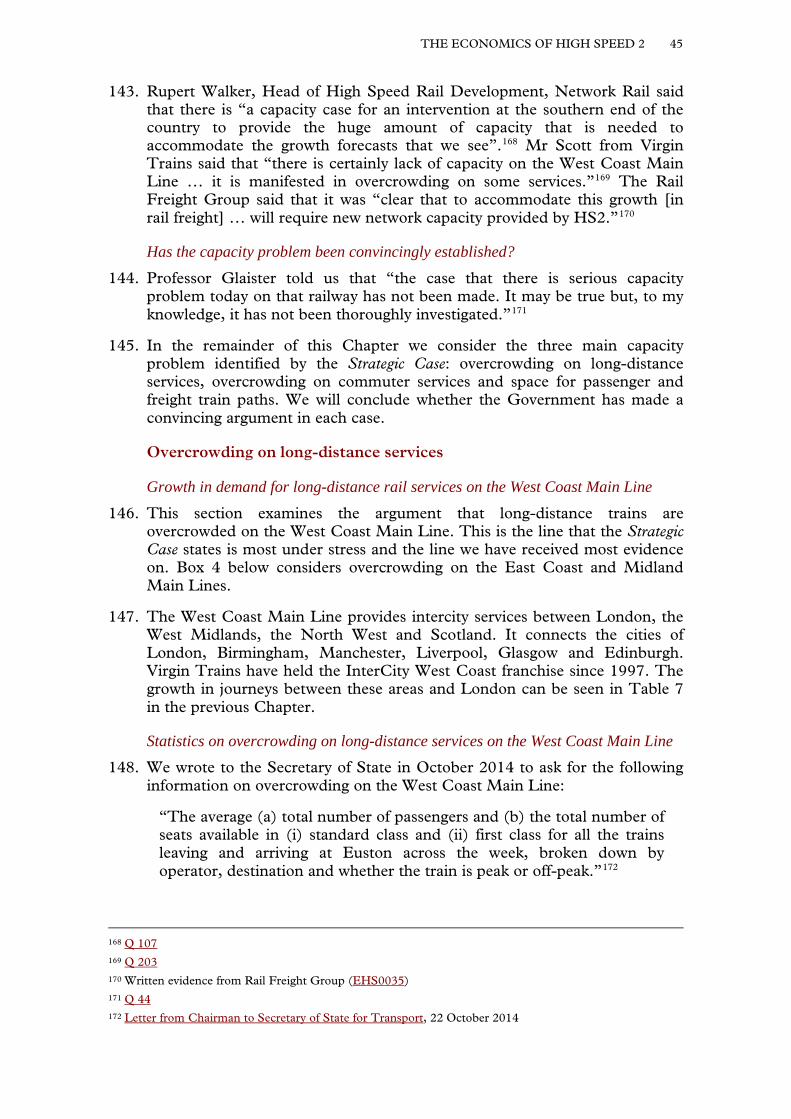
THE ECONOMICS OF HIGH SPEED 2 45
143. Rupert Walker, Head of High Speed Rail Development, Network Rail said that there is “a capacity case for an intervention at the southern end of the country to provide the huge amount of capacity that is needed to accommodate the growth forecasts that we see”.168 Mr Scott from Virgin Trains said that “there is certainly lack of capacity on the West Coast Main Line … it is manifested in overcrowding on some services.”169 The Rail Freight Group said that it was “clear that to accommodate this growth [in rail freight] … will require new network capacity provided by HS2.”170
Has the capacity problem been convincingly established? 144. Professor Glaister told us that “the case that there is serious capacity
problem today on that railway has not been made. It may be true but, to my knowledge, it has not been thoroughly investigated.”171
145. In the remainder of this Chapter we consider the three main capacity problem identified by the Strategic Case: overcrowding on long-distance services, overcrowding on commuter services and space for passenger and freight train paths. We will conclude whether the Government has made a convincing argument in each case.
Overcrowding on long-distance services
Growth in demand for long-distance rail services on the West Coast Main Line 146. This section examines the argument that long-distance trains are
overcrowded on the West Coast Main Line. This is the line that the Strategic Case states is most under stress and the line we have received most evidence on. Box 4 below considers overcrowding on the East Coast and Midland Main Lines.
147. The West Coast Main Line provides intercity services between London, the West Midlands, the North West and Scotland. It connects the cities of London, Birmingham, Manchester, Liverpool, Glasgow and Edinburgh. Virgin Trains have held the InterCity West Coast franchise since 1997. The growth in journeys between these areas and London can be seen in Table 7 in the previous Chapter.
Statistics on overcrowding on long-distance services on the West Coast Main Line 148. We wrote to the Secretary of State in October 2014 to ask for the following
information on overcrowding on the West Coast Main Line:
“The average (a) total number of passengers and (b) the total number of seats available in (i) standard class and (ii) first class for all the trains leaving and arriving at Euston across the week, broken down by operator, destination and whether the train is peak or off-peak.”172
168 Q 107 169 Q 203 170 Written evidence from Rail Freight Group (EHS0035) 171 Q 44 172 Letter from Chairman to Secretary of State for Transport, 22 October 2014
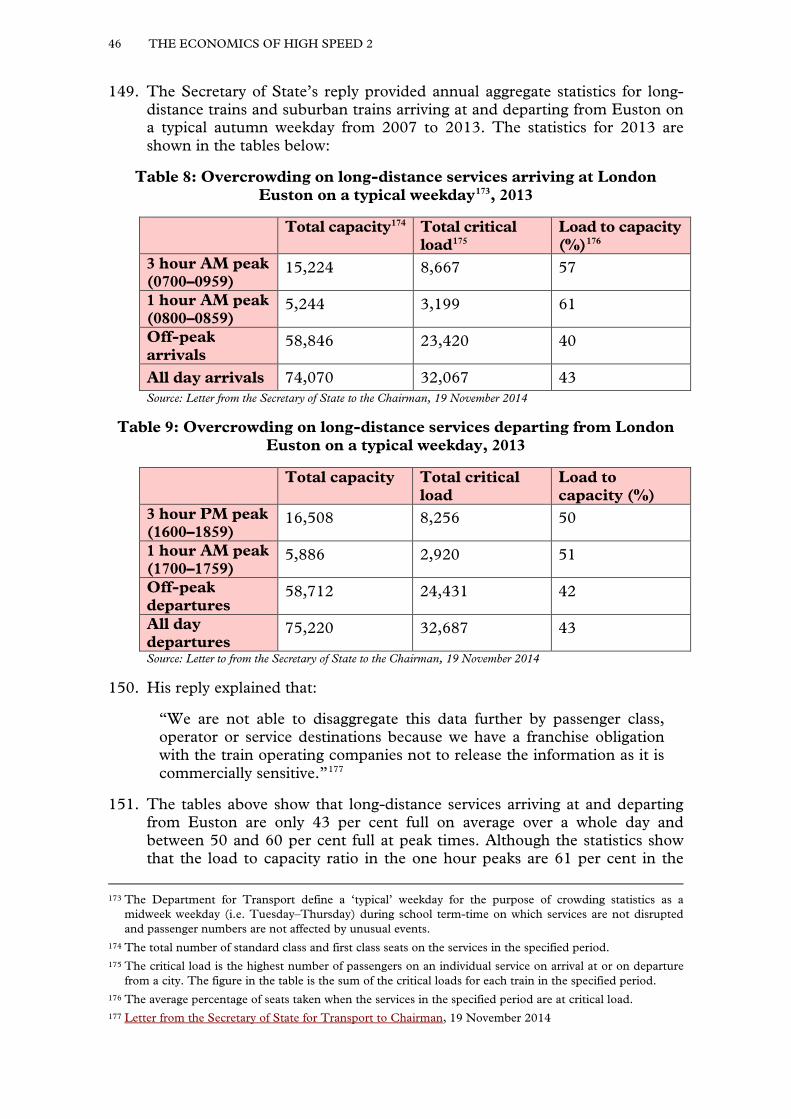
46 THE ECONOMICS OF HIGH SPEED 2
149. The Secretary of State’s reply provided annual aggregate statistics for long-distance trains and suburban trains arriving at and departing from Euston on a typical autumn weekday from 2007 to 2013. The statistics for 2013 are shown in the tables below:
Table 8: Overcrowding on long-distance services arriving at London Euston on a typical weekday173, 2013
Total capacity174 Total critical load175
Load to capacity (%)176
3 hour AM peak (0700–0959)
15,224 8,667 57
1 hour AM peak (0800–0859)
5,244 3,199 61
Off-peak arrivals
58,846 23,420 40
All day arrivals 74,070 32,067 43 Source: Letter from the Secretary of State to the Chairman, 19 November 2014
Table 9: Overcrowding on long-distance services departing from London Euston on a typical weekday, 2013
Total capacity Total critical load
Load to capacity (%)
3 hour PM peak (1600–1859)
16,508 8,256 50
1 hour AM peak (1700–1759)
5,886 2,920 51
Off-peak departures
58,712 24,431 42
All day departures
75,220 32,687 43
Source: Letter to from the Secretary of State to the Chairman, 19 November 2014
150. His reply explained that:
“We are not able to disaggregate this data further by passenger class, operator or service destinations because we have a franchise obligation with the train operating companies not to release the information as it is commercially sensitive.”177
151. The tables above show that long-distance services arriving at and departing from Euston are only 43 per cent full on average over a whole day and between 50 and 60 per cent full at peak times. Although the statistics show that the load to capacity ratio in the one hour peaks are 61 per cent in the
173 The Department for Transport define a ‘typical’ weekday for the purpose of crowding statistics as a midweek weekday (i.e. Tuesday–Thursday) during school term-time on which services are not disrupted and passenger numbers are not affected by unusual events.
174 The total number of standard class and first class seats on the services in the specified period. 175 The critical load is the highest number of passengers on an individual service on arrival at or on departure
from a city. The figure in the table is the sum of the critical loads for each train in the specified period. 176 The average percentage of seats taken when the services in the specified period are at critical load. 177 Letter from the Secretary of State for Transport to Chairman, 19 November 2014
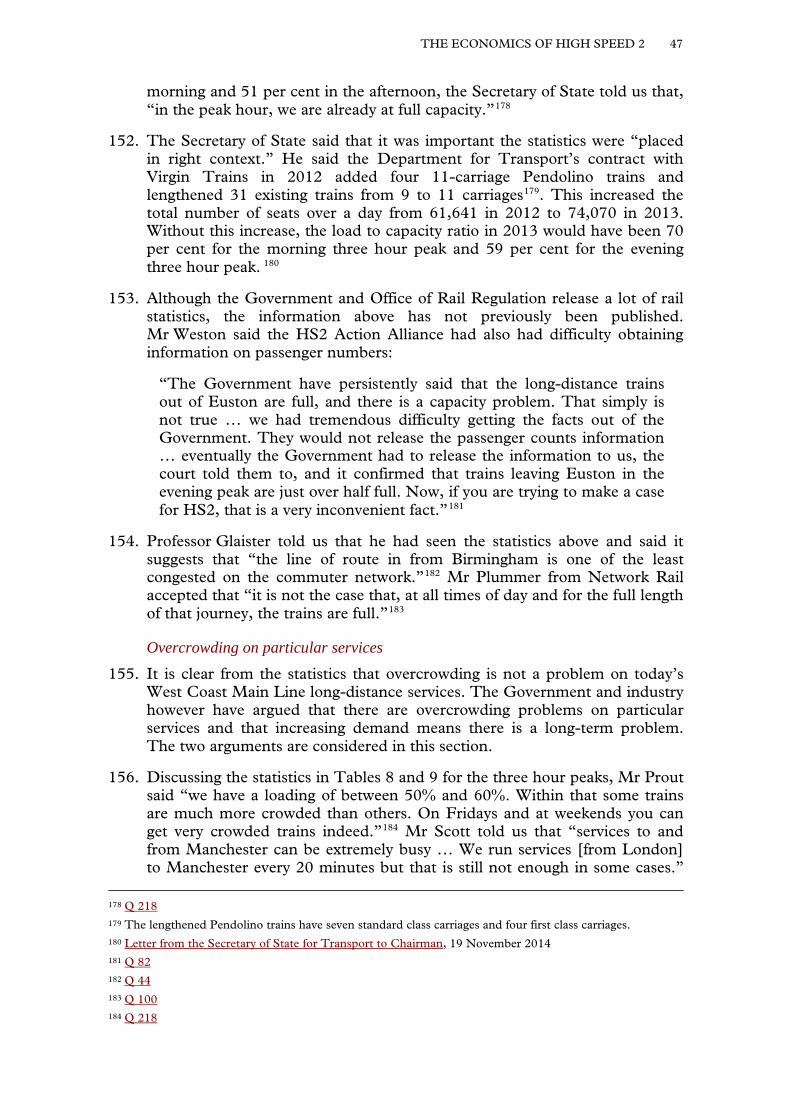
THE ECONOMICS OF HIGH SPEED 2 47
morning and 51 per cent in the afternoon, the Secretary of State told us that, “in the peak hour, we are already at full capacity.”178
152. The Secretary of State said that it was important the statistics were “placed in right context.” He said the Department for Transport’s contract with Virgin Trains in 2012 added four 11-carriage Pendolino trains and lengthened 31 existing trains from 9 to 11 carriages179. This increased the total number of seats over a day from 61,641 in 2012 to 74,070 in 2013. Without this increase, the load to capacity ratio in 2013 would have been 70 per cent for the morning three hour peak and 59 per cent for the evening three hour peak. 180
153. Although the Government and Office of Rail Regulation release a lot of rail statistics, the information above has not previously been published. Mr Weston said the HS2 Action Alliance had also had difficulty obtaining information on passenger numbers:
“The Government have persistently said that the long-distance trains out of Euston are full, and there is a capacity problem. That simply is not true … we had tremendous difficulty getting the facts out of the Government. They would not release the passenger counts information … eventually the Government had to release the information to us, the court told them to, and it confirmed that trains leaving Euston in the evening peak are just over half full. Now, if you are trying to make a case for HS2, that is a very inconvenient fact.”181
154. Professor Glaister told us that he had seen the statistics above and said it suggests that “the line of route in from Birmingham is one of the least congested on the commuter network.”182 Mr Plummer from Network Rail accepted that “it is not the case that, at all times of day and for the full length of that journey, the trains are full.”183
Overcrowding on particular services 155. It is clear from the statistics that overcrowding is not a problem on today’s
West Coast Main Line long-distance services. The Government and industry however have argued that there are overcrowding problems on particular services and that increasing demand means there is a long-term problem. The two arguments are considered in this section.
156. Discussing the statistics in Tables 8 and 9 for the three hour peaks, Mr Prout said “we have a loading of between 50% and 60%. Within that some trains are much more crowded than others. On Fridays and at weekends you can get very crowded trains indeed.”184 Mr Scott told us that “services to and from Manchester can be extremely busy … We run services [from London] to Manchester every 20 minutes but that is still not enough in some cases.”
178 Q 218 179 The lengthened Pendolino trains have seven standard class carriages and four first class carriages. 180 Letter from the Secretary of State for Transport to Chairman, 19 November 2014 181 Q 82 182 Q 44 183 Q 100 184 Q 218
48 THE ECONOMICS OF HIGH SPEED 2
He said “there are significant periods where demand is above capacity. This can be during peak periods, but it can also be during off-peak periods.”185
157. Mr Prout explained that the Department for Transport does not measure crowding on Friday evenings and weekends. He said that mid-week peaks are measured in order to give the fairest representation of crowding.186
Friday evenings 158. Mr Scott told us that “the first off-peak service after a peak period tends to
very busy [on] Friday-night services”.187 The ticket booking system on the Virgin Trains website supports this and displays the following warning when attempting to book a ticket for Friday evening travel:
Figure 8: Warning about Friday evening travel on the Virgin Trains ticket booking website
Source: www.buytickets.virgintrains.co.uk [accessed February 2015]
159. The first off-peak service is considerably cheaper than travelling on a train during the three hour evening peak. Table 9 (above) shows that the average load to capacity ratio for the peak services is 50 per cent. Table 10 (below) shows the ticket pricing structure on a Friday evening.
185 Q 203 186 Q 218 187 Q 203
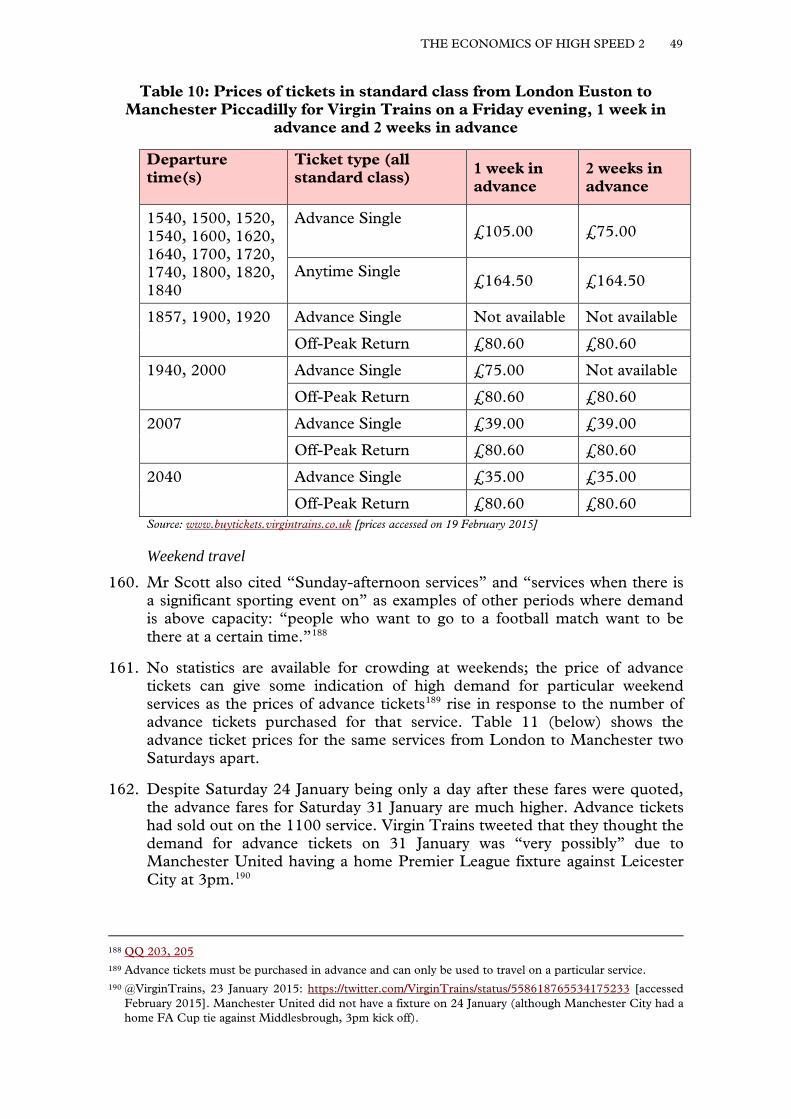
THE ECONOMICS OF HIGH SPEED 2 49
Table 10: Prices of tickets in standard class from London Euston to Manchester Piccadilly for Virgin Trains on a Friday evening, 1 week in
advance and 2 weeks in advance
Departure time(s)
Ticket type (all standard class) 1 week in
advance 2 weeks in advance
1540, 1500, 1520, 1540, 1600, 1620, 1640, 1700, 1720, 1740, 1800, 1820, 1840
Advance Single £105.00 £75.00
Anytime Single £164.50 £164.50
1857, 1900, 1920 Advance Single Not available Not available
Off-Peak Return £80.60 £80.60
1940, 2000 Advance Single £75.00 Not available
Off-Peak Return £80.60 £80.60
2007
Advance Single £39.00 £39.00
Off-Peak Return £80.60 £80.60
2040
Advance Single £35.00 £35.00
Off-Peak Return £80.60 £80.60 Source: www.buytickets.virgintrains.co.uk [prices accessed on 19 February 2015]
Weekend travel 160. Mr Scott also cited “Sunday-afternoon services” and “services when there is
a significant sporting event on” as examples of other periods where demand is above capacity: “people who want to go to a football match want to be there at a certain time.”188
161. No statistics are available for crowding at weekends; the price of advance tickets can give some indication of high demand for particular weekend services as the prices of advance tickets189 rise in response to the number of advance tickets purchased for that service. Table 11 (below) shows the advance ticket prices for the same services from London to Manchester two Saturdays apart.
162. Despite Saturday 24 January being only a day after these fares were quoted, the advance fares for Saturday 31 January are much higher. Advance tickets had sold out on the 1100 service. Virgin Trains tweeted that they thought the demand for advance tickets on 31 January was “very possibly” due to Manchester United having a home Premier League fixture against Leicester City at 3pm.190
188 QQ 203, 205 189 Advance tickets must be purchased in advance and can only be used to travel on a particular service. 190 @VirginTrains, 23 January 2015: https://twitter.com/VirginTrains/status/558618765534175233 [accessed
February 2015]. Manchester United did not have a fixture on 24 January (although Manchester City had a home FA Cup tie against Middlesbrough, 3pm kick off).
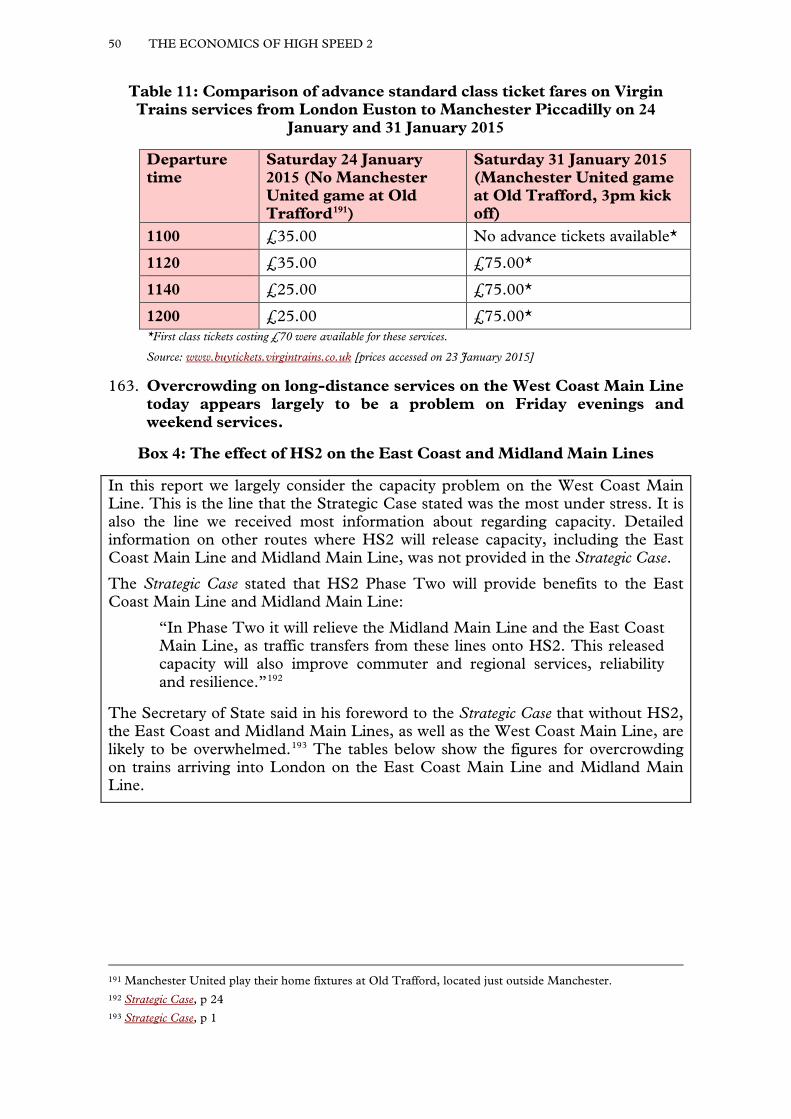
50 THE ECONOMICS OF HIGH SPEED 2
Table 11: Comparison of advance standard class ticket fares on Virgin Trains services from London Euston to Manchester Piccadilly on 24
January and 31 January 2015
Departure time
Saturday 24 January 2015 (No Manchester United game at Old Trafford191)
Saturday 31 January 2015 (Manchester United game at Old Trafford, 3pm kick off)
1100 £35.00 No advance tickets available*
1120 £35.00 £75.00*
1140 £25.00 £75.00*
1200 £25.00 £75.00* *First class tickets costing £70 were available for these services.
Source: www.buytickets.virgintrains.co.uk [prices accessed on 23 January 2015]
163. Overcrowding on long-distance services on the West Coast Main Line today appears largely to be a problem on Friday evenings and weekend services.
Box 4: The effect of HS2 on the East Coast and Midland Main Lines
In this report we largely consider the capacity problem on the West Coast Main Line. This is the line that the Strategic Case stated was the most under stress. It is also the line we received most information about regarding capacity. Detailed information on other routes where HS2 will release capacity, including the East Coast Main Line and Midland Main Line, was not provided in the Strategic Case.
The Strategic Case stated that HS2 Phase Two will provide benefits to the East Coast Main Line and Midland Main Line:
“In Phase Two it will relieve the Midland Main Line and the East Coast Main Line, as traffic transfers from these lines onto HS2. This released capacity will also improve commuter and regional services, reliability and resilience.”192
The Secretary of State said in his foreword to the Strategic Case that without HS2, the East Coast and Midland Main Lines, as well as the West Coast Main Line, are likely to be overwhelmed.193 The tables below show the figures for overcrowding on trains arriving into London on the East Coast Main Line and Midland Main Line.
191 Manchester United play their home fixtures at Old Trafford, located just outside Manchester. 192 Strategic Case, p 24 193 Strategic Case, p 1
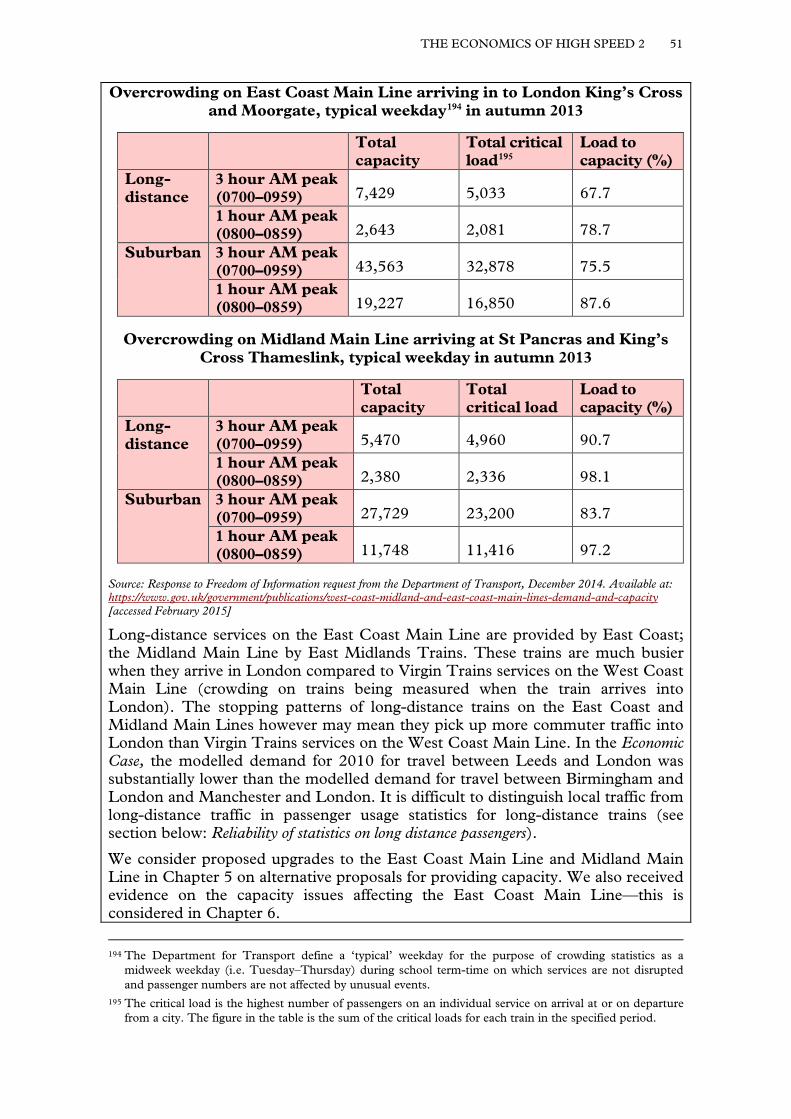
THE ECONOMICS OF HIGH SPEED 2 51
Overcrowding on East Coast Main Line arriving in to London King’s Cross and Moorgate, typical weekday194 in autumn 2013
Total capacity
Total critical load195
Load to capacity (%)
Long-distance
3 hour AM peak (0700–0959) 7,429 5,033 67.7 1 hour AM peak (0800–0859) 2,643 2,081 78.7
Suburban 3 hour AM peak (0700–0959) 43,563 32,878 75.5 1 hour AM peak (0800–0859) 19,227 16,850 87.6
Overcrowding on Midland Main Line arriving at St Pancras and King’s Cross Thameslink, typical weekday in autumn 2013
Total capacity
Total critical load
Load to capacity (%)
Long-distance
3 hour AM peak (0700–0959) 5,470 4,960 90.7 1 hour AM peak (0800–0859) 2,380 2,336 98.1
Suburban 3 hour AM peak (0700–0959) 27,729 23,200 83.7 1 hour AM peak (0800–0859) 11,748 11,416 97.2
Source: Response to Freedom of Information request from the Department of Transport, December 2014. Available at: https://www.gov.uk/government/publications/west-coast-midland-and-east-coast-main-lines-demand-and-capacity [accessed February 2015]
Long-distance services on the East Coast Main Line are provided by East Coast; the Midland Main Line by East Midlands Trains. These trains are much busier when they arrive in London compared to Virgin Trains services on the West Coast Main Line (crowding on trains being measured when the train arrives into London). The stopping patterns of long-distance trains on the East Coast and Midland Main Lines however may mean they pick up more commuter traffic into London than Virgin Trains services on the West Coast Main Line. In the Economic Case, the modelled demand for 2010 for travel between Leeds and London was substantially lower than the modelled demand for travel between Birmingham and London and Manchester and London. It is difficult to distinguish local traffic from long-distance traffic in passenger usage statistics for long-distance trains (see section below: Reliability of statistics on long distance passengers).
We consider proposed upgrades to the East Coast Main Line and Midland Main Line in Chapter 5 on alternative proposals for providing capacity. We also received evidence on the capacity issues affecting the East Coast Main Line—this is considered in Chapter 6.
194 The Department for Transport define a ‘typical’ weekday for the purpose of crowding statistics as a midweek weekday (i.e. Tuesday–Thursday) during school term-time on which services are not disrupted and passenger numbers are not affected by unusual events.
195 The critical load is the highest number of passengers on an individual service on arrival at or on departure from a city. The figure in the table is the sum of the critical loads for each train in the specified period.
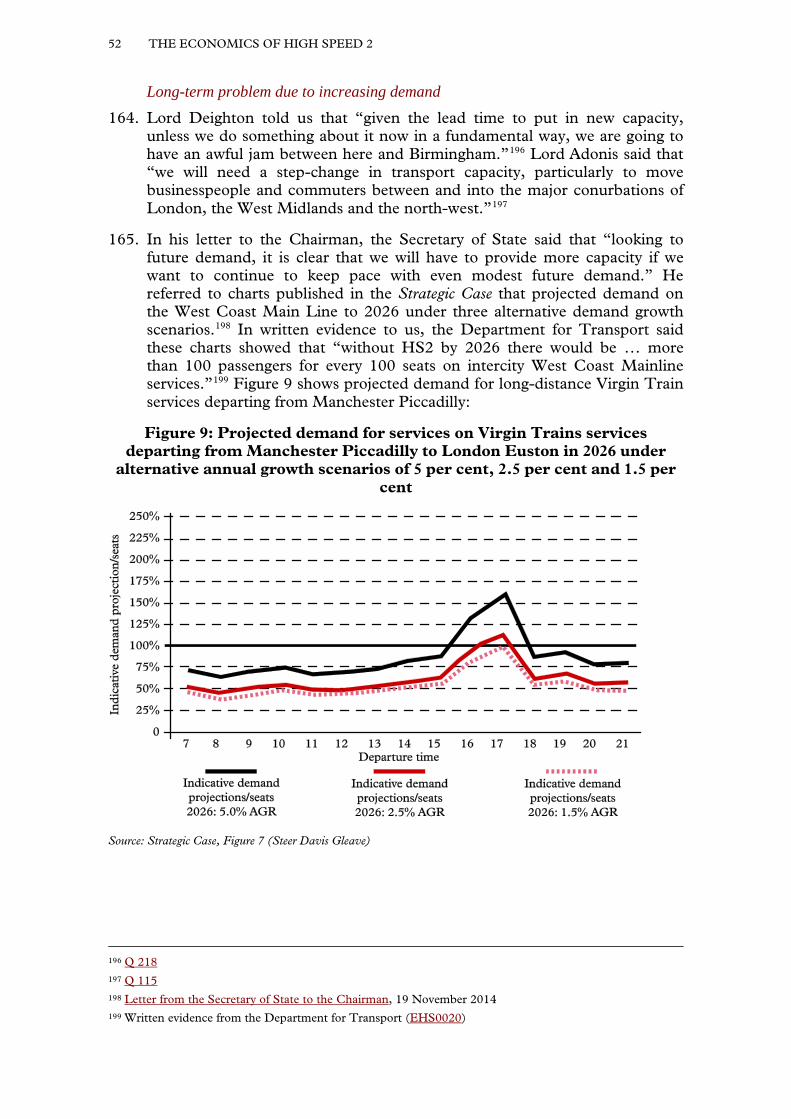
52 THE ECONOMICS OF HIGH SPEED 2
Long-term problem due to increasing demand 164. Lord Deighton told us that “given the lead time to put in new capacity,
unless we do something about it now in a fundamental way, we are going to have an awful jam between here and Birmingham.”196 Lord Adonis said that “we will need a step-change in transport capacity, particularly to move businesspeople and commuters between and into the major conurbations of London, the West Midlands and the north-west.”197
165. In his letter to the Chairman, the Secretary of State said that “looking to future demand, it is clear that we will have to provide more capacity if we want to continue to keep pace with even modest future demand.” He referred to charts published in the Strategic Case that projected demand on the West Coast Main Line to 2026 under three alternative demand growth scenarios.198 In written evidence to us, the Department for Transport said these charts showed that “without HS2 by 2026 there would be … more than 100 passengers for every 100 seats on intercity West Coast Mainline services.”199 Figure 9 shows projected demand for long-distance Virgin Train services departing from Manchester Piccadilly:
Figure 9: Projected demand for services on Virgin Trains services departing from Manchester Piccadilly to London Euston in 2026 under
alternative annual growth scenarios of 5 per cent, 2.5 per cent and 1.5 per cent
Source: Strategic Case, Figure 7 (Steer Davis Gleave)
196 Q 218 197 Q 115 198 Letter from the Secretary of State to the Chairman, 19 November 2014 199 Written evidence from the Department for Transport (EHS0020)
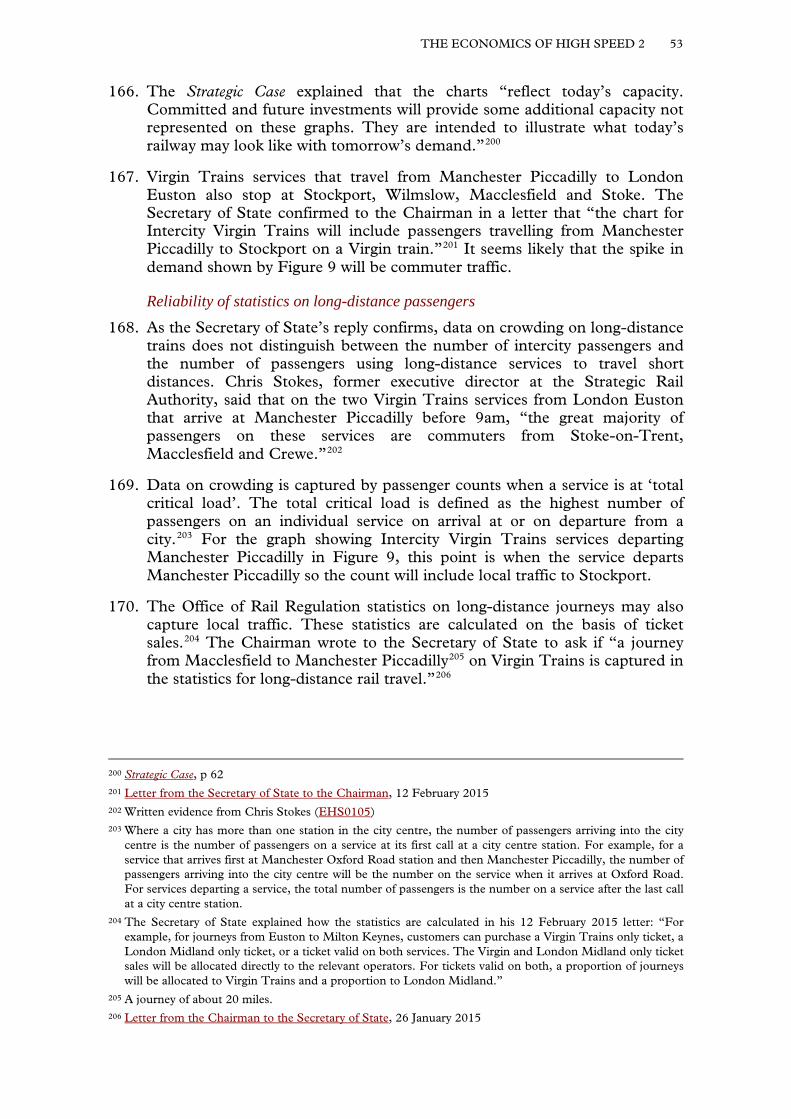
THE ECONOMICS OF HIGH SPEED 2 53
166. The Strategic Case explained that the charts “reflect today’s capacity. Committed and future investments will provide some additional capacity not represented on these graphs. They are intended to illustrate what today’s railway may look like with tomorrow’s demand.”200
167. Virgin Trains services that travel from Manchester Piccadilly to London Euston also stop at Stockport, Wilmslow, Macclesfield and Stoke. The Secretary of State confirmed to the Chairman in a letter that “the chart for Intercity Virgin Trains will include passengers travelling from Manchester Piccadilly to Stockport on a Virgin train.”201 It seems likely that the spike in demand shown by Figure 9 will be commuter traffic.
Reliability of statistics on long-distance passengers 168. As the Secretary of State’s reply confirms, data on crowding on long-distance
trains does not distinguish between the number of intercity passengers and the number of passengers using long-distance services to travel short distances. Chris Stokes, former executive director at the Strategic Rail Authority, said that on the two Virgin Trains services from London Euston that arrive at Manchester Piccadilly before 9am, “the great majority of passengers on these services are commuters from Stoke-on-Trent, Macclesfield and Crewe.”202
169. Data on crowding is captured by passenger counts when a service is at ‘total critical load’. The total critical load is defined as the highest number of passengers on an individual service on arrival at or on departure from a city.203 For the graph showing Intercity Virgin Trains services departing Manchester Piccadilly in Figure 9, this point is when the service departs Manchester Piccadilly so the count will include local traffic to Stockport.
170. The Office of Rail Regulation statistics on long-distance journeys may also capture local traffic. These statistics are calculated on the basis of ticket sales.204 The Chairman wrote to the Secretary of State to ask if “a journey from Macclesfield to Manchester Piccadilly205 on Virgin Trains is captured in the statistics for long-distance rail travel.”206
200 Strategic Case, p 62 201 Letter from the Secretary of State to the Chairman, 12 February 2015 202 Written evidence from Chris Stokes (EHS0105) 203 Where a city has more than one station in the city centre, the number of passengers arriving into the city
centre is the number of passengers on a service at its first call at a city centre station. For example, for a service that arrives first at Manchester Oxford Road station and then Manchester Piccadilly, the number of passengers arriving into the city centre will be the number on the service when it arrives at Oxford Road. For services departing a service, the total number of passengers is the number on a service after the last call at a city centre station.
204 The Secretary of State explained how the statistics are calculated in his 12 February 2015 letter: “For example, for journeys from Euston to Milton Keynes, customers can purchase a Virgin Trains only ticket, a London Midland only ticket, or a ticket valid on both services. The Virgin and London Midland only ticket sales will be allocated directly to the relevant operators. For tickets valid on both, a proportion of journeys will be allocated to Virgin Trains and a proportion to London Midland.”
205 A journey of about 20 miles. 206 Letter from the Chairman to the Secretary of State, 26 January 2015
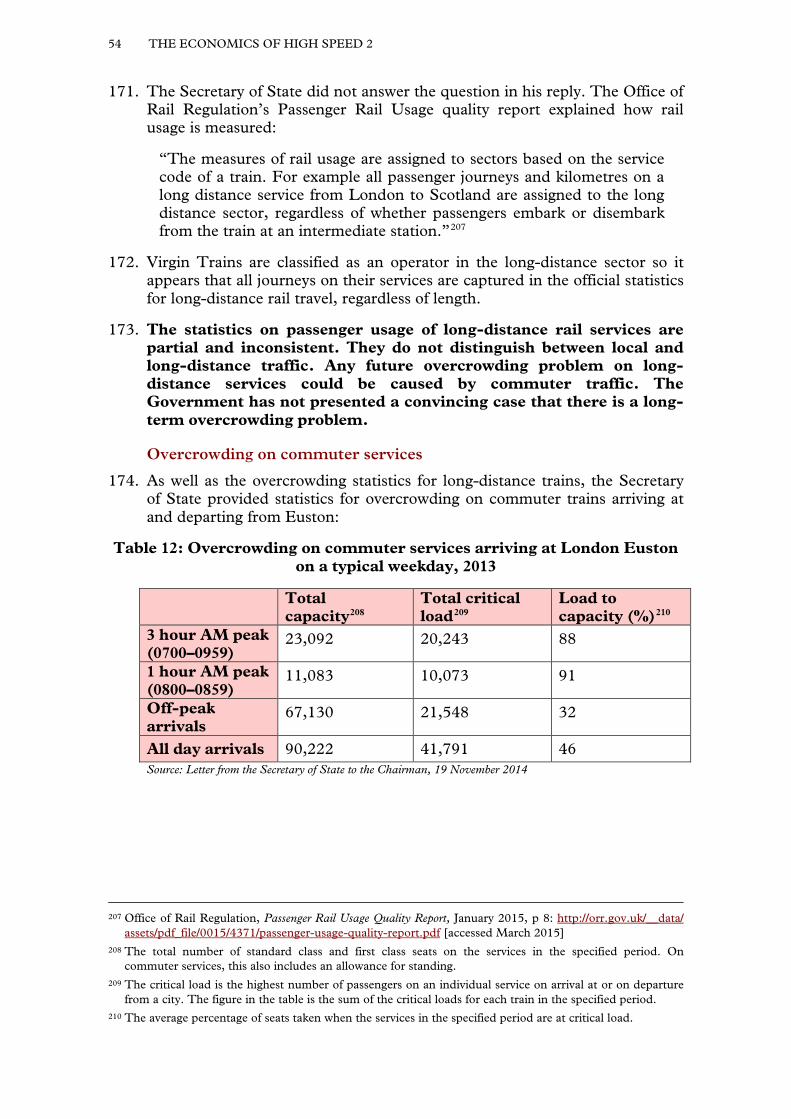
54 THE ECONOMICS OF HIGH SPEED 2
171. The Secretary of State did not answer the question in his reply. The Office of Rail Regulation’s Passenger Rail Usage quality report explained how rail usage is measured:
“The measures of rail usage are assigned to sectors based on the service code of a train. For example all passenger journeys and kilometres on a long distance service from London to Scotland are assigned to the long distance sector, regardless of whether passengers embark or disembark from the train at an intermediate station.”207
172. Virgin Trains are classified as an operator in the long-distance sector so it appears that all journeys on their services are captured in the official statistics for long-distance rail travel, regardless of length.
173. The statistics on passenger usage of long-distance rail services are partial and inconsistent. They do not distinguish between local and long-distance traffic. Any future overcrowding problem on long-distance services could be caused by commuter traffic. The Government has not presented a convincing case that there is a long-term overcrowding problem.
Overcrowding on commuter services
174. As well as the overcrowding statistics for long-distance trains, the Secretary of State provided statistics for overcrowding on commuter trains arriving at and departing from Euston:
Table 12: Overcrowding on commuter services arriving at London Euston on a typical weekday, 2013
Total capacity208
Total critical load209
Load to capacity (%)210
3 hour AM peak (0700–0959)
23,092 20,243 88
1 hour AM peak (0800–0859)
11,083 10,073 91
Off-peak arrivals
67,130 21,548 32
All day arrivals 90,222 41,791 46 Source: Letter from the Secretary of State to the Chairman, 19 November 2014
207 Office of Rail Regulation, Passenger Rail Usage Quality Report, January 2015, p 8: http://orr.gov.uk/__data/ assets/pdf_file/0015/4371/passenger-usage-quality-report.pdf [accessed March 2015]
208 The total number of standard class and first class seats on the services in the specified period. On commuter services, this also includes an allowance for standing.
209 The critical load is the highest number of passengers on an individual service on arrival at or on departure from a city. The figure in the table is the sum of the critical loads for each train in the specified period.
210 The average percentage of seats taken when the services in the specified period are at critical load.
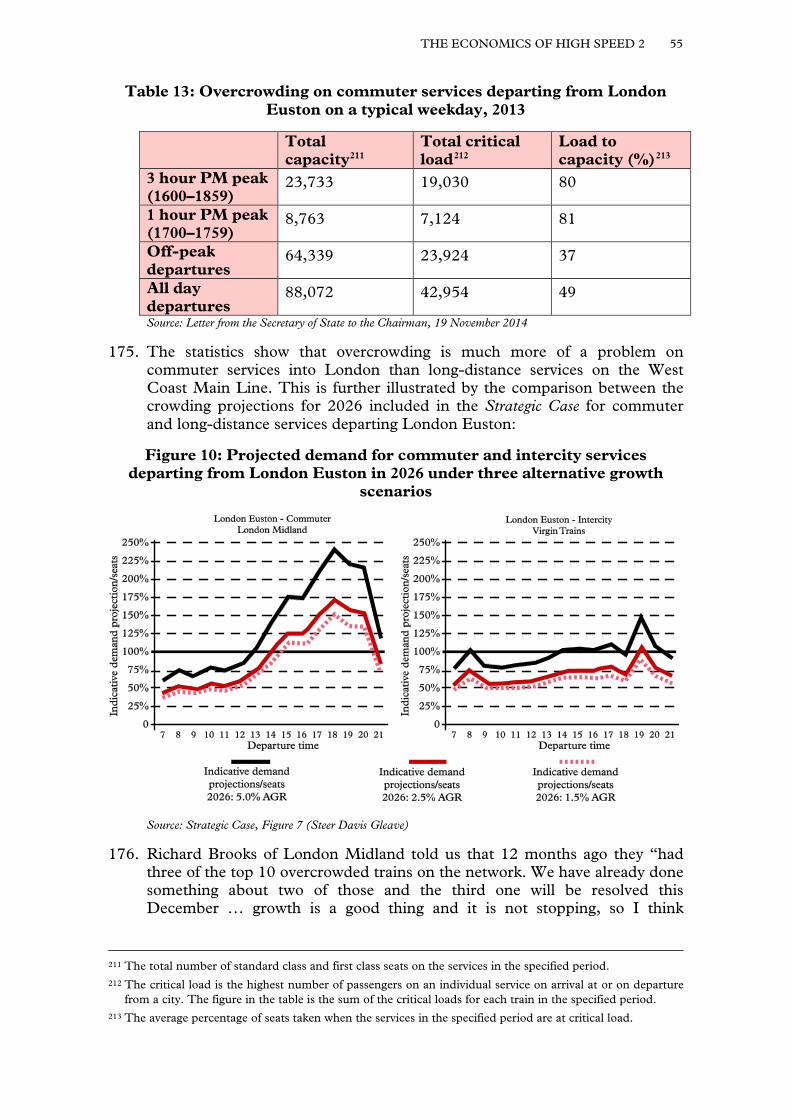
THE ECONOMICS OF HIGH SPEED 2 55
Table 13: Overcrowding on commuter services departing from London Euston on a typical weekday, 2013
Total capacity211
Total critical load212
Load to capacity (%)213
3 hour PM peak (1600–1859)
23,733 19,030 80
1 hour PM peak (1700–1759)
8,763 7,124 81
Off-peak departures
64,339 23,924 37
All day departures
88,072 42,954 49
Source: Letter from the Secretary of State to the Chairman, 19 November 2014
175. The statistics show that overcrowding is much more of a problem on commuter services into London than long-distance services on the West Coast Main Line. This is further illustrated by the comparison between the crowding projections for 2026 included in the Strategic Case for commuter and long-distance services departing London Euston:
Figure 10: Projected demand for commuter and intercity services departing from London Euston in 2026 under three alternative growth
scenarios
Source: Strategic Case, Figure 7 (Steer Davis Gleave)
176. Richard Brooks of London Midland told us that 12 months ago they “had three of the top 10 overcrowded trains on the network. We have already done something about two of those and the third one will be resolved this December … growth is a good thing and it is not stopping, so I think
211 The total number of standard class and first class seats on the services in the specified period. 212 The critical load is the highest number of passengers on an individual service on arrival at or on departure
from a city. The figure in the table is the sum of the critical loads for each train in the specified period. 213 The average percentage of seats taken when the services in the specified period are at critical load.
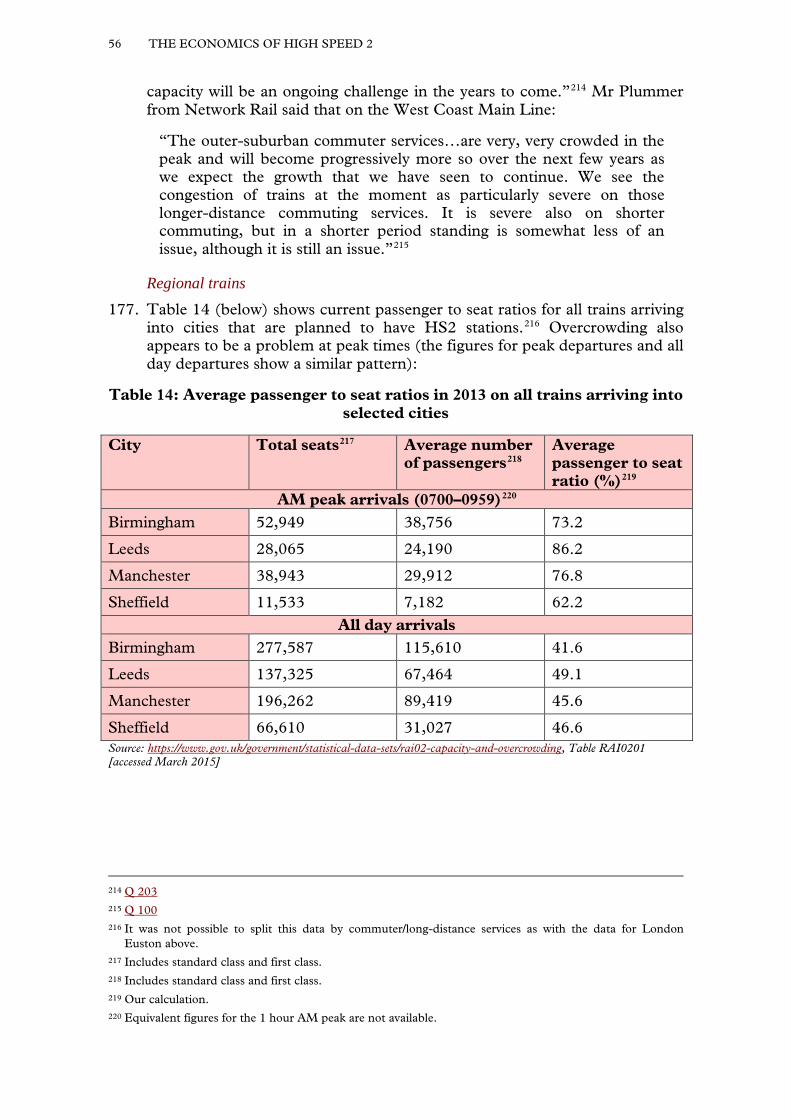
56 THE ECONOMICS OF HIGH SPEED 2
capacity will be an ongoing challenge in the years to come.”214 Mr Plummer from Network Rail said that on the West Coast Main Line:
“The outer-suburban commuter services…are very, very crowded in the peak and will become progressively more so over the next few years as we expect the growth that we have seen to continue. We see the congestion of trains at the moment as particularly severe on those longer-distance commuting services. It is severe also on shorter commuting, but in a shorter period standing is somewhat less of an issue, although it is still an issue.”215
Regional trains 177. Table 14 (below) shows current passenger to seat ratios for all trains arriving
into cities that are planned to have HS2 stations.216 Overcrowding also appears to be a problem at peak times (the figures for peak departures and all day departures show a similar pattern):
Table 14: Average passenger to seat ratios in 2013 on all trains arriving into selected cities
City Total seats217 Average number of passengers218
Average passenger to seat ratio (%)219
AM peak arrivals (0700–0959)220 Birmingham 52,949 38,756 73.2
Leeds 28,065 24,190 86.2
Manchester 38,943 29,912 76.8
Sheffield 11,533 7,182 62.2 All day arrivals
Birmingham 277,587 115,610 41.6
Leeds 137,325 67,464 49.1
Manchester 196,262 89,419 45.6
Sheffield 66,610 31,027 46.6 Source: https://www.gov.uk/government/statistical-data-sets/rai02-capacity-and-overcrowding, Table RAI0201 [accessed March 2015]
214 Q 203 215 Q 100 216 It was not possible to split this data by commuter/long-distance services as with the data for London
Euston above. 217 Includes standard class and first class. 218 Includes standard class and first class. 219 Our calculation. 220 Equivalent figures for the 1 hour AM peak are not available.
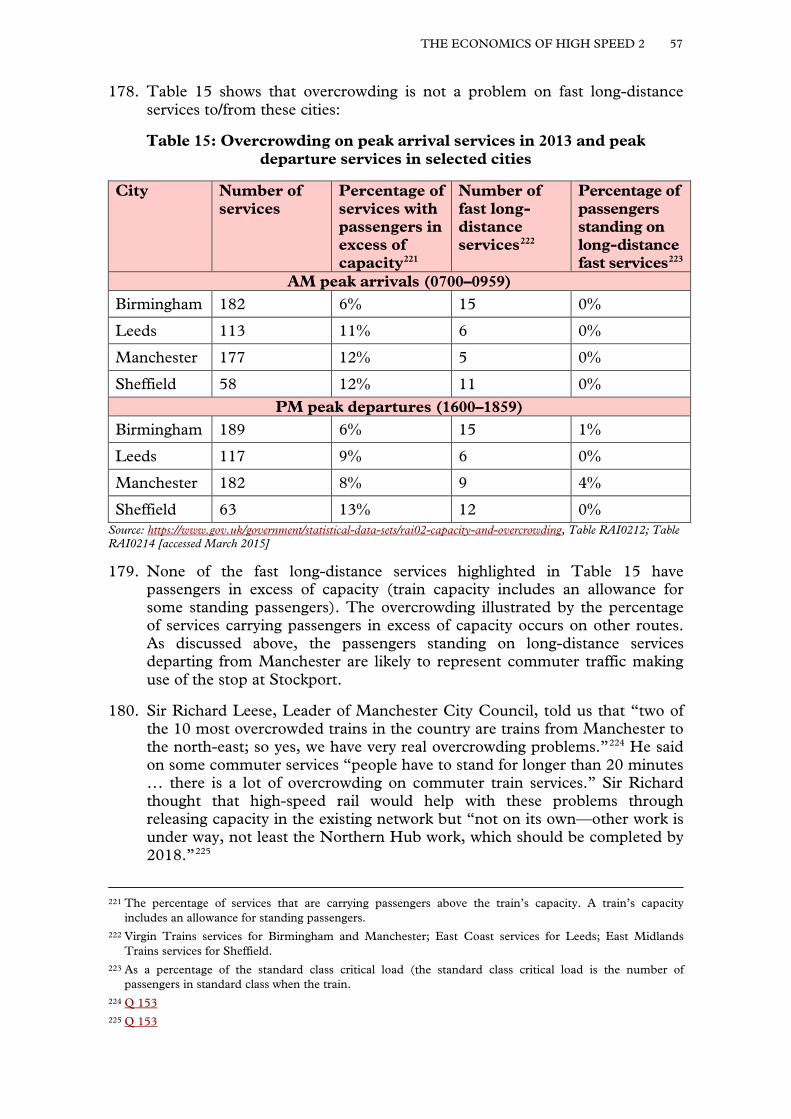
THE ECONOMICS OF HIGH SPEED 2 57
178. Table 15 shows that overcrowding is not a problem on fast long-distance services to/from these cities:
Table 15: Overcrowding on peak arrival services in 2013 and peak departure services in selected cities
City Number of services
Percentage of services with passengers in excess of capacity221
Number of fast long-distance services222
Percentage of passengers standing on long-distance fast services223
AM peak arrivals (0700–0959) Birmingham 182 6% 15 0%
Leeds 113 11% 6 0%
Manchester 177 12% 5 0%
Sheffield 58 12% 11 0% PM peak departures (1600–1859)
Birmingham 189 6% 15 1%
Leeds 117 9% 6 0%
Manchester 182 8% 9 4%
Sheffield 63 13% 12 0% Source: https://www.gov.uk/government/statistical-data-sets/rai02-capacity-and-overcrowding, Table RAI0212; Table RAI0214 [accessed March 2015]
179. None of the fast long-distance services highlighted in Table 15 have passengers in excess of capacity (train capacity includes an allowance for some standing passengers). The overcrowding illustrated by the percentage of services carrying passengers in excess of capacity occurs on other routes. As discussed above, the passengers standing on long-distance services departing from Manchester are likely to represent commuter traffic making use of the stop at Stockport.
180. Sir Richard Leese, Leader of Manchester City Council, told us that “two of the 10 most overcrowded trains in the country are trains from Manchester to the north-east; so yes, we have very real overcrowding problems.”224 He said on some commuter services “people have to stand for longer than 20 minutes … there is a lot of overcrowding on commuter train services.” Sir Richard thought that high-speed rail would help with these problems through releasing capacity in the existing network but “not on its own—other work is under way, not least the Northern Hub work, which should be completed by 2018.”225
221 The percentage of services that are carrying passengers above the train’s capacity. A train’s capacity includes an allowance for standing passengers.
222 Virgin Trains services for Birmingham and Manchester; East Coast services for Leeds; East Midlands Trains services for Sheffield.
223 As a percentage of the standard class critical load (the standard class critical load is the number of passengers in standard class when the train.
224 Q 153 225 Q 153
58 THE ECONOMICS OF HIGH SPEED 2
181. The main beneficiaries of the overcrowding relief provided by HS2 will be London commuters on the West Coast Main Line.
Space for commuter and freight train paths
182. The Strategic Case stated that “parts of the West Coast Main Line are full in terms of the number of trains, many of which are already full to overflowing at certain times of the day.”226 Lord Deighton said that “everybody agrees there is no room for more train paths.”227
Recent requests for train paths turned down 183. The Secretary of State said that the Department had taken a number of
measures to increase capacity on the West Coast Main Line but “train companies want to operate extra services and they are being prevented from offering those extra services because we do not have the train paths available.”228 Mr Scott told us that Virgin Trains have negotiated for 24 months to allow the introduction of additional services to Blackpool and Shrewsbury, although he noted that, “it is not, crucially, additional paths into London. It is an extension of two existing services to the north.”229 Mr Plummer of Network Rail said that “they ideally wanted new paths the full length of the corridor, but we found a compromise, and we will continue to find ways of making a compromise on some of that.”230
‘Step change’ required 184. The Strategic Case argued that “without a step change in capacity our main
north-south railways will be overwhelmed.”231 Network Rail wrote that the first phase of HS2 will “relieve an acute capacity problem on the West Coast Main Line … for which there is otherwise no viable long-term solution.”232 Mr Plummer argued that “you cannot sensibly keep incrementalising your way forward with regard to the corridor from London to Birmingham to Manchester and beyond into the east as well. Therefore, we needed to build a new line.”233 He explained the benefits that HS2 would bring:
“Not only do you create additional capacity with the new line, you can put your faster services on that line, but by taking those trains off the West Coast Main Line, you get an extra benefit, because the trains are then running at more consistent speeds. You get the extra capacity on the new line and more efficient use of capacity on the existing line, so that is a double benefit.”234
226 Strategic Case, p 11 227 Q 218 228 Q 218 229 Q 209 230 Q 105 231 Strategic Case, p 45 232 Written evidence from Network Rail (EHS0072) 233 Q 103 234 Q 103
THE ECONOMICS OF HIGH SPEED 2 59
Arguments that more train paths could be added 185. Some witnesses argued that train paths could be added. Mr Rukin of Stop
HS2 said that:
“HS2 Ltd and the department have consistently ignored other ways to increase capacity, including the ones that are planned, such as bringing in ERTMS [the European Railway Traffic Management System], which is automatic signalling, so you will be able to increase the number of trains and potentially the speed of the trains on the existing tracks.”235
186. Mr Plummer said that “We will always be able to do more things to eke out additional capacity in relieving constraints somewhere on the network, so I do not deny that possibility.” He said that Network Rail were “challenging ourselves to look at fundamentally different ways of re-signalling capacity on the network as a whole and the capacity that that could unlock” but he thought that it was “just putting off the inevitable and that we will need to do something much more fundamental at some stage.”236
187. We accept that the West Coast Main Line is nearing full capacity in terms of train paths. Future technological innovations could however release capacity.
188. The Government has not been able to present the public with all the relevant information about how busy train services are due to confidentiality agreements with the train operators. We have not seen convincing evidence that the nature of the capacity problem warrants building HS2.
235 Q 80 236 Q 105
60 THE ECONOMICS OF HIGH SPEED 2
Chapter 4: Conclusions and recommendations
189. Overcrowding on long-distance services on the West Coast Main Line today appears largely to be a problem on Friday evenings and weekend services. (Paragraph 163)
190. None of the fast long-distance services highlighted in Table 15 have passengers in excess of capacity (train capacity includes an allowance for some standing passengers). The overcrowding illustrated by the percentage of services carrying passengers in excess of capacity occurs on other routes. As discussed above, the passengers standing on long-distance services departing from Manchester are likely to represent commuter traffic making use of the stop at Stockport. (Paragraph 179)
191. The main beneficiaries of the overcrowding relief provided by HS2 will be London commuters on the West Coast Main Line. (Paragraph 181)
192. We accept that the West Coast Main Line is nearing full capacity in terms of train paths. Future technological innovations could however release capacity. (Paragraph 187)
193. The Government has not been able to present the public with all the relevant information about how busy train services are due to confidentiality agreements with the train operators. We have not seen convincing evidence that the nature of the capacity problem warrants building HS2. (Paragraph 188)
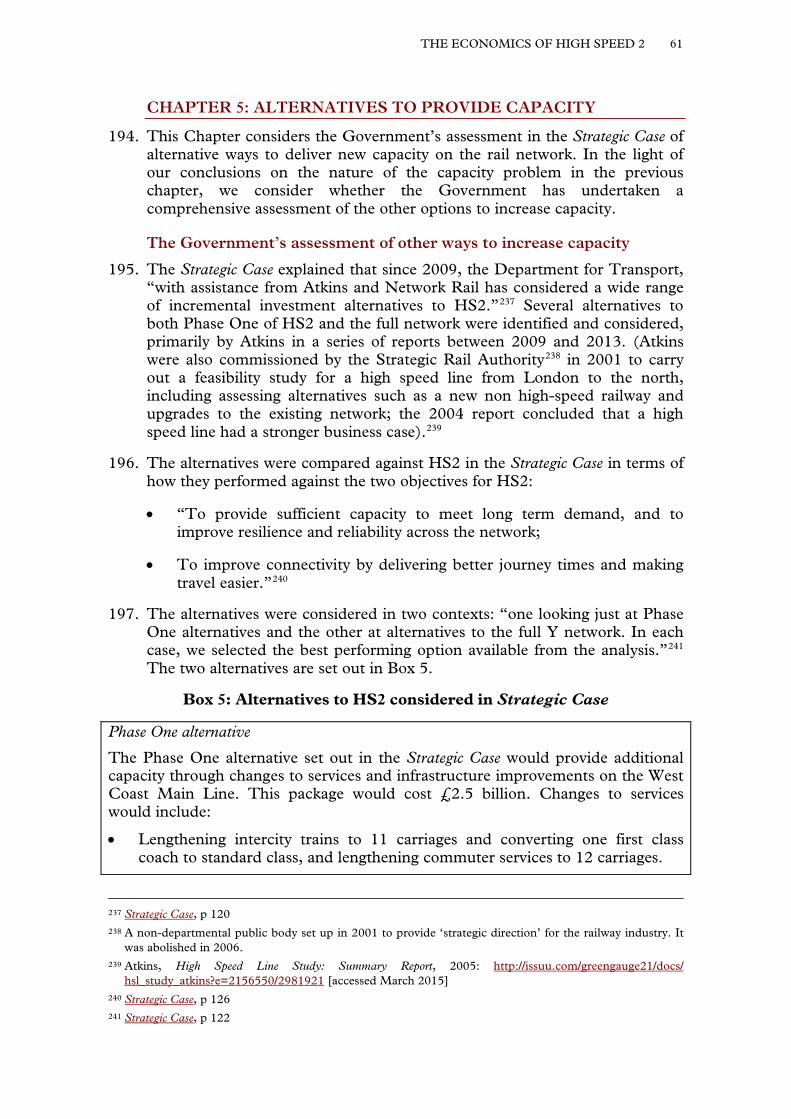
THE ECONOMICS OF HIGH SPEED 2 61
CHAPTER 5: ALTERNATIVES TO PROVIDE CAPACITY
194. This Chapter considers the Government’s assessment in the Strategic Case of alternative ways to deliver new capacity on the rail network. In the light of our conclusions on the nature of the capacity problem in the previous chapter, we consider whether the Government has undertaken a comprehensive assessment of the other options to increase capacity.
The Government’s assessment of other ways to increase capacity
195. The Strategic Case explained that since 2009, the Department for Transport, “with assistance from Atkins and Network Rail has considered a wide range of incremental investment alternatives to HS2.”237 Several alternatives to both Phase One of HS2 and the full network were identified and considered, primarily by Atkins in a series of reports between 2009 and 2013. (Atkins were also commissioned by the Strategic Rail Authority238 in 2001 to carry out a feasibility study for a high speed line from London to the north, including assessing alternatives such as a new non high-speed railway and upgrades to the existing network; the 2004 report concluded that a high speed line had a stronger business case).239
196. The alternatives were compared against HS2 in the Strategic Case in terms of how they performed against the two objectives for HS2:
• “To provide sufficient capacity to meet long term demand, and to improve resilience and reliability across the network;
• To improve connectivity by delivering better journey times and making travel easier.”240
197. The alternatives were considered in two contexts: “one looking just at Phase One alternatives and the other at alternatives to the full Y network. In each case, we selected the best performing option available from the analysis.”241 The two alternatives are set out in Box 5.
Box 5: Alternatives to HS2 considered in Strategic Case
Phase One alternative
The Phase One alternative set out in the Strategic Case would provide additional capacity through changes to services and infrastructure improvements on the West Coast Main Line. This package would cost £2.5 billion. Changes to services would include:
• Lengthening intercity trains to 11 carriages and converting one first class coach to standard class, and lengthening commuter services to 12 carriages.
237 Strategic Case, p 120 238 A non-departmental public body set up in 2001 to provide ‘strategic direction’ for the railway industry. It
was abolished in 2006. 239 Atkins, High Speed Line Study: Summary Report, 2005: http://issuu.com/greengauge21/docs/
hsl_study_atkins?e=2156550/2981921 [accessed March 2015] 240 Strategic Case, p 126 241 Strategic Case, p 122
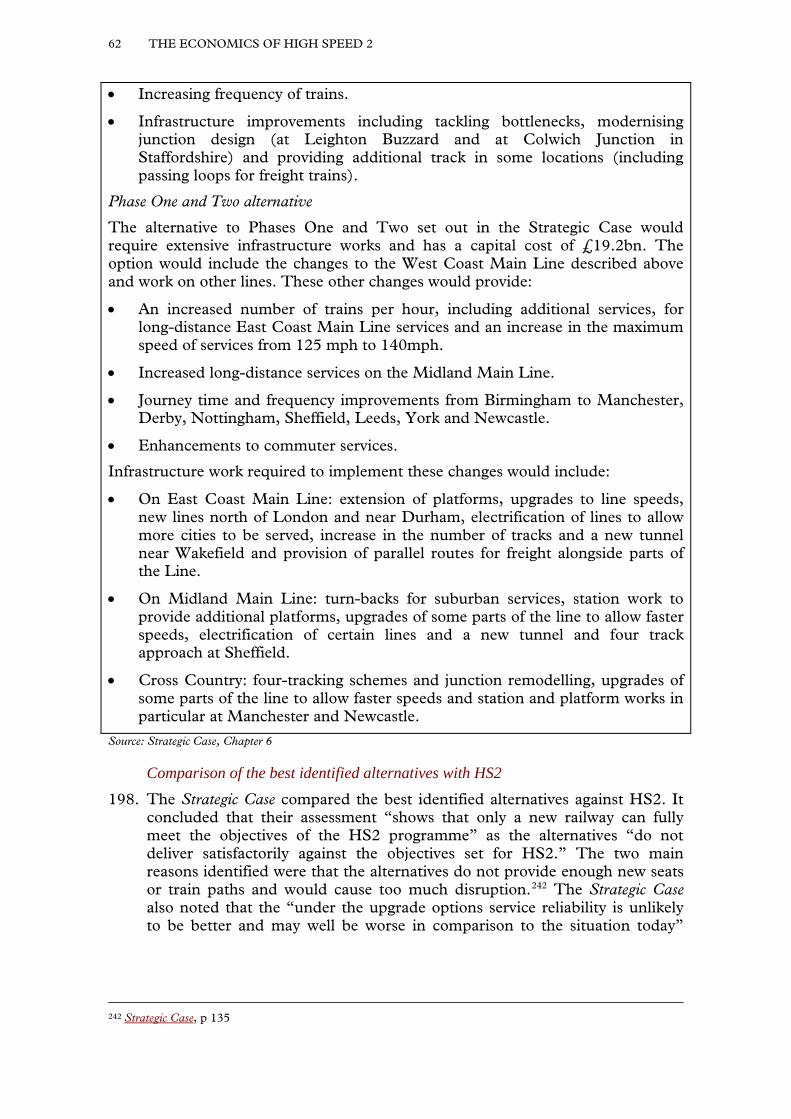
62 THE ECONOMICS OF HIGH SPEED 2
• Increasing frequency of trains.
• Infrastructure improvements including tackling bottlenecks, modernising junction design (at Leighton Buzzard and at Colwich Junction in Staffordshire) and providing additional track in some locations (including passing loops for freight trains).
Phase One and Two alternative
The alternative to Phases One and Two set out in the Strategic Case would require extensive infrastructure works and has a capital cost of £19.2bn. The option would include the changes to the West Coast Main Line described above and work on other lines. These other changes would provide:
• An increased number of trains per hour, including additional services, for long-distance East Coast Main Line services and an increase in the maximum speed of services from 125 mph to 140mph.
• Increased long-distance services on the Midland Main Line.
• Journey time and frequency improvements from Birmingham to Manchester, Derby, Nottingham, Sheffield, Leeds, York and Newcastle.
• Enhancements to commuter services.
Infrastructure work required to implement these changes would include:
• On East Coast Main Line: extension of platforms, upgrades to line speeds, new lines north of London and near Durham, electrification of lines to allow more cities to be served, increase in the number of tracks and a new tunnel near Wakefield and provision of parallel routes for freight alongside parts of the Line.
• On Midland Main Line: turn-backs for suburban services, station work to provide additional platforms, upgrades of some parts of the line to allow faster speeds, electrification of certain lines and a new tunnel and four track approach at Sheffield.
• Cross Country: four-tracking schemes and junction remodelling, upgrades of some parts of the line to allow faster speeds and station and platform works in particular at Manchester and Newcastle.
Source: Strategic Case, Chapter 6
Comparison of the best identified alternatives with HS2 198. The Strategic Case compared the best identified alternatives against HS2. It
concluded that their assessment “shows that only a new railway can fully meet the objectives of the HS2 programme” as the alternatives “do not deliver satisfactorily against the objectives set for HS2.” The two main reasons identified were that the alternatives do not provide enough new seats or train paths and would cause too much disruption.242 The Strategic Case also noted that the “under the upgrade options service reliability is unlikely to be better and may well be worse in comparison to the situation today”
242 Strategic Case, p 135
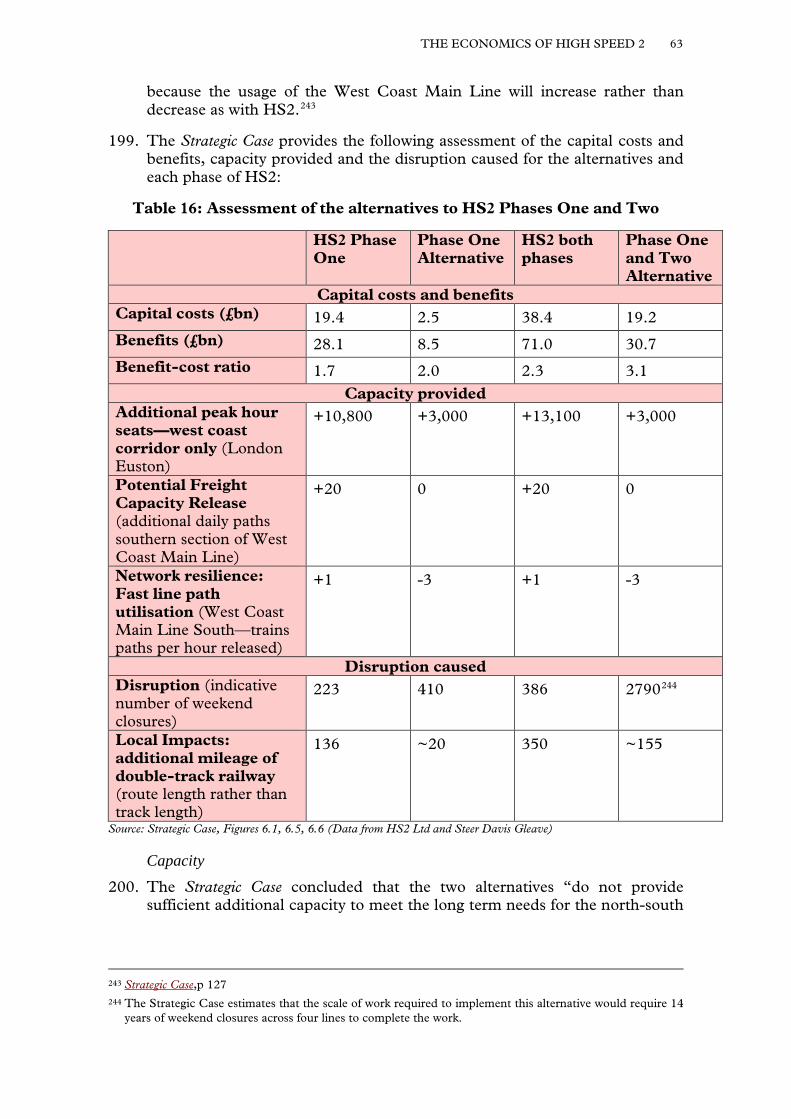
THE ECONOMICS OF HIGH SPEED 2 63
because the usage of the West Coast Main Line will increase rather than decrease as with HS2.243
199. The Strategic Case provides the following assessment of the capital costs and benefits, capacity provided and the disruption caused for the alternatives and each phase of HS2:
Table 16: Assessment of the alternatives to HS2 Phases One and Two
HS2 Phase One
Phase One Alternative
HS2 both phases
Phase One and Two Alternative
Capital costs and benefits Capital costs (£bn) 19.4 2.5 38.4 19.2 Benefits (£bn) 28.1 8.5 71.0 30.7 Benefit-cost ratio 1.7 2.0 2.3 3.1
Capacity provided Additional peak hour seats—west coast corridor only (London Euston)
+10,800 +3,000 +13,100 +3,000
Potential Freight Capacity Release (additional daily paths southern section of West Coast Main Line)
+20 0 +20 0
Network resilience: Fast line path utilisation (West Coast Main Line South—trains paths per hour released)
+1 -3 +1 -3
Disruption caused Disruption (indicative number of weekend closures)
223 410 386 2790244
Local Impacts: additional mileage of double-track railway (route length rather than track length)
136 ~20 350 ~155
Source: Strategic Case, Figures 6.1, 6.5, 6.6 (Data from HS2 Ltd and Steer Davis Gleave)
Capacity 200. The Strategic Case concluded that the two alternatives “do not provide
sufficient additional capacity to meet the long term needs for the north-south
243 Strategic Case,p 127 244 The Strategic Case estimates that the scale of work required to implement this alternative would require 14
years of weekend closures across four lines to complete the work.
64 THE ECONOMICS OF HIGH SPEED 2
railways” and “do not provide significant additional released capacity for commuters and freight on the West Coast Main Line.”245
201. The Strategic Case illustrated when today’s level of overcrowding would be reached on commuter trains under the Phase One alternative:
Figure 11: Commuter demand and route capacity achievable through upgrading the existing West Coast Main Line
Source: Strategic Case, Figure 3.2 (Steer Davis Gleave)
202. In terms of long-distance trains, the Strategic Case said that assuming 5 per cent annual growth in peak demand, by 2028 there would be as many passengers as seats across the evening peak hour, “which in practice means serious levels of overcrowding.”246
203. The Strategic Case also considered further upgrade measures that could be carried out:
“The evidence from earlier work on this type of alternative showed a pattern of diminishing returns … On the West Coast Main Line itself, if the upgrades assessed here were carried out, the next capacity increment would be likely to require a radical step change such as the provision of further tracks over the London–West Midlands section. The cost of that would be many billions of pounds … it is clear that a high speed solution offers best value for money and that the best return on tax-payer investment is likely to lie with HS2.”247
204. As the Department does not provide an estimate of the cost of building further tracks over the London-West Midlands section, it is not clear that HS2 offers better value for money than carrying out that work after the Phase One and Phase Two Alternatives (estimated cost £19.4 billion).
245 Strategic Case, p 135 246 Strategic Case, p 70 247 Strategic Case, p 134
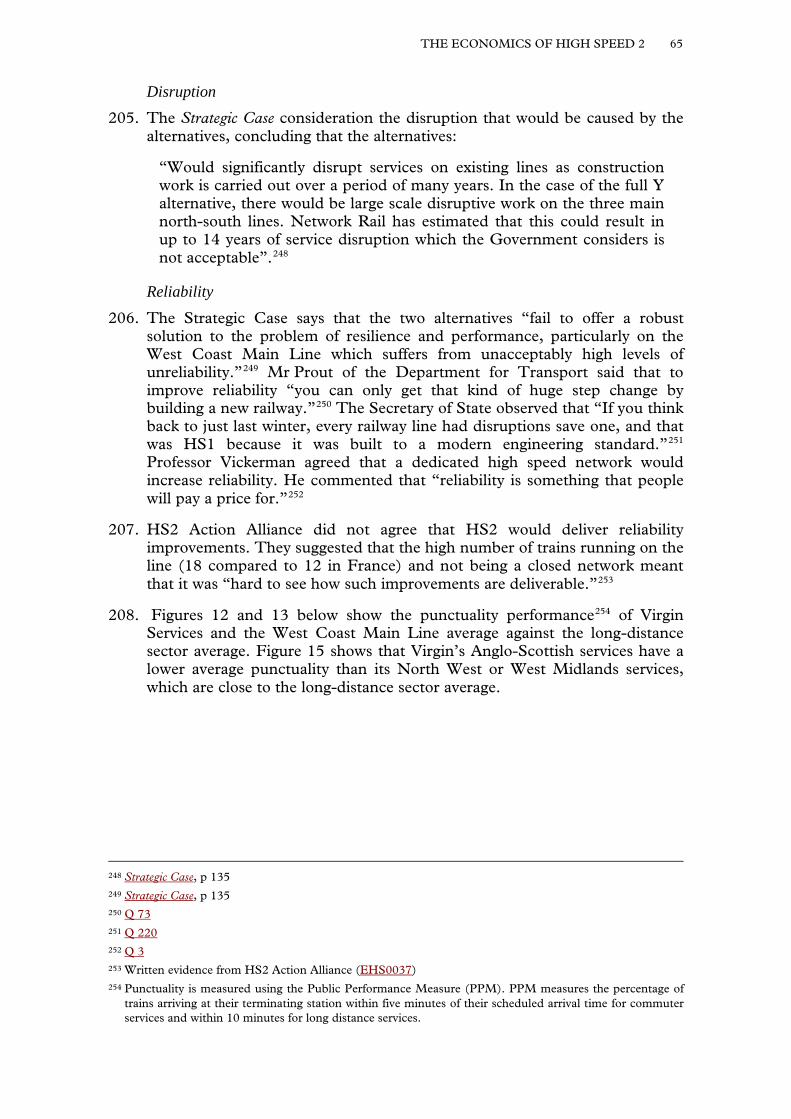
THE ECONOMICS OF HIGH SPEED 2 65
Disruption 205. The Strategic Case consideration the disruption that would be caused by the
alternatives, concluding that the alternatives:
“Would significantly disrupt services on existing lines as construction work is carried out over a period of many years. In the case of the full Y alternative, there would be large scale disruptive work on the three main north-south lines. Network Rail has estimated that this could result in up to 14 years of service disruption which the Government considers is not acceptable”.248
Reliability 206. The Strategic Case says that the two alternatives “fail to offer a robust
solution to the problem of resilience and performance, particularly on the West Coast Main Line which suffers from unacceptably high levels of unreliability.”249 Mr Prout of the Department for Transport said that to improve reliability “you can only get that kind of huge step change by building a new railway.”250 The Secretary of State observed that “If you think back to just last winter, every railway line had disruptions save one, and that was HS1 because it was built to a modern engineering standard.”251 Professor Vickerman agreed that a dedicated high speed network would increase reliability. He commented that “reliability is something that people will pay a price for.”252
207. HS2 Action Alliance did not agree that HS2 would deliver reliability improvements. They suggested that the high number of trains running on the line (18 compared to 12 in France) and not being a closed network meant that it was “hard to see how such improvements are deliverable.”253
208. Figures 12 and 13 below show the punctuality performance254 of Virgin Services and the West Coast Main Line average against the long-distance sector average. Figure 15 shows that Virgin’s Anglo-Scottish services have a lower average punctuality than its North West or West Midlands services, which are close to the long-distance sector average.
248 Strategic Case, p 135 249 Strategic Case, p 135 250 Q 73 251 Q 220 252 Q 3 253 Written evidence from HS2 Action Alliance (EHS0037) 254 Punctuality is measured using the Public Performance Measure (PPM). PPM measures the percentage of
trains arriving at their terminating station within five minutes of their scheduled arrival time for commuter services and within 10 minutes for long distance services.
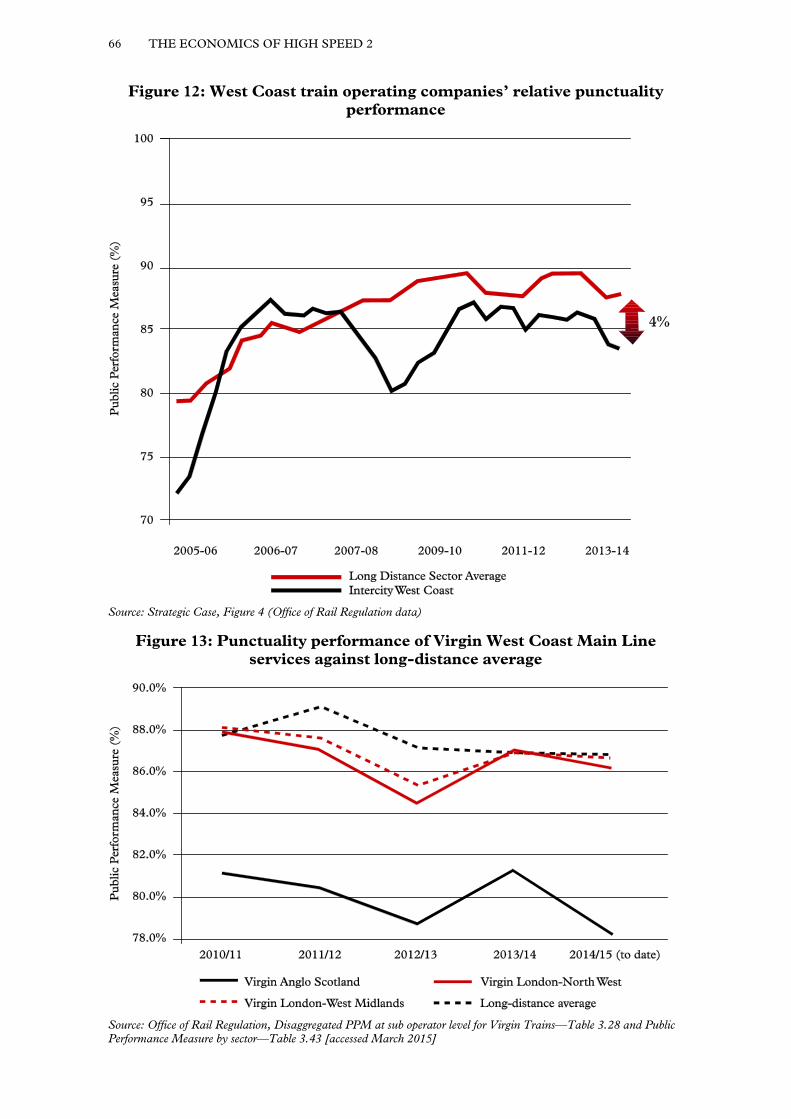
66 THE ECONOMICS OF HIGH SPEED 2
Figure 12: West Coast train operating companies’ relative punctuality performance
Source: Strategic Case, Figure 4 (Office of Rail Regulation data)
Figure 13: Punctuality performance of Virgin West Coast Main Line services against long-distance average
Source: Office of Rail Regulation, Disaggregated PPM at sub operator level for Virgin Trains—Table 3.28 and Public Performance Measure by sector—Table 3.43 [accessed March 2015]
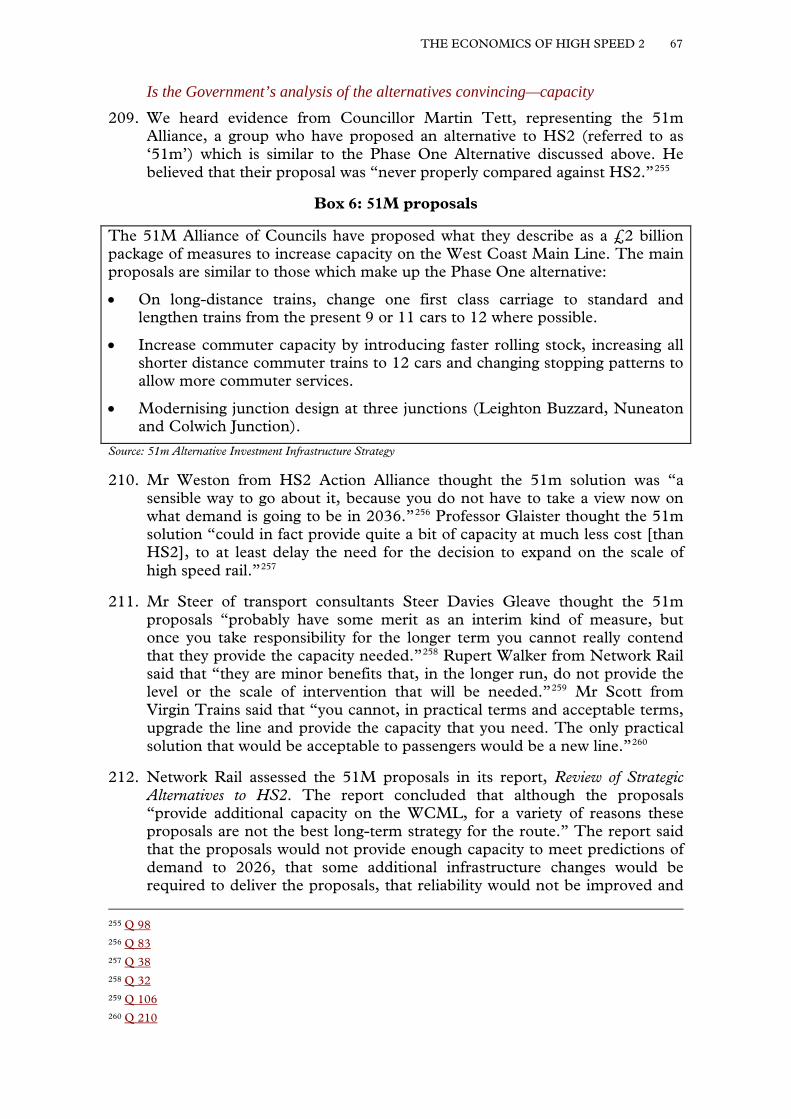
THE ECONOMICS OF HIGH SPEED 2 67
Is the Government’s analysis of the alternatives convincing—capacity 209. We heard evidence from Councillor Martin Tett, representing the 51m
Alliance, a group who have proposed an alternative to HS2 (referred to as ‘51m’) which is similar to the Phase One Alternative discussed above. He believed that their proposal was “never properly compared against HS2.”255
Box 6: 51M proposals
The 51M Alliance of Councils have proposed what they describe as a £2 billion package of measures to increase capacity on the West Coast Main Line. The main proposals are similar to those which make up the Phase One alternative:
• On long-distance trains, change one first class carriage to standard and lengthen trains from the present 9 or 11 cars to 12 where possible.
• Increase commuter capacity by introducing faster rolling stock, increasing all shorter distance commuter trains to 12 cars and changing stopping patterns to allow more commuter services.
• Modernising junction design at three junctions (Leighton Buzzard, Nuneaton and Colwich Junction).
Source: 51m Alternative Investment Infrastructure Strategy
210. Mr Weston from HS2 Action Alliance thought the 51m solution was “a sensible way to go about it, because you do not have to take a view now on what demand is going to be in 2036.”256 Professor Glaister thought the 51m solution “could in fact provide quite a bit of capacity at much less cost [than HS2], to at least delay the need for the decision to expand on the scale of high speed rail.”257
211. Mr Steer of transport consultants Steer Davies Gleave thought the 51m proposals “probably have some merit as an interim kind of measure, but once you take responsibility for the longer term you cannot really contend that they provide the capacity needed.”258 Rupert Walker from Network Rail said that “they are minor benefits that, in the longer run, do not provide the level or the scale of intervention that will be needed.”259 Mr Scott from Virgin Trains said that “you cannot, in practical terms and acceptable terms, upgrade the line and provide the capacity that you need. The only practical solution that would be acceptable to passengers would be a new line.”260
212. Network Rail assessed the 51M proposals in its report, Review of Strategic Alternatives to HS2. The report concluded that although the proposals “provide additional capacity on the WCML, for a variety of reasons these proposals are not the best long-term strategy for the route.” The report said that the proposals would not provide enough capacity to meet predictions of demand to 2026, that some additional infrastructure changes would be required to deliver the proposals, that reliability would not be improved and
255 Q 98 256 Q 83 257 Q 38 258 Q 32 259 Q 106 260 Q 210
68 THE ECONOMICS OF HIGH SPEED 2
that it was “unacceptable to undertake a programme of works that would cause this level of disruption on the route to deliver a service that would not solve overcrowding at the southern end of the route.”261
Is the Government’s analysis of the alternatives convincing—disruption 213. Mr Scott also thought that improvements to the existing railway would be
too disruptive: “a patch-and-mend approach on the West Coast Main Line would just result in an unacceptable level of disruption, which is why we believe that the only solution is a new line.”262 Dr Matthew Niblett, of the Transport Studies Unit, University of Oxford, said that “studies have shown that the disruption to the national rail network of such upgrades would be such that the cost to travellers would be much higher than is commonly imagined.”263
214. We considered in Chapter 2 whether the cost of disruption had been factored into the overall cost of HS2.
Other alternative solutions to the capacity problem
Ticket pricing 215. As discussed in Chapter 3, the current capacity problem manifests itself on
busy commuter trains in the morning and afternoon peaks and long-distance trains on Friday evenings and weekends. We heard evidence that overcrowding could be addressed by using ticket pricing to encourage people to travel at less busy times. Professor Glaister said that “if you are willing to use a different pricing policy to spread the load to the times when there are empty seats, you could, at least for a number of years, solve this problem without spending £30 billion on a brand new railway.”264
216. New services have been introduced between London and Kent which run on HS1. These services are faster but more expensive than the slower services which run between the same locations on a different route. Mr Prout told us that the Department would publish an interim report on “the impact of HS1” which would be “largely built around cost-benefit ratios”. He was unable to provide a date for the publication of this report.265 The Government should use the opportunity of this review to consider how the higher prices for faster services from London to Kent on HS1 have affected demand for these services, to apply the lessons to HS2.
Commuter peaks 217. Dr Wellings thought that increasing fares during peak travel could “spread
the load and make better use of existing capacity.”266 Mr Plummer of Network Rail said he supported the principle of improved use of pricing to
261 Network Rail, Review of Strategic Alternatives to High Speed 2, November 2011, pp 17–18: https://www.gov.uk/government/uploads/system/uploads/attachment_data/file/28572/hs2-review-of-strategic-alternatives.pdf [accessed February 2015]
262 Q 210 263 Q 6 264 Q 44 265 Q 230 266 Q 89
THE ECONOMICS OF HIGH SPEED 2 69
send price signals, “but the scale of shift that you would be looking to achieve, I suggest, would be beyond what is possible in order to change the business case for the interventions that we are talking about.”267
218. The Strategic Case stated that the Government had “explicitly ruled out any ‘super peak’ pricing.” It explained that to use fares to manage demand would require very large price increases during the busiest times. Evidence was cited that to “produce a 3% switch in travel away from the morning peak hour would need a 40% fare differential. To suppress demand across the network would therefore involve very significant and highly undesirable price rises.”268 Mr Scott agreed:
“You could increase the prices of the very busy services, but what you will be talking about there is pricing people off the railways in some cases, which is not what we want to do. We do not want this to be a railway for the elite. It should be a railway for everyone.”269
219. The Chairman wrote to the Secretary of State to ask whether train operators have the flexibility to implement dynamic pricing on trains as used by airline operators. The Secretary of State confirmed that operators were permitted to use dynamic pricing and Advance tickets offered by train companies used “yield management systems.” The sales of Advance tickets has grown from 8% of revenue in 2007/08 to 14% in 2012/13. The Secretary of State explained that the price of certain types of rail fares, including commuter fares, certain season tickets, day singles and returns were regulated by setting “the average maximum amount that the specified ‘basket’ of regulated fares can increase year-on-year for each franchise.”270
Friday evenings 220. Professor Glaister said “you may have a few trains at 7 o’clock in the evening
that are crowded, and that crowding is exacerbated by the pricing policy that is being used at the moment.”271 The previous Chapter noted how the first off-peak Virgin Trains on the West Coast Main Line are often very overcrowded but afternoon peak services are only 50 per cent full. Professor Nash thought that the Friday evening problem “could be eased to a degree by a more sensible approach to fares regulation.”272 Table 10 (Chapter 4, above) showed peak and off-peak fares on Virgin services from London Euston to Manchester Piccadilly on a weekday evening. A return journey travelling outward on a peak-time train costs substantially more than a return journey travelling outward on an off-peak time train.
267 Q 101 268 Strategic Case, p 66 269 Q 205 270 Letter from the Secretary of State to the Chairman, 12 February 2015 271 Q 44 272 Q 101
70 THE ECONOMICS OF HIGH SPEED 2
Alternative proposals for a new railway
High Speed UK 221. High Speed UK (HSUK) submitted evidence to us outlining their proposal
for a new four-track high-speed railway that would run along the M1 corridor from London to Scotland via Leeds with spurs from the “spine” to Birmingham, Manchester and Glasgow. The proponents of HSUK told us that it would deliver “10 times better” connectivity than HS2, improve 488 out of 528 journeys possible on the UK railway network and “double the capacity of HS2 on the core London ‘stem’” for a lower capital cost than HS2.273
222. Steven Leigh of the Mid-Yorkshire Chamber of Commerce and Kings Bromley Stop HS2 Action Group both supported HSUK in evidence to us, arguing that it would benefit more towns and cities than HS2 proposals at a lower cost.274 Lord Adonis, however, suggested that the proposed route up the M1 would be more controversial than HS2: “The idea that building next to existing transport corridors—which would also include having to significantly widen transport routes through major towns and cities—would be less controversial than building HS2 is for the birds.” He argued that such a route would be more expensive than HS2.275
223. We asked the Government whether they had made an assessment of HSUK’s proposals. Mr Prout told us that “The main elements of the central railway proposal were looked at in the 2013 alternative study for the East Coast Main Line.” He argued that “the reinstatement of the central railway is by no means as simple as HSUK would have us believe.”276
A new conventional speed railway 224. In Chapter 2 we considered the suggestion that the maximum speed of 400
kilometres per hour (250 mph) added significantly to the cost of HS2. In addition to cost benefits, some witnesses suggested that building for a lower maximum speed would have enabled different design choices that would have greater benefits than HS2.
225. Chiltern Ridges Action Group said that “If such speed constraints were dropped, alternatives, such as [51M], could provide the required capacity inflicting far less damage on our environment and at far less cost to the taxpayer.”277 Chris Belk, a private individual, said that “speed priority dominance has been replaced by the need for increased capacity and the generally accepted need to shrink the ‘N/S Divide’—but the opportunity to reroute Phase One to remove the cost and damage legacy of speed optimisation at all costs has so far been ignored.”278
273 Written evidence from High Speed UK (EHS0077) 274 Q 134 (Steven Leigh) and Written evidence from Kings Bromley Stop HS2 Action Group (EHS0004) 275 Q 115 276 Q 221 277 Written evidence from Chiltern Ridges Action Group (EHS0059) 278 Written evidence from Chris Belk (EHS0030)
THE ECONOMICS OF HIGH SPEED 2 71
226. Mr Prout told us that the maximum speed of HS2 had not been the reason for the route chosen: “the alignment that we have chosen is to minimise the environmental impact of the railway … I do not accept the premise that you would necessarily have a different alignment.”279
227. The Strategic Case stated that there is a choice when building a new railway between classic rail, or high speed rail:
“A conventional speed line would cost 9% less than a high speed line, but would deliver far fewer benefits in terms of journey time savings. A conventional speed line would have impacts on local communities, as would high speed rail. Overall, the journey time benefits from high speed outweigh the additional costs when compared to a conventional line by a factor of more than five to one.”280
228. The benefits referred to were calculated using assigned values of time for each type of traveller. We consider this in detail in Chapter 8.
Have the Government considered all the options?
Government’s consideration of the alternatives 229. We asked witnesses whether the Government had properly considered all of
the alternatives proposed to meet the objective of providing more capacity on the UK rail network. Professor Overman criticised what he perceived as the Government’s failure to provide a full assessment of the different options which could achieve the objective of providing additional capacity:
“I felt that if I was a Member of Parliament being asked to think about alternatives, having someone say to me, ‘We have these two alternatives for dealing with congestion, one of them has a benefit-cost ratio of 2.3 for every pound you spend. Here is this other one that has a benefit-cost ratio of 3.1 but we feel this one would be far too disruptive and here is my back-of-the-envelope calculation that gives you some feeling for why that is’, is not a satisfactory position to put decision-makers in when they are asking about things.”281
230. Mr Prout responded to this criticism and told us that the Department had “done a huge amount of work on alternatives.” He cited four reports produced by Atkins and Network Rail between 2010 and 2013 which were “really substantial, thick reports on alternatives, dealing with road and rail alternatives”. He said that these reports:
“have BCRs attached to them, assessments of the amount of capacity that you would generate, assessments of the kind of disruption that would be generated by the construction of these alternatives. You do not get the same level of cost estimation as you do on a much more mature scheme like HS2, where we know much more about it, but we deal with that by optimism bias and so on.”282
279 Q 232 280 Strategic Case, p 71 281 Q 56 282 Q 64
72 THE ECONOMICS OF HIGH SPEED 2
Has the Government properly considered the alternatives to provide additional capacity?
231. The alternatives in the Strategic Case were rejected for two main reasons: they only provide a third of the number of extra seats that HS2 does and the work required would be too disruptive to the existing network. The Government has not made a convincing case that the number of seats provided by HS2 is required and has not put a price on the disruption caused by the alternatives or by HS2. So on both grounds, the comparison is unproven.
THE ECONOMICS OF HIGH SPEED 2 73
Chapter 5: Conclusions and recommendations
232. The Government should use the opportunity of this review to consider how the higher prices for faster services from London to Kent on HS1 have affected demand for these services, to apply the lessons to HS2. (Paragraph 216)
233. The alternatives in the Strategic Case were rejected for two main reasons: they only provide a third of the number of extra seats that HS2 does and the work required would be too disruptive to the existing network. The Government has not made a convincing case that the number of seats provided by HS2 is required and has not put a price on the disruption caused by the alternatives or by HS2. So on both grounds, the comparison is unproven. (Paragraph 231)
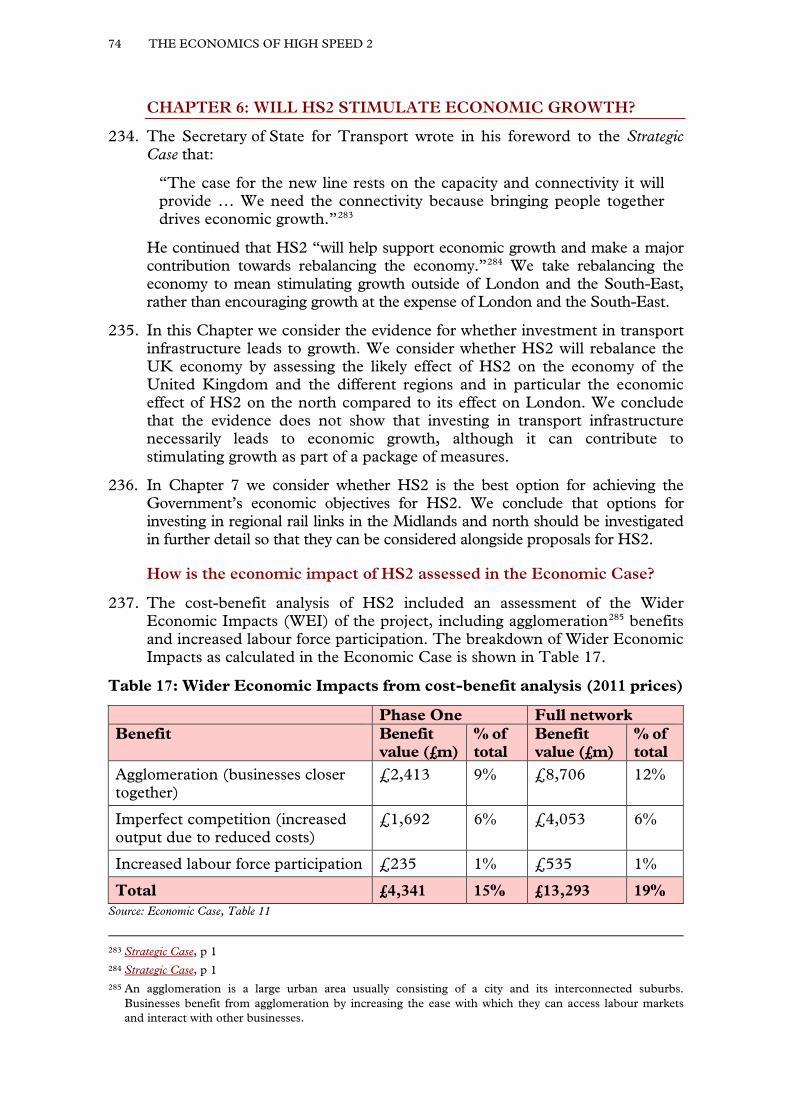
74 THE ECONOMICS OF HIGH SPEED 2
CHAPTER 6: WILL HS2 STIMULATE ECONOMIC GROWTH?
234. The Secretary of State for Transport wrote in his foreword to the Strategic Case that:
“The case for the new line rests on the capacity and connectivity it will provide … We need the connectivity because bringing people together drives economic growth.”283
He continued that HS2 “will help support economic growth and make a major contribution towards rebalancing the economy.”284 We take rebalancing the economy to mean stimulating growth outside of London and the South-East, rather than encouraging growth at the expense of London and the South-East.
235. In this Chapter we consider the evidence for whether investment in transport infrastructure leads to growth. We consider whether HS2 will rebalance the UK economy by assessing the likely effect of HS2 on the economy of the United Kingdom and the different regions and in particular the economic effect of HS2 on the north compared to its effect on London. We conclude that the evidence does not show that investing in transport infrastructure necessarily leads to economic growth, although it can contribute to stimulating growth as part of a package of measures.
236. In Chapter 7 we consider whether HS2 is the best option for achieving the Government’s economic objectives for HS2. We conclude that options for investing in regional rail links in the Midlands and north should be investigated in further detail so that they can be considered alongside proposals for HS2.
How is the economic impact of HS2 assessed in the Economic Case?
237. The cost-benefit analysis of HS2 included an assessment of the Wider Economic Impacts (WEI) of the project, including agglomeration285 benefits and increased labour force participation. The breakdown of Wider Economic Impacts as calculated in the Economic Case is shown in Table 17.
Table 17: Wider Economic Impacts from cost-benefit analysis (2011 prices)
Phase One Full network Benefit Benefit
value (£m) % of total
Benefit value (£m)
% of total
Agglomeration (businesses closer together)
£2,413 9% £8,706 12%
Imperfect competition (increased output due to reduced costs)
£1,692 6% £4,053 6%
Increased labour force participation £235 1% £535 1%
Total £4,341 15% £13,293 19% Source: Economic Case, Table 11
283 Strategic Case, p 1 284 Strategic Case, p 1 285 An agglomeration is a large urban area usually consisting of a city and its interconnected suburbs.
Businesses benefit from agglomeration by increasing the ease with which they can access labour markets and interact with other businesses.
THE ECONOMICS OF HIGH SPEED 2 75
Does transport infrastructure stimulate growth?
The link between connectivity and productivity 238. Connectivity is a measure of the extent to which places are connected to each
other and how easy it is to travel between them. Connectivity between two cities is improved by reducing the journey time between them. The Economic Case described how increasing connectivity by speeding up journey times between cities on or connected to the HS2 route would increase productivity.286
“With HS2, cities effectively become 'closer' to each other, which makes it easier for businesses (and people) to interact and coordinate activities across city boundaries. This opens up opportunities for closer integration, and trade, with the potential for each city to develop its own specialism. Greater trade and specialisation could offer the potential for additional benefits, beyond those captured within our economic appraisal, through increased productivity.”287
239. Professor Overman told us that there were three reasons why improving connectivity might increase productivity:
• It would enable businesses to employ workers from a larger labour market.
• It would allow businesses to access specialised services located in other cities. For example, businesses in Manchester would more easily be able to access specialist legal, financial or accounting services based in other cities more easily.
• It would help specialised services access their customers more easily and expand the market that they can potentially serve.288
240. Ms Rosewell and Professor Venables considered the mechanisms through which connecting places may lead to productivity gains in their paper High Speed Rail, Transport Investment and Economic Impact. They argued that transport improvements allowed economic activity to concentrate at high density in a particular place.289 This connectivity enabled skills and knowledge to be transferred more easily, facilitating local specialisations and providing a comparative advantage for businesses in the location.290
286 Productivity is a measure of output per unit of input. Increasing productivity makes a positive contribution to economic growth.
287 Economic Case, p 55 288 Q 52 289 Bridget Rosewell and Tony Venables, High Speed Rail, Transport Investment and Economic Impact: A paper
written for HS2 Ltd on the economic impacts of HS2, September 2013: http://volterra.co.uk/wp-content/uploads/2013/09/High-Speed-Rail-Transport-Investment-and-Economic-Impact.pdf [accessed February 2015]
290 Ibid., p 7
76 THE ECONOMICS OF HIGH SPEED 2
241. The link between connectivity and productivity does not necessarily mean that increasing connectivity increases productivity. Professor Graham told us that the evidence was “a bit mixed” with some “showing small or negligible effects; there is other evidence showing quite big effects.”291
Transport improvement part of a package 242. Investment in improving rail links is not in itself sufficient to generate
economic growth. Professor Vickerman said that “if you reduce the cost of interaction within an economy then you will get productivity benefits and those productivity benefits will lead to growth.”292 Professor Venables that transport could be “a spark and a leader”, but noted that “a railway line is not sufficient … It is only part of a package.” He concluded that other parts of the package, like education, matter more.293
243. The Department for Transport told us that “Evidence from the Organisation for Economic Co-Operation and Development (OECD) suggests that investment in infrastructure is important for growth and that building better transport links can have a stronger positive effect on GDP than other forms of investment.” The Department’s submission noted however that “Transport is not an end in itself but an enabler which can unlock potential and help the economy to grow”.294
244. Sir Rod Eddington, whose advice to the Government was published in the Eddington study (see Box 9) argued before the House of Commons Transport Select Committee in 2007 that “There are parts of the UK where transport spend is the best thing we can do to promote economic growth. There are other parts of the UK where transport spend has very little impact on the economy.” He argued that “transport is a key enabler and it is sometimes the most important piece of the jigsaw but it is not always the most important piece of the jigsaw.” He noted that broadband or other non-transport projects could be “the next transformation in this country.”295
Has past experience shown that transport stimulates growth? 245. The Jubilee Line296 was cited by several witnesses as an example of the
economic benefits of agglomeration through improved connectivity. Professor Vickerman described to us the experience of France. He said that where high speed stations had been well integrated with local transport systems “you get big concentrations of activity—and Lyon Part-Dieu is probably the best example of that in France.” However, “simply building more arms to connect every region, which was the sort of political promise in France, was, to put it bluntly, a rather silly thing to do … because every bit of that network is not really an economic proposition.”297
291 Q 13 292 Q 7 293 QQ 13, 18 294 Supplementary written evidence from the Department for Transport (EHS0090) 295 Oral evidence taken before the Transport Select Committee, 16 April 2007 (Session 2006–07), Q 75 (Sir
Rod Eddington) 296 For example, see Q 158 (ChrisTunstall) 297 Q 11
THE ECONOMICS OF HIGH SPEED 2 77
246. Several witnesses were sceptical about the extent to which you could draw upon previous experience to show examples of transport investment stimulating growth. Emile Quinet of the Ecole Nationale des Ponts et Chaussees, an expert on French high speed trains, told us that it was difficult to attribute increases in economic activity to the construction of the TGV network.298 Lord Deighton suggested that history tended to remember the successes: “we only ever remember the ones that had much wider economic benefits, so I think the retrospective analysis does give you a bit of an optimism bias.”299
Conclusion 247. Evidence we have heard shows that investing in transport
infrastructure does not necessarily lead to economic growth. Improvements in transport infrastructure need to be carefully chosen and linked with other policies to ensure that money is spent where it can be most effective in stimulating growth.
How will HS2 affect economic activity in the UK?
The effect of HS2 on the UK economy as a whole 248. The Economic Case estimated that HS2 would create wider economic benefits
worth £13.3 billion over 60 years (see Table 17). The Strategic Case argued that this standard analysis did not capture the full benefits of HS2 as it would have an effect on the distribution of economic activity in the UK. As the “standard economic appraisal adopts simplifying assumptions, such as fixed land use … it is unlikely to capture these impacts on economic geography.”300 HS2 Ltd commissioned KPMG to study the effect HS2 would have on the distribution of economic activity.
249. KPMG estimated that HS2 could potentially generate £15 billion per year in productivity gains for the UK economy from 2037 once Phase One and Phase Two were both in operation. However, it also noted that some cities would experience a reduction in productivity as firms moved away from these cities to places that had become more attractive.301 Commentators have criticised the accuracy of this figure (see Box 7). However, Professor Vickerman was positive about the work despite scepticism about the magnitude of the effect. He said that “whether [the economic uplift] is £15 billion or £8 billion or £5 billion seems to me to be a second order question to whether it is an overall gain. The answer is yes.”302
298 Q 130 299 Q 228 300 Economic Case, p 54 301 HS2 Ltd, HS2 Regional Economic Impacts, September 2013, p 13: https://www.kpmg.com/UK/en/
IssuesAndInsights/ArticlesPublications/Documents/PDF/Market%20Sector/Building%20and%20Construction/hs2-regional-economic-impacts.pdf [accessed February 2015]
302 Q 10
78 THE ECONOMICS OF HIGH SPEED 2
Box 7: KPMG’s work on the economic impact of HS2
HS2 Ltd commissioned KPMG to attempt to quantify the overall effect of HS2 on productivity and assess how this might be distributed between cities in the UK. KPMG’s report, HS2 Regional Economic Impacts, considered how HS2 would affect the distribution of economic activity in the UK. It gave an overall figure for the effect of HS2 on the UK economy of £15 billion per year in productivity gains from 2037, when both phases of HS2 would be open.
Several witnesses said they did not find the £15 billion per year figure persuasive. Professor Overman acknowledged that KPMG “were trying to do something difficult” but he criticised the work for two reasons. Firstly, the figure for the rail productivity benefits included a degree of double-counting of the positive effects of both road and of rail on improving connectivity. Secondly, the assessment of transport’s effect on GDP failed to account for the evidence which showed that the higher productivity of better connected places was in part explained by their tendency to attract highly skilled people.
Professor Overman also criticised the work for using an approach that was usually applied to consider the effect of increasing connectivity between two places and applying this effect to the whole of the UK.303
Responding to these criticisms, Lewis Atter of KPMG told us that they had compared their method with that used by the Spatial Economics Research Centre on the Northern Way (when Professor Overman was director of SERC), which had produced results similar to their own estimates. Mr Atter said that:
“Professor Overman’s team tried to take out the people effects, leaving the pure place-based effects. Our analysis has a relationship in terms of place that is smaller than what he is left with. Because we did not adjust for people effects—as the data did not allow it—he thinks that our number will be significantly higher than his. But actually, although we get there via a different route, our approach to actual application is very similar.”304
KPMG set out the calculations described by Mr Atter in written evidence to us.305
The effect of HS2 on cities with HS2 stations 250. We took evidence from business and political leaders from Birmingham,
Leeds, Manchester, Nottingham and Sheffield representing the cities that will have HS2 stations. Sir Richard Leese, Leader of Manchester City Council, told us that “we see the development of High Speed 2 as being essential to the long-term economic future of not just Greater Manchester but the north.”306 This positive view of the importance of HS2 to economic growth in the north and Midlands was shared by all representatives from these cities. Witnesses cited the benefits to business, potential for regeneration and job creation and improving international competitiveness as reasons why HS2 would be positive for their cities.
303 QQ 50–52 304 Q 29 305 Supplementary written evidence from KPMG (EHS0089) 306 Q 143
THE ECONOMICS OF HIGH SPEED 2 79
251. Mike Blackburn from the North West Business Leadership team said that HS2 would mean that “businesses in the Greater Manchester area can get access to skilled resources, where currently it is ineffective to get access to them.” He said that HS2 “reduces productivity costs by decreasing costs because the costs of journey time therefore of getting your goods and services to market is massively improved by having HS2, as well as getting access to different markets.”307
252. Witnesses argued that HS2 would help cities compete internationally. Jerry Blackett, Chief Executive of the Greater Birmingham Chambers of Commerce, said that HS2 was about “growth and jobs for their children and families and the ability of the Midlands, in our case, to compete globally.”308 Ian Williams of Leeds Chamber of Commerce agreed: “If I were an investor based outside the UK and looking at where to put my investment in cities, I would look at those that are well connected.”309
253. HS2 would also provide improved links to international airports—in particular to Manchester and Birmingham airports and through an interchange at Old Oak Common in West London, to Heathrow on Crossrail. Mr Williams told us that businesses in Leeds: “want to be able to access Heathrow so we can get those international connections as well, to those long-haul destinations that are not well served from other places.”310
254. Regeneration of cities and job creation were also cited as benefits of HS2. Peter Kennan of the Sheffield Chamber of Commerce said that Sheffield would receive “significant economic benefits from HS2, particularly in job creation, which will lead to more stable finances in local rates revenue.”311 Greater Birmingham Chambers of Commerce agreed that “the construction of the Curzon Street Station will be a catalyst for major redevelopment in the Eastside area of Birmingham. This has the potential to be on a similar scale as the Kings Cross/St Pancras redevelopment.”312
255. Representatives from Sheffield raised concerns, however, that the potential for growth and job creation in Sheffield as a result of HS2 coming to the city would be undermined by the proposal to locate the station at Meadowhall two miles outside the city centre. This issue is further considered below.
What do cities that are not on HS2 think? 256. We met business and council leaders from four cities that will not have an
HS2 station—Newcastle, Hull, Liverpool and Wakefield.313 The witnesses from Liverpool and Newcastle welcomed HS2—although not without some
307 Q 145 308 Q 157 309 Q 182 310 Q 186 311 Q 170 312 Written evidence from Greater Birmingham Chambers of Commerce (EHS0038) 313 Some of these towns, although not directly on the HS2 network, will have access to trains running on both
the existing and the HS2 network. For example, it is proposed that a direct train will run from Liverpool to Euston via Crewe from which point it will travel on the HS2 line.
80 THE ECONOMICS OF HIGH SPEED 2
reservations—while the witness from Hull said he had “no objection to HS2”.314 Ross Smith of the North East Chambers of Commerce told us that:
“As a relatively remote region within the context of England, connectivity is vitally important to the north-east of England and to its businesses. The East Coast Main Line is one of our major transport assets and it is going to hit severe capacity constraints in the next 15 years. HS2 has to be part of the solution to addressing those constraints.”315
He referred to proposed investments on the East Coast Main line, including increasing passing places on the East Coast Main Line north of Northallerton and reinstatement of the Leamside Line which ran parallel to the Main Line through County Durham, to provide capacity for passengers and rail freight. He said this would “significantly increase the benefit that you are going to get to the north-east from the HS2 investment.”316
257. The importance of providing additional train paths for freight was a common theme. Joe Anderson, Mayor of Liverpool, told us that “there will be an increase of between 400 per cent and 500 per cent in freight coming into the west through Liverpool” following the development of Liverpool’s port. He argued that continuing HS2 into Liverpool would create the capacity to bring freight out of the port.317 Proposals for HS2 do not include a direct link to Liverpool (an HS2 classic compatible service from Liverpool will connect via the classic network at Crewe). No additional capacity for freight is therefore planned between Liverpool and where the existing line joins the new HS2 track.
258. Sir David Higgins, Chair of HS2 Ltd, also emphasised the importance of HS2 in providing additional capacity for freight travelling north-south along the M6. He said that HS2 would “free up 20 freight paths every day.”318 This would benefit cities on the HS2 network, as well as Liverpool. We consider freight in detail below, including whether improved east-west links would be of benefit to rail freight.
Will HS2 lead to a reduction in services? 259. It was suggested stations that have an existing long-distance train service, but
are not planned to have HS2 stations, might have a reduced service following the opening of HS2.319 The Secretary of State told us that areas such as Coventry or Rugby that would not have an HS2 station would “definitely” have at least as good a rail service after HS2 came into operation: “this is an addition; it is not a minus from the services that are available.”320 He went on to describe how HS2 would be linked into the classic network to enable cities
314 Q 133 315 Q 133 316 Q 135 317 Q 136 318 Q 240 319 Stations that this might affect would be those on the West Coast or East Coast Main Lines which were not
proposed to have HS2 stations. For example, this could include Coventry, Stoke and Doncaster. 320 Q 223
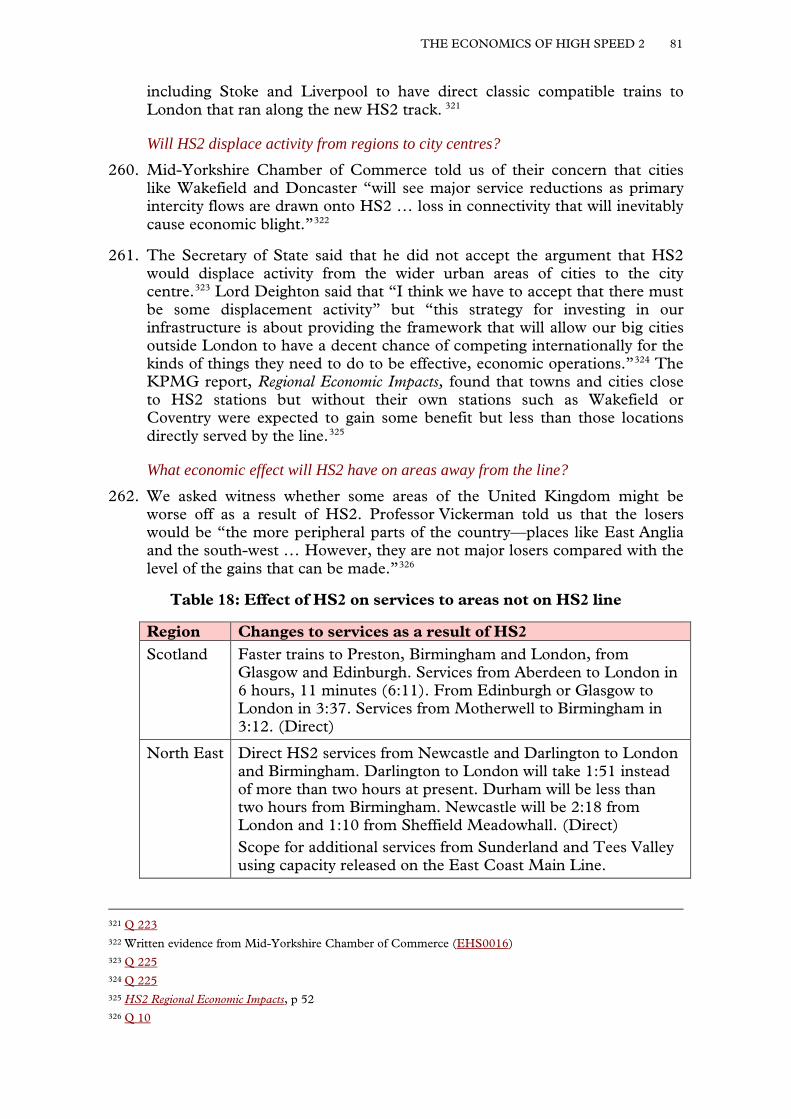
THE ECONOMICS OF HIGH SPEED 2 81
including Stoke and Liverpool to have direct classic compatible trains to London that ran along the new HS2 track. 321
Will HS2 displace activity from regions to city centres? 260. Mid-Yorkshire Chamber of Commerce told us of their concern that cities
like Wakefield and Doncaster “will see major service reductions as primary intercity flows are drawn onto HS2 … loss in connectivity that will inevitably cause economic blight.”322
261. The Secretary of State said that he did not accept the argument that HS2 would displace activity from the wider urban areas of cities to the city centre.323 Lord Deighton said that “I think we have to accept that there must be some displacement activity” but “this strategy for investing in our infrastructure is about providing the framework that will allow our big cities outside London to have a decent chance of competing internationally for the kinds of things they need to do to be effective, economic operations.”324 The KPMG report, Regional Economic Impacts, found that towns and cities close to HS2 stations but without their own stations such as Wakefield or Coventry were expected to gain some benefit but less than those locations directly served by the line.325
What economic effect will HS2 have on areas away from the line? 262. We asked witness whether some areas of the United Kingdom might be
worse off as a result of HS2. Professor Vickerman told us that the losers would be “the more peripheral parts of the country—places like East Anglia and the south-west … However, they are not major losers compared with the level of the gains that can be made.”326
Table 18: Effect of HS2 on services to areas not on HS2 line
Region Changes to services as a result of HS2 Scotland Faster trains to Preston, Birmingham and London, from
Glasgow and Edinburgh. Services from Aberdeen to London in 6 hours, 11 minutes (6:11). From Edinburgh or Glasgow to London in 3:37. Services from Motherwell to Birmingham in 3:12. (Direct)
North East Direct HS2 services from Newcastle and Darlington to London and Birmingham. Darlington to London will take 1:51 instead of more than two hours at present. Durham will be less than two hours from Birmingham. Newcastle will be 2:18 from London and 1:10 from Sheffield Meadowhall. (Direct) Scope for additional services from Sunderland and Tees Valley using capacity released on the East Coast Main Line.
321 Q 223 322 Written evidence from Mid-Yorkshire Chamber of Commerce (EHS0016) 323 Q 225 324 Q 225 325 HS2 Regional Economic Impacts, p 52 326 Q 10
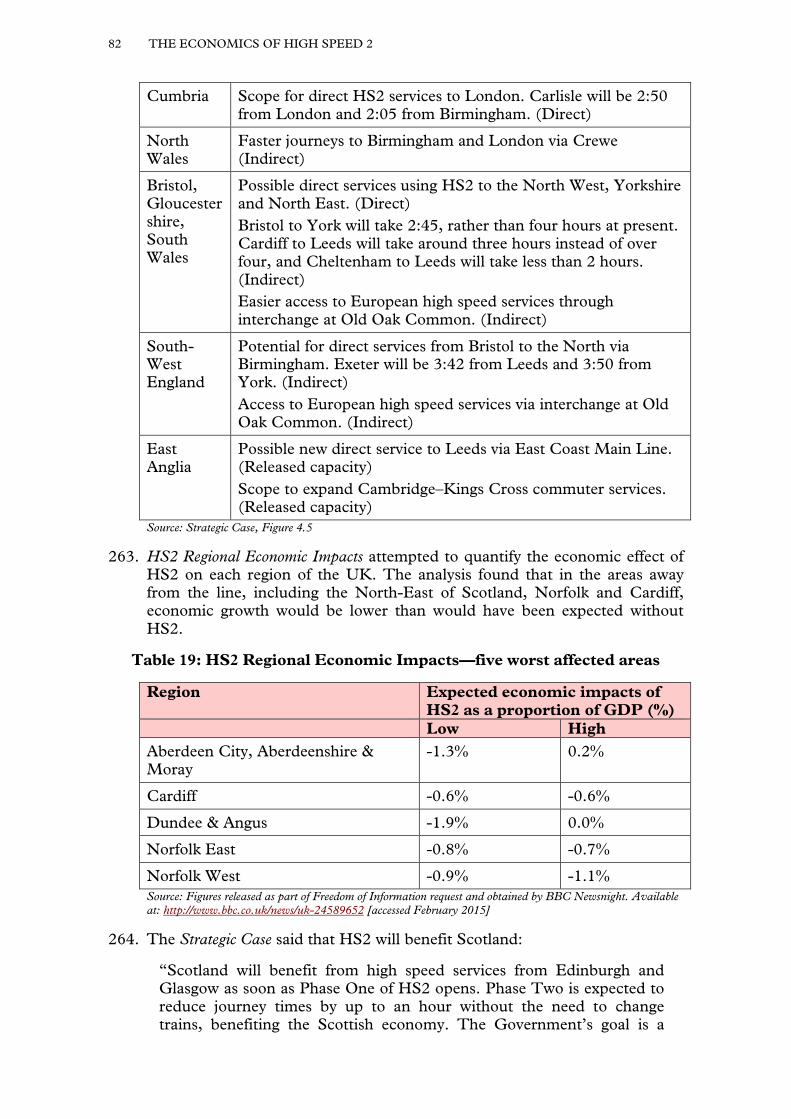
82 THE ECONOMICS OF HIGH SPEED 2
Cumbria Scope for direct HS2 services to London. Carlisle will be 2:50 from London and 2:05 from Birmingham. (Direct)
North Wales
Faster journeys to Birmingham and London via Crewe (Indirect)
Bristol, Gloucestershire, South Wales
Possible direct services using HS2 to the North West, Yorkshire and North East. (Direct) Bristol to York will take 2:45, rather than four hours at present. Cardiff to Leeds will take around three hours instead of over four, and Cheltenham to Leeds will take less than 2 hours. (Indirect) Easier access to European high speed services through interchange at Old Oak Common. (Indirect)
South-West England
Potential for direct services from Bristol to the North via Birmingham. Exeter will be 3:42 from Leeds and 3:50 from York. (Indirect) Access to European high speed services via interchange at Old Oak Common. (Indirect)
East Anglia
Possible new direct service to Leeds via East Coast Main Line. (Released capacity) Scope to expand Cambridge–Kings Cross commuter services. (Released capacity)
Source: Strategic Case, Figure 4.5
263. HS2 Regional Economic Impacts attempted to quantify the economic effect of HS2 on each region of the UK. The analysis found that in the areas away from the line, including the North-East of Scotland, Norfolk and Cardiff, economic growth would be lower than would have been expected without HS2.
Table 19: HS2 Regional Economic Impacts—five worst affected areas
Region Expected economic impacts of HS2 as a proportion of GDP (%)
Low High Aberdeen City, Aberdeenshire & Moray
-1.3% 0.2%
Cardiff -0.6% -0.6%
Dundee & Angus -1.9% 0.0%
Norfolk East -0.8% -0.7%
Norfolk West -0.9% -1.1% Source: Figures released as part of Freedom of Information request and obtained by BBC Newsnight. Available at: http://www.bbc.co.uk/news/uk-24589652 [accessed February 2015]
264. The Strategic Case said that HS2 will benefit Scotland:
“Scotland will benefit from high speed services from Edinburgh and Glasgow as soon as Phase One of HS2 opens. Phase Two is expected to reduce journey times by up to an hour without the need to change trains, benefiting the Scottish economy. The Government’s goal is a
THE ECONOMICS OF HIGH SPEED 2 83
national network that brings the country closer together, so we are taking forward a study with the Scottish Government to consider how these benefits could be extended further.”327
265. The Aberdeen and Grampian Chambers of Commerce said “businesses in the North-east of Scotland believe that the proposed HS2 line will have a positive impact on their business in the future” and they supported HS2 in principle. However, they noted the assessment by KPMG that Aberdeen would lose out as a result of HS2 and proposed that:
“a clause should be added to the legislation for the project which requires investment in alternative transport improvements in the few negatively impacted regions. This is a credible offer given the KPMG business case is being used to justify the project. This investment would be equal to the opportunity cost of the project in regions negatively impacted. This would have a negligible impact on the overall project cost and would provide a more equitable outcome across the UK.”328
266. HS2 Ltd prepared a preliminary report on extending High Speed services to Scotland for the Government. Sir David Higgins told us that this report was “work in progress” and that he did not know when it would be published. He said that “the reality is that more work needs to be done on the combination of: ‘Is it additional? Is it a series of upgrades or a new line?’.”329
Will HS2 lead to a reduction on spending on other rail infrastructure? 267. Several witnesses expressed concern that the high level of spending on HS2
would come at the penalty of a reduction of investment on other parts of the rail network which was required to address problems on existing lines. 330 Dr Ian Kelly, representing Hull and Humber Chambers of Commerce, said that “We would like a clearer picture of where it [HS2] fits in, in terms of displaced rail spending, because there is some immediate-type rail spending that would certainly benefit our part of the world.”331
268. The Aberdeen and Grampian Chambers of Commerce noted “there is a real case to deliver additional improvements to the East Coast Line between Aberdeen and Dundee to significantly improve journey times.” They continued that although transport in Scotland was a devolved issue, “some form of UK Government support to deliver additional rail investment would be a clear signal from the UK Government about their commitment to deliver benefits for the whole of the UK.”332
269. We asked Mr Prout of the Department for Transport whether HS2 would take money for investment in rail services not affected by HS2: “if you look at the overall capital investment programme for the next five-year period, £16 billion goes into HS2 and more than that goes into the classic rail network. Some £73 billion overall goes into transport infrastructure
327 Strategic Case, pp 27–28 328 Written evidence from the Aberdeen and Grampian Chambers of Commerce (EHS0022) 329 Q 244 330 QQ 135, 136. 331 Q 133 332 Written evidence from the Aberdeen and Grampian Chambers of Commerce (EHS0022)
84 THE ECONOMICS OF HIGH SPEED 2
investment, so if those plans are implemented and if those plans are continued there will be adequate funding for investment in the rest of the rail network.”333
Will London benefit the most from HS2? 270. The London economy was expected to benefit from HS2.
The Mayor of London said in written evidence that he supported the project and “if HS2 is delivered properly it can help to ease congestion and improve transport connections which will deliver major economic growth to London.”334
271. Some witnesses went further, suggesting that London would gain from HS2 at the expense of other cities. Professor Glaister suggested that HS2 might encourage longer distance commuting to London: “With High Speed 2 to Birmingham, it will take about the same time from Birmingham as it now takes from Barnet, so there is a possibility … that you will encourage a lot of longer-distance commuting into London”.335 Joe Rukin of Stop HS2 said that “when you look at the international comparisons, you find that more economic activity gets sucked to the capital”.336
272. We asked Mr Quinet what the experience had been in the case of the TGV. He acknowledged that Paris benefited more than Lyon, but noted that “Lyon probably also benefitted from the TGV, to a lesser degree.”337 Academics Albalete and Bel wrote in their report on lessons from high speed rail that “for regions and cities whose economic conditions compare unfavourably with those of their neighbours, a connection to the [high speed] line may even result in economic activities being drained away and an overall negative impact.”338
273. KPMG’s report, HS2 Regional Economic Impacts, also considered the benefit HS2 would have for London’s economy compared to other regions. It found that “productivity benefits accrue to all regions.” It continued, “Though Greater London does well, it is not at the expense of everywhere else.”339
274. When we put this to the Secretary of State, he told us that the leaders of the regions “say that this connection is vitally important for their cities to be able to compete.”340 This view was supported by witnesses from northern and Midlands cities. Sir Richard Leese said, “I would be very confident that, generally, the Midlands, the north and beyond would get far more benefit from High Speed 2 than London”341 Councillor Jon Collins, Leader of Nottingham Council and representing the Eastern High Speed Rail Network Partnership, believed that HS2 provided an opportunity to attract business
333 Q 75 334 Written evidence from the Mayor of London (EHS0088) 335 Q 43 336 Q 85 337 Q 131 338 Albalete and Bel, ‘High-Speed Rail: Lessons for Policy Makers from Experiences Abroad’, Public
Administration Review, (May/June 2012), p 346 339 HS2 Regional Economic Impacts, p 56 340 Q 225 341 Q 145
THE ECONOMICS OF HIGH SPEED 2 85
from London: “The cost of living in London is huge. Increasingly, people in a lot of jobs and professions cannot afford to live in London. The opportunity to live away and do business will undoubtedly be a positive.”342
275. Mr Kennan acknowledged that there was “a risk” that London could benefit the most from HS2, but said that “we think that we can compete and actually take jobs away from London in the private sector. At the very least, we would be able to generate jobs organically through the population that we already have.” He said that Sheffield’s universities and high quality of life would assist with retaining jobs. 343
276. Councillor Lewis, Chair of the Transport Committee, West Yorkshire Combined Authority, said that “we have specialisms in the economy that are not a duplication of what happens in London … particularly in financial services”.344 Mr Blackburn said that Manchester had “a complementary economy rather than a competitive economy” to London. He described Manchester’s “science and technology offer, which is world renowned, with the stuff that we are doing on graphene and materials generally as well as on nuclear, is very complementary to London.”345
Conclusion: will HS2 rebalance the UK economy? 277. We heard evidence that London was likely to be the biggest
beneficiary from HS2. This has been the case with similar projects in other countries where the largest cities have benefitted the most, including in France where Paris was the biggest beneficiary from the TGV. This does not mean other cities may not receive some economic benefit from HS2, which could stimulate growth and play a role in rebalancing the economy if coupled with appropriate policies to foster economic growth.
278. HS2 must not lead to a reduction in investment in improving other areas of the UK rail network. Investment on lines such as the East Coast Main Line north of Leeds, or rail services elsewhere in the country, could play an important role in stimulating growth outside of the South-East. Any reduction as a result of HS2 could mean these areas lose out.
How can the benefits of HS2 be maximised?
279. Witnesses told us about measures that needed to be taken to maximise economic growth from HS2 and ensure that benefits spread beyond the area immediately around HS2 stations.
Station locations outside London 280. Concerns have been expressed about the proposed location of the HS2
station at Meadowhall, two miles outside Sheffield city centre. The proposed East Midlands station is also expected to be located outside a city centre between Nottingham and Derby. Councillor Collins told us that this location
342 Q 176 343 Q 176 344 Q 183 345 Q 146
86 THE ECONOMICS OF HIGH SPEED 2
“maximises the regional economic benefit, and it is certainly supported by Nottingham and Nottinghamshire, Derbyshire and most of the local authorities in the east Midland.”346
281. Sir David Higgins considered these issues in his report Rebalancing Britain concluding that “the proposed hubs in the East Midlands and in South Yorkshire are, on balance, the best solutions to deliver the benefits of HS2 to their regions as a whole, and to achieve the best fit with the existing network.” He also recommended that the East Midlands hub station be located at Breaston rather than Toton as had previously been proposed.347
282. Barnsley, Doncaster and Rotherham have argued for the Sheffield HS2 station to be based at Meadowhall because of the increased connectivity to their cities provided by this location. Sir David noted that this was an area of growth: “The high-tech job growth in that area is coming in Rotherham and Barnsley, and a lot of the railway jobs and new academy are in Doncaster.” He told us that locating the HS2 station in Sheffield city centre would add £1 billion to the cost of construction.348
283. We also received evidence from representatives of Stoke-on-Trent regarding their proposal that a station be added at Stoke on the proposed HS2 line between Birmingham and Manchester. Stoke argued that having the station there rather than in Crewe would bring greater regeneration benefits and would be cheaper than the proposed route.349 Sir David Higgins recommended that the HS2 station on the western leg be located at Crewe rather than Stoke because of its greater connectivity but noted that Stoke continued to mount a “strong case.”350
284. We were told that city centre locations were more successful in providing economic benefits to that city. Professor Overman told us that “to maximise the benefits of this … you would want the stations in the middle of the city”351 Ms Rosewell agreed and suggested that a parkway station outside the city centre as well as a city centre station often provided the best solution.352 International examples have also shown that stations located outside of city centres did not bring the same level of benefit to those cities compared to city centre locations. Tours and Avignon in France and Osaka in Japan were cited as examples of this.353
285. Several witnesses noted that the real problem with out of town locations was when no effort was made to connect the station into local transport networks. Professor Overman argued, “Where we would clearly get ourselves in trouble is if we put stuff on the edge of towns and then it is in the green belt or there
346 Q 171 347 Sir David Higgins, HS2 Rebalancing Britain: From HS2 towards a national transport strategy (October 2014)
p 8: https://www.gov.uk/government/uploads/system/uploads/attachment_data/file/374709/Rebalancing_ Britain_-_From_HS2_towards_a_national_transport_strategy.pdf [accessed February 2015]
348 Q 254 349 Written evidence from City of Stoke-on-Trent (EHS0085) 350 Rebalancing Britain, p 28 351 Q 53 352 Q 37 353 QQ 36, 109, 131
THE ECONOMICS OF HIGH SPEED 2 87
are constraints on development and so on, so we do not do anything around it. That would seem to me to be something that would downplay the benefits.”354
286. Stations located outside city centres as proposed for Sheffield Meadowhall and the East Midlands Hub HS2 stations are less likely to bring economic benefit to the cities in which they are situated. Where stations cannot be located in city centres they must be properly connected into regional transport networks to ensure the maximum benefit is derived from them.
287. We also heard evidence about how the location of stations would affect the journey time savings as a result of HS2 and therefore the benefits derived from the journey time savings. We consider this in Chapter 3 on demand.
Linking HS2 to HS1 288. We heard evidence about whether HS2 should have a link to HS1. The
Strategic Case proposed a direct link between HS2 and HS1. This was however dropped at the recommendation of Sir David Higgins because “what was proposed was substandard, it was going to disadvantage freight and the North London line … and it was really only going from Old Oak Common anyway, so it was really looked at as another service from London to Paris with a separate station”.355 Without the link passengers changing from HS2 to HS1 trains to Stratford, Kent or Europe would have to walk or get the Tube from London Euston to London St. Pancras.
289. Michèle Dix of Transport for London agreed that the original proposal was unworkable, but said that “we do want to see an HS1-HS2 link provided but we would like to see that as a twin-bore tunnel that went from Old Oak Common to join with HS1 and onward to Stratford.” She said that such a link “would certainly help with the regional movements across London and the wider south-east towards the north, as well as provide a direct link to Europe.”356
290. The London Borough of Newham argued to us in written evidence that removing the link between HS1 and HS2 “undermines the business case for the network and limits the potential role for Stratford International station and therefore the potential for economic growth in the area.” The submission said that “At worst it could stall the development of east London and the South East by maintaining too much focus on connectivity with the London Central Activity Zone” and argued that the Bill currently proceeding through Parliament “represents the optimum opportunity to enable an HS1/HS2 Rail Link via passive provision357.”358 No business case has yet been produced proposing revised plans and setting out the costs and benefits of any such link.
354 Q 53 355 Q 254 356 Q 195 357 Providing passive provision would ensure the Hybrid Bill did not rule out the provision of such a link at a
future stage if it were agreed that it should be built. 358 Written evidence from the London Borough of Newham (EHS0054)
88 THE ECONOMICS OF HIGH SPEED 2
How can cities ensure they get the full benefit of HS2? 291. The Government set up the HS2 Growth Task force, chaired by
Lord Deighton, “to examine how to maximise economic growth and job opportunities from the government’s plans to build a high speed rail network.”359 Lord Deighton told us to gain the expected regeneration and growth benefits “you need the discipline of having a very clear vision locally about what they want out of it, a very clear growth strategy that fits what the cities are doing together with the broader region, and a very specific delivery body that is charged with making all that happen.”360
Box 8: HS2 Growth Task Force recommendations
The HS2 Growth Taskforce was established to examine how to maximise economic growth and job opportunities from the Government’s plans to build a high speed rail network. The taskforce published their final report, High Speed 2: Get Ready in March 2014.361 The report’s conclusions were divided into four themes:
• Getting Our Cities Ready
• Getting Our Transport Network Ready
• Getting Our People Ready
• Getting Our Businesses Ready
Recommendations focused on the importance of cities actively preparing for HS2 by preparing growth strategies for each station, to be delivered by a locally led body. The report recommended that the Government partners these authorities with a Minister given responsibility for HS2 led regeneration.
The report noted the importance of effective transport networks to spread the economic benefits as widely as possible. The report mentioned the importance of HS2 for rail freight and made recommendations on ensuring the potential for rail freight was properly considered.
292. Witnesses told us about the importance of ensuring transport infrastructure was in place connecting HS2 stations to existing transport networks to enable passengers to travel on from HS2 both within the city and region362 and on developing skills in cities to attract companies and create jobs as key to maximising the benefits of HS2.363
293. Chris Tunstall of the West Midlands Integrated Transport Authority told us about Birmingham’s and Solihull’s HS2 Growth Strategy which had identified £320 million worth of investment to capitalise on the opportunities provided by HS2.364 Other cities told us how they were also preparing these
359 HS2 Growth Task Force website: https://www.gov.uk/government/groups/hs2-growth-taskforce [accessed February 2015]
360 Q 228 361 HS2 Growth Taskforce, High Speed 2: Get Ready, March 2014: https://www.gov.uk/government/uploads/
system/uploads/attachment_data/file/294851/hs2-get-ready.pdf [accessed February 2015] 362 Q 146 (Sir Richard Leese), Q 147 (Mike Blackburn), Q 184 (Ian Williams), Q 185 (Cllr James Lewis) 363 Q 147 (Mike Blackburn) 364 Q 161
THE ECONOMICS OF HIGH SPEED 2 89
plans, although they were not as advanced as the regeneration plans for Birmingham’s stations.
294. Witnesses were also generally in agreement with Lord Deighton that “regeneration, rebalancing or growth in the cities has to be locally led.”365 Several witnesses noted the importance of national leadership. Sir Richard Leese told us that the work “needs to have an element of leadership nationally. However, a lot of the planning needs to be informed by local knowledge.”366 Lord Deighton said that this national leadership would involve a “regeneration body in the centre to support all the regeneration efforts around the cities.”367
295. It is important that stations are linked into local transport networks in order to reduce the risk that HS2 brings little or no economic benefit to nearby areas. We agree with the Growth Task Force that the Government should provide leadership nationally to ensure that the right steps are taken to prepare cities with stations for HS2.
296. As noted in Chapter 2, concerns have been raised that the full cost of complementary projects required to maximise the benefits of HS2 have not been captured. The cost of any additional work undertaken in cities to ensure the maximum benefit is derived from HS2 and who is to pay for it needs to be made clear to ensure the right decisions are made.
The effect of HS2 on freight
297. The Strategic Case cites 2.5% annual growth in rail freight for the last 20 years as a reason for the need to provide additional capacity on the UK rail network. It said that Network Rail have forecast “potential annual growth in freight tonne km of 2.2% to 2033 and 2.1% to 2043.”368 Sir David Higgins told us that “Forty per cent of the nation’s [rail] freight travels on the west coast every day and at night.”369
298. The Strategic Case said that “HS2 has the potential to increase the amount of freight that can be carried by rail between London and the West Midlands by using the existing mainline capacity that it released.” It estimated that “HS2 could provide space for an extra 20 West Coast Main Line freight paths (and possibly more subject to detailed train planning).” Previous research had concluded that “40 additional freight paths could remove up to 1,600 lorries a day from the motorways and could deliver benefits of up to £1.3bn to the economy [over 60 years].”370
365 Q 228 366 Q 152 367 Q 228 368 Strategic Case, p 81 369 Q 241 370 Strategic Case, p 81 This figure was calculated by WSP and refers to the environmental benefits of
removing lorries from the road: WSP, ‘HS2 could save carbon and money in increased freight capacity’, 2013: http://www.wspgroup.com/en/WSP-UK/Who-we-are/Newsroom/News-releases1/2013/hs2-could-save-carbon-and-money-in-increased-freight-capacity [accessed March 2015]
90 THE ECONOMICS OF HIGH SPEED 2
299. Other witnesses agreed that the additional capacity provided by HS2 would free up valuable train paths for freight. The Rail Freight Group said in evidence that to accommodate the growth in rail freight would “require new network capacity provided by HS2. It is also clear that allowing rail freight to benefit from this new capacity can deliver economic benefits.”371 Sir Richard Leese said that
“Something like 43% of rail-haul freight will use the West Coast Main Line. With the sort of developments we are seeing both in Hull, where there is major port expansion, and in Liverpool and Teesport, we want a lot of that freight to be on rail, because our road capacity is also full, and we also need to free up capacity within the classic network to be able to carry that freight as well.”372
Has the Government considered rail freight properly? 300. The Rail Freight Group, despite supporting HS2 in principle, raised
concerns about whether the Government had properly considered how HS2 would benefit rail freight: “there is a danger that the benefits from rail freight will not be realised unless a holistic approach is taken to how the released capacity that HS2 creates is allocated. Presently there has been little work undertaken to assess this, and the early work has tended to focus on the needs of the passenger sector.” They concluded that in order to ensure benefits for freight were secured they were seeking a “specific provision to safeguard a proportion of released capacity for freight, between London and Crewe, as part of the Hybrid Bill.”373
301. They added that the two phase approach to constructing HS2 “means that the potential freight paths risk being artificially truncated at Handsacre [where the HS2 Phase One line will re-join the West Coast Main Line]”. Considering Phase One in isolation and delaying the construction of the second phase could “underestimate the need for freight capacity, as much of that need is driven by the northern conurbations, where capacity is not released until Phase 2 is constructed.”374
302. Mayor Anderson told us that not connecting Liverpool to HS2 would be a missed opportunity to provide additional capacity which could accommodate the increased level of freight arriving in Liverpool’s new SuperPort: “we can take some of the biggest ships in the world, and we have to make sure we are able to get that freight out. It is going to cost a spur.”375 The campaign group 20 Miles More said that “North of Crewe HS2 services swapping to the classic tracks means that there will be no released freight capacity. So Liverpool’s new post-Panamax container port, Liverpool 2, will be unable to access the classic rail capacity released south of Crewe.” They said that HS2 had taken “a passenger centric approach, without sufficient consideration of freight capacity benefits and impacts.”376
371 Written evidence from Rail Freight Group (EHS0035) 372 Q 153 373 Written evidence from Rail Freight Group (EHS0035) 374 Ibid. 375 Q 133 376 Written evidence from 20 Miles More (EHS0051)
THE ECONOMICS OF HIGH SPEED 2 91
303. We put the concerns that the needs of freight were not being taken into consideration when planning for HS2 to Mr Plummer of Network Rail. He said that freight operators were represented at a planning group and conversations on accommodating the needs of rail freight were ongoing but “It is understandable that it [the rail freight industry] is expressing that concern, because the outcome of these conversations is not certain, but it is important to us that freight, just as much as passenger, and the value of that to the UK economy, is reflected in these decisions.”377
304. The HS2 Growth Task Force made two recommendations in relation to freight:
• “The Government and Network Rail should set out by the end of 2014 their plan for defining how HS2 will affect rail services for cities off the HS2 route and for rail freight, and also their plans for a wider review of rail services.”
• “The Government should invite the rail freight industry to set out how it could take advantage of the capacity released by HS2. Separately, the Government should evaluate the case for future-proofing HS2 to accommodate freight traffic and communicate its plans to do this.”378
305. The Government responded to these recommendations in July 2014:
“Plans are currently being developed for the work necessary to develop options and take decisions about the future use of released capacity. These plans will be published before the end of 2014. The rail freight industry and rail freight users will be a core part of developing the future strategy, building on the existing rail industry planning processes wherever possible.”379
306. Rail freight is important to the UK economy, but it has largely been ignored during the development of plans for HS2. The Government should set out in more detail how HS2 will benefit rail freight and how it will address the concerns raised by the freight industry.
307. We also received evidence on the whether improving east-west connections would be more beneficial to freight than improving north-south connections. This is considered in Chapter 7.
377 Q 108 378 HS2 Growth Taskforce, p 8 379 Department for Transport, Getting set for HS2: Responding to the HS2 Growth Task Force, July 2014, p 13:
https://www.gov.uk/government/uploads/system/uploads/attachment_data/file/336035/response-hs2.pdf [accessed February 2015]
92 THE ECONOMICS OF HIGH SPEED 2
Chapter 6: Conclusions and recommendations
308. Evidence we have heard shows that investing in transport infrastructure does not necessarily lead to economic growth. Improvements in transport infrastructure need to be carefully chosen and linked with other policies to ensure that money is spent where it can be most effective in stimulating growth. (Paragraph 247)
309. We heard evidence that London was likely to be the biggest beneficiary from HS2. This has been the case with similar projects in other countries where the largest cities have benefitted the most, including in France where Paris was the biggest beneficiary from the TGV. This does not mean other cities may not receive some economic benefit from HS2, which could stimulate growth and play a role in rebalancing the economy if coupled with appropriate policies to foster economic growth. (Paragraph 277)
310. HS2 must not lead to a reduction in investment in improving other areas of the UK rail network. Investment on lines such as the East Coast Main Line north of Leeds, or rail services elsewhere in the country, could play an important role in stimulating growth outside of the South-East. Any reduction as a result of HS2 could mean these areas lose out. (Paragraph 278)
311. Stations located outside city centres as proposed for Sheffield Meadowhall and the East Midlands Hub HS2 stations are less likely to bring economic benefit to the cities in which they are situated. Where stations cannot be located in city centres they must be properly connected into regional transport networks to ensure the maximum benefit is derived from them. (Paragraph 286)
312. It is important that stations are linked into local transport networks in order to reduce the risk that HS2 brings little or no economic benefit to nearby areas. We agree with the Growth Task Force that the Government should provide leadership nationally to ensure that the right steps are taken to prepare cities with stations for HS2. (Paragraph 295)
313. As noted in Chapter 2, concerns have been raised that the full cost of complementary projects required to maximise the benefits of HS2 have not been captured. The cost of any additional work undertaken in cities to ensure the maximum benefit is derived from HS2 and who is to pay for it needs to be made clear to ensure the right decisions are made. (Paragraph 296)
314. Rail freight is important to the UK economy, but it has largely been ignored during the development of plans for HS2. The Government should set out in more detail how HS2 will benefit rail freight and how it will address the concerns raised by the freight industry. (Paragraph 306)
THE ECONOMICS OF HIGH SPEED 2 93
CHAPTER 7: IS HS2 THE BEST WAY TO STIMULATE ECONOMIC
GROWTH IN THE NORTH OF ENGLAND?
315. In the previous Chapter we considered whether HS2 will provide economic benefits to the UK and how this growth might be distributed across the country. We concluded that investing in transport infrastructure can help increase productivity and that HS2 is likely to bring some benefit for cities served by HS2.
316. In this Chapter we examine what other options for transport investment might stimulate economic growth outside London. We focus on two particular alternative proposals for generating growth in the north—improving links between cities in the north or prioritising the construction of the northern legs of HS2 ahead of the London–Birmingham section of HS2.
Improving regional connectivity
Would improving regional connectivity be more effective? 317. Academics held different views about whether improving long distance high
speed transport connections would be the most effective way of stimulating economic growth. Professor Graham said, “the question is about whether high speed is the best way to achieve growth or productivity … I do not think the answer is necessarily yes.” He clarified that, “rather than have this big scheme that is connecting cities at long distances, have investment inside cities to improve congestion and relieve the costs of congestion.”380
318. This view was shared by the Eddington study of 2006 (see Box 9 below) which found that concentrating investment on congested urban areas, international gateways and inter-urban links, would provide a “strategic focus” for the transport investment programme. The report concluded that “large projects with speculative benefits and relying on untested technology, are unlikely to generate attractive returns”.381
319. Sir Rod Eddington clarified his view on high-speed rail when he appeared before the Transport Select Committee in 2007. He said that “that high-speed rail with unproven technology and with dubious economic benefits is not something we should be spending £30–40 billion on.”382 However, he confirmed that he had not “brushed away high speed rail”, concluding that, “I have been generally modally agnostic and my observation is that in the densest corridors high-speed rail is a critical part of transport infrastructure.”383
380 QQ 19, 22 381 The Eddington Transport Study, The case for action: Sir Rod Eddington’s advice to Government, December
2006, p 6: http://www.thepep.org/ClearingHouse/docfiles/Eddington.Transport.Study%20-%20Rod.pdf [accessed February 2015]
382 At the time Sir Rod Eddington was giving this evidence to the Transport Select Committee proposals for a “maglev” train running at 500 kph from London to Glasgow were under consideration.
383 Oral evidence taken before the Transport Select Committee, 16 April 2007 (Session 2006–07), Q 40 (Sir Rod Eddington)
94 THE ECONOMICS OF HIGH SPEED 2
Box 9: The Eddington Study
Sir Rod Eddington undertook his transport study, published in December 2006, “to advise the Government on the long-term links between transport and the UK’s economic productivity, growth and stability, within the context of the Government’s commitment to sustainable development.”
The Study recommended that “the strategic economic priorities for long term transport policy should be growing and congested urban areas and their catchments; the key inter-urban corridors; and the key international gateways.”
The Study noted that “The economic case for targeted new infrastructure is strong and offers very high returns”. It recommend that “smaller projects which unblock pinch-points, variable infrastructure schemes to support public transport in urban areas and international gateway surface access projects are likely to offer the very highest returns, sometimes higher than £10 for every pound spent. However, large projects with speculative benefits and relying on untested technology, are unlikely to generate attractive returns.” 384 Source: Eddington Study
320. Professor Venables took a different view from the conclusions of the Eddington Study. He argued, “we need to do something rather serious about making some of the regions more attractive places to work, to do business and to live … I think fairly ambitious transport comes in that set.”385 Sir Richard Leese, Leader of Manchester City Council, agreed and referred to the Northern Way project which compared investment in local transport infrastructure and intercity links, concluding that “you got more benefit out of investment in intercity links than you did from investment in local transport infrastructure.”386
What are the proposals for improving local and regional connectivity? 321. No firm proposals have yet been made by the Department for Transport for
improving regional connectivity in the north or the Midlands. Several high profile figures have however lent their support to improving these links. The Chancellor and the Prime Minister have supported plans for an east-west rail link, with the Chancellor saying in June 2014:
“We need an ambitious plan to make the cities and towns here in this northern belt radically more connected from east to west—to create the equivalent of travelling around a single global city. As well as fixing the roads, that means considering a new high speed rail link. Today I want us to start thinking about whether to build a new high speed rail connection east-west from Manchester to Leeds.”387
322. Sir David Higgins said in his report Rebalancing Britain: From HS2 towards a national transport strategy that “substantially improved services East-West across the North are not only desirable, but possible. We need to turn the
384 Eddington Study, pp 1–7 385 Q 22 386 Q 149 387 George Osborne speech on 23 June 2014 at Museum of Science and Industry, Manchester. Speech
available at: https://www.gov.uk/government/speeches/chancellor-we-need-a-northern-powerhouse [accessed March 2015]
THE ECONOMICS OF HIGH SPEED 2 95
aspiration into a practical plan.”388
323. Improvements to east-west links in the north of England have often been referred to as “HS3”. This term has been used interchangeably to mean the connection between Leeds and Manchester or a longer route running from Liverpool to Hull via Manchester and Leeds. Such a railway would not necessarily need to be high-speed. Sir David Higgins said that: “You would never build a 225 mile per hour [360 kph] railway line between Manchester and Leeds. You would be getting off just as you sat down.”389 We refer to ‘east-west links’ rather than ‘HS3’ in this report as there is no clear indication yet what form or route the proposals might take or if the trains will be “high speed” in the same sense as HS2.
324. It is not known what the cost of any project would be as no plans have been announced. It has been suggested that plans to build a line from Manchester to Leeds would cost £7 billion, although Ms Munro of HS2 Ltd told us that £7 billion “was not our figure and I think it was simply if you took the per mile cost of High Speed 2 and applied it to High Speed 3.”390 Plans have been mooted to connect cities including Manchester, Leeds, Sheffield, Hull and Liverpool. Other suggestions have been made for how to improve regional connectivity which do have more detail (see Box 10).
Box 10: Proposals for improving east-west links
One North
The report One North, a Proposition for an Interconnected North,391 sets out a proposal for improving transport links to maximise economic growth across the north. The proposal was developed by representatives from Manchester, Liverpool, Leeds, Newcastle and Sheffield and is supported by a number of other cities including Hull, Bradford, Wakefield and York.
The report proposes plans for 150 per cent additional capacity on roads and up to 55 per cent increase in journey times on a faster, more frequent, interconnected rail network. The proposals also include a new trans-Pennine railway and improvements to freight movements.
The One North report is intended to complement, rather than replace, HS2 proposals and includes plans to speed up the implementation of HS2 Phase 2.
Midlands Connect
The report, Midlands Connect: How better connectivity will maximise growth for the Midlands and the nation392 was developed by a collaboration of Local Enterprise Partnerships and Local Authorities across the Midlands. Like One North, Midlands Connect builds on the HS2 proposals with the intention of providing a plan for investment in road and rail infrastructure to stimulate economic growth in the Midlands.
388 Rebalancing Britain, p 9 389 Q 254 390 Q 70 391 One North, A Proposition for an Interconnected North, July 2014: http://www.manchester.gov.uk/downloads/
download/5969/one_north [accessed February 2015] 392 Midlands Connect, How better connectivity will maximise growth for the Midlands and the nation, July 2014:
http://www.wmita.org.uk/media/1069/midlandsconnect_a4brochure_final_lowres.pdf [accessed February 2015]
96 THE ECONOMICS OF HIGH SPEED 2
Should east-west links be improved? 325. Witnesses were in agreement about the generally poor state of connections
between northern cities. David Thrower, Transport Consultant, North West Business Leadership Team, described northern city-to-city connectivity as “remarkably poor”.393 Mr Blackett agreed, noting that there was potential for the development of east-west links in the Midlands: “we have barely understood connectivity east-west and have barely even thought about it.”394
326. Lord Deighton suggested that plans for improving trans-Pennine regional connectivity were “Crossrail for the north. It takes the journey from Manchester to Leeds and makes it look like the journey from Heathrow to Canary Wharf on Crossrail.”395 Michele Dix of Transport for London agreed: “The interesting thing is how close Leeds and Manchester are. A line between them would be no longer than the Central Line. So we would support a clustering of the northern cities.”396
327. Some witnesses were keen to point out that HS2 itself would help improve connectivity between cities other than London. Sir Richard Leese told us that “One thing that we have not adequately conveyed is that HS2 is not exclusively linked to London. If you are on the east coast, the links between Leeds, Sheffield and Nottingham are vastly improved, as are the links to Birmingham on the west coast.”397
328. The economist Jim O’Neill, Chair of the Cities Growth Commission, agreed that improvements should be made to east-west links. He said that there was “quite a rise in commuting going on between Manchester, Leeds, Sheffield and Liverpool, in particular going into Manchester and Leeds from both those cities, but especially from Leeds and Sheffield.” He felt that “the best interventions are when the trend has turned or is turning”, concluding that “if you can explore non-too-expensive ways of trying to boost connectivity between those very closely geographic urban centres, you can probably get some agglomeration benefits that otherwise you cannot.”398
Should improving regional connectivity be prioritised ahead of HS2? 329. We asked witnesses whether they would prioritise improvements to regional
connectivity ahead of building HS2. Representatives of cities with HS2 stations did not agree that improved trans-Pennine links should be prioritised ahead of HS2. Sir Richard Leese told us that “We will not be able to get effective links between Leeds, Sheffield and Manchester in an economically sustainable way without that high-speed line, in particular between Sheffield and Leeds. That is a prerequisite in order to be able to get that effective east-west link.”399 Mr Williams’ response to the question of prioritisation was
393 Q 151 394 Q 159 395 Q 225 396 Q 200 397 Q 144 398 Q 261 399 Q 150
THE ECONOMICS OF HIGH SPEED 2 97
representative of the views of the cities with HS2 stations: “This is not an either/or … We want the lot, because our connectivity is poor.”400
330. Representatives of cities that were not on HS2 were generally in favour of prioritising improved east-west links. The Mayor of Liverpool told us “if I had a choice between HS2 or HS3, I would go for HS3 all the time, because it is seriously about connecting cities to drive economic growth in those cities to genuinely rebalance the economy.”401 Dr Kelly agreed, telling us that Hull and Humber Chambers of Commerce “do very much like HS3, particularly if it is what we call the Hullerpool line, going right through from Hull to Liverpool. That is a particularly good idea and offers much more significant, immediate benefits to our part of the world.”402
331. Several witnesses suggested that freight would benefit more from improved east-west connections than from improved north-south connections. Professor Glaister said that “As for freight, you need to serve the ports and bring stuff east-west, not north-south. It [HS2] will not be very helpful with those kinds of movements.”403 The Rail Freight Group said that “Capacity is increasingly tight, with the north Transpennine routes already having little or no available freight capacity. Investment to create new capacity … is therefore critical.” They added the caveat that their backing assumed “that HS3 does not delay, or de-scope HS2”, which they supported.404 20 Miles More suggested that building a spur from HS2 to Liverpool “would not only put Liverpool on the HS2 network but would be the start of HS3, from Liverpool to Manchester, Leeds and beyond.”405
332. Mr O’Neill agreed that improving links between northern cities should be prioritised ahead of HS2. He told us that “an absolute minimum thing is to connect them [northern cities] all in a vastly better way than they are today”.406 He later said that “connecting all these places [northern cities] together, is in my judgment way more important” than making it faster to travel to London from these cities.407 Chris Stokes, former executive director at the Strategic Rail Authority, noted that investment in regional links in the north of England would produce “greater and faster benefits” than HS2, “both during the construction phase [and] … the decongestion and agglomeration benefits produced by better connectivity in the region.”408
333. The Secretary of State argued that it was not “one or the other. I do think that the east-west links are part of the same issue and solution.”409
400 Q 186 401 Q 133 402 Q 133 403 Q 48 404 Written evidence from Rail Freight Group (EHS0035) 405 Written evidence from 20 Miles More (EHS0051) 406 Q 256 407 Q 259 408 Written evidence from Chris Stokes (EHS0105) 409 Q 229
98 THE ECONOMICS OF HIGH SPEED 2
Building HS2 from north to south?
334. It has been suggested that HS2 should be built from north to south (i.e. the sections connecting Birmingham with Manchester and with the East Midlands, Sheffield and Leeds should be built before the section between London and Birmingham). This received support from some witnesses, 410 including Mr O’Neill who told us “if the purpose is to think about helping those urban areas to grow more, and if it is done just in its own right or to balance the contribution to national GDP, it would be great if it was done the other way round”.411
335. Sir David Higgins, however, told us that building Phase Two ahead of Phase One was no longer practical: “You may have considered it five or six years ago, but the legislative process is such that getting the second phase through Parliament will take, if things go well, until 2021.”412 We note that the Parliamentary process is not an insurmountable obstacle and should not be treated as such if all other evidence points to a different solution being the most cost-effective.
336. Mr Prout agreed that the legislative process would make reversing the order of the phases difficult, but noted that the problem was “a practical one, which could of course be overcome by delay.” He said a more fundamental problem was that it was more important to address “capacity constraints between Birmingham and London that are causing the problems on the West Coast Main Line. You basically have to tackle those first, otherwise by freeing up the routes to the north all you do is free them up and put them into a traffic jam.”413
The importance of investment in infrastructure outside London
337. Representatives from the north and Midlands repeatedly made the point to us that investment in infrastructure in the north had been historically much lower than London and that HS2 was the opportunity to correct this balance by investing in the North as it had cross party support. Simon Green of Sheffield City Council noted that it was “130 years since we have had any major physical rail investment north of Watford.”414
338. An IPPR North report, Still on the wrong track: an updated analysis of transport infrastructure spending, found that:
“Measured on a per-capita basis, where government money is involved, this shows that as a nation we are planning to spend nearly £2,600 on transport infrastructure for each Londoner: 500 times as much as the £5 per person for the North East; 150 times as much as in the South West [£18 per person]; 20 times as much as the per capita figure for the
410 See Q 140 (Dr Ian Kelly), Q 190 (Ian Williams) 411 Q 259 412 Q 250 413 Q 74 414 Q 172
THE ECONOMICS OF HIGH SPEED 2 99
North West [£99 per person], and over 16 times as much as in Yorkshire and the Humber [£160 per person].”415
339. Several witnesses compared the cost of HS2 to infrastructure projects in London under construction including ThamesLink and Crossrail. Sir Richard Leese argued that “The estimated total cost of the package between now and 2030 for the entire pan-northern scheme for the north of England, which includes all the incremental bits and so on, is less than the cost of Crossrail.”416 Mr Thrower agreed, telling us that “London did not have to choose between Thameslink and Crossrail; it rightly has both and is rightly looking at having Crossrail 2.”417
Chapter 7: Conclusions and recommendations
Is HS2 the best way to stimulate growth outside London? 340. We have heard much support for improving regional links between
cities in the north to stimulate economic growth and we agree that investment in this area is necessary and long overdue. The Government failed to consider whether improving these links was a better option than HS2 for encouraging growth in the north.
341. As east-west links are currently poor and north-south links are already good, there is a strong case for investment to improve the former as the benefits to be derived from improving journeys between cities in the north are likely to be greater than the benefits from improving north-south links. We urge the Government to speed up its assessment of the options for improving east-west links in order that they can be considered against proposals for HS2. This assessment should include consideration of the benefits of such a scheme for rail freight.
415 Institute for Public Policy Research North, Still on the wrong track: an updated analysis of transport infrastructure spending, June 2013: http://www.ippr.org/assets/media/images/media/files/publication/2013/06/ still-on-the-wrong-track_June2013_10933.pdf [accessed February 2015]
416 Q 151 417 Q 151
100 THE ECONOMICS OF HIGH SPEED 2
CHAPTER 8: ESTIMATING THE BENEFITS OF HS2
342. The calculation of the benefits of HS2 forms part of the cost-benefit analysis of the project. The Economic Case presents the benefits as follows:
Table 20: Estimated benefits of HS2 (2011 prices)
Phase One Full network Benefit Benefit
value (£ billion)
Percentage of total
Benefit value (£ billion)
Percentage of total
Transport User Benefits
24.6 87% 59.9 84%
Wider Economic Impacts
4.3 15% 13.3 19%
Other impacts 0.4 1% 0.8 1%
Loss to government of Indirect tax
-1.2 -4% -2.9 -4%
Total 28.1 100% 71.0 100% Source: Economic Case, Table 15.
343. The following table shows the benefit-cost ratio for Phase One of HS2 and the full network, both with and without the wider economic impacts (WEIs):
Table 21: Benefit-cost ratio (BCR) of HS2 with/without wider economic impacts
Phase One Full Network BCR without WEIs (ratio) 1.4 1.8
BCR with WEIs (ratio) 1.7 2.3 Source: Economic Case, Table 15.
344. The vast majority of the benefits relate to time savings by transport users. These are calculated by applying a monetary value to the time saved by business, commuter and leisure travellers as a result of HS2. The wider economic impacts are largely benefits from increased productivity and are explored in Chapter 6.
345. This Chapter considers the suitability of cost-benefit analysis for assessing the benefits of HS2. It also examines the assumptions used in the valuation of time savings: the predicted proportion of business, commuter and leisure travellers using HS2 and the values of travel time savings assigned to each of those purposes.
Cost-benefit analysis of HS2
346. The Economic Case sets out the cost-benefit analysis for the project. Following HM Treasury’s Green Book principles, the Department for Transport requires a cost-benefit analysis to be carried out for the appraisal of all transport projects that require Government approval. The
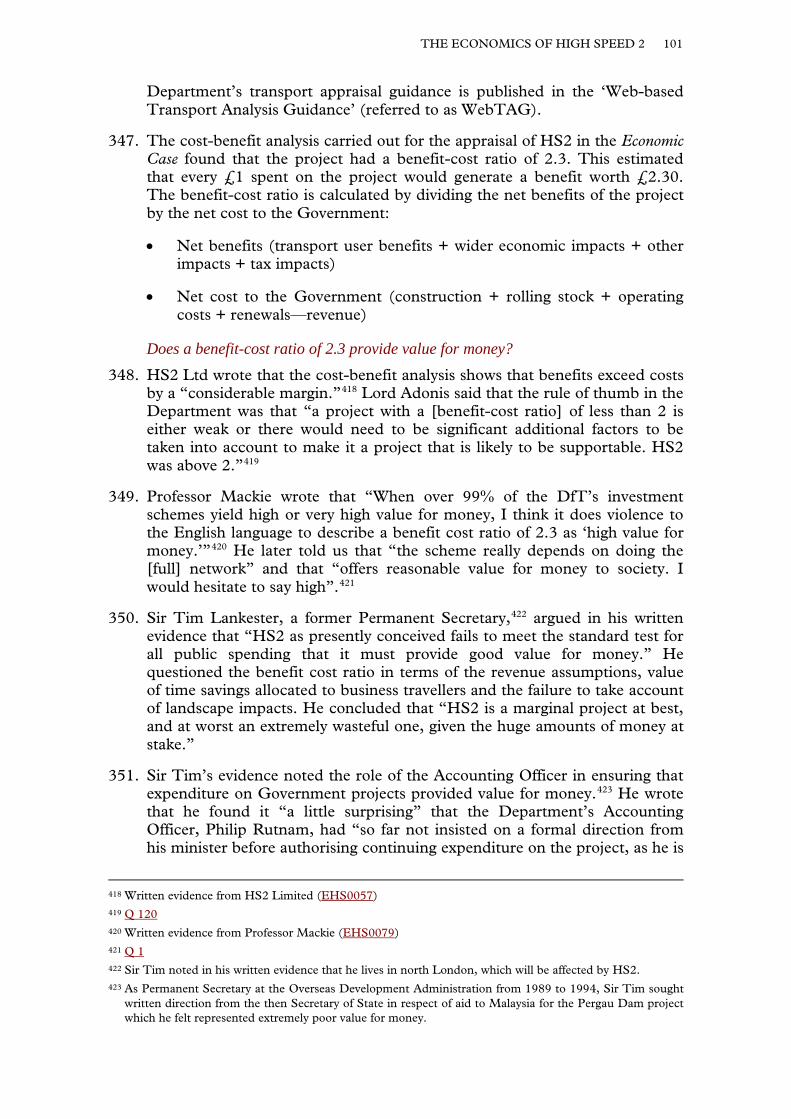
THE ECONOMICS OF HIGH SPEED 2 101
Department’s transport appraisal guidance is published in the ‘Web-based Transport Analysis Guidance’ (referred to as WebTAG).
347. The cost-benefit analysis carried out for the appraisal of HS2 in the Economic Case found that the project had a benefit-cost ratio of 2.3. This estimated that every £1 spent on the project would generate a benefit worth £2.30. The benefit-cost ratio is calculated by dividing the net benefits of the project by the net cost to the Government:
• Net benefits (transport user benefits + wider economic impacts + other impacts + tax impacts)
• Net cost to the Government (construction + rolling stock + operating costs + renewals—revenue)
Does a benefit-cost ratio of 2.3 provide value for money? 348. HS2 Ltd wrote that the cost-benefit analysis shows that benefits exceed costs
by a “considerable margin.”418 Lord Adonis said that the rule of thumb in the Department was that “a project with a [benefit-cost ratio] of less than 2 is either weak or there would need to be significant additional factors to be taken into account to make it a project that is likely to be supportable. HS2 was above 2.”419
349. Professor Mackie wrote that “When over 99% of the DfT’s investment schemes yield high or very high value for money, I think it does violence to the English language to describe a benefit cost ratio of 2.3 as ‘high value for money.’”420 He later told us that “the scheme really depends on doing the [full] network” and that “offers reasonable value for money to society. I would hesitate to say high”.421
350. Sir Tim Lankester, a former Permanent Secretary,422 argued in his written evidence that “HS2 as presently conceived fails to meet the standard test for all public spending that it must provide good value for money.” He questioned the benefit cost ratio in terms of the revenue assumptions, value of time savings allocated to business travellers and the failure to take account of landscape impacts. He concluded that “HS2 is a marginal project at best, and at worst an extremely wasteful one, given the huge amounts of money at stake.”
351. Sir Tim’s evidence noted the role of the Accounting Officer in ensuring that expenditure on Government projects provided value for money.423 He wrote that he found it “a little surprising” that the Department’s Accounting Officer, Philip Rutnam, had “so far not insisted on a formal direction from his minister before authorising continuing expenditure on the project, as he is
418 Written evidence from HS2 Limited (EHS0057) 419 Q 120 420 Written evidence from Professor Mackie (EHS0079) 421 Q 1 422 Sir Tim noted in his written evidence that he lives in north London, which will be affected by HS2. 423 As Permanent Secretary at the Overseas Development Administration from 1989 to 1994, Sir Tim sought
written direction from the then Secretary of State in respect of aid to Malaysia for the Pergau Dam project which he felt represented extremely poor value for money.
102 THE ECONOMICS OF HIGH SPEED 2
required to do under Treasury rules if the value for money test fails to be met.” He noted that Mr Rutnam had sought formal direction from the Minister in February 2015 in relation to the proposal to issue invitations to tender for the Northern and Transpennine Express franchises.”424
352. Professor Overman noted that as the benefit-cost ratio without the wider economic impacts was 1.8, he found it “surprising” that the Department referred to ratios between 1.5 and 2.0 as ‘medium value for money’: “they are probably in the bottom 10% … of transport projects that we have on the books as doable.”425 He said that “the returns on it are not great but they are not awful. It is a sort of mediocre, medium-type return project.”426
353. We asked Mr Prout of the Department for Transport if he agreed with Professor Overman’s analysis. He replied that the Department had published statistics on the value for money of the schemes it has funded since 2011:
Table 22: Percentage of transport spend by value for money category since 2011
Year Percentage of spend by value for money category Poor (0–1.0)
Low (1.0–1.5)
Medium (1.5–2.0)
High (2.0–4.0)
Very High (4.0+)
2013 0 0 6 80 14
2012 0 0 0 42 58
2011 0 0 0 63 37 Source: Letter from David Prout to the Chairman, 7 November 2014
354. Mr Prout concluded that a benefit-cost ratio of 2.3 “places HS2 in the same [value for money] category as the majority of transport spending by [Department for Transport] over the past three years.”427
355. We asked the Secretary of State to provide a breakdown of the benefit-cost ratios of transport spending which fell in the ‘High’ value for money category. The Secretary of State told us that the Department “does not hold a central register of individual BCRs … the Value for Money (VfM) category is central to informing the Department’s decision making it is this information that DfT holds centrally for transparency purposes.” 428 We are surprised that, while the Department is able to provide a breakdown between projects of low value for money (1.0–1.5) and medium value for money (1.5–2.0), it is apparently unable to distinguish between projects with a value for money of 2.0–3.0 and 3.0–4.0. This may of course be because the majority of projects in the 2.0–4.0 range (80 per cent of all projects in 2013) were, unlike HS2, in the 3.0–4.0 range.
424 Written evidence from Tim Lankester (EHS0107) 425 Q 49 426 Q 58 427 Letter from David Prout to the Chairman, 7 November 2014 428 Letter from the Secretary of State to the Chairman, 3 March 2015
THE ECONOMICS OF HIGH SPEED 2 103
Suitability of cost-benefit analysis for assessing large projects 356. A number of witnesses questioned the suitability of cost-benefit analysis for
assessing large, long-term projects.
Cost-benefit analysis underestimates the likely benefits
357. Lord Deighton explained that this way of assessing projects:
“Does not really quite match a transformational project. The more transformational and the bigger the project, the more important the wider economic benefits are … let us put behind us assessing the costs and benefits, because you can only go so far before you reach diminishing returns”.429
358. The Department for Transport agreed and said there was “good reason” to believe that the return on the investment could be higher as the analysis uses “conservative assumptions” like capping growth in passenger demand in 2036.430 Lord Adonis took a similar view, describing the assumption as “crazy”431
Doubts over suitability for decision-making on large infrastructure projects 359. Lord Adonis told us that he had always been “somewhat sceptical” of
benefit-cost ratios: “My own view is that this is an aid to policymaking, but it should not be a substitute for judgment … aggregating small journey time savings is a debatable and maybe not particularly fruitful endeavour.”432
360. The Transport Studies Unit from the University of Oxford described cost-benefit analysis as “contested and problematic.”433 They thought that because the Government’s estimate of the benefit-cost ratio (excluding wider economic impacts) fell from 2.2 to 1.8 between February 2011 and October 2013, this indicated that “the volatility of economic conditions and forecasts can have major impacts on the credibility of large infrastructure projects such as HS2, and bring into doubt the suitability of [benefit-cost ratios] as a guide to decision making.”434
361. A recent article by Professor Dieter Helm, Professor of Energy Policy at Oxford University, was cited to us in evidence from the Transport Studies Unit. The article discussed the use of cost-benefit analysis for assessing large infrastructure projects:
“A moment’s reflection indicates how weak such techniques are when it comes to deciding how much infrastructure to provide. For infrastructure typically comes in systems, not discrete bits. Choosing what sort and level of infrastructure to supply is not a marginal decision.
429 Q 228 430 Written evidence from Department for Transport (EHS0021) 431 Q 115 432 Q 116 433 Written evidence from the Transport Studies Unit (EHS0058) 434 Written evidence from the Transport Studies Unit (EHS0058)
104 THE ECONOMICS OF HIGH SPEED 2
It is often about one system or another. Marginal analysis—as the core of cost-benefit analysis]—has little obvious to offer.”435
362. As an example to illustrate his point, he discussed HS2, saying the question is “not whether to build a new line to Birmingham from London, or to weigh up the costs and benefits to the existing economy. It is whether to have a high-speed rail system, within which the particular section would fit.”436
Support for the technique 363. Lord Deighton said the technique was “an important discipline … you
always begin with a standard cost-benefit analysis, because then you can rank projects and not get too carried away.”437 Sir David Higgins, Chair of HS2 Ltd, similarly said it was a “method of rating various infrastructure projects against other infrastructure projects” and it could be “relied on.”438
364. Mr Prout told us that Professor Venables and Professor Overman had recently completed a study reviewing the Department’s guidance on how to estimate the effects of transport investment on economic performance: “they come from very different standpoints … and their conclusion is that our [benefit-cost ratios] are robust and our processes are world class.”439 Professor Overman described the results of the cost-benefit analysis as “reasonably good central estimates.”440
365. The Jubilee Line extension and M25 were mentioned by some witnesses as successful projects that had low benefit-cost ratios. Lord Adonis said the projects had “much weaker” benefit-cost ratios than HS2 but “nobody would dream now [of] revisiting.”441 The Secretary of State said that the Jubilee Line had a benefit-cost ratio of 0.9 but he thought “without taking that kind of punt … we would not have seen the kind of transformation that we have seen in that area.”442 Lord Deighton however said that “we talk about the Jubilee Line and the M25, and we only ever remember the ones that had much wider economic benefits, so I think the retrospective analysis does give you a bit of an optimism bias.”443
366. Cost-benefit analysis is an important discipline; it is the best tool for comparing several projects to see which provides the best value for money. But the reliability of the method for quantifying the benefits of a project depends upon the quality of the evidence used in the analysis.
435 Dieter Helm, ‘British Infrastructure and the Gradual Return of the State’, Oxford Review of Economic Policy, vol. 29, no. 2, (2013), pp 287-306
436 Ibid. 437 Q 228 438 Q 239 439 Q 219 440 Q 49 441 Q 116 442 Q 227 443 Q 228
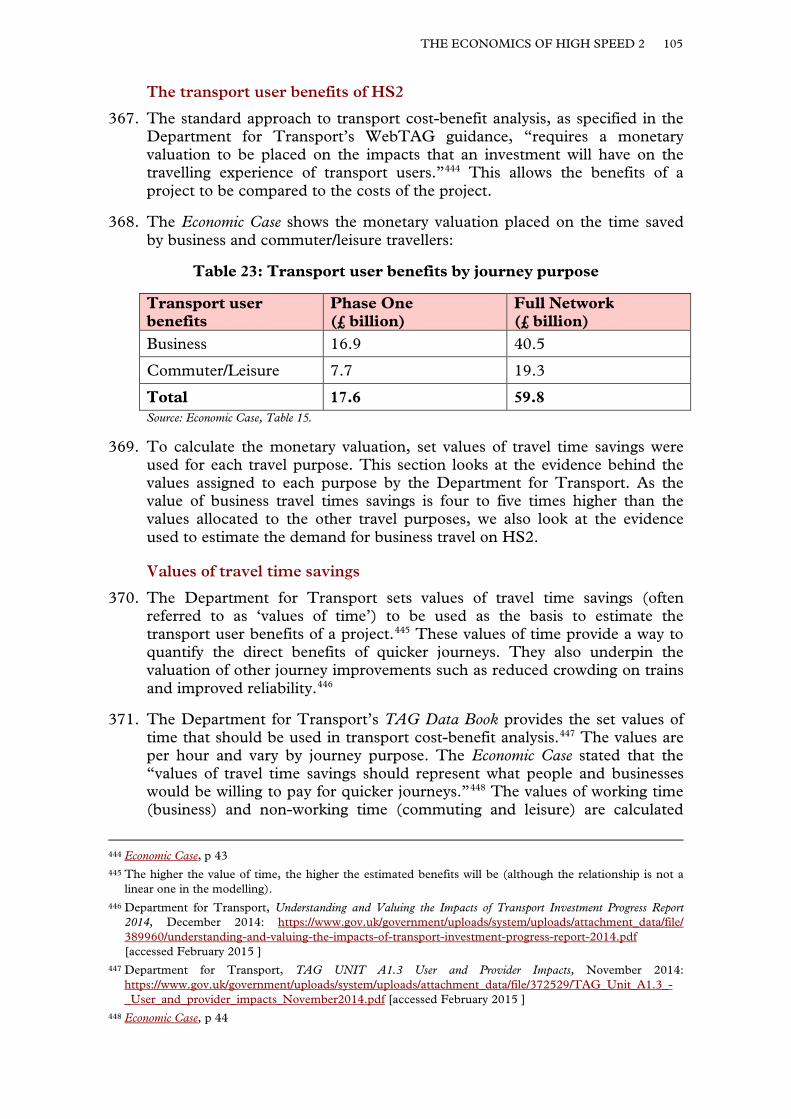
THE ECONOMICS OF HIGH SPEED 2 105
The transport user benefits of HS2
367. The standard approach to transport cost-benefit analysis, as specified in the Department for Transport’s WebTAG guidance, “requires a monetary valuation to be placed on the impacts that an investment will have on the travelling experience of transport users.”444 This allows the benefits of a project to be compared to the costs of the project.
368. The Economic Case shows the monetary valuation placed on the time saved by business and commuter/leisure travellers:
Table 23: Transport user benefits by journey purpose
Transport user benefits
Phase One (£ billion)
Full Network (£ billion)
Business 16.9 40.5
Commuter/Leisure 7.7 19.3
Total 17.6 59.8 Source: Economic Case, Table 15.
369. To calculate the monetary valuation, set values of travel time savings were used for each travel purpose. This section looks at the evidence behind the values assigned to each purpose by the Department for Transport. As the value of business travel times savings is four to five times higher than the values allocated to the other travel purposes, we also look at the evidence used to estimate the demand for business travel on HS2.
Values of travel time savings
370. The Department for Transport sets values of travel time savings (often referred to as ‘values of time’) to be used as the basis to estimate the transport user benefits of a project.445 These values of time provide a way to quantify the direct benefits of quicker journeys. They also underpin the valuation of other journey improvements such as reduced crowding on trains and improved reliability.446
371. The Department for Transport’s TAG Data Book provides the set values of time that should be used in transport cost-benefit analysis.447 The values are per hour and vary by journey purpose. The Economic Case stated that the “values of travel time savings should represent what people and businesses would be willing to pay for quicker journeys.”448 The values of working time (business) and non-working time (commuting and leisure) are calculated
444 Economic Case, p 43 445 The higher the value of time, the higher the estimated benefits will be (although the relationship is not a
linear one in the modelling). 446 Department for Transport, Understanding and Valuing the Impacts of Transport Investment Progress Report
2014, December 2014: https://www.gov.uk/government/uploads/system/uploads/attachment_data/file/ 389960/understanding-and-valuing-the-impacts-of-transport-investment-progress-report-2014.pdf [accessed February 2015 ]
447 Department for Transport, TAG UNIT A1.3 User and Provider Impacts, November 2014: https://www.gov.uk/government/uploads/system/uploads/attachment_data/file/372529/TAG_Unit_A1.3_-_User_and_provider_impacts_November2014.pdf [accessed February 2015 ]
448 Economic Case, p 44
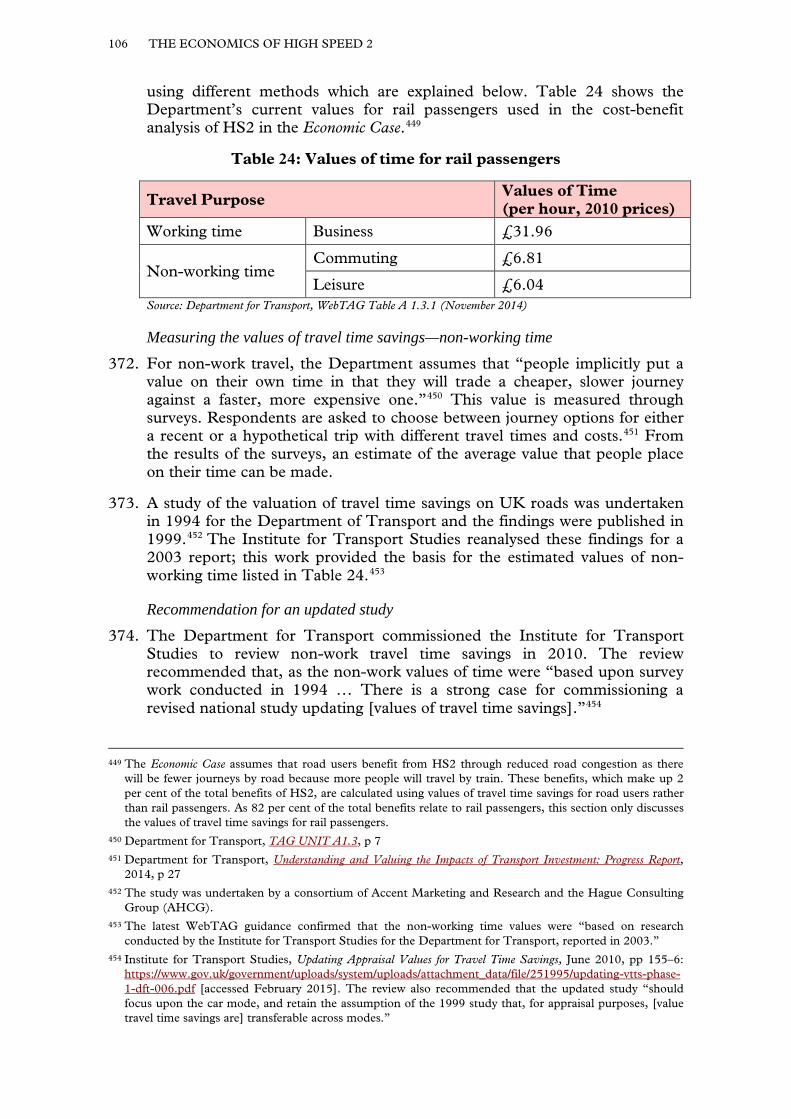
106 THE ECONOMICS OF HIGH SPEED 2
using different methods which are explained below. Table 24 shows the Department’s current values for rail passengers used in the cost-benefit analysis of HS2 in the Economic Case.449
Table 24: Values of time for rail passengers
Travel Purpose Values of Time (per hour, 2010 prices)
Working time Business £31.96
Non-working time Commuting £6.81
Leisure £6.04 Source: Department for Transport, WebTAG Table A 1.3.1 (November 2014)
Measuring the values of travel time savings—non-working time 372. For non-work travel, the Department assumes that “people implicitly put a
value on their own time in that they will trade a cheaper, slower journey against a faster, more expensive one.”450 This value is measured through surveys. Respondents are asked to choose between journey options for either a recent or a hypothetical trip with different travel times and costs.451 From the results of the surveys, an estimate of the average value that people place on their time can be made.
373. A study of the valuation of travel time savings on UK roads was undertaken in 1994 for the Department of Transport and the findings were published in 1999.452 The Institute for Transport Studies reanalysed these findings for a 2003 report; this work provided the basis for the estimated values of non-working time listed in Table 24.453
Recommendation for an updated study 374. The Department for Transport commissioned the Institute for Transport
Studies to review non-work travel time savings in 2010. The review recommended that, as the non-work values of time were “based upon survey work conducted in 1994 … There is a strong case for commissioning a revised national study updating [values of travel time savings].”454
449 The Economic Case assumes that road users benefit from HS2 through reduced road congestion as there will be fewer journeys by road because more people will travel by train. These benefits, which make up 2 per cent of the total benefits of HS2, are calculated using values of travel time savings for road users rather than rail passengers. As 82 per cent of the total benefits relate to rail passengers, this section only discusses the values of travel time savings for rail passengers.
450 Department for Transport, TAG UNIT A1.3, p 7 451 Department for Transport, Understanding and Valuing the Impacts of Transport Investment: Progress Report,
2014, p 27 452 The study was undertaken by a consortium of Accent Marketing and Research and the Hague Consulting
Group (AHCG). 453 The latest WebTAG guidance confirmed that the non-working time values were “based on research
conducted by the Institute for Transport Studies for the Department for Transport, reported in 2003.” 454 Institute for Transport Studies, Updating Appraisal Values for Travel Time Savings, June 2010, pp 155–6:
https://www.gov.uk/government/uploads/system/uploads/attachment_data/file/251995/updating-vtts-phase-1-dft-006.pdf [accessed February 2015]. The review also recommended that the updated study “should focus upon the car mode, and retain the assumption of the 1999 study that, for appraisal purposes, [value travel time savings are] transferable across modes.”
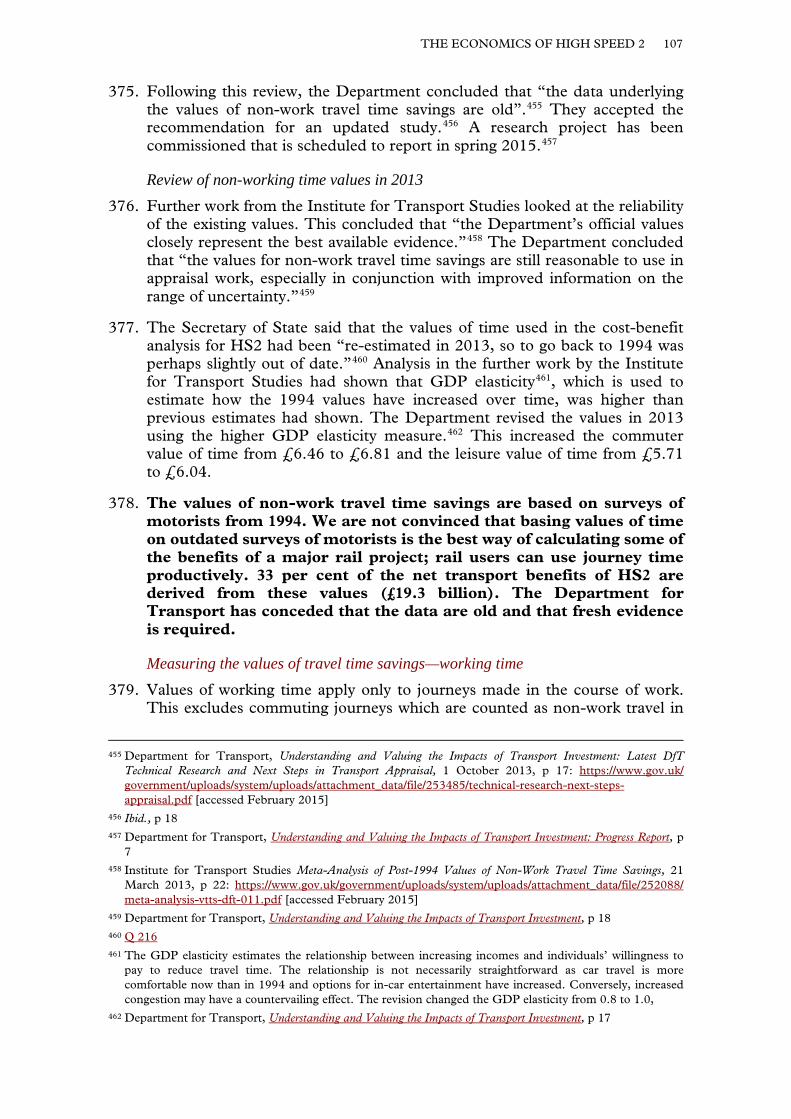
THE ECONOMICS OF HIGH SPEED 2 107
375. Following this review, the Department concluded that “the data underlying the values of non-work travel time savings are old”.455 They accepted the recommendation for an updated study.456 A research project has been commissioned that is scheduled to report in spring 2015.457
Review of non-working time values in 2013 376. Further work from the Institute for Transport Studies looked at the reliability
of the existing values. This concluded that “the Department’s official values closely represent the best available evidence.”458 The Department concluded that “the values for non-work travel time savings are still reasonable to use in appraisal work, especially in conjunction with improved information on the range of uncertainty.”459
377. The Secretary of State said that the values of time used in the cost-benefit analysis for HS2 had been “re-estimated in 2013, so to go back to 1994 was perhaps slightly out of date.”460 Analysis in the further work by the Institute for Transport Studies had shown that GDP elasticity461, which is used to estimate how the 1994 values have increased over time, was higher than previous estimates had shown. The Department revised the values in 2013 using the higher GDP elasticity measure.462 This increased the commuter value of time from £6.46 to £6.81 and the leisure value of time from £5.71 to £6.04.
378. The values of non-work travel time savings are based on surveys of motorists from 1994. We are not convinced that basing values of time on outdated surveys of motorists is the best way of calculating some of the benefits of a major rail project; rail users can use journey time productively. 33 per cent of the net transport benefits of HS2 are derived from these values (£19.3 billion). The Department for Transport has conceded that the data are old and that fresh evidence is required.
Measuring the values of travel time savings—working time 379. Values of working time apply only to journeys made in the course of work.
This excludes commuting journeys which are counted as non-work travel in
455 Department for Transport, Understanding and Valuing the Impacts of Transport Investment: Latest DfT Technical Research and Next Steps in Transport Appraisal, 1 October 2013, p 17: https://www.gov.uk/ government/uploads/system/uploads/attachment_data/file/253485/technical-research-next-steps-appraisal.pdf [accessed February 2015]
456 Ibid., p 18 457 Department for Transport, Understanding and Valuing the Impacts of Transport Investment: Progress Report, p
7 458 Institute for Transport Studies Meta-Analysis of Post-1994 Values of Non-Work Travel Time Savings, 21
March 2013, p 22: https://www.gov.uk/government/uploads/system/uploads/attachment_data/file/252088/ meta-analysis-vtts-dft-011.pdf [accessed February 2015]
459 Department for Transport, Understanding and Valuing the Impacts of Transport Investment, p 18 460 Q 216 461 The GDP elasticity estimates the relationship between increasing incomes and individuals’ willingness to
pay to reduce travel time. The relationship is not necessarily straightforward as car travel is more comfortable now than in 1994 and options for in-car entertainment have increased. Conversely, increased congestion may have a countervailing effect. The revision changed the GDP elasticity from 0.8 to 1.0,
462 Department for Transport, Understanding and Valuing the Impacts of Transport Investment, p 17
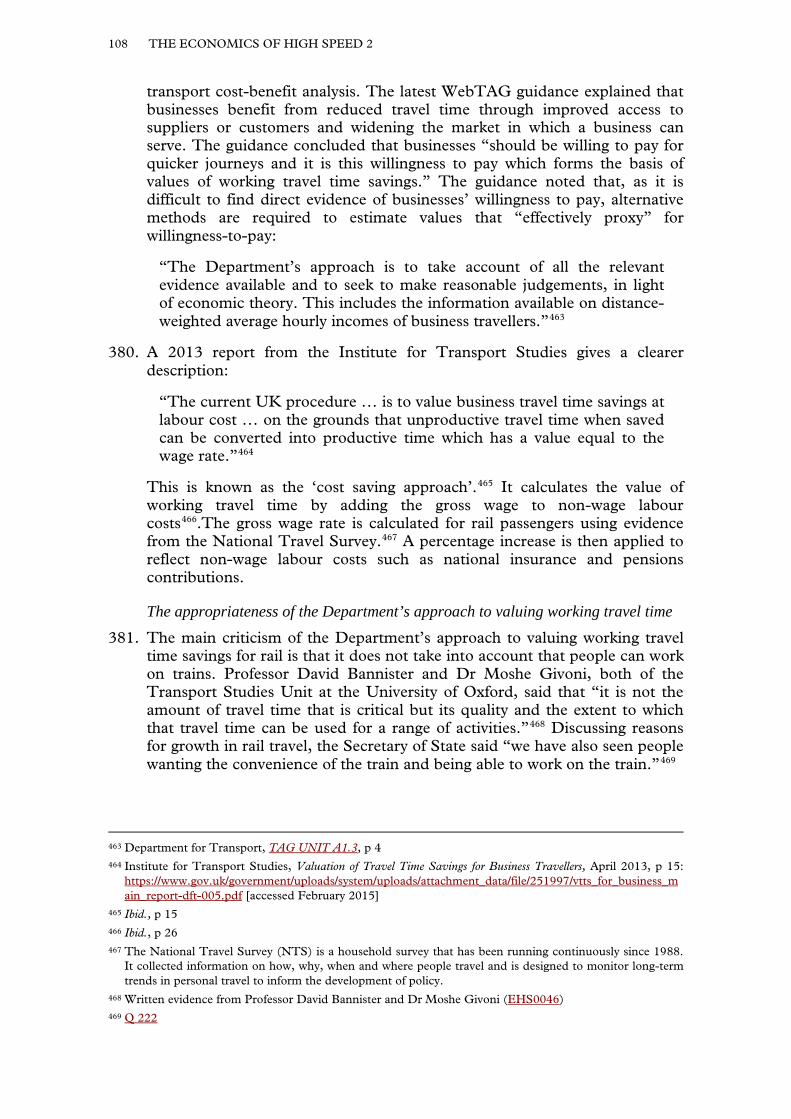
108 THE ECONOMICS OF HIGH SPEED 2
transport cost-benefit analysis. The latest WebTAG guidance explained that businesses benefit from reduced travel time through improved access to suppliers or customers and widening the market in which a business can serve. The guidance concluded that businesses “should be willing to pay for quicker journeys and it is this willingness to pay which forms the basis of values of working travel time savings.” The guidance noted that, as it is difficult to find direct evidence of businesses’ willingness to pay, alternative methods are required to estimate values that “effectively proxy” for willingness-to-pay:
“The Department’s approach is to take account of all the relevant evidence available and to seek to make reasonable judgements, in light of economic theory. This includes the information available on distance-weighted average hourly incomes of business travellers.”463
380. A 2013 report from the Institute for Transport Studies gives a clearer description:
“The current UK procedure … is to value business travel time savings at labour cost … on the grounds that unproductive travel time when saved can be converted into productive time which has a value equal to the wage rate.”464
This is known as the ‘cost saving approach’.465 It calculates the value of working travel time by adding the gross wage to non-wage labour costs466.The gross wage rate is calculated for rail passengers using evidence from the National Travel Survey.467 A percentage increase is then applied to reflect non-wage labour costs such as national insurance and pensions contributions.
The appropriateness of the Department’s approach to valuing working travel time 381. The main criticism of the Department’s approach to valuing working travel
time savings for rail is that it does not take into account that people can work on trains. Professor David Bannister and Dr Moshe Givoni, both of the Transport Studies Unit at the University of Oxford, said that “it is not the amount of travel time that is critical but its quality and the extent to which that travel time can be used for a range of activities.”468 Discussing reasons for growth in rail travel, the Secretary of State said “we have also seen people wanting the convenience of the train and being able to work on the train.”469
463 Department for Transport, TAG UNIT A1.3, p 4 464 Institute for Transport Studies, Valuation of Travel Time Savings for Business Travellers, April 2013, p 15:
https://www.gov.uk/government/uploads/system/uploads/attachment_data/file/251997/vtts_for_business_main_report-dft-005.pdf [accessed February 2015]
465 Ibid., p 15 466 Ibid., p 26 467 The National Travel Survey (NTS) is a household survey that has been running continuously since 1988.
It collected information on how, why, when and where people travel and is designed to monitor long-term trends in personal travel to inform the development of policy.
468 Written evidence from Professor David Bannister and Dr Moshe Givoni (EHS0046) 469 Q 222
THE ECONOMICS OF HIGH SPEED 2 109
382. Mr Scott of Virgin Trains said that they were in discussions with Network Rail to “provide free and superfast internet connectivity on board to all passengers”. With this in place, Mr Scott said that business travellers would “certainly … be able to work effectively.”470
383. We also heard evidence in support of the Department’s approach. The Institute for Transport Studies, in a report for the Department for Transport, said that:
“it is not simply a matter of stating that people work while travelling and hence the Cost Saving Approach produces inflated values, because it is the work that would have been done in the saved time, and not on average, that is pertinent. A range of other issues are potentially relevant, such as the value of more time at the destination, the avoidance of long days, relative productivity at work and while travelling, and possible premium valuations of walk and wait time.”471
384. Professor Glaister said that “The principle is a good one … The question is whether we have the right value here in terms of what business would be willing to pay … My own view would be that it has been reasonably well researched.”472 The Secretary of State said that the values are “consistent with people working on trains.”473
Review of the Department’s approach 385. The Department for Transport commissioned the Institute for Transport
Studies to review the evidence for valuing working travel time savings in 2013. The review noted that the assumptions on which the approach was based, “have been questioned to various degrees by commentators from very different backgrounds and over many years.” It outlined three arguments put forward for change:
• “The mobile communications revolution including in-car phones and wi-fi enabled trains. There is clear evidence of willingness to pay for such facilities and it might be hypothesised that the usability of travel time for working has risen over time.”
• “The proportion of business travellers in occupations and roles which enable them to use travel time productively has risen.”
• “There has been a perceptible move to a more flexible working hours environment … the implicit contract for many middle and senior managers is that long days involving business trips are part of the deal and that this makes it more likely that faster journeys switch time at least partially between travel and leisure rather than between travel and work.”474
470 Q 215 471 Institute for Transport Studies, Valuation of Travel Time Savings for Business Travellers, p 10 472 Q 47 473 Q 216 474 Institute for Transport Studies, Valuation of Travel Time Savings for Business Travellers, p 25
110 THE ECONOMICS OF HIGH SPEED 2
386. The review provided a thorough assessment of the evidence that lies behind the cost saving approach and compared it to two other methods: ‘willingness to pay’ and the ‘modified wage based (Hensher) approach’. Box 11 gives an overview of these methods.
Box 11: Other methods of working travel time values
The Government uses the cost savings approach to value business travel time. There are two other main methods for evaluating the value of business travel time:
• Willingness to pay
This method involves establishing how much travellers are willing to pay through revealed preferences or stated preferences.
Revealed preference relies on observed behaviour; business travellers reveal their willingness to pay through their choices between travel modes, routes and prices.
Stated preference relies on surveys aimed at eliciting the preferences of business travellers for travel modes, routes, and prices.
• Modified wage based (Hensher) approach
This is a modified version of the cost savings approach which takes account of the proportion of time spent engaged in work whilst travelling and how productive that work is. It also considers the proportion time saved from a quicker journey that the employee uses for leisure rather than additional work. It is considered difficult to apply and its use has been limited.
Comparison of the Department’s approach with other methods 387. The Institute for Transport Studies’ review compared the results of the
Department’s approach with those of willingness to pay studies and the modified wage based (Hensher) approach. Mr Prout said that these findings showed that the proxy value used by the Department was “absolutely smack in the middle” of the ranges indicated by willingness to pay studies from across Europe (this comparison was highlighted in a table in the Strategic Case; whilst it shows that the Department’s valuation is roughly in the middle of the revealed and stated preference studies, it is substantially above the value calculated using the modified wage based (Hensher) approach).
388. The conclusion in the Institute for Transport Studies’ report on the comparison with other methods was as follows:
“The evidence we have reviewed does not tell an entirely consistent story. On the one hand, the Hensher equation implies that in some cases, and particularly for rail, [there are] significant reductions on the value of time estimated via the traditional cost savings approach. On the other hand, the [willingness to pay] value of time evidence is more in line with the values of the cost savings approach.”475
475 Institute for Transport Studies, Valuation of Travel Time Savings for Business Travellers, p 65
THE ECONOMICS OF HIGH SPEED 2 111
The review’s conclusion and the Department’s response 389. Overall, the review concluded that:
“It is clear that there is no consensus on the theoretical underpinnings of the business value of time. Whilst the Cost Saving Approach dominates international appraisal practice, several practitioners have reservations about its theoretical underpinnings … Nor is the empirical evidence clear. We are not aware of detailed research that has aimed to determine how companies value the time saving benefits of their employees whilst not only do different approaches yield differing values there is also variation in values within particular approaches.”476
390. However, the review warned that “it is not simply a matter of stating that people work while travelling and hence the Cost Saving Approach produces inflated values … A range of other issues are potentially relevant, such as the value of more time at the destination”.477 It set out a number of options, including alternatives to the cost savings approach, which the Department could pursue.
391. The Department’s initial response was to carry out the “do minimum” option to update the gross wage rate and non-wage labour costs used in the cost savings approach.478 The working travel time value for rail fell as a result from £47.18 to £31.96.
392. The Department also undertook to collect fresh evidence of businesses’ willingness to pay.479 The Department’s latest guidance states that “due to the uncertainties and inconsistencies in the existing evidence, the Department believes that fresh empirical evidence on business travellers’ willingness-to-pay for travel time savings is required.”480
393. The Secretary of State providing further details on this work. He explained that the study will “measure values of time through directly surveying both people and business to understand how they value travel time savings.” One of the objectives of this work was to “Extend the use of direct survey methods, previously used for non-work travel, to business travel time savings. Using this method will implicitly take account of the fact people work on trains.”481
394. The Secretary of State said that following consultation on the recommendations, they would be reflected in an updated WebTAG in 2016. The Economic Case for HS2 will be kept “under review” and updated “as appropriate to take account of the latest evidence as it becomes available.”482
476 Ibid., pp 10–11 477 Ibid., p 10 478 Department for Transport, Understanding and Valuing the Impacts of Transport Investment, p 21 479 Department for Transport, Understanding and Valuing the Impacts of Transport Investment: Progress Report, pp
6–7 480 Department for Transport, TAG UNIT A1.3, p 6 481 Letter from the Secretary of State to the Chairman, 12 February 2015 482 Ibid.
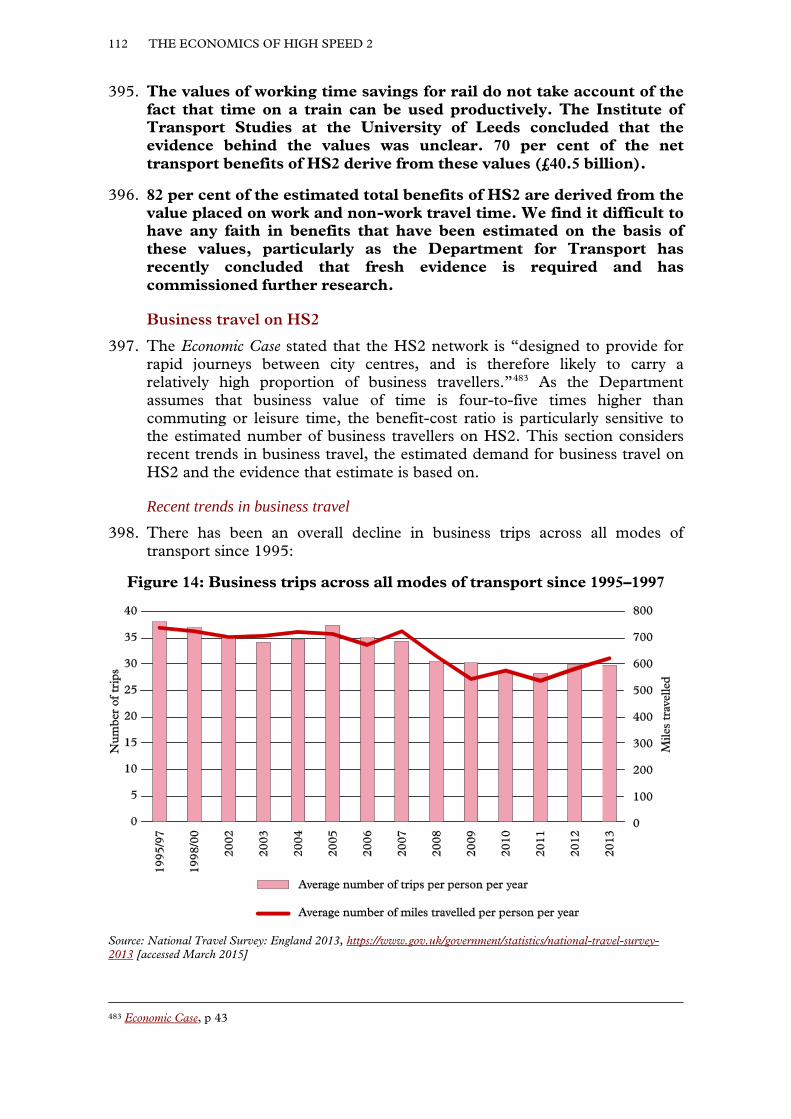
112 THE ECONOMICS OF HIGH SPEED 2
395. The values of working time savings for rail do not take account of the fact that time on a train can be used productively. The Institute of Transport Studies at the University of Leeds concluded that the evidence behind the values was unclear. 70 per cent of the net transport benefits of HS2 derive from these values (£40.5 billion).
396. 82 per cent of the estimated total benefits of HS2 are derived from the value placed on work and non-work travel time. We find it difficult to have any faith in benefits that have been estimated on the basis of these values, particularly as the Department for Transport has recently concluded that fresh evidence is required and has commissioned further research.
Business travel on HS2
397. The Economic Case stated that the HS2 network is “designed to provide for rapid journeys between city centres, and is therefore likely to carry a relatively high proportion of business travellers.”483 As the Department assumes that business value of time is four-to-five times higher than commuting or leisure time, the benefit-cost ratio is particularly sensitive to the estimated number of business travellers on HS2. This section considers recent trends in business travel, the estimated demand for business travel on HS2 and the evidence that estimate is based on.
Recent trends in business travel 398. There has been an overall decline in business trips across all modes of
transport since 1995:
Figure 14: Business trips across all modes of transport since 1995–1997
Source: National Travel Survey: England 2013, https://www.gov.uk/government/statistics/national-travel-survey-2013 [accessed March 2015]
483 Economic Case, p 43
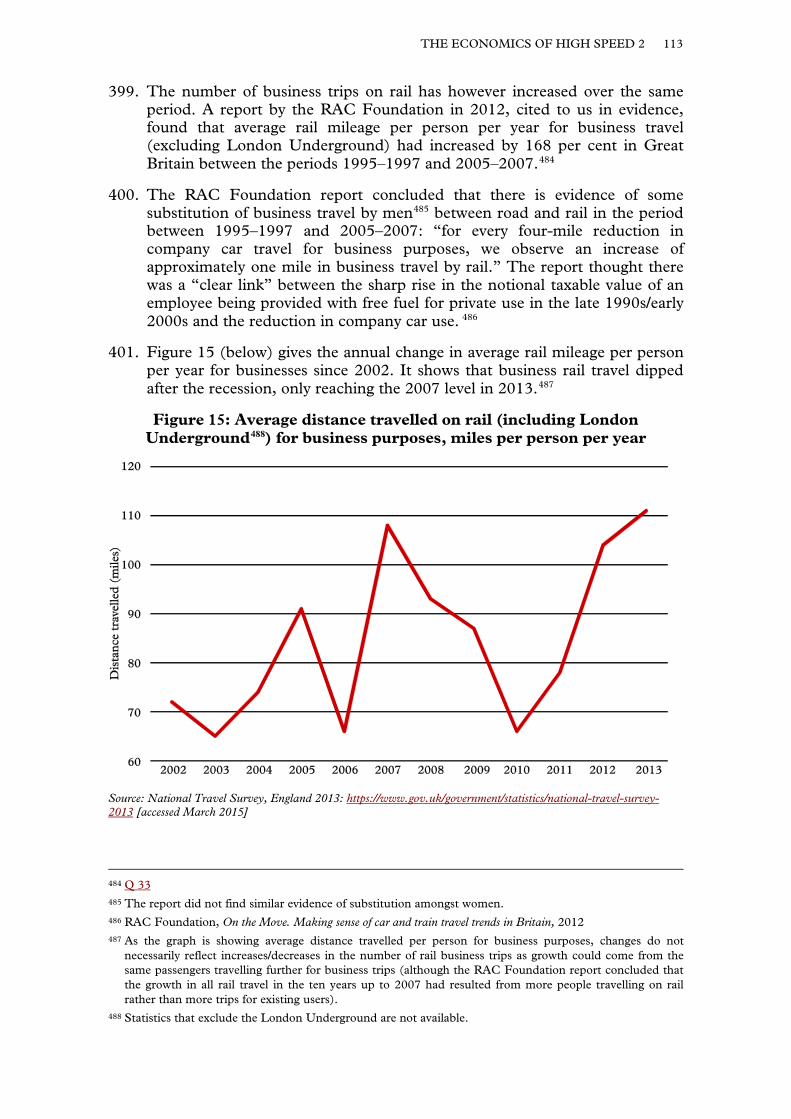
THE ECONOMICS OF HIGH SPEED 2 113
399. The number of business trips on rail has however increased over the same period. A report by the RAC Foundation in 2012, cited to us in evidence, found that average rail mileage per person per year for business travel (excluding London Underground) had increased by 168 per cent in Great Britain between the periods 1995–1997 and 2005–2007.484
400. The RAC Foundation report concluded that there is evidence of some substitution of business travel by men485 between road and rail in the period between 1995–1997 and 2005–2007: “for every four-mile reduction in company car travel for business purposes, we observe an increase of approximately one mile in business travel by rail.” The report thought there was a “clear link” between the sharp rise in the notional taxable value of an employee being provided with free fuel for private use in the late 1990s/early 2000s and the reduction in company car use. 486
401. Figure 15 (below) gives the annual change in average rail mileage per person per year for businesses since 2002. It shows that business rail travel dipped after the recession, only reaching the 2007 level in 2013.487
Figure 15: Average distance travelled on rail (including London Underground488) for business purposes, miles per person per year
Source: National Travel Survey, England 2013: https://www.gov.uk/government/statistics/national-travel-survey-2013 [accessed March 2015]
484 Q 33 485 The report did not find similar evidence of substitution amongst women. 486 RAC Foundation, On the Move. Making sense of car and train travel trends in Britain, 2012 487 As the graph is showing average distance travelled per person for business purposes, changes do not
necessarily reflect increases/decreases in the number of rail business trips as growth could come from the same passengers travelling further for business trips (although the RAC Foundation report concluded that the growth in all rail travel in the ten years up to 2007 had resulted from more people travelling on rail rather than more trips for existing users).
488 Statistics that exclude the London Underground are not available.
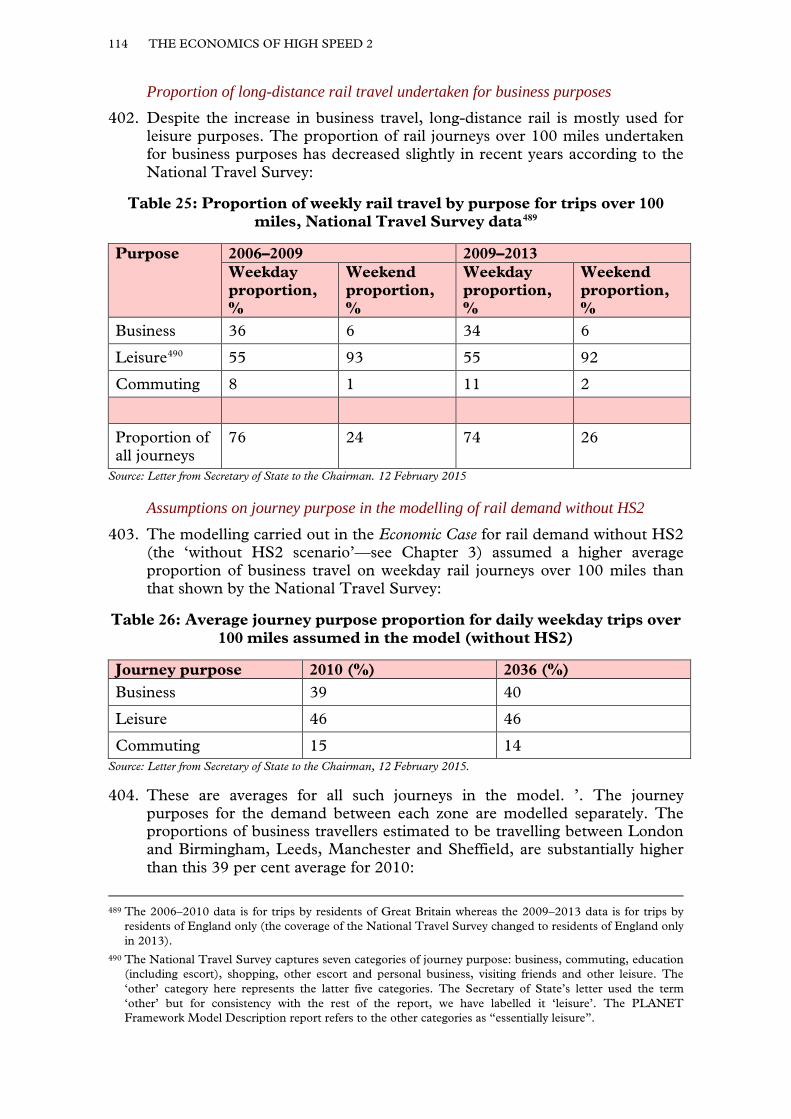
114 THE ECONOMICS OF HIGH SPEED 2
Proportion of long-distance rail travel undertaken for business purposes 402. Despite the increase in business travel, long-distance rail is mostly used for
leisure purposes. The proportion of rail journeys over 100 miles undertaken for business purposes has decreased slightly in recent years according to the National Travel Survey:
Table 25: Proportion of weekly rail travel by purpose for trips over 100 miles, National Travel Survey data489
Purpose 2006–2009 2009–2013 Weekday proportion, %
Weekend proportion, %
Weekday proportion, %
Weekend proportion, %
Business 36 6 34 6
Leisure490 55 93 55 92
Commuting 8 1 11 2
Proportion of all journeys
76 24 74 26
Source: Letter from Secretary of State to the Chairman. 12 February 2015
Assumptions on journey purpose in the modelling of rail demand without HS2 403. The modelling carried out in the Economic Case for rail demand without HS2
(the ‘without HS2 scenario’—see Chapter 3) assumed a higher average proportion of business travel on weekday rail journeys over 100 miles than that shown by the National Travel Survey:
Table 26: Average journey purpose proportion for daily weekday trips over 100 miles assumed in the model (without HS2)
Journey purpose 2010 (%) 2036 (%) Business 39 40
Leisure 46 46
Commuting 15 14 Source: Letter from Secretary of State to the Chairman, 12 February 2015.
404. These are averages for all such journeys in the model. ’. The journey purposes for the demand between each zone are modelled separately. The proportions of business travellers estimated to be travelling between London and Birmingham, Leeds, Manchester and Sheffield, are substantially higher than this 39 per cent average for 2010:
489 The 2006–2010 data is for trips by residents of Great Britain whereas the 2009–2013 data is for trips by residents of England only (the coverage of the National Travel Survey changed to residents of England only in 2013).
490 The National Travel Survey captures seven categories of journey purpose: business, commuting, education (including escort), shopping, other escort and personal business, visiting friends and other leisure. The ‘other’ category here represents the latter five categories. The Secretary of State’s letter used the term ‘other’ but for consistency with the rest of the report, we have labelled it ‘leisure’. The PLANET Framework Model Description report refers to the other categories as “essentially leisure”.
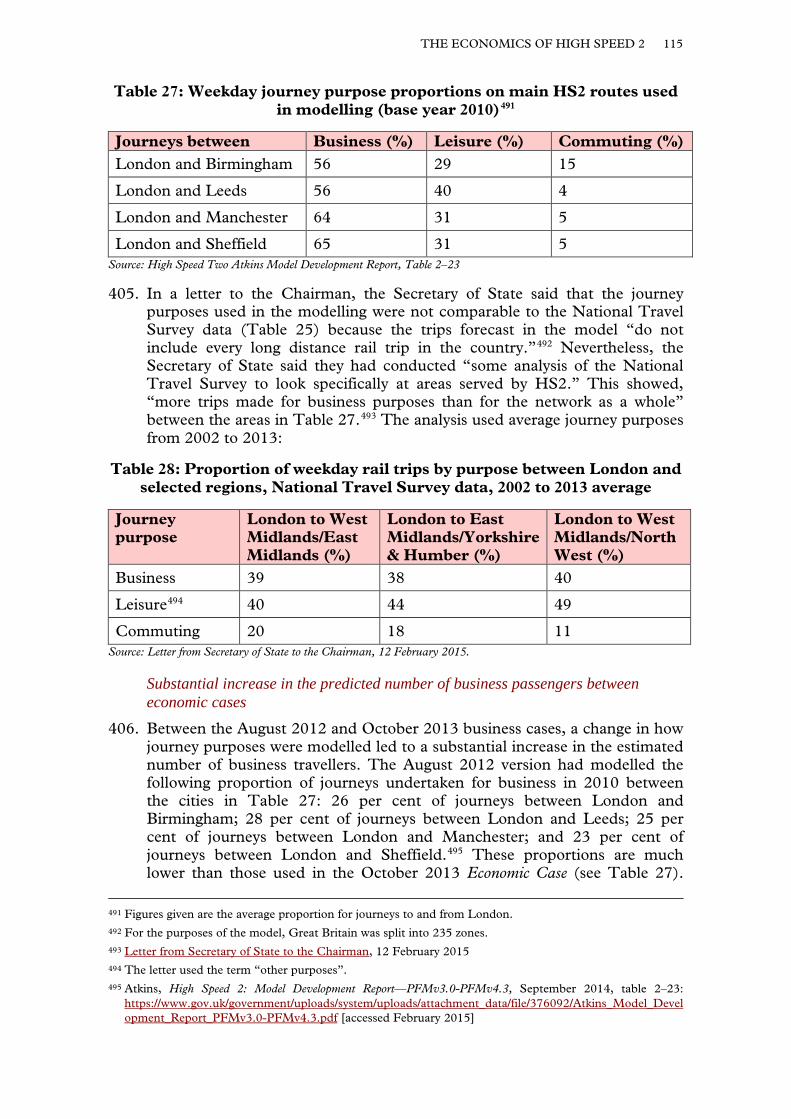
THE ECONOMICS OF HIGH SPEED 2 115
Table 27: Weekday journey purpose proportions on main HS2 routes used in modelling (base year 2010)491
Journeys between Business (%) Leisure (%) Commuting (%) London and Birmingham 56 29 15
London and Leeds 56 40 4
London and Manchester 64 31 5
London and Sheffield 65 31 5 Source: High Speed Two Atkins Model Development Report, Table 2–23
405. In a letter to the Chairman, the Secretary of State said that the journey purposes used in the modelling were not comparable to the National Travel Survey data (Table 25) because the trips forecast in the model “do not include every long distance rail trip in the country.”492 Nevertheless, the Secretary of State said they had conducted “some analysis of the National Travel Survey to look specifically at areas served by HS2.” This showed, “more trips made for business purposes than for the network as a whole” between the areas in Table 27.493 The analysis used average journey purposes from 2002 to 2013:
Table 28: Proportion of weekday rail trips by purpose between London and selected regions, National Travel Survey data, 2002 to 2013 average
Journey purpose
London to West Midlands/East Midlands (%)
London to East Midlands/Yorkshire & Humber (%)
London to West Midlands/North West (%)
Business 39 38 40
Leisure494 40 44 49
Commuting 20 18 11 Source: Letter from Secretary of State to the Chairman, 12 February 2015.
Substantial increase in the predicted number of business passengers between economic cases
406. Between the August 2012 and October 2013 business cases, a change in how journey purposes were modelled led to a substantial increase in the estimated number of business travellers. The August 2012 version had modelled the following proportion of journeys undertaken for business in 2010 between the cities in Table 27: 26 per cent of journeys between London and Birmingham; 28 per cent of journeys between London and Leeds; 25 per cent of journeys between London and Manchester; and 23 per cent of journeys between London and Sheffield.495 These proportions are much lower than those used in the October 2013 Economic Case (see Table 27).
491 Figures given are the average proportion for journeys to and from London. 492 For the purposes of the model, Great Britain was split into 235 zones. 493 Letter from Secretary of State to the Chairman, 12 February 2015 494 The letter used the term “other purposes”. 495 Atkins, High Speed 2: Model Development Report—PFMv3.0-PFMv4.3, September 2014, table 2–23:
https://www.gov.uk/government/uploads/system/uploads/attachment_data/file/376092/Atkins_Model_Development_Report_PFMv3.0-PFMv4.3.pdf [accessed February 2015]
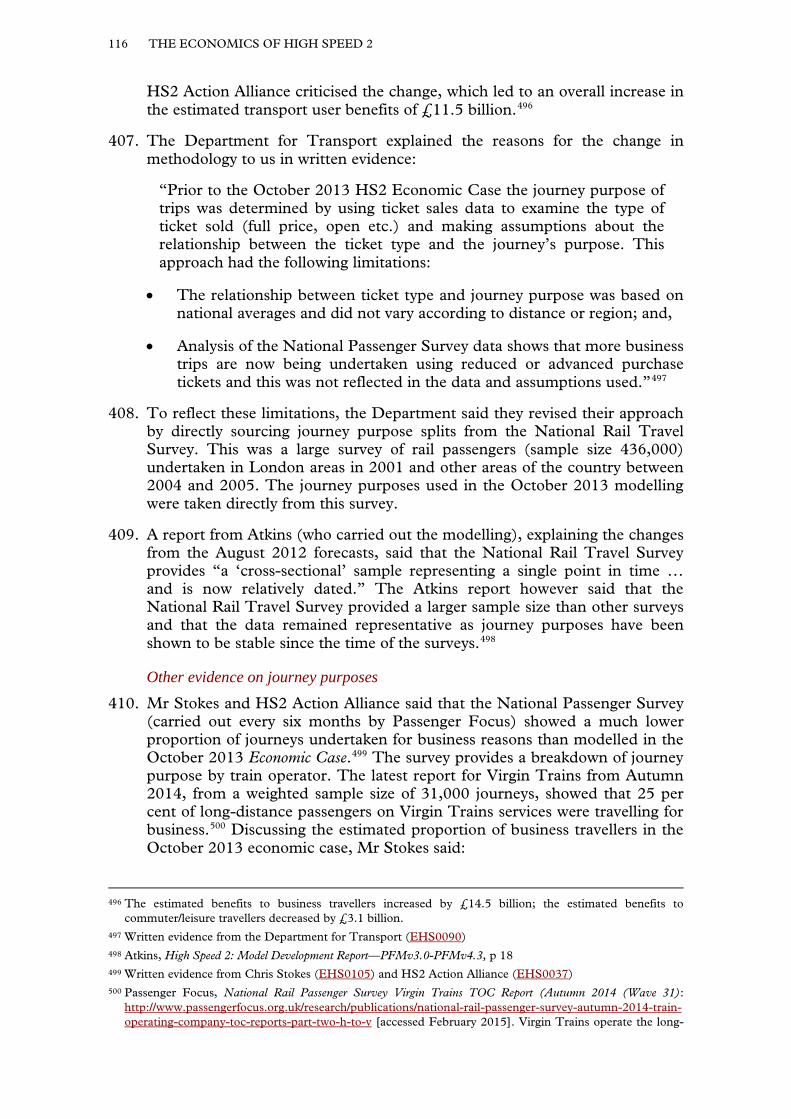
116 THE ECONOMICS OF HIGH SPEED 2
HS2 Action Alliance criticised the change, which led to an overall increase in the estimated transport user benefits of £11.5 billion.496
407. The Department for Transport explained the reasons for the change in methodology to us in written evidence:
“Prior to the October 2013 HS2 Economic Case the journey purpose of trips was determined by using ticket sales data to examine the type of ticket sold (full price, open etc.) and making assumptions about the relationship between the ticket type and the journey’s purpose. This approach had the following limitations:
• The relationship between ticket type and journey purpose was based on national averages and did not vary according to distance or region; and,
• Analysis of the National Passenger Survey data shows that more business trips are now being undertaken using reduced or advanced purchase tickets and this was not reflected in the data and assumptions used.”497
408. To reflect these limitations, the Department said they revised their approach by directly sourcing journey purpose splits from the National Rail Travel Survey. This was a large survey of rail passengers (sample size 436,000) undertaken in London areas in 2001 and other areas of the country between 2004 and 2005. The journey purposes used in the October 2013 modelling were taken directly from this survey.
409. A report from Atkins (who carried out the modelling), explaining the changes from the August 2012 forecasts, said that the National Rail Travel Survey provides “a ‘cross-sectional’ sample representing a single point in time … and is now relatively dated.” The Atkins report however said that the National Rail Travel Survey provided a larger sample size than other surveys and that the data remained representative as journey purposes have been shown to be stable since the time of the surveys.498
Other evidence on journey purposes 410. Mr Stokes and HS2 Action Alliance said that the National Passenger Survey
(carried out every six months by Passenger Focus) showed a much lower proportion of journeys undertaken for business reasons than modelled in the October 2013 Economic Case.499 The survey provides a breakdown of journey purpose by train operator. The latest report for Virgin Trains from Autumn 2014, from a weighted sample size of 31,000 journeys, showed that 25 per cent of long-distance passengers on Virgin Trains services were travelling for business.500 Discussing the estimated proportion of business travellers in the October 2013 economic case, Mr Stokes said:
496 The estimated benefits to business travellers increased by £14.5 billion; the estimated benefits to commuter/leisure travellers decreased by £3.1 billion.
497 Written evidence from the Department for Transport (EHS0090) 498 Atkins, High Speed 2: Model Development Report—PFMv3.0-PFMv4.3, p 18 499 Written evidence from Chris Stokes (EHS0105) and HS2 Action Alliance (EHS0037) 500 Passenger Focus, National Rail Passenger Survey Virgin Trains TOC Report (Autumn 2014 (Wave 31):
http://www.passengerfocus.org.uk/research/publications/national-rail-passenger-survey-autumn-2014-train-operating-company-toc-reports-part-two-h-to-v [accessed February 2015]. Virgin Trains operate the long-
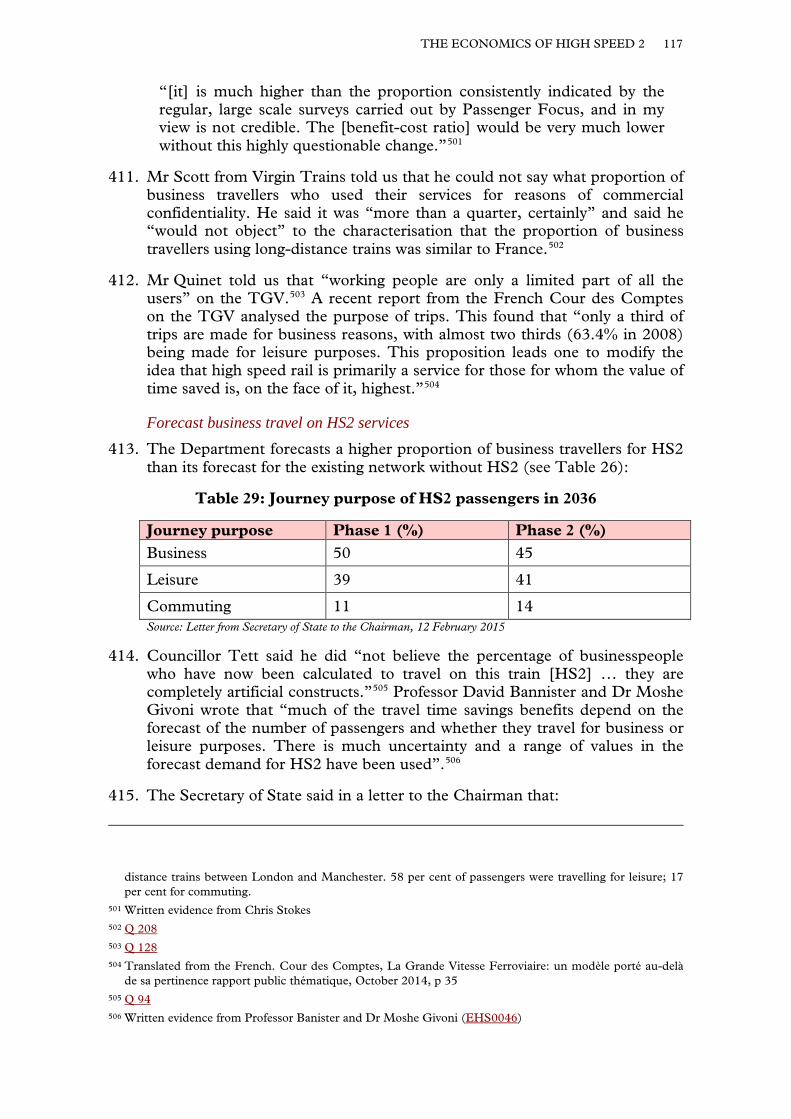
THE ECONOMICS OF HIGH SPEED 2 117
“[it] is much higher than the proportion consistently indicated by the regular, large scale surveys carried out by Passenger Focus, and in my view is not credible. The [benefit-cost ratio] would be very much lower without this highly questionable change.”501
411. Mr Scott from Virgin Trains told us that he could not say what proportion of business travellers who used their services for reasons of commercial confidentiality. He said it was “more than a quarter, certainly” and said he “would not object” to the characterisation that the proportion of business travellers using long-distance trains was similar to France.502
412. Mr Quinet told us that “working people are only a limited part of all the users” on the TGV.503 A recent report from the French Cour des Comptes on the TGV analysed the purpose of trips. This found that “only a third of trips are made for business reasons, with almost two thirds (63.4% in 2008) being made for leisure purposes. This proposition leads one to modify the idea that high speed rail is primarily a service for those for whom the value of time saved is, on the face of it, highest.”504
Forecast business travel on HS2 services 413. The Department forecasts a higher proportion of business travellers for HS2
than its forecast for the existing network without HS2 (see Table 26):
Table 29: Journey purpose of HS2 passengers in 2036
Journey purpose Phase 1 (%) Phase 2 (%) Business 50 45
Leisure 39 41
Commuting 11 14 Source: Letter from Secretary of State to the Chairman, 12 February 2015
414. Councillor Tett said he did “not believe the percentage of businesspeople who have now been calculated to travel on this train [HS2] … they are completely artificial constructs.”505 Professor David Bannister and Dr Moshe Givoni wrote that “much of the travel time savings benefits depend on the forecast of the number of passengers and whether they travel for business or leisure purposes. There is much uncertainty and a range of values in the forecast demand for HS2 have been used”.506
415. The Secretary of State said in a letter to the Chairman that:
distance trains between London and Manchester. 58 per cent of passengers were travelling for leisure; 17 per cent for commuting.
501 Written evidence from Chris Stokes 502 Q 208 503 Q 128 504 Translated from the French. Cour des Comptes, La Grande Vitesse Ferroviaire: un modèle porté au-delà
de sa pertinence rapport public thématique, October 2014, p 35 505 Q 94 506 Written evidence from Professor Banister and Dr Moshe Givoni (EHS0046)
118 THE ECONOMICS OF HIGH SPEED 2
“the projections do suggest there will be a higher proportion of business travellers on HS2 than on the classic network in the base year and the without HS2 scenario. I am aware that some quarters have challenged what they consider to be unrealistic increases in business travellers. However, I would suggest that an increase in business travel is precisely what is to be expected from a railway which is designed to significantly reduce travel times between major urban areas.”507
416. The economic viability of HS2 is highly dependent on the forecast number of business passengers, in addition to the value of their saved time. The substantial increase in forecast business travel in the latest economic case is questionable: the supporting evidence was based on survey data that is over ten years old. There is conflicting data about the number of passengers who use long-distance rail for business purposes.
417. 84 per cent of the estimated benefits of HS2 rely on the values allocated to travel time savings and demand forecasts. The evidence behind both of these is inconsistent and out-of-date.
507 Letter from the Secretary of State to the Chairman, 12 February 2015
THE ECONOMICS OF HIGH SPEED 2 119
Chapter 8: Conclusions and recommendations
418. Cost-benefit analysis is an important discipline; it is the best tool for comparing several projects to see which provides the best value for money. But the reliability of the method for quantifying the benefits of a project depends upon the quality of the evidence used in the analysis. (Paragraph 366)
419. The values of non-work travel time savings are based on surveys of motorists from 1994. We are not convinced that basing values of time on outdated surveys of motorists is the best way of calculating some of the benefits of a major rail project; rail users can use journey time productively. 33 per cent of the net transport benefits of HS2 are derived from these values (£19.3 billion). The Department for Transport has conceded that the data are old and that fresh evidence is required. (Paragraph 378)
420. The values of working time savings for rail do not take account of the fact that time on a train can be used productively. The Institute of Transport Studies at the University of Leeds concluded that the evidence behind the values was unclear. 70 per cent of the net transport benefits of HS2 derive from these values (£40.5 billion). (Paragraph 395)
421. 82 per cent of the estimated total benefits of HS2 are derived from the value placed on work and non-work travel time. We find it difficult to have any faith in benefits that have been estimated on the basis of these values, particularly as the Department for Transport has recently concluded that fresh evidence is required and has commissioned further research. (Paragraph 396)
422. The economic viability of HS2 is highly dependent on the forecast number of business passengers, in addition to the value of their saved time. The substantial increase in forecast business travel in the latest economic case is questionable: the supporting evidence was based on survey data that is over ten years old. There is conflicting data about the number of passengers who use long-distance rail for business purposes. (Paragraph 416)
423. 84 per cent of the estimated benefits of HS2 rely on the values allocated to travel time savings and demand forecasts. The evidence behind both of these is inconsistent and out-of-date. (Paragraph 417)
120 THE ECONOMICS OF HIGH SPEED 2
CHAPTER 9: THE QUESTIONS FOR GOVERNMENT
On the basis of our report, we ask the Government following the 2015 General Election to address the questions below. The Government must answer these questions before the High Speed Rail Bill completes its passage through Parliament.
National transport plan
• In the absence of a co-ordinated transport plan, how can the Government be sure that HS2 is the best way to achieve the project’s objectives?
The cost of HS2
• What measures will be taken to limit the cost of constructing HS2?
• Is the funding envelope of £50 billion for the cost of construction an absolute limit or will this increase with inflation?
• How much cheaper would a new railway built for a lower maximum speed (for example, 320 kilometres per hour as in France) be?
• How will the Government ensure that HS2 stations are appropriately linked in to local transport networks? How will this be funded?
Who will pay for HS2
• Should passengers benefiting from faster journeys on HS2 pay premium fares to reduce the high level of taxpayer subsidy of the project?
• How does the high level of taxpayer subsidy of HS2 fit with the Government’s commitment to reduce the level of subsidy of the UK rail network?
Demand and capacity
• Will the Government either release the full data on overcrowding, down to the level of individual services, or ensure the data is reviewed independently, to provide the public with evidence there will be a growing problem on long-distance services?
Lack of consideration of alternative rail investment
• Could incremental improvements to the existing rail network deliver the required capacity improvements?
• Could the use of flexible pricing policies, such as those used by low-cost airlines, assist with managing overcrowding on the busiest trains?
• Is HS2 the best way to address the problems which currently exist?
Effect on the UK economy
• Given that evidence from abroad suggests that large cities benefit the most from improving connectivity, how will HS2 rebalance Britain’s economy?
THE ECONOMICS OF HIGH SPEED 2 121
• Is High Speed 2 the best way to spend £50 billion to stimulate the UK economy?
• Would local and regional infrastructure investment, as recommended by the Eddington Study of 2006, offer a more realistic proposition of a return on investment than HS2?
Prioritisation
• Should improving regional rail links in the north be prioritised ahead of building HS2 Phase One?
Lack of evidence
• What effect will the findings of the research commissioned on values of time have on the cost-benefit analysis of HS2?
122 THE ECONOMICS OF HIGH SPEED 2
APPENDIX 1: LIST OF MEMBERS AND DECLARATIONS OF
INTEREST
Members
Baroness Blackstone Lord Carrington of Fulham Lord Griffiths of Fforestfach Lord Hollick (Chairman) Lord Lawson of Blaby Lord May of Oxford Lord McFall of Alcluith Lord Monks Lord Rowe-Beddoe Lord Shipley Lord Skidelsky Lord Smith of Clifton Baroness Wheatcroft (appointed 25 November 2014)
Declarations of interest
Lord Hollick Founding Trustee, Institute for Public Policy Research
Lord Rowe-Beddoe Chairman of Cardiff Wales Airport
Lord Shipley Chair (unpaid) of National Connectivity Task Force on UK connectivity with airports in London and the South East (September 2014–January 2015). Established by Heathrow Airport and reporting to the Airports Commission
A full list of Members’ interests can be found in the Register of Lords’ Interests: http://www.parliament.uk/mps-lords-and-offices/standards-and-interests/register-of-lords-interests
Specialist Adviser
Tom Worsley, Visiting Fellow at the Institute for Transport Studies, University of Leeds, acted as Specialist adviser for this inquiry and declared the following interests:
Visiting Fellow at the Institute for Transport Studies at the University of Leeds. Member of the research team at the Institute for Transport Studies who researched the evidence on the value of travel time savings after being awarded a contract by the Department for Transport. Economic Adviser to the Railway Industry Association. Fellow of the Chartered Institute of Logistics and Transport. Member of the Public Policy Committee. Member of the Strategic Rail Policy Group. Consultant for Department of Transport providing advice on the economic objectives to support the strategic case for the Northern Transport Strategy (from January 2015).
THE ECONOMICS OF HIGH SPEED 2 123
APPENDIX 2: LIST OF WITNESSES
Evidence is published online at http://www.parliament.uk/hleconomicaffairs and available for inspection at the Parliamentary Archives (020 7219 3074).
Evidence received by the Committee is listed below in chronological order of oral evidence session and in alphabetical order. Those witnesses marked with ** gave both oral evidence and written evidence. Those marked with * gave oral evidence and did not submit any written evidence. All other witnesses submitted written evidence only.
Acknowledgments
We would like to thank everyone who gave evidence to us, both at oral evidence sessions, held from October 2014 to January 2015, and in writing. We are also grateful to the National Audit Office who briefed us on their report on High Speed 2 towards the start of the inquiry, and High Speed UK who provided a briefing to the Committee on their proposals.
Oral evidence in chronological order
** Professor Peter Mackie, Emeritus Professor, Institute for Transport Studies, University of Leeds
QQ 1–12
* Dr Matthew Niblett, Senior Visiting Research Associate, Transport Studies Unit, University of Oxford
** Professor Roger Vickerman, Professor of European Economics, University of Kent
* Professor Dan Graham, Professor of Statistical Modelling, Imperial College London
QQ 13–23
* Professor Tony Venables, BP Professor of Economics, Director, OxCarre, University of Oxford
** Lewis Atter, KPMG QQ 24–37
* Jim Steer, Non-Executive Director, Steer Davies Gleave Consulting
** Bridget Rosewell, Senior Adviser, Volterra Consultants
** Professor Stephen Glaister, Emeritus Professor of Transport and Infrastructure, Imperial College London
QQ 38–48
* Professor Henry Overman, Professor of Economic Geography, London School of Economics
QQ 49–62
** Alison Munro, Managing Director of Development, HS2 Limited
QQ 63–77
** David Prout, Director General, High Speed 2 Group, Department for Transport
** Bruce Weston, Director, HS2 Action Alliance QQ 78–87
** Joe Rukin, Campaign Manager, Stop HS2
124 THE ECONOMICS OF HIGH SPEED 2
** Councillor Martin Tett, Leader, Buckinghamshire County Council (representing 51m Alliance of Councils)
QQ 88–99
** Dr Richard Wellings, Deputy Editorial Director, Institute of Economic Affairs
* Professor Chris Nash, Research Professor, Institute for Transport Studies, University of Leeds
QQ 100–111
** Rupert Walker, Head of High Speed Rail Development, Network Rail
* Paul Plummer, Group Strategy Director, Network Rail and Rail Delivery Group
* The Rt Hon. The Lord Adonis QQ 112–121
* Emile Quinet, Ecole Nationale des Ponts et Chaussees QQ 122–132
* Dr Ian Kelly, Chief Executive, Hull and Humber Chamber of Commerce
QQ 133–142
** Joe Anderson, Mayor of Liverpool
** Steven Leigh, Head of Policy and Representation, Mid Yorkshire Chamber of Commerce
* Ross Smith, Director of Policy, North East Chamber of Commerce
* Sir Richard Leese CBE, Leader, Manchester City Council QQ 143–155
** Mike Blackburn, Deputy Chairman, North West Business Leadership Team
** David Thrower, Transport Consultant, North West Business Leadership Team
** Jerry Blackett, CEO, Greater Birmingham Chambers of Commerce
QQ 156–169
** Chris Tunstall, West Midlands Integrated Transport Authority
** Councillor Jon Collins, Leader, Nottingham City Council (representing Eastern High Speed Rail Network Partnership)
QQ 170–181
* Peter Kennan, Vice Chair, Sheffield Chamber of Commerce Transport Forum
* Simon Green, Executive Director, Sheffield City Council
* Ian Williams, Director of Policy and Business Representation, Leeds Chamber of Commerce
QQ 182–191
* Councillor James Lewis, Chair, Transport Committee, West Yorkshire Combined Authority
* Michèle Dix, Managing Director of Planning, Transport for London
QQ 192–202
* Richard Brooks, Commercial Director, London Midland QQ 203–215
THE ECONOMICS OF HIGH SPEED 2 125
* Richard Scott, Director of Corporate Affairs, Virgin Trains
** Rt Hon. Patrick McLoughlin MP, Secretary of State for Transport
QQ 216–235
** David Prout, Director General, High Speed 2 Group, Department for Transport
* Lord Deighton, Commercial Secretary to the Treasury and former Chair, HS2 Growth Task Force
** Sir David Higgins, Chair, HS2 Limited QQ 236–255
* Jim O’Neill, Chair, City Growth Commission QQ 256–262
Alphabetical list of all witnesses
20 Miles More EHS0051
** 51m Alliance of Councils (QQ 88–99) EHS0023 EHS0099
Aberdeen and Grampian Chamber of Commerce EHS0022
* Lord Adonis (QQ 112–121)
Ampthill Square Tenants and Residents Association EHS0082
Alan Andrews EHS0071
Associated Society of Locomotive Engineers and Firemen (ASLEF)
EHS0066
William Avery EHS0014
Aylesbury Park Golf Club Ltd EHS0011
Professor David Banister EHS0046
William Barter EHS0095
Chris Belk EHS0030
Bluespace Thinking Ltd EHS0009
Andrew Bodman EHS0027 EHS0092 EHS0096 EHS0101
Primavera Boman-Behram EHS0013
British Chambers of Commerce EHS0045
Marilyn Brown EHS0007
Steve Brown EHS0007
** Buckinghamshire County Council EHS0020
Camden Town Unlimited EHS0081
Dr Paul Carter EHS0003
Chiltern Ridges (HS2) Action Group EHS0059
126 THE ECONOMICS OF HIGH SPEED 2
Chiltern Society EHS0034
Connected Cities EHS0047
David Cooper-Smith EHS0093
* Lord Deighton, Commercial Secretary to the Treasury and former Chair, HS2 Growth Task Force (QQ 216–235)
Dr Chris Eaglen LLB MIET EHS0002
** Eastern High Speed Rail Network Partnership (QQ 170–181)
EHS0042
Mrs Mary Gair EHS0005
Professor Mike Geddes EHS0032
Rt Hon. Cheryl Gillan MP EHS0040
Dr Moshe Givoni EHS0046
** Professor Stephen Glaister (QQ 38–48) EHS0097
* Professor Dan Graham
** Greater Birmingham Chambers of Commerce EHS0038
Greater Manchester Combined Authority EHS0048
** Sir David Higgins, Chair, HS2 Limited (QQ 236–255)
High Speed UK EHS0077
Mike Hill EHS0041
Department for Transport (QQ 63–77) EHS0021 EHS0090
Kelvin Hopkins MP EHS0075
Rex Hora EHS0001
** HS2 Action Alliance (QQ 78–87) EHS0037 EHS0091 EHS0103
** HS2 Limited (QQ 63–77) EHS0057
* Hull and Humber Chamber of Commerce (QQ 133–142)
** Institute for Economic Affairs (QQ 88–99) EHS0100
Kings Bromley Stop HS2 Action Group EHS0004
** KPMG LLP (QQ 24–37) EHS0065 EHS0089
Sir Tim Lankester KCB EHS0107
* Leeds Chamber of Commerce (QQ 182–191)
** Liverpool City Region (Mayor of Liverpool) (QQ 133–142) EHS0068
London Borough of Camden EHS0043
London Borough of Hillingdon EHS0029
* London Midland (QQ 203–215)
THE ECONOMICS OF HIGH SPEED 2 127
** Professor Peter Mackie (QQ 1–12) EHS0079
* Manchester City Council (QQ 143–155)
Stan Mason EHS0064
Neil Mathers EHS0087
John Marriott EHS0098
Mayor of London’s Office EHS0088
** Rt Hon. Patrick McLoughlin MP, Secretary of State for Transport (QQ 216–235)
** Mid-Yorkshire Chamber of Commerce (QQ 133–142) EHS0016
* Professor Chris Nash (QQ 100–111)
Netley Primary School Governing Body EHS0060
** Network Rail (QQ 100–111) EHS0072
* Dr Matthew Niblett (QQ 1–12)
* North East Chamber of Commerce (QQ 133–142)
** North West Business Leadership Team (QQ 143–155) EHS0028
* Jim O’Neill (QQ 256–262)
* Professor Henry Overman
Pan-Camden HS2 Alliance EHS0063
Helen Peach EHS0006
Stephen Plowden EHS0073 EHS0104
Christopher Prideaux DL EHS0008
* Emile Quinet (QQ 122–132)
* Rail Delivery Group (QQ 100–111)
Rail Freight Group EHS0035
Matthew Semple EHS0086
* Sheffield Chamber of Commerce (QQ 170–181)
* Sheffield City Council (QQ 170–181)
Dr Nigel Shepperson EHS0019
* Jim Steer (QQ 24–37)
Stoke-on-Trent City Council EHS0085
** Stop HS2 (QQ 78–87) EHS0049
Dr Richard Stubbs EHS0018
Tonge and Breedon HS2 Action Group EHS0012
* Transport for London (QQ 192–202)
Transport Studies Unit, University of Oxford EHS0058
Transport Watch EHS0024
128 THE ECONOMICS OF HIGH SPEED 2
Twyford Parish Council EHS0033
* Professor Tony Venables (QQ 13–23)
** Professor Roger Vickerman (QQ 1–12) EHS0025
* Virgin Trains (QQ 203–215)
** Volterra Partners (QQ 24–37) EHS0036
Madeleine Wahlberg EHS0062
Michael Wand EHS0056 EHS0094
J A Waters EHS0084
W J Waters EHS0083
Wendover HS2 EHS0044
** West Midlands Integrated Transport Authority (QQ 156–169)
EHS0052
* West Yorkshire Combined Authority (QQ 182–191)
Whitmore and Baldwins Gate HS2 Action Group EHS0078
Whittington and Fisherwick Parish Council EHS0053
Daniel Richard Wolfe EHS0061
THE ECONOMICS OF HIGH SPEED 2 129
APPENDIX 3: CALL FOR EVIDENCE
The Economic Affairs Committee of the House of Lords, chaired by Lord Hollick, is conducting an inquiry into The Economic Case for HS2. The Committee invites interested individuals and organisations to submit evidence to this inquiry.
Written evidence is sought as soon as possible. Public hearings will be held in October, November and December 2014. The Committee aims to report to the House, with recommendations, in February. The report will receive a response from the Government, and may be debated in the House.
Background
The remit of the Economic Affairs Committee is to consider economic affairs. Information including membership and recent inquiries can be found on this link: http://www.parliament.uk/business/committees/committees-a-z/lords-select/economic-affairs-committee.
The Economic Affairs Committee’s inquiry into The Economic Case for HS2 does not form part of parliamentary consideration of the High Speed Rail (London–West Midlands) Bill, which is now with the House of Commons Select Committee on the Bill. Individuals and organisations who feel they are directly and specially affected by the Hybrid Bill should continue to turn for information and advice to this link: http://www.parliament.uk/business/committees/committees-a-z/commons-select/high-speed-rail-london-west-midlands-bill-select-committee-commons.
Issues
The Economic Affairs Committee invites evidence on any aspect of The Economic Case for HS2, and particularly on the following questions:
(1) Is there an economic case for HS2?
(2) Should the Strategic Case for HS2 published in October 2013 by the Department for Transport and analysis from HS2 Ltd have taken account of any other factors in making an economic case for the project? Is the expected range of the benefit cost ratio persuasive?
(3) What are the likely economic benefits of HS2 to the Midlands, to the North of England and to Scotland? Do they also depend on complementary action by governments, local authorities and Local Enterprise Partnerships, for example measures to attract investment and skilled workers?
(4) Might some parts of the UK suffer economic disadvantage from HS2?
(5) Is London likely to be a main economic beneficiary of HS2?
(6) How might the expected benefits of HS2 to the national economy be realised?
(7) How should HS2 be operated? As a franchise in competition with West and East Coast Main Lines?
(8) Should travellers expect to pay higher fares on HS2 than on other lines?
(9) Does the prospect of HS3 affect the economic case for HS2?

130 THE ECONOMICS OF HIGH SPEED 2
These questions are illustrative. Not all need be answered. The Q & A format need not be followed. Other aspects of the economic case for HS2 may also be addressed.
As stated above, this inquiry will not address the High Speed Rail (London–West Midlands) Bill now before Parliament. Those with concerns about that Bill should pursue them via this link: http://www.parliament.uk/business/committees/ committees-a-z/commons-select/high-speed-rail-london-west-midlands-bill-select-committee-commons.
THE ECONOMICS OF HIGH SPEED 2 131
APPENDIX 4: LIST OF CORRESPONDENCE
Chairman to Secretary of State for Transport 22 October 2014
Chairman to Virgin Trains 29 October 2014
David Prout, Department for Transport, to Chairman 7 November 2014
Chairman to Lord Deighton, HM Treasury 18 November 2014
Secretary of State for Transport to Chairman 19 November 2014
Chairman to Secretary of State for Transport 24 November 2014
David Prout, Department for Transport, to Committee Clerk 5 December 2014
Lord Deighton, HM Treasury, to Chairman 5 December 2014
Secretary of State for Transport to Chairman 14 December 2014
Richard Scott, Virgin Trains, to Chairman 16 December 2014
David Prout, Department for Transport, to Chairman 7 January 2015
Chairman to Secretary of State for Transport 26 January 2015
Paul Plummer, Network Rail, to Chairman 2 February 2015
Secretary of State for Transport to Chairman 12 February 2015
Chairman to Secretary of State for Transport 25 February 2015
Secretary of State for Transport to Chairman 3 March 2015