Embed Size (px)
Citation preview
THE ECONOMICS OF MANAGERIAL DECISIONS
A01_BLAI8235_01_SE_FM_ppi-xxxiv.indd 1 15/09/17 11:33 AM
The Pearson Series in EconomicsAbel/Bernanke/CroushoreMacroeconomics*Acemoglu/Laibson/ListEconomics*Bade/ParkinFoundations of Economics*Berck/HelfandThe Economics of the EnvironmentBierman/FernandezGame Theory with Economic ApplicationsBlair/RushThe Economics of Managerial Decisions*BlanchardMacroeconomics*BoyerPrinciples of Transportation EconomicsBransonMacroeconomic Theory and PolicyBrucePublic Finance and the American EconomyCarlton/PerloffModern Industrial OrganizationCase/Fair/OsterPrinciples of Economics*ChapmanEnvironmental Economics: Theory, Application, and PolicyDaniels/VanHooseInternational Monetary & Financial EconomicsDownsAn Economic Theory of DemocracyFarnhamEconomics for ManagersFroyenMacroeconomics: Theories and PoliciesFusfeldThe Age of the EconomistGerberInternational Economics*GordonMacroeconomics*GreeneEconometric AnalysisGregory/StuartRussian and Soviet Economic Performance and StructureHartwick/OlewilerThe Economics of Natural Resource UseHeilbroner/MilbergThe Making of the Economic SocietyHeyne/Boettke/PrychitkoThe Economic Way of ThinkingHubbard/O’BrienEconomics*InEconMoney, Banking, and the Financial System*Hubbard/O’Brien/RaffertyMacroeconomics*Hughes/CainAmerican Economic History
Husted/MelvinInternational EconomicsJehle/RenyAdvanced Microeconomic TheoryKeat/Young/ErfleManagerial EconomicsKleinMathematical Methods for EconomicsKrugman/Obstfeld/MelitzInternational Economics: Theory & Policy*LaidlerThe Demand for MoneyLynnEconomic Development: Theory and Practice for a Divided WorldMillerEconomics Today*Miller/BenjaminThe Economics of Macro IssuesMiller/Benjamin/NorthThe Economics of Public IssuesMishkinThe Economics of Money, Banking, and Financial Markets*The Economics of Money, Banking, and Financial Markets, Business
School Edition*Macroeconomics: Policy and Practice*MurrayEconometrics: A Modern IntroductionO’Sullivan/Sheffrin/PerezEconomics: Principles, Applications and Tools*ParkinEconomics*PerloffMicroeconomics*Microeconomics: Theory and Applications with Calculus*Perloff/BranderManagerial Economics and Strategy*Pindyck/RubinfeldMicroeconomics*Riddell/Shackelford/Stamos/SchneiderEconomics: A Tool for Critically Understanding SocietyRobertsThe Choice: A Fable of Free Trade and ProtectionSchererIndustry Structure, Strategy, and Public PolicySchillerThe Economics of Poverty and DiscriminationShermanMarket RegulationStock/WatsonIntroduction to EconometricsStudenmundUsing Econometrics: A Practical GuideTodaro/SmithEconomic DevelopmentWalters/Walters/Appel/Callahan/Centanni/Maex/O’NeillEconversations: Today’s Students Discuss Today’s IssuesWilliamsonMacroeconomics
*denotes MyLab™ Economics titles. Visit www.pearson.com/mylab/economics to learn more.
A01_BLAI8235_01_SE_FM_ppi-xxxiv.indd 2 15/09/17 11:33 AM
THE ECONOMICS OF MANAGERIAL DECISIONS
ROGER D. BLAIRUniversity of Florida
MARK RUSHUniversity of Florida
New York, NY
A01_BLAI8235_01_SE_FM_ppi-xxxiv.indd 3 15/09/17 11:33 AM
Microsoft and/or its respective suppliers make no representations about the suitability of the information contained in the documents and related graphics published as part of the services for any purpose. All such documents and related graphics are provided “as is” without warranty of any kind. Microsoft and/or its respective suppliers hereby disclaim all warranties and conditions with regard to this information, includ-ing all warranties and conditions of merchantability, whether express, implied or statutory, fitness for a par-ticular purpose, title and non-infringement. In no event shall Microsoft and/or its respective suppliers be liable for any special, indirect or consequential damages or any damages whatsoever resulting from loss of use, data or profits, whether in an action of contract, negligence or other tortious action, arising out of or in connection with the use or performance of information available from the services.
The documents and related graphics contained herein could include technical inaccuracies or typograph-ical errors. Changes are periodically added to the information herein. Microsoft and/or its respective suppliers may make improvements and/or changes in the product(s) and/or the program(s) described herein at any time. Partial screen shots may be viewed in full within the software version specified.
Microsoft® and Windows® are registered trademarks of the Microsoft Corporation in the U.S.A. and other countries. This book is not sponsored or endorsed by or affiliated with the Microsoft Corporation.
Copyright © 2019 by Pearson Education, Inc. or its affiliates. All Rights Reserved. Manufactured in the United States of America. This publication is protected by copyright, and permission should be obtained from the publisher prior to any prohibited reproduction, storage in a retrieval system, or transmission in any form or by any means, electronic, mechanical, photocopying, recording, or otherwise. For informa-tion regarding permissions, request forms, and the appropriate contacts within the Pearson Education Global Rights and Permissions department, please visit www.pearsoned.com/permissions/.
Acknowledgments of third-party content appear on the appropriate page within the text.
PEARSON, ALWAYS LEARNING, and MYLAB are exclusive trademarks owned by Pearson Education, Inc. or its affiliates in the U.S. and/or other countries.
Unless otherwise indicated herein, any third-party trademarks, logos, or icons that may appear in this work are the property of their respective owners, and any references to third-party trademarks, logos, icons, or other trade dress are for demonstrative or descriptive purposes only. Such references are not in-tended to imply any sponsorship, endorsement, authorization, or promotion of Pearson’s products by the owners of such marks, or any relationship between the owner and Pearson Education, Inc., or its af-filiates, authors, licensees, or distributors.
Library of Congress Cataloging-in-Publication Data is on file at the Library of Congress.
Vice President, Business, Economics, and UK Courseware: Donna Battista
Director of Portfolio Management: Adrienne D’AmbrosioSenior Portfolio Manager: Christina MasturzoDevelopment Editor: Lena Buonnano, Karen TrostEditorial Assistant: Courtney PaganelliVice President, Product Marketing: Roxanne McCarleySenior Product Marketer: Tricia MurphyProduct Marketing Assistant: Marianela SilvestriManager of Field Marketing, Business Publishing:
Adam GoldsteinSenior Field Marketing Manager: Carlie MarvelVice President, Production and Digital Studio, Arts and
Business: Etain O’DeaDirector of Production, Business: Jeff HolcombManaging Producer, Business: Alison KalilContent Producer: Carolyn Philips
Operations Specialist: Carol MelvilleDesign Lead: Kathryn FootManager, Learning Tools: Brian SuretteContent Developer, Learning Tools: Sarah PetersonManaging Producer, Digital Studio and GLP, Media Production
and Development: Ashley SantoraManaging Producer, Digital Studio: Diane LombardoDigital Studio Producer: Melissa HonigDigital Studio Producer: Alana ColesDigital Content Team Lead: Noel LotzDigital Content Project Lead: Noel LotzProject Manager: Susan McNally, Cenveo® Publisher ServicesInterior Design: Cenveo® Publisher ServicesCover Design: Carie Keller, Cenveo® Publisher ServicesPrinter/Binder: LSC Communications, Inc. Willard, OhioCover Printer: Phoenix Color/Hagerstown
ISBN-10: 0133548236ISBN-13: 9780133548235
A01_BLAI8235_01_SE_FM_ppi-xxxiv.indd 4 15/09/17 11:33 AM

For Chau, our kids and our grandkids Roger D. Blair
For Sue’s memory and our kids Mark B. Rush
A01_BLAI8235_01_SE_FM_ppi-xxxiv.indd 5 15/09/17 11:33 AM

Roger D. Blair is the Walter J. Matherly Professor and chair of economics at the University of Florida. He has been a visiting professor at the University of Hawaii and the University of California–Berkeley as well as Visiting Scholar in Residence, Center for the Study of American Business, Washington University. Professor Blair’s research centers on antitrust economics and policy. He has published 10 books and 200 journal articles. He has also served as an antitrust consultant to numerous corpo-rations, including Intel, Anheuser-Busch, TracFone, Blue Cross–Blue Shield, Waste Management, Astellas Pharma, and many others.
Mark Rush is a professor of economics at the University of Florida. Prior to teach-ing at Florida, he was an assistant professor of economics at the University of Pittsburgh. He has spent eight months at the Kansas City Federal Reserve Bank as a Visiting Scholar. Professor Rush has taught MBA classes for many years and has won teaching awards for his classes. He has published in numerous professional journals, including the Journal of Political Economy; the Journal of Monetary Economics; the Journal of Money, Credit, and Banking; the Journal of International Money and Finance; and the Journal of Labor Economics.
ABOUT THE AUTHORS
A01_BLAI8235_01_SE_FM_ppi-xxxiv.indd 6 15/09/17 11:33 AM
PART 1 ECONOMIC FOUNDATIONS
1 Managerial Economics and Decision Making 1
2 Demand and Supply 33
3 Measuring and Using Demand 86
PART 2 MARKET STRUCTURE AND MANAGERIAL DECISIONS
4 Production and Costs 138
5 Perfect Competition 186
6 Monopoly and Monopolistic Competition 227
7 Cartels and Oligopoly 274
8 Game Theory and Oligopoly 318
9 A Manager’s Guide to Antitrust Policy 371
PART 3 MANAGERIAL DECISIONS
10 Advanced Pricing Decisions 414
11 Decisions About Vertical Integration and Distribution 465
12 Decisions About Production, Products, and Location 499
13 Marketing Decisions: Advertising and Promotion 541
14 Business Decisions Under Uncertainty 587
15 Managerial Decisions About Information 635
16 Using Present Value to Make Multiperiod Managerial Decisions 677
Content on the Web:
Appendix: The Business Plan Chapter: Franchising Decisions
BRIEF CONTENTS
A01_BLAI8235_01_SE_FM_ppi-xxxiv.indd 7 15/09/17 11:33 AM
viii
CONTENTS
1 Managerial Economics and Decision Making 1
Managers at Sears Holdings Use Opportunity Cost to Make Tough Decisions 1
Introduction 1
1.1 Managerial Economics and Your Career 2
1.2 Firms and Their Organizational Structure 3Definition of a Firm 3The Legal Organization of Firms 3
1.3 Profit, Accounting Cost, and Opportunity Cost 6Goal: Profit Maximization 6Total Revenue 7Accounting Cost and Opportunity Cost 8
DECISION SNAPSHOT Sunk Costs in the Stock Market 11
DECISION SNAPSHOT Opportunity Cost at Singing the Blues Blueberry Farm 13
Comparing Accounting Cost and Opportunity Cost 15Using Opportunity Cost to Make Decisions 17
SOLVED PROBLEM Resting Energy’s Opportunity Cost 17
1.4 Marginal Analysis 18The Marginal Analysis Rule 18Using Marginal Analysis 19
SOLVED PROBLEM How to Respond Profitably to Changes in Marginal Cost 20
Revisiting How Managers at Sears Holdings Used Opportunity Cost to Make Tough Decisions 21
Summary: The Bottom Line 22
Key Terms and Concepts 23
Questions and Problems 23
MyLab Economics Auto-Graded Excel Projects 25
APPENDIX The Calculus of Marginal Analysis 28A. Review of Mathematical Results 28B. Marginal Benefit and Marginal Cost 29C. Maximizing Total Surplus 29D. Maximizing Total Surplus: Example 30
Calculus Questions and Problems 31
PART 1ECONOMIC FOUNDATIONS
A01_BLAI8235_01_SE_FM_ppi-xxxiv.indd 8 15/09/17 11:33 AM
Contents ix
2 Demand and Supply 33
Managers at Red Lobster Cope with Early Mortality Syndrome 33
Introduction 332.1 Demand 34
Law of Demand 34Demand Curve 35Factors That Change Demand 37
DECISION SNAPSHOT Demand for the Cadillac Escalade 41
Changes in Demand: Demand Function 41
SOLVED PROBLEM Demand for Lobster Dinners 43
2.2 Supply 44Law of Supply 44Supply Curve 44Factors That Change Supply 46Changes in Supply: Supply Function 49
SOLVED PROBLEM The Supply of Gasoline-Powered Cars and the Price of Hybrid Cars 50
2.3 Market Equilibrium 51Equilibrium Price and Equilibrium Quantity 51Demand and Supply Functions: Equilibrium 53
SOLVED PROBLEM Equilibrium Price and Quantity of Plush Toys 54
2.4 Competition and Society 54Total Surplus 54Consumer Surplus 58Producer Surplus 59
SOLVED PROBLEM Total Surplus, Consumer Surplus, and Producer Surplus in the Webcam Market 60
2.5 Changes in Market Equilibrium 61Use of the Demand and Supply Model When One Curve Shifts: Demand 61Use of the Demand and Supply Model When One Curve Shifts: Supply 63Use of the Demand and Supply Model When Both Curves Shift 64Demand and Supply Functions: Changes in Market Equilibrium 68
SOLVED PROBLEM Demand and Supply for Tablets Both Change 70
2.6 Price Controls 70Price Ceiling 70Price Floor 72
SOLVED PROBLEM The Effectiveness of a Minimum Wage 74
2.7 Using the Demand and Supply Model 75Predicting Your Costs 75Predicting Your Price 76
Revisiting How Managers at Red Lobster Coped with Early Mortality Syndrome 78
Summary: The Bottom Line 78
Key Terms and Concepts 79
Questions and Problems 80
MyLab Economics Auto-Graded Excel Projects 83
MANAGERIAL APPLICATION
A01_BLAI8235_01_SE_FM_ppi-xxxiv.indd 9 15/09/17 11:33 AM
x Contents
3 Measuring and Using Demand 86
Managers at the Gates Foundation Decide to Subsidize Antimalarial Drugs 86
Introduction 87
3.1 Regression: Estimating Demand 87The Basics of Regression Analysis 88Regression Analysis 89Regression Results: Estimated Coefficients and Estimated Demand Curve 92
SOLVED PROBLEM Regression Analysis at Your Steak Chain 94
3.2 Interpreting the Results of Regression Analysis 94Estimated Coefficients 94Fit of the Regression 99
SOLVED PROBLEM Confidence Intervals and Predictions for the Demand for Doors 100
3.3 Limitations of Regression Analysis 101Specification of the Regression Equation 101Functional Form of the Regression Equation 102
SOLVED PROBLEM Which Regression to Use? 104
3.4 Elasticity 105The Price Elasticity of Demand 105
DECISION SNAPSHOT Advertising and the Price Elasticity of Demand 117
Income Elasticity and Cross-Price Elasticity of Demand 117
SOLVED PROBLEM The Price Elasticity of Demand for a Touch-Screen Smartphone 119
3.5 Regression Analysis and Elasticity 120Using Regression Analysis 120Using the Price Elasticity of Demand 122Using the Income Elasticity of Demand Through the Business Cycle 122
Revisiting How Managers at the Gates Foundation Decided to Subsidize Antimalarial Drugs 123
Summary: The Bottom Line 123
Key Terms and Concepts 124
Questions and Problems 124
MyLab Economics Auto-Graded Excel Projects 128
CASE STUDY Decision Making Using Regression 130
APPENDIX The Calculus of Elasticity 133A. Price Elasticity of Demand for a Linear and a Log-Linear Demand Function 133B. Total Revenue Test 134C. Income Elasticity of Demand and Cross-Price Elasticity of Demand 135
Calculus Questions and Problems 136
MANAGERIAL APPLICATION
A01_BLAI8235_01_SE_FM_ppi-xxxiv.indd 10 15/09/17 11:33 AM
Contents xi
4 Production and Costs 138
Pizza Hut Managers Learn That Size Matters 138
Introduction 1384.1 Production 139
Production Function 139Short-Run Production Function 141Long-Run Production Function 145
SOLVED PROBLEM Marginal Product of Labor at a Bicycle Courier Service 147
4.2 Cost Minimization 147Cost-Minimization Rule 148Generalizing the Cost-Minimization Rule 149
SOLVED PROBLEM Cost Minimization at a Construction Firm 150
4.3 Short-Run Cost 150Fixed Cost, Variable Cost, and Total Cost 151Average Fixed Cost, Average Variable Cost, and Average Total Cost 152Marginal Cost 153
DECISION SNAPSHOT Input Price Changes and Changes in the Marginal Cost of an Eiffel Tower Tour 154
Competitive Return 156Shifts in Cost Curves 157
DECISION SNAPSHOT Changes in Input Prices and Cost Changes at Shagang Group 159
SOLVED PROBLEM Calculating Different Costs at a Caribbean Restaurant 161
4.4 Long-Run Cost 162Long-Run Average Cost 162Economies of Scale, Constant Returns to Scale, and Diseconomies of Scale 166
SOLVED PROBLEM Long-Run Average Cost 169
4.5 Using Production and Cost Theory 170Effects of a Change in the Price of an Input 170Economies and Diseconomies of Scale 171
Revisiting How Pizza Hut Managers Learned That Size Matters 173
Summary: The Bottom Line 174
Key Terms and Concepts 174
Questions and Problems 175
MyLab Economics Auto-Graded Excel Projects 178
APPENDIX The Calculus of Cost 179A. Marginal Product 179B. Cost Minimization 180C. Marginal Cost and the Marginal/Average Relationship 183
Calculus Questions and Problems 184
MANAGERIAL APPLICATION
PART 2MARKET STRUCTURE AND MANAGERIAL DECISIONS
A01_BLAI8235_01_SE_FM_ppi-xxxiv.indd 11 15/09/17 11:33 AM
xii Contents
5 Perfect Competition 186
Burger King Managers Decide to Let Chickens Have It Their Way 186
Introduction 186
5.1 Characteristics of Competitive Markets 187Defining Characteristics of Perfect Competition 188Perfectly Competitive Markets 189
SOLVED PROBLEM The Markets for Fencing and Cell Phones 190
5.2 Short-Run Profit Maximization in Competitive Markets 191Marginal Analysis 191Using Marginal Analysis to Maximize Profit 194
DECISION SNAPSHOT Marginal Analysis at the American Cancer Society 196
Changes in Costs 196Amount of Profit 197Shutting Down 201
DECISION SNAPSHOT Lundberg Family Farms Responds to a Fall in the Price of Rice 203
The Firm’s Short-Run Supply Curve 204
DECISION SNAPSHOT A Particleboard Firm Responds to a Fall in the Price of an Input 205
The Short-Run Market Supply Curve 206
SOLVED PROBLEM Amount of Profit and Shutting Down at a Plywood Producer 207
5.3 Long-Run Profit Maximization in Competitive Markets 208Long-Run Effects of an Increase in Market Demand 208Change in Technology 212
SOLVED PROBLEM The Long Run at a Plywood Producer 214
5.4 Perfect Competition 215Applying Marginal Analysis 215Optimal Long-Run Adjustments 215
Revisiting How Burger King Managers Decided to Let Chickens Have It Their Way 217
Summary: The Bottom Line 218
Key Terms and Concepts 218
Questions and Problems 219
MyLab Economics Auto-Graded Excel Projects 222
APPENDIX The Calculus of Profit Maximization for Perfectly Competitive Firms 224A. Marginal Revenue 224B. Maximizing Profit 224C. Maximizing Profit: Example 224
Calculus Questions and Problems 226
MANAGERIAL APPLICATION
A01_BLAI8235_01_SE_FM_ppi-xxxiv.indd 12 15/09/17 11:33 AM
6 Monopoly and Monopolistic Competition 227
Premature Rejoicing by the Managers at KV Pharmaceutical 227
Introduction 228
6.1 A Monopoly Market 228Defining Characteristics of a Monopoly Market 228Demand and Marginal Revenue for a Monopoly 229
DECISION SNAPSHOT Is Delta Airlines a Monopoly? 229
SOLVED PROBLEM The Relationship Among the Price Elasticity of Demand, Marginal Revenue, and Price 233
6.2 Monopoly Profit Maximization 234Profit Maximization for a Monopoly 234
DECISION SNAPSHOT Profit-Maximizing Range of Prices for Tires 237
Comparing Perfect Competition and Monopoly 239Barriers to Entry 241
SOLVED PROBLEM Merck’s Profit-Maximizing Price, Quantity, and Economic Profit 247
6.3 Dominant Firm 247Dominant Firm’s Profit Maximization 248
DECISION SNAPSHOT How a Technology Firm Responds to Changes in the Competitive Fringe 251
SOLVED PROBLEM The Demand for Shoes at a Dominant Firm 252
6.4 Monopolistic Competition 252Defining Characteristics of Monopolistic Competition 253Short-Run Profit Maximization for a Monopolistically Competitive Firm 253Long-Run Equilibrium for a Monopolistically Competitive Firm 255
SOLVED PROBLEM J-Phone’s Camera Phone 256
6.5 The Monopoly, Dominant Firm, and Monopolistic Competition Models 257Using the Models in Managerial Decision Making 257Applying the Monopolistic Competition Model 259
Revisiting Premature Rejoicing by the Managers at KV Pharmaceutical 261
Summary: The Bottom Line 261
Key Terms and Concepts 262
Questions and Problems 262
MyLab Economics Auto-Graded Excel Projects 268
APPENDIX The Calculus of Profit Maximization for Firms with Market Power 269A. Marginal Revenue Curve 269B. Elasticity, Price, and Marginal Revenue 269C. Maximizing Profit 270D. Maximizing Profit: Example 271
Calculus Questions and Problems 272
MANAGERIAL APPLICATION
Contents xiii
A01_BLAI8235_01_SE_FM_ppi-xxxiv.indd 13 15/09/17 11:33 AM
xiv Contents
7 Cartels and Oligopoly 274
Managers at Major Publishers Read the e-Writing on the e-Wall 274
Introduction 274
7.1 Cartels 275Cartel Profit Maximization 276Instability of a Cartel 277
SOLVED PROBLEM Potential Profit from a Cellular Telephone Cartel 280
7.2 Tacit Collusion 280Price Visibility 281
DECISION SNAPSHOT A Contract in the Market for Propane 282
Preannouncements 283Precommitments 283Price Leadership 284
SOLVED PROBLEM Price Leadership in the Market for Insulin 284
7.3 Four Types of Oligopolies 285Cournot Oligopoly 285
DECISION SNAPSHOT South Africa’s Impala Platinum as a Cournot Oligopolist 293
Chamberlin Oligopoly 294Stackelberg Oligopoly 296Bertrand Oligopoly 297Comparing Oligopoly Models 298
SOLVED PROBLEM Coca-Cola Reacts to PepsiCo 299
7.4 Cartels and Oligopoly 300Using Cartel Theory and Tacit Collusion for Managerial Decision Making 301Using Types of Oligopolies for Managerial Decision Making 301
Revisiting How Managers at Major Publishers Read the e-Writing on the e-Wall 302
Summary: The Bottom Line 303
Key Terms and Concepts 303
Questions and Problems 304
MyLab Economics Auto-Graded Excel Projects 307
APPENDIX The Calculus of Oligopoly 309A. Cournot Oligopoly 309B. Stackelberg Oligopoly 315
Calculus Questions and Problems 316
MANAGERIAL APPLICATION
A01_BLAI8235_01_SE_FM_ppi-xxxiv.indd 14 15/09/17 11:33 AM
8 Game Theory and Oligopoly 318
Managers at Pfizer Welcome a Competitor in the Market for Lipitor 318
Introduction 318
8.1 Basic Game Theory and Games 319Elements of a Game 320A Sample Game 320Nash Equilibrium 322A Dilemma 323
DECISION SNAPSHOT An Advertising Game 324
Repeated Games 325
DECISION SNAPSHOT TragoCo and Boca-Cola Play a Repeated Game 327
Dominated Strategies 330
SOLVED PROBLEM Games Between Two Smartphone Producers 332
8.2 Advanced Games 334Multiple Nash Equilibria 334Mixed-Strategy Nash Equilibrium 337
SOLVED PROBLEM Custom’s Flower of the Day 343
8.3 Sequential Games 344An Entry Game 344
DECISION SNAPSHOT Game Tree Between Disney and Warner Brothers 347
Commitment and Credibility 348
SOLVED PROBLEM A Pharmaceutical Company Uses Game Theory to Make an Offer 352
8.4 Game Theory 354Using Basic Games for Managerial Decision Making 354Using Advanced Games for Managerial Decision Making 356Using Sequential Games for Managerial Decision Making 357
SOLVED PROBLEM Is a Threat Credible? 359
Revisiting How Managers at Pfizer Welcomed a Competitor in the Market for Lipitor 360
Summary: The Bottom Line 361
Key Terms and Concepts 362
Questions and Problems 362
MyLab Economics Auto-Graded Excel Projects 368
MANAGERIAL APPLICATION
Contents xv
A01_BLAI8235_01_SE_FM_ppi-xxxiv.indd 15 15/09/17 11:33 AM
xvi Contents
9 A Manager’s Guide to Antitrust Policy 371
The Managers of Sea Star Line Walk the Plank 371
Introduction 372
9.1 Overview of U.S. Antitrust Policy 372The Monopoly Problem 372The Sherman Act, 1890 374The Clayton Act, 1914 374The Federal Trade Commission Act, 1914 375Sanctions for Antitrust Violations 375Recent Antitrust Cases 377
SOLVED PROBLEM A Perfectly Competitive Market Versus a Monopoly Market 378
9.2 The Sherman Act 379Sherman Act Section 1: Restraint of Trade 379Sherman Act Section 2: Monopolization and Attempt to Monopolize 383
SOLVED PROBLEM Going, Going, Gone: Price Fixing in the Market for Fine Art 387
9.3 The Clayton Act 388Clayton Act Section 2: Price Discrimination 388Clayton Act Section 3: Conditional Sales 388Clayton Act Section 7: Mergers 391
SOLVED PROBLEM The Business Practices Covered in the Clayton Act 392
9.4 U.S. Merger Policy 392Economic Effects of Horizontal Mergers 393Antitrust Merger Policy 394
DECISION SNAPSHOT The XM/Sirius Satellite Radio Merger 396
SOLVED PROBLEM Mergers in the Office-Supply Market 397
9.5 International Competition Laws 398European Union Laws 398Chinese Laws 400Worldwide Competition Laws 401
SOLVED PROBLEM Gazprom Gas Prices Create Indigestion in the European Union 402
9.6 Antitrust Policy 402Using the Sherman Act and the Clayton Act 402Using International Competition Laws 403Antitrust Advice for Managers 403
Revisiting How the Managers of Sea Star Line Walked the Plank 404
Summary: The Bottom Line 405
Key Terms and Concepts 405
Questions and Problems 406
MyLab Economics Auto-Graded Excel Projects 410
CASE STUDY Student Athletes and the NCAA 412
MANAGERIAL APPLICATION
A01_BLAI8235_01_SE_FM_ppi-xxxiv.indd 16 15/09/17 11:33 AM
10 Advanced Pricing Decisions 414
Managers at the Turtle Bay Resort Think Kama’aina Pricing Is Par for the Course 414
Introduction 414
10.1 Price Discrimination 416First-Degree Price Discrimination 416Second-Degree Price Discrimination 418Third-Degree Price Discrimination 419
DECISION SNAPSHOT American Airlines Identifies a Customer Type 425
SOLVED PROBLEM Price Discrimination at Warner Brothers: That’s All, Folks! 426
10.2 Peak-Load Pricing 427Long-Run Capacity Decision 428Short-Run Pricing and Quantity Decisions 429
DECISION SNAPSHOT Peak-Load Pricing by the Minneapolis–St. Paul Metropolitan Airport 432
SOLVED PROBLEM Peak-Load Pricing 433
10.3 Nonlinear Pricing 434Two-Part Pricing 434All-or-Nothing Offers 440
DECISION SNAPSHOT Nonlinear Pricing at the 55 Bar 443
Commodity Bundling 443
SOLVED PROBLEM Movie Magic 446
10.4 Using Advanced Pricing Decisions 447Managerial Use of Price Discrimination 447Managerial Use of Peak-Load Pricing 448Managerial Use of Nonlinear Pricing 449
Revisiting How the Managers at Turtle Bay Resort Came to Think Kama’aina Pricing Is Par for the Course 450
Summary: The Bottom Line 451
Key Terms and Concepts 451
Questions and Problems 451
MyLab Economics Auto-Graded Excel Projects 456
APPENDIX The Calculus of Advanced Pricing Decisions 458A. Third-Degree Price Discrimination 458B. Two-Part Pricing 459
Calculus Questions and Problems 463
MANAGERIAL APPLICATION
PART 3MANAGERIAL DECISIONS
Contents xvii
A01_BLAI8235_01_SE_FM_ppi-xxxiv.indd 17 15/09/17 11:33 AM
xviii Contents
12 Decisions About Production, Products, and Location 499
Managers at Freeport-McMoRan Dig Deep to Make a Decision 499
Introduction 500
12.1 Joint Production 500Fixed Proportions 501Variable Proportions 502
SOLVED PROBLEM A Refinery Responds to an Increase in the Profit from Gasoline 506
11 Decisions About Vertical Integration and Distribution 465
Why Would Walgreens Boots Alliance Purchase Wholesaler AmerisourceBergen? 465
Introduction 465
11.1 The Basics of Vertical Integration 467Markets Versus Vertical Integration 467Types of Vertical Integration 468Transfer Prices and Taxes 469
SOLVED PROBLEM Vertical Integration 470
11.2 The Economics of Vertical Integration 471Synergies 471Costs of Using a Market: Transaction Costs, the Holdup Problem, and Technological Interdependencies 471
DECISION SNAPSHOT PepsiCo Reduces Transaction Costs 473
Costs of Using Vertical Integration 476
DECISION SNAPSHOT Pilgrim’s Pride and the Limits of Vertical Integration 477
SOLVED PROBLEM IBM Avoids a Holdup Problem 478
11.3 Vertical Integration and Market Structure 478Vertical Integration with Competitive Distributors 479Vertical Integration with a Monopoly Distributor 483
SOLVED PROBLEM Price and Quantity with Competitive Distributors and a Monopoly Distributor 488
11.4 Vertical Integration and Distribution 489Using the Economics of Vertical Integration for Managerial Decision Making 489Using Vertical Integration and Market Structure for Managerial Decision Making Within a Firm 490
Revisiting Why Walgreens Boots Alliance Would Purchase Wholesaler AmerisourceBergen 490
Summary: The Bottom Line 491
Key Terms and Concepts 492
Questions and Problems 492
MyLab Economics Auto-Graded Excel Projects 496
MANAGERIAL APPLICATION
A01_BLAI8235_01_SE_FM_ppi-xxxiv.indd 18 15/09/17 11:33 AM
13 Marketing Decisions: Advertising and Promotion 541
Heads Up for Advertising Decisions at Riddell 541
Introduction 541
13.1 Profit-Maximizing Advertising by a Firm 542Advertising and Profit Maximization 543Choosing Advertising Media 547
Contents xix
12.2 The Multi-Plant Firm 506Marginal Cost for a Multi-Plant Firm 507Profit Maximization for a Multi-Plant Firm 508
SOLVED PROBLEM Can Producing Too Many Cookies Hurt Your Firm’s Profit? 510
12.3 Location Decisions 511Changes in Costs from Adding Plants 511The Effect of Transportation Costs on Location Decisions 513
DECISION SNAPSHOT Quaker Oats’ Location Decision 514
DECISION SNAPSHOT Walgreens and CVS Compete for Your Drug Prescription 515
The Effect of Geographic Variation in Input Prices on Location Decisions 516
SOLVED PROBLEM A Department Store Pays for Transportation 518
12.4 Decisions About Product Quality 518SOLVED PROBLEM Flower Quality 520
12.5 Optimal Inventories 521Economic Order Quantity Model 521General Optimal Inventory Decisions 523
SOLVED PROBLEM How a Decrease in Demand Affects the Economic Order Quantity 524
12.6 Production, Products, and Location 525Joint Production of an Input 525Transportation Costs, Plant Size, and Location 526
Revisiting How Managers at Freeport-McMoRan Had to Dig Deep to Make a Decision 528
Summary: The Bottom Line 528
Key Terms and Concepts 529
Questions and Problems 529
MyLab Economics Auto-Graded Excel Projects 534
APPENDIX The Calculus of Multi-Plant Profit-Maximization and Inventory Decisions 536A. Production Decisions at a Multi-Plant Firm 536B. Economic Order Quantity Inventory Model 537
Calculus Questions and Problems 539
MANAGERIAL APPLICATION
A01_BLAI8235_01_SE_FM_ppi-xxxiv.indd 19 15/09/17 11:33 AM
xx Contents
DECISION SNAPSHOT PepsiCo Allocates Its Advertising Dollars 548
SOLVED PROBLEM Marginal Benefit from Automobile Advertising 549
13.2 Optimal Advertising by an Industry 550Industry-Wide Advertising as a Public Good 550Challenges of Industry-Wide Advertising 551
SOLVED PROBLEM The National Football League’s Advertising Problem 554
13.3 False Advertising 554When Can False Advertising Be Successful? 555What Are the Penalties for False Advertising? 557
SOLVED PROBLEM Advertising for Skechers Shape-Ups Gets the Boot 558
13.4 Resale Price Maintenance and Product Promotion 558The Effect of Resale Price Maintenance 559Profit Maximization with Resale Price Maintenance 560Resale Price Maintenance and Antitrust Policy 561
DECISION SNAPSHOT Amazon.com Markets Its Kindle 562
SOLVED PROBLEM Profit-Maximizing Resale Price Maintenance for Designer Shoes 563
13.5 International Marketing: Entry and Corruption Laws 564Entering a Foreign Market 564U.S. Anticorruption Law: The Foreign Corrupt Practices Act 566
DECISION SNAPSHOT JPMorgan “Sons and Daughters” Program 569
U.K. Bribery Act 569
SOLVED PROBLEM Legal or Illegal? 570
13.6 Marketing and Promotional Decisions 571Industry-Wide Advertising 571Resale Price Maintenance 571Foreign Marketing Issues 573
Revisiting Heads Up for Advertising Decisions at Riddell 573
Summary: The Bottom Line 575
Key Terms and Concepts 576
Questions and Problems 576
MyLab Economics Auto-Graded Excel Projects 580
APPENDIX The Calculus of Advertising 582A. Profit-Maximizing Amount of Advertising with a Single Advertising Medium 582B. Profit-Maximizing Amount of Advertising with Two or More Advertising Media 584
Calculus Questions and Problems 585
MANAGERIAL APPLICATION
A01_BLAI8235_01_SE_FM_ppi-xxxiv.indd 20 15/09/17 11:33 AM

Contents xxi
14 Business Decisions Under Uncertainty 587
Embezzlement Makes Managers at a Nonprofit See Red 587
Introduction 587
14.1 Basics of Probability 588Relative Frequency 588
DECISION SNAPSHOT Probability of Success at a New Branch 589
Expected Value 590Subjective Probability 591
SOLVED PROBLEM Expected Customers at a Car Dealership 592
14.2 Profit Maximization with Random Demand and Random Cost 593Expected Profit Maximization with Random Demand 593Expected Profit Maximization with Random Cost 596Expected Profit Maximization with Random Demand and Random Cost 598
SOLVED PROBLEM Profit Maximization for a Vineyard 599
14.3 Optimal Inventories with Random Demand 600The Inventory Problem 600Profit-Maximizing Inventory 601
SOLVED PROBLEM Profit-Maximizing Inventory of Pastry Rings 603
14.4 Minimizing the Cost of Random Adverse Events 604Minimizing the Cost of Undesirable Outcomes 604Expected Marginal Benefit from Avoiding Undesirable Outcomes 604Marginal Cost of Avoiding Undesirable Outcomes 606Optimal Accident Avoidance 607
DECISION SNAPSHOT Patent Search at a Pharmaceutical Firm 608
The Role of Marginal Analysis in Minimizing the Cost of Accidents 611
SOLVED PROBLEM Safety at an Energy Firm 611
14.5 The Business Decision to Settle Litigation 612Basic Economic Model of Settlements: Parties with Similar Assessments 612
DECISION SNAPSHOT Actavis Versus Solvay Pharmaceuticals 614
Parties with Different Assessments 615
SOLVED PROBLEM To Settle or Not To Settle, That Is the Question 616
14.6 Risk Aversion 616Insurance 617Risk Aversion and Diversification 617Risk Aversion and Litigation 618
SOLVED PROBLEM Merck Takes Advantage of Risk Aversion 618
A01_BLAI8235_01_SE_FM_ppi-xxxiv.indd 21 15/09/17 11:33 AM
xxii Contents
15 Managerial Decisions About Information 635
Auctions Float the Navy’s Boat 635
Introduction 635
15.1 Intellectual Property 636Patents and Trade Secrets 637Copyrights 639Trademarks 640
SOLVED PROBLEM Patent Infringement 641
15.2 Value of Forecasts 642Random Demand Model 642Factors Affecting the Value of Forecasts 644
SOLVED PROBLEM Value of a Forecast 648
15.3 Auctions 650Types of Auctions 650Bidding Strategy 651
DECISION SNAPSHOT Strategy in an English Auction of a U.S. Silver Dollar 655
Expected Revenue 656
SOLVED PROBLEM The San Francisco Giants Strike Out 658
15.4 Asymmetric Information 658Adverse Selection 659Moral Hazard 663
SOLVED PROBLEM Adverse Selection and Insurance Companies 665
15.5 Decisions about Information 666Value of Forecasts for Different Time Periods 666Managing the Winner’s Curse When Selling a Product 667Incentives and the Principal–Agent Problem 667
Revisiting How Auctions Float the Navy’s Boat 669
Summary: The Bottom Line 669
Key Terms and Concepts 670
Questions and Problems 671
MyLab Economics Auto-Graded Excel Projects 674
MANAGERIAL APPLICATION
14.7 Making Business Decisions Under Uncertainty 619Maximizing Profit with Random Demand and Random Cost 619Optimal Inventories with Uncertainty About Demand 620Making Business Decisions to Settle Litigation 622
Revisiting How Embezzlement Made Managers at a Nonprofit See Red 622
Summary: The Bottom Line 623
Key Terms and Concepts 624
Questions and Problems 624
MyLab Economics Auto-Graded Excel Projects 630
CASE STUDY Decision Making with Final Offer Arbitration 632
MANAGERIAL APPLICATION
A01_BLAI8235_01_SE_FM_ppi-xxxiv.indd 22 15/09/17 11:33 AM
16 Using Present Value to Make Multiperiod Managerial Decisions 677
Why Did Ziosk’s Managers Give Their Tablets to Chili’s for Free? 677
Introduction 677
16.1 Fundamentals of Present Value 678Calculating Future Values 679Calculating Present Values 680Valuing a Stream of Future Payments 683Future and Present Value Formulas 688
SOLVED PROBLEM Choosing a Loan Repayment Schedule 688
16.2 Evaluating Investment Options 689Net Present Value and the Net Present Value Rule 689Extensions to the Net Present Value Rule 692
DECISION SNAPSHOT Salvage Value at a Car Rental Firm 693
DECISION SNAPSHOT Depreciation Allowance: Should a Tax Firm Take It Now or Later? 697
Selection of the Discount Rate 698Risk and the Net Present Value Rule 698
SOLVED PROBLEM Investment Decision for an Electric Car Maker 700
16.3 Make-or-Buy Decisions 701Make-or-Buy Basics 701Make-or-Buy Net Present Value Calculations 703
SOLVED PROBLEM A Make-or-Buy Decision with Learning by Doing 704
16.4 Present Value and Net Present Value 704Valuing Financial Assets 704Using the Net Present Value Rule in the Real World 705The Effect of Tax Shields on Net Present Value 706
Revisiting Why Ziosk’s Managers Gave Their Tablets to Chili’s for Free 707
Summary: The Bottom Line 708
Key Terms and Concepts 709
Questions and Problems 709
MyLab Economics Auto-Graded Excel Projects 712
CASE STUDY Analyzing Predatory Pricing as an Investment 715
Answer Key to Chapters 717
Answer Key to Calculus Appendices 756
Index 765
MANAGERIAL APPLICATION
Contents xxiii
A01_BLAI8235_01_SE_FM_ppi-xxxiv.indd 23 15/09/17 11:33 AM
xxiv Contents
Content on the Web
The following content is available on www.pearson.com/mylab/economics
Web Appendix: The Business Plan
A. Dehydrated Business Plan
B. Funding Business PlanExecutive SummaryMarket and Customer AnalysisCompany Description, Product Description, and Competitor AnalysisMarketing and Pricing Strategies
DECISION SNAPSHOT Gilead Sciences Needs a Price
Operations PlanDevelopment Plan TeamCritical RisksOfferingFinancial Plan
Key Terms and Concepts
Questions and Problems
Web Chapter: Franchising Decisions
Quiznos Sandwiches Finds Its Stores Under Water
Introduction
WC.1 FranchisingFranchising IssuesMonopoly BenchmarkInput Purchase RequirementsSales Revenue RoyaltiesResale Price Controls and Sales Quotas
WORKED PROBLEM Subway Uses an Input Purchase Requirement
WC.2 Managerial Application: Franchising TheoryManagerial Use of Lump-Sum Franchise FeesManagerial Use of Sales Revenue RoyaltiesManagerial Use of Resale Price Controls and Sales QuotasSummary
Revisiting How Quiznos Sandwiches Found Its Stores Under Water
Summary: The Bottom Line
Key Terms and Concepts
Questions and Problems
A01_BLAI8235_01_SE_FM_ppi-xxxiv.indd 24 15/09/17 11:33 AM

PREFACE
Solving Teaching and Learning ChallengesStudents who enroll in the managerial economics course are typically not economics majors. They take the course with the goal of building skills that will help them be-come better managers in a variety of business settings, including small and large firms, nonprofit organizations, and public service. In teaching our classes, we often skipped theoretical, abstract coverage in existing books—such as indifference curves, isoquants, the Cobb–Douglas production function, the Rothschild Index, and the Lerner Index—because these topics are not useful to students pursuing careers in management. Based on our teaching experiences and feedback from many reviewers and class testers, we have omitted this sort of theoretical, abstract coverage from our book.
Our decision to omit these topics does not mean that we shortchange economic theory. On the contrary, our book and a wide range of media assets show students how economic theory and concepts—including opportunity cost, marginal analysis, and profit maximization—can provide important insights into real-world manage-rial challenges such as how to price a product, how many workers to hire, whether to expand production, and how much to spend on advertising. Applications and extensions of the core theory abound. Some of the topics include bundled pricing, vertical integration, resale price maintenance, industry-wide advertising, settle-ment of legal disputes, present value and investment decisions, auctions and opti-mal bidding, and optimal patent search. We focus on how to think critically and make decisions in real-world business situations—in other words, how to apply economic theory.
MyLab EconomicsMyLab Economics is an online homework, tutorial, and assessment program that delivers technology-enhanced learning in tandem with printed textbooks and etexts. It improves results by helping students quickly grasp concepts and by providing educators with a robust set of tools to easily gauge and address the performance of individuals and classrooms.
The Study Plan provides personalized recommendations for each student, based on his or her ability to master the learning objectives in your course. This allows stu-dents to focus their study time by pinpointing the precise areas they need to review, and allowing them to use customized practice and learning aids—such as videos, eText, tutorials, and more—to keep them on track.
First-in-class content is delivered digitally to help every student master criti-cal course concepts. MyLab Economics includes Mini Sims, Auto-Graded Excel Projects, and Digital Interactives to not only help students understand important economic concepts, but also help them learn how to apply these concepts in a variety of ways so they can see how they can use economics long after the last day of class.
MyLab Economics allows for easy and flexible assignment creation, so instructors can assign a variety of assignments tailored to meet their specific course needs.
Visit www.pearson.com/mylab/economics for more information on Mini Sims, Auto-Graded Excel Projects, Digital Interactives, our LMS integration options, and course management options for any course of any size.
xxv
A01_BLAI8235_01_SE_FM_ppi-xxxiv.indd 25 15/09/17 11:33 AM
Chapter FeaturesThe following key features and media assets demonstrate how The Economics of Managerial Decisions keeps the spotlight on the student as a future manager.
Real-world chapter openers and closers: Each chapter begins with a real-world example that piques student interest and poses a managerial decision-making ques-tion. We revisit this question and apply the chapter content to provide an answer at the end. Because students pursue careers in various fields, the chapter openers pres-ent challenges faced by a number of different types of organizations, including large and small profit-seeking firms, government organizations, nongovernmental organi-zations, and nonprofits.
xxvi Preface
CH
AP
TE
R
3 Measuring and Using Demand
Learning ObjectivesAfter studying this chapter, you will be able to
3.1 Explain the basics of regression analysis.3.2 Interpret the results from a regression.3.3 Describe the limitations of regression analysis and how they affect its use by managers.3.4 Discuss different elasticity measures and their use.3.5 Use regression analysis and the different elasticity measures to make better managerial
decisions.
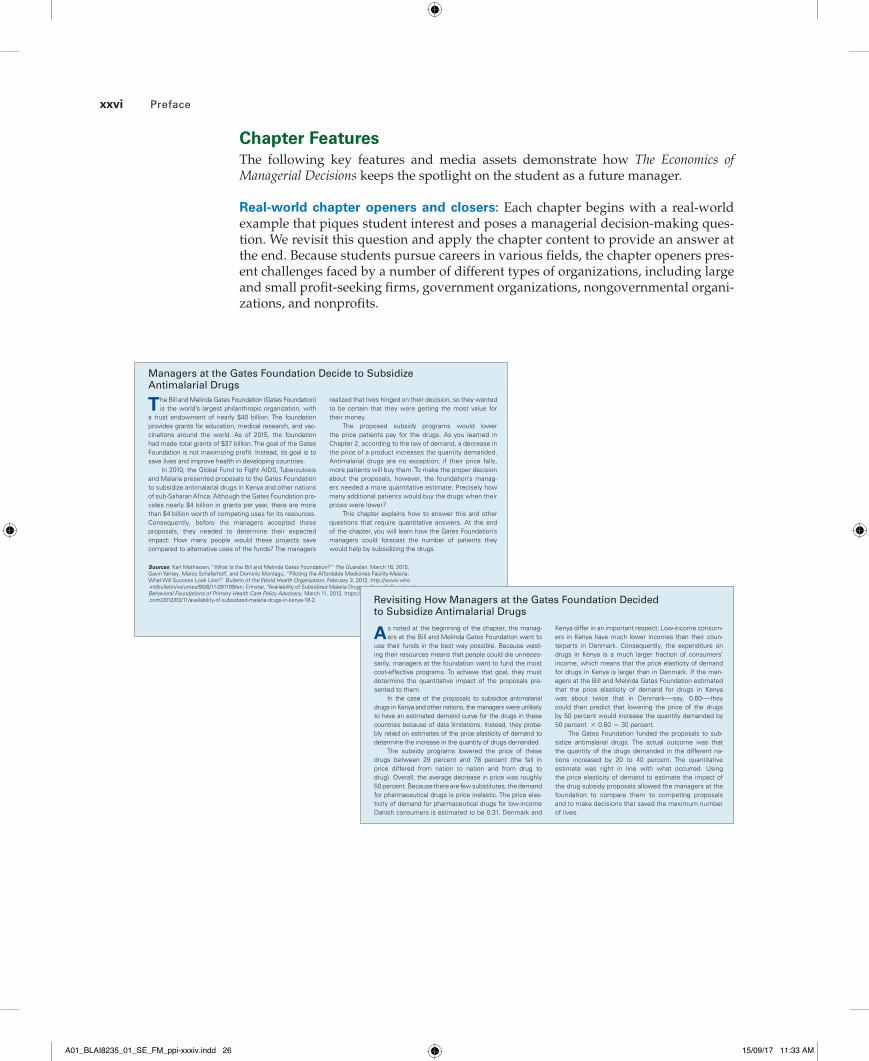
Managers at the Gates Foundation Decide to Subsidize Antimalarial Drugs
The Bill and Melinda Gates Foundation (Gates Foundation) is the world’s largest philanthropic organization, with
a trust endowment of nearly $40 billion. The foundation provides grants for education, medical research, and vac-cinations around the world. As of 2015, the foundation had made total grants of $37 billion. The goal of the Gates Foundation is not maximizing profit. Instead, its goal is to save lives and improve health in developing countries.
In 2010, the Global Fund to Fight AIDS, Tuberculosis and Malaria presented proposals to the Gates Foundation to subsidize antimalarial drugs in Kenya and other nations of sub-Saharan Africa. Although the Gates Foundation pro-vides nearly $4 billion in grants per year, there are more than $4 billion worth of competing uses for its resources. Consequently, before the managers accepted these proposals, they needed to determine their expected impact: How many people would these projects save compared to alternative uses of the funds? The managers
realized that lives hinged on their decision, so they wanted to be certain that they were getting the most value for their money.
The proposed subsidy programs would lower the price patients pay for the drugs. As you learned in Chapter 2, according to the law of demand, a decrease in the price of a product increases the quantity demanded. Antimalarial drugs are no exception; if their price falls, more patients will buy them. To make the proper decision about the proposals, however, the foundation’s manag-ers needed a more quantitative estimate: Precisely how many additional patients would buy the drugs when their prices were lower?
This chapter explains how to answer this and other questions that require quantitative answers. At the end of the chapter, you will learn how the Gates Foundation’s managers could forecast the number of patients they would help by subsidizing the drugs.
Sources: Karl Mathiesen, “What Is the Bill and Melinda Gates Foundation?” The Guardian. March 16, 2015; Gavin Yamey, Marco Schaferhoff, and Dominic Montagu, “Piloting the Affordable Medicines Facility-Malaria: What Will Success Look Like?” Bulletin of the World Health Organization, February 3, 2012, http://www.who .int/bulletin/volumes/90/6/11-091199/en; Erinstar, “Availability of Subsidized Malaria Drugs in Kenya,” Social and Behavioral Foundations of Primary Health Care Policy Advocacy, March 11, 2012, https://sbfphc.wordpress .com/2012/03/11/availability-of-subsidized-malaria-drugs-in-kenya-18-2.
86
M03_BLAI8235_01_SE_C03_pp86-137.indd 86 23/08/17 9:53 AM
Revisiting How Managers at the Gates Foundation Decided to Subsidize Antimalarial Drugs
As noted at the beginning of the chapter, the manag-ers at the Bill and Melinda Gates Foundation want to
use their funds in the best way possible. Because wast-ing their resources means that people could die unneces-sarily, managers at the foundation want to fund the most cost-effective programs. To achieve that goal, they must determine the quantitative impact of the proposals pre-sented to them.
In the case of the proposals to subsidize antimalarial drugs in Kenya and other nations, the managers were unlikely to have an estimated demand curve for the drugs in these countries because of data limitations. Instead, they proba-bly relied on estimates of the price elasticity of demand to determine the increase in the quantity of drugs demanded.
The subsidy programs lowered the price of these drugs between 29 percent and 78 percent (the fall in price differed from nation to nation and from drug to drug). Overall, the average decrease in price was roughly 50 percent. Because there are few substitutes, the demand for pharmaceutical drugs is price inelastic. The price elas-ticity of demand for pharmaceutical drugs for low-income Danish consumers is estimated to be 0.31. Denmark and
Kenya differ in an important respect: Low-income consum-ers in Kenya have much lower incomes than their coun-terparts in Denmark. Consequently, the expenditure on drugs in Kenya is a much larger fraction of consumers’ income, which means that the price elasticity of demand for drugs in Kenya is larger than in Denmark. If the man-agers at the Bill and Melinda Gates Foundation estimated that the price elasticity of demand for drugs in Kenya was about twice that in Denmark-—say, 0.60-—they could then predict that lowering the price of the drugs by 50 percent would increase the quantity demanded by 50 percent * 0.60 = 30 percent.
The Gates Foundation funded the proposals to sub-sidize antimalarial drugs. The actual outcome was that the quantity of the drugs demanded in the different na-tions increased by 20 to 40 percent. The quantitative estimate was right in line with what occurred. Using the price elasticity of demand to estimate the impact of the drug subsidy proposals allowed the managers at the foundation to compare them to competing proposals and to make decisions that saved the maximum number of lives.
Summary: The Bottom Line3.1 Regression: Estimating Demand• Regression analysis is a statistical tool used to estimate
the relationships between two or more variables.• Regression analysis assumes that the function to be es-
timated has a random element. The estimated coeffi-cients minimize the sum of the squared residuals between the actual values of the dependent variable and the values predicted by the regression.
3.2 Interpreting the Results of Regression Analysis
• The coefficients estimated by a regression change when the data change. The statistical programs used in regression analysis calculate confidence intervals for each estimated coefficient. For the 95 percent confi-dence interval, the value of the true coefficient falls within the interval 95 percent of the time.
• The P-value indicates whether an estimated coefficient is statistically significantly different from zero. If the P-value is 5 percent (0.05) or less, then you can be 95 percent confident that the true coefficient is not equal to zero.
• The R2 statistic, which measures the overall fit of the regression, varies between 100 percent (the predicted values capture all the variation in the actual dependent variable) and 0 (the predicted values capture none of the variation in the actual dependent variable).
3.3 Limitations of Regression Analysis• Managers should examine regressions reported to
them to be certain that all the relevant variables are included.
• Managers should determine whether a regression’s functional form (curve or straight line) is the best fit for the data.
3.4 Elasticity• The price elasticity of demand measures how strongly
the quantity demanded responds to a change in the price of a product. It equals the absolute value of the percentage change in the quantity demanded divided by the percentage change in the price.
Summary: The Bottom Line 123
M03_BLAI8235_01_SE_C03_pp86-137.indd 123 23/08/17 9:53 AM
A01_BLAI8235_01_SE_FM_ppi-xxxiv.indd 26 15/09/17 11:33 AM
120 CHAPTER 3 Measuring and Using Demand
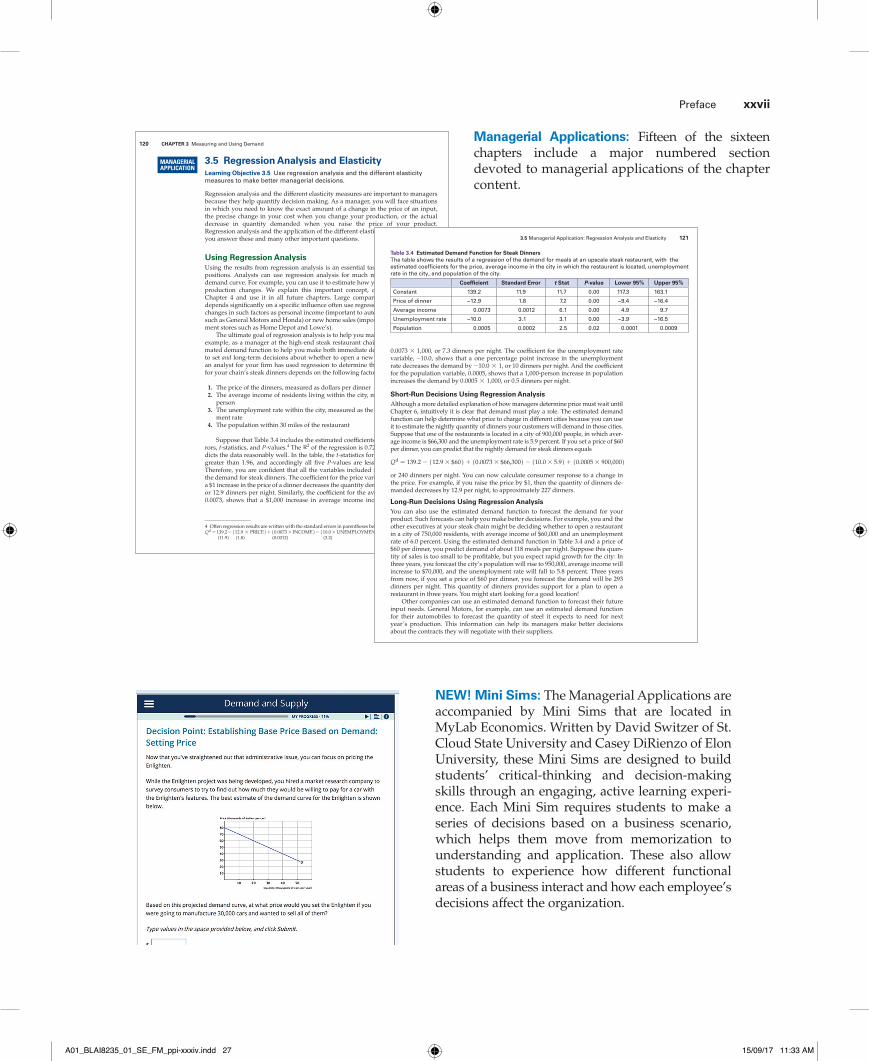
3.5 Regression Analysis and ElasticityLearning Objective 3.5 Use regression analysis and the different elasticity measures to make better managerial decisions.
Regression analysis and the different elasticity measures are important to managers because they help quantify decision making. As a manager, you will face situations in which you need to know the exact amount of a change in the price of an input, the precise change in your cost when you change your production, or the actual decrease in quantity demanded when you raise the price of your product. Regression analysis and the application of the different elasticity measures can help you answer these and many other important questions.
Using Regression AnalysisUsing the results from regression analysis is an essential task in many managerial positions. Analysts can use regression analysis for much more than estimating a demand curve. For example, you can use it to estimate how your costs change when production changes. We explain this important concept, called marginal cost, in Chapter 4 and use it in all future chapters. Large companies with demand that depends significantly on a specific influence often use regression analysis to forecast changes in such factors as personal income (important to automobile manufacturers such as General Motors and Honda) or new home sales (important to home improve-ment stores such as Home Depot and Lowe’s).
The ultimate goal of regression analysis is to help you make better decisions. For example, as a manager at the high-end steak restaurant chain, you can use an esti-mated demand function to help you make both immediate decisions about the price to set and long-term decisions about whether to open a new location. Suppose that an analyst for your firm has used regression to determine that the nightly demand for your chain’s steak dinners depends on the following factors:
1. The price of the dinners, measured as dollars per dinner2. The average income of residents living within the city, measured as dollars per
person3. The unemployment rate within the city, measured as the percentage unemploy-
ment rate4. The population within 30 miles of the restaurant
Suppose that Table 3.4 includes the estimated coefficients and their standard er-rors, t-statistics, and P-values.4 The R2 of the regression is 0.72, so the regression pre-dicts the data reasonably well. In the table, the t-statistics for all five coefficients are greater than 1.96, and accordingly all five P-values are less than 5 percent (0.05). Therefore, you are confident that all the variables included in the regression affect the demand for steak dinners. The coefficient for the price variable, −12.9, shows that a $1 increase in the price of a dinner decreases the quantity demanded by -12.9 * $1, or 12.9 dinners per night. Similarly, the coefficient for the average income variable, 0.0073, shows that a $1,000 increase in average income increases the demand by
MANAGERIAL APPLICATION
4 Often regression results are written with the standard errors in parentheses below the estimated coefficients:Qd = 139.2 - 112.9 * PRICE2 + 10.0073 * INCOME2 - 110.0 * UNEMPLOYMENT2+ 10.0005 * POPULATION2 (11.9) (1.8) (0.0012) (3.2) (0.0002)
M03_BLAI8235_01_SE_C03_pp86-137.indd 120 23/08/17 9:53 AM
Preface xxvii
NEW! Mini Sims: The Managerial Applications are accompanied by Mini Sims that are located in MyLab Economics. Written by David Switzer of St. Cloud State University and Casey DiRienzo of Elon University, these Mini Sims are designed to build students’ critical-thinking and decision-making skills through an engaging, active learning experi-ence. Each Mini Sim requires students to make a series of decisions based on a business scenario, which helps them move from memorization to understanding and application. These also allow students to experience how different functional areas of a business interact and how each employee’s decisions affect the organization.
Managerial Applications: Fifteen of the sixteen chapters include a major numbered section devoted to managerial applications of the chapter content.
3.5 Managerial Application: Regression Analysis and Elasticity 121
0.0073 * 1,000, or 7.3 dinners per night. The coefficient for the unemployment rate variable, −10.0, shows that a one percentage point increase in the unemployment rate decreases the demand by -10.0 * 1, or 10 dinners per night. And the coefficient for the population variable, 0.0005, shows that a 1,000-person increase in population increases the demand by 0.0005 * 1,000, or 0.5 dinners per night.
Short-Run Decisions Using Regression AnalysisAlthough a more detailed explanation of how managers determine price must wait until Chapter 6, intuitively it is clear that demand must play a role. The estimated demand function can help determine what price to charge in different cities because you can use it to estimate the nightly quantity of dinners your customers will demand in those cities. Suppose that one of the restaurants is located in a city of 900,000 people, in which aver-age income is $66,300 and the unemployment rate is 5.9 percent. If you set a price of $60 per dinner, you can predict that the nightly demand for steak dinners equals
Qd = 139.2 - 112.9 * $602 + 10.0073 * $66,3002 - 110.0 * 5.92 + 10.0005 * 900,0002or 240 dinners per night. You can now calculate consumer response to a change in the price. For example, if you raise the price by $1, then the quantity of dinners de-manded decreases by 12.9 per night, to approximately 227 dinners.
Long-Run Decisions Using Regression AnalysisYou can also use the estimated demand function to forecast the demand for your product. Such forecasts can help you make better decisions. For example, you and the other executives at your steak chain might be deciding whether to open a restaurant in a city of 750,000 residents, with average income of $60,000 and an unemployment rate of 6.0 percent. Using the estimated demand function in Table 3.4 and a price of $60 per dinner, you predict demand of about 118 meals per night. Suppose this quan-tity of sales is too small to be profitable, but you expect rapid growth for the city: In three years, you forecast the city’s population will rise to 950,000, average income will increase to $70,000, and the unemployment rate will fall to 5.8 percent. Three years from now, if you set a price of $60 per dinner, you forecast the demand will be 293 dinners per night. This quantity of dinners provides support for a plan to open a restaurant in three years. You might start looking for a good location!
Other companies can use an estimated demand function to forecast their future input needs. General Motors, for example, can use an estimated demand function for their automobiles to forecast the quantity of steel it expects to need for next year’s production. This information can help its managers make better decisions about the contracts they will negotiate with their suppliers.
Table 3.4 Estimated Demand Function for Steak DinnersThe table shows the results of a regression of the demand for meals at an upscale steak restaurant, with the estimated coefficients for the price, average income in the city in which the restaurant is located, unemployment rate in the city, and population of the city.
Coefficient Standard Error t Stat P-value Lower 95% Upper 95%
Constant 139.2 11.9 11.7 0.00 117.3 163.1
Price of dinner −12.9 1.8 7.2 0.00 −9.4 −16.4
Average income 0.0073 0.0012 6.1 0.00 4.9 9.7
Unemployment rate −10.0 3.1 3.1 0.00 −3.9 −16.5
Population 0.0005 0.0002 2.5 0.02 0.0001 0.0009
M03_BLAI8235_01_SE_C03_pp86-137.indd 121 23/08/17 9:53 AM
A01_BLAI8235_01_SE_FM_ppi-xxxiv.indd 27 15/09/17 11:33 AM
Solved Problems: This section-ending feature guides students step by step in solving a managerial problem, set in the context of a situation managers may encounter.
Decision Snapshots: This feature places readers in the role of managers facing a decision in a range of indus-tries, including large and small for-profit firms, public service organizations, and nonprofits. An answer is in-cluded so students can con-firm the decision they have made.
Integrated examples: We consistently present economic concepts in the context of business scenarios from a range of industries. For example:
• Chapter 4, “Production and Costs,” uses dinners at a restaurant to present the concepts of production and costs.
• Chapter 13, “Marketing Decisions: Advertising and Promotion,” includes exam-ples of advertising by a private company as well as by an entire industry.
• Chapter 14, “Business Decisions Under Uncertainty,” discusses the effect of uncertainty on business decisions using examples including Starbucks and Samsung.
xxviii Preface
104 CHAPTER 3 Measuring and Using Demand
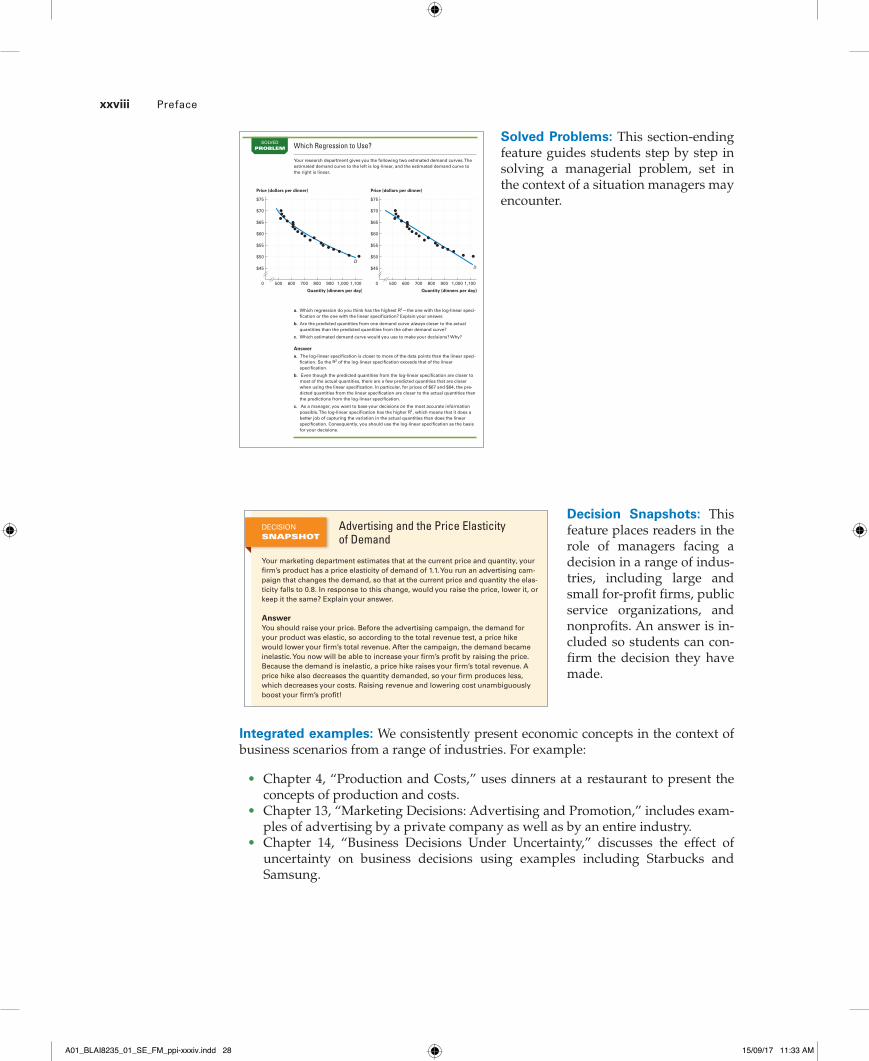
SOLVED PROBLEM Which Regression to Use?
Your research department gives you the following two estimated demand curves. The estimated demand curve to the left is log-linear, and the estimated demand curve to the right is linear.
Price (dollars per dinner)
Quantity (dinners per day)
$75
$45
$50
1,100
D
1,000900800700600500
$55
$60
$65
$70
0
Price (dollars per dinner)
Quantity (dinners per day)
$75
$45
$50
1,1001,000900800700600500
$55
$60
$65
$70
0
D
a. Which regression do you think has the highest R2—the one with the log-linear speci-fication or the one with the linear specification? Explain your answer.
b. Are the predicted quantities from one demand curve always closer to the actual quantities than the predicted quantities from the other demand curve?
c. Which estimated demand curve would you use to make your decisions? Why?
Answer
a. The log-linear specification is closer to more of the data points than the linear speci-fication. So the R2 of the log-linear specification exceeds that of the linear specification.
b. Even though the predicted quantities from the log-linear specification are closer to most of the actual quantities, there are a few predicted quantities that are closer when using the linear specification. In particular, for prices of $67 and $64, the pre-dicted quantities from the linear specification are closer to the actual quantities than the predictions from the log-linear specification.
c. As a manager, you want to base your decisions on the most accurate information possible. The log-linear specification has the higher R2, which means that it does a better job of capturing the variation in the actual quantities than does the linear specification. Consequently, you should use the log-linear specification as the basis for your decisions.
M03_BLAI8235_01_SE_C03_pp86-137.indd 104 23/08/17 9:53 AM
3.4 Elasticity 117
maximizes Pfizer’s total revenue because that will maximize your royalty and profit. Knowing the price elasticity of demand for your drug is important to you. For example, if your drug is the only one to treat an illness, Pfizer has a monopoly. In other words, it is the only seller in the market. You will learn in Chapter 6 that because Pfizer has a monopoly, its profit-maximizing price for the product will fall in the elastic range of the demand. Accepting this result, you can see that when you license your drug to Pfizer, you need to push Pfizer to cut the price from what it wants to set because the total revenue test shows that when demand is elastic, a decrease in the price increases total revenue. If Pfizer’s total revenue increases, the royalty revenue your company receives will get a boost as well. Of course, Pfizer will resist lowering the price, but because you know that the demand for the drug is elastic, your biotech company will keep pressuring Pfizer.
Your marketing department estimates that at the current price and quantity, your firm’s product has a price elasticity of demand of 1.1. You run an advertising cam-paign that changes the demand, so that at the current price and quantity the elas-ticity falls to 0.8. In response to this change, would you raise the price, lower it, or keep it the same? Explain your answer.
AnswerYou should raise your price. Before the advertising campaign, the demand for your product was elastic, so according to the total revenue test, a price hike would lower your firm’s total revenue. After the campaign, the demand became inelastic. You now will be able to increase your firm’s profit by raising the price. Because the demand is inelastic, a price hike raises your firm’s total revenue. A price hike also decreases the quantity demanded, so your firm produces less, which decreases your costs. Raising revenue and lowering cost unambiguously boost your firm’s profit!
DECISION SNAPSHOT
Advertising and the Price Elasticity of Demand
Income Elasticity and Cross-Price Elasticity of DemandSo far, you have learned about only one type of elasticity, the price elasticity of demand. Although this is the most important elasticity, there are two others to keep in mind: the income elasticity of demand and the cross-price elasticity of demand. You are unlikely to use either of these two measures often, but under-standing the different types of elasticity will help you avoid confusing them. In addition, learning about income elasticity and cross-price elasticity will help rein-force your understanding of the price elasticity of demand because all elasticities have four points in common: (1) changes are expressed as percentages, (2) fractions are used, (3) the factor driving the change is in the denominator, and (4) the factor responding to the change is in the numerator. (The Appendix at the end of this chapter presents a calculus treatment of these elasticities.)
M03_BLAI8235_01_SE_C03_pp86-137.indd 117 23/08/17 9:53 AM
A01_BLAI8235_01_SE_FM_ppi-xxxiv.indd 28 15/09/17 11:33 AM
124 CHAPTER 3 Measuring and Using Demand
• If the price elasticity of demand exceeds 1.0, consum-ers respond strongly to a change in price, and demand is elastic. If the price elasticity of demand equals 1.0, demand is unit elastic. If the price elasticity of demand is less than 1.0, consumers respond weakly to a change in price, and demand is inelastic.
• The more substitutes available for the product and the larger the fraction of the consumer’s budget spent on the product, the larger the price elasticity of demand.
• The income elasticity of demand equals the percentage change in the quantity demanded divided by the per-centage change in income. It is positive for normal goods and negative for inferior goods.
• The cross-price elasticity of demand equals the per-centage change in the quantity demanded of one good
divided by the percentage change in the price of a re-lated good. It is positive for products that are substi-tutes and negative for those that are complements.
3.5 Managerial Application: Regression Analysis and Elasticity
• Regression analysis can estimate a firm’s demand function and other important relationships. You can use the estimated functions to make forecasts and pre-dictions that improve your decisions.
• When there are not enough data to estimate a demand function, you can use the price elasticity of demand, the income elasticity of demand, and/or the cross-price elasticity of demand to estimate or forecast the effect of changes in market factors.
Key Terms and ConceptsConfidence interval
Critical value
Cross-price elasticity of demand
Elastic demand
Elasticity
Income elasticity of demand
Inelastic demand
Perfectly elastic demand
Perfectly inelastic demand
Price elasticity of demand
P-value
Regression analysis
R2 statistic
Significance level
t-statistic
Unit-elastic demand
Questions and ProblemsAll exercises are available on MyEconLab; solutions to even-numbered Questions and Problems appear in the back of this book.
3.1 Regression: Estimating DemandLearning Objective 3.1 Explain the basics of regression analysis.
1.1 In the context of regression analysis, explain the meaning of the terms dependent variable, indepen-dent variable, explanatory variable, univariate equa-tion, and multivariate equation.
1.2 Why does regression analysis presume the pres-ence of a random error term?
1.3 Explain why minimizing the sum of the squared residuals is a reasonable objective for regression analysis.
3.2 Interpreting the Results of Regression AnalysisLearning Objective 3.2 Interpret the results from a regression.
2.1 Your marketing research department provides the following estimated demand function for your
product: Qd = 500.6 - 11.4P + 0.5INCOME, where P is the price of your product and INCOME is average income.a. Is your product a normal good or an inferior
good? Explain your answer.b. The standard error for the price coefficient
is 2.0. What is its t-statistic? What can you conclude about the coefficient’s statistical significance?
c. The standard error for the income coeffi-cient is 0.3. What is its t-statistic? What can you conclude about the coefficient’s statisti-cal significance?
2.2 What does the R2 statistic measure? Why is it important?
2.3 The estimated coefficient for a variable in a regression is 3.5, with a P-value of 0.12. Given these two values, what conclusions can you make about the estimated coefficient?
M03_BLAI8235_01_SE_C03_pp86-137.indd 124 23/08/17 9:53 AM
Decision-Making Using Regression
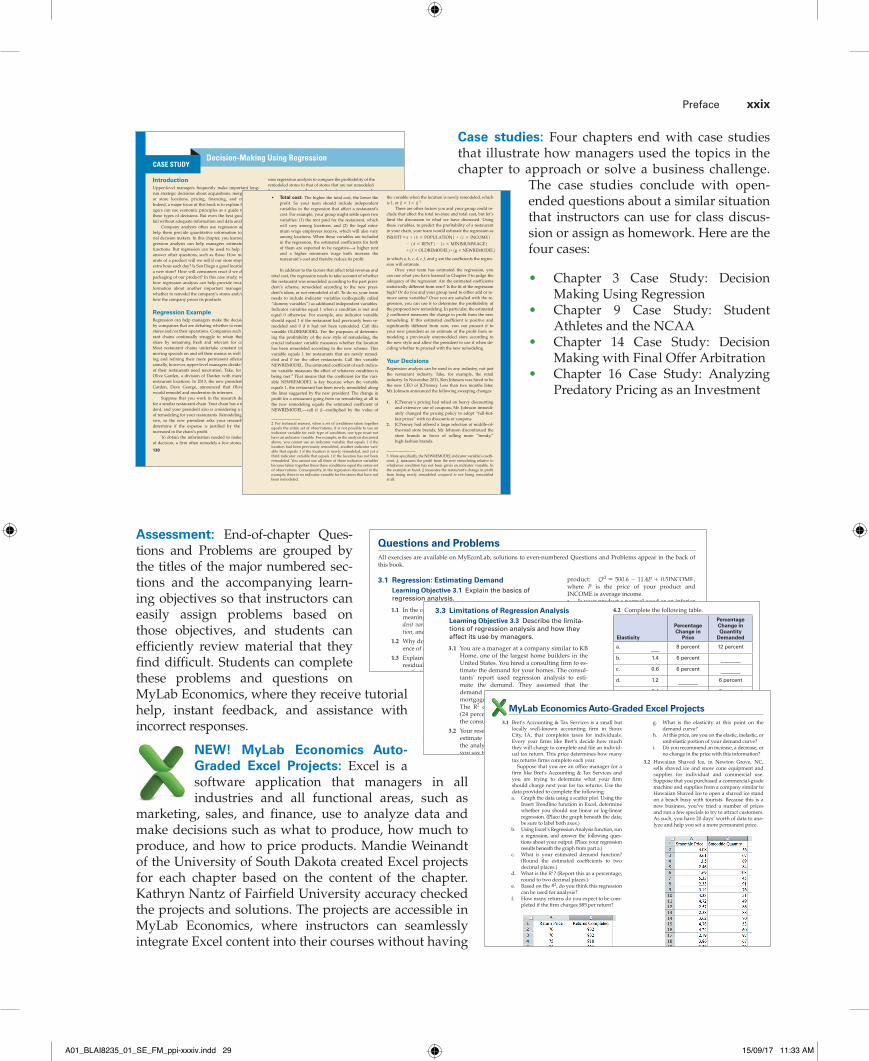
IntroductionUpper-level managers frequently make important long-run strategic decisions about acquisitions, mergers, plant or store locations, pricing, financing, and marketing. Indeed, a major focus of this book is to explain how man-agers can use economic principles as a guide to making these types of decisions. But even the best guidance can fail without adequate information and data analysis.
Company analysts often use regression analysis to help them provide quantitative information to manage-rial decision makers. In this chapter, you learned how re-gression analysis can help managers estimate demand functions. But regression can be used to help managers answer other questions, such as these: How many more units of a product will we sell if our store stays open an extra hour each day? Is San Diego a good location to open a new store? How will consumers react if we change the packaging of our product? In this case study, we explore how regression analysis can help provide invaluable in-formation about another important managerial issue, whether to remodel the company’s stores and/or change how the company prices its products.
Regression ExampleRegression can help managers make the decisions faced by companies that are debating whether to remodel their stores and/or their operations. Companies such as restau-rant chains continually struggle to retain their market share by remaining fresh and relevant for consumers. Most restaurant chains undertake constant innovation, moving specials on and off their menus as well as tweak-ing and refining their more permanent offerings. Occa-sionally, however, upper-level managers decide that some of their restaurants need renovation. Take, for example, Olive Garden, a division of Darden with more than 800 restaurant locations. In 2013, the new president of Olive Garden, Dave George, announced that Olive Garden would remodel and modernize its interiors.
Suppose that you work in the research department for a similar restaurant chain. Your chain has a new presi-dent, and your president also is considering a new style of remodeling for your restaurants. Remodeling is expen-sive, so the new president asks your research team to determine if the expense is justified by the projected increased in the chain’s profit.
To obtain the information needed to make this type of decision, a firm often remodels a few stores and then
130
CASE STUDY
1 This situation is similar to what Darden’s analysts faced in 2013 because Olive Garden had started remodeling its stores’ ex-teriors and some of the interiors to present a different view of Italy. That approach, however, was not what the incoming presi-dent, Mr. George, envisioned. His goal was modernization, not changing the geographic region the stores presented.
uses regression analysis to compare the profitability of the remodeled stores to that of stores that are not remodeled. Suppose, however, that your chain faces a more compli-cated situation: Under the previous president, the chain had already remodeled some locations but in a way that differs from your new president’s vision.1 So you have two types of restaurants—already remodeled and not previously remodeled. The regression analysis needs to consider this factor.
To use regression, your chain needs to remodel sev-eral restaurants according to the new president’s vision. Which restaurants are remodeled is unimportant because your regression should be able to predict the profitability regardless of location. After the remodeling, your group must collect data over several months to measure the profitability of all your restaurants. Ideally, you would collect the economic profits of the restaurants. In practice, however, their economic profit is impossible to measure, so you will need to use their accounting profits as a proxy for their economic profits. Your research group will use these data as the dependent variable in the regression.
Your team of analysts needs to determine how the new remodeling scheme affects profitability. But other factors also affect profitability. A restaurant’s profit equals its total revenue minus its total cost, so you and the other analysts need to determine what variables affect total rev-enue and total cost:
• Total revenue. The higher the demand for meals at your restaurants, the greater the total revenue. So the regression should include independent variables that affect the demand for dining at your restaurants. For example, your group might decide to include two in-dependent variables that affect demand and thereby total revenue: (1) the population of the county or lo-cality in which the restaurant is located and (2) in-come in that county or locality. When these variables are included in the regression, the estimated coeffi-cients for both these variables are expected to be pos-itive—higher population and higher income both in-crease demand and thereby increase the restaurant’s total revenue and raise its profit.
M03_BLAI8235_01_SE_C03_pp86-137.indd 130 23/08/17 9:53 AM
Preface xxix
Assessment: End-of-chapter Ques-tions and Problems are grouped by the titles of the major numbered sec-tions and the accompanying learn-ing objectives so that instructors can easily assign problems based on those objectives, and students can efficiently review material that they find difficult. Students can complete these problems and questions on MyLab Economics, where they receive tutorial help, instant feedback, and assistance with incorrect responses.
NEW! MyLab Economics Auto-Graded Excel Projects: Excel is a software application that managers in all industries and all functional areas, such as
marketing, sales, and finance, use to analyze data and make decisions such as what to produce, how much to produce, and how to price products. Mandie Weinandt of the University of South Dakota created Excel projects for each chapter based on the content of the chapter. Kathryn Nantz of Fairfield University accuracy checked the projects and solutions. The projects are accessible in MyLab Economics, where instructors can seamlessly integrate Excel content into their courses without having
Case studies: Four chapters end with case studies that illustrate how managers used the topics in the chapter to approach or solve a business challenge.
The case studies conclude with open-ended questions about a similar situation that instructors can use for class discus-sion or assign as homework. Here are the four cases:
• Chapter 3 Case Study: Decision Making Using Regression
• Chapter 9 Case Study: Student Athletes and the NCAA
• Chapter 14 Case Study: Decision Making with Final Offer Arbitration
• Chapter 16 Case Study: Analyzing Predatory Pricing as an Investment
3.3 Limitations of Regression AnalysisLearning Objective 3.3 Describe the limita-tions of regression analysis and how they affect its use by managers.
3.1 You are a manager at a company similar to KB Home, one of the largest home builders in the United States. You hired a consulting firm to es-timate the demand for your homes. The consul-tants’ report used regression analysis to esti-mate the demand. They assumed that the demand for your homes depended on the mortgage interest rate and disposable income. The R2 of the regression they report is 0.24 (24 percent). What suggestions do you have for the consultants?
3.2 Your research analyst informs you that “I always estimate log-linear regressions.” Do you think the analyst’s procedure is correct? What would you say to the analyst?
3.3 You are an executive manager for HatsforAll, a major producer of hats. You are studying a pre-liminary report submitted by a research firm you hired. The report includes a regression that estimates the demand for your hats. The re-search firm used 20 years of data on sales of your hats and included two independent vari-ables: the annual average price of your hats and the annual average winter temperature in your marketing areas. (The theory behind the tem-perature variable is that consumers are more likely to buy hats when the temperature is colder.) The estimated coefficient for the price variable is −5.8, with a standard error of 0.8, and the estimated coefficient for the tempera-ture variable is −20.8, with a standard error of 15.6. Based on the results of survey cards in-cluded with the hats, you are confident that higher-income people buy more hats. You are writing a memo to the research firm regarding the report. What additional information will you request from the research firm, and what changes will you recommend it make?
3.4 ElasticityLearning Objective 3.4 Discuss different elasticity measures and their use.
4.1 The short-run price elasticity of demand for oil is 0.3. If new discoveries of oil increase the quan-tity of oil by 6 percent, what will be the resulting change in the price of oil?
4.2 Complete the following table.
Elasticity
Percentage Change in
Price
Percentage Change in Quantity
Demanded
a. __ 8 percent 12 percent
b. 1.4 6 percent _____c. 0.6 6 percent _____d. 1.2 _____ 6 percent
e. 0.4 _____ 6 percent
4.3 The slope of a linear demand curve is −$2 per unit.a. What is the price elasticity of demand when
the price is $300 and the quantity is 100 units?b. What is the price elasticity of demand when
the price is $250 and the quantity is 125 units?c. What is the price elasticity of demand when
the price is $100 and the quantity is 200 units?d. As the price falls (causing a downward
movement along the demand curve), how does the price elasticity of demand change?
4.4 Your marketing research department estimates that the demand function for your product is equal to Qd = 2,000 - 20P. What is the price elasticity of demand when P = $60?
4.5 Your marketing research department estimates that the demand function for your product is equal to Qd = 2,000 - 20P. What is the price elasticity of demand when P = $40?
4.6 Your marketing research department estimates that the demand function for your product is equal to ln Qd = 7.5 - 2.0ln P. What is the price elasticity of demand when P = $60?
4.7 As a brand manager for Honey Bunches of Oats cereal, you propose lowering the price by 4 percent. What will you tell your supervisor about what you expect will be the impact on sales in the short run and in the long run? Explain your answer.
4.8 You own a small business and want to increase the total revenue you collect from sales of your product.a. If the demand for your product is inelastic,
what can you do to increase total revenue?b. If the demand for your product is elastic,
what can you do to increase total revenue?c. If the demand for your product is unit elas-
tic, what can you do to increase total revenue?
Questions and Problems 125
M03_BLAI8235_01_SE_C03_pp86-137.indd 125 23/08/17 9:53 AM
SUMMARY 131
• Total cost. The higher the total cost, the lower the profit. So your team should include independent variables in the regression that affect a restaurant’s cost. For example, your group might settle upon two variables: (1) the rent paid for the restaurant, which will vary among locations, and (2) the legal mini-mum wage employees receive, which will also vary among locations. When these variables are included in the regression, the estimated coefficients for both of them are expected to be negative—a higher rent and a higher minimum wage both increase the restaurant’s cost and thereby reduce its profit.
In addition to the factors that affect total revenue and total cost, the regression needs to take account of whether the restaurant was remodeled according to the past presi-dent’s scheme, remodeled according to the new presi-dent’s ideas, or not remodeled at all. To do so, your team needs to include indicator variables (colloquially called “dummy variables”) as additional independent variables. Indicator variables equal 1 when a condition is met and equal 0 otherwise. For example, one indicator variable should equal 1 if the restaurant had previously been re-modeled and 0 if it had not been remodeled. Call this variable OLDREMODEL. For the purposes of determin-ing the profitability of the new style of remodeling, the crucial indicator variable measures whether the location has been remodeled according to the new scheme. This variable equals 1 for restaurants that are newly remod-eled and 0 for the other restaurants. Call this variable NEWREMODEL. The estimated coefficient of each indica-tor variable measures the effect of whatever condition is being met.2 That means that the coefficient for the vari-able NEWREMODEL is key because when the variable equals 1, the restaurant has been newly remodeled along the lines suggested by the new president. The change in profit for a restaurant going from no remodeling at all to the new remodeling equals the estimated coefficient of NEWREMODEL—call it gn—multiplied by the value of
the variable when the location is newly remodeled, which is 1, or gn * 1 = gn.3
There are other factors you and your group could in-clude that affect the total revenue and total cost, but let’s limit the discussion to what we have discussed. Using these variables, to predict the profitability of a restaurant in your chain, your team would estimate the regression as
PROFIT = a + 1b * POPULATION2 + 1c * INCOME2 - 1d * RENT2 - 1e * MINIMUMWAGE2+ 1 f * OLDREMODEL2+1g * NEWREMODEL2
in which a, b, c, d, e, f, and g are the coefficients the regres-sion will estimate.
Once your team has estimated the regression, you can use what you have learned in Chapter 3 to judge the adequacy of the regression: Are the estimated coefficients statistically different from zero? Is the fit of the regression high? Or do you and your group need to either add or re-move some variables? Once you are satisfied with the re-gression, you can use it to determine the profitability of the proposed new remodeling. In particular, the estimated gn coefficient measures the change in profit from the new remodeling. If this estimated coefficient is positive and significantly different from zero, you can present it to your new president as an estimate of the profit from re-modeling a previously unremodeled store according to the new style and allow the president to use it when de-ciding whether to proceed with the new remodeling.
Your DecisionsRegression analysis can be used in any industry, not just the restaurant industry. Take, for example, the retail industry. In November 2011, Ron Johnson was hired to be the new CEO of JCPenney. Less than two months later, Mr. Johnson announced the following sweeping changes:
1. JCPenney’s pricing had relied on heavy discounting and extensive use of coupons; Mr. Johnson immedi-ately changed the pricing policy to adopt “full-but-fair prices” with no discounts or coupons.
2. JCPenney had offered a large selection of middle-of-the-road store brands; Mr. Johnson discontinued the store brands in favor of selling more “trendy,” high-fashion brands.
2 For technical reasons, when a set of conditions taken together equals the entire set of observations, it is not possible to use an indicator variable for each type of condition; one type must not have an indicator variable. For example, in the analysis discussed above, you cannot use an indicator variable that equals 1 if the location had been previously remodeled, another indicator vari-able that equals 1 if the location is newly remodeled, and yet a third indicator variable that equals 1 if the location has not been remodeled. You cannot use all three of these indicator variables because taken together these three conditions equal the entire set of observations. Consequently, in the regression discussed in the example, there is no indicator variable for the stores that have not been remodeled.
3 More specifically, the NEWREMODEL indicator variable’s coeffi-cient, gn, measures the profit from the new remodeling relative to whichever condition has not been given an indicator variable. In the example at hand, gn measures the restaurant’s change in profit from being newly remodeled compared to not being remodeled at all.
CHAPTER 3 CASE STUDY Decision-Making Using Regression 131
M03_BLAI8235_01_SE_C03_pp86-137.indd 131 13/09/17 4:22 PM
128 CHAPTER 3 Measuring and Using Demand
3.1 Bret’s Accounting & Tax Services is a small but locally well-known accounting firm in Sioux City, IA, that completes taxes for individuals. Every year firms like Bret’s decide how much they will charge to complete and file an individ-ual tax return. This price determines how many tax returns firms complete each year. Suppose that you are an office manager for a firm like Bret’s Accounting & Tax Services and you are trying to determine what your firm should charge next year for tax returns. Use the data provided to complete the following:a. Graph the data using a scatter plot. Using the
Insert Trendline function in Excel, determine whether you should use linear or log-linear regression. (Place the graph beneath the data; be sure to label both axes.)
b. Using Excel’s Regression Analysis function, run a regression, and answer the following ques-tions about your output. (Place your regression results beneath the graph from part a.)
c. What is your estimated demand function? (Round the estimated coefficients to two decimal places.)
d. What is the R2? (Report this as a percentage; round to two decimal places.)
e. Based on the R2, do you think this regression can be used for analysis?
f. How many returns do you expect to be com-pleted if the firm charges $85 per return?
g. What is the elasticity at this point on the demand curve?
h. At this price, are you on the elastic, inelastic, or unit-elastic portion of your demand curve?
i. Do you recommend an increase, a decrease, or no change in the price with this information?
3.2 Hawaiian Shaved Ice, in Newton Grove, NC, sells shaved ice and snow cone equipment and supplies for individual and commercial use. Suppose that you purchased a commercial-grade machine and supplies from a company similar to Hawaiian Shaved Ice to open a shaved ice stand on a beach busy with tourists. Because this is a new business, you’ve tried a number of prices and run a few specials to try to attract customers. As such, you have 20 days’ worth of data to ana-lyze and help you set a more permanent price.
a. Graph the data provided using a scatter plot. Using the Insert Trendline function in Excel, determine whether you should use linear or log-linear regression. (Place the graph beneath the data; be sure to label both axes.)
b. Using Excel’s Regression Analysis function, run a regression, and answer the following ques-tions about your output. (Place your regression results beneath the graph from part a.)
c. What is your estimated demand function?d. Discuss the fit and significance of the
regression.
MyLab Economics Auto-Graded Excel Projects
M03_BLAI8235_01_SE_C03_pp86-137.indd 128 23/08/17 9:53 AM
A01_BLAI8235_01_SE_FM_ppi-xxxiv.indd 29 15/09/17 11:33 AM
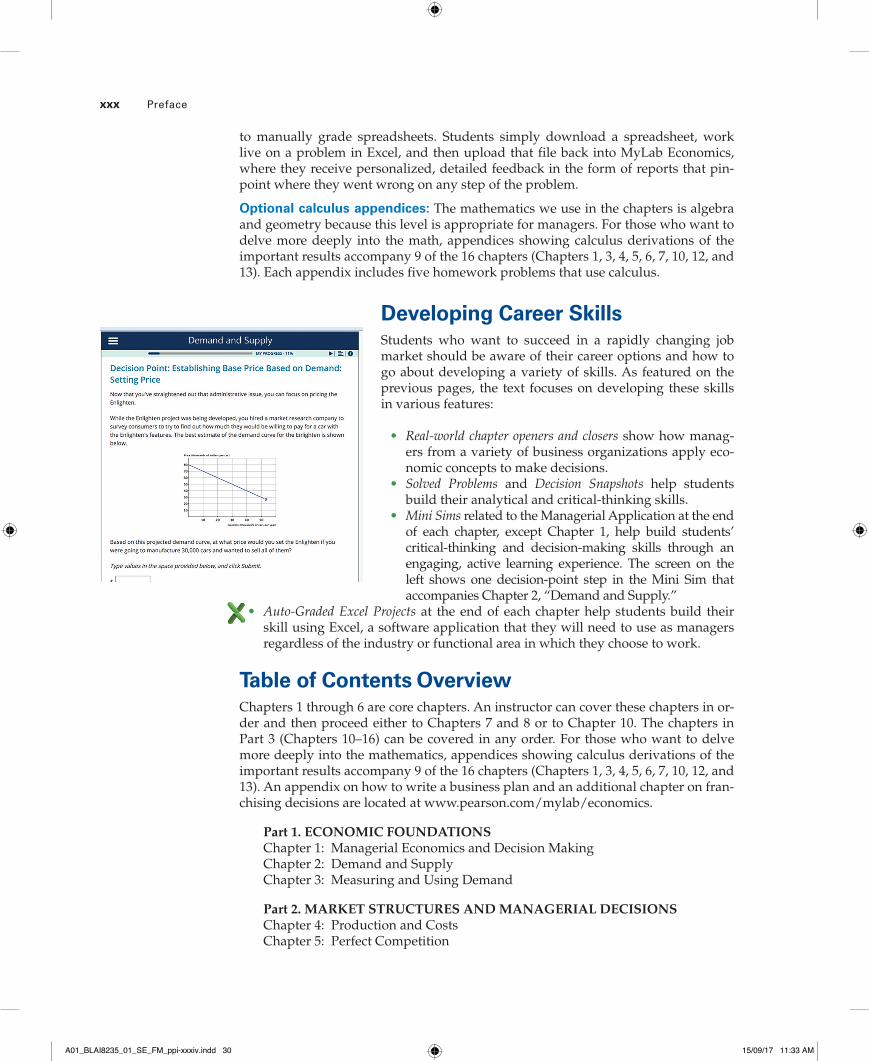
to manually grade spreadsheets. Students simply download a spreadsheet, work live on a problem in Excel, and then upload that file back into MyLab Economics, where they receive personalized, detailed feedback in the form of reports that pin-point where they went wrong on any step of the problem.
Optional calculus appendices: The mathematics we use in the chapters is algebra and geometry because this level is appropriate for managers. For those who want to delve more deeply into the math, appendices showing calculus derivations of the important results accompany 9 of the 16 chapters (Chapters 1, 3, 4, 5, 6, 7, 10, 12, and 13). Each appendix includes five homework problems that use calculus.
Developing Career SkillsStudents who want to succeed in a rapidly changing job market should be aware of their career options and how to go about developing a variety of skills. As featured on the previous pages, the text focuses on developing these skills in various features:
• Real-world chapter openers and closers show how manag-ers from a variety of business organizations apply eco-nomic concepts to make decisions.
• Solved Problems and Decision Snapshots help students build their analytical and critical-thinking skills.
• Mini Sims related to the Managerial Application at the end of each chapter, except Chapter 1, help build students’ critical-thinking and decision-making skills through an engaging, active learning experience. The screen on the left shows one decision-point step in the Mini Sim that accompanies Chapter 2, “Demand and Supply.”
• Auto-Graded Excel Projects at the end of each chapter help students build their skill using Excel, a software application that they will need to use as managers regardless of the industry or functional area in which they choose to work.
Table of Contents OverviewChapters 1 through 6 are core chapters. An instructor can cover these chapters in or-der and then proceed either to Chapters 7 and 8 or to Chapter 10. The chapters in Part 3 (Chapters 10–16) can be covered in any order. For those who want to delve more deeply into the mathematics, appendices showing calculus derivations of the important results accompany 9 of the 16 chapters (Chapters 1, 3, 4, 5, 6, 7, 10, 12, and 13). An appendix on how to write a business plan and an additional chapter on fran-chising decisions are located at www.pearson.com/mylab/economics.
Part 1. ECONOMIC FOUNDATIONSChapter 1: Managerial Economics and Decision MakingChapter 2: Demand and SupplyChapter 3: Measuring and Using Demand
Part 2. MARKET STRUCTURES AND MANAGERIAL DECISIONSChapter 4: Production and CostsChapter 5: Perfect Competition
xxx Preface
A01_BLAI8235_01_SE_FM_ppi-xxxiv.indd 30 15/09/17 11:33 AM

Preface xxxi
Chapter 6: Monopoly and Monopolistic CompetitionChapter 7: Cartels and OligopolyChapter 8: Game Theory and OligopolyChapter 9: A Manager’s Guide to Antitrust Policy
Part 3. MANAGERIAL DECISIONSChapter 10: Advanced Pricing DecisionsChapter 11: Decisions About Vertical Integration and DistributionChapter 12: Decisions About Production, Products, and LocationChapter 13: Marketing Decisions: Advertising and PromotionChapter 14: Business Decisions Under UncertaintyChapter 15: Managerial Decisions About InformationChapter 16: Using Present Value to Make Multiperiod Managerial Decisions
The following content is posted on www.pearson.com/mylab/economics:Web Appendix: The Business PlanWeb Chapter: Franchising Decisions
Instructor Teaching ResourcesThe following supplements are available to instructors for download at www. pearsonhighered.com.
The Instructor’s Manual was prepared by David Switzer of St. Cloud State University and includes the following features:
• Solutions to all end-of-chapter and appendix questions and problems, which the authors prepared and then revised based on an accuracy review by two other professors.
• Chapter summaries• Lists of learning objectives• Chapter outlines, section summaries, and key term definitions• Extra examples• Teaching tips
The Test Bank was prepared by Casey DiRienzo of Elon University and includes over 2,400 questions, with approximately 125 multiple-choice questions and 25 true/false questions per chapter. Between 5 and 10 questions per chapter include a graph and ask students to analyze that graph. The questions are organized by learning objective, and each question has the following annotations:
• Topic• Skill• AACSB learning standard (Written and Oral Communication; Ethical
Understanding and Reasoning; Analytical Thinking; Information Technology; Interpersonal Relations and Teamwork; Diverse and Multicultural Work; Reflective Thinking; Application of Knowledge)
The PowerPoint Presentation was prepared by Julia Frankland of Malone University and includes the following features:
• All the graphs, tables, and equations in each chapter• Section summaries for all chapters• Lecture notes
A01_BLAI8235_01_SE_FM_ppi-xxxiv.indd 31 15/09/17 11:33 AM

Eric Abrams, McKendree UniversityBasil Al Hashimi, Mesa Community
CollegeJasmin Ansar, Mills CollegeElena Antiniadou, Emory UniversitySisay Asefa, Western Michigan UniversityJoseph Bailey, University of MarylandLila Balla, St. Louis UniversitySourav Batabyal, Loyola University
MarylandJason Beck, Armstrong State UniversityAriel Belasan, Southern Illinois University
at EdwardsvilleJeanne Boeh, Augsburg CollegeDavid Bouras, Lincoln UniversityTerry Brownschidle, Rider UniversityDonald Bumpass, Sam Houston State
UniversityLouis P. Cain, Northwestern UniversityHugh Cassidy, Kansas State UniversityHector Chade, Arizona State UniversityKalyan Chakraborty, Emporia State
UniversityKeith W. Chauvin, University of KansasJihui Chen, Illinois State UniversityAbdur Chowdhury, Marquette UniversityJan Christopher, Delaware State
UniversityKalock Chu, Loyola University at ChicagoChristopher Colburn, Old Dominion
UniversityKristen Collett-Schmitt, University of
Notre DameBenjamin Compton, University of
TennesseeCristanna Cook, Husson University and
the University of MaineAkash Dania, Alcorn State UniversityTina Das, Elon UniversityDennis Debrecht, Carroll UniversityLisa Dickson, University of Maryland–
Baltimore CountyCassandra DiRienzo, Elon UniversityCarol Doe, Jacksonville University
Juan Du, Old Dominion UniversityNazif Durmaz, University of
Texas–VictoriaMaxwell Eseonu, Virginia State
UniversityXin Fang, Hawaii Pacific UniversityJose Fernandez, University of LouisvilleDarren Filson, Claremont McKenna
CollegeJohn Fizel, Pennsylvania State UniversityJohn Flanders, Central Methodist
UniversityJulia Frankland, Malone UniversityYoshi Fukasawa, Midwestern State
UniversityChris Gingrich, Eastern Mennonite
UniversityTuncer Gocmen, Shepherd UniversityRajeev Goel, Illinois State UniversityNatallia Gray, Southeast Missouri State
UniversityAnthony Greco, University of Louisiana
at LafayetteGauri S. Guha, Arkansas State UniversityJohn Hayfron, Western Washington
UniversityMartin D. Heintzelman, Clarkson
UniversityJ. Scott Holladay, University of TennesseeAdora Holstein, Robert Morris UniversityJohn Horowitz, Ball State UniversityJack Hou, California State University
at Long BeachSyed Jafri, Tarleton State UniversityAndres Jauregui, Columbus State
UniversityRuss Kashian, University of Wisconsin
at WhitewaterMark Keightley, George Mason UniversityDavid Kelly, University of MiamiAbdullah Khan, Claflin UniversityFelix Kwan, Maryville UniversityJacob LaRiviere, University of TennesseeMarc Law, University of Vermont
AcknowledgmentsWe are grateful for the guidance and recommendations of our many reviews, class testers, and accuracy checkers. Their constructive feedback and support was indis-pensable in the development of the chapters, media assets, and supplements.
xxxii Acknowledgments
A01_BLAI8235_01_SE_FM_ppi-xxxiv.indd 32 15/09/17 11:33 AM

Acknowledgments xxxiiiAcknowledgments xxxiii
Robert Lawson, Southern Methodist University
Mahdi Majbouri, Babson CollegeMichael Maloney, Clemson UniversityRuss McCullough, Ottawa UniversityEric McDermott, University of IllinoisHannah Mead, George Mason UniversityDouglas Meador, University of St. Francis
at Fort WayneSaul Mekies, University of Iowa/Kirkwood
Community CollegeEvelina Mengova, Governors State
UniversityMatt Metzgar, University of North
Carolina at CharlottePhillip Mixon, Troy UniversityMasoud Moallem, Rockford UniversityFrancis Mummery, California State
University at FullertonKathryn Nantz, Fairfield UniversityMichael Newsome, Marshall UniversityDmitri Nizovtsev, Washburn UniversityChristian Nsiah, Baldwin Wallace
UniversityTunay Oguz, Lenoir Rhyne UniversityCharles Parker, Wayne State CollegeRobert Pennington, University of Central
FloridaPaul Pieper, University of Illinois at ChicagoChung Ping, University of North FloridaHarvey Poniachek, Rutgers UniversityJohn Reardon, Hamline UniversityJean Ricot, Valencia Community CollegeKaty Rouse, Elon UniversityStefan Ruediger, Arizona State UniversityCharles R. Sebuharara, Binghamton
University SUNY
Stephanie Shayne, Husson UniversityDongsoo Shin, Santa Clara UniversitySteven Shwiff, Texas A&M University
at CommerceKusum Singh, LeMoyne Owen CollegeKen Slaysman, York College of
PennsylvaniaJohn Spytek, Webster UniversityDenise Stanley, California State University
at FullertonPaul Stock, University of Mary Hardin–
Baylor UniversityBrock Stoddard, University of South
DakotaDavid Switzer, St. Cloud State UniversityMichael Tasto, Southern New Hampshire
UniversityBill Taylor, New Mexico Highlands
UniversityKasaundra Tomlin, Oakland UniversitySuzanne Toney, Savannah State
UniversityDosse Toulaboe, Fort Hays State
UniversityJulianne Treme, University of North
Carolina at WilmingtonJennifer VanGilder, Ursinus CollegeElizabeth Wark, Worcester State
UniversityMandie Weinandt, University of South
DakotaKeith Willet, Oklahoma State UniversityMark Wilson, West Virginia University
TechShishu Zhang, University of the Incarnate
WordTing Zhang, University of Baltimore
A Note of Thanks…When we first started work on this book, we never realized how many people would be so heavily involved, helping us, assisting us, and frequently prodding us along the way. In truth, it is impossible to convey an adequate measure of thanks for their input. But we shall try:
• Christina Masturzo, Senior Portfolio Manager with Pearson, was our guiding light. We owe her a huge debt for her belief in our vision and for her tireless work helping us achieve this vision. The team she assembled was first class, as were her comments and inputs. Simply put, without her this book would not exist.
A01_BLAI8235_01_SE_FM_ppi-xxxiv.indd 33 15/09/17 11:33 AM
• Lena Buonanno, Content Development Specialist with Pearson, helped keep us on track and our noses to the grindstone. Lena was with us every step of the way, literally from the first day to the last. We believe we would still be working on the project were it not for her incredibly cheerful emails (most of which re-minded us about missed deadlines).
• Karen Trost, Freelance Development Editor, together with Lena, helped convert our writing into something that has at least a passing resemblance to English. We cannot believe the number of hours Karen put in making grammatical im-provements that sharpened and clarified the text. Because she will not have a chance to edit this preface, all wee kan say is thanx.
• Carolyn Philips, Content Producer with Pearson, played a crucial role in helping our thoughts progress from a manuscript to a finished product. We shudder to think what the book would look like without her help.
• Courtney Paganelli, Editorial Assistant with Pearson, truly kept us organized—at least as much as possible. We cannot imagine how Courtney was able to keep all the details about all the aspects of the project straight and especially how she was able to do so when working with us, disorganized as we are. We would doff our hats to her if we could find them.
• Susan McNally, Production Manager with Cenveo, had what is probably the most thankless task of all. Susan had to work with us when we had no idea how to edit pages for publication. Her explanations about what could be (and what could not be) done were invaluable. Time after time she patiently answered our neophyte questions, making us eternally grateful and forever in her debt.
xxxiv Acknowledgments
A01_BLAI8235_01_SE_FM_ppi-xxxiv.indd 34 15/09/17 11:33 AM