Embed Size (px)
Citation preview
J. Bio. & Env. Sci. 2018
402 | Conrado V.
RESEARCH PAPER OPEN ACCESS
The economics of organic and conventional vegetables
production in Northern Philippines
Vilma Du Conrado*
Cagayan State University, Caritan, Tuguegarao City, Philippines
Article published on August 30, 2018
Key words: Pinakbet, organic vegetables, organic agriculture, Philippines, economics, profitability.
Abstract
The study was conducted in the Cagayan Valley region of the Northern Philippines to generate baseline data
and information on the profitability and economics of organic vegetable “pinakbet” production versus
conventional vegetable production. A total of 64 organic and 52 conventional vegetable producers were
taken as respondents. Data were gathered through field reconnaissance survey and interview using
structured questionnaire. Descriptive statistics was used to analyze the data. The organic vegetable indu stry
is in its infancy stage. The average area cultivated to organic vegetable was 508.55sq m and 2,972.19sq m
for conventional vegetables. Organic vegetable farmer-respondents had higher yield per 1000sq m for okra
(748kg), squash (545kg) and string beans (437kg) than the conventional farmers with 131kg, 261kg and
236kg per 1000sq m, respectively. Conventional farmers had higher yield/1000sq m on eggplant (1,239kg),
ampalaya (1,080kg), tomato (2,054kg) and pepper (330kg) than the organic farmers. Organic farmers
received higher average price and higher net farm income for all vegetables than the conventional farmers.
Break-even yield per 1000sq m for conventional farmers was higher than the organic farmers in all
vegetables. The organic vegetable farmers had lower capital-output ratio and land-output ratio for almost
all the vegetables but higher labor-output ratio than the conventional farmers. Laborious, high cost of
certification as organic farm, lack of financial support and limited market outlet for organic products were
the problems encountered. Massive education and awareness campaign, continuous extension education
services and other methods to increase effective demand for organically produce vegetables should be done.
*Corresponding Author: Vilma Du Conrado [email protected]
Journal of Biodiversity and Environmental Sciences (JBES) ISSN: 2220-6663 (Print) 2222-3045 (Online)
Vol. 13, No. 2, p. 402-415, 2018
http://www.innspub.net
J. Bio. & Env. Sci. 2018
403 | Conrado V.
Introduction
With the increasing concerns on population growth,
health, food security, increasing farmers income,
improve living standards, and environment concerns
all over the world encouraged the widespread
adoption of organic products (Motor Intelligence,
2017, Amadou Binta BA and Bruno Barbier, 2015,
Thippeswamy, 2013). Organic farming may seem to
be the key in addressing these concerns (Crowder,
2015; Aquino 2013). Global sales for organic food and
drink has been increasing which expanded to about
10% in 2015 compared to previous year. With the
passing of the Organic Agriculture Act (RA 10068),
organic agriculture has now arrived a strong concern
in farming in the Philippines. The Philippines is one
of the ten countries with the highest increase in
organic agricultural land and the fifth country with
the largest number of organic producers in 2015
(Helga and Lernuod, 2017). However, despite being
an agricultural country, has yet to achieve the goal of
National Organic Agriculture Program (NOAP),
wherein five percent of the country's agricultural
farms should have been converted to organic in 2016
(NOAP, 2012-2016). The NOAP serves as a guide for
the implementation of organic agriculture activities in
the country (NOAP, 2012-2016).
Several studies also determine the profitability of
organic agriculture vis a vis conventional agriculture
but found a great variability in the profitability
(Tomekde Ponti 2012). There is high variation in yield
gap of organic agriculture and relative yields differ
between crops and regions. There are several factors
that determine the profitability of organic vegetable
production such as within system variation, physical
characteristics, external factors, and unmeasurable
influence, (Nemes, 2009), price, yield, production
environment, location and management practices.
Crowder (2015) analyzed the financial performance of
organic and conventional agriculture from five
continents found that, in spite of lower yields, organic
agriculture was significantly more profitable than
conventional agriculture and has room to expand
globally (Shennan et al, 2017, Naglova, 2015, Amadou
Binta BA and Bruno Barbier, 2015, Nemes, 2009,
Crowder, 2015, Verena Seufert and Navin
Ramankutty, 2017) found considerable evidence for
environmental and social benefits. Generally it is hard
to conclude that one system is more profitable than
the other – it depends on site and crop specific
factors, availability of marketing opportunities,
labour availability, agronomic factors, etc. Several
variables could impact overall farm performance,
thus a multi-disciplinary approach that involves the
whole farm (with livestock operations if there are)
and takes into account the management skills and
objectives of the farmers is a more favourable option.
(Noémi, 2009). Rates of organic farming adoption are
highly sensitive to the yield drop after switchover to
organic techniques (Olabisi, 2015).
In the Philippines, Porciuncula (2015) concluded that
the returns in organic vegetable (eggplant, tomato,
ampalaya and stringbeans) in Central Luzon
production in all sites is promising given the
acceptable, at par and even better yield per 1000sq m,
net income, and return to total operating expenses
compared to conventional vegetable production.
Studies on supply chain indicate that whole farm
performance, yields, prices and costs matter most in
the calculations of profitability (Lantican, 2011, and
Lanndicho) and there is cost and margin differentials
across players and across geographic locations
indicating variations in the distribution of benefits
among key factors (Cabrera and Wagney in NOAP
report, 2016). The vegetable growers relied on their
indigenous knowledge acquired from years of
experience in vegetable farming, infusing additional
knowledge and skills learned from trainings on the
use of organic inputs and technologies.
To date, organic agriculture faces several challenges
due to different factors. The shifting from conventional
towards organic farming may still face a long way.
However, data and information on organic vegetables
production enterprises in the country are very few. Is
organic farming more profitable then conventional
farming is a question that need to be answered.
Several studies found that there is variations and
stability of profitability performance of organic
J. Bio. & Env. Sci. 2018
404 | Conrado V.
farming versus conventional farming because several
dimensions have to be considered. An evaluation of
the profitability and economics of the production of
organic vegetables crops in Cagayan Valley region would
assist the producers in choosing between organic
productions versus the conventional production. The
study aims to determine the profitability and economics
of organic vegetables (“pinakbet type”) vis-à-vis
conventional vegetables production in Northern
Philippine. It compares the costs of production,
profitability, input utilization rations of organic and
conventional vegetables production.
Materials and methods
Locale and Research Design of the Study
The study was conducted in the Cagayan Valley
region, Northern part of the Philippines where
temperate lowland vegetables (ampalaya, eggplant
and tomato, pepper, pole sitao or string beans, and
okra are grown). It made use of the descriptive
research design.
Data and Respondents
The study made used of the survey data of the
PCAARRD funded project “Documentation of Organic
Vegetables Production in Region 02” by Conrado et
al. (2011). In the absence of a priori list of organic
vegetable growers in the region, reconnaissance
survey and key informants interview were undertaken
to map out the whereabouts of organic vegetable
producers. All identified organic vegetable growers
(either full, in-conversion or traditional) were taken
as organic respondents since there is no certified
organic vegetable farm (third party) yet. A total of 64
organic farmers (22 full organic, 19 in-conversion and
23 traditional) and 52 conventional vegetable farmers
were taken as respondents.
Data Analysis
Descriptive statistics was used to summarize
descriptive data such as frequency counts, percentages
and means. The ratios between production factors and
output were determined to measure the extent of input
utilization. The following ratios were used: a) Capital-
Output Ratio (COR) is the ratio between total cost of
production and the value of total output which
implies how intensive capital was used; b) Labor-
Output Ratio (LOR) is the ratio between total farm
labor (in man-days) and total value of output which
implies how intensive labor was used; and c) Land-
Output Ratio (SOR) is the ratio between the total area
cultivated (in ha) and total value of output which
implies how productive land was used. Cost and
return analysis and break-even yield were used to
determine profitability.
Definition of Terms
Full organic respondents farmers who do not
anymore used any inorganic chemical materials and
follow the PNSOA although they are not yet certified
organic but they were trying to apply for certification.
In-conversion farmers are those who have plans to
convert their farms to organic, following the PNSOA
but are still using partly inorganic.
Traditional farmers are those farmers who ever since
they started growing vegetables had not used any
inorganic inputs.
Conventional farmers those who used inorganic inputs.
Pinakbet (from the work pinakebbet meaning shrunk
or shriveled) is an indigenous Filipino dish from the
northern regions of the Philippines made from mixed
vegetables which includes bitter gourd (ampalaya),
eggplant, tomato, okra, string beans, chili peppers,
parda, winged beans, and others
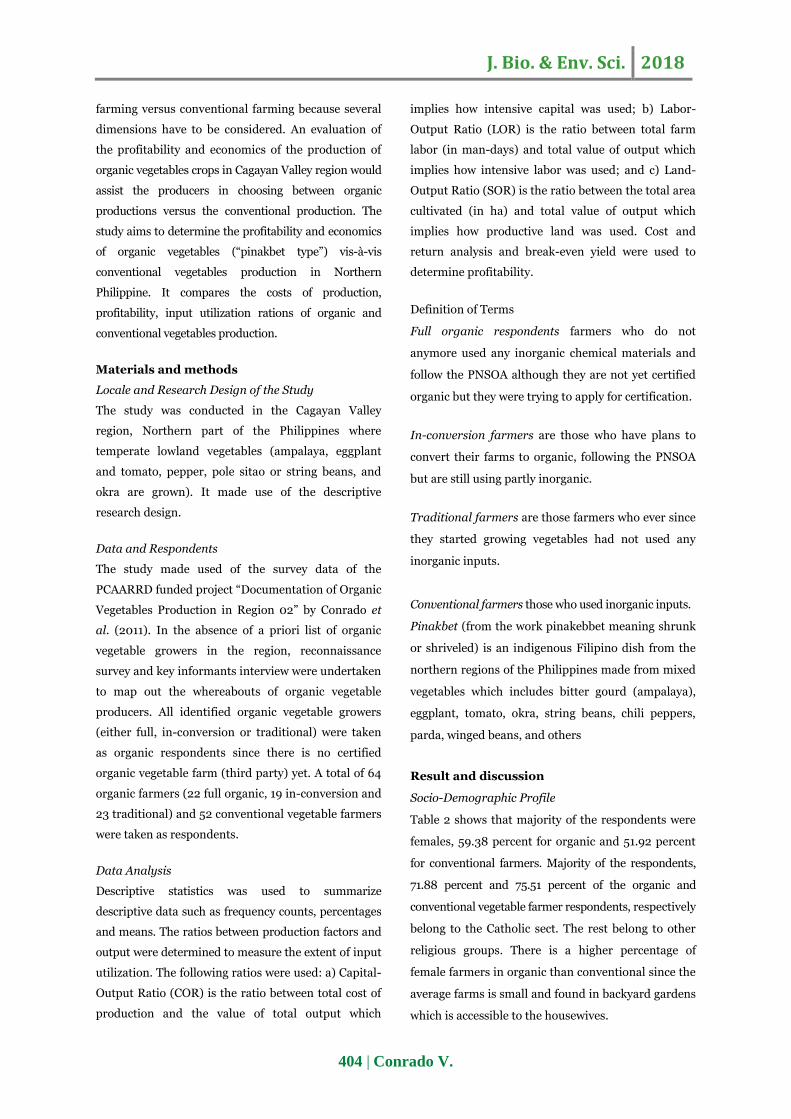
Result and discussion
Socio-Demographic Profile
Table 2 shows that majority of the respondents were
females, 59.38 percent for organic and 51.92 percent
for conventional farmers. Majority of the respondents,
71.88 percent and 75.51 percent of the organic and
conventional vegetable farmer respondents, respectively
belong to the Catholic sect. The rest belong to other
religious groups. There is a higher percentage of
female farmers in organic than conventional since the
average farms is small and found in backyard gardens
which is accessible to the housewives.
J. Bio. & Env. Sci. 2018
405 | Conrado V.
On the average, organic vegetable farmer-respondents
were older (53 years old) by seven years than the
conventional farmers (46 years old). Organic farmer-
respondents are older on the average because it
includes the traditional farmers. The traditional
farmers are the older ones and they are habituated and
more comfortable to the traditional practices. The
household size for organic vegetable farmer-respondents
was 5.5, a little bit larger than the conventional farmers,
with a household size of 5.1 members. Conventional
farmer-respondents had longer vegetable farming
experience (14.93 years) than their organic
counterpart with only 12.22 years.
The organic vegetable farming experience of the
organic respondents was 6.22 year, half of their total
vegetable farming experience. This can be explained
by the new decisions to convert their farms from
conventional to organic farming.
The traditional farmers had the highest organic
farming experience among the three types of organic
farmer respondents, which was the same with their
total years of farming experience (11.68 years). As to
education, organic vegetable farmer respondents had
9.5 years, higher than the conventional which was
7.65 years in school although both however are in the
high school level.
Table 1. Profile of respondents by type of farmer-respondent, economics of vegetables production in Region 02,
2009-2010.
Particular Type of Organic Farmer All Organic (n=64)
Convent Ional
Full (n=22)
In Conversion (n=19)
Traditional (n=23)
Freq % Freq % Freq % Freq % Freq % Sex Male 9 40.91 9 47.37 8 34.78 26 40.63 24 48.08 Female 13 59.09 10 52.63 15 65.22 38 59.38 26 51.92 Religious Sect Catholic 16 72.73 16 84.21 14 60.87 46 71.88 37 75.51 Methodist 2 9.09 2 10.53 2 8.70 6 9.38 0 0.00 Born Again 0 0 1 5.26 2 8.70 3 4.69 4 8.16 Others 4 18.19 0 0 5 21.74 9 14.06 8 16.33 Average Age 56.5 45.5 51 53 45.89 Household Size 5.5 4.5 5.5 5.5 5.1 Farming experience (years) Total experience 16.17 9.94 11.68 12.22 14.93 Organic 3.33 3.67 11.68 6.22 Educ’l Attainment 9.5 9 10 9.5 7.65
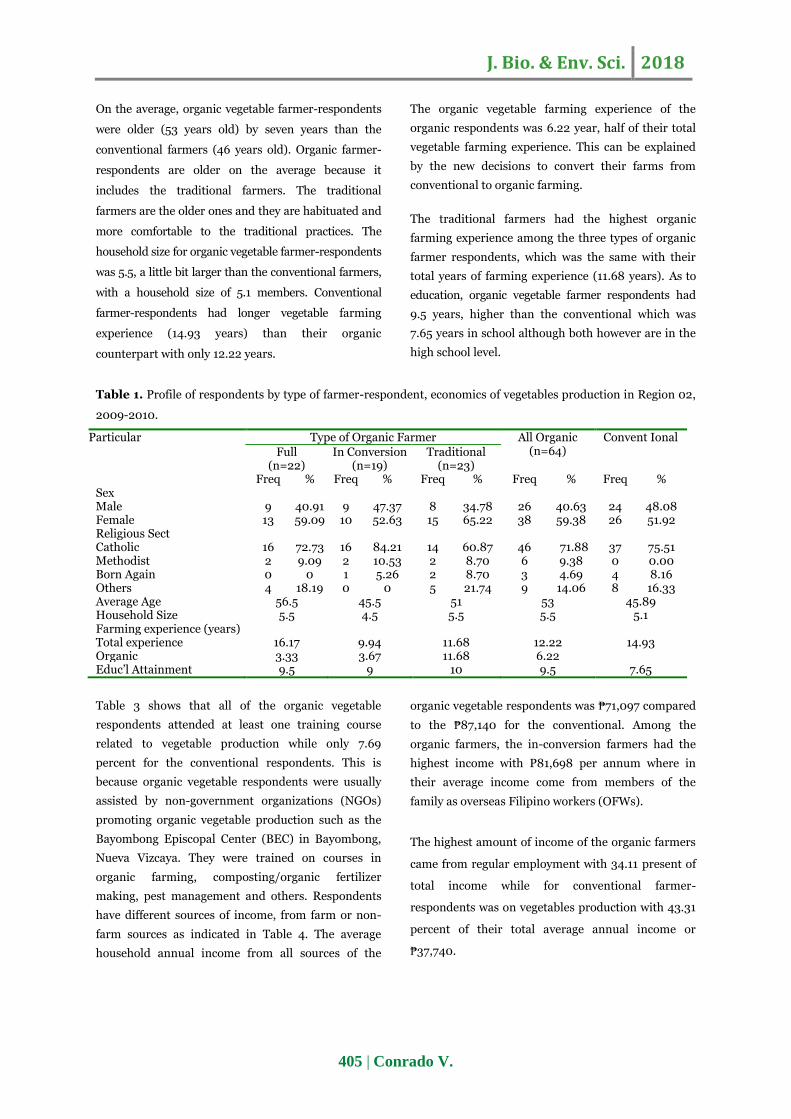
Table 3 shows that all of the organic vegetable
respondents attended at least one training course
related to vegetable production while only 7.69
percent for the conventional respondents. This is
because organic vegetable respondents were usually
assisted by non-government organizations (NGOs)
promoting organic vegetable production such as the
Bayombong Episcopal Center (BEC) in Bayombong,
Nueva Vizcaya. They were trained on courses in
organic farming, composting/organic fertilizer
making, pest management and others. Respondents
have different sources of income, from farm or non-
farm sources as indicated in Table 4. The average
household annual income from all sources of the
organic vegetable respondents was ₱71,097 compared
to the ₱87,140 for the conventional. Among the
organic farmers, the in-conversion farmers had the
highest income with P81,698 per annum where in
their average income come from members of the
family as overseas Filipino workers (OFWs).
The highest amount of income of the organic farmers
came from regular employment with 34.11 present of
total income while for conventional farmer-
respondents was on vegetables production with 43.31
percent of their total average annual income or
₱37,740.
J. Bio. & Env. Sci. 2018
406 | Conrado V.
Table 2. Trainings attended by type of farmer-respondent, documentation of organic vegetables in Region 02,
2009-2010.
Particular Type of Organic Farmer All Organic (n=64)
Convent Ional Full
(n=22) In
Conversion Traditional
(n=23) (n=19)
Freq % Freq % Freq % Freq % Freq % Attended Trainings? Yes 22 100 19 100 23 100 64 100 4 7.69 No 0 0 0 0 0 0 0 0 48 92.31 Training Courses Attended Organic Farming 12 54.54 9 47.37 6 26.09 27 42.19 1 1.92 Composting & Organic Fertilizer Making 1 4.55 2 10.53 0 0 3 4.69 1 1.92 Others 4 18.2 6 31.56 3 13.05 13 20.31 2 3.85
Sources and Average Annual Household Income
The higher average annual household income of the
conventional farmers can be attributed to the higher
income on conventional vegetables production which
is more than 43 percent of their annual average total
income. It is worth mentioning that there are still
organic farmers who still have income from
conventional vegetables production. This means that
they are not yet ready to convert all their farms into
organic, since the stage of converting is risky. Based
on the Philippine National Standards Specification for
Organic Agriculture, conversion is the process of
changing an agricultural system from conventional to
organic. The period covered during this process is
known as transition. This includes the total change of
inputs of artificial fertilizer and/ or pesticide to inputs
that conform to this standard.
Table 3. Average annual household income by source by type of farmer-respondents, economics of organic
vegetables production in Region 02, 2009-2010.
Source of Income
Type of Organic Farmer All Organic
(n= 64) Convent- Ional
(n=52) Full
(n=22) In conversion (n=19) Traditional (n=23)
Amount % Amount % Amount % Amount % Amount %
Regular employment 44,975 48.90 21,105 25.81 12,696 22.89 25,685 34.11 10,615 12.18 Rice and corn 11,647 12.66 16,339 19.99 16,509 29.76 14,889 19.77 25,272 29.00 OFW
13.05 29,053 35.53 3,548 6.40 14,090 18.71 1,846 2.12
Organic vegetable 14,767 16.61 8,373 10.31 6,423 11.47 9,712 13.11 -
Conventional vegetable 1,167 1.60 332 0.41 5,124 9.24 2,379 3.29 37,740 43.31 Livestock and poultry 1,750 1.90 1,158 1.42 3,084 5.56 2,064 2.74 1,424 1.63 Driving -
368 0.45 4,217 7.60 1,677 2.23 896 1.03
Hired labor-non farm 960 1.30 2,633 3.22 783 1.41 1,484 1.97 5,458 6.26 Business -
-
2,109 3.80 782 1.04 2,845 3.26
Others 3,655 3.98 2,337 2.86 1,043 1.89 2,282 3.03 1,045 1.20 Total household income 78,921 100.00 81,698 100.00 55,535 100.00 71,097 100.00 87,140 100.00
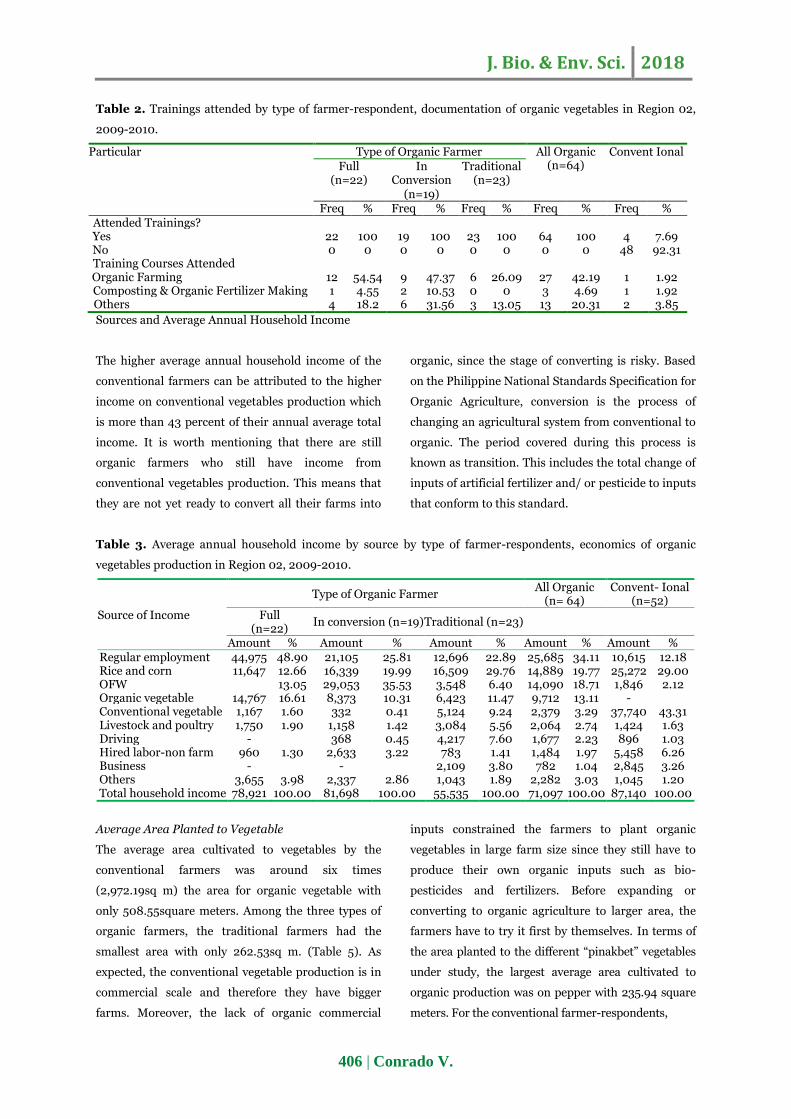
Average Area Planted to Vegetable
The average area cultivated to vegetables by the
conventional farmers was around six times
(2,972.19sq m) the area for organic vegetable with
only 508.55square meters. Among the three types of
organic farmers, the traditional farmers had the
smallest area with only 262.53sq m. (Table 5). As
expected, the conventional vegetable production is in
commercial scale and therefore they have bigger
farms. Moreover, the lack of organic commercial
inputs constrained the farmers to plant organic
vegetables in large farm size since they still have to
produce their own organic inputs such as bio-
pesticides and fertilizers. Before expanding or
converting to organic agriculture to larger area, the
farmers have to try it first by themselves. In terms of
the area planted to the different “pinakbet” vegetables
under study, the largest average area cultivated to
organic production was on pepper with 235.94 square
meters. For the conventional farmer-respondents,
J. Bio. & Env. Sci. 2018
407 | Conrado V.
the largest area cultivated was on “ampalaya”
(1,082.22sq m). Although the study is on the lowland
vegetables, there were farmer-respondents who also
produce high land vegetables (lettuce, sweet peas and
carrots). These farmers are from the higher elevation
areas of the study site.
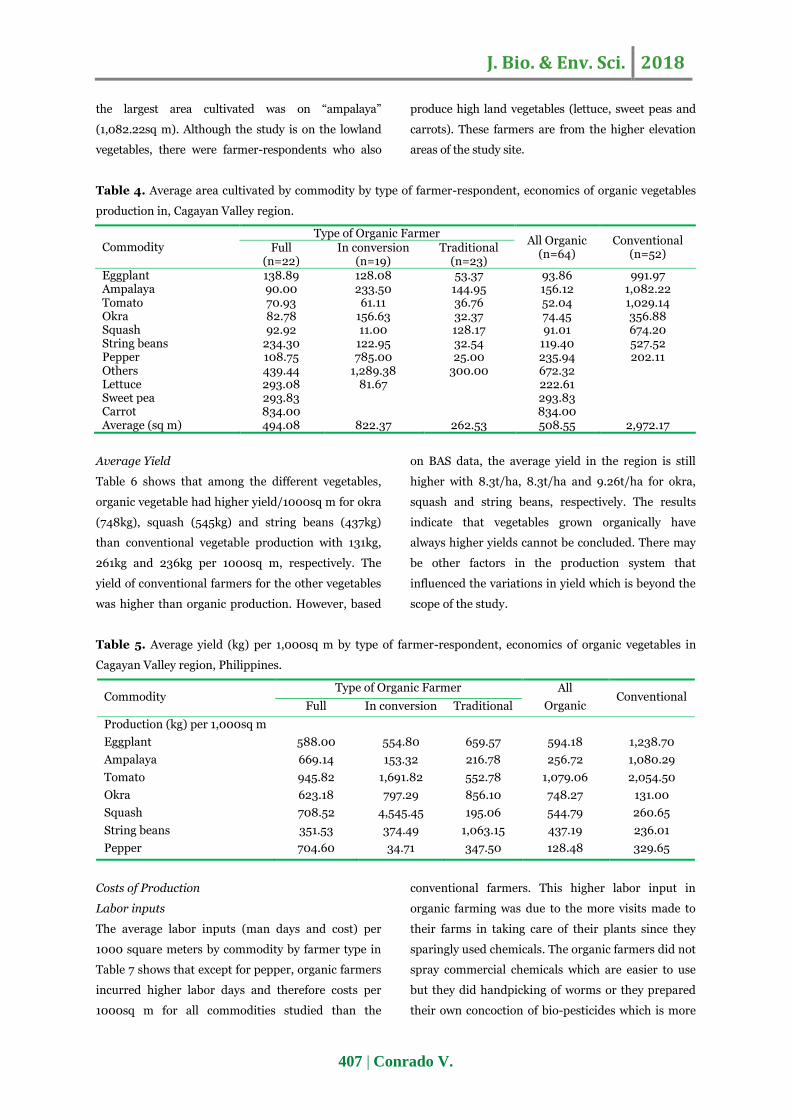
Table 4. Average area cultivated by commodity by type of farmer-respondent, economics of organic vegetables
production in, Cagayan Valley region.
Commodity Type of Organic Farmer
All Organic (n=64)
Conventional (n=52)
Full (n=22)
In conversion (n=19)
Traditional (n=23)
Eggplant 138.89 128.08 53.37 93.86 991.97 Ampalaya 90.00 233.50 144.95 156.12 1,082.22 Tomato 70.93 61.11 36.76 52.04 1,029.14 Okra 82.78 156.63 32.37 74.45 356.88 Squash 92.92 11.00 128.17 91.01 674.20 String beans 234.30 122.95 32.54 119.40 527.52 Pepper 108.75 785.00 25.00 235.94 202.11 Others 439.44 1,289.38 300.00 672.32
Lettuce 293.08 81.67
222.61
Sweet pea 293.83
293.83
Carrot 834.00
834.00
Average (sq m) 494.08 822.37 262.53 508.55 2,972.17
Average Yield
Table 6 shows that among the different vegetables,
organic vegetable had higher yield/1000sq m for okra
(748kg), squash (545kg) and string beans (437kg)
than conventional vegetable production with 131kg,
261kg and 236kg per 1000sq m, respectively. The
yield of conventional farmers for the other vegetables
was higher than organic production. However, based
on BAS data, the average yield in the region is still
higher with 8.3t/ha, 8.3t/ha and 9.26t/ha for okra,
squash and string beans, respectively. The results
indicate that vegetables grown organically have
always higher yields cannot be concluded. There may
be other factors in the production system that
influenced the variations in yield which is beyond the
scope of the study.
Table 5. Average yield (kg) per 1,000sq m by type of farmer-respondent, economics of organic vegetables in
Cagayan Valley region, Philippines.
Commodity Type of Organic Farmer All
Organic Conventional
Full In conversion Traditional
Production (kg) per 1,000sq m
Eggplant 588.00 554.80 659.57 594.18 1,238.70
Ampalaya 669.14 153.32 216.78 256.72 1,080.29
Tomato 945.82 1,691.82 552.78 1,079.06 2,054.50
Okra 623.18 797.29 856.10 748.27 131.00
Squash 708.52 4,545.45 195.06 544.79 260.65
String beans 351.53 374.49 1,063.15 437.19 236.01
Pepper 704.60 34.71 347.50 128.48 329.65
Costs of Production
Labor inputs
The average labor inputs (man days and cost) per
1000 square meters by commodity by farmer type in
Table 7 shows that except for pepper, organic farmers
incurred higher labor days and therefore costs per
1000sq m for all commodities studied than the
conventional farmers. This higher labor input in
organic farming was due to the more visits made to
their farms in taking care of their plants since they
sparingly used chemicals. The organic farmers did not
spray commercial chemicals which are easier to use
but they did handpicking of worms or they prepared
their own concoction of bio-pesticides which is more
J. Bio. & Env. Sci. 2018
408 | Conrado V.
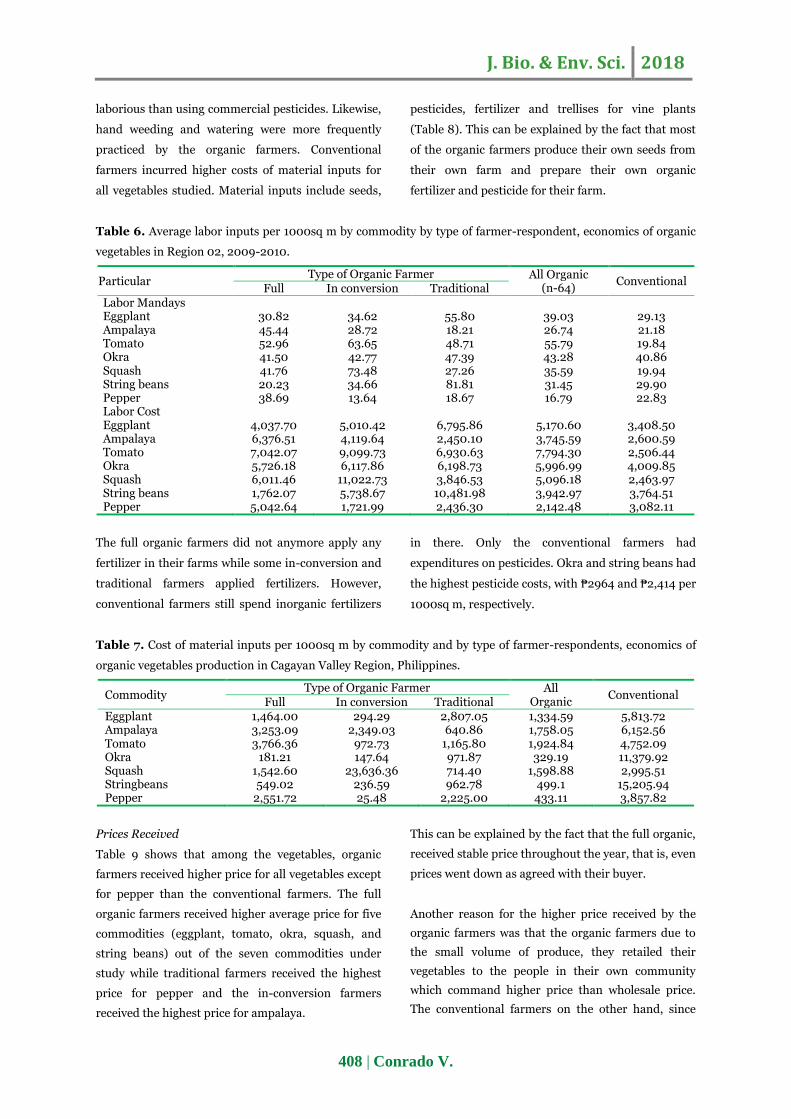
laborious than using commercial pesticides. Likewise,
hand weeding and watering were more frequently
practiced by the organic farmers. Conventional
farmers incurred higher costs of material inputs for
all vegetables studied. Material inputs include seeds,
pesticides, fertilizer and trellises for vine plants
(Table 8). This can be explained by the fact that most
of the organic farmers produce their own seeds from
their own farm and prepare their own organic
fertilizer and pesticide for their farm.
Table 6. Average labor inputs per 1000sq m by commodity by type of farmer-respondent, economics of organic
vegetables in Region 02, 2009-2010.
Particular Type of Organic Farmer All Organic
(n-64) Conventional
Full In conversion Traditional Labor Mandays
Eggplant 30.82 34.62 55.80 39.03 29.13 Ampalaya 45.44 28.72 18.21 26.74 21.18 Tomato 52.96 63.65 48.71 55.79 19.84 Okra 41.50 42.77 47.39 43.28 40.86 Squash 41.76 73.48 27.26 35.59 19.94 String beans 20.23 34.66 81.81 31.45 29.90 Pepper 38.69 13.64 18.67 16.79 22.83 Labor Cost
Eggplant 4,037.70 5,010.42 6,795.86 5,170.60 3,408.50 Ampalaya 6,376.51 4,119.64 2,450.10 3,745.59 2,600.59 Tomato 7,042.07 9,099.73 6,930.63 7,794.30 2,506.44 Okra 5,726.18 6,117.86 6,198.73 5,996.99 4,009.85 Squash 6,011.46 11,022.73 3,846.53 5,096.18 2,463.97 String beans 1,762.07 5,738.67 10,481.98 3,942.97 3,764.51 Pepper 5,042.64 1,721.99 2,436.30 2,142.48 3,082.11
The full organic farmers did not anymore apply any
fertilizer in their farms while some in-conversion and
traditional farmers applied fertilizers. However,
conventional farmers still spend inorganic fertilizers
in there. Only the conventional farmers had
expenditures on pesticides. Okra and string beans had
the highest pesticide costs, with ₱2964 and ₱2,414 per
1000sq m, respectively.
Table 7. Cost of material inputs per 1000sq m by commodity and by type of farmer-respondents, economics of
organic vegetables production in Cagayan Valley Region, Philippines.
Commodity Type of Organic Farmer All
Organic Conventional
Full In conversion Traditional Eggplant 1,464.00 294.29 2,807.05 1,334.59 5,813.72 Ampalaya 3,253.09 2,349.03 640.86 1,758.05 6,152.56 Tomato 3,766.36 972.73 1,165.80 1,924.84 4,752.09 Okra 181.21 147.64 971.87 329.19 11,379.92 Squash 1,542.60 23,636.36 714.40 1,598.88 2,995.51 Stringbeans 549.02 236.59 962.78 499.1 15,205.94 Pepper 2,551.72 25.48 2,225.00 433.11 3,857.82
Prices Received
Table 9 shows that among the vegetables, organic
farmers received higher price for all vegetables except
for pepper than the conventional farmers. The full
organic farmers received higher average price for five
commodities (eggplant, tomato, okra, squash, and
string beans) out of the seven commodities under
study while traditional farmers received the highest
price for pepper and the in-conversion farmers
received the highest price for ampalaya.
This can be explained by the fact that the full organic,
received stable price throughout the year, that is, even
prices went down as agreed with their buyer.
Another reason for the higher price received by the
organic farmers was that the organic farmers due to
the small volume of produce, they retailed their
vegetables to the people in their own community
which command higher price than wholesale price.
The conventional farmers on the other hand, since
J. Bio. & Env. Sci. 2018
409 | Conrado V.
they have higher volume of produce due to higher
production area and mono cropping, they sold their
produce to wholesalers and therefore at a lower price.
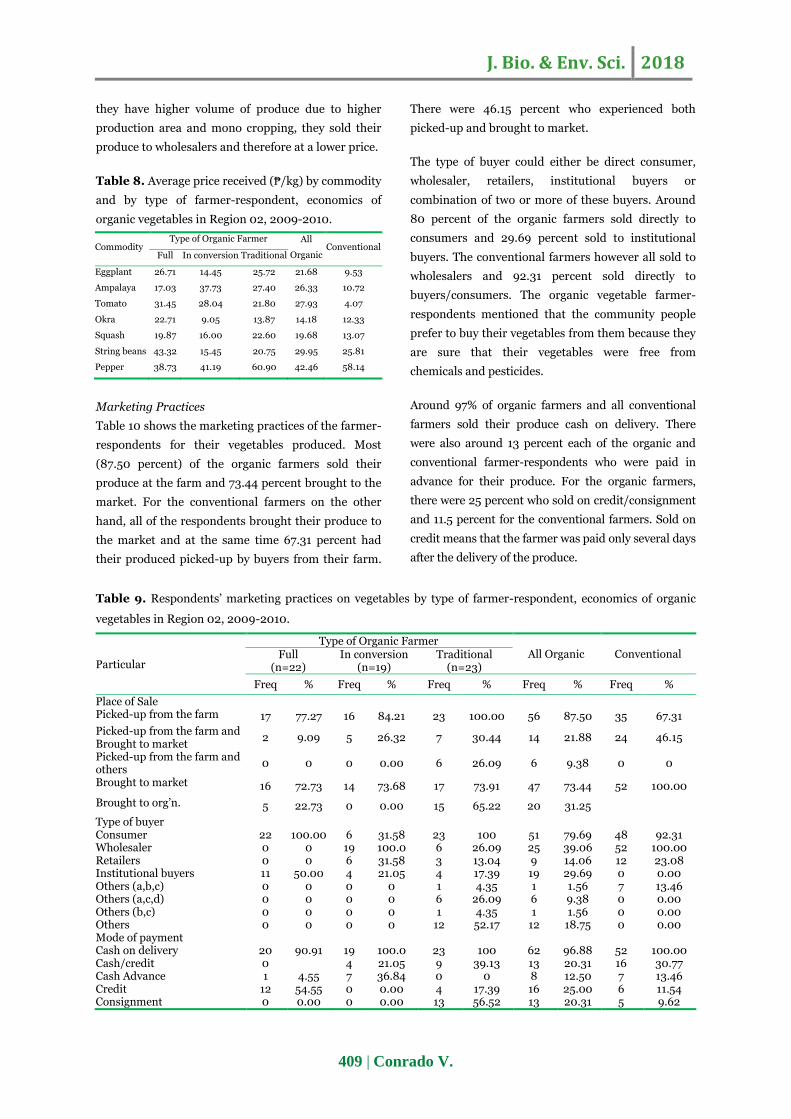
Table 8. Average price received (₱/kg) by commodity
and by type of farmer-respondent, economics of
organic vegetables in Region 02, 2009-2010.
Commodity Type of Organic Farmer All
Organic Conventional
Full In conversion Traditional
Eggplant 26.71 14.45 25.72 21.68 9.53
Ampalaya 17.03 37.73 27.40 26.33 10.72
Tomato 31.45 28.04 21.80 27.93 4.07
Okra 22.71 9.05 13.87 14.18 12.33
Squash 19.87 16.00 22.60 19.68 13.07
String beans 43.32 15.45 20.75 29.95 25.81
Pepper 38.73 41.19 60.90 42.46 58.14
Marketing Practices
Table 10 shows the marketing practices of the farmer-
respondents for their vegetables produced. Most
(87.50 percent) of the organic farmers sold their
produce at the farm and 73.44 percent brought to the
market. For the conventional farmers on the other
hand, all of the respondents brought their produce to
the market and at the same time 67.31 percent had
their produced picked-up by buyers from their farm.
There were 46.15 percent who experienced both
picked-up and brought to market.
The type of buyer could either be direct consumer,
wholesaler, retailers, institutional buyers or
combination of two or more of these buyers. Around
80 percent of the organic farmers sold directly to
consumers and 29.69 percent sold to institutional
buyers. The conventional farmers however all sold to
wholesalers and 92.31 percent sold directly to
buyers/consumers. The organic vegetable farmer-
respondents mentioned that the community people
prefer to buy their vegetables from them because they
are sure that their vegetables were free from
chemicals and pesticides.
Around 97% of organic farmers and all conventional
farmers sold their produce cash on delivery. There
were also around 13 percent each of the organic and
conventional farmer-respondents who were paid in
advance for their produce. For the organic farmers,
there were 25 percent who sold on credit/consignment
and 11.5 percent for the conventional farmers. Sold on
credit means that the farmer was paid only several days
after the delivery of the produce.
Table 9. Respondents’ marketing practices on vegetables by type of farmer-respondent, economics of organic
vegetables in Region 02, 2009-2010.
Particular
Type of Organic Farmer All Organic Conventional Full
(n=22) In conversion
(n=19) Traditional
(n=23)
Freq % Freq % Freq % Freq % Freq %
Place of Sale Picked-up from the farm 17 77.27 16 84.21 23 100.00 56 87.50 35 67.31
Picked-up from the farm and Brought to market
2 9.09 5 26.32 7 30.44 14 21.88 24 46.15
Picked-up from the farm and others
0 0 0 0.00 6 26.09 6 9.38 0 0
Brought to market 16 72.73 14 73.68 17 73.91 47 73.44 52 100.00
Brought to org’n. 5 22.73 0 0.00 15 65.22 20 31.25
Type of buyer Consumer 22 100.00 6 31.58 23 100 51 79.69 48 92.31 Wholesaler 0 0 19 100.0 6 26.09 25 39.06 52 100.00 Retailers 0 0 6 31.58 3 13.04 9 14.06 12 23.08 Institutional buyers 11 50.00 4 21.05 4 17.39 19 29.69 0 0.00 Others (a,b,c) 0 0 0 0 1 4.35 1 1.56 7 13.46 Others (a,c,d) 0 0 0 0 6 26.09 6 9.38 0 0.00 Others (b,c) 0 0 0 0 1 4.35 1 1.56 0 0.00 Others 0 0 0 0 12 52.17 12 18.75 0 0.00 Mode of payment Cash on delivery 20 90.91 19 100.0 23 100 62 96.88 52 100.00 Cash/credit 0
4 21.05 9 39.13 13 20.31 16 30.77
Cash Advance 1 4.55 7 36.84 0 0 8 12.50 7 13.46 Credit 12 54.55 0 0.00 4 17.39 16 25.00 6 11.54 Consignment 0 0.00 0 0.00 13 56.52 13 20.31 5 9.62
J. Bio. & Env. Sci. 2018
410 | Conrado V.
Multiple responses
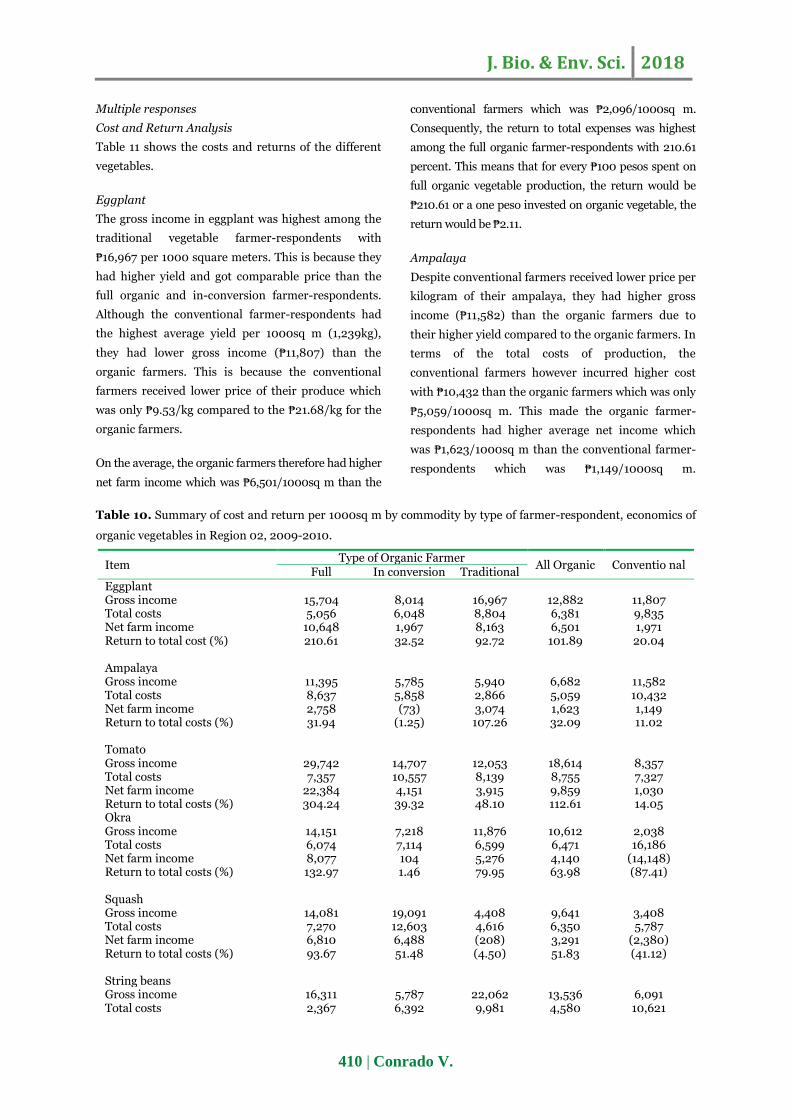
Cost and Return Analysis
Table 11 shows the costs and returns of the different
vegetables.
Eggplant
The gross income in eggplant was highest among the
traditional vegetable farmer-respondents with
₱16,967 per 1000 square meters. This is because they
had higher yield and got comparable price than the
full organic and in-conversion farmer-respondents.
Although the conventional farmer-respondents had
the highest average yield per 1000sq m (1,239kg),
they had lower gross income (₱11,807) than the
organic farmers. This is because the conventional
farmers received lower price of their produce which
was only ₱9.53/kg compared to the ₱21.68/kg for the
organic farmers.
On the average, the organic farmers therefore had higher
net farm income which was ₱6,501/1000sq m than the
conventional farmers which was ₱2,096/1000sq m.
Consequently, the return to total expenses was highest
among the full organic farmer-respondents with 210.61
percent. This means that for every ₱100 pesos spent on
full organic vegetable production, the return would be
₱210.61 or a one peso invested on organic vegetable, the
return would be ₱2.11.
Ampalaya
Despite conventional farmers received lower price per
kilogram of their ampalaya, they had higher gross
income (₱11,582) than the organic farmers due to
their higher yield compared to the organic farmers. In
terms of the total costs of production, the
conventional farmers however incurred higher cost
with ₱10,432 than the organic farmers which was only
₱5,059/1000sq m. This made the organic farmer-
respondents had higher average net income which
was ₱1,623/1000sq m than the conventional farmer-
respondents which was ₱1,149/1000sq m.
Table 10. Summary of cost and return per 1000sq m by commodity by type of farmer-respondent, economics of
organic vegetables in Region 02, 2009-2010.
Item Type of Organic Farmer
All Organic Conventio nal Full In conversion Traditional
Eggplant Gross income 15,704 8,014 16,967 12,882 11,807
Total costs 5,056 6,048 8,804 6,381 9,835 Net farm income 10,648 1,967 8,163 6,501 1,971 Return to total cost (%) 210.61 32.52 92.72 101.89 20.04
Ampalaya Gross income 11,395 5,785 5,940 6,682 11,582
Total costs 8,637 5,858 2,866 5,059 10,432 Net farm income 2,758 (73) 3,074 1,623 1,149 Return to total costs (%) 31.94 (1.25) 107.26 32.09 11.02
Tomato Gross income 29,742 14,707 12,053 18,614 8,357
Total costs 7,357 10,557 8,139 8,755 7,327 Net farm income 22,384 4,151 3,915 9,859 1,030 Return to total costs (%) 304.24 39.32 48.10 112.61 14.05 Okra
Gross income 14,151 7,218 11,876 10,612 2,038 Total costs 6,074 7,114 6,599 6,471 16,186 Net farm income 8,077 104 5,276 4,140 (14,148) Return to total costs (%) 132.97 1.46 79.95 63.98 (87.41)
Squash Gross income 14,081 19,091 4,408 9,641 3,408
Total costs 7,270 12,603 4,616 6,350 5,787 Net farm income 6,810 6,488 (208) 3,291 (2,380) Return to total costs (%) 93.67 51.48 (4.50) 51.83 (41.12)
String beans Gross income 16,311 5,787 22,062 13,536 6,091
Total costs 2,367 6,392 9,981 4,580 10,621
J. Bio. & Env. Sci. 2018
411 | Conrado V.
Item Type of Organic Farmer
All Organic Conventio nal Full In conversion Traditional
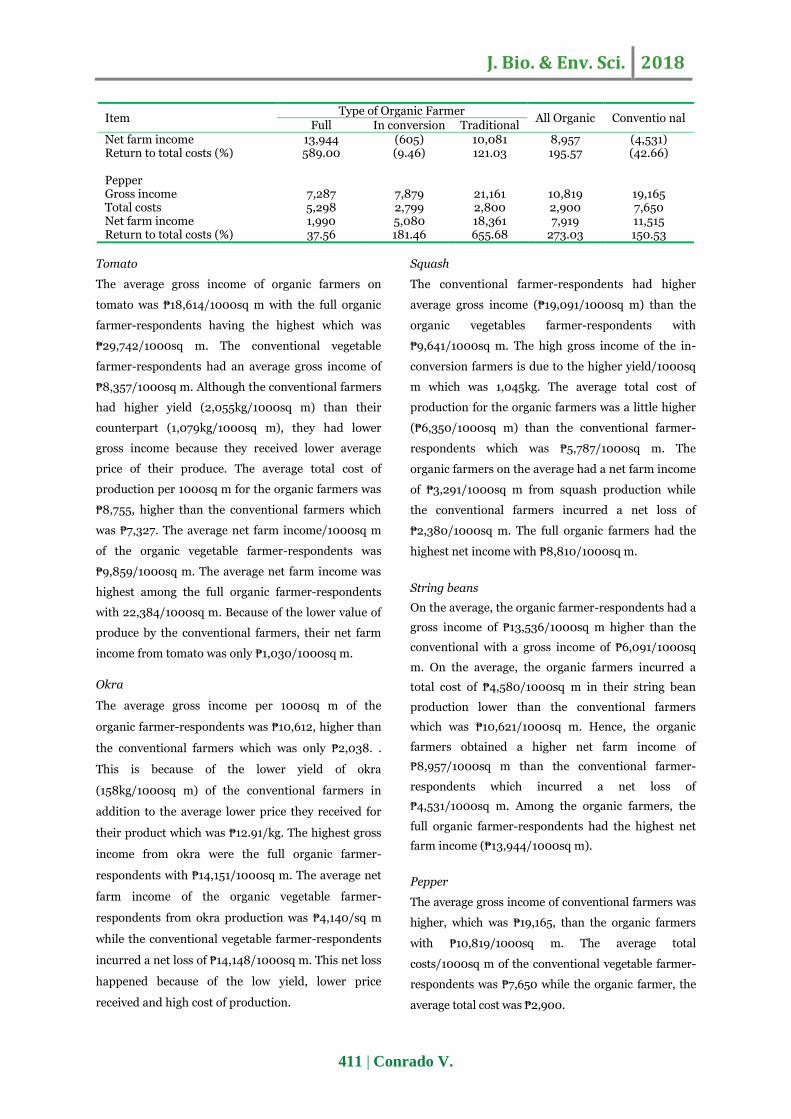
Net farm income 13,944 (605) 10,081 8,957 (4,531) Return to total costs (%) 589.00 (9.46) 121.03 195.57 (42.66)
Pepper Gross income 7,287 7,879 21,161 10,819 19,165
Total costs 5,298 2,799 2,800 2,900 7,650 Net farm income 1,990 5,080 18,361 7,919 11,515 Return to total costs (%) 37.56 181.46 655.68 273.03 150.53
Tomato
The average gross income of organic farmers on
tomato was ₱18,614/1000sq m with the full organic
farmer-respondents having the highest which was
₱29,742/1000sq m. The conventional vegetable
farmer-respondents had an average gross income of
₱8,357/1000sq m. Although the conventional farmers
had higher yield (2,055kg/1000sq m) than their
counterpart (1,079kg/1000sq m), they had lower
gross income because they received lower average
price of their produce. The average total cost of
production per 1000sq m for the organic farmers was
₱8,755, higher than the conventional farmers which
was ₱7,327. The average net farm income/1000sq m
of the organic vegetable farmer-respondents was
₱9,859/1000sq m. The average net farm income was
highest among the full organic farmer-respondents
with 22,384/1000sq m. Because of the lower value of
produce by the conventional farmers, their net farm
income from tomato was only ₱1,030/1000sq m.
Okra
The average gross income per 1000sq m of the
organic farmer-respondents was ₱10,612, higher than
the conventional farmers which was only ₱2,038. .
This is because of the lower yield of okra
(158kg/1000sq m) of the conventional farmers in
addition to the average lower price they received for
their product which was ₱12.91/kg. The highest gross
income from okra were the full organic farmer-
respondents with ₱14,151/1000sq m. The average net
farm income of the organic vegetable farmer-
respondents from okra production was ₱4,140/sq m
while the conventional vegetable farmer-respondents
incurred a net loss of ₱14,148/1000sq m. This net loss
happened because of the low yield, lower price
received and high cost of production.
Squash
The conventional farmer-respondents had higher
average gross income (₱19,091/1000sq m) than the
organic vegetables farmer-respondents with
₱9,641/1000sq m. The high gross income of the in-
conversion farmers is due to the higher yield/1000sq
m which was 1,045kg. The average total cost of
production for the organic farmers was a little higher
(₱6,350/1000sq m) than the conventional farmer-
respondents which was ₱5,787/1000sq m. The
organic farmers on the average had a net farm income
of ₱3,291/1000sq m from squash production while
the conventional farmers incurred a net loss of
₱2,380/1000sq m. The full organic farmers had the
highest net income with ₱8,810/1000sq m.
String beans
On the average, the organic farmer-respondents had a
gross income of ₱13,536/1000sq m higher than the
conventional with a gross income of ₱6,091/1000sq
m. On the average, the organic farmers incurred a
total cost of ₱4,580/1000sq m in their string bean
production lower than the conventional farmers
which was ₱10,621/1000sq m. Hence, the organic
farmers obtained a higher net farm income of
₱8,957/1000sq m than the conventional farmer-
respondents which incurred a net loss of
₱4,531/1000sq m. Among the organic farmers, the
full organic farmer-respondents had the highest net
farm income (₱13,944/1000sq m).
Pepper
The average gross income of conventional farmers was
higher, which was ₱19,165, than the organic farmers
with ₱10,819/1000sq m. The average total
costs/1000sq m of the conventional vegetable farmer-
respondents was ₱7,650 while the organic farmer, the
average total cost was ₱2,900.
J. Bio. & Env. Sci. 2018
412 | Conrado V.
The organic farmers had lower net farm income per
1000sq m (₱7,919) than the conventional farmers
(₱11,515). However, the return to total cost for the
organic farmers was higher (273 percent) than the
conventional farmers with only 150 percent. Among
the organic farmers, the traditional farmer-
respondents had the highest net farm income with
₱18,36.
In summary, the results indicate that organic farmer-
respondents had higher net farm income per 1000sq
m for all commodities except pepper where the
conventional farmers had higher net farm income
than the organic farmers. The full organic farmers
had the highest net farm income for eggplant, tomato,
okra, squash and string beans while the traditional
farmers had the highest net farm income in ampalaya
and pepper. Conventional farmers incurred a net loss
in okra, squash and string beans.
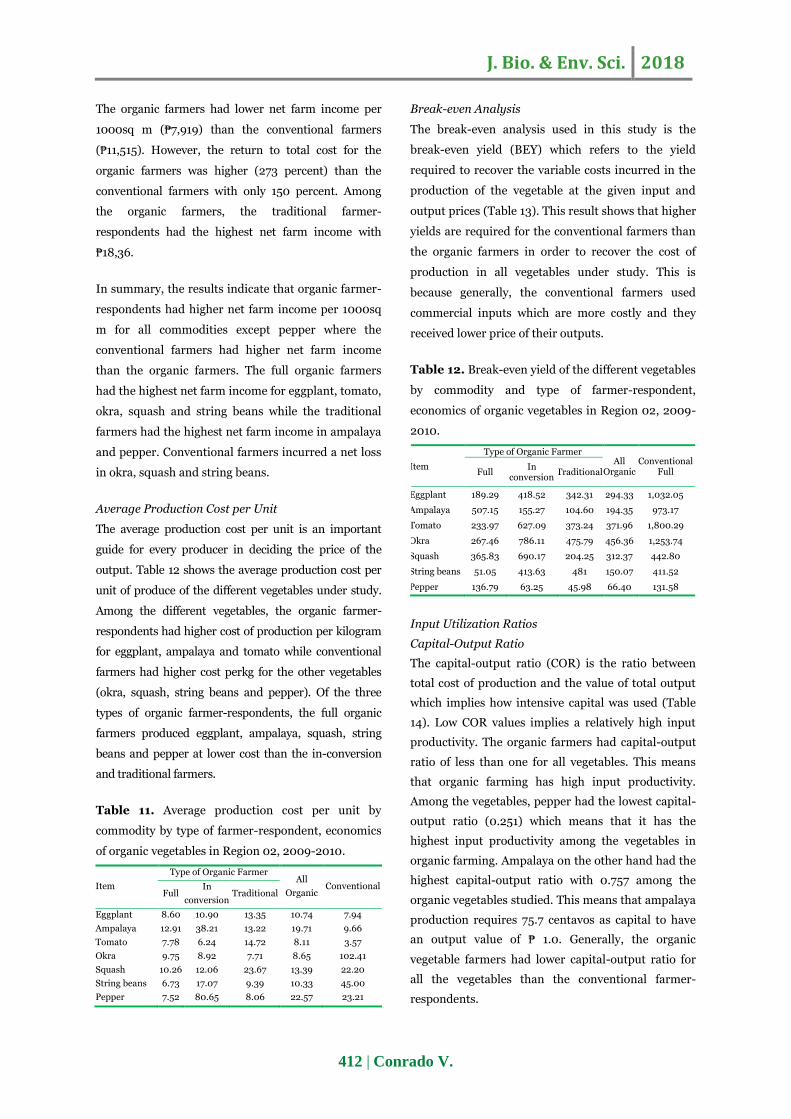
Average Production Cost per Unit
The average production cost per unit is an important
guide for every producer in deciding the price of the
output. Table 12 shows the average production cost per
unit of produce of the different vegetables under study.
Among the different vegetables, the organic farmer-
respondents had higher cost of production per kilogram
for eggplant, ampalaya and tomato while conventional
farmers had higher cost perkg for the other vegetables
(okra, squash, string beans and pepper). Of the three
types of organic farmer-respondents, the full organic
farmers produced eggplant, ampalaya, squash, string
beans and pepper at lower cost than the in-conversion
and traditional farmers.
Table 11. Average production cost per unit by
commodity by type of farmer-respondent, economics
of organic vegetables in Region 02, 2009-2010.
Item
Type of Organic Farmer All
Organic Conventional
Full In
conversion Traditional
Eggplant 8.60 10.90 13.35 10.74 7.94
Ampalaya 12.91 38.21 13.22 19.71 9.66
Tomato 7.78 6.24 14.72 8.11 3.57
Okra 9.75 8.92 7.71 8.65 102.41
Squash 10.26 12.06 23.67 13.39 22.20
String beans 6.73 17.07 9.39 10.33 45.00
Pepper 7.52 80.65 8.06 22.57 23.21
Break-even Analysis
The break-even analysis used in this study is the
break-even yield (BEY) which refers to the yield
required to recover the variable costs incurred in the
production of the vegetable at the given input and
output prices (Table 13). This result shows that higher
yields are required for the conventional farmers than
the organic farmers in order to recover the cost of
production in all vegetables under study. This is
because generally, the conventional farmers used
commercial inputs which are more costly and they
received lower price of their outputs.
Table 12. Break-even yield of the different vegetables
by commodity and type of farmer-respondent,
economics of organic vegetables in Region 02, 2009-
2010.
Item
Type of Organic Farmer All
Organic Conventional
Full Full In
conversion Traditional
Eggplant 189.29 418.52 342.31 294.33 1,032.05
Ampalaya 507.15 155.27 104.60 194.35 973.17
Tomato 233.97 627.09 373.24 371.96 1,800.29
Okra 267.46 786.11 475.79 456.36 1,253.74
Squash 365.83 690.17 204.25 312.37 442.80
String beans 51.05 413.63 481 150.07 411.52
Pepper 136.79 63.25 45.98 66.40 131.58
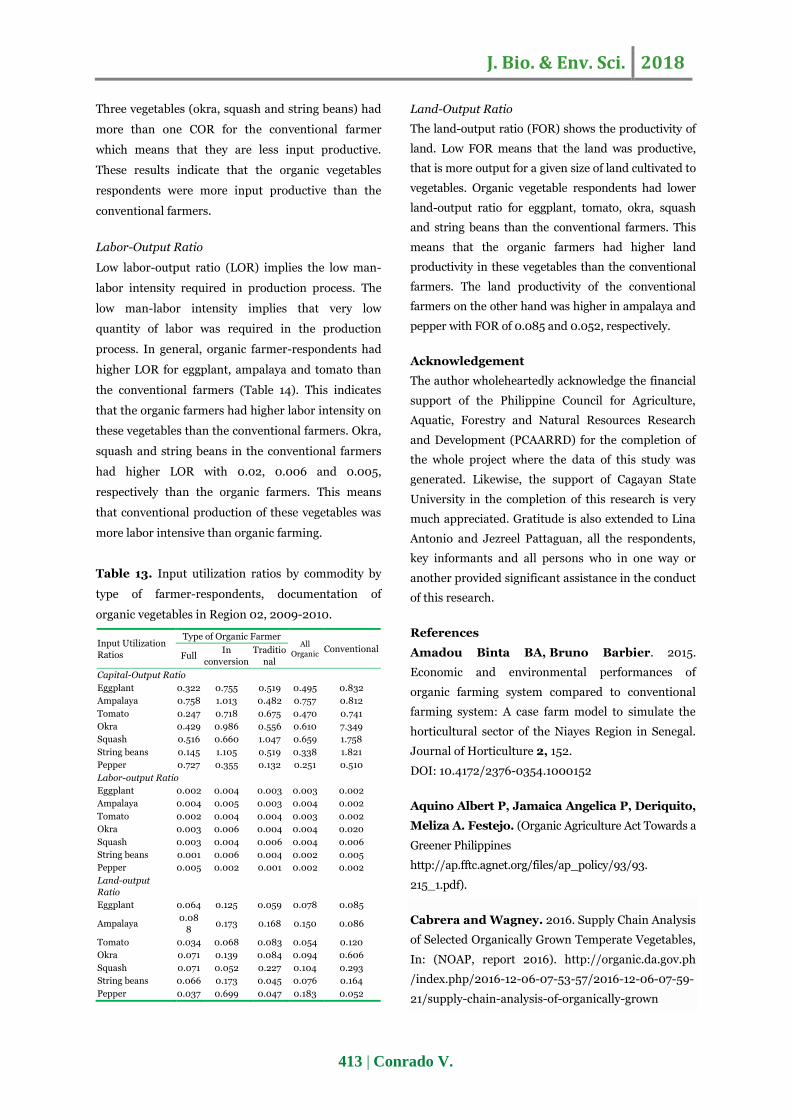
Input Utilization Ratios
Capital-Output Ratio
The capital-output ratio (COR) is the ratio between
total cost of production and the value of total output
which implies how intensive capital was used (Table
14). Low COR values implies a relatively high input
productivity. The organic farmers had capital-output
ratio of less than one for all vegetables. This means
that organic farming has high input productivity.
Among the vegetables, pepper had the lowest capital-
output ratio (0.251) which means that it has the
highest input productivity among the vegetables in
organic farming. Ampalaya on the other hand had the
highest capital-output ratio with 0.757 among the
organic vegetables studied. This means that ampalaya
production requires 75.7 centavos as capital to have
an output value of ₱ 1.0. Generally, the organic
vegetable farmers had lower capital-output ratio for
all the vegetables than the conventional farmer-
respondents.
J. Bio. & Env. Sci. 2018
413 | Conrado V.
Three vegetables (okra, squash and string beans) had
more than one COR for the conventional farmer
which means that they are less input productive.
These results indicate that the organic vegetables
respondents were more input productive than the
conventional farmers.
Labor-Output Ratio
Low labor-output ratio (LOR) implies the low man-
labor intensity required in production process. The
low man-labor intensity implies that very low
quantity of labor was required in the production
process. In general, organic farmer-respondents had
higher LOR for eggplant, ampalaya and tomato than
the conventional farmers (Table 14). This indicates
that the organic farmers had higher labor intensity on
these vegetables than the conventional farmers. Okra,
squash and string beans in the conventional farmers
had higher LOR with 0.02, 0.006 and 0.005,
respectively than the organic farmers. This means
that conventional production of these vegetables was
more labor intensive than organic farming.
Table 13. Input utilization ratios by commodity by
type of farmer-respondents, documentation of
organic vegetables in Region 02, 2009-2010.
Input Utilization
Ratios
Type of Organic Farmer All
Organic Conventional Full
In
conversion
Traditio
nal
Capital-Output Ratio
Eggplant 0.322 0.755 0.519 0.495 0.832
Ampalaya 0.758 1.013 0.482 0.757 0.812
Tomato 0.247 0.718 0.675 0.470 0.741
Okra 0.429 0.986 0.556 0.610 7.349
Squash 0.516 0.660 1.047 0.659 1.758
String beans 0.145 1.105 0.519 0.338 1.821
Pepper 0.727 0.355 0.132 0.251 0.510
Labor-output Ratio
Eggplant 0.002 0.004 0.003 0.003 0.002
Ampalaya 0.004 0.005 0.003 0.004 0.002
Tomato 0.002 0.004 0.004 0.003 0.002
Okra 0.003 0.006 0.004 0.004 0.020
Squash 0.003 0.004 0.006 0.004 0.006
String beans 0.001 0.006 0.004 0.002 0.005
Pepper 0.005 0.002 0.001 0.002 0.002
Land-output
Ratio
Eggplant 0.064 0.125 0.059 0.078 0.085
Ampalaya 0.08
8 0.173 0.168 0.150 0.086
Tomato 0.034 0.068 0.083 0.054 0.120
Okra 0.071 0.139 0.084 0.094 0.606
Squash 0.071 0.052 0.227 0.104 0.293
String beans 0.066 0.173 0.045 0.076 0.164
Pepper 0.037 0.699 0.047 0.183 0.052
Land-Output Ratio
The land-output ratio (FOR) shows the productivity of
land. Low FOR means that the land was productive,
that is more output for a given size of land cultivated to
vegetables. Organic vegetable respondents had lower
land-output ratio for eggplant, tomato, okra, squash
and string beans than the conventional farmers. This
means that the organic farmers had higher land
productivity in these vegetables than the conventional
farmers. The land productivity of the conventional
farmers on the other hand was higher in ampalaya and
pepper with FOR of 0.085 and 0.052, respectively.
Acknowledgement
The author wholeheartedly acknowledge the financial
support of the Philippine Council for Agriculture,
Aquatic, Forestry and Natural Resources Research
and Development (PCAARRD) for the completion of
the whole project where the data of this study was
generated. Likewise, the support of Cagayan State
University in the completion of this research is very
much appreciated. Gratitude is also extended to Lina
Antonio and Jezreel Pattaguan, all the respondents,
key informants and all persons who in one way or
another provided significant assistance in the conduct
of this research.
References
Amadou Binta BA, Bruno Barbier. 2015.
Economic and environmental performances of
organic farming system compared to conventional
farming system: A case farm model to simulate the
horticultural sector of the Niayes Region in Senegal.
Journal of Horticulture 2, 152.
DOI: 10.4172/2376-0354.1000152
Aquino Albert P, Jamaica Angelica P, Deriquito,
Meliza A. Festejo. (Organic Agriculture Act Towards a
Greener Philippines
http://ap.fftc.agnet.org/files/ap_policy/93/93.
215_1.pdf).
Cabrera and Wagney. 2016. Supply Chain Analysis
of Selected Organically Grown Temperate Vegetables,
In: (NOAP, report 2016). http://organic.da.gov.ph
/index.php/2016-12-06-07-53-57/2016-12-06-07-59-
21/supply-chain-analysis-of-organically-grown
J. Bio. & Env. Sci. 2018
414 | Conrado V.
Conrado Vilma D, Avelina Antonio, Jezreel
Pattaguan. 2011. Documentation of Organic
Vegetables in Region 02. Unpublished Research
Report, Cagayan State University, Tuguegarao City.
Crowder, David W, John P. Reganold. 2015.
Financial competitiveness of organic agriculture on a
global scale. In Proceedings of the National Academy
of Sciences (PNAS) of the United States, June 16,
2015, 112 (24).
https://doi.org/10.1073/pnas. 1423674112 Edited by M.
S. Swaminathan, Centre for Research on Sustainable
Agricultural and Rural nt, Madras, India.
Helga, Willer and Julia Lernuod (Eds). 2017. The
World of Organic Agriculture Statistics and Emerging
Trends 2017 Research Institute of Organic Agriculture
(FiBL), Frick and IFOAM, edited by- Organics
International, Bonn, Version 1.1 of February 8, 2017.
IFOAM & FiBL. 2006. Brief Overview of Organic
Farming. www.intracen.org/ Organics/Country- Profile-
Philippines. htm.
Landicho, Leila D, Roselyn F, Paelmo, Rowena
D. Cabahug, Roberto G. Visco and Maryanne
G, Abadillos. 2014. Prospects and Challenges in
Promoting Organic Agriculture in the Upland
Communities in the Philippines: Implications to Food
Security and Nutrition. International Conference on
Food Security and Nutrition, IPCBEE vol.67 (2014) ©
(2014) IACSIT Press, Singapore,
DOI: 10.7763 /IPCBEE. 2014. V67. 12. 60 – 65.
Lantican FA. 2011. Supply chain analysis of high
value vegetables in the Philippines [2011] in FAO-
AGRIS from The Journal of Issaas [International
Society For Southeast Asian Agricultural Sciences]
(Philippines) ISSN : 0859-3132.
http://agris.fao.org/agrissearch/search.do?recordID
=PH2013000516
Mordo Intelligence. 2017. Market Entry - Organic
Food Market in Philippines: Analysis of Growth,
Trends and Progress (2017 - 2022). 5th Floor, Brigade
Towers, Financial District, Gachibowli, Hyderabad -
500032, India. https://www.mordorintelligence.com
/industry-reports/market-entry-organic-food-market.
Nemes, Noémi. 2009. Analysis Of Organic And Non-
Organic Farming Systems: A Critical Assessment Of
Farm Profitability. A Report in the Food and Agriculture
Organization of the United States.
www.fao.org/tempref/docrep/fao/011/ak355e/ak355
e00.pdf
NOAP. 2012-2016, http://organic.da.gov.ph/images
/Documents/NOAPDocument.pdf.
Olabisi, Laura Schmitt Olabisi, Ryan Qi Wang
and Arika Ligmann-Zielinska. 2015. Why Don’t
More Farmers Go Organic? Using A Stakeholder-
Informed Exploratory Agent-Based Model to Represent
the Dynamics of Farming Practices in the Philippines.
Land 4, 979-1002
DOI: 10.3390 /land4040979
Porciuncula Fe L, Luzviminda M, Galang, Rex
S, Parayno. 2015. Going organic: Understanding the
organic vegetables production environment in Central
Luzon, Philippines, Journal of Agricultural
Technology 11(2), 341-366. ISSN 1686-9141.
Republic Act. 10068. Organic Agriculture Act of the
Philippines. https://www.lawphil.net/statutes/repacts
/ra2010/ra_10068_2010.html
Rijk, Tomekde Ponti Bert, Martin K. van
Ittersum. 2012. The crop yield gap between organic
and conventional agriculture, Agricultural Systems
Vol 108, April 2012, page 1-9, Elsevier.
DOI: 10.1016/J.AGSY.2011.12.004
Shennan, Carol, Timothy J, Krupnik, Graeme
Baird, Hamutahl Cohen, Kelsey Forbush,
Robin J, Lovell, Elissa M, Olimpi. 2017. Organic
and Conventional Agriculture: A Useful Framing?
Annual Review of Environment and Resources Vol.
42, 317-346 (Volume publication date October 2017)
https://doi.org/10.1146/annurev-environ-110615-085750
Thippeswamy E, Comparative analysis of
organic and inorganic food. 2013. IOSR Journal
of Agriculture and Veterinary Science (IOSR-JAVS) e-
ISSN: 2319-2380, p-ISSN: 2319-2372.Volume 4,
Issue 6 (Sep. - Oct. 2013), pp 53-57
J. Bio. & Env. Sci. 2018
415 | Conrado V.
Verena Seufert, Navin Ramankutty. 2017. Many
shades of gray—The context-dependent performance of
organic agriculture. Science Advances 3(3), 2017. Sci.
Adv. 2017; 3: e1602638 10 March 2017 p 1 – 14.
https://www.ncbi.nlm.nih.gov/pmc/articles/PMC5362009/
Villegas, Pablito and Custodio, Henry. 2014.
Socio-Economics and Policy Support Towards
Enhancing the Organic Vegetables Industry in the
Philippines. Paper in: IFOAM Organic World
Congress 2014, Istanbul, Turkey, 13-15 October 2014.
Vlašicová E, Náglová Z. 2015. Differences in the
financial management of conventional, organic, and
biodynamic farms*. Scientia agriculturae bohemica
46(3), 106–111.
DOI: 10.1515/sab-2015-0024