Embed Size (px)
Citation preview
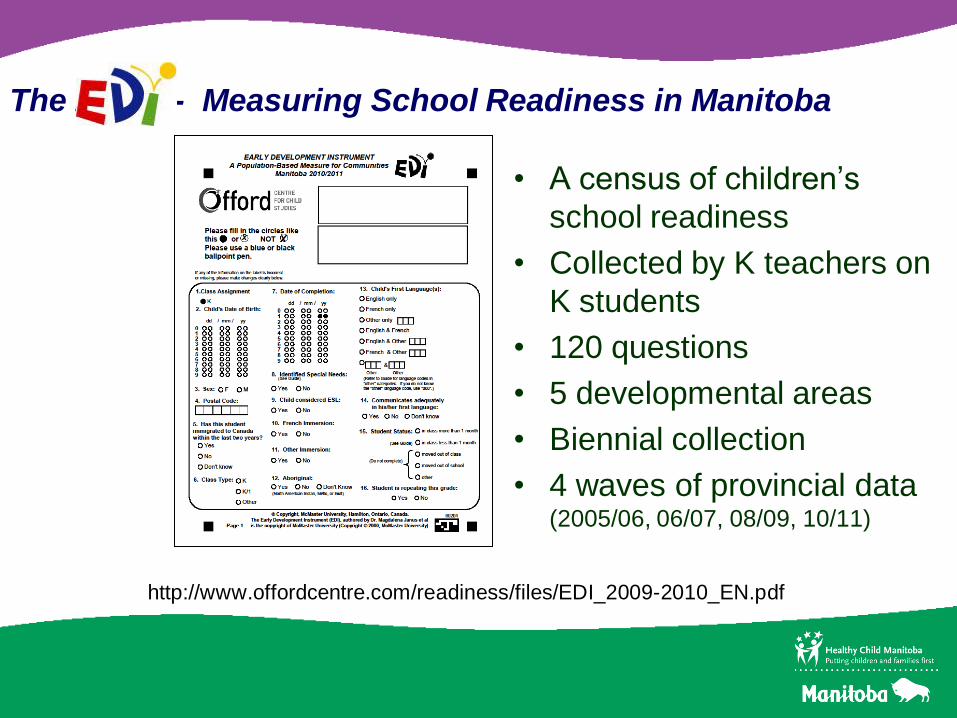
http://www.offordcentre.com/readiness/files/EDI_2009-2010_EN.pdf
The EDI: - Measuring School Readiness in Manitoba
• A census of children’s
school readiness
• Collected by K teachers on
K students
• 120 questions
• 5 developmental areas
• Biennial collection
• 4 waves of provincial data (2005/06, 06/07, 08/09, 10/11)
EDI Background
• A partnership among:
–Healthy Child Manitoba Office
–Manitoba’s 37 School Divisions
–Manitoba Education
–Manitoba’s 26 Parent Child Coalitions
–Offord Centre for Child Studies, McMaster University
• Developed by Drs. Dan Offord and Magdalena Janus at the Offord
Centre for Child Studies in 1998
• Objective - a tool to report on populations of children in different
communities, assess strengths and needs, and predict how children
will do in school
EDI Background
• Collected on a biennial basis within all of Manitoba’s 37 school
divisions (and some independent schools)
• Kindergarten teachers complete the EDI questionnaire on each
Kindergarten student in their classroom
• Parents are informed of the EDI collection and may request to
withdraw their child from the EDI
• It takes a Kindergarten teachers 20 minutes to complete the 180
item questionnaire on each child
• The EDI is collected between February and March which allows the
teacher enough time to get to know each child in the classroom
What does the EDI measure?
• It provides a snapshot of children’s school readiness
as they prepare to begin grade one
• The EDI is intended to measure children’s
school readiness at a group level – it is not an
individual assessment tool
• Readiness for school is influenced by children’s early
years – and the family and community factors that
shape children’s early years
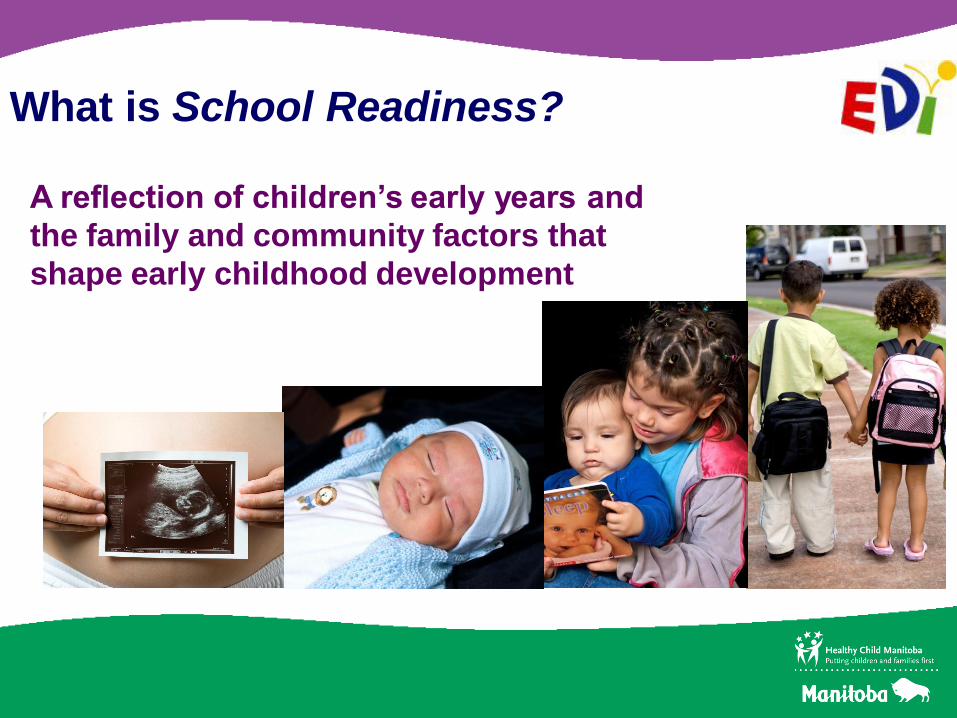
What is School Readiness?
A reflection of children’s early years and
the family and community factors that
shape early childhood development
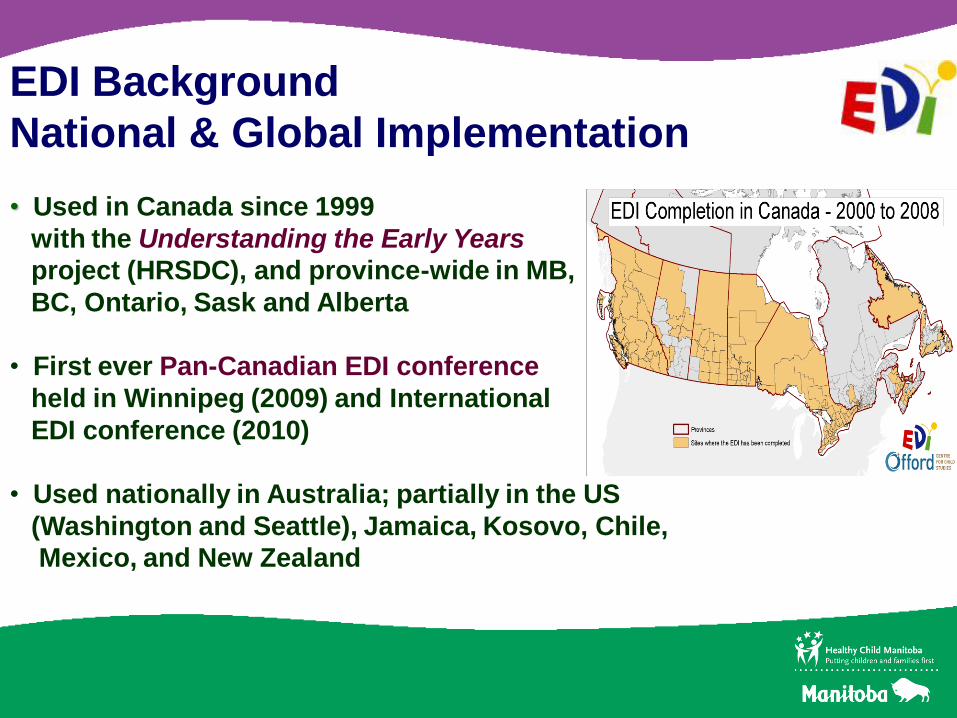
• Used in Canada since 1999
with the Understanding the Early Years
project (HRSDC), and province-wide in MB,
BC, Ontario, Sask and Alberta
• First ever Pan-Canadian EDI conference
held in Winnipeg (2009) and International
EDI conference (2010)
• Used nationally in Australia; partially in the US
(Washington and Seattle), Jamaica, Kosovo, Chile,
Mexico, and New Zealand
EDI Background
National & Global Implementation
EDI Background
• Population-based measurement of children’s readiness for school at
a group level – not an individual assessment tool
• Readiness for school refers to children’s readiness to learn as they
transition from K to grade one
• Readiness for school is influenced by children’s early years – and
the family and community factors that shape children’s early years
• EDI results reflect the strengths and needs of children’s
communities, related to how they prepare children for school
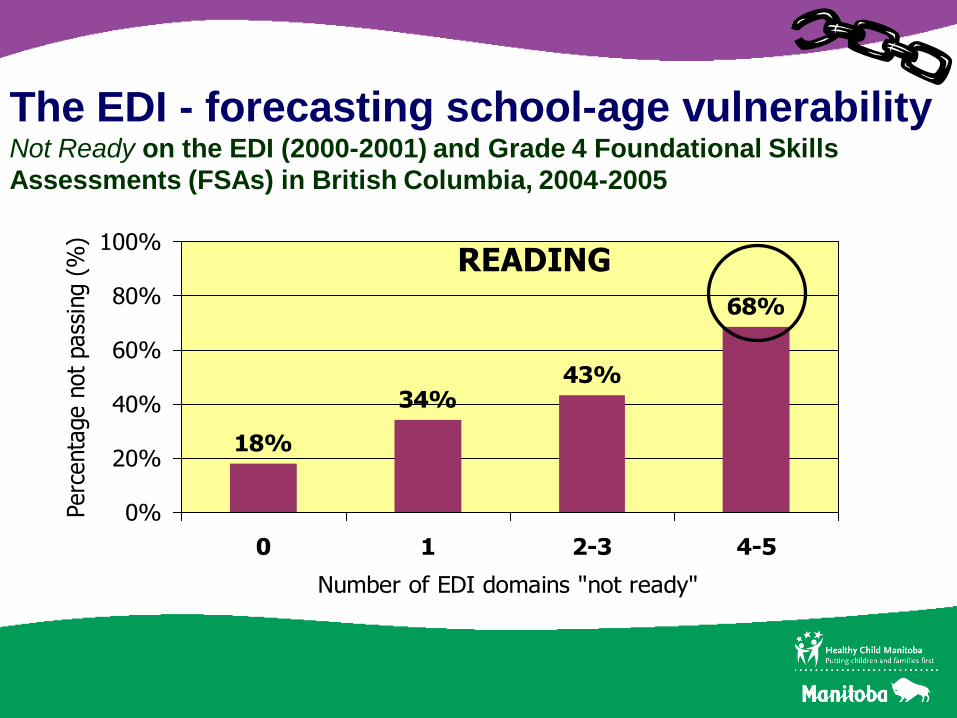
The EDI - forecasting school-age vulnerabilityNot Ready on the EDI (2000-2001) and Grade 4 Foundational Skills
Assessments (FSAs) in British Columbia, 2004-2005
18%
34%43%
68%
0%
20%
40%
60%
80%
100%
0 1 2-3 4-5
Number of EDI domains "not ready"
Perc
enta
ge n
ot
pass
ing (
%)
READING
Conclusion: Prevention is the key!
• ‘Not ready for school’ is closely tied to poor
school performance in later years, and it is very
difficult to reverse this pathway of vulnerability
over the subsequent school years
• Quality investments in early childhood are critical
to ‘leveling the playing field’, so that all children
have the same best start in school
The evidence is clear and strong
• Everything in a newborn’s environment contributes to brain development
• Brain plasticity is selective and time limited
• Language acquisition begins in early infancy
• Quality relationships between infant and caregiver promote secure attachment and brain development
• Genes need nurturing – and predispositions for developmental problems can be positively altered through nurturing caregiver/child relationships
(Early Years 2 – Putting Science into Action)
“The UN Convention on the Rights of the Child
commits Canada and 191 other countries to
doing all they can to help young children thrive.
But how do we know if we are succeeding?
In our world, what gets counted, counts and
the EDI makes early childhood count. Better than
anything else, it tells us if we are fulfilling our
promise to our youngest children.”
Dr. Clyde Hertzman
President, National Council on Early Child Development
The EDI makes early childhood count
Are our children ready?…
Are we ready for our children?
Research tells us that children
who begin school ready to learn
will have future successes in
learning throughout their lives.
So how do we help children get
this best start to school? The
answer is what societies have
known for generations –
it takes a village to raise a child.
Ready parents & families
+
Ready communities & schools
+
Ready governments & leaders
= Ready children!
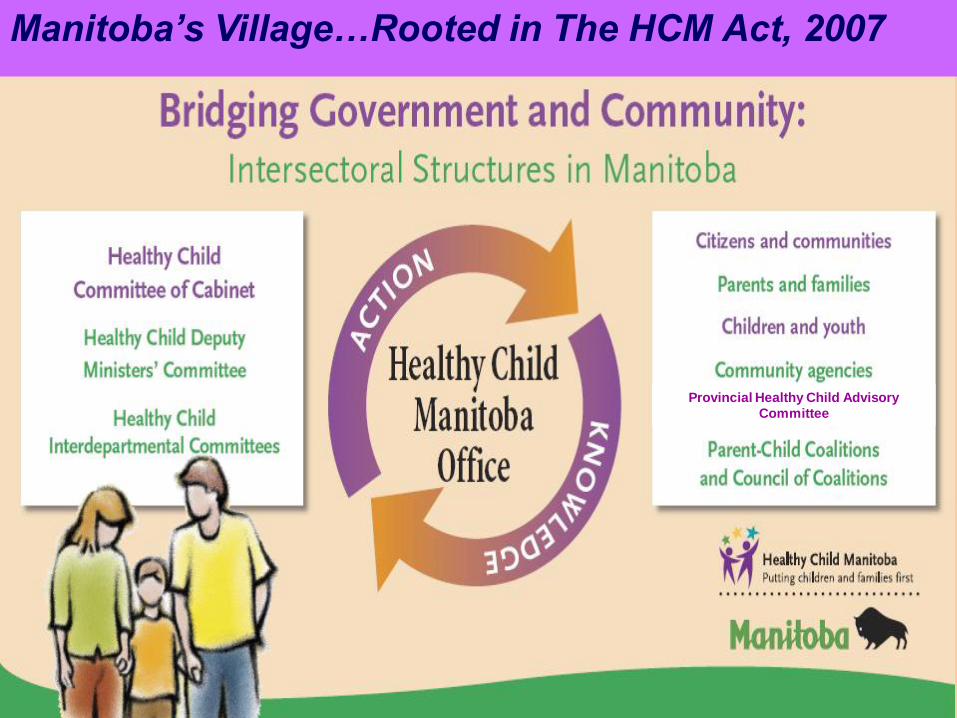
Provincial Healthy Child Advisory
Committee
Manitoba‟s Village…Rooted in The HCM Act, 2007
Healthy Child Manitoba
HCM Vision:
The best possible outcomes for Manitoba’s children
HCM Strategy:
Evidence-based decision making to support healthy
childhood development. The EDI steers, monitors and
evaluates Manitoba’s work in supporting our Strategy
• How are our children doing?
• Are our ECD investments working?
• What could we do better?
There are 5 EDI domains of school readiness:
1. Physical Health & Well-being
2. Social Competence
3. Emotional Maturity
4. Language & Thinking Skills
5. Communication Skills & General Knowledge
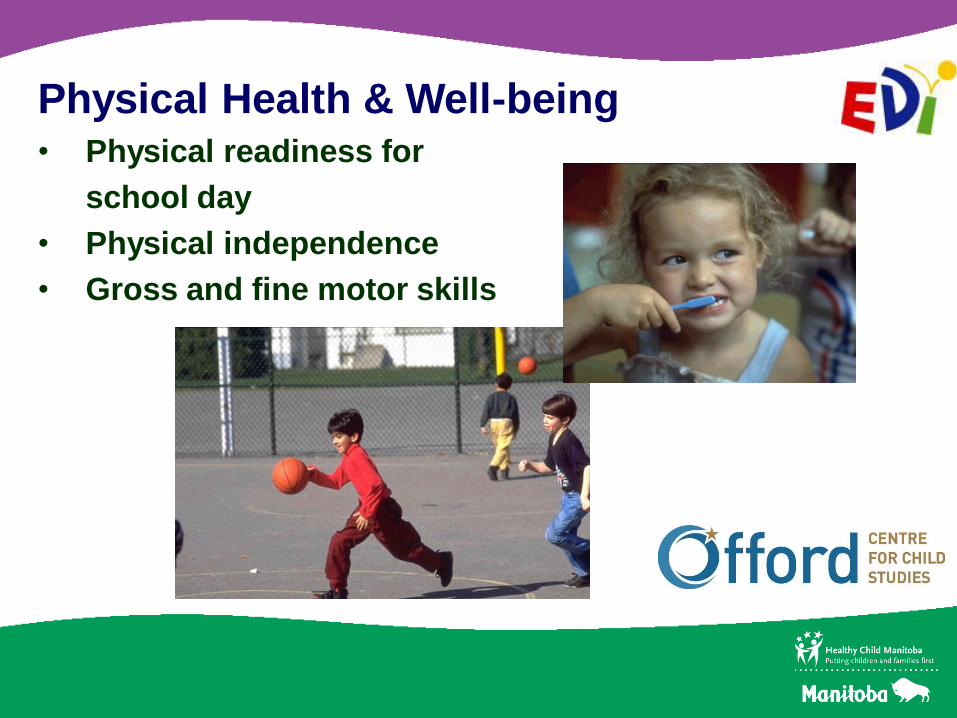
Physical Health & Well-being• Physical readiness for
school day
• Physical independence
• Gross and fine motor skills
Social Competence• Overall social competence
• Responsibility and respect
• Approaches to learning
• Readiness to explore
new things
Emotional Maturity• Prosocial and helping
behaviour
• Anxious and fearful
behaviour
• Aggressive behaviour
• Hyperactivity and
inattention
Language & Thinking Skills• Basic Literacy
• Interest & Memory
• Complex literacy
• Basic Numeracy
Communication Skills & General Knowledge
• Communicates with adults and peers
What Do our School Readiness Data tell us?
Provincial EDI Data: 2005-06, 2006-07 and 2008-09
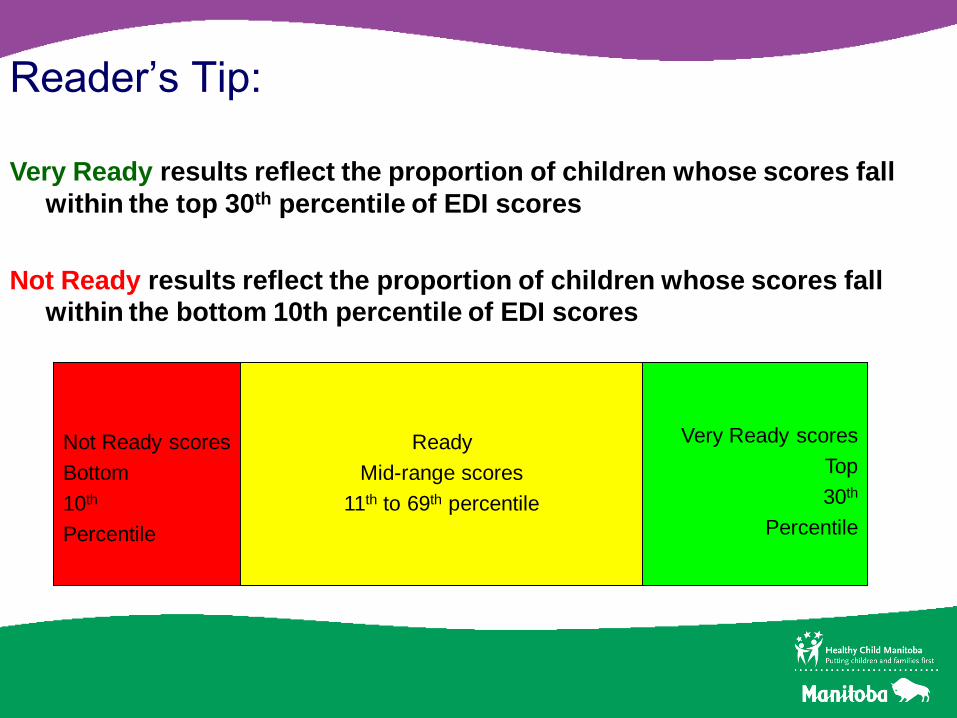
Very Ready results reflect the proportion of children whose scores fall
within the top 30th percentile of EDI scores
Not Ready results reflect the proportion of children whose scores fall
within the bottom 10th percentile of EDI scores
Very Ready scores
Top
30th
Percentile
Not Ready scores
Bottom
10th
Percentile
Ready
Mid-range scores
11th to 69th percentile
Reader’s Tip:
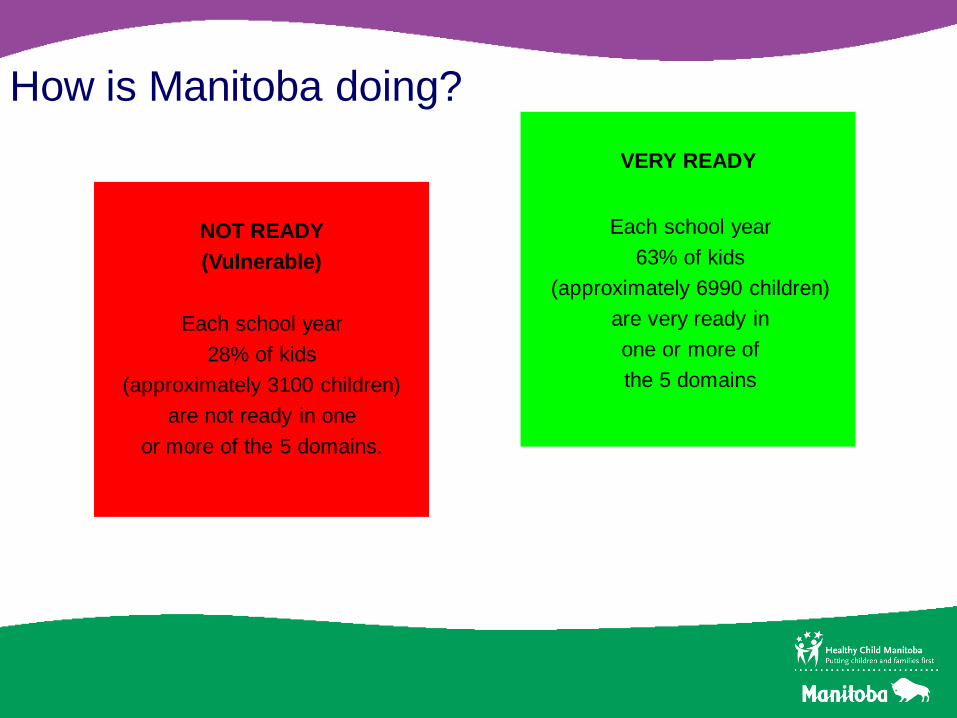
How is Manitoba doing?
VERY READY
NOT READY
(Vulnerable)
Each school year
63% of kids
(approximately 6990 children)
are very ready in
one or more of
the 5 domains
Each school year
28% of kids
(approximately 3100 children)
are not ready in one
or more of the 5 domains.
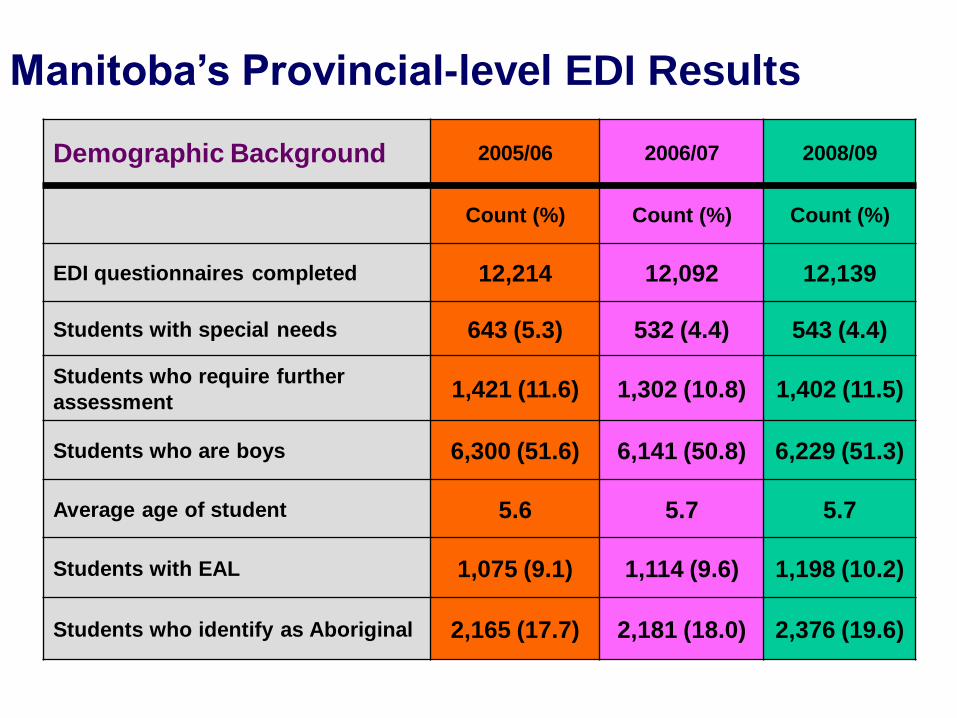
Manitoba’s Provincial-level EDI Results
Demographic Background 2005/06 2006/07 2008/09
Count (%) Count (%) Count (%)
EDI questionnaires completed 12,214 12,092 12,139
Students with special needs 643 (5.3) 532 (4.4) 543 (4.4)
Students who require further
assessment1,421 (11.6) 1,302 (10.8) 1,402 (11.5)
Students who are boys 6,300 (51.6) 6,141 (50.8) 6,229 (51.3)
Average age of student 5.6 5.7 5.7
Students with EAL 1,075 (9.1) 1,114 (9.6) 1,198 (10.2)
Students who identify as Aboriginal 2,165 (17.7) 2,181 (18.0) 2,376 (19.6)
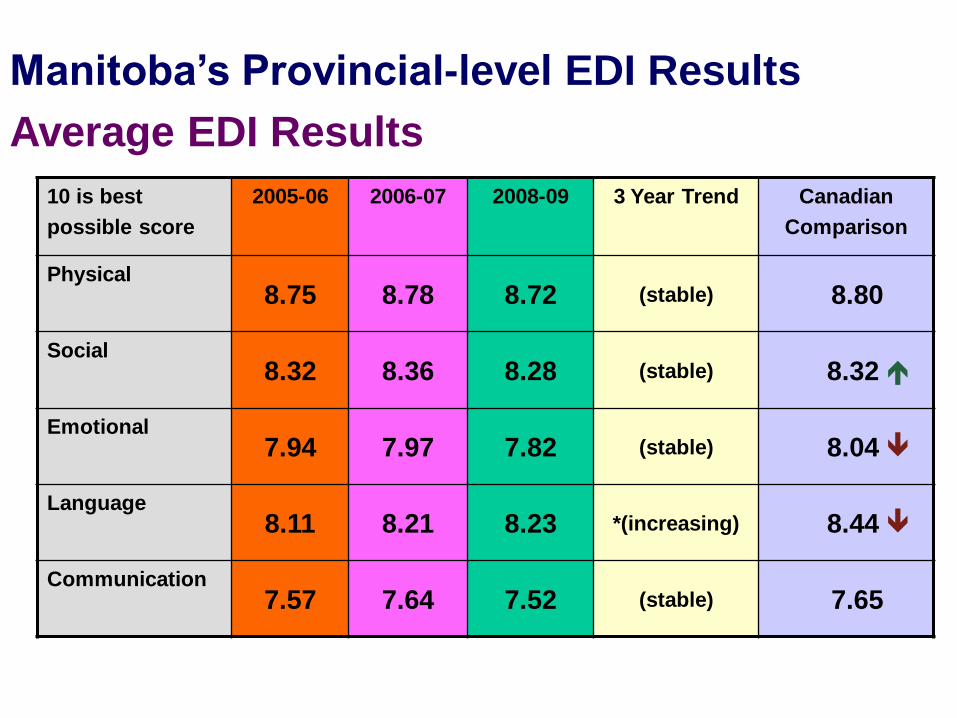
Manitoba’s Provincial-level EDI Results
Average EDI Results
10 is best
possible score
2005-06 2006-07 2008-09 3 Year Trend Canadian
Comparison
Physical8.75 8.78 8.72 (stable) 8.80
Social8.32 8.36 8.28 (stable) 8.32
Emotional7.94 7.97 7.82 (stable) 8.04
Language8.11 8.21 8.23 *(increasing) 8.44
Communication7.57 7.64 7.52 (stable) 7.65
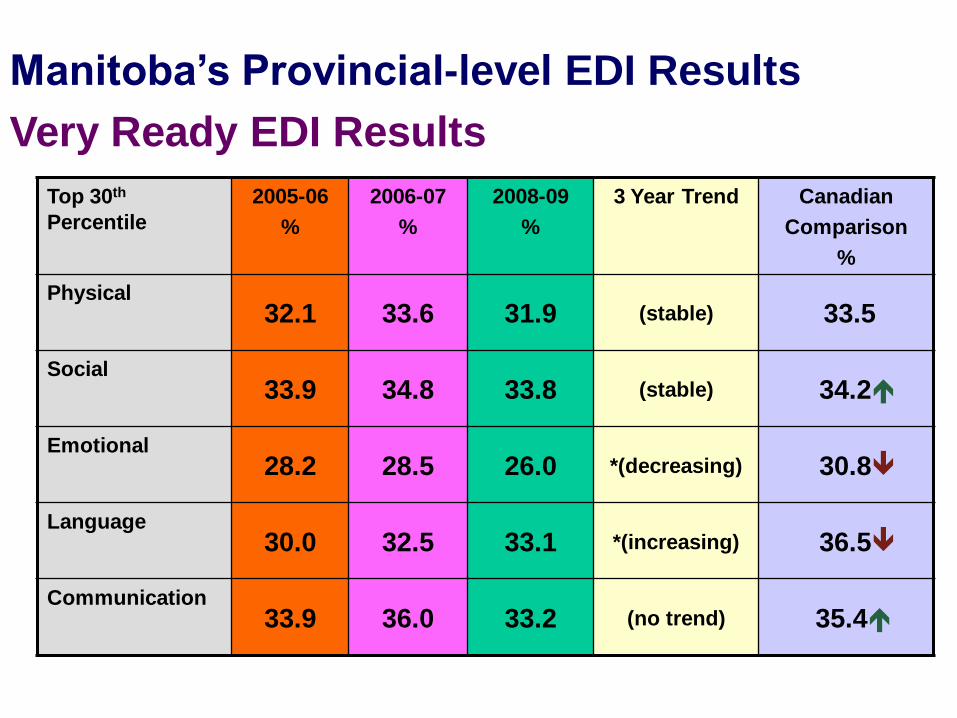
Manitoba’s Provincial-level EDI Results
Very Ready EDI Results
Top 30th
Percentile
2005-06
%
2006-07
%
2008-09
%
3 Year Trend Canadian
Comparison
%
Physical32.1 33.6 31.9 (stable) 33.5
Social33.9 34.8 33.8 (stable) 34.2
Emotional28.2 28.5 26.0 *(decreasing) 30.8
Language30.0 32.5 33.1 *(increasing) 36.5
Communication33.9 36.0 33.2 (no trend) 35.4
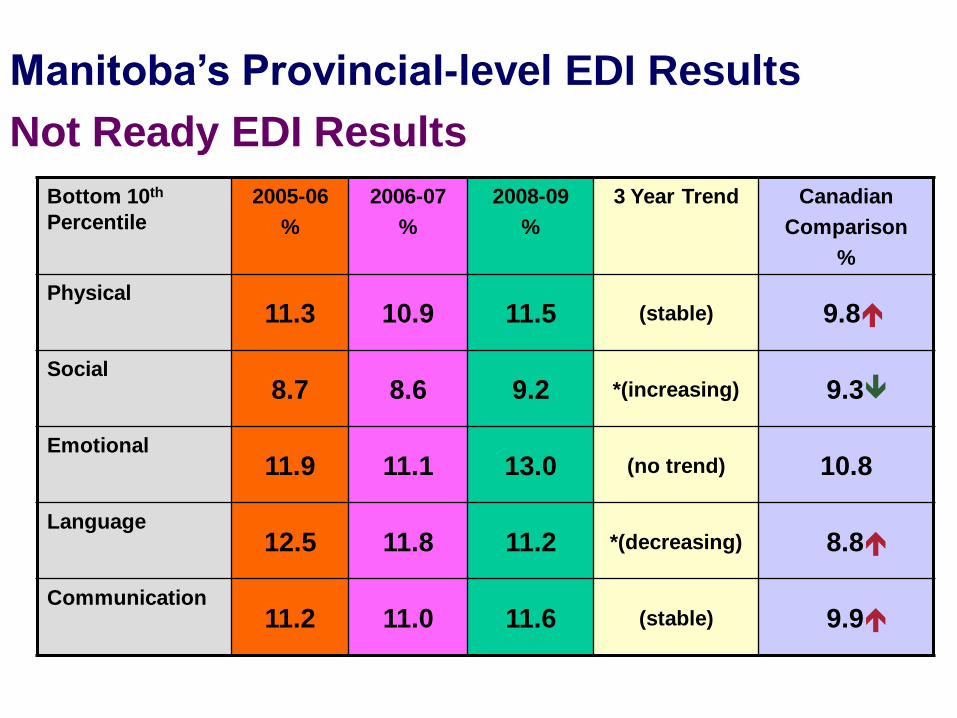
Manitoba’s Provincial-level EDI Results
Not Ready EDI Results
Bottom 10th
Percentile
2005-06
%
2006-07
%
2008-09
%
3 Year Trend Canadian
Comparison
%
Physical11.3 10.9 11.5 (stable) 9.8
Social8.7 8.6 9.2 *(increasing) 9.3
Emotional11.9 11.1 13.0 (no trend) 10.8
Language12.5 11.8 11.2 *(decreasing) 8.8
Communication11.2 11.0 11.6 (stable) 9.9
So what do we do?
Dig deeper!
Within each of the 5 domains, there are
sub-domains. What proportion of children
are vulnerable within each sub-domain?
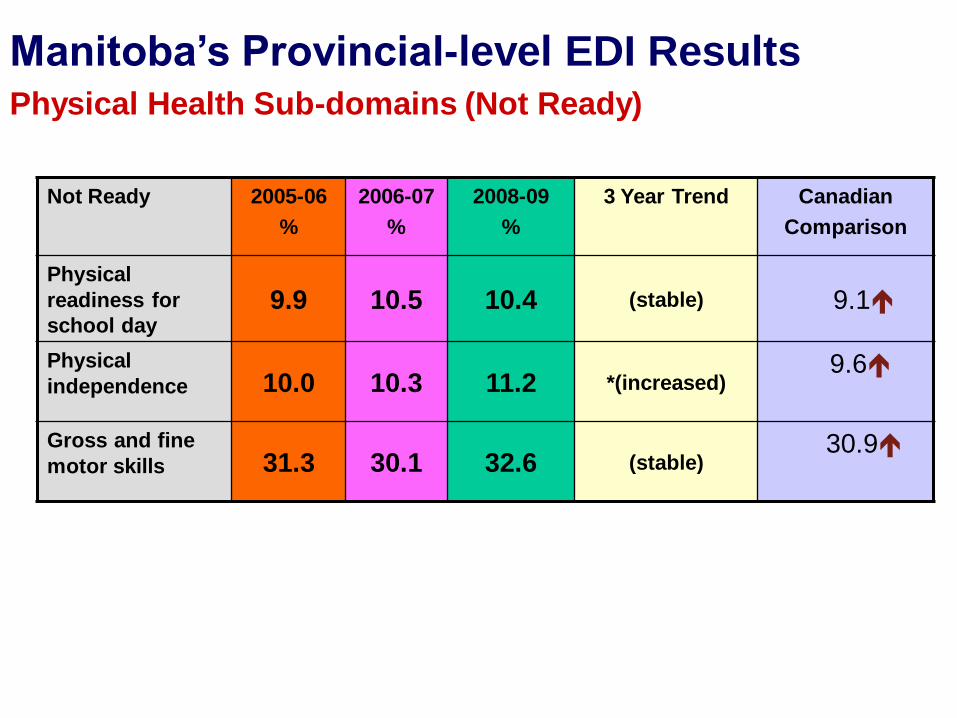
Manitoba’s Provincial-level EDI ResultsPhysical Health Sub-domains (Not Ready)
Not Ready 2005-06
%
2006-07
%
2008-09
%
3 Year Trend Canadian
Comparison
Physical
readiness for
school day9.9 10.5 10.4 (stable) 9.1
Physical
independence 10.0 10.3 11.2 *(increased)9.6
Gross and fine
motor skills 31.3 30.1 32.6 (stable)30.9
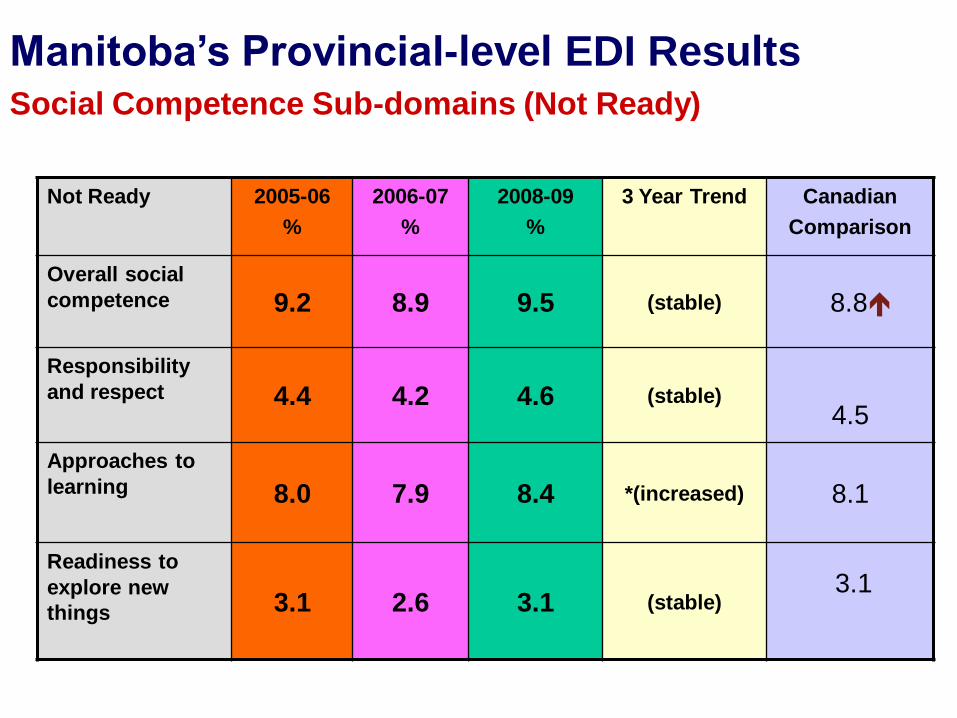
Manitoba’s Provincial-level EDI ResultsSocial Competence Sub-domains (Not Ready)
Not Ready 2005-06
%
2006-07
%
2008-09
%
3 Year Trend Canadian
Comparison
Overall social
competence 9.2 8.9 9.5 (stable) 8.8
Responsibility
and respect 4.4 4.2 4.6 (stable)4.5
Approaches to
learning 8.0 7.9 8.4 *(increased) 8.1
Readiness to
explore new
things 3.1 2.6 3.1 (stable)3.1
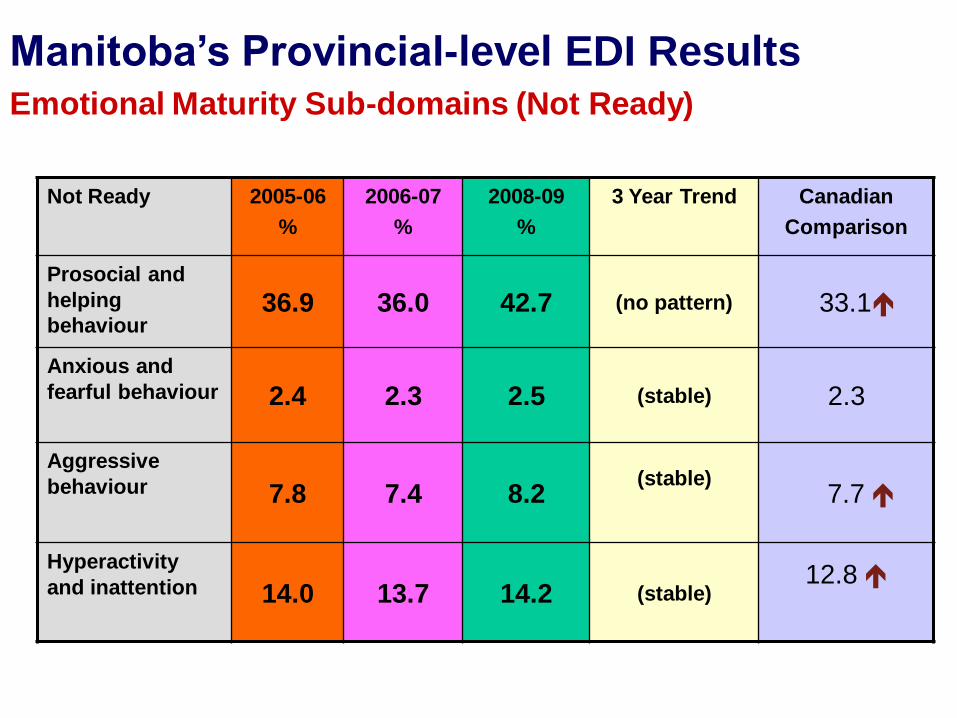
Manitoba’s Provincial-level EDI ResultsEmotional Maturity Sub-domains (Not Ready)
Not Ready 2005-06
%
2006-07
%
2008-09
%
3 Year Trend Canadian
Comparison
Prosocial and
helping
behaviour36.9 36.0 42.7 (no pattern) 33.1
Anxious and
fearful behaviour 2.4 2.3 2.5 (stable) 2.3
Aggressive
behaviour 7.8 7.4 8.2(stable)
7.7
Hyperactivity
and inattention 14.0 13.7 14.2 (stable)12.8
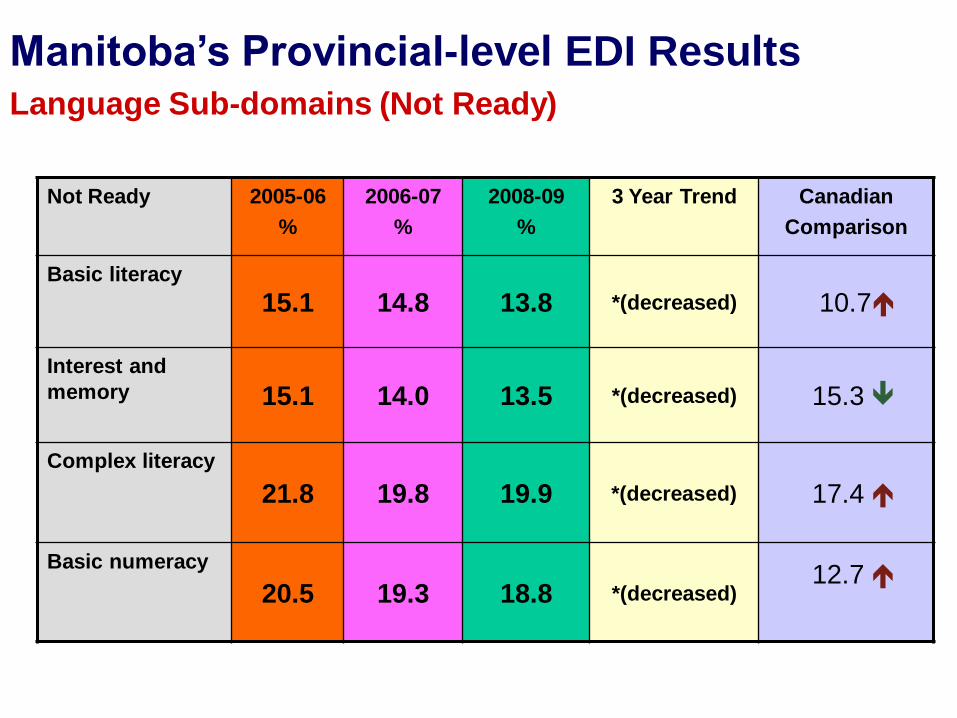
Manitoba’s Provincial-level EDI ResultsLanguage Sub-domains (Not Ready)
Not Ready 2005-06
%
2006-07
%
2008-09
%
3 Year Trend Canadian
Comparison
Basic literacy
15.1 14.8 13.8 *(decreased) 10.7
Interest and
memory 15.1 14.0 13.5 *(decreased) 15.3
Complex literacy
21.8 19.8 19.9 *(decreased) 17.4
Basic numeracy
20.5 19.3 18.8 *(decreased)12.7
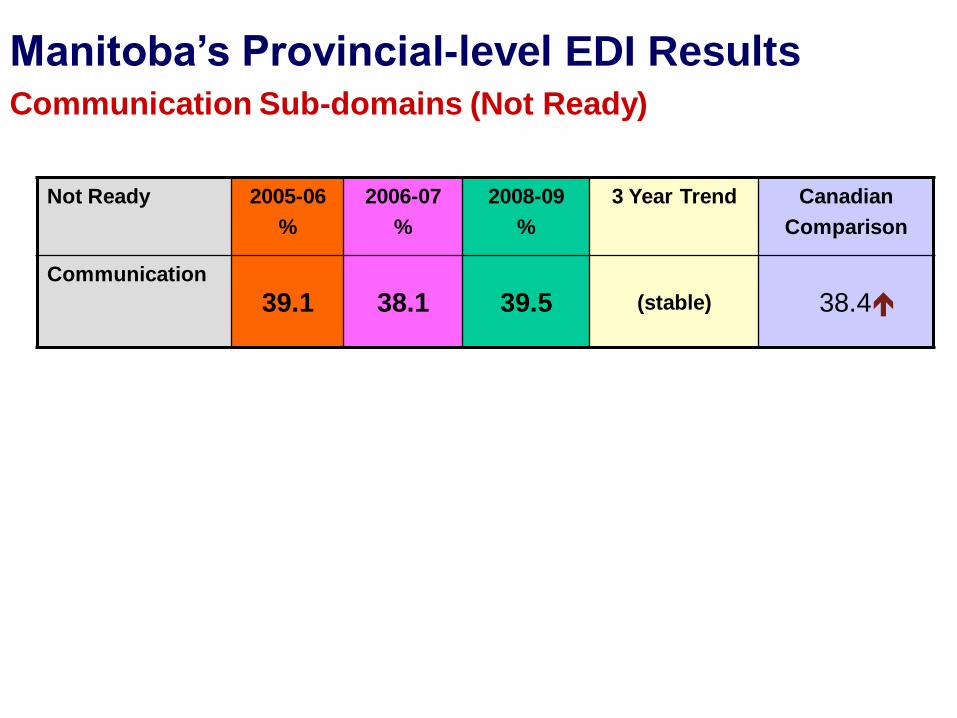
Manitoba’s Provincial-level EDI ResultsCommunication Sub-domains (Not Ready)
Not Ready 2005-06
%
2006-07
%
2008-09
%
3 Year Trend Canadian
Comparison
Communication
39.1 38.1 39.5 (stable) 38.4
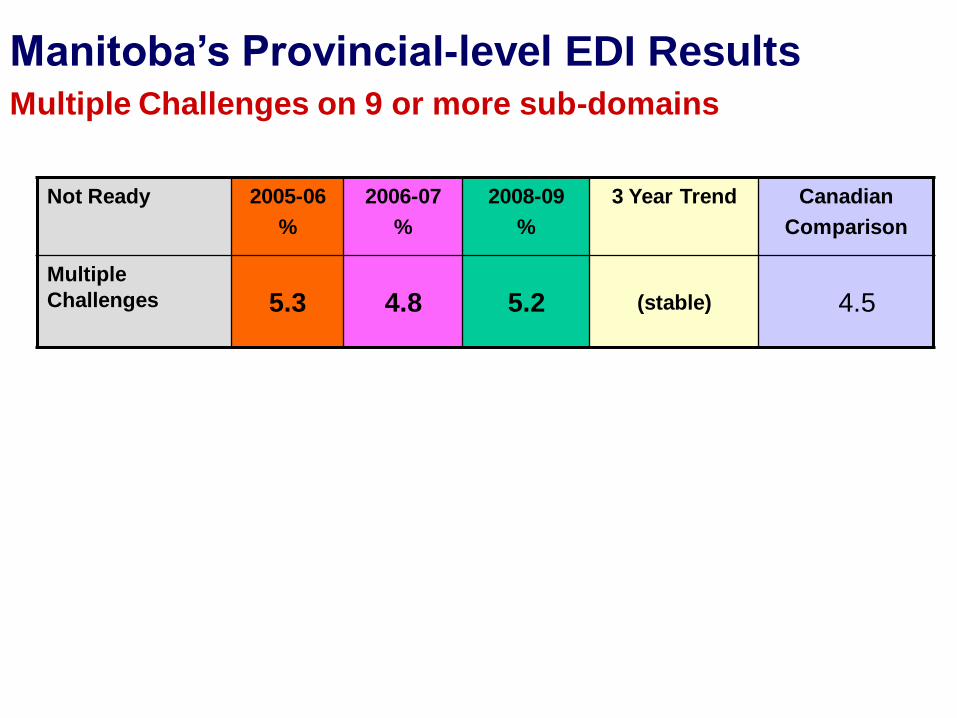
Manitoba’s Provincial-level EDI ResultsMultiple Challenges on 9 or more sub-domains
Not Ready 2005-06
%
2006-07
%
2008-09
%
3 Year Trend Canadian
Comparison
Multiple
Challenges 5.3 4.8 5.2 (stable) 4.5
So what do we do?
Dig deeper!
Group comparison analyses tell us how different
aspects of children’s background (age, gender)
are related to school readiness. Which aspects
are most related to EDI scores?
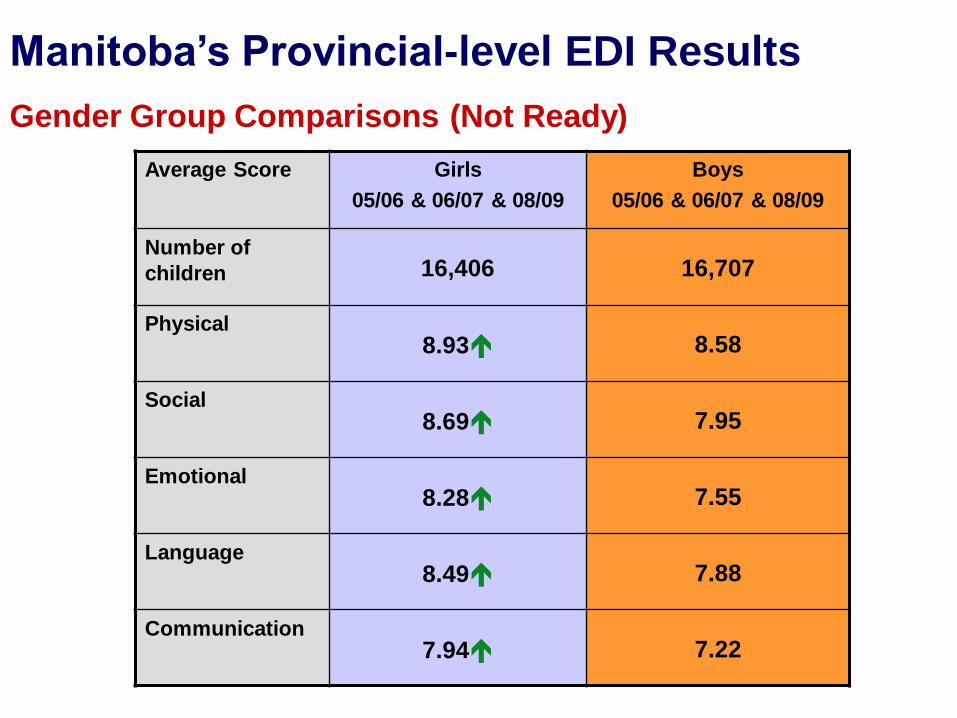
Manitoba’s Provincial-level EDI Results
Gender Group Comparisons (Not Ready)
Average Score Girls
05/06 & 06/07 & 08/09
Boys
05/06 & 06/07 & 08/09
Number of
children 16,406 16,707
Physical8.93 8.58
Social8.69 7.95
Emotional8.28 7.55
Language8.49 7.88
Communication7.94 7.22
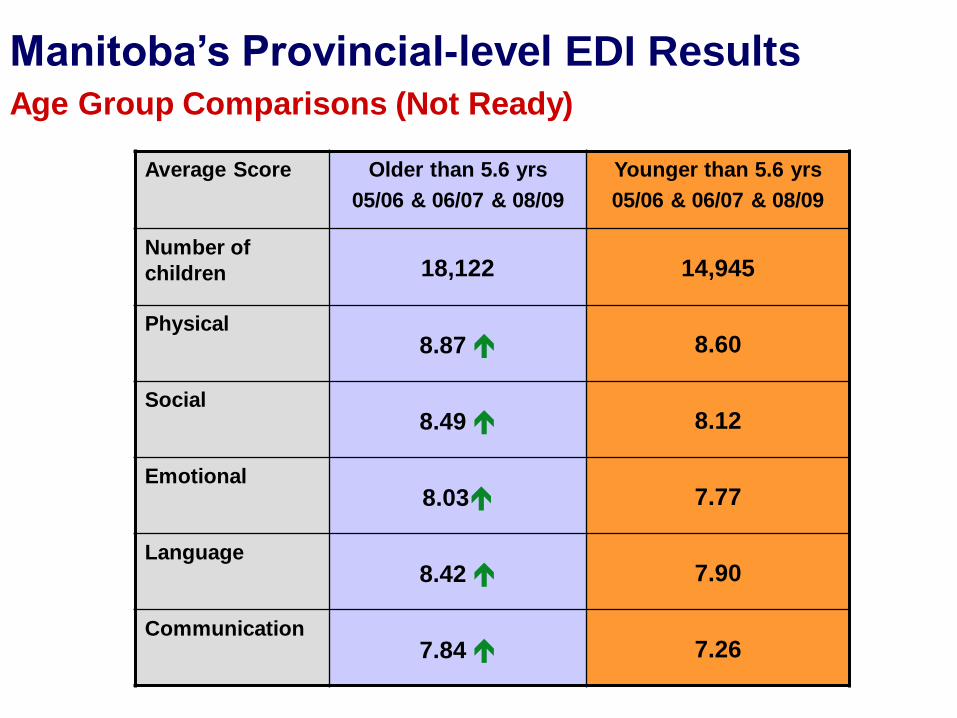
Manitoba’s Provincial-level EDI ResultsAge Group Comparisons (Not Ready)
Average Score Older than 5.6 yrs
05/06 & 06/07 & 08/09
Younger than 5.6 yrs
05/06 & 06/07 & 08/09
Number of
children 18,122 14,945
Physical8.87 8.60
Social8.49 8.12
Emotional8.03 7.77
Language8.42 7.90
Communication7.84 7.26
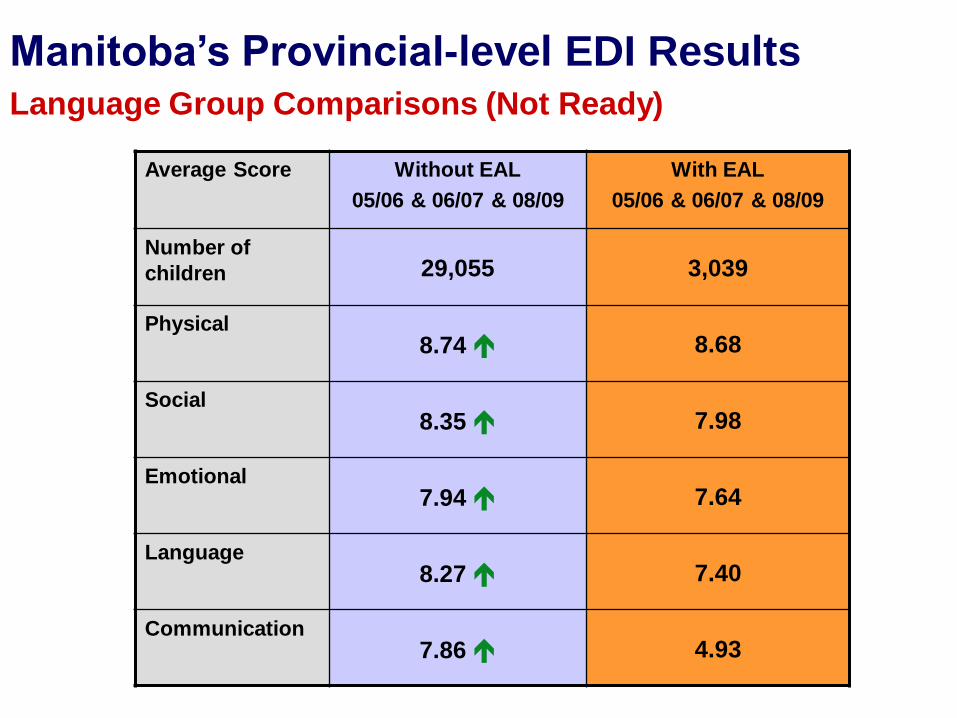
Manitoba’s Provincial-level EDI ResultsLanguage Group Comparisons (Not Ready)
Average Score Without EAL
05/06 & 06/07 & 08/09
With EAL
05/06 & 06/07 & 08/09
Number of
children 29,055 3,039
Physical8.74 8.68
Social8.35 7.98
Emotional7.94 7.64
Language8.27 7.40
Communication7.86 4.93
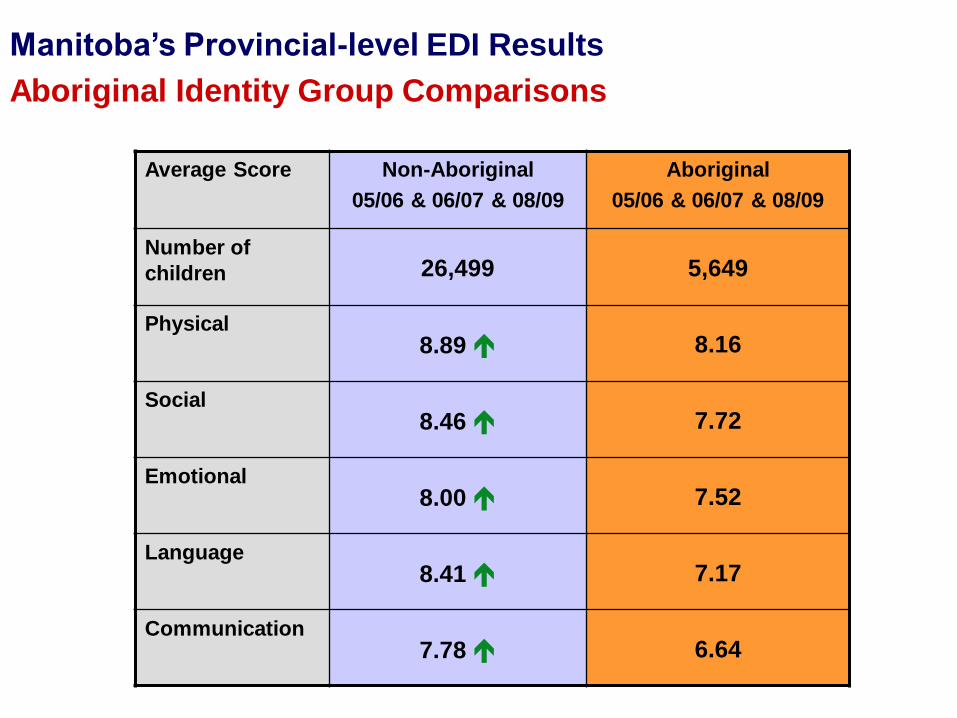
Manitoba’s Provincial-level EDI Results
Aboriginal Identity Group Comparisons
Average Score Non-Aboriginal
05/06 & 06/07 & 08/09
Aboriginal
05/06 & 06/07 & 08/09
Number of
children 26,499 5,649
Physical8.89 8.16
Social8.46 7.72
Emotional8.00 7.52
Language8.41 7.17
Communication7.78 6.64
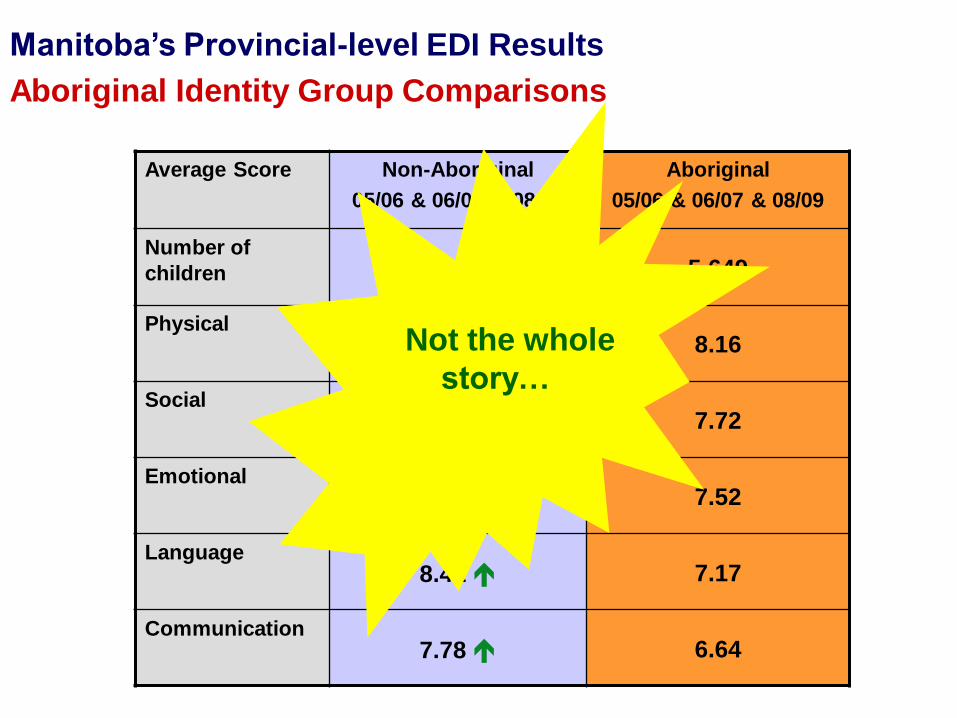
Manitoba’s Provincial-level EDI Results
Aboriginal Identity Group Comparisons
Average Score Non-Aboriginal
05/06 & 06/07 & 08/09
Aboriginal
05/06 & 06/07 & 08/09
Number of
children 26,499 5,649
Physical8.89 8.16
Social8.46 7.72
Emotional8.00 7.52
Language8.41 7.17
Communication7.78 6.64
Not the whole
story…
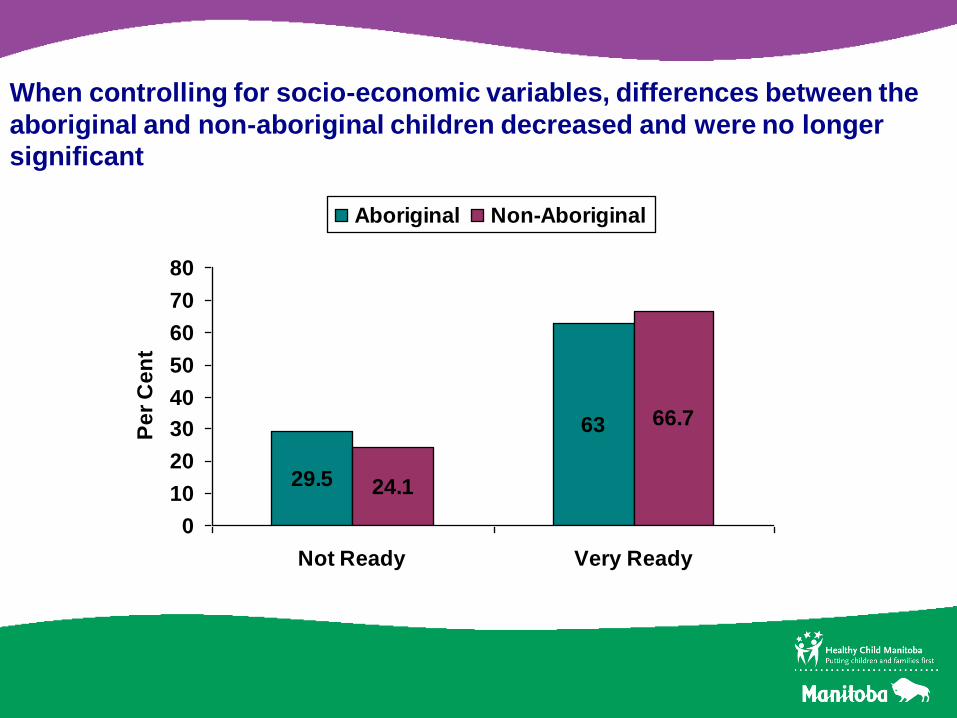
When controlling for socio-economic variables, differences between the
aboriginal and non-aboriginal children decreased and were no longer
significant
29.5
63
24.1
66.7
0
10
20
30
40
50
60
70
80
Not Ready Very Ready
Pe
r C
en
t
Aboriginal Non-Aboriginal
Conclusion:
• EDI results illustrate the strengths and needs of communities related to how they promote the school readiness of their children
• The EDI alone cannot tell the whole story of childhood development – other data must be used in companion with the EDI (asset mapping, school performance data, perinatal data, parent survey data, community-level census data)
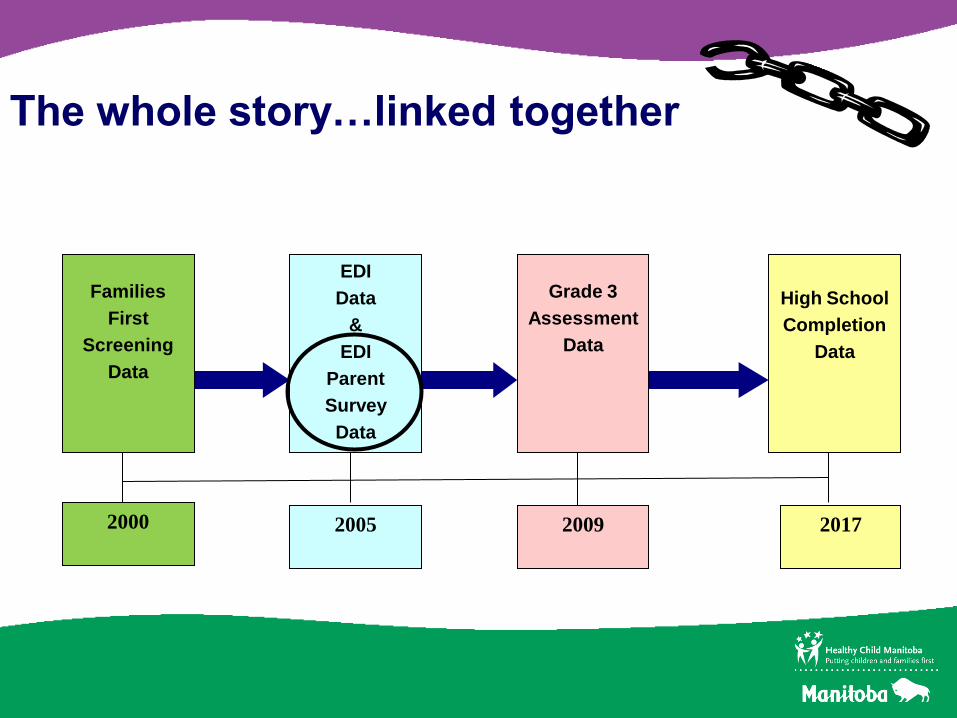
The whole story…linked together
20172005 20092000
EDI
Data
&
EDI
Parent
Survey
Data
Grade 3
Assessment
Data
High School
Completion
Data
Families
First
Screening
Data
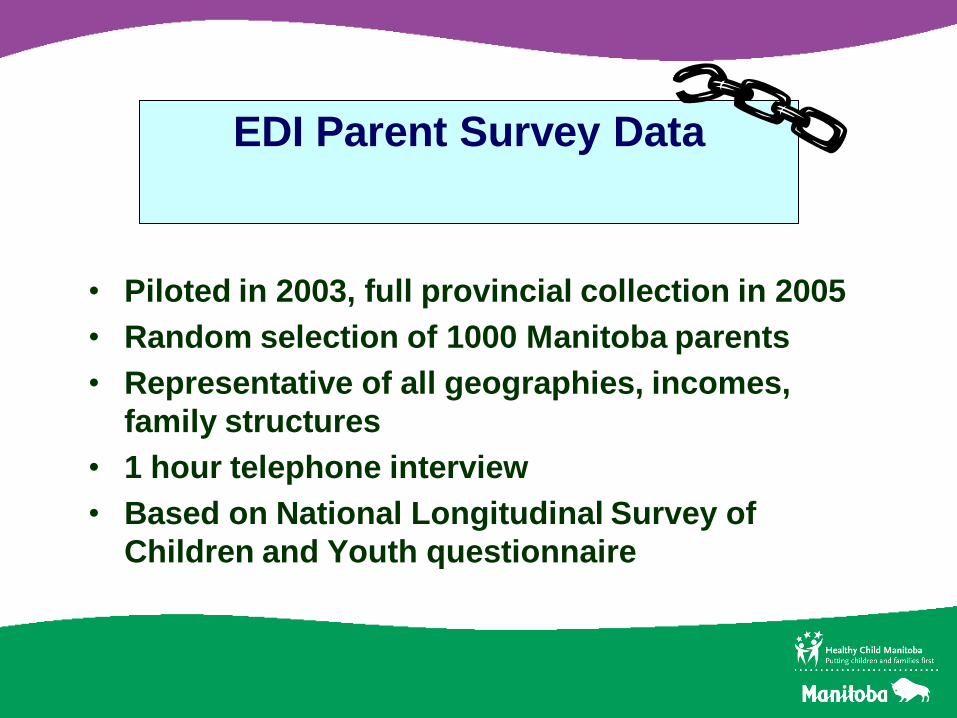
• Piloted in 2003, full provincial collection in 2005
• Random selection of 1000 Manitoba parents
• Representative of all geographies, incomes,
family structures
• 1 hour telephone interview
• Based on National Longitudinal Survey of
Children and Youth questionnaire
EDI Parent Survey Data
• Parenting Factors
• Maternal Mental Health Factors
• Family Factors
• Community Factors
• Socio-economic Factors
• ECD opportunities
EDI Parent Survey Data
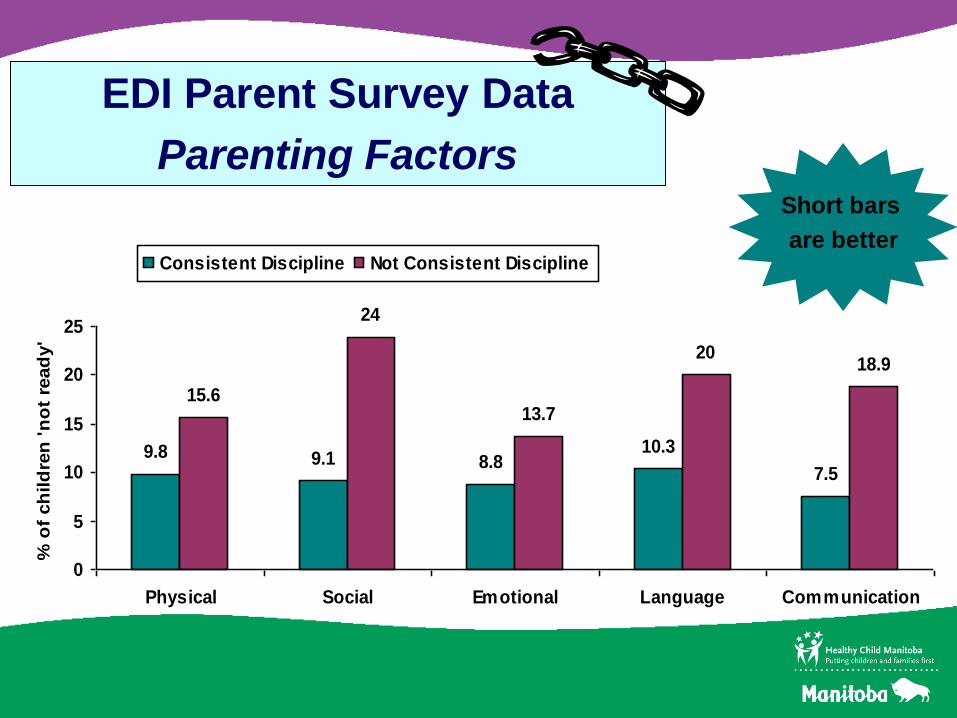
9.8 9.1 8.810.3
7.5
15.6
24
13.7
2018.9
0
5
10
15
20
25
Physical Social Emotional Language Communication
% o
f ch
ild
ren
'n
ot
read
y'
Consistent Discipline Not Consistent Discipline
Short bars
are better
EDI Parent Survey Data
Parenting Factors
Short bars
are better
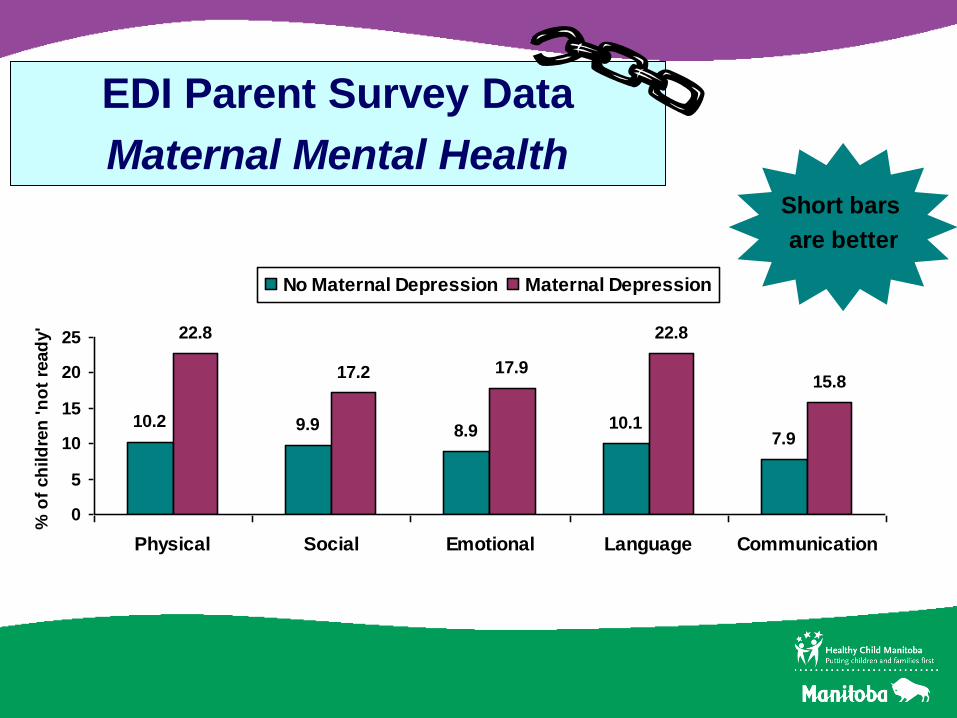
10.2 9.9 8.9 10.17.9
22.8
17.2 17.9
22.8
15.8
0
5
10
15
20
25
Physical Social Emotional Language Communication
% o
f ch
ild
ren
'n
ot
read
y'
No Maternal Depression Maternal Depression
EDI Parent Survey Data
Maternal Mental Health
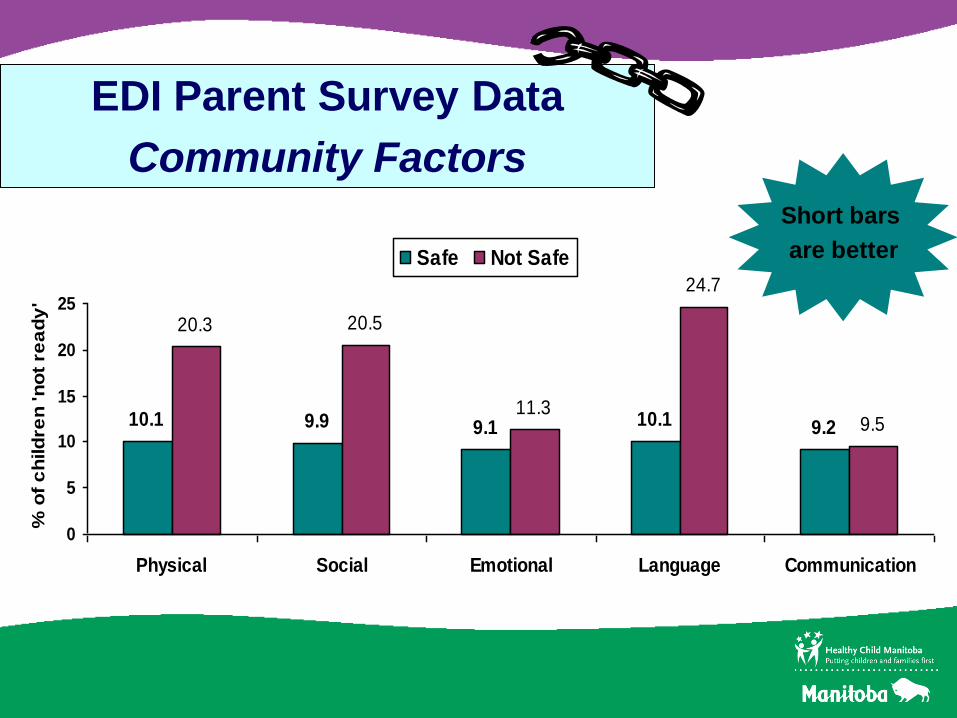
Community Factors
10.1 9.9 9.1 10.1 9.211.3
24.7
9.5
20.520.3
0
5
10
15
20
25
Physical Social Emotional Language Communication
% o
f c
hild
ren
'n
ot
rea
dy
'
Safe Not Safe
Short bars
are better
EDI Parent Survey Data
Community Factors
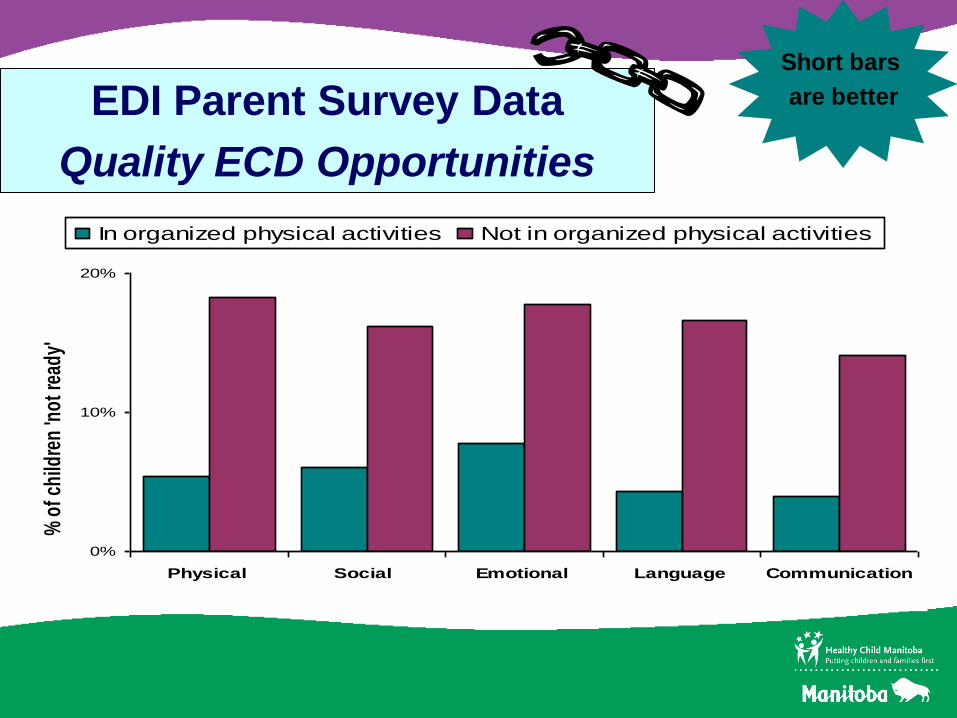
0%
10%
20%
Physical Social Emotional Language Communication
In organized physical activities Not in organized physical activities
% o
f chi
ldre
n 'n
ot re
ady'
Short bars
are betterEDI Parent Survey Data
Quality ECD Opportunities
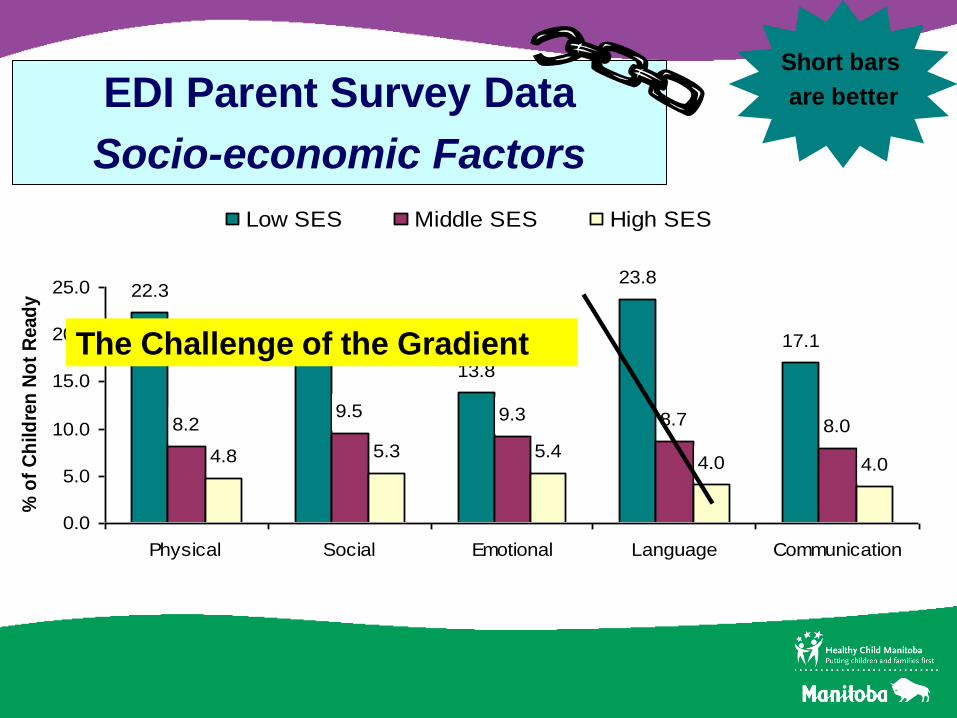
SES
22.3
18.5
23.8
8.7 8.0
4.8 5.3 5.4
17.1
13.8
8.29.5 9.3
4.0 4.0
0.0
5.0
10.0
15.0
20.0
25.0
Physical Social Emotional Language Communication
% o
f C
hild
ren
No
t R
ead
y
Low SES Middle SES High SES
The Challenge of the Gradient
EDI Parent Survey Data
Socio-economic Factors
Short bars
are better

The whole story…linked together
20172005 20092000
EDI
Data
&
EDI
Parent
Survey
Data
Grade 3
Assessment
Data
High School
Completion
Data
Families
First
Screening
Data
What Does our School Performance Data tell us?Data from Manitoba Centre for Health Policy
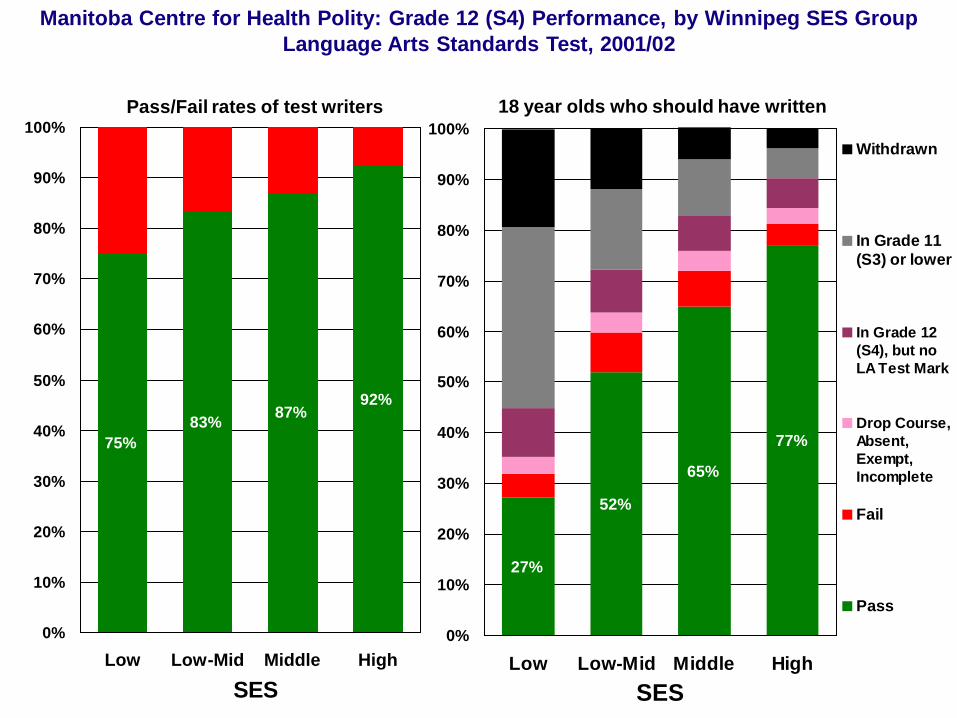
Manitoba Centre for Health Polity: Grade 12 (S4) Performance, by Winnipeg SES Group
Language Arts Standards Test, 2001/02
75%
83%
92%87%
0%
10%
20%
30%
40%
50%
60%
70%
80%
90%
100%
Low Low-Mid Middle High
SES
Pass/Fail rates of test writers 18 year olds who should have written
27%
52%
65%
77%
0%
10%
20%
30%
40%
50%
60%
70%
80%
90%
100%
Low Low-Mid Middle High
SES
Withdrawn
In Grade 11
(S3) or lower
In Grade 12
(S4), but no
LA Test Mark
Drop Course,
Absent,
Exempt,
Incomplete
Fail
Pass
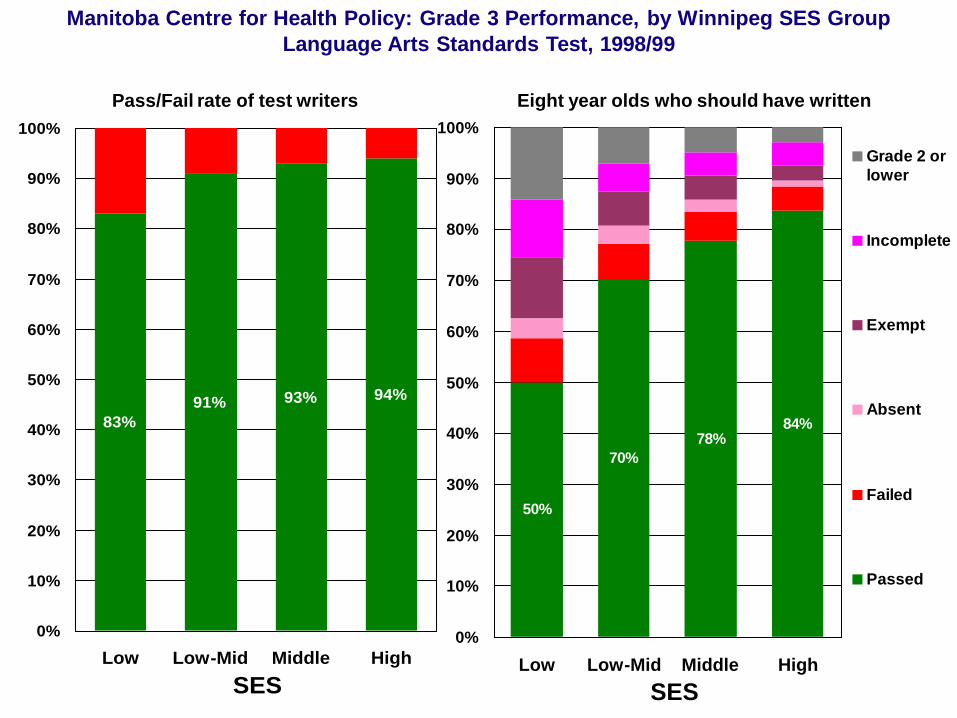
Manitoba Centre for Health Policy: Grade 3 Performance, by Winnipeg SES Group
Language Arts Standards Test, 1998/99
83%
91%94%93%
0%
10%
20%
30%
40%
50%
60%
70%
80%
90%
100%
Low Low-Mid Middle High
SES
Pass/Fail rate of test writers Eight year olds who should have written
50%
70%
78%84%
0%
10%
20%
30%
40%
50%
60%
70%
80%
90%
100%
Low Low-Mid Middle High
SES
Grade 2 or
lower
Incomplete
Exempt
Absent
Failed
Passed
Conclusion:A large proportion of children from low SES families
have learning and educational vulnerabilities. These
vulnerabilities can be detected as early as
Kindergarten (EDI), and continue throughout school,
and throughout life.
SES is associated with social and developmental
outcomes: academic achievement, physical and
mental health, literacy, criminal behaviour and life
expectancy (Early Years 2 – Putting Science into
Action)
However…
Wealth does not equal health!
“It is not wealth, but equality that produces healthy populations. Consistently, countries demonstrating high health and literacy outcomes show a fairly flat socioeconomic gradient. Countries with healthy, more literate populations, invest heavily in young children and their families” (EY2 – Putting Science into Action).
• E.g. Manitoba‟s Families First Program, Perry Preschool Program, Abecedarian Project, Ontario Better Beginnings, Better Futures
Conclusion:
• Children from all SES backgrounds can be vulnerable – we need a mix of both universal and targeted programs
• Children from low SES backgrounds have a far greater risk for vulnerability, but with enhancedquality early learning opportunities, much of this vulnerability can be prevented!
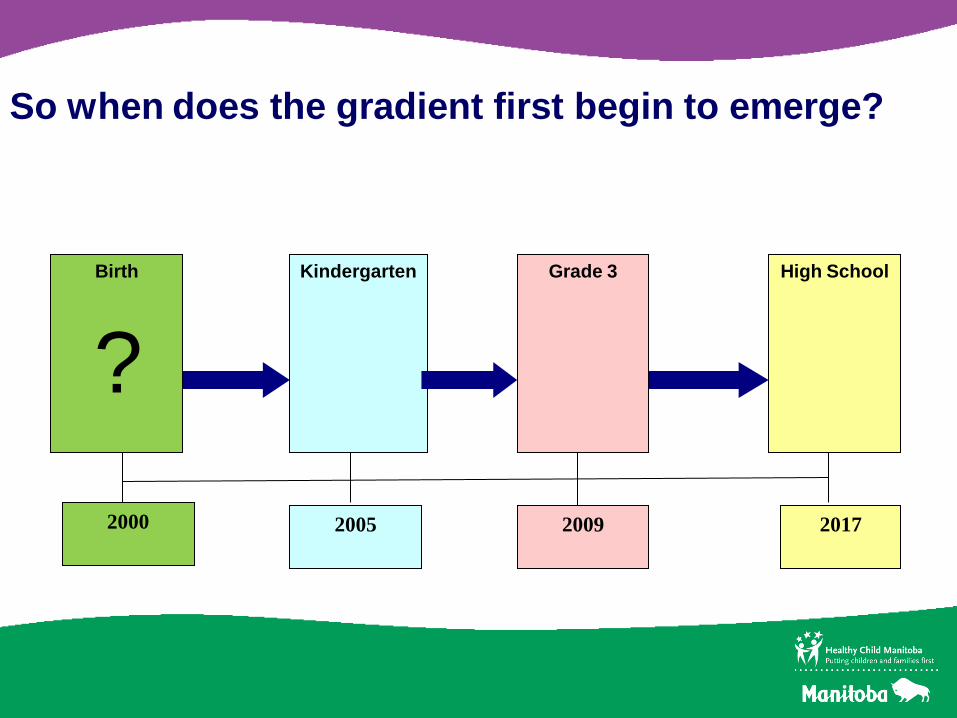
So when does the gradient first begin to emerge?
20172005 20092000
Kindergarten Grade 3 High SchoolBirth
?
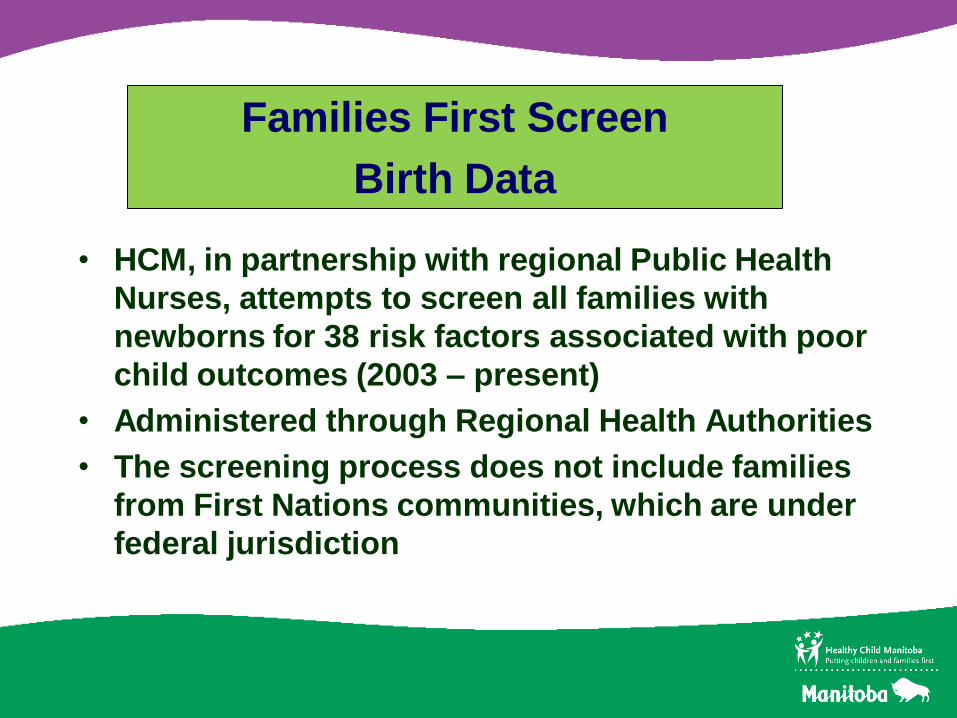
• HCM, in partnership with regional Public Health
Nurses, attempts to screen all families with
newborns for 38 risk factors associated with poor
child outcomes (2003 – present)
• Administered through Regional Health Authorities
• The screening process does not include families
from First Nations communities, which are under
federal jurisdiction
Families First Screen
Birth Data
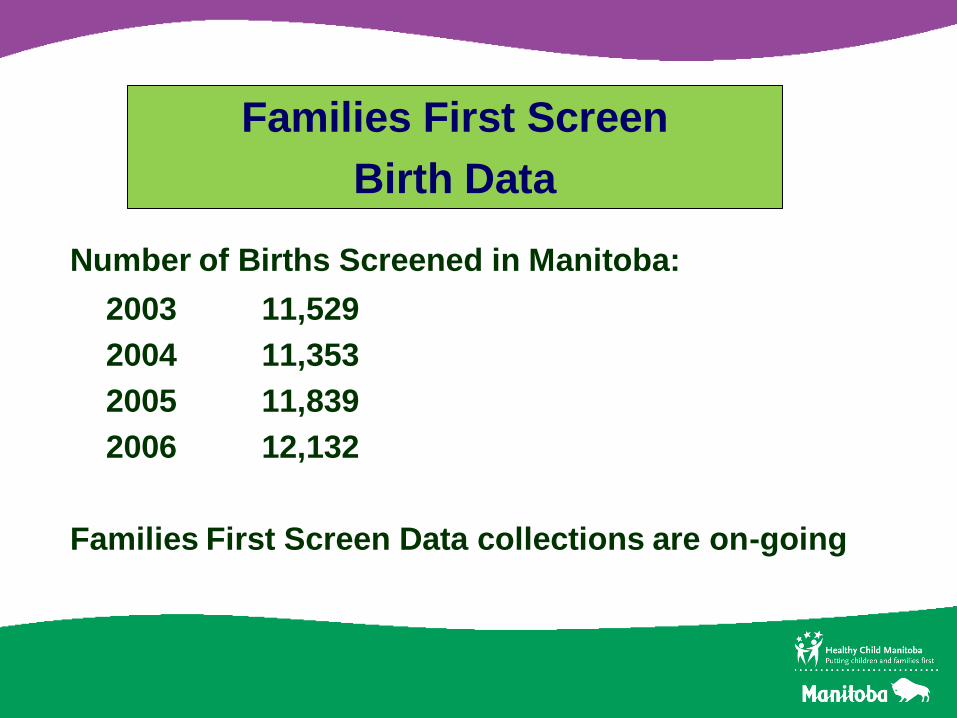
Number of Births Screened in Manitoba:
2003 11,529
2004 11,353
2005 11,839
2006 12,132
Families First Screen Data collections are on-going
Families First Screen
Birth Data
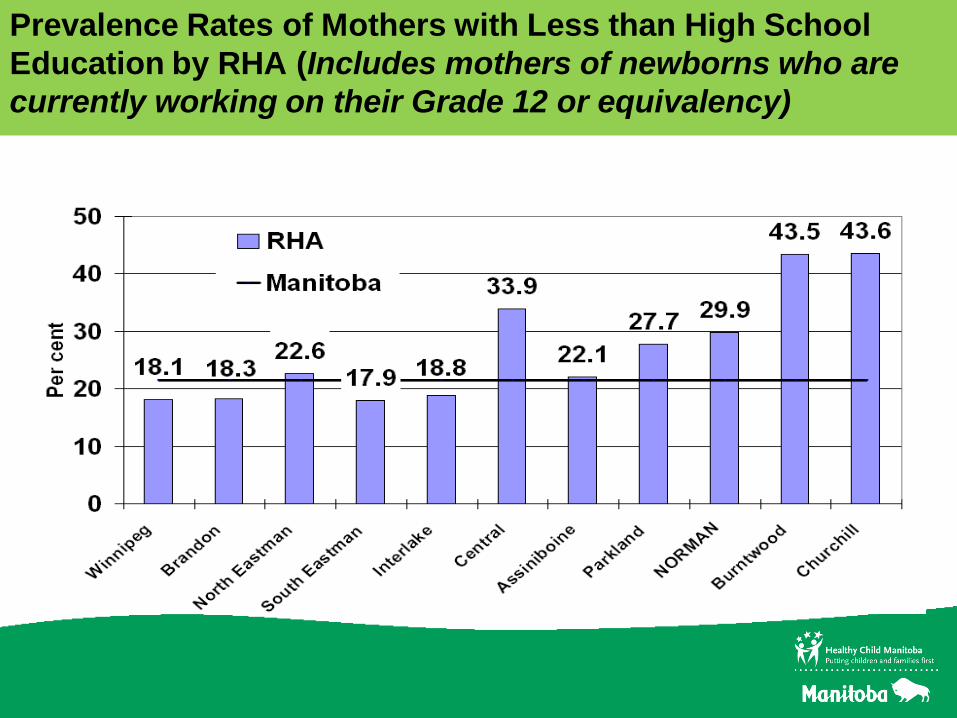
Prevalence Rates of Mothers with Less than High School
Education by RHA (Includes mothers of newborns who are
currently working on their Grade 12 or equivalency)
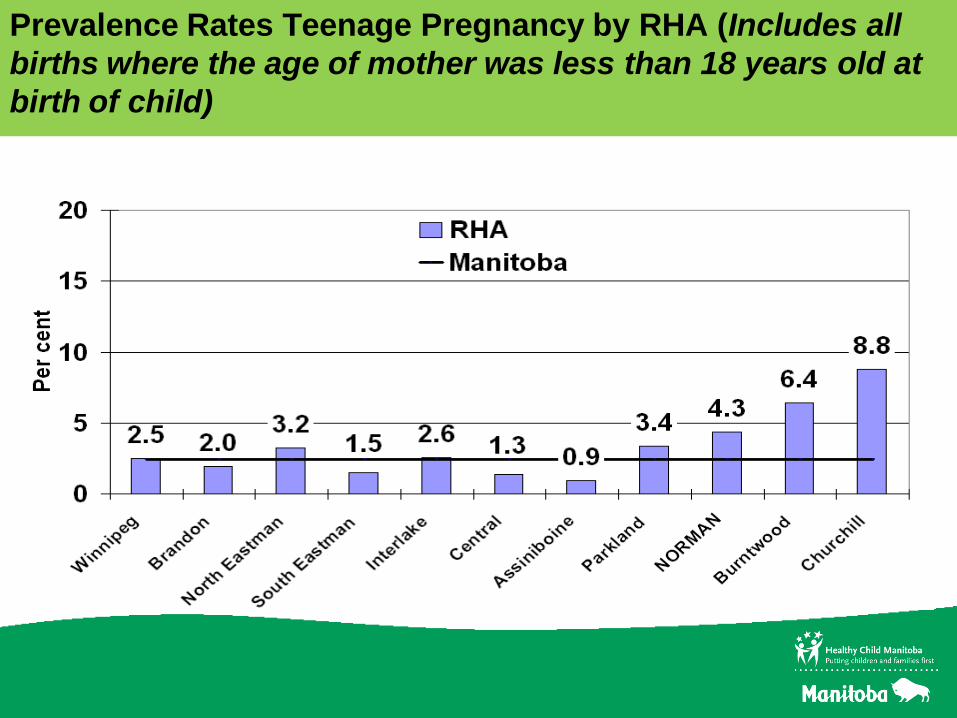
Prevalence Rates Teenage Pregnancy by RHA (Includes all
births where the age of mother was less than 18 years old at
birth of child)
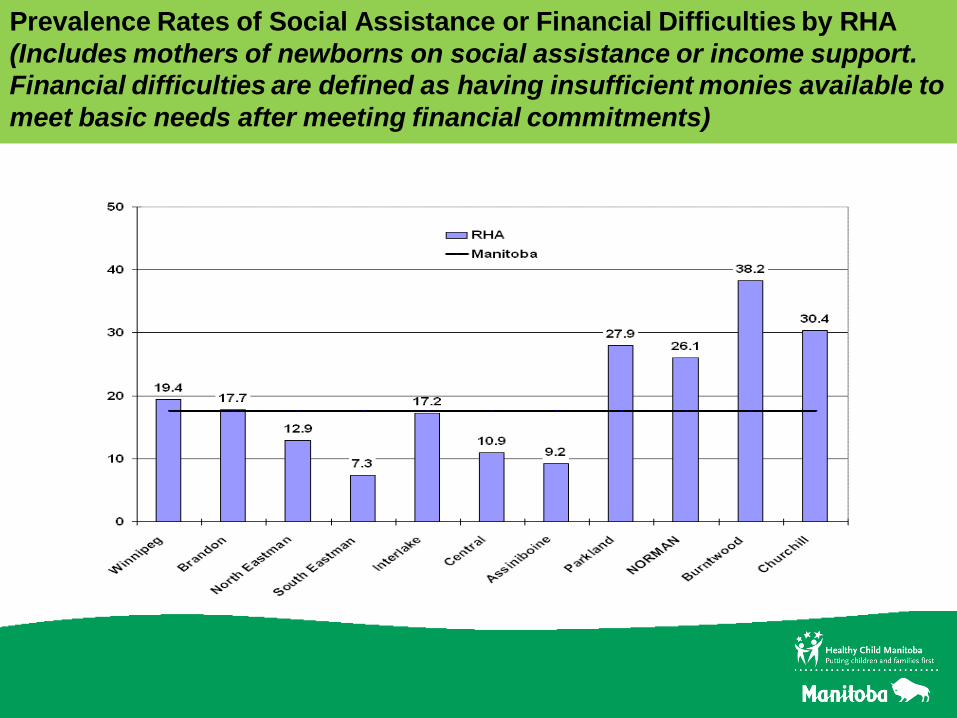
Prevalence Rates of Social Assistance or Financial Difficulties by RHA
(Includes mothers of newborns on social assistance or income support.
Financial difficulties are defined as having insufficient monies available to
meet basic needs after meeting financial commitments)
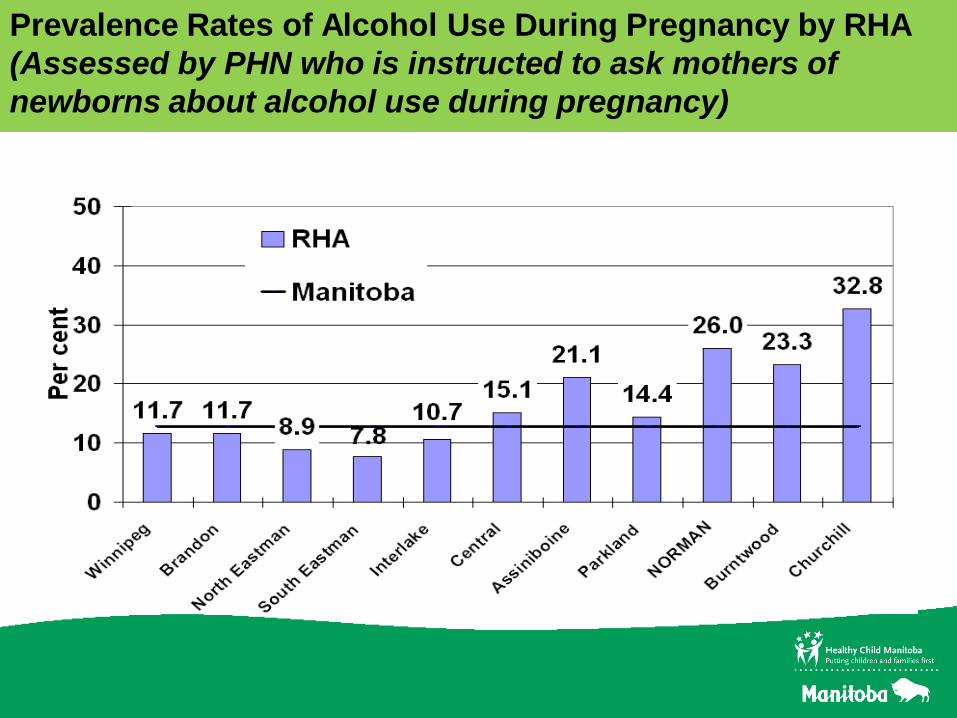
Prevalence Rates of Alcohol Use During Pregnancy by RHA
(Assessed by PHN who is instructed to ask mothers of
newborns about alcohol use during pregnancy)
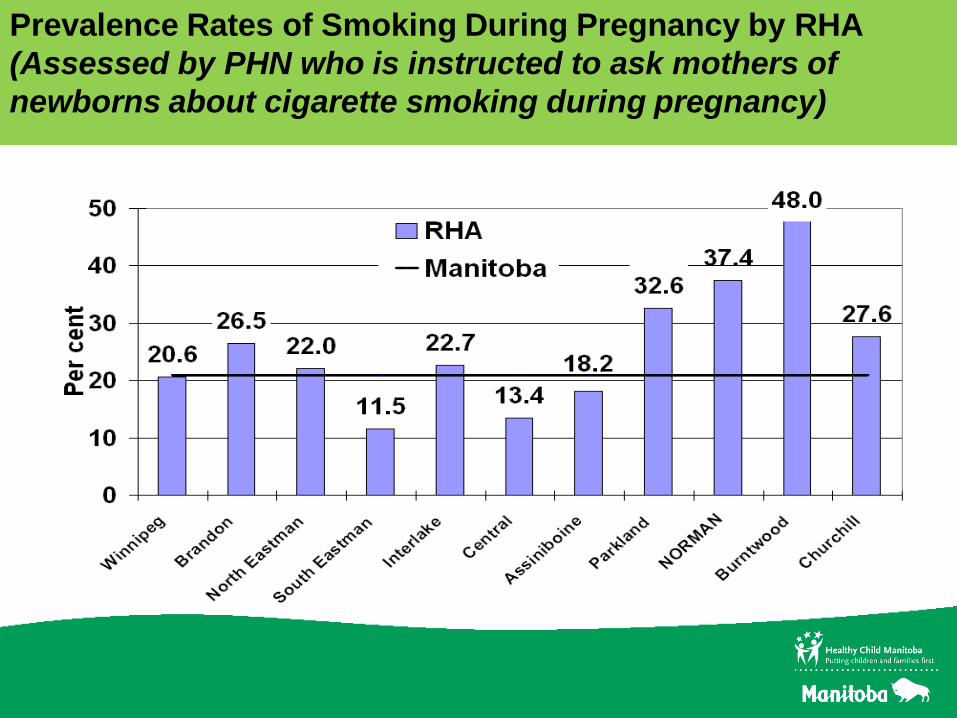
Prevalence Rates of Smoking During Pregnancy by RHA
(Assessed by PHN who is instructed to ask mothers of
newborns about cigarette smoking during pregnancy)
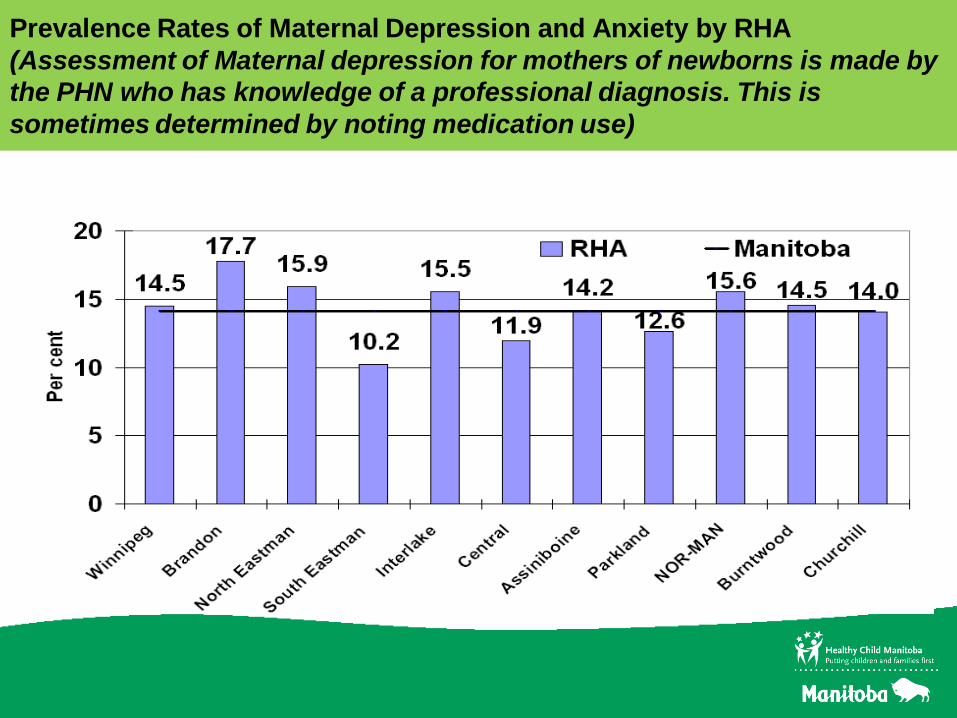
Prevalence Rates of Maternal Depression and Anxiety by RHA
(Assessment of Maternal depression for mothers of newborns is made by
the PHN who has knowledge of a professional diagnosis. This is
sometimes determined by noting medication use)
Conclusion:
The rates of these risk factors point to the need for
interventions that meet the wide spectrum of needs of
Manitoba’s children and families, including…
Mental health services for expectant and new mothers,
financial supports, alcohol abuse and addiction
counseling, domestic relationship counseling, and
outreach services to better connect new parents and
families with their communities

A piece of the story…linked together
20172005 20092000
EDI
Data
Grade 3
Assessment
Data
High School
Completion
Data
Families
First
Screening
Data
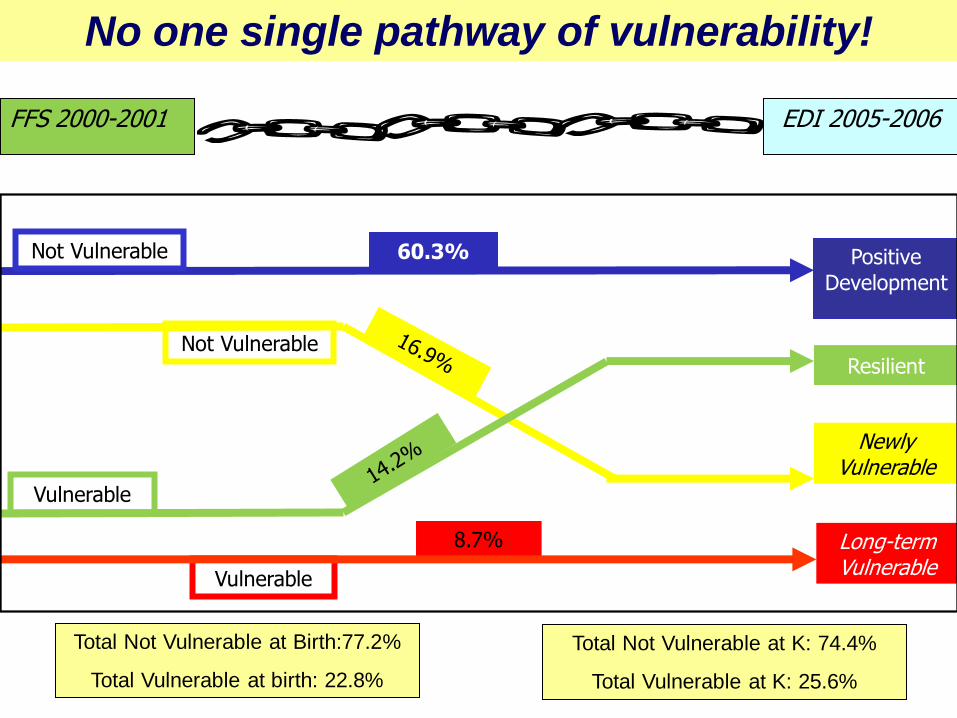
FFS 2000-2001 EDI 2005-2006
Total Not Vulnerable at Birth:77.2%
Total Vulnerable at birth: 22.8%
Not Vulnerable
NewlyVulnerable
Vulnerable
Long-termVulnerable
8.7%
Positive
Development
60.3%Not Vulnerable
Resilient
Vulnerable
Total Not Vulnerable at K: 74.4%
Total Vulnerable at K: 25.6%
No one single pathway of vulnerability!
Conclusion:
There is no one single pathway of
healthy development or vulnerability in
childhood.
So what do we do?
What do we do?
Universal Programs and Services…
• Quality ECD programs and supports for all
parents (including expectant parents), children
and families, that are universal, accessible, and
inclusive (e.g. outreach, referrals/partnerships)
• Integrated service delivery systems (e.g. early
childhood learning and care / public education
system / public health / FSCA / housing)
• Early identification of vulnerability, and
intervention services that meet the broad
spectrum of needs of parents, children and
families (e.g. parenting, mental health, financial,
safety)
• Quality ECD programs that meet the needs of
Aboriginal parents, children and families, both
on-reserve and off-reserve
What do we do?
Targeted Programs and Services…
• Child-centered decision-making and policy development, inter-governmental collaboration (e.g. Healthy Child Manitoba, Healthy Child Committee of Cabinet, Healthy Child Deputy Minister’s Committee of Cabinet)
• An established role for community stakeholders in child-centered decision-making (e.g. HCM Act, Parent Child Coalitions, Provincial Healthy Child Advisory Committee)
• Equitable investments in ECD
What do we do?
Children first…
All children need:
• Positive parenting and consistent discipline
• Positive family functioning
• Safe and supportive communities
• Quality early childhood opportunities
• Financial stability
• Responsive governments and leaders
What do we do?
It takes a village…
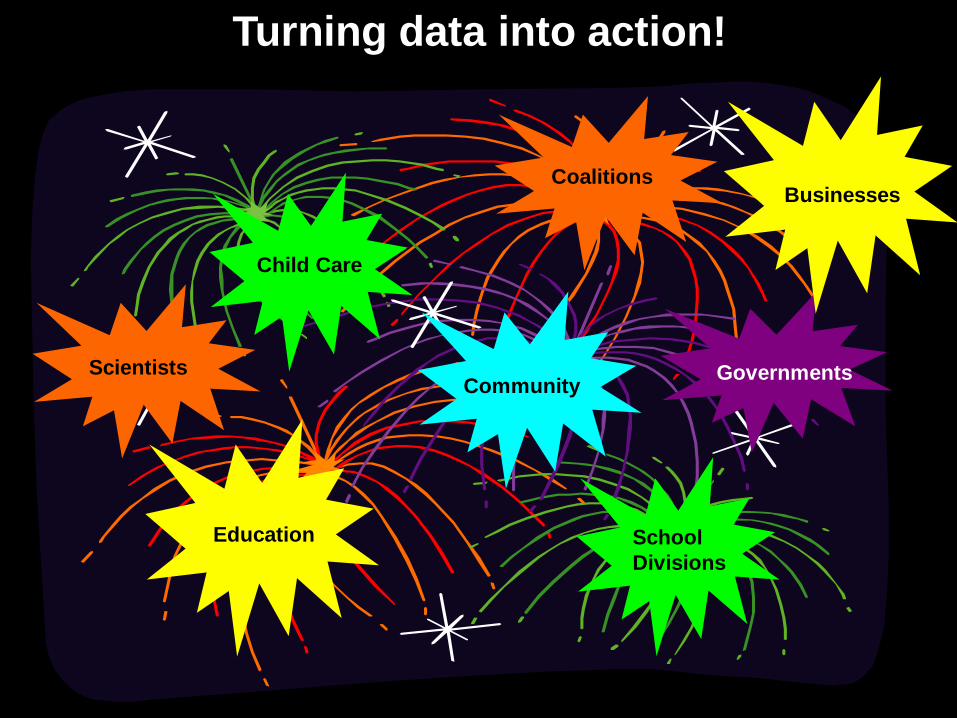
Turning data into action!
Child Care
Education
Coalitions
GovernmentsCommunity
Scientists
Businesses
School
Divisions
Looking Backward…
School Divisions use their Divisional and School-level
EDI results to assist in their ECDI (Early Childhood
Development Initiative) programming and planning
decisions
Looking Forward…
School Divisions use their Divisional and School-level
EDI results to align programs and services for students
based on the identified strengths and needs of each
school
Schools and School Divisions
School Divisions: Turning Data into Action
“In the Louis Riel School Division, we use the EDI in
many ways with our programming needs and budget
planning. And in our work with Parent-Child Coalitions,
our EDI results help us to identify goals for our Parent
Child Family Centres, and help us to monitor our
community needs.”
Sylvia Madill
Retired Student Services Coordinator, Louis Riel School Division
“Our Kinderlinks program offers preschoolers and their
parents a positive introduction to school and helps
prepare them for the transition to Kindergarten.
The School‟s decision to develop this program, a
partnership with the Elspeth Reid Family Resource Centre
and the Brandon Parent-Child Coalition, came from the
results of our EDI data, and the program goals of
Kinderlinks are based around the five domains of the EDI‟s
measurement of school readiness”.
Shawn Lehman, Principal of Valleyview Centennial School
Schools: Turning Data into Action
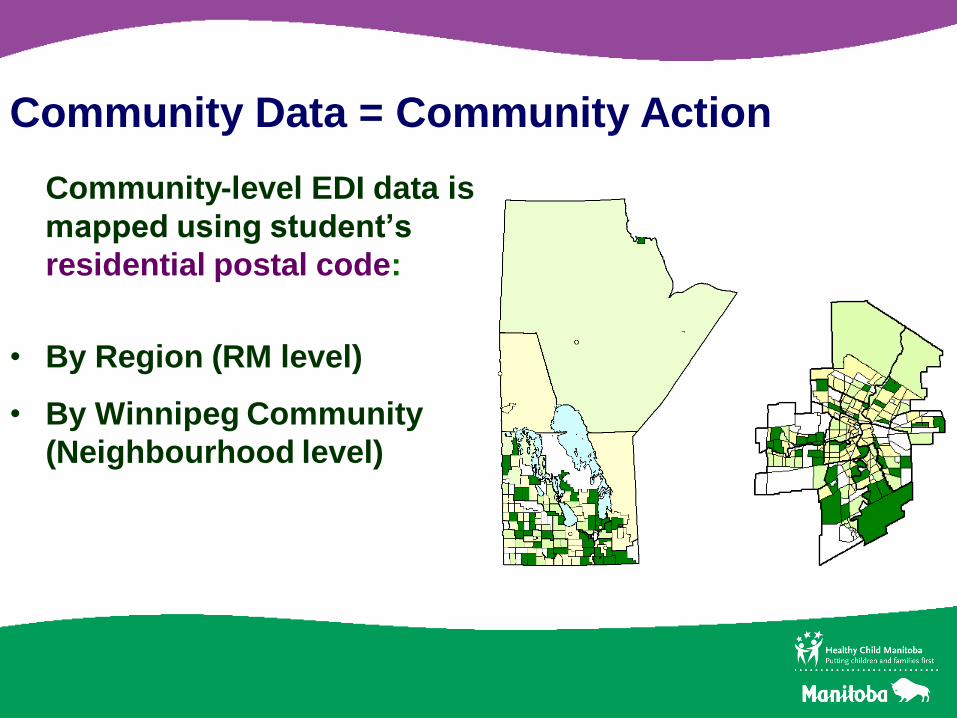
Community Data = Community Action
Community-level EDI data is
mapped using student’s
residential postal code:
• By Region (RM level)
• By Winnipeg Community
(Neighbourhood level)
Community Data = Community Action
• Parent-Child Coalitions and the Child Care
Community use their local-level EDI results to assist
in their early years programming decisions
• The EDI enables communities to align policies and
programs for children and parents based on the
identified strengths and needs of that community
“We use the EDI in lots of ways. The decision to
develop our Coalition‟s “Kit and Kaboodle” program, a
literacy-focused preschool program, evolved from our
EDI data which showed „need‟ in the Language and
Thinking Skills domain. Our Coalition Steering
Committee consults with our EDI data in reviewing our
grant applications, and the data is one of the factors we
consider when making our funding decisions.”
Kathy Wightman
Former Chair of the Central Region Parent-Child Coalition
Parent-Child Coalitions: Turning Data into Action
“The SPLASH nursery school is one of the programs
made possible by the enhanced nursery school funding
strategy that is being further expanded in the Family
Choices child care agenda. This nursery program is a
great example of how we can address the evidence-
based needs of communities, using EDI results, as we
move forward with our 5 year plan to improve early
learning and child care across Manitoba”.
Lois Speirs
Former Director of the Manitoba Child Care Office
Child Care: Turning Data into Action
Healthy Child Manitoba: Turning Data into Action
“The EDI helps us measure what matters most to
Manitoba: the well-being of our children. As a province
and in our communities, it helps us look back, to
evaluate the outcomes of our investments in early
childhood development. It also helps us look ahead, to
improve our future decisions in policy and program
development, to make the Manitoba we want for all of our
children.”
Dr. Rob Santos, Scientific Director & Senior Policy Advisor
Healthy Child Manitoba Office, Healthy Child Committee of Cabinet
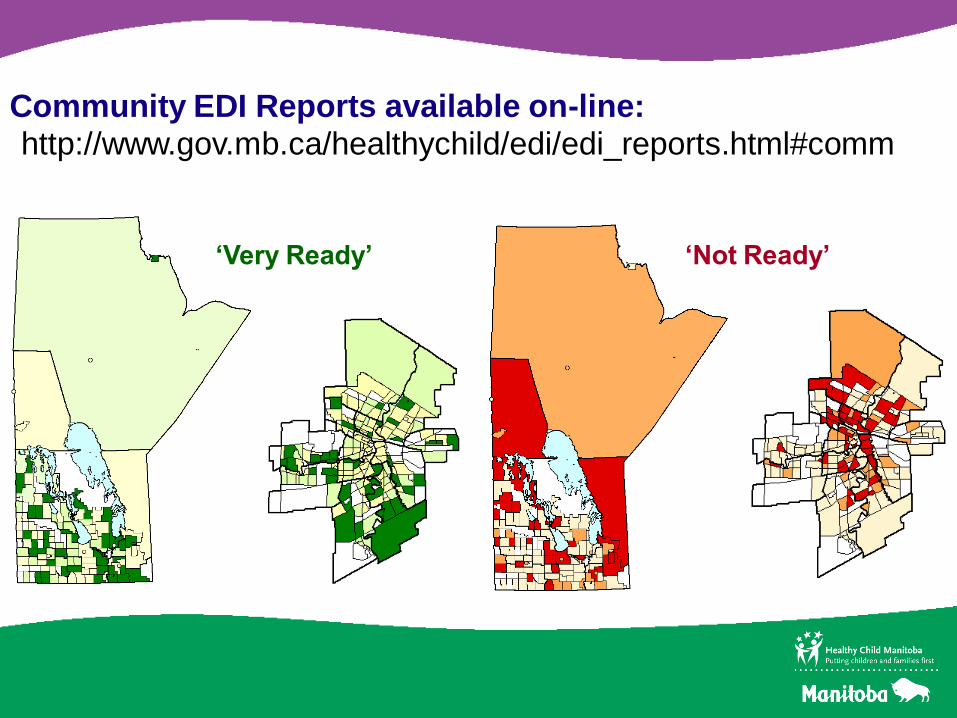
Community EDI Reports available on-line:
‘Very Ready’ ‘Not Ready’
http://www.gov.mb.ca/healthychild/edi/edi_reports.html#comm
For additional EDI resources:
Offord Centre for Child Studies
www.offordcentre.com/readiness
Healthy Child Manitoba
www.gov.mb.ca/healthychild/edi

Contact:
Terra Johnston
Provincial EDI Coordinator
Healthy Child Manitoba Office
204.945.0177