Embed Size (px)
Citation preview

$3.00 PER COPY TO ASME MEMBERS
79-GT-165
The Society shall not be responsible for statements or opinions advanced in papers or in discussion at meetings of the Society or of its Divisions or Sections, or printed in its publications. Discussion is printed only if the paper is published in an ASME journal or Proceedings. Released for general publication upon presentation. Full credit should be given to ASME. the Technical Division, and the author(s).
The Effect of a Sample Lot of Fuel JECTORS on Emissions Levels of a Small Gas Turbine
GEORGE OPDYKE, Jr.
Manager, Combustor Section, Avco Lycoming Division, Stratford, Conn. Mem.ASME
!. B R /\ r V
A single small gas turbine engine, containing an annular combustor producing nearly conventional emission levels, was sampled for gaseous emissions and smoke a total of 20 times in a one month period. Five samples each of two fuel injector designs were tested in random order, and the combustor angular orientation was varied with respect to the compressor. In addition to the basic tests with aviation kerosene fuel, emission measurements were also made with Avgas and diesel fuel with each injector design. Fuel spray drop size distributions were estimated from sample test data. The result of changing the fuel injectors was the production of a significant variation in hydrocarbon and carbon monoxide emissions, with limited variation in oxides of nitrogen and smoke. After correction for ambient and operating conditions. the standard deviation in the EPA parameter for hydrocarbons was about 30 percent of the average value and 15 percent of the average value for carbon monoxide. It was postulated that the variation was caused by fuel injector manufacturing tolerances which resulted in large variations in the maximum drop size in individual sprays causing variable entrapment of unvaporized drops in the wall cooling film. The conclusion is that small and perhaps non-detectable variations in injectors can cause changes in emissions from gas turbines, and, in particular, from small gas turbines.
Contributed by the Gas Turbine Division of The American Society of Mechanical Engineers for presentation at the Gas Turbine Conference & Exhibit & Solar Energy Conference, San Diego, Calif., March 12-15, 1979. Manuscript received at ASME Headquarters January 3, 1979. Copies will be available until December 1, 1979.
AN SOCIETY OF MECHANICAL ENGINEERS, UNITED ENGINEERING CENTER, 345 EAST 47th STREET, NEW YORK, N.Y. 10017
Copyright © 1979 by ASME
Downloaded From: http://proceedings.asmedigitalcollection.asme.org/ on 09/09/2018 Terms of Use: http://www.asme.org/about-asme/terms-of-use

The Effect of a Sample lot of Fuel
JECTORS on Emissions levels of a Small Gas Turbine
GEORGE OPDYKE, Jr.
ABSTRACT
A single small gas turbine engine, containing an annular combustor producing nearly conventional emission levels, was sampled for gaseous emissions and smoke a total of 20 times in a one monlh period. Five samples each of two fuel injector designs were tested in random order, and !he combustor angular orientation was varied with respect to the compressor. In addition to the basic tests with aviation kerosene fuel, emission measurements were also made with Avgas and diesel fuel with each injector design. Fuel spray drop size distributions were estimated from sample test data.
The result of changing the fuel injectors was the production of a significant variation in hydrocarbon and carbon monoxide emissions, with limited variation in oxides of nitrogen and smoke.. After correction for ambient and operating conditions, the standard deviation in the EPA parameter for hydrocarbons was about 30% of the average value and 15°/o of the average value for carbon monoxide. It was postulated ihat the variation was caused by fuel injector manufacturing tolerances which resulted in large variations in ihe maximum drop size in individual sprays causing variable entrapment of unvaporized drops in ihe wall cooling film. The conclusion is that small, and perhaps non-detectable, variations in injectors can cause changes in emissions from gas turbines, and, in particular, from small gas turbines.
NOMENCLATURE
A Area, m 2
D Diameter, m
2
H
(0) p R
SMD
T
wa wf b
b
d
q
b.P
p
µ. Subscripts
Humidity, gms/gm air
Volumetric fraction of oxygen radical
Pressure 1 k Pa, abs
Weight fraction of a spray greater than diameter d -6 Sauter mean diameter, m x 10
Temperature, degrees K
Air flow rate, kg/sec
Fuel flow rate, kg;hr
Inlet temperature factor in 8 parameter, degrees K Constant indicative of mass median diameter
Diameter of drop, m x 10-6
Constant indicative of dispersion of ihe distribution
Pressure drop, k Pa
Fuel density, kg/m3
·
Kinematic viscosity, mm2
/s
R Reference
S Steich iometric
INTRODUCTION
The emission levels of any gas turbine engine model will
vary considerably from engine-to-engine in any sample lot tested. Some of ihe variation is caused by differences in
r ambien addilic uring 11 and cm This C(l
ing I in1 slight!) in perf1 tolercm powe1· I difficul
Th ambien to evcd and !he trivicil,
It emissio1 injedo1 turbine periorl I injecto1 vendors well,
Descrip
ThE at 463 E used in Piaggio models, others.
Figure 1
The pressor � combust; turbine .
Downloaded From: http://proceedings.asmedigitalcollection.asme.org/ on 09/09/2018 Terms of Use: http://www.asme.org/about-asme/terms-of-use

�r d
es K
ot
ambient conditions at which the engines are tested, some additional variation results from errors in sampl ir.g and measuring the several chemical species in the engine exhaust gas, and an additional cause of variation is from the engine i
.tself.
·This can result from slight variations in each engine's operating line, causing each engine's combustor to operate at slightly different conditions; or the combustor itself can vary in performance because of normal manufacturing or assembly tolerances. In addition, emissions data may be taken at power levels slightly different than those specified because of difficulties in setting the test point.
There have been q Rumber of attempts to correct f§f ambient conditions \ 1 )\2J and for operating variables/ J(4) to evaluate sampling errors (5) and in strumentation errors(6), and the general result has been to show that none of these are trivial•
It is the purpose of th is paper to discuss !he variability of emissions data measured in a test program where the fuel iniectors were the prime test variable. A single small gas turbine engine was tested twenty times within a one month period for emission levels. Ten different fuel manifold and injector assemblies were tested, five each from two different vendors. Rep I icate tests were run and fuel type was varied as well.
Description of Parts Tested
The engine tested was an LTP 101-600 turboprop, rated at463 equivalent kilowatts at take-off power. This engine is used in general aviation service in such applications as the Piaggio P-166, the Riley Aircraft conversion of two Cessna models, the Dornier Sky Servant, agricultural aircraft, and others. The engine is shown in Figure 1.
'AVCO LYCOMING LTP 101
The engine is configured with an axial-centrifugal com�pressor with a pressure ratio of 8/1, an annular reverse flow cornbustor, an axial compressor turbine and a free power
The combustor is a unique, patented(7)design called a circumferenl'ially stirred combustor, to distinguish it from conventional axial vortex stabilized combustors. This combustor design tends to have a lower rate of change of N Ox with increasing inlet temperature than conventional combustors, as correlated by Lipfert(4). However, the specific configuration used in this test series was not an emission controlled design, except that the fuel spray was designed to be relatively fine at taxi-idle fuel rates.
The circumferentially stirred combustor design incorporates a primary zone flame stabilization method which permits a simple inexpensive shape for the combustor liner and a reduction of the number of fuel injectors to about one-half that normally used. This contributes to the low engine cost which is required for a general aviation engine.
The design concept of the combustor is schema ti cal ly shown in Figure 2. A vortex is generated perpendicular to the fuel injector centerline, which flows away from each injector in both directions, spreading the vaporizing and burning fuel circumferentially. Each end of the vortex is aerodynamically forced by the folding jets to tum into an axial direction, forming two vortices which persist until combustion is essentially complete and the vortices are dissipated by the mixing iets in !he diluent zone. In this engine the com bus tor I iner has an annular height of approximately 36 mm, a length/hei1ht ratio of 3. 1, and a surface to volume ratio of 3. 15 cm- • The straight I ine distance from the apex of the fuel spray to the I iner wal Is and to the estimated path of the folding jet is 28 and 34 mm, respectively
Combustor Housing
Liner Liner Inner Outer Wall Wall
OK: j Secondary ' V
(Folding Jy \
Primary � ,,___/ /; Primary
Horseshoe - Shaped Mean Circulation Path
Secondary (Folding) Jets
(')� _/ ' � d9 '8\ ,''f (;jj; �SQ� J ! J I l�l t L
Primary Slot Air /,;ew X Fuel Injector Fuel Injector
Figure 2. Circumferentially stirred combustor flow pattern
The fuel injectors used in this combustor configuration were of conventional dual orifice design, with eight injectors mounted in a dual tube fuel manifold, with a single flow divider valve to schedule fuel flow to the primary and secondary swirl chambers of the injectors. The flow divider schedules secondary fuel flow to start at approximately taxiidle, so that the average spray droplet size is small at this operating condition. In order to permit reasonable manufacturing tolerances, !he fuel flow from each injector in each manifold assembly is permitted to deviate from the average
3
Downloaded From: http://proceedings.asmedigitalcollection.asme.org/ on 09/09/2018 Terms of Use: http://www.asme.org/about-asme/terms-of-use
injector flow of that assembly by an amount which is greatest at idle, and minimum at take-off power. The result is that at idle conditions there can be a significant variation in both the local fuel-air ratio in the pri�ary zone, downstream of each injector location, and the Sauter Mean Diameter of each spray. The injeptors which have the greatest flow will also have the largest spray Sauter Mean Diameters, a combination which would tend to result in the longest local flame length.
The two alternate designs of fuel manifold, flow divider, injector assemblies used in this investigation had similar, but not the same, pressure drop - fuel flow characteristics and injector flow numbers. The differences between these two manifold designs was the major test variable in this investigation. The two designs are designated A and B.
TESTS CON DUCTED
Engine Emissions Tests
Five manifold assemblies from each vendor were chosen at random and tested on a single experimental engine in a statistically determined random sequence. The fuel used met the specifications of ASTM D-1655, Jet A. The engine remained in one test eel I during the 16 calendar days required to run 20 emissions tests. All emissions tests were run during day time hours under the supervision of a single engineer.
At two intervals in the sequence of testing the ten man ifolds, the entire combustor turbine assembly was rotated both 27 degrees clockwise and 27 degrees counterclockwise, using a single manifold assembly of each design in each instance. The original position of the hot end assembly was retested at the conclusion of each rotation sequence to provide a measure of data repeatability.
At the conclusion of the ten manifold tests and the six additional rotation tests on Jet A fuel, a manifold assembly of each design was also tested on Marine Diesel, MIL-F-16884, Grade 11, and Aviation Gasoline, MIL-F-5572, Grade 100/ 130.
The fuel characteristics of major concern were, for Avgas, Jet A and diesel, respectively:
Viscosity at Tl° F, centistokes: 0.6 2. 0 avg. 3. 3 Carbon-Hydrogen weight ratio: 6.61 6.45 avg. 6. 52 Aromatic Content, %: 9.0 17. 4 avg. 25. 1
The engine was configured for th is test with a turboshaft gearbox so that power could be measured with a water brake. Engine airflow was measured with a calibrated bellmouth and fuel flow by calibrated turbine meters. The gas sampling rake was cruciform in shape with each of the four legs containing 3 sampling ports at centers of equal area. The inlet conditions to the engine were not controlled, but were never extremely far from ISO standard conditions. For example, humidity varied from 2.3 to 8.3 gms/kg, ambient temperature from 7°C to 31° C, and ambient pressure was normal for sea level.
During each individual test, at least six emissions measurements were taken: at low idle, high idle, approach, climbout, take-off, and low idle, in that order. Only normal care was taken to set each point at the prescribed referred
4
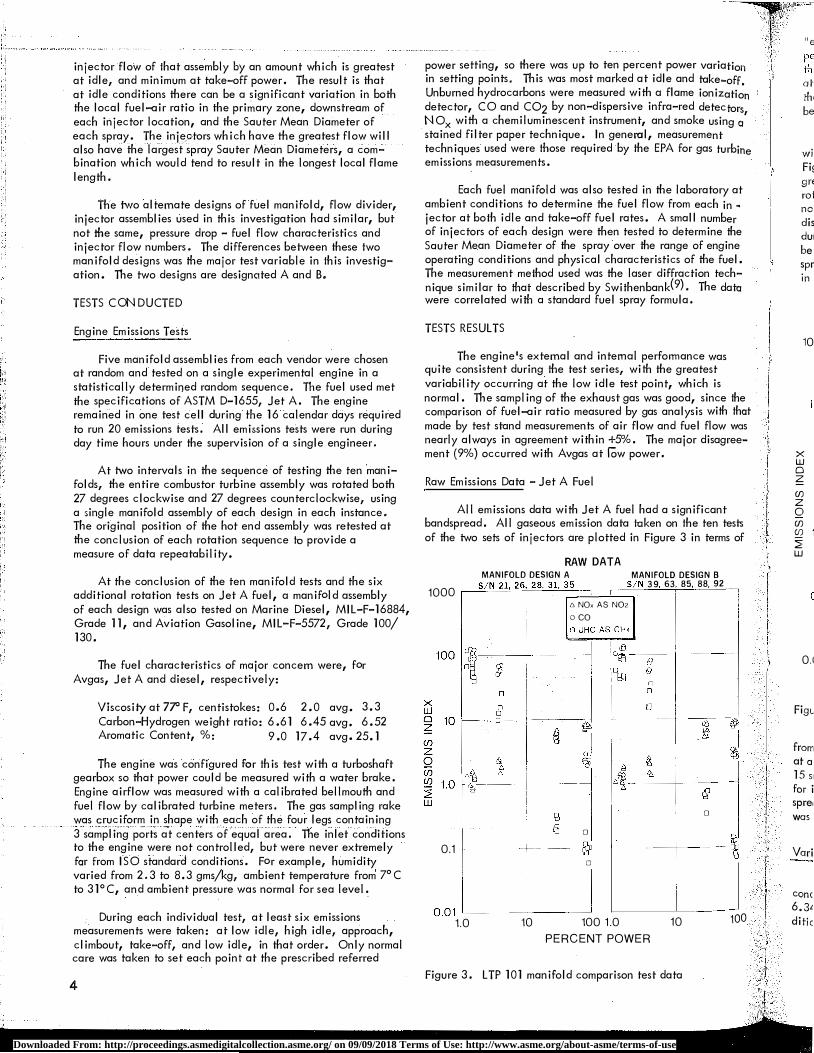
power setting, so there was up to ten percent power variation in setting points. This was most marked at idle and take-off, Unburned hydrocarbons were measured with a flame ionization detector, CO and C02 by non-dispersive infra-red detectors N Ox with a chemiluminescent instrument, and smoke using 01 stained filter paper technique. In general, measurement techniques used were those required by the EPA for gas turbine emissions measurements.
Each fuel manifold was also tested in the laboratory at ambient conditions to determine !he fuel flow from each in� jector at boih idle and take-off fuel rates. A small number of injectors of each design were !hen tested to determine the Sauter Mean Diameter of !he spray over !he range of engine operating conditions and physical characteristics of the fuel. The measurement meihod used was !he laser diffraction technique similar to that described by Swithenbank(9), The data were correlated wiih a standard fuel spray formula.
TESTS RESULTS
The engine's external and internal performance was quite consistent during the test series, wiih the greatest variability occurring at the low idle test point, which is normal. The sampling of !he exhaust gas was good, since the comparison of fuel-air ratio measured by gas analysis with that made by test stand measurements of air flow and fuel flow was nearly always in agreement within +5%. The major disagreement (9%) occurred with Avgas at !Ow power.
Raw Emissions Data - Jet A Fuel
All emissions data with Jet A fuel had a significant bandspread. All gaseous emission data taken on the ten tests of the two sets of injectors are plotted in Figure 3 in terms of
RAW DATA MANIFOLD DESIGN A MANIFOLD DESIGN B
1000 �-S�/-'-' N�2_1�, _26--;-2_8�31�3::
5::.='-'--'- -
S�
/N 3 9 63 85 88 92
I 6 NO, AS N02
0 co
0
I 0.1 �-- -+-
0
' --- ----+---------- � 0
0.01�1_ I 1.0 10 100 1.0
PERCENT POWER 10
Figure 3. LTP 101 manifold comparison test data
100
i
"e
c1t th( be
wi Fis gr� rot noi dis du1 be spr in
10
x w 0 z (/) z 0 (/) !:!}. ::;?: w
0.1
FigL
from at a ] 5 SI for i spre1 was
Vari
cone 6,3L di tic
Downloaded From: http://proceedings.asmedigitalcollection.asme.org/ on 09/09/2018 Terms of Use: http://www.asme.org/about-asme/terms-of-use

"emission indices" versus "percent referred power". The ,,--�w+---ww-·-percentage spread tends to be greatest at low power, where
Jhe variation of combustor efficiency is the greatest, and ion ff. ti on ::>rs, J a
bine
at ,�
1r ne )e �1. n-lta
the that was ee-
�sts , of
h
(
at low emission index values, where measurement accuracy is Jhe lowest. There is only a slight difference in the data between the two injector designs.
The raw data from the two sets of four tests associated wilh !he rotation of the engine's hot end are plotted in Figure 4. The data spread of the two replicate tests was as great as the variation of the clockwise and counterclockwise rotation tests, indicating that the combustor performance was not measurably affected by orientation. Since there was no disassembly of the combustor or removal of the manifold during these test sequences, the variabi Ii ty of these data can be considered indicative of test-to-test repeatability. The spread of the data in these rotation tests is obviously less than in the manifold tests.
RAW DATA MANIFOLD DESIGN A, S/N 31 MANIFOLD DESIGN B, S/N 88
1000 --1 u NO, AS N02
0 co D UHC AS CH4
I 100 -ij;-- +
El & {iS; --
x � 10 ;s (/) z Q (/) � 1.0 2 w
0.1
08 '1 0---+
0.01 �---�----�
1.0 10 100 1.0 PERCENT POWER
Figure 4. LTP 101 manifold rotation test data
� I
O:sl
i � I +----� I D i
10 100
-� \ The smoke number with Jet A fuel increased in level
� from 10 to 15 at idle to 45 to 55 at full power, with all data
�j at all power levels falling within a band spread of less than 15 smoke numbers. At full power, the average smoke number for injector A was about 5 greater than injector B. The band spread of smoke numbers measured during the rotation tests
, --ww __ , __ ,� __ was less than 7, except at idle, wher it was 10.
� J 100
Variability Analysis
The raw data were corrected to standard ISO ambient conditions (pressure 101.3 kPa, temperature 15° C, humidity 6.34 gms/kg) and to the standard day engine operating conditions of a typical engine of !he LTP 101-600 model, using
the technique of Donovan and Cackette, (2), assuming two different taxi-idle powers. A low idle of th is typical engine was defined as 3.2% of take-off power and a high idle as 4.8%. The T3 coefficients for hydrocarbons, CO and NOx were taken from the trend lines, the ambient humidity correction coefficient was -19 and the P3 coefficient for smoke was 1.0, as recommended in Reference 2.
The gaseous emission indices from the raw and corrected data were summarized at selected operating conditions. This summary 'is given in Table 1, which shows the average emission index and the coefficient of variation (standard deviation/ average va I ue) for each set of tests for each species.
By comparison of Table la and Table lb, it can be seen that the correction technique generally increased the average level of the emission indices, and decreased the smoke number slightly. This is largely because of the differences between the test engine and the assumed typical engine cycle. The variabi I ity of the data has been noticeably decreased by the correction procedure. When the coefficients of variation for the tests of both manifold designs at all listed conditions are averaged, the variability of the idle hydrocarbon emission indices was decreased 21%, idle CO decreased by 19"/o, N Ox decreased by 31% and smoke decreased by 43%. When the rotation test data is averaged, the correction procedure decreased the variability of UHC by 38%, CO by 30%, N Ox by 18% and decreased smoke variability by 60%.
When comparing the magnitude of the coefficients of variability of the corrected emission indices for the rotation tests with those of the manifold tests, the variation was reduced by about one half, except for N 0 • This would indicate that changing fuel manifolds affects \ydrocarbon emissions, CO emissions, and smoke, but has no effect on NOX.
However, the levels of the corrected emission indices listed in Table lb for Manifold Design A and B differ from each other by less than one standard deviation, in most of the cases. In general, if the student's t test is applied to the data, it is not possible to prove that the two designs give different results.
All of the corrected data were then used to calculate two EPAP values for theLTO cycle defined in Reference 8, using taxi-idle settings of 3.2% and 4.8% of maximum power. The averaged results are I isted in Table 2 for the two sets of manifold tests and the rotation tests. As was seen in the comparison of emission indices, it is difficult to differentiate between the two manifold designs, since all differences are less than one standard deviation apart. This difference is less than that needed for 95% confidence that a real difference exists between the two designs, so, statistically, it cannot be said that the manifold designs give different emissions characteristics, The greatest difference in the manifold EPAP values occurs with UHC and CO in the cycle with taxi-idle of 4. 8% of take-off, and even here theri:l is only about a 50% chance !hat !he values are different.
In comparing !he rotation tests with the manifold tests, the variabi I ity of the data is about the same for N Ox and smoke, but, on !he average, much less lhan half for UHC and CO EPAP values, which agrees with the earlier observation that !he changing of fuel manifolds, regardless of !he design, had an effect on hydrocarbon and CO emission levels.
5
Downloaded From: http://proceedings.asmedigitalcollection.asme.org/ on 09/09/2018 Terms of Use: http://www.asme.org/about-asme/terms-of-use

Table la. Selected Raw Emissions Data
Raw Data EMISSION INDICES UHC as CH4 co
Low Idle Low Idle High Idle Low Idle Low Idle Out In Out In
MANIFOLD TESTS Manifold A - Average, X 62. l 69. 0 17. 8 102. 9 114. 1
Coefficient of Var. S/X % 34 23 40 14 10
Manifold B - Average, X 7 2. 0 46.7 20.7 102. 2 92. 8 Coefficient of Var. S/X % 31 13 41 20 7
Average Coefficient of Var. S/X % 33 18 41 17 9
ROTATION TESTS Manifold A - Average, X 74.6 76. l 17 .9 111. 5 116. 1
Coefficient of Var. S/X % 31 29 25 13 8
Manifold B - Average, X 53. 1 50. 1 16.2 93. 4 93.5 Coefficient of Var. S/X % 12 19 12 5 8
Average Coefficient of Var. S/X % 22 24 19 9 8
Table lb. Selected Emissions Data Corrected (Reference 2 Method)
Corrected Data EMISSION INDICES UHC as CH4 co
Low Idle Low Idle High Idle Low Idle Low Idle Out In Out In
MAN I FOLD TESTS Manifold A - Averal'.)e, )( 68. 6 78. 8 24. 8 112. 4 130. 0
Coefficient of Var. S/)( % 30 13 34 12 6
Manifold B - Average, X 80. 8 52. 3 29. 8 113. 8 102. 1
Coefficient of Var. S/>C % 29 9 29 23 2
Average Coefficient of Var. S/>< % 30 11 32 18 4
ROTATION TESTS Manifold A - Average, X 81. 4 83. 5 24. 6 121. 1 127 .7
Coefficient of Var, S/X % 22 16 14 9 3
Manifold B - Average, X 58. 0 56. 1 22. 6 100. 8 103. 1
Coefficient of Var• S/)( % 7 14 6 4 6
Average Coefficient of Var. S/X % 15 15 10 7 5
6
High Idle
60. 3 14
62. 9 18
16
61. 0 8
55. 2 4
6
High Idle
73.5 11
78. 1 12
12
73.6 6
66.7 1
4
Max. NOx as No2
Smok, !N o.
Approach Climb Out
5. 8 8. 2 55 7 4 9
6. 0 8. 6 50 9 6 5
8 5 7
5. 5 7 . 8 53 8 3 7
6. 0 8.9 48 6 4 2
7 4 5
Max. Smoke
NOx as N02 No. Approach Climb
Out
5.6 7 . 9 47 5 3 2
5.7 8. 0 50 4 4 6
5 4 4
5. 5 7 .7 48 5 5 2
5. 9 8. 3 46 3 4 3
4 5 2
/raw di This rr with r for Uf for sm The c< measu pa ram,
8
which fit I in' UHC s ency, corres1 enginE from ti deterrr Figure condit Refere
Downloaded From: http://proceedings.asmedigitalcollection.asme.org/ on 09/09/2018 Terms of Use: http://www.asme.org/about-asme/terms-of-use

5
\ax. noke lo.
i7 ! 50 )
rn 2 �6 3 2
f I
Tobie 2. EPAP Values from Corrected Data (Reference 2 Method)
EPAP VALUES Smoke EPAP VALUES T/1=4.8% of T.O. No. T/1=3.2% of T.O. UHC co NOx UHC co NOx
MANIFOLD TESTS Manifold A - 5 Tests
Average - X 13. l Coefficient of Variance - S/X - % 34
Manifold B - 5 Tests Average - X 16.3 Coefficient of Variance - S/X - % 30
ROTATION TESTS Manifold A - 4 Tests
Average - X 13.0 Coefficient of Variance - S/X - % 14
Manifold B - 4 Tests Average - )( 12.0 Coefficient of Variance - S/X - % 5
A second method was used to correct the gaseous emission raw data to standard ambient and standard engine conditions. This method has been used at Avco-Lycoming for some time with reasonable success, and consists of two techniques; one for UHC and CO and one for N Ox• No correction is made for smoke. The UHC and CO technique was as follows: The combustion efficiency, calculated from the UHC and CO measurements, was plotted against the efficiency correlating parameter, 8, (lO)
8 pl.75 x AD0.75 eT/b
w a which had been calculated for each test point, and a best fit line drawn for the data for each manifold tested. A COUHC split curve, which has a parameter for combustor efficiency, was also plotted. Then, by using values of 8 which corresponded to the L. T. O. operating modes of a typical engine at ambient conditions, the efficiency was determined from the first curve and the CO and UHC emission indices determined from the second. This technique is illustrated in Figure 5. The N Ox data points were corrected to standard conditions by the use of correlating equation l 0 from Reference 11, repeated here for convenience.
NO x
NOxR
40.5 4.6 47 33.5 46.8 4.5 10 5 2 24 9 4
44.3 4.5 50 34.4 54.5 4.5 12 7 6 24 16 6
40.6 4.4 48 38.4 59.5 4.3 5 6 2 19 6 5
37.5 4.9 46 27. l 50.2 4.8 1 5 3 8 4 5
...J 60 >- /CLIMB OUT w ::::J � 100 IL w 'APPROACH '\.. 0 u TAKEOFF "' Co u:: STANDARD CONDITIONS � s-..<-,('�&u IL 0 /00,t.'r,,o w 'TAXI IDLE c�1' z 90 0 980 0 () F IL Cl) Cl CORRECTED DATA 0 ::::J J:J. TEST DATA al UJ � 0 80 16 ()
EFFICIENCY PARAMETER, 0
Figure 5. Avco method of correcting UHC and CO Emission Indices
The spread of the raw data was reduced by approximately one-half by using this method. The corrected data were then used to calculate EPAP values as before, using a taxi-idle setting of 3 .2% of maximum power in one case, and 4. 8% in the other. The averaged results are listed in Table 3.
The levels of UHC and CO are somewhat lower than obtained using the Donovan and Cackette method, while NOx values are about 10% higher. Again, however, the differences in level between the two manifold designs is so small that they cannot be considered to give statistically different emissions characteristics, with t�e possible exception of smoke. Also, the differences in the coefficients of variability between the rotation and manifold tests are great enough to conclude that the manifold test variation of UHC and CO is not solely due to test and measurement errors, but is caused by the interchange of the manifolds themselves.
Effect of Fuels on Emissions
The maximum smoke level, using data corrected by Donovan and Cackette method, correlated reasonably wel I with fuel aromatic content for each injector design, as shown in Figure 6. There was a significant change in smoke from the Jet A level when either Avgas or D.F-2 fuel was used • .
7
Downloaded From: http://proceedings.asmedigitalcollection.asme.org/ on 09/09/2018 Terms of Use: http://www.asme.org/about-asme/terms-of-use

Table 3. EPAP Values from Corrected Data (Avco Method)
-0 w I-0 w 60 a: a: 0 0 -a: w ca 50 � :::> z w � 0 � (/) 40 w <( (/) ......_ <( a.. w
MAN !FOLD TESTS
Manifold A - 5 Tests Average - X Coefficient of Variance - S/)( - %
Manifold B - 5 Tests Average - X Coefficient of Variance - S/)( - %
ROTATION TESTS
Manifold A - 4 Tests Average - )( Coefficient of Variance - S/X - %
Manifold B - 4 Tests Average - X Coefficient of Variance - S/X - %
DESIGN B MA� IFOLD 39 :----y _,- - -
nT-/ I ?S/ I
� DESIGN B AVG. -+fSi I I J2s� -DEs1bN A I I _t_ AVG.
I -2S -I
/ �GNA MANIFOLD 35
I I <(
. (f) I-> <( w <((.'.) '
C\J I
LL 0
·-
0 10 20 30
FUEL AROMATIC CONTENT - %
Figure 6. Effect of fuel type on LTP 101 exhaust smoke
EPAP VALUE) Smoke tPAP VALUES T/1 =4. 8% of T.O. No. T /I = 3. 2% of T. 0. UHC co NOX UHC co NOX
11. 34 37. 53 5. 11 55 28. 16 50.47 4.98 32 14 4 9 28 10 3
14. 30 40.26 5. 16 50 28.14 54. 06 5. 04 33 15 5 5 25 16 4
11.52 36.89 4.99 53 32. 26 48.65 4.89 12 3 3 7 9 .3 3
11.31 35. 59 5. 40 48 23. 33 44.90 5.24 12 l 3 2 8 4 3
FUEL NOZZLE TEST RESULTS
The tests for fuel spray Sauter Mean Diameter, using 3 I iquids, showed that the resulting values could be described fairly well by a formula routinely used at Avco by merely adiO't�n::: c:::?>i;
')ing(wf \
2�icrons
\�p.442 \ p ) The fuel flow rate from each fuel injector was measured
at each engine test fuel rate, and the deviation of the individual flow rates from ihe average value at each condition was shown to be within normal, specified limits.
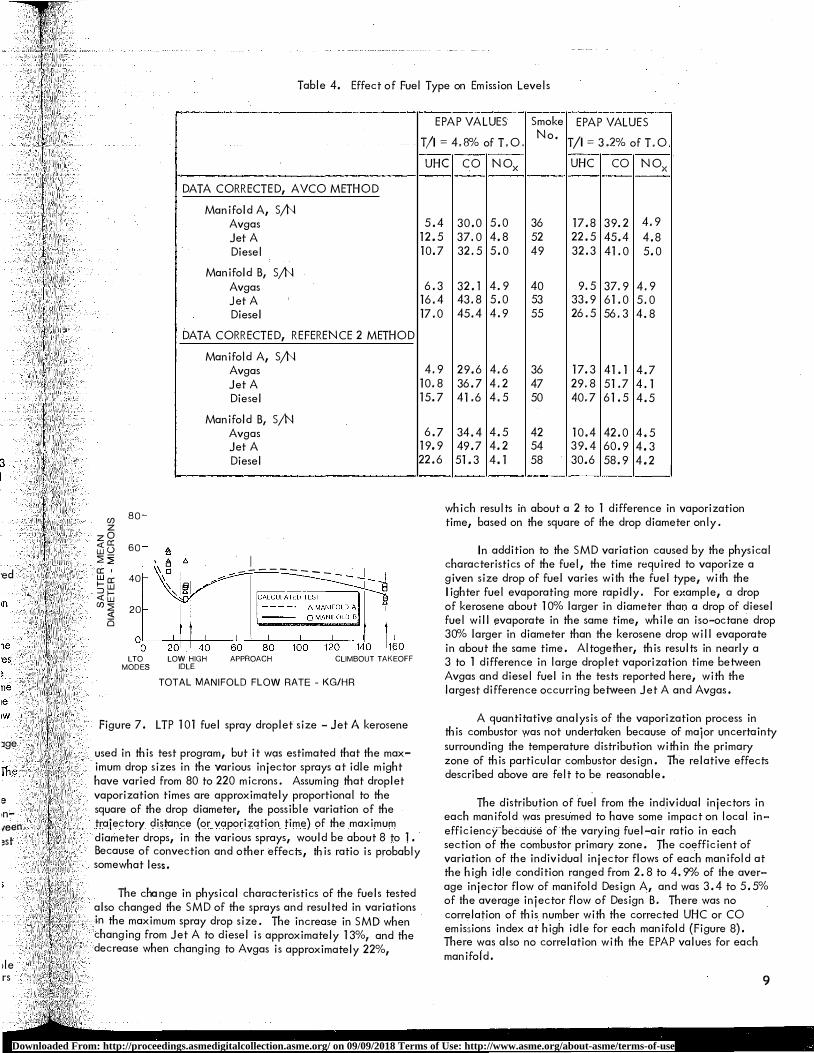
The spray angles were normal and well defined and the sprays were not streaky. Since individual injector flow rates vary in a given manifold at the same pressure drop, and the pressure drop will vary from manifold to manifold at the same total fuel rate, there will be a considerable variation in the SMD of e ach spray at a given engine fuel flow. For the low and high idle conditions of this test series, the calculated variation in SMD would be approximately ±7% of the average value at these conditions, which is in the 20 to 30 micron region for both manifold designs, when using Jet A fuel. llie calculated average SMD over ihe power spectrum for each injector design is given in Figure 7; The test data from the sample lot of injectors tested are also plotted. There is considerable scatter in the test results, and the deviation between the test data and the calculated SMD is shown to be greatest at low fuel flow.
The spray distributions measured in the injector tests followed the Rosin-Rammler distribution function,
The corrected EPAP values, using boih correction methods, are shown in Table 4. The fuel type had essentially no effect on N Ox, and the UHC and CO emissions were significantly less with Avgas. The differences between Jet A and diesel
R = e -bdq
The value of the slope, q, was not constant, so the maximum drop size in each spray was not a constant multiple
of the SMD. It was not possible to test al 1 80 fuel injectors fuel were variable, and often smal 1. 8
l l !
0: w I-=> <( (/)
F
USI im ha va sqt tra die Be· sor
als in ch< de<
Downloaded From: http://proceedings.asmedigitalcollection.asme.org/ on 09/09/2018 Terms of Use: http://www.asme.org/about-asme/terms-of-use
·ed
Jge
The
e 1nfeen ·�···1'--····· �st
1le rs
Table 4. Effect of Fuel Type on Emission Levels
EPAP VALUES Smoke EPAP VALUES
T/I = 4.8% of T.O. No.
T/I = 3.2% of T.O
UHC co NOX UHC co NOX
DATA CORRECTED, AVCO METHOD
Manifold A, s;N Avgas 5. 4 30. 0 5. 0 36 17. 8 39.2 4.9 Jet A 12.5 37.0 4. 8 52 22. 5 45. 4 4. 8 Diesel 10. 7 32.5 5. 0 49 32. 3 41.0 5. 0
Manifold B, s;N Avgas 6. 3 32. l 4.9 40 9.5 37.9 4.9 Jet A 16. 4 43.8 5. 0 53 33. 9 61. 0 5.0 Diesel 17. 0 45. 4 4. 9 55 26. 5 56.3 4.8
DATA CORRECTED, REFERENCE 2 METHOD
Manifold A, S;N Avgas 4.9 29. 6 4. 6 36 17. 3 41. l 4. 7 Jet A 10.8 36. 7 4.2 47 29.8 51. 7 4. 1 Diesel 15. 7 41.6 4.5 50 40.7 61. 5 4. 5
Manifold B, s;N Avgas 6. 7 34.4 4. 5 42 10. 4 42. 0 4.5 Jet A 19.9 49. 7 4. 2 54 39.4 60. 9 4.3 Diesel 22. 6 51.3 4.1 58 30.6 58. 9 4.2
(j) 80 z zO U}5 60 2� a: '
�ffi 40
�tu (/)2 20 <!'. 15
-
I ---------
00
L_�2� 0-l-l----4Lo�-6� 0---+----=s �o��1�0�0��12� 0;--�1j4�0----i�160 LTO LOW HIGH APPROACH CLIMBOUT TAKEOFF
MODES IDLE
TOTAL MANIFOLD FLOW RATE - KG/HR
Figure 7. LTP 101 fuel spray droplet size - Jet A kerosene
used in this test program, but it was estimated that the maximum drop sizes in the various injector sprays at idle might have varied from 80 to 220 microns. Assuming that droplet vaporization times are approximately proportional to the square of the drop diameter, the possible variation of the traiectory distance (or vaporization time) of the maximum diameter drops, in the various sprays, would be about 8 to 1. Because of convection and other effects, th is ratio is probably somewhat less.
The change in physical characteristics of the fuels tested also changed the SMD of the sprays and resulted in variations in the maximum spray drop size. The increase in SMD when changing from Jet A to diesel is approximately 13%, and the decrease when changing to Avgas is approximately 22%,
I
which results in about a 2 to 1 difference in vaporization time, based on the square of the drop diameter only.
In addition to the SMD variation caused by the physical characteristics of the fuel, the time required to vaporize a given size drop of fuel varies with the fuel type, with the I ighter fuel evaporating more rapidly. For example, a drop of kerosene about 10% larger in diameter than a drop of diesel fuel will evaporate in the same time, while an iso-octane drop 30% larger in diameter than the kerosene drop will evaporate in about the same time. Altogether, this results in nearly a 3 to l difference in large droplet vaporization time belween Avgas and diesel fuel in the tests reported here, with the largest difference occurring belween Jet A and Avgas.
A quantitative analysis of the vaporization process in this combustor was not undertaken because of major uncertainty surrounding the temperature distribution within the primary zone of this particular combustor design. The relative effects described above are felt to be reasonable.
The distribution of fuel from the individual injectors in each manifold was presumed to have some impact on local inefficiency because of the varying
. fuel-air ratio in each
section of the combustor primary zone. The coefficient of variation of the individual injector flows of each manifold at the high idle condition ranged from 2.8 to 4.9"/o of the average injector flow of manifold Design A, and was 3. 4 to 5. 5% of the average injector flow of Design B. There was no correlation of this number with the corrected UHC or CO emissions index at high idle for each manifold (Figure 8). There was also no correlation with the EPAP values for each manifold.
9
Downloaded From: http://proceedings.asmedigitalcollection.asme.org/ on 09/09/2018 Terms of Use: http://www.asme.org/about-asme/terms-of-use

0 100 � -....... � 0 90
Cf) w 0 0 z z 0 Cf) Cf) � WO oI w ::J l-o w er: er: 0 0
70
60
="'
40
30
20
10
0
I Iii DESIGN Al "' DESIGN B
A
I;.
1 2
.. &
1111
Iii
... -11111 A • Ill
A
II A
Ill
IA ... A 11111
II
3 4 5 6
COEFFICIENT OF VARIATION - SIX - % INDIVIDUAL INJECTOR FLOWS AT IDLE
Figure 8. Local fuel flow compared to emission indices at high idle
DISCUSSION OF RESULTS
The fact that N 0 was only slightly affected by changes in fuel manifolds or fu�I type suggests that the adiabatic flame temperature was nearly constant in every test. Since there were variations in the local fuel/air ratio associated with each injector, and variations in vapor/air ratio because of SMD and fuel variations, it was concluded that most of the NOV was formed in diffusion flames associated with droplet burn'lng. The presumption of a diffusion flame is in agreement with the appearance of the flame in the primary zone visually observed in model tests during the development of th is combustor and is probably typical of most conventional spray combustors, particularly at low powers(12).
The variation in hydrocarbon emissions probably results from the variation in maximum drop diameter in the individual injector sprays, caused either by smal I variations in injector manufacture or by physical characteristics of the fuel, resulting in penetration of a varying (but smal I) number of fuel droplets into the wal I cooling film. The variation of carbon monoxide emissions would result from reaction quenching in either the mainstream or the cooling film. The 3 to 5% variation in fuel/air ratio from injector to injector circumferentially around the combustor annulus appears to be unimportant.
The variability in the fuel spray droplet size distribution appears to be more a function of injector manufacturing variations within a given design, rather than from differences
10
in injector design. The magnil'ude of manufacturing variation is probably greater for injectors of small physical size. However, the impact of drop size variation on emissions would be a function of the specific match between combustor size, injector flow number, and fuel evaporation rates, and is probably important at low power conditions for many combustor designs, even though combustors of small physical size or those with strong primary zone cooling films would feel the effects more.
The variability in emission levels caused by fuel injection effects must be taken into account when setting design emission goals relative to regulatory emission levels in order to achieve an economically low rejection rate. Assuming a 4% rejection rate is acceptable for the engine discussed here, and that the distribution of emission levels is Gaussian, the emission design goal for UHC would have to be at least 60% less than the maximum allowable limit, and the CO goal would have to be 30% less. The margins for N Ox and smoke would have to be at least 10 or 15%. If appropriate factors are not used to correct emissions data for deviations of ambient or operating conditions from standard, the emission design margins will have to be greater •
CON CLUSIONS
The tests conducted indicate a significant variation in hydrocarbon and carbon monoxide emissions when fuel injectors are interchanged. The variability was not much influenced by the taxi-idle setting, but it was similar to the variation caused by significant fuel differences.
It is postulated that the emissions variability resulted mainly from large drops in the fuel sprays reaching and becoming entrapped in the wall cooling film, and that the number of large drops above a critical size varies among individual fuel injectors because of normal manufacturing tolerances.
ACKNOWLEDGEMENTS
The author would like to thank the several people who assisted in the preparation of this paper. Particular credit goes to Vincent Zeccardi, who supervised the emissions testingi to Sidney Watkins, who did the injector tests and their analysisi and to Elizabeth Hudson and Cynthia Poslusny, who made hundreds of calculations without complaint. Drew Auth provided lucid advice on statistical matters.
REFERENCES
1 Blazowski, W. S., and Marzewski, J. W., "Ambient Correction Factors for Aircraft Gas Turbine Idle Emissions", ASME Paper 76-GT-130, 1976.
2 Donovan, P., and Cackette, T., "The Effects of Ambient Conditions on Gas Turbine Emissions", ASME Paper 78-GT-87, 1978.
3 Sarli, V. J., Eiler, D. C., and Marshall, R. L., "Effects of Operating Variables on Gaseous Emissions", Air Pollution Control Association Conference, October 1975.
4 Lipfert, F. W., "Correlation of Gas Turbine Emissions Data", ASME Paper 72-GT-60, 1972.
5 Doyle, B. W., "Sampling a Turbine Engine Exhaust for Average Emissions", ASME paper 73-WA/GT-9, 1973.
u c /l
I/' (I
Downloaded From: http://proceedings.asmedigitalcollection.asme.org/ on 09/09/2018 Terms of Use: http://www.asme.org/about-asme/terms-of-use

6 Dieck, Ronald H., "Gas Turbine Emission Measure-ment Uncertainty" / Instrument Society of America Preprint
7 4-6 39, 1 974. 7 U. S. Patent Numbers 3, 645, 095 and 3, 671 ,171 . 8 40 CFR Part 87 , "Emission Standards and Test
Procedures for Aircraft", Federal Register, Vol. 38, No. 1 36, datedJuly 17, 1 973.
9 Swithenbank, J., et al, "A Laser Diagnostic Technique for the Measurement of Droplet and Particle Size Distribution", Progress in Astronautics and Aeronautics, Vol. 531 Experimental Diagnostics in Gas Phase Combustion Systems, Ben. T. Zinn, Editor, 1 977.
1 0 Anon, "The Design and Performance Analysis of Gas Turbine Combustion Chambers", Northern Research and Engineering Report 1 082-1 , Page 1 37.
11 Rubins, P. M. and Marchionna, N, R., "Eval-uation of N 0 Prediction-Correlation Equations for Smal I Gas Turbines"� Journal of Aircraft, Vol. 1 5, No. 8. , August 1 978.
1 2 Odgers, J., "Current Theories of Combustion Within Gas Turbine Chambers", Fifteenth Symposium (International) on Combustion, Pages 1 323-1 325, 1 97 4.
Downloaded From: http://proceedings.asmedigitalcollection.asme.org/ on 09/09/2018 Terms of Use: http://www.asme.org/about-asme/terms-of-use