Embed Size (px)
Citation preview

The effect of acetaminophen overdose
on catalase in hepatocytes
Extended Essay
Biology
Manuel García Ferrer – dpt253
Colegio San Francisco de Paula
2010 - 2012
Word count: 3994 words

1
Abstract
The present extended essay is the result of an investigation about the possible action of
acetaminophen as an inhibitor of catalase in pork hepatocytes. It has involved experimental
procedure in order to determine whether there is evidence of enzyme inhibition or not. The
purpose of the research was to establish a relation between acetaminophen induced
hepatotoxicity and catalase inhibition due to acetaminophen overdose. The latter was tested in
the laboratory.
The extent of the investigation included the experimental test of enzyme inhibition due
to acetaminophen, along with a bibliographical research about acetaminophen induced
hepatotoxicity, oxidative stress and liver metabolism. The extended essay shows the
experimental results and it explains the possibility of a relation between acetaminophen
intoxication and catalase inhibition. The experiments were performed at the school laboratories
and they measured how the increase in gas pressure changed as different amounts of
acetaminophen were added to the test tube where the reaction between catalase and hydrogen
peroxide was carried out, as a result of a differing amount of oxygen as a product.
Empiric data shows a satisfactory correlation between the amount of acetaminophen
present and the extent to which the reaction between catalase and hydrogen peroxide takes
place, positively confirming the hypothesis that acetaminophen inhibits catalase. Thus, the fact
that hydrogen peroxide is not fully eliminated can be added to the list of reasons which cause
liver failure due to acetaminophen overdose. (232 words)
2
Acknowledgments
I would like to thank my family and friends
for their help and support. Special thanks to
Ricardo, Juan Bautista and Rosario for
helping me find resources and materials.
Thanks also to don Germán Tenorio, my
supervisor, and the rest of my teachers, who
aided me in the long learning process of
writing this extended essay.

3
Contents
Introduction 4
The Experiment 5
Purpose 5
Hypothesis and Variables 6
Results 7
Extension 13
Discussion 14
Conclusion 15
Bibliography 16
References 16
Other information sources 17
Appendix 19
1: Method 19
2: Pictures 20
4
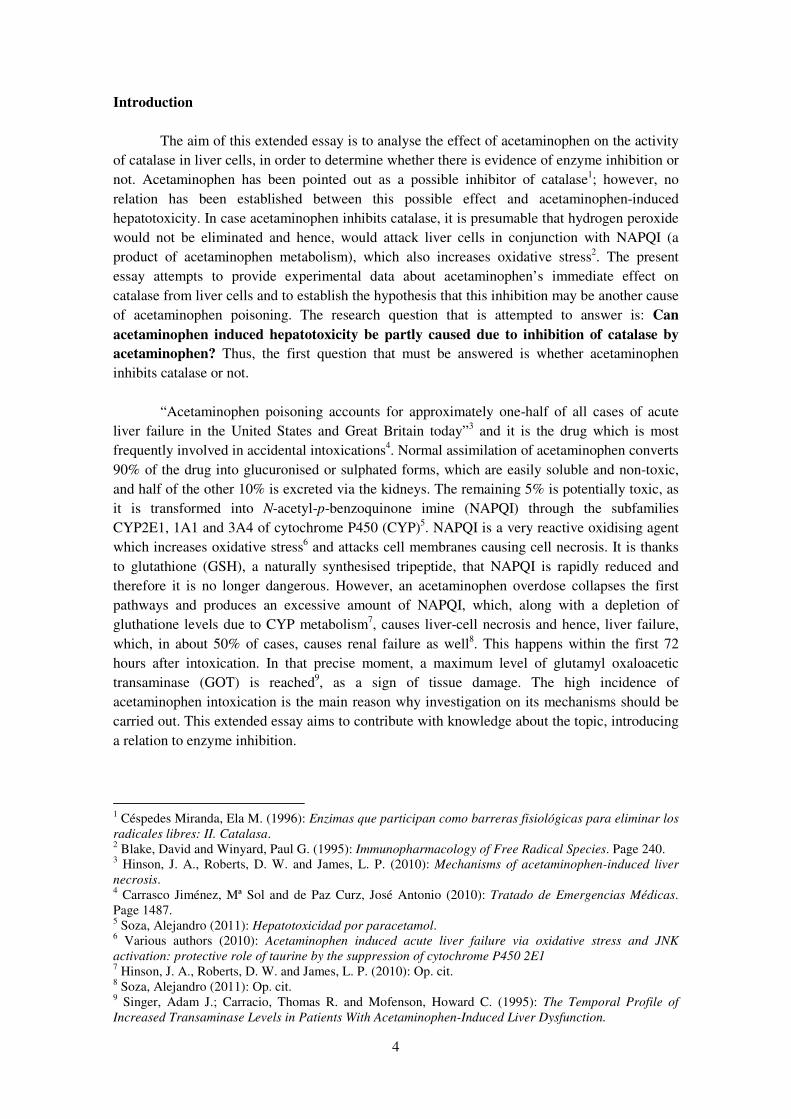
Introduction
The aim of this extended essay is to analyse the effect of acetaminophen on the activity
of catalase in liver cells, in order to determine whether there is evidence of enzyme inhibition or
not. Acetaminophen has been pointed out as a possible inhibitor of catalase1; however, no
relation has been established between this possible effect and acetaminophen-induced
hepatotoxicity. In case acetaminophen inhibits catalase, it is presumable that hydrogen peroxide
would not be eliminated and hence, would attack liver cells in conjunction with NAPQI (a
product of acetaminophen metabolism), which also increases oxidative stress2. The present
essay attempts to provide experimental data about acetaminophen’s immediate effect on
catalase from liver cells and to establish the hypothesis that this inhibition may be another cause
of acetaminophen poisoning. The research question that is attempted to answer is: Can
acetaminophen induced hepatotoxicity be partly caused due to inhibition of catalase by
acetaminophen? Thus, the first question that must be answered is whether acetaminophen
inhibits catalase or not.
“Acetaminophen poisoning accounts for approximately one-half of all cases of acute
liver failure in the United States and Great Britain today”3 and it is the drug which is most
frequently involved in accidental intoxications4. Normal assimilation of acetaminophen converts
90% of the drug into glucuronised or sulphated forms, which are easily soluble and non-toxic,
and half of the other 10% is excreted via the kidneys. The remaining 5% is potentially toxic, as
it is transformed into N-acetyl-p-benzoquinone imine (NAPQI) through the subfamilies
CYP2E1, 1A1 and 3A4 of cytochrome P450 (CYP)5. NAPQI is a very reactive oxidising agent
which increases oxidative stress6 and attacks cell membranes causing cell necrosis. It is thanks
to glutathione (GSH), a naturally synthesised tripeptide, that NAPQI is rapidly reduced and
therefore it is no longer dangerous. However, an acetaminophen overdose collapses the first
pathways and produces an excessive amount of NAPQI, which, along with a depletion of
gluthatione levels due to CYP metabolism7, causes liver-cell necrosis and hence, liver failure,
which, in about 50% of cases, causes renal failure as well8. This happens within the first 72
hours after intoxication. In that precise moment, a maximum level of glutamyl oxaloacetic
transaminase (GOT) is reached9, as a sign of tissue damage. The high incidence of
acetaminophen intoxication is the main reason why investigation on its mechanisms should be
carried out. This extended essay aims to contribute with knowledge about the topic, introducing
a relation to enzyme inhibition.
1 Céspedes Miranda, Ela M. (1996): Enzimas que participan como barreras fisiológicas para eliminar los
radicales libres: II. Catalasa. 2 Blake, David and Winyard, Paul G. (1995): Immunopharmacology of Free Radical Species. Page 240.
3 Hinson, J. A., Roberts, D. W. and James, L. P. (2010): Mechanisms of acetaminophen-induced liver
necrosis. 4 Carrasco Jiménez, Mª Sol and de Paz Curz, José Antonio (2010): Tratado de Emergencias Médicas.
Page 1487. 5 Soza, Alejandro (2011): Hepatotoxicidad por paracetamol.
6 Various authors (2010): Acetaminophen induced acute liver failure via oxidative stress and JNK
activation: protective role of taurine by the suppression of cytochrome P450 2E1 7 Hinson, J. A., Roberts, D. W. and James, L. P. (2010): Op. cit.
8 Soza, Alejandro (2011): Op. cit.
9 Singer, Adam J.; Carracio, Thomas R. and Mofenson, Howard C. (1995): The Temporal Profile of
Increased Transaminase Levels in Patients With Acetaminophen-Induced Liver Dysfunction.

5
Furthermore, acetaminophen’s metabolism in the liver is well known, yet “the precise
mechanisms of hepatocyte death are poorly understood”10
, only to the extent that necrosis is
considered the way in which hepatocytes die, rejecting the hypothesis that it is apoptosis11
.
Further investigation about acetaminophen-induced hepatotoxicity could explain how cells die,
and hydrogen peroxide’s action could be a reason, so this extended essay can bring new ideas
and ways of focusing that research question, which could ultimately serve as the basis to
develop a more effective treatment, with fewer counter-effects and higher bioavailability than
N-acetylcysteine12
(NAC), which is the most common prescription in cases of intoxication due
to acetaminophen.
The purpose of this extended essay is to add to that process the possibility of an
influence of catalase inhibition due to acetaminophen ingestion. Catalase is present in all body
cells, and it can be found inside peroxisomes, organelles which are mostly active in
hepatocytes13
(a micrograph image of peroxisomes in a hepatocyte can be found in the
appendix). This enzyme avoids excessive accumulation of hydrogen peroxide (H2O2), a toxic
oxidising agent similar to NAPQI, as it breaks it down to water and oxygen14
. The reaction is as
follows:
2H2O2 � 2H2O + O2
The essay offers experimental information about a positive inhibition of catalase in liver
cells due to the presence of acetaminophen, so it can be deducted that another possible reason
why acetaminophen is toxic is that it avoids the elimination of hydrogen peroxide naturally
produced by mitochondria in liver cells15
.
The Experiment
Purpose
The aim of the experiment was to determine whether acetaminophen acts as an inhibitor
of catalase or not. Results were expected to be obtained comparing the gas pressure produced
inside a test tube where pork liver pieces (containing catalase), hydrogen peroxide and different
amounts of acetaminophen were put in contact. Each measurement did not take long, as catalase
activity rate is one of the fastest known16
.
10
James, Laura P., Mayeux, Philip R. and Hinsons, Jack A. (2004): Acetaminophen.induced
hepatotoxicity. 11
Various authors (1999): Inhibition of Fas Receptor (CD95)-Induced Hepatic Caspase Activation and
Apoptosis by Acetaminophen in Mice. 12
Schmidt, Lars E. and Dalhoff, K. (2000): Risk factors in the development of adverse reactions to N-
acetylcysteine in patients with paracetamol poisoning. 13
Fox, Stuart Ira (2004): Fisiología humana. 7th
edition. 14 Lehninger, Albert L. (1980): Bioquímica: Las bases moleculares de la estructura y la función celular.
Page 189. 15
Sohal, R. S., Svensson, I. and Brunk, U. T. (1990): Hydrogen peroxide production by liver
mitochondria in different species. 16
Fox, Stuart Ira (2004): Op. cit. Page 60.

6
Hypothesis and variables
The hypothesis was that greater amounts of acetaminophen would lead to a lower
increase of gas pressure against time. This would support the possibility that acetaminophen
inhibits catalase. The independent variable was the amount of acetaminophen present in the test
tube. This amount was chosen to be measured as mass instead of as concentration. If it were
measured as concentration it could have helped to the reproducibility of results, as the
experiment could be carried out again in different volumes, keeping the same concentrations.
However, mass was decided to be used because acetaminophen does not dissolve well in
hydrogen peroxide at the amounts needed for the experiment. As it is not a good solute, an
important fraction of it deposits on the bottom of the test tube. Therefore, concentration could
not be used, as the solute did not fully dissolve. Instead, it was tried to keep as much of the
acetaminophen in suspension as possible by vigorously shaking the mixture before the liver
piece was added (shaking the test tube with the liver piece inside would lead to significant
errors in data collection, as it would alter the surface area that is in contact with hydrogen
peroxide at a time) and measuring the amount added in mass, most of which remained in
suspension.
The dependent variable was the amount of oxygen produced by the reaction between
catalase and hydrogen peroxide within a certain time, indirectly measured through the increase
of gas pressure inside the test tube where the reaction took place. This is an indirect
measurement of the reaction rate. After collecting data from the sensor, the gas pressure
increase slope was measured for the first 60 and 90 seconds of reaction. As mentioned before,
the reaction was fast, and 90 seconds was the time at which enzyme activity started to slow
down to zero (it could be noticed because most gas pressure against time graphs started to
appear constant after one minute and a half). However, the measurement was not the immediate
slope of one point in the graph but the slope of the line of best fit from the second 0 to the
second 60 and 90. A double measurement was chosen to be taken for each amount of
acetaminophen (in each measurement series) in order to have more trustworthy experimental
evidence that could support or discard the hypothesis.
There were many controlled variables to take into account. Most important, the size,
mass and shape of liver pieces. The purpose of this was to keep the surface that would be in
contact with the hydrogen peroxide as constant as possible, because reaction rate is extremely
dependent on the surface of the reactants17
, and a significant difference in shape (that would
lead to a difference in surface area) would introduce an important error source. Therefore, liver
pieces were cut in the most regular way possible, ensuring that their mass was always 0.50
±0.05g and that they had a similar shape. Other controlled variables were the volume of
hydrogen peroxide used in each measurement (10mL), its concentration (1.5% in mass), the
time the reaction took place in (100 seconds), the temperature of the liver (it was kept in a
refrigerator before being used for each series of measurements) and room temperature (around
16ºC) and pressure (102.72 kPa). The experiment was carried out on three consecutive days (the
20th, 21
st and 22
nd of December, 2011). Several trials were performed before to adjust the
experiment’s settings.
17
Green, John and Sadru, Damji (2008): Chemistry. 3rd
edition. Page 168.

7
Results
The experiment involved large amounts of data (a total of 2700 different gas pressure
numbers, as the gas pressure sensor collected a measurement every second) that are not shown
in this report because of practical issues. Instead, raw data about the slope of the line of best fit
applied to each measurement for the first 60 and 90 seconds are shown in the following table.
An example of a typical gas-pressure-against-time graph is shown in the appendix. “Reaction
rate” is not going to be used as a name for the slope because it does not strictly represent the rate
of the reaction18
, but the general increase of gas pressure. Each series should be treated
independently, because experimental conditions were more similar in between the
measurements of the same series, as they were performed closer in time. However, the average
between the measurements that share the same acetaminophen mass in different series can be
calculated without important errors. The following table shows the slope of the line of best fit
for every measurement, in the five different series.
Table 1: Slopes of lines of best fit for each measurement.
Series Acetaminophen mass
(±0.01g)
Slope for first 60 seconds
(±0.0001 kPa/s)
Slope for first 90 seconds
(±0.0001 kPa/s)
1
0.00 0.5820 0.4698
0.20 0.5515 0.4053
0.40 0.4716 0.3637
0.60 0.4269 0.3574
0.80 0.3613 0.3115
1.00 0.3543 0.2492
2
0.00 0.6053 0.4402
0.20 0.5941 0.4471
0.40 0.5316 0.4361
0.60 0.5044 0.4068
0.80 0.4318 0.3638
1.00 0.3250 0.2600
3
0.00 0.8045 0.6534
0.20 0.6462 0.5231
0.40 0.5228 0.4767
0.60 0.5039 0.4192
0.80 0.5831 0.4428
1.00 0.4464 0.3342
4
0.00 0.9218 0.7330
0.20 0.8293 0.6627
0.40 0.6708 0.5036
0.60 0.6735 0.4094
0.80 0.4523 0.4400
1.00 0.5492 0.4515
18
It is not the difference of oxygen concentration against the difference in time, but a graphical
generalization of the data.

8
5
0.00 0.7582 0.5814
0.20 0.6906 0.5475
0.40 0.5378 0.4091
0.60 0.5522 0.4116
0.80 0.4425 0.3810
1.00 0.4169 0.3497
As can be seen from the table above, excluding some exceptions, there is a clear
tendency of a decrease in the slope of the line of best fit (hence, in the reaction rate) as
acetaminophen mass increases. Therefore, there is an inverse relationship between the
independent and dependent variables. This can be better seen if data is plotted into graphs:
Graph 1: Slopes of lines of best fit for each measurement in series 1.
Graph 2: Slopes of lines of best fit for each measurement in series 2.
0,0
0,1
0,2
0,3
0,4
0,5
0,6
0,7
0,0 0,2 0,4 0,6 0,8 1,0 1,2
Slo
pe
of
lin
e o
f b
est
fit
(±0
.00
01
kP
a/s
)
Acetaminophen mass (±0.01g)
60s
90s
0,0
0,1
0,2
0,3
0,4
0,5
0,6
0,7
0 0,2 0,4 0,6 0,8 1 1,2
Slo
pe
of
lin
e o
f b
est
fit
(±0
.00
01
kP
a/s
)
Acetaminophen mass (±0.01g)
60s
90s
9
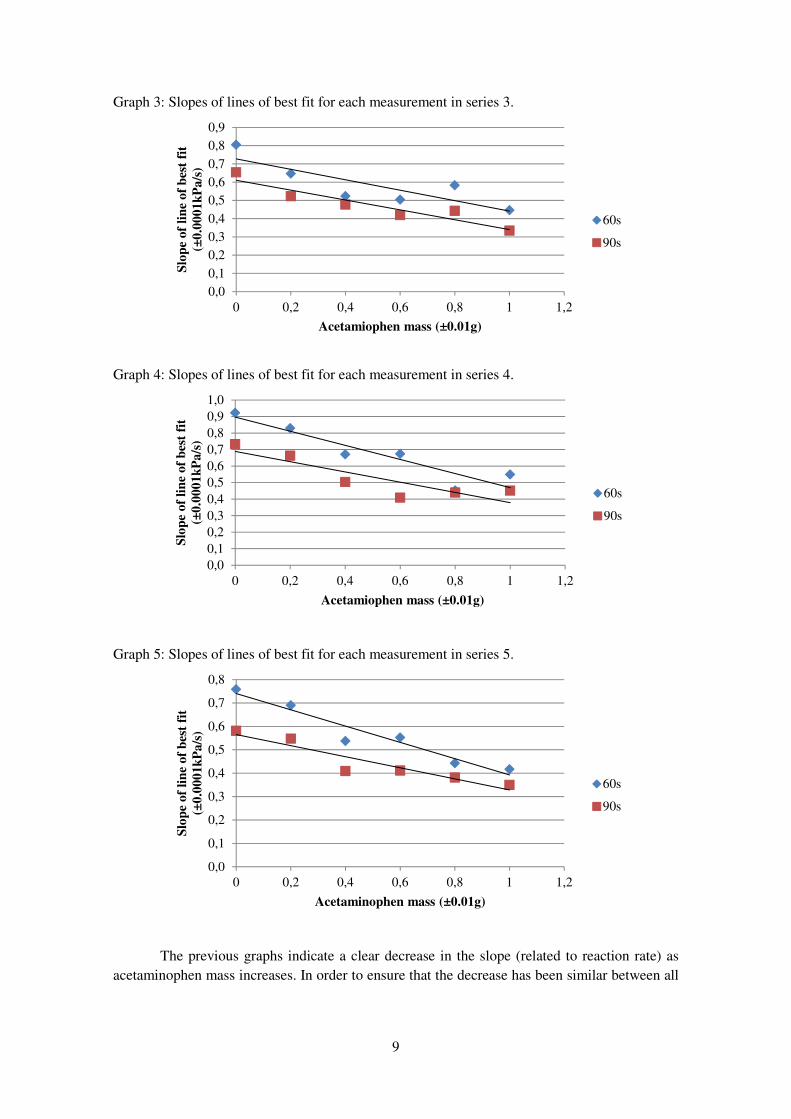
Graph 3: Slopes of lines of best fit for each measurement in series 3.
Graph 4: Slopes of lines of best fit for each measurement in series 4.
Graph 5: Slopes of lines of best fit for each measurement in series 5.
The previous graphs indicate a clear decrease in the slope (related to reaction rate) as
acetaminophen mass increases. In order to ensure that the decrease has been similar between all
0,0
0,1
0,2
0,3
0,4
0,5
0,6
0,7
0,8
0,9
0 0,2 0,4 0,6 0,8 1 1,2
Slo
pe
of
lin
e o
f b
est
fit
(±0
.00
01
kP
a/s
)
Acetamiophen mass (±0.01g)
60s
90s
0,0
0,1
0,2
0,3
0,4
0,5
0,6
0,7
0,8
0,9
1,0
0 0,2 0,4 0,6 0,8 1 1,2
Slo
pe
of
lin
e o
f b
est
fit
(±0
.00
01
kP
a/s
)
Acetamiophen mass (±0.01g)
60s
90s
0,0
0,1
0,2
0,3
0,4
0,5
0,6
0,7
0,8
0 0,2 0,4 0,6 0,8 1 1,2
Slo
pe
of
lin
e o
f b
est
fit
(±0
.00
01
kP
a/s
)
Acetaminophen mass (±0.01g)
60s
90s

10
measurement series, so as to ensure that a correlation can be established, the trend line19
for
every graph has been obtained and the average between their slopes has been calculated:
Table 2: Slopes of trend lines for each data series in graphs 1 to 5.
Graph / Series Slope of trend line
60s 90s
1 -0,2505 -0,1987
2 -0,2737 -0,1686
3 -0,2855 -0,2706
4 -0,4273 -0,3100
5 -0,3481 -0,2365
Average -0,3170 -0,2369
SD 0,07145 0,05613
% SD 20
22,54 23,70
The values of SD% are within the limits used in Biology (33%). Therefore, it is
acceptable to establish a correlation between acetaminophen mass and the slope of the line of
best fit. The average between the measurements that share the same acetaminophen mass among
the five series has been calculated and shown in the following table:
Table 3: Average of slopes of lines of best fit for each acetaminophen mass.
60s 90s
Acetaminophen
mass (±0,01g)
Average slope
(± 0,0005kPa/s)21
SD %SD
Average slope
(± 0,0005kPa/s) SD %SD
0,00 0,7344 0,1419 19,32 0,5756 0,1229 21,35
0,20 0,6623 0,1071 16,17 0,5171 0,0994 19,23
0,40 0,5469 0,0740 13,53 0,4378 0,0551 12,59
0,60 0,5322 0,0909 17,07 0,4009 0,0247 6,170
0,80 0,4542 0,0804 17,71 0,3878 0,0552 14,24
1,00 0,4184 0,0876 20,95 0,3289 0,0815 24,79
19
This can be confusing, as the previous graphs also represent slopes of lines of best fit. In order to
differentiate them, “trend line” will refer to the lines of best fit for graphs 1 to 5.”Line of best fit” will
remain for those obtained with the sensor and the computer program. 20
“%SD” always refers to what percentage of the average does the standard deviation correspond to. 21
The error is ±0,0005 because we have added five numbers with an error of ±0,0001.

11
Graph 6: Average of slopes of lines of best fit for each acetaminophen mass (data from table 3).
Lines of best fit have been obtained for the two data series in graph 6.
Table 4: Equations and R2 value of lines of best fit in graph 6.
Data series Equation R2
60s y = -0,3170x + 0,7166 0,963
90s y = -0,2369x + 0,5598 0,960
The next step is to calculate the quantitative effect of acetaminophen on catalase. From
the raw data collected, we obtain the actual average increase in gas pressure produced with each
mass of acetaminophen. Knowing the volume and temperature inside the test tube, we can
calculate the number of moles of oxygen that have caused that increase in pressure. The volume
of water produced could influence the result, but the amount is so small that we do not take it
into account. The following table shows the average increase in gas pressure (called “g. p.”) and
its corresponding number of moles, being the unoccupied volume in the test tube 17.0mL and
the temperature 289K. As the reaction is exothermic, we introduce a random error (it is different
depending on the amount of reagents present), because we cannot measure the temperature
inside the test tube during the reaction (it is not viable, due to the experimental method).
0,0
0,1
0,2
0,3
0,4
0,5
0,6
0,7
0,8
0,9
1,0
0,0 0,2 0,4 0,6 0,8 1,0 1,2
Slo
pe
of
lin
e o
f b
est
fit
(±0
.00
05
kP
a/s
)
Acetaminophen mass (±0.01g)
60s
90s
12
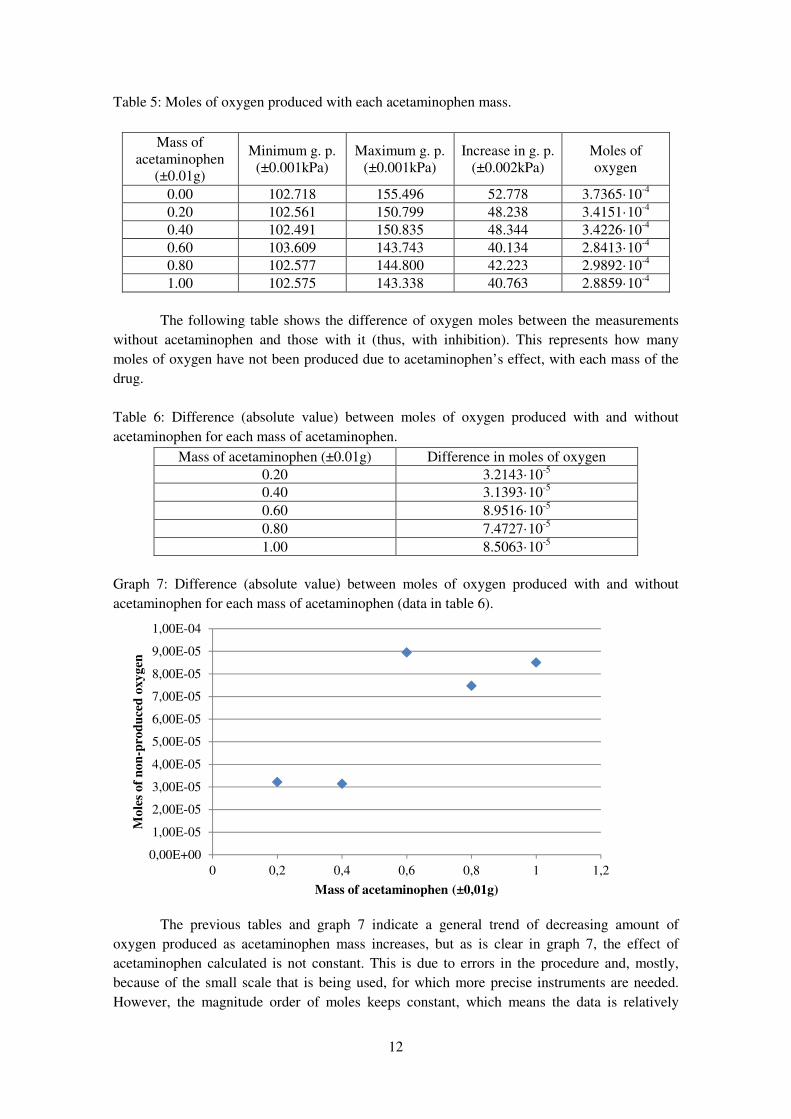
Table 5: Moles of oxygen produced with each acetaminophen mass.
Mass of
acetaminophen
(±0.01g)
Minimum g. p.
(±0.001kPa)
Maximum g. p.
(±0.001kPa)
Increase in g. p.
(±0.002kPa)
Moles of
oxygen
0.00 102.718 155.496 52.778 3.7365·10-4
0.20 102.561 150.799 48.238 3.4151·10-4
0.40 102.491 150.835 48.344 3.4226·10-4
0.60 103.609 143.743 40.134 2.8413·10-4
0.80 102.577 144.800 42.223 2.9892·10-4
1.00 102.575 143.338 40.763 2.8859·10-4
The following table shows the difference of oxygen moles between the measurements
without acetaminophen and those with it (thus, with inhibition). This represents how many
moles of oxygen have not been produced due to acetaminophen’s effect, with each mass of the
drug.
Table 6: Difference (absolute value) between moles of oxygen produced with and without
acetaminophen for each mass of acetaminophen.
Mass of acetaminophen (±0.01g) Difference in moles of oxygen
0.20 3.2143·10-5
0.40 3.1393·10-5
0.60 8.9516·10-5
0.80 7.4727·10-5
1.00 8.5063·10-5
Graph 7: Difference (absolute value) between moles of oxygen produced with and without
acetaminophen for each mass of acetaminophen (data in table 6).
The previous tables and graph 7 indicate a general trend of decreasing amount of
oxygen produced as acetaminophen mass increases, but as is clear in graph 7, the effect of
acetaminophen calculated is not constant. This is due to errors in the procedure and, mostly,
because of the small scale that is being used, for which more precise instruments are needed.
However, the magnitude order of moles keeps constant, which means the data is relatively
0,00E+00
1,00E-05
2,00E-05
3,00E-05
4,00E-05
5,00E-05
6,00E-05
7,00E-05
8,00E-05
9,00E-05
1,00E-04
0 0,2 0,4 0,6 0,8 1 1,2
Mo
les
of
no
n-p
rod
uce
d o
xy
gen
Mass of acetaminophen (±0,01g)
13
acceptable. We cannot calculate the exact effect of acetaminophen based on these data because
the error is too high. What we can obtain is the certainty that a higher presence of
acetaminophen in hepatocytes lowers the activity of catalase, as the moles of oxygen produced
are less with high masses of acetaminophen. From graph 7 we could deduct that 0.60 grams of
acetaminophen is the value for which inhibition reaches its maximum, and higher amounts of
acetaminophen do not represent a relevant effect. However, further investigation must be carried
out to ensure this assertion.
Qualitative data
There are some experimental observations that should be detailed:
• During the reaction, a brown coloured phase appeared beneath the liver piece. It may
be a result of the attack exerted by hydrogen peroxide on liver cells.
• If the test tube were shaken during the reaction, gas pressure increased drastically, as an
effect of a larger surface being in contact with hydrogen peroxide. The measurements
in which the test tube was shaken have not been taken into account in the results.
• The second series of measurements was done with liver pieces that came from the same
liver as in the first one (the third, fourth and fifth series were performed with another
liver bought at the same butchery and were performed on the same day). The second
series was performed a day after the first one, and the liver was more dehydrated and
flaccid, as well as having a slightly darker colour. However, the general state and
catalase content were the same, as results were similar.
• The test tube stopper had to be held with the hand because gas pressure inside the test
tube within the first 90 seconds of reaction was enough to push it out.
• Acetaminophen did not dissolve completely in hydrogen peroxide, so part of the white
solid was deposited on the bottom of the test tube.
• There was no apparent reaction between acetaminophen and hydrogen peroxide that
could lead to errors in the experiment.
Extension
A similar version of the experiment was tried, this time immersing two different liver
pieces (0.5g each) in different media of the same volume (50mL) for two minutes. The first
medium was water, and it was compared to the second one, dissolved acetaminophen (10g·L-1
).
The aim was to test if there would be a larger effect of acetaminophen as an inhibitor of catalase
if the liver piece had been in contact with it over a longer period of time. After being in their
respective media for two minutes, the liver pieces were put in contact with 10mL of hydrogen
peroxide 1.5% in mass for another two minutes. The increase in gas pressure produced by the
reaction was measured with the sensor and the effect of the different media was compared.
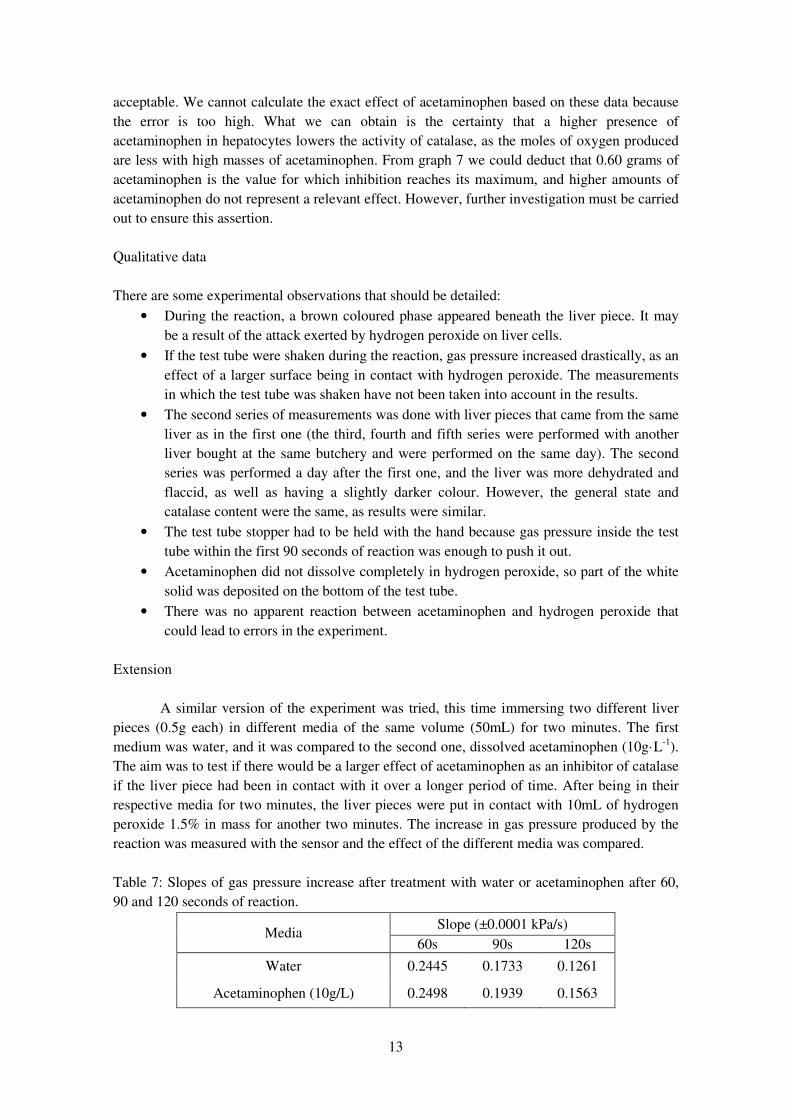
Table 7: Slopes of gas pressure increase after treatment with water or acetaminophen after 60,
90 and 120 seconds of reaction.
Media Slope (±0.0001 kPa/s)
60s 90s 120s
Water 0.2445 0.1733 0.1261
Acetaminophen (10g/L) 0.2498 0.1939 0.1563
14
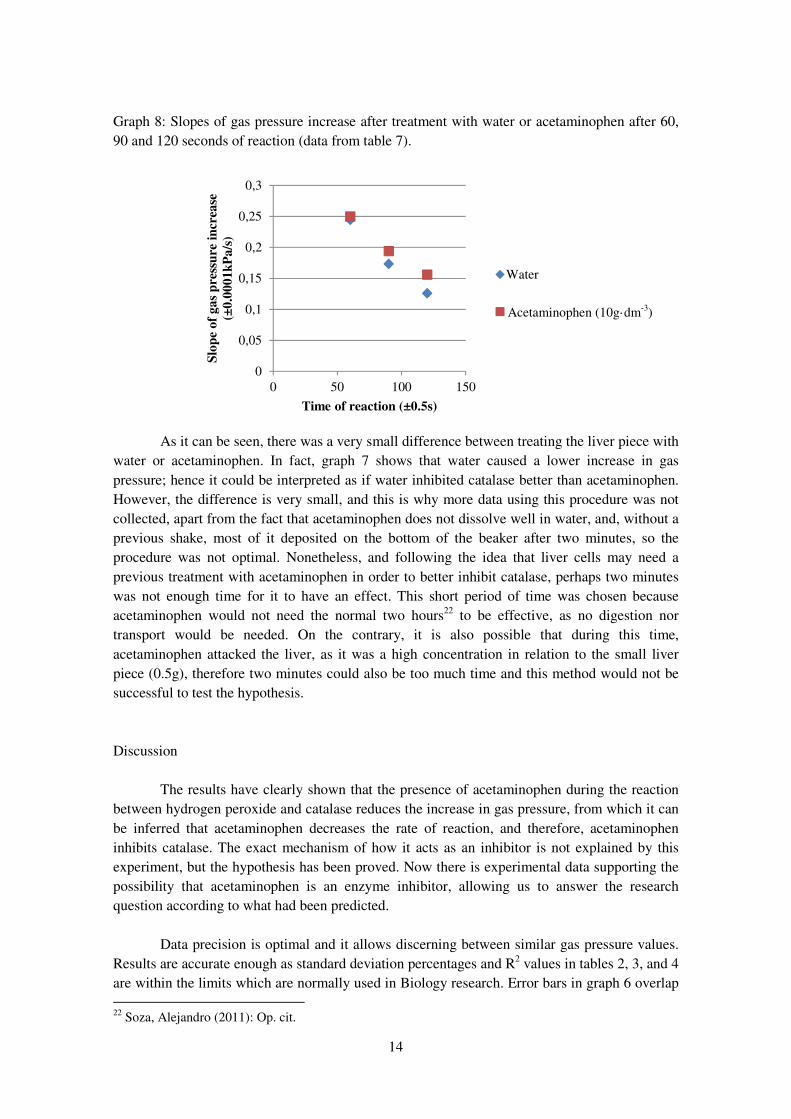
Graph 8: Slopes of gas pressure increase after treatment with water or acetaminophen after 60,
90 and 120 seconds of reaction (data from table 7).
As it can be seen, there was a very small difference between treating the liver piece with
water or acetaminophen. In fact, graph 7 shows that water caused a lower increase in gas
pressure; hence it could be interpreted as if water inhibited catalase better than acetaminophen.
However, the difference is very small, and this is why more data using this procedure was not
collected, apart from the fact that acetaminophen does not dissolve well in water, and, without a
previous shake, most of it deposited on the bottom of the beaker after two minutes, so the
procedure was not optimal. Nonetheless, and following the idea that liver cells may need a
previous treatment with acetaminophen in order to better inhibit catalase, perhaps two minutes
was not enough time for it to have an effect. This short period of time was chosen because
acetaminophen would not need the normal two hours22
to be effective, as no digestion nor
transport would be needed. On the contrary, it is also possible that during this time,
acetaminophen attacked the liver, as it was a high concentration in relation to the small liver
piece (0.5g), therefore two minutes could also be too much time and this method would not be
successful to test the hypothesis.
Discussion
The results have clearly shown that the presence of acetaminophen during the reaction
between hydrogen peroxide and catalase reduces the increase in gas pressure, from which it can
be inferred that acetaminophen decreases the rate of reaction, and therefore, acetaminophen
inhibits catalase. The exact mechanism of how it acts as an inhibitor is not explained by this
experiment, but the hypothesis has been proved. Now there is experimental data supporting the
possibility that acetaminophen is an enzyme inhibitor, allowing us to answer the research
question according to what had been predicted.
Data precision is optimal and it allows discerning between similar gas pressure values.
Results are accurate enough as standard deviation percentages and R2 values in tables 2, 3, and 4
are within the limits which are normally used in Biology research. Error bars in graph 6 overlap
22
Soza, Alejandro (2011): Op. cit.
0
0,05
0,1
0,15
0,2
0,25
0,3
0 50 100 150
Slo
pe
of
ga
s p
ress
ure
in
crea
se
(±0
.00
01
kP
a/s
)
Time of reaction (±0.5s)
Water
Acetaminophen
(10g·dm)Acetaminophen (10g·dm
-3)
15
with each other, but this would only be a problem if we tried to determine the exact effect of
each mass of acetaminophen. Although bars overlap, there is inhibition evidence, supported by
the very good R2 values in table 4. The main error sources are keeping the test tube still in order
not to shake it, as it had to be held with the hand; the difference in shape among liver pieces and
therefore, in the surface that was in contact with hydrogen peroxide, and the different conditions
between the different measurement series, one of the most important being the liver temperature
and state (colour and texture changed slightly, but temperature was kept constant enough).
One of the main weak points of the experiment is the fact that acetaminophen does not
dissolve readily in hydrogen peroxide, at least not at the concentrations needed to fulfil the
investigation. However, this error was constant throughout the measurements, as a proportional
fraction of the acetaminophen mass added remained in suspension, apart from the solid that
dissolved until the solution was saturated (which happened rapidly). Another weakness was the
presence of excipients23
in acetaminophen, which were not eliminated and could lead to errors,
because the inhibition could be caused by any of them. However, most of the drug is
acetaminophen (unfortunately, its exact concentration is unknown) and ultimately, considering
that the inhibition of catalase may not be due to acetaminophen, the results and conclusions in
this extended essay would not be valid for any of the existing commercial versions of
acetaminophen, but they would serve to analyse the effect of the one used in the experiment.
In order to improve the investigation, the experiment could be carried out in different
conditions. The best improvement would be to assess the effect of acetaminophen on purified
catalase. Thus, we could be sure that the effect shown by the experiment was due to inhibition
and not because of any other possible factor. Moreover, similar experiments could be
performed, changing any of the controlled variables as the mass of the liver piece, the
concentration of hydrogen peroxide or the amounts of acetaminophen used, in order to
corroborate the results shown in the present extended essay.
Conclusion
The experiment provided evidence which, within its limitations, proves that
acetaminophen inhibits catalase. Inhibiting the enzyme means that hydrogen peroxide produced
by mitochondria in the liver is not correctly eliminated. Therefore, it attacks cells, increases
their permeability24
and causes necrosis25
. It can be inferred that an acetaminophen overdose is
hazardous due to, apart from the already known effect of NAPQI, hydrogen peroxide’s action in
liver cells (it acts in the liver because it is where acetaminophen is metabolised). This indicates
that treatment in cases of acetaminophen-induced hepatotoxicity should also target hydrogen
peroxide or catalase inhibition mechanism in order to be more successful.
Answering the research question, inhibition of catalase by acetaminophen can cause its
hepatotoxicity, to the point that it avoids the elimination of another toxic agent, hydrogen
23
Excipients were pregelatinized corn starch (without gluten), stearic acid, povidone
(polyvinylpyrrolidone, PVP), crospovidone, microcrystalline cellulose and vegetal origin magnesium
stearate. Source: Paracetamol Pharma Combix 1g prospectus. 24
Thomson, David Landsborough. (1927): The Effect of Hydrogen Peroxide on the Permeability of the
Cell. 25
James, Laura P., Mayeux, Philip R. and Hinsons, Jack A. (2004): Op. cit.

16
peroxide, and therefore, exposes liver cells to danger by a free radical species. However, there
are still some unresolved questions, whose answers would be provided by a broader
investigation about the topic. It would be useful to further develop the investigation by
increasing the range of acetaminophen mass studied and performing statistical analysis in order
to support or reject the hypothesis more efficiently. The minimum amount that causes a
noticeable inhibition effect needs to be determined, as well as the way in which hydrogen
peroxide’s action could be involved in the unexplained cellular death mechanism.
The present extended essay has fulfilled its purpose, as it has opened a new approach to
acetaminophen-induced hepatotoxicity, solidly supporting it with experimental evidence.
Further investigation is needed and encouraged in order to re-test the hypothesis and evaluate
the proportions at which acetaminophen is hazardous due to catalase inhibition. This can lead to
new treatments that substitute those being currently used, as NAC, and improve their
effectiveness, tackling enzyme inhibition as well as NAPQI proliferation.
Bibliography
References:
Blake, David and Winyard, Paul G. (1995): Immunopharmacology of Free Radical Species. San
Diego: Academic Press.
Carrasco Jiménez, Mª Sol and de Paz Curz, José Antonio (2010): Tratado de Emergencias
Médicas. 2 volumes. Madrid: Arán.
Céspedes Miranda, Ela M. (1996): Enzimas que participan como barreras fisiológicas para
eliminar los radicales libres: II. Catalasa [on-line document]. La Habana: Institute of Basic and
Preclinical Sciences. Last modified: Unknown date. Last visited: 17/12/2011. Available on
Web: http://bvs.sld.cu/revistas/ibi/vol15_2_96/ibi01296.htm
Fawcett, Don W. (1981): The Cell. Chapter 9: Peroxisomes. Second Edition. Available on Web:
http://www.ascb.org/bioeducate/images/FawcettTheCellPDFs/FawcettTheCellChapter9.pdf
Fox, Stuart Ira (2004): Fisiología humana. 7th edition (Spanish translated version). Getafe:
McGraw Hill.
Green, John and Sadru, Damji (2008): Chemistry. 3rd
edition. Victoria: IBID Press.
Hinson, J. A., Roberts, D. W. and James, L. P. (2010): Mechanisms of acetaminophen-induced
liver necrosis (abstract) [on-line document]. Arkansas: National Center for Biotechnology
Information. Last modified: Unknown date. Last visited: 27/12/2011. Available on Web: http://www.ncbi.nlm.nih.gov/pubmed/20020268
James, Laura P., Mayeux, Philip R. and Hinsons, Jack A. (2004): Acetaminophen.induced
hepatotoxicity [on-line document]. Arkansas: American Society for Pharmacology and
Experimental Therapeutics in Drug Metabolism and Disposition. Last modified: 25/06/2003.
Last visited: 03/01/2012. Available on Web: http://dmd.aspetjournals.org/content/31/12/1499.short
17
Lehninger, Albert L. (1980): Bioquímica: Las bases moleculares de la estructura y la función
celular. 2nd
edition (Spanish translated version). Barcelona: Omega.
Schmidt, Lars E. and Dalhoff, K. (2000): Risk factors in the development of adverse reactions to
N-acetylcysteine in patients with paracetamol poisoning [on-line document]. Copenhagen
National Center for Biotechnology Information. Last modified: 03/10/2000. Last visited:
03/01/2012. Available on Web: http://www.ncbi.nlm.nih.gov/pmc/articles/PMC2014432/
Singer, Adam J.; Carracio, Thomas R. and Mofenson, Howard C. (1995): The Temporal Profile
of Increased Transaminase Levels in Patients With Acetaminophen-Induced Liver Dysfunction
(abstract) [on-line document]. Salt Lake City: Annals of Emergency Medicine. Volume 26,
Issue 1, pages 49 to 53, July 1995. Last modified: Unknown date. Last visited: 03/01/2012.
Available on Web: http://www.annemergmed.com/article/S0196-0644(95)70237-7/abstract
Sohal, R. S., Svensson, I. and Brunk, U. T. (1990): Hydrogen peroxide production by liver
mitochondria in different species (abstract) [on-line document]. Dallas: National Center for
Biotechnology Information. Last modified: Unknown date. Last visited: 03/01/2012. Available
on Web: http://www.ncbi.nlm.nih.gov/pubmed/2115947
Soza, Alejandro (2011): Hepatotoxicidad por paracetamol [on-line document]. Last modified:
27/04/2011. Last visited: 19/12/2011. Available on Web: http://hepatitis.cl/882/hepatotoxicidad-
paracetamol
Thomson, David Landsborough. (1927): The Effect of Hydrogen Peroxide on the Permeability
of the Cell [on-line document]. Cambridge: Institue of Biochemistry, University of Cambridge.
Last modified: Unknown date. Last visited: 03/01/2012. Available on Web:
http://jeb.biologists.org/content/5/3/252.full.pdf
Unknown author (2009): Paracetamol Pharma Combix 1g prospectus. Madrid: Laboratorios
Combix.
Various authors (2010): Acetaminophen induced acute liver failure via oxidative stress and JNK
activation: protective role of taurine by the suppression of cytochrome P450 2E (abstract) [on-
line document]. Kolkata: National Center for Biotechnology Information. Last modified:
Unkown date. Last visited: 03/01/2012. Available on Web: http://www.ncbi.nlm.nih.gov/pubmed/20166895
Various authors (1999): Inhibition of Fas Receptor (CD95)-Induced Hepatic Caspase
Activation and Apoptosis by Acetaminophen in Mice (abstract) [on-line document]. Michigan:
Toxicology and Applied Pharmacology. Volume 156, issue 3, 1st May 1999, pages 179 to 186.
Last modified: 27/03/2002. Last visited: 03/01/2012. Available on Web:
http://www.sciencedirect.com/science/article/pii/S0041008X99986350
Other information sources:
Guyton, Arthur C. and Hall, John E. (2011): Tratado de fisiología médica (translated version).
12th edition. Barcelona: Elsevier.

18
Tanner, George A. and Rhoades, Rodney A. (2003): Medical Physiology. Philadelphia:
Williams & Wilkins.
Illingworth, John (2001): Liver Metabolism (Metabolic map) [on-line document]. University of
Leeds. Last modified: Unknown date. Last visited: 14/12/2011. Available on Web:
http://www.bmb.leeds.ac.uk/teaching/icu3/metabol/
Unknown author (2011): Acetaminophen [on-line document]. Last modified: 13/01/2011. Last
visited: 17/12/2011. Available on Web: http://www.drugs.com/monograph/acetaminophen.html
Koeppen, Bruce M. and Stanton, Bruce A. (2009): Fisiología (translated version). 6th edition.
Barcelona: Elsevier.
Pocock, Gilian and Richards, Cristopher D. (2002): Fisiología humana: la base de la medicina
(translated version). Barcelona: Masson.
Satorre Rosas, Javier (1992): Efectos de dos antagonistas del calcio, diltiazem y nifedipina,
sobre la hepatotoxicidad inducida por sobredosis de paracetamol en el ratón (abstract) [on-line
document]. University of Alicante. Alicante, Spain. Last modified: Unknown date. Last visited:
17/12/2011. Available on Web:
http://www.mastesis.com/tesis/efectos+de+dos+antagonistas+del+calcio-
2C+diltiazem+y+nifedi:40814
Various authors (1999): Neonatal oxidative liver metabolism: effects of hydrogen peroxide, a
putative mediator of septic damage (abstract) [on-line document]. Published at Journal of
Pediatric Surgery. Presented at Toronto, Canada. Last modified: Unknown date. Last visited:
17/12/2011. Available on Web: http://www.jpedsurg.org/article/S0022-3468(99)90577-
8/abstract

19
Appendix 1: Method26
List of materials:
• Acetaminophen 1g (the label used in the experiment was Paracetamol Pharma Combix
1g)
• Beaker (100mL)
• Computer with Vernier software
• Distilled water
• Graduated cylinder (up to 50mL)
• Hydrogen peroxide (dilute to 1.5% in mass)
• Knife
• Pipette and pipette bulb
• Pork liver (50g)
• Scale (3 decimal figures)
• Spoon and spatula
• Test tubes
• Vernier gas pressure sensor
• Watch glasses (2)
Procedure: (for one series of measurements)
1. Connect the sensor to the computer and open Vernier software.
2. Cut six liver pieces and ensure they weigh 5g. Place them on one watch glass.
3. Weigh the acetaminophen that is going to be used in the measurement (from 0.00g to
1.00g, in intervals of 0.20g).
4. Pour 10mL of hydrogen peroxide 1.5% in a test tube.
5. Pour the acetaminophen into the test tube and shake vigorously.
6. Start collecting data from the gas pressure sensor onto the computer.
7. Place a liver piece inside the test tube.
8. Cover the test tube immediately with its stopper.
9. Wait until 90 seconds have passed since the test tube was covered and stop the
measurement.
10. Collect data from the computer and calculate the slope of the increase of gas pressure in
the first 60 and 90 seconds of the measurement (since the liver piece was added).
11. Repeat the procedure for each measurement (different amounts of acetaminophen).
26
This is a description of exactly how the experiment was performed, including labels of the materials
used. Similar results can be obtained through a similar procedure with different materials.

20
Appendix 2: Pictures
Commented images about materials, instruments and procedure are shown below:
Image 1: Gas pressure against time graph
This is a screen capture showing Vernier software after performing one measure. The
shaded area shows the time taken into account in results processing, i.e. from the moment in
which liver was put in contact with hydrogen peroxide until 90 seconds later. Two lines of best
fit can be seen, corresponding to the first 60 and 90 seconds of reaction. At the beginning there
is a sudden increase in gas pressure, after what the graph becomes convex. Near the end of the
shaded area there is an increase that does not follow the general trend. This is due to an error,
most probably because of an involuntary movement of the test tube. This is why this
measurement was not taken into account, and it was repeated. The sudden decrease in gas
pressure at the very end of the graph is due to the release of the stopper.
Image 2: Connection between the test tube and the computer.

21
The test tube stopper had a hole where the plastic tube (seen in the image) was
connected. This was then attached to the gas sensor (a small box appearance), which was finally
connected via USB to the computer. Data was collected immediately, and it responded rapidly
to any voluntary change of gas pressure.
Image 3: Acetaminophen used.
Acetaminophen was bought in tablets, which were triturated with the help of a mortar
and pestle. Exhaustive trituration was essential because it allowed for better dissolving of
acetaminophen and a more homogeneous effect.
Image 4: Liver and liver pieces.
Liver pieces of same weight and similar shape on a watch glass. Cutting the liver
equally is one of the main error sources in the experiment. A good, sharp knife is needed.

22
Image 5: Reaction.
The image shows a test tube with a liver piece and hydrogen peroxide (without
acetaminophen) during a measurement. It can be observed how a different liquid phase appears
beneath the liver piece. Near the end of the measurement, this phase turned brownish in colour.
Image 6: Peroxisomes in rat hepatocyte (pointed with arrows).
Image from: Fawcett, Don W. (1981): The Cell. Chapter 9: Peroxisomes. 2
nd edition.
Phase under liver piece
Stopper and connection
to the sensor and
computer.
Liver piece.
Hydrogen peroxide.
Oxygen bubbles