Embed Size (px)
Citation preview

355
SP-230—21
The Effect of Adhesive Type on the Bondof NSM Tape to Concrete
by C. Shield, C. French, and E. Milde
Synopsis:Synopsis:Synopsis:Synopsis:Synopsis: Near surface mounted (NSM) reinforcement is becoming a viable materialfor strengthening existing concrete structures in flexure and shear. As this methodmoves from the laboratory testing phase to implementation in the field, designers willneed to be able to predict the capacity of the strengthening scheme. Bond of NSMreinforcement to concrete will likely be a key factor in determining the strengthenedcapacity. There are a number of parameters that affect bond between steel rebar andconcrete, where only two different materials are present. In the case of bond of NSMreinforcement, a third material, adhesive, is present, further complicating the analyticaldescription of bond of NSM reinforcement. This paper presents the results of two typesof bond tests that were used to determine the effect of epoxy adhesive materialproperties on the bond of NSM tape to concrete. From the testing, it was found thateven for epoxy adhesives with similar shear strengths, the bond strength and bondfailure mechanisms differ significantly.
Keywords: bond; FRP; NSM

356 Shield et al.Carol Shield is an Associate Professor in the Department of Civil Engineering at the
University of Minnesota. She serves as secretary of ACI Committee 440.
Cathy French is a Professor in the Department of Civil Engineering at the University of
Minnesota. She is member of ACI Committees 352 and 318 and Chairs subcommittee
318B.
Emily Milde is a Master's Degree candidate in Structural Engineering at the University of
Minnesota. She is currently an Intern Structural Engineer at Opus Architects and
Engineers.
INTRODUCTION
Several different types of fiber reinforced polymers (FRP) are available for use in
strengthening applications. The most common are externally bonded sheets and plates.
Near surface mounted (NSM) reinforcement is a recent development that has been
gaining attention. Near surface mounted FRP is installed by first cutting a groove in the
surface of the concrete. The groove is then filled with an appropriate adhesive, and the
NSM reinforcement is placed in the groove. Round FRP rods have been studied by
researchers for use as NSM reinforcement (De Lorenzis, Nanni, and La Tegola 2000; De
Lorenzis and Nanni 2001, 2002; De Lorenzis, Lundgren and Rizzo 2004; Valerio and
Ibell 2003). Rectangular FRP tape is emerging as an alternative NSM reinforcement, but
is not yet widely available.
Externally bonded (EB) and NSM FRP each have their own advantages and
drawbacks. Externally bonded FRP sheets can easily form to the shape of the structural
member. This makes them more suitable for curved, I-shaped, T-shaped or otherwise
oddly shaped members. A disadvantage of the EB FRP is the possibility of premature
debonding. NSM FRP cannot usually form to the shape of a beam, but it can be anchored
into flanges or adjacent members. The NSM FRP is much less sensitive to surface
preparation than the EB FRP. NSM FRP also has more consistent quality because it is
pre-cured and pultruded. It is also better protected after installation because it is
embedded in the concrete.
Tensile bond tests conducted by Blaschko and Zilch (1999) indicated that applying
FRP in slits greatly increased the ultimate load over applying FRP to the surface of the
concrete. Hassan and Rizkalla (2002) compared the cost and effectiveness of rectangular
NSM reinforcement to round NSM bars and EB sheets. Externally bonded sheets and
rectangular NSM strips were found to be the most cost effective repair methods when
cost of materials, equipment and labor were analyzed for a 30% increase in flexural
strength of an existing bridge. Carolin, Nordin and Talisten (2001) conducted tests on
seven beams strengthened in flexure with one or two square (10 x 10 mm [0.4 x 0.4in] )
NSM reinforcement, and found that the strength of the beam was increased by 57% when
one bar was added and between 93 and 141% when two bars were added, depending on
the bonding material used.
FRPRCS-7 357De Lorenzis, Lundgren and Rizzo (2004) conducted a bond test on round NSM bars
using groove filling material (epoxy paste and expansive cement) as a variable. It was
found that tests with epoxy-filled grooves had higher strength than tests with expansive
cement-filled grooves, attributed to the higher tensile strength of the epoxy. Carolin,
Nordin and Talisten (2001) tested beams strengthened on the underside in flexure with
square NSM rods and recommended using cement mortar instead of epoxy for
improvement of health and environmental conditions on site.
Surface treatment of the bars was a variable in bond tests conducted by De Lorenzis
Lundgren and Rizzo (2004). Both CFRP and GFRP bars were tested. Specimens
containing bars with a spirally wound surface deformation pattern had higher bond
strengths than specimens containing bars with a ribbed surface. De Lorenzis and Nanni
(2002) found that deformed bars were more likely to cause a splitting failure of the
surrounding material, while sand coated rods were more likely to pull out.
Surface preparation of the groove was also a variable in bond tests conducted by De
Lorenzis, Lundgren and Rizzo (2004). The specimens with rougher grooves made by
saw cutting achieved higher loads than specimens with smooth formed grooves.
Groove width was a variable in bond tests performed by De Lorenzis and Nanni
(2001, 2002). They found that increasing the size of the groove increased the strength
until the increase in groove width changed the mode of failure from splitting of the epoxy
cover to longitudinal and inclined cracking of the surrounding concrete. De Lorenzis,
Lundgren and Rizzo (2004) found that increasing the groove size increased the bond
strength by delaying the splitting failure.
Several researchers investigated the effects of different bond lengths. Yan et al.
(1999) using pullout tests, De Lorenzis and Nanni (2001) using a Rilem type hinged
beam bond test and De Lorenzis, Lundgren and Rizzo (2004) using pullout tests with
round No. 3 NSM FRP bars, found that increasing the bonded length of the NSM
reinforcement over the range of 4db to 9d
b significantly increased the ultimate load, while
a further increase in bonded length to 14db showed only modest increases in ultimate
load. Hassan and Rizkalla (2003) conducted beam tests using rectangular NSM tape (25
x 1.2mm [1 x 0.05 in]) to strengthen beams in flexure, where the length of the NSM tape
was a variable. They found that tape lengths of less than 500 mm (19.7 in) did not result
in a significant load increase over the control beam with no FRP due to premature
debonding of the tape. Tape lengths between 500 mm (19.7 in) and 1700 mm (66.9 in)
resulted in a load increase of approximately 15 to 45% over the control beam with no
NSM, but eventually failed by debonding of the FRP tape. Tape lengths greater than
1700 mm (66.9 in) had the highest loads, with a load increase of approximately 53% over
the control beam, and failed by rupture of the strips. In contrast to the previously
mentioned work on round NSM bars, Hassan and Rizkalla’s work indicated that the
development length for the rectangular NSM tape on the beams in the study was
approximately 850 mm (33.5 in), the length of tape on either side of the central flexural
crack. The large discrepancy in development length may be due to the significantly
different types of testing and not necessarily due to the different cross-sectional shape.
358 Shield et al.Hassan and Rizkalla also performed a parametric analytical study which indicated that
development length increased with increasing internal steel reinforcement ratio.
It is difficult to directly compare the results of the tests on NSM FRP because several
different types and shapes of bars were used in the tests, and there were very few test
results available for rectangular NSM FRP tape. To further gain an understanding of the
performance of NSM tape for strengthening, it was included in an investigation at the
University of Minnesota regarding shear strengthening of bridge pier caps.
One of the first issues of importance discovered in the tests was the choice of
adhesive to bond the NSM reinforcement to the concrete. To this end, a study was
conducted to investigate the effect of adhesive on NSM bond using small-scale bond tests
in which the concrete was highly confined. Larger scale bond tests were then used to
better predict bond strength in field applications and to investigate parameters such as
fiber orientation to crack and vibration during cure.
SMALL-SCALE ADHESIVE TESTS
Some NSM tapes are not commercially sold as a system. Consequently, appropriate
choice of adhesive is a critical factor to the success of the system. As part of the research
investigation, seven different adhesives were chosen for evaluation. Six specimens of
each adhesive were tested. The adhesive that exhibited the best behavior along with one
of the more popularly used adhesives were used for the larger scale NSM FRP bond tests.
Test set-up
The FRP system chosen was Aslan 500 CFRP tape manufactured by Hughes
Brothers. Aslan 500 Tape was chosen because it was the most readily available
rectangular near surface mounted tape in the US. The rectangular profile is desirable
because it increases the bondable surface area for a given cross-sectional tape area. It
was made from 4.8 GPa (700 ksi) carbon fiber, 60% by volume in a bisphenol epoxy
vinyl ester resin matrix. The tape was rectangular with a 2 x 16 mm (0.079 x 0.63 in)
cross section and area of 32 mm2
(0.05 in2
). The manufacturer specified guaranteed
tensile strength of the tape was 2.1 GPa (300 ksi) and the modulus was 130 GPa (19,000
ksi). The manufacturer specified ultimate strain of the tape was 1.7%. The measured
tensile strength was determined in the laboratory to be 2.5 GPa (360ksi) with a
coefficient of variation of 4.5% from an average of six tensile tests.
The adhesives chosen for testing were Sikadur Anchorfix-3, Master
Builders/Chemrex Concresive 1420, 3M DP600NS, 3M DP460NS, Sonneborn Epofil,
Sikadur 35 Hi-Mod LV, and Sikadur 32 Hi-Mod. Recommended cure time, viscosity,
tensile strength, tensile modulus, elongation to failure, and shear strength of these
adhesives are given in Table1. All information in the table was provided by each
manufacturer except the elongation to failure for 3M DP460NS, which was determined in
previous research at the University of Minnesota (Nozaka, 2002). A dash in the table
indicates that the information was not available.
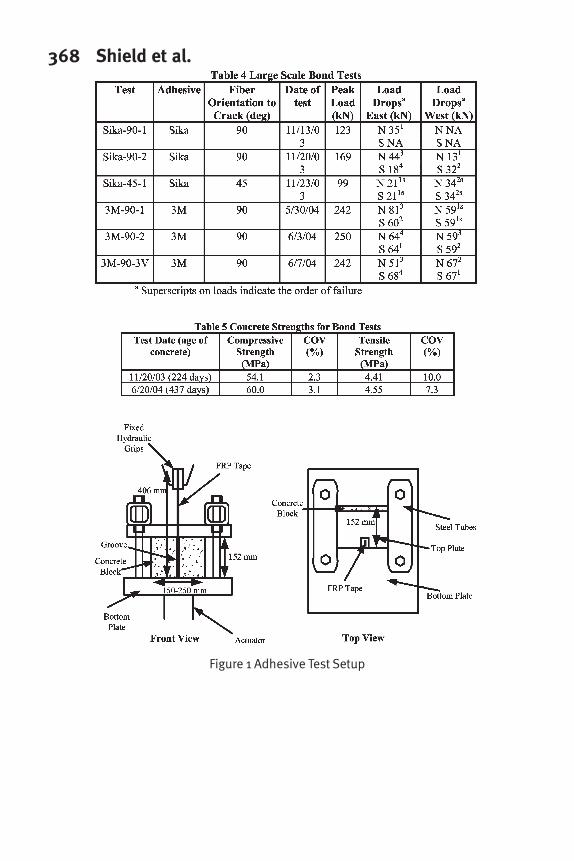
FRPRCS-7 359The small-scale bond test setup is shown in Figure 1. Concrete blocks measuring
approximately 152 x 152 x 203 mm (6 x 6 x 8 in) were cast in modulus of rupture beam
molds. Plywood spacers were set in the molds to divide the beams into three pieces
approximately 203 mm (8 in) in length. The plywood spacers moved slightly during
casting, causing the lengths of the blocks to vary between 150 and 250 mm (6 and 10 in).
All of the blocks had a 152 x 152 mm (6 x 6 in) cross section which were the dimensions
of importance to the test. Due to volume limitations of the mixer, the blocks were cast in
two batches on consecutive days. Compressive strengths and split tensile strengths,
measured as the average of three tests per ASTM C39 and ASTM C469 respectively
using 102x203 mm (4 x 8 in) cylinders at the beginning of the adhesive tests, are shown
in Table 2.
A 6.4 x 19 mm (0.25 x 0.75 in) groove was saw-cut into one of the 152 mm (6 in)
high sides of the concrete blocks using a tuck pointing blade on a circular saw. The
groove was cut perpendicular to the top side of the block. The grooves were then
brushed clean and high pressure air was used to remove any remaining dust or debris.
The FRP tape was cut to a length of 406 mm (16 in), then lightly sanded and wiped with
acetone to remove any dust or grease from the surface.
The procedure for applying the adhesive differed depending on the consistency of the
adhesive. Epofil, Sikadur 32, and Sikadur 35 were two-component liquid adhesives. To
apply them to the specimens, the FRP tape was inserted into the center of the groove.
Small pieces of tape, placed so as to not interfere with flow of the adhesive, were used as
spacers at the top and bottom of the FRP to keep the FRP in the center of the groove and
slightly forward of the back of the groove. The front of the groove was then sealed with
duct tape, leaving the top of the groove open. For Sikadur 32 and Sikadur 35, the two
components of the adhesive were measured and mixed thoroughly using a drill fitted with
a mixing attachment. The adhesive was then transferred to a squeeze bottle and
dispensed into the groove from one side of the top until the entire groove was full. After
filling, the front of the tape was tapped to dislodge any trapped air. Post-test inspection
did not reveal any voids in the adhesive. Epofil was a two-component cartridge that was
mixed with a static mixing nozzle and dispensed into the top of the groove using a
manual gun. Sikadur Anchorfix-3, Concresive 1420, 3M DP600NS and 3M DP460NS
were non-sag two-component adhesives that were supplied in cartridges. They were
mixed with static mixing nozzles and applied using manual guns. The grooves were not
taped for application of the non-sag adhesives. The grooves were filled from the front
with the adhesive. The FRP tape was then coated with the adhesive and inserted into the
center of the groove. The surface of the adhesive was smoothed with a trowel.
After application of the adhesive, the FRP tape was clamped to a steel tube and angle
seated on top of the block. The angle kept the FRP tape perpendicular to the top of the
block while the adhesive cured.
Approximately 24 hours prior to testing, aluminum tabs were epoxied to the top end
of the FRP tape. The 16 x 102 mm (0.625 x 4 in) tabs were cut from 3.2 mm (0.125 in)
thick aluminum. They were lightly sanded and wiped with acetone before bonding them
to the FRP tape with a fast-curing epoxy.

360 Shield et al.After the tab epoxy had cured, the specimen was inserted into an MTS 900 kN (200
kip) test frame. The test setup is shown in Figure 1. Shims were used under the concrete
block to position the top of the block tightly against the top plate. The top plate kept the
block from rotating as the tensile force was applied eccentrically to the block through the
FRP tape, which was located on one side of the block. The plate also put the concrete in
a state of compression to promote an adhesive failure rather than a concrete failure to
facilitate comparison of the different adhesives. The crosshead was lowered until the
grips covered approximately 76 mm (3 in) of the tabs. The hydraulic grips were closed
and the testing began. The loading was displacement-controlled at a rate of 0.25mm/min
(0.01 in/min). Testing continued until the load dropped suddenly due to failure of bond
between the tape and the adhesive, failure of the concrete, failure of the adhesive, or
fracture of the FRP tape. If the FRP tape had not broken, it was pulled out of the
concrete block before both parts were removed from the test frame.
Some of the blocks were re-used for a second round of testing. A groove was cut in
the face opposite the first groove. The same procedure was followed for preparation and
testing.
Small-scale adhesive test results
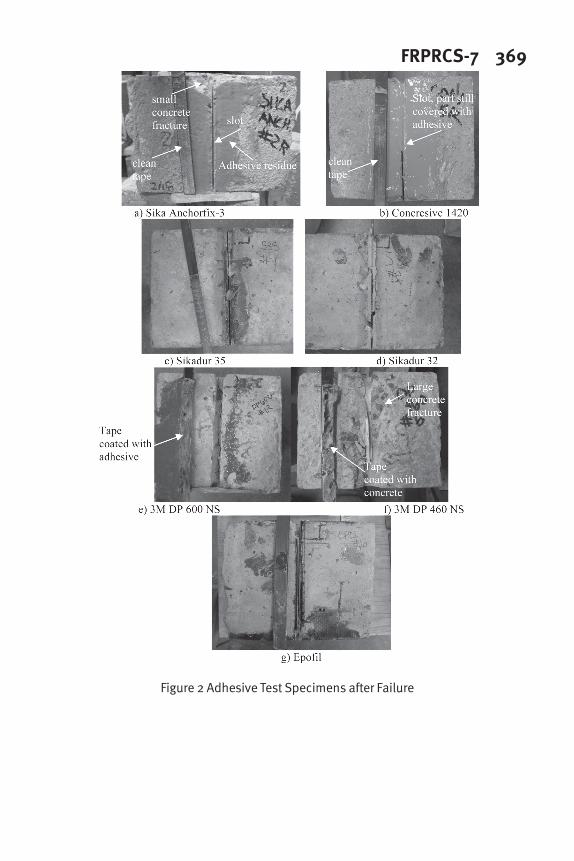
There were several different types of failures observed in the adhesive tests. Most of
the adhesive tests using Anchorfix-3, Concresive 1420, Sikadur 32, Sikadur 35, and
Epofil failed by a loss of bond between the FRP tape and the adhesive. This usually
occurred in a very sudden fashion. In some of these tests, shock from the abrupt loss of
bond immediately caused the FRP tape to break. In these cases, the FRP broke off
cleanly with no fraying of the fibers. The tests using 3M DP600NS all failed by loss of
bond between the adhesive and the concrete. The tests using 3M DP460 NS failed in
various ways including loss of bond between the tape and the adhesive, failure in the
adhesive, failure in the concrete, and fracture of the FRP tape. When failure occurred by
fracture of the FRP tape, it was not a clean break. The fibers began to fray and break off
individually until the tape completely deteriorated. Figure 2 shows a photograph of a
typical failure for each adhesive type.
Table 3 shows the maximum loads reached in each of the tests, as well as the age of
adhesive cure at the time of testing. A dash in the table indicates that the test was not
valid because of a failure due to the gripping method. Figure 3 shows a graph comparing
the average and highest load of the six tests conducted for each of the seven adhesives.
The tests using Sika Anchorfix-3 had the lowest ultimate strengths with an average load
of 30 kN (6.8 kips) and a maximum load of 34 kN (7.7 kips). The tests using 3M
DP460NS had the highest ultimate strengths with an average load of 73 kN (16.5 kips)
and a maximum load of 81 kN (18.3 kips). The other adhesives all performed
comparably, with maximum loads between 50 and 60 kN (11.3 and 13.6 kips).
No strong correlation between any of the manufacturer provided adhesive properties
and the results of the small-scale bond tests was observed. Adhesive tensile strength and
shear strength correlated the least well (r2
values of approximately 0.07 and 0.02
respectively), with tension modulus and elongation at failure correlating better (r2
values
of 0.53 and 0.42). Clearly the results of these tests indicate that picking an adhesive
FRPRCS-7 361solely based on the manufacturer provided shear strength will not lead to the best system.
Nozaka (2002) found that the bond strength between FRP and steel was strongly
dependent on the ductility of the adhesive. Long lengths of adhesive are required to yield
in shear to build up enough force through redistribution to fracture the FRP. It is possible
that the development length of NSM tape in highly confined concrete is also highly
dependent on the ability of the adhesive to deform and yield in shear, which cannot
typically be determined from the manufacturer provided data.
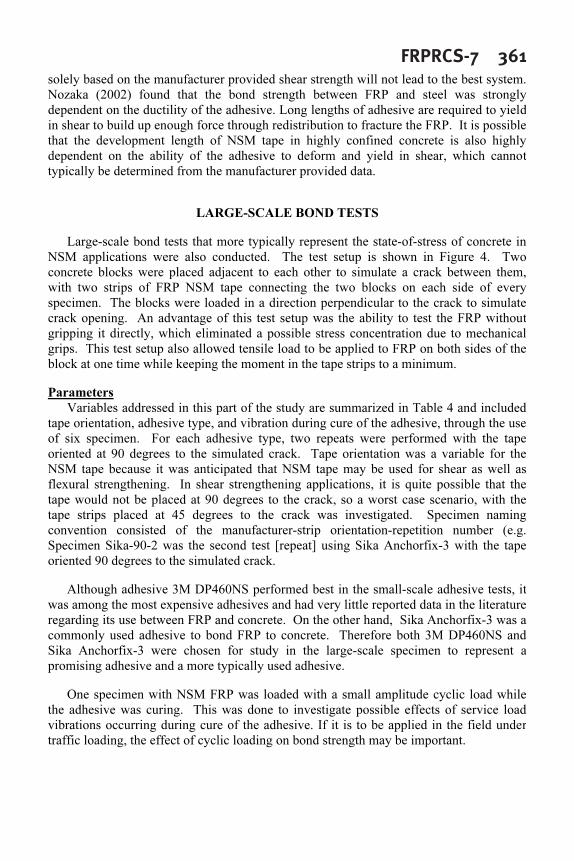
LARGE-SCALE BOND TESTS
Large-scale bond tests that more typically represent the state-of-stress of concrete in
NSM applications were also conducted. The test setup is shown in Figure 4. Two
concrete blocks were placed adjacent to each other to simulate a crack between them,
with two strips of FRP NSM tape connecting the two blocks on each side of every
specimen. The blocks were loaded in a direction perpendicular to the crack to simulate
crack opening. An advantage of this test setup was the ability to test the FRP without
gripping it directly, which eliminated a possible stress concentration due to mechanical
grips. This test setup also allowed tensile load to be applied to FRP on both sides of the
block at one time while keeping the moment in the tape strips to a minimum.
Parameters
Variables addressed in this part of the study are summarized in Table 4 and included
tape orientation, adhesive type, and vibration during cure of the adhesive, through the use
of six specimen. For each adhesive type, two repeats were performed with the tape
oriented at 90 degrees to the simulated crack. Tape orientation was a variable for the
NSM tape because it was anticipated that NSM tape may be used for shear as well as
flexural strengthening. In shear strengthening applications, it is quite possible that the
tape would not be placed at 90 degrees to the crack, so a worst case scenario, with the
tape strips placed at 45 degrees to the crack was investigated. Specimen naming
convention consisted of the manufacturer-strip orientation-repetition number (e.g.
Specimen Sika-90-2 was the second test [repeat] using Sika Anchorfix-3 with the tape
oriented 90 degrees to the simulated crack.
Although adhesive 3M DP460NS performed best in the small-scale adhesive tests, it
was among the most expensive adhesives and had very little reported data in the literature
regarding its use between FRP and concrete. On the other hand, Sika Anchorfix-3 was a
commonly used adhesive to bond FRP to concrete. Therefore both 3M DP460NS and
Sika Anchorfix-3 were chosen for study in the large-scale specimen to represent a
promising adhesive and a more typically used adhesive.
One specimen with NSM FRP was loaded with a small amplitude cyclic load while
the adhesive was curing. This was done to investigate possible effects of service load
vibrations occurring during cure of the adhesive. If it is to be applied in the field under
traffic loading, the effect of cyclic loading on bond strength may be important.
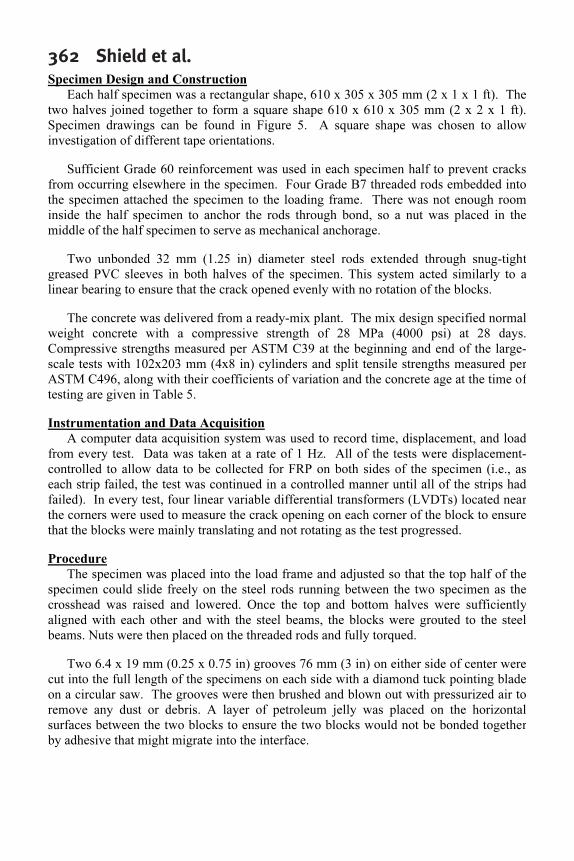
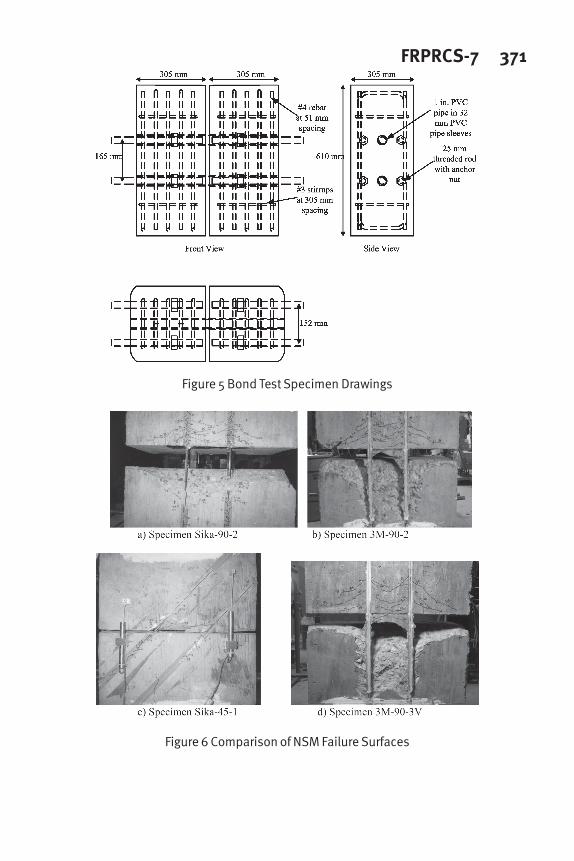
362 Shield et al.Specimen Design and Construction
Each half specimen was a rectangular shape, 610 x 305 x 305 mm (2 x 1 x 1 ft). The
two halves joined together to form a square shape 610 x 610 x 305 mm (2 x 2 x 1 ft).
Specimen drawings can be found in Figure 5. A square shape was chosen to allow
investigation of different tape orientations.
Sufficient Grade 60 reinforcement was used in each specimen half to prevent cracks
from occurring elsewhere in the specimen. Four Grade B7 threaded rods embedded into
the specimen attached the specimen to the loading frame. There was not enough room
inside the half specimen to anchor the rods through bond, so a nut was placed in the
middle of the half specimen to serve as mechanical anchorage.
Two unbonded 32 mm (1.25 in) diameter steel rods extended through snug-tight
greased PVC sleeves in both halves of the specimen. This system acted similarly to a
linear bearing to ensure that the crack opened evenly with no rotation of the blocks.
The concrete was delivered from a ready-mix plant. The mix design specified normal
weight concrete with a compressive strength of 28 MPa (4000 psi) at 28 days.
Compressive strengths measured per ASTM C39 at the beginning and end of the large-
scale tests with 102x203 mm (4x8 in) cylinders and split tensile strengths measured per
ASTM C496, along with their coefficients of variation and the concrete age at the time of
testing are given in Table 5.
Instrumentation and Data Acquisition
A computer data acquisition system was used to record time, displacement, and load
from every test. Data was taken at a rate of 1 Hz. All of the tests were displacement-
controlled to allow data to be collected for FRP on both sides of the specimen (i.e., as
each strip failed, the test was continued in a controlled manner until all of the strips had
failed). In every test, four linear variable differential transformers (LVDTs) located near
the corners were used to measure the crack opening on each corner of the block to ensure
that the blocks were mainly translating and not rotating as the test progressed.
Procedure
The specimen was placed into the load frame and adjusted so that the top half of the
specimen could slide freely on the steel rods running between the two specimen as the
crosshead was raised and lowered. Once the top and bottom halves were sufficiently
aligned with each other and with the steel beams, the blocks were grouted to the steel
beams. Nuts were then placed on the threaded rods and fully torqued.
Two 6.4 x 19 mm (0.25 x 0.75 in) grooves 76 mm (3 in) on either side of center were
cut into the full length of the specimens on each side with a diamond tuck pointing blade
on a circular saw. The grooves were then brushed and blown out with pressurized air to
remove any dust or debris. A layer of petroleum jelly was placed on the horizontal
surfaces between the two blocks to ensure the two blocks would not be bonded together
by adhesive that might migrate into the interface.

FRPRCS-7 363The adhesives used came in two-part cartridges that were mixed using a static mixing
nozzle and dispensed with a manual or pneumatic gun. A small amount of adhesive was
discarded at the beginning of each cartridge to ensure that only well-mixed adhesive was
applied. The FRP tape was cut to 610 mm (24 in) and one piece of tape was coated with
adhesive. Prior to filling, the edges of the grooves were masked with tape to prevent
excess adhesive on the surface of the concrete. One groove was then filled with adhesive
and the tape was inserted so that it was centered in the groove. Any remaining voids
were filled with adhesive and the excess adhesive was removed with a trowel. The
surface was smoothed, and the masking tape was removed. The same procedure was then
followed for the other three grooves.
The hydraulics were turned on and the load was set to 4.5 kN (1 kip) in compression
in order to maintain a constant position while the FRP cured. The load was held for at
least 48 hours until testing began. Keeping the load constant was more successful than
keeping the displacement constant, possibly due to shrinkage in the grout.
One specimen had cyclic loading applied while the adhesive was curing. For that
specimen, the load was set to cycle between 4.5 and 22 kN in compression at a frequency
of 1 Hz. This load range was determined from an analysis of overhang of the pier cap of
MN Bridge 19855/56 with the bridge loaded with passenger cars. The maximum
flexural stress on the face of the pier cap overhang, assuming uncracked sections was
calculated. The 17.5 kN load applied to the large-scale test specimen resulted in this
same stress, The stress was then applied to the bond test specimen in compression. It
was not possible to apply any tension to the specimen while the adhesive was curing
because there was nothing to resist tension holding the two halves of the specimen
together. The loading began as soon as the FRP had been applied to the specimen, and
continued for 3 days until the specimen was tested.
Testing of the six specimens was conducted approximately 48 hours after bonding,
with the exception of Specimen Sika-90-1 which was tested approximately 24 hours after
bonding, and Specimen 3M-90-3V, which was tested approximately 72 hours after
bonding to accommodate the cyclic loading during cure. In all cases, full cure should
have been reached after 24 hours (Table 1). The tests were monotonic with a crosshead
loading rate of 0.00127 mm/sec (0.00005 in/sec). The tests continued until failure (loss
of load carrying capability) or a crosshead displacement of 1.25 mm (0.5 in).
Large-Scale Bond Test Results
Table 4 gives the results of the tests for the six large-scale specimen, including,
maximum load reached in the test, load drops associated with the failure of each
individual tape strips and the order of strip failure (the superscripts on the failure loads).
A superscript “s” indicates that two or more different tape locations failed simultaneously
and the total load was divided equally among the tape strips.
For each of the specimens using Sika Anchorfix-3, the failure began with cracking of
the adhesive that extended into the surrounding concrete, followed by a shear failure in
the concrete near the interface between the two blocks, often resulting in the loss of a
large piece of concrete from the block as shown in Figure 6a. Ultimately the specimen

364 Shield et al.using Sika Anchorfix-3 lost bond between the FRP tape and the adhesive, with the tape
pulling out of the adhesive. During this phase, load carrying capacity was provided by
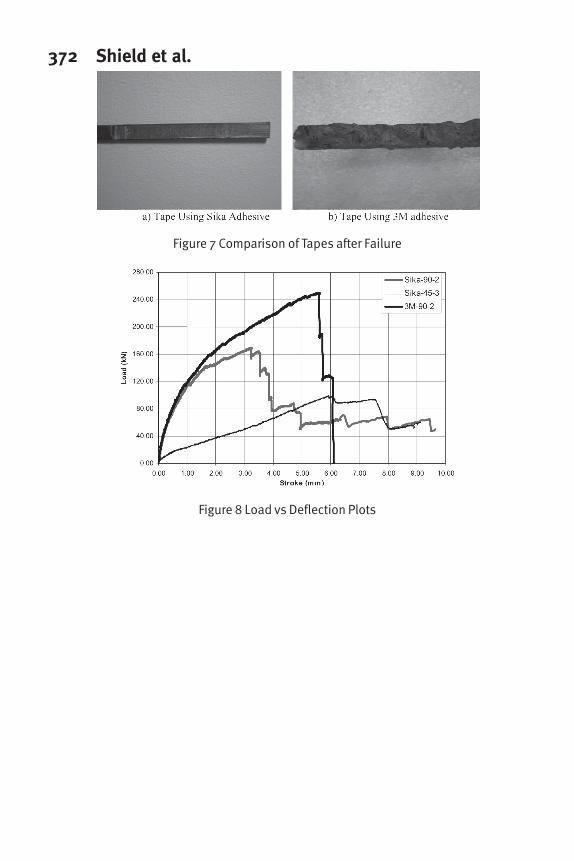
friction between the tape and the adhesive. All of the FRP tapes that had been bonded
using Sika Anchorfix-3 showed little to no concrete attached to the surface and
significant damage to the matrix during post-test inspection as shown in Figure 7a. The
variability in bond between the first two tests using Sika Anchorfix-3 was high. The tests
were identical with the exception of cure time, but Specimen Sika-90-1showed
indications of poorly cured adhesive in two locations upon post test inspection, even
though the manufacturer recommended installation procedure was followed. It was
unclear why these two locations showed poor cure, while the rest of the adhesive had
cured well. The second test, Sika-90-2, was a repeat of the first test with an ultimate load
of 169 kN (38.1 kips), and was taken as more predictive of a well cured bond between
FRP and concrete using Sika Anchorfix-3.
The specimens using 3M DP460NS exhibited progressive cracking in the concrete
directly surrounding the groove, ultimately failing when large pieces of concrete were
broken off between the two blocks as shown in Figure 6b. None of the tapes fractured
during the test. There was no failure between the FRP and adhesive or in the adhesive as
shown by the large amount of concrete remaining bonded to the tape after the conclusion
of the test in Figure 7b. The two identical tests of the specimen using the 3M DP460-NS
(Specimens 3M-90-1 and 3M-90-2) did not exhibit high variability.
Effect of Adhesive Type for NSM FRP -- The specimens using 3M DP460NS
exhibited much higher loads than those using Sika Anchorfix-3 even though the
manufacturer’s reported shear strengths of both adhesives were similar, with Sika
Anchorfix-3 having a slightly larger value (Table1). The maximum load for the 90
degree specimen with Sika Anchorfix-3 was 169 kN (38.1 kips). The average maximum
load for the three 90 degree specimens with 3M DP460-NS was 246 kN (55.3 kips), with
a coefficient of variation of 2.0%. The specimen using 3M DP460NS had an increase in
ultimate load of 45% over the specimen using Sika Anchorfix-3, simply by changing the
adhesive type with all other parameters kept constant.
Although these differences in strength were quite large, they were not as large as
those observed between these two adhesives in the highly confined small-scale tests
(143%). The difference in strength in the large-scale tests was mainly attributable to the
difference in failure modes due to the different adhesive types. Specimens using 3M
DP460NS had higher strengths because they were able to take better advantage of the
strength of the FRP tape. The maximum loads recorded for the specimens made with 3M
DP460NS were close to the load expected to fracture the four tapes when using the
manufacturer’s guaranteed strength for the Aslan 500 tape (266 kN [59.7 kips] based on a
guaranteed strength of 2.1 GPa [300 ksi]). According to Table 1, 3M DP460NS had a
larger elongation to failure, perhaps indicating that it was a more ductile adhesive in
shear. From the results of the large-scale tests, it appeared that a tougher, less brittle
adhesive may be more effective in bonding the dissimilar substrates of FRP and concrete.
The failure surfaces for typical NSM specimens with both adhesives are shown in Figures
6a and 6b.

FRPRCS-7 365Effect of Fiber Orientation for NSM FRP -- Tape orientation was taken as a variable
to examine potential shear strengthening cases. In a shear crack, the crack opens as well
as slides. As a consequence, it may be desirable to place the reinforcement at a 45 degree
angle to the crack. For this investigation, it was also of interest to see if this orientation
could demonstrate good ductility while still carrying a considerable amount of load.
Thus, the third test using Sika Anchorfix-3 (Specimen Sika-45-1) was conducted with the
NSM reinforcement oriented 45 degrees to the crack.
As expected, this specimen had a much lower ultimate load than the specimen using
Sika Anchorfix-3 with the reinforcement oriented 90 degrees to the crack (Specimen
Sika-90-2). The 45 degree test reached a load of 99 kN (22.3 kips), 59% of the strength
of the 90 degree specimen. This configuration was less stiff than the tests with fibers
oriented 90 degrees to the crack, and had a larger displacement at peak load. The 45
degree specimen had approximately twice the displacement of the 90 degree specimen
with the same adhesive at peak load (6.1 mm [0.24 in] for Sika-45-1, 3.0 mm [0.12 in] for
Sika-90-2) The load vs. displacement plot for the 45 degree Sika Anchorfix-3 specimen
(Sika-45-3), one of the 90 degree specimens using Sika Anchorfix-3 (Sika-90-2) and one
of the 90 degree specimens using 3M DP460NS (3M-90-2), are shown in Figure 8.
Failure of Specimen Sika-45-1 began with progressive cracking of the concrete and
epoxy on the surface, followed by shear failure of the concrete near the crack and a loss
of bond between the FRP tape and the adhesive. The failure surface of the 45 degree
specimen, shown in Figure 6c, lost much less concrete than the 90 degree specimen. The
FRP tape did not fracture at the crack, but its flexibility allowed it to bend as the crack
opened. There was significant damage at failure in the matrix of the tape near the crack.
Effect of Vibrations During Cure of Adhesive on NSM FRP -- The test of the
specimen (3M-90-3V) that was cyclically loaded during curing of the 3M DP460NS
adhesive had a maximum capacity of 242 kN (54.5 kips). The average of the tests using
the same parameters, but no cyclic loading during cure (3M-90-1 and 3M-90-2) was 246
kN (55.3 kips). This shows that there was an insignificant change in strength when cyclic
loading was applied to the specimen while the adhesive was curing. The failure surface
of the specimen subject to vibrations was similar to that of the control specimens with the
3M adhesive. The failure surfaces are shown in Figure 6d.
CONCLUSIONS AND RECOMMENDATIONS
Bond strength of the NSM tape was highly dependent on both the adhesive as well as
the state of stress in the concrete surrounding the tape. The dependence did not correlate
to the manufacturer supplied shear strength of the adhesive. For most adhesives, even in
the small scale tests with highly confined concrete, the failure was in the concrete or
adhesive. Only the specimens using 3M DP460NS were able to achieve strengths large
enough to break the NSM. In the more realistic large-scale tests neither adhesive could
develop enough bond to break the NSM tape, with a maximum force of 98% of the strip
strength using 3M DP460NS. The improvement in ultimate strength for the specimens
using 3M DP460NS was likely attributable to the larger ductility of this adhesive.
366 Shield et al.However, there was no good correlation between any manufacturer provided adhesive
material properties and the strength and ductility of the test specimen. Indicating that
other material properties such as ultimate shear strain and shear modulus of the adhesives
may play an important role in determining the amount of bond that can be developed.
The limited scope of the work reported herein should be expanded to determine the role
of concrete strength, NSM tape type, other forms of adhesives, and the effect of flexure in
the tape, with the long term goal to develop a design equation for bond of NSM that
accounts for all the important physical parameters.
REFERENCES
Blaschko, M., and Zilch, K., 1999, “Rehabilitation of Concrete Structures with Strips
Glued into Slits,” Proceedings of the Twelfth International Conference on Composite
Materials, Paris, France, July 5-9.
Carolin, A., Nordin, M., and Taljsten, B., 2001, “Concrete Beams Strengthened with
Near Surface Mounted Reinforcement of CFRP,” Proceedings of the International
Conference on FRP Composites in Civil Engineering, pp. 1059-1066.
De Lorenzis, L., Lundgren, K., and Rizzo, A., 2004, “Anchorage Length of Near-
Surface Mounted Fiber-Reinforced Polymer Bars for Concrete Strengthening-
Experimental Investigation and Numerical Modeling,” ACI Structural Journal, March-
Apr, V. 101, No. 2, pp. 269-278.
De Lorenzis, L., and Nanni, A., 2001, “Characterization of FRP Rods as Near-Surface
Mounted Reinforcement,” ASCE Journal of Composites for Construction, May, V. 5, No.
2, pp. 114-121.
De Lorenzis, L., and Nanni, A., 2002, “Bond between Near-Surface Mounted Fiber-
Reinforced Polymer Rods and Concrete in Structural Strengthening,” ACI Structural
Journal, Mar/Apr, V. 99, No. 2, pp. 123-132.
De Lorenzis, L., Nanni A., and La Tegola, A., 2000, “Flexural and Shear Strengthening
of Reinforced Concrete Structures with Near Surface Mounted FRP Rods,” Proceedings
of the Third International Conference on Advanced Composite Materials in Bridges and
Structures, Aug, pp. 521-528.
Hassan, T., and Rizkalla, S., 2002, “Flexural Strengthening of Post-Tensioned Bridge
Slabs with FRP Systems,” PCI Journal, V. 47, N. 1, pp. 76-93.
Hassan, T., and Rizkalla, S., 2003, “Investigation of Bond in Concrete Structures
Strengthened with Near Surface Mounted CFRP Strips,” ASCE Journal of Composites for
Construction, V. 7, N. 3, pp. 248-257.
Nozaka, K., 2002, “Repair of Fatigued Steel Bridge Girders with Carbon Fiber Strips,”
PhD Thesis, Department of Civil Engineering, University of Minnesota, 174 pp.

FRPRCS-7 367Valerio, P. and Ibell, T. J., 2003, “Shear Strengthening of Existing Concrete Bridges,”
Structures and Buildings, Feb, V. 156, No. 1, pp. 75-84.
Yan, X., Miller, B., Nanni, A., and Bakis, C., 1999, “Characterization of CFRP Rods
Used as Near-Surface Mounted Reinforcement,” Proceedings of the Eighth International
Structural Faults and Repair Conference, M. D. Forde Editor., Engineering Technics
Press, Edinburgh, CD-ROM version.
368 Shield et al.
Figure 1 Adhesive Test Setup
FRPRCS-7 369
Figure 2 Adhesive Test Specimens after Failure

370 Shield et al.
Figure 3 Adhesive Test Load Comparison Graph
Figure 4 Large-ScaleTest Setup for 90 Degree Tests
FRPRCS-7 371
Figure 5 Bond Test Specimen Drawings
Figure 6 Comparison of NSM Failure Surfaces
372 Shield et al.
Figure 7 Comparison of Tapes after Failure
Figure 8 Load vs Deflection Plots


![Superior adhesive performance acrylic foam Double-coated adhesive tape HYPERJOINT ... · 2021. 4. 12. · H9004 [Tape thickness:0.4mm] H9008 [Tape thickness:0.8mm] H9012 [Tape](https://img.pdfslide.net/doc/110x75/612dd5e11ecc515869426f9b/superior-adhesive-performance-acrylic-foam-double-coated-adhesive-tape-hyperjoint.jpg)