Embed Size (px)
Citation preview
Clark UniversityClark Digital CommonsInternational Development, Community andEnvironment (IDCE) Master’s Papers
5-2016
The Effect of Athletic Stadiums on Communities,with a Focus on HousingDominique WilkinsClark University, [email protected]
Follow this and additional works at: https://commons.clarku.edu/idce_masters_papers
Part of the Demography, Population, and Ecology Commons, Environmental Studies Commons,Human Geography Commons, Inequality and Stratification Commons, Sports Studies Commons,and the Urban Studies and Planning Commons
This Research Paper is brought to you for free and open access by the Master’s Papers at Clark Digital Commons. It has been accepted for inclusion inInternational Development, Community and Environment (IDCE) by an authorized administrator of Clark Digital Commons. For more information,please contact [email protected], [email protected].
Recommended CitationWilkins, Dominique, "The Effect of Athletic Stadiums on Communities, with a Focus on Housing" (2016). International Development,Community and Environment (IDCE). 88.https://commons.clarku.edu/idce_masters_papers/88
The Effect of Athletic Stadiums on Communities
With a Focus on Housing
Dominique Wilkins
May 2016
A Master’s Research Paper
Submitted to the faculty of Clark University, Worcester,
Massachusetts, in partial fulfillment of the requirements for
the degree of Master of Arts in the department of Community, Development, and Planning
And accepted on the recommendation of
_______________________________________________
Mark Tigan, Chief Instructor
ABSTRACT
The Effect of Athletic Stadiums on Communities
With a Focus on Housing
Dominique Wilkins
The purpose of this research is to examine the role of athletic stadiums in the gentrification of minority
neighborhoods. New athletic stadiums have increasingly been constructed in low- and moderate- income
areas with high minority populations, and results in the displacement of that community’s longstanding
residents. This paper uses Census and American Community Survey (ACS) data as part of a case study of the
Washington Nationals Stadium in Washington DC; the data shows that within a few years of construction,
the community that previously boasted an affordable housing stock and a high low-income minority
population is replaced with high-income, white professionals. This paper investigates what happens to the
original population and, specifically, their housing when these stadiums are constructed, and makes
development recommendations for ways to preserve neighborhoods.
________________________________
Mark Tigan, Ph. D.
Chief Instructor
________________________________
Laurie Ross, Ph. D.
Assistant Professor
ACADEMIC HISTORY
Name: Dominique Shari Wilkins Date: May 2016
Baccalaureate Degree: Geography, Sociology
Source: Clark University Date: May 2008

iv
ACKNOWLEDGEMENTS
To Professors Tigan and Ross, who helped me finish this paper…
…seven years after I started it.
Thank you.
v
TABLE OF CONTENTS
Abstract ………………………………………………………………………..…………….ii
Acknowledgements…………………………………………………………….……………iv
Chapter 1: Introduction……………..………………………………………..………………1
Research Question/Rationale………………………………………….…………….2
Chapter 2: Relevant Literature………………...………………………….….………………3
The Incentive to Build…………………………………………….………………...3
Economic Benefits ………………………………………...….….…………………5
Crowding Out……………………………………………………....……………….7
Substitution Effect………………………………………….……...………………..7
Leakages……………………………………………….…….….…………….…….8
Effect of Stadiums on Permanent Housing……….…………….……………..……9
The Olympics…………………………………………………….………….…….14
Gaps in Current Literature……………………………………….………………..16
Chapter 3: Methodology
Statement of Research Question………………………………….…….…………18
Research Process……………………………………………….…………………19
Hypotheses/Anticipated Findings……………………………….…….…………..20
Chapter 4: A Case Study: Washington Nationals Stadium
The Stadium…………………………………………………….………………...20
ACS and Census Data Findings...……………………………….………………...21
Analysis of Data……….……………………………………….…………………28
Chapter 5: Implications and Conclusions……………………………….….…….………..28
Recommendations for Future Development…………………….…..……………31
References….…………………………………………………………….……………….34
1
Chapter 1: Introduction
Gentrification is the “process of neighborhood change that results in the
replacement of lower income residents with higher income ones” (Brookings Institute
2001, p. 1). The Brookings Institute (2001) has documented three waves of gentrification:
“the federally sponsored urban renewal efforts in the ‘50s and ‘60s… the so-called ‘back-
to-the-city’ movement of the late ‘70s and early 1980s,” and today. Gentrification is
marked by three features (Brookings Institute 2001): the involuntary displacement of
lower-income residents by higher rents or property tax bills, the upgrading of the housing
stock, and a change in the “social fabric” of the neighborhood (Brookings Institute 2001, p.
5).
The purpose of this research is to examine the effects of athletic stadiums on
communities; lack of data and literature on this topic forced me to narrow my scope and
focus on the impact of athletic stadiums on housing. Many new athletic stadiums have
been constructed in low- and moderate-income areas with high minority populations;
investors target these areas for the “potential to find bargain” prices on properties
(Brookings Institute 2001, p. 11). Within a few years, the community that previously
boasted multiple locally owned businesses, an affordable family housing stock, and a high
low-income minority population is replaced with upper-middle class, single, young white
professionals. This paper focuses on the numerous social and economic changes to these
communities, with a specific focus on the replacement of single-family dwellings with
higher-priced loft-style apartments. It also examines how athletic stadiums are used as
catalysts for local economies categorized as impoverished by the cities, in which the
2
stadiums are located. Furthermore, this paper will address how athletic stadiums fuel
gentrification, and the results of this gentrification on the housing cost provided to the
communities displaced.
Gentrification conflicts arise from “competing beliefs in the preservation of poorer
urban neighborhoods for the benefit of their present populations versus their
redevelopment and upgrading to attract middle- and upper-class populations back to the
city” (Berke et al 2006, p. 40), and failures of both the private and public sectors to
ameliorate it. Though higher property values, increased walkability and access to
amenities, and environmental benefits may be appealing to the white elite who are moving
back to cities, these very same factors can exclude the poor minorities in the same areas.
Today, planners must find a balance between all classes and races competing for space in
our cities today as suburbs slowly become a thing of the past.
“Gentrification has a very clear racial component, as higher income white
households replace lower income minority households, sometimes in the very same
neighborhoods that experienced ‘white flight’ and traumatic urban renewal in the ‘50s and
‘60s” (Brookings Institute 2001, p. 5). Overt racist practices occur in the form of lawfully
enforced segregation practices similar to the “separate but equal” laws of the Jim Crow
Era. While these highly racist laws have long been outlawed, the birth and continued use of
structural and institutionalized racist practices included in many redevelopment practices
today have resulted in the gentrification of many inner-city urban communities.
3
Chapter 2: Literature Review
Though the literature on the effects of athletic stadiums on housing is sparse, there
is sufficient literature on the effects of athletic stadiums on various economic factors, such
as employment rates, the impact of stadiums on the regional economy, and general
standards of living. While Siegfried and Zimbalist (2000) write most of literature relevant
to housing and stadiums, Baade, Baumann, Matheson (2008) provide the most information
about the proposed economic benefits of stadiums. Many of the articles used in this
literature review reveal that athletic stadiums are endeavors aimed to stimulate local and
regional economies, however, this same literature provides facts and figures to disprove
this hypothesis. While much of the literature does not directly address the question of
housing impacts, the economic impacts discussed have a direct affect on the local
populations and ultimately the housing stock. I address the gaps in current literature later in
this paper.
The Incentive to Build
The literature provides multiple examples of metropolises competing for athletic
stadiums. Siegfried and Zimbalist (2000) found six main reasons cities compete for athletic
stadiums. First and foremost is the proliferation of local politics; “constructing a facility
may help to secure political support for the expenditure from local labor unions,
4
contractors, property owners, and other interested parties” (Siegfried and Zimbalist 2000,
p. 100). Second, teams sign leases to the stadiums for terms averaging 20 to 30 years,
signifying a long-term investment in the city. Third, the stadium provides a team with
“potential” revenue. This potential revenue provides an incentive for the team to perform
well because they would benefit from money made directly on ticket sales whereas “cash
transfers from the city to the team would provide no incentive for team improvement”
(Siegfried and Zimbalist 2000, p. 100). Fourth, loopholes in the 1986 Tax Reform Act
have resulted in national government subsidies for stadium construction. The 1986 Tax
Reform Act was created to prohibit the use of tax-exempt municipal bonds for the
construction of “facilities [where] more than 10 percent of the facility’s annual debt service
is covered by facility-related revenues” (Siegfried and Zimbalist 2000, p. 100). Today,
communities pay a greater share of the stadium costs to retain their eligibility for the tax-
exempt bond funding, resulting in national taxpayers subsidizing the stadiums (Siegfried
and Zimbalist 2000). Fifth, “if cities communicate the notion that subsidies come only in
the form of sports facilities, then other potential subsidy recipients who do not need a
stadium or arena for their business may be deterred from asking,” thus eliminating their
financial competition. Finally, direct cash subsidies awarded to wealthy team owners from
the government in front of voters is detrimental to the campaigns of local politicians.
In addition to the perceived economic benefits, proponents of stadium building
believe that a new sports stadium will boost civic pride and promote a sense of community
(Siegfried and Zimbalist 2000). Proponents claim that a new sports stadium will stimulate
spending in the community by attracting businesses and tourists to the community, but
5
these are assumptions that have widely been disproved by the literature. In the following
sections, I will provide data and information from sources that refute these assumptions.
Economic Benefits
Proponents for sports stadiums cite economic gains as the primary gain for the
community the stadium will be located in (Baade, Baumann, Matheson 2008). “Promoters
envision hoards of wealthy sports fans descending on a city’s hotels, restaurants, and
businesses” (Baade, Baumann, Matheson 2008, p. 794). A group aimed at bringing a major
league baseball team to Portland, OR claims that a new stadium could bring between $70
and $300 million a year to the state (Baade, Baumann, Matheson 2008, p. 795). A Virginia
based group advocating for a professional baseball stadium in northern Virginia believes
that the stadium would bring in more than $8.6 billion into the Virginia economy over a 30
year span (Baade, Baumann, Matheson 2008, p. 795).
Sports stadium boosters “are often vague about exactly what is being
measured in these claims of hundreds of millions of dollars of benefits...but
the overall claims are clear: Professional sports provide huge economic
windfalls for host cities” (Baade, Baumann, Matheson 2008, p. 795).
League and franchise owners frequently highlight the economic benefits associated with
new stadiums and teams, often to minimize their own required contribution to the funding
of the stadium (Baade, Baumann, Matheson 2008). Promoters cite the Superbowl or All-
Star Games as opportunities to cash in on fans who will support local restaurants and
businesses.
6
Most boosters overestimate how many guests will visit the stadiums and how
much they will spend while visiting. “In March 2005, Denver, Colorado, tourism officials
predicted 100,000 visitors for the NBA All-Star game. Considering that the Pepsi Center,
the game’s venue, only holds 20,000 fans, and taking into account that Denver has only
about 6,000 hotel rooms, it is not clear exactly how such an influx of basketball fans would
be possible” (Baade, Baumann, Matheson 2008, p. 796). Baade, Baumann, Matheson
(2008) push that some economic factors are fabricated citing the 1997 and 1999 NCAA
Women’s Basketball Final Four. In 1997, the tournament was estimated to generate $7
million for Cincinnati, Ohio, and somehow, 2 years later that same event was projected to
generate $32 million for San Jose, California.
Contrary to the arguments made by sports franchise boosters, cities often end up
paying for most of the new stadium and the expenses that run alongside. For the Olympics,
security of the athletes is paramount and covered by local taxpayers. The 2002 Winter
Olympics in Utah showed the event generating a profit for the city, however, the same
documents failed to show the “millions of dollars of additional security provided by the
U.S. Department of Defense at no cost to the local organizing committee” (Baade,
Baumann, Matheson 2008, p. 795). The 2004 Summer games in Athens spent $1.5 billion
on security alone (Baade, Baumann, Matheson 2008).
7
Crowding Out
Many times, sports related activities dissuade local citizens from venturing to a city
or businesses because of congestion, which further reduces the economic impact of
stadiums. “Attractions such as Chicago’s Field Museum or Cleveland’s Rock and Roll Hall
of Fame are located next door to NFL stadiums, and their attendance suffers during the
Chicago Bears or Cleveland Browns home games” (Baade, Baumann, Matheson 2008, p.
797). Mega-events (like the Superbowl or the Olympics) also dissuade regular recreational
and business visitors from coming to the city during that time. If a hotel is full of sports
fans, vacationers or conventioneers are displaced. Hotels that raise prices to meet the
demand of the sports enthusiasts exclude vacationers, and thus, displace other economic
income that may have occurred (Baade, Baumann, Matheson 2008).
The Substitution Effect
Siegfried and Zimbalist (2000) focus on the substitution effect and leakages while
examining the effect of stadiums on local economies. The substitution effect is based on
the presumption that the majority of consumers have a relatively inflexible leisure budget
and that money is transferred from one establishment to another. In other words, every
time you spend money in a sports stadium you are taking money from the local bowling
alley you would usually visit, resulting in a net effect on spending in metropolitan areas
very close to zero; sports teams rearrange money, but do not create it (Siegfried and
8
Zimbalist 2000). Many proponents of stadiums argue that out-of-state tourists contribute
new money to the local economy. Noll and Zimbalist (1997 in Siegfried and Zimbalist
2000]) argue that most tourists do not come to town because of the game. Noll and
Zimbalist believe that tourists visit the city for other reasons and that their attendance at the
sports game is a secondary activity. “Hence, their disbursements in and around the ballpark
substitute for other local spending. Further, they may be guests of a local business or
family who pays for the tickets and concessions, in which case” there is no new money
generated (Noll and Zimbalist 1997 in Siegfried and Zimbalist 2000, p. 106). Finally,
national television contracts and funds to central league offices remove money from the
local economy.
Leakages
Perhaps the largest leakage of sports teams is in player salaries. “Approximately 55
to 60 percent of NHL, NBA, NFL, and MLB team revenues go to player compensation”
with the remaining going to owners for stadium maintenance (Siegfried and Zimbalist
2000, p. 106). According to Siegfried and Zimbalist (2000) there are four main leakages
attributed to sports stadiums. First, the higher your income the more taxes you must pay to
the national government; “thus over 40 percent of their incremental income leaks directly
from the local economy to Washington, D.C.” (Siegfried and Zimbalist 2000, p. 106).
Second, high wages lead to higher savings rates, especially to players who are seen as
having transitory incomes, so most of the local money leaks into global money markets.
9
Third, most players and owners do not live year-round in the local community, so the
majority of their spending is on travel to and maintenance of their multiple homes located
elsewhere. Finally, concession sales must be divided amongst the corporate community
that owns them which is, more often that not, located elsewhere.
The Effect of Stadiums on Permanent Housing
Carlino and Coulson (2004) concluded that athletic stadiums do not increase
property values. Traffic congestion, air and noise pollution, and undesirable crowds cause
property values to decline (Tu 2005). In his 2005 study of the FedEx Field, Tu found that
before construction, properties in close proximity to the stadium have lower property
values and increase in value as you move away from the stadium but only within a 2-3
mile buffer. After opening day, the price differential narrows as property values increase
for residences closest to the stadium. “The results show that the value of a single family
home located less than three miles but more than two miles from the FedEx Field is not
significantly affected, whereas properties within a one mile radium of the stadium are
priced approximately 10.06% lower than comparable units outside the impact area” (Tu
2005, p. 386). Tu also states that the lower property vales in the impact area may have been
the cause and not the effect of the stadium and that the stadium was placed here because of
the already low property values.
Tu (2005) found that the properties closest to the stadium experienced
infrastructure and aesthetic improvements that helped raise the property value but it is
10
important to note that this increase in property value is not a direct result of the stadium.
He concludes that the closer the property to the FedEx Field the greater the price
improvement, and that the impact on properties more than 2.5 miles away is minimal. Tu
believes that the stadium generated new low-wage employment opportunities that
accurately matched the skills of the high-minority low-education level of the original
population, provided a recreational outlet to foster a sense of community, and improved the
local infrastructure which may not have happened without the stadium. Tu did find,
however, that pre-development property values near the proposed stadium were lower than
those located further away, but that “this gradient became less pronounced following the
stadium’s development” (Tu 2005 in Dehring et al 2007).
Dehring et al (2007) go one step further than Tu when studying the Dallas
Cowboys stadium. They examine how the announcement of the new stadium affects the
local residential area before construction on said stadium even begins. They also examine
the changing housing stock, moving from an area predominated by single family homes to
one and two bedroom condos and apartments and lofts. Their results show the stadium
having a negative and statistically significant impact on the age of housing (new housing
units were constructed), a positive and statistically significant effect on optional luxury
features and amenities (for example swimming pools), and a negative and statistically
significant effect on the number of stories of housing units (more apartments, lofts,
studios). Dehring et al found that the announcement of the new stadium construction had a
negative effect on residential property values within 20 miles of the proposed site. They
conclude that
11
“The aggregated impact of stadium announcements when stadiums are
funded by municipal tax dollars is the combination of three distance
elements: the tax burden, which causes a reduction in property values; the
overall city amenity effect, which causes an increase in property values, and
the proximity amenity effect, which has an ambiguous effect on residential
property values” (Dehring et al 2007, p. 7).
Dehring et al state that the reduction in property value is not statistically significant and is
barely distinguishable from zero, which is different from Tu’s study when he found a
positive amenity effect for properties around the Redskins stadium. The difference in their
findings may belong to the role of taxes in each project; the Dallas stadium was funded by
increases in local taxes but the Redskins stadium was not (Dehring et al 2007).
Carlino and Coulson (2004) measure the social benefits of NFL stadiums in the
form of crime rates, measurable litter, utility costs, unemployment rates, etc. Currently, the
NFL franchises receive more attention than any other sports franchises in the U.S. and as a
result they are expanding. The placements of NFL franchises have “less to do with city-
specific characteristics than in any other major sports league” (Carlino and Coulson 2004,
p. 28). In central cities with NFL franchises, annual rents rise by 8 percent and
approximately half that amount when the entire metropolitan area hosts the franchise
(Carlino and Coulson 2004). In addition, wages in metropolitan areas with NFL teams
decline by 2 percent. Carlino and Coulson (2004) go on to compare rents in select cities
that did not have NFL teams in 1993 but did by 1999 and in every city, the rent increased.
Carlino and Coulson examine changes in the central city, the metropolitan
statistical area (MSA), and the consolidated metropolitan statistical area (CMSA). In
central cities, NFL franchises have a positive and statistically significant effect on rents
12
(rents go up), a negative and statistically significant effect on the number of rent
controlled properties (less housing and neighborhood stability), a positive and significant
effect on the presence of high-rise buildings (fewer single-family homes), a negative and
significant effect on the presence of abandoned buildings in the neighborhood (fewer
abandoned buildings), and a negative effect on the unemployment rate (fewer unemployed)
(Carlino and Coulson 2004).
In the MSA, there is a positive and statistically significant effect of NFL franchises
on the presence of high-rise buildings (less single-family homes), a negative and
statistically significant effect on the number of abandoned building (fewer abandoned
buildings), a negative and statistically significant effect on the number of rent controlled
properties (less housing and neighborhood stability), and a negative and statistically
significant effect on the unemployment rate (fewer unemployed).
In the CMSA, there is a negative and statistically significant effect by the NFL
team on the unemployment rate (fewer unemployed), a negative and statistically significant
effect on the number of abandoned buildings in the community (fewer abandoned
buildings), and a positive and statistically significant effect on the number of high-rise
buildings (fewer single-family homes). For the population itself, there is a negative and
statistically significant effect on the Black and Asian populations (more white people), and
a positive and statistically significant on the number of residents possessing a college
degree or better (higher educational obtainment). This data provided shows that athletic
stadiums reduce the black and Asian population and increases the number of high-rise
housing units.
13
The increase in single person occupancy housing units (high-rise housing units)
replaces community that was full of working-class, majority-minority, single-family homes
with a community of college-educated single people living alone in high-rise apartments.
The decline of the unemployment rate in the central city, MSA, and CMSA, may be
attributed to the new community members who might work outside the community. The
increase in the amount of amenities (central air conditioning, garages, public sewers) also
serves to increase the annual rents paid by the residential population.
There is overwhelming evidence in the literature that athletic stadiums do not
stimulate local or regional economies. Baade (1994) found “no significant difference in
personal income growth from 1958 to 1987 between 36 metropolitan areas that hosted a
team in one of the four premier professional sport leagues and 12 otherwise comparable
areas that did not (Baade in Siegfried and Zimbalist 2000, p. 104). Baade even goes so far
as to state that “the presence of a major league sports team actually put a drag on the local
economy” (Baade in Siegfried and Zimbalist 2000, p. 104). Proponents of athletic stadiums
argue that the stadium will create new jobs as well as stimulate the local economy in the
form of restaurants, hotels, and higher property values. Baade (in Siegfried and Zimbalist
2000) asserts that there is no evidence that a new sports stadium increase the per capita
income in the host community. Coates and Humphreys (1999) find that new stadiums
actually reduce per capita income in the host city. Siegfried and Zimbalist (2000) go on to
discuss employment trends, with stadiums hiring most employees as day-of-game
personnel who work in low-wage, unskilled, temporary part-time jobs. One NFL team
provides day-of-game employment for the full-time equivalent of 20 to 30 year round jobs
14
with another 70 to 130 employed in the team’s front offices (Siegfried and Zimbalist
2000).
According to Siegfried and Zimbalist (2000) there are cycles of building for new
athletic stadiums, estimating that “more than $21.7 billion will be spent on these 95 new
stadiums built or planned since 1990” (95). The sports facility construction cycle occurs in
30-year increments, with a new cycle likely to begin around 2020 (Siegfried and Zimbalist
2000). Stadiums are becoming more and more expensive too; “the average cost of facility
construction in current dollars rose from $3.8 million in the 1950s, to $25 million in the
1960s, $71 million in the 1970s, $103 million in the 1980s, and to $200 million from 1990
through 1998” (Siegfried and Zimbalist 2000, p. 97).
The Olympics
When cities are marketing their Olympic bid to their citizens, promises are made in
three ways: civic pride, economic growth, and modernization of the host city (Corrarino
2014). There has been a lot of debate surrounding the construction and development of
stadiums for use in Olympic Games. Most recently, Los Angeles and Boston have been in
the news as potential hosts for the 2024 Olympics. Opponents in Boston for the Boston
2024 Olympics have cited the profound negative social and economic impacts to
communities of color as a reason not to host the Olympics, citing abandoned Olympic sites
and increased spending. In 1990 after Atlanta was awarded the 1995 Olympics,
development for city space halted and money that was previously spent on city renewal
15
and resources was funneled only to the Olympic venues themselves (Rutheiser 1997). The
organization that promised to help with the redevelopment of downtown Atlanta and to
revitalize a depressed commercial and residential area spent most of the its money on the
Olympic venues themselves, new street lighting, pavement, and street furniture that was
meant to stimulate pedestrian traffic both during and after the 1995 Olympics. “Many
Atlantans, especially those in the poorer neighborhoods, were deeply disappointed by the
modest and limited extent of…[the] urban redecorating plans” (Rutheiser 1997, p. 25)
As Brazil prepares to host the 2016 Summer Olympics, rampant development
projects have gone underway. While we could predict that the poorest communities in
Brazil are disproportionately affected by Olympic development, even the middle and upper
classes in Rio de Janeiro are facing zero-day evictions (Corrarino 2014). Environmental
analyses have been “ignored as the city speeds ahead with transportation projects that
threated the environment around the city’s world-famous beach dunes” (Corrarino 2014, p.
181). The decisions to move forward with these socially and economically disruptive
decisions have been made without public input and behind closed doors. Corrarino notes
that:
“mega-events create pretexts for the implementation of ‘law-exclusion
zones’-- spaces, both physical and metaphorical, in which normal legal
processes are jettisoned and new, exceptional legal regimes take their
place-- and...these regimes often undermine normal human rights
protections, allowing a few to profit at the expense of the many” (2014,
p.182).
Boston’s Olympic bid process comes under the same scrutiny. Boston’s own pro-Olympic
Campaign (Boston 2024) was scrutinized for its lack of transparency and tendency to say
16
“one thing behind closed doors, and an entirely different thing to Massachusetts
taxpayers” (Bismark Tribune 2015).
Economic growth has long been used as a tactic to entice citizens to support an
Olympic bid. The promised development of new infrastructure aims to portray the host city
as successful and, consequently, “without the homeless, public housing residents, and other
low-income Atlantans who were also predominately racial minorities” (Gustafson 2013, p.
199). These residents were forcibly evicted from their homes and forced to move away
from Olympic related development. There was intensification in the closure of public
housing, homeless people were bussed out of the city, new anti-homelessness ordinances
were created, and forced evictions and displacements followed the construction of Olympic
infrastructure (Gustafson 2013).
Gaps in Current Literature
While the topic of where to build athletic stadiums is not a new one, there is very
limited existing research available. The research available is largely completed by just a
few scholars who cite each other in literature reviews and references. Most of said research
is also now outdated, and there has been no supplemental subsequent research. While the
effects of the gentrification of housing has been studied and dissected, it is most often
related to the ebbs and flow of cities and development. The construction of athletic
stadiums and gentrification has a cause and effect relationship; construction spurs new
development, which results in the disruption and disintegration of the existing community.
17
The literature on athletic stadiums as it relates to the topic of this paper is largely
related to jobs and the economy. When athletic stadiums are sold to communities, it is easy
to document the promises made to host communities by the developers: more jobs, more
tourists, and higher visibility. Because these promises are made public to communities,
there has been research done refuting all claims made by the developer that the new
athletic stadium will ultimately benefit the community. There has been less effect, however
on the social implications of the new construction, probably because it is harder to
quantify. What kinds of people will be working in the stadium? Where will they live in
relation to the stadium? What will happen to the people whose property is taken to build
the stadiums? Where will the people who are displaced by the stadium ultimately live?
Current available literature focuses mostly on the quantitative value of people and space,
and there is little to no research about the qualitative impact of athletic stadiums on
communities.
In addition, the literature needs to make the link between race and stadium
construction. New construction of athletic stadiums, more often than not, is happening in
low-income, under-funded, majority-minority communities. That same community is then
disrupted, displaced, and replaced by young, white, middle- and upper-middle class, child-
less people.
18
Chapter 4: Methodology
For this paper, available Census and American Community Survey (ACS) data can
compare neighborhood characteristics on multiple levels including: income, racial
composition, and housing stock. These dimensions will reflect the gentrification of the
neighborhoods; gentrification is marked as a change in a neighborhood from being
predominately low-income and minority families to being predominately young, college-
educated, singles. Housing characteristics will be compared on multiple levels, including:
occupancy rate, household size, and household type. These housing characteristics will
show an increase in the supply of smaller housing units and structures and a decline in
family housing structures to meet the demands of a younger, unmarried population. In the
absence of all this necessary data for a side-by-side comparison of both neighborhoods, I
will use the case study approach, influenced by Robert Yin (2013) in terms of organization
and analysis of the data. The case study will focus on the construction of the Washington
Nationals Stadium located in Southeast DC.
Census and American Community Survey data (ACS) will be available for
Southeast DC. Data collection and analysis techniques for this paper will be similar to
those employed by Tu (2005); the Nationals field impact zone will incorporate the entirety
of southeast DC, identified by the zip code 20003. The impact zone for the Nationals field
was chosen due to natural barriers that will most likely serve as barriers to development,
including the Anacostia River to the south, the Southeast Highway/I-295 to the north and
east, and South Capital Street to the west.
19
The use of this type of data is documented evidence, defined by Yin (2013) as
stable (can be viewed repeatedly), unobtrusive (existed before and after the case study),
and specific (examines income, race, and housing stock) (Yin 2013, p. 106). In addition,
Census and ACS data does not reflect reporting bias, however, the lack of participants in
the Census can lead to bias based on educational obtainment (correlated to income) or
housing instability (if people are moving and miss the questionnaire they may be
unaccounted for). “For many case studies, archival records [(public files)]...are relevant”
(Yin 2013, p. 109).
Yin (2013) also suggests using multiple sources of evidence (Yin 2013). My
decision to look at three sources of evidence (income, racial composition, and housing
stock) allows me as the researcher to triangulate on my hypothesis; “any finding or
conclusion is likely to be more convincing and accurate if it is based on several different
sources of information” (Yin 2013, p. 120).
ACS data is available for the southeast region of DC; however, it incorporates an
area larger than needed for this study. The use of GIS would help narrow this case study’s
impact area, but in its absence we will use the entire Census tract. In other words, the use
of GIS will help us see the change in community directly surrounding the Nationals
stadium.
20
Anticipated Findings
Using GIS data to track the change in housing, I anticipate a graduated change in
housing surrounding the projected athletic stadium. Pre-construction, I predict that the
surrounding neighborhood will be mostly single family dwellings inhabited mostly by
people of color. It will be an economically depressed area that has seen little to no new
development projects in the past 10 years. During and after construction, I anticipate a
spike in property values in the surrounding area. I anticipate the beginning of the
displacement of the longstanding families, either through use of eminent domain, raised
property taxes, or the relocation of rental families. Post-construction, I anticipate the
continued construction of high-rise, single occupancy condominiums, and a largely young,
white demographic. These anticipated findings will show that the construction of new
athletic stadiums disproportionately affects families and communities of color, that
developers choose these low-income, high-minority neighborhoods because property is
cheap, and eventually turn the neighborhood into an area inhabited by and frequented by
young, white professionals.
A Case Study: Washington Nationals Stadium
The Stadium
The Washington Nationals are the professional baseball team for Washington DC.
The Washington Nationals stadium is located in Washington DC’s Navy Yard, opened in
21
2008, and can hold 41,546 fans. The stadium cost more than $611 million and is a
certified Green building- “the ballpark’s design and construction exceeded the target of a
‘certified’ Green Building” and received the US Green Building Council’s “Silver Status”
(www.washingtonnationals.com: 2 Feb 2016).
The Washington Nationals stadium is located near where I grew up and where most
of my family lives. While studying at American University in Washington DC during my
undergraduate years, I participated in an American Cities and Development semester-long
seminar. We walked past the stadium almost every day, which at the time was sitting idle
due to what I can only assume to be slowed funding due to the recession. I was able to see
first hand the change in housing: single-family homes with backyards and set-back sitting
across the street from high-rise single-bedroom lofts. I became curious about the effects of
athletic stadiums on communities, specifically regarding gentrification and the change in
housing stock, and was able to use that curiosity to zoom in on that stadium for this case
study.
ACS and Census Data Findings
Construction on the Nationals Stadium started in May 2006 and finished in 2008
for the 20003 zip code. Below is data taken directly from the 2000 Census, the 2000
American Community Survey (ACS), and the 2014 American Community Survey (ACS)
for the 20003 zip code:
22
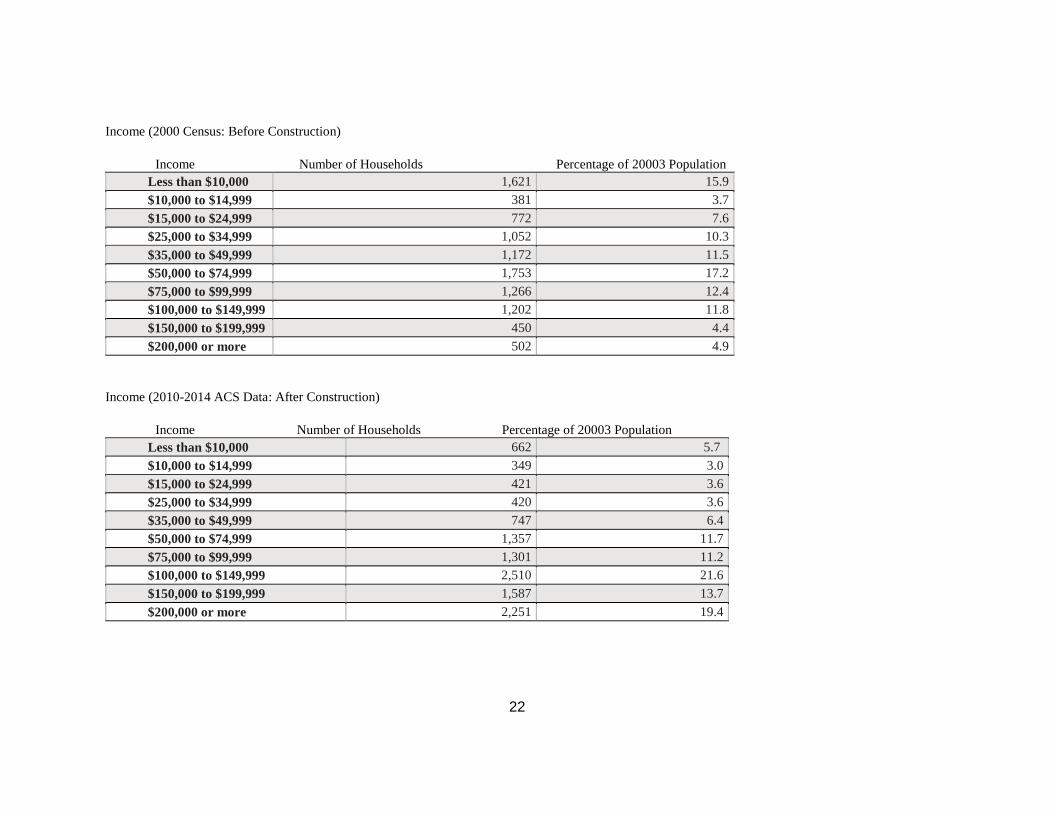
Income (2000 Census: Before Construction)
Income Number of Households Percentage of 20003 Population
Less than $10,000 1,621 15.9
$10,000 to $14,999 381 3.7
$15,000 to $24,999 772 7.6
$25,000 to $34,999 1,052 10.3
$35,000 to $49,999 1,172 11.5
$50,000 to $74,999 1,753 17.2
$75,000 to $99,999 1,266 12.4
$100,000 to $149,999 1,202 11.8
$150,000 to $199,999 450 4.4
$200,000 or more 502 4.9
Income (2010-2014 ACS Data: After Construction)
Income Number of Households Percentage of 20003 Population
Less than $10,000 662 5.7
$10,000 to $14,999 349 3.0
$15,000 to $24,999 421 3.6
$25,000 to $34,999 420 3.6
$35,000 to $49,999 747 6.4
$50,000 to $74,999 1,357 11.7
$75,000 to $99,999 1,301 11.2
$100,000 to $149,999 2,510 21.6
$150,000 to $199,999 1,587 13.7
$200,000 or more 2,251 19.4
23
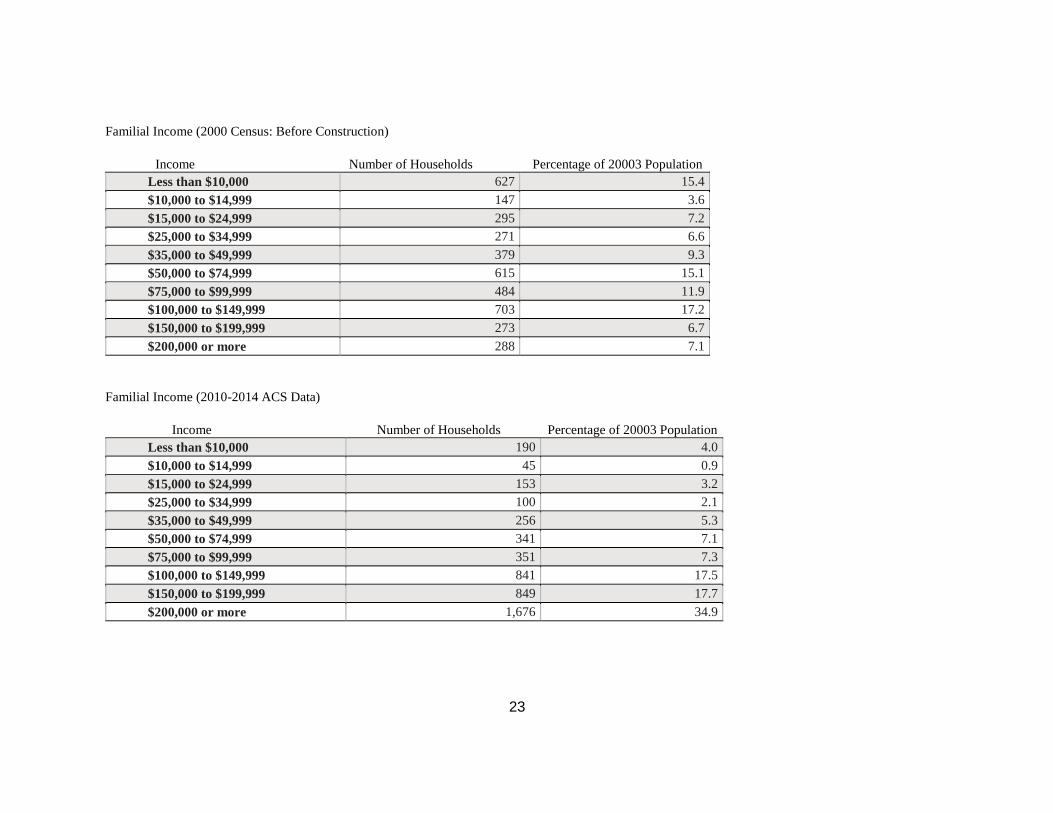
Familial Income (2000 Census: Before Construction)
Income Number of Households Percentage of 20003 Population
Less than $10,000 627 15.4
$10,000 to $14,999 147 3.6
$15,000 to $24,999 295 7.2
$25,000 to $34,999 271 6.6
$35,000 to $49,999 379 9.3
$50,000 to $74,999 615 15.1
$75,000 to $99,999 484 11.9
$100,000 to $149,999 703 17.2
$150,000 to $199,999 273 6.7
$200,000 or more 288 7.1
Familial Income (2010-2014 ACS Data)
Income Number of Households Percentage of 20003 Population
Less than $10,000 190 4.0
$10,000 to $14,999 45 0.9
$15,000 to $24,999 153 3.2
$25,000 to $34,999 100 2.1
$35,000 to $49,999 256 5.3
$50,000 to $74,999 341 7.1
$75,000 to $99,999 351 7.3
$100,000 to $149,999 841 17.5
$150,000 to $199,999 849 17.7
$200,000 or more 1,676 34.9
24
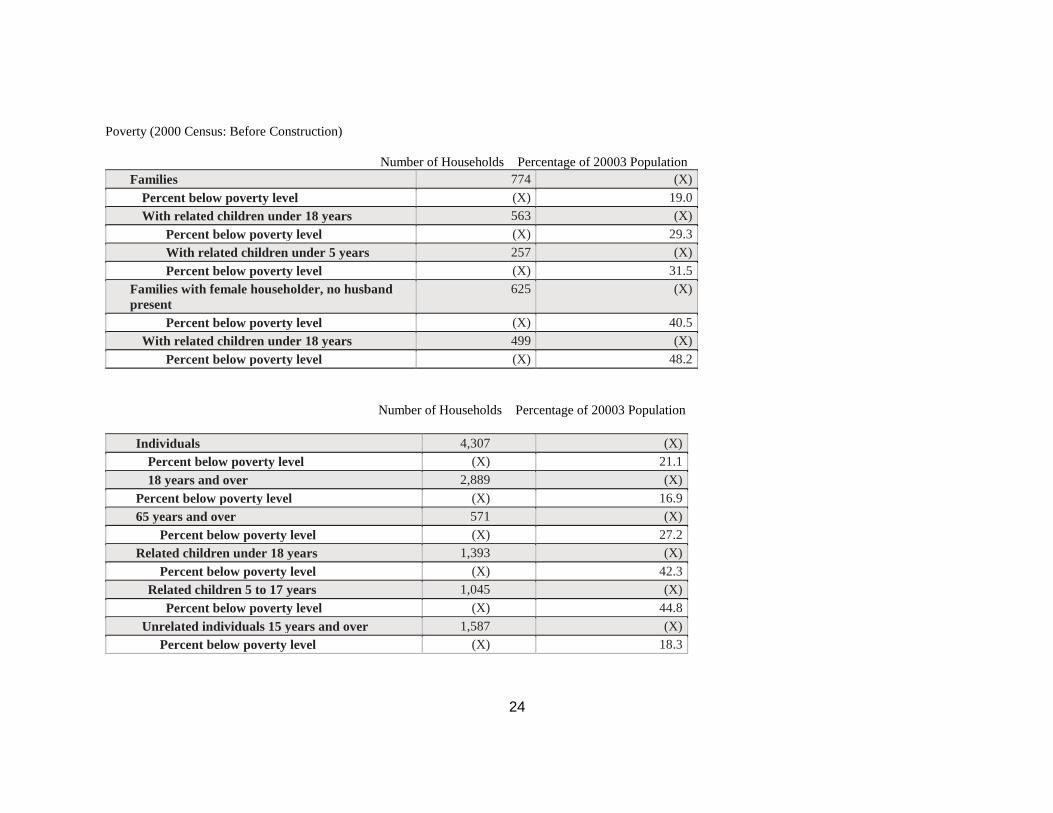
Poverty (2000 Census: Before Construction)
Number of Households Percentage of 20003 Population
Families 774 (X)
Percent below poverty level (X) 19.0
With related children under 18 years 563 (X)
Percent below poverty level (X) 29.3
With related children under 5 years 257 (X)
Percent below poverty level (X) 31.5
Families with female householder, no husband
present
625 (X)
Percent below poverty level (X) 40.5
With related children under 18 years 499 (X)
Percent below poverty level (X) 48.2
Number of Households Percentage of 20003 Population
Individuals 4,307 (X)
Percent below poverty level (X) 21.1
18 years and over 2,889 (X)
Percent below poverty level (X) 16.9
65 years and over 571 (X)
Percent below poverty level (X) 27.2
Related children under 18 years 1,393 (X)
Percent below poverty level (X) 42.3
Related children 5 to 17 years 1,045 (X)
Percent below poverty level (X) 44.8
Unrelated individuals 15 years and over 1,587 (X)
Percent below poverty level (X) 18.3
25
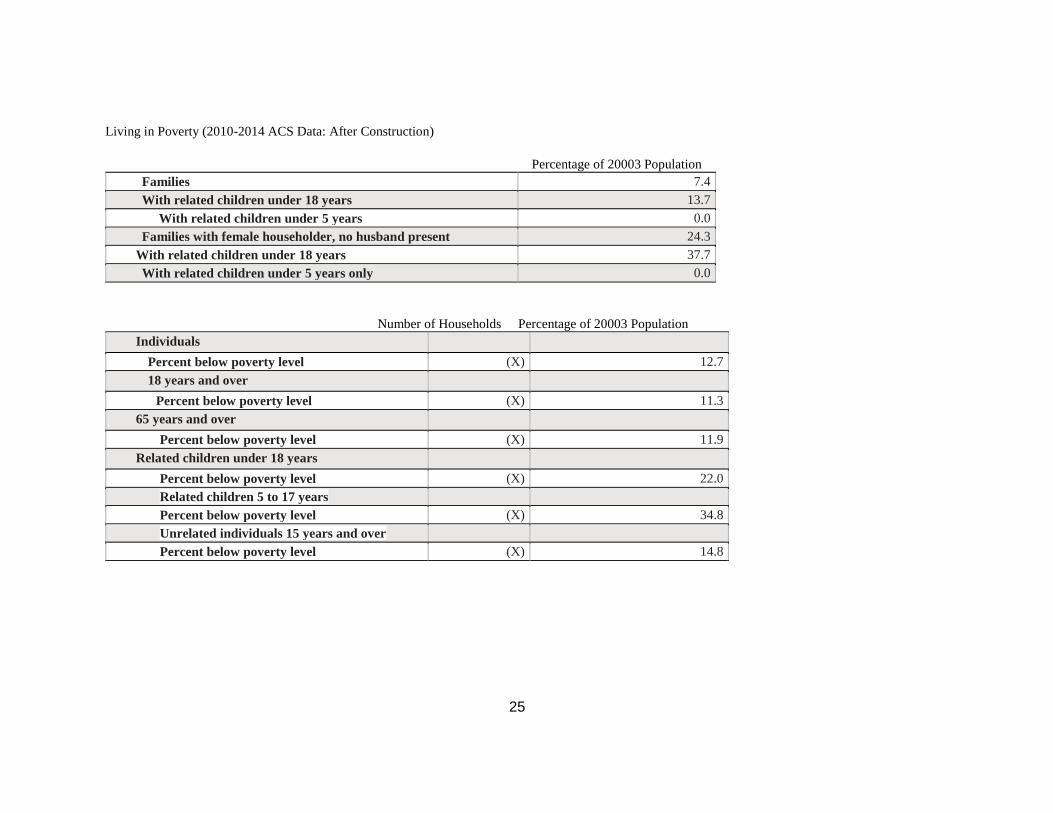
Living in Poverty (2010-2014 ACS Data: After Construction)
Percentage of 20003 Population
Families 7.4
With related children under 18 years 13.7
With related children under 5 years 0.0
Families with female householder, no husband present 24.3
With related children under 18 years 37.7
With related children under 5 years only 0.0
Number of Households Percentage of 20003 Population
Individuals
Percent below poverty level (X) 12.7
18 years and over
Percent below poverty level (X) 11.3
65 years and over
Percent below poverty level (X) 11.9
Related children under 18 years
Percent below poverty level (X) 22.0
Related children 5 to 17 years
Percent below poverty level (X) 34.8
Unrelated individuals 15 years and over
Percent below poverty level (X) 14.8
26
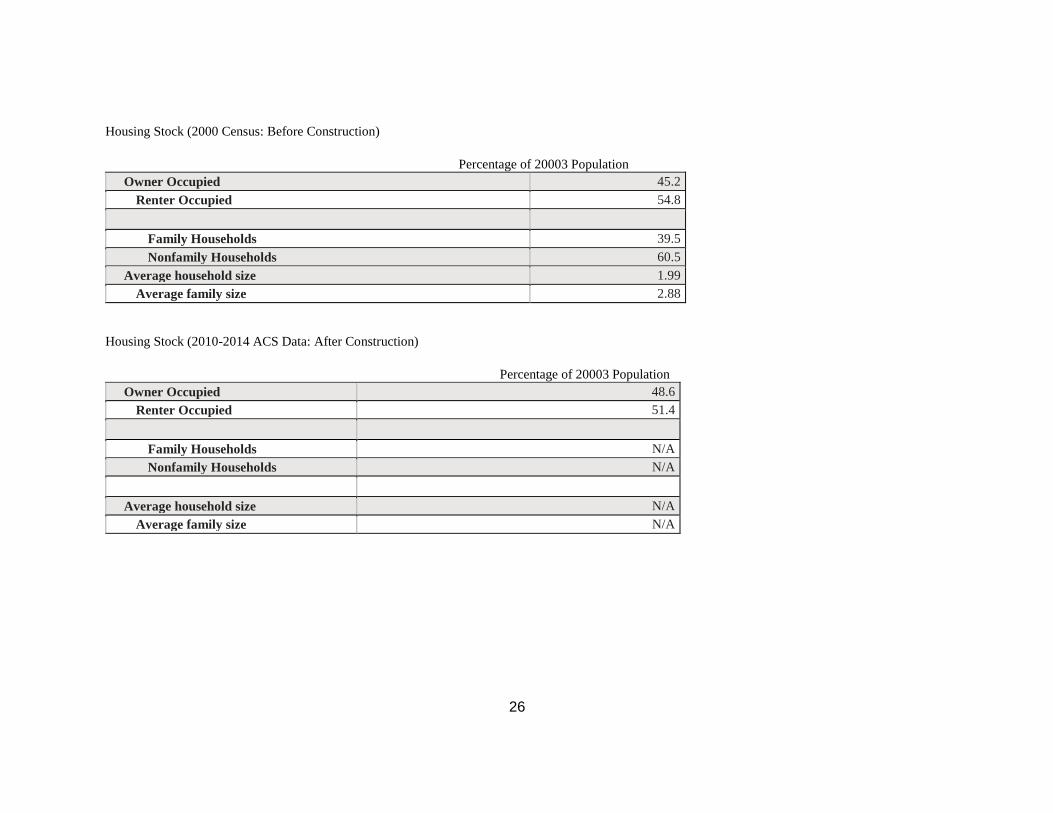
Housing Stock (2000 Census: Before Construction)
Percentage of 20003 Population
Owner Occupied 45.2
Renter Occupied 54.8
Family Households 39.5
Nonfamily Households 60.5
Average household size 1.99
Average family size 2.88
Housing Stock (2010-2014 ACS Data: After Construction)
Percentage of 20003 Population
Owner Occupied 48.6
Renter Occupied 51.4
Family Households N/A
Nonfamily Households N/A
Average household size N/A
Average family size N/A
27
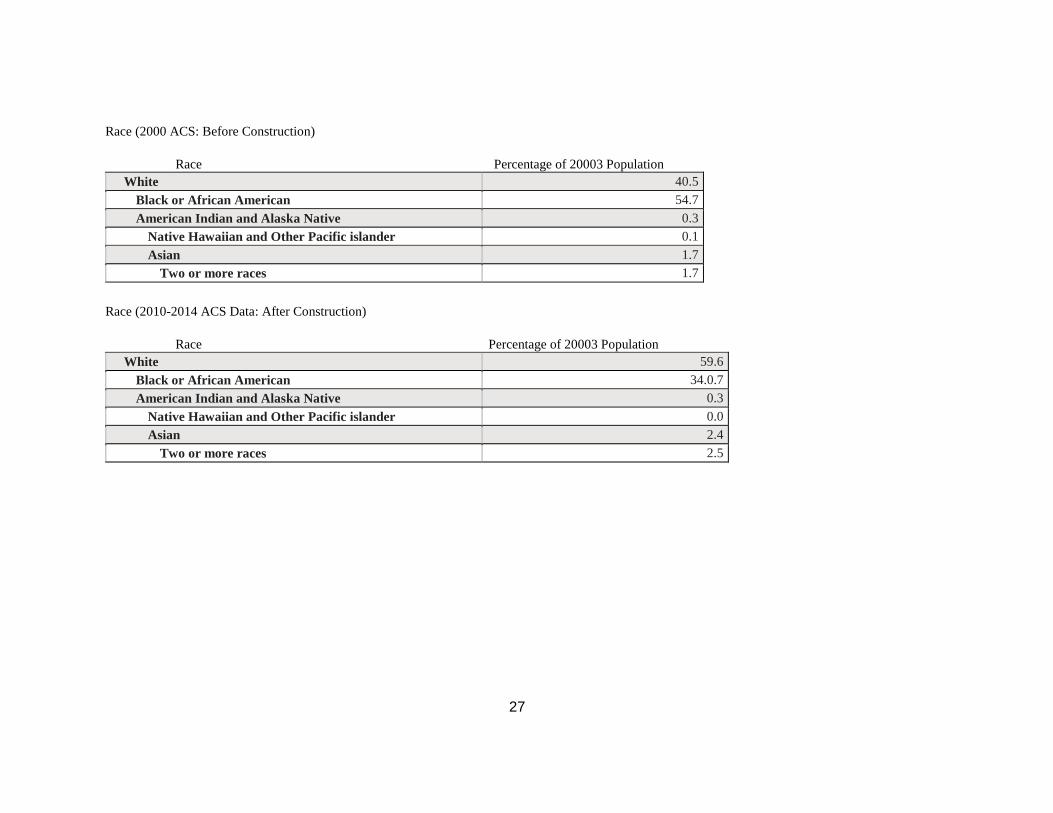
Race (2000 ACS: Before Construction)
Race Percentage of 20003 Population
White 40.5
Black or African American 54.7
American Indian and Alaska Native 0.3
Native Hawaiian and Other Pacific islander 0.1
Asian 1.7
Two or more races 1.7
Race (2010-2014 ACS Data: After Construction)
Race Percentage of 20003 Population
White 59.6
Black or African American 34.0.7
American Indian and Alaska Native 0.3
Native Hawaiian and Other Pacific islander 0.0
Asian 2.4
Two or more races 2.5
28
Analysis of Data
With the data obtained from the Census and American Communities Survey
(ACS), it can been seen that there is a strong correlation with the development of the
athletic stadium and the change in housing stock, racial composition of the neighborhood,
and income changes in the neighborhood. Eight years before the stadium was built, the
20003 zip code that includes the waterfront and Navy Yard was a majority low- and
middle-income, African-American neighborhood. There were just as many households
living in poverty as there were making $50,000 a year. Six years after the construction of
the stadium is complete, the neighborhood has changed: it is overwhelmingly white and
the majority of households earn $200,000 a year or more. Owner occupied and renter
occupied housing ratios have stayed just about the same, and in the absence of data on
familial and household size, it cannot be determined just how many people are raising their
families here or are just roommates living together to save on housing costs.
While this paper attributes neighborhood changes in the 20003 zip code to the new
construction of the athletic stadium, it is important to note that there may have been other
factors influencing community change.
Chapter 5: Implications and Conclusions
As the case study above shows, the construction of athletic stadiums results in the
displacement of that community’s original population. These neighborhoods start as low-
income, mostly minority neighborhoods and change to middle and high income mostly
29
white neighborhoods. Cities who are eager to reap the projected benefits of new stadiums
should work with developers to find responsible housing options for residents.
In the literature review, Carlino and Coulson (2004), and Dehring et al (2007)
conclude that athletic stadiums do not increase property values. Carlino and Coulson site
social effects of the NFL, countering that the increase in air and noise pollution and traffic
deter new residents from settling near stadiums; stadiums actually bring down property
values. Dehring et al conclude that there is a net zero effect of athletic stadiums (2007), but
recognize that Tu (2005) contradicts this finding in his study. Tu’s 2005 study and the case
study for this paper of the Washington Nationals stadium cite increases in property values.
The implications for development of new athletic stadiums directly mirror uneven
development recommendations. While the list of policy recommendations to prevent
gentrification and uneven development is extensive, specific recommendations related to
preservation of housing would have the largest impact on communities.
Displacement and Housing
Displacement of people and communities is the largest factor that fuels
gentrification and is the most visible effect on the community (Kennedy and Leonard,
2001). Renters who live in cities are at risk for being pushed out as landlord raise rents;
“Displacement begins as landlords take advantage of rising market values
and evict long-time residents in order to rent or sell to the more affluent.
Increasingly, newcomers are more likely to be homeowners, and the rising
property values cause down payment requirements to increase” (Rose
2002, p. 6)
30
As new, higher-income tenants move into an area, new services catering to this
demographic appear. The new, high-income tenants reject services offered to low-income
tenants, such as social service facilities for the homeless, industrial services, or other things
they deem undesirable (Rose 2002). The community’s longest residents and their services
(faith-based, industries, cultural, commercial) are subsequently forced out of the
neighborhood.
Renters are most vulnerable for displacement because they cannot afford increased
rent prices and are less willing to combat their landlords, especially if they do not speak
English or have a questionable immigration status. Property owners have more flexibility
in their options because they can elect to sell their property at a profit. This can still,
however, contribute to gentrification; owners must now choose whether or not they want to
sell their property with a substantial profit or stay and in their neighborhood (Kennedy and
Leonard 2001).
Funding for The U.S. Department of Housing and Urban Development (HUD) and
low-income housing has been shrinking in past years, resulting in a concentration of low-
income housing in underserved communities (Rose 2002). “The federal investment in
HUD and low-income housing programs has declined as much as 60% over the last quarter
century” (Rose 2002, p. 5). Between 1997 and 1999, more than 300,000 affordable
housing units (for low-income households) were lost and not replaced (Rose 2002). In
1999, 14 million people (owners and renters) spent more than half of their income on
housing (Rose 2002). Currently, not all cities and towns have affordable housing policies
in place, which puts more pressure on existing affordable housing units. Zoning practices
31
make it increasingly difficult to create more low-income options so there are often more
households in need of low-income housing than are currently available.
Preserving Housing and Communities
Rose (2002) outlines 4 steps to expand affordable housing, thus contributing to the
stabilization of communities. First, do a community assessment. How many renters are in
your neighborhood? How many property owners? What amenities does your community
already have? What services and resources are necessary for the community? Second,
stabilize the communities’ renters. Create emergency funds for rental assistance.
Investigate and remove any discriminatory rental barriers, including rent increase
schedules and limits. Develop housing cooperatives that empower residents in their own
communities by providing them with a voice. Cooperatives can acquire land and accrue
assets that can help to preserve their communities. Third, control land for community
development. Allowing nonprofits to own land and property ensures long-term
affordability because it is a public, rather than private, investment. Decide as a community
if current zoning ordinances contribute to your communities goals. “This will include
promoting inclusionary zoning ordinances, mixed-use and transit-oriented development
and density provisions” (Rose 2002, p. 7), all of which encourage affordable and mixed-
income development.
Community Land Trusts (CLTs) ensure long-term affordability for renters, low-
income homeowners, and nonprofits by removing real estate from the market and keeping
32
it centered on community-based organizations. Housing Trust Funds create a cycle of
revenue stream by diverting funds to affordable housing. (Rose 2002). These tools, in
combination with Community Development Block Grants (CDBG) and federal money can
help maintain and create new affordable housing opportunities for households.
Conclusion
Developers today must be socially conscious when redeveloping inhabited cities.
The previously racially exclusive redevelopment practices have received much more
publicity in recent years. We need more advocacy planners who will give more power to
the previously disenfranchised groups that have been subject to any and every whim of
profit-driven planners and developers. I believe that the lack of minorities from the
planning field has left no voice for the communities selected to be redeveloped.
Heightened awareness about socially disruptive planning practices combined with the
absence of any community voices has warranted more socially conscious redevelopment
patterns that help to expand existing blighted cities without replacing the communities who
are already there. While we as planners, and civil human beings, would like to believe that
we live in a nation free of social prejudices and racism, I must ask why our current
planning practices continue to disrupt communities of only non-whites? We must examine
the corrupt and racist planning practices that have already left poor minorities alone and
isolated in inner-cities. It is time to create a system that is fair and just for all especially
when addressing one of humankind’s most basic needs: shelter.
33
The construction of athletic stadiums has a clear, documented effect on the
community. Athletic stadiums are most often constructed in low-income majority-minority
areas because of the low cost of property. Over time, the neighborhood changes to house
mostly upper-class, single, young white professionals. In addition, the housing stock
changes from mostly single-family homes to single-occupancy homes. The promises of
developers most often prove to be empty, and any gains for the community are felt not by
the community they were promised to, but by the community that replaces them.
Poor residents are disproportionately affected by the construction of new athletic
stadiums; inequitable and uneven planning practices have a negative impact on low-
income communities of color. In addition, having your city and developers invest money
into your own community for future residents rather than current ones can also impact a
community’s self-esteem and sense of value. Future developers of athletic stadiums should
work directly with communities to combat the mass displacement of communities. When
developers work together to ensure equitable redevelopment, long-standing communities
can stay intact, there will be more mixed-income housing, and all can benefit from
reinvestment.
34
List of References
Baade, Robert. 1994. “Stadiums, Professional Sports, and Economic Development: Assessing the
Reality” The Heartland Institute 62: 1-40.
Baade, Robert and Robert Baumann and Victor Matheson. 2008. “Selling the Game: Estimating the
Economic Impact of Professional Sports through Taxable Sales” Southern Economic
Journal 74(3): 794-810.
Baade, Robert A., and Victor A. Matheson. “Professional Sports, Hurricane Katrina, and the
Economic Redevelopment of New Orleans. (Report)” Contemporary Economic Policy.
25.4 (Oct 2007): 591(13). Academic OneFile. Gale, Clark University. 2 Feb 2009.
Carlino, Gerald and N. Edward Coulson. 2004. “Compensating Differentials and the Social
Benefits of the NFL” Journal of Urban Economics 56:25-50.
U.S. Census Bureau. 2000. Profile of General Demographic Characteristics: 2000.
U.S. Census Bureau. 2000. Profile of Selected Economic Characteristics: 2000.
U.S. Census Bureau. 2007-2011. ACS Demographic and Housing Estimates. 2007-2011.
U.S. Census Bureau. 2010. Profile of General Population Characteristics: 2010.
Coates, Dennis. “Stadiums and Arenas: Economic Development or Economic Redistribution?
(Report)” Contemporary Economic Policy. 25.4 (Oct 2007): 565(13). Expanded Academic
ASAP. Gale. Clark University. 2 Feb 2009.
Coates, Dennis and Brad Humphreys. 1999. “The Growth Effects of Sport Franchises, Stadia, and
Arenas” Journal of Policy Analysis and Management v18 (n4): 601-624.
Colclough, William G., Lawrence A. Daellenbach and Keith R. Sherony. 1994. “Estimating the
Economic Impact of a Minor League Baseball Stadium” Managerial and Decision
Economics v15 n(5): 497-502.
Crompton, John L. 1995. “Economic Impact Analysis of Sports Facilities and Events: Eleven
Sources of Misapplication” Journal of Sport Management 9: 14-35.
35
Davies, Larissa E. 2005. “Not in My Back Yard! Sports Stadia Location and the Property Market”
The Royal Geographical Society (with the Institute of British Geographers v37 n(3): 271-
274.
Dehring, Carolyn A., Craig A. Depken, and Michael R. Ward. “The Impact of Stadium
Announcements on Residential Property Values: Evidence from a Natural Experiment in
Dallas-Fort Worth. (Report)” Contemporary Economic Policy. 25.4 (Oct 2007): 627(12).
Expanded Academic ASAP. Gale. Clark University. 2 Feb 2009.
Gustafson, Seth. 2013. “Displacement and the Racial State in Olympic Atlanta: 1990-1996”
Southeastern Geographer v53 (n2): 198-213.
Kennedy, Maureen and Paul Leonard. 2001. “Dealing with Neighborhood Change: A Primer on
Gentrification and Policy Changes” The Brookings Institution Center on Urban and
Metropolitan Policy 17-38.
Leeds, Michael. 2008. “Do Good Olympics Make Good Neighbors?” Contemporary Economic
Policy v26 (n3): 460-467.
Rose, Kalima. “Combating Gentrification Through Equitable Development” Race, Poverty, and the
Environment v9 (n1): 5-8.
Ruthesier, Charles. 1997. “Making Place In The Nonplace Urban Realm: Notes On The
Revitalization of Downtown Atlanta” Urban Anthropology and Studies of Cultural Systems
and World Economic Development v26 (n1): 9-42.
Siegfried, John and Andrew Zimbalist. 2000. “The Economics of Sports Facilities and Their
Communities” The Journal of Economic Perspectives v15 (n3): 95-114.
Swindell, David and Mark S. Rosentraub. 1998. “Who Benefits from the Presence of Professional
Sports Teams? The Implications for Public Funding of Stadiums and Arenas” American
Society for Public Administration v58 (n1): 11-20.
Yin, R. 2013. Case Study Research: Design and Methods (Applied Social Research Methods.
California: SAGE Publications Inc.

36