Embed Size (px)
Citation preview
THE EFFECT OF BORDERS ON THE LINGUISTIC PRODUCTION AND PERCEPTION OF
REGIONAL IDENTITY IN LOUISVILLE, KENTUCKY
BY
JENNIFER SUZANNE CRAMER
DISSERTATION
Submitted in partial fulfillment of the requirements
for the degree of Doctor of Philosophy in Linguistics
in the Graduate College of the
University of Illinois at Urbana-Champaign, 2010
Urbana, Illinois
Doctoral Committee:
Professor Rakesh M. Bhatt, Chair
Professor Eyamba G. Bokamba
Assistant Professor Adrienne Lo
Professor Dennis R. Preston, Oklahoma State University
ii
ABSTRACT
A great deal of scholarly research has addressed the issue of dialect mapping in the
United States. These studies, usually based on phonetic or lexical items, aim to present an overall
picture of the dialect landscape. But what is often missing in these types of projects is an
attention to the borders of a dialect region and to what kinds of identity alignments can be found
in such areas. This lack of attention to regional and dialect border identities is surprising, given
the salience of such borders for many Americans. This salience is also ignored among
dialectologists, as nonlinguists‟ perceptions and attitudes have been generally assumed to be
secondary to the analysis of “real” data, such as the phonetic and lexical variables used in
traditional dialectology.
Louisville, Kentucky is considered as a case study for examining how dialect and
regional borders in the United States impact speakers‟ linguistic acts of identity, especially the
production and perception of such identities. According to Labov, Ash, and Boberg (2006),
Louisville is one of the northernmost cities to be classified as part of the South. Its location on
the Ohio River, on the political and geographic border between Kentucky and Indiana, places
Louisville on the isogloss between Southern and Midland dialects. Through an examination of
language attitude surveys, mental maps, focus group interviews, and production data, I show that
identity alignments in borderlands are neither simple nor straightforward. Identity at the border is
fluid, complex, and dynamic; speakers constantly negotiate and contest their identities. The
analysis shows the ways in which Louisvillians shift between Southern and non-Southern
identities, in the active and agentive expression of their amplified awareness of belonging
brought about by their position on the border.

iii
For Aaron Michael, Isabelle Lorene, and the little one
iv
ACKNOWLEDGMENTS
During the course of this project, I have received a great amount of love, support, and
encouragement from so many people. I would like to first thank Dr. Rakesh Bhatt for the
countless hours spent helping me make this project a reality. Thank you so much for being such a
great advisor and mentor. You have certainly prepared me well for an academic career, and for
that, I am grateful.
I would also like to thank my committee members: Dr. Eyamba Bokamba, Dr. Adrienne
Lo, and Dr. Dennis Preston. I am so thankful for the encouragement and guidance you have each
provided me during the course of this project. Many thanks for the comments and feedback you
have provided; these additions have certainly made the dissertation better.
For certain technical aspects of the dissertation, I would also like to thank the nice people
in the Geographical Information Systems division of ATLAS, who helped with the preparation
of the regional map and with my understanding of ArcGIS. I also had help with the phonetics
aspect of this dissertation from the graduate student workers in the Illinois Phonetics &
Phonology Lab. I could not have done this work without the help of Meg Osfar, Chris Carignan,
and especially Shawn Chang, who provided a great deal of guidance.
The support of my colleagues in the Dissertation Discussion Group and the Language and
Society Discussion Group was also greatly appreciated. Our discussions helped me to better
understand certain aspects of our field. I thank you all for the feedback and for the chance to
share my work with you. In a similar vein, I would also like to thank the audiences from LSA
2009 and ADS 2010 for their comments and suggestions.
I must also thank all of my friends and family who have really been my strength
throughout this whole process. You were very encouraging and provided me a chance to take a
v
break from the stress of writing the dissertation. I want to thank Isabelle for helping me learn
how to play again and for being a shining light in my life. You have been the ultimate motivation
for finishing this degree. Finally, and perhaps most importantly, I want to thank my husband,
Aaron. You have truly made this whole thing possible! It‟s been wonderful having you, the one
who went there first, by my side, being wonderful and understanding. In addition to the moral
support, you provided invaluable technical support, which made the work a lot easier. You are
awesome! I love you!
vi
TABLE OF CONTENTS
CHAPTER 1: INTRODUCTION ................................................................................................... 1
1 Overview .............................................................................................................................. 1
2 Summary of Results ........................................................................................................... 11
3 Organization of Dissertation .............................................................................................. 12
CHAPTER 2: REVIEW OF THE LITERATURE ....................................................................... 15
1 Overview ............................................................................................................................ 15
2 Previous Research .............................................................................................................. 15
3 Theoretical Framework ...................................................................................................... 49
4 Discussion .......................................................................................................................... 73
CHAPTER 3: ABOUT LOUISVILLE ......................................................................................... 75
1 Overview ............................................................................................................................ 75
2 General Information ........................................................................................................... 75
3 At a Geographic and Political Border ................................................................................ 77
4 At a Linguistic Border ....................................................................................................... 79
5 At a Historic Border ........................................................................................................... 80
6 At a Cultural Border........................................................................................................... 84
7 At a Perceptual Border ....................................................................................................... 86
8 Discussion .......................................................................................................................... 87
CHAPTER 4: RESEARCH DESIGN ........................................................................................... 88
1 Overview ............................................................................................................................ 88
2 Perceptual Dialectology ..................................................................................................... 88
3 Production of Identity ........................................................................................................ 95
4 Perception of Identity ....................................................................................................... 104
5 Discussion ........................................................................................................................ 111
CHAPTER 5: PERCEPTUAL DIALECTOLOGY IN LOUISVILLE ...................................... 112
1 Overview .......................................................................................................................... 112
2 Mental Maps .................................................................................................................... 112
3 Language Attitudes .......................................................................................................... 139
4 Labels and Open-Ended Responses ................................................................................. 157
5 Discussion ........................................................................................................................ 166
CHAPTER 6: THE SOUTHERN VOWEL SHIFT AND PRODUCTION OF IDENTITY ..... 168
1 Overview .......................................................................................................................... 168
2 Analysis............................................................................................................................ 169
vii
3 Expressions of Southernness in Context .......................................................................... 197
4 Discussion ........................................................................................................................ 208
CHAPTER 7: PERCEIVING LOUISVILLE ............................................................................. 210
1 Overview .......................................................................................................................... 210
2 Classifying Dialects ......................................................................................................... 211
3 Dialect Perception and Varying Social Information ........................................................ 226
4 Discussion ........................................................................................................................ 250
CHAPTER 8: CONCLUSIONS ................................................................................................. 251
1 Overview .......................................................................................................................... 251
2 Discussion of Results ....................................................................................................... 251
3 The Contributions of This Dissertation............................................................................ 254
4 Limitations and Problems in the Research ....................................................................... 259
5 Areas for Further Research .............................................................................................. 263
6 Discussion ........................................................................................................................ 264
REFERENCES ........................................................................................................................... 266
AUTHOR‟S BIOGRAPHY ........................................................................................................ 285
1
CHAPTER 1: INTRODUCTION
1 Overview
The objective of this dissertation is to gain a better understanding of the ways in which
regional identity is perceived and constructed linguistically at dialect borders in the United
States, using Louisville, Kentucky as an example border situation. These dialect borders are
usually depicted as static, with a linguistic feature present on one side and absent on the other.
Based on the previous research on borderlands, I suggest that a fluidity and hybridity of
identities, much like that described in the third space literature (e.g. Bhabha 1994, Bhatt 2008), is
exhibited in Louisville, which stands in opposition to this static notion. Specifically, this study a)
explores how border residents categorize their own regional variety of English and b)
investigates the ways border residents produce and perceive the regional identities attributed to
them.
Through the examination of language attitude surveys, mental maps, focus group
interviews, and production data, I show that the nature of identities at the border is very fluid.
That is, subjects vary in their attitudes toward and production and perception of certain linguistic
features in a way that indicates that subjects experience the border as the coming together of at
least two distinct regions, seemingly choosing to align or disalign with different ones depending
upon the context of the interaction.
This project, then, not only adds to our specific understanding of the linguistic situation
in Louisville, a rather understudied locale, but it also extends and expands our understanding of
language and identity construction and the particular case of the effects of borders on such
identities.
2
1.1 Introduction to the Research Problem
Dialect mapping is the practice of dialectologists and sociolinguists aimed at defining
dialect boundaries within a given area. These maps are typically created based on large survey
projects where fieldworkers collect data about speakers‟ pronunciation or lexical inventory.
There is a rather long history of dialect mapping in the United States. For instance, as early as
1930, The Linguistic Atlas of the United States and Canada was launched, and Hans Kurath took
the lead in organizing the project (Chambers and Trudgill 1980).
The ultimate goal in these types of dialect mapping projects is to present a clear picture of
how dialects are divided within the country. But dialectologists do not always agree on where to
draw the lines. For example, while most scholars agree on the three major dialect divisions of
North, South, and West, which correspond to the vowel patterns presented in Labov (1991), there
is some dispute about the existence of a Midland region and the appropriate divisions therein (cf.
Kurath 1949, Bailey 1968, Carver 1987, Davis and Houck 1992, Johnson 1994, Frazer 1994).
These types of disagreements affect how dialectologists classify other parts of the
country, including where the northern boundary of the South is drawn. There is a long tradition
of claiming that the Ohio River serves as this northern border (i.e. Carver 1987, Labov 1991,
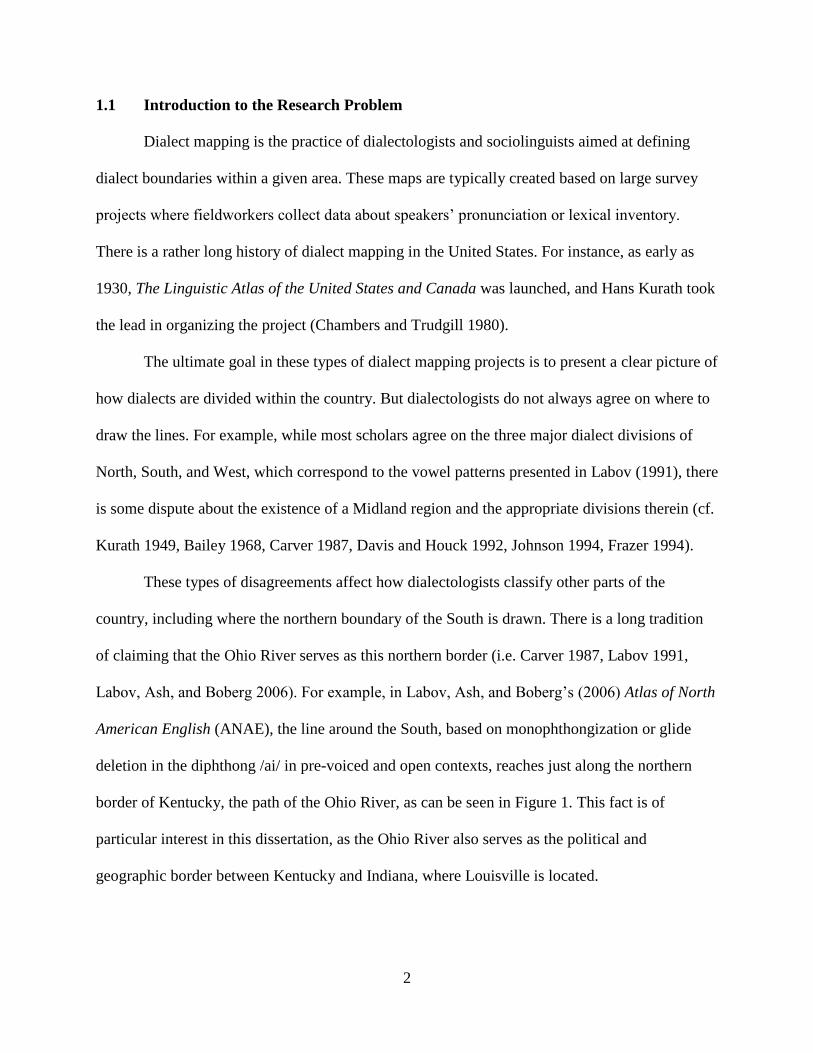
Labov, Ash, and Boberg 2006). For example, in Labov, Ash, and Boberg‟s (2006) Atlas of North
American English (ANAE), the line around the South, based on monophthongization or glide
deletion in the diphthong /ai/ in pre-voiced and open contexts, reaches just along the northern
border of Kentucky, the path of the Ohio River, as can be seen in Figure 1. This fact is of
particular interest in this dissertation, as the Ohio River also serves as the political and
geographic border between Kentucky and Indiana, where Louisville is located.
3
Figure 1 – Boundary of the South in ANAE (Labov, Ash, and Boberg 2006: Interactive maps), arrow added
What is most interesting about this map is that Louisville is represented as a cluster of
two points, one red and one yellow, at the intersection of the red and orange lines (i.e. at the
border between Southern and Midland dialects). The different colors for these two points
indicate that one speaker exhibited monophthongization while the other did not, thus making the
positioning of Louisville as a Southern city seem somewhat arbitrary. Further results on /ai/
monophthongization and its variation in Louisville (Cramer 2009) support the claim that the
situation on the isogloss border is more complicated than the ANAE suggests.
Furthermore, when the area around the Ohio River is classified as Midland instead,
scholars suggest that much of what is found here is not unique to the region, claiming that all
features are found in the North or South (Kurath and McDavid 1961), that it serves as a transition
zone (Davis and Houck 1992, Johnson 1994), and that “[t]he lack of regularity in the Ohio
Valley Midland is thus a simple reflection of the fact that the total Midland area is characterized
as much by being not Northern and not Southern as it is by a body of uniform and universally
4
used vocabulary” (Dakin 1971: 31). These notions together hint at a situation similar to that of
the bilingual, as described by Woolard (1999), where the processes of simultaneity and bivalency
become relevant for the production of identity. That is, a speaker in this region might be
expected to produce some sort of identity that is Southern and, at the same time, non-Southern.
This paints a picture of a rather complex locale for linguistic investigation. What is more,
the act of drawing lines around areas, or more precisely, groups of people, and giving them
names like “South” or “Midland” based on phonetic and lexical differences ignores the fact that
those lines necessarily imply group belonging and group distinction. At the collision point of two
isoglosses, then, we find border regions, areas portrayed as “zone[s] between stable places”
(Rosaldo 1988: 85; Appadurai 1988: 19), or third spaces (e.g. Bhabha 1994, Bhatt 2008), which
serve as dynamic sites for identity construction. In much of the previous dialectology research,
this question of identity has been left relatively unexplored.
In particular, little work has been done on identity construction at regional or dialect
borders. Most studies dealing with border identities draw on national borders, like, for example,
the U.S.-Mexico border (cf. Alvarez 1995, Pletsch de García 2006) or the Ireland-Northern
Ireland border (Zwickl 2002), and much of this research deals with aspects of identity not
necessarily connected to language. For instance, Flynn (1997) explores the negotiation of a
border identity on the Bénin-Nigeria border in the context of transborder trade. In fact, as
Alvarez (1995) notes, many early border studies dealt with immigration, folklore, and cultural
products in order to address aspects of identity conflict at the border. Only relatively recently, in
works like Bejarano (2006), have scholars recognized the extent to which language, identity, and
borderlands are related.
5
One study in England (Llamas 2007), however, does demonstrate that a regional border
can serve as a dynamic site for identity construction through linguistic practices. In
Middlesbrough, a city located on a regional and dialect border in Northern England, speakers not
only vary in their production of linguistic variables but also in their attitudes toward the varieties
spoken nearby, such that a generational shift is evident in the construction of particular regional
identities. Yet, despite the salience regional identity and dialect variation in the United States has
for many Americans, as evidenced by popular documentaries like American Tongues (Alvarez
and Kolker 1988) and Do You Speak American? (Cran 2005), little research has examined how
regional borders impact identity construction, especially through linguistic means.
To fill this gap in the literature, Louisville, Kentucky is presented as a case study for
examining how dialect and regional borders in the United States impact speakers‟ identity
production and perception. According to the dialect map produced by Labov, Ash, and Boberg
(2006), Louisville is one of the northernmost cities to be classified as part of the South. Its
location on the Ohio River, on the political and geographic border between Kentucky and
Indiana, places Louisville on the isogloss between Southern and Midland dialects. In addition to
these political, geographical, and linguistic facts which place Louisville at the border, certain
historical, cultural, and perceptual issues also point to Louisville‟s status as a border town. All of
these borders are considered in the examination of Louisvillians‟ identity positionings.
It is not enough, however, to point to external factors in creating an understanding of
Louisville as a border town. We have to discover whether people in Louisville recognize this
border nature. While this question is addressed in my dissertation, we can turn to some anecdotal
evidence that indicates the importance of this border in the imagination of many Louisvillians.
6
Louisville‟s position on a regional border seems to be clear to residents of the town. For
instance, when Cramer (2010) asked Louisville participants in a study on styles and stereotypes
in the South about the position of Kentucky in the regional geography of the United States, one
participant exclaimed, “Man! We are just right on the border!” Also, blogs, polls, and other
forums online present varying positions on the question of Louisville‟s regional affiliation; for
example, a poll at City-Data.com asked the question “Louisville, KY…southern or midwestern?”
with the majority of people selecting Midwestern (City-Data.com 2007), while
SkyscraperPage.com asked a similar question with the majority of responses pointing to
Southern (SkyscraperPage.com 2008). Even more telling than the number of responses is the
content of the forum posts, which further suggest the border experience of residents.
So, ultimately, the question remains as to how this border influences the production and
perception of identities. Using Louisville as an example, this study explores this topic further and
provides some insight into border effects on identity.
1.2 Research Questions
As noted above, Louisville has been portrayed as geographically, politically,
linguistically, historically, culturally, and perceptually located at a border. But when thinking
about ways of speaking, one needs to ask whether Louisvillians acknowledge this border, or
whether they feel certain about Louisville‟s place on the linguistic map of the United States. To
have a clearer picture of how Louisvillians experience their own regional identity, it is important
to recognize where Louisvillians see themselves as belonging. But we must examine more than
just the labels they employ in discussing regional varieties of English. To know if Louisvillians
see their categorizations of Louisville as appropriate, we must also understand speakers‟
7
ideologies about the different categories they depict. The first research question and subsequent
specific questions explore this matter:
1. How do Louisvillians understand and label regional varieties of English spoken in the
United States?
a. Where do they place Louisville in terms of its regional linguistic identity?
b. Do they represent the same border nature of Louisville in their distinctions that
has been previously represented in traditional dialectology?
c. What ideologies about regional varieties of English are currently circulating in the
community in question? What ideologies do Louisvillians have about the
particular variety spoken in Louisville? What are the linguistic ideologies that
they use to rationalize their various identity positionings?
Once the on-the-ground categories have been established, we can then examine how
these categories are realized linguistically in the production of certain linguistic variables
associated with different regional varieties of English. That is, we can examine how well the
categorizations made by non-linguists match up to those made by dialectologists. Specifically,
since dialect maps often position Louisville as part of the Southern dialect region, we must
examine production data for elements of Southern speech, like the Southern Vowel Shift (cf.
Fridland 1998; Fridland 2001; Labov, Ash, and Boberg 2006). Since this dissertation is
concerned also with the production of regional identity, it is also important to examine the ways
in which regional identity is mobilized through speakers‟ selection of particular variables. The
following questions will guide the investigation of these issues:
2. Looking at linguistic features taken from traditional dialectology, do speakers from
Louisville use Southern or non-Southern linguistic features?
8
a. How does the use of particular variants influence a speaker‟s identity alignments?
That is, in which contexts do speakers use which particular variants?
b. Do the patterns of production of such features match up with the labels given to
varieties of English by Louisvillians? Do the patterns of production of such
features match up with traditional dialect boundaries established by
dialectologists?
The production data alone, however, will not provide a complete picture of regional
identity in Louisville. Since identities are not only produced but also interpreted in specific ways,
it is also important to know how Louisvillians perceive the regional identities expressed by other
Louisvillians. Answers to the following questions will lead us to a better understanding of
regional identity in Louisville:
3. How do Louisvillians perceive the identities of other speakers from Louisville?
a. Can Louisvillians correctly identify a speaker as being from Louisville? If not, in
which region(s) do they place other Louisvillians?
b. How does this perception compare to their perception of speakers from nearby
locales, like Indianapolis or Nashville, that tend to fall stereotypically into non-
Southern and Southern dialect regions, respectively?
Gaining answers to these questions will not only help us to better understand the specific
linguistic situation in Louisville; the answers will provide some insight into the dynamic nature
of linguistic (and other) borders, pointing specifically to the ways in which identity work is
interactionally located and ideologically produced in the space between relatively stable dialect
areas. That is,
9
[w]ithin a language ideology framework, speakers‟ own comments about language and
other social phenomena are used as a means of interpreting and understanding linguistic
variation in the community, thus allowing insight into social psychological motivations
for sociolinguistic differences that may be otherwise inaccessible to the analyst. (Llamas
2007: 581)
1.3 Methodology
Several different methodologies, which utilize varying kinds of data, are employed in this
research project. While this serves as a summary of the data and methodologies included in this
project, further information can be found in Chapter 4.
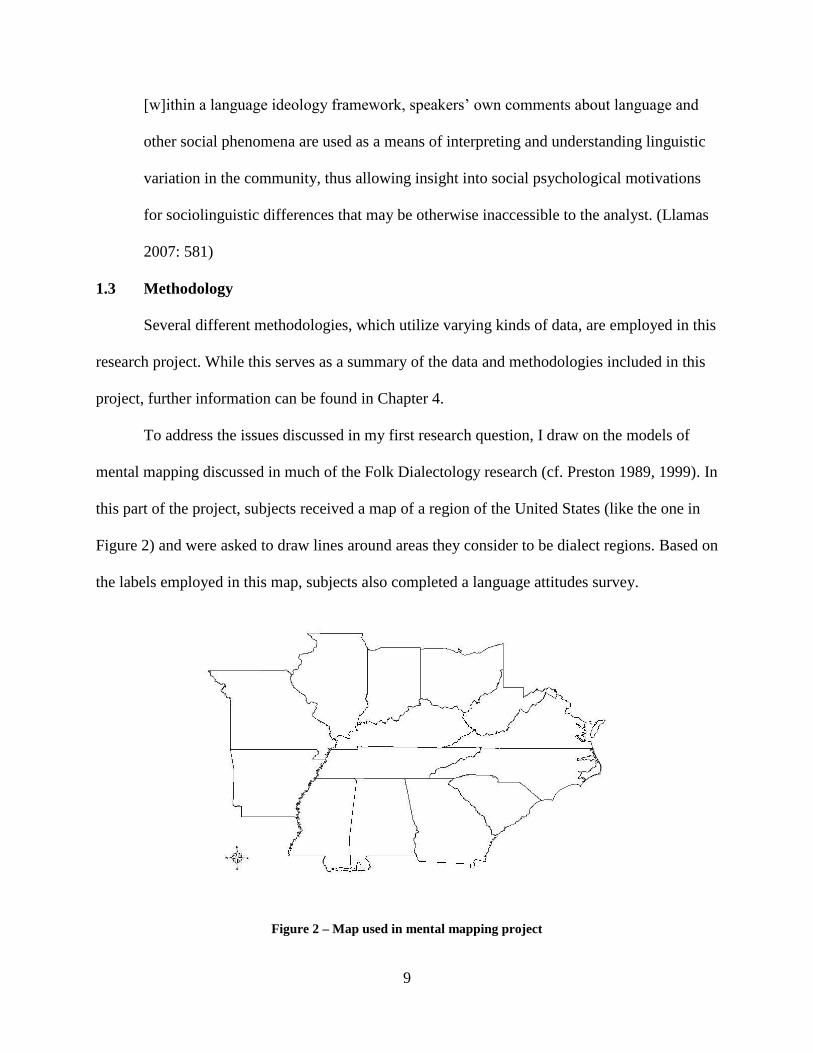
To address the issues discussed in my first research question, I draw on the models of
mental mapping discussed in much of the Folk Dialectology research (cf. Preston 1989, 1999). In
this part of the project, subjects received a map of a region of the United States (like the one in
Figure 2) and were asked to draw lines around areas they consider to be dialect regions. Based on
the labels employed in this map, subjects also completed a language attitudes survey.
Figure 2 – Map used in mental mapping project
10
The production data, which also serve as the stimuli for the perception experiments, come
from an original SOAPnet reality television show, Southern Belles: Louisville (Livecchi and
Bull 2009). The show, described as a “docusoap” or “docudrama”, follows the lives of five
Louisville women in their 20s and 30s, detailing their experiences as friends, as professionals,
and as bachelorettes. The data consists of more than seven hours of broadly transcribed video.
For the analysis of the production of identity, I examined this data for specific phonetic features
typically associated with Southern dialect areas. Specifically, I examined the data for features of
the Southern Vowel Shift (cf. Fridland 1998; Fridland 2001; Labov, Ash, and Boberg 2006),
claiming that the presence of particular features serve as indexes of certain identities. I present an
acoustic analysis of the speech of each of the five women, discussing in detail how each
subject‟s vowel space differs depending upon the context of the interaction.
As noted above, the same data serves as the stimuli for the perception experiments. In the
first experiment, subjects listened to a short segment of speech from the show1 and were asked to
pinpoint on a map where they believed the speaker to be from. Subjects were asked to provide a
point of origin for all five women from the show. Based on the results of this first part of the
experiment, the speaker who was most frequently identified as being from or from near the
Louisville area was used as the production sample in a second perceptual experiment. Subjects in
this experiment were divided into three focus groups. Each group heard the same segment of
speech, but each group was given slightly differing social information (Niedzielski 1999). While
one group knew that the speaker was from Louisville, the two other groups were told that the
speaker was from a distinctly Southern city (Nashville) or a distinctly Midwestern city
(Indianapolis). Focus group interviews centered on group reactions to and ideologies about the
1 Video was not included, as the show features many scenic shots of the Louisville area, and it is unclear how
popular the show is or how well-known the women are in Louisville.
11
speaker, and discourse analytic methods were used to analyze the data collected during this
experiment.
2 Summary of Results
Overall, the dissertation reveals that people in Louisville do not have a uniform way of
classifying their city in terms of regional identity. This lack of uniformity suggests that
Louisvillians see themselves as located at a border, or at the intersection of at least two cultures
in the linguistic landscape of the United States. The identity alignments in these borderlands are
neither simple nor straightforward; instead, they can best be described as fluid, dynamic, and
complex. Within interactions, we see Louisvillians constantly contesting and negotiating the
identities attributed to them. They seem to shift in and out of regional identities with ease,
producing both Southernness and non-Southernness in their linguistic production and perception
of identities.
This dissertation makes certain empirical, theoretical, and methodological contributions
to the field. In terms of empirical contributions, this research project adds significantly to the
discussion of regional identity in the United States, bringing to light some of the problems
associated with static understandings of regionality. Additionally, Louisville in particular, and
Kentucky as a whole, has been given very little attention in linguistic research. The main
theoretical importance of this dissertation for the field of sociolinguistics is that it shows how
identities in the borderlands are fluid and dynamic, and it indicates how these identities are both
produced and perceived by Louisvillians. Methodologically, I have incorporated new ways of
analyzing the different types of data I have collected, in order to make them more quantitatively
sophisticated yet still qualitatively interesting.
12
3 Organization of Dissertation
The remainder of the dissertation is organized as follows:
Chapter 2 – Review of the Literature
In this chapter, I present the relevant literature on dialect maps and features, language and
identity, border studies and identity, language ideologies, and folk linguistics, focusing on the
theoretical and methodological frameworks to be used in the research. I address areas that have
been left relatively understudied and indicate how this dissertation serves to fill certain gaps in
these areas of study.
Chapter 3 – About Louisville
This chapter serves to demonstrate that Louisville is, in fact, located in a border region by
presenting a discussion of the specific geo-political, socio-historical, linguistic, perceptual, and
cultural situation present in the city. This information indicates that the investigation of linguistic
practices and language attitudes at such a border can provide interesting insights into general
identity construction and the more specific effects of borders on these identity positionings.
Chapter 4 – Research Design
In Chapter 4, I present the research design for this project. I discuss each of the individual
research projects, particularly as they pertain to the research questions identified above. I also
provide a detailed description of the subjects recruited, the types of data used in this study, the
data collection methods, and the analysis procedures.
Chapter 5 – Perceptual Dialectology in Louisville
In this first data analysis chapter, I explore the ways in which Louisvillians understand
the linguistic landscape of the United States. Following the work of Dennis Preston (cf. 1989,
1999), this study examines the folk perceptions about dialectal variation among participants in
13
Louisville, examining not only the mental maps they draw, but also the labels they employ for
the varying dialects of English they distinguish and their attitudes towards those varieties. The
findings of this study show that Louisvillians categorize their city in a few ways: 1) the city is
given no regional designation; 2) the city is considered its own separate variety; or 3) the city is
positioned as being located at a border.
Chapter 6 – The Southern Vowel Shift and the Production of Identity
Chapter 6 is an analysis of the vowel systems of the five Louisville women from the
SOAPnet reality television show Southern Belles: Louisville (Livecchi and Bull 2009). The
analysis examines how regional identity is realized in the production of certain linguistic
variables. Specifically, since dialect maps often position Louisville as part of the Southern
dialect region, I explore the level of participation among these speakers in certain aspects
associated with Southern speech. The results show that the use or non-use of Southern variants is
rather chaotic and the choice in variant is not straightforwardly linked to expressions of
Southernness in context.
Chapter 7 – Perceiving Louisville
This chapter reveals, through the examination of perceptual data, that regional identity
affiliations at the border are fluid, complex, and dynamic. The first perceptual experiment seeks
to show whether Louisvillians can accurately identify a speaker as being from Louisville, based
on sound alone. The second experiment involves focus group reactions to a segment of speech
from the speaker selected in the first perceptual experiment as the one from nearest to Louisville.
Three focus groups were recruited, and each group was given varying information as to her point
of origin: one group knew she was from Louisville, one group was told she was from
Indianapolis, and another group was told she was from Nashville. Even with these varying
14
understandings of the speaker, I show that Louisvillians have mixed feelings about the regional
position of Louisville.
Chapter 8 – Conclusions
The final chapter of the dissertation serves as the conclusion to the research project. Here,
I summarize the general results, describe the contributions made by the dissertation research,
discuss any problems encountered during the research project, and examine possible areas for
further research.
15
CHAPTER 2: REVIEW OF THE LITERATURE
1 Overview
A great deal of scholarly research has addressed the issue of dialect mapping in the
United States. These studies, usually based on phonetic or lexical items, aim to present an overall
picture of the dialect landscape. But what is often missing in these types of projects is an
attention to the borders of a dialect region, and on what kinds of identity alignments can be found
in such areas. This lack of attention to regional and dialect border identities is surprising, given
the salience of such borders for many Americans. This salience is also ignored among
dialectologists, as nonlinguists‟ perceptions and attitudes have been generally assumed to be
secondary to the analysis of “real” data, such as the phonetic and lexical variables used in
traditional dialectology.
The focus of this dissertation, then, is on the ways in which speakers in the borderlands
produce and reproduce varying indexes of identity. Specifically, with Louisville considered as a
case study, I examine how dialect and regional borders in the United States impact speakers‟
linguistic acts of identity, especially the production and perception of such identities. The goal is
to show that identity alignments in borderlands are neither simple nor straightforward. Identity at
the border is fluid, complex, and dynamic; speakers constantly negotiate and contest their
identities. The data in this dissertation indicate that Louisvillians shift between Southern and
non-Southern identities, in the active and agentive expression of their amplified awareness of
belonging brought about by their position on the border.
2 Previous Research
In this section, I present the literature that informs this research, including a brief history
of dialect mapping in the United States, examining the defining features of the South and the
16
problems associated with dialect classification; an examination of the intersection of language
and identity, particularly as it relates to dialect; some studies dealing with identity at the border,
to frame our understanding of borderlands; and an understanding of how language ideologies
come into consideration in studies of identity.
2.1 Dialect Maps and Features
As noted in Chapter 1, dialectology has a long history in the United States, beginning as
early as the 1930s with Hans Kurath and The Linguistic Atlas of the United States and Canada.
This project was divided into several regional surveys spanning several decades, including The
Linguistic Atlas of New England (Kurath et al. 1939-1943), Kurath‟s (1949) Word Geography of
the Eastern United States, Atwood‟s (1953) A Survey of Verb Forms in the Eastern United
States, and, perhaps most famously, Kurath and McDavid‟s (1961) The Pronunciation of English
in the Atlantic States. Later works in the same tradition include The Linguistic Atlas of the Upper
Midwest (Allen 1973-1976), The Linguistic Atlas of the Gulf States (Pederson, McDaniel, and
Adams 1986-1992), and The Linguistic Atlas of the Middle and South Atlantic States (McDavid
and O‟Cain 1980).
These types of studies have largely been based on lexical inventories. Another project
focusing on regional vocabulary is the Dictionary of American Regional English (Cassidy and
Hall 1985-present), which began in the 1960s. This project includes data from all 50 states and
has produced several print volumes and an electronic version. Carver (1987) used this data to
produce a map of American regional varieties of English.
More recently, Labov, Ash, and Boberg published The Atlas of North American English
(ANAE), a rather large-scale project providing “the first comprehensive view of the
pronunciation and phonology of English across the American continent” (2006: 2). Instead of
17
examining lexical inventories, the authors focused on phonetic variables because, as they
contend, it is really the vowel patterns that distinguish regional dialects of English in the United
States. Interviews primarily consisting of spontaneous speech and minimal pair word lists were
conducted via the Telsur project, a telephone survey carried out during the 1990s, which focused
on area natives and their speech patterns. The project focused on the speech of individuals in
urban settings, however, only one or two speakers were considered in each location. The authors
noted that the atlas thus cannot be considered an accurate description of the internal variation
within a community and claimed that they hope their work would “stimulate local studies to
provide a more detailed view of the sociolinguistic and geographic variation in a given area”
(2006: 2).
This call actually serves as one of the driving forces of this research project. If we
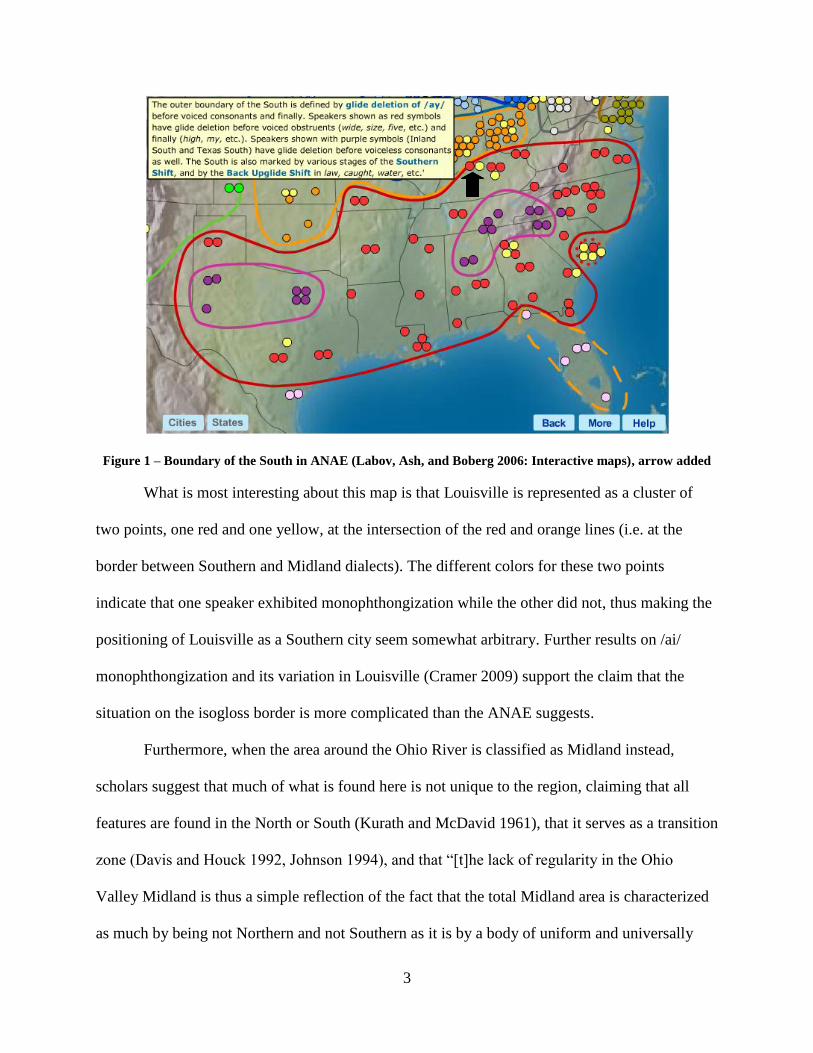
examine the map from the ANAE presented in Chapter 1, and reproduced here below as Figure
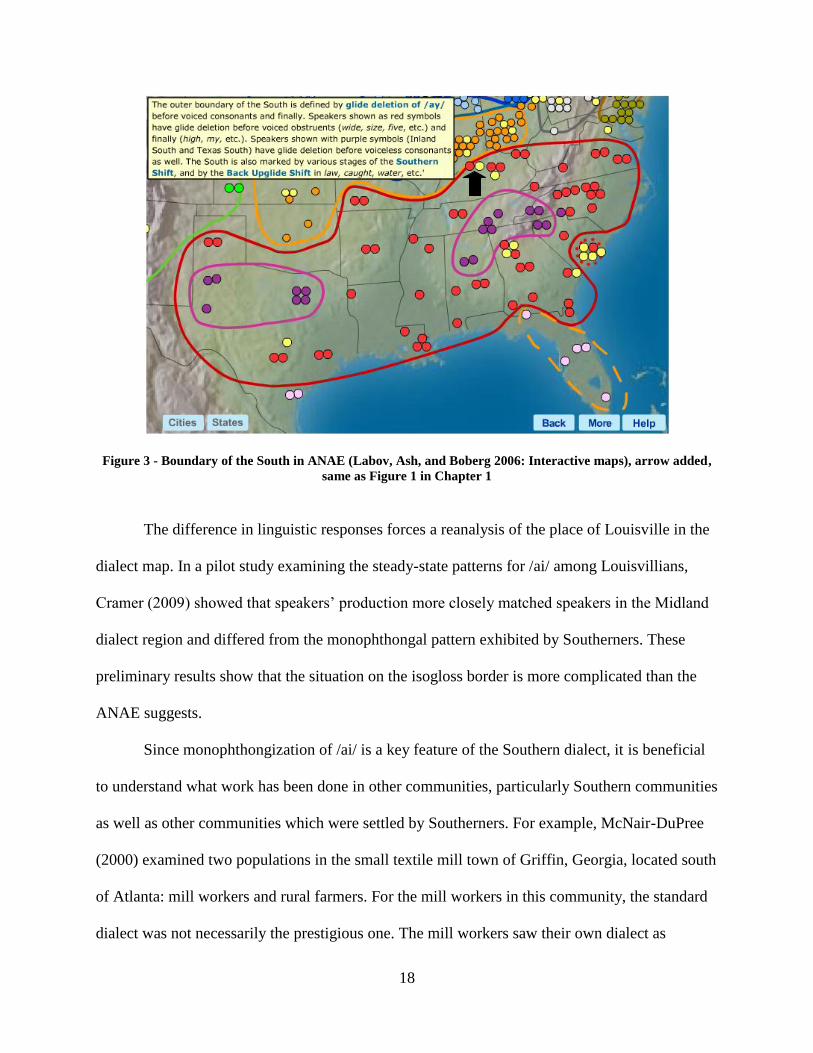
3, we see that monophthongization of /ai/ (in open and pre-voiced obstruent contexts) serves as
the defining feature of the South. Louisville is represented as a cluster of two points, one red and
one yellow, at the intersection of the red and orange border near the top of the map, categorizing
Louisville as a Southern city. But the different colors for these two points indicate that one
speaker exhibited monophthongization while the other did not. Thus, the positioning of
Louisville as Southern seems somewhat arbitrary.
18
Figure 3 - Boundary of the South in ANAE (Labov, Ash, and Boberg 2006: Interactive maps), arrow added,
same as Figure 1 in Chapter 1
The difference in linguistic responses forces a reanalysis of the place of Louisville in the
dialect map. In a pilot study examining the steady-state patterns for /ai/ among Louisvillians,
Cramer (2009) showed that speakers‟ production more closely matched speakers in the Midland
dialect region and differed from the monophthongal pattern exhibited by Southerners. These
preliminary results show that the situation on the isogloss border is more complicated than the
ANAE suggests.
Since monophthongization of /ai/ is a key feature of the Southern dialect, it is beneficial
to understand what work has been done in other communities, particularly Southern communities
as well as other communities which were settled by Southerners. For example, McNair-DuPree
(2000) examined two populations in the small textile mill town of Griffin, Georgia, located south
of Atlanta: mill workers and rural farmers. For the mill workers in this community, the standard
dialect was not necessarily the prestigious one. The mill workers saw their own dialect as
19
something to be proud of and something to mark them as Southern. However, since many of the
farmers were forced to give up farming, they saw the mill workers as a threat to their personal
independence, choosing to distance themselves from the changes occurring in the Griffin dialect.
McNair-DuPree found that /ai/ reduction is variable before voiced and voiceless
consonants (as in /ra:d/ „ride‟ and /ra:t/ „right‟). While most speakers in Griffin tended to lose the
second element of the diphthong across the board, some variation existed when age and gender
were considered. Older mill men and women exhibited monophthongization more frequently
than their rural farmer counterparts in both voiced and voiceless environments. Middle-aged mill
men had stable variation within the voiced and voiceless environments while the same age group
of rural men showed a high rate of monophthongization before voiced consonants and a much
lower rate in voiceless contexts. McNair-DuPree concluded that the speech of older participants
indicates that “an occupational distinction once existed in Griffin in the categories of mill versus
rural affiliation” (2000: 249), but that the middle-aged group seemed to show less distinction
between the two groups. This can be attributed to the fact that /ai/ reduction provides the desired
Southern identity marker for the people of Griffin.
Bailey and Bernstein (1989) took on a rather large project in completing a phonological
survey of Texas. They examined phonological variation and change in four Texas towns:
Houston, Bryan, Atmore, and Springville. Their results indicated that the younger generation and
women were more likely to use the monophthongal form than older people and men. Also,
whether people lived in urban or rural areas affected their choice, with rural respondents leading
urban ones in production of the monophthong.
Anderson (2002) went north to Detroit to explore monophthongization among African-
Americans in the city. She claimed that pre-voiced consonantal [a:], as well as the reduced glide
20
variants [aæ] and [a
ε], were common markers of Southern speech that appear in the speech of
African-Americans in Detroit. She operated under the assumption that whites and blacks in the
South use the monophthong in all environments except before voiceless consonants. She noted
that some whites in Appalachia and Texas were beginning to reduce the diphthong even in the
voiceless context, but indicated that this was not a common phenomenon. She claimed that
Detroit African-Americans reduced diphthongs in this pre-voiceless consonant environment,
despite the fact that it is not common among speakers of Standard African-American English.
In Detroit, racial segregation, as a result of “white flight,” exists between the city and the
suburbs to a rather large extent. This residential segregation appears to play a role in speech
differences, as African-Americans who live in the city relate more to the whites of Appalachian
ancestry who remained in the inner city than to the suburban whites.
In Anderson‟s study, two interviewers collected data from 27 speakers ranging in age
from 20 to 81. Most black participants classified themselves as Southern. Older speakers tended
to use the standard dialect, without pre-voiceless consonant monophthongization. Younger
speakers, however, tended to use the monophthong in the voiceless context. Anderson concluded
that this was a sort of dialect leveling, which indexes a desire among this community to distance
itself from the Northern whites and align with its Southern heritage.
It is clear that monophthongization of /ai/ has been a relatively important change in
Southern speech. Ultimately, it serves as “the most likely candidate for a structural delimitation
of the outer limits of the Southern dialect region” (Labov, Ash, and Boberg 2006: 127).2 It has
also been claimed (e.g. Feagin 1986, Fridland 1998, 2000, Labov, Ash, and Boberg 2006) that
2 Labov, Ash, and Boberg provide one caveat about using /ai/ monophthongization as the delimiting factor of the
South: “A considerable amount of glide deletion is found just north of the red isogloss, in Midland cities close to the
South. However, in these communities /ay/ glides are deleted only before resonants (nasals and liquids), in time,
nine, tire, mile, etc.” (125, 127). See Frazer (1978), among others, for further discussion of Southern features in
Midland areas.
21
this phenomenon is the pivotal change in the Southern vowel system that leads to a series of
further movements called the Southern Vowel Shift. The Southern Vowel Shift, or Southern
Shift, is a phenomenon involving a “possibly interrelated series of rotations in vowel space
currently underway in the dialects of southern speakers in the United States” (Fridland
2000:267).
Labov (1991), Feagin (1986), and Fridland (1998) have used the term to refer to two
different shifts in the vowel system of Southerners. The first shift, sometimes referred to as the
Back Shift, refers to the back vowels becoming more like front vowels. Feagin focused on the
fronting of /u/ and /oʊ/.3 These vowels begin to move toward the front, resembling rounded front
vowels (like /y/). The fronting of /u/ appears to be more advanced than that of /oʊ/, and the
movement of the latter vowel has been said to occur by analogy to the movement of /u/ (Labov
1994, Fridland 2000). More recent work (e.g. Labov, Ash, and Boberg 2006), however, has
suggested that the Back Shift is found also in the Midland dialect region and is therefore not
specific to the Southern region.
The other shift, sometimes referred to as the Front Shift, refers to the front tense and lax
vowels switching places in the vowel space. This involves the inversion of /i/ and /ɪ/ and /ei/ and
/ɛ/. The movement of /ei/, which likely occurs because /ai/ moves out of its low, back position,
happened early in the Front Shift. Its nucleus falls along the non-peripheral track and becomes a
mid-low lax front vowel (like /ɛ/). This causes /ɛ/ to raise and become diphthongized and
peripheralized, approaching the former position of /ei/. Like /ei/, /i/ shifts from tense to lax, also
falling along the non-peripheral track, becoming like /ɪ/. This movement causes /ɪ/ to also raise
3 Fronting of /oʊ/ has also been noted in Midland dialects (Labov, Ash, and Boberg 2006).
22
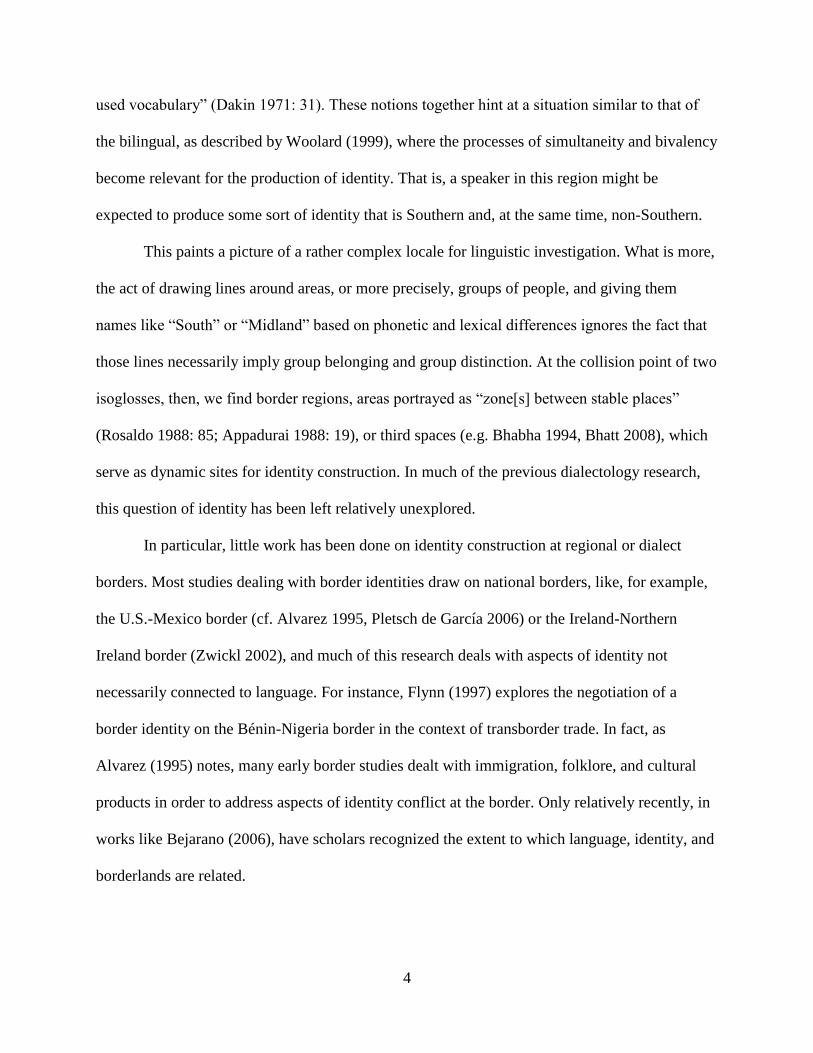
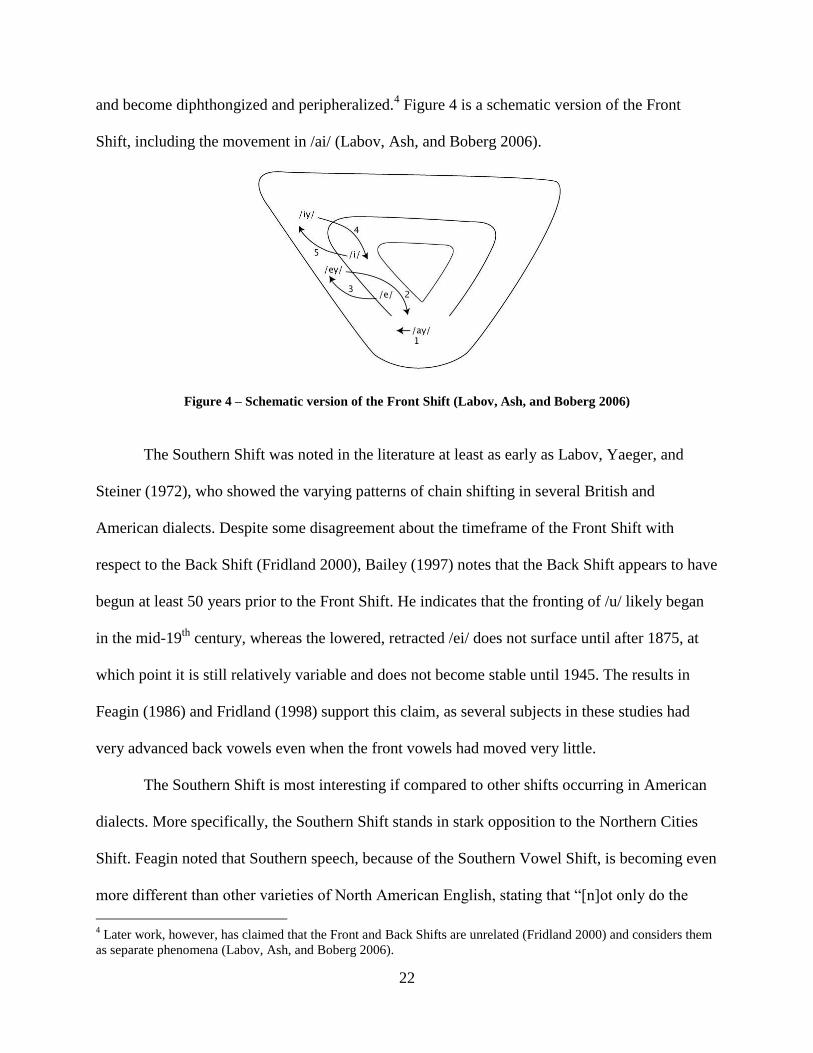
and become diphthongized and peripheralized.4 Figure 4 is a schematic version of the Front
Shift, including the movement in /ai/ (Labov, Ash, and Boberg 2006).
Figure 4 – Schematic version of the Front Shift (Labov, Ash, and Boberg 2006)
The Southern Shift was noted in the literature at least as early as Labov, Yaeger, and
Steiner (1972), who showed the varying patterns of chain shifting in several British and
American dialects. Despite some disagreement about the timeframe of the Front Shift with
respect to the Back Shift (Fridland 2000), Bailey (1997) notes that the Back Shift appears to have
begun at least 50 years prior to the Front Shift. He indicates that the fronting of /u/ likely began
in the mid-19th
century, whereas the lowered, retracted /ei/ does not surface until after 1875, at
which point it is still relatively variable and does not become stable until 1945. The results in
Feagin (1986) and Fridland (1998) support this claim, as several subjects in these studies had
very advanced back vowels even when the front vowels had moved very little.
The Southern Shift is most interesting if compared to other shifts occurring in American
dialects. More specifically, the Southern Shift stands in stark opposition to the Northern Cities
Shift. Feagin noted that Southern speech, because of the Southern Vowel Shift, is becoming even
more different than other varieties of North American English, stating that “[n]ot only do the
4 Later work, however, has claimed that the Front and Back Shifts are unrelated (Fridland 2000) and considers them
as separate phenomena (Labov, Ash, and Boberg 2006).
23
vowels have quite different values from those of other North American varieties of English, but
the historical movements or direction of change of Southern vowels is taking those sounds in a
different direction from the vowels of Northern varieties” (1986: 83).
Labov, Ash, and Boberg note, “The Southern Shift…was identified by studies in
Knoxville, the Outer Banks, Birmingham, Atlanta, and central Texas, but there was no clear
indication of how far it extended and where – if anywhere – it confronted the Northern Cities
Shift” (2006: 5). As we will see below, further studies have been undertaken in areas like
Alabama, Tennessee, and Kentucky, to see the extent to which the Southern Vowel Shift has
spread across the South. The Inland South (mostly Appalachia and southern Georgia) and a large
part of Texas represent the locations where the Southern Vowel Shift is most complete (Labov,
Ash, and Boberg 2006).
Setting out to confirm what Labov, Yaeger, and Steiner (1972) claimed about the
Southern Shift, Feagin (1986) analyzed the speech of white community members in Anniston,
Alabama, a rather small, rural area. Her goal was to not only confirm the presence of the
Southern Vowel Shift in her data but also to discover which changes happened first, to determine
if the change was urban or rural in origin, to show which gender, age group, and classes were
leading the changes, and to explain the linguistic features behind the change.
Her results show that, in fact, speakers in the Anniston community are participating in the
Southern Shift. The Back Shift appeared to be an older, more fully established change, as it was
found across all ages and social categories, while the Front Shift seemed to be a relatively new,
yet rapidly moving change. Like Labov before her, Feagin claimed that the shift was rural in
origin, moving to cities through massive out migration and decreasing agricultural needs. This
24
stands in opposition to the Northern Cities Shift, which is thought to have originated in urban
areas. Her results indicated that the women were slightly ahead of men in the shift.
She also noted that the shift was not confined to the working class, as had been suggested
in previous work. Working class and upper class speakers participate in the shift to some degree,
indicating a shared phonology. As Fridland points out, the results for the upper class speakers in
Feagin‟s study suggest “that the changes occurring in Southern speech are perhaps being adopted
as incoming norms from below and have not yet reached the level of conscious awareness which
might cause them to be suppressed” (1998: 62).
Finally, in discussing how the change occurred internally, Feagin suggests that of the two
possible mechanisms, a pull chain, where “…the „drawled‟ short front vowels are pulled
upwards displacing the traditionally long front vowels” (Feagin 1986: 92), or a push chain,
where the movement of the back vowels causes the movement in the front vowels, either
mechanism could have produced the changes.
Yet, as Fridland notes, “the extent to which large urban centers are affected is at this
point relatively unknown” (2000: 267). So, Fridland set out to discover the levels of participation
in the Southern Shift among white speakers in Memphis, Tennessee. Her dissertation (1998) and
later work (e.g. 2000, 2001) dealt with data from 25 native Memphians of different ages,
socioeconomic classes, and genders. The goal of this research was to see which vowels were
affected by the Southern Shift in Memphis, to determine what initiate the changes, and to
establish the different stages of the shift, also looking at the social categories that affect usage.
Using Peterson and Barney‟s (1952) description of an unshifted system as the point of
comparison for her data, Fridland showed that the vowel systems for native Memphians were in
the process of shifting. She found that the Front Shift appears to be slowing in younger
25
generations, suggesting the shift will not come to completion. The Front Shift was led by males
and by lower middle and upper working class speakers. Fridland indicated that the Back Shift
could still move to completion, as /u/ appears to be fronted in all speakers‟ systems, suggesting
that it is the older, established shift which may be stable. Women lead the Back Shift, as do
younger middle middle class speakers and older males.
Irons (2007) addressed the Southern Vowel Shift in Appalachia, examining three
generations of speakers in the rural Cumberland Plateau in southeast Kentucky. His results
indicate, contrary to Fridland‟s results, that the Front Shift is not receding in rural areas as it is in
urban areas. Instead, for his speakers, the shift is becoming solidified and even expanded. This is
seen most clearly in the fact that among his speakers, the shifting positions of /i/ and /ɪ/, the least
common shift in the data of previous studies, is most advanced in his youngest speakers. To
account for the rural/urban divide, Irons stated:
…given that the Southern Shift is receding in apparent time in urban areas, these results
strongly support the notion that the Southern Shift began as a rural innovation, which
most likely spread to urban areas from rural areas in a pattern of counterhierarchical
diffusion. This diffusion most likely occurred as a function of rural out-migration to
urban centers and successively receded in urban areas, as younger urban speakers
rejected a rural identity in favor of an urban identity. (2007: 131)
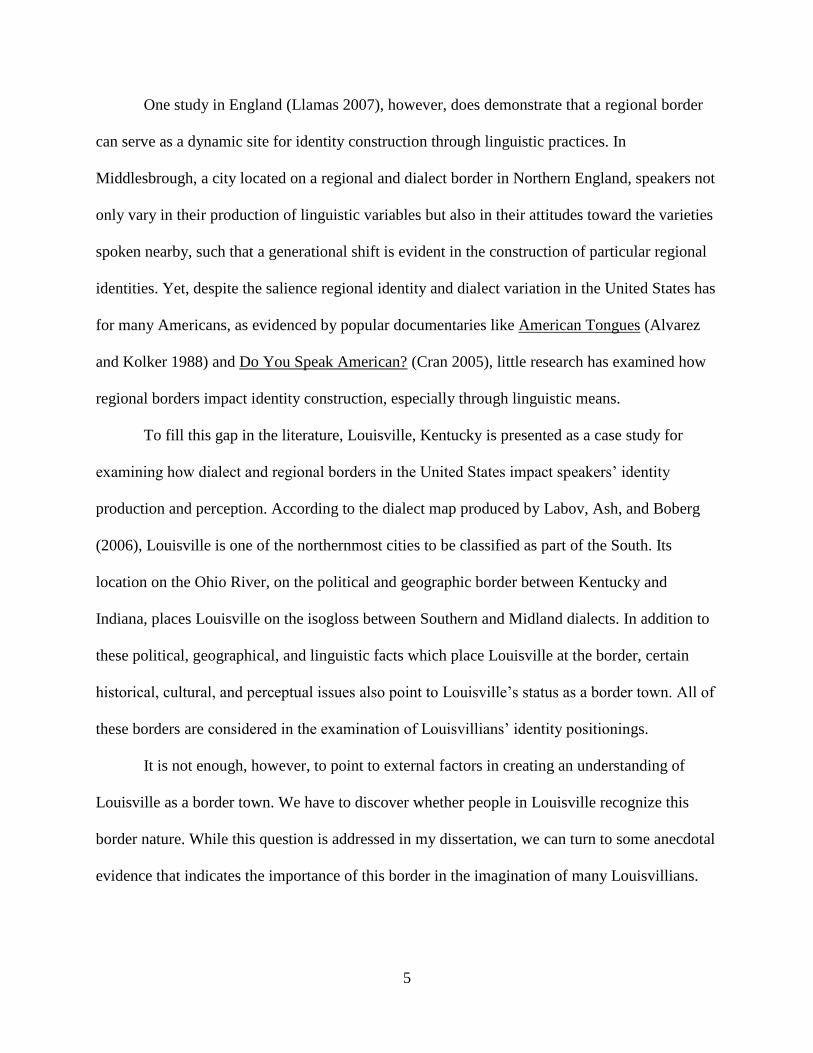
Finally, turning to what we know about the status of the Southern Vowel Shift in
Louisville, we can examine how the city is categorized in Labov, Ash, and Boberg‟s (2006) Atlas
of North American English. They define the Southern Vowel Shift in terms of three stages: Stage
1 – Monophthongization of /ai/, Stage 2 – centralization and lowering of /ei/, which is
accompanied by fronting and raising of /ɛ/, and Stage 3 – centralization and lowering of /i/,
26
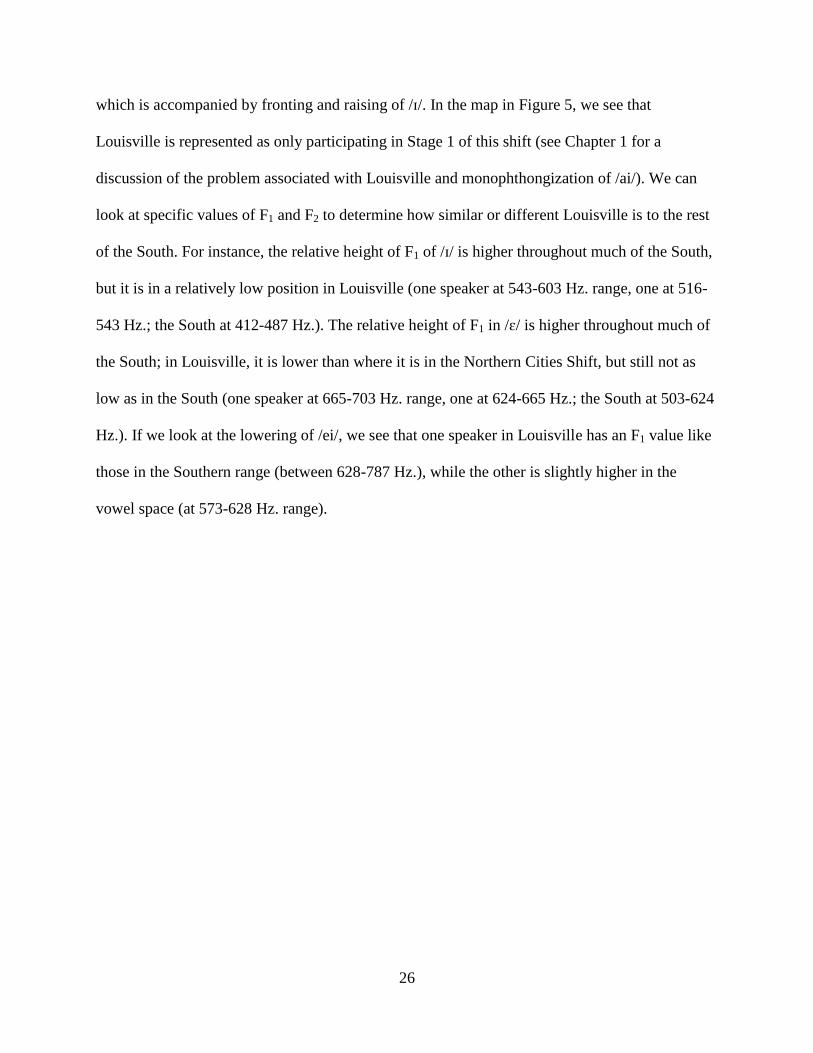
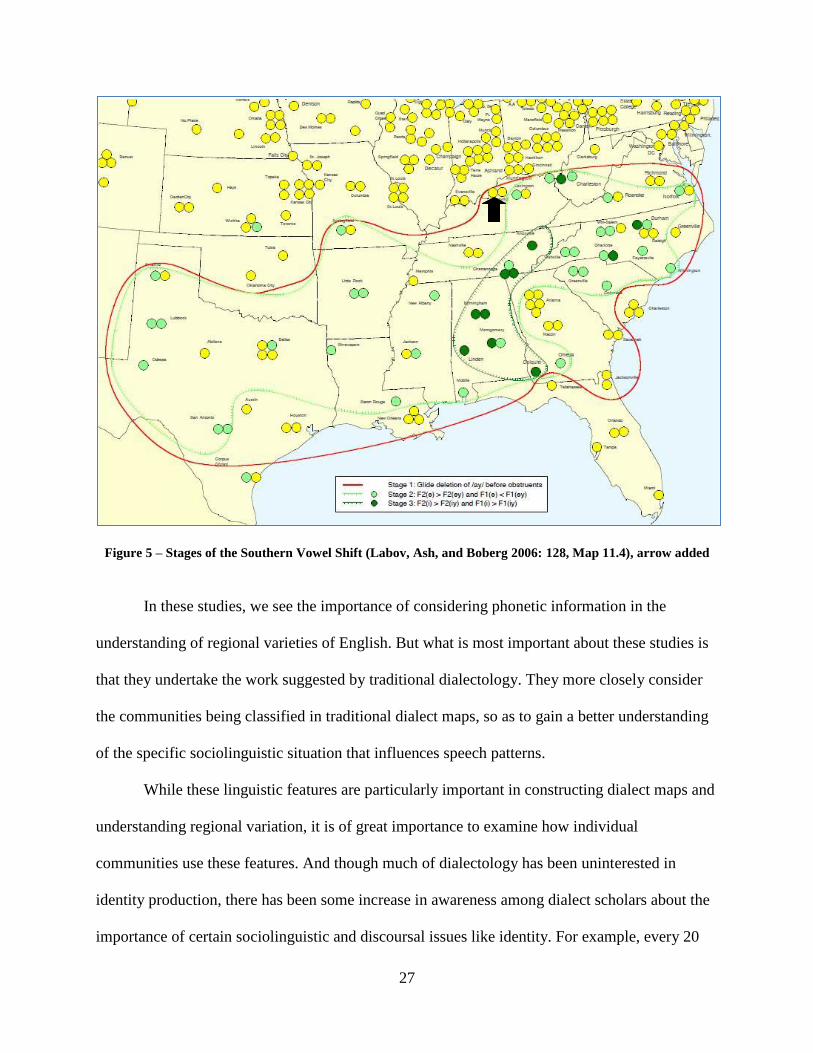
which is accompanied by fronting and raising of /ɪ/. In the map in Figure 5, we see that
Louisville is represented as only participating in Stage 1 of this shift (see Chapter 1 for a
discussion of the problem associated with Louisville and monophthongization of /ai/). We can
look at specific values of F1 and F2 to determine how similar or different Louisville is to the rest
of the South. For instance, the relative height of F1 of /ɪ/ is higher throughout much of the South,
but it is in a relatively low position in Louisville (one speaker at 543-603 Hz. range, one at 516-
543 Hz.; the South at 412-487 Hz.). The relative height of F1 in /ɛ/ is higher throughout much of
the South; in Louisville, it is lower than where it is in the Northern Cities Shift, but still not as
low as in the South (one speaker at 665-703 Hz. range, one at 624-665 Hz.; the South at 503-624
Hz.). If we look at the lowering of /ei/, we see that one speaker in Louisville has an F1 value like
those in the Southern range (between 628-787 Hz.), while the other is slightly higher in the
vowel space (at 573-628 Hz. range).
27
Figure 5 – Stages of the Southern Vowel Shift (Labov, Ash, and Boberg 2006: 128, Map 11.4), arrow added
In these studies, we see the importance of considering phonetic information in the
understanding of regional varieties of English. But what is most important about these studies is
that they undertake the work suggested by traditional dialectology. They more closely consider
the communities being classified in traditional dialect maps, so as to gain a better understanding
of the specific sociolinguistic situation that influences speech patterns.
While these linguistic features are particularly important in constructing dialect maps and
understanding regional variation, it is of great importance to examine how individual
communities use these features. And though much of dialectology has been uninterested in
identity production, there has been some increase in awareness among dialect scholars about the
importance of certain sociolinguistic and discoursal issues like identity. For example, every 20
28
years, the American Dialect Society (ADS) produces a volume on needed research in American
dialect studies. In 2003, this publication added aspects of sociolinguistic and discourse analysis
which had previously been missing in the ADS publication (Preston 2003). Thus, the inclusion of
articles by Johnstone (2003) and Eckert (2003) suggests a need to turn to identity (particularly as
it concerns border regions) to gain a better understanding of regional variation, placing emphasis
on the importance of ethnography. As Eckert explains, “Survey studies can give us a general
map of the linguistic landscape, but they cannot provide us with the meanings that inhabit that
landscape or the linguistic practices that constitute it. At the same time, ethnographic studies
cannot transcend the local unless they have a broader structure to orient to” (2003: 116).
2.2 Language and Identity
As this dissertation concerns the construction of regional identity, it would be prudent to
begin with a description of what is meant by the concept of “identity”, specifically as it pertains
to linguistic research. Linguistic studies of identity tend to focus on specific socially constructed
categories like gender or nationality. The main assumption in the study of identity, particularly in
linguistic anthropology, is that it is ultimately socially constructed (Bucholtz and Hall 2004). A
structural perspective, one that assumes the static nature of identities, has been shown to be
untenable (cf. Holmes 1997, Bucholtz 1999), and the current perspective assumes that identities
are dynamic and emerge within the context of an interaction “through the combined effects of
structure and agency” (Bucholtz 1999: 209).
Many definitions of the concept have been provided in the literature. One such definition
is presented in Turner (1999), who has suggested that a social identity is “a person‟s definition of
self in terms of some social group membership with the associated value connotations and
emotional significance” (1999: 8). Thus, for Turner, the key fact in identity construction is
29
association with other like-minded individuals, thus suggesting identities are fixed, not
malleable.
Bucholtz and Hall (2005), however, explain that “[i]dentity is the social positioning of
the self and other” (2005: 586). Thus, identity is not only about an individual and how he or she
is similar to some group; it also includes the ways in which we describe others, which can often
say more about the individual speaking than it does about the one being described (e.g.
Galasiński and Meinhof 2002), and the ways in which we differentiate ourselves from others.
The very process by which individuals can say that they belong to a certain group
requires proving that they do not belong to some other group. But the task of determining what
separates “us” from “them” is quite difficult. Therefore, in distinguishing themselves, in-group
members rely on stereotypes, attitudes, and ideologies in describing others. Bucholtz and Hall
suggest that
[i]t is not easy for an outside observer to determine when a group of people should be
classified as „alike,‟ nor is it obvious on what grounds such a classification should be
made, given the infinitude ways in which individuals may vary from one another. Hence,
externally imposed identity categories generally have at least as much to do with the
observer‟s own identity position and power stakes as with any sort of objectively
describable social reality. (2004: 370)
In addition to definitions and processes, we must also discuss the properties and functions
of identities. Identities are seen as dynamic entities, not static ones, and these identities emerge
within the context of an interaction (cf. Bucholtz and Hall 2004, 2005). Thus, as two individuals
engage in discourse, the identities that are relevant for the context emerge as the speaker situates
him/herself in relation to the hearer. Identities develop, over the course of a person‟s life (and,
30
over the course of an interaction), yet an individual is always recognized as the same individual
(Mühlhäusler and Harré 1990: 16).
When considering their function for a group, identities are seen as entities that help bind a
community (Jansen 1999). But identity operates on a number of levels: interactional,
ethnographic, historical, and political, among others (Bucholtz and Hall 2008). If we look at
individual identities, we will see that people have many varying identities, thus positioning them
as members of many groups. That is, speakers have an entire repertoire of identities, and
different identities are employed in different interactions, based on the goals and desires of the
individual as well as the social norms governing the context of use.
These identities come in the form of ethnicity, religion, gender, nationality, and other
such socially constructed groups (Extra and Yağmur 2004). In a great deal of identity studies, the
focus has been on national identity (cf. Joseph 2004, Martinello 1995). For instance, identity
becomes of key interest in studies of nation-building; in these situations, the establishment of a
national identity, through the creation of national symbols like flags and anthems is seen as a
necessity, to ensure unity and loyalty (Martinello 1995). Establishing an official language can
also serve as one of these national symbols, making it a key component in national identity.
Of course, many linguistic studies have dealt with other types of identities as well: gender
(cf. Bucholtz, Liang, and Sutton 1999, Holmes 1997, Eckert and McConnell-Ginet 1992);
religion (cf. Omoniyi and Fishman 2006, Joseph 2004, Zwickl 2002); ethnicity (cf. Joseph 2004,
Fishman 1999, Le Page and Tabouret-Keller 1985). In the literature, however, regional identity
is rather understudied.
One study that does address the concept of regional identity is Hazen (2002). Though he
refers to it as “cultural identity”, Hazen claims that the concept addresses “how speakers
31
conceive of themselves in relation to their local and larger regional communities” (2002: 241). In
this study, Hazen examines how speakers of Warren County, North Carolina utilize vernacular
variants of present and past tense be as indexes of regional identity. He argues that the strong
correlation between vernacular variants and orientation toward a particular region suggests a
need for more research on cultural identities.
As it were, Miller (2008) takes up Hazen‟s call and examines regional identity in
Louisville, Kentucky. Though without the emphasis on how the border impacts regional identity,
Miller also points to the debate among Louisvillians about their regional position as a reason for
examining the particular area. He found, in an informal poll, that the labels “Southern” and
“Midwestern” were used equally frequently. His study focused on how to quantify that which is
qualitative: identity. He developed a scoring system, called Scova, to quantify the relationship
between /ai/ monophthongization and the construction of regional identity, showing that, on a
continuum between Southern and Midwestern (though it is unclear how one could consider these
as two endpoints on a continuum), those who scored highly on the Southern end were more
likely to produce the monophthongal variant, while those who scored highly on the Midwestern
end disfavored the variant. Unfortunately, Miller makes many generalizations about regional
identity that make his method unsuitable for understanding identity beyond simple correlations
of features with regional labels. In fact, his concern is that identity research is too qualitative; but
one cannot explore the true dynamic nature of identity without solid qualitative analysis (in
addition to the quantitative).
Other than these few studies, regional identity has been relatively understudied in the
United States. This is surprising, given the great amount of popular attention given to regional
dialect variation, as evidenced by documentaries like American Tongues (Alvarez and Kolker
32
1988) and Do You Speak American? (Cran 2005). But it is exactly this salience of regional
identity that makes it such a fruitful area for research in the United States.
There are many frameworks available for the analysis of identity in linguistic research.
One of the major frameworks for identity construction is Le Page and Tabouret-Keller‟s (1985)
linguistic theory of acts of identity. In this seminal piece, the authors aim to capture the
generalizations of identity construction and the ways in which linguistic performance aids in this
construction. Each time we speak, we align with some group, and seek other like-minded
individuals to join our group. Further, Le Page and Tabouret-Keller suggest that despite our
desires to align ourselves with different groups, we are constrained by certain factors. They
indicate that individuals are constrained by their ability 1) to identify the group they wish to join,
2) to acquire access to the group in order to analyze the behaviors of its members, 3) to have
sufficient desire to join, and 4) to modify their behaviors to match those of the group (Le Page
and Tabouret-Keller 1985: 182).
We can examine these constraints more closely. To identify with a group, we must be
able to identify its members and know how the group is delimited. Access to the group requires
meaningful interaction with members of the group, and through these interactions, one should be
able to discover the (linguistic) patterns group members follow. A speaker‟s motivation, which
has been called the most important constraint (Le Page and Tabouret-Keller 1985: 184), is linked
to the notion of group solidarity. Finally, in modifying one‟s behavior, a speaker is expected to
approximate the patterns discovered in the second constraint in an acceptable manner (i.e. must
be accepted by group members).
This framework has been used often in the more than two decades since its publication.
More recently, Hatcher (2008) used this framework in an analysis of a historical change in script
33
in Azerbaijan. Hatcher, in creating a parallel between language choice and script choice, showed
that selecting one script over another served as an act of identity, but that generational shifts in
what constitutes an Azerbaijani identity make it such that different script choices align with
different acts of identity. In another study, Cramer and Hallett (forthcoming) show how hip hop
artists‟ use of lexical items pointing to regional affiliation serve as an act of (regional) identity.
By exploiting the constraints on identity construction, Ludacris, Nelly, and Kanye West are able
to create regional connections with their audiences.
Another framework often used to discuss language and identity is accommodation theory
(cf. Giles and Powesland 1975, Giles, Coupland, and Coupland 1991). In this theory, the notions
of convergence and divergence are used to show how speakers modify their linguistic practices
in order to more closely resemble or distinguish themselves from their interlocutors. Much like
acts of identity, this theory focuses on a speaker‟s ability to make modifications for his or her
audience, with an emphasis on the acceptance or rejection of a person as effectively able to
change. But unlike acts of identity, this theory also points to the external pressures that might
lead one to modify his or her behavior. For example, if a speaker seeks approval of some sort in
a social interaction, the speaker is more likely to converge to the speech patterns of the person
from whom he or she seeks approval.
The theory considers four components (Gudykunst 2005): the sociohistorical context,
which is the reason for the interaction; accommodative orientation, which consists of
interpersonal and intergroup factors as well as the initial orientation of those in the interaction;
the immediate situation, or the actual interaction, which is shaped by sociopsychological factors,
goals, sociolinguistic strategies, behaviors, and attributions; and evaluation and future intentions,
34
which includes the perception of one‟s interlocutor and the effect this perception has on future
group encounters (i.e. positive interactions likely bring further communication).
One recent example of a study that employs accommodation theory is that of Lin and
Zhang (2008). In this study of difference in conversational topics among groups of young and
old Taiwanese, the authors found that the themes used in conversation were accommodative in
nature. Older adults focused conversations with young adults on things associated with the lives
of young people (i.e. marriage, work, etc.), while they focused on issues of old age (i.e. health,
exercise, etc.) and their children when talking to peers. These shifts in accommodation show the
ways in which speakers express age identity in conversation.
Bell‟s (1984) theory of audience and referee design is another framework that has been
used in discussions of language and identity. In this theory, much like in accommodation theory,
a speaker adjusts his or her linguistic practices in response to the audience in the context. And
while convergence and divergence are still considered important, what seems more prominent is
the composition of the audience. Bell distinguishes between addressees, auditors, overhearers,
and eavesdroppers, all different kinds of audience members who influence a speaker‟s linguistic
practices in different ways. In referee design, speakers‟ shifts in style represent initiative
switches in topic, as a way of redefining the current situation towards some absent reference
group.
Bell‟s (1999) own work in New Zealand identity alignments will help illustrate how this
framework has been used in understanding issues of language and identity. Here, he focuses on
the responsive/initiative distinction, which suggests that a responsive shift occurs because of a
situation while an initiative one creates a new situation. He examines a series of advertisements
in New Zealand which make a clear nationalistic appeal to the majority Anglo group. The ads
35
draw on stereotypes associated with a cultural minority (the Māori), and they feature one native-
like and three non-native Māori singing a traditional Māori song. Bell‟s findings show a
combination of responsive and initiative styles in the performance of the song by each of the
different speakers and suggest that the Anglo identity is constructed through some connection to
the Māori people, as the Māori seem to represent New Zealandness to outsiders, despite their
minority status in New Zealand.
More recently, Bucholtz and Hall (2004, 2005) have also created a framework for
understanding identities, based on the semiotic nature of the processes of identification, of which
there are four: practice, indexicality, ideology, and performance. These four semiotic processes
serve as the basis for identity. The authors claim that identity is “an outcome of cultural
semiotics that is accomplished through the production of contextually relevant sociopolitical
relations of similarity and difference, authenticity and inauthenticity, and legitimacy and
illegitimacy” (2004: 382).
Their framework stems from this definition. It focuses not only on how identities are
formed but also why, and it addresses the intersection of culture, agency, and power, unlike many
previous models of identity (i.e. accommodation theory, audience and referee design, acts of
identity). They posit three tactics of intersubjectivity, claiming that “[e]ach of these tactics
foregrounds a different use to which identity may be put: the establishment of relations of
similarity and difference, of genuineness and artifice, and of legitimacy and disempowerment
vis-à-vis some reference group or individual” (Bucholtz and Hall 2004: 383).The three pairs of
oppositions are: adequation and distinction; authentication and denaturalization; and
authorization and illegitimation.
36
Turning our attention more specifically to the processes of identification in linguistic
practices, we can see how Bucholtz and Hall (2004) have addressed the semiotic nature of such
processes, of which there are four: practice, indexicality, ideology, and performance. Together,
these four interrelated processes combine in the construction of identity and culture. Practice,
which is considered to be “habitual social activity, the series of actions that make up our daily
lives” (2004: 377), centers on the notion of “habitus” described by Bourdieu (1977), which can
be understood as the aspects of culture, including a person‟s beliefs, that are durable and
acquired through the repetition of life experiences. For Bourdieu, language is one such practice.
Indexicality is “the semiotic operation of juxtaposition, whereby one entity or event
points to another” (Bucholtz and Hall 2004: 378). Again, repetition is important; if we continue
to see smoke, and ultimately discern that it was caused by some fire, we will necessarily link
smoke as an index of fire. In linguistics, this means that certain forms, over time, become
intrinsically linked to certain kinds of speakers, thus often leading to social stereotypes.
Ideology involves the cultural belief systems of individuals. Linguistic ideologies are,
therefore, beliefs about language. Since indexicality sets up links between linguistic forms and
types of speakers, beliefs about language often turn into beliefs about speakers (Bucholtz and
Hall 2004).
Performance is a deliberate social display, in which an audience evaluates the speaker‟s
production of identity. While this has often been discussed in terms of stage performances,
linguistic anthropologists see linguistic performance in daily life. In these types of performance,
certain ideologies are brought to light in the exaggerated performance of an identity.
Drawing on this framework and the four semiotic processes presented above, Bucholtz
and Hall (2005) also propose five principles to be included in the analysis of identities in
37
interaction: emergence, positionality, indexicality, relationality, and partialness. Emergence
addresses the ways in which identities are realized in the context of an interaction. Positionality
points to the importance of interlocutor roles and the position one interlocutor takes with respect
to another; these roles and positions are portrayed as temporary and context-specific. Indexicality
draws on the semiotic process mentioned above, indicating how participants utilize indexical
processes to make connections between linguistic forms and social meaning. Relationality,
which focuses more on the notions presented in their framework, indicates the intersubjective
nature of identities. Partialness deals with how identities are necessarily partial and that any
description of identities will also be partial.
Some studies have used Bucholtz and Hall‟s model to analyze particular linguistic
situations. For instance, Chen (2008), in examining the linguistic practices of bilingual returnees
in Hong Kong, notes that returnees and locals are seen as distinct categories with which to
identify, and they use the tactics of adequation and distinction to position themselves in this
dichotomy. Additionally, Chen argues that locals make a claim to realness through tactics of
authenticity, positioning themselves as the powerful group, thus able to delegitimate returnees. In
another study, Williams (2008) suggests that Chinese Americans note the benefits of learning
Mandarin, thus aligning with the language through tactics of adequation, while subsequently
condemning the language as annoying, thus distancing themselves through distinction. These
bivalent stances aid in the emergence of an appropriate identity in the context of the interaction.
Cashman (2008), who focuses more on Bucholtz and Hall‟s (2005) principle of emergence,
explains how children in an English-Spanish bilingual setting use impolite forms and
codeswitching as resources for adequation and distinction to construct the identity of a classmate
as a marginalized member of the class.
38
These frameworks have contributed to our understanding of issues in language and
identity in different ways. Yet, while a framework can guide the research, one must begin by
setting goals for the study of identity and language. Bucholtz and Hall (2008) claim that we
should aim:
(1) to describe an identity that has been unrecognized or misrecognized by researchers or
cultural members […] (2) to demonstrate the importance of a particular interactional
resource for identity work that has previously been overlooked […] (3) to add greater
nuance to the conceptualization of identity and its construction […] or (4) to show how
identities are tied up with larger sociopolitical processes, institutions, histories, and
ideologies that are consequential beyond the interaction itself. (2008: 160-161)
This dissertation aims to address the regional identity expressed in Louisville because it
has been virtually ignored in linguistic research (but see Miller 2008). What makes it interesting
is its location in the United States. As a border town, Louisville represents a location where it is
likely that more than one regional identity is expressed. As such, it will be necessary to address
the complexity of mapping linguistic choices to identity construction in border towns, in order to
capture the sociolinguistic nuances of the language-identity interface. I will show how
geographical, political, linguistic, historical, cultural, and perceptual borders affect the linguistic
practices and identity constructions and perceptions of people in this town, a topic which has
been mostly ignored in linguistic studies.
2.3 Border Studies and Identity
In order to understand what happens near borders, we must first examine how terms like
“border” and “borderlands” have been theorized. While a border may simply be conceived of as
a line (often a political or geographic boundary), borderlands are considered to be strips of land
39
on either side of the border (Bejarano 2006), or “a region and set of practices defined and
determined by this border that are characterized by conflict and contradiction, material and
ideational” (Alvarez 1995: 448).
These regions are locales for the convergence of political, social, and other identities
(Flynn 1997). In these regions, identities are constantly challenged and transformed. Alvarez
claims that borders and borderlands represent graphically the conflicts associated with the
current organization of the world. Alvarez adds, “For it is here that cultures, ideologies, and
individuals clash and challenge our disciplinary perspectives on social harmony and equilibrium”
(1995: 449).
Alvarez (1995) examines the history of borderland studies in anthropology. He claims
that the anthropological investigation of borders grew out of many studies along the US-Mexico
border (e.g. Bustamante 1978, Hansen 1981, Stoddard, Nostrand, and West 1982), and that these
studies provided the model for the study of other national borders. These researchers found
interest in the US-Mexico border because of its unique status as a boundary between the first and
third worlds. These early studies were concerned mainly with issues of immigration. Later,
anthropologists moved toward folklore and cultural products at the border as a way of
investigating aspects of identity and cultural conflict. The field was further encouraged by native
anthropologists challenging the traditional notions of subject and object in anthropological
research, taking it upon themselves to investigate their own border communities from an
insider‟s perspective. As more studies on this and other borders developed, the field of
borderland studies quickly became a vibrant area of research.
One issue of concern for anthropologists is the notion that a border does not confine a
culture to a specific area. Appadurai (1988) expressed unease with the notion that cultures might
40
be bounded in this way. Gupta and Ferguson (1992) state that the globalized world in which we
live makes it impossible to suggest that borders “contain” culture. Though the early perspective
of a border as the literal dividing line between discrete cultures ultimately became untenable,
many anthropological studies still rarely considered the border as a variable (Alvarez 1995,
Appadurai 1988).
As Alvarez notes, despite the rich history associated with the US-Mexico border, most
work has been ahistorical, ignoring the implications such information might have for the
construction of border identities. He calls for more history and more ethnography, in order to
better understand contested and shifting identities at the border. Others, like Gupta and Ferguson,
suggest that a renewed interest in space “forces us to reevaluate such central analytic concepts in
anthropology as that of „culture‟ and, by extension, the idea of „cultural difference‟” (1992: 6),
which, in the absence of the assumed isomorphism of culture and space, becomes more apparent.
We can turn to some recent studies at the US-Mexico border to see how cultural
differences are exposed when we pay attention to space, and borders in particular. Pletsch de
García (2006) examined Laredo, Texas, a border town where 93% of the population is of
Hispanic descent. Her focus was on TexMex, the name of a particular kind of mixed language
that has both negative and positive connotations for different speakers. Her findings show that
monolingual English speakers tended to have more negative associations with TexMex than did
the people who actually used it. The cultural difference in this border community deals
specifically with attitudes toward language; in order to show this difference, Pletsch de García
needed a strong understanding of the social norms and the linguistic culture associated with the
people in the community, thus answering Alvarez‟s call to more ethnography.
41
Another such study at the US-Mexico border examines the youth identities of Latino
students in a border town high school. Bejarano (2006) examined the many distinctions in
identity made by people at the border (Latino, Chicano, Mexican, Mexican-American, etc.) that
the majority of US society ignores. In her study, Bejarano focuses on how youth identities are
created and influenced by geopolitics and sociocultural implications of the border. Like the
definition of borderlands presented above suggests, Bejarano emphasizes the contestation of
identities that occurs in border communities, saying, “The borderlands thus is a place where
people face simultaneous affirmations and contradictions about their identities” (2006: 22).
Among her informants were both American-born and Mexican-born youths, who, in their
identity creations, contested the relative Mexicanness or Americanness of their counterparts. She
found that their identity positionings were tied up with their understanding of citizenship and the
salience of linguistic choices. Students were able to present their level of Mexicanness or
Americanness based on both their birthright, so to speak, and their choice of English, Spanish,
Spanglish, or codeswitching between the languages. Ultimately, Bejarano discovered that the
borderlands held varying meanings for its residents, and that identity construction was a complex
practice that required not only strong ethnographic background knowledge but also an
understanding of the historical situation that created the borderlands.
Like in Bejarano‟s research, many border studies emphasize the hybridity of identities at
the border. As Rosaldo suggests, we often consider border identities to be “a little of this and a
little of that, and not quite one or the other” (1993: 209). Flynn (1997) argues, however, that the
situation at the Bénin-Nigeria border presents a different possibility. For her informants, on
either side of the political and geographic border, the idea that governments could dictate who
did and did not belong to a particular community was preposterous. The communities positioned
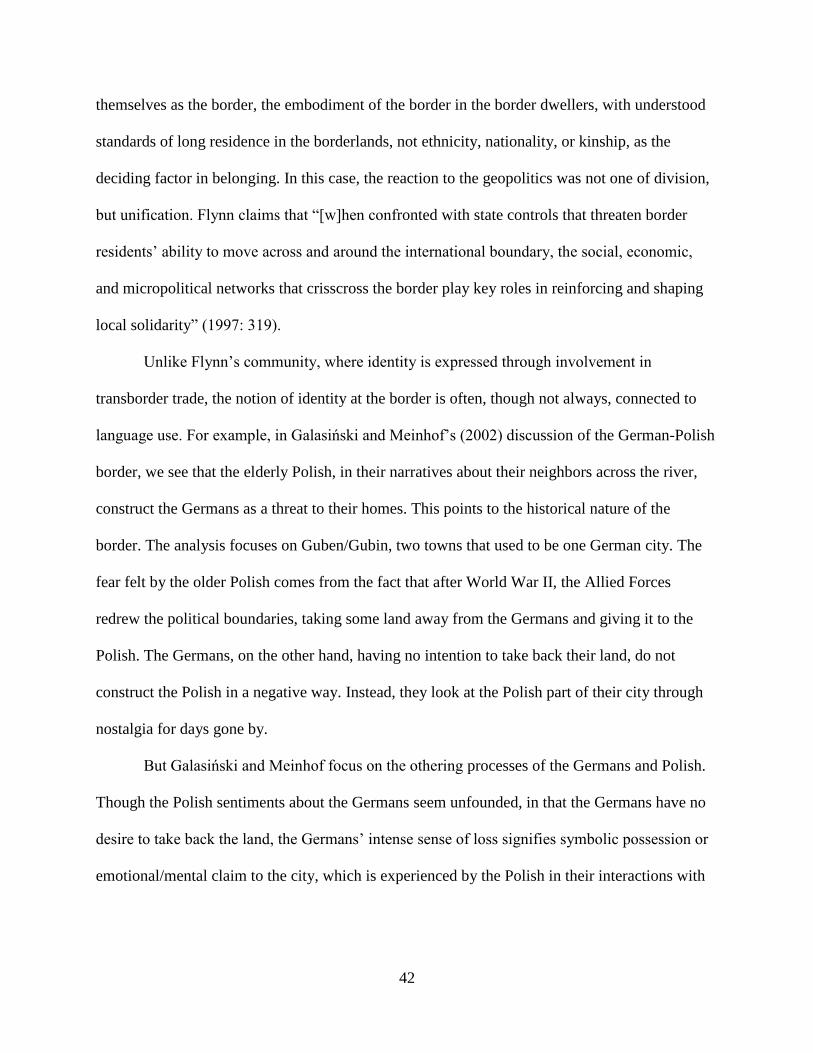
42
themselves as the border, the embodiment of the border in the border dwellers, with understood
standards of long residence in the borderlands, not ethnicity, nationality, or kinship, as the
deciding factor in belonging. In this case, the reaction to the geopolitics was not one of division,
but unification. Flynn claims that “[w]hen confronted with state controls that threaten border
residents‟ ability to move across and around the international boundary, the social, economic,
and micropolitical networks that crisscross the border play key roles in reinforcing and shaping
local solidarity” (1997: 319).
Unlike Flynn‟s community, where identity is expressed through involvement in
transborder trade, the notion of identity at the border is often, though not always, connected to
language use. For example, in Galasiński and Meinhof‟s (2002) discussion of the German-Polish
border, we see that the elderly Polish, in their narratives about their neighbors across the river,
construct the Germans as a threat to their homes. This points to the historical nature of the
border. The analysis focuses on Guben/Gubin, two towns that used to be one German city. The
fear felt by the older Polish comes from the fact that after World War II, the Allied Forces
redrew the political boundaries, taking some land away from the Germans and giving it to the
Polish. The Germans, on the other hand, having no intention to take back their land, do not
construct the Polish in a negative way. Instead, they look at the Polish part of their city through
nostalgia for days gone by.
But Galasiński and Meinhof focus on the othering processes of the Germans and Polish.
Though the Polish sentiments about the Germans seem unfounded, in that the Germans have no
desire to take back the land, the Germans‟ intense sense of loss signifies symbolic possession or
emotional/mental claim to the city, which is experienced by the Polish in their interactions with
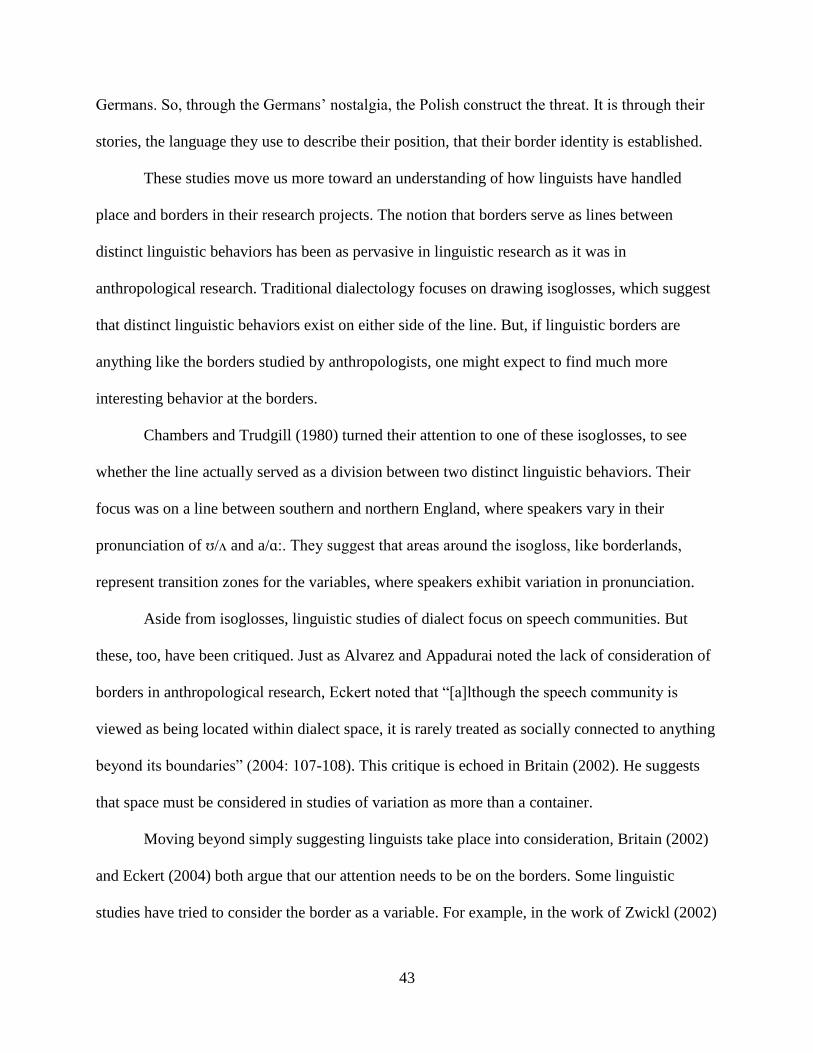
43
Germans. So, through the Germans‟ nostalgia, the Polish construct the threat. It is through their
stories, the language they use to describe their position, that their border identity is established.
These studies move us more toward an understanding of how linguists have handled
place and borders in their research projects. The notion that borders serve as lines between
distinct linguistic behaviors has been as pervasive in linguistic research as it was in
anthropological research. Traditional dialectology focuses on drawing isoglosses, which suggest
that distinct linguistic behaviors exist on either side of the line. But, if linguistic borders are
anything like the borders studied by anthropologists, one might expect to find much more
interesting behavior at the borders.
Chambers and Trudgill (1980) turned their attention to one of these isoglosses, to see
whether the line actually served as a division between two distinct linguistic behaviors. Their
focus was on a line between southern and northern England, where speakers vary in their
pronunciation of ʊ/ʌ and a/ɑ:. They suggest that areas around the isogloss, like borderlands,
represent transition zones for the variables, where speakers exhibit variation in pronunciation.
Aside from isoglosses, linguistic studies of dialect focus on speech communities. But
these, too, have been critiqued. Just as Alvarez and Appadurai noted the lack of consideration of
borders in anthropological research, Eckert noted that “[a]lthough the speech community is
viewed as being located within dialect space, it is rarely treated as socially connected to anything
beyond its boundaries” (2004: 107-108). This critique is echoed in Britain (2002). He suggests
that space must be considered in studies of variation as more than a container.
Moving beyond simply suggesting linguists take place into consideration, Britain (2002)
and Eckert (2004) both argue that our attention needs to be on the borders. Some linguistic
studies have tried to consider the border as a variable. For example, in the work of Zwickl (2002)
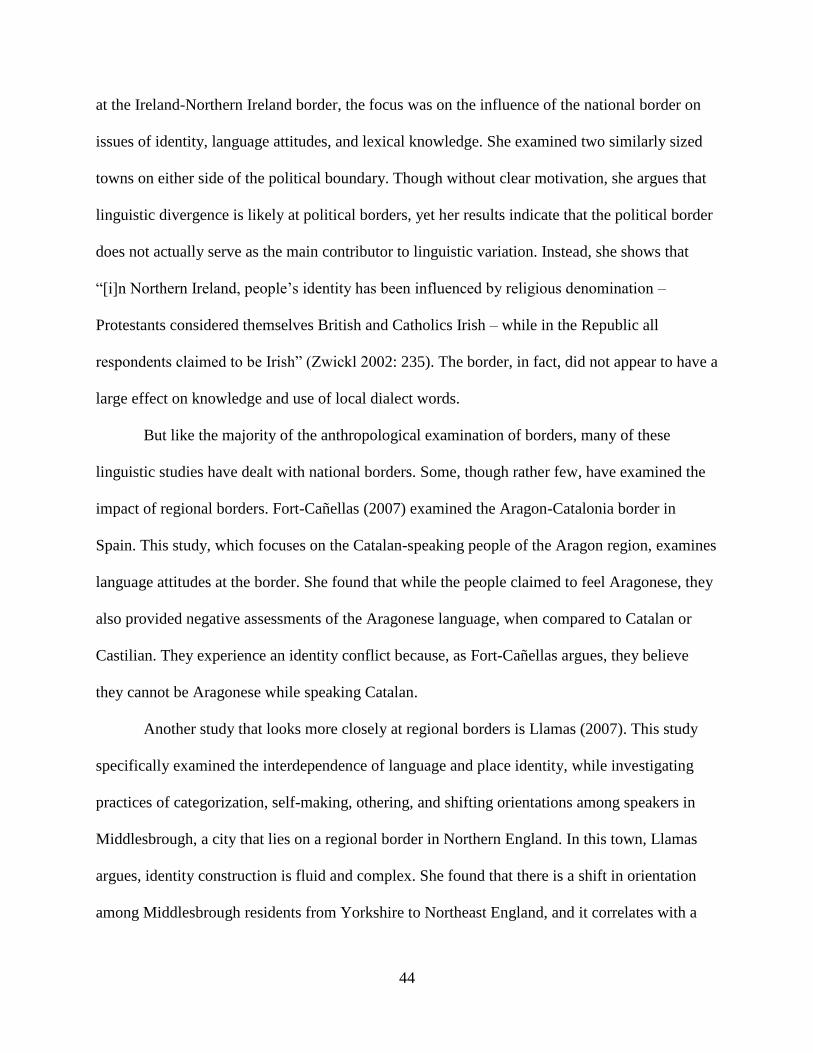
44
at the Ireland-Northern Ireland border, the focus was on the influence of the national border on
issues of identity, language attitudes, and lexical knowledge. She examined two similarly sized
towns on either side of the political boundary. Though without clear motivation, she argues that
linguistic divergence is likely at political borders, yet her results indicate that the political border
does not actually serve as the main contributor to linguistic variation. Instead, she shows that
“[i]n Northern Ireland, people‟s identity has been influenced by religious denomination –
Protestants considered themselves British and Catholics Irish – while in the Republic all
respondents claimed to be Irish” (Zwickl 2002: 235). The border, in fact, did not appear to have a
large effect on knowledge and use of local dialect words.
But like the majority of the anthropological examination of borders, many of these
linguistic studies have dealt with national borders. Some, though rather few, have examined the
impact of regional borders. Fort-Cañellas (2007) examined the Aragon-Catalonia border in
Spain. This study, which focuses on the Catalan-speaking people of the Aragon region, examines
language attitudes at the border. She found that while the people claimed to feel Aragonese, they
also provided negative assessments of the Aragonese language, when compared to Catalan or
Castilian. They experience an identity conflict because, as Fort-Cañellas argues, they believe
they cannot be Aragonese while speaking Catalan.
Another study that looks more closely at regional borders is Llamas (2007). This study
specifically examined the interdependence of language and place identity, while investigating
practices of categorization, self-making, othering, and shifting orientations among speakers in
Middlesbrough, a city that lies on a regional border in Northern England. In this town, Llamas
argues, identity construction is fluid and complex. She found that there is a shift in orientation
among Middlesbrough residents from Yorkshire to Northeast England, and it correlates with a
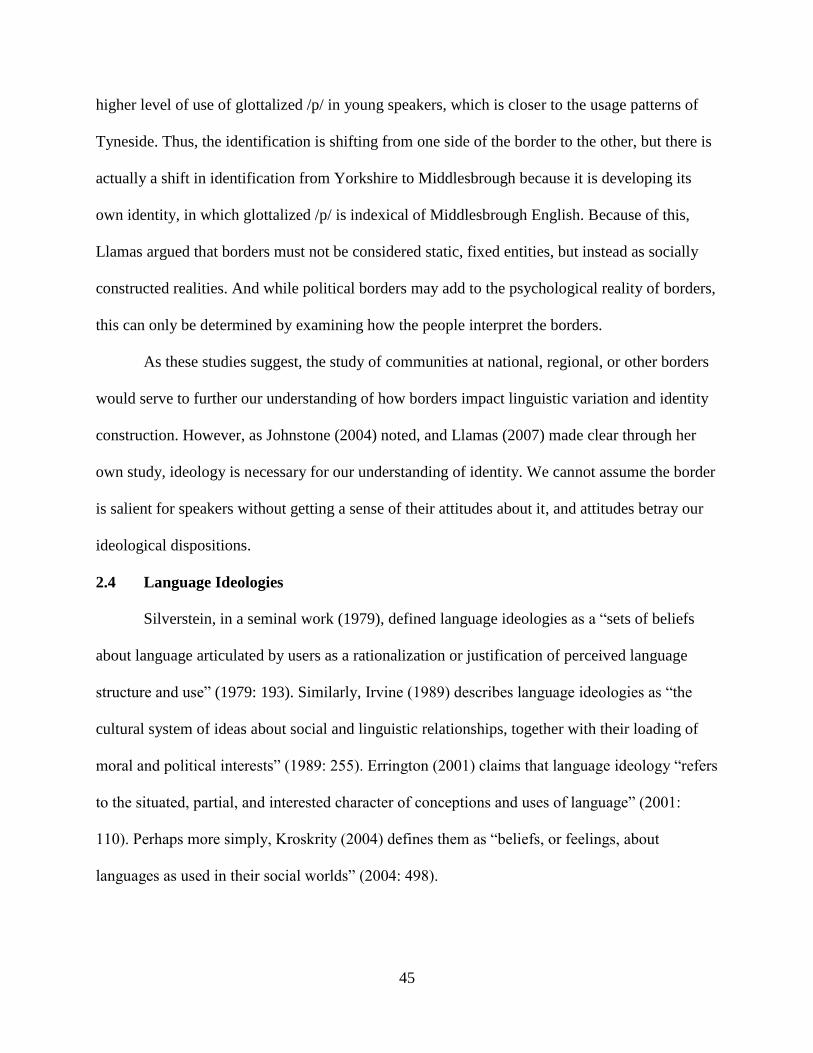
45
higher level of use of glottalized /p/ in young speakers, which is closer to the usage patterns of
Tyneside. Thus, the identification is shifting from one side of the border to the other, but there is
actually a shift in identification from Yorkshire to Middlesbrough because it is developing its
own identity, in which glottalized /p/ is indexical of Middlesbrough English. Because of this,
Llamas argued that borders must not be considered static, fixed entities, but instead as socially
constructed realities. And while political borders may add to the psychological reality of borders,
this can only be determined by examining how the people interpret the borders.
As these studies suggest, the study of communities at national, regional, or other borders
would serve to further our understanding of how borders impact linguistic variation and identity
construction. However, as Johnstone (2004) noted, and Llamas (2007) made clear through her
own study, ideology is necessary for our understanding of identity. We cannot assume the border
is salient for speakers without getting a sense of their attitudes about it, and attitudes betray our
ideological dispositions.
2.4 Language Ideologies
Silverstein, in a seminal work (1979), defined language ideologies as a “sets of beliefs
about language articulated by users as a rationalization or justification of perceived language
structure and use” (1979: 193). Similarly, Irvine (1989) describes language ideologies as “the
cultural system of ideas about social and linguistic relationships, together with their loading of
moral and political interests” (1989: 255). Errington (2001) claims that language ideology “refers
to the situated, partial, and interested character of conceptions and uses of language” (2001:
110). Perhaps more simply, Kroskrity (2004) defines them as “beliefs, or feelings, about
languages as used in their social worlds” (2004: 498).
46
These definitions point to several features thought to be present in language ideologies.
They are seen as imbued with the political, social, and moral issues prevalent within a
community (Irvine and Gal 2000). A group has multiple ideologies, which are context-specific
and constructed over time through the experiences of individuals (Kroskrity 2004). But our
social constructions are based on more than direct sensory input; in fact, ideologies come about
from our perceptions of the sensory information (Edwards 1999). These ideologies, like
identities, are seen as dynamic entities, not static ones (Woolard 1992, Kroskrity 2004).
One important point is that language ideologies, linguistic form, and social use are
interconnected. Each one is thought to shape and inform the others, and within this, “language
ideology is a mediating link between social structures and forms of talk” (Woolard 1992: 235).
However, as Woolard (2008) has noted, it is quite difficult to focus on all three variables at the
same time, thus research becomes focused on talk about language and not on linguistic practices.
But, despite these features which seem to make language ideologies a keen point of study
in linguistic research, previous linguistic studies were focused solely on linguistic variation,
seeing attitudes as secondary, or as interesting parallel research. That is, variationist studies and
language attitudes have often seemed to be separate ventures (Milroy 2004). This tradition goes
back at least as far as Bloomfield (1944), who famously claimed that these ideologies only serve
as distracters to genuine linguistic analyses. On the other hand, the study of language ideologies
has had great success in the area of social psychology, though these studies tend not to focus on
linguistic variation (Edwards 1999, Milroy and Preston 1999), thus making Woolard‟s (2008)
point about the difficulties associated with focusing on three variables quite clear.
Those who have focused their attentions on bridging the gap have set out some
interesting frameworks for the analysis of ideology. For instance, Irvine and Gal (2000) suggest
47
three semiotic processes concerning “the way people conceive of links between linguistic forms
and social phenomena” (2000: 37). These processes consist of the following: iconization, fractal
recursivity, and erasure. Iconization deals with the ways in which certain linguistic forms which
serve as linguistic markers of differentiation are intrinsically linked to social differentiation. For
example, the fact that Southern American speakers are perceived to speak more slowly than
other groups has been linked to the idea that they must also be slower thinkers (i.e. dumb). An
example can be seen when a speaker makes a connection between the speech of a Southerner and
the social practice of marrying cousins or not wearing shoes (Cramer 2010).
Fractal recursivity is the idea that oppositions at one level of difference are projected onto
another level within each group. For example, British speakers are thought to have precise
enunciation, which leads people to associate such a dialect with being smart (by iconization),
while Americans, who are thought to “swallow” their consonants, presenting a dialect that is
often linked to being dumb comparatively. But within American speech patterns (another level of
difference), speakers have more or less precise enunciation (i.e. attempt a British accent).
Speakers who have more precise enunciation are associated with characteristics like formal,
white, and standard, while the dialect with swallowed consonants is associated with informal,
non-white, and non-standard speech. This same dichotomy has been shown when describing the
differences between urban and rural varieties (Cramer 2010).
Erasure is the process that renders certain distinctions invisible. Perceived homogeneity
within a language is one way in which erasure is realized. As Irvine and Gal note, “Erasure in
ideological representation does not, however, necessarily mean actual eradication of the
awkward element, whose very existence may be unobserved or unattended to” (2000: 38).
48
Together, these three semiotic processes explain the ways in which ideologies about linguistic
differences are formed.
Perhaps more related to the goals of this dissertation is the framework discussed in
Milroy (2004). She claims that there is a need for “a framework for incorporating into
mainstream variationist work an account of language attitudes, treated as manifestations of
locally constructed language ideologies” (2004: 161). Her approach, which draws on Labov‟s
(1963) classic study of variation in Martha‟s Vineyard and more recent work by Eckert (2000),
emphasizes ethnographic detail and indexicality in identity and ideology research. Since 1963,
variationists have done a great deal of work showing how phonological elements index group
identity. But these works depended on the ethnography of the community. Thus, Milroy
encourages an understanding of the locally relevant social categories before beginning our
research. Such an approach will reveal the ideological motivations of group members to affiliate
with a particular group.
Turning again to the attention given to regional variation, and more specifically to
linguistic ideologies, in the American popular press, the importance of attitudes in linguistic
research becomes more apparent. One goal of this project is to draw on these popular notions of
regional variation, looking to folk attitudes and ideologies as a way of understanding belonging,
and considering the border as an area where these ideologies are particularly important in
determining how speakers express belonging with respect to region. Without a clear
understanding of the ways in which community members construct and perceive their own and
others‟ identities, we lose the important social and cultural information that informs our research.
49
3 Theoretical Framework
In this section, I focus on the theoretical framework that will be used in my data analysis.
This dissertation draws extensively on work done in folk linguistics. This section includes a brief
history of folk linguistics, as well as a description of the types of tools used within this field of
study and a presentation of some research projects that have utilized these tools.
3.1 The History of Folk Linguistics
In many traditional dialectology studies, as noted above, there is a lack of inclusion of
speakers‟ attitudes and beliefs about linguistic varieties and variation. In general, dialectologists,
particularly those from the American structuralist tradition (more particularly, those heavily
influenced by Bloomfield) have not been interested in the overt opinions of nonlinguists, instead
claiming that only production data counts as “real” data (Preston 1989, Niedzielski and Preston
2000, Benson 2003).
Despite the prevalence of the Bloomfieldian perspective, in the 1960s, Hoenigswald
(1966) incited interest in the beliefs of speakers, or “the folk”, in linguistic research. He
suggested that linguists should be concerned not only with language as production but also with
how people react to language and how people represent language in talk about language. Thus, a
field referred to as “folk linguistics” was established, and work done by Dennis Preston, among
others, in the 1980s and later, emphasized the importance of language attitudes and perceptions
in the study of linguistic variation.
But, as Preston has noted, this was not the actual beginning of the field. Perceptual
dialectology5, a branch of folk linguistics that has its focus in what nonlinguists say about
language and linguistic variation, including where they think it comes from, where they think it
5 A terminological note: Preston uses the term “perceptual dialectology”, as opposed to “folk dialectology” because
the word “folk” is often understood to mean “false” (Preston 1999).
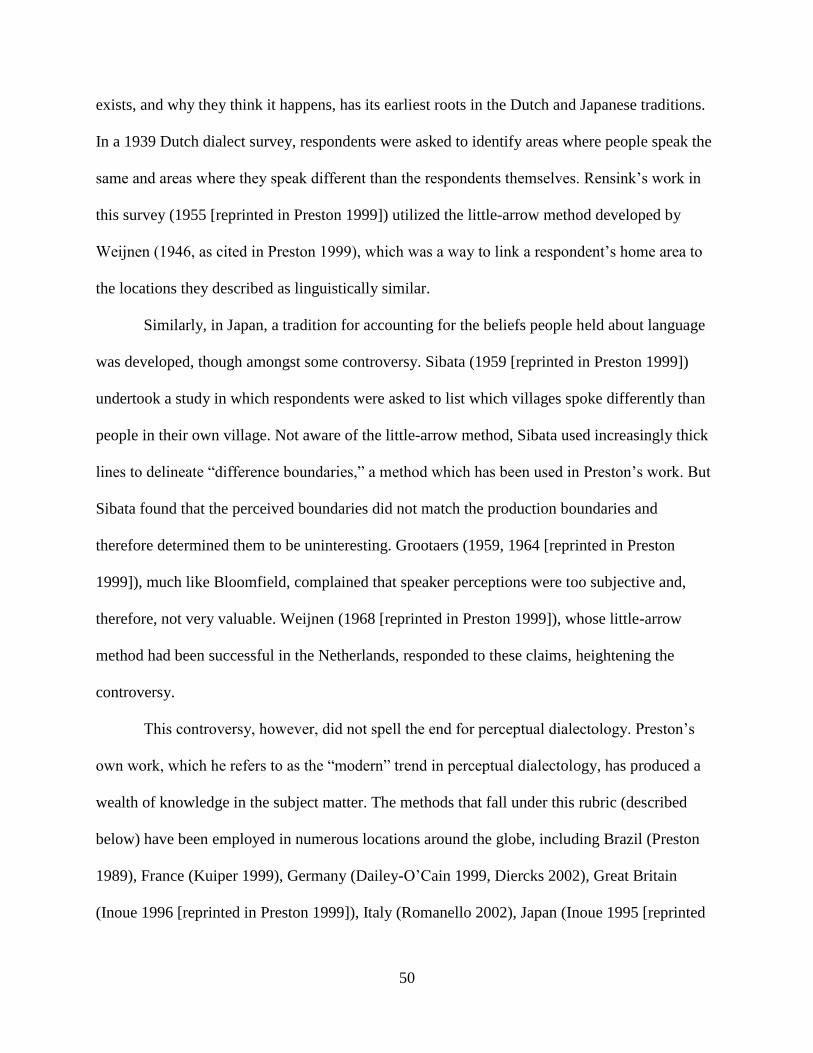
50
exists, and why they think it happens, has its earliest roots in the Dutch and Japanese traditions.
In a 1939 Dutch dialect survey, respondents were asked to identify areas where people speak the
same and areas where they speak different than the respondents themselves. Rensink‟s work in
this survey (1955 [reprinted in Preston 1999]) utilized the little-arrow method developed by
Weijnen (1946, as cited in Preston 1999), which was a way to link a respondent‟s home area to
the locations they described as linguistically similar.
Similarly, in Japan, a tradition for accounting for the beliefs people held about language
was developed, though amongst some controversy. Sibata (1959 [reprinted in Preston 1999])
undertook a study in which respondents were asked to list which villages spoke differently than
people in their own village. Not aware of the little-arrow method, Sibata used increasingly thick
lines to delineate “difference boundaries,” a method which has been used in Preston‟s work. But
Sibata found that the perceived boundaries did not match the production boundaries and
therefore determined them to be uninteresting. Grootaers (1959, 1964 [reprinted in Preston
1999]), much like Bloomfield, complained that speaker perceptions were too subjective and,
therefore, not very valuable. Weijnen (1968 [reprinted in Preston 1999]), whose little-arrow
method had been successful in the Netherlands, responded to these claims, heightening the
controversy.
This controversy, however, did not spell the end for perceptual dialectology. Preston‟s
own work, which he refers to as the “modern” trend in perceptual dialectology, has produced a
wealth of knowledge in the subject matter. The methods that fall under this rubric (described
below) have been employed in numerous locations around the globe, including Brazil (Preston
1989), France (Kuiper 1999), Germany (Dailey-O‟Cain 1999, Diercks 2002), Great Britain
(Inoue 1996 [reprinted in Preston 1999]), Italy (Romanello 2002), Japan (Inoue 1995 [reprinted
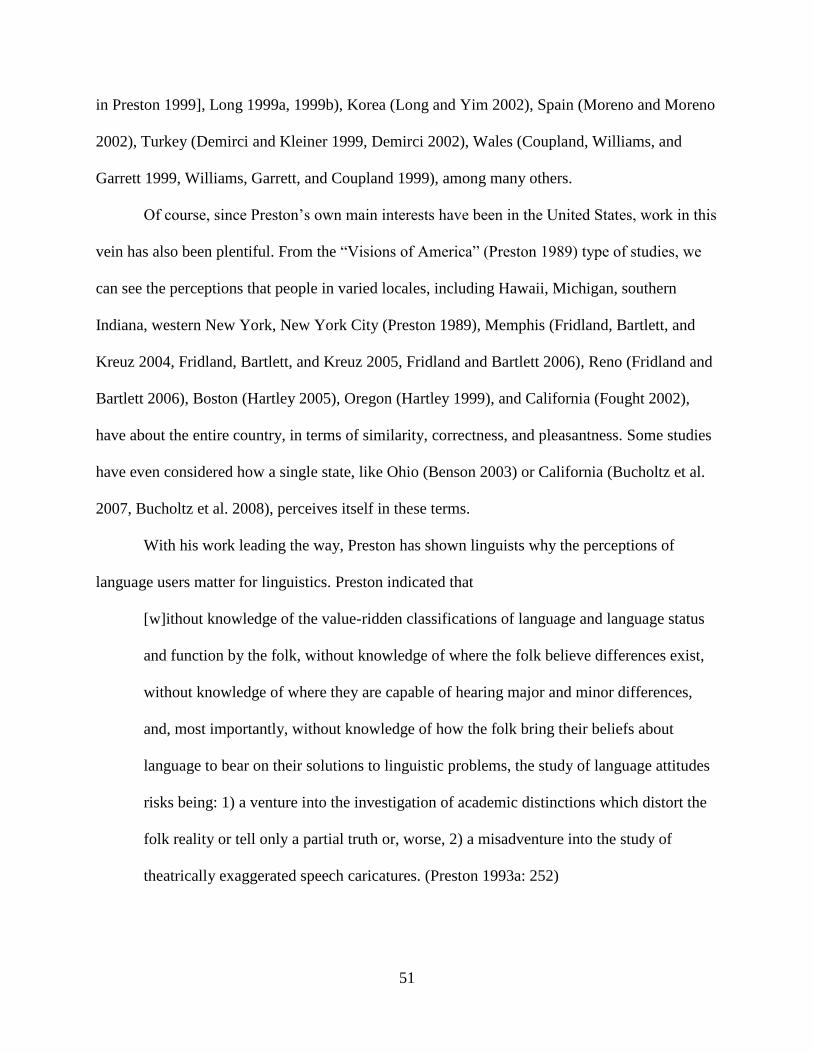
51
in Preston 1999], Long 1999a, 1999b), Korea (Long and Yim 2002), Spain (Moreno and Moreno
2002), Turkey (Demirci and Kleiner 1999, Demirci 2002), Wales (Coupland, Williams, and
Garrett 1999, Williams, Garrett, and Coupland 1999), among many others.
Of course, since Preston‟s own main interests have been in the United States, work in this
vein has also been plentiful. From the “Visions of America” (Preston 1989) type of studies, we
can see the perceptions that people in varied locales, including Hawaii, Michigan, southern
Indiana, western New York, New York City (Preston 1989), Memphis (Fridland, Bartlett, and
Kreuz 2004, Fridland, Bartlett, and Kreuz 2005, Fridland and Bartlett 2006), Reno (Fridland and
Bartlett 2006), Boston (Hartley 2005), Oregon (Hartley 1999), and California (Fought 2002),
have about the entire country, in terms of similarity, correctness, and pleasantness. Some studies
have even considered how a single state, like Ohio (Benson 2003) or California (Bucholtz et al.
2007, Bucholtz et al. 2008), perceives itself in these terms.
With his work leading the way, Preston has shown linguists why the perceptions of
language users matter for linguistics. Preston indicated that
[w]ithout knowledge of the value-ridden classifications of language and language status
and function by the folk, without knowledge of where the folk believe differences exist,
without knowledge of where they are capable of hearing major and minor differences,
and, most importantly, without knowledge of how the folk bring their beliefs about
language to bear on their solutions to linguistic problems, the study of language attitudes
risks being: 1) a venture into the investigation of academic distinctions which distort the
folk reality or tell only a partial truth or, worse, 2) a misadventure into the study of
theatrically exaggerated speech caricatures. (Preston 1993a: 252)
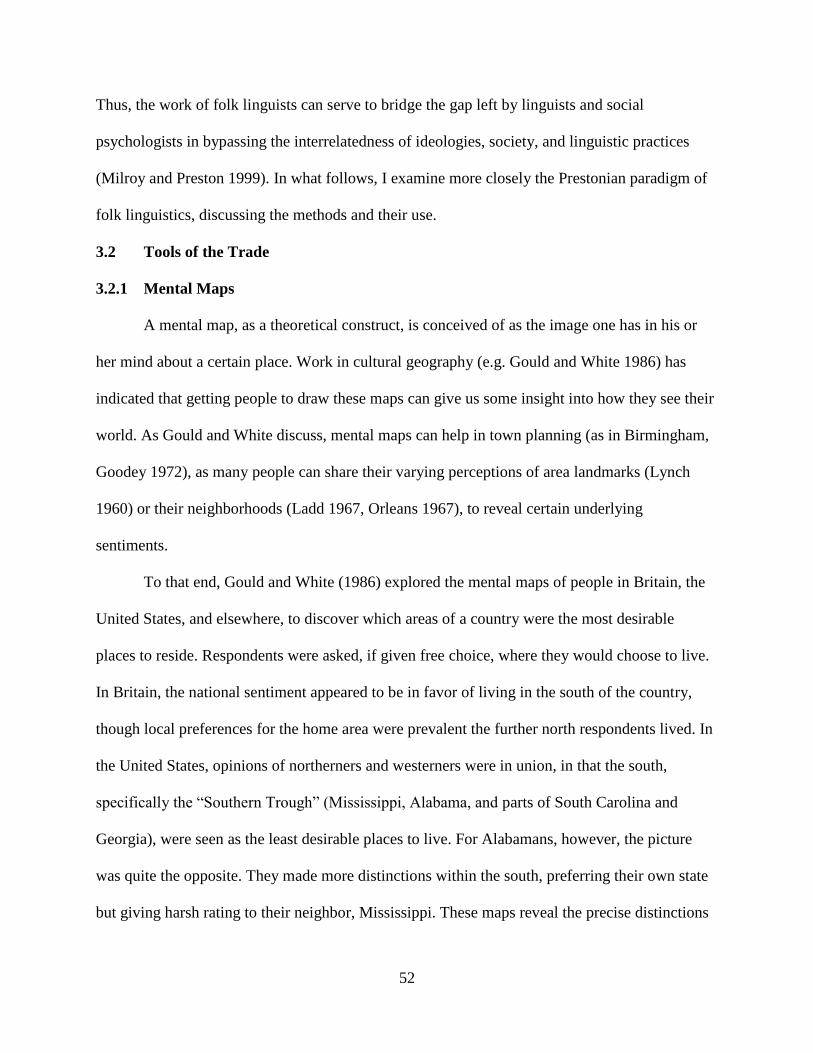
52
Thus, the work of folk linguists can serve to bridge the gap left by linguists and social
psychologists in bypassing the interrelatedness of ideologies, society, and linguistic practices
(Milroy and Preston 1999). In what follows, I examine more closely the Prestonian paradigm of
folk linguistics, discussing the methods and their use.
3.2 Tools of the Trade
3.2.1 Mental Maps
A mental map, as a theoretical construct, is conceived of as the image one has in his or
her mind about a certain place. Work in cultural geography (e.g. Gould and White 1986) has
indicated that getting people to draw these maps can give us some insight into how they see their
world. As Gould and White discuss, mental maps can help in town planning (as in Birmingham,
Goodey 1972), as many people can share their varying perceptions of area landmarks (Lynch
1960) or their neighborhoods (Ladd 1967, Orleans 1967), to reveal certain underlying
sentiments.
To that end, Gould and White (1986) explored the mental maps of people in Britain, the
United States, and elsewhere, to discover which areas of a country were the most desirable
places to reside. Respondents were asked, if given free choice, where they would choose to live.
In Britain, the national sentiment appeared to be in favor of living in the south of the country,
though local preferences for the home area were prevalent the further north respondents lived. In
the United States, opinions of northerners and westerners were in union, in that the south,
specifically the “Southern Trough” (Mississippi, Alabama, and parts of South Carolina and
Georgia), were seen as the least desirable places to live. For Alabamans, however, the picture
was quite the opposite. They made more distinctions within the south, preferring their own state
but giving harsh rating to their neighbor, Mississippi. These maps reveal the precise distinctions
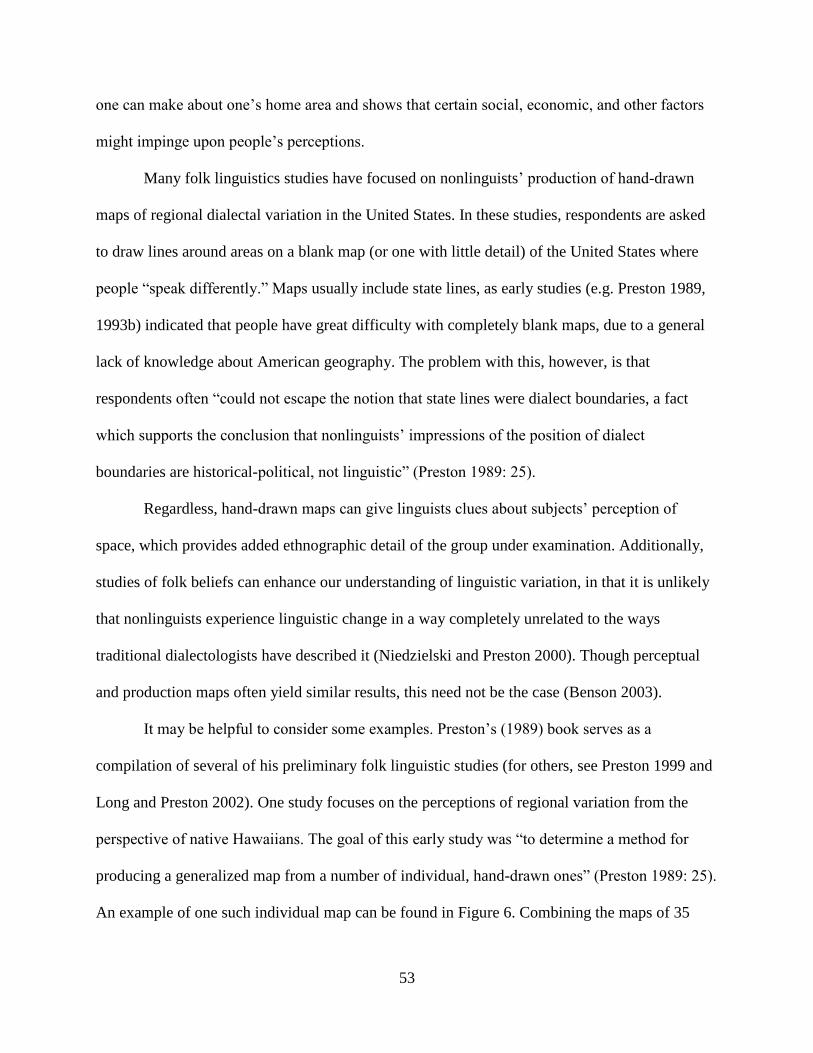
53
one can make about one‟s home area and shows that certain social, economic, and other factors
might impinge upon people‟s perceptions.
Many folk linguistics studies have focused on nonlinguists‟ production of hand-drawn
maps of regional dialectal variation in the United States. In these studies, respondents are asked
to draw lines around areas on a blank map (or one with little detail) of the United States where
people “speak differently.” Maps usually include state lines, as early studies (e.g. Preston 1989,
1993b) indicated that people have great difficulty with completely blank maps, due to a general
lack of knowledge about American geography. The problem with this, however, is that
respondents often “could not escape the notion that state lines were dialect boundaries, a fact
which supports the conclusion that nonlinguists‟ impressions of the position of dialect
boundaries are historical-political, not linguistic” (Preston 1989: 25).
Regardless, hand-drawn maps can give linguists clues about subjects‟ perception of
space, which provides added ethnographic detail of the group under examination. Additionally,
studies of folk beliefs can enhance our understanding of linguistic variation, in that it is unlikely
that nonlinguists experience linguistic change in a way completely unrelated to the ways
traditional dialectologists have described it (Niedzielski and Preston 2000). Though perceptual
and production maps often yield similar results, this need not be the case (Benson 2003).
It may be helpful to consider some examples. Preston‟s (1989) book serves as a
compilation of several of his preliminary folk linguistic studies (for others, see Preston 1999 and
Long and Preston 2002). One study focuses on the perceptions of regional variation from the
perspective of native Hawaiians. The goal of this early study was “to determine a method for
producing a generalized map from a number of individual, hand-drawn ones” (Preston 1989: 25).
An example of one such individual map can be found in Figure 6. Combining the maps of 35
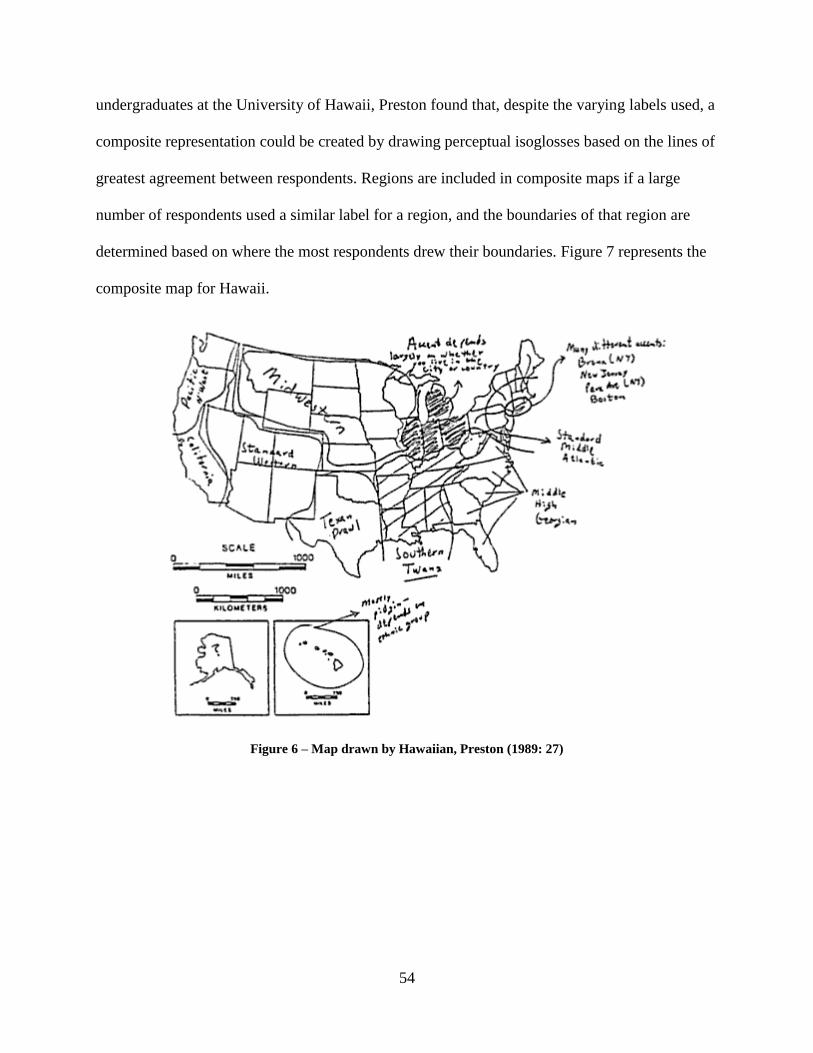
54
undergraduates at the University of Hawaii, Preston found that, despite the varying labels used, a
composite representation could be created by drawing perceptual isoglosses based on the lines of
greatest agreement between respondents. Regions are included in composite maps if a large
number of respondents used a similar label for a region, and the boundaries of that region are
determined based on where the most respondents drew their boundaries. Figure 7 represents the
composite map for Hawaii.
Figure 6 – Map drawn by Hawaiian, Preston (1989: 27)
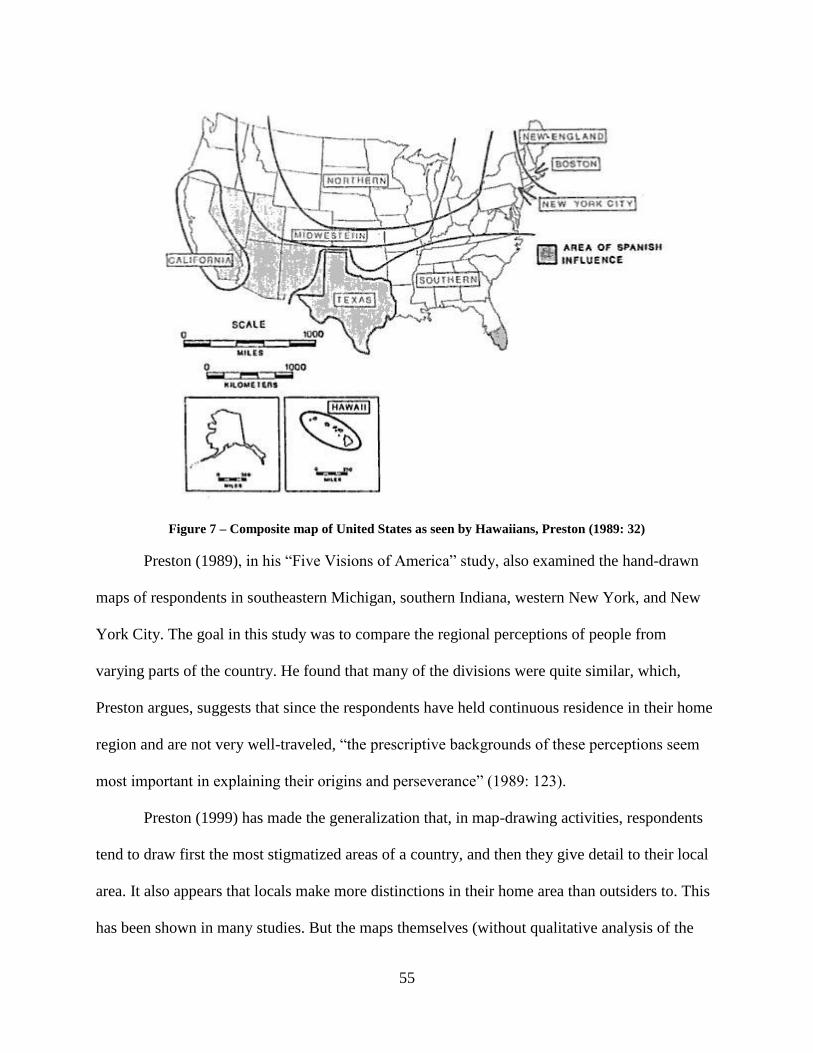
55
Figure 7 – Composite map of United States as seen by Hawaiians, Preston (1989: 32)
Preston (1989), in his “Five Visions of America” study, also examined the hand-drawn
maps of respondents in southeastern Michigan, southern Indiana, western New York, and New
York City. The goal in this study was to compare the regional perceptions of people from
varying parts of the country. He found that many of the divisions were quite similar, which,
Preston argues, suggests that since the respondents have held continuous residence in their home
region and are not very well-traveled, “the prescriptive backgrounds of these perceptions seem
most important in explaining their origins and perseverance” (1989: 123).
Preston (1999) has made the generalization that, in map-drawing activities, respondents
tend to draw first the most stigmatized areas of a country, and then they give detail to their local
area. It also appears that locals make more distinctions in their home area than outsiders to. This
has been shown in many studies. But the maps themselves (without qualitative analysis of the
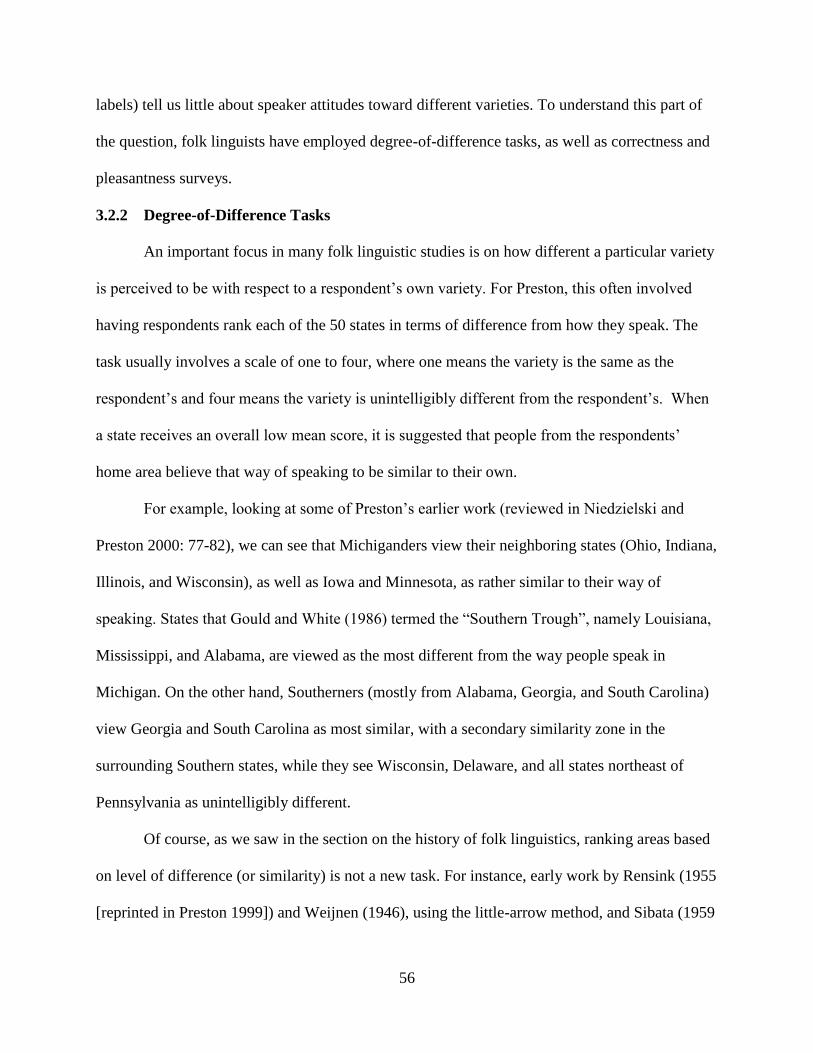
56
labels) tell us little about speaker attitudes toward different varieties. To understand this part of
the question, folk linguists have employed degree-of-difference tasks, as well as correctness and
pleasantness surveys.
3.2.2 Degree-of-Difference Tasks
An important focus in many folk linguistic studies is on how different a particular variety
is perceived to be with respect to a respondent‟s own variety. For Preston, this often involved
having respondents rank each of the 50 states in terms of difference from how they speak. The
task usually involves a scale of one to four, where one means the variety is the same as the
respondent‟s and four means the variety is unintelligibly different from the respondent‟s. When
a state receives an overall low mean score, it is suggested that people from the respondents‟
home area believe that way of speaking to be similar to their own.
For example, looking at some of Preston‟s earlier work (reviewed in Niedzielski and
Preston 2000: 77-82), we can see that Michiganders view their neighboring states (Ohio, Indiana,
Illinois, and Wisconsin), as well as Iowa and Minnesota, as rather similar to their way of
speaking. States that Gould and White (1986) termed the “Southern Trough”, namely Louisiana,
Mississippi, and Alabama, are viewed as the most different from the way people speak in
Michigan. On the other hand, Southerners (mostly from Alabama, Georgia, and South Carolina)
view Georgia and South Carolina as most similar, with a secondary similarity zone in the
surrounding Southern states, while they see Wisconsin, Delaware, and all states northeast of
Pennsylvania as unintelligibly different.
Of course, as we saw in the section on the history of folk linguistics, ranking areas based
on level of difference (or similarity) is not a new task. For instance, early work by Rensink (1955
[reprinted in Preston 1999]) and Weijnen (1946), using the little-arrow method, and Sibata (1959
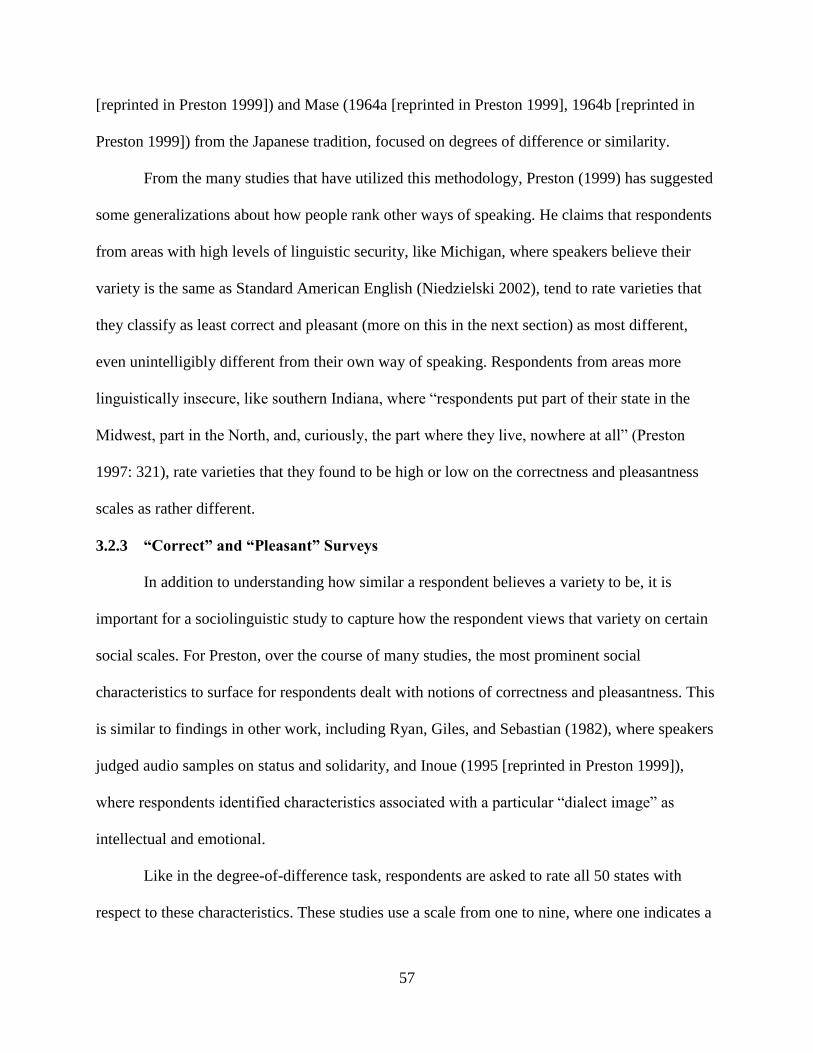
57
[reprinted in Preston 1999]) and Mase (1964a [reprinted in Preston 1999], 1964b [reprinted in
Preston 1999]) from the Japanese tradition, focused on degrees of difference or similarity.
From the many studies that have utilized this methodology, Preston (1999) has suggested
some generalizations about how people rank other ways of speaking. He claims that respondents
from areas with high levels of linguistic security, like Michigan, where speakers believe their
variety is the same as Standard American English (Niedzielski 2002), tend to rate varieties that
they classify as least correct and pleasant (more on this in the next section) as most different,
even unintelligibly different from their own way of speaking. Respondents from areas more
linguistically insecure, like southern Indiana, where “respondents put part of their state in the
Midwest, part in the North, and, curiously, the part where they live, nowhere at all” (Preston
1997: 321), rate varieties that they found to be high or low on the correctness and pleasantness
scales as rather different.
3.2.3 “Correct” and “Pleasant” Surveys
In addition to understanding how similar a respondent believes a variety to be, it is
important for a sociolinguistic study to capture how the respondent views that variety on certain
social scales. For Preston, over the course of many studies, the most prominent social
characteristics to surface for respondents dealt with notions of correctness and pleasantness. This
is similar to findings in other work, including Ryan, Giles, and Sebastian (1982), where speakers
judged audio samples on status and solidarity, and Inoue (1995 [reprinted in Preston 1999]),
where respondents identified characteristics associated with a particular “dialect image” as
intellectual and emotional.
Like in the degree-of-difference task, respondents are asked to rate all 50 states with
respect to these characteristics. These studies use a scale from one to nine, where one indicates a
58
variety that is least correct or least pleasant and nine indicates a variety is most correct or most
pleasant. This is similar to the practices of cultural geographers, like Gould and White (1986),
where respondents were asked to indicate areas of the country that were most desirable with
respect to residence.
An example from Preston‟s work (reviewed in Niedzielski and Preston 2000: 63-77)
shows that those same Michigan respondents discussed above have a rather high opinion of
themselves (as also revealed in other studies, like Niedzielski 2002). They rank their own variety
alone as the most correct variety and only rate four other states as high as Michigan on
pleasantness. They rate Southern states, particularly Alabama, rather low on correctness and
relatively low on pleasantness. On the other hand, Indiana respondents, who also rate Southern
states as low on correctness, tended to give high scores for pleasantness in those same states
(though these respondents were pretty generous with their pleasantness ratings; a large majority
of the country was rated at a six or higher). Southern respondents, being rather linguistically
insecure, rated their own varieties (at least for the Georgia and Alabama respondents) as lower in
terms of correctness than several other northern, eastern, and western states. They made the
further distinction that Texas, Louisiana, and Mississippi speak the least correct varieties,
confirming the generalization made about the mental maps that regional locals make more
distinctions within their home area. The Southern respondents also rated Alabama as the most
pleasant, with coastal southern states ranking as a secondary locus for pleasantness. They rank
northeastern states, like New York and New Jersey, as relatively low on the pleasantness scale.
The generalizations Preston (1999) has made about these surveys are: Respondents from
areas with high levels of linguistic security will rank their own variety as very correct and might
include other states in the classification of most pleasant; they tend to rank states as low on both
59
scales; respondents from linguistically insecure locales rate their own variety as most pleasant,
but they choose several location (not always their own) as most correct; they also usually
distinguish between the least correct and the least pleasant varieties.
3.2.4 Placing Voices
Another tool used in Preston‟s perceptual dialectology studies involves placing voices.
Given voices on a “dialect continuum” (in scrambled order) and a forced-choice set of locations,
respondents are asked to determine where the speaker comes from. This tool is seemingly the
most problematic in terms of value, as varying studies have shown different levels of accuracy
for respondents completing this type of task. For instance, while Preston (1993a) maintains that
subjects do relatively well at placing voices, a notion that has been supported by work on the
perception of vowels associated with the Southern Vowel Shift as Southern in Memphis
(Fridland, Bartlett, and Kreuz 2004, 2005) and by work on ethnic dialect identification (Purnell,
Idsardi, and Baugh 1999), others have found that respondents perform rather poorly on this task
(e.g. Williams, Garrett, and Coupland 1999, Clopper and Pisoni 2004).
Despite this possible controversy, this type of research is deemed important by Preston,
as we cannot make connections between regional dialects and language attitudes without
knowing the respondent‟s ability to identify where a voice belongs. That is,
unless we ask (and surprisingly few studies of language attitude have), we do not know
where the respondents believe the voice is from. A report might accurately state that
respondents had certain attitudes towards a South Midland voice sample, but the
respondents might have gone home believing that they had heard an Inland North one.
(Preston 1993a: 193)
60
Preston‟s most famous example of this task (discussed in Niedzielski and Preston 2000:
82-95, and elsewhere) involves the placement of voice samples from nine middle-class, middle-
aged male speakers from nine different locations on a north-south continuum from Saginaw,
Michigan to Dothan, Alabama. In addition to showing that nonlinguists are relatively good at
placing voices on this north-south dimension, Preston showed that respondents seem to
experience certain “minor” and “major” dialect boundaries that often resemble dialect
boundaries described in traditional dialectology. For instance, while his Michigan respondents
hear a major north-south boundary between sites #4 and #5 (Muncie, Indiana and New Albany,
Indiana, respectively), which approximately seems to coincide with the traditional boundary of
the South that runs alongside the Ohio River (e.g. Labov, Ash, and Boberg 2006), they also hear
a minor boundary between sites #6 and #7 (Bowling Green, Kentucky and Nashville, Tennessee,
respectively), which might replicate a distinction between “South Midland” and “Deep South”
dialects. On the other hand, his Indiana respondents hear two major dialect boundaries: one
between sites #2 and #3 (Coldwater, Michigan and South Bend, Indiana, respectively), and
another between sites #3 and #4 (South Bend, Indiana and Muncie, Indiana, respectively). The
first of these boundaries does not resemble those of traditional dialectology and perhaps indicates
a certain level of super-awareness of northernness associated with their sense of linguistic
insecurity. They also hear the boundary between sites #4 and #5 (Muncie, Indiana and New
Albany, Indiana, respectively), though for Indiana respondents, this is a minor boundary.
The main generalization Preston (1999) has drawn from this work as to do with the
already mentioned level of accuracy of respondents. But he also mentions that respondents from
different places hear the voices presented to them in varying ways. More specifically, his point is
that the “minor” and “major” boundaries he has discussed are different for different groups of
61
respondents, and hear them with different levels of intensity, “more often making more
distinctions closer to the local area and fewer in areas farther from the local area” (Preston 1999:
xxxv).
3.2.5 Qualitative Data
Finally, though briefly, I wish to mention the qualitative data that often accompanies
many folk linguistic studies. In many ways, this information can be more insightful than the
quantifications of the other folk linguistic tools. In many of Preston‟s studies, respondents are
asked to answer questions about the tasks they have completed. These questions often result in
open-ended conversations about language and variation, including discussions of the people who
speak certain varieties. Examples of this conversational data are discussed at length in
Niedzielski and Preston (2000).
While this type of data is often difficult to make generalizations about, Preston (1999),
does note some general trends in the conversational data. He claims that: 1) people mention face-
to-face encounters with people who speak other varieties more often than they mention popular
culture (i.e. television, movies, etc.) depictions of said varieties; 2) people often have trouble
explicitly detailing phonological (and other) features of certain dialects, and imitations of said
dialects can be accurate or inaccurate in many ways (Preston 1992); and 3) people tend to be
very concerned with correctness.
3.3 Folk Linguistics in Practice
Having considered the many tools of the trade, we can now examine the ways in which
these tools have been employed in numerous linguistic studies. While I focus on the information
relevant to the current study (namely, studies that examine American perceptions of dialects), I
also discuss some of the research that has taken place abroad, to get a sense of whether these
62
tools can be useful outside of the American context. In this section, I will go beyond Preston‟s
work to show how his students and others have engaged the Prestonian paradigm in new and
interesting ways. I also return to Preston‟s work to get a preliminary view of the Louisville
perspective of American dialects.
3.3.1 American Perspectives
In their comparison of folk linguistic perceptions in Memphis and Reno, Fridland and
Bartlett (2006) found that Memphians, like many Southerners, found their region to be generally
pleasant but relatively incorrect when compared to the north. The most incorrect states in the
region were the states that touch the southwest border of Tennessee, where Memphis is located.
What is interesting about this, however, is that while Mississippi and Arkansas were rated
significantly less correct than Tennessee, they were also rated as less different than Tennessee in
the degree-of-difference task.
Memphians rated the west as most pleasant, but the Reno residents did not return the
favor. In fact, Reno residents rated the South negatively on both correctness and pleasantness. A
high level of linguistic security associated with western dialects also surfaces in the Reno results,
as Westerners are seen as speaking significantly more correctly. Interestingly, they did not rank
Nevada as most correct, which the authors claim echoes Preston‟s (1989) southern Indiana
respondents, who seem to be linguistically insecure due to their proximity to the south. What is
Reno‟s reason for insecurity? Fridland and Bartlett claim Nevada‟s connection to illicit activities
like gambling might lead residents to rate it lower.
Fridland, Bartlett, and Kreuz (2004, 2005) also examined the folk perceptions in
Memphis. They were concerned with whether Memphians could determine which vowel variants
were Southern and which were not, using synthesized tokens from native Memphians as the
63
stimuli. The vowels used in the study were those representative of the Southern Vowel Shift (e.g.
Feagin 1986, Fridland 1998). In the 2004 article, the authors determined that Memphians were
more accurate at selecting tokens of front vowels, especially /ei/, as Southern. They claim there
is a strong connection between production and perception, as/ei/ has been shown (e.g. Fridland
1998) to be the most actively shifting vowel in Memphis, and it was the vowel most commonly
identified as Southern. They suggest that “the ability of participants to accurately rate differences
between vowel variants and assign scores appears to vary, depending on whether the local
community speech norms involve those particular variants and whether those variants are shared
with other regions” (Fridland, Bartlett, and Kreuz 2004: 13).
The later study (2005) focused on how Memphians rate these particular vowel variants in
terms of education and pleasantness. Examining specifically the front shift between /ei/ and /ɛ/,
as well as the back shift of /u/ and /oʊ/, the authors found that respondents found the non-
Southern variants of the front vowels to be significantly more educated and pleasant and favored
the traditionally positioned back vowels to the shifted ones. Additionally, all back vowels were
rated as more educated and more pleasant than all front vowels. The authors explain this
preference for back vowels by claiming that they resist regional categorization, as the shifting of
back vowels is more widespread (though the South leads the changes). But what the authors find
most interesting is that it is the vowel classes that respondents knew to have Southern variants
that they rated higher for education and pleasantness for the Northern variants. That is, the less
regional salience a token had for respondents, the more positive ratings it received.
Why, then, do the speakers use these variants, as has been shown in Fridland‟s (e.g.
2008) production research? We generally assume that speakers continue to use stigmatized forms
for other purposes like solidarity. But since these Memphians rated the vowels they use rather
64
low on both education and pleasantness, it is unclear what exactly is gained by using the forms.
The results here do not match the results in the 2004 study, which noted that speakers rated
Memphis as less educated by not less pleasant than the North. The authors blamed the odd
results in the 2005 article on the lab setting and the test instrument, but it is important to note that
studies focusing on folk perceptions and attitudes sometimes reveal conflicting pictures.
Hartley (2005) examined perceptions on the East Coast, discussing how Bostonians
struggle with two common stereotypes associated with people from their city: the educated elite
stereotype, exemplified by Boston Brahmins and Harvard professors, and the working-class,
descendant-of-immigrants stereotype, as portrayed in movies like Good Will Hunting. In her
study, Hartley used Multidimensional Scaling analysis, as well as k-means cluster analysis, to
show exactly how Bostonians perceive differences across the country. As might be expected,
Bostonians marked Massachusetts as being least different, while they considered Alabama to be
most different. They also tended to group Boston/Massachusetts with other traditionally New
English states for the degree-of-difference task, but they set it apart in the correctness and
pleasantness surveys. In fact, they did not rate Massachusetts as the highest on the correctness
scale, which indicates a level of linguistic insecurity that is not necessarily expected, given the
ratings Massachusetts receives from other Americans. But Hartley suggests that respondents are
rather aware of the two dominant stereotypes about the area, causing them to struggle with one
clear image of the city. This is exemplified by the conflict represented in their maps and surveys
which indicate both levels of linguistic security and insecurity.
Hartley (1999) also conducted folk linguistic research on the West Coast, examining the
perceptions of Oregonians, where little work had been conducted. Using mental maps, degree-of-
difference tasks, and correctness and pleasantness surveys, the author determined that, as in
65
many studies, the South was the most salient region, which was also, as in many studies, ranked
low for correctness but high for pleasantness.
3.3.2 Individual State Perspectives
Whereas many of the early folk linguistic studies elicited perceptions about the entire
country, some recent studies have focused attention on smaller areas within the United States.
Benson (2003), for example, examined the perceptions of speakers from Ohio, surveying people
from cities in four different regions of the state. Respondents received a map consisting only of
Ohio and its bordering states on which to draw distinct linguistic regions. Looking specifically at
how Ohioans categorize varieties spoken within Ohio, her research shows that distinctions can
be made on a smaller map. Benson was able to show how people from different portions of the
state perceive Ohio‟s position on the regional map differently, based on their experiences.
Specifically, in relation to Kentucky and Preston‟s (1989) southern Indiana respondents, she
showed that southern Ohio residents rate Kentucky similarly on the degree-of-difference task but
do not include it with Ohio in their mental maps, where all respondents marked the boundary of
the south along the Ohio River. In this way, Benson claims, “The respondents from southeast-
central and southern Ohio are more like Preston‟s linguistically insecure southern Indiana
respondents” (Benson 2003: 323).
Bucholtz et al. (2007), following Fought (2002), did a similar investigation into the
perceptions of another state: California. Having students in a low-level sociolinguistics class at a
university in California complete the map drawing task, the researchers were able to show that
students were very aware of a north-south border within their state. Quite often, the northern part
of the state was labeled as standard or normal, while the southern portion tended to be negatively
evaluated, mirroring the north-south distinctions made in the eastern part of the country. In
66
Bucholtz et al. (2008), this is further emphasized by the fact that, when asked where people
speak the best/worst in California, respondents consistently marked southern California as the
worst, stigmatized variety and northern California was considered the best. This sentiment is
even sometimes shared by southern California residents themselves, which parallels the
sentiments of people in the American South who, according to Lippi-Green (1997), have long
suffered from the linguistic subordination of the north, eventually accepting their place as a
lesser variety.
These studies, conducted in response to the fact that little research has been done on
perceptions within the American West and that ideas about the West are less fully developed in
studies examining the country as a whole, are interesting because California is the center of the
entertainment world, making it a center for new trends, including linguistic ones. Also, since
many of the respondents themselves were white residents of southern California, many of the
traditional stereotypes (like surfer dude and Valley girl) do not show up in the labels, as they
might be considered unmarked categories. Overall, these individual state studies provide a more
detailed picture of the local scene than studies focused on national level differences.
3.3.3 Global Perspectives
Turning now to the ways in which folk linguistic research in the Prestonian paradigm has
flourished outside of the United States, we turn to Dailey-O‟Cain‟s (1999) work in post-
unification Germany. Given a list of different varieties of German, respondents were asked to
rate them in terms of correctness, pleasantness, and similarity to their own dialect. Additionally,
respondents completed a mental map. Results indicate that residents of the former West
Germany view their and other western varieties as significantly more correct and pleasant than
eastern varieties. For residents of the former East Germany, there was no significant difference
67
between eastern and western varieties in terms of correctness, but they perceived western
varieties to be more pleasant. While this does not exactly mirror the north-south division in the
United States, it is clear that former East Germans experience some level of linguistic insecurity
similar to that felt in the American South. The boundary between them, which had been a
physical boundary, was even pronounced in their mental maps, suggesting the respondents still
view their country in these east-west terms.
In Wales, Williams, Garrett, and Coupland (1999) discussed the ability of speakers to
correctly identify dialects, emphasizing the importance of making a connection between
production studies and perception research. The authors collected stories from schoolchildren at
14 sites in Wales. Thirty-second excerpts of these stories were played, at random, to other
children, as well as teachers, in other schools in the same regions as the samples had been
collected. Respondents were asked questions about the speakers, including where they thought
the speakers were from, given a set of locations. Results indicated that teachers were more
successful than students in correctly identifying where the speakers were from, though the
accuracy rates tended to be rather low. For instance, the adolescents in the study were able to
correctly identify speakers only 20-44% of times. Additionally, respondents varied widely on
their ability to correctly identify a speaker who was from his or her own region. For example,
while one speaker from Cardiff was correctly identified each time by other Cardiff residents, a
speaker from the Valleys was only correctly identified by other residents of the Valleys 13.8% of
the time. These results suggest that respondents, particularly young ones (who likely have less
travel and residential experience), may not do very well with dialect recognition tasks.
68
3.3.4. New Directions in Folk Linguistics
Additionally, there are some studies that have taken folk linguistics in some very
interesting directions. For example, Niedzielski (1999) looked at the effect of social information
on perception. In her study, Niedzielski provided respondents with a voice sample and several
synthesized vowels, asking respondents to select which synthesized vowel best matched the
original voice sample. The speech was taken from a native of Detroit, and all respondents were
also Detroiters. What changed between respondents was whether they were told that the speaker
was from Detroit, or whether Niedzielski had given them false social information by telling them
that the speaker was from Canada.
This is an interesting study because, based on what we know about the Northern Cities
Shift and Canadian Raising (e.g. Labov, Ash, and Boberg 2006), Detroiters shares some vowel
characteristics with Canadians. However, Detroiters (and Michiganders, in general) are known to
think they speak the standard variety of English (Niedzielski 2002). Previous language attitude
surveys in Michigan indicate that speakers have negative stereotypes about Canadians, based
mostly on certain features of Canadian Rising, even though those features are also present in
their dialect.
Her results indicate that “…listeners „hear‟ the stereotyped raised variant if the speaker
fits the social description of someone who is expected to raise it – that is, someone from Canada”
(Niedzielski 1999: 69). Thus, the respondents are clearly relying more on the social information
than on the actual phonetic cues. An additional fact that supports this claim is that, when
respondents were told the speaker was from Michigan, they were more likely to select the
hyperstandardized token as being representative of Michigan speech, pointing again to the
stereotype Michiganders are thought to hold about their own speech.
69
Another study, still examining overall perceptions of the United States, examined the
effect of early linguistic experience as it relates to residential history on dialect perception.
Clopper and Pisoni (2004) examined the perceptions of “homebodies”, or people who had lived
their entire lives in one state (namely, Indiana), and those of “army brats”, or those who had
lived in three or more places. In a forced-choice test, respondents were asked to place a voice in
its appropriate region. The results indicated that the “army brats” performed better than the
“homebodies”, suggesting that early linguistic experience does impact one‟s ability to accurately
classify dialects.
But their results indicate that the overall categorization accuracy for both groups was
barely about chance. So, even though they suggest that history of residence in a given region
provides some additional knowledge that helps respondents accurately classify dialects, the
authors indicate a lack of trust in the methodology, citing similar results in Williams, Garrett, and
Coupland (1999).
Yet, as Purnell, Idsardi, and Baugh (1999) show, it appears that at least some people are
able to classify certain dialects based on as little as one word. In attempting to show that many
African-Americans and Latinos face housing discrimination in California, the authors found that
speakers of African-American Vernacular English (AAVE) and Chicano English were more
likely to be discriminated against in traditionally white neighborhoods. Using a matched-guise
technique, where John Baugh (a tridialectal speaker) left messages with potential landlords in
AAVE, Chicano English, and Standard English, they found that the non-standard dialects were
less likely to be called back for an appointment by landlords in traditionally white areas.
To further prove their point, they had additional listeners try to guess the ethnicity of the
speaker, given one of the three guises that had been presented to landlords. Listeners were able to
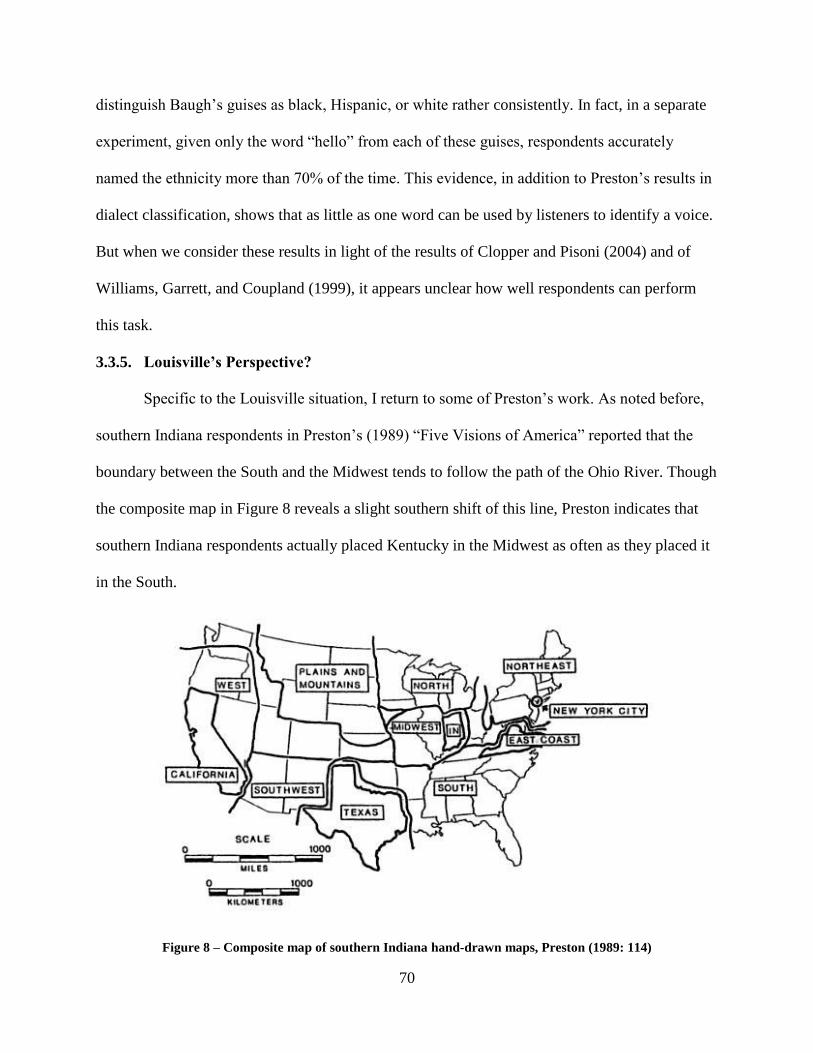
70
distinguish Baugh‟s guises as black, Hispanic, or white rather consistently. In fact, in a separate
experiment, given only the word “hello” from each of these guises, respondents accurately
named the ethnicity more than 70% of the time. This evidence, in addition to Preston‟s results in
dialect classification, shows that as little as one word can be used by listeners to identify a voice.
But when we consider these results in light of the results of Clopper and Pisoni (2004) and of
Williams, Garrett, and Coupland (1999), it appears unclear how well respondents can perform
this task.
3.3.5. Louisville’s Perspective?
Specific to the Louisville situation, I return to some of Preston‟s work. As noted before,
southern Indiana respondents in Preston‟s (1989) “Five Visions of America” reported that the
boundary between the South and the Midwest tends to follow the path of the Ohio River. Though
the composite map in Figure 8 reveals a slight southern shift of this line, Preston indicates that
southern Indiana respondents actually placed Kentucky in the Midwest as often as they placed it
in the South.
Figure 8 – Composite map of southern Indiana hand-drawn maps, Preston (1989: 114)
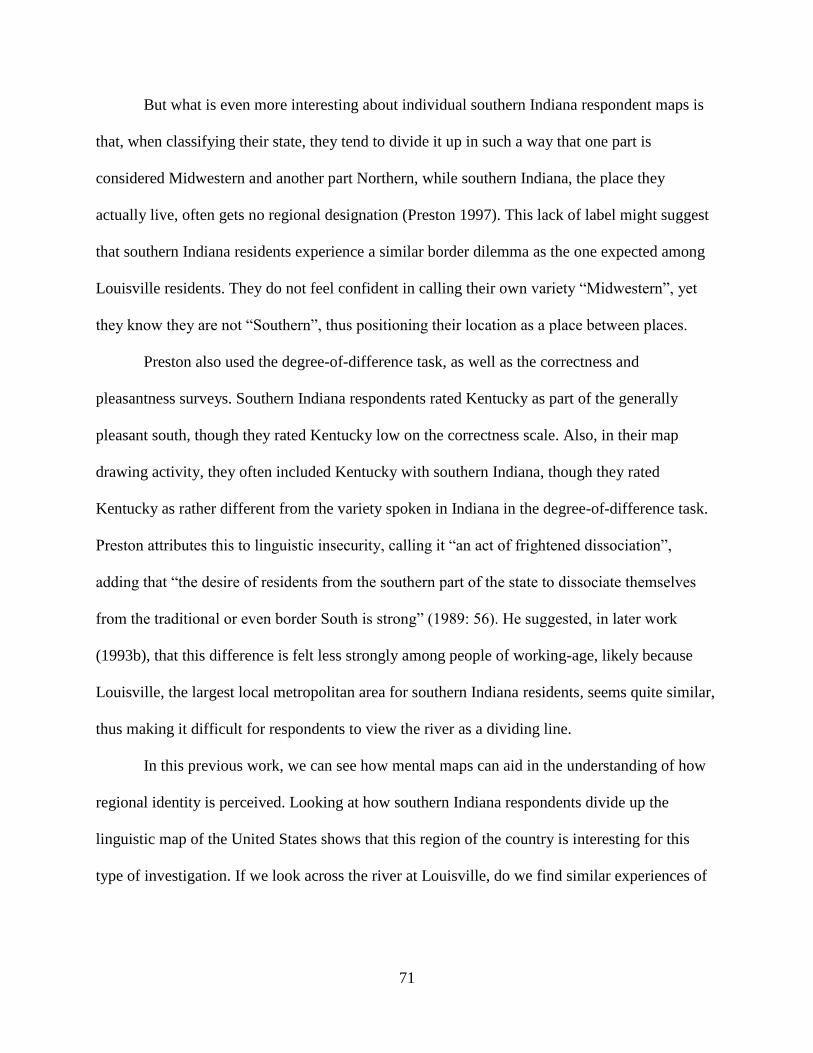
71
But what is even more interesting about individual southern Indiana respondent maps is
that, when classifying their state, they tend to divide it up in such a way that one part is
considered Midwestern and another part Northern, while southern Indiana, the place they
actually live, often gets no regional designation (Preston 1997). This lack of label might suggest
that southern Indiana residents experience a similar border dilemma as the one expected among
Louisville residents. They do not feel confident in calling their own variety “Midwestern”, yet
they know they are not “Southern”, thus positioning their location as a place between places.
Preston also used the degree-of-difference task, as well as the correctness and
pleasantness surveys. Southern Indiana respondents rated Kentucky as part of the generally
pleasant south, though they rated Kentucky low on the correctness scale. Also, in their map
drawing activity, they often included Kentucky with southern Indiana, though they rated
Kentucky as rather different from the variety spoken in Indiana in the degree-of-difference task.
Preston attributes this to linguistic insecurity, calling it “an act of frightened dissociation”,
adding that “the desire of residents from the southern part of the state to dissociate themselves
from the traditional or even border South is strong” (1989: 56). He suggested, in later work
(1993b), that this difference is felt less strongly among people of working-age, likely because
Louisville, the largest local metropolitan area for southern Indiana residents, seems quite similar,
thus making it difficult for respondents to view the river as a dividing line.
In this previous work, we can see how mental maps can aid in the understanding of how
regional identity is perceived. Looking at how southern Indiana respondents divide up the
linguistic map of the United States shows that this region of the country is interesting for this
type of investigation. If we look across the river at Louisville, do we find similar experiences of
72
linguistic insecurity? Do we find similar divisions? The examination of Louisvillians‟ mental
maps will indicate the level to which they experience the Ohio River as a border.
One piece of data, taken from Preston (1989), which might show more clearly that this
type of mental mapping technique will be beneficial in an examination of Louisville, is a single,
hand-drawn map by a young, white, college-enrolled female from Louisville. This map can be
found in Figure 9.
Figure 9 – Individual hand-drawn map of a Louisvillian, Preston (1989: 128)
In this section of his book, Preston examines some future prospects for research in the
folk dialectology tradition. He uses the Louisville map to show how his template for perceptual
areas of the country (see Chapter 4) can create a consistent understanding of varieties, regardless
of the individual labels selected by participants, insuring comparable perceptual maps in
different areas. He claims that her labels Western Drawl, Midwest, Great Lakes, „Same slight
Country Inflection I Have‟, Country/Hillbilly, New England, and Southern correspond to
Northwest, Western, North, Midwest, Outer South, New England, and South, respectively, in the
73
template. Being able to categorize her labels makes the creation of a composite map easier and
allows for comparison of composite maps in different areas of the country.
But because the current project is focused on Louisville in particular, we can look more
precisely at how this one speaker divides up the country. Her line between Country and „Same
slight Country Inflection I Have‟ actually seems to run directly through Louisville. This might
suggest that she experiences the border in this area; however, she indicates that one of these
groups, particularly the one north of the Ohio River, which lines up to the Midwest category in
the template, speaks the same as she does, thus aligning herself with a Midwestern dialect group.
Also, the labels she uses for Kentucky varieties, like Country and Hillbilly, as opposed to
other labels used in the rest of the South, like Southern and Distinctive “Soft” Southern, express
negative connotations for those varieties. It seems this speaker has selected these labels as a
means for distinguishing herself from the poor English she perceives among other Kentuckians.
Since the goal of showing this map was not to delve deeply into the folk perceptions of
Louisvillians, we do not have additional attitudinal data to support this claim, but it appears that
this speaker draws the same distinction between Midwestern and Southern varieties as traditional
dialectologists but seemingly places Louisville within the Midwestern region. While we cannot
make generalizations based on one map, this map suggests that the data collected in the
Louisville area will be beneficial to the study of language attitudes and the perception of regional
identity.
4 Discussion
Overall, folk dialectology can serve as a good corollary to production studies and
language attitude surveys. Despite the fact that folk notions have largely been ignored,
considered incidental, or have been presented as anecdotal (see Preston 1989, 1993b), work in
74
the field reveals that perceptions can be systematically collected and analyzed (Niedzielski and
Preston 2000).
To summarize, this theoretical framework will aid in our understanding of Louisville‟s
place in the regional and dialectal landscape of the United States from the perspective of
Louisvillians. While Preston (1989) has examined the population just across the Ohio River in
southern Indiana, Louisville has not been included in folk dialectology research. By combining
many aspects of the methodologies in folk linguistic research, I show how Louisville is located at
a very interesting border, where identity alignments are anything but straightforward.
In the next chapter, I describe Louisville as an area of interest, discussing in particular
how Louisville is positioned at many types of borders. I examine the geographical, political,
linguistic, historical, cultural, and perceptual facts that position Louisville as located between
Southern and non-Southern regional representations.
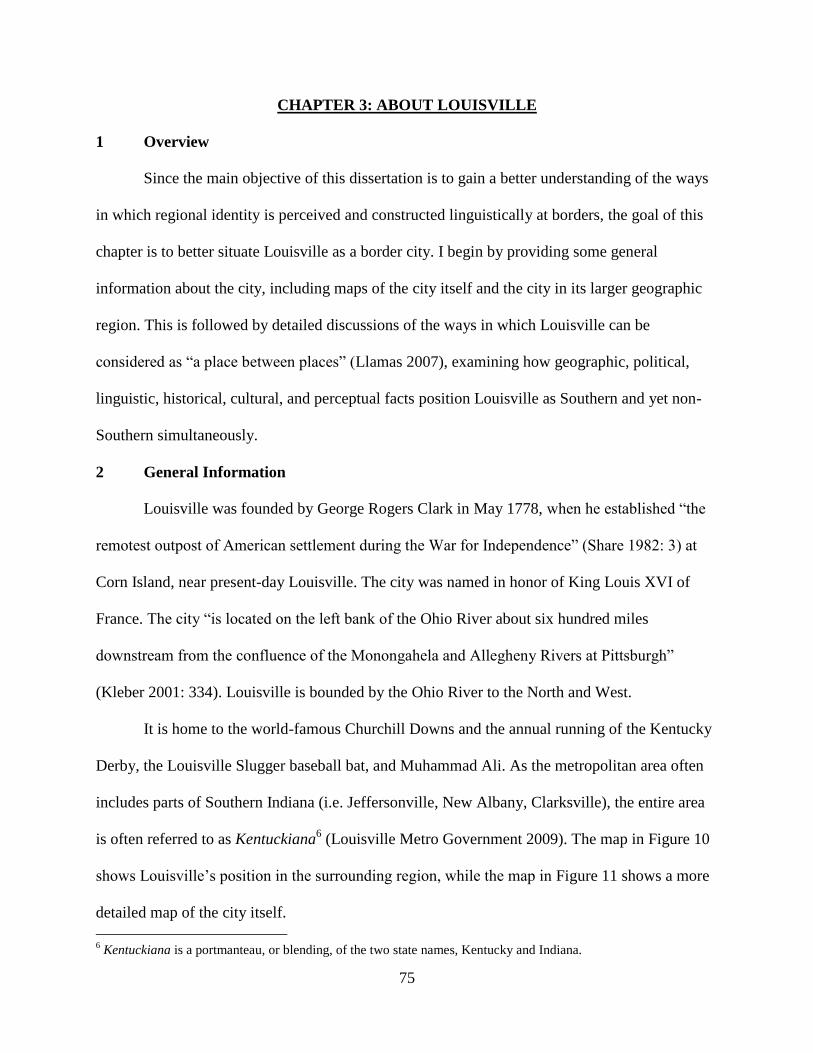
75
CHAPTER 3: ABOUT LOUISVILLE
1 Overview
Since the main objective of this dissertation is to gain a better understanding of the ways
in which regional identity is perceived and constructed linguistically at borders, the goal of this
chapter is to better situate Louisville as a border city. I begin by providing some general
information about the city, including maps of the city itself and the city in its larger geographic
region. This is followed by detailed discussions of the ways in which Louisville can be
considered as “a place between places” (Llamas 2007), examining how geographic, political,
linguistic, historical, cultural, and perceptual facts position Louisville as Southern and yet non-
Southern simultaneously.
2 General Information
Louisville was founded by George Rogers Clark in May 1778, when he established “the
remotest outpost of American settlement during the War for Independence” (Share 1982: 3) at
Corn Island, near present-day Louisville. The city was named in honor of King Louis XVI of
France. The city “is located on the left bank of the Ohio River about six hundred miles
downstream from the confluence of the Monongahela and Allegheny Rivers at Pittsburgh”
(Kleber 2001: 334). Louisville is bounded by the Ohio River to the North and West.
It is home to the world-famous Churchill Downs and the annual running of the Kentucky
Derby, the Louisville Slugger baseball bat, and Muhammad Ali. As the metropolitan area often
includes parts of Southern Indiana (i.e. Jeffersonville, New Albany, Clarksville), the entire area
is often referred to as Kentuckiana6 (Louisville Metro Government 2009). The map in Figure 10
shows Louisville‟s position in the surrounding region, while the map in Figure 11 shows a more
detailed map of the city itself.
6 Kentuckiana is a portmanteau, or blending, of the two state names, Kentucky and Indiana.
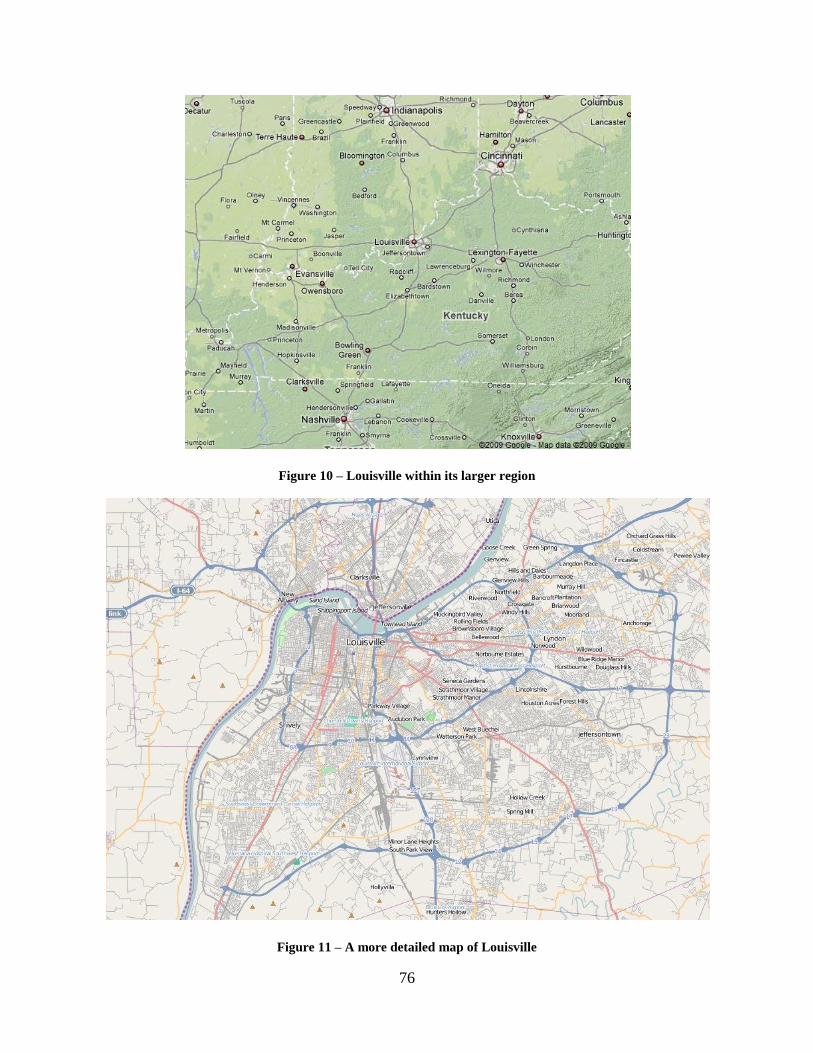
76
Figure 10 – Louisville within its larger region
Figure 11 – A more detailed map of Louisville
77
With a population of over 700,000, Louisville is the largest city in Kentucky, a fact which
has been true since 1830, when Louisville surpassed Lexington as the dominant urban center in
the state (Share 1982). This number includes both the inner-city and the suburban populations,
since the Louisville and Jefferson County governments merged in 2003 to become Louisville
Metro, one of the 20 largest cities in the country (Louisville Metro Government 2009).
Descriptions of Louisville‟s location in the landscape of the United States vary, though it
is often positioned just south of a North-South regional border in the United States. The city has
been called “America‟s southernmost northern city and its northernmost southern city”
(Emporis.com 2009). Another description takes geography as the starting point, but turns to other
explanations in pointing out the complex nature of regionality in the area:
In a larger geographic sense, Louisville lies at the western limits of the Outer Bluegrass
physiographically, and, as a town, between the Midwest and the South culturally. This
latter situation was reinforced by a large electric sign that was located for many years at
the southern end of the Clark Memorial Bridge on the Louisville Gas and Electric Power
Plant proudly proclaiming Louisville as the “Gateway to the South.” (Kleber 2001: 335)
These kinds of depictions, as well as other geographical, political, linguistic, historical,
cultural, and perceptual facts point to Louisville‟s position as a border town. The following
sections further discuss this border nature.
3 At a Geographic and Political Border
Historically, geographical borders served as barriers to contact between people.
Mountains and rivers provided natural protection from outside influences, good or bad. In a more
connected, more mobile, globalized world, perhaps this role for geographical borders is outdated.
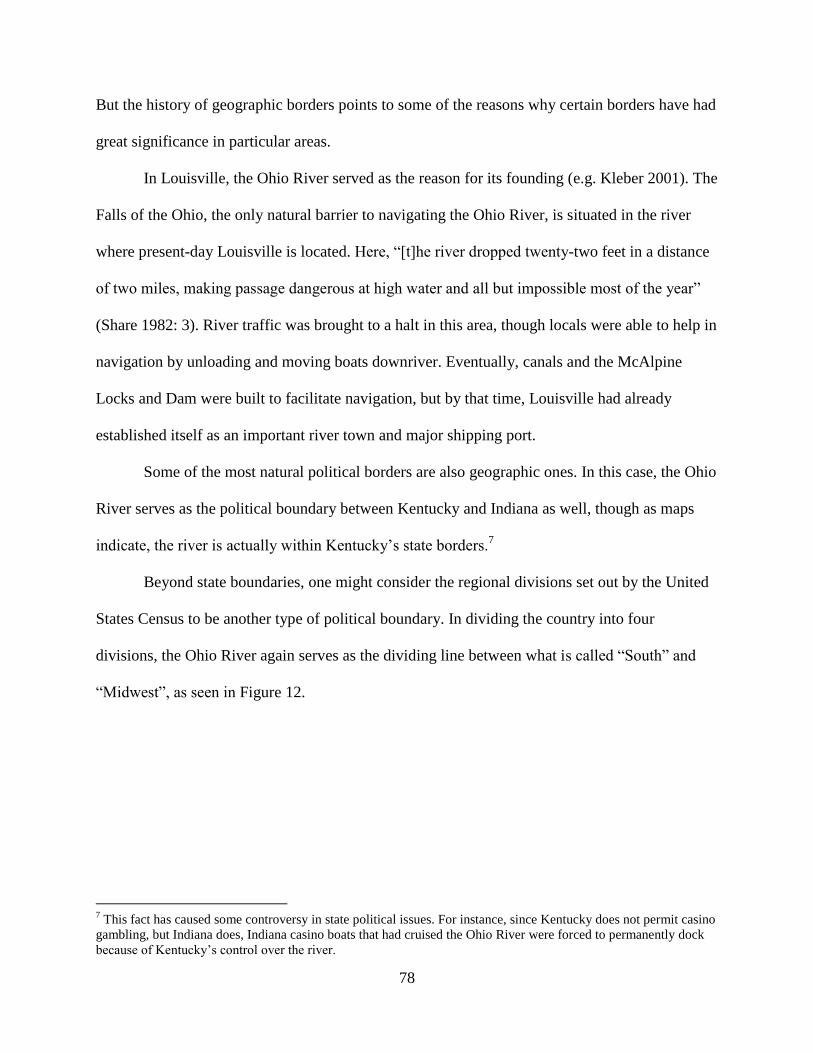
78
But the history of geographic borders points to some of the reasons why certain borders have had
great significance in particular areas.
In Louisville, the Ohio River served as the reason for its founding (e.g. Kleber 2001). The
Falls of the Ohio, the only natural barrier to navigating the Ohio River, is situated in the river
where present-day Louisville is located. Here, “[t]he river dropped twenty-two feet in a distance
of two miles, making passage dangerous at high water and all but impossible most of the year”
(Share 1982: 3). River traffic was brought to a halt in this area, though locals were able to help in
navigation by unloading and moving boats downriver. Eventually, canals and the McAlpine
Locks and Dam were built to facilitate navigation, but by that time, Louisville had already
established itself as an important river town and major shipping port.
Some of the most natural political borders are also geographic ones. In this case, the Ohio
River serves as the political boundary between Kentucky and Indiana as well, though as maps
indicate, the river is actually within Kentucky‟s state borders.7
Beyond state boundaries, one might consider the regional divisions set out by the United
States Census to be another type of political boundary. In dividing the country into four
divisions, the Ohio River again serves as the dividing line between what is called “South” and
“Midwest”, as seen in Figure 12.
7 This fact has caused some controversy in state political issues. For instance, since Kentucky does not permit casino
gambling, but Indiana does, Indiana casino boats that had cruised the Ohio River were forced to permanently dock
because of Kentucky‟s control over the river.
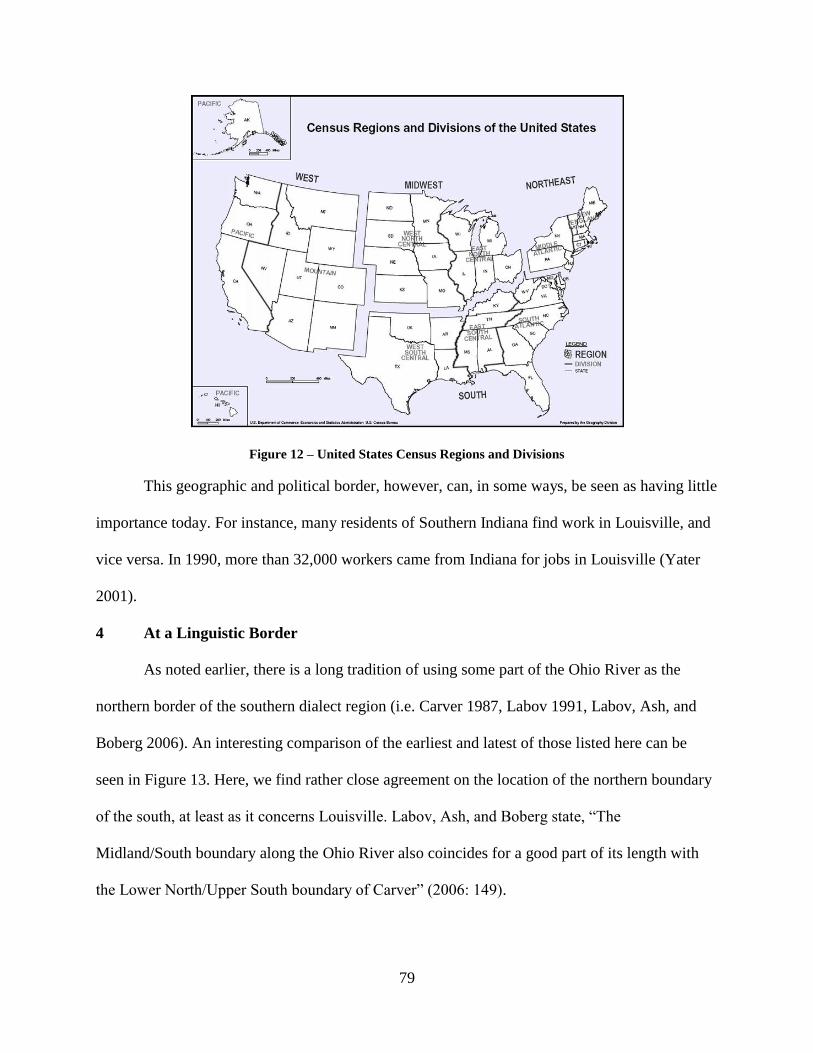
79
Figure 12 – United States Census Regions and Divisions
This geographic and political border, however, can, in some ways, be seen as having little
importance today. For instance, many residents of Southern Indiana find work in Louisville, and
vice versa. In 1990, more than 32,000 workers came from Indiana for jobs in Louisville (Yater
2001).
4 At a Linguistic Border
As noted earlier, there is a long tradition of using some part of the Ohio River as the
northern border of the southern dialect region (i.e. Carver 1987, Labov 1991, Labov, Ash, and
Boberg 2006). An interesting comparison of the earliest and latest of those listed here can be
seen in Figure 13. Here, we find rather close agreement on the location of the northern boundary
of the south, at least as it concerns Louisville. Labov, Ash, and Boberg state, “The
Midland/South boundary along the Ohio River also coincides for a good part of its length with
the Lower North/Upper South boundary of Carver” (2006: 149).
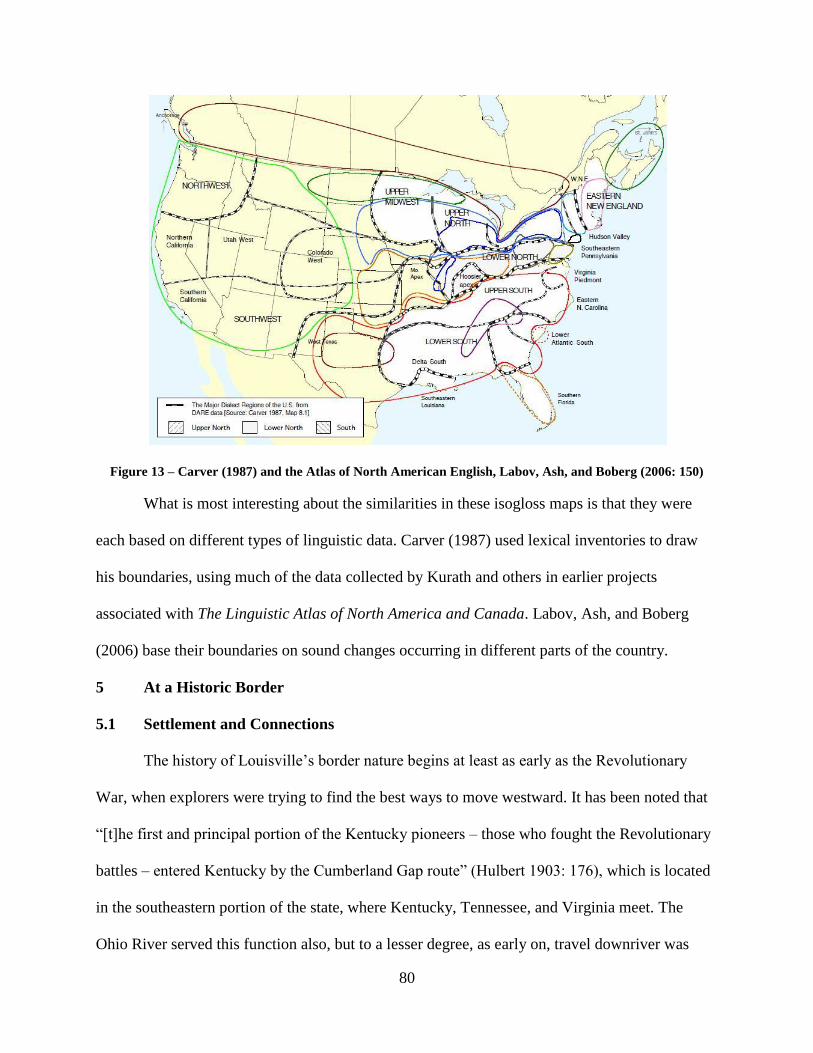
80
Figure 13 – Carver (1987) and the Atlas of North American English, Labov, Ash, and Boberg (2006: 150)
What is most interesting about the similarities in these isogloss maps is that they were
each based on different types of linguistic data. Carver (1987) used lexical inventories to draw
his boundaries, using much of the data collected by Kurath and others in earlier projects
associated with The Linguistic Atlas of North America and Canada. Labov, Ash, and Boberg
(2006) base their boundaries on sound changes occurring in different parts of the country.
5 At a Historic Border
5.1 Settlement and Connections
The history of Louisville‟s border nature begins at least as early as the Revolutionary
War, when explorers were trying to find the best ways to move westward. It has been noted that
“[t]he first and principal portion of the Kentucky pioneers – those who fought the Revolutionary
battles – entered Kentucky by the Cumberland Gap route” (Hulbert 1903: 176), which is located
in the southeastern portion of the state, where Kentucky, Tennessee, and Virginia meet. The
Ohio River served this function also, but to a lesser degree, as early on, travel downriver was
81
thought to be dangerous, not only for the conditions of the river itself but also because of “the
terrifying menace posed by the Indians” (Share 1982: 4). As we will see, however, the Ohio
River would prove to be the major factor in Louisville‟s success.
Kentucky became a state in 1792, which “started a fresh influx of settlers into the
territory and both the Wilderness Road through the Gap and the broad waterway of the Ohio
were thronged with hordes of homesteaders” (McMeekin 1945: 32). Additionally, from the
South, Louisville was the first port encountered upriver from New Orleans, thus serving as a port
of entry for foreign goods (Share 1982).
After the Civil War, Pittsburgh began shipping more coal downriver, as Louisville began
shipping lime upriver (Kleber 2001). Louisville became a regional distribution hub for flour,
pork, tobacco, and other products headed south, and cotton, sugar, rice, and other products
headed north (Share 1982). This increased the contact between northerners arriving via the Ohio
and southerners arriving via the Cumberland Gap. Though trade served as one of the main
catalysts for contact, northerners had long been migrating to Louisville (Turner 1911).
Thus, Louisville gained early success because of natural geographic advantages
associated with the Ohio River, its proximity to established communities like Lexington and
Cincinnati, and its location on the booming commerce highway. It further benefitted from the
invention of the steam engine. By 1830, Louisville was the center of the steamboat industry, and
river traffic increased (Share 1982). As Yater notes, “If the river made Louisville a town, the
steamboat made Louisville a city” (Yater 2001: xvi).
But soon the rail would take over as the preferred mode of transporting goods.
Recognizing this trend, and fearing a loss of power to upriver rival Cincinnati, Louisville sought
a connection to its neighbor to the south, Nashville. “A railroad to the South would enable
82
Louisville to break through its commercial isolation when the Ohio was impassable, to neutralize
rival Nashville, and to gain the jump on Cincinnati in the quest for southern markets” (Share
1982: 36-37). This brought the creation of the L&N Railroad, which was completed to Nashville
in 1859, establishing Louisville as “the Gateway to the South” (Share 1982: 37).
5.2 The Civil War and its Consequences
During the American Civil War, Louisville‟s position on the Ohio River further added to
the dichotomy experienced by residents. Louisville (and the rest of the state) was divided on the
issue of slavery. This difficult position can be partially exemplified by a few facts. Kentucky was
the only state to be officially represented at some point on both the Union and Confederate flags.
Additionally, both the President of the Union, Abraham Lincoln, and the President of the
Confederacy, Jefferson Davis, were Kentuckians (McMeekin 1945).
Because of these facts, some suggested that Kentucky should serve as mediator between
the states, be impartial, and help restore peace. The state legislature declared neutrality in the
war, which meant that the state chose not to align with the North or the South. When the
Secretary of War requested four regiments of troops from Kentucky, the governor, Beriah
Magoffin replied, “I say emphatically Kentucky will furnish no troops for the wicked purpose of
subduing her sister Southern States” (McMeekin 1945: 128). Additionally, Governor Magoffin
declined a similar request from the Confederate forces.
Even though, as Yater notes, “As a border city in a slave state with commercial ties to the
North as well as the South, Louisville attempted for a short while to adopt a neutral stance”
(2001: xix), both pro-Union and pro-Confederacy factions existed in Louisville (Beach 1995).
Flags from both sides were flown on houses and businesses in the city. The two major
newspapers in the city, The Courier and The Journal, differed in their support: while The
83
Courier supported the South, The Journal supported the North8 (McMeekin 1945). Despite this
seemingly divided stance, Union army recruits outnumbered Confederate ones by three to one
(Yater 2001).
This division, Kleber claims, came about because of the particular geography of the
place, noting, “Located at the top of the South, it is separated by only a mile of water from the
Midwest. Located in a slave state, it always faced south but it could never completely ignore the
free territory at its back, although it did its best to do so” (2001: xi). This location also made it
easy for pro-Union men in Louisville to simply cross into northern territory, causing a breach of
Kentucky‟s neutrality as Kentucky men joined the Union forces. Pro-Confederate men also
crossed borders to join the cause.
During the war, there was a federal ban on trade with the South, which caused great
difficulty for Louisville‟s economy (Yater 2001). After the war, the editor at the Louisville Daily
Journal suggested a need to resume trade with the South as soon as possible. To do so, a group
of traveling salesmen known as drummers, many of whom were ex-Confederates, was
established because “the community‟s merchants recognized that the city‟s „southernness‟ could
be an important psychological weapon in the battle with Cincinnati for the trade of the South”
(Share 1982: 68). Thus, when dealing with southern customers, Louisville‟s location within a
former slave state was emphasized, and Cincinnati was positioned as a Yankee town (Share
1982, Yater 2001).
Louisville‟s rivalry with Cincinnati escalated when the Southern Commercial Convention
was hosted in Cincinnati. As Henry Watterson, editor of the Courier-Journal, fumed:
to locate a Southern Convention there is doing violence to all outline maps of geography,
common sense, history, and decency. There is nothing Southern in or about Cincinnati. In
8 Later, the two papers merged to become The Courier-Journal, which is the current newspaper in the city.
84
all the broad Southern land it is on record that Cincinnati is Southern, precisely as the
carpet-baggers are Southern. She now reaches out her long, bony fingers…for Southern
dollars and cents, just as she reached them out during the war for Southern cotton and
Southern plantations. (quoted in Share 1982: 69)
In 1883, however, Louisville got its chance to shine as a beacon of commercialism in the
South. Louisville hosted the Southern Exposition, a small, annual business fair, which “was
meant to promote Louisville‟s developing industrial economy and its ability to serve as a
transportation link between the North and the South” (Findling 2009: 52). The goal of this
exposition was to strengthen Louisville‟s ties with traders in the North and South, in order to
continue in its position as a gateway city.
6 At a Cultural Border
Louisville seems to stand apart from the rest of the state in many respects. Many
depictions of the distinction place more emphasis on the rural-urban division within the state.
Early on, the state had relatively few urban centers, of which Louisville was one. Share notes,
“By 1815 two societies had emerged in Kentucky, one rural and one urban, with distinct patterns
of life, institutions, habits, and modes of thought” (1982: 20). In describing these patterns of life,
however, Share also notes that the cultural fare of Louisville varied, including activities like
horse racing, dancing, and theatrical productions, which were typically associated with wealth
and urbanity, as well as other less refined activities like card playing, barbecues, and billiards,
which seemed to be associated more with the non-wealthy. This establishes, in addition to the
rural-urban division within the state, a class divide within the city. I would argue that the
wealthy, urban practices above might also be associated with northernness, while, to a lesser
degree, the other practices could be described as southern practices.
85
Much like many Northern cities, and unlike the typically Protestant South, Louisville has
a large population of Roman Catholics. As of 2000, the entire state boasted only 100.5 Roman
Catholics per thousand people, though Jefferson County more than doubled that number, with
226.3 Roman Catholics per thousand. Catholics represent the largest religious group in
Louisville, while Kentucky as a whole has a larger percentage of Southern Baptist adherents
(The Association of Religion Data Archive 2009). Thus, Louisville has been described as “one of
the few heavily Catholic urban areas in the American South” (Kleber 2001).
This has not always been the case. In 1845, there was a large influx of immigrants from
Ireland, because of the potato famine, and from Germany, because of a failed revolution, who
arrived in Louisville. These immigrants, largely Catholic, changed the predominantly Protestant
face of the city. Unfortunately, the political climate, which saw the rise of the Know-Nothings in
the 1850s, led to violence against these Catholics, culminating in what has been called “Bloody
Monday,” a riot which killed at least 22 (Yater 2001).
Historically, the Catholic Church in Louisville has a rich and important history in terms
of American Catholicism. While the first church established in Louisville was Episcopalian, the
Catholics were not far behind. The Diocese of Baltimore was the first and only Catholic diocese
in the United States until Pope Pius VII added Bardstown, Kentucky as a diocese, spanning a
large portion of the middle of the country. Eventually, the See, or administrative center, was
transferred to Louisville (McMeekin 1945).
Politically, more democrats can be found in Louisville, whereas the rest of the state tends
to be more conservative. In the 2004 presidential election, for instance, only 48.78% of ballots
cast in Jefferson County went to Bush/Cheney, whereas they pulled 59.55% of the ballots cast in
the rest of the state. Additionally, in a 2004 Senate race, Louisville chose democratic candidate
86
Daniel Mongiardo by nearly 2:1 (59.58%), but Jim Bunning, the republican candidate, won the
state with 50.66% of the vote (Kentucky State Board of Elections 2009). Furthermore, in local
politics, Republican candidates rarely won a Louisville mayoral contest during the 20th
century
(Kleber 2001). It has been noted that
[t]he Kentucky Republican Party and its arm in Louisville and Jefferson County have led
parallel lives. They each historically do well in presidential and congressional elections,
but Democrats rule when voters choose state and local officials. It is a phenomenon
manifested by registration figures in Jefferson County, where Democrats outregister
Republicans by about two to one. (Kleber 2001: 756)
History, again, plays a role in how this division came about. Bolstered by the influx of
Irish and Germans immigrants in the mid 1800s, Democrats rose in opposition to the Know-
Nothings party, which tended toward anti-Catholic violence, as evidenced by the events of
“Bloody Monday” (Kleber 2001).
Despite these differences, Louisville represents Kentucky on the national and
international level, especially during events like the Kentucky Derby, when the sports world
focuses on the city and its residents. In an editorial in the Courier-Journal, one writer explains,
“On this day, more than any other, the split personality of our border city tends toward the
southern” (“The Derby” 2009). These types of descriptions associate this event with an
expression of Southernness, suggesting that the popular media see Louisville as a representative
Southern city.
7 At a Perceptual Border
It is important to note how previous studies in folk dialectology also add to my
understanding of Louisville as being located on a border. In his “Five Visions of America”,
87
Preston (1989) showed that, in drawing maps of regional variation, respondents from southern
Indiana, New York City, and western New York place the boundary of the South and the
Midwest or North along the Ohio River. Additionally, respondents from Hawaii and Michigan
do not include Louisville in either of these designations, leaving the city without a region,
suggesting that they are either completely unfamiliar with the variety spoken there, or, perhaps
more likely, they are confused by the perceived mixture of linguistic cultures in the area. These
perceptions reflect the popular interpretations of the South and its boundary, and it suggests that
Louisvillians are subjected to classification from people outside of the city, which likely has
some bearing on how they classify themselves.
8 Discussion
On an insert, presumably from the cover, in Isabel McLennan McMeekin‟s (1945)
discussion about Louisville as a gateway city, it claims, “This is the story of a city which has
always been called the gateway from the North to the South, where the best Southern traditions
of gracious living are combined with vigorous northern qualities of thriving business and
industrial growth.” Simply put, Louisville has a history of being located between North and
South, and in these section, I have shown that Louisville is, in fact, located at many types of
borders, going beyond gracious living and thriving business to look at the facts of geography,
history, and other factors in portraying the dichotomous nature of this great city. I suggest that
these borders influence Louisvillians‟ perception and production of regional identity.
88
CHAPTER 4: RESEARCH DESIGN
1 Overview
In this chapter, I discuss each of the segments of the dissertation and their respective
methodologies, particularly as they pertain to the research questions identified in Chapter 1. This
includes a discussion of the subjects recruited, the types of data that were collected, the ways in
which such data were collected, and the procedures for data analysis.
2 Perceptual Dialectology
These tasks establish how Louisvillians see regional variation in the United States and,
more specifically, shows where they believe Louisville to be located. Hand-drawn maps can
reveal where participants believe the boundaries to be located, thus indicating whether they
experience a border in Louisville. Additional attitudinal data and an analysis of the labels used to
describe different varieties of English can reveal more about their sentiments of belonging.
2.1 Subjects
I selected people to whom I was of no relation, using the friend-of-a-friend method of
subject selection made popular in sociolinguistic research by Milroy (1980). The data for this
study come from 23 participants living in Louisville, most of whom claim to have spent all or
nearly all of their lives in Louisville. There were 10 female and 13 male respondents, ranging in
age from 18 to 66. All subjects were white native speakers of English. Of those who did not
claim to have lived their entire lives in Louisville, subjects either claimed to have left only for
college, to have arrived in Louisville as a young child, to have been born there but spent some
time away in early childhood, or to have been living in Louisville for a significant portion of
their lives just prior to completing the survey. Table 1 provides details about each individual
subjects, and Table 2 is a summary of the information about subjects.
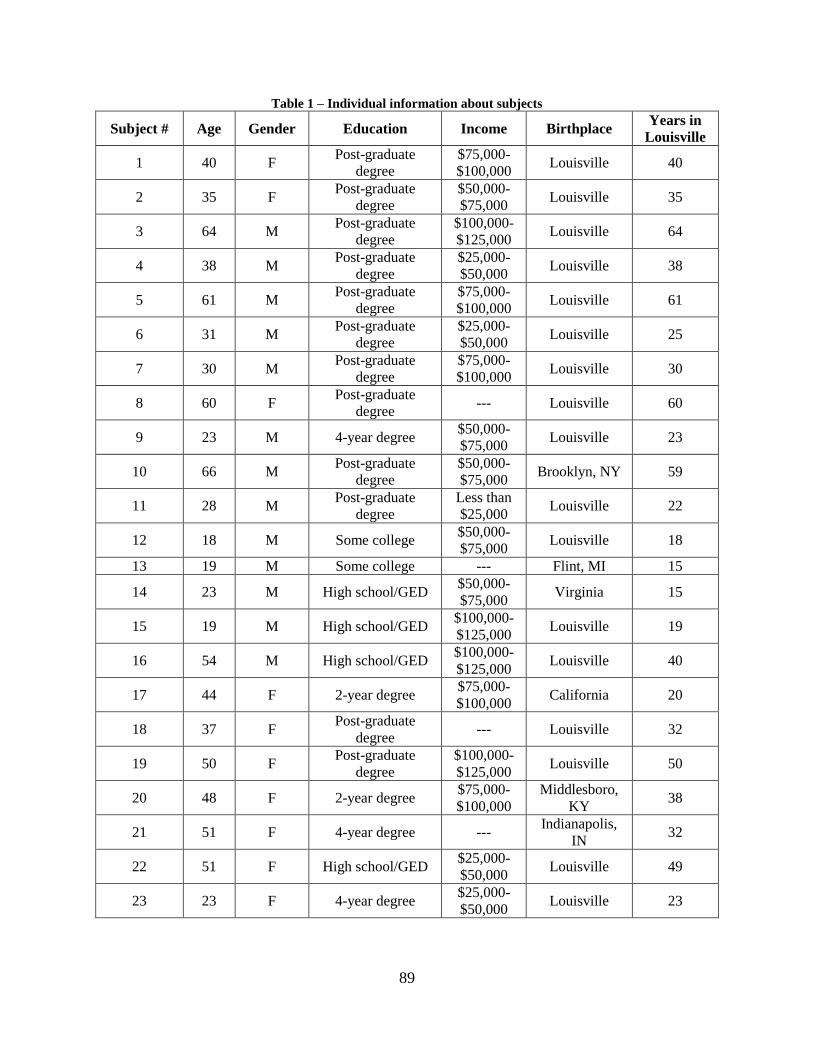
89
Table 1 – Individual information about subjects
Subject # Age Gender Education Income Birthplace Years in
Louisville
1 40 F Post-graduate
degree $75,000-
$100,000 Louisville 40
2 35 F Post-graduate
degree $50,000-
$75,000 Louisville 35
3 64 M Post-graduate
degree $100,000-
$125,000 Louisville 64
4 38 M Post-graduate
degree $25,000-
$50,000 Louisville 38
5 61 M Post-graduate
degree $75,000-
$100,000 Louisville 61
6 31 M Post-graduate
degree $25,000-
$50,000 Louisville 25
7 30 M Post-graduate
degree $75,000-
$100,000 Louisville 30
8 60 F Post-graduate
degree --- Louisville 60
9 23 M 4-year degree $50,000-
$75,000 Louisville 23
10 66 M Post-graduate
degree $50,000-
$75,000 Brooklyn, NY 59
11 28 M Post-graduate
degree Less than
$25,000 Louisville 22
12 18 M Some college $50,000-
$75,000 Louisville 18
13 19 M Some college --- Flint, MI 15
14 23 M High school/GED $50,000-
$75,000 Virginia 15
15 19 M High school/GED $100,000-
$125,000 Louisville 19
16 54 M High school/GED $100,000-
$125,000 Louisville 40
17 44 F 2-year degree $75,000-
$100,000 California 20
18 37 F Post-graduate
degree --- Louisville 32
19 50 F Post-graduate
degree $100,000-
$125,000 Louisville 50
20 48 F 2-year degree $75,000-
$100,000 Middlesboro,
KY 38
21 51 F 4-year degree --- Indianapolis,
IN 32
22 51 F High school/GED $25,000-
$50,000 Louisville 49
23 23 F 4-year degree $25,000-
$50,000 Louisville 23
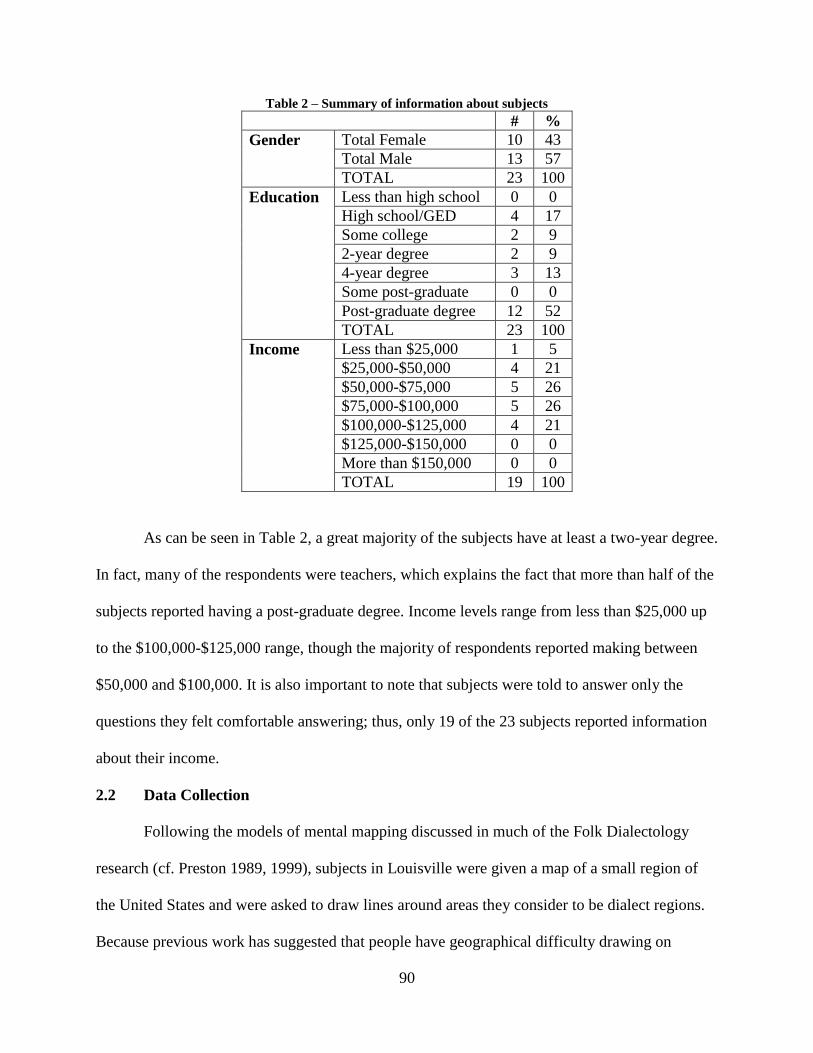
90
Table 2 – Summary of information about subjects
# %
Gender Total Female 10 43
Total Male 13 57
TOTAL 23 100
Education
Less than high school 0 0
High school/GED 4 17
Some college 2 9
2-year degree 2 9
4-year degree 3 13
Some post-graduate 0 0
Post-graduate degree 12 52
TOTAL 23 100
Income Less than $25,000 1 5
$25,000-$50,000 4 21
$50,000-$75,000 5 26
$75,000-$100,000 5 26
$100,000-$125,000 4 21
$125,000-$150,000 0 0
More than $150,000 0 0
TOTAL 19 100
As can be seen in Table 2, a great majority of the subjects have at least a two-year degree.
In fact, many of the respondents were teachers, which explains the fact that more than half of the
subjects reported having a post-graduate degree. Income levels range from less than $25,000 up
to the $100,000-$125,000 range, though the majority of respondents reported making between
$50,000 and $100,000. It is also important to note that subjects were told to answer only the
questions they felt comfortable answering; thus, only 19 of the 23 subjects reported information
about their income.
2.2 Data Collection
Following the models of mental mapping discussed in much of the Folk Dialectology
research (cf. Preston 1989, 1999), subjects in Louisville were given a map of a small region of
the United States and were asked to draw lines around areas they consider to be dialect regions.
Because previous work has suggested that people have geographical difficulty drawing on
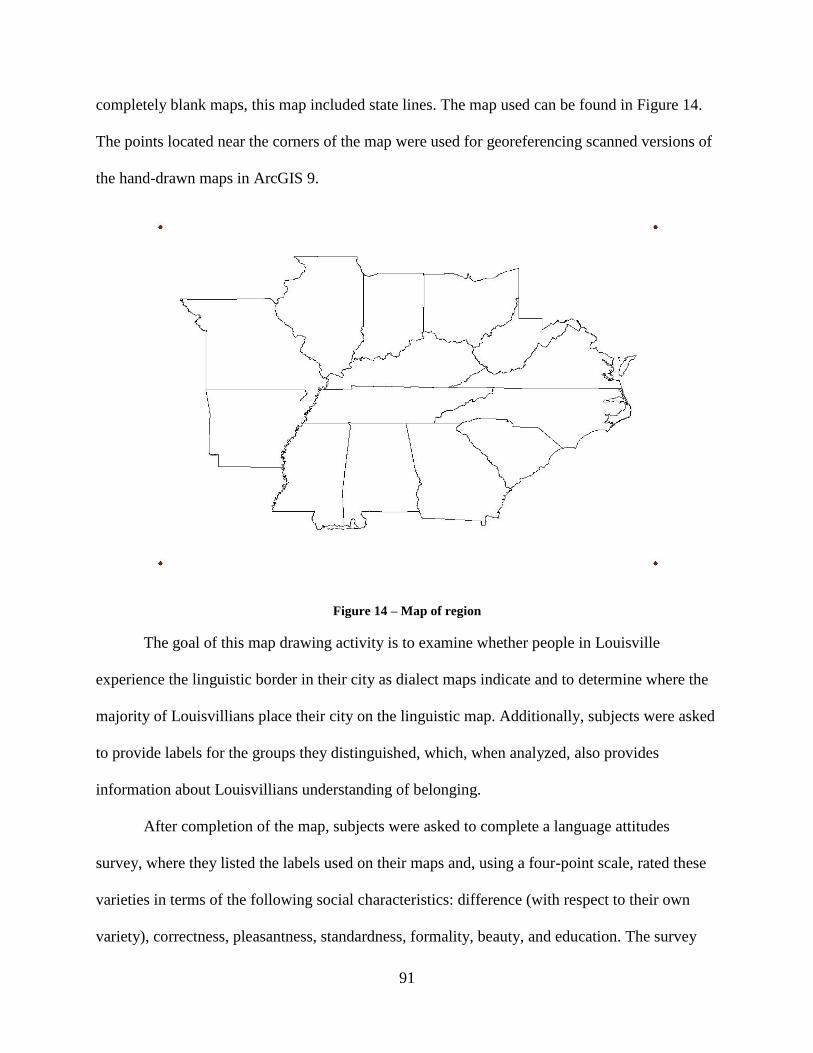
91
completely blank maps, this map included state lines. The map used can be found in Figure 14.
The points located near the corners of the map were used for georeferencing scanned versions of
the hand-drawn maps in ArcGIS 9.
Figure 14 – Map of region
The goal of this map drawing activity is to examine whether people in Louisville
experience the linguistic border in their city as dialect maps indicate and to determine where the
majority of Louisvillians place their city on the linguistic map. Additionally, subjects were asked
to provide labels for the groups they distinguished, which, when analyzed, also provides
information about Louisvillians understanding of belonging.
After completion of the map, subjects were asked to complete a language attitudes
survey, where they listed the labels used on their maps and, using a four-point scale, rated these
varieties in terms of the following social characteristics: difference (with respect to their own
variety), correctness, pleasantness, standardness, formality, beauty, and education. The survey
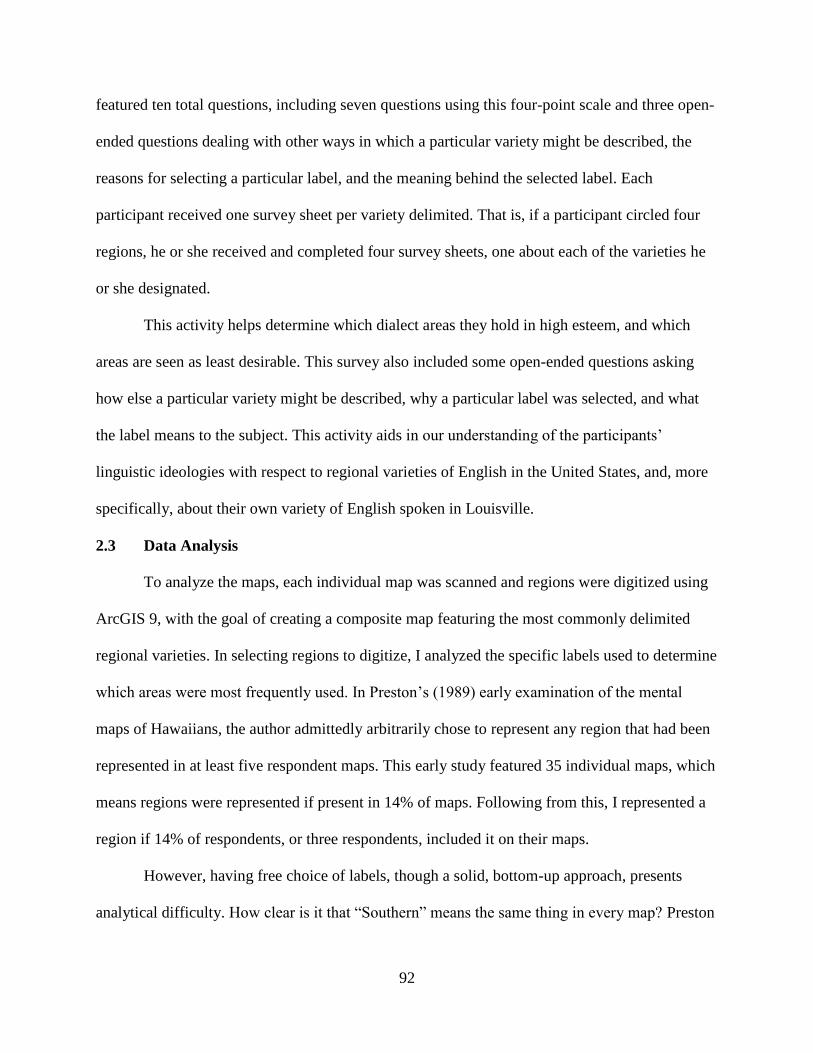
92
featured ten total questions, including seven questions using this four-point scale and three open-
ended questions dealing with other ways in which a particular variety might be described, the
reasons for selecting a particular label, and the meaning behind the selected label. Each
participant received one survey sheet per variety delimited. That is, if a participant circled four
regions, he or she received and completed four survey sheets, one about each of the varieties he
or she designated.
This activity helps determine which dialect areas they hold in high esteem, and which
areas are seen as least desirable. This survey also included some open-ended questions asking
how else a particular variety might be described, why a particular label was selected, and what
the label means to the subject. This activity aids in our understanding of the participants‟
linguistic ideologies with respect to regional varieties of English in the United States, and, more
specifically, about their own variety of English spoken in Louisville.
2.3 Data Analysis
To analyze the maps, each individual map was scanned and regions were digitized using
ArcGIS 9, with the goal of creating a composite map featuring the most commonly delimited
regional varieties. In selecting regions to digitize, I analyzed the specific labels used to determine
which areas were most frequently used. In Preston‟s (1989) early examination of the mental
maps of Hawaiians, the author admittedly arbitrarily chose to represent any region that had been
represented in at least five respondent maps. This early study featured 35 individual maps, which
means regions were represented if present in 14% of maps. Following from this, I represented a
region if 14% of respondents, or three respondents, included it on their maps.
However, having free choice of labels, though a solid, bottom-up approach, presents
analytical difficulty. How clear is it that “Southern” means the same thing in every map? Preston
93
(1989) provided a template for hand-drawn maps, which aided in the conversion from individual
maps and labels to a composite map. This template can be found in Figure 15. Yet this template
did not seem to encompass the entire spectrum of regions Louisvillians wanted to represent.
Thus, geography and frequency of occurrence were also considered in selecting which regions to
represent in the composite map. This includes categories like specific state or city names, as well
as certain regional labels, like “Appalachia”, which are not represented in Preston‟s template.
Thus, overarching category names were created to cover the numerous labels used by individual
subjects.
Figure 15 – Template for hand-drawn map activity, Preston (1989: 127)
In the analysis of these maps, a composite map will be used to show where Louisvillians
generally place Louisville in the linguistic landscape of the United States. It also reveals whether
a border is generally perceived among Louisvillians. The composite map features the 11 regions
defined by Louisvillians, using a level of 50% agreement for determining the boundaries of each
composite region. I examine several individual maps to show how the border is, in fact, a reality
94
for these participants, demonstrating how their understanding of regional identity is informed by
their recognition of the border.
Using the overarching category names as a starting point for the analysis of language
attitudes, I examine how participants perceive the varieties of English they have delimited. Using
statistical methods, specifically a post hoc Tukey HSD (Honestly Significant Difference) test, I
compare the scores for different varieties, to determine which varieties are perceived as better
than or worse than others, given the social descriptors given in the language attitudes survey
listed above. Specifically, I am interested in how they perceive a Louisville dialect in relation to
a larger Kentucky dialect, a Southern dialect, and a Midwestern dialect.
Returning to the original labels employed on each individual map, I examine the nature
of the ways in which different varieties are defined. I categorize these labels as positive,
negative, or neutral with respect to the ways in which they further described the varieties in the
open-ended portion of the language attitudes surveys.
Finally, as any data collection and analysis with human subjects might encounter, there
were a number of ways in which subjects did not explicitly follow my directions. My analysis
deals with these cases in a few ways. In digitizing the regions for the composite map, since many
participants drew multiple circles around one region, I selected the outermost line to delimit the
region. If participants did not draw a circle around an area but provided a label, these regions
were not included in the composite map. However, if they provided data for these regions in the
language attitudes section, and it was clear which overarching category their label might fall
under, that data was included in the analysis of attitudes. Some people did not complete the
language attitudes section, due to time constraints. I included as much data as they provided, but
in some cases, a region was included in the composite map but not in the language attitudes
95
section. In certain cases, multiple categories on the individual maps were condensed into one
region for the purposes of the composite map, yet when I analyzed the language attitudes data, I
considered the information provided for each of the different labels.
3 Production of Identity
Moving from how Louisvillians categorize varieties of English in the United States, the
next step is to examine how particular categories are realized linguistically in the production of
certain region-specific linguistic variables. This project mirrors the previous one, in that the
extent to which the distinctions made by dialectologists match those in reality can be further
investigated. Specifically, recalling Labov, Ash, and Boberg‟s (2006) classification of Louisville
as a Southern city, I examine the production data for elements of the Southern Vowel Shift (cf.
Fridland 1998; Fridland 2001; Labov, Ash, and Boberg 2006).
3.1 Subjects
The production data come from an original SOAPnet reality television show, Southern
Belles: Louisville (Livecchi and Bull 2009). The show, described as a “docusoap” or
“docudrama”, follows the lives of five Louisville women in their 20s and 30s, detailing their
experiences as friends, as professionals, and as bachelorettes. It is a typical reality show, with
segments of free conversation, long stories, and monologues directly in front of the camera. The
women form a group of friends, very involved in different aspects of life in Louisville.
Emily, the youngest member of the group, is the daughter of rather religious parents,
including an overprotective father who owns his own company. Her parents want her to get
involved with the family business, but Emily would rather pursue her own dream of becoming a
television reporter, specializing in entertainment news. Her main focus during the show is
96
whether to move to Las Vegas for an opportunity in television, despite her family‟s wishes for
her to stay in Louisville.
Hadley is characterized as the “girl next door,” who has a penchant for “bad boys.” She
cannot seem to decide what she wants in life; she began a PhD but decided to take a break from
school to work as a personal assistant. The show follows Hadley‟s adventures in dating and
deciding on a career path.
Julie, the oldest and only African-American member of the group, is a model who
discovers that her career must change course because of her age. She must now look for roles for
older women. She is single, which she claims is caused by her devotion to her career. Julie wants
a husband and a family but fears she may be short on time. In the show, the audience sees her
battle with juggling a career and a dating life.
Kellie, like Julie, feels the pressure of time. She is 32 and has already been divorced
twice. She desperately wants children, but the man she is dating during the course of the show
does not want children. The show deals extensively with how Kellie will resolve this issue.
During the show, the audience comes to understand the many trials Kellie has struggled through
in her life: two divorces, a miscarriage, an eating disorder, a drug addiction, and a complicated
early family life.
Shea, the daughter of a wealthy Louisville doctor, is portrayed as spoiled and snobbish.
She is and wants to continue to be a part of Louisville‟s high society. Her fiancé, however, does
not share the same background. The show chronicles their courtship. Throughout the show, the
audience sees Shea‟s desire for expensive things, which makes her fiancé nervous about their
lives together. The focus is on Shea‟s desire to get married right away.
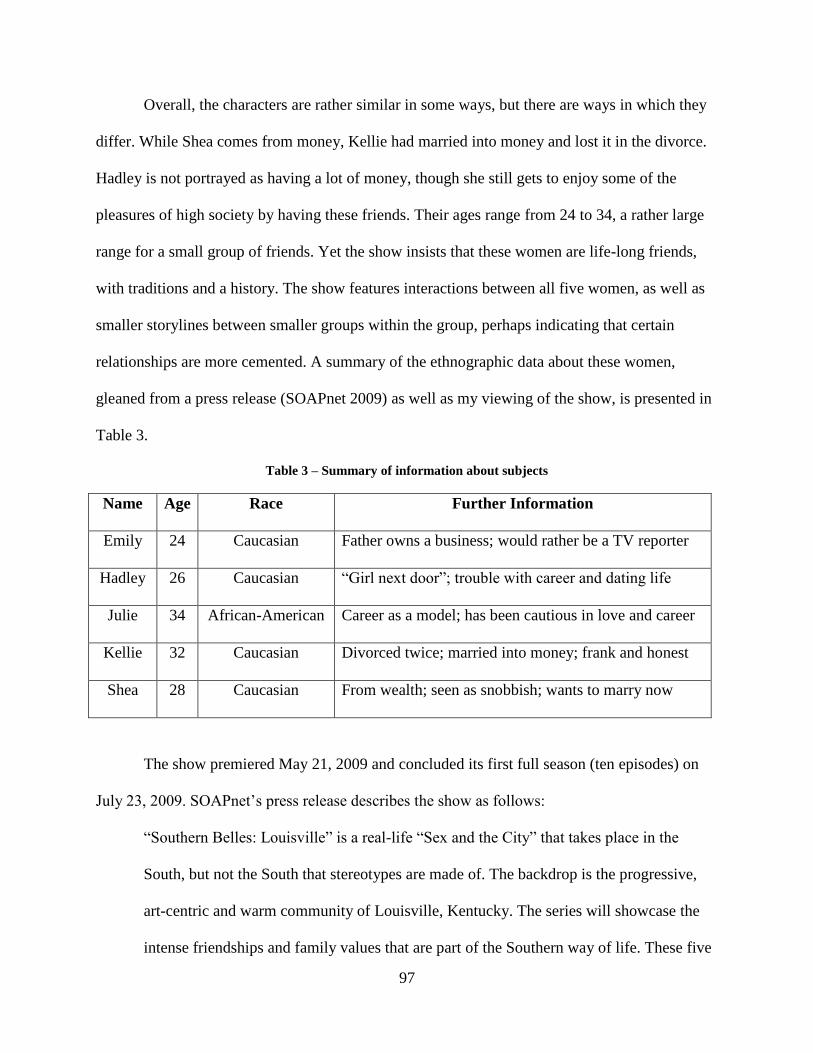
97
Overall, the characters are rather similar in some ways, but there are ways in which they
differ. While Shea comes from money, Kellie had married into money and lost it in the divorce.
Hadley is not portrayed as having a lot of money, though she still gets to enjoy some of the
pleasures of high society by having these friends. Their ages range from 24 to 34, a rather large
range for a small group of friends. Yet the show insists that these women are life-long friends,
with traditions and a history. The show features interactions between all five women, as well as
smaller storylines between smaller groups within the group, perhaps indicating that certain
relationships are more cemented. A summary of the ethnographic data about these women,
gleaned from a press release (SOAPnet 2009) as well as my viewing of the show, is presented in
Table 3.
Table 3 – Summary of information about subjects
Name Age Race Further Information
Emily 24 Caucasian Father owns a business; would rather be a TV reporter
Hadley 26 Caucasian “Girl next door”; trouble with career and dating life
Julie 34 African-American Career as a model; has been cautious in love and career
Kellie 32 Caucasian Divorced twice; married into money; frank and honest
Shea 28 Caucasian From wealth; seen as snobbish; wants to marry now
The show premiered May 21, 2009 and concluded its first full season (ten episodes) on
July 23, 2009. SOAPnet‟s press release describes the show as follows:
“Southern Belles: Louisville” is a real-life “Sex and the City” that takes place in the
South, but not the South that stereotypes are made of. The backdrop is the progressive,
art-centric and warm community of Louisville, Kentucky. The series will showcase the
intense friendships and family values that are part of the Southern way of life. These five
98
contemporary and independent women are all at critical crossroads in their lives: Some
are confronting their biological clocks, some are still looking for Mr. Right and are trying
to find their career paths, and one is preparing for her wedding. (SOAPnet 2009)
Thus, the show is positioned as being representative of the South, and as such, one might expect
the women to also be appropriate representatives. Also, positioning Louisville as Southern, using
stereotypical notions of warmth and family values, yet somehow non-Southern, depicting the city
as art-centric and progressive, with the implication that these characteristics are not
stereotypically associated with the South, adds to our understanding of Louisville as a border
city.
3.2 Data Collection
The data consists of more than seven hours of video. In this study, each episode of
Southern Belles: Louisville was transcribed, and the complete transcript served as a corpus of
vowel tokens. A program was designed to randomly select words in the transcript that featured
one of the vowels under analysis, using dictionary.com as a database for anticipated (“standard”)
pronunciations. When words were randomly drawn that could not be located in the dictionary,
they were judged by the author. In cases where there were two possible tokens of the same vowel
class in one word, I used a coin flip to determine which vowel to analyze.
The vowel classes under investigation include: /ai/, /ei/, /ɛ/, /i/, /ɪ/, /u/, and /oʊ/.9
Additionally, tokens for /æ/ and /ʌ/ were included as control vowels. These vowels are thought to
participate minimally, if at all, in the Southern Vowel Shift, making them stable vowels. These
stable vowels were used to measure the general patterns of shifting in the vowels involved in the
shift, providing a reliable evaluation across speakers.
9 Despite the fact that the Back Shift has been shown to be more widespread than initially thought, also occurring in
the Midland dialect region, I have still included an analysis of the back vowels, so as to be able to compare my
results to those of previous studies dealing with the Southern Shift.
99
A total of ten tokens were selected for each of the vowel classes under investigation for
each subject, for a total of 70 target tokens per speaker. Additionally, five tokens for each of the
control vowels were collected, resulting in 80 total tokens per speaker. For each subject, a word
was used only once per vowel class, so as to avoid duplication of the same exact token, which,
because of television editing processes, was quite possible. Plurals, homophones, and
contractions, thus, were not considered to be the same word. For the /ai/ vowel tokens, pre-
voiceless environments were not used, since monophthongization is less likely in these
environments. Also, words like “a”, “the”, and “and” were not used as tokens because of the
reductive nature of such words in natural speech. Finally, the word “Louisville” was rejected as a
candidate because of the issues associated with the pronunciation of the city‟s name.10
3.3 Data Analysis
Each target word was subjected to spectral analysis using Praat version 5.0.35 (Boersma
and Weenink 2008). For each word, I hand-selected the vowel in Praat through visual inspection
of the spectrogram. The boundaries of the vowel were determined by listening to the speech
sample, zooming in to the spectrogram, looking for the higher energy bands typical of vowel
formants, and identifying the end of the preceding phoneme and the closure of the following
phoneme. This type of acoustic analysis is necessary and better than traditional methods of
transcription, especially when the analyst is a member of the speech community under
examination, because, as Feagin noted, “It is particularly difficult for a member of that speech
community to hear local vowels as being different from the standard vowel charts” (1986: 90).
10
“Louisville” is known for having many different pronunciations; non-Louisvillians seem to have difficulty
understanding one of these pronunciations (IPA: [ˈlu:əvəl], often shortened to [ˈlʌvəl]), which differs widely from
the Standard English pronunciation (IPA: [ˈlu:i:vɪl]). See Cramer (2010) for a discussion of the connection between
pronunciation of “Louisville” and Southernness.
100
3.3.1 Monophthongization of /ai/
The methodology used for analyzing /ai/ monophthongization in the Southern Belles:
Louisville data comes from Cramer (2009), which, drawing on work by Thomas (2000),
examined the steady-state patterns of the American English diphthong /ai/ for speakers in
Louisville, Kentucky as compared to Midland speakers from central Illinois. Within that study,
one subject from the Southern dialect region was analyzed as a point of reference for the pattern
exhibited in that region. Subjects read a list of minimal pairs. Each word was monosyllabic and
featured a consonant or consonant cluster, followed by /ai/, and ended with /t/ or /d/. The
Midland and Southern patterns were established, and the Louisville data were compared to show
if Louisville speakers pattern with either one of these dialect groups.
In American English, diphthongs typically exhibit two steady-states: one in the onset,
which is followed by a transition, and another in the offset (Lehiste and Peterson 1961). To
analyze the speakers‟ use of the monophthongal variant, I exported the formant values from
Praat for each token of /ai/, and, using MATLAB, I applied an optimization-based curve fitting
procedure to the F1 and F2 values. In this procedure, I was fitting the data to the ideal diphthong
pattern using four parameters: transition beginning and end times and frequencies. Fitting to this
pattern can allow for all other possible patterns to be described. F1 and F2 were analyzed
separately.
The goal was to minimize the sum of the squares of errors using a piecewise linear
regression model. The optimization procedure consisted of a linear least squares model nested in
two line searches. A line search seeks to optimize a function of one variable on a line segment, in
this case, attempting to minimize the curve-fitting error. The outer line search seeks the optimal
transition beginning time by minimizing a function defined by a nested line search. This inner
101
line search seeks the optimal transition end time (given a transition beginning time). Given the
transition beginning and end times, it is possible to formulate an over-constrained linear equation
in the beginning and end frequencies. Finding the least squares solution to the linear equation is a
basic operation in MATLAB. The inner line search minimizes the error associated with the least
squares solution. The type of line search used in this study is a Fibonacci line search, which
iteratively narrows the range in which the optimal value must lie. The code for the Fibonacci line
searches was adapted from Chong and Żak (2001).
A vowel was considered to be a monophthong if the change in frequency (in F1 or F2)
from the initial point of the vowel to the end point was less than 25%. The literature on
monophthongs overwhelmingly defines it as a single steady-state vowel with no transition.
However, Hewlett and Beck (2006) claim that monophthongs and diphthongs are not discrete
categories but points on a continuum. Thus, vowels that are perceived to be monophthongs may
exhibit a dynamic phase. My definition accounts for such monophthongs.
Figure 16 is a sample output of the procedure. It shows the data points exported from
Praat (blue „x‟ marks) as well as the best fitting curve (red lines) for those points. This figure,
from Cramer (2009), was produced based on the data of a central Illinois subject producing the
word height. This vowel was not determined to be a monophthong under the previously
described definition.
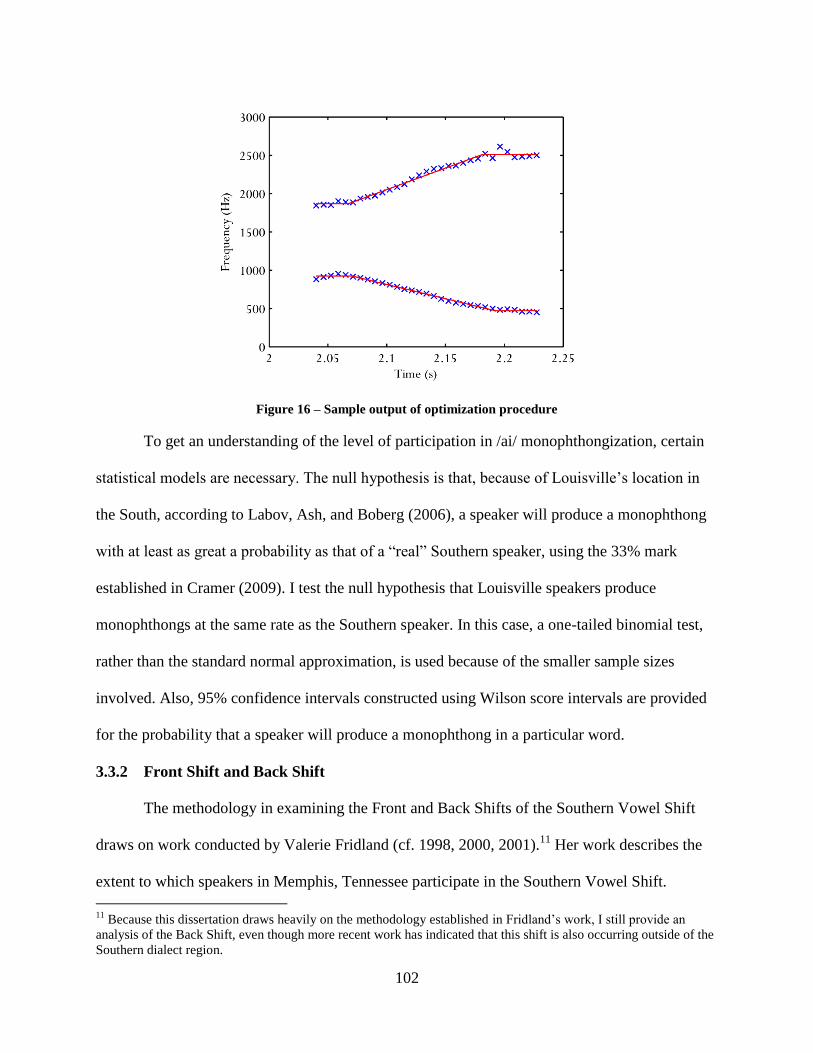
102
Figure 16 – Sample output of optimization procedure
To get an understanding of the level of participation in /ai/ monophthongization, certain
statistical models are necessary. The null hypothesis is that, because of Louisville‟s location in
the South, according to Labov, Ash, and Boberg (2006), a speaker will produce a monophthong
with at least as great a probability as that of a “real” Southern speaker, using the 33% mark
established in Cramer (2009). I test the null hypothesis that Louisville speakers produce
monophthongs at the same rate as the Southern speaker. In this case, a one-tailed binomial test,
rather than the standard normal approximation, is used because of the smaller sample sizes
involved. Also, 95% confidence intervals constructed using Wilson score intervals are provided
for the probability that a speaker will produce a monophthong in a particular word.
3.3.2 Front Shift and Back Shift
The methodology in examining the Front and Back Shifts of the Southern Vowel Shift
draws on work conducted by Valerie Fridland (cf. 1998, 2000, 2001).11
Her work describes the
extent to which speakers in Memphis, Tennessee participate in the Southern Vowel Shift.
11
Because this dissertation draws heavily on the methodology established in Fridland‟s work, I still provide an
analysis of the Back Shift, even though more recent work has indicated that this shift is also occurring outside of the
Southern dialect region.
103
Louisville and Memphis are similar in many respects. Both might be described as mid-sized
towns, and with populations near 700,000, both are the largest cities in their respective states. As
Fridland points out, little has been said about how urban centers are affected by the Southern
Vowel Shift (which is in opposition to the approach scholars have taken to studying the Northern
Cities Shift), thus an examination of Louisville, like one of Memphis, adds to our greater
knowledge in this respect.
Starting again from the hand-selected vowel tokens in Praat, I ran a script to find the mid
values of F1 and F2 for each of the target and control vowels. The mean of these mid values were
used to plot each speaker‟s vowels in two-dimensional vowel space, where F1 values indicate
vowel height and F2 values indicate vowel frontness. Each speaker‟s vowel means were
compared to Peterson and Barney‟s (1952) unshifted system. Since all speakers in this study are
female, I used the unshifted system of a female in Peterson and Barney‟s work.
For analyzing elements of the Front Shift, front vowels were claimed to be shifting if the
positions of the vowels of these women were different from those of the unshifted speaker, using
a graphical representation of the vowel space to show where the vowels are in relation to other
vowels in the system.
For analyzing elements of the Back Shift, the back vowels /u/ and /oʊ/ were claimed to
be shifting if the positions of the vowels of these women were different from the unshifted
speaker, using a graphical representation of the vowel space to show where the vowels are in
relation to other vowels in the system.
Finally, returning to the question of how this provides evidence about the question of
identity, I examine the contexts of use where the Southern variants appear. Do these women use
Southern variants in contexts dealing specifically with aspects of Southern life? How clear is it
104
that they are doing “being Southern” and not just speaking with a Southern accent? I attempt to
answer these questions, turning to the literature on language and identity to understand how the
use of particular variants shapes a speaker‟s identity alignments.
4 Perception of Identity
It is also important, in addition to understanding the ways in which regional identity is
produced, to determine the extent to which certain linguistic features aid in the perception of
regional identities. Is it possible for Louisvillians to identify, with any certainty, another speaker
from Louisville? This project attempts to gauge this ability and examines how differences in
social knowledge can affect how a speaker is categorized.
4.1 Classifying Dialects
The main objective for this perceptual experiment is to understand if participants in
Louisville can accurately classify a speaker from their own town based on sound alone. Using
the production data from Southern Belles: Louisville and the same regional map used in the map
drawing activity, this experiment shows where Louisvillians place other Louisvillians in the
linguistic landscape of the United States.
4.1.1 Subjects
I recruited 26 adult participants from Louisville, Kentucky to take part in a web-based
survey. Subjects did not know that they were being selected because they were from Louisville,
as that would bias the results. Subjects were recruited by the author sending a link to friends on
Facebook and asking them to take the survey themselves and forward the link along to some of
their friends and family. They were told to only send the survey to people who live in the United
States and only to people 18 years of age or older. Since this process could generate data from
people who were not from Louisville (or who were not 18), a brief demographic survey was also
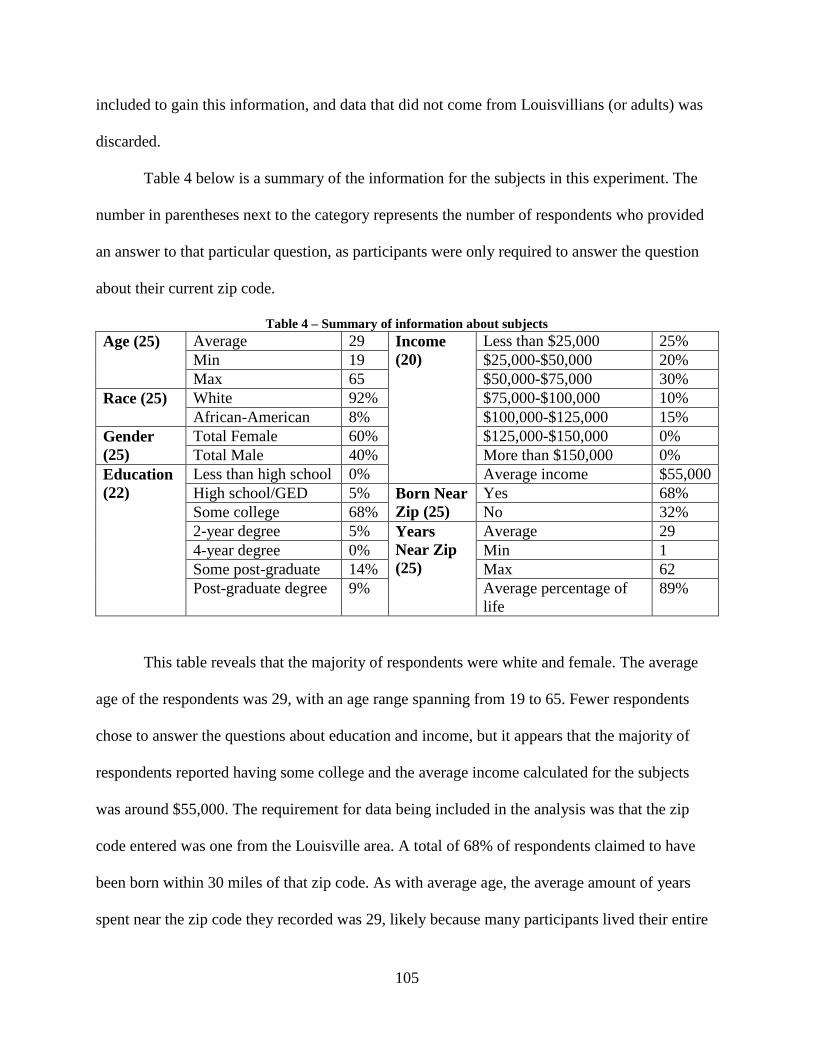
105
included to gain this information, and data that did not come from Louisvillians (or adults) was
discarded.
Table 4 below is a summary of the information for the subjects in this experiment. The
number in parentheses next to the category represents the number of respondents who provided
an answer to that particular question, as participants were only required to answer the question
about their current zip code.
Table 4 – Summary of information about subjects
Age (25) Average 29 Income
(20)
Less than $25,000 25%
Min 19 $25,000-$50,000 20%
Max 65 $50,000-$75,000 30%
Race (25) White 92% $75,000-$100,000 10%
African-American 8% $100,000-$125,000 15%
Gender
(25)
Total Female 60% $125,000-$150,000 0%
Total Male 40% More than $150,000 0%
Education
(22)
Less than high school 0% Average income $55,000
High school/GED 5% Born Near
Zip (25)
Yes 68%
Some college 68% No 32%
2-year degree 5% Years
Near Zip
(25)
Average 29
4-year degree 0% Min 1
Some post-graduate 14% Max 62
Post-graduate degree 9% Average percentage of
life
89%
This table reveals that the majority of respondents were white and female. The average
age of the respondents was 29, with an age range spanning from 19 to 65. Fewer respondents
chose to answer the questions about education and income, but it appears that the majority of
respondents reported having some college and the average income calculated for the subjects
was around $55,000. The requirement for data being included in the analysis was that the zip
code entered was one from the Louisville area. A total of 68% of respondents claimed to have
been born within 30 miles of that zip code. As with average age, the average amount of years
spent near the zip code they recorded was 29, likely because many participants lived their entire
106
lives or most of their lives in Louisville. This is verified in the fact that the calculated average
percentage of life spent within 30 miles of the zip code they recorded was 89%.
4.1.2 Data Collection
The production data from Southern Belles: Louisville serve as the perceptual stimuli for
this part of the dissertation. The goal is to examine the ability of Louisvillians to correctly
identify a speaker as being from Louisville based on sound alone. In particular, subjects heard
samples of speech from the show that featured several instances of /ai/ monophthongization,
“[o]ne of the most salient and stereotypical features of Southern American English” (Fridland
2003: 280). It is suggested that if subjects believe Louisville to be a Midwestern town, they
would be less likely to categorize these speakers as from Louisville, or any of the cities located
in the Midwest. On the other hand, if Louisvillians believe Louisville to be a Southern town, they
might be more willing to select Louisville as the place of origin for the speakers.
In a web-based survey, subjects listened to short segments of speech from the show12
and
were asked to pinpoint on a map of a small region of the United States (the same map used in the
mental maps exercise) where they believed the speaker to be from. Subjects were suggested to
select the area that most closely represents where they think the speaker could be from. The map
included several cities as guideposts, though subjects were not required to select individual
cities. Stimuli were presented to subjects in a random order, with each individual webpage
featuring one sound file, represented on the webpage by a clickable icon, and one map for
classification. Subjects were allowed to listen to the sound file repeatedly. After clicking a
location, subjects were directed to the next page, with no ability to go back and change their
previous answers, until all sound files had been classified. At the end of the survey, a comment
12
Video was not included, as the show features many scenic shots of the Louisville area, and it is unclear how
popular the show is or how well-known the women are in Louisville.
107
box was provided for speakers to optionally provide any insight about their classifications
specifically, or about the survey as a whole.
The stimuli included one sample from each of the five women from the show, as well as
five filler samples, also taken from characters from the show. The filler samples were selected
from people on the show who were found to be originally from locations outside of Louisville.
Each target sound sample was controlled for length (22-30 seconds) and number of /ai/ tokens
(15-20).
4.1.3 Data Analysis
Since the results of this exercise determine the stimulus for the next exercise, the analysis
of the data involves determining which of the five women was determined to be from an area
closest to Louisville. This process involved a few steps. The first step was to translate the pixels
of the map into miles. To create a scaling factor, the distance in miles and pixels between
Louisville and Kansas City were determined, and by dividing the miles by the pixels, I
determined the number of miles per pixel. Then, given the individual x and y coordinates of the
positions selected by the subjects, I calculated the distance in miles from Louisville by
multiplying the coordinates by the scaling factor.
From these coordinates now in miles, I determined the distance from Louisville for each
point. These distances were averaged for each speaker, and the speaker with the lowest average
distance from Louisville was selected as the perceptual stimulus for the second part of the
perceptual experiment. Of course, other methods for determining distance were available; I also
considered the possibility of determining a mean position and comparing that to Louisville‟s
position. However, using the mean distances prevents problems of directionality. For example, if
two subjects selected positions 100 miles away from Louisville, one to the North and one to the
108
South, the mean position would be located in Louisville, whereas the mean distance would be
100 miles. Using mean distances means that large distances, no matter which direction from
Louisville, remain large distances.
Finally, as a check of the selected perceptual stimulus, I also took the base-10 logarithm
of each sample distance, found the average of those, and determined the mean log distance from
Louisville for each speaker. These mean logs were exponentiated (i.e. 10x) to determine
perceived miles. This draws on the Weber-Fechner law, which deals with the idea that there is a
relationship between the physical and perceived magnitudes of stimuli. That is, in terms of
numerical recognition, “discriminability decreases with increasing numerical magnitude because
the distance between numbers becomes subjectively smaller as their magnitude increases”
(Longo and Lourenco 2007). For example, the distance between 50 and 100 miles is not
perceived to be the same magnitude as the distance between 250 and 300 miles (i.e. the second is
perceived to be a smaller change). In a project such as this one, then, distances from Louisville
that are higher are not perceived to be as far away as they actually are.
So in this study, there are varying distances wherein the difference in perception is not
constantly related to the difference in distances. Using the log scale, the unrelated scale can be
translated onto a scale whereby the difference between the log values is constantly related to
differences in perceptions, thereby mapping actual distances onto a sort of perception scale,
looking at the mean perceptions and then converting back into miles to get mean perceived
distances.
4.2 Focus Group Dialect Perception
In this part of the project, the main question of interest is: how do subjects in Louisville
perceive speakers differently depending on where they think the speaker is from? Louisville‟s
109
location on the border with Southern and Midwestern regions indicates that there may exist some
variation in subjects‟ attitudes toward different speakers depending on how they classify
Louisville. This section provides insight about the ideologies Louisvillians have about their own
and others varieties of English. The ways in which identities are perceived is as much a part of
identity creation as anything else, thus it is important to gain this knowledge.
4.2.1 Subjects
Subjects in this experiment were divided into three focus groups, each consisting of 3-4
adult speakers living in Louisville. I selected people who were friends, family members, or
friends of friends and family members to participate in this study. One group consisted of a
married couple and their married couple neighbors. Another group consisted of a married couple
and the wife‟s sister. The last group consisted of a married couple and their adult daughter.
There were six female and four male participants. Most subjects claimed to be from
Louisville, having lived most of their lives in the area. Two subjects, a married couple, were not
native Louisvillians; the husband was originally from Michigan and claimed to have lived many
places, while the wife was originally from Germany, having only lived in the United States for
less than 15 years.
4.2.2 Data Collection
Based on the results of the first part of the perceptual study, Emily, the speaker who was
identified as being the most likely candidate to be from or from near the Louisville area, was
selected as the production sample in a second perceptual experiment. Subjects in this experiment
were divided into three focus groups. Each group heard the same segment of speech from Emily,
which was also the sample used in the first part of the experiment, but each group was given
slightly differing social information (Niedzielski 1999). While one group knew that Emily is
110
from Louisville, the two other groups were told that she is from Nashville, a distinctly Southern
city, or Indianapolis, a distinctly Midwestern city.
Focus group interviews dealt with group reactions to and ideologies about Emily. The
data was collected using semi-structured interviews, where the author asked participants open-
ended questions regarding their perceptions about the speaker, as well as questions specifically
about where they believe Louisville and/or Nashville/Indianapolis fits in relation to typical
descriptions of U.S. regions. Participants were allowed and encouraged to take the discussion in
directions other than what was suggested by the questions. Interviews were video-recorded at the
subjects‟ homes or at the subjects‟ neighbors‟ home. Each video-recording session lasted
approximately one half hour. All interviews were broadly transcribed for analysis.
4.2.3 Data Analysis
The focus of the data analysis is on stereotypes, or perceptions these Louisvillians have
about 1) people from Louisville, 2) people from Indianapolis, or the Midwest in general, and 3)
people from Nashville, or the South in general. Reyes (2007) broadly defines stereotypes as
“widespread typifications linking attributes to entities” (16). Following from this definition, I
examine the ways in which the participants inhabit and align themselves with or against the
stereotypes they present with reference to these different types. Aligning with, or resisting,
certain stereotypes requires participants to take a position, positive or negative, with respect to
the stereotype. Inhabiting stereotypes involves applying certain stereotypes to the self.
Widespread typifications are those that are widely circulating and are often invoked in
the popular media. For example, the media often portrays Southerners as uneducated (e.g. Lippi-
Green 1997), and Midwesterners are depicted as being industrial, materialistic, and urban or as
being salt-of-the-earth rural (e.g. Collins and Sawyer 1984). Yet, while the widespread
111
typifications are widely visible, it is the local typifications, those that surface in the interaction
and those that are particular to the Louisville context, that are of concern in this project.
Thus, in this analysis, I examine the ways in which the stereotypes Louisvillians have
about the South and Midwest surface in their discussions about people thought to be from those
regions and discuss how that bears on their own stereotypes of what it means to be from
Louisville. The ways in which Louisvillians position Louisville with respect to these groups
gives insight on their opinions about Louisville‟s location in the linguistic landscape of the
United States.
5 Discussion
This research design, which utilizes several different methodologies and varying kinds of
data, was selected in order to best capture the nuances of linguistic identity construction in
Louisville. The combination of quantitative and qualitative analyses allows for a clearer picture
of the linguistic situation in this specific locale. Drawing on insights in the areas of folk
linguistics, sociolinguistics, dialectology, and linguistic anthropology, this work also adds to our
understanding of the dynamic nature of identities, particularly at linguistic and other borders,
showing further how identity work is produced interactionally and ideologically.
112
CHAPTER 5: PERCEPTUAL DIALECTOLOGY IN LOUISVILLE
1 Overview
In this chapter, I explore how Louisvillians understand the linguistic landscape of the
United States. Drawing on insights in the field of perceptual dialectology, specifically following
the work of Dennis Preston (cf. 1989, 1999), this study examines the folk perceptions about
dialectal variation among participants in Louisville.
In particular, I am concerned with where Louisvillians place their own city in terms of its
regional location, examining not only the mental maps they draw, but also the labels they employ
for the varying dialects of English they distinguish and their attitudes towards those varieties.
Here, I determine if Louisvillians recognize the border that has been represented in dialect maps,
like Labov, Ash, and Boberg (2006). This task establishes the on-the-ground categories used by
Louisvillians, which will aid in our understanding of the production and perception of regional
identity, which will be addressed in the following chapters.
The data for this study come from 23 participants in Louisville. Participants were given a
map of a small region of the United States and were asked to draw lines around areas they
consider to be dialect regions. Participants were also asked to provide labels for the groups they
distinguished and complete a language attitudes survey about each of these varieties. This
chapter is an analysis of this data, featuring both quantitative and qualitative examinations.
2 Mental Maps
In this section, I analyze individual maps as well as composite maps created based on the
23 individual maps. In the first part, I examine individual maps for tendencies in the map
drawing processes of Louisvillians. I present the least and most detailed maps, as well as some
others with features that are interesting with respect to considering Louisville‟s location in the
113
linguistic landscape of the United States. In the second part, I present an overall picture of how
Louisvillians see regional variation in the United States, which involves the analysis of several
composite maps which highlight the regions designated by the group as a whole. Please note that
when label names appear from the individual maps, all spelling, punctuation, and capitalization
conventions used by the participant are retained. In all maps, a star has been added to mark the
geographic location of Louisville. This marking was not, however, provided to participants.
2.1 Individual Maps
Figure 17 is the least detailed map completed by a participant in this study. This map,
which features only one region labeled “Southern Twang,” was created by a 19-year old white
male who was born and raised in Louisville. In his open-ended discussion about this label, the
participant suggested that he recognizes this label as one that has been applied to him,
specifically by “people from up North.” He further indicated his understanding of Louisville‟s
position as Southern by indicating that the label means that he is “from the South.”
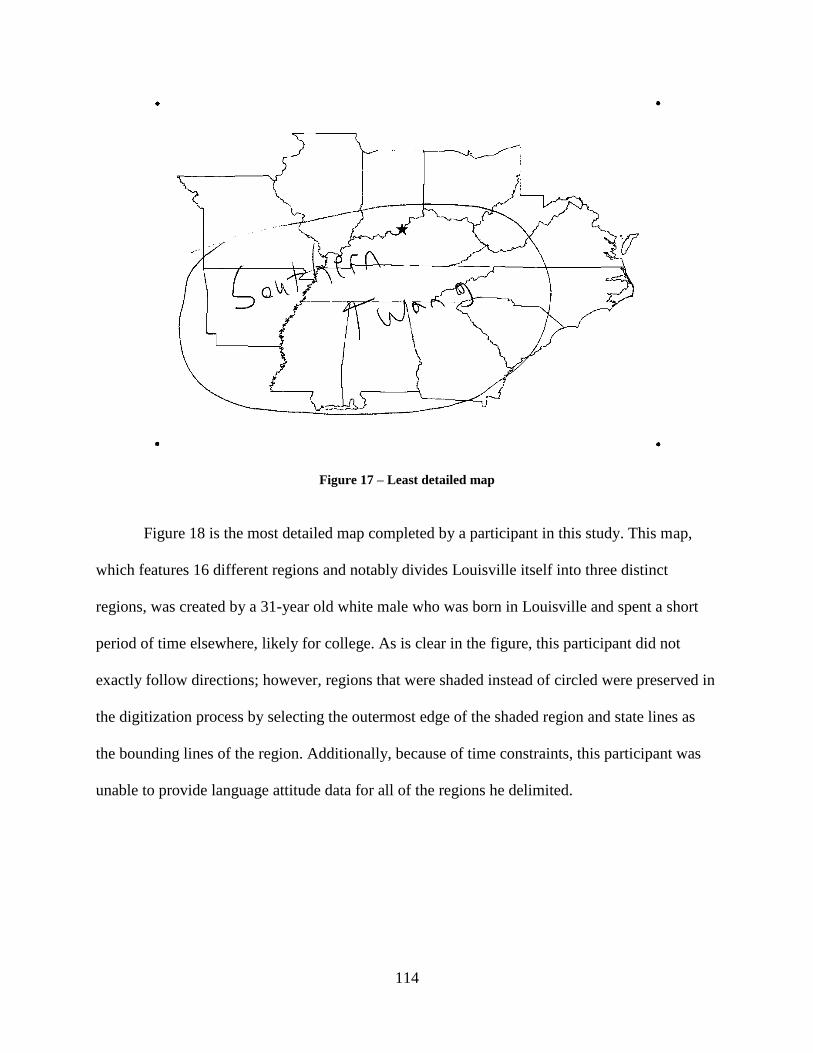
114
Figure 17 – Least detailed map
Figure 18 is the most detailed map completed by a participant in this study. This map,
which features 16 different regions and notably divides Louisville itself into three distinct
regions, was created by a 31-year old white male who was born in Louisville and spent a short
period of time elsewhere, likely for college. As is clear in the figure, this participant did not
exactly follow directions; however, regions that were shaded instead of circled were preserved in
the digitization process by selecting the outermost edge of the shaded region and state lines as
the bounding lines of the region. Additionally, because of time constraints, this participant was
unable to provide language attitude data for all of the regions he delimited.
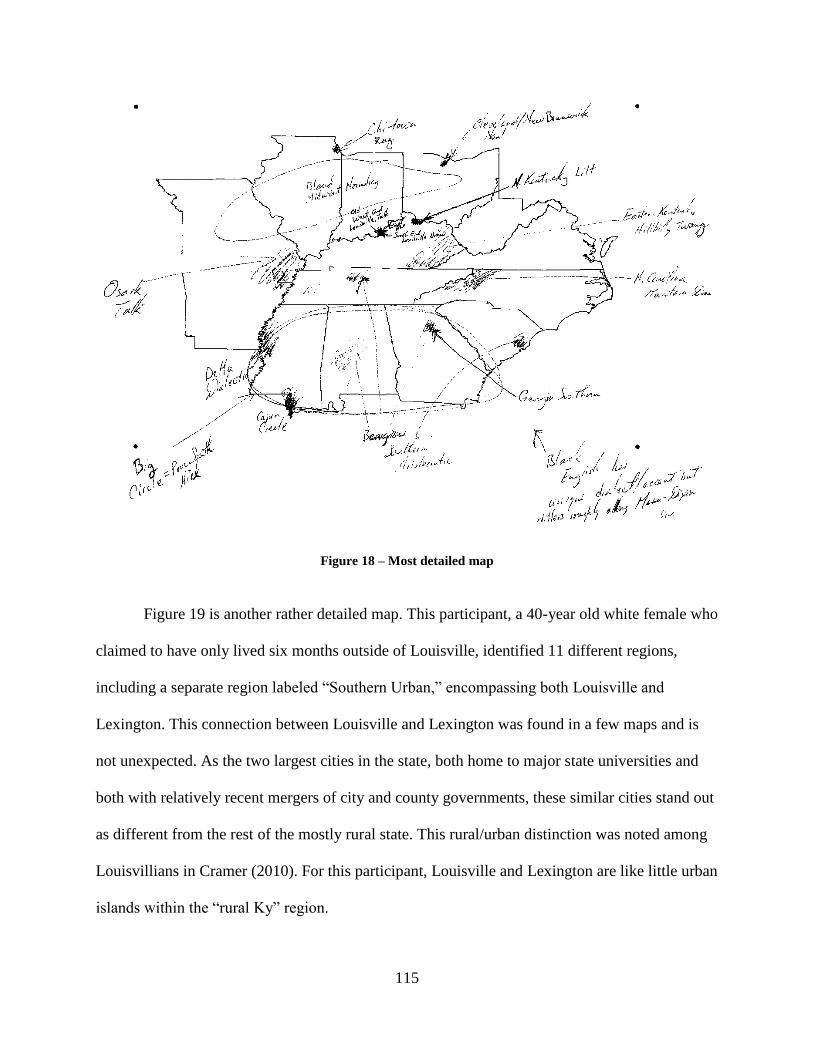
115
Figure 18 – Most detailed map
Figure 19 is another rather detailed map. This participant, a 40-year old white female who
claimed to have only lived six months outside of Louisville, identified 11 different regions,
including a separate region labeled “Southern Urban,” encompassing both Louisville and
Lexington. This connection between Louisville and Lexington was found in a few maps and is
not unexpected. As the two largest cities in the state, both home to major state universities and
both with relatively recent mergers of city and county governments, these similar cities stand out
as different from the rest of the mostly rural state. This rural/urban distinction was noted among
Louisvillians in Cramer (2010). For this participant, Louisville and Lexington are like little urban
islands within the “rural Ky” region.
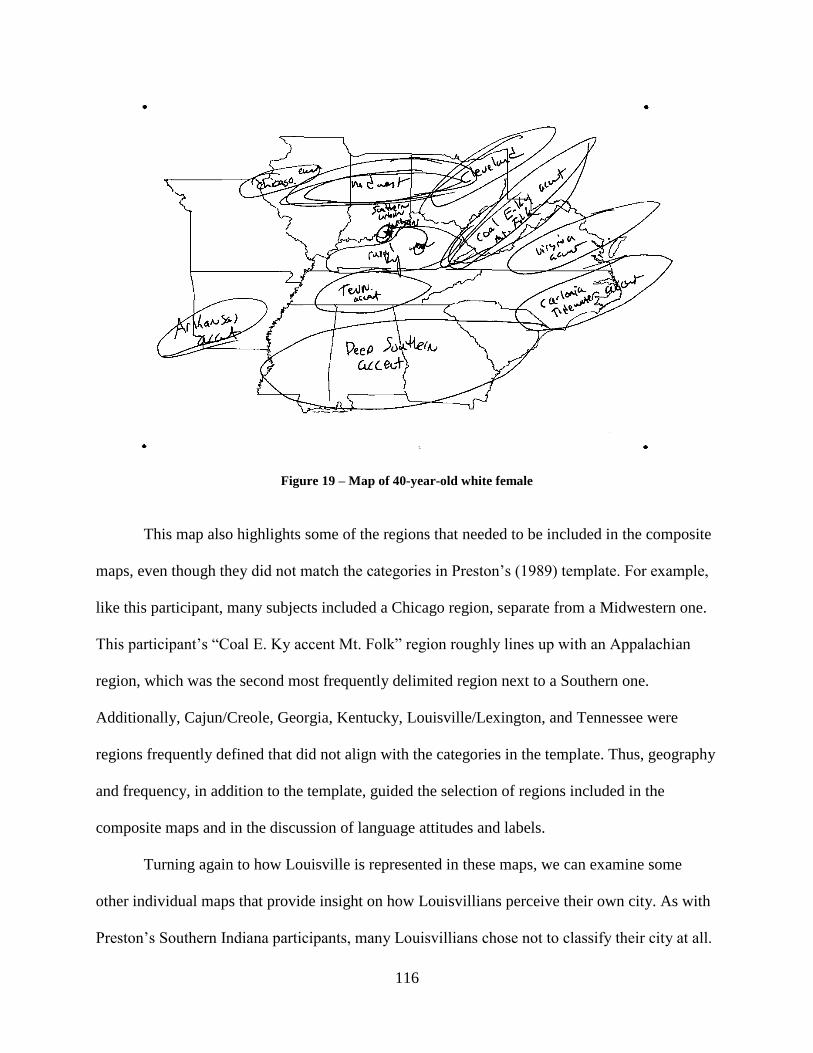
116
Figure 19 – Map of 40-year-old white female
This map also highlights some of the regions that needed to be included in the composite
maps, even though they did not match the categories in Preston‟s (1989) template. For example,
like this participant, many subjects included a Chicago region, separate from a Midwestern one.
This participant‟s “Coal E. Ky accent Mt. Folk” region roughly lines up with an Appalachian
region, which was the second most frequently delimited region next to a Southern one.
Additionally, Cajun/Creole, Georgia, Kentucky, Louisville/Lexington, and Tennessee were
regions frequently defined that did not align with the categories in the template. Thus, geography
and frequency, in addition to the template, guided the selection of regions included in the
composite maps and in the discussion of language attitudes and labels.
Turning again to how Louisville is represented in these maps, we can examine some
other individual maps that provide insight on how Louisvillians perceive their own city. As with
Preston‟s Southern Indiana participants, many Louisvillians chose not to classify their city at all.
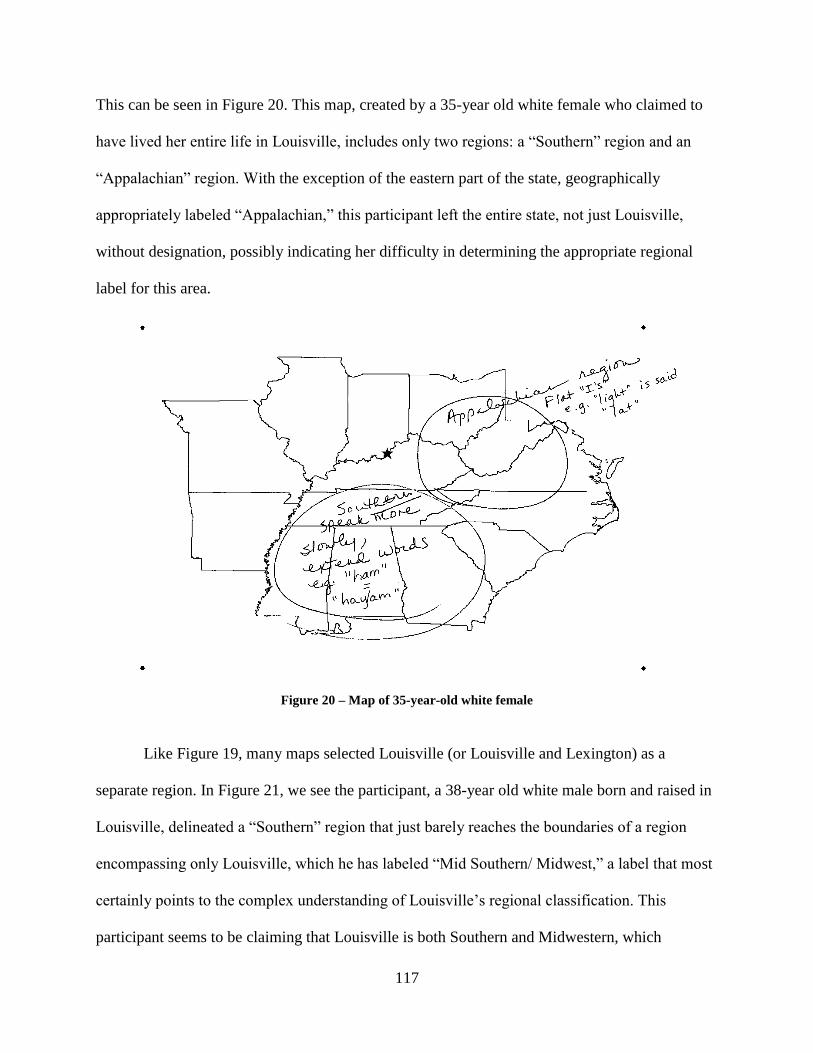
117
This can be seen in Figure 20. This map, created by a 35-year old white female who claimed to
have lived her entire life in Louisville, includes only two regions: a “Southern” region and an
“Appalachian” region. With the exception of the eastern part of the state, geographically
appropriately labeled “Appalachian,” this participant left the entire state, not just Louisville,
without designation, possibly indicating her difficulty in determining the appropriate regional
label for this area.
Figure 20 – Map of 35-year-old white female
Like Figure 19, many maps selected Louisville (or Louisville and Lexington) as a
separate region. In Figure 21, we see the participant, a 38-year old white male born and raised in
Louisville, delineated a “Southern” region that just barely reaches the boundaries of a region
encompassing only Louisville, which he has labeled “Mid Southern/ Midwest,” a label that most
certainly points to the complex understanding of Louisville‟s regional classification. This
participant seems to be claiming that Louisville is both Southern and Midwestern, which
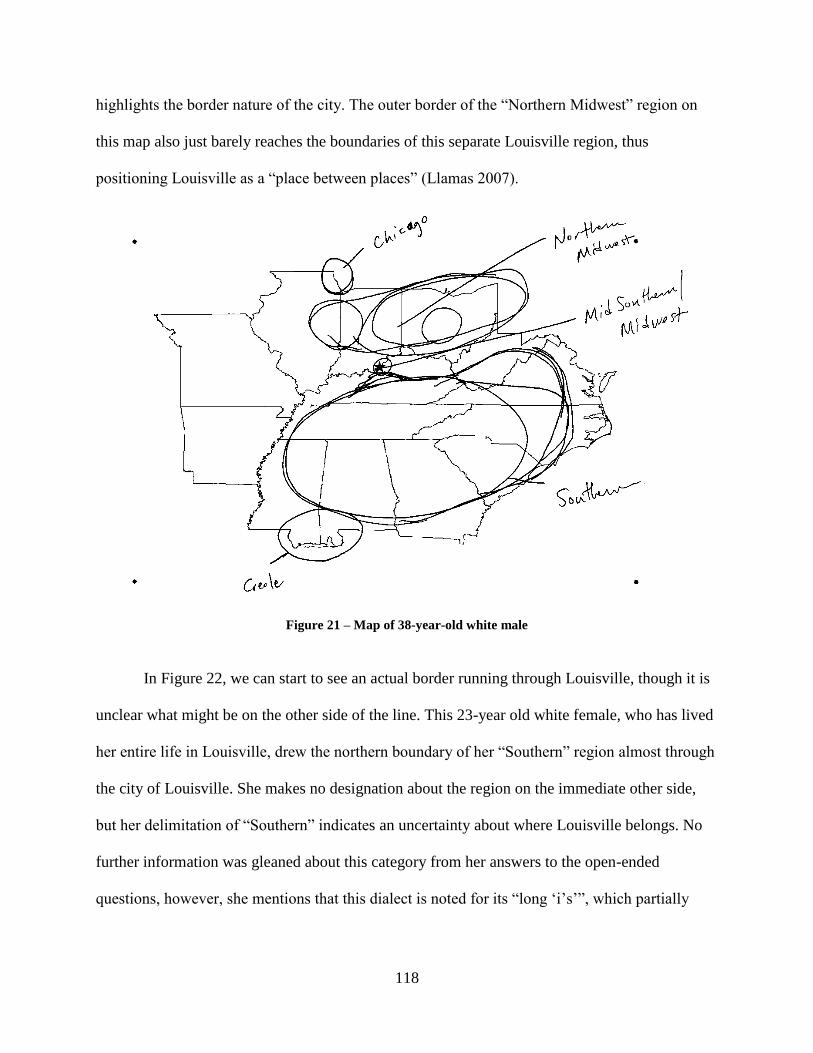
118
highlights the border nature of the city. The outer border of the “Northern Midwest” region on
this map also just barely reaches the boundaries of this separate Louisville region, thus
positioning Louisville as a “place between places” (Llamas 2007).
Figure 21 – Map of 38-year-old white male
In Figure 22, we can start to see an actual border running through Louisville, though it is
unclear what might be on the other side of the line. This 23-year old white female, who has lived
her entire life in Louisville, drew the northern boundary of her “Southern” region almost through
the city of Louisville. She makes no designation about the region on the immediate other side,
but her delimitation of “Southern” indicates an uncertainty about where Louisville belongs. No
further information was gleaned about this category from her answers to the open-ended
questions, however, she mentions that this dialect is noted for its “long „i‟s‟”, which partially
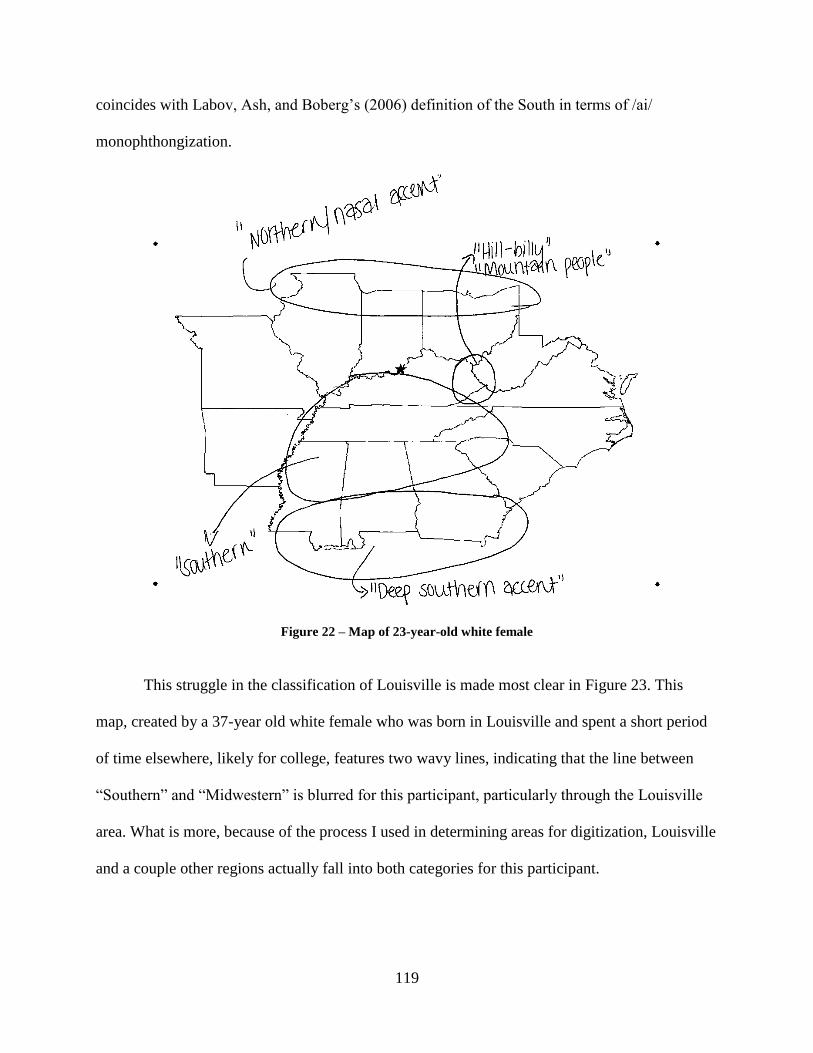
119
coincides with Labov, Ash, and Boberg‟s (2006) definition of the South in terms of /ai/
monophthongization.
Figure 22 – Map of 23-year-old white female
This struggle in the classification of Louisville is made most clear in Figure 23. This
map, created by a 37-year old white female who was born in Louisville and spent a short period
of time elsewhere, likely for college, features two wavy lines, indicating that the line between
“Southern” and “Midwestern” is blurred for this participant, particularly through the Louisville
area. What is more, because of the process I used in determining areas for digitization, Louisville
and a couple other regions actually fall into both categories for this participant.
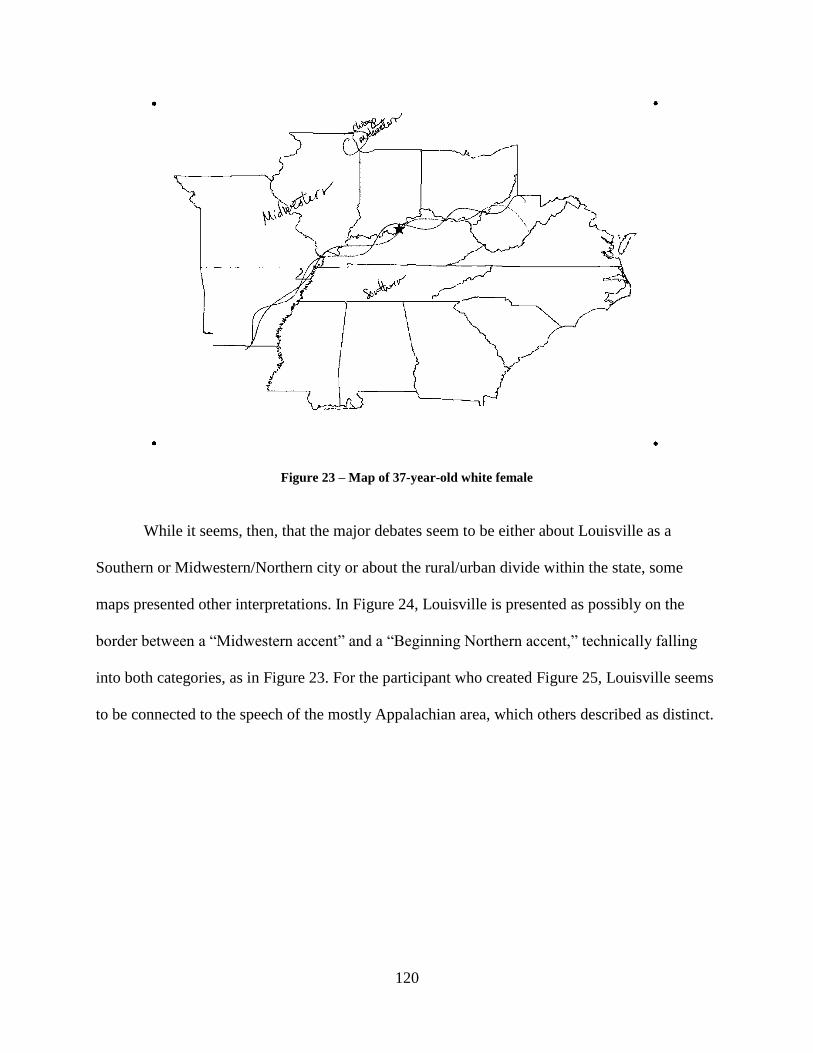
120
Figure 23 – Map of 37-year-old white female
While it seems, then, that the major debates seem to be either about Louisville as a
Southern or Midwestern/Northern city or about the rural/urban divide within the state, some
maps presented other interpretations. In Figure 24, Louisville is presented as possibly on the
border between a “Midwestern accent” and a “Beginning Northern accent,” technically falling
into both categories, as in Figure 23. For the participant who created Figure 25, Louisville seems
to be connected to the speech of the mostly Appalachian area, which others described as distinct.
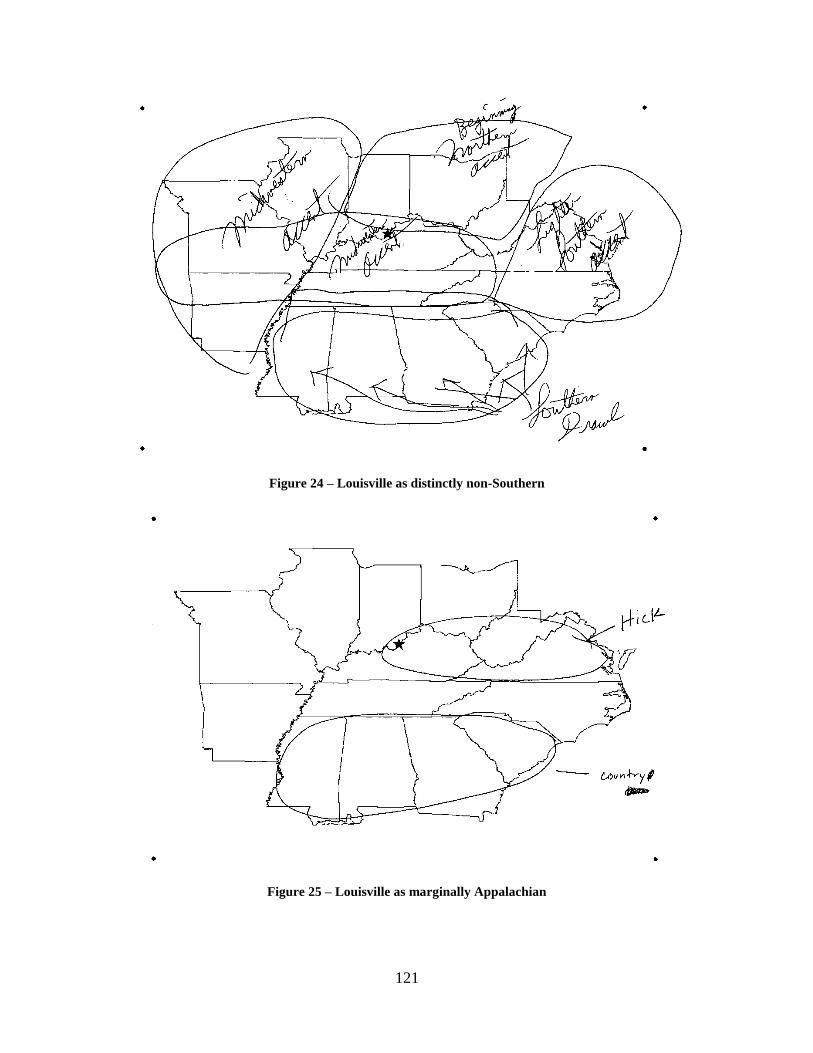
121
Figure 24 – Louisville as distinctly non-Southern
Figure 25 – Louisville as marginally Appalachian
122
This section has shown that there are varying interpretations about where Louisville is
located in the linguistic landscape of the United States. While some participants squarely place
Louisville in one region or another, many choose to make it a separate region altogether and
others present rather blurry boundaries in the vicinity of the city. Of course, these are individual
perceptions about the dialect situation, which can be anecdotal at best. To get an overall picture
of how Louisvillians see the dialect map, we turn to composite maps which highlight the regions
designated by the group as a whole.
2.2 Composite Maps
As noted in Chapter 4, the complete free choice of labels presents analytical difficulty in
perceptual dialectological studies, particularly in the construction of composite maps. To address
this issue, each individual label was linked to overarching category names, which were devised
based on Preston‟s (1989) template, geographical delimitations, and frequency of occurrence.
For example, since “Appalachia” was a rather common label, which usually encompassed at
least some of the geographic area of the Appalachian Mountains (i.e. on this map, eastern
Kentucky, West Virginia, and parts of Ohio, Virginia, Tennessee, North Carolina, South
Carolina, Georgia, and Mississippi), other regions that encompassed this geographic area but did
not necessarily use the label “Appalachia” were included under this overarching category.
Language attitudes information was consulted as well, to assure the correct classification.
For example, when participants linked a particular label to the speech of people who live in the
mountains, this label was also subsumed under the “Appalachia” overarching category. Table 5
is a list of the overarching categories that were used in the creation of the composite map. It also
lists all individual labels that fell into each category, and the number in parentheses indicates the
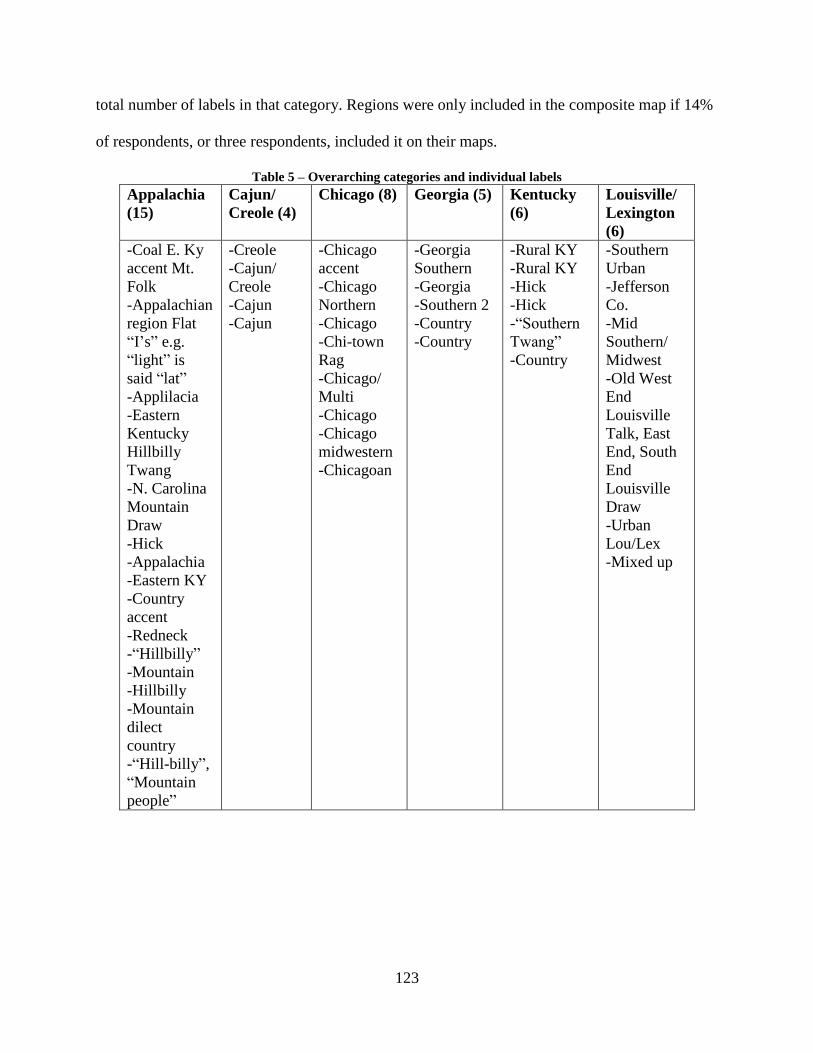
123
total number of labels in that category. Regions were only included in the composite map if 14%
of respondents, or three respondents, included it on their maps.
Table 5 – Overarching categories and individual labels
Appalachia
(15)
Cajun/
Creole (4)
Chicago (8) Georgia (5) Kentucky
(6)
Louisville/
Lexington
(6)
-Coal E. Ky
accent Mt.
Folk
-Appalachian
region Flat
“I‟s” e.g.
“light” is
said “lat”
-Applilacia
-Eastern
Kentucky
Hillbilly
Twang
-N. Carolina
Mountain
Draw
-Hick
-Appalachia
-Eastern KY
-Country
accent
-Redneck
-“Hillbilly”
-Mountain
-Hillbilly
-Mountain
dilect
country
-“Hill-billy”,
“Mountain
people”
-Creole
-Cajun/
Creole
-Cajun
-Cajun
-Chicago
accent
-Chicago
Northern
-Chicago
-Chi-town
Rag
-Chicago/
Multi
-Chicago
-Chicago
midwestern
-Chicagoan
-Georgia
Southern
-Georgia
-Southern 2
-Country
-Country
-Rural KY
-Rural KY
-Hick
-Hick
-“Southern
Twang”
-Country
-Southern
Urban
-Jefferson
Co.
-Mid
Southern/
Midwest
-Old West
End
Louisville
Talk, East
End, South
End
Louisville
Draw
-Urban
Lou/Lex
-Mixed up
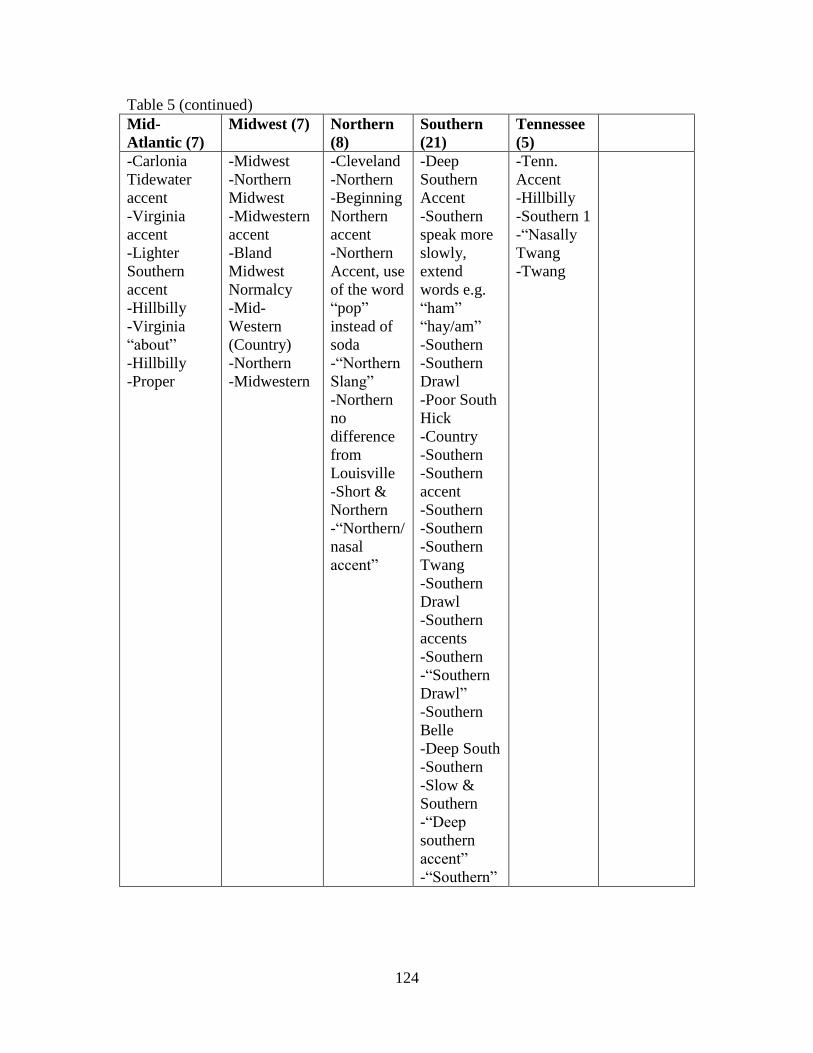
124
Table 5 (continued)
Mid-
Atlantic (7)
Midwest (7) Northern
(8)
Southern
(21)
Tennessee
(5)
-Carlonia
Tidewater
accent
-Virginia
accent
-Lighter
Southern
accent
-Hillbilly
-Virginia
“about”
-Hillbilly
-Proper
-Midwest
-Northern
Midwest
-Midwestern
accent
-Bland
Midwest
Normalcy
-Mid-
Western
(Country)
-Northern
-Midwestern
-Cleveland
-Northern
-Beginning
Northern
accent
-Northern
Accent, use
of the word
“pop”
instead of
soda
-“Northern
Slang”
-Northern
no
difference
from
Louisville
-Short &
Northern
-“Northern/
nasal
accent”
-Deep
Southern
Accent
-Southern
speak more
slowly,
extend
words e.g.
“ham”
“hay/am”
-Southern
-Southern
Drawl
-Poor South
Hick
-Country
-Southern
-Southern
accent
-Southern
-Southern
-Southern
Twang
-Southern
Drawl
-Southern
accents
-Southern
-“Southern
Drawl”
-Southern
Belle
-Deep South
-Southern
-Slow &
Southern
-“Deep
southern
accent”
-“Southern”
-Tenn.
Accent
-Hillbilly
-Southern 1
-“Nasally
Twang
-Twang
125
These 11 overarching categories serve as the regional delimiters in the composite map. In
what follows, I present and discuss each of these 11 regions, which appear as individual regions
in Figure 26 through Figure 36. Figure 37 represents the Louisville composite map of these
regions. Each of the individual regional maps includes all responses within that category. The
darkest shading in the region is the area that was included in the most maps, while the lightest
shaded regions represent only one selection. Additionally, even though respondents drew lines
outside of the state boundaries provided in the test instrument, I have cropped the composite
shaded portions to align with state lines, since it is unclear whether participants intended to
indicate anything about the possible adjoining states.
I begin by discussing the region with the overarching label “Appalachia.” In
Figure 26, we see that the core of this region is situated rather accurately in terms of the
geographic space of the Appalachian Mountains, which seemed to be the motivation for
participants who selected this region. The darkest shading is in Eastern Kentucky, an area that
Louisvillians have likely come to know as quite different from their own, whether through
actually visiting the area, as many participants indicated, or simply through stereotypes.
However, as we noted in the section on individual maps, it appears one participant links his
variety of speech in Louisville to the speech of Appalachia. It appears that participants used
geography (or at least their perceptions of geography) to guide their selection for this region.
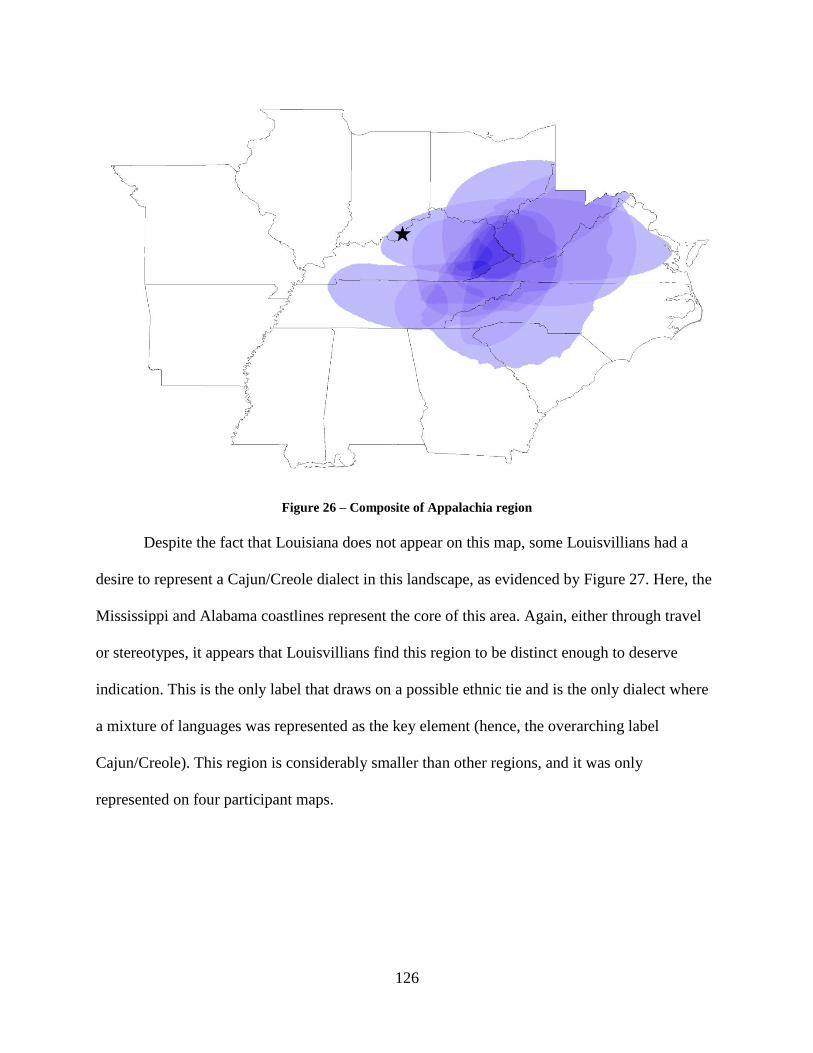
126
Figure 26 – Composite of Appalachia region
Despite the fact that Louisiana does not appear on this map, some Louisvillians had a
desire to represent a Cajun/Creole dialect in this landscape, as evidenced by Figure 27. Here, the
Mississippi and Alabama coastlines represent the core of this area. Again, either through travel
or stereotypes, it appears that Louisvillians find this region to be distinct enough to deserve
indication. This is the only label that draws on a possible ethnic tie and is the only dialect where
a mixture of languages was represented as the key element (hence, the overarching label
Cajun/Creole). This region is considerably smaller than other regions, and it was only
represented on four participant maps.
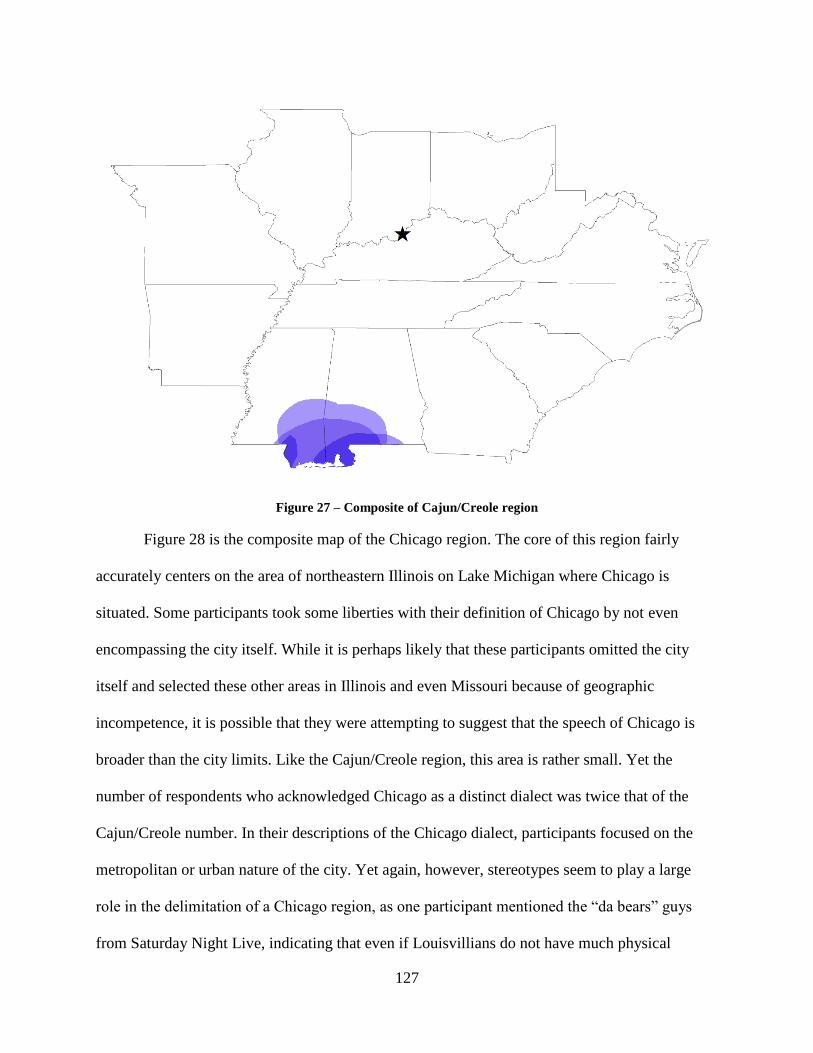
127
Figure 27 – Composite of Cajun/Creole region
Figure 28 is the composite map of the Chicago region. The core of this region fairly
accurately centers on the area of northeastern Illinois on Lake Michigan where Chicago is
situated. Some participants took some liberties with their definition of Chicago by not even
encompassing the city itself. While it is perhaps likely that these participants omitted the city
itself and selected these other areas in Illinois and even Missouri because of geographic
incompetence, it is possible that they were attempting to suggest that the speech of Chicago is
broader than the city limits. Like the Cajun/Creole region, this area is rather small. Yet the
number of respondents who acknowledged Chicago as a distinct dialect was twice that of the
Cajun/Creole number. In their descriptions of the Chicago dialect, participants focused on the
metropolitan or urban nature of the city. Yet again, however, stereotypes seem to play a large
role in the delimitation of a Chicago region, as one participant mentioned the “da bears” guys
from Saturday Night Live, indicating that even if Louisvillians do not have much physical
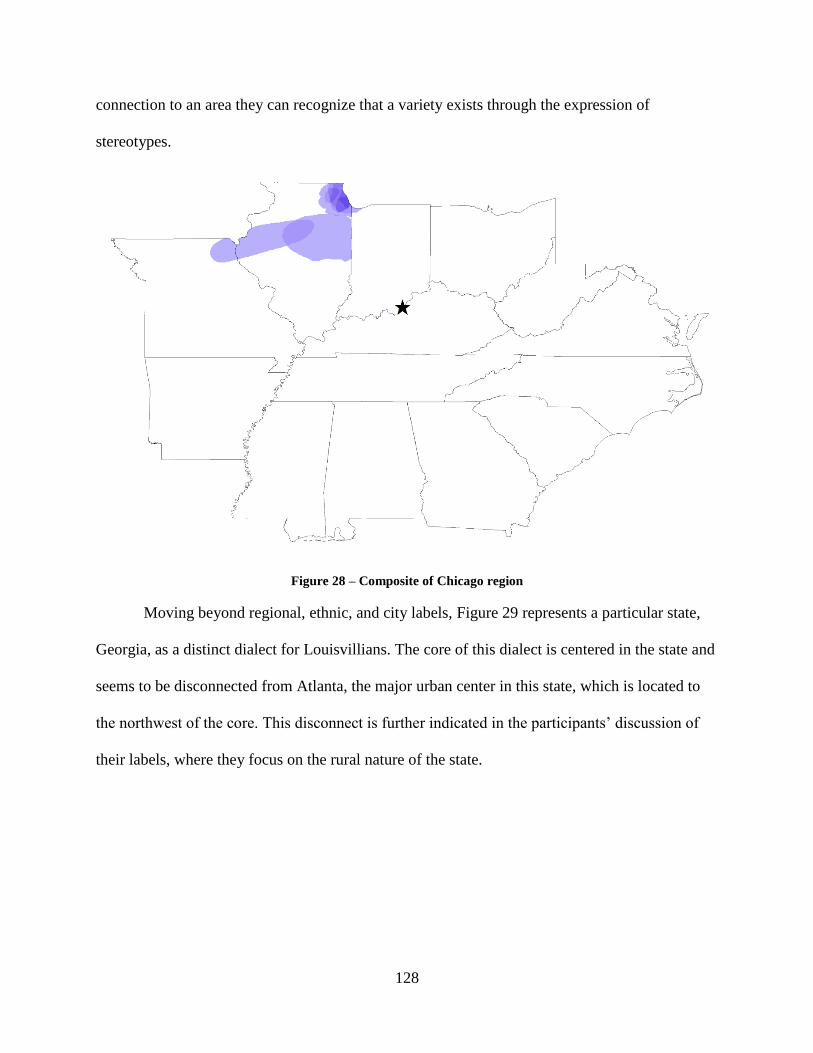
128
connection to an area they can recognize that a variety exists through the expression of
stereotypes.
Figure 28 – Composite of Chicago region
Moving beyond regional, ethnic, and city labels, Figure 29 represents a particular state,
Georgia, as a distinct dialect for Louisvillians. The core of this dialect is centered in the state and
seems to be disconnected from Atlanta, the major urban center in this state, which is located to
the northwest of the core. This disconnect is further indicated in the participants‟ discussion of
their labels, where they focus on the rural nature of the state.
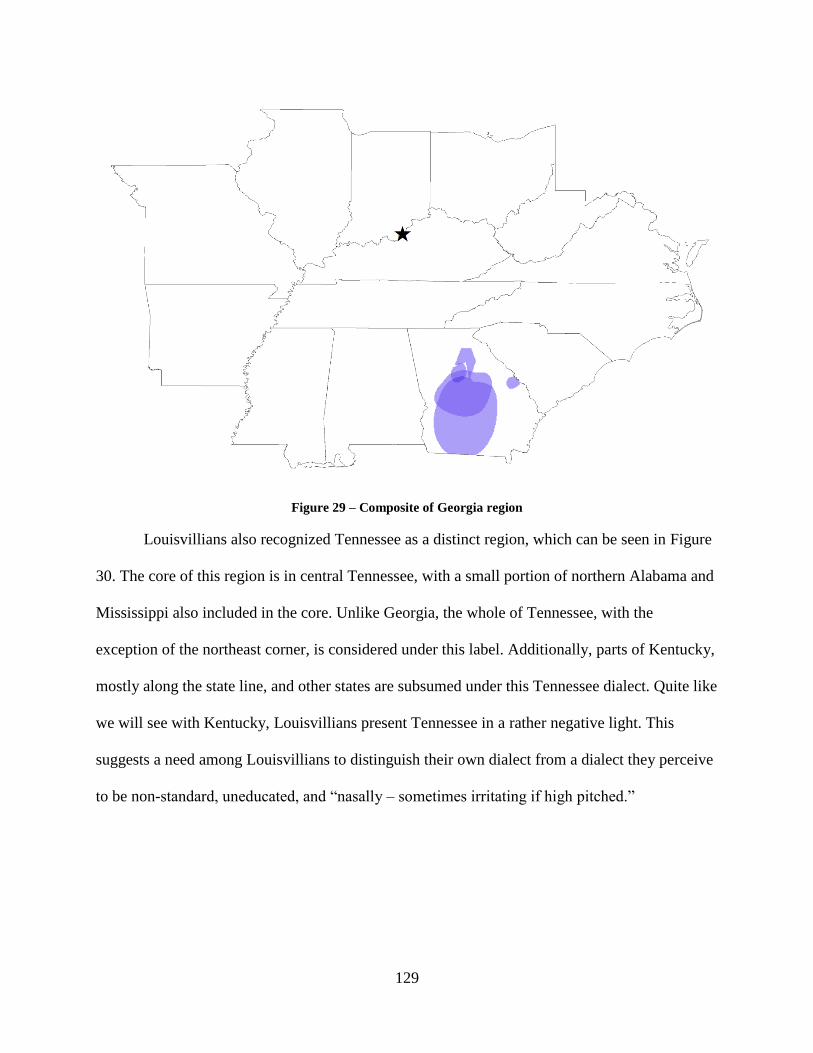
129
Figure 29 – Composite of Georgia region
Louisvillians also recognized Tennessee as a distinct region, which can be seen in Figure
30. The core of this region is in central Tennessee, with a small portion of northern Alabama and
Mississippi also included in the core. Unlike Georgia, the whole of Tennessee, with the
exception of the northeast corner, is considered under this label. Additionally, parts of Kentucky,
mostly along the state line, and other states are subsumed under this Tennessee dialect. Quite like
we will see with Kentucky, Louisvillians present Tennessee in a rather negative light. This
suggests a need among Louisvillians to distinguish their own dialect from a dialect they perceive
to be non-standard, uneducated, and “nasally – sometimes irritating if high pitched.”
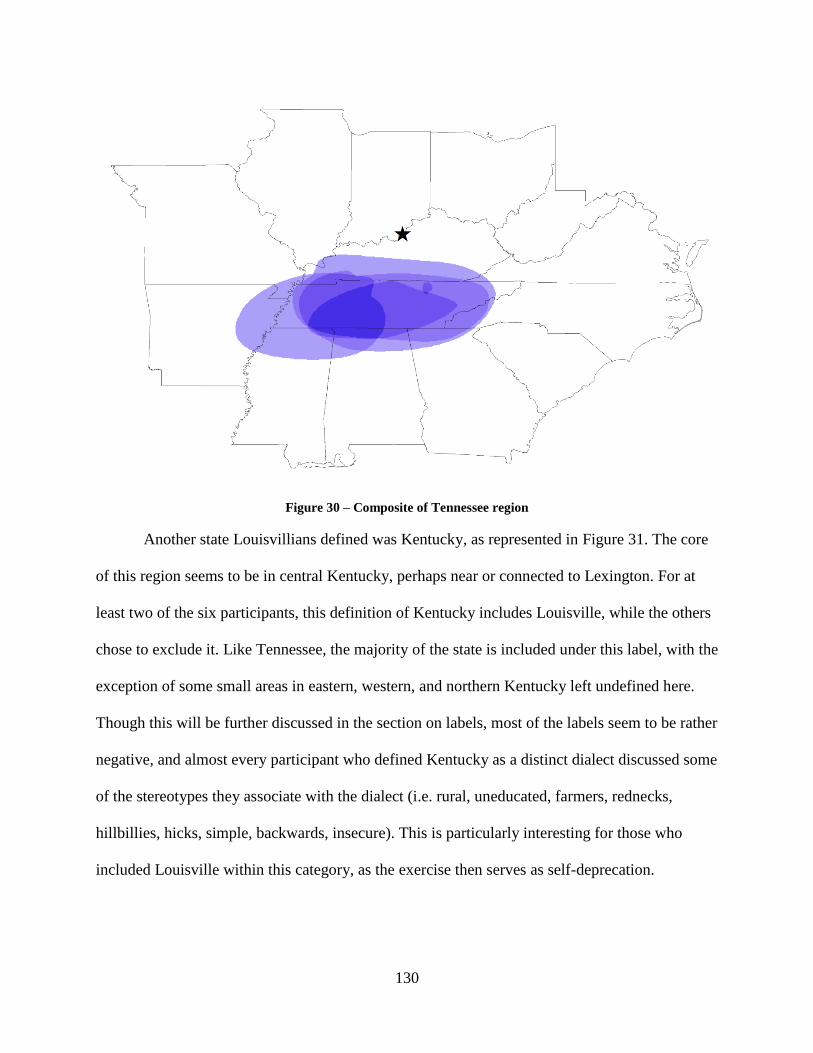
130
Figure 30 – Composite of Tennessee region
Another state Louisvillians defined was Kentucky, as represented in Figure 31. The core
of this region seems to be in central Kentucky, perhaps near or connected to Lexington. For at
least two of the six participants, this definition of Kentucky includes Louisville, while the others
chose to exclude it. Like Tennessee, the majority of the state is included under this label, with the
exception of some small areas in eastern, western, and northern Kentucky left undefined here.
Though this will be further discussed in the section on labels, most of the labels seem to be rather
negative, and almost every participant who defined Kentucky as a distinct dialect discussed some
of the stereotypes they associate with the dialect (i.e. rural, uneducated, farmers, rednecks,
hillbillies, hicks, simple, backwards, insecure). This is particularly interesting for those who
included Louisville within this category, as the exercise then serves as self-deprecation.
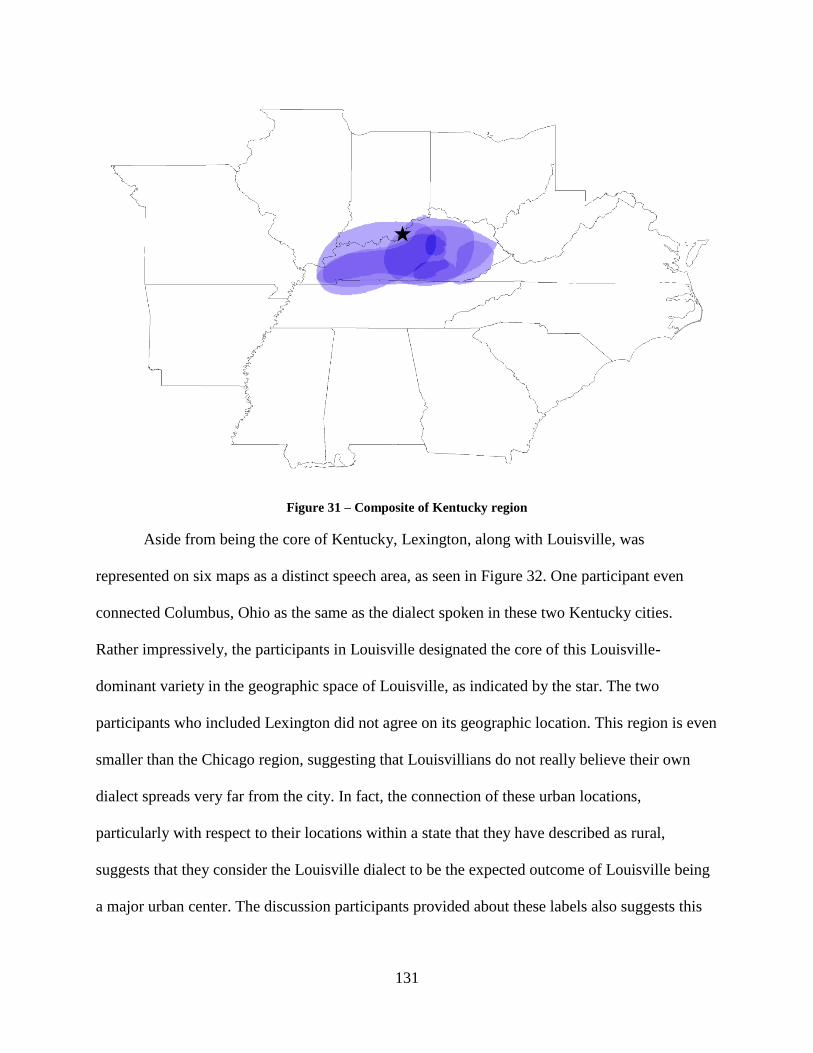
131
Figure 31 – Composite of Kentucky region
Aside from being the core of Kentucky, Lexington, along with Louisville, was
represented on six maps as a distinct speech area, as seen in Figure 32. One participant even
connected Columbus, Ohio as the same as the dialect spoken in these two Kentucky cities.
Rather impressively, the participants in Louisville designated the core of this Louisville-
dominant variety in the geographic space of Louisville, as indicated by the star. The two
participants who included Lexington did not agree on its geographic location. This region is even
smaller than the Chicago region, suggesting that Louisvillians do not really believe their own
dialect spreads very far from the city. In fact, the connection of these urban locations,
particularly with respect to their locations within a state that they have described as rural,
suggests that they consider the Louisville dialect to be the expected outcome of Louisville being
a major urban center. The discussion participants provided about these labels also suggests this
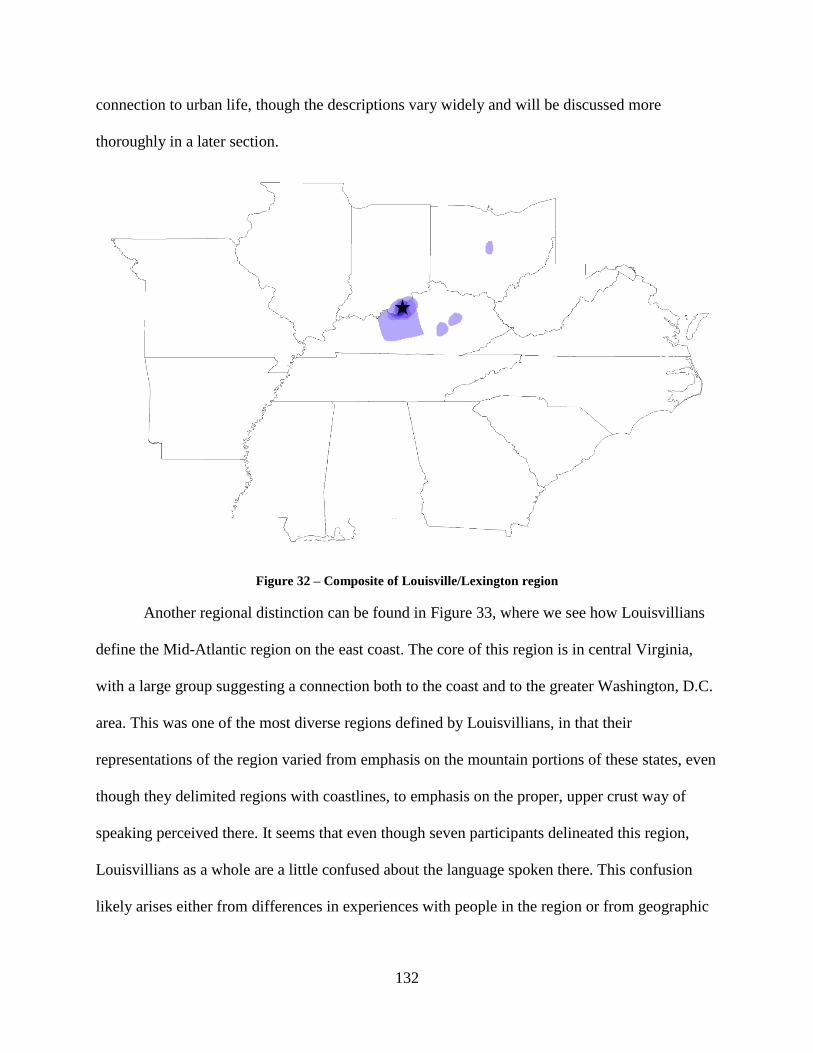
132
connection to urban life, though the descriptions vary widely and will be discussed more
thoroughly in a later section.
Figure 32 – Composite of Louisville/Lexington region
Another regional distinction can be found in Figure 33, where we see how Louisvillians
define the Mid-Atlantic region on the east coast. The core of this region is in central Virginia,
with a large group suggesting a connection both to the coast and to the greater Washington, D.C.
area. This was one of the most diverse regions defined by Louisvillians, in that their
representations of the region varied from emphasis on the mountain portions of these states, even
though they delimited regions with coastlines, to emphasis on the proper, upper crust way of
speaking perceived there. It seems that even though seven participants delineated this region,
Louisvillians as a whole are a little confused about the language spoken there. This confusion
likely arises either from differences in experiences with people in the region or from geographic
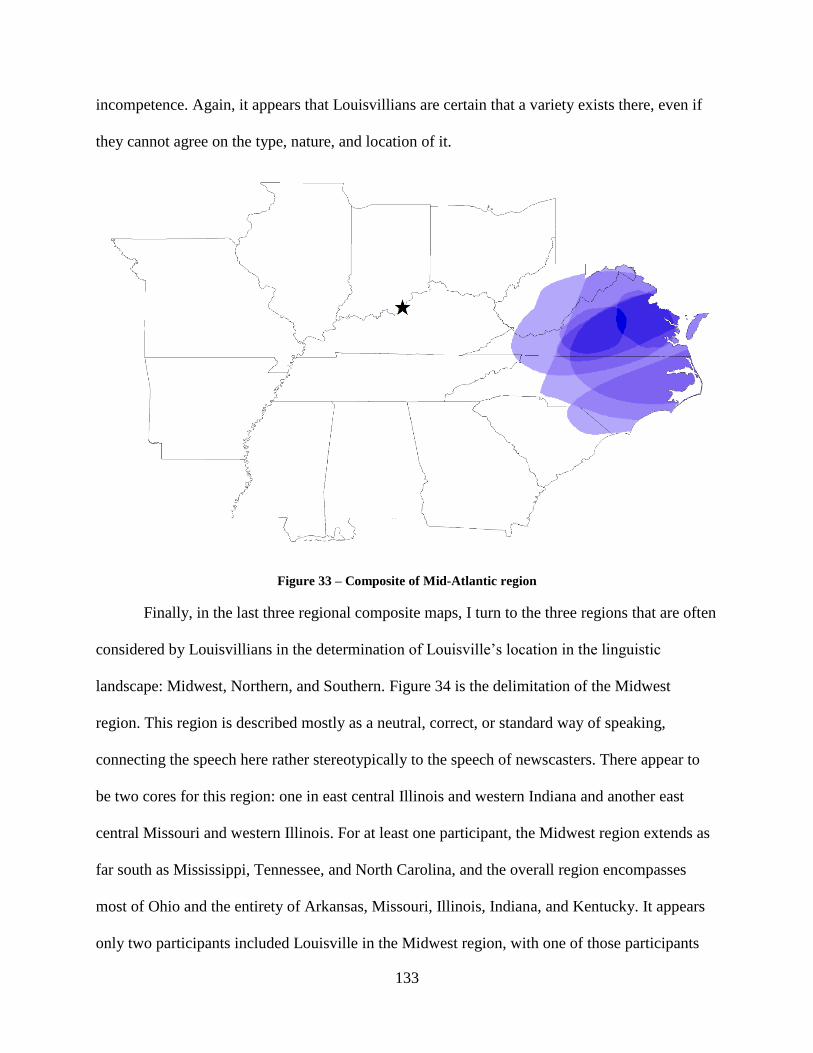
133
incompetence. Again, it appears that Louisvillians are certain that a variety exists there, even if
they cannot agree on the type, nature, and location of it.
Figure 33 – Composite of Mid-Atlantic region
Finally, in the last three regional composite maps, I turn to the three regions that are often
considered by Louisvillians in the determination of Louisville‟s location in the linguistic
landscape: Midwest, Northern, and Southern. Figure 34 is the delimitation of the Midwest
region. This region is described mostly as a neutral, correct, or standard way of speaking,
connecting the speech here rather stereotypically to the speech of newscasters. There appear to
be two cores for this region: one in east central Illinois and western Indiana and another east
central Missouri and western Illinois. For at least one participant, the Midwest region extends as
far south as Mississippi, Tennessee, and North Carolina, and the overall region encompasses
most of Ohio and the entirety of Arkansas, Missouri, Illinois, Indiana, and Kentucky. It appears
only two participants included Louisville in the Midwest region, with one of those participants
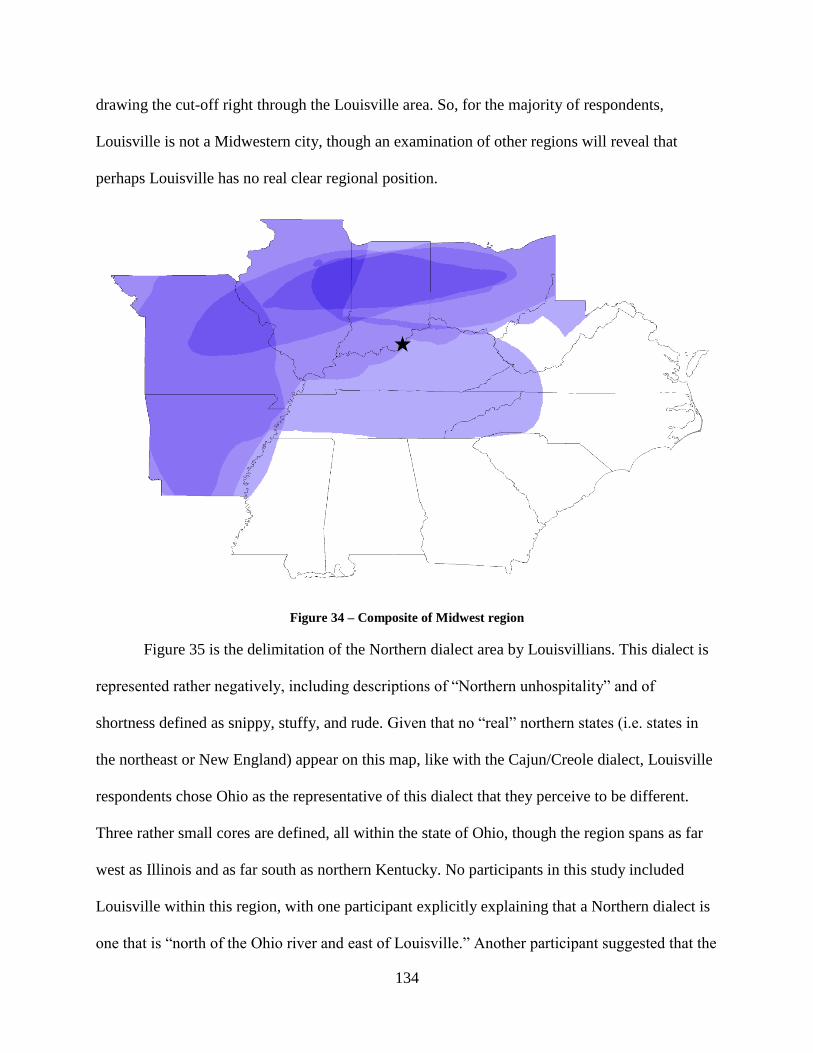
134
drawing the cut-off right through the Louisville area. So, for the majority of respondents,
Louisville is not a Midwestern city, though an examination of other regions will reveal that
perhaps Louisville has no real clear regional position.
Figure 34 – Composite of Midwest region
Figure 35 is the delimitation of the Northern dialect area by Louisvillians. This dialect is
represented rather negatively, including descriptions of “Northern unhospitality” and of
shortness defined as snippy, stuffy, and rude. Given that no “real” northern states (i.e. states in
the northeast or New England) appear on this map, like with the Cajun/Creole dialect, Louisville
respondents chose Ohio as the representative of this dialect that they perceive to be different.
Three rather small cores are defined, all within the state of Ohio, though the region spans as far
west as Illinois and as far south as northern Kentucky. No participants in this study included
Louisville within this region, with one participant explicitly explaining that a Northern dialect is
one that is “north of the Ohio river and east of Louisville.” Another participant suggested that the
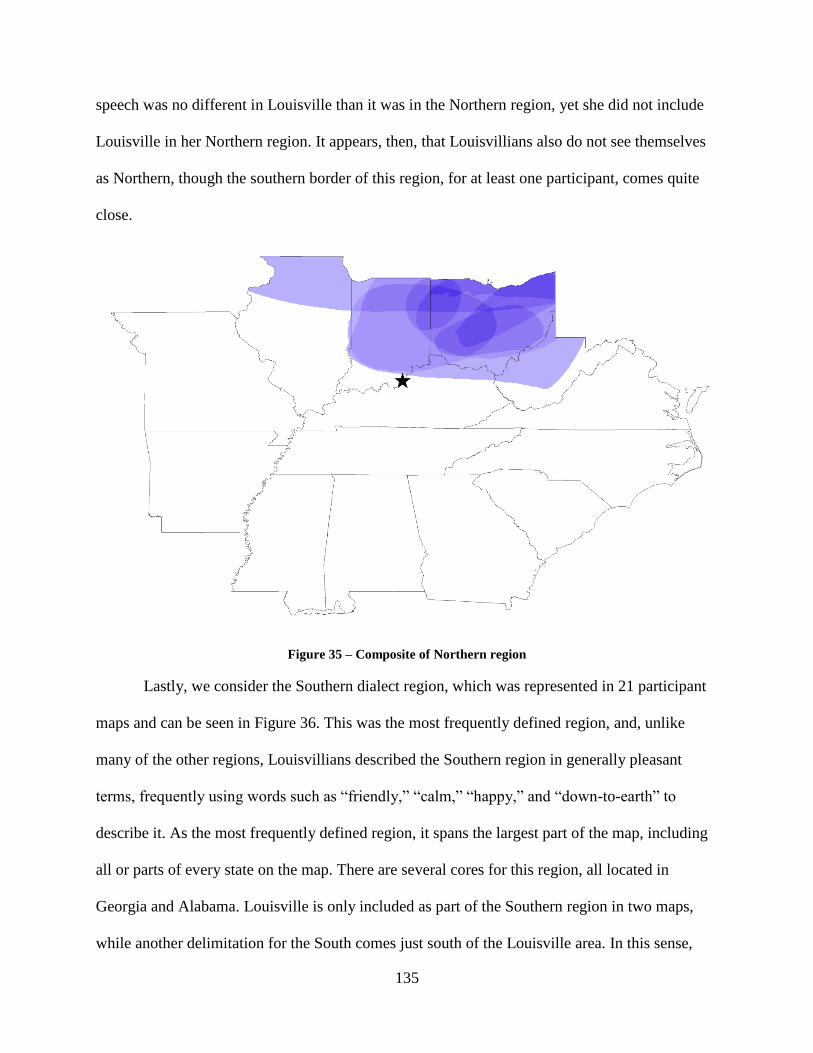
135
speech was no different in Louisville than it was in the Northern region, yet she did not include
Louisville in her Northern region. It appears, then, that Louisvillians also do not see themselves
as Northern, though the southern border of this region, for at least one participant, comes quite
close.
Figure 35 – Composite of Northern region
Lastly, we consider the Southern dialect region, which was represented in 21 participant
maps and can be seen in Figure 36. This was the most frequently defined region, and, unlike
many of the other regions, Louisvillians described the Southern region in generally pleasant
terms, frequently using words such as “friendly,” “calm,” “happy,” and “down-to-earth” to
describe it. As the most frequently defined region, it spans the largest part of the map, including
all or parts of every state on the map. There are several cores for this region, all located in
Georgia and Alabama. Louisville is only included as part of the Southern region in two maps,
while another delimitation for the South comes just south of the Louisville area. In this sense,
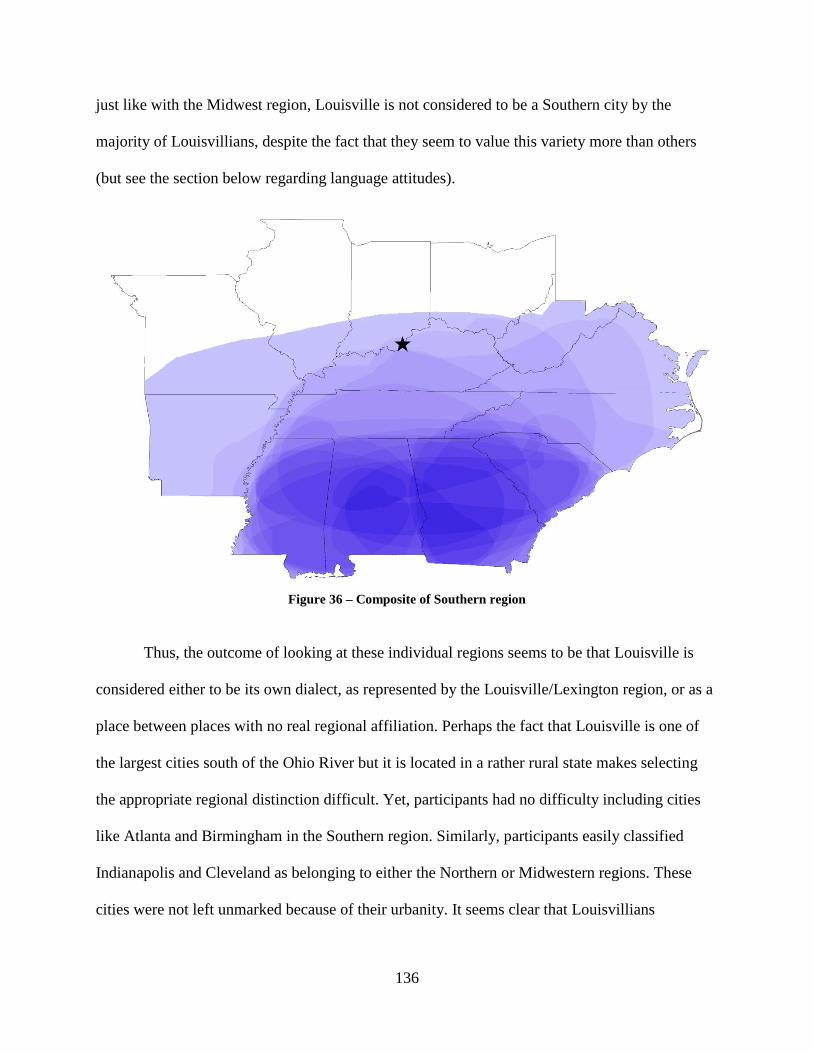
136
just like with the Midwest region, Louisville is not considered to be a Southern city by the
majority of Louisvillians, despite the fact that they seem to value this variety more than others
(but see the section below regarding language attitudes).
Figure 36 – Composite of Southern region
Thus, the outcome of looking at these individual regions seems to be that Louisville is
considered either to be its own dialect, as represented by the Louisville/Lexington region, or as a
place between places with no real regional affiliation. Perhaps the fact that Louisville is one of
the largest cities south of the Ohio River but it is located in a rather rural state makes selecting
the appropriate regional distinction difficult. Yet, participants had no difficulty including cities
like Atlanta and Birmingham in the Southern region. Similarly, participants easily classified
Indianapolis and Cleveland as belonging to either the Northern or Midwestern regions. These
cities were not left unmarked because of their urbanity. It seems clear that Louisvillians
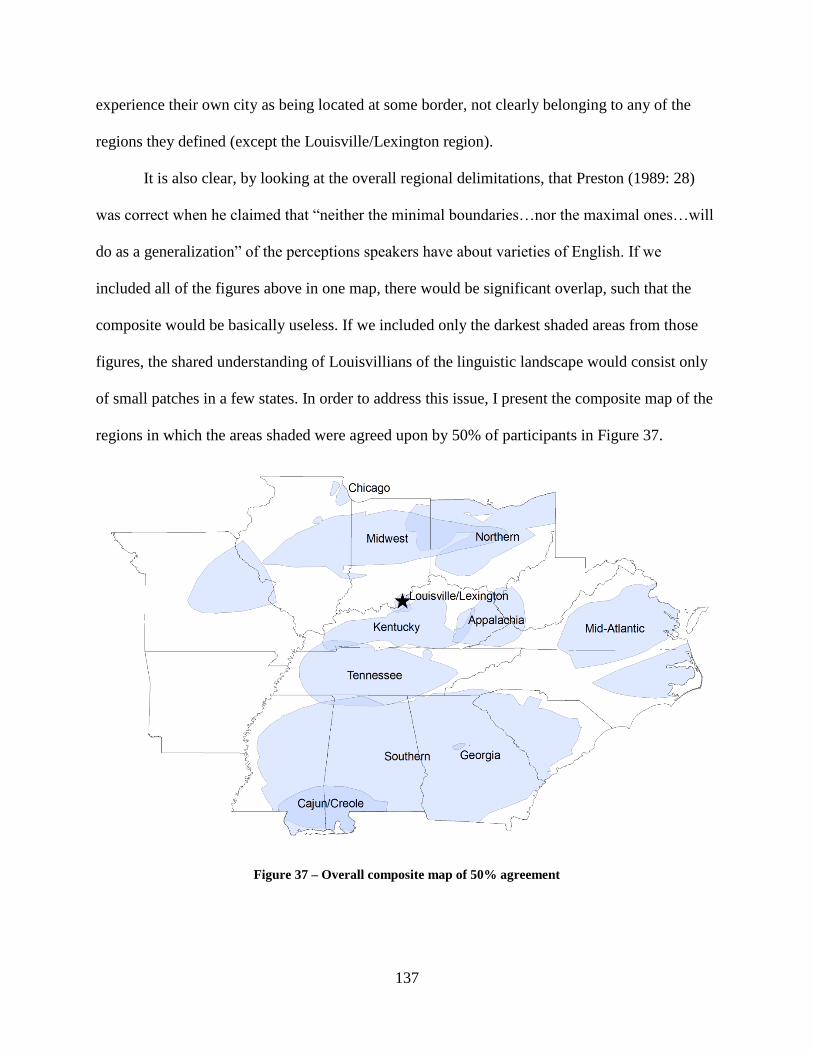
137
experience their own city as being located at some border, not clearly belonging to any of the
regions they defined (except the Louisville/Lexington region).
It is also clear, by looking at the overall regional delimitations, that Preston (1989: 28)
was correct when he claimed that “neither the minimal boundaries…nor the maximal ones…will
do as a generalization” of the perceptions speakers have about varieties of English. If we
included all of the figures above in one map, there would be significant overlap, such that the
composite would be basically useless. If we included only the darkest shaded areas from those
figures, the shared understanding of Louisvillians of the linguistic landscape would consist only
of small patches in a few states. In order to address this issue, I present the composite map of the
regions in which the areas shaded were agreed upon by 50% of participants in Figure 37.
Figure 37 – Overall composite map of 50% agreement
138
This map is rather complex. For instance, both the Mid-Atlantic and Midwest regions
consist of two large disconnected pieces. The Southern region subsumes both the Cajun/Creole
and the Georgia regions, the second of which is but two very small points on the map. Part of the
Midwest region overlaps with the Northern region, which is almost completely confined to Ohio.
This confining to Ohio seems appropriate, as the focus of the Northern region for Louisvillians
was Ohio, given this map. Chicago, which appears as two small regions, stands alone as separate
from the Midwest region, which is also the way in which Louisvillians described it. The
Tennessee and Kentucky regions fill in a great majority of their state space, with only a small
amount of overlap in western Kentucky. Tennessee also overlaps slightly with the Southern
region. The Appalachia region here is much more condensed and, in fact, the fact that it is
centered in eastern Kentucky shows that this representation closely matches the part of
Appalachia that the participants were describing in their surveys. There is some overlap between
the Appalachia and Kentucky regions.
Turning to Louisville‟s position on this map, we see that the Louisville/Lexington region
has been simply trimmed down to only include Louisville, with Lexington no longer being
represented (i.e. less than 50% of participants designated the same area as Lexington). As with
the map featuring all respondent markings for the Louisville/Lexington region, it is clear that
participants have very good knowledge of Louisville‟s geographic location. We also see some
slight overlap of the Louisville/Lexington and Kentucky regions. But Louisville is not situated
within any of the larger regions delimited by Louisvillians, thus making it seem that
Louisvillians mark their city as having no regional affiliation.
139
2.3 Summary
In this section, we have seen varying interpretations of the linguistic landscape of this
portion of the United States from the perspective of Louisvillians. The first part of this section
featured several individual maps, which allowed us to see the many regions Louisvillians
perceive and the many ways in which Louisville is positioned. These maps showed that at least
some participants acknowledge the border situation present in their city, while others were
clearer on their regional interpretation of Louisville. The second part of this section showed the
most common regions delimited by Louisvillians, the ways in which each of these regions was
delimited, and the composite map, which presented the overall picture of the dialect landscape at
a rate of 50% agreement among participants. These maps also show the varying positionings of
Louisville, with the outcome of the composite map being that Louisville has no regional position
at all.
But the picture is not complete without considering, in addition to this broad
understanding of the linguistic landscape of the United States, the attitudes held by participants
about these varieties, specifically as it pertains to their placement of Louisville. In the next
section, I analyze the participants‟ rankings of different varieties of American English with
respect to several social characteristics.
3 Language Attitudes
In the language attitudes survey, participants were asked to list one of the labels they
employed on the hand-drawn map on one page of the survey and were asked to answer a set of
ten questions about that variety, including seven questions about social characteristics on a four
point scale and three open-ended questions. Participants received one page of the survey per
label on map. These survey questions, as they appeared on the survey sheet, can be found in
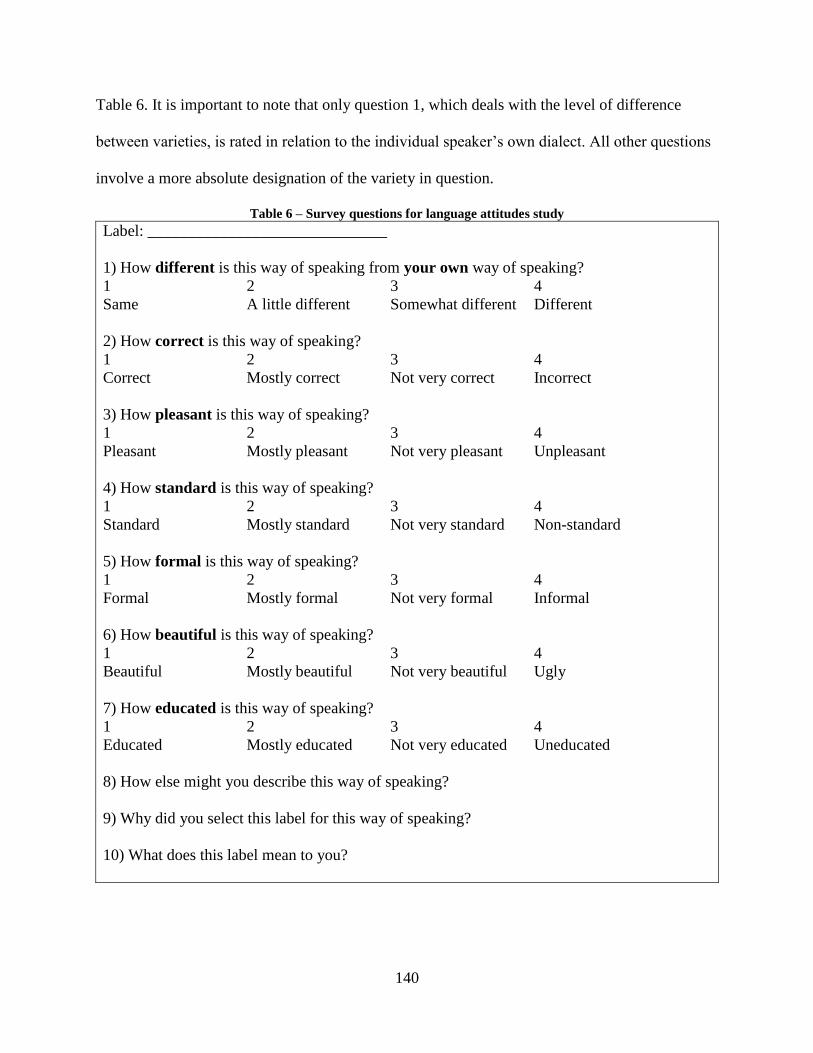
140
Table 6. It is important to note that only question 1, which deals with the level of difference
between varieties, is rated in relation to the individual speaker‟s own dialect. All other questions
involve a more absolute designation of the variety in question.
Table 6 – Survey questions for language attitudes study
Label: ______________________________
1) How different is this way of speaking from your own way of speaking?
1 2 3 4
Same A little different Somewhat different Different
2) How correct is this way of speaking?
1 2 3 4
Correct Mostly correct Not very correct Incorrect
3) How pleasant is this way of speaking?
1 2 3 4
Pleasant Mostly pleasant Not very pleasant Unpleasant
4) How standard is this way of speaking?
1 2 3 4
Standard Mostly standard Not very standard Non-standard
5) How formal is this way of speaking?
1 2 3 4
Formal Mostly formal Not very formal Informal
6) How beautiful is this way of speaking?
1 2 3 4
Beautiful Mostly beautiful Not very beautiful Ugly
7) How educated is this way of speaking?
1 2 3 4
Educated Mostly educated Not very educated Uneducated
8) How else might you describe this way of speaking?
9) Why did you select this label for this way of speaking?
10) What does this label mean to you?
141
To provide an overall picture of how Louisvillians perceive other varieties, I only analyze
the data provided on the language attitudes surveys that corresponds to the regions that were
indicated on the composite map. However, as I noted in Chapter 4, my goal was to include as
much information as possible. Thus, in cases where a participant used multiple labels that all fell
under the same overarching category in the composite map, I incorporated all data sets included
in the language attitudes survey as separate entries. For instance, in Figure 18, the participant
defined three separate dialect groups within Louisville, which were all condensed under the
heading “Louisville/Lexington” for the purposes of the composite map. In the language attitudes
survey, however, each region is included as a separate data set. Even though they are still
subsumed under the same overarching category, we have a broader understanding of how
Louisville is perceived.
The analysis of language attitudes involves the post hoc statistical test known as the
Tukey HSD (Honestly Significant Difference) test. A post hoc analysis is necessary, as the
categories used by participants were not determined before the experiment. This test is a
variation of the t distribution, using instead the studentized range distribution q. This method is
used to compare all pairs of means of every treatment and is used instead of multiple standard t-
tests to reduce the likelihood of type I errors. This method was also selected because it can
handle unequal sample sizes, as found in my data.
Like a t-test, a critical value must be determined in order to decide if the result is
significant. A result is significant if the q value calculated is larger than the q critical value
determined in a distribution table. For q, the distribution table is based on degrees of freedom of
error (dfe) and number of treatments. Unfortunately, q distribution tables are not equipped to
exactly handle my data. These tables list numbers of treatments up to ten, though my data
142
features 11 different groups. Additionally, the dfe listed in the tables includes 60 dfe and jumps
up to 120 dfe, whereas the dfe in my data sets was between 70 and 80. Thus, as a conservative
measure, between 60 and 120 dfe, I selected the higher of the two values under the column for
ten treatments. Based on this, the critical value for my data was 4.65.
For each of the social factors (difference, correctness, pleasantness, standardness,
formality, beauty, and education), I determined the number of responses and the mean values of
the responses for each of the 11 overarching categories. I then ranked the mean values for each
region over the entire category. For instance, in terms of correctness, the Appalachia region, with
a mean score of 3, had the highest mean value, giving it a rank of 11, while the Chicago region,
with a mean score of 1.571429, had the lowest mean value, giving it a rank of 1. That means that
Appalachia is viewed as rather low on the correctness scale and Chicago rather high.
Using the ranking system, I created pairs of regions under each social category. The first
pair was always the lowest and highest ranking means in the group. After performing the
analysis of this pair, the next pair consisted in the region with the lowest ranking mean and the
second highest ranking mean. The analysis continues as such until a result is returned that is not
significant. The pairings start again, this time with the second lowest ranking mean and the
highest ranking mean, again until a result is returned that is not significant. This continues until
the comparison of any first region and the highest ranked region returns a result that is not
significant. Then, as a precautionary measure, one more pairing was analyzed, to assure that no
further significant values would be found. In the case of a tie in rank, the order of the analysis of
the tied regions was based on highest number of responses selecting that label. In the case where
the tied regions had the same number of responses, the analysis was done alphabetically. For
example, in the correctness example above, the first pairing would be Appalachia and Chicago.
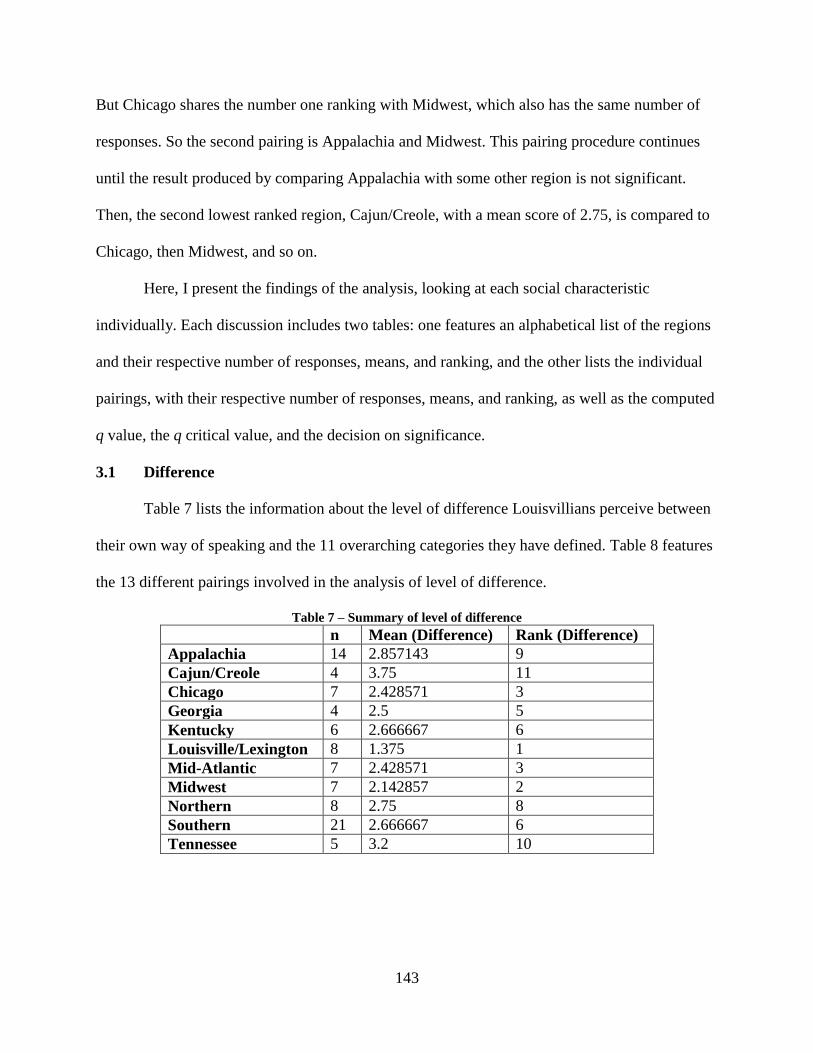
143
But Chicago shares the number one ranking with Midwest, which also has the same number of
responses. So the second pairing is Appalachia and Midwest. This pairing procedure continues
until the result produced by comparing Appalachia with some other region is not significant.
Then, the second lowest ranked region, Cajun/Creole, with a mean score of 2.75, is compared to
Chicago, then Midwest, and so on.
Here, I present the findings of the analysis, looking at each social characteristic
individually. Each discussion includes two tables: one features an alphabetical list of the regions
and their respective number of responses, means, and ranking, and the other lists the individual
pairings, with their respective number of responses, means, and ranking, as well as the computed
q value, the q critical value, and the decision on significance.
3.1 Difference
Table 7 lists the information about the level of difference Louisvillians perceive between
their own way of speaking and the 11 overarching categories they have defined. Table 8 features
the 13 different pairings involved in the analysis of level of difference.
Table 7 – Summary of level of difference
n Mean (Difference) Rank (Difference)
Appalachia 14 2.857143 9
Cajun/Creole 4 3.75 11
Chicago 7 2.428571 3
Georgia 4 2.5 5
Kentucky 6 2.666667 6
Louisville/Lexington 8 1.375 1
Mid-Atlantic 7 2.428571 3
Midwest 7 2.142857 2
Northern 8 2.75 8
Southern 21 2.666667 6
Tennessee 5 3.2 10
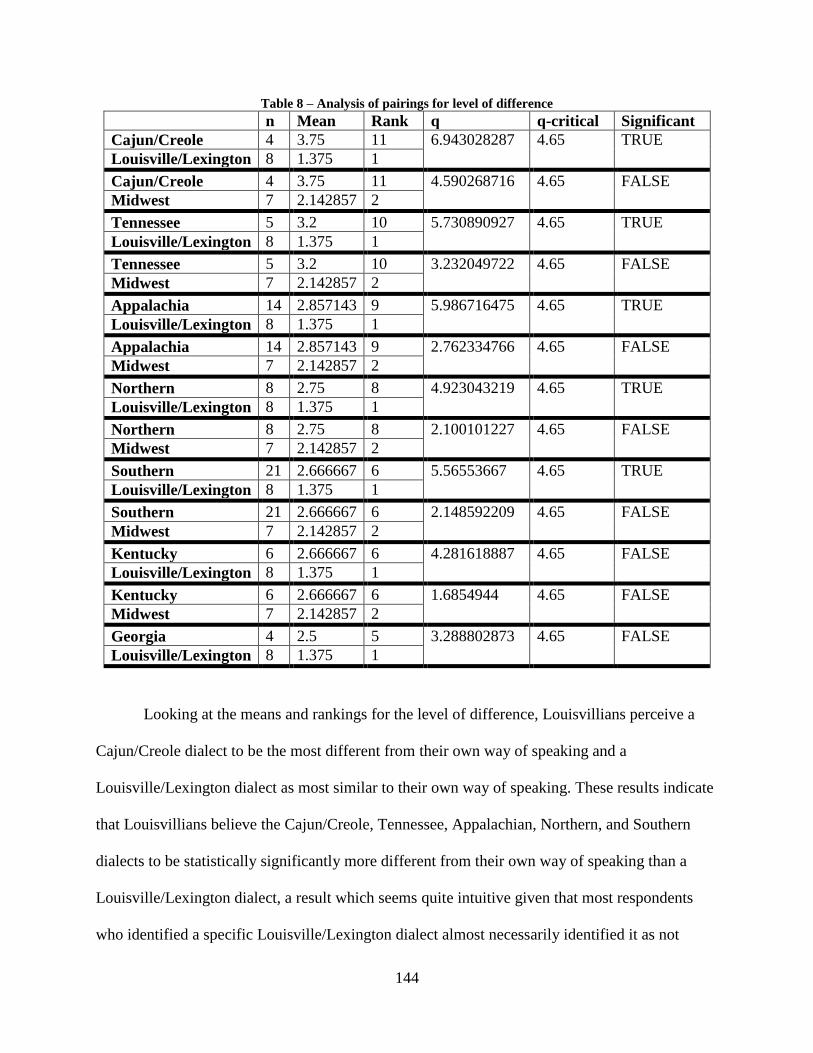
144
Table 8 – Analysis of pairings for level of difference
n Mean Rank q q-critical Significant
Cajun/Creole 4 3.75 11 6.943028287 4.65 TRUE
Louisville/Lexington 8 1.375 1
Cajun/Creole 4 3.75 11 4.590268716 4.65 FALSE
Midwest 7 2.142857 2
Tennessee 5 3.2 10 5.730890927 4.65 TRUE
Louisville/Lexington 8 1.375 1
Tennessee 5 3.2 10 3.232049722 4.65 FALSE
Midwest 7 2.142857 2
Appalachia 14 2.857143 9 5.986716475 4.65 TRUE
Louisville/Lexington 8 1.375 1
Appalachia 14 2.857143 9 2.762334766 4.65 FALSE
Midwest 7 2.142857 2
Northern 8 2.75 8 4.923043219 4.65 TRUE
Louisville/Lexington 8 1.375 1
Northern 8 2.75 8 2.100101227 4.65 FALSE
Midwest 7 2.142857 2
Southern 21 2.666667 6 5.56553667 4.65 TRUE
Louisville/Lexington 8 1.375 1
Southern 21 2.666667 6 2.148592209 4.65 FALSE
Midwest 7 2.142857 2
Kentucky 6 2.666667 6 4.281618887 4.65 FALSE
Louisville/Lexington 8 1.375 1
Kentucky 6 2.666667 6 1.6854944 4.65 FALSE
Midwest 7 2.142857 2
Georgia 4 2.5 5 3.288802873 4.65 FALSE
Louisville/Lexington 8 1.375 1
Looking at the means and rankings for the level of difference, Louisvillians perceive a
Cajun/Creole dialect to be the most different from their own way of speaking and a
Louisville/Lexington dialect as most similar to their own way of speaking. These results indicate
that Louisvillians believe the Cajun/Creole, Tennessee, Appalachian, Northern, and Southern
dialects to be statistically significantly more different from their own way of speaking than a
Louisville/Lexington dialect, a result which seems quite intuitive given that most respondents
who identified a specific Louisville/Lexington dialect almost necessarily identified it as not
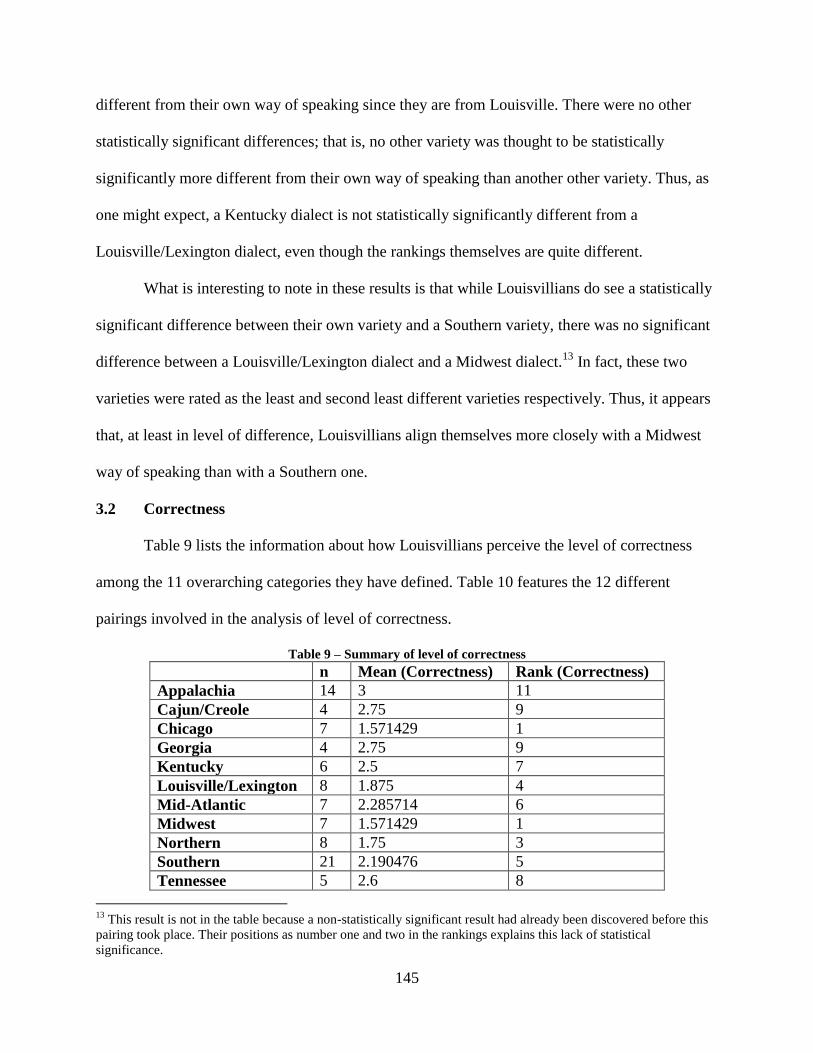
145
different from their own way of speaking since they are from Louisville. There were no other
statistically significant differences; that is, no other variety was thought to be statistically
significantly more different from their own way of speaking than another other variety. Thus, as
one might expect, a Kentucky dialect is not statistically significantly different from a
Louisville/Lexington dialect, even though the rankings themselves are quite different.
What is interesting to note in these results is that while Louisvillians do see a statistically
significant difference between their own variety and a Southern variety, there was no significant
difference between a Louisville/Lexington dialect and a Midwest dialect.13
In fact, these two
varieties were rated as the least and second least different varieties respectively. Thus, it appears
that, at least in level of difference, Louisvillians align themselves more closely with a Midwest
way of speaking than with a Southern one.
3.2 Correctness
Table 9 lists the information about how Louisvillians perceive the level of correctness
among the 11 overarching categories they have defined. Table 10 features the 12 different
pairings involved in the analysis of level of correctness.
Table 9 – Summary of level of correctness
n Mean (Correctness) Rank (Correctness)
Appalachia 14 3 11
Cajun/Creole 4 2.75 9
Chicago 7 1.571429 1
Georgia 4 2.75 9
Kentucky 6 2.5 7
Louisville/Lexington 8 1.875 4
Mid-Atlantic 7 2.285714 6
Midwest 7 1.571429 1
Northern 8 1.75 3
Southern 21 2.190476 5
Tennessee 5 2.6 8
13
This result is not in the table because a non-statistically significant result had already been discovered before this
pairing took place. Their positions as number one and two in the rankings explains this lack of statistical
significance.
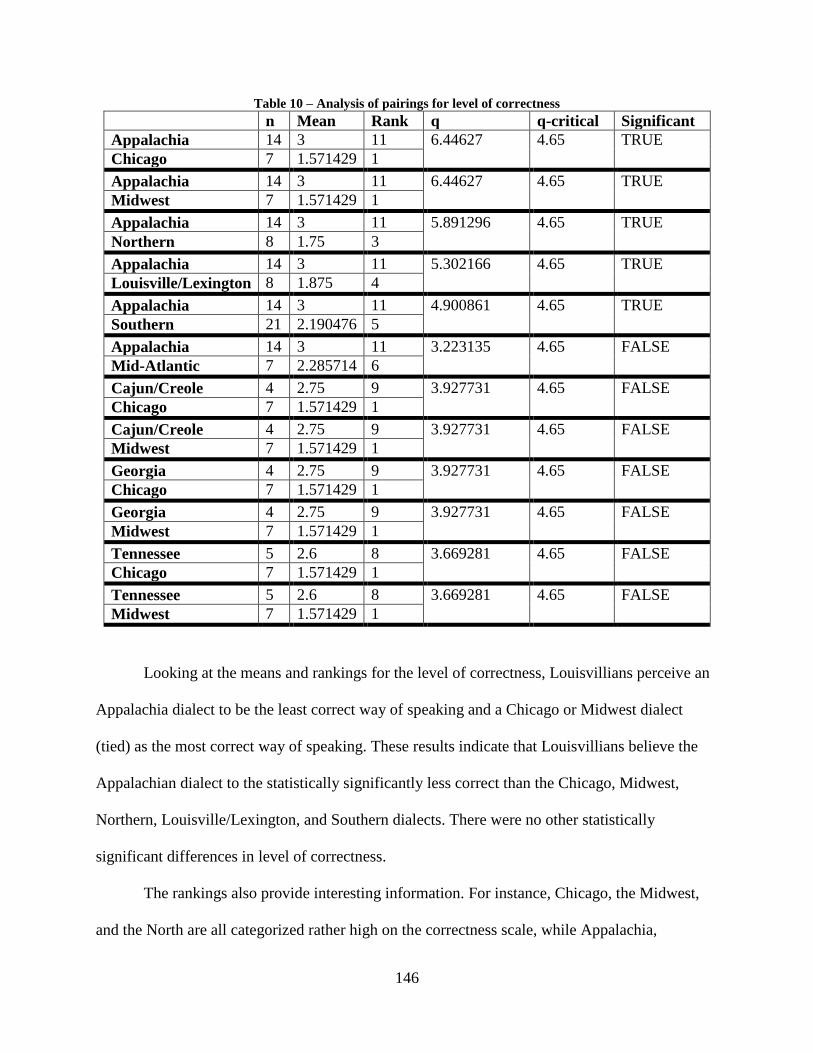
146
Table 10 – Analysis of pairings for level of correctness
n Mean Rank q q-critical Significant
Appalachia 14 3 11 6.44627 4.65 TRUE
Chicago 7 1.571429 1
Appalachia 14 3 11 6.44627 4.65 TRUE
Midwest 7 1.571429 1
Appalachia 14 3 11 5.891296 4.65 TRUE
Northern 8 1.75 3
Appalachia 14 3 11 5.302166 4.65 TRUE
Louisville/Lexington 8 1.875 4
Appalachia 14 3 11 4.900861 4.65 TRUE
Southern 21 2.190476 5
Appalachia 14 3 11 3.223135 4.65 FALSE
Mid-Atlantic 7 2.285714 6
Cajun/Creole 4 2.75 9 3.927731 4.65 FALSE
Chicago 7 1.571429 1
Cajun/Creole 4 2.75 9 3.927731 4.65 FALSE
Midwest 7 1.571429 1
Georgia 4 2.75 9 3.927731 4.65 FALSE
Chicago 7 1.571429 1
Georgia 4 2.75 9 3.927731 4.65 FALSE
Midwest 7 1.571429 1
Tennessee 5 2.6 8 3.669281 4.65 FALSE
Chicago 7 1.571429 1
Tennessee 5 2.6 8 3.669281 4.65 FALSE
Midwest 7 1.571429 1
Looking at the means and rankings for the level of correctness, Louisvillians perceive an
Appalachia dialect to be the least correct way of speaking and a Chicago or Midwest dialect
(tied) as the most correct way of speaking. These results indicate that Louisvillians believe the
Appalachian dialect to the statistically significantly less correct than the Chicago, Midwest,
Northern, Louisville/Lexington, and Southern dialects. There were no other statistically
significant differences in level of correctness.
The rankings also provide interesting information. For instance, Chicago, the Midwest,
and the North are all categorized rather high on the correctness scale, while Appalachia,
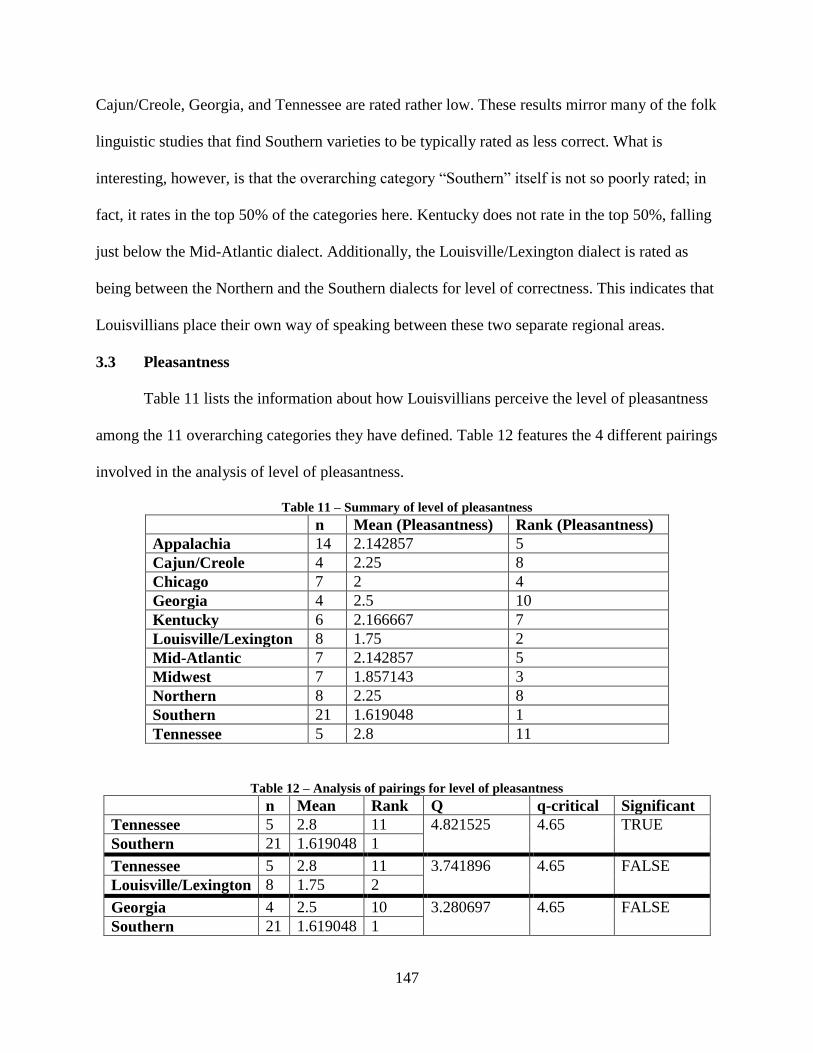
147
Cajun/Creole, Georgia, and Tennessee are rated rather low. These results mirror many of the folk
linguistic studies that find Southern varieties to be typically rated as less correct. What is
interesting, however, is that the overarching category “Southern” itself is not so poorly rated; in
fact, it rates in the top 50% of the categories here. Kentucky does not rate in the top 50%, falling
just below the Mid-Atlantic dialect. Additionally, the Louisville/Lexington dialect is rated as
being between the Northern and the Southern dialects for level of correctness. This indicates that
Louisvillians place their own way of speaking between these two separate regional areas.
3.3 Pleasantness
Table 11 lists the information about how Louisvillians perceive the level of pleasantness
among the 11 overarching categories they have defined. Table 12 features the 4 different pairings
involved in the analysis of level of pleasantness.
Table 11 – Summary of level of pleasantness
n Mean (Pleasantness) Rank (Pleasantness)
Appalachia 14 2.142857 5
Cajun/Creole 4 2.25 8
Chicago 7 2 4
Georgia 4 2.5 10
Kentucky 6 2.166667 7
Louisville/Lexington 8 1.75 2
Mid-Atlantic 7 2.142857 5
Midwest 7 1.857143 3
Northern 8 2.25 8
Southern 21 1.619048 1
Tennessee 5 2.8 11
Table 12 – Analysis of pairings for level of pleasantness
n Mean Rank Q q-critical Significant
Tennessee 5 2.8 11 4.821525 4.65 TRUE
Southern 21 1.619048 1
Tennessee 5 2.8 11 3.741896 4.65 FALSE
Louisville/Lexington 8 1.75 2
Georgia 4 2.5 10 3.280697 4.65 FALSE
Southern 21 1.619048 1
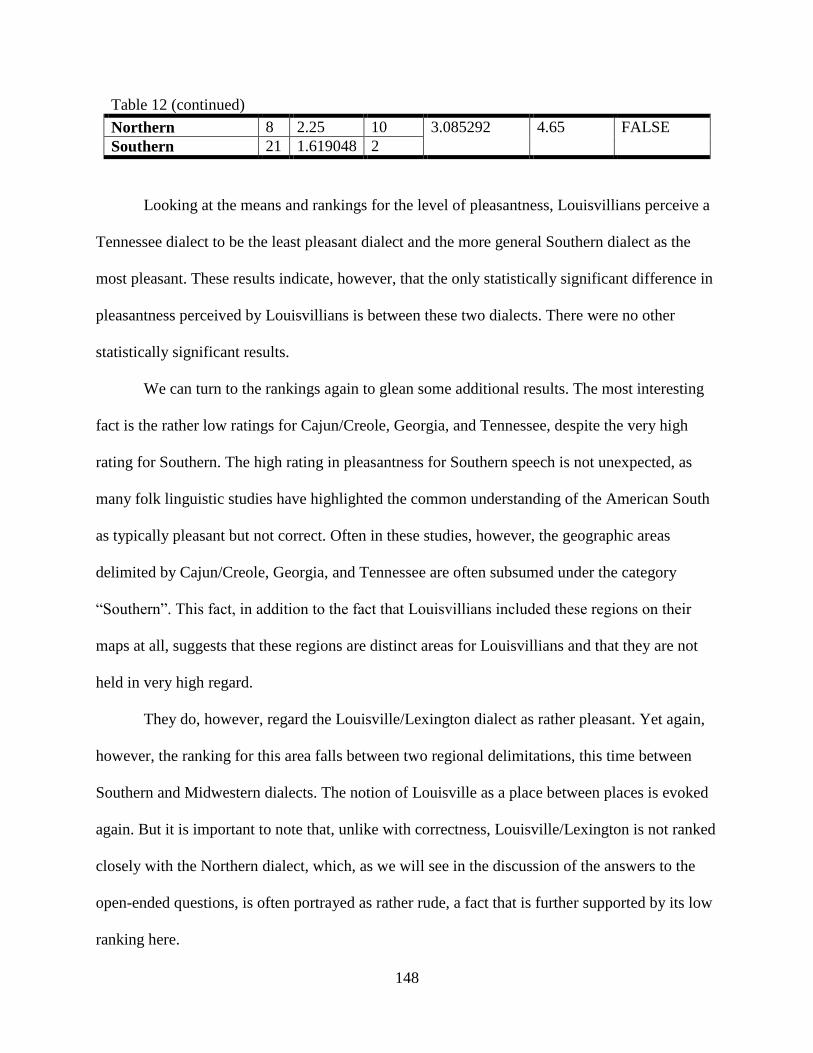
148
Table 12 (continued)
Northern 8 2.25 10 3.085292 4.65 FALSE
Southern 21 1.619048 2
Looking at the means and rankings for the level of pleasantness, Louisvillians perceive a
Tennessee dialect to be the least pleasant dialect and the more general Southern dialect as the
most pleasant. These results indicate, however, that the only statistically significant difference in
pleasantness perceived by Louisvillians is between these two dialects. There were no other
statistically significant results.
We can turn to the rankings again to glean some additional results. The most interesting
fact is the rather low ratings for Cajun/Creole, Georgia, and Tennessee, despite the very high
rating for Southern. The high rating in pleasantness for Southern speech is not unexpected, as
many folk linguistic studies have highlighted the common understanding of the American South
as typically pleasant but not correct. Often in these studies, however, the geographic areas
delimited by Cajun/Creole, Georgia, and Tennessee are often subsumed under the category
“Southern”. This fact, in addition to the fact that Louisvillians included these regions on their
maps at all, suggests that these regions are distinct areas for Louisvillians and that they are not
held in very high regard.
They do, however, regard the Louisville/Lexington dialect as rather pleasant. Yet again,
however, the ranking for this area falls between two regional delimitations, this time between
Southern and Midwestern dialects. The notion of Louisville as a place between places is evoked
again. But it is important to note that, unlike with correctness, Louisville/Lexington is not ranked
closely with the Northern dialect, which, as we will see in the discussion of the answers to the
open-ended questions, is often portrayed as rather rude, a fact that is further supported by its low
ranking here.
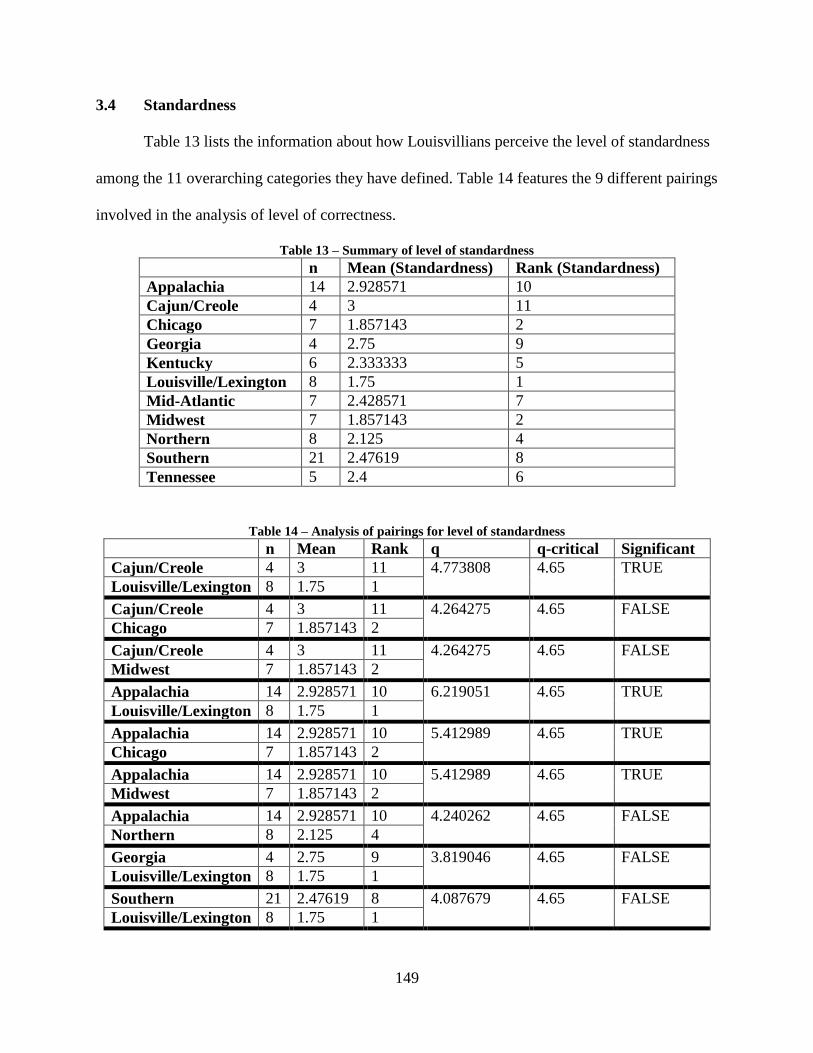
149
3.4 Standardness
Table 13 lists the information about how Louisvillians perceive the level of standardness
among the 11 overarching categories they have defined. Table 14 features the 9 different pairings
involved in the analysis of level of correctness.
Table 13 – Summary of level of standardness
n Mean (Standardness) Rank (Standardness)
Appalachia 14 2.928571 10
Cajun/Creole 4 3 11
Chicago 7 1.857143 2
Georgia 4 2.75 9
Kentucky 6 2.333333 5
Louisville/Lexington 8 1.75 1
Mid-Atlantic 7 2.428571 7
Midwest 7 1.857143 2
Northern 8 2.125 4
Southern 21 2.47619 8
Tennessee 5 2.4 6
Table 14 – Analysis of pairings for level of standardness
n Mean Rank q q-critical Significant
Cajun/Creole 4 3 11 4.773808 4.65 TRUE
Louisville/Lexington 8 1.75 1
Cajun/Creole 4 3 11 4.264275 4.65 FALSE
Chicago 7 1.857143 2
Cajun/Creole 4 3 11 4.264275 4.65 FALSE
Midwest 7 1.857143 2
Appalachia 14 2.928571 10 6.219051 4.65 TRUE
Louisville/Lexington 8 1.75 1
Appalachia 14 2.928571 10 5.412989 4.65 TRUE
Chicago 7 1.857143 2
Appalachia 14 2.928571 10 5.412989 4.65 TRUE
Midwest 7 1.857143 2
Appalachia 14 2.928571 10 4.240262 4.65 FALSE
Northern 8 2.125 4
Georgia 4 2.75 9 3.819046 4.65 FALSE
Louisville/Lexington 8 1.75 1
Southern 21 2.47619 8 4.087679 4.65 FALSE
Louisville/Lexington 8 1.75 1
150
Looking at the means and rankings for the level of standardness, Louisvillians perceive a
Cajun/Creole dialect to be the least standard dialect and the Louisville/Lexington dialect as the
most standard. These results indicate that Louisvillians believe the Cajun/Creole and Appalachia
dialects to be statistically significantly less standard than the Louisville/Lexington dialect. Also,
the Appalachian dialect was rated as statistically significantly less standard than the Chicago and
Midwest dialects. There were no other statistically significant results.
The rankings indicate that, like with level of correctness, Louisvillians believe many of
the dialects in the Southern United States to be less standard than the Chicago, Midwest, and
Northern dialects. However, unlike with the level of correctness, the Southern dialect itself also
receives a poor rating in terms of standardness. This fact suggests that standardness must mean
something different to Louisvillians than correctness. This is further evidenced by the
information provided in the open-ended questions, where many people seems to associate these
non-Southern varieties with news anchors, and the news industry is often associated with a
variety known as Standard American English.
Of interest here also is the rating of Louisville/Lexington as most standard. At this point
in the analysis, the level of linguistic security among Louisvillians is unclear. The result here, as
well as the rather high rating given to Louisville/Lexington for pleasantness, might indicate a
level of linguistic security on par with that of Preston‟s (1989) Michigan sample. Yet the
mediocre rating given to Louisville/Lexington in terms of correctness indicates this level of
linguistic security might not be so high.
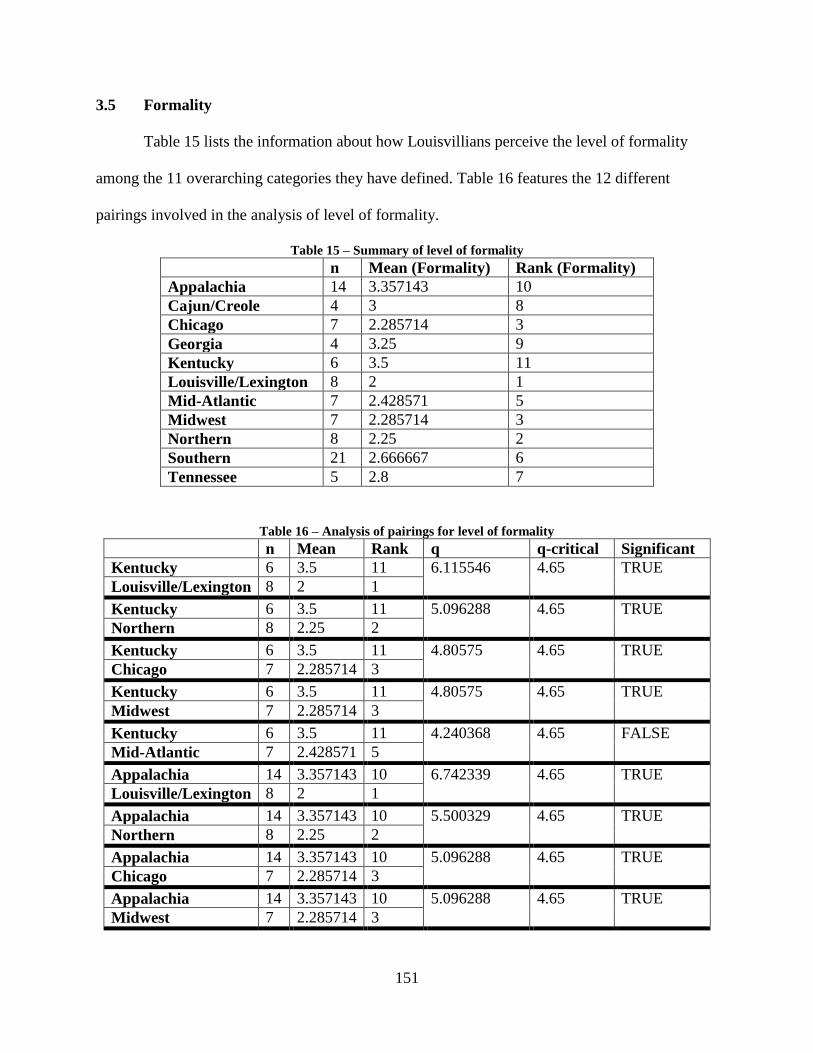
151
3.5 Formality
Table 15 lists the information about how Louisvillians perceive the level of formality
among the 11 overarching categories they have defined. Table 16 features the 12 different
pairings involved in the analysis of level of formality.
Table 15 – Summary of level of formality
n Mean (Formality) Rank (Formality)
Appalachia 14 3.357143 10
Cajun/Creole 4 3 8
Chicago 7 2.285714 3
Georgia 4 3.25 9
Kentucky 6 3.5 11
Louisville/Lexington 8 2 1
Mid-Atlantic 7 2.428571 5
Midwest 7 2.285714 3
Northern 8 2.25 2
Southern 21 2.666667 6
Tennessee 5 2.8 7
Table 16 – Analysis of pairings for level of formality
n Mean Rank q q-critical Significant
Kentucky 6 3.5 11 6.115546 4.65 TRUE
Louisville/Lexington 8 2 1
Kentucky 6 3.5 11 5.096288 4.65 TRUE
Northern 8 2.25 2
Kentucky 6 3.5 11 4.80575 4.65 TRUE
Chicago 7 2.285714 3
Kentucky 6 3.5 11 4.80575 4.65 TRUE
Midwest 7 2.285714 3
Kentucky 6 3.5 11 4.240368 4.65 FALSE
Mid-Atlantic 7 2.428571 5
Appalachia 14 3.357143 10 6.742339 4.65 TRUE
Louisville/Lexington 8 2 1
Appalachia 14 3.357143 10 5.500329 4.65 TRUE
Northern 8 2.25 2
Appalachia 14 3.357143 10 5.096288 4.65 TRUE
Chicago 7 2.285714 3
Appalachia 14 3.357143 10 5.096288 4.65 TRUE
Midwest 7 2.285714 3
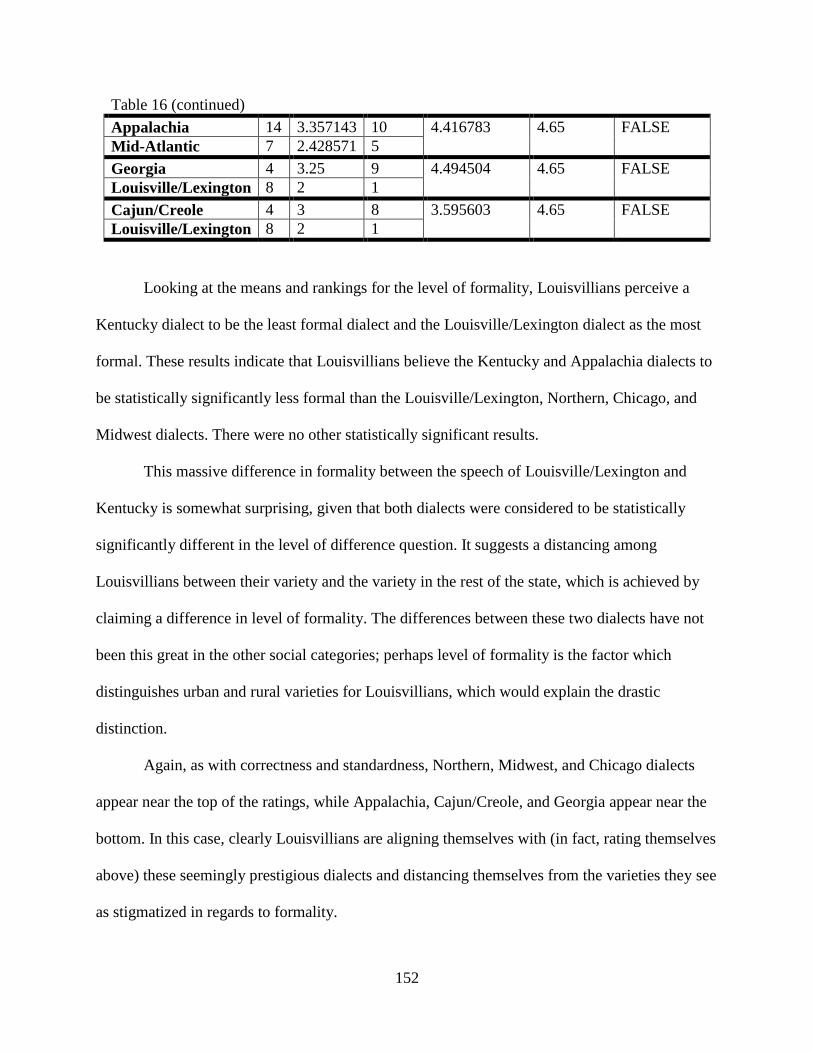
152
Table 16 (continued)
Appalachia 14 3.357143 10 4.416783 4.65 FALSE
Mid-Atlantic 7 2.428571 5
Georgia 4 3.25 9 4.494504 4.65 FALSE
Louisville/Lexington 8 2 1
Cajun/Creole 4 3 8 3.595603 4.65 FALSE
Louisville/Lexington 8 2 1
Looking at the means and rankings for the level of formality, Louisvillians perceive a
Kentucky dialect to be the least formal dialect and the Louisville/Lexington dialect as the most
formal. These results indicate that Louisvillians believe the Kentucky and Appalachia dialects to
be statistically significantly less formal than the Louisville/Lexington, Northern, Chicago, and
Midwest dialects. There were no other statistically significant results.
This massive difference in formality between the speech of Louisville/Lexington and
Kentucky is somewhat surprising, given that both dialects were considered to be statistically
significantly different in the level of difference question. It suggests a distancing among
Louisvillians between their variety and the variety in the rest of the state, which is achieved by
claiming a difference in level of formality. The differences between these two dialects have not
been this great in the other social categories; perhaps level of formality is the factor which
distinguishes urban and rural varieties for Louisvillians, which would explain the drastic
distinction.
Again, as with correctness and standardness, Northern, Midwest, and Chicago dialects
appear near the top of the ratings, while Appalachia, Cajun/Creole, and Georgia appear near the
bottom. In this case, clearly Louisvillians are aligning themselves with (in fact, rating themselves
above) these seemingly prestigious dialects and distancing themselves from the varieties they see
as stigmatized in regards to formality.
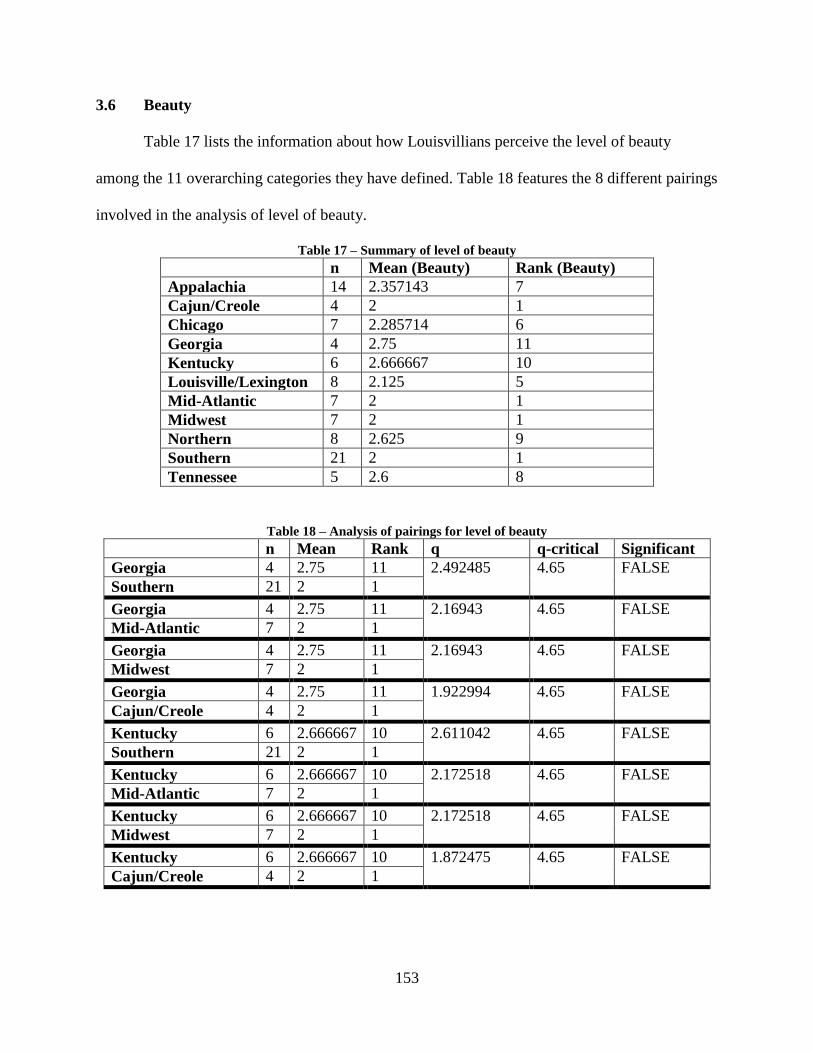
153
3.6 Beauty
Table 17 lists the information about how Louisvillians perceive the level of beauty
among the 11 overarching categories they have defined. Table 18 features the 8 different pairings
involved in the analysis of level of beauty.
Table 17 – Summary of level of beauty
n Mean (Beauty) Rank (Beauty)
Appalachia 14 2.357143 7
Cajun/Creole 4 2 1
Chicago 7 2.285714 6
Georgia 4 2.75 11
Kentucky 6 2.666667 10
Louisville/Lexington 8 2.125 5
Mid-Atlantic 7 2 1
Midwest 7 2 1
Northern 8 2.625 9
Southern 21 2 1
Tennessee 5 2.6 8
Table 18 – Analysis of pairings for level of beauty
n Mean Rank q q-critical Significant
Georgia 4 2.75 11 2.492485 4.65 FALSE
Southern 21 2 1
Georgia 4 2.75 11 2.16943 4.65 FALSE
Mid-Atlantic 7 2 1
Georgia 4 2.75 11 2.16943 4.65 FALSE
Midwest 7 2 1
Georgia 4 2.75 11 1.922994 4.65 FALSE
Cajun/Creole 4 2 1
Kentucky 6 2.666667 10 2.611042 4.65 FALSE
Southern 21 2 1
Kentucky 6 2.666667 10 2.172518 4.65 FALSE
Mid-Atlantic 7 2 1
Kentucky 6 2.666667 10 2.172518 4.65 FALSE
Midwest 7 2 1
Kentucky 6 2.666667 10 1.872475 4.65 FALSE
Cajun/Creole 4 2 1
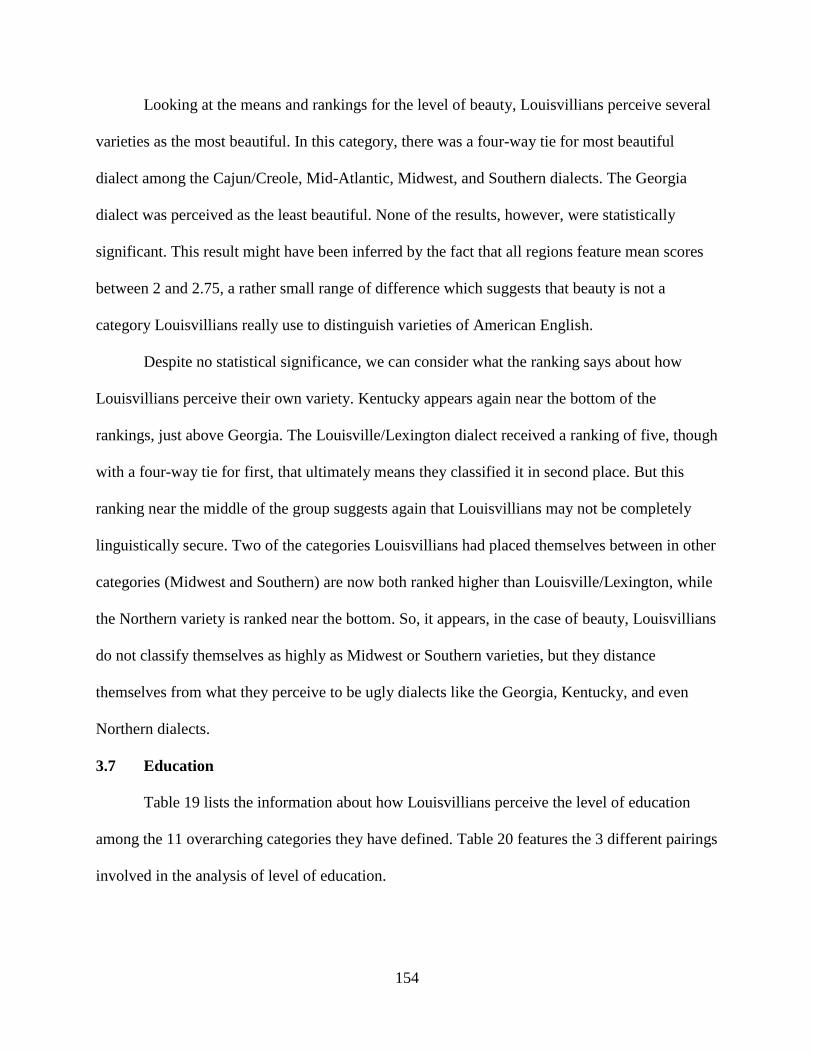
154
Looking at the means and rankings for the level of beauty, Louisvillians perceive several
varieties as the most beautiful. In this category, there was a four-way tie for most beautiful
dialect among the Cajun/Creole, Mid-Atlantic, Midwest, and Southern dialects. The Georgia
dialect was perceived as the least beautiful. None of the results, however, were statistically
significant. This result might have been inferred by the fact that all regions feature mean scores
between 2 and 2.75, a rather small range of difference which suggests that beauty is not a
category Louisvillians really use to distinguish varieties of American English.
Despite no statistical significance, we can consider what the ranking says about how
Louisvillians perceive their own variety. Kentucky appears again near the bottom of the
rankings, just above Georgia. The Louisville/Lexington dialect received a ranking of five, though
with a four-way tie for first, that ultimately means they classified it in second place. But this
ranking near the middle of the group suggests again that Louisvillians may not be completely
linguistically secure. Two of the categories Louisvillians had placed themselves between in other
categories (Midwest and Southern) are now both ranked higher than Louisville/Lexington, while
the Northern variety is ranked near the bottom. So, it appears, in the case of beauty, Louisvillians
do not classify themselves as highly as Midwest or Southern varieties, but they distance
themselves from what they perceive to be ugly dialects like the Georgia, Kentucky, and even
Northern dialects.
3.7 Education
Table 19 lists the information about how Louisvillians perceive the level of education
among the 11 overarching categories they have defined. Table 20 features the 3 different pairings
involved in the analysis of level of education.
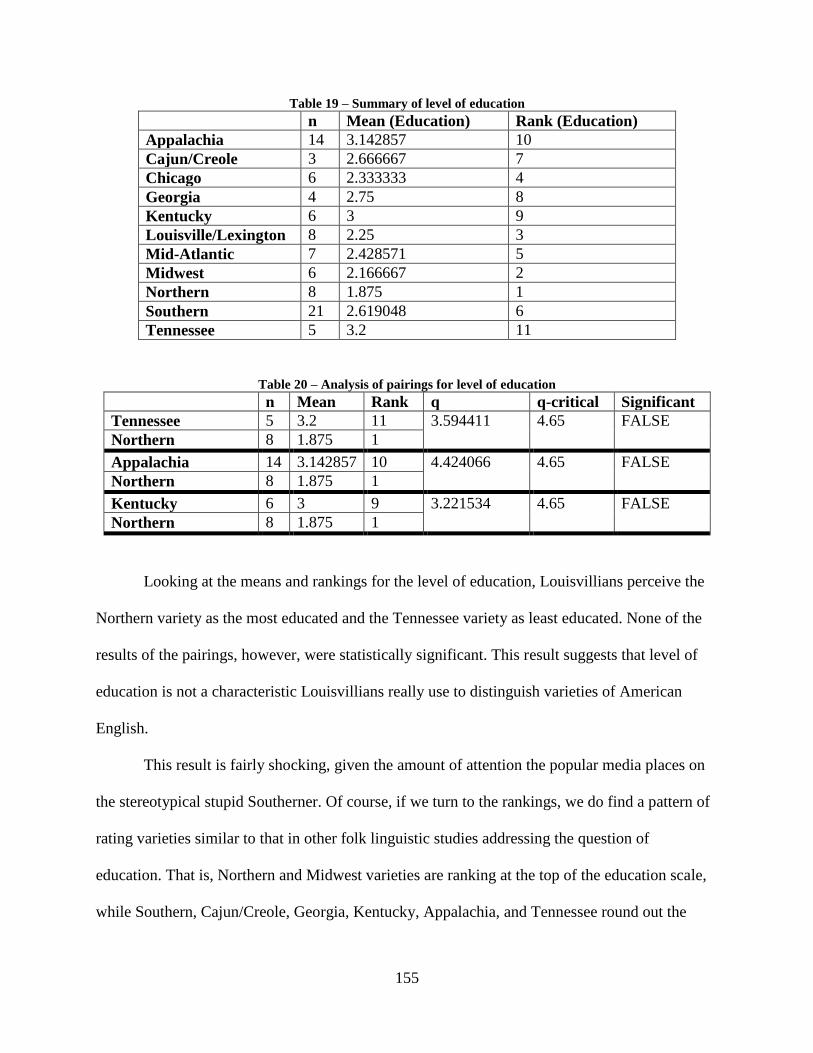
155
Table 19 – Summary of level of education
n Mean (Education) Rank (Education)
Appalachia 14 3.142857 10
Cajun/Creole 3 2.666667 7
Chicago 6 2.333333 4
Georgia 4 2.75 8
Kentucky 6 3 9
Louisville/Lexington 8 2.25 3
Mid-Atlantic 7 2.428571 5
Midwest 6 2.166667 2
Northern 8 1.875 1
Southern 21 2.619048 6
Tennessee 5 3.2 11
Table 20 – Analysis of pairings for level of education
n Mean Rank q q-critical Significant
Tennessee 5 3.2 11 3.594411 4.65 FALSE
Northern 8 1.875 1
Appalachia 14 3.142857 10 4.424066 4.65 FALSE
Northern 8 1.875 1
Kentucky 6 3 9 3.221534 4.65 FALSE
Northern 8 1.875 1
Looking at the means and rankings for the level of education, Louisvillians perceive the
Northern variety as the most educated and the Tennessee variety as least educated. None of the
results of the pairings, however, were statistically significant. This result suggests that level of
education is not a characteristic Louisvillians really use to distinguish varieties of American
English.
This result is fairly shocking, given the amount of attention the popular media places on
the stereotypical stupid Southerner. Of course, if we turn to the rankings, we do find a pattern of
rating varieties similar to that in other folk linguistic studies addressing the question of
education. That is, Northern and Midwest varieties are ranking at the top of the education scale,
while Southern, Cajun/Creole, Georgia, Kentucky, Appalachia, and Tennessee round out the
156
bottom. Again, in an effort to separate themselves from the stigmatized stereotype of having no
education, Louisvillians rated the Louisville/Lexington dialect as third most educated, echoing
the results of the level of correctness analysis above. Participants also clearly make some
distinction between the Louisville/Lexington dialect and the Kentucky one, as they yet again
separated these varieties in their rankings by a fairly large margin. This perhaps points again to
the rural/urban divide within the state, with Louisvillians choosing to support the stereotype of
educated city-dwellers versus uneducated rural residents.
3.8 Summary
These results reveal some interesting facts about Louisvillians and their understanding of
Louisville‟s regional location. One clear pattern is a distancing from all that is considered bad.
Louisvillians do not want to classify their own dialect alongside the uneducated, incorrect,
nonstandard varieties that are most often found in the Southern United States, but they also do
not want to be associated with the Northern rudeness so many were quick to address. This
seeking for the best of both worlds approach hints to their resistance to classification.
Louisvillians believe that they can be both this and that without having to be pigeon-holed into
one category or another. This mentality comes from their recognition of their place on the border
between these multiple places. The fact that they rank themselves high in pleasantness and
correctness, for instance, shows that, unlike the typical Southerner who has been plagued by
linguistic subordination, Louisvillians have a certain level of linguistic security that allows them
to take pride in their way of speaking. Yet, they still subordinate themselves to the Midwest and
Northern varieties, in that sometimes, as in level of education, Louisvillians rate these varieties
ahead of their own. This unclear position in terms of linguistic security is indicative of the effect
the border has on Louisvillians‟ perceptions of regional variation in the United States.
157
Additionally, Louisvillians take great strides to distance themselves not just from the
South in general, but also Kentucky in particular. Louisvillians are aware of the stereotypes
people have of Kentuckians: they do not wear shoes, they marry their cousins14
, they ride horses
to school, and they do not value education. Thus, since by the simple facts of geography,
Louisville belongs to Kentucky, and thereby can be appropriately connected to these stereotypes,
Louisvillians seek a way to widen the gap between their own way of speaking and how the rest
of the state speaks. Thus, Kentucky becomes the scapegoat, as it were, for all that is considered
wrong within the South.
4 Labels and Open-Ended Responses
In the final part of this analysis, I turn to the labels used by participants, to discover
trends, naming conventions, and other various details about how varieties are categorized. I
discuss the types of labels given to individual regions, I discuss some of the common words used
in the labels and their distribution, and I examine the answers to the open-ended questions for
further interesting details. As in previous sections, I only focus on the regions that were shared
by at least 14% of respondents, which includes the 11 overarching categories discussed above.
4.1 Labels
In the analysis of the types of labels utilized by respondents, I examined each individual
label and determined what aspect of the variety the participants were trying to convey through
their label. Each label received as many as two different types, and every label received at least
one type. This aided in handling the numerous multi-word labels given to individual regions.
When more than two categories were possible, I determined the two categories that seemed to
best describe the label.
14
See Cramer (2010) for more on Louisvillians‟ thoughts about these first two stereotypes.
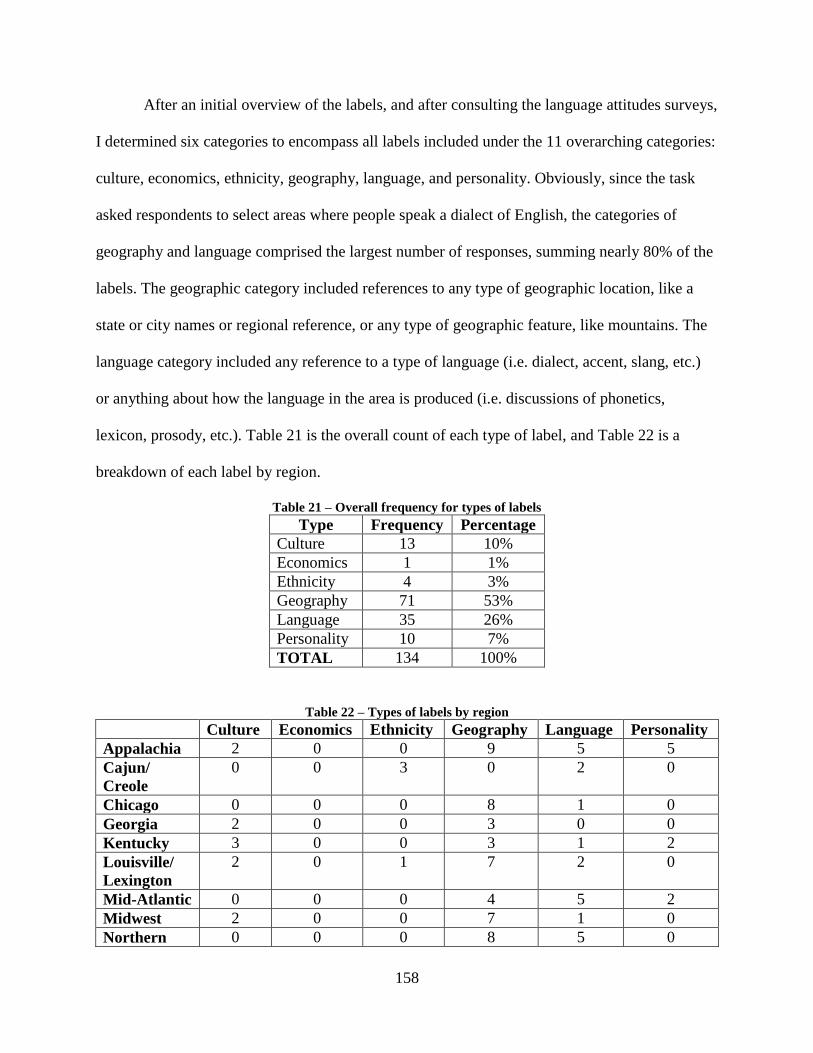
158
After an initial overview of the labels, and after consulting the language attitudes surveys,
I determined six categories to encompass all labels included under the 11 overarching categories:
culture, economics, ethnicity, geography, language, and personality. Obviously, since the task
asked respondents to select areas where people speak a dialect of English, the categories of
geography and language comprised the largest number of responses, summing nearly 80% of the
labels. The geographic category included references to any type of geographic location, like a
state or city names or regional reference, or any type of geographic feature, like mountains. The
language category included any reference to a type of language (i.e. dialect, accent, slang, etc.)
or anything about how the language in the area is produced (i.e. discussions of phonetics,
lexicon, prosody, etc.). Table 21 is the overall count of each type of label, and Table 22 is a
breakdown of each label by region.
Table 21 – Overall frequency for types of labels
Type Frequency Percentage
Culture 13 10%
Economics 1 1%
Ethnicity 4 3%
Geography 71 53%
Language 35 26%
Personality 10 7%
TOTAL 134 100%
Table 22 – Types of labels by region
Culture Economics Ethnicity Geography Language Personality
Appalachia 2 0 0 9 5 5
Cajun/
Creole
0 0 3 0 2 0
Chicago 0 0 0 8 1 0
Georgia 2 0 0 3 0 0
Kentucky 3 0 0 3 1 2
Louisville/
Lexington
2 0 1 7 2 0
Mid-Atlantic 0 0 0 4 5 2
Midwest 2 0 0 7 1 0
Northern 0 0 0 8 5 0
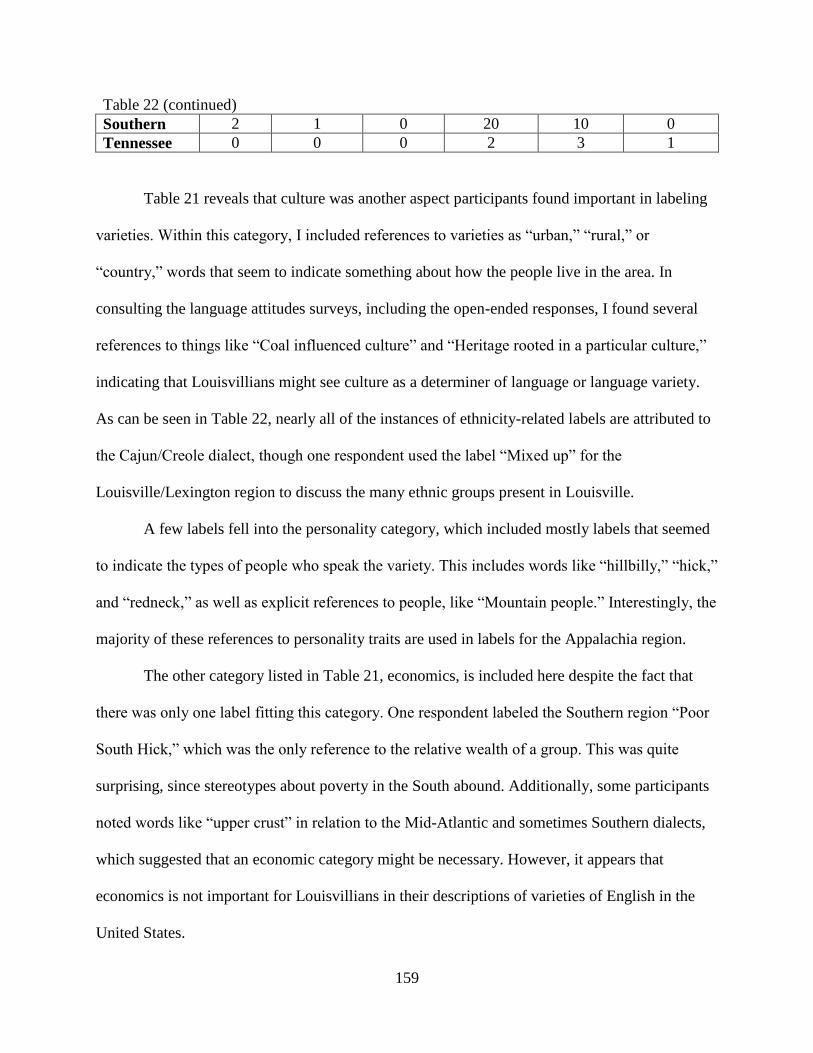
159
Table 22 (continued)
Southern 2 1 0 20 10 0
Tennessee 0 0 0 2 3 1
Table 21 reveals that culture was another aspect participants found important in labeling
varieties. Within this category, I included references to varieties as “urban,” “rural,” or
“country,” words that seem to indicate something about how the people live in the area. In
consulting the language attitudes surveys, including the open-ended responses, I found several
references to things like “Coal influenced culture” and “Heritage rooted in a particular culture,”
indicating that Louisvillians might see culture as a determiner of language or language variety.
As can be seen in Table 22, nearly all of the instances of ethnicity-related labels are attributed to
the Cajun/Creole dialect, though one respondent used the label “Mixed up” for the
Louisville/Lexington region to discuss the many ethnic groups present in Louisville.
A few labels fell into the personality category, which included mostly labels that seemed
to indicate the types of people who speak the variety. This includes words like “hillbilly,” “hick,”
and “redneck,” as well as explicit references to people, like “Mountain people.” Interestingly, the
majority of these references to personality traits are used in labels for the Appalachia region.
The other category listed in Table 21, economics, is included here despite the fact that
there was only one label fitting this category. One respondent labeled the Southern region “Poor
South Hick,” which was the only reference to the relative wealth of a group. This was quite
surprising, since stereotypes about poverty in the South abound. Additionally, some participants
noted words like “upper crust” in relation to the Mid-Atlantic and sometimes Southern dialects,
which suggested that an economic category might be necessary. However, it appears that
economics is not important for Louisvillians in their descriptions of varieties of English in the
United States.
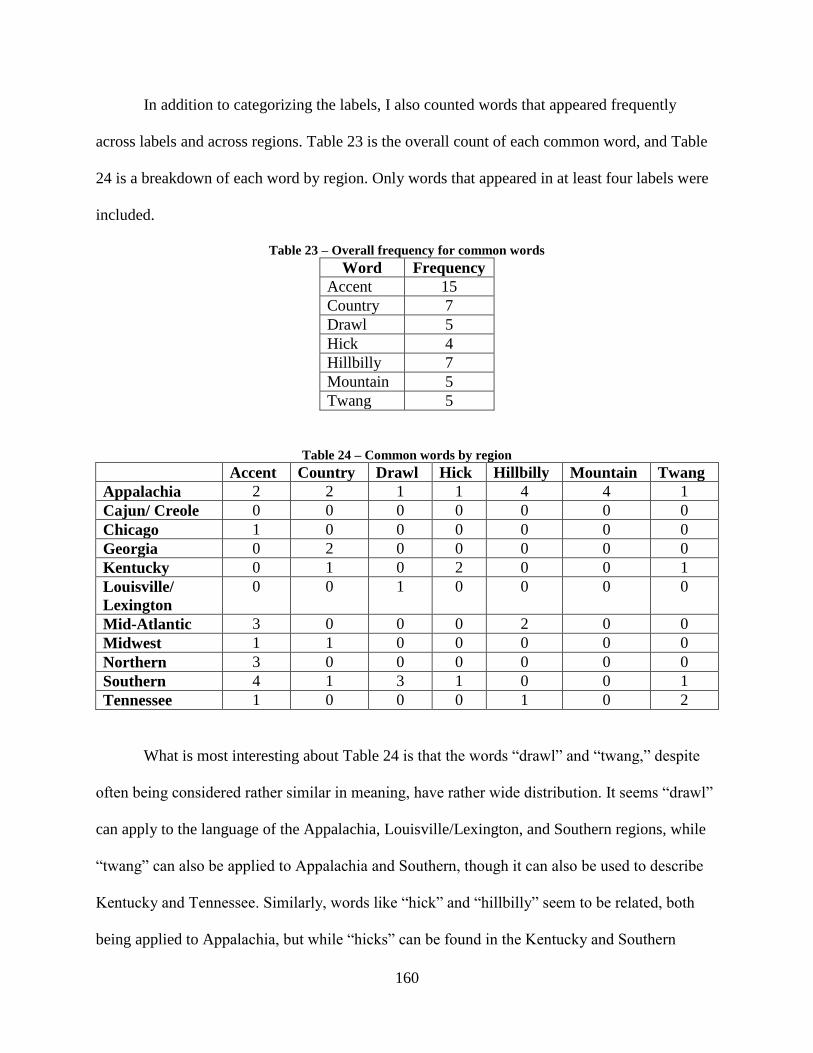
160
In addition to categorizing the labels, I also counted words that appeared frequently
across labels and across regions. Table 23 is the overall count of each common word, and Table
24 is a breakdown of each word by region. Only words that appeared in at least four labels were
included.
Table 23 – Overall frequency for common words
Word Frequency
Accent 15
Country 7
Drawl 5
Hick 4
Hillbilly 7
Mountain 5
Twang 5
Table 24 – Common words by region
Accent Country Drawl Hick Hillbilly Mountain Twang
Appalachia 2 2 1 1 4 4 1
Cajun/ Creole 0 0 0 0 0 0 0
Chicago 1 0 0 0 0 0 0
Georgia 0 2 0 0 0 0 0
Kentucky 0 1 0 2 0 0 1
Louisville/
Lexington
0 0 1 0 0 0 0
Mid-Atlantic 3 0 0 0 2 0 0
Midwest 1 1 0 0 0 0 0
Northern 3 0 0 0 0 0 0
Southern 4 1 3 1 0 0 1
Tennessee 1 0 0 0 1 0 2
What is most interesting about Table 24 is that the words “drawl” and “twang,” despite
often being considered rather similar in meaning, have rather wide distribution. It seems “drawl”
can apply to the language of the Appalachia, Louisville/Lexington, and Southern regions, while
“twang” can also be applied to Appalachia and Southern, though it can also be used to describe
Kentucky and Tennessee. Similarly, words like “hick” and “hillbilly” seem to be related, both
being applied to Appalachia, but while “hicks” can be found in the Kentucky and Southern
161
regions, “hillbillies” can be found in the Mid-Atlantic and Tennessee regions. If, in fact,
“hillbilly,” which has its roots in describing people of the mountains, is being used in this way, it
might be expected that the Mid-Atlantic and Tennessee regions would be included, since, as we
saw previously, Louisvillians make a connection between the Appalachia and Mid-Atlantic
regions, and Tennessee is another state where the Appalachian Mountains are located. But if this
is the case, why are there no hillbillies in Kentucky? And if the mountains themselves are so
important to these areas, why does the word “mountain” only appear in descriptions of
Appalachia?
Additionally, the majority of the words here (perhaps with the exception of accent and
mountain) are often used in a derogatory manner, both within these labels and within their wider
usage. In light of this, I briefly categorized the labels as having positive, neutral, or negative
attributes, based on their further information in the language attitudes section, and discovered
that while the majority of the labels appear to be rather neutral, many more of the labels are
negative or derogatory in nature and very few at all appear to be positive.
Interestingly, of all these seemingly negative words, only “drawl” is applied to the
Louisville/Lexington region. If we consider this in light of the fact that the whole spectrum of
negative words can be used to describe the Appalachia region, we can see that Louisvillians use
their labels to further distinguish themselves from negative attributes.
4.2 Open-Ended Responses
In this section, I will present some of the more interesting responses in the answers
participants provided for the open-ended questions on the language attitudes survey. These
questions addressed how else participants might describe a particular way of speaking, why they
selected a particular label for this way of speaking, and what this label means to the participant.
162
One rather common theme in the responses seemed to be justification of position,
typically as a way of demonstrating political correctness. For instance, one person wrote for four
different labels that the label was “only perception – not reality,” indicating that she knew that
the label was stereotypical and not necessarily representative of the group. Another respondent,
in describing the Mid-Atlantic region, claimed that it was “a pattern of speech that, although a
little different from my own is still as valid in its own way,” a mantra he reiterated for other
labels as well.
Some participants even overtly mentioned the word “stereotype,” so as to protect
themselves from being associated with such ideas. One participants claimed that the rural
Kentucky dialect she had designated was “stereotyped uneducated.” Another person admitted
that the reason she selected a particular label for the Tennessee region had to do with “travel
experience, stereotypes.” One participant suggested that she selected the label “Southern Drawl”
for the Southern region because of “past descriptions/stereotypical?” I am unsure as to the point
of the question mark, but this same formation is used by another participant, who claims to have
selected the label “Hillbilly” for the Appalachia region because it is a “Stereotypical term,
perhaps, that I‟ve heard before?”
Others chose different routes to avoid being thought of as politically incorrect. In
describing Appalachia, one respondent suggested that while speakers there are “Resistant to
standard american english,” “locals are proud of their distinct ways of speaking.” Others tried to
soften the blow by using additional, lessening adjectives, as in “somewhat redneck” to describe
Georgia and “Innocently simple” to describe Kentucky. One described Southern speech as
possibly “grating or beautiful, depending on who‟s speaking,” which suggests that the identity of
the interlocutor is more important than the dialect he or she uses. Another description of the
163
Southern region labels the variety as “Casual, but friendly,” neither of which seem negative, but
the inclusion of this conjunction that implies opposition indicates the participant believes she
may have made a negative statement.
Some, however, do not hold back in their descriptions, providing further negative detail
in the open-ended responses. One respondent described the speech of Tennessee as sounding like
“a „clothespin‟ on the nose.” The speech of the Northern region was described as “Short to the
point. Northern unhospitality,” “choppy,” “possibly snippy,” “cold, unfriendly, rushed,” “stand
offish,” “rude,” “high-pitched accent, annoying,” “stuffy,” “condescending,” and “almost an
attitude of not wanting to be bothered with.” The speech of the Appalachia region was described
as “hard to understand,” “red-neck,” “poor grammar…sometimes monotone,”
“hayseed/backwards,” “isolated,” “comical,” and “uneducated.”
In addition to simply listing adjectives associated with varieties of English, some
participants chose to list the linguistic features they associated with the dialect. Participants noted
a sing-song style about the Appalachia region, such that one suggested it “sometimes also sounds
like a song…a „sawng‟.” Another participant claimed that “It seems when I am in Eastern Ky in
the mountains the folks have the same rhythm or cadence in their speech.”
Of course, as indicated with the discussion of types of labels, the Cajun/Creole variety is
often discussed in terms of the language. Specifically, people focused on the mixing of French
influences on the language. One participant stated that this “very interesting sounding dialect has
whole vernacular,” and while I am unsure as to this participant‟s use of the word “vernacular,” I
imagine he was suggesting that it appears as a variety in its own right.
In discussing the language of Chicago, one participant noted the speed or fast pace of the
speech there. In contrast, the speech of Georgia is described as being “Slow, like it is so much
164
fun that it‟s worth drawing out.” It is suggested that the speech of Kentucky features “Drawn out
words,” while Northern speakers are “Short to the point.” Southern speech is also frequently
described as slow and drawn out.
Many participants focused on the phonetics of a region. One participant pointed to the
well-known way in which Chicagoans pronounce the name of their city, with the “pronunciation
of ah sound – Distinct way of saying Chicahgo, Wiscahnsin, etc. pahp.” A well-known feature of
Southern speech, the monophthongization of /ai/, is mentioned by two participants, one who
claims that the speech is “Slow, long i sound specifically marks sound quality.” The same feature
is indicated in the speech of Tennessee, which is also described as drawn out and nasally.
From these adjectives and explicit commentary on the language spoken in certain areas,
we get a better sense of the overall interpretation Louisvillians have of a particular area. If we
consider the Midwest, we see that there is a strong focus on how the Midwest is perceived as
being representative of Standard American English. Some refer to the speech as “neutral,”
“standard,” or “correct,” while others indicated that it is how they “expect news anchors to
sound.” For some participants, it is best represented in the speech of farmers. In addition to
geography and the fact that “sound qualities make it distinct,” one participant noted that he
selected the label “Midwestern” because “it is related to the general cultural lifestyle of that
area.” In general, the impression one gets about the Midwest from the perspective of
Louisvillians is that they highly value the speech there. In particular, they seem to value what
they perceive to be standard speech spoken in the Midwest.
The Southern region is also described in mostly pleasant ways. Southerners and their
speech are seen as “down to earth, relaxed,” “lilting,” “friendly, melodic,” “layedback,” “calm,”
“happy,” “hospitable,” “comfortable,” and “refined.” One participant even mentioned that a
165
“Deep southern accent” makes her “think of sweet tea and porch swings, calm.” Another noted
that, “The people seem to not let anything bother them.” Again, Louisvillians seem to value this
way of speaking. In particular, the fascination seems to be with the positive Southern stereotypes
of warmth and hospitality. The fact that Louisvillians seem to value both the Midwest and
Southern regions, though in different ways, suggests, as we saw in the language attitudes data,
that Louisvillians want to be considered both, but only if they are perceived as having only the
positive features associated with each region.
So, what do Louisvillians say about Louisville? The border mentality is made clearer
through the comments provided in this section. One participant claimed that he might also
describe the speech of Louisville as “a blend of Northern (Indiana) and Southern Ky speech.”
Another indicated that the speech in Louisville is “not as slow as southern dialect but not as fast
as midwest,” adding further that “it has the inbetween qualities.” This participant also claimed
that the speech found in Louisville is representative of “people who live along the mason-dixon
line.” Thus, at least some of these participants understand Louisville to be situated at some
important border, one that makes it distinct from the regions that are located nearby.
4.3 Summary
In this section, I discussed the labels employed by Louisvillians in naming varieties of
English and explored further their open-ended question responses from the language attitudes
surveys. I found that Louisvillians try to distance themselves from negative associations by using
more negative terms in their labeling of other varieties than they use for the Louisville/Lexington
region. Also, I showed how Louisvillians present both the Midwest and Southern regions in
positive lights, suggesting their affinity for the best of both worlds. In their own classifications of
Louisville, they explicitly called attention to the border that they perceive in their town.
166
5 Discussion
This chapter examined how Louisvillians understand the linguistic landscape of the
United States using a perceptual dialectology framework for data collection and analysis. In
examining the folk perceptions Louisvillians have about dialectal variation, the findings of this
study show that Louisvillians categorize their city in a few ways: 1) the city is given no regional
designation, as can be seen in several individual maps and the composite map; 2) the city is
considered its own separate variety, as can be seen in the overarching categories gleaned from
the individual maps; and 3) the city is positioned as being located at a border, as is clear from
some individual maps and the discussion of the responses to the open-ended questions.
Additionally, this study has shown how Louisvillians perceive other regions, perhaps
indicating the regions with which they are more likely to affiliate. For example, the analysis of
the labels, as well as the language attitudes data, shows that Louisvillians distance themselves
dramatically from an Appalachia dialect. The responses to the open-ended questions and the
language attitudes data reveal that Louisvillians value certain aspects of both the Midwest and
Southern dialects, and the comparative approach to the language attitudes data revealed that
Louisvillians varied on which variety they wanted to connect with depending on which region
was known for a particular positive attribute.
Overall, this chapter provides the on-the-ground categories that Louisvillians use to talk
about dialectal variation. It indicates the ways in which they interpret Louisville in the greater
linguistic landscape and shows the varying ideologies Louisvillians have about regional variety
in the United States. In the next chapter, I examine production data to see if these categories are
realized linguistically by presenting a phonetic analysis of particular linguistic variables

167
associated with the Southern Vowel Shift (cf. Fridland 1998; Fridland 2001; Labov, Ash, and
Boberg 2006).
168
CHAPTER 6: THE SOUTHERN VOWEL SHIFT AND PRODUCTION OF IDENTITY
1 Overview
In this chapter, I present an analysis of the vowel systems of five Louisville women in
order to examine how regional identity is realized in the production of certain linguistic
variables. Specifically, since dialect maps often position Louisville as part of the Southern
dialect region, I explore the level of participation among these speakers in certain aspects
associated with Southern speech.
The linguistic variables of concern in this chapter are the vowels associated with the
Southern Vowel Shift (cf. Fridland 1998; Fridland 2001; Labov, Ash, and Boberg 2006), a series
of shifts in the vowel space occurring in many dialects in the Southern United States. The
phenomenon of /ai/ monophthongization is thought to be the catalyst for the shifts (e.g. Feagin
1986, Fridland 1998, 2000, Labov, Ash, and Boberg 2006), and this phenomenon, as well as the
movement of vowels of the Front Shift (the inversion of /i/ and /ɪ/ and /ei/ and /ɛ/) and the
movement of vowels of the Back Shift (the fronting of /u/ and /oʊ/) are examined in this
chapter.15
The data for this project come from an original SOAPnet reality television show,
Southern Belles: Louisville (Livecchi and Bull 2009). The show, described as a “docusoap” or
“docudrama”, follows the lives of five Louisville women in their 20s and 30s, detailing their
experiences as friends, as professionals, and as bachelorettes. The data consists of more than
seven hours of broadly transcribed video.
This chapter features an acoustic analysis of the speech of each of the five women,
examining each subject‟s speech with reference to each particular stage of the Southern Shift.
15
The Back Shift is analyzed in this dissertation, despite having been shown to be more widespread than being
confined to the Southern dialect region, in order to be able to compare what earlier studies (e.g. Feagin 1986,
Fridland 1998) have shown in relation to the Southern Shift.
169
For monophthongization of /ai/, I measure each subject‟s participation in the stage by defining
monophthongization as less than a 25% change in frequency across the vowel, as established in
Cramer (2009), and by comparing the frequency of occurrence of the monophthongal variant to
the frequency of occurrence in the speech of a “real” Southerner (from Alabama), also
established in Cramer (2009), to determine statistical significance. For the Front and Back Shifts,
I discuss in detail how each subject‟s vowel space varies from that of an unshifted speaker,
which has been gleaned from Peterson and Barney (1952). In all analyses, F1 and F2 are
considered separately.
In summary, this chapter shows that the use or non-use of Southern variants is rather
chaotic, such that the purely numerical analysis reveals widely varying usage patterns, including
what appears to be a cline of participation in the shifts among the speakers, and the more
subjective contextual analysis indicates that while Southern contexts might initiate use of the
Southern variants, the choice in variant is not so straightforward. In the following sections, I
present both the quantitative and qualitative analyses of the data and a discussion of those results.
2 Analysis
The analysis is divided into the different stages of the Southern Shift, as described in
Chapter 2. Since monophthongization of /ai/ is thought to be the trigger for the shift, I examine
this part of the data first. The next section deals with the Front Shift, or the reversal of the front
tense and lax vowels. Finally, I explore the features of the Back Shift, or the fronting of the back
vowels /u/ and /oʊ/. In the analyses, a total of ten tokens were selected for each of the vowel
classes under investigation for each subject, for a total of 70 target tokens per speaker.
Additionally, tokens for two control vowels were also collected.
170
Within each section, I examine each participant individually, as an overall analysis of
five women would not likely yield very interesting generalizations about Louisville as a whole.
But the analysis of these individual women does provide insight into the identity processes
available for Louisvillians because of their location at the border. Each subsection below
discusses the findings for each of the stages of the shift and for each of the participants in further
detail. The participants are presented here in alphabetical order by first name.
2.1 Monophthongization of /ai/
In this section, I use the methodology established in Cramer (2009) to examine the level
of use of the monophthongal variant of /ai/ among these five women. Using Praat and
MATLAB, I applied an optimization-based curve fitting procedure to the F1 and F2 values, to fit
the curves produced to the ideal diphthong pattern (a steady-state, followed by a transition, and
another steady-state). A vowel was considered to be monophthongal if the change in frequency
across the vowel was less than 25%. The results of the analysis are presented here.
2.1.1 Emily
In F1, Emily used the monophthongal variant in four of ten cases. In F2, she produced a
monophthong in all but two words. All four cases where F1 featured the monophthong also
featured a monophthong in F2, making these vowels complete monophthongs.16
Table 25
features the individual words, the ratios of the end frequencies to the beginning frequencies
(Z2/Z1), and whether the ratio met the requirements of a monophthong as defined by the study,
showing both F1 and F2 separately. The bolded entries are complete monophthongs. Each table
for the other four women is constructed in the same manner.
16
Cramer (2009) found some instances where either F1 or F2 but not both were monophthongal.
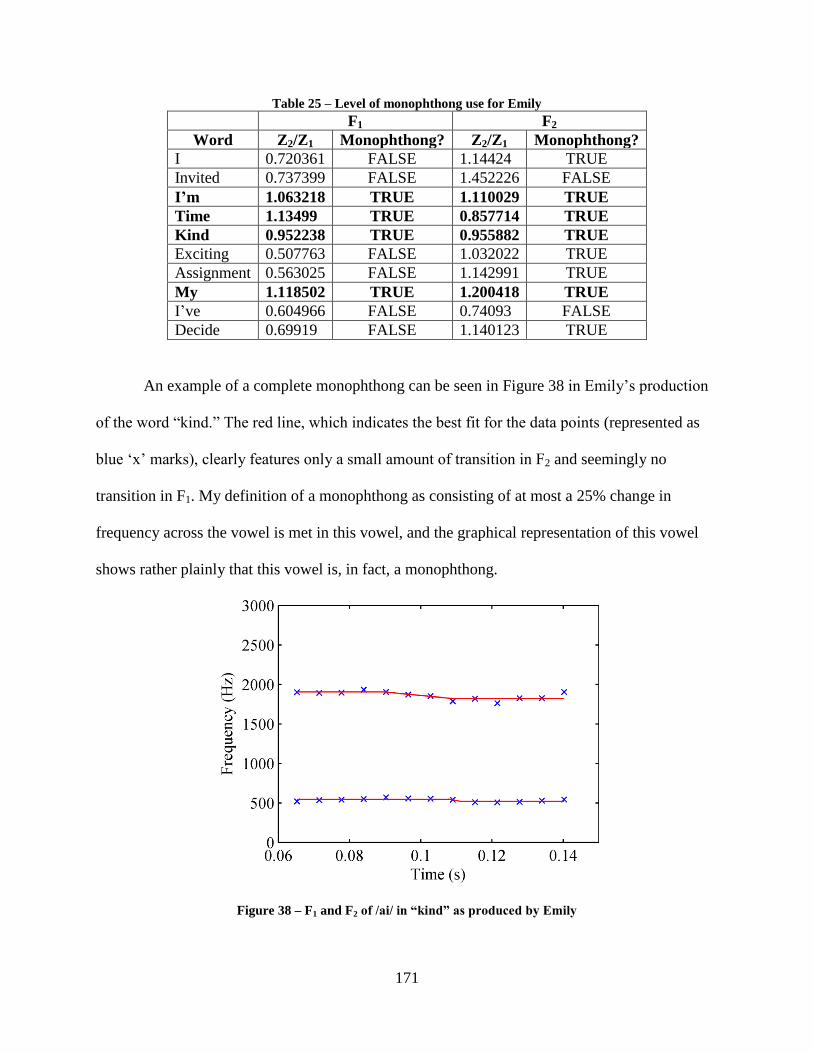
171
Table 25 – Level of monophthong use for Emily
F1 F2
Word Z2/Z1 Monophthong? Z2/Z1 Monophthong?
I 0.720361 FALSE 1.14424 TRUE
Invited 0.737399 FALSE 1.452226 FALSE
I’m 1.063218 TRUE 1.110029 TRUE
Time 1.13499 TRUE 0.857714 TRUE
Kind 0.952238 TRUE 0.955882 TRUE
Exciting 0.507763 FALSE 1.032022 TRUE
Assignment 0.563025 FALSE 1.142991 TRUE
My 1.118502 TRUE 1.200418 TRUE
I‟ve 0.604966 FALSE 0.74093 FALSE
Decide 0.69919 FALSE 1.140123 TRUE
An example of a complete monophthong can be seen in Figure 38 in Emily‟s production
of the word “kind.” The red line, which indicates the best fit for the data points (represented as
blue „x‟ marks), clearly features only a small amount of transition in F2 and seemingly no
transition in F1. My definition of a monophthong as consisting of at most a 25% change in
frequency across the vowel is met in this vowel, and the graphical representation of this vowel
shows rather plainly that this vowel is, in fact, a monophthong.
Figure 38 – F1 and F2 of /ai/ in “kind” as produced by Emily
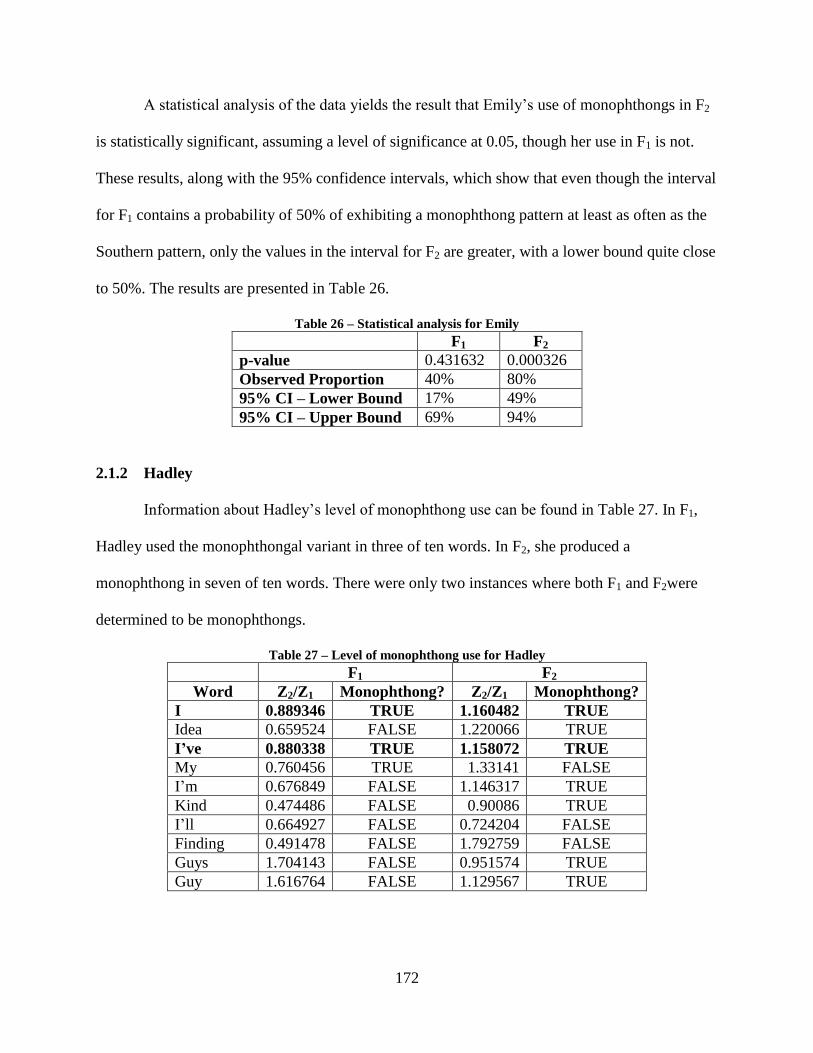
172
A statistical analysis of the data yields the result that Emily‟s use of monophthongs in F2
is statistically significant, assuming a level of significance at 0.05, though her use in F1 is not.
These results, along with the 95% confidence intervals, which show that even though the interval
for F1 contains a probability of 50% of exhibiting a monophthong pattern at least as often as the
Southern pattern, only the values in the interval for F2 are greater, with a lower bound quite close
to 50%. The results are presented in Table 26.
Table 26 – Statistical analysis for Emily
F1 F2
p-value 0.431632 0.000326
Observed Proportion 40% 80%
95% CI – Lower Bound 17% 49%
95% CI – Upper Bound 69% 94%
2.1.2 Hadley
Information about Hadley‟s level of monophthong use can be found in Table 27. In F1,
Hadley used the monophthongal variant in three of ten words. In F2, she produced a
monophthong in seven of ten words. There were only two instances where both F1 and F2were
determined to be monophthongs.
Table 27 – Level of monophthong use for Hadley
F1 F2
Word Z2/Z1 Monophthong? Z2/Z1 Monophthong?
I 0.889346 TRUE 1.160482 TRUE
Idea 0.659524 FALSE 1.220066 TRUE
I’ve 0.880338 TRUE 1.158072 TRUE
My 0.760456 TRUE 1.33141 FALSE
I‟m 0.676849 FALSE 1.146317 TRUE
Kind 0.474486 FALSE 0.90086 TRUE
I‟ll 0.664927 FALSE 0.724204 FALSE
Finding 0.491478 FALSE 1.792759 FALSE
Guys 1.704143 FALSE 0.951574 TRUE
Guy 1.616764 FALSE 1.129567 TRUE
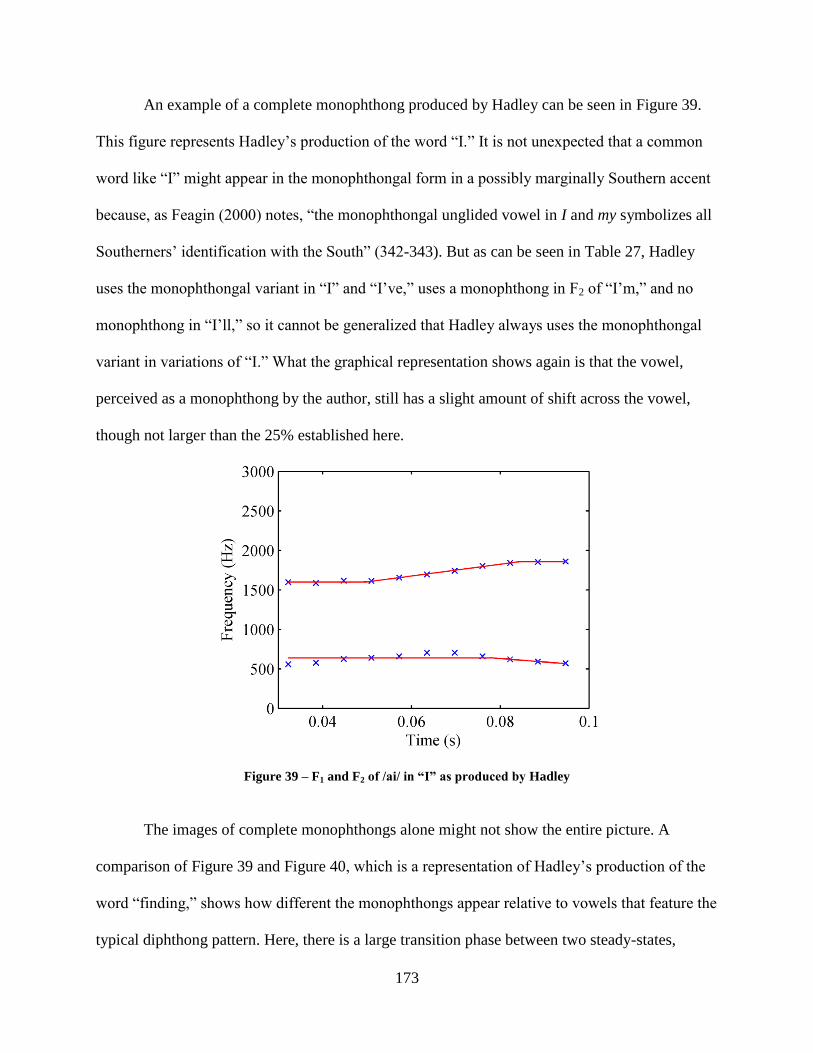
173
An example of a complete monophthong produced by Hadley can be seen in Figure 39.
This figure represents Hadley‟s production of the word “I.” It is not unexpected that a common
word like “I” might appear in the monophthongal form in a possibly marginally Southern accent
because, as Feagin (2000) notes, “the monophthongal unglided vowel in I and my symbolizes all
Southerners‟ identification with the South” (342-343). But as can be seen in Table 27, Hadley
uses the monophthongal variant in “I” and “I‟ve,” uses a monophthong in F2 of “I‟m,” and no
monophthong in “I‟ll,” so it cannot be generalized that Hadley always uses the monophthongal
variant in variations of “I.” What the graphical representation shows again is that the vowel,
perceived as a monophthong by the author, still has a slight amount of shift across the vowel,
though not larger than the 25% established here.
Figure 39 – F1 and F2 of /ai/ in “I” as produced by Hadley
The images of complete monophthongs alone might not show the entire picture. A
comparison of Figure 39 and Figure 40, which is a representation of Hadley‟s production of the
word “finding,” shows how different the monophthongs appear relative to vowels that feature the
typical diphthong pattern. Here, there is a large transition phase between two steady-states,
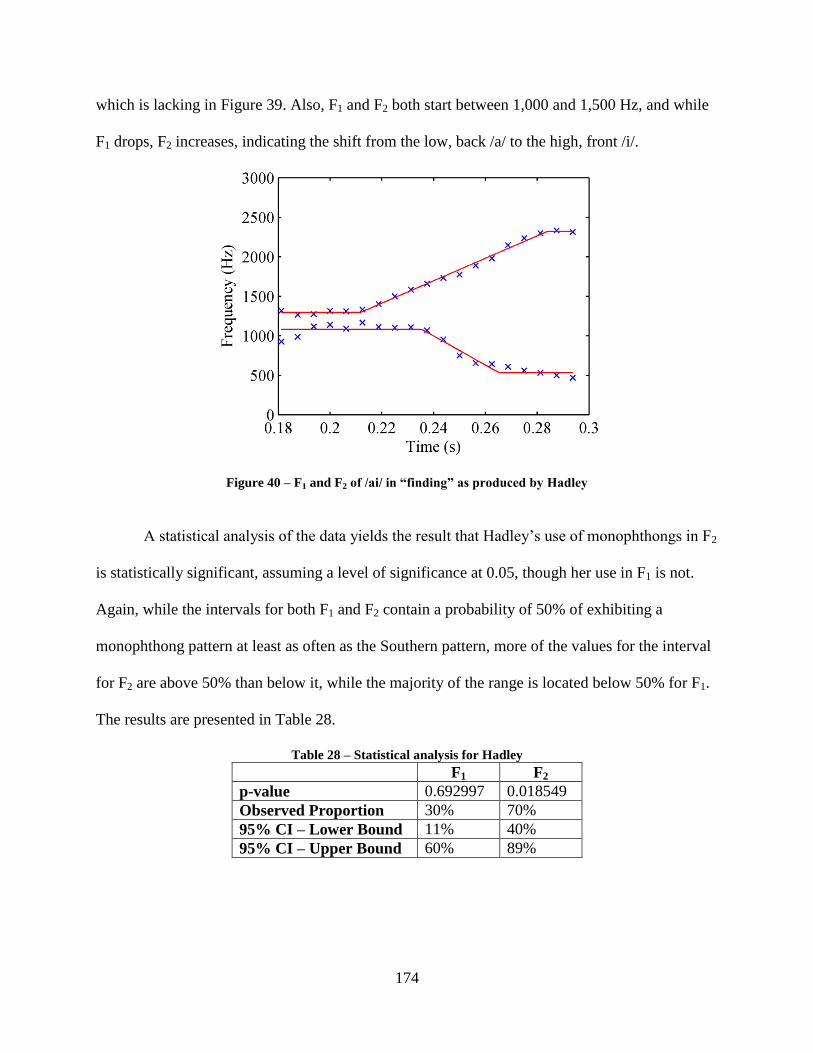
174
which is lacking in Figure 39. Also, F1 and F2 both start between 1,000 and 1,500 Hz, and while
F1 drops, F2 increases, indicating the shift from the low, back /a/ to the high, front /i/.
Figure 40 – F1 and F2 of /ai/ in “finding” as produced by Hadley
A statistical analysis of the data yields the result that Hadley‟s use of monophthongs in F2
is statistically significant, assuming a level of significance at 0.05, though her use in F1 is not.
Again, while the intervals for both F1 and F2 contain a probability of 50% of exhibiting a
monophthong pattern at least as often as the Southern pattern, more of the values for the interval
for F2 are above 50% than below it, while the majority of the range is located below 50% for F1.
The results are presented in Table 28.
Table 28 – Statistical analysis for Hadley
F1 F2
p-value 0.692997 0.018549
Observed Proportion 30% 70%
95% CI – Lower Bound 11% 40%
95% CI – Upper Bound 60% 89%
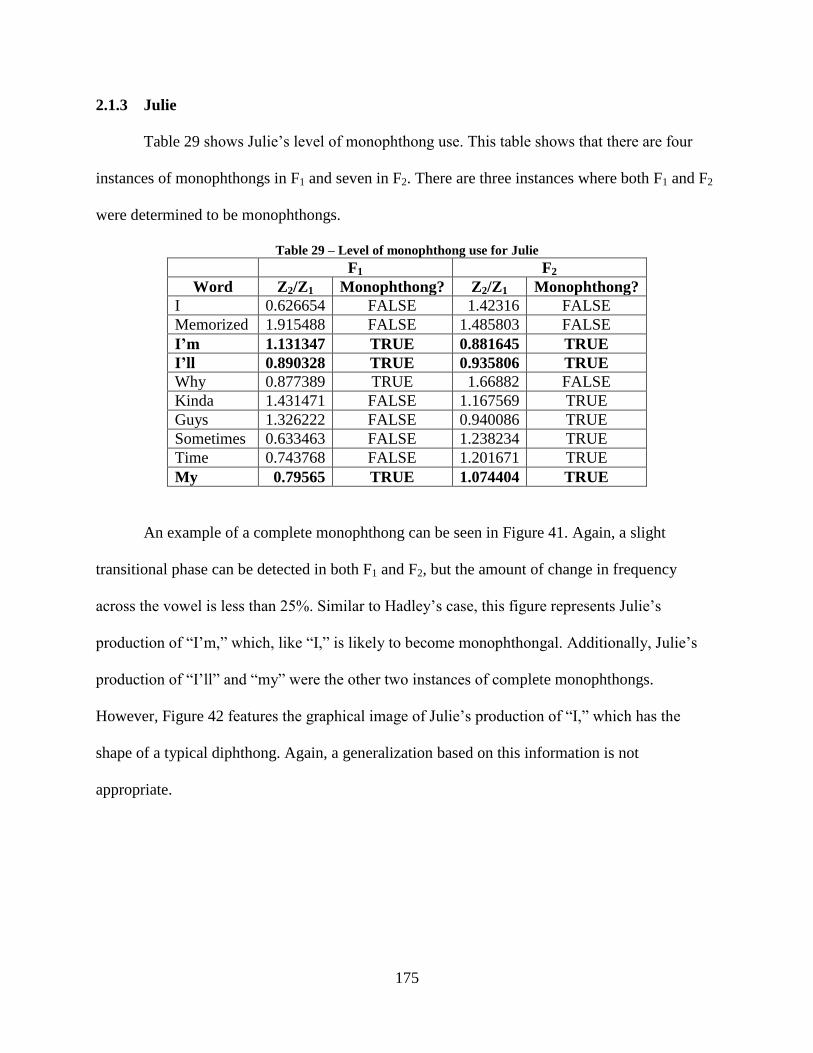
175
2.1.3 Julie
Table 29 shows Julie‟s level of monophthong use. This table shows that there are four
instances of monophthongs in F1 and seven in F2. There are three instances where both F1 and F2
were determined to be monophthongs.
Table 29 – Level of monophthong use for Julie
F1 F2
Word Z2/Z1 Monophthong? Z2/Z1 Monophthong?
I 0.626654 FALSE 1.42316 FALSE
Memorized 1.915488 FALSE 1.485803 FALSE
I’m 1.131347 TRUE 0.881645 TRUE
I’ll 0.890328 TRUE 0.935806 TRUE
Why 0.877389 TRUE 1.66882 FALSE
Kinda 1.431471 FALSE 1.167569 TRUE
Guys 1.326222 FALSE 0.940086 TRUE
Sometimes 0.633463 FALSE 1.238234 TRUE
Time 0.743768 FALSE 1.201671 TRUE
My 0.79565 TRUE 1.074404 TRUE
An example of a complete monophthong can be seen in Figure 41. Again, a slight
transitional phase can be detected in both F1 and F2, but the amount of change in frequency
across the vowel is less than 25%. Similar to Hadley‟s case, this figure represents Julie‟s
production of “I‟m,” which, like “I,” is likely to become monophthongal. Additionally, Julie‟s
production of “I‟ll” and “my” were the other two instances of complete monophthongs.
However, Figure 42 features the graphical image of Julie‟s production of “I,” which has the
shape of a typical diphthong. Again, a generalization based on this information is not
appropriate.
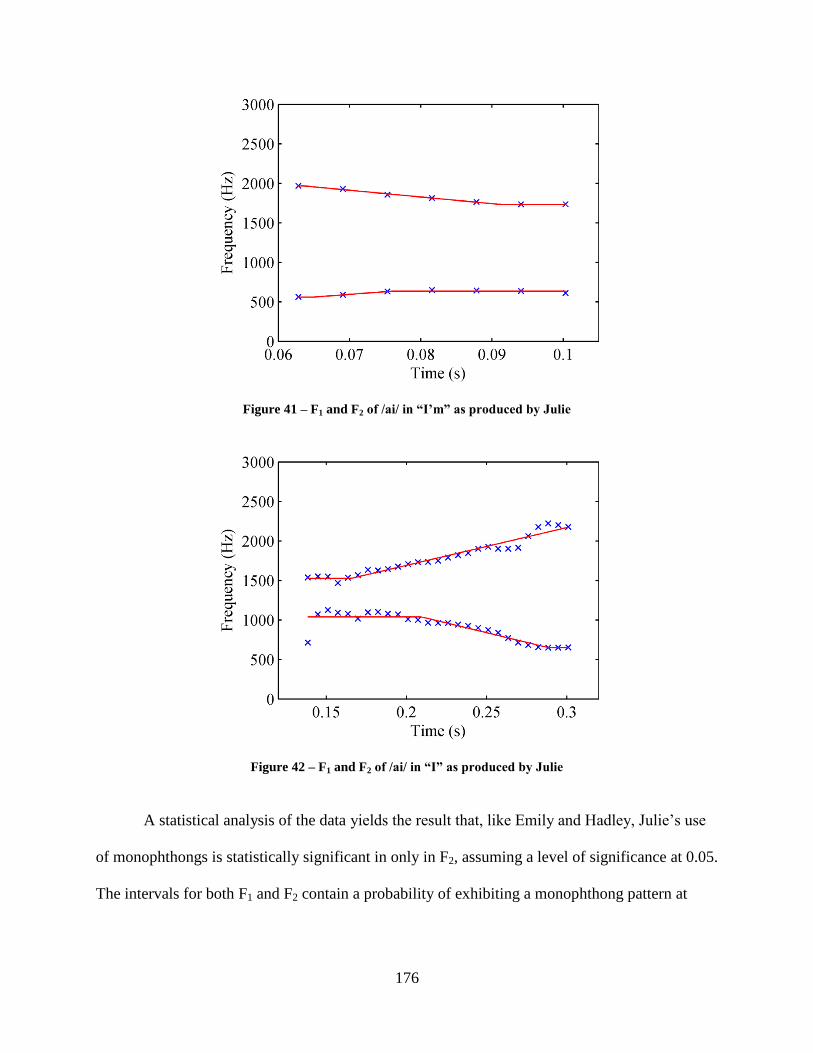
176
Figure 41 – F1 and F2 of /ai/ in “I’m” as produced by Julie
Figure 42 – F1 and F2 of /ai/ in “I” as produced by Julie
A statistical analysis of the data yields the result that, like Emily and Hadley, Julie‟s use
of monophthongs is statistically significant in only in F2, assuming a level of significance at 0.05.
The intervals for both F1 and F2 contain a probability of exhibiting a monophthong pattern at
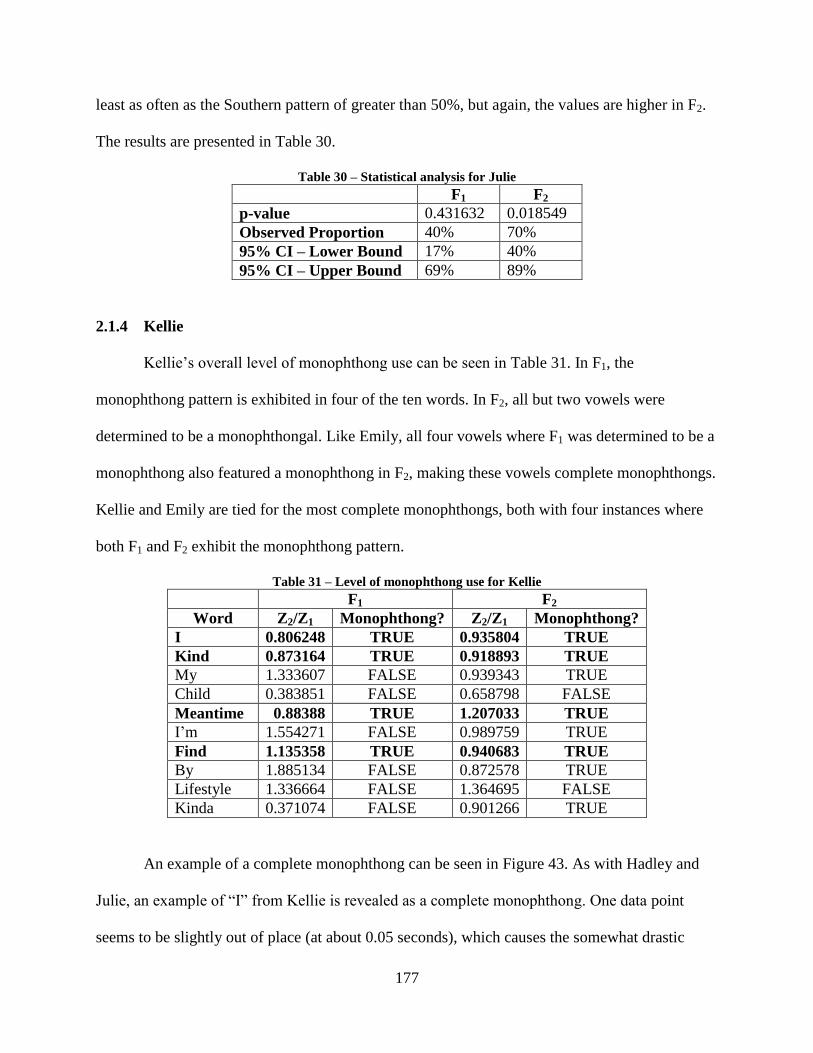
177
least as often as the Southern pattern of greater than 50%, but again, the values are higher in F2.
The results are presented in Table 30.
Table 30 – Statistical analysis for Julie
F1 F2
p-value 0.431632 0.018549
Observed Proportion 40% 70%
95% CI – Lower Bound 17% 40%
95% CI – Upper Bound 69% 89%
2.1.4 Kellie
Kellie‟s overall level of monophthong use can be seen in Table 31. In F1, the
monophthong pattern is exhibited in four of the ten words. In F2, all but two vowels were
determined to be a monophthongal. Like Emily, all four vowels where F1 was determined to be a
monophthong also featured a monophthong in F2, making these vowels complete monophthongs.
Kellie and Emily are tied for the most complete monophthongs, both with four instances where
both F1 and F2 exhibit the monophthong pattern.
Table 31 – Level of monophthong use for Kellie
F1 F2
Word Z2/Z1 Monophthong? Z2/Z1 Monophthong?
I 0.806248 TRUE 0.935804 TRUE
Kind 0.873164 TRUE 0.918893 TRUE
My 1.333607 FALSE 0.939343 TRUE
Child 0.383851 FALSE 0.658798 FALSE
Meantime 0.88388 TRUE 1.207033 TRUE
I‟m 1.554271 FALSE 0.989759 TRUE
Find 1.135358 TRUE 0.940683 TRUE
By 1.885134 FALSE 0.872578 TRUE
Lifestyle 1.336664 FALSE 1.364695 FALSE
Kinda 0.371074 FALSE 0.901266 TRUE
An example of a complete monophthong can be seen in Figure 43. As with Hadley and
Julie, an example of “I” from Kellie is revealed as a complete monophthong. One data point
seems to be slightly out of place (at about 0.05 seconds), which causes the somewhat drastic
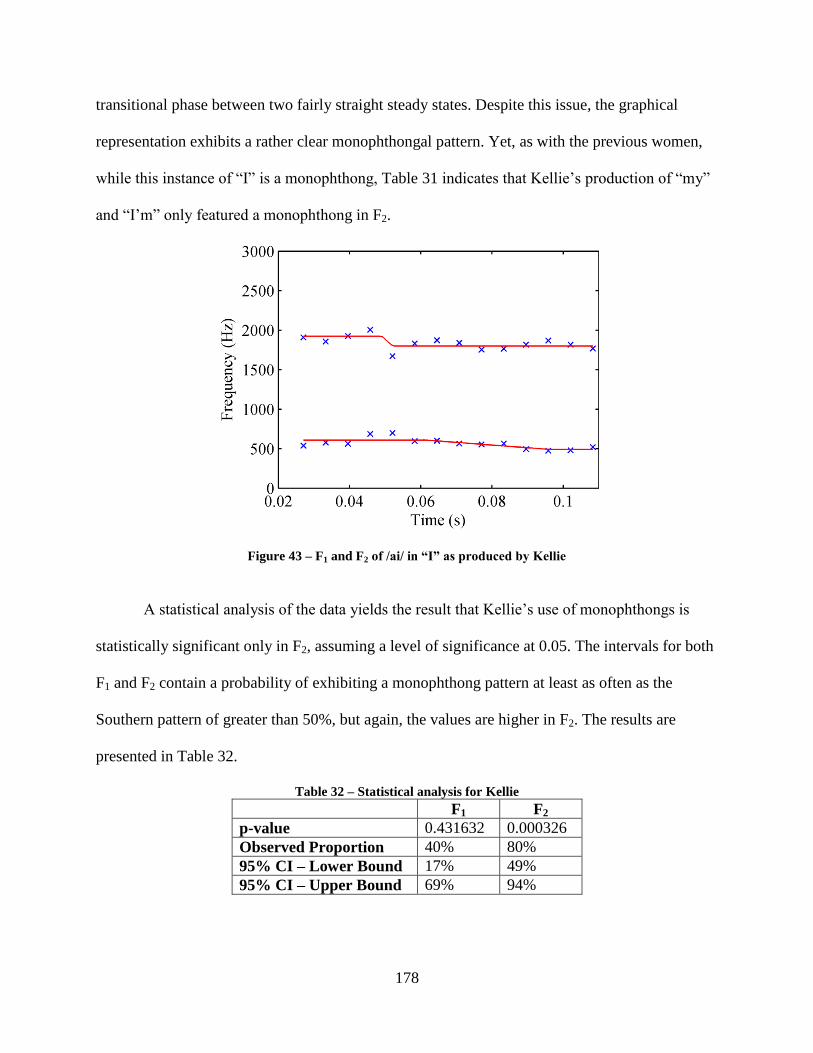
178
transitional phase between two fairly straight steady states. Despite this issue, the graphical
representation exhibits a rather clear monophthongal pattern. Yet, as with the previous women,
while this instance of “I” is a monophthong, Table 31 indicates that Kellie‟s production of “my”
and “I‟m” only featured a monophthong in F2.
Figure 43 – F1 and F2 of /ai/ in “I” as produced by Kellie
A statistical analysis of the data yields the result that Kellie‟s use of monophthongs is
statistically significant only in F2, assuming a level of significance at 0.05. The intervals for both
F1 and F2 contain a probability of exhibiting a monophthong pattern at least as often as the
Southern pattern of greater than 50%, but again, the values are higher in F2. The results are
presented in Table 32.
Table 32 – Statistical analysis for Kellie
F1 F2
p-value 0.431632 0.000326
Observed Proportion 40% 80%
95% CI – Lower Bound 17% 49%
95% CI – Upper Bound 69% 94%
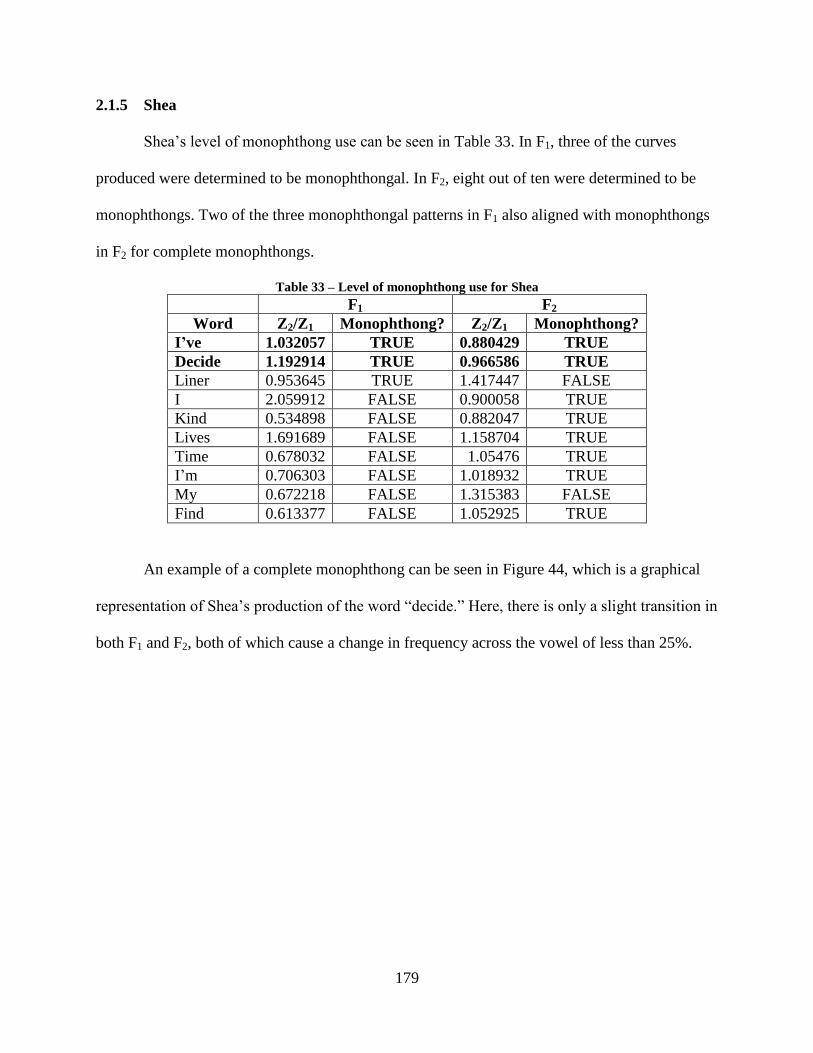
179
2.1.5 Shea
Shea‟s level of monophthong use can be seen in Table 33. In F1, three of the curves
produced were determined to be monophthongal. In F2, eight out of ten were determined to be
monophthongs. Two of the three monophthongal patterns in F1 also aligned with monophthongs
in F2 for complete monophthongs.
Table 33 – Level of monophthong use for Shea
F1 F2
Word Z2/Z1 Monophthong? Z2/Z1 Monophthong?
I’ve 1.032057 TRUE 0.880429 TRUE
Decide 1.192914 TRUE 0.966586 TRUE
Liner 0.953645 TRUE 1.417447 FALSE
I 2.059912 FALSE 0.900058 TRUE
Kind 0.534898 FALSE 0.882047 TRUE
Lives 1.691689 FALSE 1.158704 TRUE
Time 0.678032 FALSE 1.05476 TRUE
I‟m 0.706303 FALSE 1.018932 TRUE
My 0.672218 FALSE 1.315383 FALSE
Find 0.613377 FALSE 1.052925 TRUE
An example of a complete monophthong can be seen in Figure 44, which is a graphical
representation of Shea‟s production of the word “decide.” Here, there is only a slight transition in
both F1 and F2, both of which cause a change in frequency across the vowel of less than 25%.
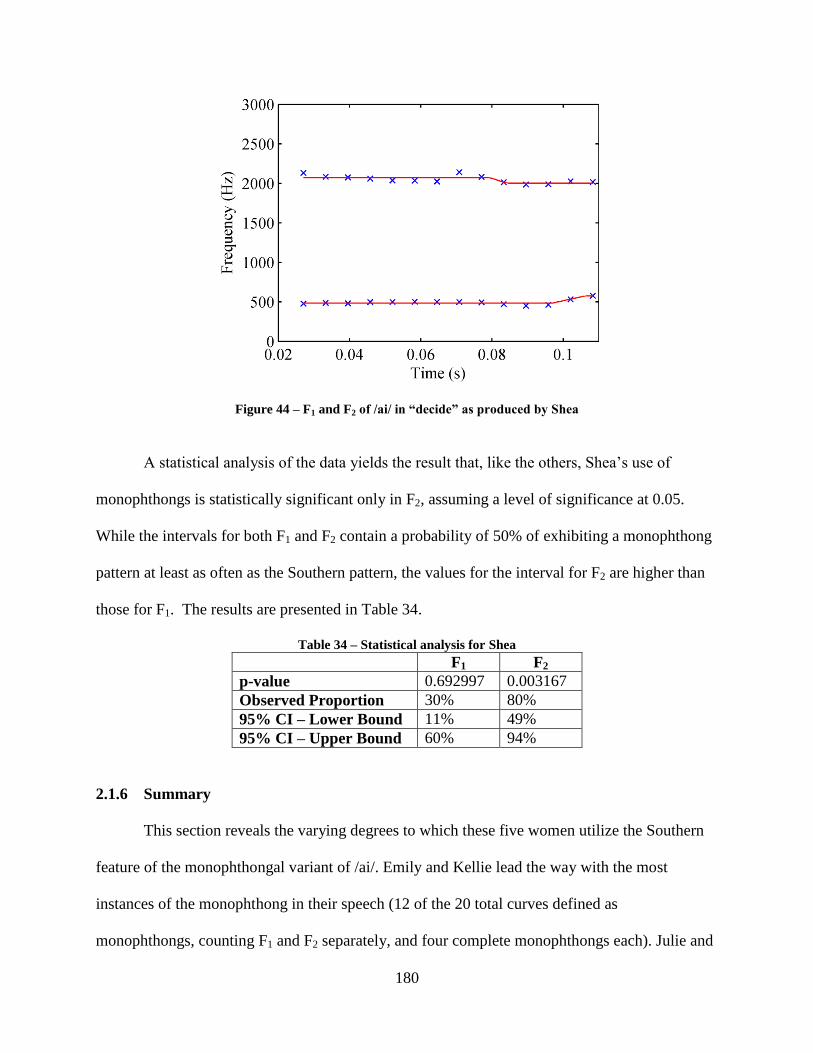
180
Figure 44 – F1 and F2 of /ai/ in “decide” as produced by Shea
A statistical analysis of the data yields the result that, like the others, Shea‟s use of
monophthongs is statistically significant only in F2, assuming a level of significance at 0.05.
While the intervals for both F1 and F2 contain a probability of 50% of exhibiting a monophthong
pattern at least as often as the Southern pattern, the values for the interval for F2 are higher than
those for F1. The results are presented in Table 34.
Table 34 – Statistical analysis for Shea
F1 F2
p-value 0.692997 0.003167
Observed Proportion 30% 80%
95% CI – Lower Bound 11% 49%
95% CI – Upper Bound 60% 94%
2.1.6 Summary
This section reveals the varying degrees to which these five women utilize the Southern
feature of the monophthongal variant of /ai/. Emily and Kellie lead the way with the most
instances of the monophthong in their speech (12 of the 20 total curves defined as
monophthongs, counting F1 and F2 separately, and four complete monophthongs each). Julie and
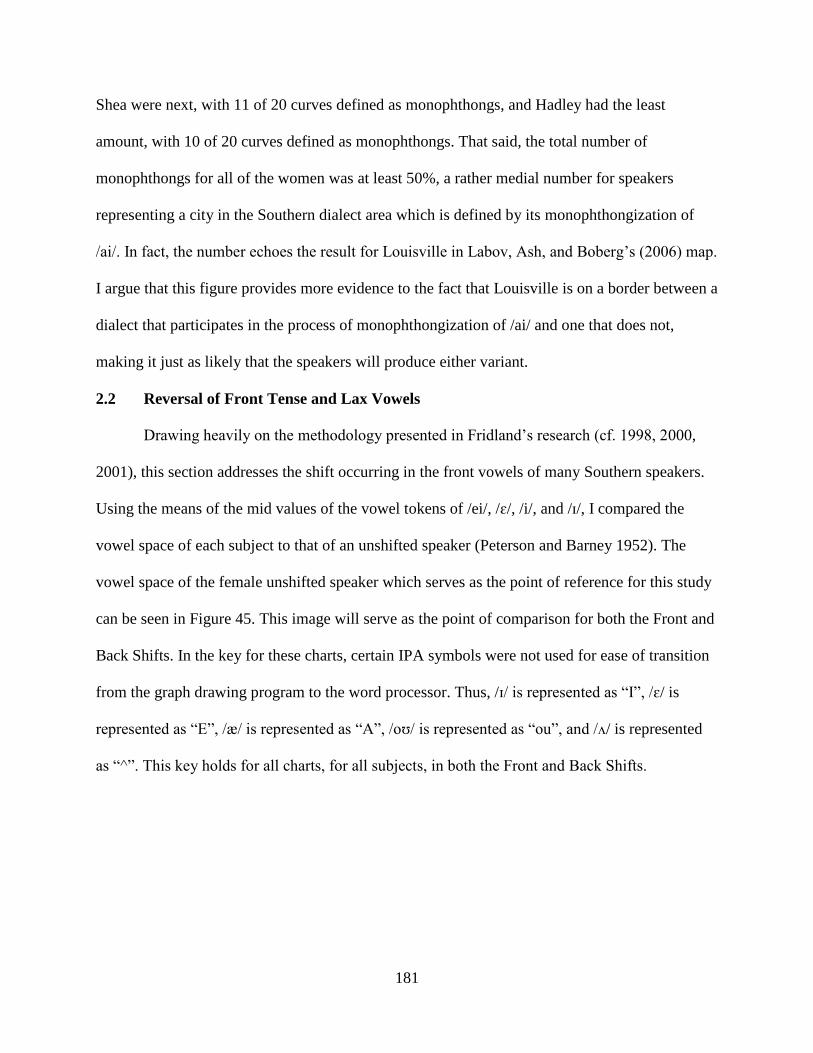
181
Shea were next, with 11 of 20 curves defined as monophthongs, and Hadley had the least
amount, with 10 of 20 curves defined as monophthongs. That said, the total number of
monophthongs for all of the women was at least 50%, a rather medial number for speakers
representing a city in the Southern dialect area which is defined by its monophthongization of
/ai/. In fact, the number echoes the result for Louisville in Labov, Ash, and Boberg‟s (2006) map.
I argue that this figure provides more evidence to the fact that Louisville is on a border between a
dialect that participates in the process of monophthongization of /ai/ and one that does not,
making it just as likely that the speakers will produce either variant.
2.2 Reversal of Front Tense and Lax Vowels
Drawing heavily on the methodology presented in Fridland‟s research (cf. 1998, 2000,
2001), this section addresses the shift occurring in the front vowels of many Southern speakers.
Using the means of the mid values of the vowel tokens of /ei/, /ɛ/, /i/, and /ɪ/, I compared the
vowel space of each subject to that of an unshifted speaker (Peterson and Barney 1952). The
vowel space of the female unshifted speaker which serves as the point of reference for this study
can be seen in Figure 45. This image will serve as the point of comparison for both the Front and
Back Shifts. In the key for these charts, certain IPA symbols were not used for ease of transition
from the graph drawing program to the word processor. Thus, /ɪ/ is represented as “I”, /ɛ/ is
represented as “E”, /æ/ is represented as “A”, /oʊ/ is represented as “ou”, and /ʌ/ is represented
as “^”. This key holds for all charts, for all subjects, in both the Front and Back Shifts.
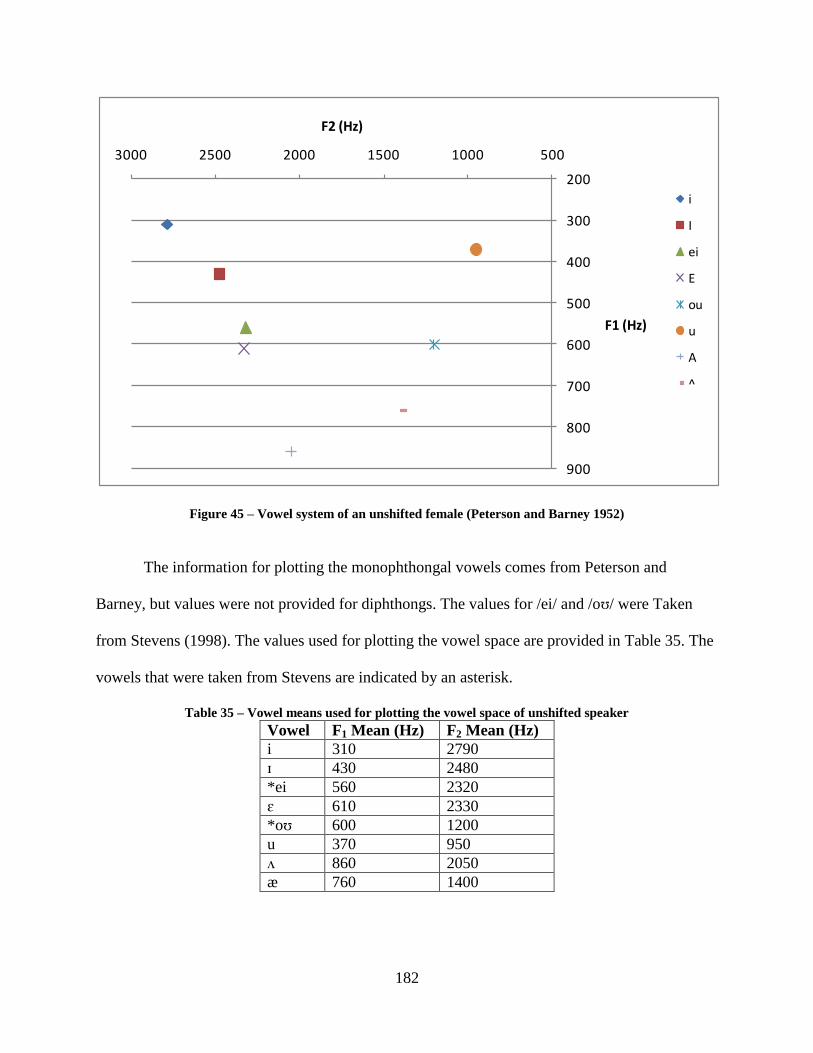
182
Figure 45 – Vowel system of an unshifted female (Peterson and Barney 1952)
The information for plotting the monophthongal vowels comes from Peterson and
Barney, but values were not provided for diphthongs. The values for /ei/ and /oʊ/ were Taken
from Stevens (1998). The values used for plotting the vowel space are provided in Table 35. The
vowels that were taken from Stevens are indicated by an asterisk.
Table 35 – Vowel means used for plotting the vowel space of unshifted speaker
Vowel F1 Mean (Hz) F2 Mean (Hz)
i 310 2790
ɪ 430 2480
*ei 560 2320
ɛ 610 2330
*oʊ 600 1200
u 370 950
ʌ 860 2050
æ 760 1400
200
300
400
500
600
700
800
900
50010001500200025003000
F1 (Hz)
F2 (Hz)
i
I
ei
E
ou
u
A
^
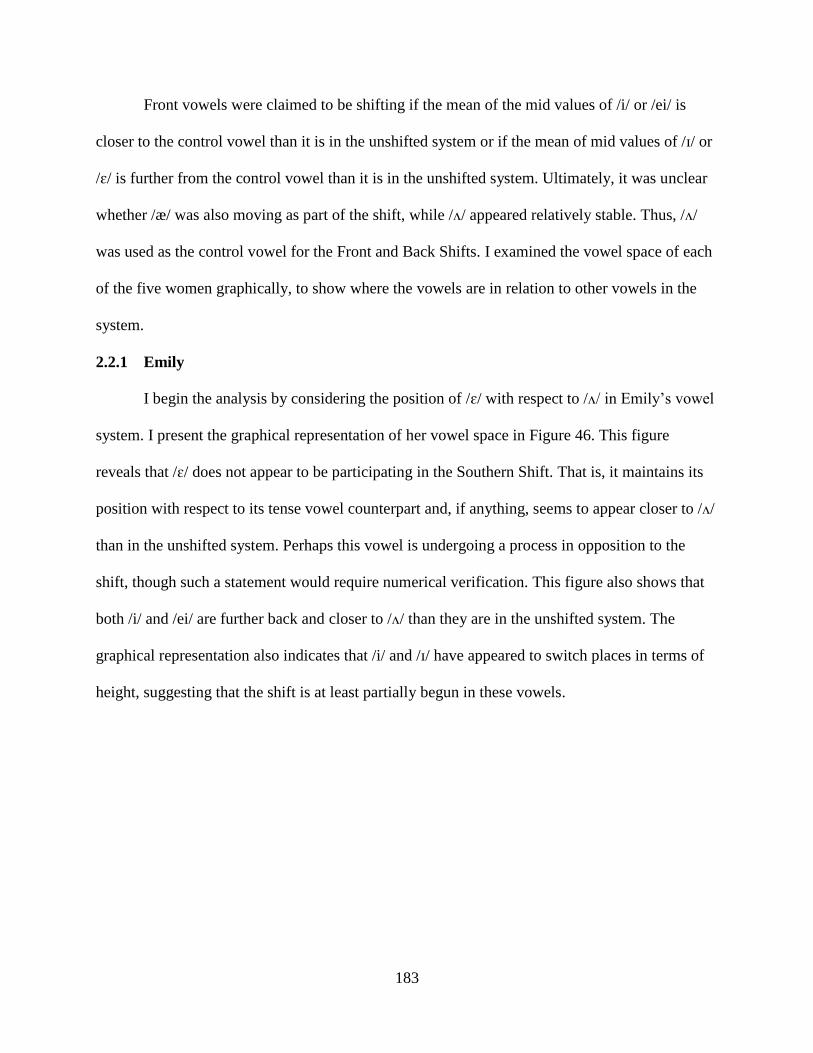
183
Front vowels were claimed to be shifting if the mean of the mid values of /i/ or /ei/ is
closer to the control vowel than it is in the unshifted system or if the mean of mid values of /ɪ/ or
/ɛ/ is further from the control vowel than it is in the unshifted system. Ultimately, it was unclear
whether /æ/ was also moving as part of the shift, while /ʌ/ appeared relatively stable. Thus, /ʌ/
was used as the control vowel for the Front and Back Shifts. I examined the vowel space of each
of the five women graphically, to show where the vowels are in relation to other vowels in the
system.
2.2.1 Emily
I begin the analysis by considering the position of /ɛ/ with respect to /ʌ/ in Emily‟s vowel
system. I present the graphical representation of her vowel space in Figure 46. This figure
reveals that /ɛ/ does not appear to be participating in the Southern Shift. That is, it maintains its
position with respect to its tense vowel counterpart and, if anything, seems to appear closer to /ʌ/
than in the unshifted system. Perhaps this vowel is undergoing a process in opposition to the
shift, though such a statement would require numerical verification. This figure also shows that
both /i/ and /ei/ are further back and closer to /ʌ/ than they are in the unshifted system. The
graphical representation also indicates that /i/ and /ɪ/ have appeared to switch places in terms of
height, suggesting that the shift is at least partially begun in these vowels.
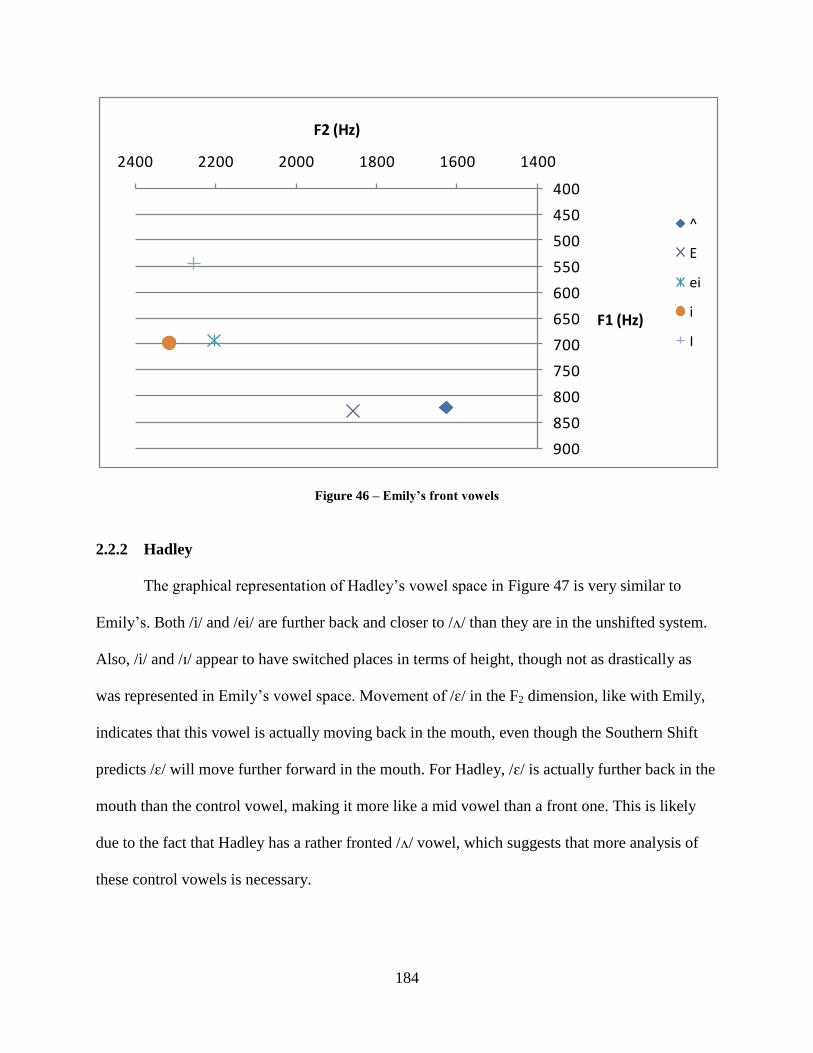
184
Figure 46 – Emily’s front vowels
2.2.2 Hadley
The graphical representation of Hadley‟s vowel space in Figure 47 is very similar to
Emily‟s. Both /i/ and /ei/ are further back and closer to /ʌ/ than they are in the unshifted system.
Also, /i/ and /ɪ/ appear to have switched places in terms of height, though not as drastically as
was represented in Emily‟s vowel space. Movement of /ɛ/ in the F2 dimension, like with Emily,
indicates that this vowel is actually moving back in the mouth, even though the Southern Shift
predicts /ɛ/ will move further forward in the mouth. For Hadley, /ɛ/ is actually further back in the
mouth than the control vowel, making it more like a mid vowel than a front one. This is likely
due to the fact that Hadley has a rather fronted /ʌ/ vowel, which suggests that more analysis of
these control vowels is necessary.
400
450
500
550
600
650
700
750
800
850
900
140016001800200022002400
F1 (Hz)
F2 (Hz)
^
E
ei
i
I
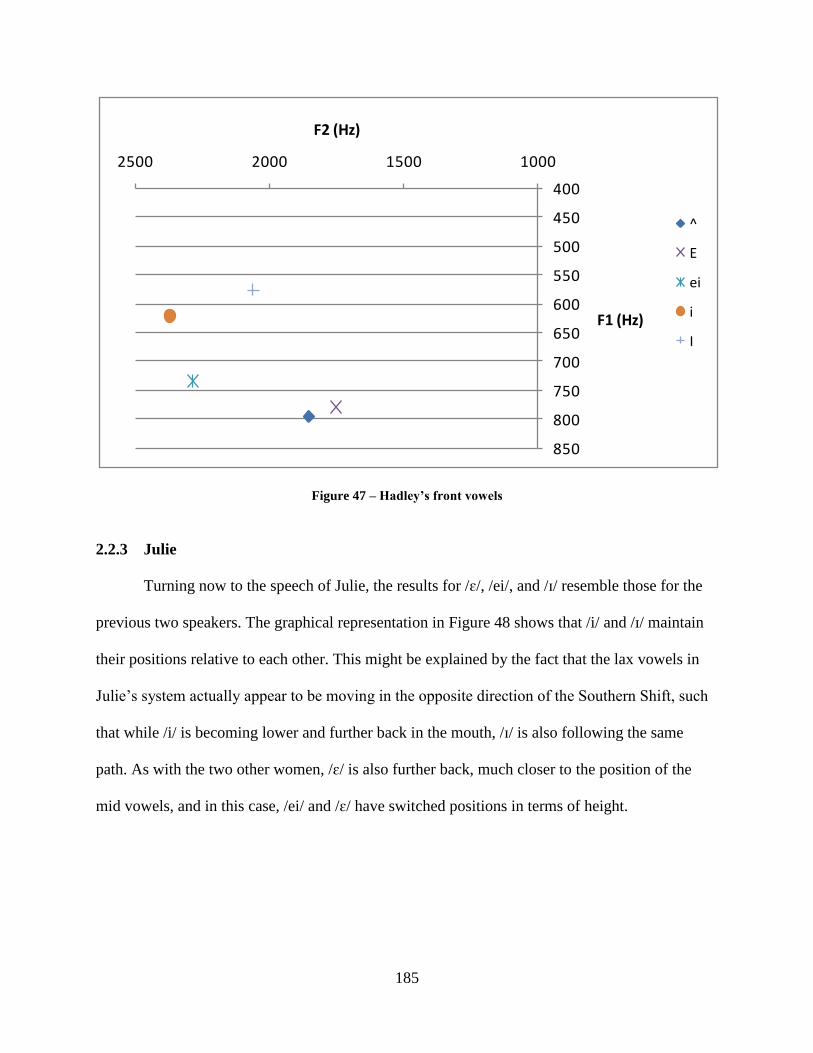
185
Figure 47 – Hadley’s front vowels
2.2.3 Julie
Turning now to the speech of Julie, the results for /ɛ/, /ei/, and /ɪ/ resemble those for the
previous two speakers. The graphical representation in Figure 48 shows that /i/ and /ɪ/ maintain
their positions relative to each other. This might be explained by the fact that the lax vowels in
Julie‟s system actually appear to be moving in the opposite direction of the Southern Shift, such
that while /i/ is becoming lower and further back in the mouth, /ɪ/ is also following the same
path. As with the two other women, /ɛ/ is also further back, much closer to the position of the
mid vowels, and in this case, /ei/ and /ɛ/ have switched positions in terms of height.
400
450
500
550
600
650
700
750
800
850
1000150020002500
F1 (Hz)
F2 (Hz)
^
E
ei
i
I
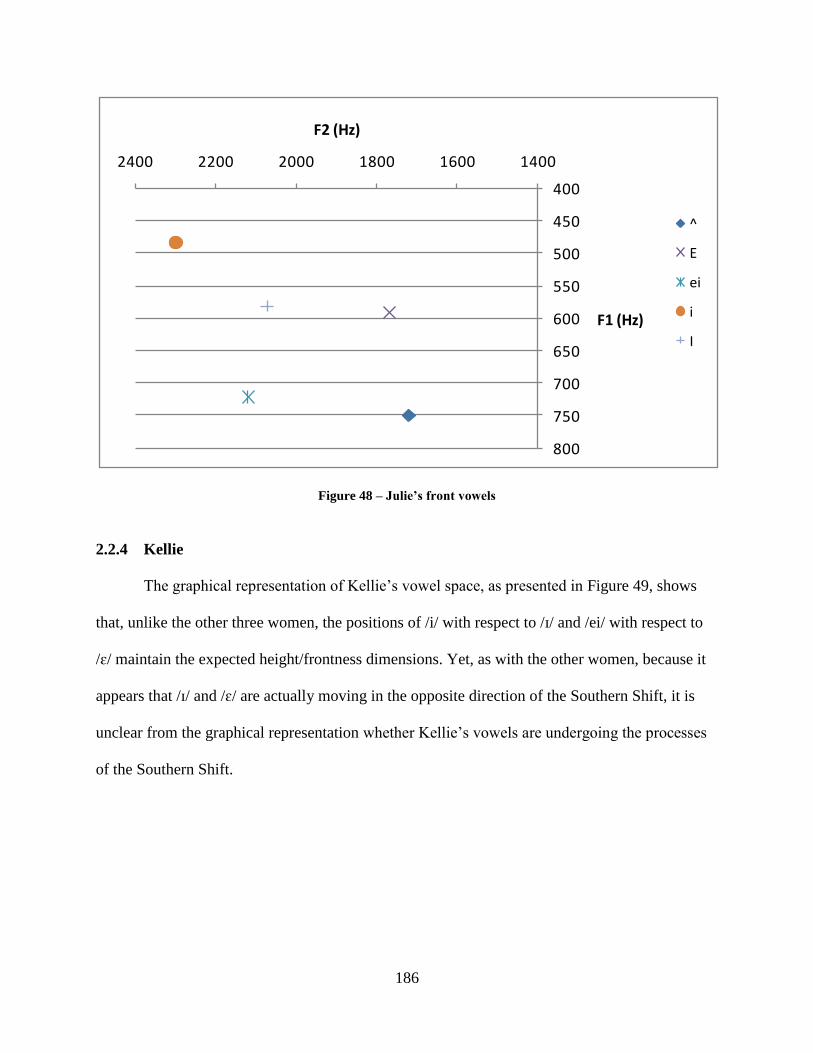
186
Figure 48 – Julie’s front vowels
2.2.4 Kellie
The graphical representation of Kellie‟s vowel space, as presented in Figure 49, shows
that, unlike the other three women, the positions of /i/ with respect to /ɪ/ and /ei/ with respect to
/ɛ/ maintain the expected height/frontness dimensions. Yet, as with the other women, because it
appears that /ɪ/ and /ɛ/ are actually moving in the opposite direction of the Southern Shift, it is
unclear from the graphical representation whether Kellie‟s vowels are undergoing the processes
of the Southern Shift.
400
450
500
550
600
650
700
750
800
140016001800200022002400
F1 (Hz)
F2 (Hz)
^
E
ei
i
I
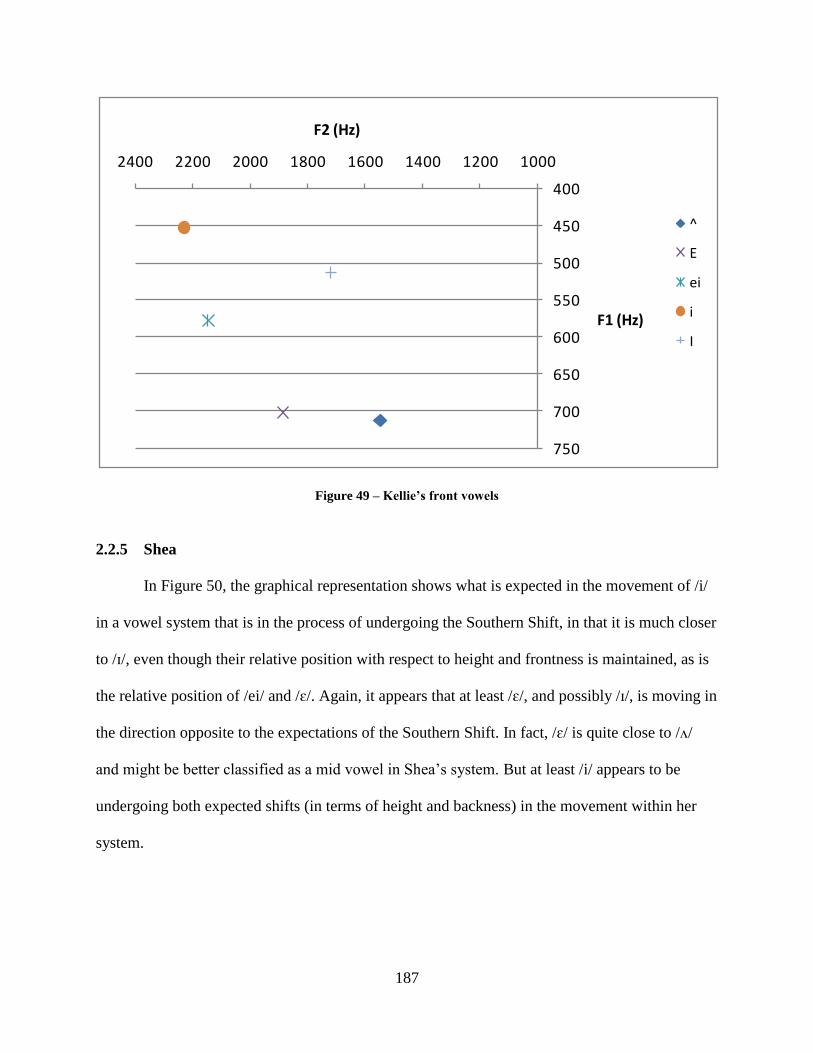
187
Figure 49 – Kellie’s front vowels
2.2.5 Shea
In Figure 50, the graphical representation shows what is expected in the movement of /i/
in a vowel system that is in the process of undergoing the Southern Shift, in that it is much closer
to /ɪ/, even though their relative position with respect to height and frontness is maintained, as is
the relative position of /ei/ and /ɛ/. Again, it appears that at least /ɛ/, and possibly /ɪ/, is moving in
the direction opposite to the expectations of the Southern Shift. In fact, /ɛ/ is quite close to /ʌ/
and might be better classified as a mid vowel in Shea‟s system. But at least /i/ appears to be
undergoing both expected shifts (in terms of height and backness) in the movement within her
system.
400
450
500
550
600
650
700
750
10001200140016001800200022002400
F1 (Hz)
F2 (Hz)
^
E
ei
i
I
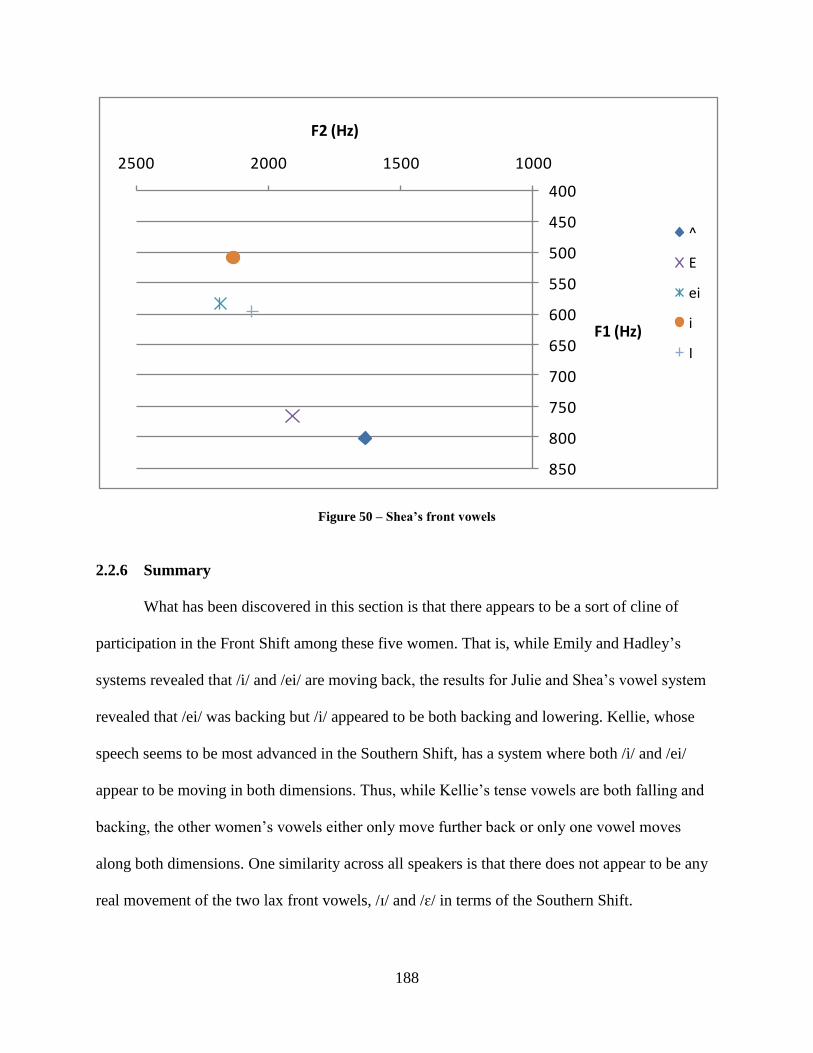
188
Figure 50 – Shea’s front vowels
2.2.6 Summary
What has been discovered in this section is that there appears to be a sort of cline of
participation in the Front Shift among these five women. That is, while Emily and Hadley‟s
systems revealed that /i/ and /ei/ are moving back, the results for Julie and Shea‟s vowel system
revealed that /ei/ was backing but /i/ appeared to be both backing and lowering. Kellie, whose
speech seems to be most advanced in the Southern Shift, has a system where both /i/ and /ei/
appear to be moving in both dimensions. Thus, while Kellie‟s tense vowels are both falling and
backing, the other women‟s vowels either only move further back or only one vowel moves
along both dimensions. One similarity across all speakers is that there does not appear to be any
real movement of the two lax front vowels, /ɪ/ and /ɛ/ in terms of the Southern Shift.
400
450
500
550
600
650
700
750
800
850
1000150020002500
F1 (Hz)
F2 (Hz)
^
E
ei
i
I
189
These results are best understood in light of previous research on the Southern Shift. As
Fridland notes, “Labov‟s description of the Southern Shift includes two major tendencies: (1) the
flip-flop in the position of the tense and lax vowels in the front system, led by the falling of /ey/
and subsequent falling of /iy/, and the monophthongization of /ay/; and (2) the fronting of several
of the back vowels” (Fridland 2000: 268). This means that, in the Front Shift, /ei/ falls first, then
/i/ falls. The results of the current study seem to indicate that, if taking the most conservative
systems as the starting points of the shift, the backing of these two vowels happens first.
Additionally, while the most active changes in Fridland‟s study were occurring in /ei/ and /ɛ/
(other shifts were noted as rare in that study), this study seems to indicate that the backing of /ei/
and /i/ leads the shift, followed by the lowering of /i/ and then the lowering of /ei/, as in the most
radical system of Kellie.
How can these differences from previous studies be explained? One explanation might be
found in the particular population from which this data was drawn. One might describe these
subjects as young, (upper-) middle to upper class women, resembling some of the upper class
speakers in Feagin‟s (1986) study in Alabama. Fridland (1998) points out that Feagin‟s results
with upper class speakers suggest “that the changes occurring in Southern speech are perhaps
being adopted as incoming norms from below and have not yet reached the level of conscious
awareness which might cause them to be suppressed” (62). Thus, the changes might be occurring
in a different pattern than found in other socio-economic groups in previous studies.
Despite the fact that the order in which the shift is taking place is different for these
women, it is important to note that the shift is at least partially taking place. This indicates that 1)
the shift has at least partially made its way into urban centers, as Fridland also showed with
Memphis, 2) these Louisvillians have access to features that have been fairly well contained
190
within the Southern dialects, and 3) there are varying levels of participation in the shift, even
among a rather homogenous group (young, female, higher socioeconomic class), which is also
indicative of the border nature of the city.
2.3 Fronting of Back Vowels
In this section, I again follow the methodology of Fridland (cf. 1998, 2000, 2001) in
examining the movement of the back vowels in the Southern Shift. Using the same unshifted
speaker as presented in Figure 45, this section examines the speech of each woman in order to
determine the level of participation in the Back Shift.
Back vowels were claimed to be shifting if the mean of the mid values of /u/ or /oʊ/ is
closer to the control vowel /ʌ/ than it is in the unshifted system. Even though the shift has been
mostly described in terms of fronting, this section also examines the level to which these vowels
may also be lowering. I examine the vowel space of each of the five women graphically, to show
where the vowels are in relation to other vowels in the system.
2.3.1 Emily
As with the Front Shift, I turn to graphical representations to understand the nature of the
vowel system for each woman. The graphical representation of Emily‟s back vowels can be seen
in Figure 51. Here it is clear that while /oʊ/ maintains its position behind /ʌ/, though closer than
in the unshifted system, /u/ has fronted to the point that it is in front of /ʌ/, perhaps more
appropriately being characterized as a front vowel. There appears to be no change in terms of the
height of these vowels.
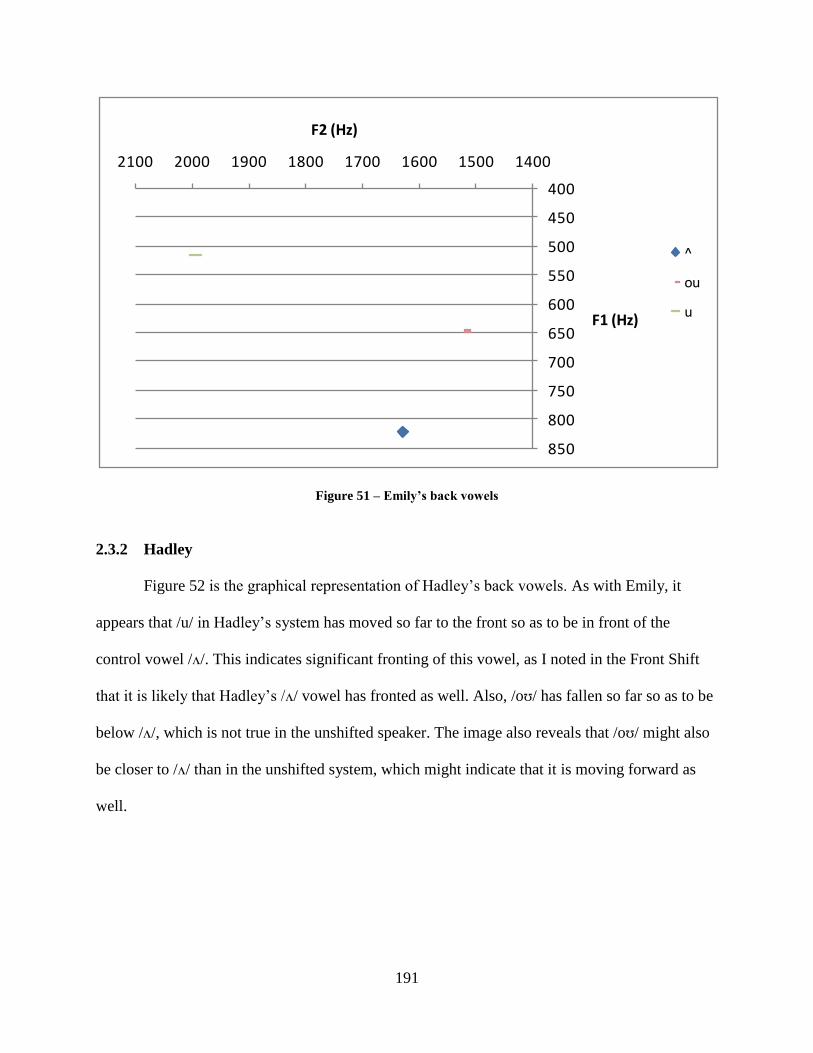
191
Figure 51 – Emily’s back vowels
2.3.2 Hadley
Figure 52 is the graphical representation of Hadley‟s back vowels. As with Emily, it
appears that /u/ in Hadley‟s system has moved so far to the front so as to be in front of the
control vowel /ʌ/. This indicates significant fronting of this vowel, as I noted in the Front Shift
that it is likely that Hadley‟s /ʌ/ vowel has fronted as well. Also, /oʊ/ has fallen so far so as to be
below /ʌ/, which is not true in the unshifted speaker. The image also reveals that /oʊ/ might also
be closer to /ʌ/ than in the unshifted system, which might indicate that it is moving forward as
well.
400
450
500
550
600
650
700
750
800
850
14001500160017001800190020002100
F1 (Hz)
F2 (Hz)
^
ou
u
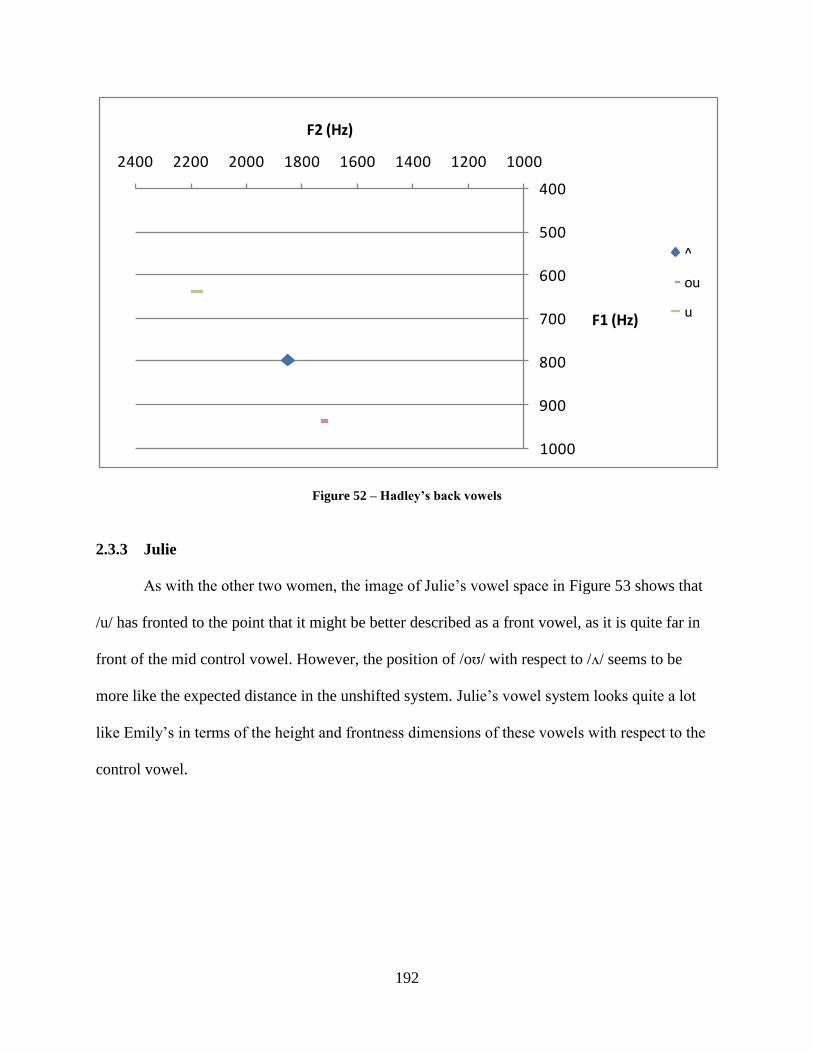
192
Figure 52 – Hadley’s back vowels
2.3.3 Julie
As with the other two women, the image of Julie‟s vowel space in Figure 53 shows that
/u/ has fronted to the point that it might be better described as a front vowel, as it is quite far in
front of the mid control vowel. However, the position of /oʊ/ with respect to /ʌ/ seems to be
more like the expected distance in the unshifted system. Julie‟s vowel system looks quite a lot
like Emily‟s in terms of the height and frontness dimensions of these vowels with respect to the
control vowel.
400
500
600
700
800
900
1000
10001200140016001800200022002400
F1 (Hz)
F2 (Hz)
^
ou
u
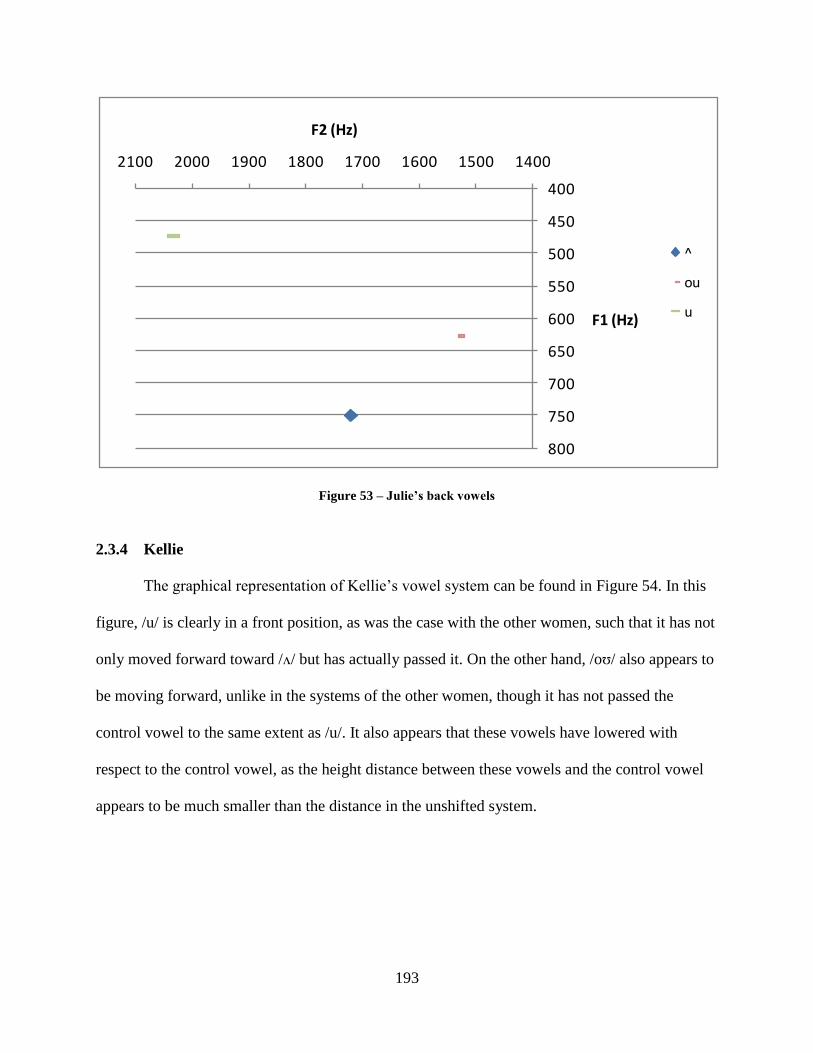
193
Figure 53 – Julie’s back vowels
2.3.4 Kellie
The graphical representation of Kellie‟s vowel system can be found in Figure 54. In this
figure, /u/ is clearly in a front position, as was the case with the other women, such that it has not
only moved forward toward /ʌ/ but has actually passed it. On the other hand, /oʊ/ also appears to
be moving forward, unlike in the systems of the other women, though it has not passed the
control vowel to the same extent as /u/. It also appears that these vowels have lowered with
respect to the control vowel, as the height distance between these vowels and the control vowel
appears to be much smaller than the distance in the unshifted system.
400
450
500
550
600
650
700
750
800
14001500160017001800190020002100
F1 (Hz)
F2 (Hz)
^
ou
u
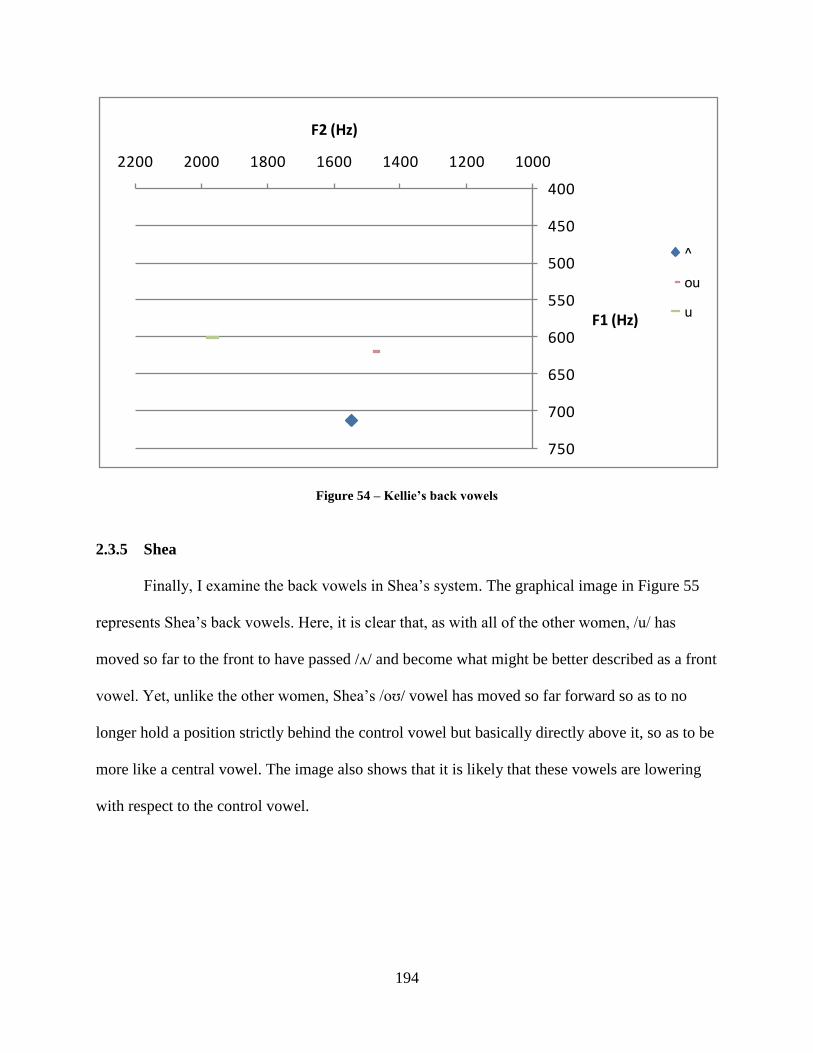
194
Figure 54 – Kellie’s back vowels
2.3.5 Shea
Finally, I examine the back vowels in Shea‟s system. The graphical image in Figure 55
represents Shea‟s back vowels. Here, it is clear that, as with all of the other women, /u/ has
moved so far to the front to have passed /ʌ/ and become what might be better described as a front
vowel. Yet, unlike the other women, Shea‟s /oʊ/ vowel has moved so far forward so as to no
longer hold a position strictly behind the control vowel but basically directly above it, so as to be
more like a central vowel. The image also shows that it is likely that these vowels are lowering
with respect to the control vowel.
400
450
500
550
600
650
700
750
1000120014001600180020002200
F1 (Hz)
F2 (Hz)
^
ou
u
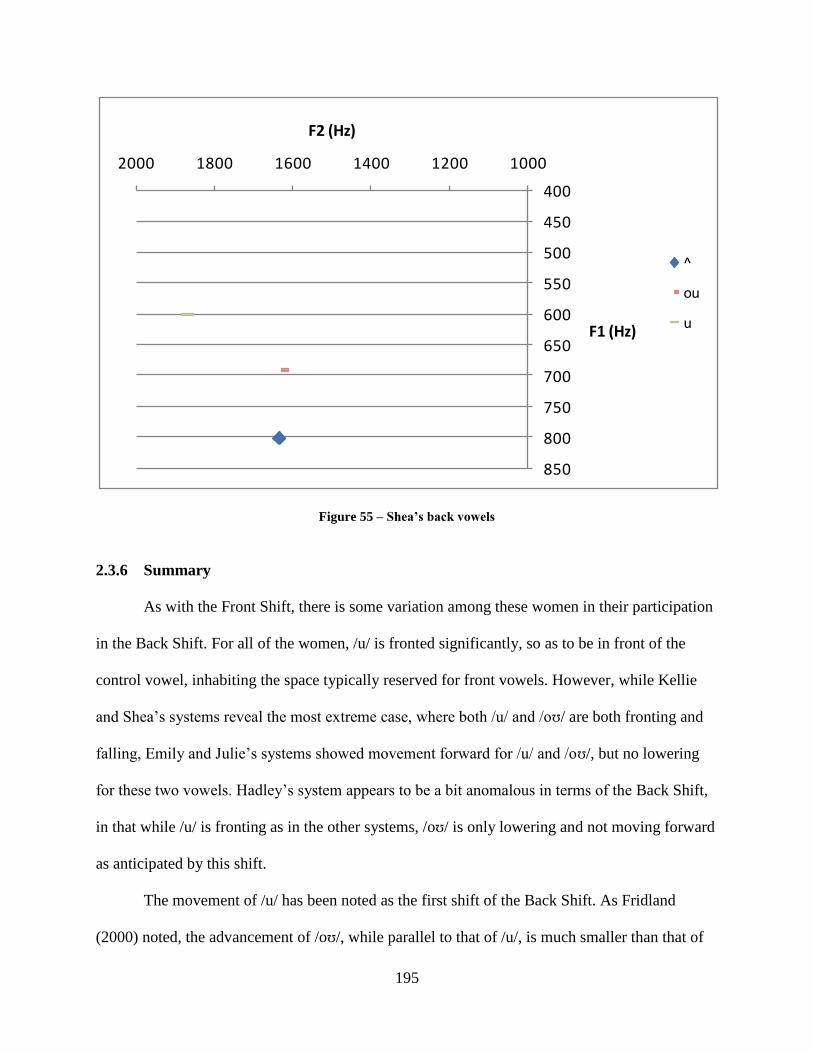
195
Figure 55 – Shea’s back vowels
2.3.6 Summary
As with the Front Shift, there is some variation among these women in their participation
in the Back Shift. For all of the women, /u/ is fronted significantly, so as to be in front of the
control vowel, inhabiting the space typically reserved for front vowels. However, while Kellie
and Shea‟s systems reveal the most extreme case, where both /u/ and /oʊ/ are both fronting and
falling, Emily and Julie‟s systems showed movement forward for /u/ and /oʊ/, but no lowering
for these two vowels. Hadley‟s system appears to be a bit anomalous in terms of the Back Shift,
in that while /u/ is fronting as in the other systems, /oʊ/ is only lowering and not moving forward
as anticipated by this shift.
The movement of /u/ has been noted as the first shift of the Back Shift. As Fridland
(2000) noted, the advancement of /oʊ/, while parallel to that of /u/, is much smaller than that of
400
450
500
550
600
650
700
750
800
850
100012001400160018002000
F1 (Hz)
F2 (Hz)
^
ou
u
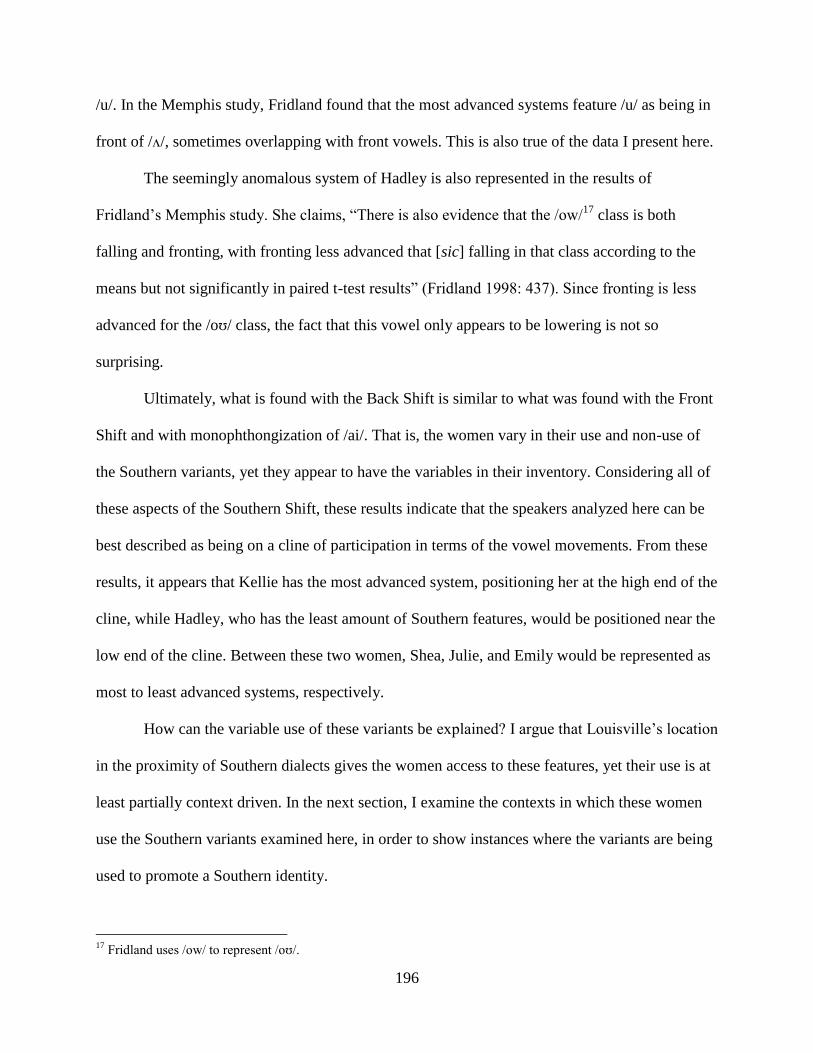
196
/u/. In the Memphis study, Fridland found that the most advanced systems feature /u/ as being in
front of /ʌ/, sometimes overlapping with front vowels. This is also true of the data I present here.
The seemingly anomalous system of Hadley is also represented in the results of
Fridland‟s Memphis study. She claims, “There is also evidence that the /ow/17
class is both
falling and fronting, with fronting less advanced that [sic] falling in that class according to the
means but not significantly in paired t-test results” (Fridland 1998: 437). Since fronting is less
advanced for the /oʊ/ class, the fact that this vowel only appears to be lowering is not so
surprising.
Ultimately, what is found with the Back Shift is similar to what was found with the Front
Shift and with monophthongization of /ai/. That is, the women vary in their use and non-use of
the Southern variants, yet they appear to have the variables in their inventory. Considering all of
these aspects of the Southern Shift, these results indicate that the speakers analyzed here can be
best described as being on a cline of participation in terms of the vowel movements. From these
results, it appears that Kellie has the most advanced system, positioning her at the high end of the
cline, while Hadley, who has the least amount of Southern features, would be positioned near the
low end of the cline. Between these two women, Shea, Julie, and Emily would be represented as
most to least advanced systems, respectively.
How can the variable use of these variants be explained? I argue that Louisville‟s location
in the proximity of Southern dialects gives the women access to these features, yet their use is at
least partially context driven. In the next section, I examine the contexts in which these women
use the Southern variants examined here, in order to show instances where the variants are being
used to promote a Southern identity.
17
Fridland uses /ow/ to represent /oʊ/.
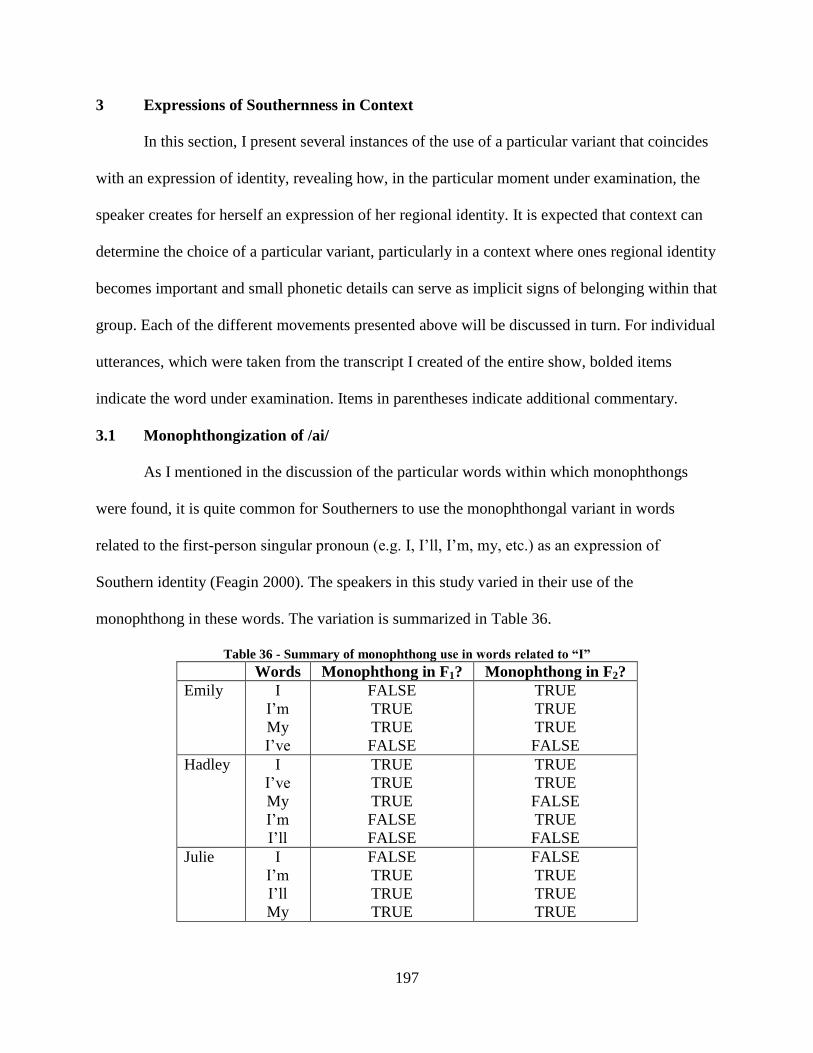
197
3 Expressions of Southernness in Context
In this section, I present several instances of the use of a particular variant that coincides
with an expression of identity, revealing how, in the particular moment under examination, the
speaker creates for herself an expression of her regional identity. It is expected that context can
determine the choice of a particular variant, particularly in a context where ones regional identity
becomes important and small phonetic details can serve as implicit signs of belonging within that
group. Each of the different movements presented above will be discussed in turn. For individual
utterances, which were taken from the transcript I created of the entire show, bolded items
indicate the word under examination. Items in parentheses indicate additional commentary.
3.1 Monophthongization of /ai/
As I mentioned in the discussion of the particular words within which monophthongs
were found, it is quite common for Southerners to use the monophthongal variant in words
related to the first-person singular pronoun (e.g. I, I‟ll, I‟m, my, etc.) as an expression of
Southern identity (Feagin 2000). The speakers in this study varied in their use of the
monophthong in these words. The variation is summarized in Table 36.
Table 36 - Summary of monophthong use in words related to “I”
Words Monophthong in F1? Monophthong in F2?
Emily I
I‟m
My
I‟ve
FALSE
TRUE
TRUE
FALSE
TRUE
TRUE
TRUE
FALSE
Hadley I
I‟ve
My
I‟m
I‟ll
TRUE
TRUE
TRUE
FALSE
FALSE
TRUE
TRUE
FALSE
TRUE
FALSE
Julie I
I‟m
I‟ll
My
FALSE
TRUE
TRUE
TRUE
FALSE
TRUE
TRUE
TRUE
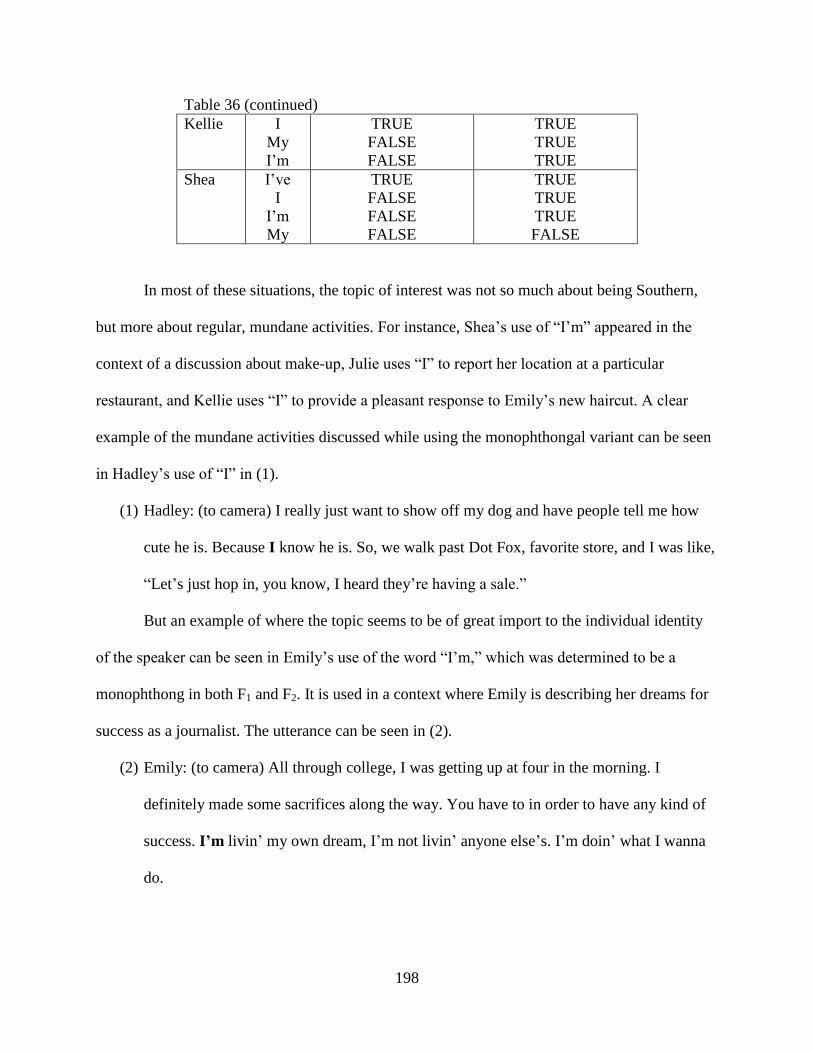
198
Table 36 (continued)
Kellie I
My
I‟m
TRUE
FALSE
FALSE
TRUE
TRUE
TRUE
Shea I‟ve
I
I‟m
My
TRUE
FALSE
FALSE
FALSE
TRUE
TRUE
TRUE
FALSE
In most of these situations, the topic of interest was not so much about being Southern,
but more about regular, mundane activities. For instance, Shea‟s use of “I‟m” appeared in the
context of a discussion about make-up, Julie uses “I” to report her location at a particular
restaurant, and Kellie uses “I” to provide a pleasant response to Emily‟s new haircut. A clear
example of the mundane activities discussed while using the monophthongal variant can be seen
in Hadley‟s use of “I” in (1).
(1) Hadley: (to camera) I really just want to show off my dog and have people tell me how
cute he is. Because I know he is. So, we walk past Dot Fox, favorite store, and I was like,
“Let‟s just hop in, you know, I heard they‟re having a sale.”
But an example of where the topic seems to be of great import to the individual identity
of the speaker can be seen in Emily‟s use of the word “I‟m,” which was determined to be a
monophthong in both F1 and F2. It is used in a context where Emily is describing her dreams for
success as a journalist. The utterance can be seen in (2).
(2) Emily: (to camera) All through college, I was getting up at four in the morning. I
definitely made some sacrifices along the way. You have to in order to have any kind of
success. I’m livin‟ my own dream, I‟m not livin‟ anyone else‟s. I‟m doin‟ what I wanna
do.
199
This example is interesting in that, in the production of a sentence dealing clearly with identity
issues, the first-person singular pronoun surfaces as the Southern variant. Given that Emily has
the ability to produce non-monophthongal versions of /ai/, the use of the Southern variant in this
context emerges as a linguistic act of identity (Le Page and Tabouret-Keller 1985), indicating an
inherent connection between her identity at this moment and Southernness.
Contexts where the speaker‟s “real” or vernacular speech is likely to arise include
instances where the speaker is paying little attention to their speech, as in discussions of their
fear of dying or other emotional situations (e.g. Labov 1984). For Shea, this occurs when she
reveals that she has suffered two rather sad events, as seen in (3).
(3) Shea: (to camera) Jeff and I were going through a rough patch, and he was sort of
disappearing on me. I knew I was being lied to. The two biggest surprises of my entire
life both happened in the same week. My fiancé cheated on me and my mom died. I lost
my mother and my best friend.
In this instance, Shea, who is visibly distraught, reveals her sad news, and in doing so, she uses
the standard /ai/ vowel, not the monophthong, in her production of “my.” While the fact that she
is speaking on camera, a situation that likely requires some attention to speech, might have
created the actual context for her usage, it is important to also note that Shea rarely shows this
level of emotion throughout the course of the show. At one point, she even comments that she
does not cry. Yet, in this instance, Shea is upset, and her use of the diphthongal variant might be
best linked to her understanding of the seriousness of the issue, not necessarily with her
expression of Southernness.
200
Examples (4) and (5) from Kellie‟s speech represent two utterances over the course of a
short period of time, where Kellie is trying to set her mom up on a date with a man she meets at a
coffee shop. In both of these utterances, Kellie uses the monophthongal variant.
(4) Kellie: (to man) Oh, good! I‟m very excited. I’m Kellie.
(5) Kellie: (to man) Um! (laughter) If you are up for it, would you like to go on a date with
my momma?
What is different about this case is that Kellie is not talking to the camera. She is talking to
another person with whom she would like to build a connection. In both the expression of her
name in (4), an expression clearly linked to one‟s personal identity, and her mention of her
mother in (5), another likely context connected closely to Kellie‟s identity, Kellie produces at
least a partially monophthongal vowel. This use indicates that Kellie is attempting to present
herself as a Southerner to this man, something she must assume he will appreciate, since she is
trying to get him to do something for her. This expression of Southernness, then, appears in the
context of Kellie‟s attempt to be real, friendly, and hospitable, in order to get what she wants.
Moving beyond the words that are related to “I,” Julie‟s use of the monophthongal
variant in her production of “sometimes” can be seen in (6). This word, uttered in front of the
camera, comes in the context of Julie being set up by Kellie on a second blind date after having
already been rejected.
(6) Julie: (to camera) Sometimes you have to be vulnerable in order to make yourself
available for good things to happen.
Julie‟s vulnerability is made explicit through this statement, yet she hopes to acknowledge that
one has to try in order to succeed. This vulnerability might also be described in terms of being
emotional, a situation where the vernacular is likely to arise. Julie‟s use of the monophthongal
201
variant in this context reveals that her vulnerability is expressed through the use of Southern
vowels.
This section has shown that, particularly with the first person pronoun examples, the use
of the monophthongal variant is rather varied. Contexts where identity is key or where emotions
run deep seem to trigger the use of the Southern vowels, though perhaps seriousness or other
situations require the use of the standard variant. It is not completely clear that these women
draw distinctions between contexts for expressing Southernness and contexts for not. The
seemingly random use or non-use of the Southern variant further indicates the fluidity and
dynamicity of the border situation, such that the choice in variant is both chaotic and complex for
these speakers.
3.2 Front Shift
In analyzing the contexts of use for the Front Shift, I compare the position of the vowel in
individual instances with the control vowel /ʌ/. To make the analysis of context comparable to
the analysis above, I focus on the vowels which appeared to be moving. For example, in Shea‟s
speech, the graphical representation indicated that there was backing of /ei/ and backing and
lowering of /i/, and an example of a token of /ei/ can be found in (7).
(7) Shea: I‟d say I‟ve definitely been a daddy‟s girl.
In this utterance, Shea is expressing something about her identity that indicates that she has a
close relationship with her father. This vowel token, with a mean F2 value of 2,038 Hz, is one of
the most backed tokens of /ei/ in Shea‟s speech. This suggests that this vowel is more like the
Southern shifted vowels. The content of the utterance directly relates to her identity, and the use
of the Southern vowel indirectly links that identity with a Southern one.
202
An example from Hadley‟s speech can be seen in (8). This represents a token of /i/,
which was found to be moving further back with respect to the control vowel. In this utterance,
Hadley is comparing herself to other types of people found in Louisville.
(8) Hadley: When you‟re in Louisville, there‟s always the upper crust people. Who have a
lot of money. I am not in that group.
This token of /i/, with a mean F2 value of 2077 Hz, was one of the tokens that was situated rather
far back in the mouth with respect to the control vowel. The context suggests that Hadley
believes there to be an elite upper class in Louisville, of which many of the other women on the
show claim to be a part, but that she does not belong to that group. Her juxtaposition of herself,
who uses the Southern vowel here, and this upper crust group, while not explicitly about
Southernness, might indicate Hadley‟s acceptance of the poor Southerner stereotype, and her
rejection of the elite Southerner stereotype that the entire show is drawing upon in the name
“Southern Belles.”
In Kellie‟s speech, both /ei/ and /i/ were analyzed as having become more back and lower
with respect to the control vowel. The token of /ei/ from the utterance in (9) is the token that,
with a mean F1 value of 672 Hz and a mean F2 value of 1720 Hz, is the lowest /ei/ token and also
the furthest back, actually being positioned behind the mean values for /ʌ/.
(9) Kellie: Yeah, if you can get over biting someone‟s toe nails then you can concentrate on
that.
In this statement, Kellie is talking to someone about the positive aspects of her matchmaking
business, which will allow people to know the pros and cons about their date up front, so that
they can concentrate on really getting to know the person on the date. Nothing in particular about
this utterance points to Southernness, which suggests that Kellie, even in the most mundane
203
discussions, uses the Southern vowels, which is not unexpected, given that Kellie‟s system
appears to be the most advanced.
Yet, in (10), when Kellie is discussing a rather serious issue with her boyfriend, the
vowel used here is the most front and raised token of /i/ in Kellie‟s speech, putting it in the
position expected in the unshifted system. This appears comparable to Shea‟s use of the
diphthongal variant of /ai/ in her moment of seriousness.
(10) Kellie: (to Jeff) Um, you know when I was married, I was pregnant, but then I lost the
baby, and then, you know, it‟s been, you know, the doctors, you know, “it‟s probably
going to be difficult for you.”
This utterance indicates that, despite Kellie‟s rather frequent use of Southern vowels, she has the
ability to also use the unshifted vowels.
In the analysis of Emily‟s speech, it was determined that both /ei/ and /i/ were backing. In
(11), the struggle Emily is encountering between leaving for Las Vegas or staying in Louisville
reaches a high level, where Emily seeks an unachievable duality. Her use of the word “me”
features the most backed token of /i/ in her speech. Her use of the word “places” contains a
rather backed version of /ei/.
(11) Emily: In Kentucky, there hasn‟t been a lot of opportunities for me for a career and I‟ve
always wanted a little bit more. I think I‟m filling a desire to dream that I have within
myself right now. I‟ve got the great job in Las Vegas, but, in Kentucky, I‟ve got great
friends and this lifestyle that‟s very relaxing and humbling. I want all of that. I wanna be
two people. I wanna be Louisville Emily and Las Vegas Emily, and you can‟t be in two
places at once.
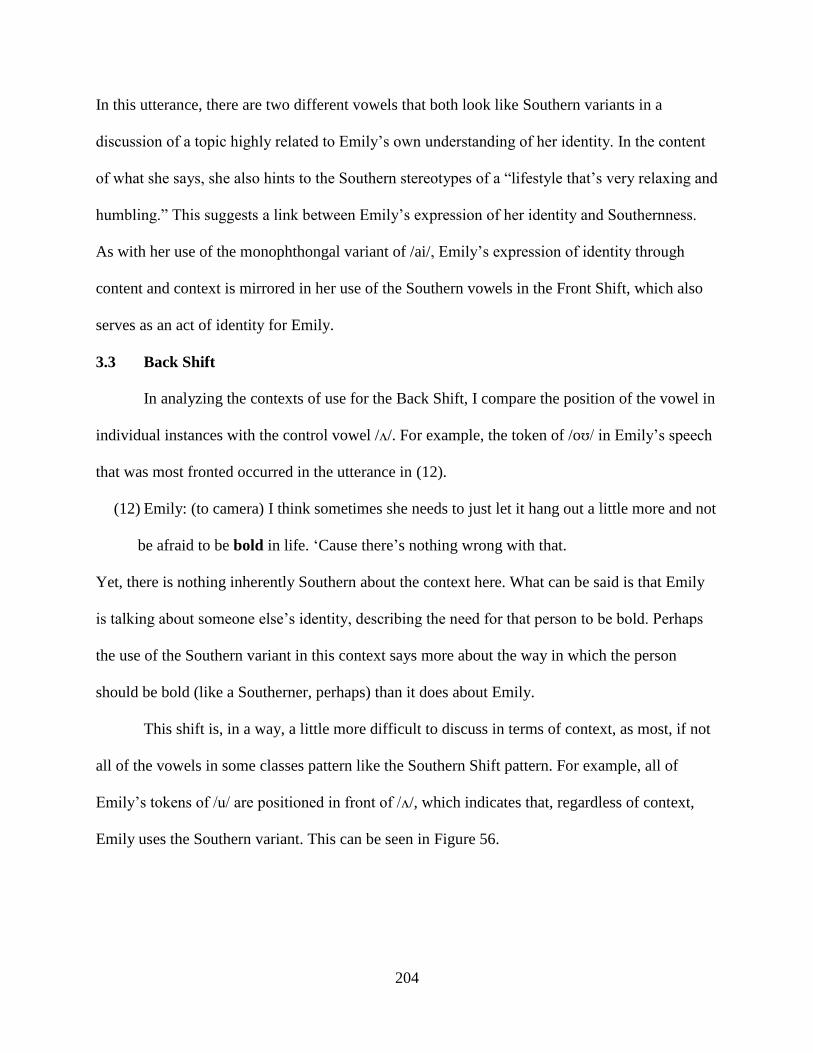
204
In this utterance, there are two different vowels that both look like Southern variants in a
discussion of a topic highly related to Emily‟s own understanding of her identity. In the content
of what she says, she also hints to the Southern stereotypes of a “lifestyle that‟s very relaxing and
humbling.” This suggests a link between Emily‟s expression of her identity and Southernness.
As with her use of the monophthongal variant of /ai/, Emily‟s expression of identity through
content and context is mirrored in her use of the Southern vowels in the Front Shift, which also
serves as an act of identity for Emily.
3.3 Back Shift
In analyzing the contexts of use for the Back Shift, I compare the position of the vowel in
individual instances with the control vowel /ʌ/. For example, the token of /oʊ/ in Emily‟s speech
that was most fronted occurred in the utterance in (12).
(12) Emily: (to camera) I think sometimes she needs to just let it hang out a little more and not
be afraid to be bold in life. „Cause there‟s nothing wrong with that.
Yet, there is nothing inherently Southern about the context here. What can be said is that Emily
is talking about someone else‟s identity, describing the need for that person to be bold. Perhaps
the use of the Southern variant in this context says more about the way in which the person
should be bold (like a Southerner, perhaps) than it does about Emily.
This shift is, in a way, a little more difficult to discuss in terms of context, as most, if not
all of the vowels in some classes pattern like the Southern Shift pattern. For example, all of
Emily‟s tokens of /u/ are positioned in front of /ʌ/, which indicates that, regardless of context,
Emily uses the Southern variant. This can be seen in Figure 56.
205
Figure 56 – Emily’s /u/ tokens in vowel space
It still might be beneficial to examine contexts where identity is expressed both through
content and through use of these vowels. For instance, in (13), there is a case where Emily is
talking to her family about her own identity, using the fronted /oʊ/ in the process.
(13) Emily: (to dad) Ok, there‟s nothing wrong with that. And those roots and the traditions of
my family and my friends and the people that love me for me, I will always cherish that.
Like, you can‟t replace that, and I don‟t ever want to replace that.
In her expression of connectedness to certain roots and traditions, she uses the fronted variant of
/oʊ/ as an additional connector to those same items. That is, she does Southern identity by both
highlighting the stereotypical notions that connect Southernness to appreciation for family and
tradition and by using Southern vowels in her speech.
400
450
500
550
600
650
700
750
800
850
1400160018002000220024002600
F1 (Hz)
F2 (Hz)
^
u
206
Another stereotype of Southerners is their love of what might be called “comfort food,”
or very greasy, hearty foods. When Kellie chooses to prepare some of this kind of food for the
other women, Shea makes the comment in (14).
(14) Shea: (to camera) I understand the comfort food thing. She‟d been through a long day
and I think that you just want to make yourself happy at the time. Kinda ease the stress,
the pain, the feelings, whatever it might be. And we benefitted from it, it was awesome.
In discussing this food, Shea also uses the most fronted token of /u/ in her set to voice the word
“food.” Thus, through the content of her utterance (i.e. appreciation for comfort food) and
through the manner in which she speaks of the food (i.e. using Southern vowels), Shea indexes a
certain level of Southernness.
Recall that /oʊ/ was not seen to be fronting in Hadley‟s system, which suggests that it
might be possible to find examples where the vowel is fronted and others where it is not. All of
Hadley‟s /oʊ/ tokens can be seen in Figure 57, which shows that these tokens were mostly all
still behind /ʌ/.
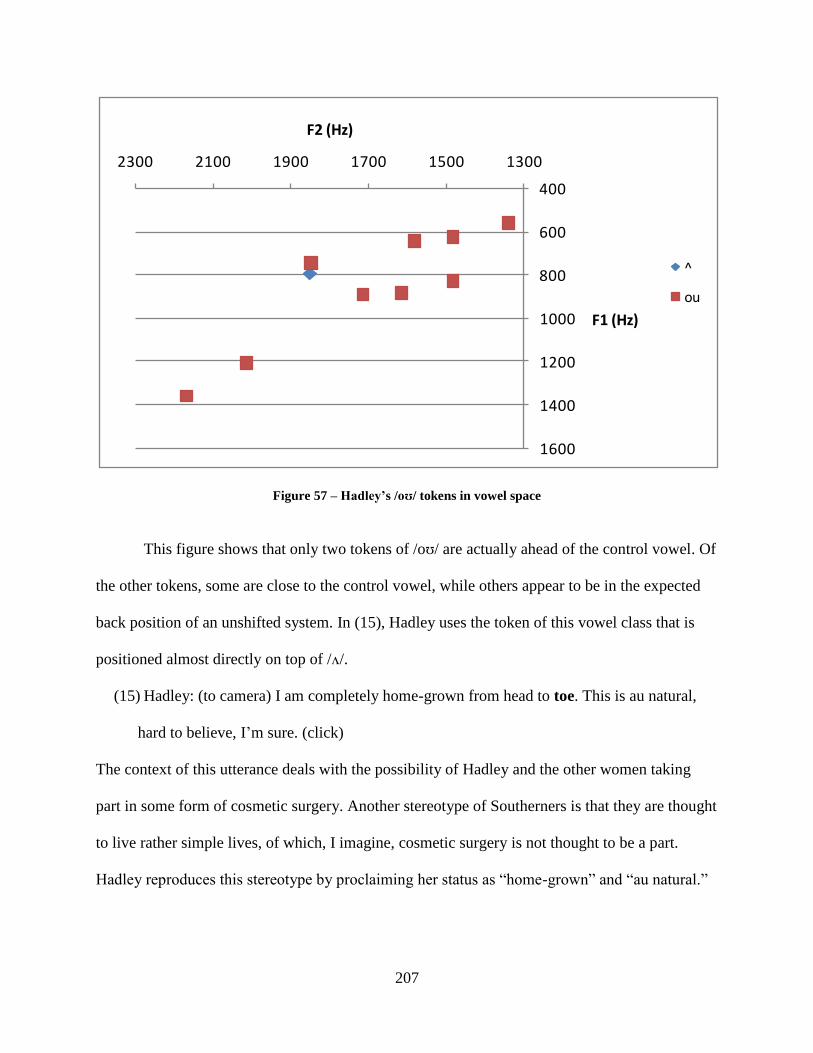
207
Figure 57 – Hadley’s /oʊ/ tokens in vowel space
This figure shows that only two tokens of /oʊ/ are actually ahead of the control vowel. Of
the other tokens, some are close to the control vowel, while others appear to be in the expected
back position of an unshifted system. In (15), Hadley uses the token of this vowel class that is
positioned almost directly on top of /ʌ/.
(15) Hadley: (to camera) I am completely home-grown from head to toe. This is au natural,
hard to believe, I‟m sure. (click)
The context of this utterance deals with the possibility of Hadley and the other women taking
part in some form of cosmetic surgery. Another stereotype of Southerners is that they are thought
to live rather simple lives, of which, I imagine, cosmetic surgery is not thought to be a part.
Hadley reproduces this stereotype by proclaiming her status as “home-grown” and “au natural.”
400
600
800
1000
1200
1400
1600
130015001700190021002300
F1 (Hz)
F2 (Hz)
^
ou
208
The use of the fronted vowel /oʊ/ in this utterance adds to the positioning of Hadley as
embracing Southernness and its stereotypes.
While Kellie‟s vowel system seemed to be the most advanced in terms of the Southern
Shift, one of the most backed tokens of /oʊ/ is found in a context where perhaps Kellie wished to
deemphasize her Southernness. The utterance in question can be found in (16).
(16) Kellie: (to camera) If I move to Chicago, maybe Jeff‟s viewpoint changes on having a
child. Maybe it could be a deciding factor.
Here, Kellie is considering the option of moving to Chicago to live with her boyfriend. This
rather non-Southern token, in connection with the context of moving further north, suggests that
Kellie feels a need to disalign with her typical Southernness in order to make the move.
This section has shown that, while it appears that the back vowels of these women are
usually fronted as in the Southern Shift, it is possible to examine the contexts closer to find cases
where the content of the utterance and the use of the Southern vowels serve as two ways of
indexing Southernness in their identities. Additionally, as the example from Kellie shows, the
speakers can turn off these features in order to deemphasize the Southernness in their identities.
4 Discussion
The findings of this study show that the use or non-use of the Southern variants of the
vowels involved in the Southern Shift is not straightforward. In some cases, it appears that these
women use the Southern vowels in all contexts, mundane or otherwise, regardless of any
particular identity function. In other cases, where emotion and seriousness would seem to trigger
the use of the vernacular variety, these women use the standard, unshifted forms.
The most appropriate explanation for the variation in the results of both the numerical
analysis and the contextual analysis is, I argue, that Louisville‟s position on the border between
209
two distinct dialects, one that uses these Southern vowels and one that does not, makes it such
that these women have access to both sets of features, and the fluidity with which they approach
their regional identity is represented in the seemingly random selection of vowel variant.
An important feature that hints to this argument is the fact that the group under
investigation here is rather homogenous. As noted previously, these are all young females who
live upwardly-mobile lives in the high society circles of Louisville. With the exception of one
African-American, most of these women are also white and seem to come from somewhat
similar backgrounds. One might expect, in a group of such similar types, to find rather similar
and consistent results. However, these results show that these linguistic identities are not so
secure, as indicated by their varying performances of regionality. Within the context of the
border, however, this is not unexpected; the rather dynamic way in which these women produce
the signs of regional identity discussed here is anticipated by the fact that they are located in a
place between places.
Overall, this chapter examines how regional identity is realized linguistically through the
use or non-use of Southern vowel variants associated with the Southern Shift. It indicates that the
use is perhaps quite in line with Labov, Ash, and Boberg‟s (2006) description of Louisville,
where only 50% of respondents used the monophthongal variant, which defines their Southern
region. In the next chapter, I examine how the regional identity attributed to Louisvillians is
perceived by people in Louisville.
210
CHAPTER 7: PERCEIVING LOUISVILLE
1 Overview
In this chapter, I present an analysis of two perceptual experiments geared toward
understanding how people in Louisville interpret and perceive the regional identity of other
Louisvillians. This chapter, together with the previous one on the production of regional identity,
provides a more complete picture of the regional identity attributed to Louisville. That is, since
identities are both produced and perceived, it is important to have an understanding of both
aspects of identity.
The data for these experiments comes from the same source as the production study, the
SOAPnet reality television show, Southern Belles: Louisville (Livecchi and Bull 2009). Excerpts
of less than 30 seconds each were extracted for each of the five women as the target sounds for
the experiment. Excerpts of similar length were also extracted for five filler sounds, from other
people on the show who were determined to be from somewhere other than Louisville.
The first experiment seeks to show whether Louisvillians can accurately identify a
speaker as being from Louisville, based on sound alone. In a web-based survey, subjects listened
to a short segment of speech from the show for each of the five women and the five fillers, in
random order, and were asked to pinpoint on a map where they believed the speaker to be from.
The second experiment, using the sound segment of the (non-filler) woman from the first
experiment that was most closely positioned as being from or from near Louisville as the
stimulus, focused on showing group reactions to the speaker based on varying understandings of
her point of origin. That is, one focus group was told the speaker was from Louisville, but the
other two focus groups were given false information about where the speaker was from.
Specifically, one of these groups was told that the speaker was from Nashville, a distinctly
211
Southern city, while the other group was told that the speaker was from Indianapolis, a distinctly
Midwestern city.
In this chapter, I show that despite the fact that Louisvillians have strong opinions on
American dialects and the speech of Louisville, they are not very good at identifying from where
a speaker comes. I was able to determine the target speaker they thought was most likely from
Louisville, through the calculation of mean distances, though one of the filler speakers was
actually placed closer to Louisville than any of the targets. In the second perceptual experiment, I
show that, just like the mental maps project, Louisvillians have mixed feelings about the position
of Louisville, though there is a strong tendency toward considering it Midwestern. This tendency
likely derives from the negative attitudes they have about Southernness or from an established
connection they have made between Southernness and some other “real” South, as indicated in
their repeated references to stereotypes of the South. These results show how regional identity
alignments in Louisville are rather fluid, complex, and dynamic.
2 Classifying Dialects
The goal of this first perceptual experiment is to find the speaker that Louisvillians
classify as being representative of the Louisville dialect through the use of a web-based survey.
One long segment of speech, lasting less than 30 seconds, was selected for each of the five
women. Five other excerpts from other speakers were included as fillers. The text of those
excerpts can be found in Table 37. The excerpts that were selected had no references to
Louisville, the show or characters in it, or other references that would aid in the regional
classification of the speaker, or, if these references appeared, they were cut from the sound file,
as long as it still sounded natural to the author. For the five women, these excerpts were
controlled for length (22-30 seconds) and number of /ai/ tokens (15-20).
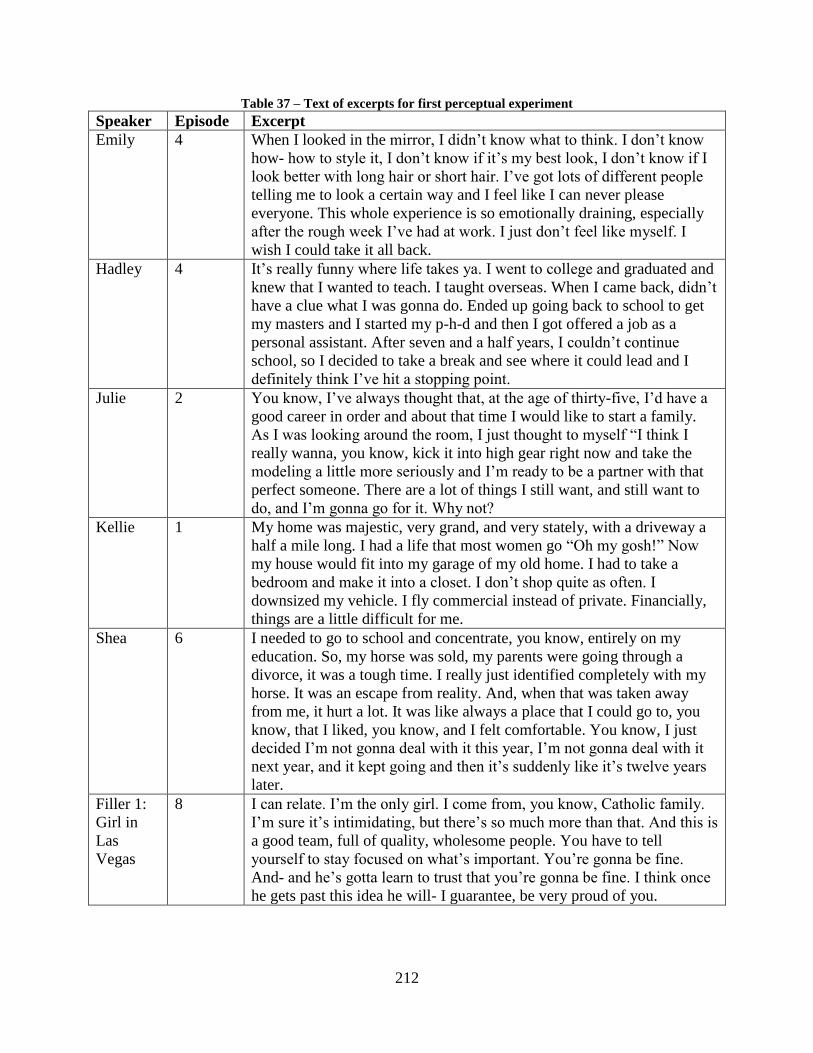
212
Table 37 – Text of excerpts for first perceptual experiment
Speaker Episode Excerpt
Emily 4 When I looked in the mirror, I didn‟t know what to think. I don‟t know
how- how to style it, I don‟t know if it‟s my best look, I don‟t know if I
look better with long hair or short hair. I‟ve got lots of different people
telling me to look a certain way and I feel like I can never please
everyone. This whole experience is so emotionally draining, especially
after the rough week I‟ve had at work. I just don‟t feel like myself. I
wish I could take it all back.
Hadley 4 It‟s really funny where life takes ya. I went to college and graduated and
knew that I wanted to teach. I taught overseas. When I came back, didn‟t
have a clue what I was gonna do. Ended up going back to school to get
my masters and I started my p-h-d and then I got offered a job as a
personal assistant. After seven and a half years, I couldn‟t continue
school, so I decided to take a break and see where it could lead and I
definitely think I‟ve hit a stopping point.
Julie 2 You know, I‟ve always thought that, at the age of thirty-five, I‟d have a
good career in order and about that time I would like to start a family.
As I was looking around the room, I just thought to myself “I think I
really wanna, you know, kick it into high gear right now and take the
modeling a little more seriously and I‟m ready to be a partner with that
perfect someone. There are a lot of things I still want, and still want to
do, and I‟m gonna go for it. Why not?
Kellie 1 My home was majestic, very grand, and very stately, with a driveway a
half a mile long. I had a life that most women go “Oh my gosh!” Now
my house would fit into my garage of my old home. I had to take a
bedroom and make it into a closet. I don‟t shop quite as often. I
downsized my vehicle. I fly commercial instead of private. Financially,
things are a little difficult for me.
Shea 6 I needed to go to school and concentrate, you know, entirely on my
education. So, my horse was sold, my parents were going through a
divorce, it was a tough time. I really just identified completely with my
horse. It was an escape from reality. And, when that was taken away
from me, it hurt a lot. It was like always a place that I could go to, you
know, that I liked, you know, and I felt comfortable. You know, I just
decided I‟m not gonna deal with it this year, I‟m not gonna deal with it
next year, and it kept going and then it‟s suddenly like it‟s twelve years
later.
Filler 1:
Girl in
Las
Vegas
8 I can relate. I‟m the only girl. I come from, you know, Catholic family.
I‟m sure it‟s intimidating, but there‟s so much more than that. And this is
a good team, full of quality, wholesome people. You have to tell
yourself to stay focused on what‟s important. You‟re gonna be fine.
And- and he‟s gotta learn to trust that you‟re gonna be fine. I think once
he gets past this idea he will- I guarantee, be very proud of you.
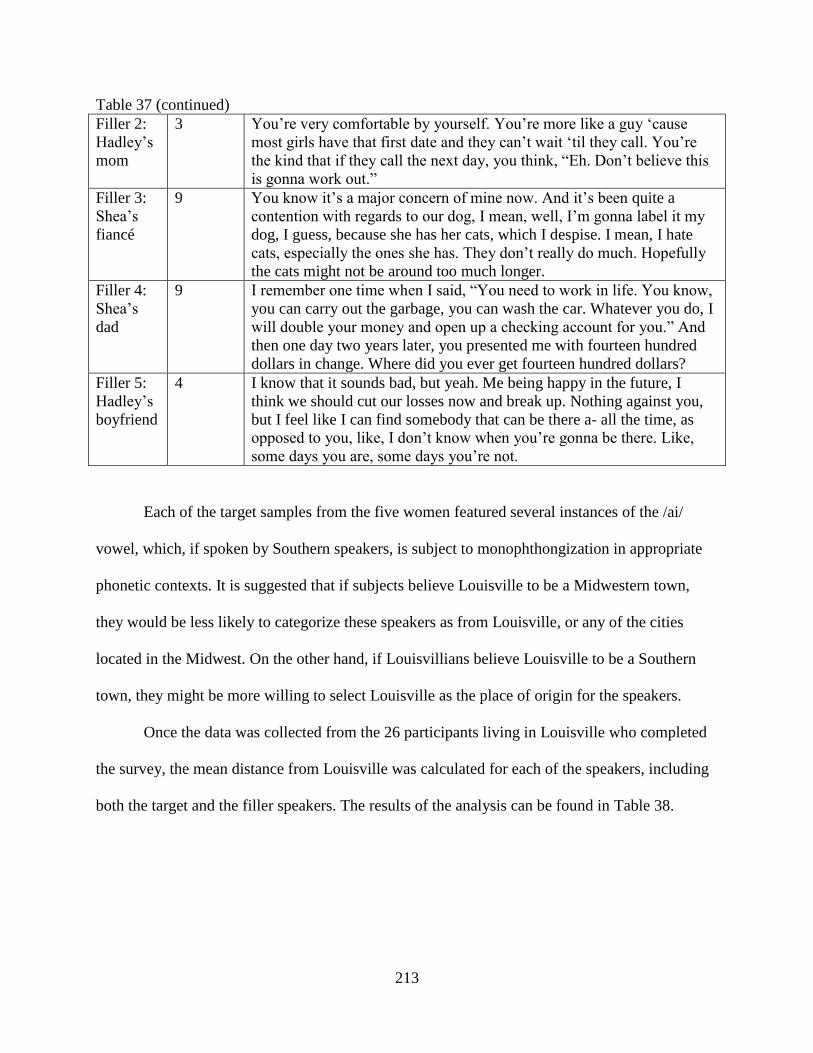
213
Table 37 (continued)
Filler 2:
Hadley‟s
mom
3 You‟re very comfortable by yourself. You‟re more like a guy „cause
most girls have that first date and they can‟t wait „til they call. You‟re
the kind that if they call the next day, you think, “Eh. Don‟t believe this
is gonna work out.”
Filler 3:
Shea‟s
fiancé
9 You know it‟s a major concern of mine now. And it‟s been quite a
contention with regards to our dog, I mean, well, I‟m gonna label it my
dog, I guess, because she has her cats, which I despise. I mean, I hate
cats, especially the ones she has. They don‟t really do much. Hopefully
the cats might not be around too much longer.
Filler 4:
Shea‟s
dad
9 I remember one time when I said, “You need to work in life. You know,
you can carry out the garbage, you can wash the car. Whatever you do, I
will double your money and open up a checking account for you.” And
then one day two years later, you presented me with fourteen hundred
dollars in change. Where did you ever get fourteen hundred dollars?
Filler 5:
Hadley‟s
boyfriend
4 I know that it sounds bad, but yeah. Me being happy in the future, I
think we should cut our losses now and break up. Nothing against you,
but I feel like I can find somebody that can be there a- all the time, as
opposed to you, like, I don‟t know when you‟re gonna be there. Like,
some days you are, some days you‟re not.
Each of the target samples from the five women featured several instances of the /ai/
vowel, which, if spoken by Southern speakers, is subject to monophthongization in appropriate
phonetic contexts. It is suggested that if subjects believe Louisville to be a Midwestern town,
they would be less likely to categorize these speakers as from Louisville, or any of the cities
located in the Midwest. On the other hand, if Louisvillians believe Louisville to be a Southern
town, they might be more willing to select Louisville as the place of origin for the speakers.
Once the data was collected from the 26 participants living in Louisville who completed
the survey, the mean distance from Louisville was calculated for each of the speakers, including
both the target and the filler speakers. The results of the analysis can be found in Table 38.
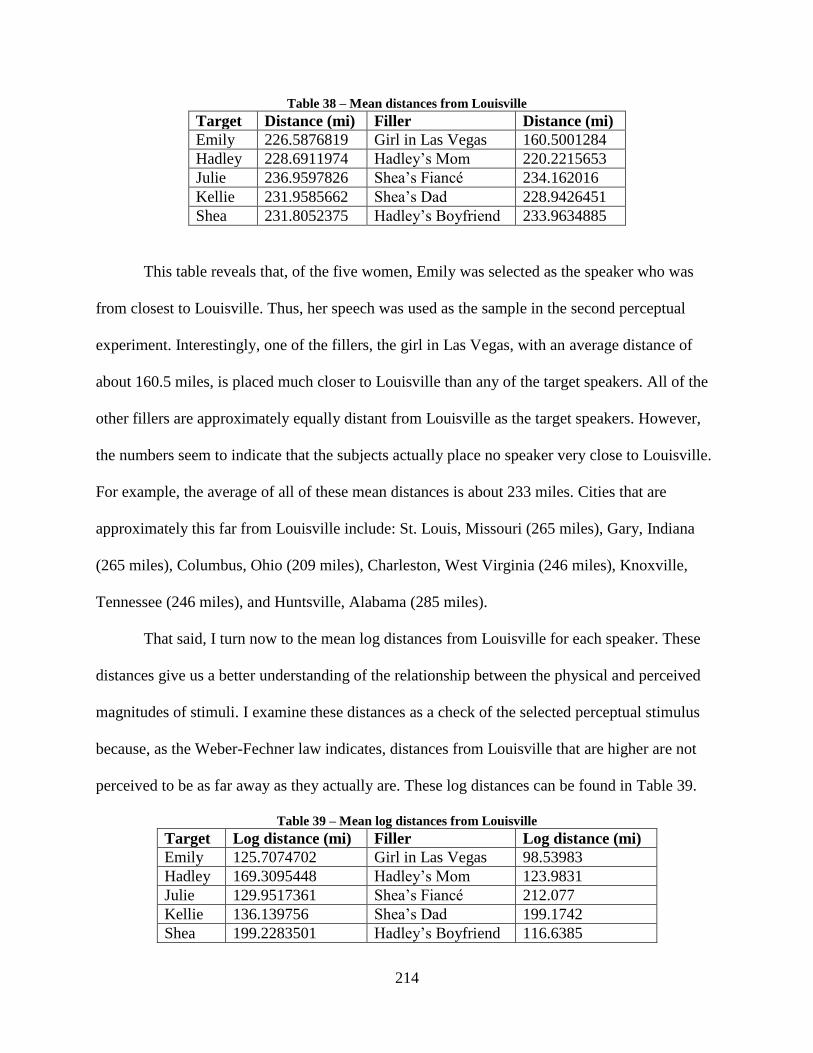
214
Table 38 – Mean distances from Louisville
Target Distance (mi) Filler Distance (mi)
Emily 226.5876819 Girl in Las Vegas 160.5001284
Hadley 228.6911974 Hadley‟s Mom 220.2215653
Julie 236.9597826 Shea‟s Fiancé 234.162016
Kellie 231.9585662 Shea‟s Dad 228.9426451
Shea 231.8052375 Hadley‟s Boyfriend 233.9634885
This table reveals that, of the five women, Emily was selected as the speaker who was
from closest to Louisville. Thus, her speech was used as the sample in the second perceptual
experiment. Interestingly, one of the fillers, the girl in Las Vegas, with an average distance of
about 160.5 miles, is placed much closer to Louisville than any of the target speakers. All of the
other fillers are approximately equally distant from Louisville as the target speakers. However,
the numbers seem to indicate that the subjects actually place no speaker very close to Louisville.
For example, the average of all of these mean distances is about 233 miles. Cities that are
approximately this far from Louisville include: St. Louis, Missouri (265 miles), Gary, Indiana
(265 miles), Columbus, Ohio (209 miles), Charleston, West Virginia (246 miles), Knoxville,
Tennessee (246 miles), and Huntsville, Alabama (285 miles).
That said, I turn now to the mean log distances from Louisville for each speaker. These
distances give us a better understanding of the relationship between the physical and perceived
magnitudes of stimuli. I examine these distances as a check of the selected perceptual stimulus
because, as the Weber-Fechner law indicates, distances from Louisville that are higher are not
perceived to be as far away as they actually are. These log distances can be found in Table 39.
Table 39 – Mean log distances from Louisville
Target Log distance (mi) Filler Log distance (mi)
Emily 125.7074702 Girl in Las Vegas 98.53983
Hadley 169.3095448 Hadley‟s Mom 123.9831
Julie 129.9517361 Shea‟s Fiancé 212.077
Kellie 136.139756 Shea‟s Dad 199.1742
Shea 199.2283501 Hadley‟s Boyfriend 116.6385
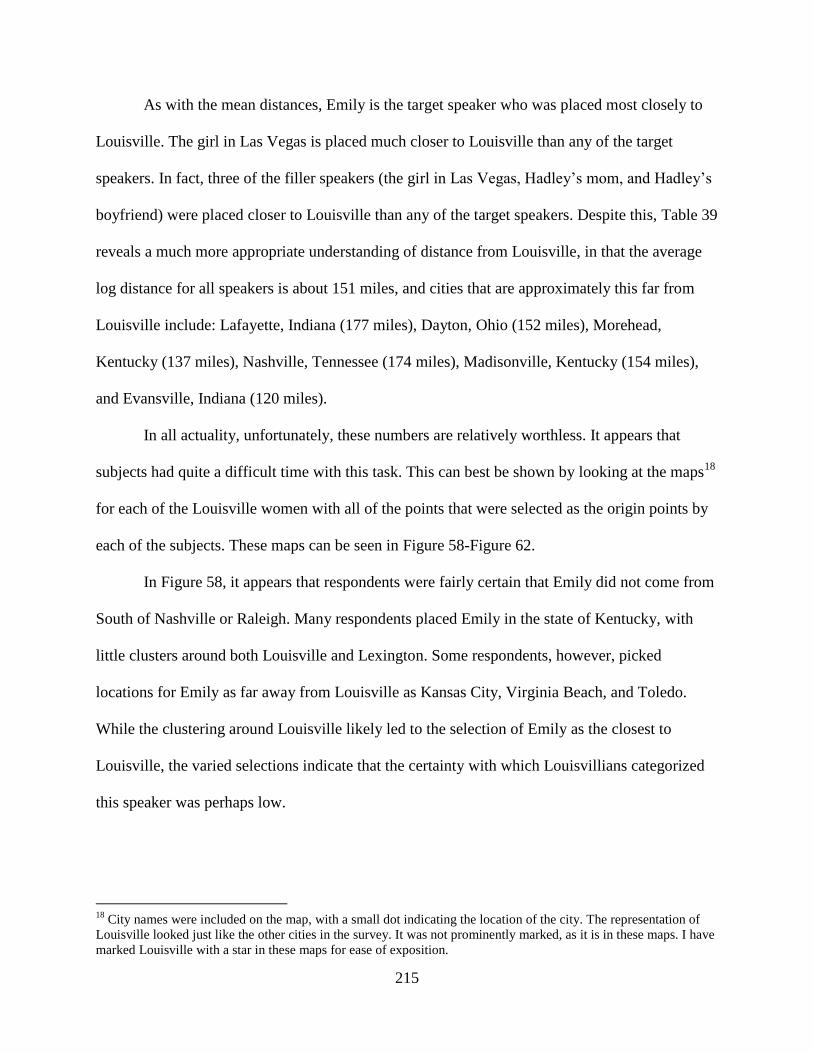
215
As with the mean distances, Emily is the target speaker who was placed most closely to
Louisville. The girl in Las Vegas is placed much closer to Louisville than any of the target
speakers. In fact, three of the filler speakers (the girl in Las Vegas, Hadley‟s mom, and Hadley‟s
boyfriend) were placed closer to Louisville than any of the target speakers. Despite this, Table 39
reveals a much more appropriate understanding of distance from Louisville, in that the average
log distance for all speakers is about 151 miles, and cities that are approximately this far from
Louisville include: Lafayette, Indiana (177 miles), Dayton, Ohio (152 miles), Morehead,
Kentucky (137 miles), Nashville, Tennessee (174 miles), Madisonville, Kentucky (154 miles),
and Evansville, Indiana (120 miles).
In all actuality, unfortunately, these numbers are relatively worthless. It appears that
subjects had quite a difficult time with this task. This can best be shown by looking at the maps18
for each of the Louisville women with all of the points that were selected as the origin points by
each of the subjects. These maps can be seen in Figure 58-Figure 62.
In Figure 58, it appears that respondents were fairly certain that Emily did not come from
South of Nashville or Raleigh. Many respondents placed Emily in the state of Kentucky, with
little clusters around both Louisville and Lexington. Some respondents, however, picked
locations for Emily as far away from Louisville as Kansas City, Virginia Beach, and Toledo.
While the clustering around Louisville likely led to the selection of Emily as the closest to
Louisville, the varied selections indicate that the certainty with which Louisvillians categorized
this speaker was perhaps low.
18
City names were included on the map, with a small dot indicating the location of the city. The representation of
Louisville looked just like the other cities in the survey. It was not prominently marked, as it is in these maps. I have
marked Louisville with a star in these maps for ease of exposition.
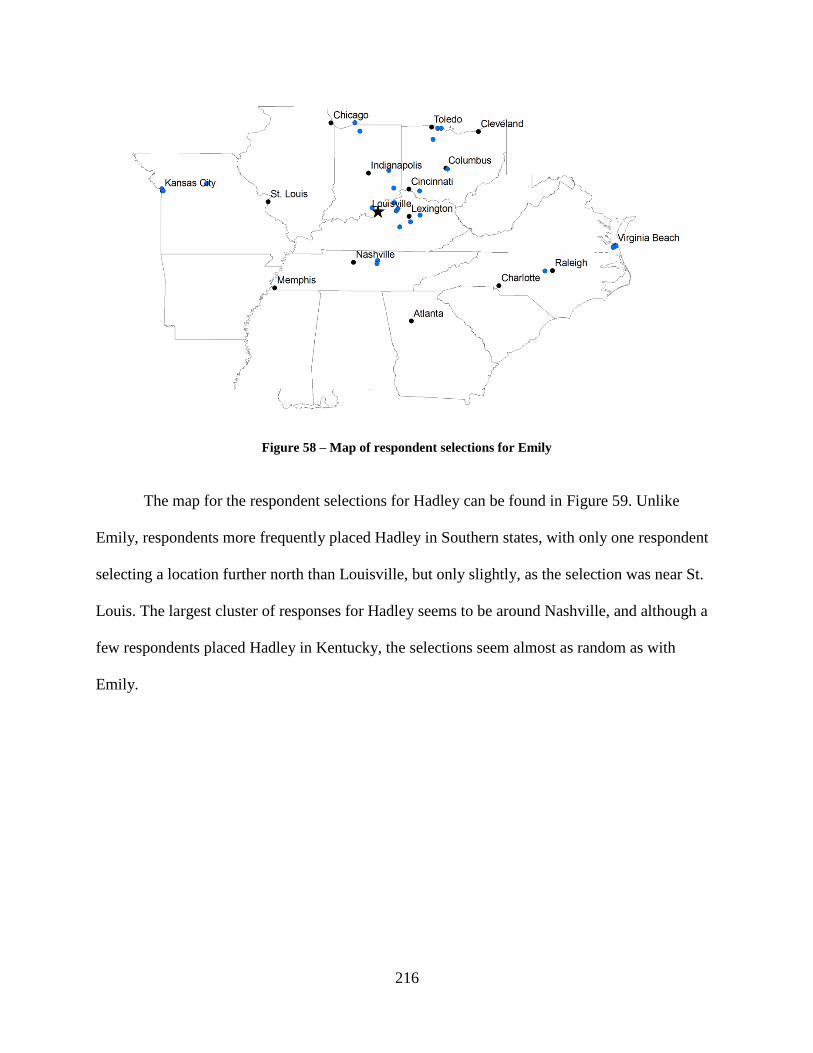
216
Figure 58 – Map of respondent selections for Emily
The map for the respondent selections for Hadley can be found in Figure 59. Unlike
Emily, respondents more frequently placed Hadley in Southern states, with only one respondent
selecting a location further north than Louisville, but only slightly, as the selection was near St.
Louis. The largest cluster of responses for Hadley seems to be around Nashville, and although a
few respondents placed Hadley in Kentucky, the selections seem almost as random as with
Emily.
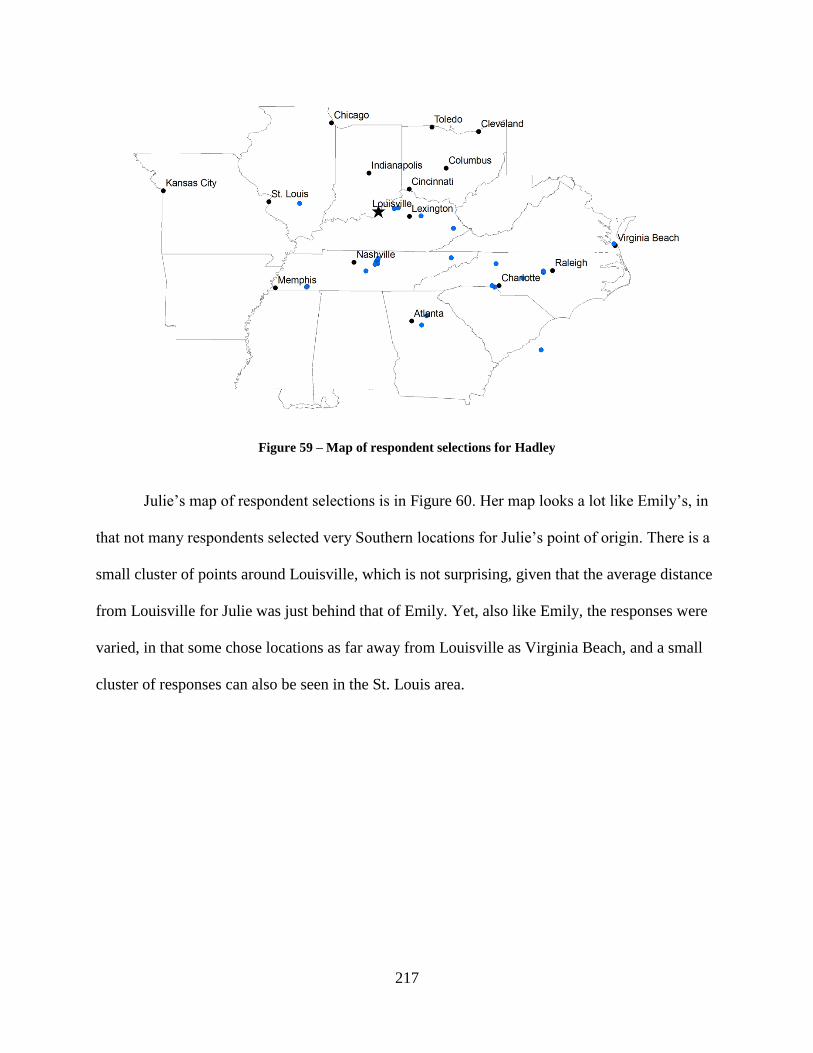
217
Figure 59 – Map of respondent selections for Hadley
Julie‟s map of respondent selections is in Figure 60. Her map looks a lot like Emily‟s, in
that not many respondents selected very Southern locations for Julie‟s point of origin. There is a
small cluster of points around Louisville, which is not surprising, given that the average distance
from Louisville for Julie was just behind that of Emily. Yet, also like Emily, the responses were
varied, in that some chose locations as far away from Louisville as Virginia Beach, and a small
cluster of responses can also be seen in the St. Louis area.
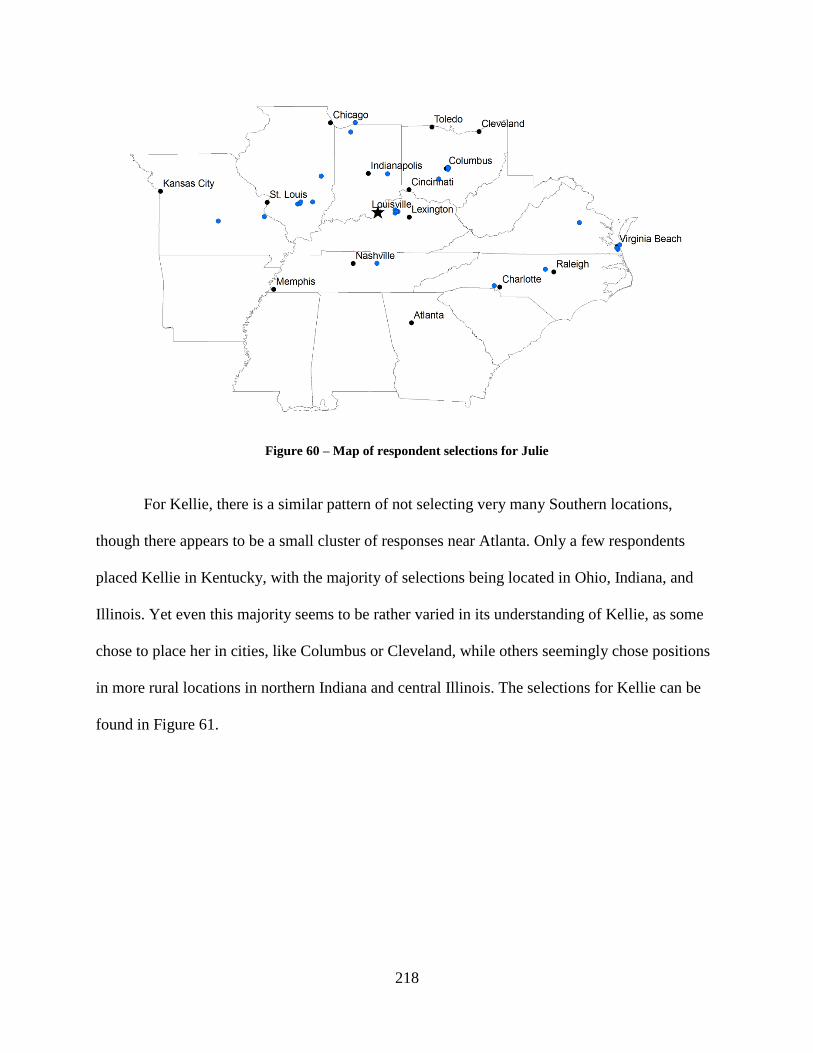
218
Figure 60 – Map of respondent selections for Julie
For Kellie, there is a similar pattern of not selecting very many Southern locations,
though there appears to be a small cluster of responses near Atlanta. Only a few respondents
placed Kellie in Kentucky, with the majority of selections being located in Ohio, Indiana, and
Illinois. Yet even this majority seems to be rather varied in its understanding of Kellie, as some
chose to place her in cities, like Columbus or Cleveland, while others seemingly chose positions
in more rural locations in northern Indiana and central Illinois. The selections for Kellie can be
found in Figure 61.
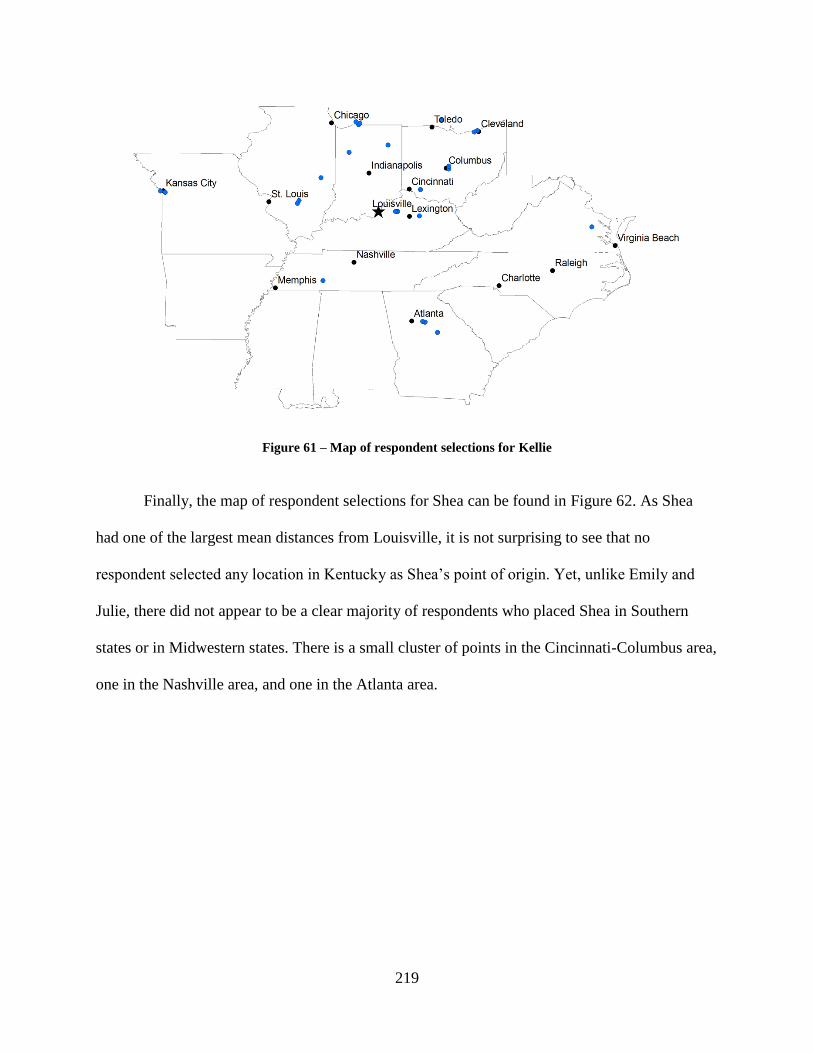
219
Figure 61 – Map of respondent selections for Kellie
Finally, the map of respondent selections for Shea can be found in Figure 62. As Shea
had one of the largest mean distances from Louisville, it is not surprising to see that no
respondent selected any location in Kentucky as Shea‟s point of origin. Yet, unlike Emily and
Julie, there did not appear to be a clear majority of respondents who placed Shea in Southern
states or in Midwestern states. There is a small cluster of points in the Cincinnati-Columbus area,
one in the Nashville area, and one in the Atlanta area.
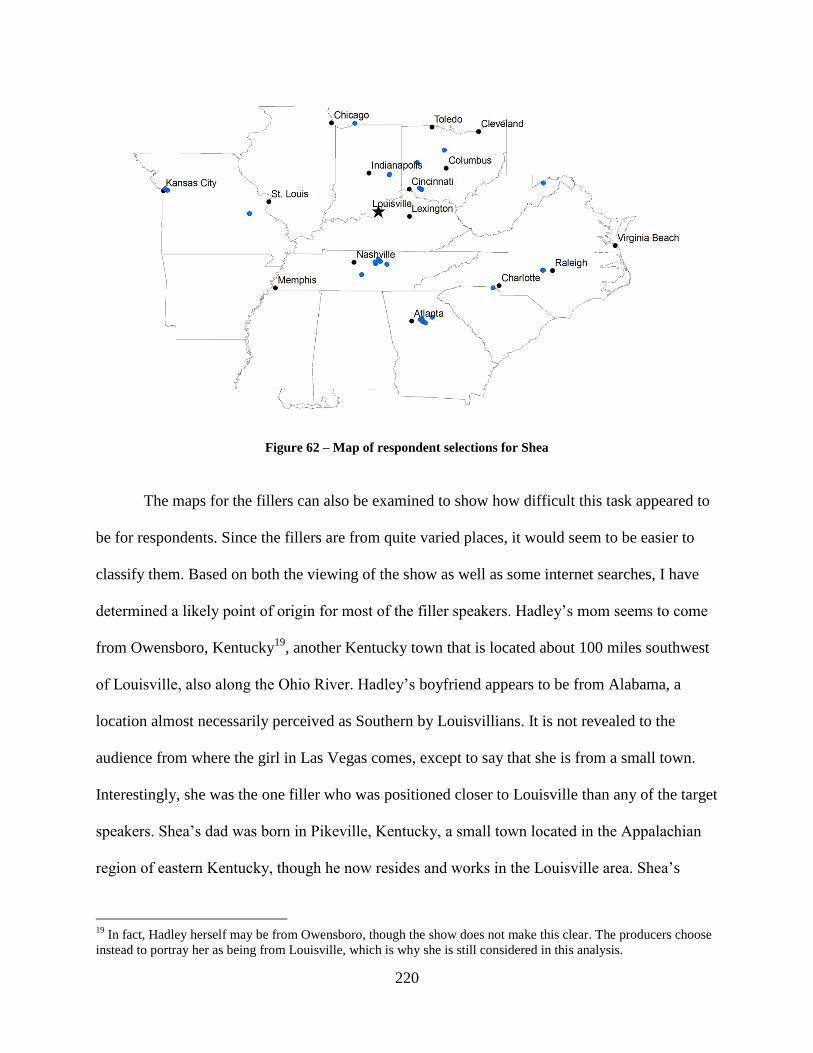
220
Figure 62 – Map of respondent selections for Shea
The maps for the fillers can also be examined to show how difficult this task appeared to
be for respondents. Since the fillers are from quite varied places, it would seem to be easier to
classify them. Based on both the viewing of the show as well as some internet searches, I have
determined a likely point of origin for most of the filler speakers. Hadley‟s mom seems to come
from Owensboro, Kentucky19
, another Kentucky town that is located about 100 miles southwest
of Louisville, also along the Ohio River. Hadley‟s boyfriend appears to be from Alabama, a
location almost necessarily perceived as Southern by Louisvillians. It is not revealed to the
audience from where the girl in Las Vegas comes, except to say that she is from a small town.
Interestingly, she was the one filler who was positioned closer to Louisville than any of the target
speakers. Shea‟s dad was born in Pikeville, Kentucky, a small town located in the Appalachian
region of eastern Kentucky, though he now resides and works in the Louisville area. Shea‟s
19
In fact, Hadley herself may be from Owensboro, though the show does not make this clear. The producers choose
instead to portray her as being from Louisville, which is why she is still considered in this analysis.
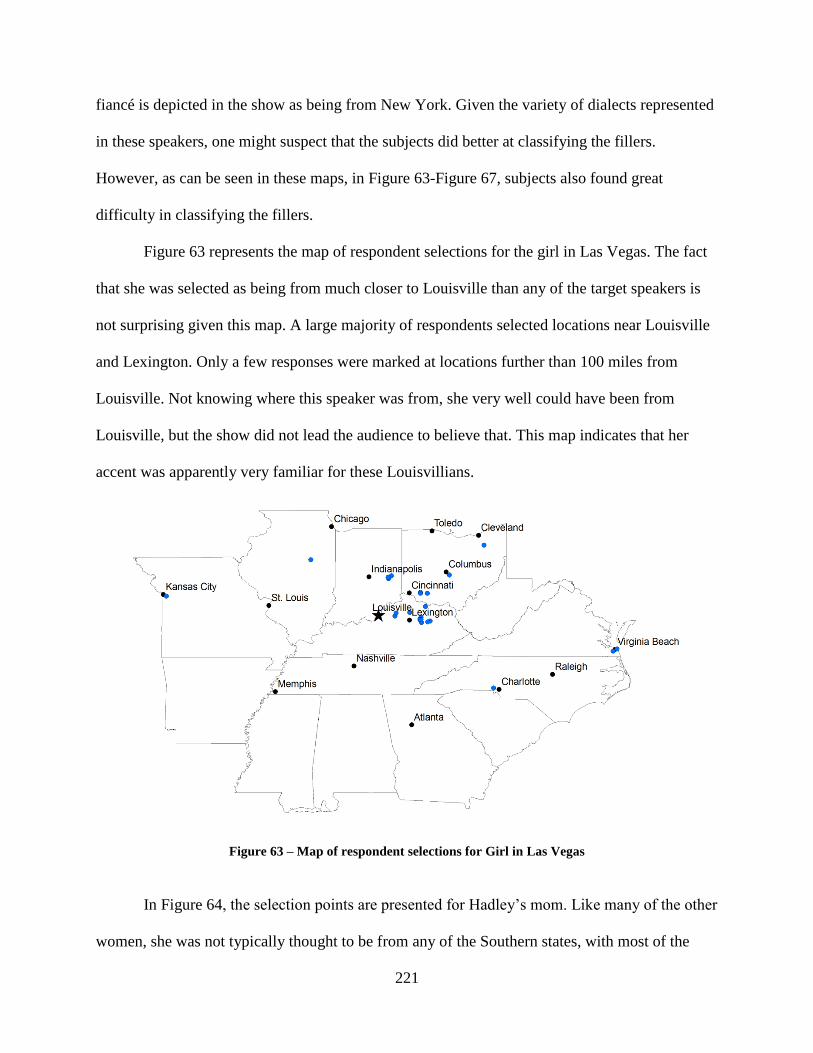
221
fiancé is depicted in the show as being from New York. Given the variety of dialects represented
in these speakers, one might suspect that the subjects did better at classifying the fillers.
However, as can be seen in these maps, in Figure 63-Figure 67, subjects also found great
difficulty in classifying the fillers.
Figure 63 represents the map of respondent selections for the girl in Las Vegas. The fact
that she was selected as being from much closer to Louisville than any of the target speakers is
not surprising given this map. A large majority of respondents selected locations near Louisville
and Lexington. Only a few responses were marked at locations further than 100 miles from
Louisville. Not knowing where this speaker was from, she very well could have been from
Louisville, but the show did not lead the audience to believe that. This map indicates that her
accent was apparently very familiar for these Louisvillians.
Figure 63 – Map of respondent selections for Girl in Las Vegas
In Figure 64, the selection points are presented for Hadley‟s mom. Like many of the other
women, she was not typically thought to be from any of the Southern states, with most of the
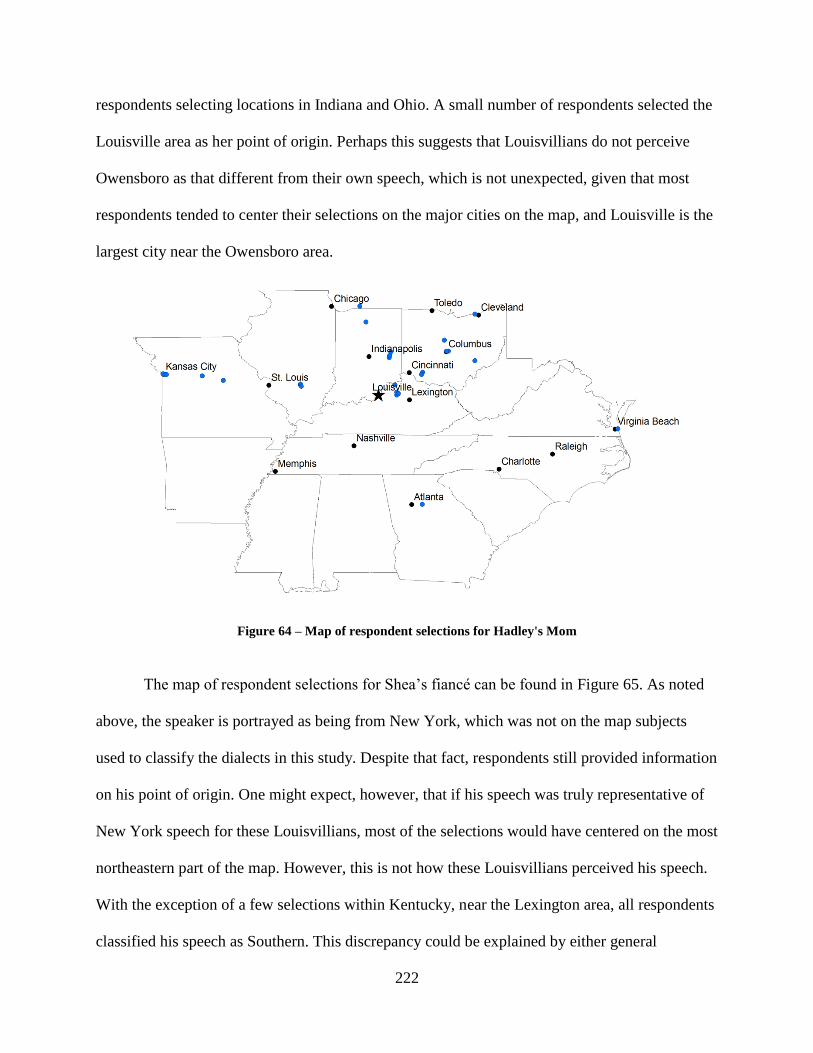
222
respondents selecting locations in Indiana and Ohio. A small number of respondents selected the
Louisville area as her point of origin. Perhaps this suggests that Louisvillians do not perceive
Owensboro as that different from their own speech, which is not unexpected, given that most
respondents tended to center their selections on the major cities on the map, and Louisville is the
largest city near the Owensboro area.
Figure 64 – Map of respondent selections for Hadley's Mom
The map of respondent selections for Shea‟s fiancé can be found in Figure 65. As noted
above, the speaker is portrayed as being from New York, which was not on the map subjects
used to classify the dialects in this study. Despite that fact, respondents still provided information
on his point of origin. One might expect, however, that if his speech was truly representative of
New York speech for these Louisvillians, most of the selections would have centered on the most
northeastern part of the map. However, this is not how these Louisvillians perceived his speech.
With the exception of a few selections within Kentucky, near the Lexington area, all respondents
classified his speech as Southern. This discrepancy could be explained by either general
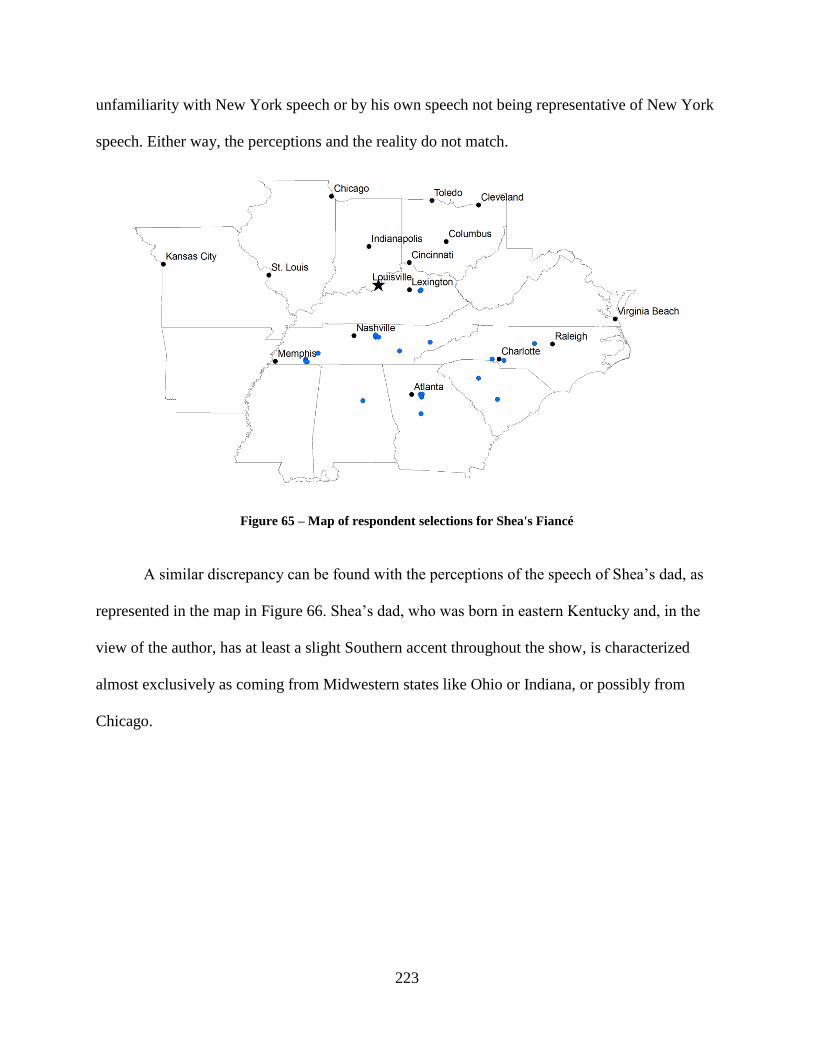
223
unfamiliarity with New York speech or by his own speech not being representative of New York
speech. Either way, the perceptions and the reality do not match.
Figure 65 – Map of respondent selections for Shea's Fiancé
A similar discrepancy can be found with the perceptions of the speech of Shea‟s dad, as
represented in the map in Figure 66. Shea‟s dad, who was born in eastern Kentucky and, in the
view of the author, has at least a slight Southern accent throughout the show, is characterized
almost exclusively as coming from Midwestern states like Ohio or Indiana, or possibly from
Chicago.
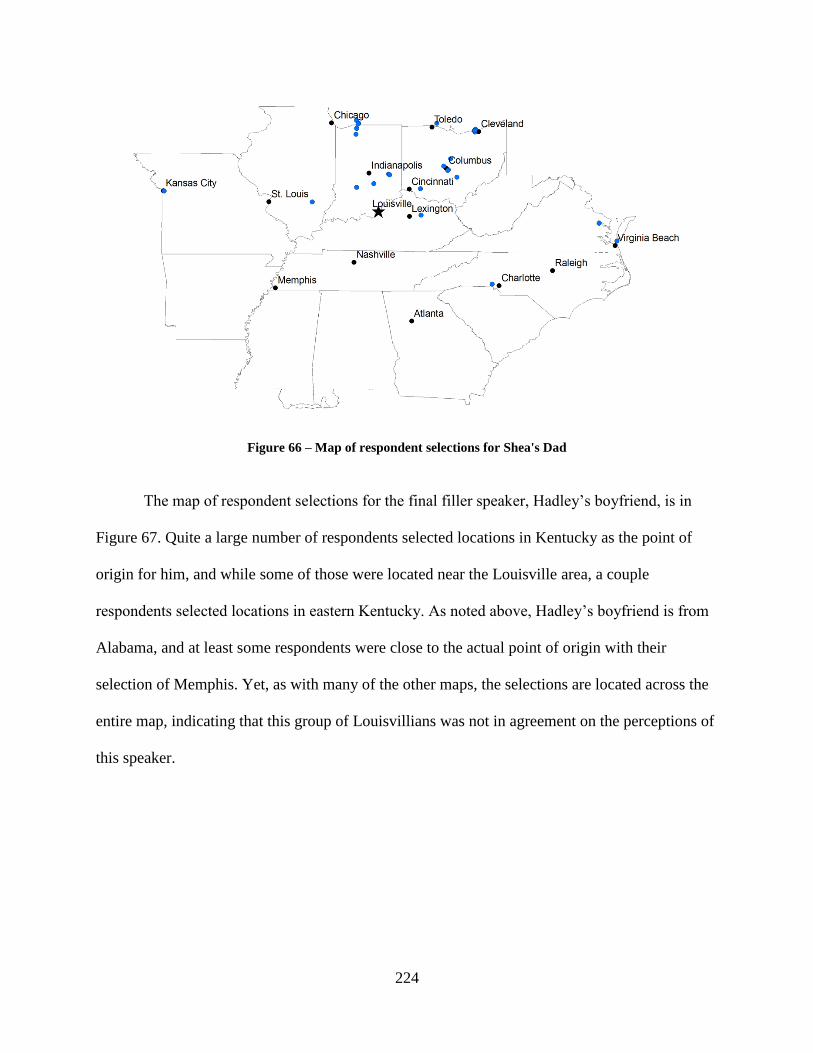
224
Figure 66 – Map of respondent selections for Shea's Dad
The map of respondent selections for the final filler speaker, Hadley‟s boyfriend, is in
Figure 67. Quite a large number of respondents selected locations in Kentucky as the point of
origin for him, and while some of those were located near the Louisville area, a couple
respondents selected locations in eastern Kentucky. As noted above, Hadley‟s boyfriend is from
Alabama, and at least some respondents were close to the actual point of origin with their
selection of Memphis. Yet, as with many of the other maps, the selections are located across the
entire map, indicating that this group of Louisvillians was not in agreement on the perceptions of
this speaker.
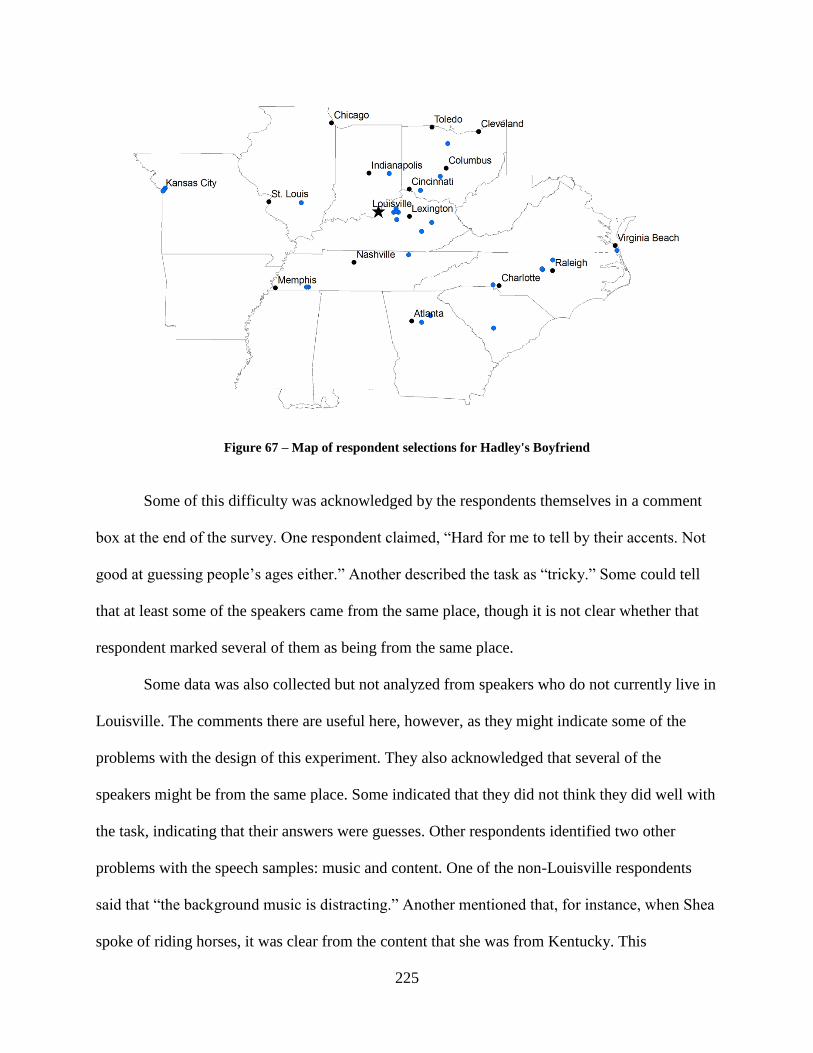
225
Figure 67 – Map of respondent selections for Hadley's Boyfriend
Some of this difficulty was acknowledged by the respondents themselves in a comment
box at the end of the survey. One respondent claimed, “Hard for me to tell by their accents. Not
good at guessing people‟s ages either.” Another described the task as “tricky.” Some could tell
that at least some of the speakers came from the same place, though it is not clear whether that
respondent marked several of them as being from the same place.
Some data was also collected but not analyzed from speakers who do not currently live in
Louisville. The comments there are useful here, however, as they might indicate some of the
problems with the design of this experiment. They also acknowledged that several of the
speakers might be from the same place. Some indicated that they did not think they did well with
the task, indicating that their answers were guesses. Other respondents identified two other
problems with the speech samples: music and content. One of the non-Louisville respondents
said that “the background music is distracting.” Another mentioned that, for instance, when Shea
spoke of riding horses, it was clear from the content that she was from Kentucky. This
226
respondent, obviously drawing on a stereotype, was also able to note that he or she thought some
of the samples came from Southern Belles: Louisville, though he or she also thought some of the
clips came from a different reality show called The Real Housewives of Atlanta.
Despite the apparent difficulty with the task and some of these methodological issues,
this part of the project was designed to select the speaker that subjects placed nearest to
Louisville. This task was accomplished in the selection of Emily. In the second perceptual
experiment, this same sound segment from Emily was used as the stimulus for the focus group
interviews. In the next section, I discuss the results of that part of the perceptual project.
3 Dialect Perception and Varying Social Information
In this second perceptual experiment, the goal is to understand how the social information
given about a person effects how that person is described and discussed in terms of identity
features, including regional identity. Understanding how Louisville is perceived might also
require understanding how speakers from nearby locales, like Indianapolis or Nashville, that tend
to fall stereotypically into non-Southern and Southern dialect regions, respectively, are perceived
as well. In this section, I analyze the data provided by each of the focus groups in response to the
segment from Emily, looking specifically for instances where participants align themselves with
or against the stereotypes they present with reference to these different types (i.e. Louisvillian,
Midwesterner, Southerner, etc.).
3.1 Focus Group 1 – Indianapolis
The Indianapolis focus group consisted of two married couples. One of these couples is
from Louisville, both members living there for their entire lives. The other couple consisted of a
husband who was originally from Michigan and who had claimed to have lived in many places,
and a wife who was originally from Germany, having only lived in the United States for less than
227
15 years. Despite the fact that these speakers were not from Louisville, I consider their opinions
here to additionally show ideas that people from the outside have about Louisville. The husband
from Louisville is represented in the excerpts as Mike, and his wife is represented as Sarah. The
husband who is not from Louisville is represented as John, and his wife is represented as Mary.20
Each interview began by listening to the excerpt from Emily. Participants were told that
they could hear it again, it they wanted to, though only this group chose to listen again. I found
that, in this and other groups, the focus of their comments began with a focus on the content of
what Emily said. The text of the utterance can be found in Table 37, but the main theme of the
excerpt was Emily‟s bad week and bad haircut. The Indianapolis group‟s first responses to the
sound file can be seen in (1).
(1) (Laughter from all participants)
Mary: Poor girl! She‟s so insecure!
John: She‟s got problems. Wow.
All of the participants were narrowing in on the bad week Emily was discussing, though the
responses in (1) seem to indicate that these participants thought Emily‟s bad week was
representative of some larger problem, perhaps with her character as a whole. The other couple
indicated that perhaps there was more to the story, like a more drastic problem than hair, or that
the problem with her hair was linked to some other part of her life, like her job, with Sarah
suggesting that perhaps she is a young model.
When asked to provide adjectives for Emily, the group chose words like “insecure,”
“inexperienced,” “nervous,” and “stressed,” still honing in on the content of the discussion, not
so much about her overall character. To get them thinking more along the lines of personal
attributes, I asked whether they thought she sounded educated. While Mary shook her head “no,”
20
These are, of course, pseudonyms, as are all other names presented in the data, with the exception of the author.
228
her husband John claimed to not really be able to tell from such a short excerpt. Mike and Sarah
were a little more forthcoming on this topic, as can be seen in (2).
(2) Mike: She sounded young and she didn‟t say “like, like, like, like, like.”
Sarah: She didn‟t have bad grammar.
Mike: She seemed like she spoke well, so I would say she had the potential of being…
Though Mike trailed off at the end, it appears this couple perceived Emily to be rather well-
educated. This shows a situation where the two couples diverged on their perceptions of the
speaker. In this interactional situation, the couple produces a linguistic ideology that indexically
links good grammar with educatedness and educatedness with being Midwestern.
When I suggested some other adjectives like “pretty,” the discussion returned to the
content. While Mary suggested that Emily did not even know what pretty was, based on her
debate with herself about how to style her hair, others turned to more possible explanations of
why she was so concerned with beauty. John and Sarah suggested that she might be a bride21
.
Then, John suggested that she might be doing a television show. This same sentiment shows up
later in the interview, when Sarah and Mike suggest it might be a reality television show. As will
become clear, this group saw the interview as a game, where the goal was to accurately decipher
who this woman was. In the end, they were excited that they had accurately guessed that she was
from a reality show, though none of the speakers indicated that they had recognized her voice or
the show.
Next, we talked about certain characteristics like friendliness and honesty. Mary
described her as outgoing, mostly because she tells a lot about herself. In a similar vein, Sarah
called her honest, as she thought Emily was being honest at least with the person to whom she
21
Actually, they thought she might be a “bridezilla,” a word used to describe a future bride who becomes obnoxious
and hard to deal with during the planning of the wedding.
229
was speaking. Despite the fact that they had come to the conclusion that this might be a reality
show, Sarah suggested that it sounded like she was being open like one would with a friend. To
this Mike replied that if it was a reality show, she might be talking to the camera like a friend.
Mike also called her friendly, saying that he thought this because he sees her as a people-pleaser,
and in trying to get people to like her, she comes across as friendly. John agreed with this
sentiment.
Next, I tried to understand more closely their impressions of Indianapolis, specifically as
it relates to their understanding of Louisville. However, I did not want to make it explicit that
this was my goal, so I simply asked what they thought of people from Indianapolis and the way
they speak. Without prompting, Sarah decided to make the comparison herself, and Mary chimes
in as well, as in (3).
(3) Sarah: They‟re not that different from Louisville as far as wh- the people I‟ve known
from there.
Mary: I don‟t think that people from Indianapolis have an accent. Because, me coming
from Germany, you know, I would- I would- she doesn‟t talk like somebody from
Princeton, Kentucky.
In this excerpt, Sarah has suggested that people from Louisville and Indianapolis are no different
in terms of their dialects. To which Mary responds that people in Indianapolis do not have an
accent, echoing the stereotype of the non-accented Midwesterner, further implicating other
Kentuckians, namely those in Princeton, a small town in western Kentucky, as being the
accented people. She described her own experiences with those in Princeton, claiming that she
had to speak with them about health-related issues, and that she could not understand what they
were saying. In her impression of the problems she faced, she highlighted the stereotypical
230
Southern feature of /ai/ monopthongization, as in the word “eye.” This suggests that Mary is
linking Princeton speech with Southern speech, and thereby connecting Southernness with
accentedness and markedness. Combined with Sarah‟s comment, these two women have
constructed Louisville as belonging to the same category as Indianapolis, thus in stark opposition
to the Southernness they perceive even in other parts of the state.
I wanted to understand their notion of “accent” a little better. The excerpt in (4) followed
the previous one and was geared toward making clearer what was meant by “accent.” In excerpts
where my speech is present, I will be represented as Jennifer.
(4) Jennifer: So, she doesn‟t have an accent.
Mike: No, I didn‟t hear an accent.
Sarah: No, like, deep Southern drawl. And she doesn‟t have that Northern, like a Chicago
kinda sound either.
While Mike‟s contribution in the excerpt only verifies that other people recognize the non-
accented Midwesterner stereotype, it is Sarah‟s response that serves to further our understanding
of “accent.” For her, the “accents” that might be of relevance for the Indianapolis situation would
be the Southern drawl, upon which she does not elaborate, or a Northern/Chicago variety, which
she classifies in terms of a nasal sound quality. She claims Emily does not exhibit either of these,
suggesting that Sarah thinks that Indianapolis is devoid of these accents. Since she has already
claimed that Louisville and Indianapolis are quite similar, perhaps this suggests that she thinks
Louisville is devoid of these accents as well. What is interesting is that she presents two possible
accents that are not found in Indianapolis, which is quite similar to the way Louisville has been
depicted in terms of being located between two cultures. This might suggest that Sarah believes
Indianapolis is also located at a similar border as Louisville.
231
A little more probing about this idea of a non-accented Indianapolis helped to understand
how these participants viewed Louisville with respect to other parts of the state or the South.
This exchange can be found in (5). Here, Sarah further connects Indianapolis to Louisville by
claiming the non-accented Midwesterner stereotype for the group.
(5) Sarah: I think they don‟t have an accent to us because they sound a lot like us though.
She further elaborated that people in the Northeast, in Oklahoma, or even down South might hear
this sample and think that Emily has an accent, but because she perceives this similarity between
her own speech and that of Indianapolis Emily, Sarah suggests that Louisvillians do not have an
accent. This suggestion is ratified by Mary, who claims that Mike and Sarah do not sound like
they are from Kentucky. Sarah replies to this remark in (6).
(6) Sarah: Because we‟re from Louisv- I don‟t know.
Sarah has made explicit the claim that Cramer (2010) found with other Louisvillians, which is
that Louisvillians see themselves as different from the rest of the state. Often they will lump
Lexington in with Louisville in this difference, which was also the case with the map drawing
activity in Chapter 5. Mary suggests that it is really a rural/urban distinction, a statement with
which Sarah agrees.
This brings up some of the variation they see even within Louisville. They begin to talk
about certain language items you might find in Louisville. Sarah suggests that Louisvillians say
“you all,” a lengthened version of the stereotypical (and somewhat stigmatized) Southern
expression “y‟all” for the second person plural pronoun. Mike disagrees, claiming that he says
“y‟all.” Even Mary, from Germany, claims to use “y‟all.” At the suggestion that Louisvillians
might use this form, Sarah turns up her nose and says, “I don‟t say „y‟all.‟”
232
This discussion of variation within Louisville brought up the problem the participants
claimed they were struggling with throughout the interview. They claimed that the size of
Indianapolis made it such that one could not make broad generalizations. From what they have
said so far, for instance, about Louisville sounding just like Indianapolis, indicates that these
participants do have the ability to make broad generalizations, but perhaps this shows a level of
awareness in the task, in that they do not want to be seen as making stereotypes if not necessary.
Earlier in the dialogue, Sarah made the claim in (7), which she reiterated after the discussion
about variation in Louisville, as in (8).
(7) Sarah: „Cause it‟s such a big city that there‟s so many different- I mean, just like in
Louisville. There‟s so many different people from different places.
(8) Sarah: See! You can‟t say from one place is just one thing! That‟s my point. That
Indianapolis doesn‟t have just one.
At this point, they are fairly excited about the big reveal, as I told them from the
beginning that I would let them in on more about who Emily is. They feel fairly confident that it
is a reality show. Mike had even noted some splicing in the audio that made him certain it came
from television. They had many “what if” scenarios playing out in the conversation. They
wondered if she was really a girl, or perhaps a cross dresser instead. They wondered if the hair
was so important because she was a cancer survivor who needed a wig, hoping that she was not
as petty as they had thought. Yet, they never questioned whether she was really from
Indianapolis. Many of them agreed that they did not have a lot of information to go on, based on
the short segment, but John realized what they had accomplished with just that short segment.
His realization is in (9).
233
(9) John: You know, it‟s funny how our little brains start working and chewin‟ on it and all
of a sudden we‟ve built on to this thing and now it‟s a big gumball and not a-
Mary: That‟s exactly what she wants to hear though.
I asked the participants if they had any more comments about Emily herself. Sarah
claimed that she was certain Emily did not have any children because people who have children
“have other priorities” than their hair. Mike decided that Emily was white, based on her voice.
Mary agreed, but John and Sarah were not certain. They had a long discussion about what race
means in this country and how we might interpret someone as sounding white if we think they
are well-educated. This focus on race adds another dimension to the complexity of identity
perception. Mike has now connected sounding white with educatedness, which is not novel, but
these speakers present their indexical understanding of educatedness as being connected to a
particular race (white), class (middle-class), and region (Midwest).
Finally, before the reveal, I asked the participants where they would place Indianapolis
regionally in the United States. They all seemed to agree on “Midwest” as the appropriate label,
claiming that it comes from maps, though they felt like the “west” part of the label is
problematic, as it really is not in the west, in the same way as California. They noted the
historical implications of the name (i.e. when settlers were moving west), but they seemed
unsure as to why it is not just called “Mid” or “Central.” Mike‟s uncertainty spilled over to his
concern about Louisville, which can be seen in his short dialogue with his wife in (10).
(10) Mike: Are we Midwest?
Sarah: We‟re all Midwest, but it doesn‟t make sense to me.
234
In this excerpt, Sarah‟s uncertainty is about the label still. Mike seems more concerned with
whether he would group Louisville with Indianapolis in this Midwest label. He agreed earlier
that they sounded the same, but this excerpt shows a little more hesitation.
When the truth was revealed, some of them claimed to know and have seen the show,
though they did not recognize it during the interview. When I asked if they were surprised at all
by the fact that she was from Louisville, they said they were not. This can be seen in (11).
(11) Jennifer: Do you think she sounds like someone from Louisville, then?
Sarah: Yes, because Louisville and Indianapolis sound-
John: We‟re, I would say, very similar.
Jennifer: Ok, is there anything in particular about the way she speaks, now that I told you
she‟s from Louisville, that you go, “Ah! Yeah, that sounds very much like something
from- from Louisville.”
Mary: No.
John: No.
Mike: No, and which means yes, because she sounds just like us.
Sarah: Right.
The last question I asked them had to do with explicitly classifying Louisville in its
proper region. John and Sarah quickly replied that Louisville, like Indianapolis, was located in
the Midwest, and the others agreed, though Mike wanted to call it more “Eastern,” highlighting
again the problems they found with the “west” part of “Midwest.” They seemed very certain that
Emily, Indianapolis, and Louisville could all be considered Midwestern. Despite the slight
controversy about “y‟all” vs. “you all,” there was no indication that they see anything Southern
about Louisville, particularly if compared to the rest of the state.
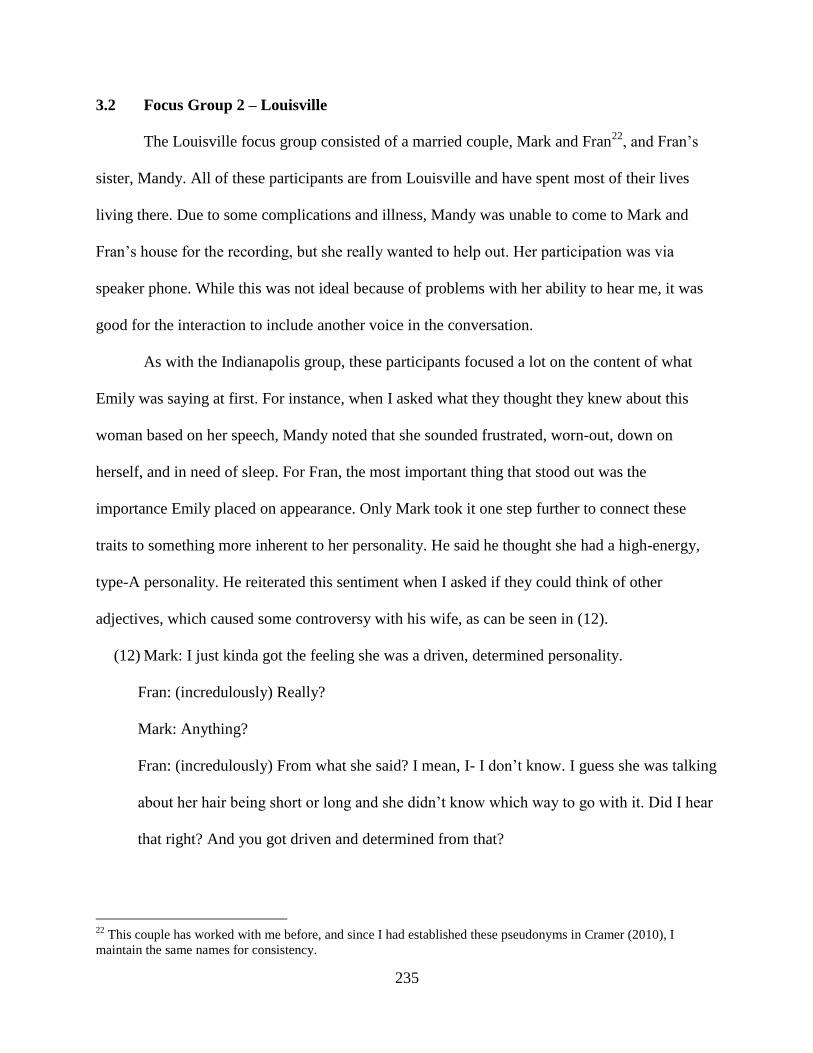
235
3.2 Focus Group 2 – Louisville
The Louisville focus group consisted of a married couple, Mark and Fran22
, and Fran‟s
sister, Mandy. All of these participants are from Louisville and have spent most of their lives
living there. Due to some complications and illness, Mandy was unable to come to Mark and
Fran‟s house for the recording, but she really wanted to help out. Her participation was via
speaker phone. While this was not ideal because of problems with her ability to hear me, it was
good for the interaction to include another voice in the conversation.
As with the Indianapolis group, these participants focused a lot on the content of what
Emily was saying at first. For instance, when I asked what they thought they knew about this
woman based on her speech, Mandy noted that she sounded frustrated, worn-out, down on
herself, and in need of sleep. For Fran, the most important thing that stood out was the
importance Emily placed on appearance. Only Mark took it one step further to connect these
traits to something more inherent to her personality. He said he thought she had a high-energy,
type-A personality. He reiterated this sentiment when I asked if they could think of other
adjectives, which caused some controversy with his wife, as can be seen in (12).
(12) Mark: I just kinda got the feeling she was a driven, determined personality.
Fran: (incredulously) Really?
Mark: Anything?
Fran: (incredulously) From what she said? I mean, I- I don‟t know. I guess she was talking
about her hair being short or long and she didn‟t know which way to go with it. Did I hear
that right? And you got driven and determined from that?
22
This couple has worked with me before, and since I had established these pseudonyms in Cramer (2010), I
maintain the same names for consistency.
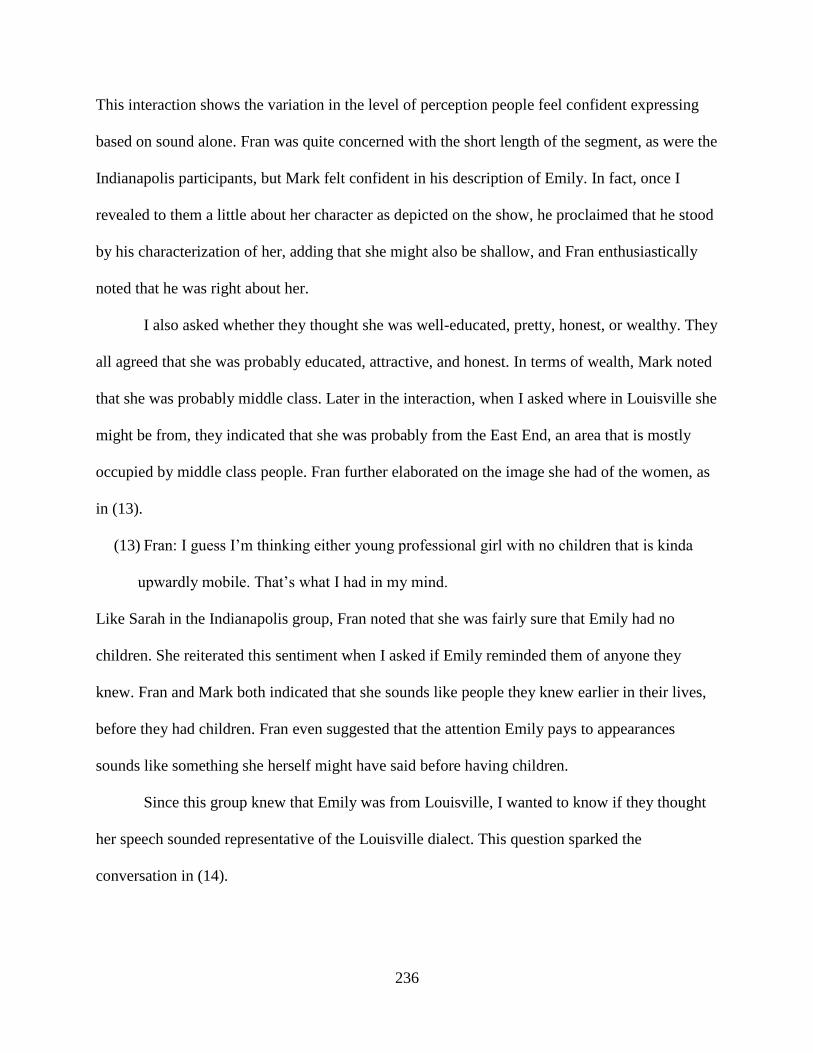
236
This interaction shows the variation in the level of perception people feel confident expressing
based on sound alone. Fran was quite concerned with the short length of the segment, as were the
Indianapolis participants, but Mark felt confident in his description of Emily. In fact, once I
revealed to them a little about her character as depicted on the show, he proclaimed that he stood
by his characterization of her, adding that she might also be shallow, and Fran enthusiastically
noted that he was right about her.
I also asked whether they thought she was well-educated, pretty, honest, or wealthy. They
all agreed that she was probably educated, attractive, and honest. In terms of wealth, Mark noted
that she was probably middle class. Later in the interaction, when I asked where in Louisville she
might be from, they indicated that she was probably from the East End, an area that is mostly
occupied by middle class people. Fran further elaborated on the image she had of the women, as
in (13).
(13) Fran: I guess I‟m thinking either young professional girl with no children that is kinda
upwardly mobile. That‟s what I had in my mind.
Like Sarah in the Indianapolis group, Fran noted that she was fairly sure that Emily had no
children. She reiterated this sentiment when I asked if Emily reminded them of anyone they
knew. Fran and Mark both indicated that she sounds like people they knew earlier in their lives,
before they had children. Fran even suggested that the attention Emily pays to appearances
sounds like something she herself might have said before having children.
Since this group knew that Emily was from Louisville, I wanted to know if they thought
her speech sounded representative of the Louisville dialect. This question sparked the
conversation in (14).
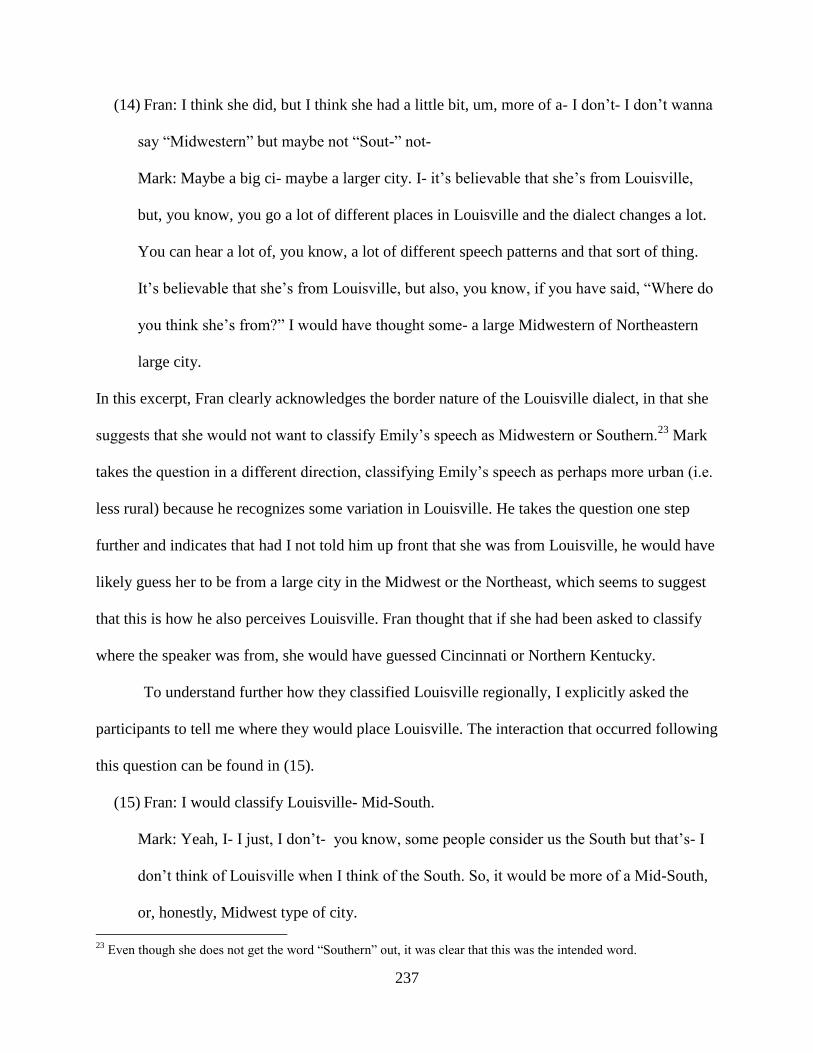
237
(14) Fran: I think she did, but I think she had a little bit, um, more of a- I don‟t- I don‟t wanna
say “Midwestern” but maybe not “Sout-” not-
Mark: Maybe a big ci- maybe a larger city. I- it‟s believable that she‟s from Louisville,
but, you know, you go a lot of different places in Louisville and the dialect changes a lot.
You can hear a lot of, you know, a lot of different speech patterns and that sort of thing.
It‟s believable that she‟s from Louisville, but also, you know, if you have said, “Where do
you think she‟s from?” I would have thought some- a large Midwestern of Northeastern
large city.
In this excerpt, Fran clearly acknowledges the border nature of the Louisville dialect, in that she
suggests that she would not want to classify Emily‟s speech as Midwestern or Southern.23
Mark
takes the question in a different direction, classifying Emily‟s speech as perhaps more urban (i.e.
less rural) because he recognizes some variation in Louisville. He takes the question one step
further and indicates that had I not told him up front that she was from Louisville, he would have
likely guess her to be from a large city in the Midwest or the Northeast, which seems to suggest
that this is how he also perceives Louisville. Fran thought that if she had been asked to classify
where the speaker was from, she would have guessed Cincinnati or Northern Kentucky.
To understand further how they classified Louisville regionally, I explicitly asked the
participants to tell me where they would place Louisville. The interaction that occurred following
this question can be found in (15).
(15) Fran: I would classify Louisville- Mid-South.
Mark: Yeah, I- I just, I don‟t- you know, some people consider us the South but that‟s- I
don‟t think of Louisville when I think of the South. So, it would be more of a Mid-South,
or, honestly, Midwest type of city.
23
Even though she does not get the word “Southern” out, it was clear that this was the intended word.
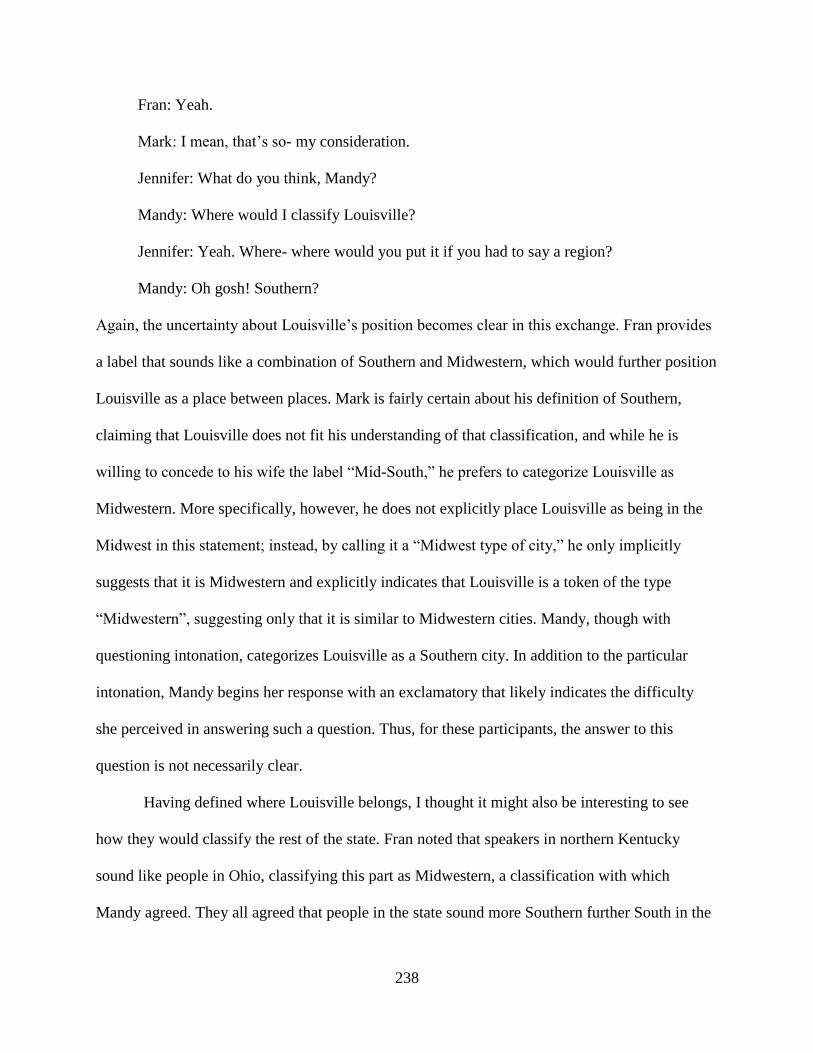
238
Fran: Yeah.
Mark: I mean, that‟s so- my consideration.
Jennifer: What do you think, Mandy?
Mandy: Where would I classify Louisville?
Jennifer: Yeah. Where- where would you put it if you had to say a region?
Mandy: Oh gosh! Southern?
Again, the uncertainty about Louisville‟s position becomes clear in this exchange. Fran provides
a label that sounds like a combination of Southern and Midwestern, which would further position
Louisville as a place between places. Mark is fairly certain about his definition of Southern,
claiming that Louisville does not fit his understanding of that classification, and while he is
willing to concede to his wife the label “Mid-South,” he prefers to categorize Louisville as
Midwestern. More specifically, however, he does not explicitly place Louisville as being in the
Midwest in this statement; instead, by calling it a “Midwest type of city,” he only implicitly
suggests that it is Midwestern and explicitly indicates that Louisville is a token of the type
“Midwestern”, suggesting only that it is similar to Midwestern cities. Mandy, though with
questioning intonation, categorizes Louisville as a Southern city. In addition to the particular
intonation, Mandy begins her response with an exclamatory that likely indicates the difficulty
she perceived in answering such a question. Thus, for these participants, the answer to this
question is not necessarily clear.
Having defined where Louisville belongs, I thought it might also be interesting to see
how they would classify the rest of the state. Fran noted that speakers in northern Kentucky
sound like people in Ohio, classifying this part as Midwestern, a classification with which
Mandy agreed. They all agreed that people in the state sound more Southern further South in the
239
state, which would seem to be geographically logical, if nothing else. Mark noted that he knows
these differences exist because he travels across the state for his job, claiming that Louisville and
Lexington are different from the rest of the state, which indicates the same rural/urban distinction
made within the Indianapolis group.
I also asked the participants what they thought of the dialect in Louisville, questioning
whether they liked the way they spoke. They all agreed that they generally liked the speech, and
they noted that while they perceived differences across the city, they found no real quality
differences in the different dialects. Their responses can be seen in (16).
(16) Mandy: I think it sounds too country.
Jennifer: You think it‟s too country.
Mark: I think it‟s a- I think it‟s a nice middle of the road „cause I don‟t think you- I mean,
of course, I don‟t listen to myself speak recorded a lot, but, you know, I would- I wouldn‟t
classify us as, you know, there‟s a distinctly Northern dialect and a distinctly Southern
dialect, I think, and we‟re somewhere in the middle. I just think- I always thought more
Midwestern kind of dialect.
Fran: I think we‟re more So- South than Midwestern. I mean, I think it- depending on
where you are and if you‟ve moved outside of Louisville and come back, it might change
a little bit…But I still think that, as a whole, when I travel anywhere north, people thing I
have a Southern accent, so I guess „South.‟
This excerpt shows more evidence that these participants really experience some border in
Louisville. Mandy associated Louisville‟s dialect with being “too country,” an attribute she does
not seem to appreciate. Mark describes Louisville‟s speech as being “middle of the road,”
indicating that he perceives a distinct Northern and a distinct Southern dialect, both of which are
240
not what he perceives in Louisville. Fran, who has been seemingly wavering between Midwest
and South in her classification, finally admits that she thinks Louisville must be Southern
because when she herself has gone north, people who hear her dialect note that she is from the
South. Thus, it is only in the gaze of the northerner that Fran recognizes her own Southernness
and it is only through her acceptance of this positioning by others that she can classify Louisville
in this way.
Yet this connection to the South does not appear to be a necessarily positive one, as the
conversation continues. They begin to describe some of the differences across the city, noting
that the more Southern parts of the city sound more Southern, which again point to the seemingly
geographically logical representation they made about the state as a whole. Mark, however,
indicates that the same was true when he lived in Indianapolis, noting that you found “a lot more
„ain‟t‟s” in the Southern parts of town. Fran‟s response, in (17), indicates that she associates this
Southernness, or perceived Southern accent, with some rather negative traits.
(17) Fran: And a little less educated, and I hate to say that, because that‟s so stereotypical but
it does- and sometimes, I mean, I‟ve even seen where, you know, sometimes on television,
you know, either on the news or- showing people from certain areas or even spotlighting
Louisville in like one of those shows- what was it? “Meet your new wife” or “your new
mother- “Mothertrade” or whatever.
Mandy: Wifeswap.
Fran: And there‟s like a couple from Louisville and you‟re like, “Oh!” (disgusted) because
you‟re thinking, “That‟s not how we sound!” You know?
Fran indicates that she recognizes the stereotype, but her utterance of it suggests her alignment
with the sentiment. Being from the part of town they suggest speaks a “more common” dialect
241
(East End), Fran positions her own dialect, and the one she perceives in Emily, as being more
educated-sounding than the more Southern accents she perceives elsewhere.
Finally, after I revealed from where the segment was taken, we spoke briefly about using
the phrase “Southern Belles” for the title of the show. Mark had already admitted that he did not
really associate Louisville with “real” Southernness, but he further expressed this sentiment in
(18).
(18) Mark: I just always tried to figure out, “Ok, it‟s called „Southern Belles.‟ Why don‟t they
go to Atlanta?” Or “Why don‟t they go to Savannah?” Or someplace- Nashville, „cause I
don‟t consider us the South, so-
In all, this statement sums up some of the problems these speakers seemed to have with the
notion of Southernness. For Mark, Southernness seems to indicate something more traditional,
like the classic notions of Southernness represented in books like “Gone with the Wind.” Mandy
is content to call Louisville “Southern,” though she seems to connect Southernness with being
“too country,” a negative connotation that might be more linked to current stereotypes of the
South represented in the comedy routines of people like Larry the Cable Guy. Fran also wants to
connect Louisville with Southernness, and she knows that she has been classified herself as
Southern when she has left Louisville. But she cannot escape the stupid Southerner stereotype.
There was no consensus within this group on Louisville‟s regional position, unlike with the
Indianapolis group.
3.3 Focus Group 3 – Nashville
Finally, the Nashville focus group consisted of a married couple, Jim and Ellen, and their
adult daughter, Sally. All of the participants claimed to be from Louisville, though they all spent
a substantial amount of time away. The married couple has spent nearly 40 years total in the
242
area, and the daughter has been there for about 15 years. This group, unlike the other two, was
much less talkative, not commenting nearly as much on the speech segment. Nonetheless, the
information provided will be valuable in our understanding of the perceptions of Louisville
speech.
In much the same manner as the other two focus groups, the initial conversation focused
more on the content of Emily‟s speech segment than on Emily herself. Ellen described her as
vain because she let her hair upset her whole week. Like Mike in the Indianapolis group, Jim
referred to Emily as a people-pleaser, choosing to explicitly disagree with Ellen. He further noted
that she was caring, or perhaps too caring. Sally called her unsatisfied.
In terms of her education, they all agreed that she had acquired a “normal” level of
education, considering her to be of average intelligence. Similarly, Ellen and Sally described her
as being also of average beauty, though Jim thinks she sounds pretty. Later in the interaction, he
reiterates this comment, noting that he thinks she sounds cute and that he would like to meet her.
They also agreed that she was probably also not of above average wealth. In general, they
seemed to think she was rather average. This sentiment was noted most clearly by Jim, as in (19).
(19) Jim: She just seems normal, just down the middle.
Having discussed Emily some, I moved to discussing what they knew about Nashville. In
(20), it becomes clear that they have some clear understanding of Nashville as particularly
Southern. They later explicitly said that they, and everyone in Louisville, consider Nashville to
be a Southern city.
(20) Jennifer: What do you know about people there? How do they speak? What do you know
about Nashville?
Sally: They like country music.
243
Jim: They speak in a drawl. A southern drawl, a lot of „em.
Ellen: Which she didn‟t seem to have.
Jim: Which she didn‟t seem to have.
Sally notes the perhaps stereotypical idea that people in Nashville (on in the South in general)
like country music. Jim immediately notes what he describes as a drawl in the speech of people
from Nashville. Ellen also chimes in, indicating that she did not hear this drawl in Emily‟s
speech. Jim‟s reiteration of Ellen‟s claim shows his agreement with the sentiment.
Later in the interaction, I asked more specifically what they meant by “a southern drawl,”
trying to understand why they did not consider Emily to be Southern. The interaction dealing
with this topic can be found in (21).
(21) Jennifer: What is she lacking?
Jim: She doesn‟t [have a drawl]
Ellen: [She doesn‟t have an accent.]
Sally: [An accent.]
Jennifer: What- what is- is there anything else you can say about it? What is that accent?
Sally: Like a twang, kind of.
Jim: A drawl.
Jennifer: Ok.
Jim: Besides, she pronounced her words [precisely.]
Ellen: [Precisely.]
The interaction in (21) reveals that they do not really have a detailed or nuanced understanding
of what the drawl is, they just know she does not have it. The continued use of seemingly generic
words like “accent,” “drawl,” and “twang,” with no further elaboration, indicates that these
244
participants can identify the thing to which they are referring, but they cannot provide added
detail. Also, both Jim and Ellen suggest that she spoke “precisely.” The juxtaposition of this
attribute, which indicates some level of properness, with the drawl that Emily lacks, suggests that
Jim and Ellen perceive the Southern dialect to be somehow less precise, or even more broadly, as
less proper. They all agreed that Emily spoke with a proper dialect.
Unintentionally, the group stumbled upon the question of where they would have
classified Emily if I had not told them up front that she was from Nashville. I had asked where
they would place Nashville regionally, which they later all responded that they consider
Nashville in the South. The interaction is in (22).
(22) Jim: I‟d say Ohio. Let‟s say Cleveland or someplace-
Jennifer: Her? Or how they speak in Nashville?
Jim: No, the way she speaks.
Jennifer: The way she speaks. You think she sounds like more from Cleveland.
Jim: Cleveland or upper.
Ellen: I don‟t know. She didn‟t sound Southern.
Sally: Yeah, she sounds like a- maybe- maybe a Midwestern, maybe.
Jim has clearly placed Emily as being from Ohio, or perhaps further north. Ellen is certain that
she does not sound Southern. Sally, on the other hand, does not sound as certain. She perhaps
was not expecting such a question, since she had already been told the speaker was from
Nashville. But they number of times she uses the word “maybe” in her utterance suggests that
she is not certain about classifying Emily as a Midwesterner.
When we continued talking about Nashville and their opinions of it, some further
stereotypes were revealed. Notably, they start to classify Nashville speech as friendly, which
245
suggests they do not view Emily as friendly, since they do not believe she sounds like someone
from there. This interaction can be found in (23).
(23) Jennifer: Do you like the way that they sound?
Sally: Yes.
Jennifer: What do you like about it?
Sally: It reminds me of my accent.
Jennifer: Ok.
Jim: Yes, because [they sound more friendly.]
Ellen: [It sounds more friendly.]
What is most interesting here is Sally‟s connection between her own speech and that of
Nashville. She has seemingly stated that, as a speaker from Louisville, she sees her own variety
as Southern, like that in Nashville, and she is proud of her speech, at least to the point that she
claims to like the way Southern speech sounds.
I then asked explicitly whether they thought Emily was friendly, based on this interaction.
Ellen said that she did not think so, implicating the rude Northerner stereotype in this suggestion.
Jim preferred to point to the fact that he thought the speech sounded rehearsed (perhaps it was),
which might be why it does not sound friendly, or at least why she does not seem to have a
Southern drawl (i.e. because it was recorded, she was guarding her speech).
Finally, I revealed the truth to this group. Ellen‟s reaction to her actually being from
Louisville can be found in (24). Here, we see that she is not surprised that Emily is not from
Nashville because, as they continuously noted, she did not seem to have a Southern accent.
When asked whether they thought it was believable that she was from Louisville, they firmly
agreed that it was feasible. Jim‟s response to this question can be found in (25).
246
(24) Ellen: We didn‟t- I never would‟ve thought Louisville, but I didn‟t think she was from
Nashville.
(25) Jim: Yes, it sounded like it could‟ve been from Louisville to me. Yeah, I mean, you
know, Ohio and Louisville. I- I don‟t consider- I don‟t consider Louisville the South.
This last response prompted the question about Louisville‟s regional position in the
United States. As with some of the other groups, the results were somewhat mixed, and their
classification labels and descriptions indicate that they experience Louisville as being on the
border of at least two distinct cultures. This interaction can be found in (26).
(26) Jennifer: Where do you put Louisville? If you had to put Louisville somewhere-
Ellen: In the middle. Not Southern, not Northern.
Jim: Mid-America. Just Mid-America- Ohio, Indiana, and Kentucky- Northern Kentucky
would be- I‟d call Mid-America.
Ellen: We‟re not Northern, we‟re not Southern, we‟re in the middle.
Sally: In the middle.
Jim: We‟re Northern Kentucky, so-
In this exchange, Ellen states twice that she does not consider Louisville to be Southern or
Northern, rather something “in the middle.” Jim chooses the label “Mid-America,” as opposed to
“Midwestern,” perhaps because he, like the Indianapolis group, has trouble with the “west” part
of that term. Interestingly, Jim refers to Louisville as “Northern Kentucky,” a label which is
usually reserved for the Kentucky counties across the river from Cincinnati (Northern Kentucky
Convention and Visitors Bureau 2010). This connection to Ohio furthers Jim‟s claim that
Louisville is not Southern. Even though he seems more content to classify Louisville as
Midwestern, he also indicates an in-between stance for the city.
247
Drawing on this depiction of Louisville, I asked the participants how they would classify
the rest of the state. They agreed that the closer one moves to Tennessee, the more Southern the
speech sounds. Having perceived some sort of misstep, Ellen retracts her use of Southern, as in
(27).
(27) Ellen: Or country. I shouldn‟t say Southern. Country.
Though it is unclear from this one statement why she decided to retract this use, later discussions
indicated that Ellen made a strong connection between real Southern speech and plantations.
This mentality became most clear when I described the show to the participants, noting that the
name they chose was “Southern Belles.” Ellen did not believe this label fit a description of
Louisville speakers because of the fact that Louisville was not known for having plantations. Jim
further indicated that Louisville did not represent the real South, pointing to Mississippi as being
representative of Southernness.
Finally, I tried to explain that the producers of the show had a different definition of
“Southern Belles” in mind when they created the show, indicating that the show positioned
Louisville as part of the South, but not the South that stereotypes are made of. I told them that
the show depicts Louisvillians as friendly and hospitable, like the positive associations made
about the South, but they are urban and interested in art and other things not normally associated
with the South. To this description, Jim replied as in (28).
(28) Jim: I‟d say that‟s pretty much- that‟s- that‟s just about right. That‟s what Louisville is.
To me.
Thus, the interaction was concluded by Jim ultimately indicating that the depiction of Louisville
as a little of Southern and a little of Northern but not wholly either one was accurate.
248
3.4 Summary
A few themes appear from examining the three groups together. The first is that they are
not in complete agreement about Louisville‟s regional location. The Louisville group had three
completely different regional distinctions, including “Midwestern,” “Mid-South,” and
“Southern.” The Nashville group preferred “Mid-America” or “Country” but not “Southern” to
define speech in Kentucky, though Sally said Southern speech in Nashville reminded her of her
own (Louisvillian) accent. The Indianapolis group debated about the term “Midwestern,” though
they seemed fairly sure Louisville belonged in that category. Yet, they even determined that the
variation within Louisville made it such that one could not classify it as one single type.
Another common trait among the groups was their depiction of some rural/urban divide
in the state. The Indianapolis group and the Louisville group both made some distinctions
between Louisville and Lexington and the rest of the state. The Nashville group did so as well,
though not as explicitly. Instead, they used the label “country” to refer to speech near the
Tennessee border, suggesting a more rural dialect. This division seems like a logical one, as the
state is mostly rural, with Louisville and Lexington standing out as the largest cities. This result
replicates the result in the mental map project, where several subjects chose to separate
Louisville and Lexington from the rest of the state as little urban islands.
A third theme that seemed to be present in all of these discussions involves the definition
of real Southern. Members of the Louisville and Nashville groups hinted to some conception of
Southernness related to antebellum items like plantations. This might be expected in a situation
where the term “Southern Belles” is used. But others had definitions of Southern that went
beyond this. Some connected Southernness to rurality, others saw more geographically Southern
locations (i.e. Mississippi, Georgia) as real representatives of the South.
249
The Indianapolis group seemed to like the way people speak in Indianapolis, mostly
because the participants think the speech is rather similar to that in Louisville. Yet it was that
same “sounds like me” attitude expressed by Sally in the Nashville group that indicated she also
liked the way they spoke there. Perhaps the coincidence is that people who perceive themselves
to be non-Southern were in the Indianapolis group and at least one speaker who perceived herself
to be Southern was in the Nashville group. But it is exactly this possibility of finding two groups
of people who align themselves so differently within this same community that makes this
research so fascinating. By positioning themselves along with the speakers in Indianapolis, this
group hoped to connect themselves with the non-accented Midwesterner stereotype, so as to not
have the negative Southern stereotypes applied to them. This was most clear in their debate about
who uses the stigmatized Southern form “y‟all.”
Also, many of the participants suggested that Emily‟s speech sounded rehearsed or like
that of a journalist. The fact that she is a journalist and that she is performing before a camera
perhaps make it such that her speech sounds much more clear and enunciated than they would
expect from just any person from any of these locales. This might have contributed to the lack of
real negative stereotypes of Emily, beyond those related to the content of the discussion.
Ultimately, all of the groups seemed to espouse at some level the notion that Louisville is
located at some sort of crossroads between Southern and Midwestern or Northern cultures, even
if only to acknowledge that they know others perceive Louisville to be Southern when they
themselves do not. No one was surprised to hear that Emily was from Louisville, despite the
different social information given up front. Because the Nashville group did not perceive any
sort of Southern drawl, as they said, they were certainly not surprised to hear that she was not
from Nashville. Yet, as the results of the phonetic study show, Emily has numerous vowels in
250
her system that look like the vowels of the Southern Shift. Perhaps the Southernness of her
speech is not at a level of consciousness for these speakers like the other stereotypical Southern
speech patterns (i.e. the Southern drawl) are.
4 Discussion
The findings of this study show that the perceptions of Louisvillians vary widely in terms
of their classification of their own speech. The first perceptual experiment revealed that
Louisvillians are not very good at placing other Louisville voices in the place of origin. The
second experiment showed that while there was a seeming trend of categorizing Louisville as
Midwestern, there was quite a bit of struggle over this label, with many participants preferring
labels and descriptions that allowed for some combination of Southern and Midwestern or
Northern cultures. All in all, these results suggest that identity affiliations at the border are fluid,
complex, and dynamic – constantly negotiated, contested, and redrawn – giving support to the
claims of the creative chaos of third spaces (e.g. Bhabha 1994, Bhatt 2008).
251
CHAPTER 8: CONCLUSIONS
1 Overview
This chapter serves as the conclusion to the research project. The first section below
summarizes the main results and implications of this dissertation. After discussing these results, I
describe the empirical, theoretical, and methodological contributions of this dissertation. First, I
detail the empirical contributions of this research project, which adds significantly to the
discussion of regional identity in the United States, bringing to light some of the problems
associated with static understandings of regionality. I then focus on the main theoretical
contributions of this dissertation for the fields of sociolinguistics, linguistic anthropology, and
folk linguistics, including a discussion of the ways in which this dissertation shows that identities
in the borderlands are fluid and dynamic and of how these identities are both produced and
perceived by Louisvillians. Finally, I discuss some of the new ways I have approached the data I
have collected methodologically, in order to make these data analysis procedures more
quantitatively sophisticated yet still qualitatively interesting.
I also discuss some of the limitations and problems associated with this research project.
In particular, I address the limitation of the project associated with focusing on place as the main
variable. The problems encountered throughout the research project include problems with data
collection and with data analysis. Finally, I conclude the chapter with a discussion of possible
avenues for future research.
2 Discussion of Results
In this section, I present a summary of the main results of the research project, examining
the main findings in each of the three data chapters. I also discuss some of the implications of
these results.
252
2.1 Summary of Results
In Chapter 5, I showed that, in their hand-drawn maps of the linguistic landscape of the
United States, Louisvillians categorize their city in a few ways: 1) the city is given no regional
designation; 2) the city is considered its own separate variety; and 3) the city is positioned as
being located at a border. Further, the analysis of the language attitudes survey and the labels
employed indicates that Louisvillians distance themselves from an Appalachian dialect and that
they value certain aspects of both Midwestern and Southern dialects, varying on which
categorization to give Louisville depending on which region was known for a particularly
positive attribute. This chapter provided the on-the-ground categories used by Louisvillians to
talk about dialectal variation, indicating the varying ways in which they classify Louisville.
Chapter 6, which involved an analysis of the production of regional identity through the
use of regionally-specific vowels, demonstrated that the use or non-use of the Southern vowel
variants of the Southern Vowel Shift is not straightforward. The results suggest that context need
not be the deciding factor for use of a Southern vowel, in that speakers use the Southern vowels
in numerous contexts, but they also shift to the standard forms for unclear identity functions. It is
argued that Louisville‟s position on the border between two dialects, one that uses the Southern
vowels and one that does not, creates a scenario where speakers have access to both sets of
vowels, and their fluid regional identities are represented in the seemingly random selection of
vowel variants.
The findings of Chapter 7, wherein I analyzed the perceptions Louisvillians have of their
own regional identity, indicate that Louisvillians vary widely in terms of where they classify
Louisville regionally. The results of the first perceptual experiment indicated that Louisvillians
are not very good at placing Louisville voices given such a large region. The results of the
253
second perceptual experiment show that there was no clear consensus on Louisville‟s regional
placement, some specifically indicating that they thought Louisville was located somewhere in
the middle of at least two easily definable regions.
Thus, Louisvillians appear to exhibit both Southern and non-Southern identities in their
production and perception of regional identity through varying alignments, revealing the
contested and dynamic nature of identity in the borderlands. The results of this research project
have several implications for linguistic research in terms of identity. In the next section, I discuss
these implications.
2.2 Implications of Results
This research project shows that large-scale dialectological surveys are in need of more
local studies, like this one, to get at internal variation. This means that communities located at
the intersection of isoglosses would prove to be extremely important and interesting in these
types of studies. Borderlands appear to be rather interesting locales for the examination of
identity, specifically as it relates to language use.
This project also indicates the importance of the views and ideologies of nonlinguists in
the discussion of regional and linguistic identity. Language ideologies are crucial for
understanding notions of belonging. The field of folk linguistics provides the right tools to aid in
making the connection between linguistic forms and social structures.
The main finding of this research project is that borders do influence the linguistic
production and perception of regional identity, at least in Louisville. Through the thorough
examination of the data collected for this project, I have shown that people located at linguistic
(and other) borders exhibit the rather fluid nature of identities.
254
Overall, this research provides a broader understanding of the linguistic situation in
Louisville. It gives more insight into the construction and perception of identity through
linguistic means. Additionally, it presents a clearer picture of the importance of borders in
identity construction in linguistic research. These are some of the main contributions of this
dissertation. In the next section, I present a more detailed discussion of the ways in which this
dissertation contributes to the fields of sociolinguistics, linguistic anthropology, and folk
linguistics.
3 The Contributions of This Dissertation
In this section, I present some of the contributions made by the dissertation research,
focusing in particular on empirical, theoretical, and methodological contributions made within
this research project.
3.1 Empirical Contributions
This dissertation makes several empirical contributions. Since this dissertation deals
greatly with location, I would argue that one of the largest empirical contributions of the project
is the examination of Louisville in the linguistic landscape of the United States. Louisville in
particular, and Kentucky as a whole, is greatly underrepresented in linguistic research. With the
exception of my own work (Cramer 2009, 2010), a few articles (like Miller 2008), and Terry
Irons‟ phonetic atlas of Kentucky (Irons 2010), very few researchers have provided detailed
information about the linguistic situation in the state. Even large-scale linguistic projects, like
Labov, Ash, and Boberg‟s (2006) Atlas of North American English, recognize that it is necessary
to look closely at smaller, local areas in order to provide a more nuanced understanding of the
sociolinguistic variation within an area. One of the goals of this research project was to provide
this kind of analysis of Louisville, to place it on the map, as it were, of linguistic research.
255
One of the most exciting things about Louisville is its position in the geography of the
United States. In Chapter 3, I discussed many of the ways in which Louisville might be
considered as located as some kind of border between the Southern and Midwestern/Northern
regions. As I noted in Chapter 2, regional identity, though seemingly the implicit focus of many
linguistic studies of variation, has not been as thoroughly considered in the literature as other
types of identities (i.e. ethnic, gender, racial, etc. identities). This research project considers
regionality as an important motivation for linguistic choice. It also uses folk linguistic
methodologies to attend to these issues. Louisville has not been fully considered in folk linguistic
research, thus this project serves as a new location for the application of these methodologies,
which are particularly well-suited to border situations.
Finally, I argue that another empirical contribution of this project is its attention to the
borders of regions in the United States. The relative lack of such studies at these borders is rather
surprising, given the salience of such borders for many Americans. By examining these borders,
drawing on insights from some linguistic anthropological studies, and showing the ways in
which the participants in this project seem to alternate between both Southern and non-Southern
identities, the project also sheds some light on some of the problems associated with a static
understanding of regionality.
3.2 Theoretical Contributions
In terms of theoretical contributions, this research project furthers our understanding of
regionality and linguistic identities at regional, dialect, and other types of borders. The analysis
involves a combination of insights from sociolinguistics, linguistic anthropology, and folk
linguistics in order to provide a better overall framework for examining the situation in
Louisville. Additionally, the inclusion of work from anthropology, particularly the research that
256
deals with the dynamicity of culture at the border, enhances the approach to the data. In fact, the
theoretical framework used here would be rather appropriate in the consideration of other border
situations, thus providing the theoretical understanding necessary for the complexity and fluidity
of identities at the border.
Additionally, this dissertation demonstrates the importance of the opinions of
nonlinguists in linguistic research. Despite the fact that many linguists have not considered the
views of nonlinguists to be “real” linguistic data, this project shows that the analysis of phonetic
data is complemented well by the analysis of mental map and perceptual data. For instance, the
analysis of the production data revealed mixed results in terms of whether the vowels produced
were Southern or non-Southern. These results were mirrored in the analysis of the mental maps
and the perceptual data, which shows that the perceptions align well with the production. Yet, the
perceptual data revealed further that the stereotypes associated with Southern speech often
conditioned the participants‟ responses more toward considering themselves Midwestern.
Without the views of the nonlinguists, this research project would only describe half of the
picture.
3.3 Methodological Contributions
The largest contributions made within this dissertation are in terms of the methodological
approaches to the data I have collected. In this section, I address the methodological
contributions made within each of the individual research projects. Overall, I would argue that
the methodology employed in this dissertation provides a systematic way of addressing both the
production and perception of regional identity, specifically by bringing together methods from
several fields and by combining a quantitative and a qualitative approach to data analysis.
257
3.3.1 Folk Linguistics
While Preston has noted that digitization of hand-drawn maps is possible by tracing these
maps onto digitizing pads (e.g. Preston and Howe 1987), my approach to digitization involved
scanning the images and using ArcGIS to automatically recognize the lines as they were drawn.
This involved using georeferencing points, to assure that the individual maps lined up with the
master map in ArcGIS. Instead of tracing the lines, I clicked on an individual line and chose the
direction for the program to search for more of that line. The program would trace the line in the
direction I had selected, and I was able to store all of the individually drawn regions digitally.
This also aided in the creation of composite maps, as I could combine all of the regions
categorized together and determine the area of greatest agreement.
Additionally, I had participants complete their individual questionnaires based on only
the regions they had defined. This allowed me greater insight as to why a particular label was
selected, so that I could more easily combine the regions across participants. Of course, since the
participants were not given pre-existing categories, the statistical methods used to analyze the
ideologies were necessarily post hoc analyses. However, I used a Tukey HSD post hoc analysis
to analyze and compare ideologies. Having the ability to use a post hoc analysis like this one
allows for the bottom-up approach to language varieties preferred in folk linguistic research.
3.3.2 Production of Identity
Instead of collecting typical sociolinguistic data like word lists, reading passages, etc., I
chose to use reality television as the source of my data in the production of identity. In particular,
Southern Belles: Louisville was framed as an appropriate source of data for the specific concern
of this dissertation; namely, the show was pitched as showing the Southern and non-Southern
sides of Louisville, which indicates that the producers see Louisville as being located at a border
258
and see it as a mix of multiple cultures. Reality television is a relatively new phenomenon, where
the characters are expected to be “real,” and much of the dialogue is supposedly unscripted.
Since these types of shows have gained in popularity over the past ten years, there has been an
explosion of linguistic studies using these shows as their data. Thus, my use of reality television
is not new; what appears to be new, however, is the use of reality television data in phonetic
analysis. A brief search of the “Linguistics and Language Behavior Abstracts” reveals no hits for
a search of “reality and television and phonetic.” Despite the fact that there may be relatively few
subjects (as in my study), transcribed (reality) television shows provide a rather large corpus
from which to draw data.
Another methodological contribution this research project makes is in the analysis of /ai/
monophthongization. While the technique was developed in a pilot study (Cramer 2009), this
research project involved the first large-scale test of the approach. My definition of
monophthongs accounts for the slight transitions that may occur in these reduced forms in cases
where an auditory analysis of the segment would indicate the use of the monophthongal variant.
The optimization procedure employs a model that considers the ideal diphthong and creates a
best fit line to what could be (in the case of data not recorded in a laboratory setting) rather
messy data. This procedure allows for a clear, quantitative analysis of variation in vowel
production.
3.3.3 Perception of Identity
In the first perceptual experiment, I utilized Facebook, a social networking site, to recruit
subjects to take part in the web-based survey. This allowed for a large number of people to take
the survey with little extra effort, since reading the recruitment message required internet access,
and the survey took very little time. Using this site as a tool for subject selection seems
259
necessarily biased, as the subjects would seem to be only the “friends” of the author. Yet, the
recruitment message asked respondents to pass the link on to friends and family, not necessarily
on Facebook, and many of the “friends” of the author did so.
Though the results indicated that people were not very good at actually pinpointing
dialects, given such a broad region of the United States from which to choose, the data collected
in this manner made digital representations of the points of origin available for easy analysis of
the selection that was closest to Louisville. Also, in addition to using mean distances to
determine the closest speaker, I calculated log distances as well, which not only supported the
results of the mean distance but also, given the Weber-Fechner law, allowed me to have a better
understanding of the perceived distances for each respondent.
4 Limitations and Problems in the Research
Despite these great contributions, the research project also suffered from some problems
with data collection and analysis and with certain limitations of the project. In this section, I will
detail those problems and limitations, examining each type of data separately.
4.1 Folk Linguistics
In this study, I was unable to recruit a very large number of subjects. The process of
drawing a dialect map is a little time consuming, and participants were a little reluctant. I did not
tell them that they would be required to complete a survey for each of the regions they defined,
so as to not have them purposefully limit the number of regions they drew. However, when one
subject drew 16 different regions, he, because of time constraints, was unable to complete the
task.
Additionally, despite the fact that I tried to indicate that they should draw lines around
areas where they knew a particular way of speaking was located, some participants did not
260
follow directions. Some drew points or shaded regions. These data were not completely
discarded, but I argue that had they understood the task better, their regions would have been
larger, and perhaps more indicative of their real perceptions. In the future, it might be worthwhile
to provide subjects with a sample map of some non-real terrain (i.e. an imaginary world) where a
fake subject has drawn dialect regions with fake names. For example, subjects could see
someone‟s hand-drawn map of the dialects of Mordor, with labels such as “Common Troll
Speech” and “Men of the East”.24
As in many folk linguistic studies, this project also suffered from the geographical
ignorance of the participants. While the ones who delineated a Louisville dialect area were fairly
accurate in their placement of their home city, they struggled with areas further away. For
instance, even though Louisiana was not on the map, participants often delimited an area called
“Cajun” or “Creole,” hinting to the French-influenced speech of that state. They placed this
region in southern Alabama and Mississippi. Perhaps the Cajun/Creole dialect is so prominent
that these participants felt a need to delimit it, even without the appropriate location on the map.
Yet, I would imagine, the New York dialect is just as prominent for people in Kentucky, and no
one circled an area in eastern Pennsylvania and called it “New Yorker.”
Another problem I encountered involved the difficulty in synthesizing the labels and
regions provided by the participants. Preston‟s template helped, of course, though my
participants seemed to have other regions in mind than those listed there. I had to rely on
geography and the individual surveys to provide more information about particular labels. For
instance, the label “country” was used to describe the Appalachia, Georgia, Kentucky, and
Southern regions. Determining the appropriate overarching categories was made difficult by
problems like this one.
24
From J.R.R. Tolkien‟s Lord of the Rings.
261
4.2 Production of Identity
As I mentioned earlier, I believe reality television offers an opportunity for a large corpus
of data for linguistic analysis, phonetic or otherwise. However, if the show is not already
transcribed, as was the case with this show, a large amount of time must be spent up front
creating the corpus. Another problem associated with this particular show was that I wanted to
do a sociolinguistic analysis, which meant I really needed to know something about the
individual speakers. This meant that only the five women who were the stars of the show were
the only real possible “subjects,” which is a rather small sample size.
Not only was the sample small, it was also rather homogenous. All of the speakers were
females, all but one of them was white, and they all seemed to be upper middle or upper class.
Because most of them were white, I did not deal with race, which is something that is rather
salient for Louisvillians, in that the city tends to be rather divided in terms of residential areas.
Also, because of the way these women were portrayed, I had to assume they were all from
Louisville, though it was not always made explicit. Some additional searching for Hadley online,
for example, showed that she may have actually been originally from Owensboro, Kentucky.
Also, despite the fact that I had this rather large corpus from which to draw my data, I
used a rather small set of tokens in the analysis, as the process for finding randomly selected
words, cutting them into smaller, more manageable sound files, and parsing and annotating the
sounds in Praat proved rather tedious. The data is not readily available to some of the automated
scripts of which I am aware, thus the selection and annotation of the vowels was necessarily
manual.
Finally, in an analysis of identity, it might be better in the future to compare the randomly
selected vowels, which are representative of the speaker‟s overall pattern, to some non-randomly
262
selected vowels that are found specifically in Southern contexts. Though it is not exactly clear
what those might be, the analysis might involve the vowels produced in a sentence using the
word “Southern,” for instance. Also, it might make sense to see what the vowels look like when
the speakers discuss Louisville specifically, to see if they use Southern or non-Southern vowels
in discussing their hometown.
4.3 Perception of Identity
As mentioned earlier, the first perceptual experiment revealed that subjects were not very
accurate in their placement of speakers from Louisville (and others) in their correct point of
origin. Other problems were present in this project that might have aided the participants in their
selection. For instance, many participants chose to click on the city names or city markers
instead of just clicking a location on the map. Allowing subjects to only select a city might make
the task easier for them, though it will not allow participants to choose rural locations, if that is
how the speaker is perceived. It might be beneficial if participants can provide feedback for each
individual speaker that they categorized, as opposed to one comment box at the end of the
survey.
Another problem I found with this first experiment was that though I forwarded the link
to the survey widely, very few people in Louisville actually replied. A total of more than 80
responses came in, though most of them listed zip codes outside of the Louisville area. This
problem could be solved by also asking the zip code where the speakers were born and by asking
how long they had lived away from that location. I suspect that many of my non-Louisville
respondents are actually from Louisville and have lived at most ten years away from the city.
The main problem participants in the second perceptual experiment noted was that the
length of the segment was too short. Fair use laws prohibit the use of segments longer than 30
263
seconds in educational or academic settings. This problem, then, seems almost unavoidable.
Some smaller problems associated with the second experiment might be improved upon in future
research. Many participants were not very talkative. Perhaps more probing questions that push
respondents away from content and more toward discussion amongst themselves would provide
better data for the analysis of perceptions. Additionally, some of the participants had not lived
their entire lives in Louisville and one was not even from the United States. I believe that it does
not really affect the data that much if speakers have not lived their whole lives in Louisville, if
the analysis is on perceptions, not on phonetic details of their speech. The fact that one speaker
was from Germany means that one of my contact participants did not follow my directions to
find other speakers from the United States. Since I did not want to reveal the point of the
interview beforehand, I could not enforce this well. Perhaps if some information was made
available to the contact participants, they might be able to recruit appropriate participants.
5 Areas for Further Research
For future research in this same vein, I would hope to collect more hand-drawn maps
from people in Louisville, to get a better sense of the dialect distinctions made by Louisvillians.
A larger number of respondents, with more varied racial, ethnic, educational, and income
backgrounds, would provide a clearer picture of the situation in Louisville. Additionally, I would
like to collect more production data selections, as well as more perceptual focus group
interviews, in order to truly account for the ways in which regional identity is produced and
perceived by Louisvillians.
In addition to Louisville, I would also like to consider other border communities with this
type of research project. It would be particularly interesting to examine other communities along
the Ohio River, since it seems to be the natural dividing line between Southern and non-Southern
264
regions. It might also be helpful to understand the views directly across the river, so that the
ways in which regional identity is produced and perceived on either side of the line can be
compared. For example, though Preston (e.g. 1989) has already examined the community in
southern Indiana, the next step might be to compare their perceptions to those in Louisville.
Further research like this, as well as with other Kentucky border situations, like Cincinnati and
Northern Kentucky, or Evansville, Indiana and Henderson, Kentucky, would show exactly how
real of a border the Ohio River is for people in these communities.
Further research with communities further away from Louisville might also show how
salient the Ohio River is as a border in the linguistic landscape of the United States. People in
Louisville often lament, as some did in the data, that if they go north of Louisville, people are
certain they are from the South, but if they go south of Louisville, people might consider them a
Midwesterner. These travel experiences could be borne out in studies that attempt to elucidate
where people outside of Louisville, or its immediate area, place it in terms of region.
Finally, I would hope to continue doing folk linguistic research in Kentucky, to see if the
rural/urban divide described by so many Louisvillians is real also for people elsewhere in the
state. This type of study might also show whether Louisvillians and other Kentuckians produce
similar regional identity markers in their speech, which might suggest that any distinction being
made goes beyond the actuality of the phonetic output.
6 Discussion
In summary, this dissertation provides several empirical, theoretical, and methodological
contributions to the fields of sociolinguistics, linguistic anthropology, and folk linguistics. It
demonstrates that identities are fluid and complex entities that, especially in the borderlands,
cannot be straightforwardly analyzed. Through the combinations of many different
265
methodologies, both quantitative and qualitative, I have shown that Louisvillians vary greatly in
their understanding, production, and perception of regional identity in their hometown. There
remains more work to be done and certain aspects to be improved upon in this research project in
order to provide a better understanding of how regional identity is produced and perceived in
border regions of the United States.
266
REFERENCES
Allen, Harold B. 1973-1976. Linguistic Atlas of the Upper Midwest. 3 vols. Minneapolis:
University of Minnesota Press.
Alvarez, Louis and Andrew Kolker (Directors). 1988. American Tongues [Documentary]. Center
for New American Media.
Alvarez, Robert R., Jr. 1995. The Mexican-US Border: The Making of an Anthropology of
Borderlands. Annual Review of Anthropology 24: 447-470.
Anderson, Bridget. 2002. Dialect leveling and /ai/ monophthongization among African American
Detroiters. Journal of Sociolinguistics 6 (1): 86-98.
Appadurai, Arjun. 1988. Introduction: Place and Voice in Anthropological Theory. Cultural
Anthropology 3(1): 16-20.
Atwood, E. Bagby. 1953. A Survey of Verb Forms in the Eastern United States. Ann Arbor, MI:
University of Michigan Press.
Bailey, Charles-James N. 1968. Is there a “Midland” dialect of American English? ED 021240.
Bailey, Guy. 1997. When did Southern American English begin? In E. Schneider (ed.),
Englishes around the world. Amsterdam: John Benjamins.
Bailey, Guy and Cynthia Bernstein. 1989. Methodology of a Phonological Survey of Texas.
Journal of English Linguistics 22 (1): 6-16.
Beach, Damian. 1995. Civil War Battles, Skirmishes, and Events in Kentucky. Louisville, KY:
Different Drummer Books.
Bejarano, Cynthia. 2006. ¿Qué onda?: Urban Youth Culture and Border Identity. Tucson, AZ:
The University of Arizona Press.
Bell, Allan. 1984. Language style as audience design. Language in Society 13 (2): 145-204.
267
Bell, Allan. 1999. Styling the other to define the self: A study in New Zealand identity making.
Journal of Sociolinguistics 3 (4): 523-541.
Benson, Erica J. 2003. Folk Linguistic Perceptions and the Mapping of Dialect Boundaries.
American Speech 78 (3): 307-330.
Bhabha, Homi. 1994. The Location of Culture. London: Routledge.
Bhatt, Rakesh M. 2008. In other words: Language mixing, identity representations, and third
space. Journal of Sociolinguistics 12 (2): 177-200.
Bloomfield, Leonard. 1944. Secondary and tertiary responses to language. Language 20: 44-55.
Boersma, Paul and David Weenink. 2008. Praat: doing phonetics by computer (Version 5.0.35).
http://www.fon.hum.uva.nl/praat/.
Bourdieu, Pierre. 1977. Outline of a Theory of Practice. Cambridge: Cambridge University
Press.
Britain, David. 2002. Space and Spatial Diffusion. In J.K. Chambers, P. Trudgill, and N.
Shilling-Estes (eds.), Handbook of Language Variation and Change. Oxford: Oxford
University Press. 603-637.
Bucholtz, Mary. 1999. “Why be normal?”: Language and identity practices in a community of
nerd girls. Language in Society 28: 203-223.
Bucholtz, Mary, Nancy Bermudez, Victor Fung, Lisa Edwards, and Rosalva Vargas. 2007. Hella
Nor Cal or Totally So Cal?: The Perceptual Dialectology of California. Journal of English
Linguistics 35 (4): 325-352.
Bucholtz, Mary, Nancy Bermudez, Victor Fung, Rosalva Vargas, and Lisa Edwards. 2008. The
Normative North and the Stigmatized South: Ideology and Methodology in the
Perceptual Dialectology of California. Journal of English Linguistics 36 (1): 62-87.
268
Bucholtz, Mary and Kira Hall. 2004. Language and Identity. In A. Duranti (ed.), A Companion
to Linguistic Anthropology. Malden, MA: Blackwell. 369-394.
Bucholtz, Mary and Kira Hall. 2005. Identity and Interaction: A Sociocultural Linguistic
Approach. Discourse Studies 7 (4-5): 585-614.
Bucholtz, Mary and Kira Hall. 2008. Finding identity: Theory and data. Multilingua 27: 151-163.
Bucholtz, Mary, A.C. Liang, and Laurel A. Sutton (eds.). 1999. Reinventing Identities: The
Gendered Self in Discourse. Oxford: Oxford University Press.
Bustamante, Jorge A. 1978. Commodity migrants: structural analysis of Mexican immigration to
the United States. In S. Ross (ed.), Views Across the Border. Albuquerque: University of
New Mexico Press. 183-203.
Carver, Craig M. 1987. American Regional Dialects: A Word Geography. Ann Arbor, MI:
University of Michigan Press.
Cashman, Holly R. 2008. Accomplishing marginalization in bilingual interaction: Relational
work as a resource for the intersubjective construction of identity. Multilingua 27: 129-
150.
Cassidy, Frederic G. and Joan Houston Hall. 1985-present. Dictionary of American Regional
English. Cambridge, MA: Belknap Press of Harvard University Press.
Chambers, J.K. and Peter Trudgill. 1980. Dialectology. Cambridge: Cambridge University Press.
Chen, Katherine Hoi Ying. 2008. Positioning and repositioning: Linguistic practices and identity
negotiation of overseas returning bilinguals in Hong Kong. Multilingua 27: 57-75.
Chong, Edwin K.P. and Stanislaw H. Żak. 2001. An Introduction to Optimization, second
edition. Wiley: New York.
269
City-Data.com. 2007. Kentucky…specifically Louisville…south or midwest? City-data.com
forums. http://www.city-data.com/forum/louisville-area/85418-kentucky-specifically-
louisville-south-midwest.html. Accessed 28 September 2009.
Clopper, Cynthia G. and David B. Pisoni. 2004. Homebodies and army brats: Some effects of
early linguistic experience and residential history on dialect categorization. Language
Variation and Change 16: 31-48.
Collins, Charles O. and Corinne Holt Sawyer. 1984. Teaching from Television: M*A*S*H as
Geography. Journal of Geography 83 (6): 265-268.
Coupland, Nikolas, Angie Williams, and Peter Garrett. 1999. “Welshness” and “Englishness” as
Attitudinal Dimensions of English Language Varieties in Wales. In D. Preston (ed.),
Handbook of Perceptual Dialectology, vol. 1. Amsterdam: John Benjamins. 333-343.
Cramer, Jennifer. 2009. Steady-state Patterns of /ai/ in Southern and Midland Dialects: The Case
of Louisville. Paper presented at the annual meeting of the Linguistic Society of America,
San Francisco, CA.
Cramer, Jennifer. 2010. Styles, Stereotypes, and the South: Constructing Difference at the
Linguistic Border. Paper presented at the annual meeting of the American Dialect
Society, Baltimore, MD.
Cramer, Jennifer and Jill Hallett. Forthcoming. From Chi-Town to the Dirty Dirty: Regional
identity markers in U.S. Hip Hop. In M. Terkourafi (ed.), The Language(s) of Global Hip
Hop. London and New York: Continuum.
Cran, William (Director). 2005. Do You Speak American? [Documentary]. PBS.
270
Dailey-O‟Cain, Jennifer. 1999. The Perception of Post-Unification German Regional Speech. In
D. Preston (ed.), Handbook of Perceptual Dialectology, vol. 1. Amsterdam: John
Benjamins. 227-242.
Dakin, Robert F. 1971. South Midland Speech in the Old Northwest. Journal of English
Linguistics 5: 31-48.
Davis, Lawrence M. and Charles L. Houck. 1992. Is there a Midland dialect area? – Again.
American Speech 67 (1): 61-70.
Demirci, Mahide and Brian Kleiner. 1999. The Perception of Turkish Dialects. In D. Preston
(ed.), Handbook of Perceptual Dialectology, vol. 1. Amsterdam: John Benjamins. 263-
281.
Demirci, Mahide. 2002. Gender Differences in the Perception of Turkish Regional Dialects. In
D. Long and D. Preston (eds.), Handbook of Perceptual Dialectology, vol. 2. Amsterdam:
John Benjamins. 41-50.
Diercks, Willy. 2002. Mental Maps: Linguistic-Geographic Concepts. In D. Long and D. Preston
(eds.), Handbook of Perceptual Dialectology, vol. 2. Amsterdam: John Benjamins. 51-70.
Eckert, Penelope and Sally McConnell-Ginet. 1992. Think Practically and Look Locally:
Language and Gender as Community-Based Practice. Annual Review of Anthropology
21: 461-490.
Eckert, Penelope. 2000. Linguistic Variation as Social Practice. Malden, MA: Blackwell.
Eckert, Penelope. 2003. Social Variation in America. In D. Preston (ed.), Needed Research in
American Dialects. Durham, NC: Duke University Press. 99-121.
Eckert, Penelope. 2004. Variation and a Sense of Place. In C. Fought (ed.), Sociolinguistic
Variation: Critical Reflections. Oxford: Oxford University Press. 107-118.
271
Edwards, John. 1999. Refining Our Understanding of Language Attitudes. Journal of Language
and Social Psychology 18 (1): 101-110.
Emporis.com. 2009. Louisville | Emporis.com.
http://www.emporis.com/application/?nav=city&lng=3&id=louisville-ky-usa. Accessed
29 September 2009.
Errington, Joseph. 2001. Ideology. In A. Duranti (ed.), Key Terms in Language and Culture.
Malden, MA: Blackwell. 110-112.
Extra, Guus and Kutlay Yağmur (eds.). 2004. Urban Multilingualism in Europe: Immigrant
Minority Languages at Home and School. Clevedon: Multilingual Matters.
Feagin, Crawford. 1986. More evidence for vowel change in the South. In D. Sankoff (ed.),
Diversity and diachrony. Amsterdam: John Benjamins. 83-95.
Findling, John E. 2009. Louisville. Charleston, SC: Arcadia Publishing.
Fishman, Joshua A. (ed.). 1999. Handbook of Language and Ethnic Identity. Oxford: Oxford
University Press.
Flynn, Donna K. 1997. „We are the border‟: Identity, exchange, and the state along the Bénin-
Nigeria border. American Ethnologist 24 (2): 311-330.
Fought, Carmen. 2002. California Students‟ Perceptions of, You Know, Regions and Dialects?
In D. Long and D. Preston (eds.), Handbook of Perceptual Dialectology, vol. 2.
Amsterdam: John Benjamins. 113-134.
Fort-Cañellas, María Rosa. 2007. Sociolinguistics on the Aragon-Catalonia border. International
Journal of the Sociology of Language 184: 109-119.
Frazer, Timothy. 1994. On Transition Areas and the “Midland” Dialect: A Reply to Davis and
Houck. American Speech 69 (4): 430-435.
272
Fridland, Valerie. 1998. The Southern Vowel Shift: Linguistic and Social Factors. Dissertation:
Michigan State University.
Fridland, Valerie. 2000. The Southern Shift in Memphis, Tennessee. Language Variation and
Change 11: 267-285.
Fridland, Valerie. 2001. The social dimension of the Southern Vowel Shift: Gender, age and
class. Journal of Sociolinguistics 5 (2): 233-253.
Fridland, Valerie, Kathryn Bartlett, and Roger Kreuz. 2004. Do you hear what I hear?
Experimental measurement of the perceptual salience of acoustically manipulated vowel
variants by Southern speakers in Memphis, TN. Language Variation and Change 16: 1-
16.
Fridland, Valerie, Kathryn Bartlett, and Roger Kreuz. 2005. Making Sense of Variation:
Pleasantness and Education Ratings of Southern Vowel Variants. American Speech 80
(4): 366-387.
Fridland, Valerie and Kathryn Bartlett. 2006. Correctness, Pleasantness, and Degree of
Difference Ratings across Regions. American Speech 81 (4): 358-386.
Galasiński, Dariusz and Ulrike H. Meinhof. 2002. Looking across the river: German-Polish
border communities and the construction of the Other. Journal of Language and Politics 1
(1): 23-58.
Giles, Howard and Peter Powesland. 1975. Speech Style and Social Evaluation. New York:
Harcourt Brace. 154-170.
Giles, Howard, Justine Coupland, and Nikolas Coupland (eds.). 1991. Contexts of
Accommodation. Cambridge: Cambridge University Press.
273
Goodey, B. 1971. City scene: an exploration into the image of central Birmingham as seen by
area residents. Research Memorandum 10. Birmingham: Centre for Urban and Regional
Studies.
Gould, Peter and Rodney White. 1986. Mental Maps, 2nd
edition. Boston: Allen & Unwin.
Grootaers, Willem. 1959. Origin and nature of the subjective boundaries of dialects. Orbis 8 (2):
355-384.
Grootaers, Willem. 1964. The Discussion Surrounding the Subjecting Boundaries of Dialects.
Reprinted in D. Preston (ed.), Handbook of Perceptual Dialectology, vol. 1 (1999).
Amsterdam: John Benjamins. 115-129.
Gudykunst, William B. (ed.). 2005. Theorizing About Intercultural Communication. Thousand
Oaks, CA: Sage.
Gupta, Akhil and James Ferguson. 1992. Beyond „Culture‟: Space, Identity, and the Politics of
Difference. Cultural Anthropology 7 (1): 6-23.
Hansen, Niles M. 1981. The Border Economy. Austin, TX: University of Texas Press.
Hartley, Laura C. 1999. A View from the West: Perceptions of U.S. Dialects by Oregon
Residents. In D. Preston (ed.), Handbook of Perceptual Dialectology, vol. 1. Amsterdam:
John Benjamins. 315-332.
Hartley, Laura C. 2005. The Consequences of Conflicting Stereotypes: Bostonian Perceptions of
U.S. Dialects. American Speech 80 (4): 388-405.
Hatcher, Lynley. 2008. Script change in Azerbaijan: acts of identity. International Journal of the
Sociology of Language 192: 105-116.
Hazen, Kirk. 2002. Identity and Language Variation in a Rural Community. Language 78 (2):
240-257.
274
Hewlett, Nigel and Janet Mackenzie Beck. 2006. An Introduction to the Science of Phonetics.
Routledge: London.
Hoenigswald, Henry. 1966. A proposal for the study of folk-linguistics. In W. Bright (ed.),
Sociolinguistics. The Hague: Mouton de Gruyter. 16-26.
Holmes, Janet. 1997. Women, Language and Identity. Journal of Sociolinguistics 1 (2): 195-223.
Hulbert, Archer Butler. 1903. Boone‟s Wilderness Road. Cleveland, OH: The Arthur H. Clark
Company.
Inoue, Fumio. 1995. Classification of Dialects by Image: English and Japanese. Reprinted in D.
Preston (ed.), Handbook of Perceptual Dialectology, vol. 1 (1999). Amsterdam: John
Benjamins. 147-159.
Inoue, Fumio. 1996. Subjective Dialect Division in Great Britain. Reprinted in D. Preston (ed.),
Handbook of Perceptual Dialectology, vol. 1 (1999). Amsterdam: John Benjamins. 161-
176.
Irons, Terry. 2007. On the Southern Shift in Appalachian English. University of Pennsylvania
Working Papers in Linguistics 13 (2): 121-134.
Irons, Terry. 2010. KY Phonetic Atlas. http://www.phonoatlasky.net/. Accessed 24 September
2010.
Irvine, Judith T. 1989. When Talk Isn‟t Cheap: Language and Political Economy. American
Ethnologist 16: 248-267.
Irvine, Judith T. and Susan Gal. 2000. Language Ideology and Linguistic Differentiation. In P.
Kroskrity (ed.), Regimes of Language: Ideologies, Politics, and Identities. Santa Fe, NM:
School of American Research Press.
275
Jansen, Thomas. 1999. European Identity and/or the Identity of the European Union. In T. Jansen
(ed.), Reflections on European Identity. Brussels: European Commission Forward Studies
Unit Working Paper.
Johnson, Ellen. 1994. Yet Again: The Midland Dialect. American Speech 69 (4): 419-430.
Johnstone, Barbara. 2003. Conversation, Text, and Discourse. In D. Preston (ed.), Needed
Research in American Dialects. Durham, NC: Duke University Press. 75-98.
Johnstone, Barbara. 2004. Place, Globalization, and Linguistic Variation. In C. Fought (ed.),
Sociolinguistic Variation: Critical Reflections. Oxford: Oxford University Press. 65-83.
Joseph, John E. 2004. Language and Identity: National, Ethnic, Religious. Basingstoke: Palgrave
Macmillan.
Kentucky State Board of Elections. 2009. Kentucky State Board of Elections website.
http://elect.ky.gov/. Accessed 29 September 2009.
Kleber, John e. (ed.). 2001. The Encyclopedia of Louisville. Lexington, KY: The University
Press of Kentucky.
Kroskrity, Paul V. 2004. Language Ideologies. In A. Duranti (ed.), A Companion to Linguistic
Anthropology. Malden, MA: Blackwell. 496-517.
Kuiper, Lawrence. 1999. Variation and the Norm: Parisian Perceptions of Regional France. In D.
Preston (ed.), Handbook of Perceptual Dialectology, vol. 1. Amsterdam: John Benjamins.
243-262.
Kurath, Hans, Miles L. Hanley, Bernard Bloch, Guy S. Lowman, Jr., and Marcus L. Hansen.
1939-1943. Linguistic Atlas of New England. 3 vols. Providence, RI: Brown University
and American Council of Learned Societies.
276
Kurath, Hans and Raven I. McDavid Jr. 1961. The Pronunciation of English in the Atlantic
States. Ann Arbor, MI: University of Michigan Press.
Kurath, Hans. 1949. Word Geography of the Eastern United States. Ann Arbor, MI: U. of
Michigan Press.
Labov, William. 1963. The Social Motivations of a Sound Change. Word 19: 273-309.
Labov, William. 1991. The three dialects of English. In P. Eckert (ed.), New Ways of Analyzing
Sound Change. New York: Academic Press. 1-44.
Labov, William. 1994. Principles of linguistic change: Internal factors. Cambridge, MA:
Blackwell.
Labov, William, Sharon Ash, and Charles Boberg. 2006. The Atlas of North American English:
Phonetics, Phonology and Sound Change, a Multimedia Reference Tool. Berlin: Mouton
de Gruyter.
Labov, William, Malcah Yeager, and Richard Steiner. 1972. A quantitative study of sound
change in progress. Philadelphia: U.S. Regional Survey.
Ladd, F. 1967. A note on „the world across the street‟. Harvard Graduate School Education
Association Bulletin 12: 47-48.
Lehiste, Ilse and Gordon E. Peterson. 1961. Transitions, glides, and diphthongs. Journal of the
Acoustical Society of America 33: 268-277.
Le Page, R.B. and Andrée Tabouret-Keller. 1985. Acts of identity: Creole-based approaches to
language and ethnicity. Cambridge, UK: Cambridge University Press.
Lin, Mei-Chen and Yan Bing Zhang. 2008. Taiwanese older adults‟ perceptions of aging and
communication with peers and young adults. Journal of Asian Pacific Communication 18
(2): 135-156.
277
Lippi-Green, Rosina. 1997. English with an Accent: Language, Ideology, and Discrimination in
the United States. London: Routledge.
Livecchi, Joe and Donald Bull (Executive Producers). 2009. Southern Belles: Louisville
[Television series]. SOAPnet.
Llamas, Carmen, 2007. „A place between places‟: Language and identities in a border town.
Language in Society 36: 579-604.
Long, Daniel. 1999a. Geographical Perceptions of Japanese Dialect Regions. In D. Preston (ed.),
Handbook of Perceptual Dialectology, vol. 1. Amsterdam: John Benjamins. 177-198.
Long, Daniel. 1999b. Mapping Nonlinguists‟ Evaluations of Japanese Language Variation. In D.
Preston (ed.), Handbook of Perceptual Dialectology, vol. 1. Amsterdam: John Benjamins.
199-226.
Long, Daniel and Young-Cheol Yim. 2002. Regional Differences in the Perception of Korean
Dialects. In D. Long and D. Preston (eds.), Handbook of Perceptual Dialectology, vol. 2.
Amsterdam: John Benjamins. 249-275.
Long, Daniel and Dennis R. Preston (eds.). 2002. Handbook of Perceptual Dialectology, vol.2.
Amsterdam: John Benjamins.
Longo, Matthew R. and Stella F. Lourenco. 2007. Spatial attention and the mental number line:
Evidence for characteristic biases and compression. Neuropsychologia 45: 1400-1407.
Louisville Metro Government. 2009. Louisville Metro Government website.
http://www.louisvilleky.gov/. Accessed 29 September 2009.
Lynch, Kevin. The image of the city. Cambridge, MA: MIT Press.
278
Martinello, Marco. 1995. European citizenship, European identity and migrants: towards the
post-nationalist state? In R. Miles and D. Thränhardt (eds.), Migration and European
Integration: The Dynamics of Inclusion and Exclusion. London: Pinter Publishers.
Mase, Yoshio. 1964a. Dialect Consciousness and Dialect Divisions: Examples in the Nagano-
Gifu Boundary Region. Reprinted in D. Preston (ed.), Handbook of Perceptual
Dialectology, vol. 1 (1999). Amsterdam: John Benjamins. 71-99.
Mase, Yoshio. 1964b. On Dialect Consciousness: Dialect Characteristics Given by Speakers.
Reprinted in D. Preston (ed.), Handbook of Perceptual Dialectology, vol. 1 (1999).
Amsterdam: John Benjamins. 101-113.
McDavid, Raven I., Jr. and Raymond O‟Cain. 1980. Linguistic Atlas of the Middle and South
Atlantic States. Chicago: University of Chicago Press.
McMeekin, Isabel McLennan. 1946. Louisville: The Gateway City. New York: Julian Messner,
Inc.
McNair-DuPree, Lisa. 2000. Influences of Regional versus National Standards in Dialect Shift:
A Case Study in the Southeastern United States. Papers from the Regional Meetings,
Chicago Linguistic Society 36 (2): 239-250.
Miller, Daniel A. 2008. Discovering the quantity of quality: scoring „Regional Identity‟ for
quantitative research. Language Sciences 30: 652-678.
Milroy, Leslie. 1980. Language and Social Networks. Oxford: Basil Blackwell.
Milroy, Leslie and Dennis R. Preston. 1999. Introduction. Journal of Language and Social
Psychology 18 (1): 4-9.
279
Milroy, Leslie. 2004. Language Ideologies and Linguistic Change. In C. Fought (ed.),
Sociolinguistic Variation: Critical Reflections. Oxford: Oxford University Press. 161-
177.
Moreno Fernández, Juliana and Francisco Moreno Fernández. 2002. Madrid Perceptions of
Regional Varieties in Spain. In D. Long and D. Preston (eds.), Handbook of Perceptual
Dialectology, vol. 2. Amsterdam: John Benjamins. 295-320.
Mühlhäusler, Peter and Rom Harré. 1990. Pronouns and People: the linguistic construction of
social and personal identity. Oxford: Blackwell.
Niedzielski, Nancy. 1999. The Effect of Social Information on the Perception of Sociolinguistic
Variables. Journal of Language and Social Psychology 18 (1): 62-85.
Niedzielski, Nancy. 2002. Attitudes Toward Midwestern American English. In D. Long and D.
Preston (eds.), Handbook of Perceptual Dialectology, vol. 2. Amsterdam: John
Benjamins. 321-327.
Niedzielski, Nancy and Dennis R. Preston. 2000. Folk Linguistics. Berlin: Mouton de Gruyter.
Northern Kentucky Convention and Visitors Bureau. 2010. Northern Kentucky – The Southern
Side of Cincinnati. http://www.nkycvb.com/. Accessed 20 September 2010.
Omoniyi, Tope and Joshua A. Fishman (eds.). 2006. Explorations in the Sociology of Language
and Religion. Amsterdam: John Benjamins Publishing.
Orleans, P. 1967. Differential cognition of urban residents: effects of social scal on mapping.
Science, engineering and the city. Publication 1498. Washington, DC: National Academy
of Engineering.
Pederson, Lee, Susan McDaniel, and Carol Adams. 1986-1992. Linguistic Atlas of the Gulf
States. 7 vols. Athens, GA: University of Georgia Press.
280
Peterson, Gordon E. and Harold L. Barney. 1952. Control methods used in a study of the vowels.
Journal of the American Acoustical Society of America 24:175–184.
Pletsch de García, Kati. 2006. 2006 Presidential Address: ¡Ala! Linguistic Innovation and the
Blending of Cultures on the South Texas Border. Southwest Journal of Linguistics 1 (1):
1-15.
Preston, Dennis R. 1989. Perceptual Dialectology: Nonlinguists‟ views of areal linguistics
Dordrecht, the Netherlands: Foris.
Preston, Dennis R. 1992. Talking black and talking white: A study in variety imitation. In J. Hall,
N. Doane, and D. Ringler (eds.), Old English and new: Studies in language and
linguistics in honor of Frederic G. Cassidy. New York: Garland. 326-355.
Preston, Dennis R. 1993a. The uses of folk linguistics. International Journal of Applied
Linguistics 3 (2): 181-259.
Preston, Dennis R. 1993b. Folk dialectology. In D. Preston (ed.), American Dialect Research.
Amsterdam: John Benjamins. 333-377.
Preston, Dennis R. 1997. The South: The Touchstone. In C. Bernstein, T. Nunnally, and R.
Sabino (eds.), Language Variety in the South Revisited. Tuscaloosa, AL and London:
The University of Alabama Press. 311-351.
Preston, Dennis R. (ed.). 1999. Handbook of Perceptual Dialectology, vol. 1. Amsterdam: John
Benjamins.
Preston, Dennis R. 2003. Introduction. In D. Preston (ed.), Needed Research in American
Dialects. Durham, NC: Duke University Press. vii-xii.
281
Purnell, Thomas, William Idsardi, and John Baugh. 1999. Perceptual and Phonetic Experiments
and American English Dialect Identification. Journal of Language and Social Psychology
18 (1): 10-30.
Rensink, W.G. 1955. Informant Classification of Dialects. Reprinted in D. Preston (ed.),
Handbook of Perceptual Dialectology, vol. 1 (1999). Amsterdam: John Benjamins. 3-7.
Reyes, Angela. 2007. Language, Identity, and Stereotype Among Southeast Asian American
Youth: The Other Asian. Mahwah, New Jersey: Lawrence Erlbaum.
Romanello, Maria Teresa. 2002. The Perception of Urban Varieties: Preliminary Studies from
the South of Italy. In D. Long and D. Preston (eds.), Handbook of Perceptual
Dialectology, vol. 2. Amsterdam: John Benjamins. 329-349.
Rosaldo, Renato. 1988. Ideology, Place, and People without Culture. Cultural Anthropology 3
(1): 77-87.
Rosaldo, Renato. 1993. Culture & Truth: The Remaking of Social Analysis. Boston: Beacon
Press.
Ryan, Ellen B., Howard Giles, and Richard J. Sebastian. 1982. An integrative perspective for the
study of attitudes towards language. In E. Ryan and H. Giles (eds.), Attitudes towards
language variation. London: Edward Arnold. 1-19.
Share, Allen J. 1982. Cities in the Commonwealth: Two Centuries of Urban Life in Kentucky.
Lexington, KY: University Press of Kentucky.
Sibata, Takesi. 1959. Consciousness of Dialect Boundaries. Reprinted in D. Preston (ed.),
Handbook of Perceptual Dialectology, vol. 1 (1999). Amsterdam: John Benjamins. 39-
62.
282
Silverstein, Michael. 1979. Language structure and linguistic ideology. In P. Clyne, W. Hanks,
and C. Hofbauer (eds.), The elements: A parasession on linguistic units and levels.
Chicago: Chicago Linguistic Society. 193-247.
SkyscraperPage.com. 2008. Louisville Southern or Midwestern (Southern Edition).
SkyscraperPage.com forum. http://forum.skyscraperpage.com/showthread.php?t=162001.
Accessed 28 September 2009.
SOAPnet. 2009. SOAPNET‟S NEW ORIGINAL DOCUSOAP, “SOUTHERN BELLES:
LOUISVILLE,” PREMIERES THURSDAY, MAY 21 AT 10:00 PM ET/PT. [Press
release]. Released February 11, 2009. Retrieved April 13, 2009, from
http://www.soapnetmedianet.com/web/homepage/HomePage.aspx.
Stevens, Kenneth N. 1998. Acoustic Phonetics. Current studies in linguistics (No. 30).
Cambridge, MA: MIT Press.
Stoddard, Ellwyn R., Richard L. Nostrand, and Jonathan P. West (eds.). 1982. Borderlands
Sourcebook: A Guide to the Literature on Northern Mexico and the American Southwest.
Norman, OK: University of Oklahoma Press.
The Association of Religion Data Archive. 2009. The Association of Religion Data Archive
website. http://www.thearda.com/. Accessed 29 September 2009.
“The Derby: It‟s more than a horse race.” Editorial. Courier-Journal [Louisville, KY]. 2
May 2009. A6. http://www.proquest.com.ezproxy.uky.edu. Accessed 2 June 2010.
Thomas, Erik R. 2000. Spectral differences in /ai/ offsets conditioned by voicing of the following
consonant. Journal of Phonetics 28: 1-25.
283
Turner, Frederick Jackson. 1911. The Place of the Ohio Valley in American History. Ohio
archaeological and historical quarterly. Columbus, OH: Ohio State Archaeological and
Historical Society.
Turner, John C. 1999. Some current issues in research on social identity and self-categorization
theories. In N. Ellemers, R. Spears, and B. Doosje (eds.), Social identity: Context,
commitment, content. Oxford: Blackwell. 6-34.
Weijnen, Antonius A. 1946. De grenzen tussen de Oost-Noordbrabantse dialecten onderling [The
borders between the dialects of eastern North Brabant]. In A.A. Weijnen, J.M. Renders,
and J. van Ginneken (eds.), Oost-Noordbrabantse dialectproblemen [Eastern North
Brabant dialect problems]. Bijdragen en Mededelingen der Dialectencommissie van de
Koninklijke Nederlandse Akademie van Wetenschappen te Amsterdam 8. 1-15.
Weijnen, Antonius A. 1968. On the Value of Subjective Dialect Boundaries. Reprinted in D.
Preston (ed.), Handbook of Perceptual Dialectology, vol. 1 (1999). Amsterdam: John
Benjamins. 131-133.
Williams, Angie, Peter Garrett, and Nikolas Coupland. 1999. Dialect Recognition. In D. Preston
(ed.), Handbook of Perceptual Dialectology, vol. 1. Amsterdam: John Benjamins. 345-
358.
Williams, Ashley M. 2008. Brought-along identities and the dynamics of ideology:
Accomplishing bivalent stances in a multilingual interaction. Multilingua 27: 37-56.
Woolard, Kathryn A. 1992. Language Ideology: Issues and Approaches. Pragmatics 2 (3): 235-
249.
Woolard, Kathryn A. 1999. Simultaneity and Bivalency as Strategies in Bilingualism. Journal of
Linguistic Anthropology 8 (1): 3-29.
284
Woolard, Kathryn A. 2008. Why dat now?: Linguistic-anthropological contributions to the
explanation of sociolinguistic icons and change. Journal of Sociolinguistics 12 (4): 432-
452.
Yater, George. 2001. “Louisville: A Historical Overview”. In J. Kleber (ed.), The Encyclopedia
of Louisville. Lexington, KY: The University Press of Kentucky.
Zwickl, Simone. 2002. Language Attitudes, Ethnic Identity and Dialect Use across the Northern
Ireland Border: Armagh and Monaghan. Belfast: Queen‟s University.
285
AUTHOR’S BIOGRAPHY
Jennifer Suzanne Cramer was born on July 18, 1982, in Louisville, Kentucky. She
received a Bachelor of Arts degree in Linguistics and a Bachelor of Arts degree in French from
the University of Kentucky in 2004. She received a Master of Arts degree in Linguistics from
Purdue University in 2006. She then entered the graduate program in Linguistics at the
University of Illinois at Urbana-Champaign, where she received another Master of Arts in
Linguistics in 2009. She has presented her work at such conferences as the American
Association for Applied Linguistics (AAAL), the American Dialect Society (ADS), the
International Association for World Englishes (IAWE), the Linguistic Society of America
(LSA), and the Sociolinguistics Symposium. Additionally, she has published papers in Discourse
& Society and Studies in the Linguistic Sciences, and she has co-authored a book chapter in
Marina Terkourafi‟s (ed.), The Languages of Global Hip Hop. As of Fall 2010, she is a lecturer
in the Linguistics Program at the University of Kentucky in Lexington, Kentucky.