Embed Size (px)
Citation preview

THE EFFECT OF CAPITAL STRUCTURE ON THE FINANCIAL
PERFORMANCE OF SMALL AND MEDIUM ENTERPRISES IN
THIKA SUB-COUNTY
BY
EDWIN MARANGA BIRUNDU
D63/61327/2013
A RESEARCH PROJECT SUBMITTED IN PARTIAL
FULFILLMENT OF THE REQUIREMENTS FOR THE AWARD
OF THE DEGREE OF MASTER OF SCIENCE IN FINANCE,
SCHOOL OF BUSINESS OF THE UNIVERSITY OF NAIROBI
NOVEMBER 2014

ii
DECLARATION
This research project is my original work and has not been presented in any other
examination body. No part of this research project should be produced without my
consent or that of the University of Nairobi.
Signature………………………..… Date:…………………………………
Name: Edwin Maranga Birundu.
REG: D63/61327/2013
DECLARATION
This research project has been submitted with the approval of the University of
Nairobi
SUPERVISOR
Signature………………………………… Date…………………………………….
Name: Mr. Mwangi W. Mirie
Lecturer, Department of Finance and Accounting
School of Business, University of Nairobi.

iii
ACKNOWLEDGMENT
I would like to first and foremost thank God for helping me through and giving me the
strength to achieve this. My special thanks to my supervisor, Mr. Mwangi W. Mirie
for his continued advice and guidance over the research period. I also thank the
lecturers, administration staff and support staff of the University of Nairobi for their
support through the entire program period.
To my parent, friends and classmates for supporting me throughout the course
especially where matters of group work and revision were concerned. Last I wish to
thank the entire fraternity of PKF Kenya for their supports God bless them. May the
Almighty God bless you all greatly!

iv
DEDICATION
This paper is dedicated to my Mother Mrs Elizabeth Kemunto Nyantika for her
support, to my sibling Ryan Momanyi and my sister Leoninda Birundu I encourage
them work hard in school, and to my wife Rosebell wahu for her support and
encouragement to see me through.

v
TABLE OF CONTENTS
DECLARATION .......................................................................................................... ii
ACKNOWLEDGMENT.............................................................................................. iii DEDICATION ............................................................................................................. iv LIST OF TABLES ...................................................................................................... vii LIST OF FIGURES ................................................................................................... viii LIST OF ABBREVIATIONS ...................................................................................... ix
CHAPTER ONE: ...........................................................................................................1 INTRODUCTION .........................................................................................................1 1.1. Background of the Study ...............................................................................1 1.1.1. Capital Structure ...........................................................................................3 1.1.2. Firms Financial Performance .......................................................................5
1.1.3. Capital Structure and Financial Performance ..............................................7 1.1.4. Small and Medium Size Enterprises in Thika Sub-County ...........................8
1.2. Research Problem ........................................................................................10
1.3. Research Objective ......................................................................................11 1.4. Value of the Study .......................................................................................12 CHAPTER TWO: ........................................................................................................13
LITERATURE REVIEW ............................................................................................13 2.1 Introduction .................................................................................................13 2.2. Theories of Capital Structure .......................................................................13
2.2.1. Capital structure Irrelevance Theory ...........................................................13 2.2.2. Static Trade-off Theory ................................................................................14
2.2.3. Agency Costs Based Theory .........................................................................15 2.2.4. Pecking Order Theory ..................................................................................17 2.3. Determinants of Financial Performance of SMEs .......................................18
2.3.1. Asset Turnover ..............................................................................................18
2.3.2. Asset tangibility ............................................................................................18 2.3.3. Profitability ...................................................................................................19 2.3.4. Firm Size .......................................................................................................20 2.3.5. Firm Growth..................................................................................................20
2.3.6. Liquidity ........................................................................................................21 2.3.7. Non-Debt Tax Shields...................................................................................21 2.4. Empirical Evidence .......................................................................................22 2.5. Summary of the Literature Review ...............................................................26 CHAPTER THREE .....................................................................................................29
RESEARCH METHODOLOGY.................................................................................29 3.1 Introduction ...................................................................................................29 3.2. Research Design............................................................................................29 3.3. The Population ..............................................................................................29 3.4. Sample Design ..............................................................................................30
3.5. Data Collection .............................................................................................30 3.6. Data Analysis ................................................................................................31
3.6.1. Research Model ............................................................................................31 3.6.2. Measurement of Variables ............................................................................32 3.6.2.1. Independent Variables ..................................................................................32 3.6.2.2. Dependent Variables .....................................................................................33 CHAPTER FOUR ........................................................................................................34 DATA ANALYSIS, RESULTS AND DISCUSSION ................................................34

vi
4.1 Introduction ...................................................................................................34
4.2. Response Rate ...............................................................................................34 4.3. Data Validity .................................................................................................34 4.4. Descriptive Statistics .....................................................................................34 4.4.1. Debt Ratio .....................................................................................................34
4.4.2. Asset turnover ...............................................................................................35 4.4.3. Asset tangibility ............................................................................................36 4.4.4. Financial performance of SMEs ...................................................................36 4.5. Correlation Analysis .....................................................................................37 4.6. Regression Analysis and Hypothesis testing ...............................................38
4.7. Discussion of Research Findings ..................................................................40 CHAPTER FIVE .........................................................................................................43 SUMMARY, CONCLUSION AND RECOMMENDATIONS ..................................43 5.1 Introduction ...................................................................................................43 5.2. Summary of the Findings ..............................................................................43
5.3. Conclusions ...................................................................................................44 5.4. Recommendations .........................................................................................45
5.5. Limitations of the Study................................................................................46 5.6. Suggestions for Further Research .................................................................47
REFERENCES ............................................................................................................49 APPENDICES ..............................................................................................................57
Appendix I: Debt Ratio .................................................................................................57 Appendix II: Asset Turnover ........................................................................................59 Appendix III: Asset Tangibility ....................................................................................61
Appendix III: Return on Asset ......................................................................................63

vii
LIST OF TABLES
Table 4.1: Correlation Matrix…………………………………………………….….28
Table 4.2: Model Summary……………………………………………………….….28
Table 4.3: Analysis of Variance (ANOVA)…………………………………….……29
Table 4.4: Coefficients of Determination…………………………………………....29

viii
LIST OF FIGURES
Figure 4.1: Debt Ratio of SMEs in Thika……………………………………………26
Figure 4.2: Asset Turnover of SMEs in Thika………………………………….……27
Figure 4.3: Asset tangibility of SMEs in Thika……………………………………....27
Figure 4.4: Return on assets of SMEs in Thika……………………………………....28

ix
LIST OF ABBREVIATIONS
ANOVA - Analysis of Variance
GDP - Gross Domestic Product
GPM - Gross Profit Margin
KBS - Kenya Bureau of Statistics
MM - Modigliani and Miller
NDTS - Non Debt Tax Shield
NPS - Net Profit Margin
NSE - Nairobi Security Exchange
OLS - Ordinal Least Square
ROA - Return on Asset
ROCE - Return on Capital Employed
ROE - Return on Equity
SDTA - Short-Term Debt to Total Assets Ratio
SMEs - Small and Medium Enterprises

x
ABSTRACT
The objective of this research is to determine the effect of capital structure on the
financial performance of small and medium enterprises in Thika sub-county. In most
cases, it is expected the capital structure of a firm should have some effects on the
performance of SMEs. The study was conducted on 40 SMEs in Thiks sub-county
which were in operation for the five years of study from 2009 to 2013. The various
ratios and analysis of these SMEs were computed from the various data collected and
extracted from their financial statement for the period. The data was then analyzed
using linear regression models using SPSS20 to establish if there were any significant
effect of capital structure and the financial performance of these SMEs. The finding of
the analysis concluded that there were no significant effect between the capital
structure and the financial performance of SMEs in Thika sub-county based on the
variable factored during this study. There was very minimal effect which is negligible
and therefore it was concluded that there is minimal effect between capital structure
and financial performance of SMEs in Thika sub-county. Therefore we recommend
that additional research should be conducted in other areas and factoring other
variable which were not factored and identify which are the major factors that affect
the performance of their industry. This will enable them to control these factors to
ensure maximum profitability is attained and sustained for the growth of the industry.

1
CHAPTER ONE:
INTRODUCTION
1.1. Background of the Study
The contribution of Small and Medium Enterprises (SMEs) to an economy has been
viewed from the point that all consumers would prefer products that are more
personalized (Roshanak, 2013), this has create inherent pressures towards making
markets smaller and smaller same as to say, more and more particularized to the
demands of individual consumers. The managerial costs of satisfying the demands of
small markets are high as compared to big and generalized markets. SMEs serve an
economy by satisfying the demands of small markets for which there are no or lower
scale economies of production or distribution. SMEs also serve an economy by
satisfying demands where the managerial costs of large business are greater than the
market transaction costs of dealing by contract rather than by control within a firm
(Mazur, 2007).
The way small business mobilize and structure the capital is a subject of interest.
Capital refers to the resources that a business owns. These resources can have the input
of the owner(s) and or non-owner(s) or debtor(s). The input of the owner(s) is called
equity and the input of non-owner(s) for the purpose to repay with interest is called debt
(Gunasekaran, 2010). The composition of capital with respect to debt and equity is
referred to as capital structure. Both debt financing and equity financing have very
different potential incentive problems. To understand how SMEs finance their
operations, it is necessary to examine the determinants of their financing or capital
structure decisions. SMEs financing decisions involve a wide range of policy issues.

2
The relationship between capital structure and financial performance is one that
received considerable attention in the finance literature. How important is the
concentration of control for the company performance or the type of investors exerting
that control are questions that authors have tried to answer for long time The study the
impacts of capital structure or financial performance, will help us to know the potential
problems in finance performance and capital structure (Matibe, 2005).
Capital structure has been a major issue in financial economics ever since Modigliani
and Miller showed in 1958 that given frictionless markets, homogeneous expectations
capital structure decision of the firm is irrelevant. SMEs may face difficulties in raising
finance (debt component) due to information asymmetry and other inefficiencies in loan
markets. Inevitably, this has a serious impact on their capital structures. Taking
cognizance of exceptions, asymmetric information can also explain the dominance of
debt financing over equity issues in practice, as the bulk of external financing is
expected to come from commercial banks and micro-finance institutions (Bebczuk,
2003). Strong financial systems, which provide loans/credits to investors/businesses,
can directly and indirectly create employment and alleviate poverty in an economy
(Honohan and Beck, 2007).
Credit system also facilitates the process of job creation in which some will become
self-employed entrepreneurs while others involved in other business related activities
(Thomas, 1992). Economists and financial researchers have sought to establish the
factors that determine the capital structure. It has been researched in various locations
but with varied results as will been shown in the next charter, Literature Review. The
factors that appear to determine capital structure are many but this research will still
within the parameters of three factors including profitability, growth, size, asset
3
structure and age (Wald, 1999). Profitability refers to the net income with respect to
capital-net income to capital ratio.
This means that the higher the net income to capital ratio, higher the profitability and
vise-versa. Growth shall be defined as a consistent increase in the number of
employees. Size refers the number of employees (Mazur, 2007). Asset structure refers
to the value of fixed asset with respect to capital. Finally, age is the number of years of
existence with respect to the years being studied (Roshanak, 2013). Financing and
investment are two major decision areas in a firm. In the financing decision the
manager is concerned with determining the best financing mix or capital structure for
his firm. Capital structure decision is the mix of debt and equity that a company uses to
finance its business (Damodaran, 2001).
(Berger & di Patti, 2006) concluded that more efficient firms were more likely to earn a
higher return from a given capital structure, and that higher returns can act as a cushion
against portfolio risk so that more efficient firms are in a better position to substitute
equity for debt in their capital structure. This is an incidental of the trade-off theory of
capital structure where differences in efficiency enable firms to alter their optimal
capital structure either upward or downwards.
1.1.1. Capital Structure
A firm’s capital structure refers to the mix of its financial liabilities. As financial capital
is an uncertain but critical resource for all firms, suppliers of finance are able to exert
control over firms (Harris and Raviv, 1991). Debt and equity are the two major classes
of capital, with debt holders and equity holders representing the two types of investors
in the firm. Each of these is associated with different levels of risk, benefits, and
control. It is the way the corporation finances its assets through some combination of

4
equity, debt, or hybrid securities. A firm’s capital structure is then a composition or
structures of its liabilities.
Over the past years much of the capital structure research has advanced theoretical
models to explain the capital structure pattern and also to provide empirical evidence
concerning whether the theoretical models have explanatory power when applied to the
real business world. The focus of both academic research and practical financial
analysis has been on those large corporations with publicly traded debt and equity
securities that dominate economic life throughout the developed world. Capital
structure research has become increasingly internationalized in recent years, which
provides researchers the opportunity to make cross-sectional comparisons between
countries and between various industries around the world.
(Wald, 1999) examined characteristics of firms that were not similarly correlated with
leverage across countries. He demonstrated that institutional differences could
contribute to differences in capital structure. His results indicate that institutions may
significantly influence firms’ capital structure decision and that agency and monitoring
problems, while existing in every country, may create different outcomes. (Booth,
2001) provided the first empirical study to test the explanatory power of capital
structure models in developing countries. The study used data from 10 developing
countries to assess whether capital structure theory was portable across countries with
different institutional structures. It investigated whether the stylized facts, which were
observed from the studies of developed countries, could apply only to these markets or
whether they had more general applicability.
The results were somewhat skeptical of this premise. They provided evidence that
firms’ capital choice decisions in developing countries were affected by the same
5
variables as they were in developed countries. This study will use debt ratio as a
measure of the independent (explanatory) variable. This will serves as the proxy for
capital structure. However, a number of factors may impact on firm performance,
hence, the need for controlled variables to be included in the model.
1.1.2. Firms Financial Performance
A firm’s financial performance, in the view of the shareholder, is measured by how
better off the shareholder is at the end of a period, than he was at the beginning and this
can be determined using ratios derived from financial statements mainly the balance
sheet and income statement, or using data on stock market prices (Berger and Patti,
2002). These ratios give an indication of whether the firm is achieving the owners’
objectives of making them wealthier, and can be used to compare a firm’s ratios with
other firms or to find trends of performance over time. The main objective of
shareholders in investing in a business is to increase their wealth. Thus the
measurement of performance of the business must give an indication of how wealthier
the shareholder, has become as a result of the investment over a specific time.
Performance having different meanings depending on the user perspective of financial
information, a company can be categorized as global performance if it can satisfy the
interests of all stakeholders (Roshanak, 2013). The financial performance of SMEs can
be measured using a number of indicators firms size, profitability and growth rate. The
performance is a general term applied to a part or to all the conducts of activities of an
organization over a period of time often with reference to past or projected cost
efficiency, management responsibility or accountability. Thus, not just the presentation,
but the quality of results achieved refers to the performance. Performance is used to
indicate firm’s success, conditions, and compliance.

6
The recommended measures for financial analysis that determine a firm’s financial
performance are grouped into five broad categories: liquidity, solvency, profitability,
repayment capacity and financial efficiency (Mazur, 2007). It is important to remember
that past and present financial information are not the only factors affecting a firm’s
financial performance. Liquidity measures the ability of the firm/business to meet
financial obligations as they come due, without disrupting the owner equity, using the
market value of assets and including deferred taxes in the liabilities. Three widely used
financial ratios to measure solvency are the debt-to-asset ratio, the equity-to-asset ratio
(sometimes referred to as percent ownership) and the debt-to-equity ratio (sometimes
referred to as the leverage ratio).
The debt-to asset ratio expresses total farm liabilities as a proportion of total farm
assets. The higher the ratio, the lower the performance of the firm and the greater the
risk involved (Gunasekaran, 2010). Profitability measures the extent to which a
business generates a profit from the factors of production, labor, management and
capital. Profitability analysis focuses on the relationship between revenues and expenses
and on the level of profits relative to the size of investment in the business. Repayment
capacity method measures the ability to repay debt from both firm and non-firm
income. It evaluates the capacity of the business to service additional debt or to invest in
additional capital after meeting all other cash commitments (Roshanak, 2013).
The analysis of financial statements is an important aid to financial performance
analysis. Financial performance analysis includes analysis and interpretation of
financial statements in such a way that it undertakes full diagnosis of the profitability
and financial soundness of the business. (Metcalf and Titard, 1976) claims that the
financial performance analysis identifies the financial strengths and weaknesses of the

7
firm by properly establishing relationships between the items of the balance sheet and
profit and loss account.
The study will employs return on Assets (ROA) as the two dependent variables, and
measures of firm financial performance (Metcalf and Titard, 1976). Although there is
no unique measurement of firm performance in the literature, ROA were chosen
because they are important accounting – based and widely accepted measures of
financial performance. ROA can also be viewed as a measure of management’s
efficiency in utilizing all the assets under its control, regardless of source of financing.
1.1.3. Capital Structure and Financial Performance
(Hutchinson, 1995) in his scholarly works argued that, financial leverage had a
positive effect on the firm’s return on equity provided that earnings’ power of the
firm’s assets exceeds the average interest cost of debt to the firm. (Taub, 1975) also
found significantly positive relationship between debt ratio and measures of
profitability. (Nerlove, 1968), (Baker, 1973), and (Petersen and Rajan, 1994) also
identified positive association between debt and profitability but for industries. In
their study of leveraged buyouts, (Roden and Lewellen, 1995) established a
significantly positive relation between profitability and total debt as a percentage of
the total buyout-financing package.
However, some studies have shown that debt has a negative effect on firm
profitability. (Fama and French, 1998), for instance argue that the use of excessive
debt creates agency problems among shareholders and creditors and that could result
in negative relationship between leverage and profitability. (Majumdar and Chhibber,
1999) found in their Indian study that leverage has a negative effect on performance.
(Gleason, 2000) support a negative impact of leverage on the profitability of the firm.

8
In a polish study, (Hammes, 1998) also found a negative relationship between debt
and firm’s profitability.
In another study, (Hammes, 2003) examined the relation between capital structure and
performance by comparing Polish and Hungarian firms to a large sample of firms in
industrialized countries. He used panel data analysis to investigate the relation
between total debt and performance as well as between different sources of debt
namely, bank loans, and trade credits and firms’ performance measured by
profitability. His results show a significant and negative effect for most countries. He
found that the type of debt, bank loans or trade credit is not of major importance, what
matters is debt in general. (Mesquita and Lara, 2003), in their study found that the
relationship between rates of return and debt indicates a negative relationship for
long-term financing.
They however, found a positive relationship for short-term financing and equity.
(Abor, 2007) in his scholarly works on debt policy and performance of Medium Sized
Enterprises found the effect of short-term debt to be significantly and negatively
associated with gross profit margin for both Ghana and South African firms. This
indicated that increasing the amount of short-term debt would result in a decrease in
the profitability of the firms.
1.1.4. Small and Medium Size Enterprises in Thika Sub-County
Thika Sub-County is a home to large industries in Kenya including tanneries textiles,
footwear, food processing, motor vehicle assembly and cigarette manufacturing and
over a hundred light industries. Majority of the enterprises in Thika Sub-County are
SMEs, some are faced with challenges of accessing fund to finance their business and
therefore the adequate financial knowledge remain a constraints within the region.

9
Small and Medium Enterprises (SMEs) contribute greatly to the economies of all
countries, regardless of their level of development, it is the major source of
employment, it generation domestic and export earnings and are a key instrument in
poverty reduction (Mephokee, 2004). In Kenya, the SMEs sector employs 74% of the
labor force and contributes over 18% of the country’s gross domestic product (GDP),
(Ngugi, 2012). Generally, SMEs are defined by the number of workers employed, value
of assets and sales turnover (Garikai, 2011).
The term SMEs covers a wide range of perceptions and measures, varying from country
to country and between the sources reporting SME statistics. Some of the commonly used
criterions are the number of employees, total net assets, sales and investment level.
However, the most common definitional basis used is employment, many researchers
define Small and Medium Enterprises in terms of the numbers of people employed.
(Storey, 1994), for example, defines micro-enterprises as those with 0 to 9 employees,
those with 10 to 99 workforces as small business, and medium sized enterprises as having
100 to 499 employees. (Gunasekaran & Kobu, 2000), however, states that Small and
Medium Enterprises have to be defined within the context of the economies in which they
operate.
(Waweru, 2007) posits that SMEs in Kenya are characterized by the ease of entry and exit
the small scale nature of activities self-employment with a high proportion of family
workers and apprentices the little amount of capital and equipment. Further, they have
labour intensive technology, low level of skills and low level of organization with little
access to organized markets. Other observations by (Waweru, 2007) are their unregulated
and competitive markets, their limited access to formal credit, the existent low levels of
education and training and the limited access to services and amenities.
10
1.2. Research Problem
The continued poor performance coupled with closure of medium sized enterprises
has raised more questions than answers to researchers and practitioners. It is also
pointed out that the increase from 6.7% to 10.4% in June 2013 in commercial
institutions’ non-performing assets was attributable by small and medium firms’
failure to service their loans due to insufficient financial resources (RSM, 2013
banking survey), the capital structure employed by such firms could be a reason
influencing their financial performance trends, this issue has not been given much
attention as expected.
According to (Agn, 1992), small businesses are not engaged in the problems, as well
as opportunities, of large firms. However, small firms face different complexities,
such as the presence of tax, shorter expected life than large firms, intergenerational
transfer problems, and prevalence of implicit contracts. Moreover, (Pettit and Singer,
1985) argued that standard problems like asymmetric information and agency cost is
more severe in small firms than large firms.
Studies on the failure of the SMEs reveal that financial leverage is a main cause of
decline (Otieno, 1987). SMEs borrowing decisions are different form large
companies, due to the borrowing constraints they face. (Metha, 1981) argued that
"resource poverty" is one of the most frequently cited reasons for business failure.
Bigger business can seize the opportunity and win the market. External forces such as
government regulations and tax laws are felt more acutely by small ventures than by
large ones. Frequently, small ventures cannot afford the professional expertise of
accountants like large firms can.
(Kuria, 2010) found that profitability and tangibility are significantly negatively
related to leverage as also liquidity growth and taxation but are insignificant. While
11
risk was seen to have a significant positive relationship but an insignificant one for
dividend policy and non-debt tax shield. (Kiogora, 2000) indicates that there is a
complex array of factors that influence SMEs owners/managers' financing decisions.
These processes are influenced by firm owners' attitudes toward the utility of debt as a
form of funding as moderated by external environmental conditions (e.g., financial
and market considerations). The form of business also has an impact on the owners'
attitudes towards the utility of debt as a form of funding. For example, sole
proprietorships and partnerships are sensitive to the risk of unlimited liability. A
number of other factors have been shown to influence financing decisions including
profitability, growth prospect, assets structure, size and age.
(Kinyua, 2005) established that profitability, company size, asset structure,
management attitude towards risk and lenders’ attitude towards the company are key
determinants of capital structure for small and medium enterprises in Kenya. Despite
SMEs using different sources of financing some of them are still stagnated and others
are failing. This could be attributed to lack of knowledge on the best sources of
financing with majority of SME owners having no ideas on how debts and internal
sources of finance influence their financial performance. There is little that has been
done to provide viable solutions on which side of financing will benefit financial
performance of SMEs especially in Kenya. Thus, this study sought to fill this research
gap by answering, the effect of capital structure on the financial performance of SMEs
in Kenya particularly in Thika Sub-County?
1.3. Research Objective
The objective of this study was to determine the effect of capital structure on the
financial performance of SMEs in Thika Sub-County.

12
1.4. Value of the Study
The study will assist policymakers in formulating effective strategies and policies to
curb under performance of SME. Scholars and researcher’s knowledge and
information realized through this research undertaking will benefit other future
scholars who wish to study the same area as it provides an insight of what has not
been examined.
SME capital structure is rapidly growing as a field of practice. Many business
leaders believe that there is need to make effective financial decisions. The findings
will inform appropriate policy making and implementation that could spur the
growth of SMEs into medium-sized companies. In addition, the study provided
information to the SME' owners on the problems that generally face them and on
how best they can be able to solve the challenges. Prospective entrepreneurs might
find the conclusions on the challenges that face the SME sector useful on how best
they can surmount them upon entry into business. The research helped to elucidate
on how well capital structure could explain the growth of SMEs within Thika Sub-
County.

13
CHAPTER TWO:
LITERATURE REVIEW
2.1 Introduction
This chapter will present a review of the theoretical and empirical literature on the
effect of capital structure on the financial performance of SMEs in Thika Sub-
County. The section starts with the capital structure theories, empirical reviews and
then to the determinants of financial performance. The conceptual framework,
incorporate scholarly works and theories, the rationale of the study is to ascertain
the role capital structure played in determining financial performance.
2.2. Theories of Capital Structure
Finance theory has made major advances in understanding effect capital structure on
financial performance of SMEs, the following are some of modern financial theories
on capital structure.
2.2.1. Capital structure Irrelevance Theory
The initial theory of capital structure was first developed in 1958 by economists
Franco Modigliani and Merton Miller known as MM Theory. The “Irrelevance
Theory” showed that a firm's value is independent of its ratio of debt to equity
financing with the assumptions that, neutral taxes, no capital market frictions (i.e.
no transaction costs, asset trade restrictions or bankruptcy costs), symmetric access
to credit markets (i.e. firms and investors can borrow or lend at the same rate) and
firm financial policy reveals no information. Cost of capital does not affect capital
structure, particularly debt then not effect on firm value In other words, the value of
levered firm equals the value of unlevered firm.

14
Subsequently in their 1963 paper, Modigliani and Miller relaxed the assumptions by
introducing taxes into their model in which case the method of financing becomes
relevant. In the relaxation of the assumptions of the Irrelevance Theory, (Modigliani
and Miller, 1963), suggests that capital structure can alter the value of a firm in the
world of corporate tax and a firm can maximize it value by the use of debt which
provides an interest tax shield. A firm has more value if it uses debt financing
because debt reduces the corporate tax. The savings due to the use of debt adds to
the value of the firm. The firm that uses more debt saves more in the form of
corporate tax shield.
This suggests that debt is a preferable source of financing for less taxation is laid on
debt. (Modigliani and Miller, 1963). Therefore the theory acknowledge that if
capital structure is optimal at 100% debt financing it will minimize the weighted
average cost of capital and maximizes firm performance. However, according to the
theory there is a positive relationship between firm’s leverage and its performance
but the theory has not taken into consideration other factors that affect leverage and
the different sizes of the firm.
2.2.2. Static Trade-off Theory
Static Trade-off suggests that a firm sets a target debt-equity ratio and gradually
follows it. Debt has an advantage of tax shield (Modigliani and Miller, 1963).
However, debt cannot be indefinitely used as the source of financing as there is a
trade-off between tax shield advantage on one hand and bankruptcy cost and financial
distress on the other hand (Jensen and Meckling, 1976). Debt financing has one major
advantage over equity financing-the interest on debt is deducted before corporate tax
is paid. But debt also increases financial risk.

15
This makes debt-financing not emphatically less costly than equity-financing. A firm
that considers static trade-off, threats debt-equity decision as a “give and take”
between the cost of financial distress and tax shield of debt respectively. “Give and
take” as use here means cost and benefit. Capital structure reflects tax rates, assets
type, business risk, profitability and bankruptcy costs (Myers, 1984). Generally, if the
cost of debt is low and the corporate tax rate is high to the extent that the firm benefit
significantly from debt financing, the form will use more debt since the marginal tax-
rate on debt is less than the corporate tax rate.
This will lead the firm to a positive net tax advantage if it uses debt-financing. Here
the firm’s optimal capital structure will involve the trade-off between the tax
advantage of debt and various leverage-related costs (Niu, 2008). Distinction in firms’
characteristics leads to variation in the target debt-equity ratio. The trade-off theory
predicts that safe firms, firms with more physical/tangible assets and higher tax rate will
have higher debt-equity ratio. Firms that are risky (firms with more non-
physical/intangible assets) ought to have more equity-financing (Niu, 2008).
Static Trade-off theory suggests that a firm that is profitable is likely to have more debt as
it would want to shield its income from taxes. This means that a firm that in its profitable
period will use more debt-financing. Static Trade-off theory therefore suggests that there
is a positive relationship between the firm’s leverage and performance. However there is
no clear consensus on the link between capital structure and firms financial performance.
2.2.3. Agency Costs Based Theory
(Berle and means, 1932) put forward the agency theory which also contributes to the
capital structure decision. The theory argues that conflicts arise from the possible
divergence of interests between shareholders (principals) and managers (agents) of

16
firms. The primary duty of managers is to returns to shareholders thereby increasing
the profit figures and cost cash flows (Elliot and Chiber, 2002). However, (Jensen and
Meckling, 1976) and (Jensen and Ruback, 1983) argue that managers do not always
run the firm to maximize returns to shareholders. As a result of this, managers may
adopt non-profitable investments, even though the outcome is likely to be losses for
shareholders. They tend to use the three cash flow available to fulfill their personal
interest instead of investing in positive not present value projects that would benefit
the shareholders.
(Jensen, 1986) argues that the agency cost is likely to exacerbate in the presence of
free cash flow in the firm. In an effort to mitigate this agency conflict, (Pinegar and
Wilbruch, 1989) argue that capital structure can be used through increasing the debt
level and without causing any radical increase in agency costs. This will force the
managers to invest in profitable ventures that will be of benefit to the shareholders. If
they decide to invest in non-profitable projects and they are unable to pay the interest
due to debt holders, the debt holders can force the firm to liquidation and managers
will lose their decision rights or possibly their employment.
Agency theory contributes that leverage firms are better for shareholders as debt level
can be used for monitoring the managers (Boodhoo, 2009). Thus, higher leverage is
expected to lower agency costs, reduce inefficiency and thereby lead to improvement
in a firm’s performance. Empirical supports for the relationship between capital
structure and firm performance from the agency perspective are many and in support
of negative relationship. (Zeitun and Tian, 2007), using 167 Jordanion companies
over fifteen year period (1989 – 2003), found that a firm’s capital structure has a
significant negative impact on the firm’s performance indicators, in both the

17
accounting and market measures. (Rao and Syed, 2007) also confirm negative
relationship between financial leverage and performance.
Their results further suggest that liquidity, age and capital intensity have significant
influence on financial performance. Hence the disjunction at this level has posted a
challenge that there is no consensus between capital structure and firm’s financial
performance.
2.2.4. Pecking Order Theory
The pecking order theory was developed by (Myers, 1984) stated that firms prefer
internal sources of finance they adapt their target dividend payout ratios to their
investment opportunities although dividends and payout ratios are gradually
adjusted to shifts in the extent of valuable investment opportunities. Pecking Order
theory tries to capture the costs of asymmetric information. It states that companies
prioritize their sources of financing (from internal financing to equity) according to
the law of least effort, or of least resistance, preferring to raise equity as a financing
means “of last resort”.
Hence internal financing is used first when that is depleted, then debt is issued and
when it is no longer sensible to issue any more debt, equity is issued. This theory
maintains that businesses adhere to a hierarchy of financing sources and prefer
internal financing when available, and debt is preferred over equity if external
financing is required (equity would mean issuing shares which meant 'bringing
external ownership' into the company). Thus, the form of debt a firm chooses can
act as a signal of its need for external finance.
The pecking order theory is popularized by (Myers, 1984) when he argues that
equity is a less preferred means to raise capital because when managers (who are

18
assumed to know better about true condition of the firm than investors) issue new
equity, investors believe that managers think that the firm is overvalued and
managers are taking advantage of this over-valuation. As a result, investors will
place a lower value to the new equity issuance. (Myers, 1984) and (Macan and
Lucey, 2011)
2.3. Determinants of Financial Performance of SMEs
A number of empirical studies have identified firm level characteristics that affect
the capital structure of firms and these include.
2.3.1. Asset Turnover
Asset turnover is defined as the ratio of sales to total assets. Assets play important
role in leverage level of firms. A firm with large amount of fixed assets can borrow
at relatively lower rate of interest by providing the security of these assets. Having
the incentive of getting debt at lower interest rate, a firm with higher percentage of
fixed asset is expected to borrow more as compared to a firm whose cost of
borrowing is higher because of having less fixed assets. Tangible assets are less
subject to informational asymmetries and usually they have a greater value than
intangible assets in the event of bankruptcy. The trade-off theory predicts a positive
relationship between measures of leverage and the proportion of tangible assets.
Relative to this theory, (Bradley, Javrell and Kim, 1984).
2.3.2. Asset tangibility
Asset tangibility is defined as the ratio of net tangible asset to total assets. Assets
play important role in leverage level of firms and its turnover. A firm with large
amount of fixed assets can borrow at relatively lower rate of interest by providing
the security of these assets also its associated that if the assets are used efficiently

19
they will increase its turnover. Having the incentive of getting debt at lower interest
rate, a firm with higher percentage of fixed asset is expected to borrow more as
compared to a firm whose cost of borrowing is higher because of having less fixed
assets. Tangible assets are less subject to informational asymmetries and usually
they have a greater value than intangible assets in the event of bankruptcy.
2.3.3. Profitability
There are two opposite views relating relationship between profitability and leverage.
(Myers, 1984) in his pecking order theory predicts that firms prefer raising capital
from retained earnings, then from debt, then from issuing equity. The cost of capital
dictates the rank of the pecking order under asymmetric information and market
imperfections. If pecking order applies, then, higher profitability will correspond to a
lower debt ratio holding other things equal. As a result, pecking order theory assumes
negative relationship between leverage and profitability. Studies conducted by
(Danbolt and Bevan, 2001) empirically proved negative relation between leverage and
profitability.
In the trade off theory, agency costs, taxes and bankruptcy costs push more profitable
firms toward higher book leverage. First, expected bankruptcy costs decline when
profitability increases. Secondly, the deductibility of corporate interest payments
induces more profitable firms to finance with debt. In a trade-off theory framework,
when firms are profitable, they prefer debt to benefit from the tax shield. In addition,
if past profitability is a good proxy for future profitability, profitable firms can borrow
more, as the likelihood of paying back the loans is greater. In the agency models of
(Jensen and Meckling, 1976), higher leverage helps control agency problems by

20
forcing managers to pay out more of the firms excess cash. Accordingly, the trade-off
theory predicts a positive relationship between profitability and leverage.
2.3.4. Firm Size
There are two conflicting viewpoints about the relationship of size to leverage of a
firm. According to trade off theory, larger firms are well diversified, having stable
cash flows and their chances of bankruptcy are less as compared to small firms.
Therefore, large firms prefer leverage and are having high level of leverage (Myers
and Majilu, 1984). Due to the large size, high level of fixed assets, economies of
scale, stable cash flow and creditworthiness larger firms have the bargaining power
over lender and can borrow at relatively lower rate. Thus, large firms are expected to
hold more debt in their capital structure than small firms. Following this, one may
expect a positive relationship between size and leverage of a firm.
Second, contrary to first view, (Rajan and Zingales, 1995) argue that there is less
asymmetrical information about larger firms. This reduces the chances of
undervaluation of the new equity issue and thus encourages the large firms to use
equity financing. This means there is negative relationship between size and leverage
of a firm.
2.3.5. Firm Growth
Empirically, there is much controversy about the relationship between growth rate and
level of leverage. According to pecking order theory hypothesis, a firm will use first
internally generated funds which may not be sufficient for a growing firm so the next
option is for the growing firms to use debt financing which implies that a growing
firm will have a high leverage (Drobetic and Fix, 2003). Hence, pecking order theory
assumes positive relationship between leverage and growth.

21
On the other hand, agency costs for growing firms are expected to be higher as these
firms have more flexibility with regard to future investments. The reason is that
bondholders fear that such firms may go for risky projects in future as they have more
choice of selection between risky and safe investment opportunities. Because of that
bondholders will impose higher costs at lending to growing firms. Growing firms,
thus, facing higher cost of debt will use less debt and more equity. (Rajan and
Zingales, 1995) find a negative relationship between growth and leverage. In this
study, growth is taken to have a positive relationship with leverage.
2.3.6. Liquidity
There are two opposite views relating the relationship between liquidity and leverage.
According to trade off theory, the more liquid firm would use external financing due
to their ability of paying back liabilities and to get benefit of tax shields, resulting in
positive relationship between liquidity and leverage. Pecking order theory assumes
that the more liquid firm could use first its internal funds and would decrease level of
external financing, resulting in negative relationship between liquidity and leverage.
Most studies have found the negative relationship (Mazur, 2007). In this study
negative relationship between liquidity and leverage is expected. Not many studies
have tested the effect of liquidity on the choice of capital structure. (Mazur, 2007) and
(Ullah, 2011) measured liquidity as the ratio of current assets to current liabilities. In
this study, Liquidity will also be measured as the ratio of current assets to current
liabilities.
2.3.7. Non-Debt Tax Shields
The effective tax rate has been used as a possible determinant of the capital structure
choice. According to (Modigliani and Miller, 1963), if interest payments on debt are

22
tax deductible, firms with positive taxable income have an incentive to issue more
debt. That is, the main incentive for borrowing is to take advantage of interest tax
shields. Other items apart from interest expenses, which contribute to a decrease in
tax payments, are labelled as non-debt tax shields (NDTS), for example the tax
deduction for depreciation and investment tax credits.
(Angelo and Masulis, 1980) argue that non-debt tax shields are substitutes for the tax
benefits of debt financing and a firm with larger non-debt-tax shields, ceteris paribus,
is expected to use less debt. Therefore, the relation between non-debt tax shields and
leverage should be negative. (Angelo and Masulis, 1980) measured non-debt-tax
shields as depreciation divided by total assets as in most studies. Depreciation divided
by total assets is used in order to proxy for non-debt tax shield in this study.
2.4. Empirical Evidence
This section discusses studies which have been conducted locally and internationally,
which examined the impact of capital structure on financial performance. (Chode,
2003) studied impacts of capital structure of public enterprises in Kenya on its
financial performance. His period of study was between 1994 and 1998. He used
regression analysis and found out that enterprises depended on public funding and
also found a positive relationship between debt and financial performance of the
organisation, which he categorized as debt. He also concluded public enterprises did
not endeavour to maximize profits in a competitive market and their managers did not
have the motivation to respond to competition.
(Kinyua, 2005) studied the impacts of capital structure of small and medium-sized
enterprises in Kenya on its firm financial performance. In his study which covered
five years, between 1998 and 2002, he used multiple regression and correlation to

23
analyse the collected data. He established that profitability, company size, asset
structure, management attitude towards risk and lenders’ attitude towards the
company are key impacts of capital structure for small and medium enterprises in
Kenya. The study found a positive relationship between internally generated fund and
the firm performance.
(Matibe, 2005) set out to study the relationship between capital structure for listed
companies in Kenya and their financial performance. The study covered five years,
between 1998 and 2002. Correlation analysis was used to analyse the collected data.
The study found out that firms owned by the state are more likely to borrow than
those owned by individuals, institutions or foreign investors. He concluded that state-
owned firms have more access to debt than firms owned by individuals and foreign
investors. This study did not consider the effect of bankruptcy of organisation
although it has indicated that there is a positive relation between leverage and firm
performance.
(Mustafa and Osama, 2006). The study investigated the effect of capital structure on
the performance of the public Jordanian firms listed in Amman stock market. The
study used multiple regression model represented by ordinary least squares (OLS) as a
technique to examine what is the effect of capital structure on the performance by
applying on 76 firms (53 industrial firms and 23 service corporation) for the period
(2001-2006). The results of the study concluded that capital structure associated
negatively and statistically with firm performance on the study sample generally. In
addition, the study found out that there was no significant difference to the impact of
the financial leverage between high financial leverage firms and low financial
leverage firms on their performance.

24
Finally, the study also showed that the effect of financial leverage on the basis of the
growth that there is no difference between the financial leverage of high growth firms
and low growth firms on the performance, which it was negatively and statistically.
Although the study has illustrate that there was a positive relationship between
leverage and firm’s performance other factors like the asset structure and profitability
were not factored in the study.
(Osuji and Odita, 2010) did a study on impact of capital structure on financial
performance of Nigerian firms using a sample of thirty non-financial firms listed on
the Nigerian Stock Exchange during the seven year period, 2004 – 2010. Panel data
for the selected firms were generated and analysed using ordinary least squares (OLS)
as a method of estimation. The result shows that a firm’s capital structure surrogated
by debt ratio has a significantly negative impact on the firm’s financial measures
(Return on Asset ROA). The study of these findings, indicate consistency with prior
empirical studies and provide evidence in support of Agency cost theory.
(Mwangi, 2010) did a study on capital structure on firms listed at the Nairobi Stock
Exchange also tried to look on the relationship between capital structure and financial
performance. Data was collected using structured questionnaires. The study identified
that a strong positive relationship between leverage and return on equity, liquidity,
and return on investment existed This hypothesis is also supported by a number of
studies, to them the benefits of debt financing are less than it’s negative aspects, so
firms will always prefer to fund investments by internal sources (Jensen and
Meckling, 1976) all found a significant and negative impact of capital structure on
performance.

25
(Kehinde, 2012) in his study conducted between 2010 and 2012 examined the
relationship that exists between the capital structure mix of the SMEs and the overall
performance of the firm over the years in Nigerian. The study made use of
questionnaire a survey method for data collection and chi-square a non-parametric
method for data analysis. The study revealed that most SMEs have an all equity
finance structure and has a less debt finance to equity finance. It also revealed that the
earning, survival and growth of the SMEs is strongly influence by the capital structure
mix. It was recommended that the government should design a home grown and
SMEs friendly debt financing structure and managers of SMES should also seek
professional advice when approaching financial institutions for debt finance.
(Roshanak, 2013). The study of the Impact of Capital Structure Determinants on
Small and Medium size Enterprise Leverage in Iran. The study used deductive
approach with the unique set of data gathered from 201 SMEs in Iran over the period
of 2006 to 2010, the statistic panel data regression is used to analyse the empirical
data picked up from different manufacturing industries in Iran.
The result of this research reveals that the impacts of capital structure determinants on
SMEs leverage levels are different in terms of both magnitude and direction. The
result indicates that profitability has a strong impact on SMEs borrowing decisions.
Besides profitability, size and asset structure appear to have an impact on leverage
level in compare with other determinants. The research finding shed lights on the
necessity of using the maturity structure of debt (short-term debt and long-term debt)
as dependent variables.
Firms are more willing to finance their projects with short term debt, rather than long
term debt. Long term debt is costly, and the probability of bankruptcy is higher with

26
long term debt. Although long term debt is riskier for SMEs, but it shows the
management confident in the firm’s future since it obliges the firm’s management to
make legally binding future payments of interest. However, the empirical result of this
study shows that all the determinants have an effect on the level of leverage in SMEs.
(Wambugu, 2013) effects of working capital management practices on profitability of
small and medium enterprises in Nairobi County, Kenya. The objective of this study
was to determine the effect of working capital management practices on profitability
of Small and Medium Enterprises (SMEs) in Nairobi County The study adopted a
cross-sectional survey research design and also, a linear regression model was used to
analyze quantitative data and was developed and tested to explain the relationship
between various proxies of working capital management practices and profitability of
SMEs of Nairobi County. The study results of the regression analysis indicated that
the dependent variables are significant and have an effect on profitability of SMEs.
The study concluded that managers of SMEs should adopt the correct working capital
management practices and identifying critical areas that may improve the profitability
of SMEs.
2.5. Summary of the Literature Review
Initially (1958) Modigliani and Miller Theory posited that firm value is independent
of its financial structure, subsequently (1963), taking into account the corporate tax,
they underscored the effects of benefits of the tax shield of debt recognising that
leverage can reduce the payment obligations related to corporate tax. In 1960s-1970s,
research shifted towards studying the way in which firms manage to balance the
bankruptcy costs with the benefits of tax shields, derived from taking on debt these

27
works were grouped under the “static trade-off theory.” According to the theory, there
was a positive relationship between the firm’s leverage and performance.
In the mid-1970s, research turned to agency costs, focusing on two categories of
conflicts of interest between managers and shareholders. The research was predicated
on the assumption that optimal capital structure represents a compromise between the
effects of interest tax shield, financial distress costs and agency costs. In the first half
of the 1980s, the emphasis was mainly placed on information asymmetries among
investors and firms, which defined the pecking order theory.
Thus, according to pecking order theory, more profitable firms generate higher
earnings that can serve for self-financing, enabling them to opt less for debt financing
conversely, less profitable firms do not enjoy the same opportunity, being compelled
to take on debt in order to finance their on-going activity. Consequently, the theory
asserts a negative correlation between the debt level and firm performance. During the
1990s the focus on the disjunctive-hypothetical reasoning to provide arguments in
favour of or against the two theories proposed, i.e. trade-off theory and pecking order
theory, respectively
The disjunction at this level of theoretical and empirical research has posted challenge
that there is no consensus on the link between capital structure and firm performance
(for instance, static trade-off theory admits a positive relation between the firm’s debt
level and its performance. Agency cost theory recognises that higher leverage, in the
context of lower agency costs, reduces inefficiency and thereby leads to enhanced
company performance pecking order theory estimates a negative correlation between
the firm’s debt level and its performance).

28
In Kenya previous studies have focused on effect of capital structure on financial
performance of companies listed in NSE (Matibe, 2005), only three studies have been
done on SMEs in Kenya and since SMEs are becoming the major contribution in a
country economy all research have been concluded and suggested that a more tailored
research on SMEs need to be conducted. This study therefore comes in to fill the gap
in the effect on capital structure and firm performance of the SMEs in Thika Sub-
County.

29
CHAPTER THREE
RESEARCH METHODOLOGY
3.1 Introduction
This chapter presents the methods and procedures that will be followed in conducting
research with the aim of evaluating the effect of capital structure on financial
performance of SMEs in Thika Sub-County. The chapter will thus outlined into
research design in section, population and sample in section, data collection
procedures in section, research models in section and data analysis in section.
3.2. Research Design
The research adopted descriptive research design. This design gives a description of
phenomenon, characteristics and association of the research variables. It is appropriate
for the study as it will enable high level analysis such as correlation and regression
analysis that will allow to establish the nature and the extend of the effect of capital
structure on financial performance of SMEs.
3.3. The Population
There has been not convictional definition for SMEs. What was agreed upon is the
factor size which has been measured by the number of employees. What has been
practiced is the customization of definitions to suit the conditions of a particular
economy or country. Base on this practice, Kenya Bureau of Statistics (KBS) has
defined SMEs as businesses that have less than fifty (50) employees. Hence the SMEs
being studied in this research are businesses with less than fifty (50) employees (KBS,
2013). According to (KBS, 2013) Statistics Business Register, a total of

30
approximately 1,890 registered SMEs operated in Thika, hence our population frame
was 1,890.
3.4. Sample Design
The sample size was determined using (Krejcie, 1970) who developed a formula for
estimating the sample size and a table for determining the sample size based on
confidence level needed from a given population. Based on a population of 1,890
SMEs in Thika, the recommended sample size will be 40. Simple random sampling
was used to select the sample from the population. (Mugenda & Mugenda, 2003)
suggested that for correlation research, 30 cases or more are required.
Since this study involved determining the effect of capital structure on financial
performance, a sample of 40 SMEs was considered sufficient. This study used simple
random sampling technique to select sample because the technique minimized bias
and increases the chances of representativeness.
3.5. Data Collection
Secondary data was collected from the annual financial reports of SMEs in Thika. The
data was collected from the financial year 2009 – 2013. This included statement of
profit and loss, statement of financial position and statement of cash flows. The
annual reports was requested from the organisation management or data published
with the Kenya Bureau of Statists (KBA). The data collected included, total turnover
for the period, Net profit after tax, total fixed asset, and total current asset, capital
structure variables which include debt, equity, current liabilities and non-current
liabilities.

31
3.6. Data Analysis
The data collected for this study was cleaned, edited and tested for completeness. This
was done to ensure that the data used were adequately reflective, accurate and reliable
for conclusion and realization of the research objective of this study. SPSS software
was used to carry out the analysis of the data obtained. The study used three
independent variables. The researcher constructed a regression model to analyze the
reliance leverage (the dependent variables) on the independent variable outlined below.
Regression has become one of the most widely used techniques in the analyzing such data
(Bryman, 1998).
3.6.1. Research Model
The model adopted by this study was the multiple regression models. “Multiple
regressions” is a technique that allows many factors to enter the analysis separately so
that the effect of each can be estimated. It was valuable for quantifying the impact of
various simultaneous influences upon a single dependent variable.
Data collected on the variable of interest within the period of study were analyzed
through descriptive statistics. Further multiple regressions and correlation analysis
were used to explain the nature and significance of relationship between changes in
the response variables and change in the prediction variables (determinants) identified
in the study. The regression equation model was as below:
Y=β0+ β1X1+ β2X2+ β3X3+Ɛ
Where:
Y= Dependent Variable - ROA
X1=Debt Ratio (ratio of total debt to total assets)

32
X2= Asset turnover (ratio of sales to total assets)
X3= Asset tangibility (Net tangible assets to total assets)
β0 = Constant
Ɛ = error term that the residual cannot be explained by the independent variables
β1 - β3=regression coefficients define the amount by which Y was changed for every
unit change in predictor variables. ROA represents the dependent variable. On the
other hand, Debt ratio, Asset tangibility and asset turnover represents the independent
variables. This indicates that X1, X2 and X3 are all factors that influence ROA. ROA is
an accounting measure for evaluating the firm’s financial performance. Independent
variable will be represented by the debt ratio (DR), asset tangibility and asset
turnover. Debt ratio is the representative variables while asset turnover and assets
tangibility are controlled variables.
3.6.2. Measurement of Variables
The capital structure was measured using the debt ratio, asset turnover and asset
tangibility whiles the firm financial performance was measured using the return on
asset.
3.6.2.1. Independent Variables
The value of debt was arrived at using the unconventional formula, where the total
liabilities (both long term and short term) were expressed as a proportion of the total
funding. The value for the indebtedness was computed as below.
Debt ratio = total debt / Total asset
Asset turnover = Sales / Total asset
33
Asset tangibility = Net tangible asset/Total asset
3.6.2.2. Dependent Variables
The performance of a company was considered as the return on equity. The benefit or
return to the shareholder was expressed as the ratio of the net profit after taxes to the
shareholders’ funds. The net profit after tax was arrived at after deducting all
obligatory expenses of the business including interest and taxes. The shareholder’s
fund included share capital, retained profits and other reserves. This ratio expressed
the return in shillings for each shilling of the shareholder’s funding. This was
expressed mathematically by:
ROA = Profit after tax / Total asset
Greatest advantage with regression analysis was that the parameters will be estimated
to show causality between explanatory variables and regressors. Parameters estimated
suggest magnitude and direction the independent variables have on the explanatory
variables. In order to test the significance of the model in measuring the relationship
between independent and dependent variable, this study conducted an Analysis of
Variance (ANOVA). On extracting the ANOVA statistics, the researcher looked at
the significance value. The study was tested at 95% confidence level and 5%
significant level. If the significance number found to be less than the critical value (a)
set, then the conclusion will be that the model is significant in explaining the
relationship.

34
CHAPTER FOUR
DATA ANALYSIS, RESULTS AND DISCUSSION
4.1 Introduction
This chapter presents analysis and findings of the study as set out in the
research objectives and methodology. The study findings are presented on the effects
of capital structure on the financial performance of SMEs in Thika sub-county. The
Study begins by showing descriptive statistics and then finish with regression results
from ordinary least square estimates. The specific variables discussed in this chapter
include Financial performance as measured by Return on Assets, Debt ratio, asset
tangibility and asset turnover.
4.2. Response Rate
The response rate was 100% since the study targeted 40 respondents from SMEs in
Thika and all responded and gave their management accounts for the period of our
study. Therefore the response rate was considered ideal and reliable.
4.3. Data Validity
We obtained secondary data which was obtained from financial reports presented to
us and therefore data validity is not applicable under this study.
4.4. Descriptive Statistics
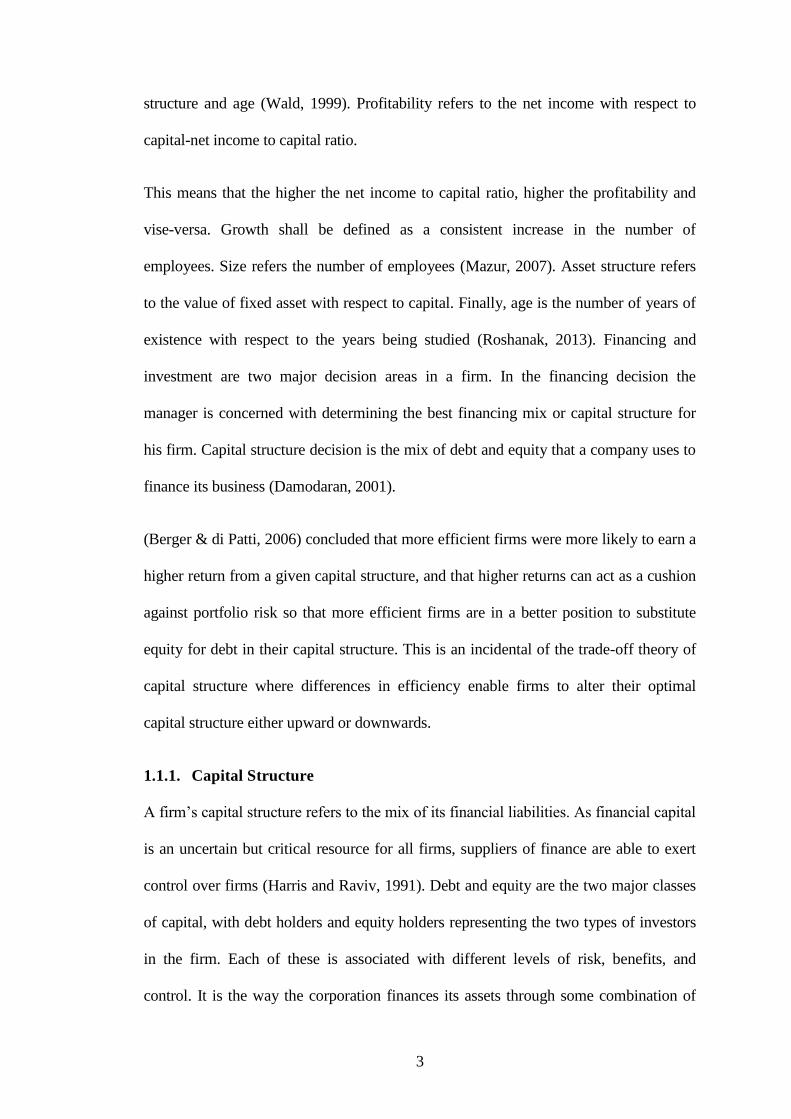
4.4.1. Debt Ratio
The study collected secondary data on the performance of the SMEs in Thika as
regards the levels of debt ratio for five years starting 2009 to 2013. From the findings
of the study, the industry debt ratio started at 88% in 2009 then reduced to 58% in
2010 before picking a downward trend in 2011 to hit a low of 53% in 2012, the debt

35
ratio level reduced further to 52% before reducing further in 2013 to 46%. These
findings are well illustrated using a graph shown in figure 4.1 below and appendix I.
Figure 4.1: Debt Ratio of SMEs in Thika
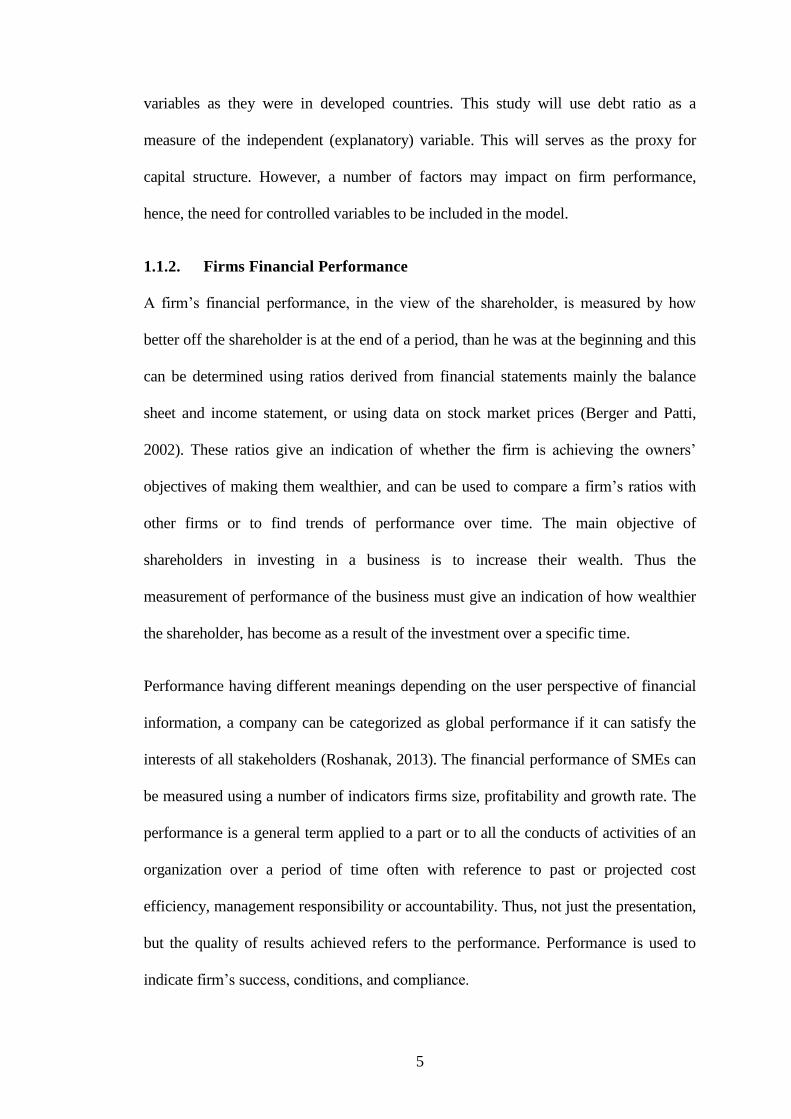
4.4.2. Asset turnover
From the findings of the study, the industry debt ratio started at 91% in 2009 then
reduced to 75% in 2010 before picking a downward trend in 2011 to hit a low of 66%
in 2012, the debt ratio level reduced further to 52% before reducing further in 2013 to
47%. These findings are well illustrated using a graph shown in figure 4.2 below and
appendix II.
Figure 4.2: Asset Turnover of SMEs in Thika
0%
20%
40%
60%
80%
100%
2009 2010 2011 2012 2013
Percentage
Period (years)
Debt Ratio
Percentage
0%
20%
40%
60%
80%
100%
2009 2010 2011 2012 2013
Percentage
Period (years)
Asset Turnover
Percentage

36
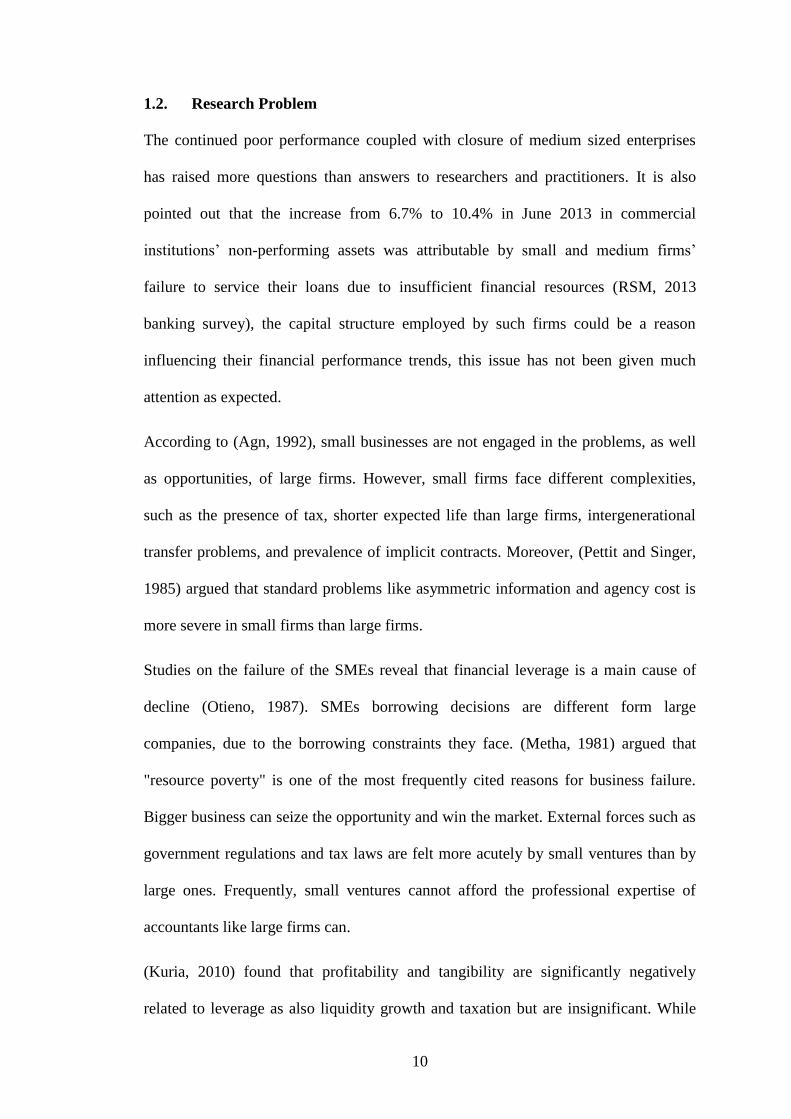
4.4.3. Asset tangibility
The study computed the tangibility of the SMEs by dividing net tangible assets by
total assets. Tangibility was used to measure the level of tangible assets owned by the
SMEs in relation to total assets. From the findings, the level of tangibility started at a
low of 46% in the year 2009 then it increased to 51% in the following year 2010. In
the year 2011, the level of tangible assets reduced further to reach 39%. The ratio
increased in 2012 to 51% which further increased to 53% in 2013. These findings are
well illustrated using a line curve in the figure 4.3 below and the data in appendix III.
Figure 4.3: Asset tangibility of SMEs in Thika
4.4.4. Financial performance of SMEs
The financial performance of the SMEs was measured using return on assets. From
the research findings, return of assets of the SMEs under study stood at 12% in the
year 2009. It decreased to 10% in 2010. In 2011 the ratio increased to 13% before
again a further reduction to 9% in 2012. In 2013 the return increased to 20%, and this
can be well illustrated using a line curve in the figure 4.4 below and the data in
appendix IV.
0%
20%
40%
60%
2009 2010 2011 2012 2013
Percentage
Period (years)
Percentage
Percentage

37
Figure 4.4: Return on assets of SMEs in Thika
4.5. Correlation Analysis
Correlation coefficient indicates strength and direction between variables.
Specifically, partial correlation coefficient shows correlation between two variables
holding others constant. Table 4.1 shows Pearson correlation coefficients of variables
of our interest.
Table 4.1: Correlation Matrix
Correlations
ROA
Debt
ratio
Asset
turnover
Asset
tangibility
ROA 1
Debt ratio -.315 1
Asset turnover -.405 .894* 1
Asset tangibility .117 -.236 -.369 1
*. Correlation is significant at the 0.05 level (2-tailed).
In table 4.1 above shown that there is a negative correlation between returns on asset
(ROA) with variables of Debt ratio of -0.315 with a probability value of 0.606 asset
turnover ratio of -0.405 with a probability value of 0.499, while there is a positive
0%
5%
10%
15%
20%
25%
2009 2010 2011 2012 2013
Percentage
Period (years)
Return on Assets
Percentage

38
correlation of asset tangibility of 0.177 with a probability value of 0.852. Although
there was a correlation between the variables at 5%, they were not significant.
4.6. Regression Analysis and Hypothesis testing
In addition to the above analysis, the researcher conducted a multiple regression
analysis so as to test the relationship among independent variables. The researcher
applied the Statistical Package for Social Sciences (SPSS Version 20) aid in
computation of the measurements of the multiple regressions for the study. The
findings are as shown in the table 4.2 below:
Table 4.2: Model Summary
Model Summary
Model R R Square Adjusted R Square Std. Error of the
Estimate
1 .422a .178 -2.286 .07744
a. Predictors: (Constant), Asset tangibility, Debt ratio, Asset turnover
The coefficient of determination explains the extent to which changes in the
dependent variable (Financial Performance of SMEs) can be explained by the change
in the independent variables (debt ratio, asset turnover and asset tangibility). The three
independent variables that were studied, explain only 17.80% of the changes in the
financial performance of SMEs in Thika as represented by the adjusted R2.
The R column represents the multiple correlation coefficients which measures the
quality of the prediction of dependent variable. In this case the value of R is 0.422
which shows a weak level of prediction. However, the R2 which is the coefficient of
determination is 0.178 indicating that only 17.8% of the financial performance of
SMEs in Thika can be explained by debt ratio, asset turnover and asset tangibility, the
other 82.2% can be explained by other variables which were not in the model.

39
Table 4.3: Analysis of Variance (ANOVA)
ANOVAa
Model Sum of
Squares
df Mean Square F Sig.
1
Regression .001 3 .000 .072 .966b
Residual .006 1 .006
Total .007 4
a. Dependent Variable: ROA
b. Predictors: (Constant), Asset tangibility, Debt ratio, Asset turnover
To test for the existence of a linear relationship between capital structure and financial
performance variables, Analysis of Variance was employed. The results from the
analysis of variance as per table 4.2 shows that the regression relationship between
ROA and the independent variables is not statistically significant at 5% level of
significance (F (3,1) = 0.072, p-value = 0.966 > 0.05), meaning that there is no
significant effect of the debt ratio, asset turnover and asset tangibility to financial
performance of SMEs in Thika. This can be shown by the significant level which is
0.966 which is more than 0.05.
Table 4.4: Coefficients of Determination
Coefficientsa
Model Unstandardized
Coefficients
Standardized
Coefficients
t Sig.
B Std. Error Beta
1
(Constant) .214 .443 .484 .713
Debt ratio .068 .533 .264 .127 .920
Asset turnover -.157 .511 -.665 -.307 .811
Asset tangibility -.050 .757 -.066 -.066 .958
a. Dependent Variable: ROA
The researcher conducted a multiple regression analysis so as to determine the effects
of capital structure on the financial performance of SMEs in Thika, although the
regression relationship between ROA and the independent variables is not statistically

40
significant at 5% level, the regression equation was not necessary. However, from our
findings the variables indicated that when all the factors are held at zero the ROA will
increase by 0.214 units. In this model, it can be observed that there is a positive
relationship between the financial performance and debt ratio meaning that as the debt
ratio increase by one unit, the ROA ratio will tend to increase by 0.068.
However, there is a negative relationship between the assets turnover and financial
performance as can be indicated by the coefficient of the assets turnover which is -
0.157. This means that as the assets turnover decreases by one unit, the ROA ratio
will tend to decrease by -0.157. Also there is a negative relationship between the
assets tangibility and financial performance as can be indicated by the coefficient of
assets tangibility which is -0.05. This means that as the assets tangibility decreases by
one unit, the ROA ratio will tend to decrease by -0.050.
4.7. Discussion of Research Findings
Capital structure decisions are vital decisions with great implication for the firm's
financial performance, the study used both descriptive (measure of central tendency)
and inferential statistics (correlations and regression) to undertake data analysis. The
findings in this study indicate that there is no significant relationship between the
three factors analysed in determining the financial performance of SMEs in Thika.
The study however established that there is a positive relationship between debt ratio
and the financial performance of SMEs although not statistically significant. As more
funds for debt are available SMEs will be able to generate more sources of capital to
enable them to expand on their activities. As more opportunities will be exploited for
better performance. These results are consistent with the agency theory postulated by
Jensen & Meckling (1976) and extended by Elliots (2002). The agency theory

41
postulate that the use of debt in the capital structure can be used to mitigate the
agency conflict by forcing managers in invests in profitable ventures that benefit the
shareholders. We noted that since SMEs in Thika had a lot of opportunity for growth
and shareholders have segregated their duties to managers to take charge in the
management of the business.
However, the positive effects can be realized when usage of borrowed funds increases
the earning ability of the firms performance in the industry by reinvesting in
opportunities as and when they arise, thereby increasing their profitability. The study
also established that there is a negative relationship between assets turnover and
financial performance. The more the amount held in as assets will have negative
effects on the financial performance of SMEs. Since the asset turnover measured how
efficient are the assets were used to generate the sales of the business.
This is an indication that the SMEs still they do not have the capability of
maximisation of their assets hence leading to misuse which leads to negative effects
between the asset turnover and the financial performance of the SMEs in Thika. The
study has well established that there exists a negative relationship between tangibility
and financial performance of SMEs. As the level of tangible assets increase, the level
of funds tied up in the assets increases, hence limiting the ability of the industry to
utilize the resources in new opportunities as and when they arise.
Since the ratio of net tangible assets to total assets has a negative effects on the
financial performance of the organisation. This is an indication that assets are not
optimally used to generate maximum benefit to the business, hence having negative
effect to the overall financial performance of the organisation. From the descriptive
result we have noted that the debt ratio as per the study of the industry started at a

42
high of 88% then it reduced to reach a low of 46%, and from our regression analysis
we have seen that debt ratio has a positive relationship with the financial performance.
Several studies have been conducted on debt financing that indicate either positive or
negative relationship on financial performance of the firm.
Abor (2007) examined the effect of capital structure on the financial performance of
firms, his model used a regression model. The results of his study indicate a positive
association between total debt ratio and financial performance. Hence from our study
it can be concluded that over the business period less debt is preferred compared to
equity. The Asset turnover as per the study of the industry started at a high of 91%
then it reduced to reach a low of 47%, and from our regression analysis we have seen
that asset turnover ratio has a negative relationship with the financial performance.
The Asset tangibility as per the study of the industry started at a low of 46% then it
increased to reach a high of 53%, and from our regression analysis we have seen that
asset tangibility has a negative relationship with the financial performance. It was
observed that the model was not a very strong predictor of financial performance
since it can only explain 17.8% of the variables that causes changes in the financial
performance of SMEs. Further from the analysis it was also found that there is no
significant effect of the debt ratio, asset turnover and asset tangibility to financial
performance of SMEs in Thika.

43
CHAPTER FIVE
SUMMARY, CONCLUSION AND RECOMMENDATIONS
5.1 Introduction
This chapter presents a summary of the findings, conclusions and recommendations.
The summary is presented on the effects of capital structure on the financial
performance of SMEs in Thika. The chapter also has a section which makes
suggestions for further study.
5.2. Summary of the Findings
The performance of SMEs in Thika is affected by different factors as reviewed in
this study. The Debt ratio as per the study of the industry started at a high of 88%
then it reduced to reach a low of 46%, and from our regression analysis we have seen
that debt ratio has a positive relationship with the financial performance. The Asset
turnover as per the study of the industry started at a high of 91% then it reduced to
reach a low of 47%, and from our regression analysis we have seen that asset turnover
ratio has a negative relationship with the financial performance.
The Asset tangibility as per the study of the industry started at a low of 46% then it
increased to reach a high of 53%, and from our regression analysis we have seen that
asset tangibility has a negative relationship with the financial performance. It was
observed that the model was not a very strong predictor of financial performance
since it can only explain 17.8% of the variables that causes changes in the financial
performance of SMEs. Further from the analysis it was also found that there is no
significant effect of the debt ratio, asset turnover and asset tangibility to financial

44
performance of SMEs in Thika. This can be shown by the significant level which is
0.966 which is more than 0.05.
5.3. Conclusions
It can therefore be concluded that capital structure do have effects to financial
performance of SMEs although the effect is very minimal and hence negligible.
Therefore it can also be concluded that there are other major factors which affect the
performance of SMEs in Thika more than its capital structure. These other factors
may have major effects on financial performance of SMEs in Thika hence they should
be included in the other studies relating to financial performance of SMEs in Thika.
From the empirical analysis, it was noted that there were significant relationship
between debt and financial performance of SMEs. Capital structure is an important
determinant of firm’s financial performance our study has revealed that debt ratio,
asset turnover and asset tangibility cannot significantly explain the extent of the
variability of the financial performance of SMEs in Thika.
From the empirical study the expectations that there is a positive and significant effect
between the debt ratio and ROA as a measure of financial performance of SMEs in
Thika has proved negligible. We have noted that although the result were not
statistically significant, there was a positive relationship of 0.68 between the financial
performance and debt ratio meaning that as the debt ratio increases by one unit the
return on Asset will tend to increase by 0.068 if all other factors are kept constant.
Therefore our theoretical study of irrelevancy theory still holds.
In conclusion, the empirical evidence from this study suggests that the debt ratio has
minimal and positive significant effect on firm financial performance. Asset
tangibility and asset turnover has both minimal and negative effects on firms financial
45
performance. Amongst these theories, the major contending are Static Trade-off theory
and Pecking Order theory. Static Trade-off theory argues the existence of an optimum
capital structure which the management of a firm will choose. Oppose to Static Trade-off
theory, Pecking Order theory argues that a firm does not observe an optimum capital
structure rather it would only solicit debt when there is no internal generate funds
(retained earnings) partly siding with Pecking Order theory.
5.4. Recommendations
In this study, it can be observed that the capital structure have very minimal effect on
the performance of SMEs in Thika. Therefore we recommend that, Performance
standards should be established and identifying weaknesses of investment may be best
one to improve the firm’s financial performance, because it indicates the area which
decision should be taken.
Identifying weaknesses of investment may be best one to improve the firm’s financial
performance, because it indicates the area which decision should be taken and
motivating the investors to help to achieve the high level of firm’s financial
performance. The management of SMEs should take into account the industry norms
when developing their financial policies. Capital structure of comparable companies
in the industry should be considered because it might reflect the unique risks inherent
in that industry.
The study also recommends that even though firms cannot possibly avoid use of loans
in its capital structure, the firm should try to operate using little amounts of loans
compared to equity to avoid higher finance costs which could otherwise be used to
invest in other profitable ventures for the firm. Regarding debt it’s recommended that
even if increased liabilities enlarge repayment obligations restrain free cash flow, a
46
right balance between debt and assets should established to avoid bankruptcies that
can be caused by over-investment since over-investment reduces cash flow.
From the descriptive analysis, we noted that the rate of borrowing reduced over time,
the reduction could be caused by the challenges the SMEs faces during the processing
of requesting for such loan. Hence we recommend that capacity building need to be
done and SMEs educated on how to reduce such challenge and access funds whenever
there is a need. SMEs should also prioritise the use trade credit before they decide to
use loan. Trade credits improve the financial performance as compared to loans.
5.5. Limitations of the Study
There were various limitations which related to this study and which need to be
mentioned to ensure that a researcher puts them into consideration when planning for
a research project. Some of these limitations include. The study used only three
measures of capital structure and this does not seem to have much effects on the
financial performance and hence there is need to carry out the study with other
different factors both qualitative and quantitative in order to be able establish which
are the major factors that affect the financial performance of SMEs in Thika.
SMEs are not obliged to disclose their financial information. Those SMEs that
disclose their financial statement may decide to disclose partially and incomplete
financial records, this could lead to understating of the revenues, overstate the
expenditure and also they may not disclosing all the bank accounts. The study
therefore could not independently verify the information given by management but
only relied on financial reports that were not audited hence we could not guarantee for
the accuracy of the figures used in the research.

47
The research was done over a period of 5 years, and over that period of five years
there has been tremendous change within our economy. In 2009 to 2011 Kenya was
still experiencing high inflation rate compared to 2012 and 2013. Hence the analysis
done in these two segments may lead to contradicting sequence flow of information as
the factors that influenced the decision were different. Also we could not differentiate
the SMEs in term of their stages of operation, as at different stages business differ in
terms of decision and challenges they face, hence combining them could hamper the
accuracy of result derived.
5.6. Suggestions for Further Research
This study advocates that further studies can be done in this areas such studies may
include identifying various other factors which affect the performance of SMEs in
Thika. The study may be carried using various other measures of financial
performance such as return on equity instead of return on asset. The study may also
use different variables from those which have been used in this study. Another area of
study which can be considered is researching on the impact of other factors such as
marketing. This may enable various stakeholders to understand if there are other
major factors which affect the performance in major way with exception of capital
structure.
Only secondary data were collected and used in this study analysis, hence further
researchers should be done based on primary data collection method. Capital structure
is a puzzling concept especially so in emerging markets like SMEs. Further study can
be conducted by adding sales growth and business risk as independent variables. To
clarify the results of our study more variables for performance measurement may be
helpful. Data of long time series may also be used for reliability of results. Future

48
research can be conducted by comparing the capital structure and firm performance of
small and large firms.

49
REFERENCES
Abor, N. (2007). Determinants of the capital structures of European SMEs. Journal of
Business Finance and Accounting, 31(5-6), 711-728.
Ahmad, F., Nasir, R., Ali, M., & Ullah, W. (2011). Extension of determinants of
capital structure: Evidence from Pakistani non-financial firms. African Journal
of Business Management, 5(28), 11375-11385.
Ang, J. (1992). On the Theory of Finance for Privately Held Firms, Journal of Small
Business Finance, 1 3,185–203.
Baker, R. G., & Zingales, L. (1994). What do we know about capital structure. Some
evidence from international data. Journal of Finance 90(5), 21-60.
Bebczuk, R. N. (2003). Asymmetric Information in Financial Markets Introduction and
Applications. The University Press, Cambridge.
Berger, A., Patti, E., & Bonaccorsi, D. (2002). Capital Structure and Firm
Performance: A new approach to testing agency theory and an application to
the Banking Industry. Retrieved from www.federalreserve. Gov/pubs/feds/2002
/200254 /200254pap.pdf.
Berle, A., A. & Means, G., C. (1932). The Modern Corporation and Private Property.
New York, Macmillan.
Boodhoo, R. (2009). Capital structure and ownership structure: a review of literature.
The Journal of On line Education, 56,(2) 1-8.
Booth, L. (2001). Capital structures in developing countries. Journal of Finance;
50
56(1):87 – 130.
Booth, L, Aivazian, V, Demirguc-Kunt, A., & Maksimovic, V. (2001). Capital
structures in developing countries. Journal of Finance; 56(1):87 – 130.
Bradley, M., Javrell, G., & Kim, E.H. (1984). On the Existence of an Optimal Capital
Structure: Theory and Evidence. Journal of Finance, 39, 857-878.
Bryman, S. (1998). Capital structure and financing of SMEs: Australian evidence.
Journal of Accounting and Finance, (43), 123–147.
Cassar, G., Holmes, S. (2003). Capital structure and financing of SMEs: Australian
evidence. Journal of Accounting and Finance, 43. 2, 23–47.
Chode, P. (2003). Determinants of capital structure of public sector enterprises in
Kenya. Unpublished MBA research project, University of Nairobi.
Damodaran, J,. S. (2000). Agency Costs and Ownership Structure, The Journal of
Finance, 55 (1), 81-106.
Danbolt, J., & Bevan, A. (2000). Capital Structure and its Determinants in the United
Kingdom: A Decomposition Analysis. SSRN Working Papers Series,
Department of Accounting and Finance, University of Glasgow.
De Angelo, H., & Masulis, R. (1980). Optimal Capital Structure under corporate and
personal taxation. Journal of Financial Economics, 8, 3-29.
Drobetic, M., & Fix, M. R. (2003). The structure and pricing of corporate debt
covenants. Some evidence from Switzerland. Working Paper, University of
Basel.

51
Drobetz, W., & Fix, R. (2003). What are the determinants of the capital structure?
Some evidence from Switzerland. Working Paper, University of Basel.
Dybvig, P. H., & Wang,Y. (2002). Debt and Equity. Journal of Finance 39(18), 36 – 56
Elliot, B. & Chber, J. (2002). Financial Accounting and Reporting. 12th Edition,
London, Prentice Hall) Financial Times. E- Views 4.1 (2002): User’s Guide.
Fama, E. F., & French, K., R. (1998). Capital Asset Pricing Model; Journal of Finance
25(18), 25 – 26
Garikai, B. W. (2011). Exportation Challenges by Small and Medium Enterprises and
Possible Exportation Strategies. Journal of Finance 95(18), 105 – 126
Gujarati, D. J. (2007). Large–Sample Evidence on the Debt Covenant Hypothesis.
Journal of Accounting Research, 40(4), 1091-1123.
Gunasekaran, A. (2010). Small firm bankruptcy. Journal of Small Business
Management (44)4, 493–512.
Hammes, J. K. (2003). Do taxes affect corporate financing decisions? The Journal of
Finance, 45(5), 1471-1493.
Harris, M., & Raviv, A. (1991). The theory of the capital structure. Journal of Finance,
46, 297- 355.
Honohan, P., & Beck, T. (2007). Making Finance Work for Africa, World Bank,
Washington, DC, USA.
Hutchinson, R. W. (1995). The capital structure and investment decisions of the small
owrner managed firm: some exploratory issues. Small Business Economics,

52
7(3), 231-239.
Jensen, M. & Ruback, R. (1983). The market for corporate control: the scientific
evidence. Journal of Financial Economics, 11, 5-50.
Jensen, M. (1986). Agency costs of free cash flow, corporate finance and takeovers.
American Economic Review, 76, 323- 329.
Jensen, M. (1988). Takeovers: their causes and consequences. Journal of Economic
Perspectives, 2, 21- 48.
Jensen, M. C., & Meckling, W.H. (1979). Rights and Production Functions: An
Application to Labor-Managed Firms and Codetermination Journal of Business
52, 469-506.
Kehinde, W. (2012). Capital structure and finance performance: evidence from Lagos.
The Business & Finance Journal, 7(4), 56-81.
Kenya National of bureau statistics (KNBS), (2013).
Kinyua, J. M. (2005). Determinants of Capital Structure of Small and Medium-Sized
Enterprises in Kenya. Unpublished MBA research project, University of
Nairobi.
Kiogora, E. M. (2000). A study of capital structure of companies quoted at the Nairobi
stock exchange an empirical Study. (Unpublished MBA project.) University of
Nairobi, Nairobi, Kenya.
Krejcie, R. V., & Morgan, D. (1970). Determining Sample Size for Research Activities
The Business & Finance Journal, 2(3)21-56.
53
Kuria, R. W. (2010). The Determinants of Capital Structure of Companies Quoted in
the Nairobi Stock Exchange. Unpublished MBA Research Project, University of
Nairobi, Kenya.
Macan, B. C., & Lucey, B. (2011). An empirical investigation of the financial growth
life cycle. Journal of Small Business and Enterprise Development, 18(4),715-
731.
Majumdar, P., & Chhibber, O. (1999). The choice between equity and debt: An
empirical study. Journal of Business Finance and Accounting, 37(1), 121-144.
Matibe, M. (2005). Relationship between ownership structure and capital structure
for companies quoted in the Nairobi securities exchange. Unpublished MBA
research project, University of Nairobi.
Mazur, K. (2007). The Determinants of Capital Structure Choice: Evidence from
polish companies. Journal of International Economics, 13, 495-514.
Mephokee, C. (2004). The Thai SMEs Development Policies: Country Report, Faculty
of Economics, Thammasat University, Bangkok.
Mesquita, J. R., & Lara, G., G. (2003). The effect of business risk on corporate capital
structure: Theory and evidence. The Journal of Finance (46), 1693-1715.
Metcalf, R. W., & Titard, P. L. (1976). Principles of Accounting, W. B. Saunders,
(Philadelphia)142-157.
Modigliani, F., & Miller, M., H. (1958). The cost of capital, corporation finance and the
theory of investment. Am Econ Rev; 48(3):261– 97.

54
Modigliani, F., & Miller, M. H. (1963). Corporate income taxes and the cost of capital:
A correction. 53(3), 433-443.
Mugenda, & Mugenda. (2003). Quantitaive and qualitative Approaches, African
Centre for technology Studies, Nairobi Kenya.
Mustafa, M., S, & Osama, S. H. (2006). Capital Structure on the Performance of the
Public Jordanian firms listed in Amman stock market. The Business &
Finance Journal, 5(28), 58-89
Mwangi, P. (2010). Capital structure on firms listed at the Nairobi Stock Exchange.
Unpublished MBA research project, University of Nairobi.
Myers, S. (1984). Corporate Financing and Investment Decisions when firms have
information investors do not have. Journal of Financial Economics, 13, 187-
221.
Myers, S., & Majilu, N. F. (1984). .Corporate Financing and Investment Decisions
when firms have information that investors do not have, Journal of financial
economies, 13(4). 187-221.
Nerlove, L. V. (1968). The capital structure and investment decisions of the small
owner managed firm: some exploratory issues. Small Business Economics, 5(9),
21-59.
Ngugi, K. P. (2012). Challenges Hindering Sustainability of Small and Medium
Enterprises (SMEs) After Exit of the Founder in Kenya (Unpublished
Dissertation, Jomo Kenyatta University of Agriculture and Technology,
Kenya).

55
Niu, X. (2008). Theoretical and Practical Review of Capital Structure and its
Determinants, International Journal of Business and Management.
Osuji, C., C. & Odita, A. (2010). Capital structure and finance performance of
Nigerian firm: evidence from Lagos. The Business & Finance Journal, 1(4),
40-61.
Otieno, W. C. (1986). Capital and Ownership Structure: Financial Management, 5–16
Petersen, L., & Rajan, R. G. (1995). What do we know about capital structure? Some
evidence from international data. Journal of Finance 50(5), 1421-1460.
Pettit, R., & Singer, R. (1985). Small Business Finance: A Research Agenda, Financial
Management, 14,3,47–60.
Pinegar, M. & Wilbricht, L. (1989). What managers think of capital structure theory: a
survey. Financial Management, winter, 82 – 91.
Rajan, R., & Zingales, L. (1995). What do we know about capital structure?–Some
evidence from International Data. Journal of Finance, 50, 1421-1460.
Rao, N.,V., & Syed, L.,A., M. (2007). Capital structure and financial performance:
evidence from Oman. Indian Journal of Economics and Business, 1- 23.
Roden, A., & Lewellen, J. (1995). Corporate financial structure in developing countries:
World Bank-International Finance Corporation.
Roshanak, H. (2013). The study of the Impact of Capital Structure Determinants on
Small and Medium size Enterprise Leverage in Iran. Unpublished MBA
Thesis, Soderton University.

56
Taub, B. W. (1975). The capital structure and investment decisions of the small owner
managed firm: some exploratory issues. Small Business Economics, 9(3), 31-39.
Thomas, W. (1992). Supporting job creation: Small business and informal sector
development, in R. Schire (Ed), Wealth or poverty? Critical choices for South
Africa. Cape Town: Oxford University Press
Wald, J., K. (1999). How firm characteristic affect capital structure: an international
comparison. Jounal of Finance Res; 22(2):161– 88.
Wambugu, P., M. (2013). effects of working capital management practices on
profitability of small and medium enterprises in Nairobi county, Kenya.
Unpublished MBA research project, Kenyatta University.
Waweru, M., G. (2007). Addressing the different tax policy and tax administrative
challenges of micro, small and medium businesses, A presentation at the
International Tax Dialogue Global Conference From 17th – 19th October 2007
At Buenos Aires, Argentina.
Zeitun, R. & Tian, G., G. (2007). Capital structure and corporate performance: evidence
from Jordan. Australasian Accounting, Business & Finance Journal, 1(4), 40-
61.

57
APPENDICES
Appendix I: Debt Ratio
2013 2012 2011 2010 2009
Name of the
SME Total Assets Total Debt
Debt
Ratio Total Assets Total Debt
Debt
Ratio Total Assets Total Debt
Debt
Ratio Total Assets Total Debt
Debt
Ratio Total Assets Total Debt
Debt
Ratio
1 Intel Fire Group
Of Companies 245,801 432,039 1.76 232,655 370,132 1.59 239,228 359,865 1.50 225,369 287,546 1.28 235,763 362,396 1.54
2 Saana Shoes L 82,475,652 82,475,652 1.00 57,557,855 40,099,084 0.70 29,927,789 22,459,566 0.75 17,945,951 13,269,131 0.74 27,639,835 28,139,189 1.02
3 Thika Cloth
Mills Ltd 36,091,446 8,764,551 0.24 29,009,843 7,008,401 0.24 27,191,540 2,566,524 0.09 27,426,109 2,083,654 0.08 28,227,937 12,632,310 0.45
4 Imara
Enterprises Ltd 11,080,986 4,315,266 0.39 14,280,510 2,853,067 0.20 12,680,748 3,584,167 0.28 11,586,954 2,869,541 0.25 12,407,300 3,405,510 0.27
5 Ruiru Hardware
Store Ltd 22,788,440 15,302,985 0.67 19,545,260 12,353,117 0.63 18,555,555 12,072,170 0.65 15,218,077 9,733,688 0.64 12,218,198 8,576,777 0.70
6 Uhuru Flowers
Limited 1,169,846,108 123,210,830 0.11 735,694,081 174,139,777 0.24 894,561,251 184,326,925 0.21 330,837,064 168,223,092 0.51 285,455,964 195,279,628 0.68
7 Waridi
Garments 97,669,376 - - 125,276,216 21,592,310 0.17 319,132,876 209,214,260 0.66 752,474,086 460,679,438 0.61 416,294,165 493,120,806 1.18
8 Savage
Holdings ltd 1,133,072 385,813 0.34 1,133,122 331,303 0.29 1,133,131 276,793 0.24 1,133,131 222,283 0.20 1,133,154 167,773 0.15
9 Alliance One
Tobacco Ltd 35,538,505 15,121,985 0.43 33,702,437 12,435,379 0.37 23,669,793 8,177,847 0.35 27,921,767 12,957,409 0.46 28,551,117 19,229,373 0.67
10 Alpha Knits Ltd 13,848,498 14,909,100 1.08 14,770,736 14,141,160 0.96 10,896,058 10,401,914 0.95 5,858,907 5,024,633 0.86 5,919,453 5,856,725 0.99
11 Macushla House
Limited 15,999,848 10,807,654 0.68 17,268,425 13,391,767 0.78 17,518,858 14,787,184 0.84 18,172,340 16,409,310 0.90 18,929,670 17,984,369 0.95
12 Flame Tree
Security Ltd 4,569,135 397,849 0.09 4,143,858 594,969 0.14 3,153,838 741,656 0.24 2,351,911 628,582 0.27 1,738,431 570,760 0.33
13 summit guest
house 2,072,620 141,022 0.07 2,140,593 75,000 0.04 2,173,634 76,000 0.03 4,310,924 2,316,171 0.54 2,465,101 1,890,843 0.77
14 Centrofood
Industries Ltd 245,025,477 163,011,956 0.67 239,712,929 166,315,698 0.69 206,177,439 150,891,648 0.73 153,563,703 101,258,673 0.66 145,977,392 119,207,507 0.82
15 Dawaline
Pharmaceuticals 11,248,902 13,808,399 1.23 57,503,333 58,220,307 1.01 54,289,323 58,230,430 1.07 49,150,109 46,337,071 0.94 56,302,622 49,241,026 0.87
16 Kenya Tanning
Extract Co Ltd 2,889,131 409,319 0.14 2,977,762 438,794 0.15 1,534,860 1,952,096 1.27 1,003,049 1,079,097 1.08 857,498 904,553 1.05
17 Ready Timber
Merchants 3,524,539 2,899,475 0.82 3,075,304 2,573,612 0.84 2,503,653 2,843,097 1.14 2,323,789 2,326,426 1.00 2,856,821 2,660,652 0.93
18 Salama Clothing
Manufacturers 22,372,152 3,955,609 0.18 21,903,325 3,350,301 0.15 21,440,125 2,691,173 0.13 16,688,369 3,202,784 0.19 15,234,038 3,617,687 0.24
19 United Textile 152,749,105 224,098,613 1.47 86,052,020 205,254,418 2.39 131,214,371 207,268,148 1.58 290,632,375 223,089,640 0.77 243,312,798 234,465,890 0.96
20 Central
Computers 348,651,695 178,416,348 0.51 236,219,762 145,551,765 0.62 236,219,762 145,551,765 0.62 92,652,234 26,990,505 0.29 94,539,323 79,113,804 0.84
21 Popular
Industries Ltd 193,931,997 193,931,997 1.00 200,683,546 26,387,216 0.13 195,069,986 100,925,192 0.52 203,629,664 27,962,254 0.14 182,034,738 155,419,303 0.85
22 Colorchase
Limited 70,217,445 19,594,405 0.28 77,819,421 29,525,528 0.38 79,694,203 43,996,526 0.55 85,622,750 62,083,820 0.73 85,117,197 64,782,351 0.76
23 Marks Photo
Studio 67,553,855 46,261,331 0.68 65,300,134 65,300,134 1.00 74,917,615 74,917,615 1.00 72,835,053 25,054,759 0.34 57,162,618 19,772,816 0.35

58
2013 2012 2011 2010 2009
Name of the
SME Total Assets Total Debt
Debt
Ratio Total Assets Total Debt
Debt
Ratio Total Assets Total Debt
Debt
Ratio Total Assets Total Debt
Debt
Ratio Total Assets Total Debt
Debt
Ratio
24 Blue Post Hotel 18,835,390 46,395,947 2.46 18,835,390 46,395,947 2.46 19,784,154 47,133,285 2.38 18,037,095 45,109,309 2.50 18,684,921 46,945,247 2.51
25 Edkan
Enterprises 61,088,417 35,213,577 0.58 61,725,524 36,640,843 0.59 62,742,707 38,614,223 0.62 61,852,216 36,822,881 0.60 59,865,234 35,698,789 0.60
26 Prisma Electric
Limited 34,359,831 42,730,467 1.24 39,087,678 45,963,341 1.18 36,771,230 44,661,558 1.21 36,739,580 44,451,789 1.21 25,897,456 36,587,214 1.41
27 Crystal Valuers
Ltd 121,419,937 127,245,389 1.05 87,491,712 119,632,581 1.37 70,069,755 79,709,859 1.14 38,555,169 41,899,746 1.09 32,812,202 30,061,721 0.92
28 Mama Millers
Limited 13,241,770 13,460,991 1.02 11,980,473 8,938,119 0.75 11,846,459 7,031,534 0.59 12,356,234 9,810,215 0.79 11,156,234 8,710,215 0.78
29 Milkon & Sons
partners acc 36,091,446 8,764,551 0.24 29,009,843 7,008,401 0.24 27,191,540 2,566,524 0.09 27,426,109 2,083,654 0.08 28,227,937 12,632,310 0.45
30 Bempee Ltd 18,835,390 46,395,947 2.46 17,589,658 45,289,741 2.57 19,784,154 47,133,285 2.38 18,037,095 45,109,309 2.50 18,684,921 46,945,247 2.51
31 Tilkones
Limited 187,258,741 193,931,997 1.04 200,683,546 26,387,216 0.13 195,069,986 100,925,192 0.52 203,629,664 27,962,254 0.14 182,034,738 155,419,303 0.85
32 Oliver Clearing
Service Limited 152,749,105 224,098,613 1.47 86,052,020 205,254,418 2.39 131,214,371 207,268,148 1.58 290,632,375 223,089,640 0.77 243,312,798 234,465,890 0.96
33 Wajibu Mobil
Service Station 4,569,135 397,849 0.09 4,143,858 594,969 0.14 3,153,838 741,656 0.24 2,351,911 628,582 0.27 1,738,431 570,760 0.33
34 Messanine Oil 11,080,986 4,315,266 0.39 14,280,510 2,853,067 0.20 12,680,748 3,584,167 0.28 11,880,867 3,949,716 0.33 10,258,965 2,256,874 0.22
35 Thika Motor
Dealers (K) Ltd 15,999,848 10,807,654 0.68 17,268,425 13,391,767 0.78 17,518,858 14,787,184 0.84 18,172,340 16,409,310 0.90 18,929,670 17,984,369 0.95
36 Wishwaste
Limited 1,169,846,108 123,210,830 0.11 735,694,081 174,139,777 0.24 894,561,251 184,326,925 0.21 330,837,064 168,223,092 0.51 285,455,964 195,279,628 0.68
37 Nelka Agencies 82,475,652 82,475,652 1.00 57,557,855 40,099,084 0.70 29,927,789 22,459,566 0.75 17,945,951 13,269,131 0.74 27,639,835 28,139,189 1.02
38 Century Oil
Trading Co Ltd 13,848,498 14,909,100 1.08 14,770,736 14,141,160 0.96 10,896,058 10,401,914 0.95 5,858,907 5,024,633 0.86 5,919,453 5,856,725 0.99
39 Samerchant
Construction 4,569,135 397,849 0.09 4,143,858 594,969 0.14 3,153,838 741,656 0.24 2,351,911 628,582 0.27 1,738,431 570,760 0.33
40 The Coconut
Gril 13,848,498 14,909,100 1.08 14,770,736 14,141,160 0.96 10,896,058 10,401,914 0.95 5,858,907 5,024,633 0.86 5,919,453 5,856,725 0.99
Totals 4,571,641,672 2,112,312,977 0.46 3,461,089,029 1,803,769,798 0.52 3,921,158,433 2,080,801,149 0.53 3,286,087,077 1,903,585,983 0.58 2,702,887,775 2,380,383,011 0.88

59
Appendix II: Asset Turnover
2013 2012 2011 2010 2009
Name of the
SME Total Sales Total Assets
Asset
turno
ver Total Sales Total Assets
Asset
turno
ver Total Sales Total Assets
Asset
turno
ver Total Sales Total Assets
Asset
turno
ver Total Sales Total Assets
Asset
turn
over
1
INTEL FIRE
GROUP OF
COMPANIES 289,219 245,801 1.18 238,899 232,655 1.03 264,059 239,228 1.10 158,659 225,369 0.70 237,709 235,763 1.01
2 Saana Shoes
Ltd 135,693,840 82,475,652 1.65 101,241,062 57,557,855 1.76 93,881,332 29,927,789 3.14 72,247,042 17,945,951 4.03 56,119,312 27,639,835 2.03
3 Thika Cloth
Mills 19,634,375 36,091,446 0.54 3,693,213 29,009,843 0.13 1,050,000 27,191,540 0.04 1,320,500 27,426,109 0.05 4,260,000 28,227,937 0.15
4 Imara
Enterprises 50,360,643 11,080,986 4.54 44,783,651 14,280,510 3.14 47,572,147 12,680,748 3.75 40,589,625 11,586,954 3.50 45,826,517 12,407,300 3.69
5
Ruiru
Hardware
Store Ltd 33,562,920 22,788,440 1.47 31,498,965 19,545,260 1.61 24,414,134 18,555,555 1.32 20,778,110 15,218,077 1.37 19,339,796 12,218,198 1.58
6 Uhuru Flowers
L 302,247,545 1,169,846,108 0.26 235,769,097 735,694,081 0.32 177,297,273 894,561,251 0.20 132,579,960 330,837,064 0.40 92,169,477 285,455,964 0.32
7 Waridi
Garments 50,911 97,669,376 0.00 1,149,675 125,276,216 0.01 884,756,110 319,132,876 2.77 671,361,871 752,474,086 0.89 385,747,506 416,294,165 0.93
8 Savage
Holdings L 761,819 1,133,072 0.67 816,338 1,133,122 0.72 870,858 1,133,131 0.77 925,381 1,133,131 0.82 960,393 1,133,154 0.85
9 Alliance One
Tobacco Ltd 106,337,103 35,538,505 2.99 107,207,167 33,702,437 3.18 80,960,144 23,669,793 3.42 82,219,567 27,921,767 2.94 77,965,691 28,551,117 2.73
10 Alpha Knits
Ltd 10,938,516 13,848,498 0.79 9,678,453 14,770,736 0.66 15,879,210 10,896,058 1.46 42,641,511 5,858,907 7.28 39,861,790 5,919,453 6.73
11 Macushla
House L 21,000,667 15,999,848 1.31 22,483,231 17,268,425 1.30 20,096,284 17,518,858 1.15 18,012,262 18,172,340 0.99 13,646,379 18,929,670 0.72
12 Flame Tree
Security Ltd 926,613 4,569,135 0.20 1,125,455 4,143,858 0.27 819,196 3,153,838 0.26 722,262 2,351,911 0.31 818,801 1,738,431 0.47
13 summit guest
house 3,240,000 2,072,620 1.56 3,482,000 2,140,593 1.63 2,891,250 2,173,634 1.33 2,567,199 4,310,924 0.60 3,030,512 2,465,101 1.23
14 Centrofood
Industries Ltd 137,101,137 245,025,477 0.56 126,056,154 239,712,929 0.53 124,635,822 206,177,439 0.60 108,166,996 153,563,703 0.70 91,611,329 145,977,392 0.63
15
Dawaline
Pharmaceticals
Ltd 12,190,667 11,248,902 1.08 36,877,415 57,503,333 0.64 59,830,303 54,289,323 1.10 62,748,105 49,150,109 1.28 76,943,751 56,302,622 1.37
16
Kenya
Tanning
Extract Ltd 6,729,077 2,889,131 2.33 5,149,870 2,977,762 1.73 165,726 1,534,860 0.11 - 1,003,049 - - 857,498 -
17 Ready Timber
Merchants 2,610,300 3,524,539 0.74 2,885,483 3,075,304 0.94 4,665,697 2,503,653 1.86 4,516,770 2,323,789 1.94 3,669,562 2,856,821 1.28
18
Salama
Clothing
Manufacture 34,931,233 22,372,152 1.56 29,638,685 21,903,325 1.35 26,111,417 21,440,125 1.22 21,628,474 16,688,369 1.30 19,919,965 15,234,038 1.31
19 United Textile
Industry Ltd, 89,754,720 152,749,105 0.59 25,458,504 86,052,020 0.30 42,273,246 131,214,371 0.32 167,405,334 290,632,375 0.58 327,074,736 243,312,798 1.34
20 Central
Computers 256,280 348,651,695 0.00 4,907,504 236,219,762 0.02 4,907,504 236,219,762 0.02 1,417,957 92,652,234 0.02 2,308,570 94,539,323 0.02
21 Popular
Industries 9,623,171 193,931,997 0.05 11,240,437 200,683,546 0.06 52,276,154 195,069,986 0.27 24,939,983 203,629,664 0.12 163,301,027 182,034,738 0.90
22 Colorchase
Limit 93,201,059 70,217,445 1.33 143,572,987 77,819,421 1.84 140,453,709 79,694,203 1.76 163,374,020 85,622,750 1.91 161,666,769 85,117,197 1.90

60
2013 2012 2011 2010 2009
Name of the
SME Total Sales Total Assets
Asset
turno
ver Total Sales Total Assets
Asset
turno
ver Total Sales Total Assets
Asset
turno
ver Total Sales Total Assets
Asset
turno
ver Total Sales Total Assets
Asset
turn
over
23 Marks Photo
Studio 91,911,031 67,553,855 1.36 166,048,487 65,300,134 2.54 83,344,952 74,917,615 1.11 66,697,750 72,835,053 0.92 51,552,936 57,162,618 0.90
24 Blue Post
Hotel 21,893,650 18,835,390 1.16 21,893,650 18,835,390 1.16 21,203,495 19,784,154 1.07 21,666,422 18,037,095 1.20 22,811,032 18,684,921 1.22
25 Edkan
Enterprises 5,895,000 61,088,417 0.10 5,760,000 61,725,524 0.09 5,255,000 62,742,707 0.08 5,636,667 61,852,216 0.09 4,562,365 59,865,234 0.08
26
Prisma
Electric
Limited 39,108,455 34,359,831 1.14 42,128,911 39,087,678 1.08 32,298,298 36,771,230 0.88 37,845,221 36,739,580 1.03 37,845,221 25,897,456 1.46
27 Crystal
Valuers Ltd 176,905,186 121,419,937 1.46 58,484,090 87,491,712 0.67 92,424,218 70,069,755 1.32 71,326,223 38,555,169 1.85 62,981,371 32,812,202 1.92
28 Mama Millers
Limited 47,095,877 13,241,770 3.56 53,160,419 11,980,473 4.44 53,056,364 11,846,459 4.48 51,104,220 12,356,234 4.14 52,104,400 11,156,234 4.67
29
Milkon &
Sons partners
account 19,634,375 36,091,446 0.54 3,693,213 29,009,843 0.13 1,050,000 27,191,540 0.04 1,320,500 27,426,109 0.05 4,260,000 28,227,937 0.15
30 Bempee Ltd 21,893,650 18,835,390 1.16 20,856,589 17,589,658 1.19 21,203,495 19,784,154 1.07 21,666,422 18,037,095 1.20 22,811,032 18,684,921 1.22
31 Tilkones
Limited 9,623,171 187,258,741 0.05 11,240,437 200,683,546 0.06 52,276,154 195,069,986 0.27 24,939,983 203,629,664 0.12 16,330,102 182,034,738 0.09
32
Oliver
Clearing
Service
Limited 89,754,720 152,749,105 0.59 25,458,504 86,052,020 0.30 42,273,246 131,214,371 0.32 167,405,334 290,632,375 0.58 327,074,736 243,312,798 1.34
33
Wajibu Mobil
Service
Station 926,613 4,569,135 0.20 1,125,455 4,143,858 0.27 819,196 3,153,838 0.26 722,262 2,351,911 0.31 818,801 1,738,431 0.47
34 Messanine Oil 50,360,643 11,080,986 4.54 44,783,651 14,280,510 3.14 47,572,147 12,680,748 3.75 48,966,395 11,880,867 4.12 36,897,523 10,258,965 3.60
35
Thika Motor
Dealers (K)
Ltd 21,000,667 15,999,848 1.31 22,483,231 17,268,425 1.30 20,096,284 17,518,858 1.15 18,012,262 18,172,340 0.99 13,646,379 18,929,670 0.72
36 Wishwaste
Limited 302,247,545 1,169,846,108 0.26 235,769,097 735,694,081 0.32 177,297,273 894,561,251 0.20 132,579,960 330,837,064 0.40 92,169,477 285,455,964 0.32
37 Nelka
Agencies 135,693,840 82,475,652 1.65 101,241,062 57,557,855 1.76 93,881,332 29,927,789 3.14 72,247,042 17,945,951 4.03 56,119,312 27,639,835 2.03
38
Century Oil
Trading Co
Ltd 10,938,516 13,848,498 0.79 9,678,453 14,770,736 0.66 15,879,210 10,896,058 1.46 42,641,511 5,858,907 7.28 39,861,790 5,919,453 6.73
39 Samerchant
Construction 926,613 4,569,135 0.20 1,125,455 4,143,858 0.27 819,196 3,153,838 0.26 722,262 2,351,911 0.31 818,801 1,738,431 0.47
40 The Coconut
Gril 10,938,516 13,848,498 0.79 9,678,453 14,770,736 0.66 15,879,210 10,896,058 1.46 42,641,511 5,858,907 7.28 39,861,790 5,919,453 6.73
Totals 2,128,189,883 4,571,641,672 0.47 1,783,563,401 3,461,089,029 0.52 2,582,700,644 3,921,158,433 0.66 2,468,463,535 3,286,087,077 0.75 2,469,006,658 2,702,887,775 0.91

61
Appendix III: Asset Tangibility
2013 2012 2011 2010 2009
Name of the
SME
Net Tangible
Assets Total Assets
Ass
tang
Net Tangible
Assets Total Assets
Ass
tang
Net Tangible
Assets Total Assets
Asse
tang
Net Tangible
Assets Total Assets
Asse
tang
Net Tangible
Assets Total Assets
Asse
tang
1
INTEL FIRE GROUP OF COMPANIES 69,849 245,801 0.28 14,972 232,655 0.06 13,287 239,228 0.06 12,458 225,369 0.06 27,642 235,763 0.12
2 Saana Shoes Ltd 13,754,389 82,475,652 0.17 3,304,199 57,557,855 0.06 4,976,614 29,927,789 0.17 3,346,974 17,945,951 0.19 7,395,890 27,639,835 0.27
3 Thika Cloth Mills L 7,815,312 36,091,446 0.22 7,946,073 29,009,843 0.27 8,076,834 27,191,540 0.30 8,207,595 27,426,109 0.30 8,338,356 28,227,937 0.30
4 Imara Enterprises 68,515 11,080,986 0.01 78,303 14,280,510 0.01 73,409 12,680,748 0.01 65,214 11,586,954 0.01 71,360 12,407,300 0.01
5
Ruiru Hardware Store Ltd 4,345,793 22,788,440 0.19 4,186,354 19,545,260 0.21 4,057,626 18,555,555 0.22 3,896,845 15,218,077 0.26 3,009,092 12,218,198 0.25
6 Uhuru Flowers L 870,735,908 1,169,846,108 0.74 523,997,934 735,694,081 0.71 408,912,699 894,561,251 0.46 152,836,363 330,837,064 0.46 146,506,850 285,455,964 0.51
7 Waridi Garments - 97,669,376 - - 125,276,216 - - 319,132,876 - 587,279,208 752,474,086 0.78 298,978,823 416,294,165 0.72
8
Savage Holdings limited 1,133,072 1,133,072 1.00 1,133,122 1,133,122 1.00 1,133,131 1,133,131 1.00 1,133,141 1,133,131 1.00 1,133,154 1,133,154 1.00
9
Alliance One Tobacco Ltd 5,775,505 35,538,505 0.16 6,898,967 33,702,437 0.20 5,316,634 23,669,793 0.22 5,119,333 27,921,767 0.18 5,859,522 28,551,117 0.21
10 Alpha Knits Ltd 625,758 13,848,498 0.05 625,758 14,770,736 0.04 743,318 10,896,058 0.07 266,792 5,858,907 0.05 255,512 5,919,453 0.04
11 Macushla House L 15,577,406 15,999,848 0.97 16,229,712 17,268,425 0.94 16,818,410 17,518,858 0.96 17,422,581 18,172,340 0.96 18,112,659 18,929,670 0.96
12
Flame Tree Security 145,043 4,569,135 0.03 165,880 4,143,858 0.04 189,741 3,153,838 0.06 217,078 2,351,911 0.09 248,412 1,738,431 0.14
13
summit guest house 446,133 2,072,620 0.22 532,958 2,140,593 0.25 550,998 2,173,634 0.25 583,685 4,310,924 0.14 674,086 2,465,101 0.27
14
Centrofood Industries Ltd 36,277,866 245,025,477 0.15 39,221,021 239,712,929 0.16 37,248,663 206,177,439 0.18 33,155,269 153,563,703 0.22 32,403,506 145,977,392 0.22
15
Dawaline Pharmaceuticals L 600,442 11,248,902 0.05 718,911 57,503,333 0.01 869,024 54,289,323 0.02 593,099 49,150,109 0.01 764,567 56,302,622 0.01
16
Kenya Tanning Extract Co Ltd 1,482,991 2,889,131 0.51 1,393,334 2,977,762 0.47 1,055,554 1,534,860 0.69 983,010 1,003,049 0.98 831,544 857,498 0.97
17
Ready Timber Merchants 1,907,483 3,524,539 0.54 2,009,460 3,075,304 0.65 1,321,810 2,503,653 0.53 1,391,183 2,323,789 0.60 1,657,484 2,856,821 0.58
18
Salama Clothing Manufacturers 15,894,815 22,372,152 0.71 15,012,229 21,903,325 0.69 13,954,296 21,440,125 0.65 9,229,345 16,688,369 0.55 8,778,786 15,234,038 0.58
19
United Textile Industry (K) Ltd 18,375,011 152,749,105 0.12 45,386,713 86,052,020 0.53 91,805,198 131,214,371 0.70 99,021,100 290,632,375 0.34 108,055,622 243,312,798 0.44
20
Central Computers - 348,651,695 - - 236,219,762 - - 236,219,762 - - 92,652,234 - 58,422,659 94,539,323 0.62
21 Popular Industries 188,646,978 193,931,997 0.97 192,366,965 200,683,546 0.96 150,862,546 195,069,986 0.77 196,368,661 203,629,664 0.96 26,067,583 182,034,738 0.14
22
Colorchase Limited 1,241,688 70,217,445 0.02 1,507,105 77,819,421 0.02 1,677,589 79,694,203 0.02 1,814,750 85,622,750 0.02 2,146,813 85,117,197 0.03
23
Marks Photo Studio 28,050,443 67,553,855 0.42 29,544,681 65,300,134 0.45 28,367,104 74,917,615 0.38 29,440,854 72,835,053 0.40 24,849,133 57,162,618 0.43
24 Blue Post Hotel 6,037,818 18,835,390 0.32 6,037,818 18,835,390 0.32 5,757,192 19,784,154 0.29 6,064,719 18,037,095 0.34 6,291,544 18,684,921 0.34

62
2013 2012 2011 2010 2009
Name of the
SME
Net Tangible
Assets Total Assets
Ass
tang
Net Tangible
Assets Total Assets
Ass
tang
Net Tangible
Assets Total Assets
Asse
tang
Net Tangible
Assets Total Assets
Asse
tang
Net Tangible
Assets Total Assets
Asse
tang
25 Edkan Enterprises 60,374,586 61,088,417 0.99 61,251,789 61,725,524 0.99 62,135,654 62,742,707 0.99 61,254,010 61,852,216 0.99 52,458,965 59,865,234 0.88
26
Prisma Electric Limited 4,197,013 34,359,831 0.12 3,880,812 39,087,678 0.10 3,807,474 36,771,230 0.10 3,961,766 36,739,580 0.11 2,985,647 25,897,456 0.12
27 Crystal Valuers Ltd 4,355,546 121,419,937 0.04 4,146,550 87,491,712 0.05 3,188,664 70,069,755 0.05 3,795,061 38,555,169 0.10 457,499 32,812,202 0.01
28 Mama Millers Ltd 3,967,963 13,241,770 0.30 4,295,587 11,980,473 0.36 4,831,911 11,846,459 0.41 4,365,154 12,356,234 0.35 3,465,154 11,156,234 0.31
29
Milkon & Sons partners account 7,815,312 36,091,446 0.22 7,946,073 29,009,843 0.27 8,076,834 27,191,540 0.30 8,207,595 27,426,109 0.30 8,338,356 28,227,937 0.30
30 Bempee Ltd 6,037,818 18,835,390 0.32 5,896,847 17,589,658 0.34 5,757,192 19,784,154 0.29 6,064,719 18,037,095 0.34 6,291,544 18,684,921 0.34
31 Tilkones Limited 188,646,978 187,258,741 1.01 192,366,965 200,683,546 0.96 150,862,546 195,069,986 0.77 196,368,661 203,629,664 0.96 126,067,583 182,034,738 0.69
32
Oliver Clearing Service Limited 18,375,011 152,749,105 0.12 45,386,713 86,052,020 0.53 91,805,198 131,214,371 0.70 99,021,100 290,632,375 0.34 108,055,622 243,312,798 0.44
33
Wajibu Mobil Service Station 145,043 4,569,135 0.03 165,880 4,143,858 0.04 189,741 3,153,838 0.06 217,078 2,351,911 0.09 248,412 1,738,431 0.14
34 Messanine Oil 68,515 11,080,986 0.01 78,303 14,280,510 0.01 73,409 12,680,748 0.01 70,962 11,880,867 0.01 68,515 10,258,965 0.01
35
Thika Motor Dealers (K) Ltd 15,577,406 15,999,848 0.97 16,229,712 17,268,425 0.94 16,818,410 17,518,858 0.96 17,422,581 18,172,340 0.96 18,112,659 18,929,670 0.96
36
Wishwaste Limited 870,735,908 1,169,846,108 0.74 523,997,934 735,694,081 0.71 408,912,699 894,561,251 0.46 152,836,363 330,837,064 0.46 146,506,850 285,455,964 0.51
37 Nelka Agencies 13,754,389 82,475,652 0.17 3,304,199 57,557,855 0.06 4,976,614 29,927,789 0.17 3,346,974 17,945,951 0.19 7,395,890 27,639,835 0.27
38
Century Oil Trading Co Ltd 625,758 13,848,498 0.05 625,758 14,770,736 0.04 743,318 10,896,058 0.07 266,792 5,858,907 0.05 255,512 5,919,453 0.04
39
Samerchant Construction 145,043 4,569,135 0.03 165,880 4,143,858 0.04 189,741 3,153,838 0.06 217,078 2,351,911 0.09 248,412 1,738,431 0.14
40 The Coconut Gril 625,758 13,848,498 0.05 625,758 14,770,736 0.04 743,318 10,896,058 0.07 266,792 5,858,907 0.05 255,512 5,919,453 0.04
Totals 2,414,456,264 4,571,641,672 0.53 1,768,677,230 3,461,089,029 0.51 1,546,894,399 3,921,158,433 0.39 1,716,131,942 3,286,087,077 0.52 1,242,092,730 2,702,887,775 0.46

63
Appendix III: Return on Asset
2013 2012 2011 2010 2009
Name of the
SME
Profit After
Tax Total Assets ROA
Profit After
Tax Total Assets ROA
Profit After
Tax Total Assets ROA
Profit After
Tax Total Assets ROA
Profit After
Tax Total Assets ROA
1
INTEL FIRE GROUP OF COMPANIES (51,629) 245,801 (0.21) 28,441 232,655 0.12 (11,594) 239,228 (0.05) 14,856 225,369 0.07 (4,982) 235,763 (0.02)
2
Saana Shoes Ltd 29,926,425 82,475,652 0.36 9,990,548 57,557,855 0.17 7,368,223 29,927,789 0.25 5,176,173 17,945,951 0.29 513,227 27,639,835 0.02
3
Thika Cloth Mills L 11,406,337 36,091,446 0.32 (257,186) 29,009,843 (0.01) 219,617 27,191,540 0.01 539,429 27,426,109 0.02 3,512,366 28,227,937 0.12
4
Imara Enterprises 10,587,767 11,080,986 0.96 9,299,471 14,280,510 0.65 9,943,619 12,680,748 0.78 7,859,632 11,586,954 0.68 9,422,622 12,407,300 0.76
5
Ruiru Hardware Store Ltd 255,157 22,788,440 0.01 688,417 19,545,260 0.04 1,088,333 18,555,555 0.06 1,633,414 15,218,077 0.11 349,316 12,218,198 0.03
6
Uhuru Flowers Limited 348,602,108
1,169,846,10
8 0.30 148,806,017 735,694,081 0.20 129,821,797 894,561,251 0.15 49,820,984 330,837,064 0.15 (20,862,461) 285,455,964 (0.07)
7
Waridi Garments (6,014,530) 97,669,376 (0.06) (6,234,260) 125,276,216 (0.05) 202,564,938 319,132,876 0.63 259,018,846 752,474,086 0.34 153,779,178 416,294,165 0.37
8
Savage Holdings limited (54,560) 1,133,072 (0.05) (54,519) 1,133,122 (0.05) (54,520) 1,133,131 (0.05) (54,523) 1,133,131 (0.05) (35,012) 1,133,154 (0.03)
9
Alliance One Tobacco (Kenya) (850,538) 35,538,505 (0.02) 5,775,112 33,702,437 0.17 527,588 23,669,793 0.02 5,642,614 27,921,767 0.20 (5,602,229) 28,551,117 (0.20)
10 Alpha Knits Ltd (28,800) 13,848,498 (0.00) (215,279) 14,770,736 (0.01) (335,111) 10,896,058 (0.03) 616,013 5,858,907 0.11 (727,908) 5,919,453 (0.12)
11
Macushla House Limited 1,322,946 15,999,848 0.08 1,155,882 17,268,425 0.07 984,341 17,518,858 0.06 839,988 18,172,340 0.05 195,333 18,929,670 0.01
12
Flame Tree Security Ltd 652,899 4,569,135 0.14 1,136,706 4,143,858 0.27 688,856 3,153,838 0.22 476,940 2,351,911 0.20 235,940 1,738,431 0.14
13
summit guest house 67,005 2,072,620 0.03 534,177 2,140,593 0.25 247,481 2,173,634 0.11 (647,740) 4,310,924 (0.15) 325,573 2,465,101 0.13
14
Centrofood Industries Ltd 8,619,326 245,025,477 0.04 18,105,133 239,712,929 0.08 6,213,061 206,177,439 0.03 25,535,147 153,563,703 0.17 3,195,382 145,977,392 0.02
15
Dawaline Pharmaceutica (1,842,523) 11,248,902 (0.16) (1,789,777) 57,503,333 (0.03) (1,740,235) 54,289,323 (0.03) (4,248,558) 49,150,109 (0.09) 2,122,235 56,302,622 0.04
16
Kenya Tanning Extract Co Ltd (59,155) 2,889,131 (0.02) 201,204 2,977,762 0.07 (341,188) 1,534,860 (0.22) (28,992) 1,003,049 (0.03) (17,852) 857,498 (0.02)
17
Ready Timber Merchants 98,280 3,524,539 0.03 561,352 3,075,304 0.18 (273,389) 2,503,653 (0.11) (249,582) 2,323,789 (0.11) 34,165 2,856,821 0.01
18
Salama Clothing Manufacturers 151,519 22,372,152 0.01 (483,928) 21,903,325 (0.02) 5,263,367 21,440,125 0.25 1,869,234 16,688,369 0.11 615,599 15,234,038 0.04
19 United Textile 47,852,890 152,749,105 0.31 (16,933,517) 86,052,020 (0.20) (45,417,464) 131,214,371 (0.35) (38,750,625) 290,632,375 (0.13) (2,753,601) 243,312,798 (0.01)

64
2013 2012 2011 2010 2009
Name of the
SME
Profit After
Tax Total Assets ROA
Profit After
Tax Total Assets ROA
Profit After
Tax Total Assets ROA
Profit After
Tax Total Assets ROA
Profit After
Tax Total Assets ROA
Industry (K) Ltd
20
Central Computers (10,108,492) 348,651,695 (0.03) (4,149,474) 236,219,762 (0.02) (4,149,474) 236,219,762 (0.02) (2,800,274) 92,652,234 (0.03) 3,190,896 94,539,323 0.03
21
Popular Industries (301,561) 193,931,997 (0.00) (997,909) 200,683,546 (0.00) 43,800,208 195,069,986 0.22 17,016,615 203,629,664 0.08 159,483,691 182,034,738 0.88
22
Colorchase Limited 2,343,194 70,217,445 0.03 4,599,355 77,819,421 0.06 10,418,296 79,694,203 0.13 3,316,967 85,622,750 0.04 31,413,668 85,117,197 0.37
23 Marks Photo (12,693,093) 67,553,855 (0.19) 5,448,811 65,300,134 0.08 2,077,032 74,917,615 0.03 (35,647,408) 72,835,053 (0.49) (22,650,805) 57,162,618 (0.40)
24 Blue Post Hotel (190,704) 18,835,390 (0.01) (190,704) 18,835,390 (0.01) (369,384) 19,784,154 (0.02) 1,234,629 18,037,095 0.07 (1,437,357) 18,684,921 (0.08)
25
Edkan Enterprises 790,159 61,088,417 0.01 956,197 61,725,524 0.02 123,924 62,742,707 0.00 623,427 61,852,216 0.01 569,874 59,865,234 0.01
26 Prisma Electric (1,494,973) 34,359,831 (0.04) 914,865 39,087,678 0.02 (7,890,528) 36,771,230 (0.21) (2,823,545) 36,739,580 (0.08) (1,452,365) 25,897,456 (0.06)
27
Crystal Valuers Ltd 26,315,417 121,419,937 0.22 (28,796,292) 87,491,712 (0.33) (1,481,363) 70,069,755 (0.02) (5,494,176) 38,555,169 (0.14) 2,049,599 32,812,202 0.06
28
Mama Millers Limited (3,261,575) 13,241,770 (0.25) (1,772,572) 11,980,473 (0.15) (76,994) 11,846,459 (0.01) (1,703,714) 12,356,234 (0.14) (1,403,714) 11,156,234 (0.13)
29
Milkon & Sons partners account 11,406,337 36,091,446 0.32 (257,186) 29,009,843 (0.01) 219,617 27,191,540 0.01 539,429 27,426,109 0.02 3,512,366 28,227,937 0.12
30 Bempee Ltd (190,704) 18,835,390 (0.01) (125,698) 17,589,658 (0.01) (369,384) 19,784,154 (0.02) 1,234,629 18,037,095 0.07 (1,437,357) 18,684,921 (0.08)
31
Tilkones Limited (301,561) 187,258,741 (0.00) (997,909) 200,683,546 (0.00) 43,800,208 195,069,986 0.22 17,016,615 203,629,664 0.08 15,948,369 182,034,738 0.09
32
Oliver Clearing Service Limited 47,852,890 152,749,105 0.31 (16,933,517) 86,052,020 (0.20) (45,417,464) 131,214,371 (0.35) (38,750,625) 290,632,375 (0.13) (2,753,601) 243,312,798 (0.01)
33
Wajibu Mobil Service Station 652,899 4,569,135 0.14 1,136,706 4,143,858 0.27 688,856 3,153,838 0.22 476,940 2,351,911 0.20 235,940 1,738,431 0.14
34 Messanine Oil 10,587,767 11,080,986 0.96 9,299,471 14,280,510 0.65 9,943,619 12,680,748 0.78 10,265,693 11,880,867 0.86 8,548,963 10,258,965 0.83
35
Thika Motor Dealers (K) Ltd 1,322,946 15,999,848 0.08 1,155,882 17,268,425 0.07 984,341 17,518,858 0.06 839,988 18,172,340 0.05 195,333 18,929,670 0.01
36
Wishwaste Limited 348,602,108
1,169,846,108 0.30 148,806,017 735,694,081 0.20 129,821,797 894,561,251 0.15 49,820,984 330,837,064 0.15 (20,862,461) 285,455,964 (0.07)
37 Nelka Agencies 29,926,425 82,475,652 0.36 9,990,548 57,557,855 0.17 7,368,223 29,927,789 0.25 5,176,173 17,945,951 0.29 513,227 27,639,835 0.02
38
Century Oil Trading Co Ltd (28,800) 13,848,498 (0.00) (215,279) 14,770,736 (0.01) (335,111) 10,896,058 (0.03) 616,013 5,858,907 0.11 (727,908) 5,919,453 (0.12)
39
Samerchant Construction 652,899 4,569,135 0.14 1,136,706 4,143,858 0.27 688,856 3,153,838 0.22 476,940 2,351,911 0.20 235,940 1,738,431 0.14
40 The Coconut Gril (28,800) 13,848,498 (0.00) (215,279) 14,770,736 (0.01) (335,111) 10,896,058 (0.03) 616,013 5,858,907 0.11 (727,908) 5,919,453 (0.12)
Totals 902,493,702 4,571,641,672 0.20 299,106,735 3,461,089,029 0.09 506,267,886 3,921,158,433 0.13 337,114,563 3,286,087,077 0.10 316,741,282 2,702,887,775 0.12