Embed Size (px)
Citation preview
1
The effect of chemical composition on the metal expansion
penetration in grey cast iron
Izudin Dugic and Ingvar L Svensson
Division of Component Technology Jönköping University, Box 1026, S-551 11 Jönköping, Sweden e-mail: [email protected] and [email protected]
Summary
In some grey cast iron components which are cast in sand moulds, the metal sometimes
penetrates into the mould producing defects and causing difficulties when cleaning the
components. To improve knowledge of the metal penetration mechanism a series of test
castings was performed at ITT Flygt’s foundry where the influence of chemical composition
was studied. The chemical composition of the melt was changed in the ladle before pouring.
The result showed that the carbon and phosphorus content had an influence on metal
penetration. The metal penetration tendency decreased when decreasing the carbon content as
well as when increasing the phosphorus content.
The penetration areas were analysed in a Scanning Electron Microscope (SEM) with Energy
Dispersive Analysis (EDS). The analysis showed that the average chemical composition in
the penetration zones was close to the initial composition of the alloy. Consequently, no
significant macro segregation of carbon or phosphorous could be observed.
The whole casting process was simulated with the software MAGMAsoftTM, in order to
investigate the solidification characteristics as well as the porosity formation in the casting
studied. For this, a special module for cast iron was used, MAGMAironTM, where nucleation
and growth of all relevant phases are considered. During simulation it is possible to detect the
areas where porosities are likely to be formed. The results show that expansion penetration
generally occurs in the same areas depending on the mode of solidification. The inoculation
and solidification behaviour will result in excess or deficiency of the metal at the end of
solidification, which will lead to either metal penetration or formation of porosities.
Key words: Grey cast iron, metal expansion penetration, chemical composition, inoculant,
inoculation, casting temperature.
2
Introduction
In some grey cast iron components which are cast in sand moulds, the metal sometimes
penetrates into the mould producing defects which cause difficulty when cleaning the
components. Metal penetration is a surface defect resulting from various physical, mechanical
and/or thermo-chemical interactive reactions at the mould-metal interface.
During solidification there are changes in volume, both within the casting and in the mould
cavity, which greatly determine the success of the casting operation. Most metals shrink
during cooling in the liquid state and during the transition from liquid to solid state. An
exception is grey cast iron, which may increase in volume during eutectic solidification due to
the formation of graphite, which has a large specific volume relative to the iron.1-7 The
precipitation of 1 percent of graphite in grey cast iron causes a volume increase of about 2
percent6 or a linear expansion of about 0.66 percent7. The excess liquid is forced by the
expansion pressure into the sand mould wall which results in penetration. This type of
penetration was called expansion penetration and was first identified by Levelink and Julien8-9
who called it exudation penetration. The phenomenon was verified by Kurstjens10.
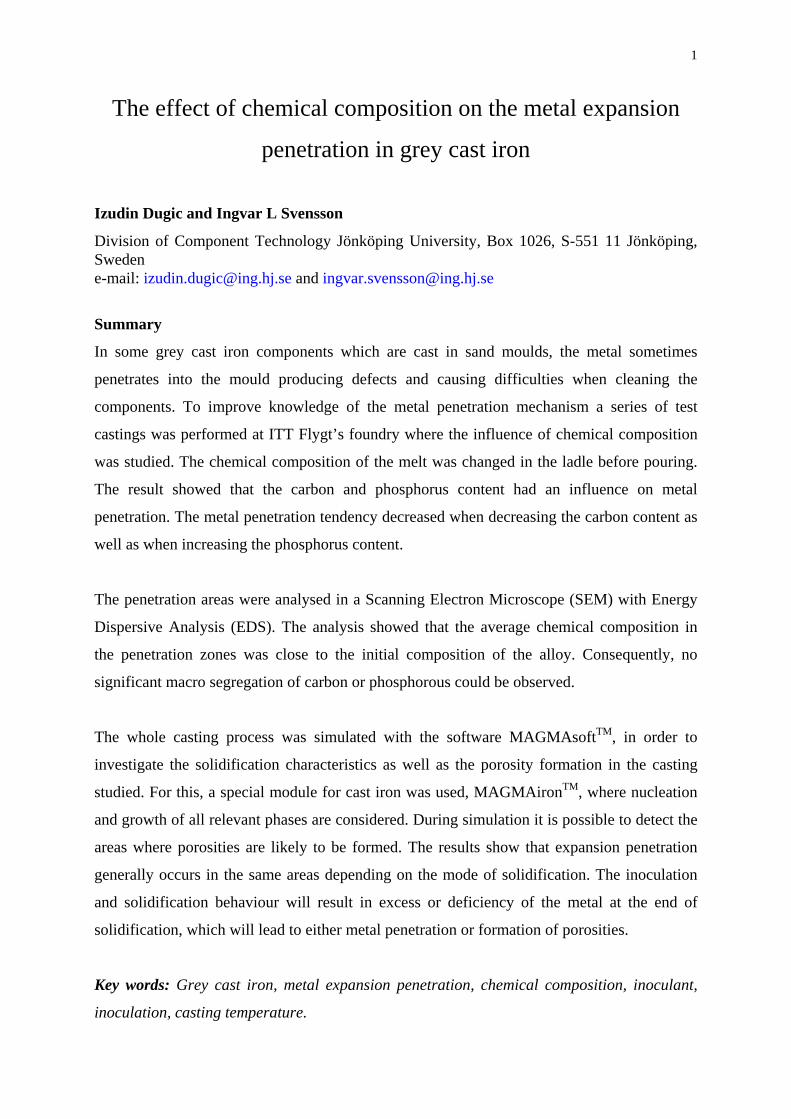
Expansion penetration depends upon the metallurgical characteristics of the solidifying metal.
Levelink and Julien found that penetration increases with increasing CE (carbon equivalent),
reaching a maximum at the eutectic composition (figure 1).
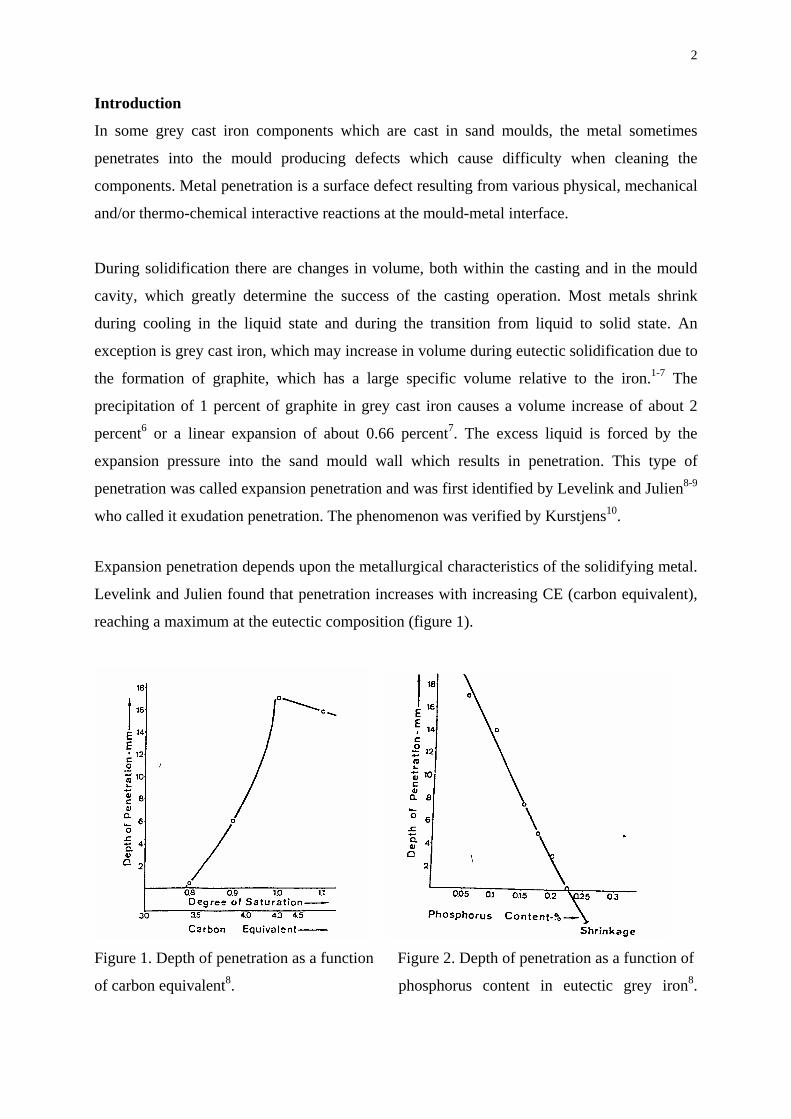
Figure 1. Depth of penetration as a function Figure 2. Depth of penetration as a function of
of carbon equivalent8. phosphorus content in eutectic grey iron8.
3
The influence of phosphorus content is shown in figure 2. As the phosphorus content was
increased, the penetration decreased and disappeared at about 0.2 % P. At higher phosphorus
levels, shrink cones above the top of the core as well as internal shrink holes were formed.
This means that the condition of metal surplus at low phosphorus levels changes to a metal
shortage at higher levels.
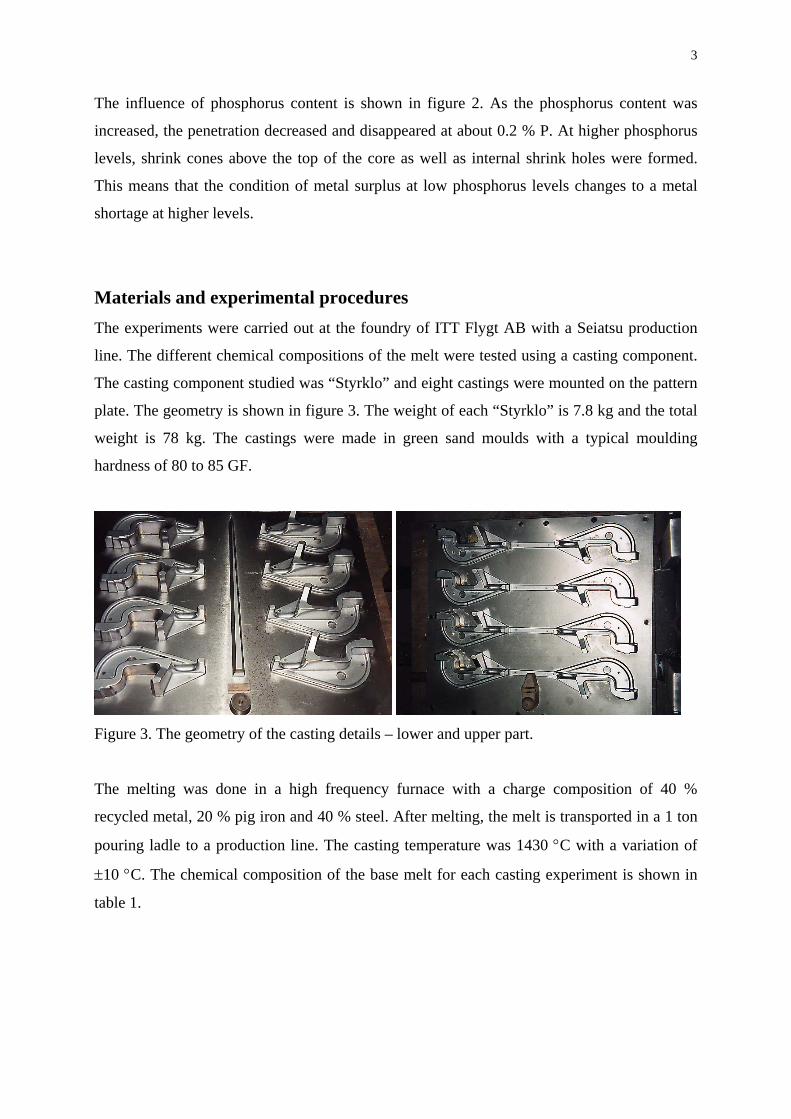
Materials and experimental procedures The experiments were carried out at the foundry of ITT Flygt AB with a Seiatsu production
line. The different chemical compositions of the melt were tested using a casting component.
The casting component studied was “Styrklo” and eight castings were mounted on the pattern
plate. The geometry is shown in figure 3. The weight of each “Styrklo” is 7.8 kg and the total
weight is 78 kg. The castings were made in green sand moulds with a typical moulding
hardness of 80 to 85 GF.
Figure 3. The geometry of the casting details – lower and upper part.
The melting was done in a high frequency furnace with a charge composition of 40 %
recycled metal, 20 % pig iron and 40 % steel. After melting, the melt is transported in a 1 ton
pouring ladle to a production line. The casting temperature was 1430 °C with a variation of
±10 °C. The chemical composition of the base melt for each casting experiment is shown in
table 1.
4
Table 1. Composition of the base melt. Cequ = % C + % Si / 4.
Element in Wt % Experi-
ment C Si Mn P S Cr Cu Cequ
A 3.45 1.78 0.66 0.082 0.091 0.05 0.24 3.895
B 3.41 1.88 0.64 0.084 0.092 0.05 0.24 3.880
C 3.33 2.02 0.62 0.075 0.089 0.04 0.25 3.835
D 3.27 1.99 0.62 0.123 0.087 0.05 0.21 3.767
E 3.30 2.04 0.60 0.102 0.074 0.07 0.26 3.810
The inoculant used in these experiments was of a ferro-silicon-strontium type. The chemical
composition is shown in table 2. The inoculant had a particle size between 1.0 and 6.0 mm.
The inoculation was made in the stream when pouring the melt from the high frequency
furnace to the pouring ladle. The amount of inoculant added was 0.15 % for all experiments.
The time after the inoculation to casting in the mould flasks were 2 minutes.
Table 2. The chemical composition of the inoculant used.
Inoculant % Si % Ca % Al % Sr
A 75±3 max 0.10 max 0.50 0.8±0.2
For each of the different chemical composition of the melt, six flasks were moulded and cast.
This yields a total 30 flasks, and consequently 240 castings, thereby providing a sound
statistical basis for evaluation of the effect of different chemical composition of the melt on
the metal expansion penetration.
Experimental results Surface defects
After blasting, all casting components were investigated by an ocular inspection. The severity
of the metal penetration; measured as a “length and width” (in mm ) in a penetration area, is
shown in table 3. The numbers given are average values for all castings from each melt
composition. The metal penetration often occurs in two places on this casting. These are
shown in figure 4 and the places are called “side” and “beneath” respectively.
5
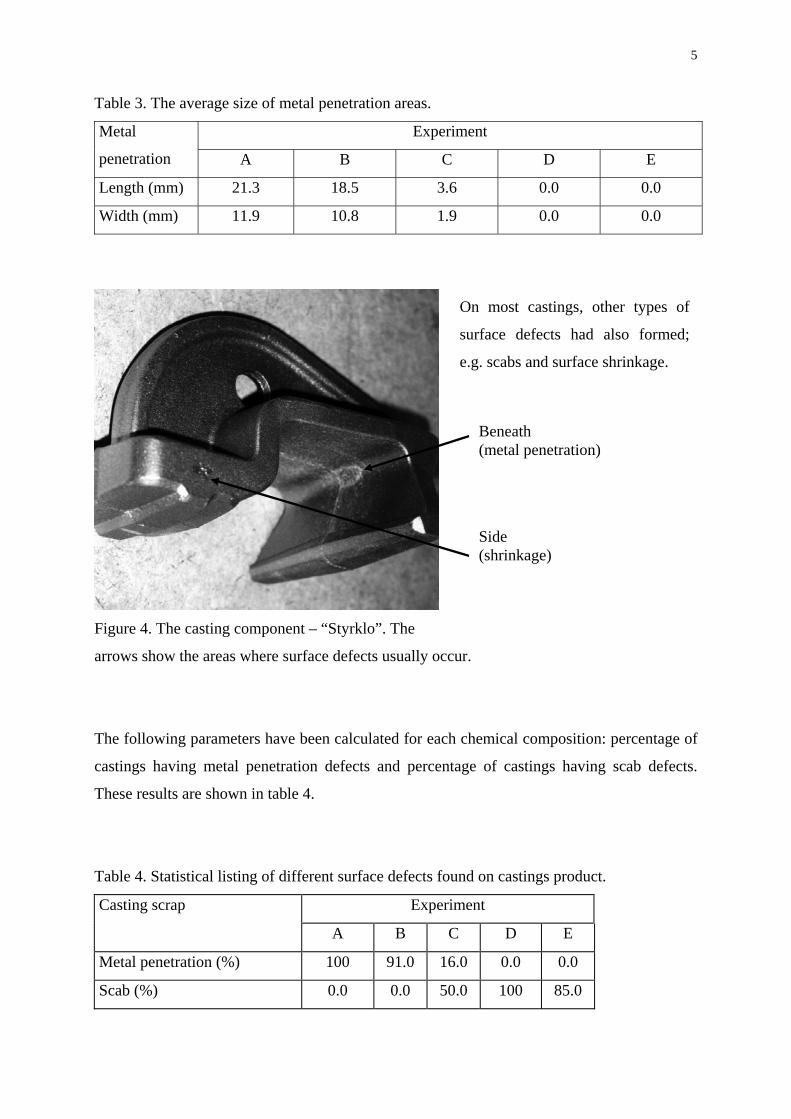
Table 3. The average size of metal penetration areas.
Experiment Metal
penetration A B C D E
Length (mm) 21.3 18.5 3.6 0.0 0.0
Width (mm) 11.9 10.8 1.9 0.0 0.0
Figure 4. The casting component – “Styrklo”. The
arrows show the areas where surface defects usually occur.
The following parameters have been calculated for each chemical composition: percentage of
castings having metal penetration defects and percentage of castings having scab defects.
These results are shown in table 4.
Table 4. Statistical listing of different surface defects found on castings product.
Experiment Casting scrap
A B C D E
Metal penetration (%) 100 91.0 16.0 0.0 0.0
Scab (%) 0.0 0.0 50.0 100 85.0
On most castings, other types of
surface defects had also formed;
e.g. scabs and surface shrinkage.
Beneath (metal penetration)
Side (shrinkage)
6
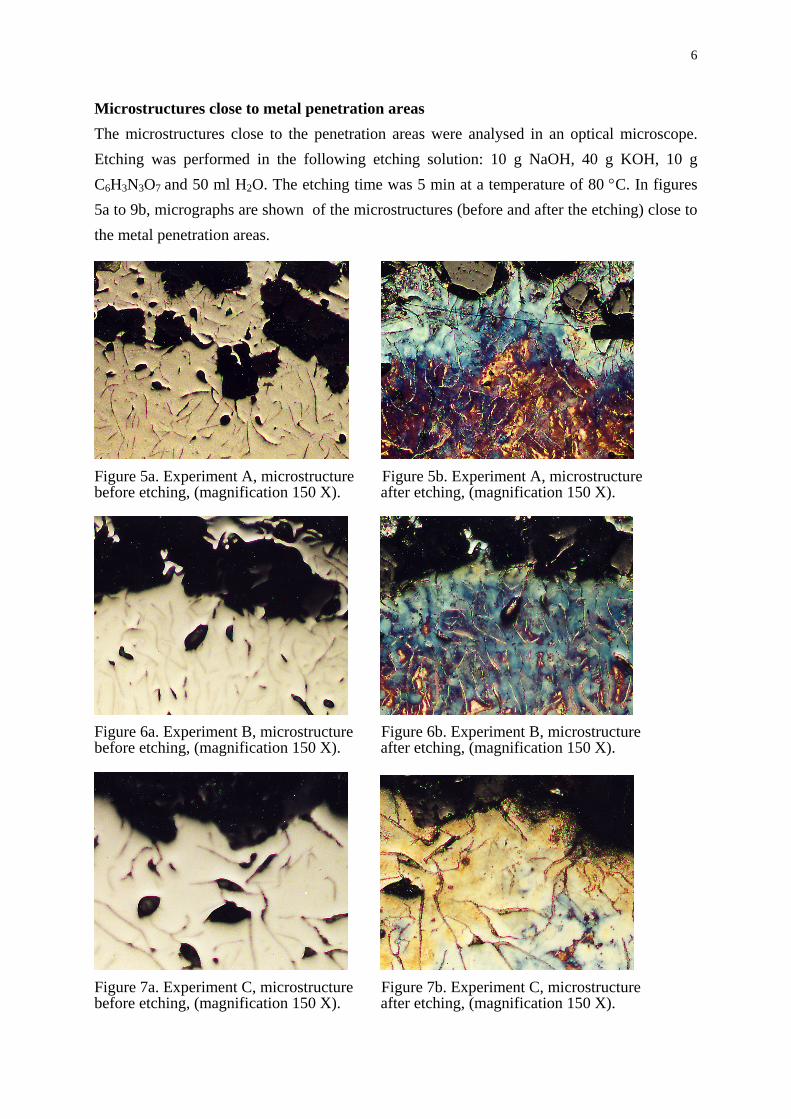
Microstructures close to metal penetration areas The microstructures close to the penetration areas were analysed in an optical microscope. Etching was performed in the following etching solution: 10 g NaOH, 40 g KOH, 10 g C6H3N3O7 and 50 ml H2O. The etching time was 5 min at a temperature of 80 °C. In figures 5a to 9b, micrographs are shown of the microstructures (before and after the etching) close to the metal penetration areas.
Figure 5a. Experiment A, microstructure Figure 5b. Experiment A, microstructure before etching, (magnification 150 X). after etching, (magnification 150 X).
Figure 6a. Experiment B, microstructure Figure 6b. Experiment B, microstructure before etching, (magnification 150 X). after etching, (magnification 150 X).
Figure 7a. Experiment C, microstructure Figure 7b. Experiment C, microstructure before etching, (magnification 150 X). after etching, (magnification 150 X).
7
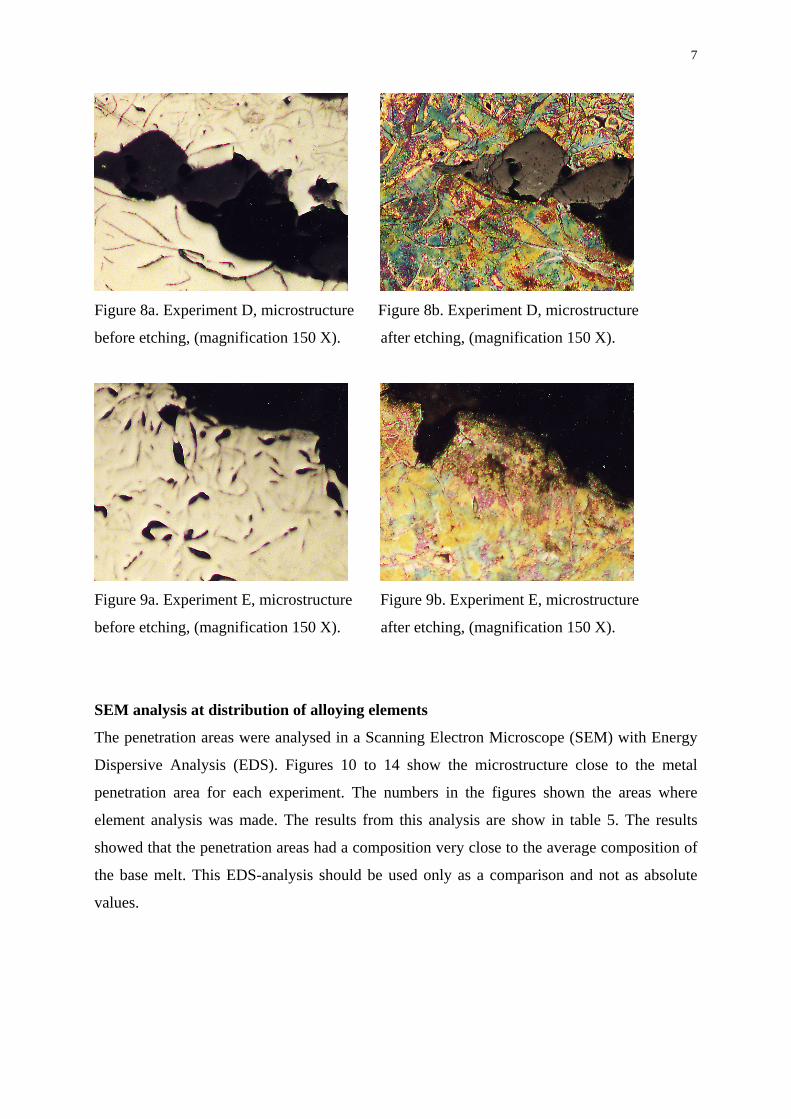
Figure 8a. Experiment D, microstructure Figure 8b. Experiment D, microstructure
before etching, (magnification 150 X). after etching, (magnification 150 X).
Figure 9a. Experiment E, microstructure Figure 9b. Experiment E, microstructure
before etching, (magnification 150 X). after etching, (magnification 150 X).
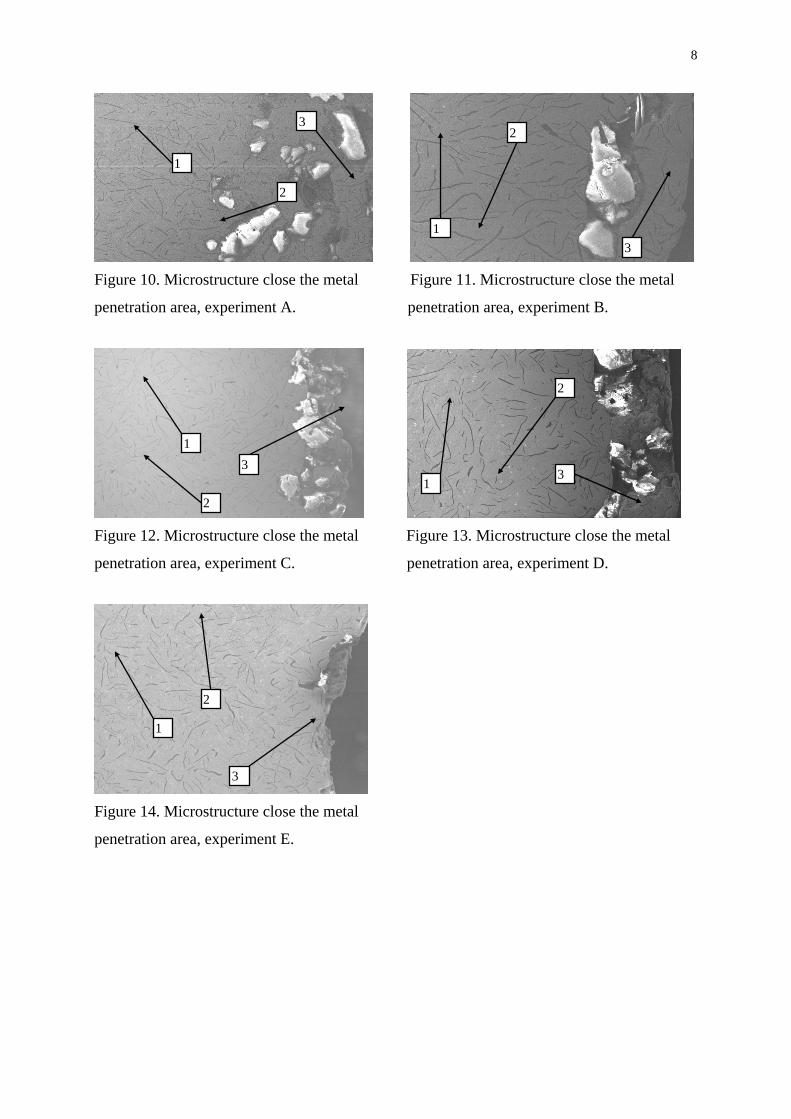
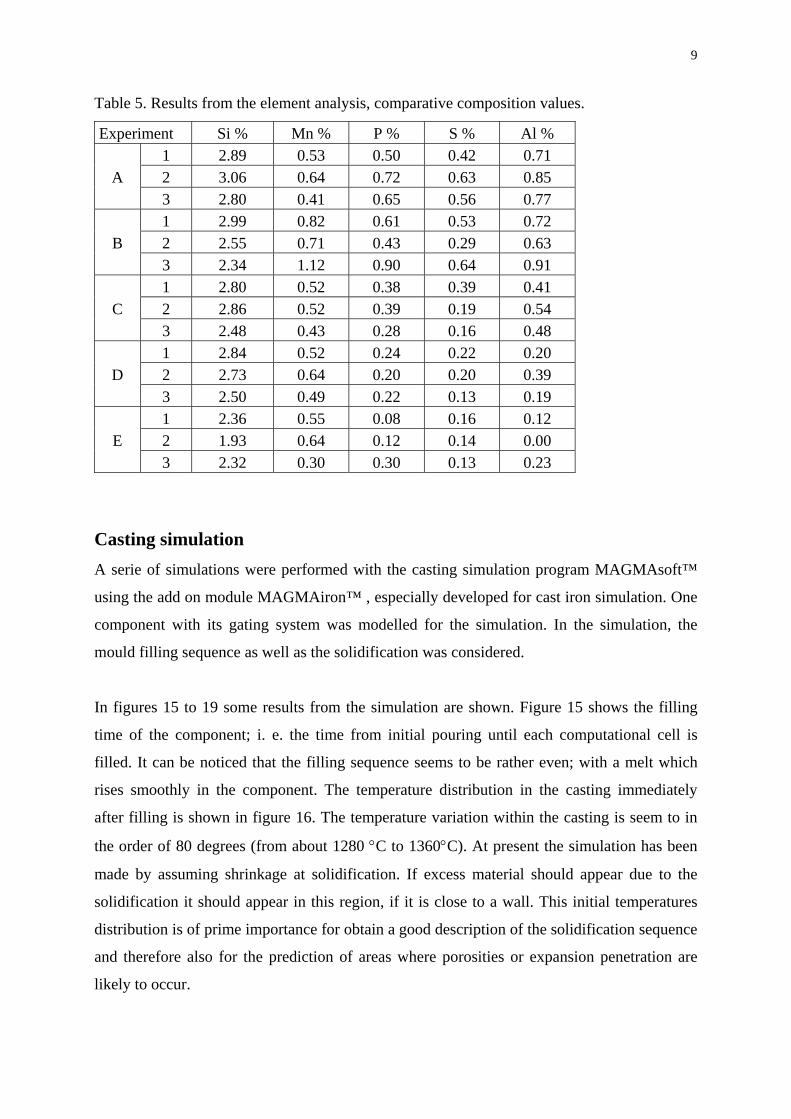
SEM analysis at distribution of alloying elements
The penetration areas were analysed in a Scanning Electron Microscope (SEM) with Energy
Dispersive Analysis (EDS). Figures 10 to 14 show the microstructure close to the metal
penetration area for each experiment. The numbers in the figures shown the areas where
element analysis was made. The results from this analysis are show in table 5. The results
showed that the penetration areas had a composition very close to the average composition of
the base melt. This EDS-analysis should be used only as a comparison and not as absolute
values.
8
Figure 10. Microstructure close the metal Figure 11. Microstructure close the metal
penetration area, experiment A. penetration area, experiment B.
Figure 12. Microstructure close the metal Figure 13. Microstructure close the metal
penetration area, experiment C. penetration area, experiment D.
Figure 14. Microstructure close the metal
penetration area, experiment E.
1
1
1
2
2
2
1
3
3
3
2
1
3
2
3
9
Table 5. Results from the element analysis, comparative composition values.
Experiment Si % Mn % P % S % Al % 1 2.89 0.53 0.50 0.42 0.71
A 2 3.06 0.64 0.72 0.63 0.85 3 2.80 0.41 0.65 0.56 0.77 1 2.99 0.82 0.61 0.53 0.72
B 2 2.55 0.71 0.43 0.29 0.63 3 2.34 1.12 0.90 0.64 0.91 1 2.80 0.52 0.38 0.39 0.41
C 2 2.86 0.52 0.39 0.19 0.54 3 2.48 0.43 0.28 0.16 0.48 1 2.84 0.52 0.24 0.22 0.20
D 2 2.73 0.64 0.20 0.20 0.39 3 2.50 0.49 0.22 0.13 0.19 1 2.36 0.55 0.08 0.16 0.12
E 2 1.93 0.64 0.12 0.14 0.00 3 2.32 0.30 0.30 0.13 0.23
Casting simulation
A serie of simulations were performed with the casting simulation program MAGMAsoft™
using the add on module MAGMAiron™ , especially developed for cast iron simulation. One
component with its gating system was modelled for the simulation. In the simulation, the
mould filling sequence as well as the solidification was considered.
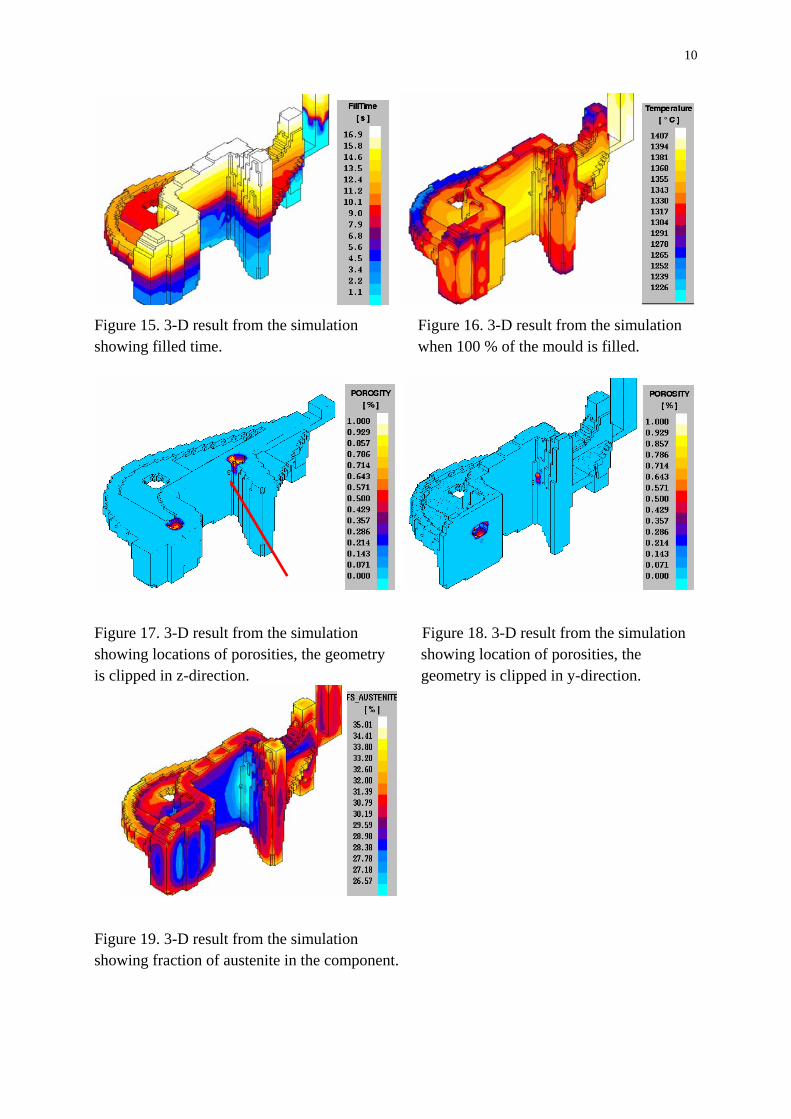
In figures 15 to 19 some results from the simulation are shown. Figure 15 shows the filling
time of the component; i. e. the time from initial pouring until each computational cell is
filled. It can be noticed that the filling sequence seems to be rather even; with a melt which
rises smoothly in the component. The temperature distribution in the casting immediately
after filling is shown in figure 16. The temperature variation within the casting is seem to in
the order of 80 degrees (from about 1280 °C to 1360°C). At present the simulation has been
made by assuming shrinkage at solidification. If excess material should appear due to the
solidification it should appear in this region, if it is close to a wall. This initial temperatures
distribution is of prime importance for obtain a good description of the solidification sequence
and therefore also for the prediction of areas where porosities or expansion penetration are
likely to occur.
10
Figure 15. 3-D result from the simulation Figure 16. 3-D result from the simulation showing filled time. when 100 % of the mould is filled.
Figure 17. 3-D result from the simulation Figure 18. 3-D result from the simulation showing locations of porosities, the geometry showing location of porosities, the is clipped in z-direction. geometry is clipped in y-direction.
Figure 19. 3-D result from the simulation showing fraction of austenite in the component.

11
The, by the simulation predicted distribution of porosities are shown in figure 17 and 18. It is
interesting to notice that the predicted porosity areas perfectly matches the areas where
surface defects occurred in the experiments, se figure 4.
In figure 19 the volume fraction of primary precipitated austenite is shown. The primary
austenite precipitation gives a primary shrinkage of the metal before the eutectic expansion
takes place. This will later have an effect on the porosities formed in the casting.
Discussion
The chemical composition of the melt was changed in the ladle before pouring. The carbon
content was varied from 3.27 % (experiment D) to 3.45 % (experiment A). The phosphorus
content was varied from 0.075 % (experiment C) to 0.123 % (experiment D). The
experiments showed that carbon and phosphorus influence the metal penetration and
shrinkage formation. The metal penetration decreases when decreasing the carbon content and
increasing the phosphorus content. The increase of phosphorus from 0.08 % to 0.12 % and
decrease of carbon from 3.40 % to 3.30 % changed for this component the expansion
penetration defect from nearly 100 % down to close to 0 %. As the expansion penetration
vanished, shrinkage appeared.
In order to accurately predict whether a porosities or metal penetration will occur, it is needed
to have accurate models describing the volumes of each phase precipitating during
solidification. These models need to account for how the volumes are affected by alloying
elements. Today, there is still a lack for accurate experimental data for volumes for the
austenite and liquid phases. However, the results show that metal penetration generally occurs
in the same areas which are sensitive for porosities.
The whole casting process was simulated with the software MAGMAsoftTM, in order to
investigate the solidification characteristics as well as the porosity formation in the casting
studied. For this, a special module for cast iron was used, MAGMAiron, where nucleation and
growth of all relevant phases are considered. During simulation it is possible to detect the
areas where porosities are likely to be formed. The results show that expansion penetration
generally occurs in the same areas depending on the mode of solidification. The inoculation
12
and solidification behaviour will result in excess or deficiency of the metal at the end of
solidification, which will lead to either metal penetration or formation of porosities.
If the simulation shows that a porosity area is located close to the casting surface, it can be
expected that in some cases if metal penetration should occur it could be formed on the
nearest surface. It is probably small variations in the solidification sequence at late stage of
solidification, which determines if there will be a shortage or access of metal.
The penetration areas were analysed in Scanning Electron Microscope (SEM) with Energy
Dispersive Analysis (EDS). The analysis showed that the average chemical composition in
the penetration zones close to the initial composition of the components. Consequently, no
significant macro segregation of carbon or phosphorous could be observed.
Conclusion The experiments showed that carbon and phosphorus had an important influence on metal
penetration and shrinkage behaviour. Metal penetration decreases when decreasing the carbon
content and increasing the phosphorus content. By simulation it is possible to detect the areas
where porosities are formed. The results show that expansion penetration generally occurs in
the same regions as shrinkage depending on the freezing rate if the area is close to a surface.
The freezing parameters will give a change in the excess or deficiency of the metal versus the
precipitation of the graphite, giving rise to either expansion or shrinkage.
Acknowledgement The authors would like to thank ITT Flygt AB for experiments, and especially Jan Ekeblom,
Conny Oldenby and Jaen Nilsson for all support. Thank to Jon Nilsson, Swedish Foundry
Association for the help with the SEM-ADS analysis.
13
References 1. Pugh G. G. “Growth in cast iron”, Foundry Trade Journal, 1969, v 126, p 203.
2. Nagaoka K. “Effect of Irreversible migration of graphite upon the growth of cast iron”,
35th Int. Fdy. Congress, 1968, paper 39.
3. Barkay G. B., Zuithoff A. J. And Niedzwieds S. “The behaviour of cast iron at sub-critical
temperatures studied with diffusion couples”, AFS Cast Metals Research Journal, 1971, v
7 (3), pp 105-107.
4. Barkay G. B. Et. Al “Graphitization and growth of cast iron at a sub-critical temperature”,
39Th Int. Fdy. Congres, 1972, paper 6.
5. Hilliard J. E. and Owen W. S. “A thermal and microscopic study of the iron-carbon-silica
system”, J. I. S. I., 1952, v 172, pp 268-282.
6. Grant J. W. “Growth characteristics of ingot-mould irons in air and vacuum”, Fdy. Trade
Journal, 1931, v 95, pp 281-282, pp 321-331 (1939), pp 259-262 (1953).
7. Heselwood W. C. and Pickering F. B. “Growth characteristics of some cast irons used for
ingot moulds”, J. I. S. I. , 1951, v 168, pp 277-286.
8. Levelink H. G. and Julien F. P. M. A. “Penetration and shrinkage by interaction of
solidifying cast iron and casting mold- Part 1”, AFS Cast Metals Research Journal, 1973,
v 9 (2), pp 56-63.
9. H. G. Levelink and F. P. M. A. Julien“Penetration and shrinkage by interaction of
solidifying cast iron and casting mold- Part 2”, AFS Cast Metals Research Journal, 1973,
v 9 (2), pp 105-109.
10. Kurstjen J. “Discussion of penetration due to interaction of solidifying cast iron in the
mold-application”, AFS Cast Metals Research Journal, 1973, v 9 (3), pp 109-111.


![Homepage [] · 2016-12-11 · Compo on Compos i ± ion Composition Compo si tion Composition Composition Composition Composition ... Cylinder TRIM Steatite TRIM REC TUNING VFO TUNING](https://img.pdfslide.net/doc/110x75/5f99801b70d8f630802d58e4/homepage-2016-12-11-compo-on-compos-i-ion-composition-compo-si-tion-composition.jpg)