Embed Size (px)
Citation preview

NZHTA TECHNICAL BRIEF March 2007 Volume 6 Number 3
The effect of classroom sound field
amplification and the effectiveness of otoacoustic emission hearing screening
in school-age children.
Meagan Stephenson
New Zealand Health Technology Assessment
Department of Public Health and General Practice
Christchurch School of Medicine and Health Sciences Christchurch, New Zealand
NEW ZEALAND HEALTH TECHNOLOGY ASSESSMENT (NZHTA) Department of Public Health and General Practice Christchurch School of Medicine and Health Sciences Christchurch, New Zealand
The effect of classroom sound field amplification and the effectiveness of otoacoustic emission hearing screening in school age children. Meagan Stephenson
NZHTA TECHNICAL BRIEF March 2007 Volume 6 Number 3

This report should be referenced as follows: Stephenson, M. The effect of classroom sound field amplification and the effectiveness of otoacoustic emission hearing screening in school-age children. NZHTA Technical Brief 2007; 6(3) Titles in this Series can be found on the NZHTA website: http://nzhta.chmeds.ac.nz/publications 2007 New Zealand Health Technology Assessment (NZHTA) ISBN 978-1-877455-01-8 (Print) ISBN 978-1-877455-02-5 (Web) ISSN 1175-7884


THE EFFECT OF CLASSROOM SOUND FIELD AMPLIFICATION AND THE EFFECTIVENESS OF OTOACOUSTIC EMISSION HEARING SCREENING IN
SCHOOL-AGE CHILDREN
i
CONTRIBUTIONS BY AUTHORS
It was authored by Meagan Stephenson (Research Fellow), who conducted the critical appraisals, prepared the report and coordinated the project.
ACKNOWLEDGEMENTS
This Technical Brief was commissioned by the New Zealand Ministry of Health.
The literature search strategy was developed and undertaken by Mrs. Susan Bidwell (Information Specialist Manager). Ms Catherine Turnbull (Administrator) provided document formatting. Internal peer review was provided by Dr Robert Weir (Director of NZHTA).
We are grateful to Mr. Michael Heeney, who provided us with a copy of his PhD thesis research and also provided us with information about future research in classroom sound field amplification in New Zealand. We are also grateful to the Journal of Educational Audiology, who assisted us by providing difficult to locate articles.
DISCLAIMER
NZHTA takes great care to ensure the accuracy of the information supplied within the project timeframe, but neither NZHTA nor the University of Otago can accept responsibility for any errors or omissions that may occur. NZHTA and the University of Otago along with their employees accept no liability for any loss of whatever kind, or damage, arising from the reliance in whole or part, by any person, corporate or natural, on the contents of this paper. This document is not intended to be used as personal health advice; people seeking individual medical advice are referred to their physician. The views expressed in this report are those of NZHTA and do not necessarily represent those of the University of Otago, or the New Zealand Ministry of Health.
COPYRIGHT
This work is copyright. Apart from any use as permitted under the Copyright Act 1994 no part may be reproduced by any process without written permission from New Zealand Health Technology Assessment. Requests and inquiries concerning reproduction and rights should be directed to the Director, New Zealand Health Technology Assessment, Christchurch School of Medicine and Health Sciences, P O Box 4345, Christchurch, New Zealand.
CONTACT DETAILS New Zealand Health Technology Assessment (NZHTA) Department of Public Health and General Practice Christchurch School of Medicine and Health Sciences PO Box 4345 Christchurch New Zealand Tel: +64 3 364 3696 Fax: +64 3 364 3697 Email: [email protected] Website: http://nzhta.chmeds.ac.nz

THE EFFECT OF CLASSROOM SOUND FIELD AMPLIFICATION AND THE EFFECTIVENESS OF OTOACOUSTIC EMISSION HEARING SCREENING IN
SCHOOL-AGE CHILDREN
ii
LEVEL OF EVIDENCE CONSIDERED IN TECHNICAL BRIEFS
Technical Briefs are rapidly produced assessments of the best available evidence for a topic of highly limited scope. They are less rigorous than systematic reviews. Best evidence is indicated by research designs which are least susceptible to bias according to the National Health and Medical Research Council’s (NHMRC) criteria (see Appendix 1). Where methodologically acceptable and applicable, appraised evidence is limited to systematic reviews, meta-analyses, evidence based clinical practice guidelines, health technology assessments and randomised controlled trials (RCTs). Where not available, poorer quality evidence may be considered.
CONFLICT OF INTEREST
None.

THE EFFECT OF CLASSROOM SOUND FIELD AMPLIFICATION AND THE EFFECTIVENESS OF OTOACOUSTIC EMISSION HEARING SCREENING IN
SCHOOL-AGE CHILDREN
iii
EXECUTIVE SUMMARY
Objectives The review was comprised of two areas of investigation and thus had two separate objectives. The first was to critically appraise evidence for the effect of classroom sound field amplification (SFA) on children’s behavioural and learning outcomes. The second was to critically appraise the evidence examining the effectiveness of otoacoustic emissions (OAE) as a method of screening children for hearing impairments.
Methods The literature was searched using the following databases: Amed, Cinahl, Cochrane Central Register of Controlled Trials, Embase, Medline, PsychInfo, and PubMed (last 90 days). The following review databases were also searched: ACP Journal Club, Cochrane Database of Systematic Reviews, Clinical Evidence, DARE database, NHS Economic Evaluation Database, Health Technology Assessment Database, and TRIP database. Information was also sourced from the following organisations: American Speech-Language-Hearing Association (ASHA), Educational Audiology Association (US), National Acoustic Laboratories (Australia), New Zealand Audiological Society, Oticon Foundation in New Zealand and RNID (UK). Wider searches of the internet, handsearching of journals and contacting of authors for unpublished studies were undertaken. Further information from relevant websites detailing projects or providing hearing screening protocols and grades of hearing impairment was sought where necessary.
Sound field amplification searches were of material published from 1990 onwards in English and otoacoustic emission searches were of material published from 1998 onwards in English.
Study selection Studies of sound field amplification were included if they measured the effect of sound field amplification on children’s academic or behavioural outcomes. All school age children were included in this part of the brief and studies of hearing or hearing-impaired children were accepted as well as studies which included children with developmental delays, learning difficulties, attention or behavioural problems.
Excluded studies were those that only focussed on measures of word recognition or perception or had a sample size less than 20.
Studies of otoacoustic emissions were included if they involved a comparison of the test performance of either transient-evoked or distortion-produced emissions with an accepted reference standard, that is, audiometry, tympanometry, auditory brainstem response or a test battery combining accepted reference standards. The topic of interest was the performance of otoacoustic emissions as a hearing screening assessment in young children, therefore studies were included if at least 50% of the sample was aged between three and eight years of age. Excluded studies included normative studies which did not report the test performance outcomes of otoacoustic emissions and studies with a sample size less than 100.
Key results and conclusions Classroom sound field amplification
Overall, evidence of the effect of sound field amplification on children’s academic or behavioural performance is not strong for two main reasons, these being a lack of published studies and poor study design. Many of the studies promoting sound field amplification are unpublished or have been presented as conference papers only and so did not meet the criteria for inclusion in this technical brief.
In addition, poor study design meant many of the published studies were susceptible to response bias. Several studies relied on class teachers to complete measures of children’s behavioural or academic progress and these teachers were not blind to either the rationale of the study or the experimental condition. Teachers could potentially have been influenced by response and expectation bias making the results of these studies less convincing.
The best evidence came from two longitudinal studies, one set in the United States and one in New Zealand. Improvements in children’s learning and listening behaviours were seen in amplified

THE EFFECT OF CLASSROOM SOUND FIELD AMPLIFICATION AND THE EFFECTIVENESS OF OTOACOUSTIC EMISSION HEARING SCREENING IN
SCHOOL-AGE CHILDREN
iv
classrooms. In the New Zealand study children who studied in classrooms with sound field amplification improved to a greater extent than children in unamplified classrooms in standardised tests of listening comprehension, reading comprehension and mathematics. The effect was the same for children with or without a history of middle ear disorders and for children from Pakeha or Maori ethnic groups. There was a trend for lower decile (lower SES) schools to improve more than high decile schools following sound field amplification but this was not significant. Unfortunately, analyses did not include direct comparisons of the control group and intervention group in either of these studies, so the results are less certain.
There is a need for randomised controlled trials investigating the effect of both sound field amplification and classroom acoustic augmentation on children’s academic and behavioural performance before implementing amplification on a wide scale. Standardised academic measures or independent measures of behaviour, such as referrals for poor behaviour, should be utilised to avoid bias due to knowledge of the experimental condition. For measures where standardised assessments are not available independent observers blind to the experimental condition should be utilised.
Otoacoustic emissions
The lack of a true gold standard in audiometric testing of children resulted in studies using pure-tone audiometry, tympanometry, audiograms or a combination of pure-tone and tympanometry as a substitute gold standard, making comparison between the studies more difficult.
Otoacoustic emission testing performed well relative to pure-tone audiometry with a high specificity and a good sensitivity. When compared to tympanometry, otoacoustic emission testing did not perform as well and sensitivity was lower. It may be that otoacoustic emissions are not as sensitive to hearing loss caused by middle ear disorders. In addition, variations between studies in the pass/fail criteria applied to otoacoustic emission, pure-tone and tympanometry tests may have affected test performance.
Two studies manipulated the signal-to-noise ratio to determine the best pass/fail criteria for optimal OAE test performance in young children. The results of these studies suggest that the criteria used for infants and newborns may not be as appropriate for the assessment of young children’s hearing. Optimal signal-to-noise ratios varied for different frequencies and varying the pass/fail criteria for different frequencies improved the sensitivity of the test. One study compared the performance of a test battery combining distortion-produced otoacoustic emissions with tympanometry with the commonly used pure-tone plus tympanometry battery. Further studies are needed to identify the optimal criteria for otoacoustic emission testing and how transient-evoked otoacoustic emissions perform in a test battery with tympanometry relative to a pure-tone/tympanometry test battery.
It appears that otoacoustic testing would be especially suitable for hearing assessment in populations which are difficult to test using pure-tone audiometry, such as children with behavioural problems, or intellectual or physical impairments. It is, however, still subject to difficulties with a small number of children refusing to cooperate for both ears and testing sometimes being affected by ambient noise or breathing difficulties. No studies were identified which assessed the test performance of otoacoustic testing among difficult to test populations however initial feasibility studies have suggested there is potential for this to be successful.
It would appear that otoacoustic emissions could be used to replace pure-tone testing in a test battery with tympanometry to screen for hearing loss but not to replace tympanometry. There is a need for community-based screening using the test battery and comparing it to a pure-tone/tympanometry battery and further investigation of the performance of otoacoustic emission testing in difficult to test populations.
THE EFFECT OF CLASSROOM SOUND FIELD AMPLIFICATION AND THE EFFECTIVENESS OF OTOACOUSTIC EMISSION HEARING SCREENING IN
SCHOOL-AGE CHILDREN
v
TABLE OF CONTENTS
CONTRIBUTIONS BY AUTHORS .................................................................................................. i ACKNOWLEDGEMENTS ............................................................................................................. i DISCLAIMER.............................................................................................................................. i COPYRIGHT ............................................................................................................................... i CONTACT DETAILS .................................................................................................................... i LEVEL OF EVIDENCE CONSIDERED IN TECHNICAL BRIEFS........................................................ ii CONFLICT OF INTEREST............................................................................................................ ii EXECUTIVE SUMMARY ............................................................................................................ iii Objectives................................................................................................................................ iii Methods................................................................................................................................... iii Study selection ........................................................................................................................ iii Key results and conclusions.................................................................................................... iii TABLE OF CONTENTS.................................................................................................................v LIST OF TABLES....................................................................................................................... vi GLOSSARY.............................................................................................................................. vii ABBREVIATIONS........................................................................................................................x BACKGROUND...........................................................................................................................1 Classroom Sound Field Amplification ......................................................................................1 Otoacoustic Emissions ..............................................................................................................1 SCOPE OF THE REVIEW ..............................................................................................................3 REVIEW QUESTIONS ..................................................................................................................3 SELECTION CRITERIA ................................................................................................................3 Study inclusion criteria .............................................................................................................3 Study exclusion criteria.............................................................................................................4 SEARCH STRATEGY...................................................................................................................4 Sound field amplification ..........................................................................................................4 Acoustic emission testing ..........................................................................................................4 Principal sources of information ..............................................................................................5 APPRAISAL METHODOLOGY......................................................................................................5 RESULTS....................................................................................................................................5 OVERVIEW – SOUND FIELD AMPLIFICATION STUDIES ...............................................................7 Settings, samples and study designs..........................................................................................7 Summary of evidence of the effect of sound field amplification in classrooms.........................7 Conclusions .......................................................................................................................12 OVERVIEW – OTOACOUSTIC EMISSION TESTING .....................................................................28 Settings and samples ...............................................................................................................28 Summary of studies .................................................................................................................28 Conclusions .......................................................................................................................34 REFERENCES ...........................................................................................................................52 APPENDIX 1: LEVELS OF EVIDENCE.........................................................................................54 APPENDIX 2:SEARCH STRATEGY .............................................................................................55 APPENDIX 3:EXCLUDED RETRIEVED PAPERS...........................................................................57 APPENDIX 4:APPRAISED RETRIEVED PAPERS ..........................................................................60

THE EFFECT OF CLASSROOM SOUND FIELD AMPLIFICATION AND THE EFFECTIVENESS OF OTOACOUSTIC EMISSION HEARING SCREENING IN
SCHOOL-AGE CHILDREN
vi
LIST OF TABLES
Table 1. Summary of the Well Child Tamariki Ora recommended hearing checks ..........2 Table 2. Order of presentation of the Neale Analysis passages to the two groups
(Arnold and Canning 1999) .................................................................................8 Table 3. Amplification condition for four classes at two schools (Massie et al. 1999) .....8 Table 4. Evidence table of appraised articles relating to the effect of sound field
amplification on behavioural, academic and learning outcomes in children .....14 Table 5 Summary of studies examining the test performance of otoacoustic emission
testing.................................................................................................................33 Table 6. Evidence table of appraised articles relating to the effectiveness of
otoacoustic emissions as a method of hearing testing in school-age children ...36

THE EFFECT OF CLASSROOM SOUND FIELD AMPLIFICATION AND THE EFFECTIVENESS OF OTOACOUSTIC EMISSION HEARING SCREENING IN
SCHOOL-AGE CHILDREN
vii
GLOSSARY
Analysis of variance (ANOVA) – A statistical analysis involving the comparison of variances reflecting different sources of variability.
Auditory brainstem response (ABR) – measures the brainstem response to auditory stimuli (multiple brief duration clicks) and using an electroencephalographic (EEG) recording of the brain activity.
A-weighted decibels – A filter/scale used in the measurement of sound levels weighted to approximate the human ear’s response to sound. A-weighted sound pressure levels are labelled dBA.
Before and after study – A situation in which the investigator compares outcomes before and after the introduction of a new intervention.
Bias – Deviation of results or inferences from the truth, or processes leading to such deviation. Any trend in the collection, analysis, interpretation, publication, or review of data that can lead to conclusions that are systematically different from the truth.
Blinded study – A study in which observers and/or subjects are kept ignorant of the group to which they are assigned. When both observers and subjects are kept ignorant, the study is referred to as double blind.
Cohort study – The analytic method of epidemiologic study in which subsets of a defined population can be identified who are, have been, or in the future may be exposed or not exposed in different degrees, to a factor or factors hypothesised to influence the probability of occurrence of a given disease or other outcome. Studies usually involve the observation of a large population, for a prolonged period (years), or both.
Conductive hearing impairment/loss – Hearing impairment due to the reduction of transmission of sound into the middle ear. Most commonly caused by fluid in the middle ear as a result of acute otitis media or otitis media with effusion. It is usually transient and less severe than sensorineural hearing loss.
Confidence interval – The computed interval with a given probability, e.g. 95%, that the true value of a variable such as a mean, proportion, or rate is contained within the interval. The 95% CI is the range of values in which it is 95% certain that the true value lies for the whole population. Specificity
Cross-sectional study – A study that examines the relationship between diseases (or other health related characteristics), and other variables of interest as they exist in a defined population at one particular time.
Decile rating – A scale used in New Zealand to rate schools based on socioeconomic factors and used to allocate resources. Schools in decile one have the highest proportion of students from low socioeconomic backgrounds. Schools in decile ten have the lowest proportion of low SES students.
Descriptive study – A study concerned with, and designed only to describe the existing distribution of variables, without regard to causal or other hypotheses.
Diagnostic test efficacy – The impact and usefulness of a diagnostic test expressed in terms of its technical properties.
Distortion-produced otoacoustic emissions – low level sounds produced by the cochlear in response to stimuli in the form of pairs of tones of particular frequencies (f1 and f2). Their presence or absence is an indication of cochlear function.
Effectiveness – A measure of the extent to which a specific intervention, procedure, regimen, or service, when deployed in the field in routine circumstances, does what it is intended to do for a specified population.
Evidence table – A summary display of selected characteristics (e.g., methodological design, results) of studies of a particular intervention or health problem.
False negative result – A negative test result in a person who does have the condition being tested for.

THE EFFECT OF CLASSROOM SOUND FIELD AMPLIFICATION AND THE EFFECTIVENESS OF OTOACOUSTIC EMISSION HEARING SCREENING IN
SCHOOL-AGE CHILDREN
viii
False positive result – A positive test result in a person who does not have the condition being tested for.
Frequency – A measurement of pitch measured on a scale in units of Hertz.
Generalisbility – Applicability of the results to other populations.
Grey literature – That which is produced by all levels of government, academics, business and industry, in print and electronic formats, but which is not controlled by commercial publishers.
Mean – A measure of central tendency; the arithmetic average.
Mild hearing loss – In New Zealand, defined as 26-40 dB hearing level in the better ear.
Moderate hearing loss – In New Zealand, defined as 40-65 dB hearing level in the better ear.
Myringotomy – A surgical procedure where a hole is formed in the ear drum.
Negative predictive value (NPV) – The probability a person does not have the disease when the screening test is negative.
Otitis media with effusion OME (glue ear) – Fluid (effusion) in the middle-ear, which is characteristically not accompanied by the symptoms associated with acute otitis media such as pain and fever.
Otoacoustic emissions (OAEs) – low level sounds produced by the cochlear as a by-product of processing sound. Their presence or absence is an indication of cochlear function. OAEs can occur spontaneously (SOAEs) or be evoked by either a tone burst or clicks (transient-evoked OAEs) or pairs of tones (distortion-produced OAEs). They are not a measure of the degree of hearing impairment.
Otoscopy – the observation of the ear drum using an otoscope.
P value – Statistical tests of significance are used to determine the probability that an association could have occurred by chance alone, if no association really exists. By convention, if the p value is less than 0.05 then the association is considered to be statistically significant.
Positive predictive value (PPV) – The probability a person actually has the disease when the screening test is positive.
Prevalence – The number of events in a given population at a designated time (point prevalence) or during a specified period (period prevalence).
Pure-tone audiometry – A hearing test administered by a trained tester using a calibrated instrument to produce tones of variable intensity that measures the subjects response and hence hearing level.
Randomised controlled trial – An epidemiologic experiment in which subjects in a population are randomly allocated into groups to receive or not receive an experimental preventive or therapeutic procedure, manoeuvre or intervention. RCTs are generally regarded as the most scientifically rigorous method of hypothesis testing available in epidemiology.
Recall bias – Systematic bias due to differences in accuracy or completeness of recall or memory of past events or experiences.
Reference standard – An independently applied test that is compared to a screening or diagnostic test being evaluated in order to verify the latter’s accuracy. A reference standard, therefore, provides an accurate or “truth” diagnosis for verification of positive and negative diagnoses. It is sometimes described as providing “final truth determination”.
Reverberation time (RT) – The time required for a sound in a room to decay by 60 dB.
Screening – Screening is the examination of asymptomatic people in order to classify them as likely or unlikely to have the disease that is the object of screening. The aim of screening is to detect disease before it is clinically apparent, and for this to improve the outcome for people with the disease.
Selection bias – Any error in selecting the study population such that the people who are selected to participate in a study are not representative of the reference population or, in analytic studies the comparison groups are not comparable.
Sensitivity (Se) – Sensitivity is the proportion of truly diseased persons in a screened population who are identified as diseased by a screening test. Sensitivity is a measure of the probability of correctly diagnosing a case, or the probability that any given case will be identified by the test.

THE EFFECT OF CLASSROOM SOUND FIELD AMPLIFICATION AND THE EFFECTIVENESS OF OTOACOUSTIC EMISSION HEARING SCREENING IN
SCHOOL-AGE CHILDREN
ix
Sensorineural hearing impairment/loss – Hearing impairment that is the result of damage to the inner ear or the auditory nerve. It is usually more permanent and severe than conductive hearing loss.
Signal-to-noise ratio (SNR) – The ratio of a voice (signal) to the background noise.
Sound field amplification (SFA) – Use of an FM receiver/amplifier, speakers and microphone to amplify a voice and create an even distribution of sound in a room.
Sound pressure level (SPL) – The level of noise, usually expressed in decibels, as measured by a standard sound level meter with a microphone.
Specificity (Sp) – The proportion of truly non-diseased persons who are so identified by a screening test. It is a measure of the probability of correctly identifying a non-diseased person with a screening test.
Standard deviation (SD) – A measure of variability; the square root of the variance. Expresses variability in terms of the original units of measure.
Transient-evoked otoacoustic emissions – low level sounds produced by the cochlear in response to stimuli in the form of tone bursts or clicks. Their presence or absence is an indication of cochlear function.
True negative – A test correctly identifies a person without the disease.
True positive – A test correctly identifies a person with the disease.
Tympanometry – (oto-admittance audiometry/impedance audiometry) – a technique for assessing middle ear function and the presence of middle ear fluid. It measures the ability of the ear drum to react to sound energy and hence is an indirect measure of the presence of fluid in the middle ear. It is not a measure of hearing impairment.
Whole wave reproducibility (REPROW) – measure of the correlation between two independent measurements of otoacoustic emission responses.

THE EFFECT OF CLASSROOM SOUND FIELD AMPLIFICATION AND THE EFFECTIVENESS OF OTOACOUSTIC EMISSION HEARING SCREENING IN
SCHOOL-AGE CHILDREN
x
ABBREVIATIONS
ABR Auditory brainstem response
ASHA American Speech-Language-Hearing Association
ATSI Aboriginal and Torres Strait Islander
CI Confidence interval
dB Decibel
dBA A-weighted decibels
CHAPPS Children’s Auditory Processing Performance Scale
DPOAE Distortion-produced otoacoustic emission
ECLB Evaluation of Classroom Listening Behaviours
ECP Environmental Communication Profile
FM Frequency modulated
Hz Hertz
HL Hearing level
ESL English as a second language
EFL English as a first language
FNR False negative rate
FPR False positive rate
kHz Kilohertz
LLO Listening and Learning Observation
MeSH Medical Subject Headings
NAL National Acoustics Laboratory
NPV Negative predictive value
NRA Neale Analysis of Reading Ability
NZ New Zealand
NZHTA New Zealand Health Technology Assessment
OAE Otoacoustic emission
OME Otitis media with effusion
PAT Progressive Achievement Test
peSPL Peak sound pressure level
PI Pacific Islander
PPV Positive predictive value
PTA Pure-tone audiometry
RCT Randomised controlled trial
REPROW Whole wave reproducibility
RIHAP Rhode Island Hearing Assessment Project
RT Reverberation time
Se Sensitivity
SFA Sound field amplification

THE EFFECT OF CLASSROOM SOUND FIELD AMPLIFICATION AND THE EFFECTIVENESS OF OTOACOUSTIC EMISSION HEARING SCREENING IN
SCHOOL-AGE CHILDREN
xi
SIFTER Screening Instrument for Targeting Educational Risk
Sp specificity
SPL Sound pressure level
SNR Signal-to-noise ratio
SOAE Spontaneous otoacoustic emission
TEOAE Transient-evoked otoacoustic emission
UK United Kingdom
USA United States of America
WHO World Health Organisation


THE EFFECT OF CLASSROOM SOUND FIELD AMPLIFICATION AND THE EFFECTIVENESS OF OTOACOUSTIC EMISSION HEARING SCREENING IN
SCHOOL-AGE CHILDREN
1
BACKGROUND
This Technical Brief was requested by Dr Pat Tuohy, Chief Advisor of Child and Youth Health, New Zealand Ministry of Health.
The review was comprised of two areas of investigation and thus had two separate aims. The first was to critically appraise evidence for the effect of classroom sound field amplification (SFA) on children’s behavioural and learning outcomes. The second was to critically appraise the evidence examining the effectiveness of otoacoustic emissions (OAE) as a method of screening children for hearing impairments.
Classroom Sound Field Amplification Classrooms in New Zealand have been criticised for having poor acoustics in an environment when current methods of teaching rely on children being able to hear and attend to the speech of the teacher. Poor acoustics make teaching, listening and hearing more difficult for students and teachers by creating a poor signal (teacher’s voice) to background noise ratio (SNR) and too much sound reverberation (Oticon Foundation in New Zealand 2002). Noise levels, or a poor signal-to-noise ratio, have been found to impair children’s speech perception and recognition as well as affecting their ability to attend to lessons, resulting in a decrease in academic performance and an increase in inappropriate behaviour (Rosenberg 1995). Sound field amplification (SFA) uses an FM receiver, speakers and a microphone to transmit and amplify the teacher’s voice in order to even out the sound field in the classroom and thus provide equal “acoustic access” (Massie et al. 2004) for all children. It aims to improve the signal-to-noise ratio in classrooms, increasing children’s ability to hear the teacher and thereby improving academic performance and behaviour.
Otitis media with effusion (OME) is the most common cause of hearing impairment in school-age children. An evaluation of screening programmes for the detection of OME and conductive hearing loss in preschool and new entrant children was conducted by the NZHTA in 1998 (Cook 1998). The review reported a prevalence of about 7-8% in 3-5 year-old children in New Zealand with a significantly higher prevalence in Maori and Pacific Island children at the same age (16-17%). While many cases spontaneously resolve, about 50% of children with OME will experience hearing impairment. A recent Cochrane Collaboration review (Lous et al. 2005) found that grommets and antibiotic treatment measures, the two most common ways of treating OME, were effective in treating OME in the short-term but not as long-term treatments. Because of the high prevalence of OME, at any one time a high percentage of children may suffer from fluctuating hearing levels. SFA has been proposed as a potential way of improving the hearing of all children in a classroom, especially children with mild to medium hearing loss, and those with learning, attention and behavioural difficulties or disorders.
The effects of SFA on academic achievement and behaviour have been investigated in many different settings and with many different age groups and populations of children. In the United States SFA has been employed since the 1980s and a large longitudinal study (Mainstream Amplification Resource Room Study) during the 1980s provided evidence of benefits to children with minimal – mild hearing loss (15-40 dB) when teachers’ voices were amplified (Rosenberg 1995). SFA has since been promoted as potentially beneficial to all students and improvements in reading comprehension, vocabulary, phonemic awareness, mathematical concepts, speech recognition and perception have been reported in classrooms and schools who employ SFA systems. Increases in attending behaviours and decreases in inappropriate behaviour have also been noted. In addition, teachers have responded positively to SFA and reported decreased vocal strain and fatigue (Rosenberg 1995).
Otoacoustic Emissions The Well Child Tamariki Ora Framework covers screening, education and support services offered to all New Zealand children from birth to five years, and to their families/whānau. The Well Child Schedule (Ministry of Health, 2002) includes recommended tests of hearing from newborns to school-age children and the current recommended tests are outlined below. The current screening protocol for school-age children in New Zealand employs tympanometry at age 3 years and tympanometry and audiometry at age 5 years. Tympanometry is a test of middle-ear function and involves the measure of sound waves sent down the ear canal. The resulting tympanogram can be examined to assess the function of the eardrum and particular types of tympanograms are associated with OME. Pure-tone audiometry (PTA) is a hearing test that measures the level of hearing in each ear. Tones of variable

THE EFFECT OF CLASSROOM SOUND FIELD AMPLIFICATION AND THE EFFECTIVENESS OF OTOACOUSTIC EMISSION HEARING SCREENING IN
SCHOOL-AGE CHILDREN
2
intensity are played into the ear and the child is trained to use a behavioural response to indicate when they have heard a tone (Cook 1998).
Table 1. Summary of the Well Child Tamariki Ora recommended hearing checks
Age Investigation
Birth Complete newborn well child check including hearing risk assessment and detailed examination of ears Referral for ABR by audiologist if risk factors for congenital deafness
6 weeks ‘Can Your Child Hear?’ Questionnaire administered by health professional
8 months ‘Can Your Child Hear?’ Questionnaire administered by health professional
15 months ‘Can Your Child Hear?’ Questionnaire administered by health professional
21-24 months ‘Can Your Child Hear?’ Questionnaire administered by health professional
3 years Screening Tympanometry ‘Can Your Child Hear?’ Questionnaire administered by health professional
5 years Screening Tympanometry Screening Audiometry
Any Age Referral to vision hearing technician or audiologist if any parental or professional concern about vision or hearing
Source: Well Child Schedule, Ministry of Health (2002) cited in (Thabrew 2003)
As part of a review of the Well Child Tamariki Ora Framework, the Ministry of Health would like to investigate the potential of OAEs as a method of screening school-age children for hearing impairments. OAEs are low intensity signals generated by the cochlea (inner ear) in non-hearing impaired individuals as a by-product of processing sound (Kemp 2003). The absence of these emissions indicates that the cochlear is not functioning properly. They may occur spontaneously (SOAEs) or in response to acoustic stimulation (evoked OAEs) and can be recorded by placing a tiny probe (microphone and earphone) at the entrance to the ear canal. The recorded emissions can then be analysed and used to identify whether the subject has a hearing impairment (Medicare Services Advisory Committee (MSAC) 1999). This method can be used as a screening test but it is unable to distinguish the degree of hearing loss (Abdala and Visser-Dumont 2001).
Evoked OAEs fall into two main categories, distortion-produced (DP) and transient-evoked (TE). DPOAEs are produced when two pure-tones (f1 and f2) are presented to the ear simultaneously. Tones are presented across a range of frequencies (0.5 – 8.0 kHz) and the elicited emissions are plotted in a DP-gram. The strongest emissions are produced when the f1 tone is presented at 55-65 dB SPL with approximately 10 dB difference between f1 and f2 and a frequency ratio of 1:1.2 (f1:f2) (Abdala and Visser-Dumont 2001). For TEOAEs the stimuli are either brief duration pure-tone bursts or pips/clicks. Clicks will elicit emissions up to 4.0 kHz while the pure-tone bursts elicit emissions of the same frequency as the tone (Kemp 2003). The fit of the ear probe, minimising noise in the environment and restricting participant movement are important for the accurate measure of both DPOAEs and TEOAEs (Nozza et al. 1997).
PTA relies on the child comprehending what is required of them during the test and performance is affected by the child’s levels of motivation and attention. Many groups of children, for instance children with developmental delays, attention problems, or learning difficulties, are unable to provide reliable responses during this test and so are excluded from these programmes or fail the test for reasons other than hearing impairment (Lyons et al. 2004). In contrast, OAE measurement is rapid, non-invasive and objective and requires no behavioural response or active cooperation from the child.
The test performance of OAEs has mostly been examined in neonatal populations (Driscoll et al. 2001) and use of this method as a means of detecting hearing impairment in neonates and infants is widely accepted. Less is known about the ability of OAEs to detect hearing impairment in preschool and school-age children and their effectiveness as a screening method is the focus of this technical brief. Both TEOAEs and DPOAEs have been measured and compared to pure-tone audiometry and tympanometry results in school-age populations. Both rely on both inner and middle ear performance and so have potential as a method of detecting middle-ear problems as well as hearing impairment (Nozza et al. 1997).
A common methodological limitation of studies assessing the test performance of OAEs is the failure to compare OAE to an acceptable ‘gold-standard’ hearing test. This technical brief includes only those

THE EFFECT OF CLASSROOM SOUND FIELD AMPLIFICATION AND THE EFFECTIVENESS OF OTOACOUSTIC EMISSION HEARING SCREENING IN
SCHOOL-AGE CHILDREN
3
studies which compared the performance of either TEOAEs or DPOAEs to an appropriate audiological test, such as pure-tone audiometry, tympanometry or auditory brainstem response (ABR).
SCOPE OF THE REVIEW
The Ministry of Health is aiming to examine options for testing primary school age children’s hearing as part of a review of the Well Child Tamariki Ora Framework. This part of the report was concerned with the effectiveness of otoacoustic emissions as a hearing screening test in school-age children and so studies were included if at least 50% of the sample was comprised of 3-8 year-old children. Studies were also required to compare the performance of either transient-evoked or distortion-produced OAEs to an acceptable reference standard. Both hearing and hearing-impaired populations were included.
The scope of this report also reflects the Ministry of Health’s priority to investigate and develop better learning environments and to ensure all children have equal access to positive learning environments. To this end, both hearing and hearing-impaired populations were included in the scope of the report as well as children with developmental delays, learning difficulties, attention or behavioural problems. Studies were included if they examined the effect of sound field amplification on children’s classroom behaviour or academic achievement. The scope of this part of the report included all school age children, including primary and secondary school pupils. The focus of the report was academic and behavioural performance and so did not include an examination of the literature regarding speech recognition or perception.
REVIEW QUESTIONS
1) What is the effect of sound field amplification on classroom behaviour and academic performance in school-age children?
2) How effective are otoacoustic emissions compared with audiological testing as a method of screening 3-8 year-old children for hearing impairment?
SELECTION CRITERIA
Study inclusion criteria Publication type
For sound field amplification, studies published between 1990 and November, 2006 inclusive in the English language, including primary (original) research (published as full original reports) and secondary research (systematic reviews and meta-analyses) appearing in the published literature. For otoacoustic emissions, studies published between 1998 and November, 2006 inclusive in the English language, including primary (original) research (published as full original reports) and secondary research (systematic reviews and meta-analyses) appearing in the published literature.
Context
Studies reporting on the effect of classroom sound field amplification on classroom behaviour or academic performance in primary or secondary school-age children. Studies reporting on the effectiveness of otoacoustic emissions a method of hearing screening in school-age children.
Outcomes
For sound field amplification studies measures of academic performance, classroom behaviour (e.g. attention, on-task behaviour), social interaction and perceptions of the effect of sound field amplification were presented in the results. For otoacoustic emission studies measures of the effectiveness of the assessment as a diagnostic test, sensitivity, false positive rate, positive predictive value (PPV) and negative predictive value (NPV) were presented in the results.
Study design
Randomised controlled trials, pseudorandomised controlled trials, comparative studies, case series, either post-test or pre-test/post-test (“before and after”) studies were included. Uncontrolled studies were not included.

THE EFFECT OF CLASSROOM SOUND FIELD AMPLIFICATION AND THE EFFECTIVENESS OF OTOACOUSTIC EMISSION HEARING SCREENING IN
SCHOOL-AGE CHILDREN
4
Sample size
For sound field amplification, studies with at least 20 human participants. For otoacoustic emissions studies with at least 100 human participants (200 ears) and at least 50% of the sample aged between 3 and 8 years of age.
Study exclusion criteria Research papers were excluded from full appraisal if they:
were descriptive studies only and did not include a comparison with a reference standard
did not compare otoacoustic emission test performance with an acceptable reference standard
for sound field amplification studies, did not include a measure of academic performance, classroom behaviour, listening or perceptions of sound field amplification. For instance, studies of speech perception in amplified versus unamplified environments were excluded.
For otoacoustic emission studies, did not include at least 50% of the sample between 3 and 8 years of age. Studies of infants and newborns were excluded as were studies of adult populations.
were uncontrolled
were not published in English
were “correspondence”, book chapters, conference proceedings, abstracts
reported studies with samples of fewer than 20 participants for sound field amplification or fewer than 100 participants for otoacoustic emissions
reported animal studies
did not clearly describe their methods and results, or had significant discrepancies
SEARCH STRATEGY
Sound field amplification Searches were of material published from 1990 onwards in English and were completed on 22 November 2006.
Main search terms
Free text terms (used in all databases): sound field amplification, classroom amplification, (classroom and sound and (amplif$ or augment$)), (sound and field and (amplif$ or augment$))
Acoustic emission testing Searches were of material published from 1998 onwards in English and were completed on 23 November 2006.
Main search terms
MeSH headings (Medline subject headings): otoacoustic emissions-spontaneous, child, child-preschool, mass screening
Embase subject headings (where different from Medline): exp otoacoustic emission, auditory screening, screening, screening test
Cinahl subject headings (where different from Medline): hearing screening
Additional free text (used in all databases): otoacoustic, oto-acoustic, screen$, school$, child$

THE EFFECT OF CLASSROOM SOUND FIELD AMPLIFICATION AND THE EFFECTIVENESS OF OTOACOUSTIC EMISSION HEARING SCREENING IN
SCHOOL-AGE CHILDREN
5
Exclusions: articles with neonate(s), neonatal, newborn, infant, or new born in the title were excluded
Principal sources of information The following databases were searched using the search strategy outlined in Appendix 2.
Bibliographic databases Amed Cinahl Cochrane Central Register of Controlled Trials Embase Medline PsychInfo PubMed (last 90 days)
Review databases ACP Journal Club Cochrane Database of Systematic Reviews Clinical Evidence DARE database NHS Economic Evaluation Database Health Technology Assessment Database TRIP database
Other sources of information American Speech Language Hearing Association (ASHA) http://www.asha.org/default.htm Educational Audiology Association (US) http://www.edaud.org/ National Acoustic Laboratories (Australia) http://www.nal.gov.au New Zealand Audiological Society http://www.audiology.org.nz/Default.aspx Oticon Foundation in New Zealand http://www.oticon.org.nz RNID (UK) http://www.rnid.org.uk
Cited references of retrieved articles were scanned for additional potentially eligible papers.
APPRAISAL METHODOLOGY
Summaries of appraisal results are shown in tabular form (known as Evidence Tables) which detail study design, study setting, sample, methods, results, reported conclusions and NZHTA reviewer conclusions/comments based on the limitations and validity of the study.
The evidence presented in the selected studies were assessed and classified according to the NHMRC’s revised hierarchy of evidence (Appendix 1).
RESULTS
From the above search strategy we identified, 163 potentially relevant otoacoustic emissions articles/abstracts and 61 potentially relevant sound field amplification articles of which 74 were retrieved. Of these retrieved articles, 59 were excluded. These papers are presented in Appendix 3.
Studies retrieved in full text were excluded for the following reasons:
Narrative review or background article (n=12)
Descriptive study with no comparison made with a reference standard (n=15)
Inappropriate gold standard reference employed (n=1)
Measures not appropriate or of interest (sound field amplification) (n=7)
Methodology not described fully (n=2)
Uncontrolled (n=2)

THE EFFECT OF CLASSROOM SOUND FIELD AMPLIFICATION AND THE EFFECTIVENESS OF OTOACOUSTIC EMISSION HEARING SCREENING IN
SCHOOL-AGE CHILDREN
6
Sample size not within inclusion criteria (n=8)
Sample age range not within inclusion criteria (n=11)
Unable to obtain full text (n=1)
15 retrieved articles were appraised (listed in Appendix 4). Included papers are presented in evidence tables within each section of the report (Tables 4 and 6). For classroom sound field amplification included studies were all level III-3 and above according to NHMRC’s hierarchy of evidence, including one controlled clinical study, one pseudorandomised cross-over study (two papers), two prospective cohort studies and two before-and-after studies. All the otoacoustic emissions studies were cross-sectional in design and were graded III-2 according to NHMRC’s hierarchy of evidence (NHMRC 2005).

THE EFFECT OF CLASSROOM SOUND FIELD AMPLIFICATION AND THE EFFECTIVENESS OF OTOACOUSTIC EMISSION HEARING SCREENING IN
SCHOOL-AGE CHILDREN
7
OVERVIEW – CLASSROOM SOUND FIELD AMPLIFICATION
The search identified seven eligible papers investigating the effect of sound field amplification in classrooms on children’s academic performance or behaviour. Below is an overview of study designs and aspects of quality represented by these studies.
Full details of the papers appraised, including methods, key results, limitations and conclusions, are provided in evidence Table 4 (pages 15-27).
Settings, samples and study designs Of the seven identified papers, one was a controlled clinical study (Arnold and Canning 1999), one was a pseudorandomised cross-over study and was reported in two papers (Massie et al. 1999; Massie et al. 2004), two were prospective cohort studies (Rosenberg et al. 1999; Heeney 2006) and two were before and after studies (McSporran et al. 1997; Valente 1998). The sample sizes ranged from 25 to 1319 participants. The two prospective cohort studies were graded III-2 and followed participants for varying lengths of time with the intervention (amplification) being implemented for between 12 weeks and 1 year. The controlled clinical study was graded III-2 and the pseudorandomised cross-over study III-1. The two before-and-after studies were graded III-3. All of the studies utilised three- or four-speaker amplification systems.
Of the seven studies, six investigated the effect of sound field amplification in mainstream primary school classrooms. One of the studies was set in a university and compared the performance of college students with and without sound field amplification (Valente 1998). Of the six studies set in primary schools, five used no selection criteria in determining which participants would be included. One of the studies (McSporran et al. 1997) included only the children in the class who scored poorly on a behaviour measure. A study set in New Zealand (Heeney 2006) included schools on the basis of their decile rating, which is based on the socioeconomic status of pupils. Two of the studies included only younger primary school children (5 – 8 year-olds), one study included older primary school age children (8-11 year-olds) and two studies included children from 5 – 11 years of age, the equivalent of Year 1 to Year 6 in New Zealand. Four of the six studies were small in sample size and ranged from 2 – 4 classes. Two of the studies were large with (Rosenberg et al. 1999) comparing 30 experimental and 30 control classes and (Heeney 2006) 30 experimental and 13 control classes.
Listening behaviours were measured in three of the seven studies (Rosenberg et al. 1999; McSporran et al. 1997; Heeney 2006), reading comprehension or skills were measured in three studies (Arnold and Canning 1999; Rosenberg et al. 1999; Heeney 2006) and mathematics performance in two studies (Rosenberg et al. 1999; Heeney 2006). (Massie et al. 1999, 2004) focussed on communicative behaviour in the classroom under amplified and unamplified conditions and (Valente 1998) compared college students’ examination performance. (Arnold and Canning 1999) also included measures of intelligence and auditory memory and (Heeney 2006) measures of phonological skills in the younger students.
Five of the seven studies included questionnaires of students’ and teachers’ perceptions of the sound field amplification (Valente 1998; McSporran et al. 1997; Rosenberg et al. 1999; Heeney 2006; Arnold and Canning 1999). Questionnaires were either structured questions with limited response options or asked for general comments about the effectiveness of sound field amplification. There were between 4 and 14 items per questionnaire and response options varied from a yes/no structure to 6-point response options ranging from strongly disagree to strongly agree. Questionnaires were completed by children or teachers in the intervention group only and so there was no comparison with a control group.
Summary of evidence of the effect of sound field amplification in classrooms Arnold and Canning (1999) compared the reading comprehension scores of children who completed spoken comprehension tests in an amplified condition (FM), where the test was administered using 3 speakers to create an even sound field, or a non-amplified condition (non-FM) where the comprehension test was played through one speaker only. Two classes (n=49 pupils) of 8-11 year-old children completed the Neale Analysis of Reading Ability (NRA), a measure of auditory memory (Digit Memory Span test) and a non-verbal intelligence test. The same six NRA passages were played to each group but in a different order and with different passages amplified (see Table 2 below). Two forms of the NRA were used with each form consisting of 3 progressively more difficult levels. Children’s comprehension scores were compared for the FM and non-FM conditions and controlled for

THE EFFECT OF CLASSROOM SOUND FIELD AMPLIFICATION AND THE EFFECTIVENESS OF OTOACOUSTIC EMISSION HEARING SCREENING IN
SCHOOL-AGE CHILDREN
8
gender, age, auditory memory and non-verbal intelligence. Children were randomly allocated to one of the groups and passages alternated between FM and non-FM administrations.
Table 2. Order of presentation of the Neale Analysis passages to the two groups (Arnold and Canning 1999)
Group One Group Two
Form 1, Level 1 (non-FM) Form 1, Level 2, (FM) Form 1, Level 3 (non-FM) Form 2, Level 1 (FM) Form 2, Level 2 (non-FM) Form 2, Level 3 (FM)
Form 2, Level 1 (non-FM0 Form 2, Level 2 (FM) Form 2, Level 3 (non-FM) Form 1, Level 1 (FM) Form 1, Level 2 (non-FM) Form 1, Level 3 (FM)
There was a significant difference between the overall FM and non FM reading comprehension scores and a significant interaction between test difficulty and FM condition. For amplified passages the comprehension scores were higher than for unamplified passages. The difference between amplified and non-amplified scores was greatest for the highest difficulty level. There was no correlation between improvement in comprehension and auditory memory, age, gender or non-verbal intelligence. Because the test required written responses from children, the participants’ performance may have been influenced by their literacy skills, especially for the English as a Second Language (ESL) children. No information was provided regarding the scoring of the comprehension test or whether the markers were blind to the amplification condition. It is also debatable whether listening to a taped voice during a comprehension test is representative of amplifying a teacher’s voice during classrooms lessons, and so whether this study could be used to provide evidence of the effect of sound field amplification in a regular classroom setting. Students also responded to five positively-framed yes/no questions about their impression of sound field amplification with 54% of children reporting an improvement in hearing with the amplification system.
Massie et al. (1999) investigated the effect of sound field amplification in classrooms on the communicative behaviour of indigenous schoolchildren in Queensland, Australia. Sixty-four Aboriginal and Torres Strait Islander (ATSI) children ranging in age from 6 – 10 years with a mean of 8 years 2 months, were given regular lessons in amplified and unamplified classrooms for eight weeks. Both the classes alternated at two week intervals between using the four-speaker amplification system and not using the system, with the two possible orders of amplification (Table 3). Interaction in the classroom was measured using the Environmental Communication Profile (ECP). Two observers collected data on the type, direction and source of communication in the classroom for weeks 2, 4, 6 and 8 of the study. Each child was observed four times during an observational session for 30 seconds each time followed by a 10 second data recording period. Children’s hearing levels were measured before and after the trial, and occupied and unoccupied classroom acoustics were measured prior to amplification of the classrooms. Pre and post-trial hearing measurements indicated that hearing loss was relatively high in the sample. Signal-to-noise ratios improved in amplified periods but the authors also noted that the signal-to-noise ratio in amplified periods was still well below the +15 dB level recommended by the American Speech-Language-Hearing Association (ASHA) which may have contributed to the lack of significance of some of the findings.
Table 3. Amplification condition for four classes at two schools (Massie et al. 1999)
Week 1 and 2 Week 3 and 4 Week 5 and 6 Week 7 and 8
Classes 1 and 3 ON OFF ON OFF
Classes 2 and 4 OFF ON OFF ON
The percentage of change in communication was compared for amplified and unamplified weeks. Verbal communication increased for children and teachers during amplified periods. There was no significant difference in nonverbal communication. Children’s initiations to the teacher increased 14% and initiations to the class decreased 29%. Indirectly prompted interactions increased 13% with no

THE EFFECT OF CLASSROOM SOUND FIELD AMPLIFICATION AND THE EFFECTIVENESS OF OTOACOUSTIC EMISSION HEARING SCREENING IN
SCHOOL-AGE CHILDREN
9
overall change in total interactions. These results were interpreted as being indicative of a change in communication dynamics in the classroom and suggesting that the children were being more attentive to the teacher and that the teacher had more control over the classroom. It is difficult to confirm these conclusions because measures of classroom behaviour and attention were not included in the study. Inter-observer agreement was reasonably high (67-77% agreement, mean = 74%) and the method of data collection for communication data was sound. Unfortunately, because it was necessary for the observers to be in the classroom during data collection, it was not possible to blind them to the amplification condition and this may have affected their coding of children’s interactions.
Teachers also completed a measure of children’s academic and classroom behaviour (Screening Identification for Targeting Educational Risk, SIFTER) with pre- and post-intervention and results reported in a subsequent paper (Massie 2004). Teachers observed a significant improvement in overall score (pre=47.95, post=50.52, p<0.007) and in the subtests for attention (pre=8.17, post=9.27, p<0.001) and communication (pre=9.60, post=10.4), p<0.004) but no significant difference in scores for academics, communication or school behaviour. The difference in scores were small and the SIFTER is comprised of three items per subtest, making it difficult to interpret the real impact of these changes on children’s performance. Teachers were not blind to the rationale behind SFA or the intervention condition. This study provides an indication of the potential changes in classroom communication in indigenous school children in Australia but lacks generalisability to other populations. Lack of participation in the classroom is a particular problem in ATSI children but it may not be as relevant a measure in other population groups. It would be useful to have information on behaviour in the classroom or standardised measures of academic achievement to generalise to other populations and settings.
Rosenberg et al. (1999) conducted a three-year study of a large sample of 5-8-year-old children (Phase 1: n=1319, Phase 2: n=735). In phase one, 30 classrooms were amplified with a four-speaker amplification system and 30 control classrooms remained unamplified. All 60 classes were followed for 12 weeks with pre-, mid- and post-trial observations completed. A subset of students (n=855) in 20 control and 20 amplified classrooms were followed for 30 weeks with pre-, 6-weeks, 12-weeks, 21-weeks and 30-weeks observations completed. In Phase 2, 34 classrooms were amplified for four weeks with a four-speaker system and pre- and post-trial data were collected from 431 students, however there was no control group for this phase. Pre-trial hearing screening (pure-tone audiometry plus tympanometry) was completed for 1252 participants (95%) in phase 1. Schools were recruited to the study based on their principal’s interest in the project and the principal then recommended teachers to join the study. Training in the utilisation of the amplification system was provided to teachers in phase 1. Experimental and control classes were matched for grade but no other variables were controlled for. Demographic characteristics for the experimental and control groups, including otological history and the percentage of children receiving specialised school services were compared and no significant differences were found other than a higher incidence of colds for the control group.
Teachers’ rated all the children in their class using the Listening and Learning Observation Schedule (LLO) which compares students’ listening behaviours and academic performance to other students in the class with a higher score indicating better performance in listening and learning (15 items, maximum score = 75). A random selection of ten students in each class was also examined using the Evaluation of Classroom Listening Behaviours (ECLB) (10 items rated on a five-point scale) with a maximum score of 50. The mean difference in LLO scores were compared for pre-mid, mid-post, and pre-post observations for the experimental and control groups. The amplified classrooms showed a significant increase in total LLO scores between the pre- and mid-trial observations (difference = 6.44) and the pre- and post-trial observations (difference = 7.49). The unamplified classrooms showed a significant difference between the mid- and post-trial (difference = 1.14) and the pre- and post-trial observations (1.79). Comparisons were also made for the subsections of the LLO (listening/academic behaviours/academic skills). For all three subsections the amplified classrooms showed a significant increase in scores between the pre- and post-trial observations (listening behaviours difference = 5.15; academic behaviours difference = 1.42; academic skills difference = 1.03). The unamplified classrooms also showed a significant increase between pre- and post-trial observations for listening behaviours (difference = 0.96) and academic skills (difference = 0.53). The mean difference in ECLB scores were compared for pre-, mid- and post-trial observations for the experimental and control groups. The amplified classrooms showed a significant increase in scores between the pre- and mid-trial (difference = 4.67) and the pre- and post-trial scores (difference = 5.37). There was no difference for the unamplified classrooms. Greatest improvement was seen for the kindergarten students (approximately 5-year-olds).

THE EFFECT OF CLASSROOM SOUND FIELD AMPLIFICATION AND THE EFFECTIVENESS OF OTOACOUSTIC EMISSION HEARING SCREENING IN
SCHOOL-AGE CHILDREN
10
A subset of students was followed for 30 weeks during which time five observations using the LLO and ECLB were completed. Mean total scores were reported for the amplified and unamplified classrooms for each of the observations, however the differences between groups were not statistically tested. The amplified classrooms scored higher than the unamplified classrooms for all observations except pre-trial for both the LLO and the ECLB. Schools were selected based on their interest in the project and it is possible that this meant principals more positive about SFA were more likely to be included. In addition, principals of selected schools then recommended which teachers should be included in the study which may have provided another source of selection bias. Teachers’ in the SFA group received training prior to implementation of the system which included information about strategies for improving student listening and learning behaviours, suggestions for acoustical modifications as well as the benefits and use of SFA. It is possible that this may have influenced the way they completed the listening behaviours questionnaires and contributed to both an expectation and response bias.
Students, teachers, parents and school administrators all completed questionnaires regarding the effect of sound field amplification during the trial period. A five-item questionnaire was completed by 663 children in phase one and 558 children in phase two and narrative comments were also invited from the children. Questions were generally positively-framed (e.g. It is easier to hear my teacher when he/she uses the microphone), and this may have influenced respondents to make an affirmative response. In addition teachers’ administered the questionnaire and it is possible the children may have been influenced by the perceived expectations of the teacher. A 12-item questionnaire with a five-point response scale (strongly agree – strongly disagree) was completed by teachers and revealed generally positive perceptions of the effect of amplification on class performance.
McSporran et al. (1997) compared the listening behaviours of children in two classrooms before and after a five month sound field amplification trial utilising a 4-speaker amplification system. In school A there were 35 children of whom 10 children were selected to be a part of the target group based on their failure of an academic performance and classroom behaviour assessment. In school B there were 30 children of whom 15 formed the target group. Hearing assessments were completed with both target groups prior to the introduction of the amplification system. In school A all children were within normal range for both ears. In school B children in the EFL (English as a First Language) group were within normal range but children in the ESL (English as a Second Language) group were not. Pure-tone audiometry and a parental questionnaire were used to complete the hearing assessments and it is possible that the poor results obtained by children in the ESL group were partly as a result of not understanding the requirements of the test.
The Children’s Auditory Processing Performance Scale (CHAPPS) was completed by teachers’ before and after the 5 month intervention period. The CHAPPS compared children to others in their class for 6 domains of listening behaviour. Response choices range from ‘less difficulty than others’ (+1) to ‘cannot function at all’ (-5), with a score range of +36 to -180. There was an increase in CHAPPS score for target group A following the intervention period from -1.87 to -1.46. In school B, there was no increase for EFL children and the group overall. There was an increase for ESL children from -1.87 to -1.29 but this was not significant. A significant difference between the number of children with an increase in score and the number of children with a decrease in score was found for group A and B combined and target group A alone but not for target group B. School B included 12/30 children who used English as their second language whereas all children in school A used English as their first language. It is possible that children in school B failed the initial academic and behavioural assessment, which assigned them to the target group, because of their English language ability rather than behaviour problems.
The change in CHAPPS score before and after introduction of the amplification system was very small, although it was statistically significant, and the sample size was very small, bringing into question the generalisability of the findings. Teachers were not blind to the amplification condition and may have exhibited response bias in their evaluation of the participants. The authors noted that the ESL children were undergoing language tuition during the five-month period of the intervention and it may have been this, rather than the amplification, which led to an improvement in their listening behaviours. No information was provided regarding the acoustic conditions when the amplification system was being used, so it is difficult to judge whether there was a decrease in reverberation time and an increase in signal-to-noise ratio with the implementation of the system. A 14-item teacher questionnaire and a five item child questionnaire were included in the measures. Both questionnaires included both positively-framed and negatively-framed questions with the child questionnaire being read aloud by class teachers. Teachers noted an improvement in the learning environment and better class control with the

THE EFFECT OF CLASSROOM SOUND FIELD AMPLIFICATION AND THE EFFECTIVENESS OF OTOACOUSTIC EMISSION HEARING SCREENING IN
SCHOOL-AGE CHILDREN
11
use of amplification equipment and strongly disagreed with statements suggesting amplification had decreased listening skills or class participation.
Valente (1998) compared the exam performance of college students enrolled in two communication disorders courses over two consecutive years. Sixty-four students were enrolled in each year and identical exams were administered to students on a quarterly basis. In year one during semesters two and four, a four-speaker amplification system was used in the classroom and for semesters one and three the classroom was unamplified. In year two, semesters one and three were amplified whereas two and four were unamplified. The amplification system increased the signal-to-noise ratio by approximately 15 dB SPL with some variability noted.
Comparisons were made between the exam performances each quarter of students taught using amplified versus non-amplified lectures, with each course being analysed separately. No significant differences in scores were found for the first three exams of course one when the amplified and unamplified groups were compared. Likewise, for the first half of course two no significant differences between groups was found. For both courses the amplified group performed better than the unamplified group in the last exam. In course one the amplified group scored 89.7% while the unamplified group scored 83.4% (p< 0.006) and a similar pattern was seen with course two (amplified=91.7%, unamplified=86.5%, p< 0.001). The mean scores for the exam were relatively high and it may have been that greater difference would have been seen with a more difficult exam. Students were not randomly assigned to classes and no measures of academic performance or intelligence were completed prior to the implementation of the amplification trial, so there may have been differences in ability between the amplified and unamplified groups which contributed to the findings. There was no way of controlling the amount of study students did outside the class lectures and it may have been that some other difference in academic performance may have produced the slightly higher exam scores for the one exam per year where the amplified class performed better. There was also no information provided regarding class attendance, making it difficult to know how often students were present for amplified or nonamplified lessons. Students and teachers each completed a 10-item questionnaire with six response options ranging from strongly disagree to strongly agree. The teacher was generally positive about sound field amplification but was also the author of the study. Only raw data were reported for the student questionnaire. Students were enrolled in an audiology course and were therefore knowledgeable of the expected effects of sound field amplification and so may have been biased in their responses.
A New Zealand study of the effect of sound field amplification on Year 1 – 6 children’s listening behaviours and academic performance was conducted by Heeney (2006). A four-speaker amplification system was implemented in 30 classrooms for 12 months with 13 control classes having no amplification. Randomisation processes were used to select intervention schools, which were also selected because they were representative of five different decile or socioeconomic ratings. Intervention schools determined the availability of control classes which were selected based on the principal’s recommendations and teachers’ willingness to participate. Children’s performance on standardised national tests of listening comprehension, reading comprehension and vocabulary and mathematics (Progressive Achievement Tests) were compared. The age percentile ranks for each child’s performance in 2002 and 2003 were paired and compared separately for the intervention and control groups using paired sample t-tests. Not all tests were completed by every age group. Phonological skills were also assessed in younger children as well as teacher absences and teacher, student and parent questionnaires.
The mean difference in percentile rank for listening comprehension was 11.30 in the intervention group (9.49 – 13.11, p< 0.0001) and 3.80 (-0.9 – 7.69, p = 0.056) in the control group. In the intervention group those in the lower quartile improved more (mean difference = 17.63) than the upper quartile (mean difference = 11.30), indicating that children with the poorest initial comprehension scores benefited more from the intervention than those with the best scores. The mean difference in percentile rank for reading comprehension was 8.37 in the intervention group (p<0.0001) and 0.64 (p = 0.797) in the control group. For reading vocabulary the mean difference was 8.74 in the intervention group (p<0.0001) and 6.46 in the control group (p<0.0001). In years one and two phonological skills were compared with 10 phonological skills subtests assessed. In the intervention group all 10 subtests significantly improved from 2002 to 2003. In the control group 6 of the 10 subtests were significantly different from test one to test two. When mathematics performance was compared from test one to test two, the intervention group showed a mean increase of 3.62 (p<0.05) and the control group a mean decrease of 5.34 (p<0.05). Comparisons were made within the intervention and control groups but not between the two groups. Comparing the mean difference in percentile rank score between the

THE EFFECT OF CLASSROOM SOUND FIELD AMPLIFICATION AND THE EFFECTIVENESS OF OTOACOUSTIC EMISSION HEARING SCREENING IN
SCHOOL-AGE CHILDREN
12
intervention and control group would be preferable to control for the possibility that some other difference between the two groups was responsible for the improvement in PAT scores from time one to time two.
The positive benefits in the SFA classrooms in listening comprehension were not dependent on whether children had a history of middle ear disorders or not or whether they were Maori or Pakeha. Listening comprehension scores increased more in lower decile schools than higher decile schools but this was not significant. There were no differences in teacher absenteeism between the SFA and no SFA groups although qualitative reports suggested teachers were able to continue teaching when sick because of the SFA system. Students and teachers also completed open-ended questions about their impressions of the effect of sound field amplification over the trial period. The response rate for the student questionnaire was very low (10%) while all intervention teachers completed the questionnaire. Improvements in listening comprehension and student cooperation were reported by 73% and 66% of teachers respectively.
Conclusions Overall, evidence of the effect of sound field amplification on children’s academic or behavioural performance is not strong for two main reasons, these being a lack of published studies and poor study design. Anecdotally it would appear that there is strong support for sound field amplification. Sound field amplification has been utilised in the U.S.A. for the past thirty years and is widely promoted. Unfortunately, many of the studies promoting sound field amplification are unpublished or have been presented as conference papers only and so did not meet the criteria for inclusion in this technical brief. There are also many reports in the grey literature supporting classroom amplification but these are often written by audiologists who are also responsible for marketing and selling amplification systems, which is potentially a source of conflict of interest. In addition, while it was necessary to train teachers in the use of amplification systems, this was often a source of bias in many of the studies because class teachers were often responsible for completing measures of children’s behaviour or academic performance. They were not blind to the aims or rationale of the study or the experimental condition and so may have been biased in their responses. When independent observers were used to collect data (Massie et al. 1999) they were still not blind to the intervention condition and, while the measures were of high quality, they were not as relevant to children’s academic performance. The findings were that the interactional dynamics of the classroom improved with the introduction of sound field amplification, however this study focussed on a small sample of indigenous Australian children and it is difficult to say how applicable or generalisable these findings are to other populations.
It appears that sound field amplification improves children’s listening comprehension, however the measures of listening comprehension varied from study to study as did the length of follow-up. Often no information was provided regarding the utilisation of amplification systems in the classroom and it is difficult to know whether teachers used the systems consistently. The best evidence came from two longitudinal studies, one set in the United States and one in New Zealand. Rosenberg et al. (1999) implemented sound field amplification into a large number of control and experimental classrooms and assessed classroom behaviour and some academic performance over the course of a year. Heeney (2006) examined the effect of sound field amplification in a large number of classrooms over the course of a year and used standardised measures of children’s academic performance. Children who studied in classrooms with sound field amplification improved to a greater extent than children in unamplified classrooms in listening comprehension, reading comprehension and mathematics. The effect was the same for children with or without a history of middle ear disorders and for children from Pakeha or Maori ethnic groups. There was a trend for lower decile (lower SES) schools to improve more than high decile schools following sound field amplification but this was not significant.
Questionnaires regarding teachers and children’s perceptions of sound field amplification were generally poorly designed and susceptible to bias. Questions asked of children were mostly positively-framed, e.g. I can hear better when my teacher uses the microphone, and with a limited number of response options (yes/no). While it is important to keep the questions simple for young children, it is also important that meaningful and unbiased information is collected, and the structure of the questions and response options may have biased the children towards positive responses. Teachers’ questionnaires were generally longer with a better mix of positive and negatively-framed questions and the opportunity to contribute narrative comments. Responses to the equipment were mainly positive and improvements in children’s listening and learning behaviours were noted, although teacher’s prior knowledge of the purported benefits of sound field amplification as well as a reliance on their accurate
THE EFFECT OF CLASSROOM SOUND FIELD AMPLIFICATION AND THE EFFECTIVENESS OF OTOACOUSTIC EMISSION HEARING SCREENING IN
SCHOOL-AGE CHILDREN
13
recall of children’s pre-intervention behaviour and performance make it difficult to interpret these findings.
The current evidence does not provide strong evidence of a positive effect of sound field amplification in classrooms because of study design and analysis problems, but neither is there evidence to suggest there are no benefits. There is a real need for randomised controlled trials investigating the effect of both sound field amplification and classroom acoustic augmentation on children’s academic and behavioural performance before implementing amplification on a wide scale. These studies should include standardised measures of academic achievement because of the difficulties in designing studies which assess ‘live’ classroom interaction or behaviour yet ensure the observers are blind to the intervention condition. There is currently research being planned in New Zealand to compare the effect of sound field amplification and acoustically-treated classrooms but this is in the planning stage (Michael Heeney, personal communication). Different age groups should be included in this research as there is some evidence that younger children may benefit more from amplification systems than older children (Rosenberg et al. 1999), as they have not developed the cognitive skills to fill in the linguistic gaps when they are unable to hear the teacher.

THE EFFECT OF CLASSROOM SOUND FIELD AMPLIFICATION AND THE EFFECTIVENESS OF OTOACOUSTIC EMISSION HEARING SCREENING IN SCHOOL-AGE CHILDREN
14
Table 4. Evidence table of appraised articles relating to the effect of sound field amplification on behavioural, academic and learning outcomes in children
Authors Country Study Design
Sample and Interventions Methods Results Limitations and Conclusions
Heeney (2006) New Zealand Mainstream primary schools Prospective cohort – 1 year follow-up Grade III-2
N =626 N= ~ 436 SFA (30 classes) N= ~187 non SFA (13 classes) SFA intervention classes N=650 invited to participate with 67% response rate Non SFA control classes N=260 invited to participate with 72% response rate N (males) = 328 (52%) N (females) = 298 (48%) N= 5 schools Selection: Schools selected as representative of 5 different decile or socioeconomic ratings Classes selected by principals based on student and school demographics, willingness of teachers to participate, acoustics of classrooms Students in years 1-6 (5-10 year-olds) included No control group for year 6. Class demographics: Range 16 – 31 pupils per class Mean = 22 students for both intervention and control Ethnicity: 57% NZ European 35% Maori 8% Pacific Island or Asian Hx of treated middle ear dysfunction: NZ European = 28% Maori = 39% PI/Asian = 25%
Decile ratings: Rated by Ministry of Education in NZ (range 1-10) Low = school with significant number of disadvantaged children Decile ratings of the five participating schools were 1, 2, 5, 6 and 10. Classroom acoustics: Standard NZ classrooms No acoustic tiles Concrete base and ‘relocatable’ rooms with timber supports and framework No acoustic modifications during the project Measures: Age percentile ranks for standardized Progressive Achievement Tests (PAT) 2002 and 2003 test results were paired. Paired samples t-test was used to compare the means of the intervention group (pair one) and the control group (pair two) and see whether the difference was significantly different from zero. PAT Listening Comprehension – years 3,4,5,6 Reading Comprehension Reading Vocabulary Mathematics – years 5 and 6 Age percentile rank norms indicate the typical or normal performance in each test of representative samples of NZ children. Phonological tests: 10 phonological skills (letter-sound relationships, phoneme substitution etc) Teacher absences Teacher experience Questionnaires – parent/caregiver, student, teacher
Listening Comprehension Mean difference in percentile rank between 2002 and 2003 Intervention group = 11.30 (9.49 – 13.11), p<0.0001 Control group = 3.80 (-0.9 – 7.69), p = 0.056 Wilcoxon signed ranks test Intervention = 10.905 (p< 0.0001) Control = 1.49 (p< 0.136) Intervention group Lower quartile = 17.63 Upper quartile = 11.30 Below the median = 16.28 Above the median = 6.06 Questionnaires – qualitative measures Reading Comprehension Mean change in percentile rank Intervention group = 8.37 (p< 0.0001) Control group = 0.64 (p = 0.797) Reading Vocabulary Mean change in percentile rank Intervention group = 8.74 (p< 0.0001) Control group = 6.46 (p< 0.0001) Phonologic and Phonemic Awareness Years 1 and 2 10 phonologic skill areas Intervention group – all 10 phonemic subtests significant Control group – 6 of 10 subtests significantly different from test 1 to test 2
Authors conclusions Classroom sound field amplification appreciably improved listening comprehension. The improvement was substantial (11.3 percentile rank increase) and was most likely because of an enhanced signal to noise ratio. Students in Years 3-6 were included in the listening comprehension assessments, and no age differences were found. Reading comprehension and vocabulary also increased significantly for the SFA group. Improvements in phonological skills (5-6 year-olds) were greater for the SFA group than for the control. There was a significant increase in mathematics performance for the SFA group but this was limited to Year 5 and 6 because no standardised tests were available for younger age groups. The control group’s mean percentile rank decreased significantly over the same period, possibly because it was a small sample and class size and teaching style may have contributed to this result. The positive benefits in the SFA classrooms in listening comprehension applied whether the participants had a history of middle-ear disorder or not. The fluctuating nature of OME conditions makes it difficult to assign a causal relationship to these findings. SFA benefited both Maori and Pakeha children with no significant differences in listening comprehension improvements between them. Listening comprehension scores increased more in lower decile schools than higher decile schools but this was not significant. There were no differences in teacher absenteeism between the SFA and no SFA groups. Qualitative reports suggested teachers were able to continue teaching when sick because of the SFA system.

THE EFFECT OF CLASSROOM SOUND FIELD AMPLIFICATION AND THE EFFECTIVENESS OF OTOACOUSTIC EMISSION HEARING SCREENING IN SCHOOL-AGE CHILDREN
15
Table 4. Evidence table of appraised articles relating to the effect of sound field amplification on behavioural, academic and learning outcomes in children (continued)
Authors Country Study Design
Sample and Interventions Methods Results Limitations and Conclusions
Heeney (2006) New Zealand Continued
SFA system: Phonic Ear Easy Listener 4 speakers fixed to classroom walls accounting for student seating and teaching style Boom microphone Teacher training sessions provided
Consistency of use of SFA: 27/30 (90%) systems used consistently 19/30 (87%) most teaching sessions 8/30 (27%) selected teaching sessions (whole class instruction and story reading) 3/30 (10%) used the equipment inconsistently
Mathematics Intervention = 3.62 (p = 0.044) Control = -5.34 (p = 0.037) Listening Comprehension Scores Treated middle ear dysfunction yes = 13.7 no = 11.3 Not significant Ethnicity Pakeha = 10.0 Maori = 14.9 Not significant Decile ranking Chi square not significant
Reviewers Conclusions and Limitations This study followed a large sample of children over a long period of time. Standardised tests were utilised, making the data less susceptible to bias. All children who agreed to participate were included in the study and otological history was collected prior to the study. Measures of teacher use of the SFA system were included and 90% of teachers used the system consistently. Randomisation processes were used to select intervention groups but control groups were selected on the basis of availability. Response rate for invited participants was 67% for the intervention group and 72% for the control group. It is possible that those who agreed to participate were different from those who declined. Comparisons were not made between the intervention and control groups and it is possible that differences between the groups other than the intervention caused the change in PAT scores.

THE EFFECT OF CLASSROOM SOUND FIELD AMPLIFICATION AND THE EFFECTIVENESS OF OTOACOUSTIC EMISSION HEARING SCREENING IN SCHOOL-AGE CHILDREN
16
Table 4. Evidence table of appraised articles relating to the effect of sound field amplification on behavioural, academic and learning outcomes in children (continued)
Authors Country Study Design
Sample and Interventions Methods Results Limitations and Conclusions
Arnold and Canning (1999) United Kingdom Controlled clinical study Grade III-2 Mainstream primary school Classroom acoustics: Front windows double-glazed Open-plan classroom situated in part of a large hall. No carpet or acoustic tiling. 38% glass 11% curtains 51% painted brick
N=49 primary school pupils (two classes) N=23 girls (mean age = 9.91 years) N= 26 boys (mean age = 9.93 years) Age: Mean = 9.92 years Range = 8.58 – 11.42 years
Intervention Random allocation to each FM condition and to presentation order of the reading test. All pupils heard all 6 passages. Order of presentation of passages counterbalanced across levels and forms of passage for non FM and FM conditions 3 loudspeakers: Speaker 1 – front of classroom positioned where the teacher normally stood at about teacher’s standing head height Speakers 2 and 3 – rear of the classroomin the two back corners at children’s seated head height Non FM condition – tape recording played from Speaker 1 only Amplified FM condition – tape recording played through all 3 speakers to create an even sound field
Measures: Nonverbal intelligence: Progressive Matrices – pattern completion Auditory Memory: Digit Memory Span (British Ability Scales) Pupil Questionnaire Neale Analysis of Reading Ability (NRA) modifiedto use as a spoken comprehension test
NRA played through the tape-recorder to the pupils and pupils required to answer comprehension for each passage in writing. Tape-recording made from levels 1-3 of Form 1 and 2 of the Neale Analysis of Reading Ability: Revised British Edition Amplification system: Senheiser Microport receiver and transmitter and 3 loudspeakers
Classroom Acoustics Mean noise level (empty classroom) = 60.05 dB Mean noise level (children and teacher present but not speaking) – 66.67 dB Mean noise level (FM condition) = 73.17 dB RT = 2.04 seconds Neale Reading Analysis: Mean score (Standard deviation) Level 1: FM = 3.62 (0.68) Non FM = 3.53 (0.86) Level 2: FM = 5.02 (1.81) Non FM = 4.54 (2.23) Level 3: FM = 2.60 (1.75) Non FM = 1.77 (1.89) Repeated measures ANOVA : FM vs non FM significant (F=46.92, p<0.001) Test level x FM condition interaction significant (F=49.67, p<0.001)
Authors Conclusions Sound field amplification produced a highly significant improvement in comprehension over the three levels of the Neale Analysis. The improvement caused by the amplification became greater as the complexity of the Neale Analysis stories increased. The results also support the claim that children benefit from a relatively high speech –signal: noise ratio and show that the linguistic complexity of verbal material is an important variable. Seating position in the classroom had no effectwhich provides reassurance that the FM systemdid even out the sound field. There was no difference in improved comprehension between boys and girls. All pupils appeared tobenefit equally and there was no effect of auditory memory or non-verbal intelligence score on performance. The questionnaire showed that 71% of pupils thought noise was a problem in their school and that 54% reported an improvement in hearing with amplification. Generalisation from one study in one school should be made with caution.

THE EFFECT OF CLASSROOM SOUND FIELD AMPLIFICATION AND THE EFFECTIVENESS OF OTOACOUSTIC EMISSION HEARING SCREENING IN SCHOOL-AGE CHILDREN
17
Table 4. Evidence table of appraised articles relating to the effect of sound field amplification on behavioural, academic and learning outcomes in children (continued)
Authors Country Study Design
Sample and Interventions Methods Results Limitations and Conclusions
Arnold and Canning (1999) United Kingdom Continued
Tape volume constant in both conditions, manipulation was even sound field versus an uneven sound field.
Improvement scores: (FM score – non FM score) No correlation between degree of improvement in comprehension and:
Auditory memory (r = 0.0256, p=0.866)
Age (r=0.0722, p=0.633) Intelligence (r=0.0092, p=0.925) No difference in improvement
scores of males and females
Reviewers Conclusions and Limitations Pretrial hearing levels were not measured but the authors did report that two boys with known moderate hearing loss were included in the sample. When results were analysed without these two participants, there was no change to the findings. The control condition was still exposed to amplification but through one speaker rather than three, so it was not exposed to an even sound field. While this study was more controlled in terms of counterbalanced measures, it is not representative of actual classroom SFA and it istherefore difficult to make any generalisations about the long-term performance of children in amplified classrooms based on these findings. No details were provided regarding the randomisation of children to classroom. There was also not enough information provided about the reading comprehension responses or blinding of markers to condition.

THE EFFECT OF CLASSROOM SOUND FIELD AMPLIFICATION AND THE EFFECTIVENESS OF OTOACOUSTIC EMISSION HEARING SCREENING IN SCHOOL-AGE CHILDREN
18
Table 4. Evidence table of appraised articles relating to the effect of sound field amplification on behavioural, academic and learning outcomes in children (continued)
Authors Country Study Design
Sample and Interventions Methods Results Limitations and Conclusions
Massie et al. (1999) Massie et al. (2004) Queensland, Australia Prospective cohort study Grade III-2 Mainstream primary schools in ATSI communities
N=64 indigenous school children (Aboriginal and Torres Strait Islander) N= 31 males N= 33 females Mean age = 8 yrs 2 mths Range = 6;1 – 10;3 One grade 2 class, two grade 3 classes and one grade 5 class from two schools in Queensland. Teacher Training: Information booklet –aims and rationale of project, FM amplification research summary In-service training in the effective use of the system Pretrial Hearing Levels: Audiometry - an average of the frequencies 500Hz, 1000Hz, 2000Hz, and 4000Hz was found for the better ear. Hearing levels were measured before and after each trial.
Classroom Acoustic Measurements: ambient noise levels measured at
central point and 4 corner points teacher voice level measured at
central point and 4 corner points classroom RT measurements
measured at 250Hz, 500Hz, 1000Hz, 2000Hz, and 4000Hz
SNR in unamplified classrooms SNR in amplified classrooms
Design: ABAB/BABA crossover design Two classrooms of students in each school Classrooms 1 and 3: ON two weeks/ OFF two weeks/ ON two weeks/ OFF two weeks Classrooms 2 and 4: OFF two weeks/ ON two weeks/ OFF two weeks/ ON two weeks Sound field FM amplification instrumentation: Four speakers, centrally-facing orientation Microphone worn by teacher Volume control was set to allow the teacher to move around the room without causing feedback. Measures: Environmental Communication Profile (ECP) (Calvert and Murray, 1985): Structured classroom observation measuring -
the type of communication initiated by the child, verbal or nonverbal
the direction of the child’s communication the type of communication that cued the
child’s interaction, verbal or nonverbal the source of the stimuli which initiated the
child’s communication Two observers (one principal, one independent). Independent observer collected data during one session for each observation week. Inter-rater agreement calculated for 25% of observations. Discontinuous partial-interval time sampling 30 seconds observation followed by 10 seconds recording for each child Each child observed four times during each observation session
Classroom Acoustics: Unoccupied: Mean noise levels 35 – 41dBA RT = 1.3 – 1.8 seconds Occupied: Mean noise levels 62-75 dBA Mean signal-to-noise ratios: Unamplified: -9 to -2 dB Amplified: -4 to +3 dB Change in signal-noise-ratio with amplification: +4 to +10 dB (mean +6 dB) Behavioural Observations ECP: Combined for all 4 classrooms Inter-rater agreement = 67-77% Results reported as %age change in behaviour from OFF to ON positions. Verbal communication: Child statements +16% Teacher statements +21% Peer statements -7% Nonverbal communication: decrease for child, teacher and peer but not sig. Direction of communication: Child’s initiations to teacher +14% Child’s initiations to class -29% Significant (p< 0.05)
Authors Conclusions The results of the observational data indicated that increasing the volume of the teacher’s voice consistently around the room produced changes in the dynamics of classroom communication. Even with the amplification systems operating, SNRs were well below the +15dB recommended by ASHA. This factor, plus the slight hearing impairment experienced in this population, may explain the lack of significant change in some of the behavioural variables. Anincrease in child and teacher statements indicated the child responded verbally more to teacher verbal cues in the ON condition. This demonstrates the child’s preference for teachers to cue him/her verbally, and suggests increased attentiveness to teacher verbal instruction The child interacted more with the teacher and less with the class as a whole in the ON condition.These results suggest a change in the direction of the child’s communication, and may indicate that, because the child was more teacher-focussed, the teacher had more control of the class when the system was on. An increase in the number of indirectly promptedchild interactions indicated the child’s willingness to communicate more without being prompted. The results of the SIFTER highlighted improvement in attention and class participation, reinforcing the improvements noted by the ECP. Reviewer Conclusions and Limitations The measures used in this study were employed because they are of particular relevance to ATSI children. Previous research had suggested that increasing classroom communication would be very beneficial to this group of children.

THE EFFECT OF CLASSROOM SOUND FIELD AMPLIFICATION AND THE EFFECTIVENESS OF OTOACOUSTIC EMISSION HEARING SCREENING IN SCHOOL-AGE CHILDREN
19
Table 4. Evidence table of appraised articles relating to the effect of sound field amplification on behavioural, academic and learning outcomes in children (continued)
Authors Country Study Design
Sample and Interventions Methods Results Limitations and Conclusions
Massie et al. (1999) Massie et al. (2004) Queensland, Australia Continued
Occupied classroom noise measurements and SNR calculations were obtained during periods when classes were ongoing. The teacher was asked to read a standard passage at a normal instructional intensity level.
Observational data collected at weeks 2,4,6 and 8 of each trial Observations at same time of day during lessons of similar content Teacher observations of academic and behavioural performance measured pre-and post-intervention using the SIFTER (maximum score for each subtest = 15 and total maximum score = 75)
Indirectly prompted interactions +13% (p< 0.016) Directly prompted interactions -1% Total interactions +2% SIFTER – Mean (SD) Academics Pre= 9.60 (3.94), post= 9.67 (4.20) Attention ** Pre= 8.17 (3.57), post= 9.27 (3.78) Communication Pre= 9.70 (3.43), post= 9.87 (3.79) Class participation ** Pre= 9.60 (3.38), post= 10.40 (3.83) School behaviour Pre=10.87 (3.72), post=11.32 (3.92) Total Score ** Pre=47.95 (15.52), post=50.52 (17.55) ** = p<0.05
While the study did reveal that SFA increased classroom communication and changed the dynamics of the interactions, this may not be a problem in other ethnic groups or urban schools and therefore lacks generalisability. The design of this study meant that the observers were not blind to the amplification condition of the classroom. The difference inSIFTER scores were small and the SIFTER is comprised of three items per subtest, making it difficult to interpret the real impact of these changes on children’s performance. Teachers were not blind to the rationale behind SFA or the intervention condition.

THE EFFECT OF CLASSROOM SOUND FIELD AMPLIFICATION AND THE EFFECTIVENESS OF OTOACOUSTIC EMISSION HEARING SCREENING IN SCHOOL-AGE CHILDREN
20
Table 4. Evidence table of appraised articles relating to the effect of sound field amplification on behavioural, academic and learning outcomes in children (continued)
Authors Country Study Design
Sample and Interventions Methods Results Limitations and Conclusions
Rosenberg et al. (1999) United States Prospective cohort Grade III-2
Phase 1: N=1319 kindergarten, first and second grade students in 30 SFA (N=663) and 30 control (N=656) general education classrooms (20 at each grade level). N=14 schools in four medium and two large school districts. Slightly more male than female subjects. Minority students = 18.35% Exceptional Student Education (ESE) programs other than Speech/Language Therapy or Specific Learning Disabilities =15.16%. Free or reduced lunch = 39.53% (below the state average of 45.97% for elementary schools). Phase 2: N=735 students in kindergarten, first and second grade general education classes. N=19 schools, all receiving SFA. Pre and post-treatment data collected for 431 students in 20/34 classes (58.82%). Free or reduced school lunch = 61.38%, Intervention summary: Phase 1: N=1319 students (30 control and 30 SFA classes) followed for 12 weeks in 1994 (pre, mid, post treatment obs) Of the original sample N=804 students (20 control, 20 SFA classes) followed for 30 weeks (pre, 6, 12, 21, 30 week obs)
Phase 1: School principals interviewed to ascertain interest. Teachers (n=60) selected based on principals’ recommendation and willingness to participate. Standard American dialect and no voice/speech pathology. Teachers were not selected to ensure ability groupings or classroom acoustic environments. Phase 2: Small and rural districts targeted. Those districts willing to participate were asked to identify two general education classroom teachers in kindergarten, first or second grade. 15/27 small districts committed to the project (55.56%) and two middle size districts were invited so that a target of 34 SFA classrooms could be met. Hearing Screening: Phase 1: Hearing screening at 15 and 20dB HL, 5K, 1K, 2K, and 4KHz, plus tympanometry. N=1252 students Certified audiologists, speech language pathologists Phase 2: No hearing screening in phase 2 due to inconsistent availability of personnel. Parents were able to volunteer information about otologic history through a questionnaire. Teacher in-service training: Phase 1: Minimum 4 hours in-service training provided for participating teachers (n=60)
Demographic Information: No difference between treatment and control groups for any effects other than a higher incidence of colds and health problems for the control group. Phase 2: pre and post LLO observation differences for gender and special services effects. Hearing Screening: Phase 1: Pure tone screenings for 1258 students and tympanometry for1252 students. 92.57% had normal tympanometry results. Reasons for no screening were: parent request or absenteeism Otologic history information: 1450 students (67%). Nearly 15% had experienced 10 or more ear problems during their lifetime. Unoccupied mean = 47.48 dBA (R=33.80-62.10, SD=7.37) Quietest for kindergarten and highest for first grade Acoustical Treatments Classroom Ambient Noise Levels Phase 1: 2/60 classrooms met the standards for unoccupied classrooms (ASHA) Occupied mean = 62.63 dBA (r=47.00-73.30, SD=5.99) Occupied kindergarten the noisiest and second grade quietest
Authors Conclusions: Students in SFA classrooms showed significantly greater improvement in listening and learning behaviours and skills and changed at a faster rate than their peers in unamplified classrooms. Interestingly, students in amplified classrooms exhibited lower pre-treatment scores than control classes. FM SFA is an effective intervention strategy to produce significant change in student’s listening and learning behaviours and skills. Students in early grade SFA classrooms demonstrated significantly greater change than grade-alike peers in unamplified classes, with younger students showing the greatest improvement. Kindergarten students showed most improvement and first and second grade less. Crandell (1995) suggested this may be due to higher rate of OME in younger age group as well as less ability to fill in the gaps in auditory information. Important to include RT measurements if study were repeated. Reviewers Conclusions and Limitations This study followed a large sample of children over a long period of time. Thorough information was provided about participants’ otological history and hearing screening was completed for all children in phase 1. There was no difference between the treatment and control groups on any of the demographic measures, including otological history. Amplified classrooms showed a significant increase in total LLO scores between the pre- and mid-trial observations and the pre- and post-trial observations. Unamplified classrooms showed a significant but much smaller difference between the mid- and post-trial and the pre- and post-trial observations.

THE EFFECT OF CLASSROOM SOUND FIELD AMPLIFICATION AND THE EFFECTIVENESS OF OTOACOUSTIC EMISSION HEARING SCREENING IN SCHOOL-AGE CHILDREN
21
Table 4. Evidence table of appraised articles relating to the effect of sound field amplification on behavioural, academic and learning outcomes in children (continued)
Authors Country Study Design
Sample and Interventions Methods Results Limitations and Conclusions
Rosenberg et al. (1999) Continued United States Continued
Phase 2: N=735 students in 34 classrooms (all SFA), pre and post obs data on 431 students (4 weeks pre and post-treatment obs) Amplification system: 4 speaker arrangement – ear height of students Option of traditional lapel or boom mic headset. Majority (76.7%) chose the boom mic. Equipment installed by audiologist in phase 1 and by classroom teachers in phase 2. Classroom environment: Phase 1: 90% (n=54) classrooms were self-contained, with the remainder housed in relocatable classrooms. Distribution same for SFA and control. Majority had HVAC systems. Teachers rated the loudness of noise sources from 1 (very quiet) to 5 (very noisy). Average ceiling height = 9.57 feet.
Sound level measurements: Ambient noise levels using 5 positions in the classroom and computing an average measurement. Occupied measures taken during regular classroom activity. Unoccupied levels were taken before and after school with HVAC system running. Teachers’ vocal intensities were measured on the dBA scale at a distance of 6 inches from the mouth. Unamplified measures obtained for all and amplified measures for SFA teachers only.
Topics: classroom acoustics, speech perception, strategies for improving student listening and learning behaviours, suggestions for acoustical modifications as well as the benefits and use of FM SFA. Also information provided about observation forms. Phase 2: in-servicing for n=50 teachersEvaluation of Classroom Listening Behaviours (ECLB) 10 items Paired for discrete classroom listening tasks (close and distant listening, listening in noise and quiet). Each behaviour rated on a 5-point scale (1=seldom and 5=frequently) Maximum score is 50. Listening and Learning Observation (LLO)
general student data (absences, retention, health status, special programme participation)
listening behaviours (5 point scale where 1=frequently and 5=seldom)
academic/pre-academic behaviours (5 pointscale where 1=frequently and 5=seldom)
academic/pre-academic skills (5 point scale where 1=below average and 5=above average)
Teachers rated students’ behaviours and skills in comparison to other students in the class. Maximum score is 75 (listening = 45, behaviours = 15, skills = 15)
Observation schedule: Phase 1: LLO for all students, ECLB completed for 10 students in each class selected via random numbers set.
Increase in Teacher’s Voice Level Average increase +6.94 dBA (within the anticipated 5-10 dB increase) Listening and Learning Observation (mean difference in score) Pre-mid trial SFA= -6.541* No SFA= -0.646 Mid – Post trial SFA = -1.050 No SFA = -1.139 Pre-post trial SFA= -7.591* No SFA = -1.785* * = p< 0.05 Paired t-tests for the LLO total score showed the experimental group andcontrol group to be significantly different at pre to mid-treatment, mid to post, and pre to post. Phase 2 – significant change after 4 weeks of SFA based on LLO and ECLB scores. ECLB: Pre-mid trial SFA= -4.677* No SFA= -0.094 Mid – Post trial SFA = -0.694 No SFA = -0.512 Pre-post trial SFA= -5.371* No SFA = -0.606 * = p< 0.05
A subset of students was followed for 30 weeks during which time 5 observations using the LLO and ECLB were completed. Mean total scores were reported for the amplified and unamplified classrooms for each of the observations, however the differences between groups were not statistically tested. The amplified classrooms scored higher than the unamplified classrooms for all observations except pre-trial for both the LLO and the ECLB. Schools were selected based on their interest in the project and it is possible that this meant principals more positive about SFA were more likely to be included. In addition, principals of selected schools then recommended which teachers should be included in the study which may have provided another source of selection bias. Teachers’ completed the listening behaviours measures and because they were not blind to the amplification condition of their class, may have demonstrated response bias. This was made more likely because the SFA training teachers received prior to implementation of the system included information about strategies for improving student listening and learning behaviours, suggestions for acoustical modifications as well as the benefits and use of SFA. It would be better if students were evaluated either using standardised measures of achievement across all schools or behavioural measures collected by independent observers. No information was provided regarding control over teachers’ use of the system and whether it was used consistently over the course of the study.

THE EFFECT OF CLASSROOM SOUND FIELD AMPLIFICATION AND THE EFFECTIVENESS OF OTOACOUSTIC EMISSION HEARING SCREENING IN SCHOOL-AGE CHILDREN
22
Table 4. Evidence table of appraised articles relating to the effect of sound field amplification on behavioural, academic and learning outcomes in children (continued)
Authors Country Study Design
Sample and Interventions Methods Results Limitations and Conclusions
Rosenberg et al. (1999) Continued United States Continued
Obs at pre-treatment, mid-treatment (6 weeks) and post-treatment (12 weeks) Two additional obs on 804 students at 21 weeks and 30 weeks. Phase 2: teachers completed both observation forms for each student
LLO and ECLB 30 week observation SFA group showed significantly greater improvement in LLO and ECLB total scores than control for pre-treatment to 6, 12, 21, and 30 week scores. LLO and ECLB correlations r = 0.7-0.83

THE EFFECT OF CLASSROOM SOUND FIELD AMPLIFICATION AND THE EFFECTIVENESS OF OTOACOUSTIC EMISSION HEARING SCREENING IN SCHOOL-AGE CHILDREN
23
Table 4. Evidence table of appraised articles relating to the effect of sound field amplification on behavioural, academic and learning outcomes in children (continued)
Authors, Country, Study Design
Sample and Interventions Methods Results Limitations and Conclusions
Valente (1998) Saint Louis University, United States Before and after study Grade III-3
N= 128 college students enrolled in two communication disorders courses (intro to audiology and aural rehabilitation. N= 32 students in each course, each semester. N=124 women and n=4 men Age range = approximately 20-25 years Pure tone hearing screening at 20 dB HL from 500 to 4000 Hz, performed in an audiometric suite. All passed bilaterally with the exception of one student. Equipment: Phonic ear 210 easy listener FM system, 4 loudspeakers mounted at student ear level in four corners of the room. lapel microphone Classroom: 35 feet x 22 feet No carpeting, curtains or other acoustical treatments Ambient noise levels measured weekly and measured in five positions in the classroom (back, middle, front of room, left and right of instructor) Intensity levels of instructor’s voice measured at five locations under amplified and unamplified conditions.
Two year duration Two audiology classes, two aural rehab classes Audiology course: 100 point exam after each quarter Year 1: SFA 2nd and 4th quarters Non amplified 1st and 3rd quarters Year 2: SFA 1st and 3rd quarters Non amplified 2nd and 4th quarters Identical exams administered yearly on a quarterly basis. Comparisons made after each quarter between AMP and UNAMP Student questionnaire with items asking about the benefits of SFA Aural rehab course: Divided into thirds each semester with the first two-thirds examined for this study. 100 point exam after the 1st and 2nd third of each semester. Year 1: AMP 2nd third UNAMP 1st third Year 2: AMP 1st third UNAMP 2nd third Examination scores compared after each third under different listening conditions.
Mean ambient noise measurements range 54.1 – 56.3 dBA SPL Mean unamplified SPL range 60.3 – 67.1 Mean amplified SPL range 75.6 – 82.6, range of 7 dB SPL SFA system provided an enhancement in SNR of approximately 15 dB SPL, variability noted. Mean exam scores audiology: 96UN1 = 85.4 96UN2 = 87.1 96AMP1 = 82.2 96AMP2 = 89.7 97UN1 = 83.4 97UN2 = 83.4 97AMP1= 81.9 97AMP2 = 87.2 T-tests for unrelated samples were used to determine if significant differences were present. 96UN1 vs 97AMP1 – no sig diff 96AMP1 vs 97UN1 – no sig diff 96UN2 vs 97AMP2 – no sig diff 96AMP2 vs 97UN2 –sig diff p<.006 Mean exam scores aural rehab: 97UN1 = 90.5 98UN1 = 86.5 97AMP1 = 91.7 98AMP1 = 88.5
Authors Conclusions There were no significant differences in examination scores for the audiology course for quarters 1-3. There were no significant differences in examination scores for the aural rehab course in the first quarter. Students attending SFA lectures performed significantly better than no SFA students in the final test for both courses. The students may have become more reliant on SFA during the course of the year or have been fatigued at the end of the year and benefited more in the amplified classrooms as a result. Greater benefits may have been seen in a large lecture hall or theatre. Reviewers Conclusions and Limitations This study compared the examination performance of university students who attended amplified and unamplified lectures. The amount of study that students completed outside of class time was not measured or controlled and the students were enrolled in an audiology course. It is possible that they had knowledge of the potential effects of SFA and the purpose of the study, and studied more for the exam following amplified lectures. There may have been other differences between the classes, such as intelligence, that led to any differences in exam performance. The results ofthis study cannot be generalised to other populations, such as primary or secondary age school children.

THE EFFECT OF CLASSROOM SOUND FIELD AMPLIFICATION AND THE EFFECTIVENESS OF OTOACOUSTIC EMISSION HEARING SCREENING IN SCHOOL-AGE CHILDREN
24
Table 4. Evidence table of appraised articles relating to the effect of sound field amplification on behavioural, academic and learning outcomes in children (continued)
Authors, Country, Study Design
Sample and Interventions Methods Results Limitations and Conclusions
Valente (1998) Saint Louis University, United States Continued
Questionnaire: 10 questions, 5 point rating scale from strongly disagree (1) to strongly agree (5) Instructor questionnaire: 10 questions, 5 point rating scale Only raw data reported
T-tests for unrelated samples were used to determine if significant differences were present. 97UN1 vs 98AMP1 – no sig diff 97AMP1 vs 98UN1 –sig diff p<.001

THE EFFECT OF CLASSROOM SOUND FIELD AMPLIFICATION AND THE EFFECTIVENESS OF OTOACOUSTIC EMISSION HEARING SCREENING IN SCHOOL-AGE CHILDREN
25
Table 4. Evidence table of appraised articles relating to the effect of sound field amplification on behavioural, academic and learning outcomes in children (continued)
Authors Country Study Design
Sample and Interventions Methods Results Limitations and Conclusions
McSporran et al. (1997) United Kingdom Before and after study Grade III-3
Selection of the target groups: Initial assessment in both classrooms for the target groups was made using the SIFTER – 15 child behaviour statements relating to academic performance, attention, communication, class participation, school behaviour. Scores indicated either pass, marginal or fail. Target samples based on failure of SIFTER: N=10 children in class A (6 boys, 4 girls) N=15 children in class B (10 boys, 5 girls) – 8 children EFL, 7 ESL Average age target group A = 7.6 years, non target = 7.8 years Average age target group B=7.7 years, non target = 7.9 years School A: N=35 children Age range 7.3 – 8.2 years All English as first language. RT (average of 0.5,1,2 kHz) = 1.6 seconds,maximum 1.75 secs Wooden floor, plaster ceiling and walls, ceramic tiles bottom part of 3 walls. One wall large windows One wall hinged glass and wooden partition to separate classroom from corridor, no curtains, carpets or acoustical treatment
Hearing status of target groups: Questionnaire related to ear and hearing history (parental interview) Pure tone audiometry TG A: all within normal range for both ears TG B: 4-5 dB poorer than group A but within limit for normal thresholds for EFL group. ESL group falls outside limit in the worse ear with a difference of up to 14 dB between ears and up to 10 dB difference at respective frequencies. Assessment of the target groups: Children’s Auditory Processing Performance Scale (CHAPPS) Allows a teacher or parent to assess the listening behaviour of a child compared to other children of similar age and background. Meant that target group children were compared to other children in the classroom under the same listening conditions. 36 questions in 6 categories: noise; quiet; multiple inputs; auditory memory, sequencing; auditory attention span. Response choices range from ‘less difficulty than others’ (+1) to ‘cannot function at all’ (-5), giving a possible score range of +36 to -180 points. Completed by class teachers for all children in target groups before and after the trial period. Length of trial = 5 months to allow children to become familiar with the equipment and to experience potential benefit from its use.
CHAPPS: Increase in score for all groups. Number of children with an increase was greater than those with a decrease. Wilcoxon matched-pairs signed ranks test. School A: significant number of increases (p< 0.05) School B: not significant, 10/15 children showed an increase in score The poorer the initial score, the greater the increase in score tended to be. Spearman’s rank order correlation coefficient = 0.67 (p < 0.001). Questionnaires: Participants’ views on the equipment: 1 strongly agree, 6 strongly disagree Children’s questionnaire read aloud Teachers: • amplification equipment user-
friendly and believed the learning environment had improved
• would like to keep the equipment permanently
• No reports of adverse effects • strongly disagreed with
‘decrease in listening skills or classroom participation’
Authors Conclusions Large proportion of children in the target groups showed an improvement in listening behaviour according to their scores on the CHAPPS. The greater the initial difficulty the child was experiencing, the greater the improvement tended to be. This would be expected from the CHAPPS questionnaire as it iscomparing the child’s performance with their peers. It is unlikely that a child whose score was only slightly below the norm would become better than the norm. Maturity may be a factor in the improvement, but as the children were being compared with their peers the maturity factor would be similar for target and non target groups. Children with ESL showed improved listening behaviour with SFA. They tended to show a greater increase, may be because they experienced more difficulty initially. Another factor may be that the extra tuition in English improved their understanding and therefore their listening behaviour. Potential benefit of SFA technology even in highly reverberant conditions. All but 3 target children had hearing levels within 15 dB HL and nearly all showed improved listening behaviour with SFA. Potential to facilitate listening in typical classroom acoustic conditions for children with normal hearing sensitivity. Reviewers Conclusions and Limitations This study selected participants on the basis of their poor behaviour and so the results may be less generalisable to children without behaviourproblems.

THE EFFECT OF CLASSROOM SOUND FIELD AMPLIFICATION AND THE EFFECTIVENESS OF OTOACOUSTIC EMISSION HEARING SCREENING IN SCHOOL-AGE CHILDREN
26
Table 4. Evidence table of appraised articles relating to the effect of sound field amplification on behavioural, academic and learning outcomes in children (continued)
Authors Country Study Design
Sample and Interventions Methods Results Limitations and Conclusions
McSporran et al. (1997) United Kingdom Continued
School B: N=30 Age range 7.3 – 8.2 years N=18 English as first language N=12 English as second language RT (average 0.5,1,2 kHZ) = 0.79 secs with a maximum if 0.83 secs Floor vinyl tiles Ceiling acoustic tiles Walls hard plaster with two large window areas, no curtains but small area carpeted
Amplification system: Phonic Ear Easy Listener: transmitter and lapel microphone and 4 loudspeakers. Speakers sited in walls at convenient points around the room, largely dictated by having to attach them wherepossible to the walls. Care was taken to elevate them several feet above the level of the seated children and to avoid inappropriate positioning. Volume was adjusted to avoid feedback and to be at a comfortable level for teachers and children.
• Did not think the children dislikedthe equipment.
Majority of children liked the system and found it easier to hear their teachers. Most common reason as to why they liked the system was that it was easier to hear.
There were also a large number of children in the class with ESL and there is a possibility that the improvement in listening behaviour seen in this group of children was the result of extra English tuition over the period of the study, rather than SFA. All children were exposed to SFA and there was no unexposed control group. It is possible that the changes in children’s behaviour were due to something other than the amplification of the classroom. Teachers rated children’s performance on the CHAPPS and it is possible that they were subject to response bias.

THE EFFECT OF CLASSROOM SOUND FIELD AMPLIFICATION AND THE EFFECTIVENESS OF OTOACOUSTIC EMISSION HEARING SCREENING IN
SCHOOL-AGE CHILDREN
27

THE EFFECT OF CLASSROOM SOUND FIELD AMPLIFICATION AND THE EFFECTIVENESS OF OTOACOUSTIC EMISSION HEARING SCREENING IN
SCHOOL-AGE CHILDREN
28
OVERVIEW – OTOACOUSTIC EMISSION TESTING
The search identified eight eligible papers comparing the accuracy of otoacoustic emissions testing to a gold standard audiological test or test battery. Below is an overview of study designs and aspects of quality represented by these studies.
Full details of the papers appraised, including methods, key results, limitations and conclusions, are provided in evidence Table 6 (page 37-51).
All eight of identified papers were cross-sectional studies where all children were tested using all the test methods. The sample sizes ranged from 152 to 1003 participants (297 - 2006 ears). Five of the studies recruited children from one or more mainstream schools within the same area or city without applying selection criteria to the sample. In three of the studies, at least a portion of the participants were recruited or referred from speech and hearing clinics (Ho et al. 2002, Taylor and Brooks 2000) or were selected because they failed an initial audiological examination (Davilis et al. 2005). These studies generally showed a higher test failure rate than that found in studies examining a routinely screened community population. For six of the studies participants ranged in age from three to twelve years. One study included children from birth to six years, with 54% of the sample aged between 3 and 6 years of age (Taylor and Brooks 2000). Results were reported separately for this age group as well as overall results for the whole sample. One study omitted details about the age of the participants (Krueger and Ferguson 2002), however all the children were recruited from second and third grade American classrooms (approximately 7-8 year-olds).
Settings and samples In studies where the sample represented a routinely screened population the failure rates of the gold standard tests ranged from 2.8 – 25% for pure-tone audiometry and from 1.3 – 17.9% for tympanometry. In studies where participants were recruited from speech and hearing clinics or selected on the basis of their failure of an audiological examination failure rates ranged from 10.8 – 20% for pure-tone audiometry and 8.6 – 58% for tympanometry. OAE testing failure rates ranged from 6.3 – 23%. Pass/fail criteria for pure-tone testing varied both in the frequencies assessed and the level of hearing loss required for a pass or fail. Most studies though included at least 1.0 – 4.0 kHz and used a cut-off of 20-25 dB HL. In studies where tympanometry was included in the test battery (n=7), a Type B tympanogram was considered a fail in one study (Bu et al. 2005), a Type B or Type C was considered a fail in 3 studies (Davilis et al. 2005), (Lyons et al. 2004; Driscoll et al. 2001), with the remaining studies using measures of tympanometric width and static admittance to distinguish passes from fails (Ho et al. 2002; Krueger and Ferguson 2002; Taylor and Brooks 2000). Six studies included a comparison of the performance of oto-acoustic emission testing with pure-tone audiometry (Davilis et al. 2005; Lyons et al. 2004; Driscoll et al. 2001; Krueger and Ferguson 2002; Taylor and Brooks 2000; Sabo et al. 2000), four included a comparison with tympanometry (Taylor and Brooks 2000, Krueger and Ferguson 2002; Ho et al. 2002; Davilis et al. 2005) and four included a comparison with a test battery which combined pure-tone and tympanometry results (Davilis et al. 2005; Bu et al. 2005; Lyons et al. 2004; Driscoll et al. 2001). One study compared the test performance of TEOAE and pure-tone testing to a gold standard audiogram (Sabo et al. 2000).
This variation in “gold standard” test and pass/fail criteria implies the reference standard used was imperfect in at least some studies. This results in bias in the estimates of test performance for OAE. For example, it is instructive to compare the studies that include both Type B and Type C tympanograms with studies that include Type B tympanograms only as a fail. Assuming Type B tympanograms are not associated with any false positive results, Type C tympanograms were detected and Type C tympanograms were also not associated with any false positives, then this implies some true fails were only detected by those studies including Type C tympanograms as a fail. The studies that missed those fails, i.e. those that relied on Type B tympanograms alone, would have classified any true positive tests from OAE as a false positive, therefore overestimating specificity and underestimating sensitivity.
Summary of studies Davilis et al. (2005) investigated the effectiveness of different screening methods to detect hearing loss in a sample of children (n=5253) on the Greek island of Kea in a rural community. The paediatric population on the island was included in the initial otoscopic examination, with approximately 90% coverage. The mean age of the children was 7.5 years, range 4-12 years of age. Children who had an

THE EFFECT OF CLASSROOM SOUND FIELD AMPLIFICATION AND THE EFFECTIVENESS OF OTOACOUSTIC EMISSION HEARING SCREENING IN
SCHOOL-AGE CHILDREN
29
abnormal result from the otoscopic examination, a positive history of middle ear disease or hearing loss of any type, or the presence of factors predisposing them to hearing loss, e.g. congenital anomalies, were then given an audiological examination. This test battery included pure-tone audiometry, tympanometry and TEOAEs and was administered to 271 children (497 ears). The test performance of TEOAEs was compared to pure-tone audiometry, tympanometry, and a protocol combining the results of PTA and tympanometry. The sensitivity of TEOAEs relative to a gold standard of PTA was 66% and specificity 87.7%. Relative to tympanometry a sensitivity of 36.6% and specificity of 95.2% was obtained. When PTA and tympanogram results were combined as one protocol, TEOAE results had a sensitivity of 36.6% and specificity of 95.2%.
The children who were included in the full audiological examination group were selected based on the results of their otoscopic examination and so the prevalence of hearing loss may have been higher, possibly introducing selection bias. A cut-off of 30 dB HL was used for the PTA test, whereas many other studies utilising PTA use a 20 – 25 dB HL cut-off. This more lenient cut-off for identifying children with hearing loss means that some children with mild hearing loss (26-40 dB HL) would have been classified as passing PTA which may have decreased sensitivity and increased specificity. Aside from the effect on test performance of preselecting the sample based on their otoscopic results, this lessens the study’s generalisability to a normal population where the prevalence of hearing loss would be lower. Because TEOAE would most likely be employed as part of an initial screening of all schoolchildren, rather than as a follow-up after a preliminary examination, the results of this study are less relevant to a school-based screening programme. While there was a lack of detailed information about the administration of the TEOAE test protocol and pass/fail criteria, the authors used a standardised OAE device (Otodynamics Echocheck model) with automatic TEOAE validation. No information was provided regarding adjustment for background noise prior to or during the test session A signal-to-noise ratio of 6 dB in the 1.6 to 2.8 kHz region was considered a fail and partial passes and fails were classified as ‘abnormal results’. No information was provided as to whether the test administrators were blind to the results of previous tests, including the otoscopic examination.
Driscoll et al. (2001) recruited 940 primary school children from 22 schools in Brisbane, Australia. The mean age of the sample was 6.2 years (range 5.2 – 7.9 years). Children were invited to participate on a voluntary basis. An otoscopic examination was completed prior to testing using PTA, tympanometry and TEOAEs in a randomised and counterbalanced order and all testing was carried out by one audiologist. PTA stimuli were presented for 0.5 – 4.0 kHz frequencies at 25 dB HL. TEOAE spectrum recordings of 3 dB or higher above the noise floor and halfway across the frequency bands of 2-3 and 3-4 kHz in both ears were required for TEOAEs to be classified as present (pass). This criteria was adapted from the Rhode Island Hearing Assessment Project (RIHAP) which investigated the use of TEOAEs in assessing hearing loss in newborns and infants and is accepted as a benchmark study of OAE screening. In analysing the test performance of TEOAE testing relative to PTA result, the authors varied the pass criteria of the TEOAE to identify the ideal signal-to-noise ratio for optimal test performance. When the SNR was varied from 1 – 15 dB, the sensitivity varied from 65 – 92% with specificity ranging from 7 – 64%. The ROC curve revealed a SNR of 7 dB led to 79% sensitivity and 80% specificity. The highest sensitivity (92%) was obtained with a 15 dB SNR pass criteria but the specificity at this level was 36%. When compared to an overall screening protocol of PTA and tympanometry, sensitivity decreased and specificity increased slightly. When pass criteria for TEOAEs was varied between 3 and 9 dB above the noise floor, sensitivity ranged from 51 – 73% and specificity 74 – 93%. Lastly, low frequency results were omitted from the analyses to examine the performance of TEOAEs relative to pure-tone testing at higher frequencies (2.0 – 4.0 kHz). These comparisons revealed a sensitivity ranging between 79% and 91% and specificity of 69 – 94% when TEOAE pass criteria was varied between 0 and 9 dB signal-to-noise ratio. At 7 dB SNR a sensitivity of 91% and specificity of 79% were obtained.
The authors concluded that the criteria applied to TEOAE testing in infants may not be appropriate when school-age children are tested and needs to be revised before TEOAEs could be used in this age group. This is possibly because TEOAE screening is not sensitive to middle-ear dysfunction. When lower frequencies were excluded from analyses the sensitivity and specificity of TEOAE screening increased, possibly because lower frequencies are more susceptible to ambient noise and middle-ear pathology. The poorer test performance of TEOAE testing relative to a protocol combining PTA and tympanometry led the authors to conclude that TEOAE testing could be used to replace pure-tone testing but not the pure-tone plus tympanometry battery in the 6-year-old age group. A school setting, while not providing optimal test conditions, is reflective of normal testing situations (non-sound treated rooms with varying levels of ambient noise). While the order of testing was randomised, one

THE EFFECT OF CLASSROOM SOUND FIELD AMPLIFICATION AND THE EFFECTIVENESS OF OTOACOUSTIC EMISSION HEARING SCREENING IN
SCHOOL-AGE CHILDREN
30
audiologist performed all the tests suggesting that this person was not blind to the results of other tests. Testing methodologies including pass/fail criteria were described in detail.
Lyons et al. (2004) investigated the performance of DPOAE screening relative to pure-tone testing and a battery combining pure-tone and tympanometry results. A large sample of 1003 school children with a mean age of 6.2 years (range 4.1 – 7.9 years) was recruited from primary schools in Brisbane, Australia. A large proportion of the sample (n=940) had previously taken part in an examination of the effectiveness of TEOAE to detect hearing loss (Driscoll et al. 2001). A single audiologist conducted all testing, including a preliminary otoscopic examination, and children were tested in quiet but non-sound-treated rooms. Pure-tone audiometry, tympanometry and DPOAE testing were administered in a counterbalanced order. The PTA fail threshold was set at 25 dB HL and the hearing threshold was determined for each frequency which failed to reach this level. ROC curves were plotted for performance of each DPOAE frequency (1.1, 1.9 and 3.8 kHz) relative to the closest pure-tone frequency (1, 2, and 4 kHz respectively). The pass/fail criteria for DPOAEs were varied to identify the optimal signal-to-noise ratio for each frequency. For the 1.9 kHz frequency, a 5 dB SNR yielded 89% sensitivity and a 19% FPR. For the 3.8 kHz frequency an 11 dB SNR yielded a 90% sensitivity and a 22% FPR. The test performance of the 1.9 and 3.8 kHz frequencies was better than that of the 1.1 kHz frequency (4 dB SNR, sensitivity 86%, FPR 52%). Subsequent analyses compared the test performance of the 1.9 and 3.8 kHz frequencies relative to a pure-tone plus tympanometry battery both separately and combined with tympanometry results. The sensitivity and FPR for the 1.9 kHz and 3.8 kHz frequencies were 62% and 14% and 68% and 17% respectively. Four protocol options were then compared with a gold standard of pure-tone plus tympanometry results. Sensitivity ranged from 96 – 99% and FPR were 5-26% when either or both of the DPOAE frequencies were combined with tympanometry. The lowest FPR (5%, sensitivity 96%) was obtained when DPOAEs at 1.9 kHz or 3.8 kHz plus normal tympanometry results were considered a pass. The highest sensitivity (99%, FPR 26%) was obtained when DPOAEs at 1.9 kHz and 3.8 kHz plus normal tympanometry was considered a pass.
The authors concluded that DPOAEs alone could not replace the pure-tone plus tympanometry battery because the DPOAE test is not highly sensitive to middle-ear dysfunction in school-age children. If identifying middle-ear pathology is a goal of any screening programme then tympanometry must be included in the test battery. DPOAE testing does not perform as well at lower frequencies (1.1 kHz) possibly because of a greater effect of ambient noise on lower frequencies. The authors suggested that the best option for screening using DPOAEs in school settings would be to minimise the FPR while retaining a sensitivity of >80% to reduce parental anxiety and limit the cost of the screening programme. As the optimal signal-to-noise ratio varied between frequencies, the authors recommended that a fixed SNR was not ideal. The performance of DPOAEs plus tympanometry was superior to that of DPOAEs alone. The authors also suggested that DPOAE testing could be an essential tool for testing children who are unable to perform pure-tone tests.
Bu et al. (2005) assessed the test performance of TEOAEs as part of a study examining the effectiveness of the Chinese Hearing Questionnaire for Schoolchildren (CHQS) relative to pure-tone and tympanometry assessments. The caregivers of 317 children aged 5.5 – 12.75 years (mean = 9.43 years) from a rural school in China completed the CHQS two weeks prior to audiological assessment of the children using otoscopy, pure-tone testing, tympanometry and TEOAE testing. Testing was completed by a team of otolaryngologists, audiologists and nurses. TEOAE pass/fail criteria were set at ≥ 3 dB SNR and a whole wave reproducibility ≥ 50% averaged over 1.5 – 4.0 kHz frequencies. The threshold for passing pure-tone testing was ≤ 20 dB averaged over four thresholds and Type B tympanograms were considered a fail. TEOAE test performance was compared to a gold standard battery consisting of pure-tone plus tympanometric testing and yielded a sensitivity of 73% with a 2% FPR. The authors commented on the low prevalence of histories of diagnosed ear pathology (7%), difficulty hearing sounds (5%), and the low failure rate during testing (PTA = 2.8%, tympanometry = 1.3%, TEOAE = 6.6%). The low prevalence of middle-ear pathology may have influenced test performance and it was also suggested by the authors that there may be a lower incidence of tympanometry failures in some ethnic groups, suggesting that the test performance of TEOAE testing among Chinese children may not generalise to other populations. Initially 519 children were asked to participate in the study with 61% (n=317) agreeing to participate. The children who participated in the study may have had a lower or higher prevalence of hearing loss than those who refused to participate, and this may have influenced positive and negative predictive values. The generalisability of the sample to the rest of the Chinese schoolchildren population and to other populations is questionable.

THE EFFECT OF CLASSROOM SOUND FIELD AMPLIFICATION AND THE EFFECTIVENESS OF OTOACOUSTIC EMISSION HEARING SCREENING IN
SCHOOL-AGE CHILDREN
31
Ho et al. (2002) investigated the test performance of TEOAEs relative to tympanometry in a sample of 664 children recruited through mother and infants clinics and day care centres in Minnesota, U.S.A. The mean age of the sample was 37 months with 54% aged 36 months or older. Children whose parents agreed to participate in the study were assessed using otoscopy to identify any ear occlusion, TEOAEs and tympanometry by graduate audiology students. Parents were also asked to complete a questionnaire about the child’s history of and risk factors for hearing loss or otitis media. Ears occluded with cerumen were excluded from analyses because of potential interference with both tympanometry and TEOAE results. The fail criteria for tympanometry was a static compensated acoustic admittance level of <0.2mmho (0-24 months) or < 0.3mmho (>24 months). TEOAE fail criteria were a whole wave reproducibility of ≤ 50% at 0.8 and 1.6 kHz or ≤ 75% at 2.4, 3.2 and 4.0 kHz. There was a moderate level of agreement between TEOAE and tympanometric widths results (κ=0.64 – 0.67). A TW>300 was used for the age-stratified comparison of TEOAE and tympanometry results. In children aged 36 months or older TEOAE had a sensitivity of 78.2% and a specificity of 94.6% relative to tympanometry results. Across the whole sample sensitivity and specificity was 79.2% and 91.4% respectively.
Krueger and Ferguson (2002) examined the test performance of DPOAEs relative to tympanometry and pure-tone audiometry in a sample of 300 children recruited from four schools in Texas, U.S.A. The mean age and age range of the sample were not provided, however all children were recruited from second and third grade classes (equivalent to year 3 and year 4 in New Zealand). Children underwent an initial otoscopy performed by an audiologist followed by the three screening methods. No information was provided regarding counterbalancing or whether a single person administered all tests. If a single audiologist administered all tests they would not be blind to the results of previous tests, thereby possibly introducing bias into their administration of tests or interpretation of test results. The order of the tests may have been the same for all children and it is possible that some order effects may have biased the test results. The pure-tone testing in particular could be influenced by children’s attention and motivation to perform and if always performed first or last in the battery could be subject to performance bias. Pure-tone pass/fail criteria were set at 35 dB HL, a more lenient criteria than other studies utilising pure-tone testing. Mild hearing loss occurs at 26 - 30 dB HL and moderate hearing loss above this level. For consistency across studies a pure-tone criteria of 25 - 30 dB HL may have been more appropriate. Not enough information was provided regarding the administration and pass/fail criteria of the DPOAE testing, however a standardised OAE device with preset pass criteria appears to have been used. The failure rate for PTA was 3.3% and no information was provided regarding the pass/fail criteria for tympanometry testing.
Relative to pure-tone testing, DPOAEs had a sensitivity of 95.7% and specificity of 65%. Relative to tympanometry, DPOAEs had a sensitivity of 98.2% and a specificity of 56%. The pure-tone testing comparison may have decreased sensitivity and increased specificity due to the poorer level of hearing being accepted as a pass (<35 dB HL). No information was provided as to whether hearing thresholds were set when a child failed this criteria. There was also no information provided regarding the frequencies at which DPOAEs were measured or whether results were averaged across frequencies. All of these aspects may have affected DPOAE test performance and brings into question the validity of the findings of this study. No results were provided regarding the otoscopic examination. Children with ears occluded by cerumen are often excluded from analyses comparing the performance of OAEs and pure-tone testing because this condition may affect test performance. The authors did not calculate sensitivity or specificity because they had no gold standard audiological results with which to compare test findings. The author of this review calculated sensitivity and specificity of DPOAE testing relative to pure-tone and tympanometry testing for the purposes of comparison with other studies. The authors concluded that DPOAE testing is a good hearing testing option for children who are difficult to test with conventional methods. Methodological flaws or lack of details in the study make it difficult to support or reject this conclusion.
Sabo et al. (2000) investigated the test performance of TEOAEs and pure-tone testing relative to a gold standard audiogram. Children from four schools selected to represent suburban, urban, rural, and Native American populations were recruited with a total of 583 children participating (age range 5-9 years). A similar number of children participated from each school. Pure-tone audiometry was administered using four frequencies with a correct response to all four tones in both ears required for a pass. The authors did not provide the hearing level at which the tones were presented (e.g. 30 dB HL) or the frequencies tested, however standard pure-tone testing criteria in the state of Arizona where the study was conducted is 25 dB HL at 0.5 kHz and 20 dB HL for 1.0, 2.0 and 4.0 kHz, and it is likely that these criteria were applied to pure-tone testing in this study. The pass criteria for TEOAE testing was response at three frequencies of 3 dB or more above the noise floor with a whole wave
THE EFFECT OF CLASSROOM SOUND FIELD AMPLIFICATION AND THE EFFECTIVENESS OF OTOACOUSTIC EMISSION HEARING SCREENING IN
SCHOOL-AGE CHILDREN
32
reproducibility of at least 70% and stability of 90% or greater. Testing was conducted in schools in varying situations, e.g. in classrooms during quiet time, and by various school and audiology personnel in order to reflect the testing situation in school screening programmes. The order of testing was randomized and TEOAE test administration training was provided by an audiologist who was present during screening but did not administer any of the tests.
Pure-tone and TEOAE results were compared to a gold standard audiogram performed by an audiologist. The sensitivity and specificity of TEOAE testing was 63% and 91% respectively, while that of pure-tone testing was 87% and 80% respectively. TEOAE testing had a higher specificity and lower sensitivity relative to pure-tone testing. The sensitivity and specificity of PTA and TEOAE was provided separately for each school and there was a wide variability in the performance of both tests with TEOAE testing performing as well as or better than PTA in two schools and worse in two schools. A possible explanation for these differences could be that there may have been differences in the quality of test administration, protocols and levels of ambient noise between schools. While this reflects the testing conditions of school-based screening programmes, it makes interpretation of the sensitivity and specificity findings for this study difficult, especially because information about ambient noise levels, the location of testing and the test administrators was not reported. The prevalence of hearing loss and failure rates for each of the tests in each school were also not reported and these may have influenced screening performance.
Taylor and Brooks (2000) compared the test performance of TEOAEs to pure-tone and tympanometry testing and otoscopy. Children (n=152) ranged in age from 3 to 8 years (mean = 5.5 years) and were referred from local speech and hearing centres, doctors, clinics and day care centres. Two audiologists administered the four tests in sound-treated rooms with the order of the testing randomized and no single audiologist performing all the tests for one child. Pure-tone testing stimuli were presented for 1.0, 2.0 and 4.0 kHz frequencies at 20 dB HL in the right ear and then the left ear. Failure to respond to 20 dB for one or more frequencies was classified as a fail and the hearing threshold for that ear was subsequently set to ensure that the child failed to hear the tone rather than refusing or being incapable of responding. Tympanometry was carried out using a 226 Hz probe tone. Failure was determined by either static admittance (< 0.3 mmho), or ear canal volume (> 1.0cm3) when accompanied by a flat tympanogram, or tympanometric width (> 200 daPa). TEOAEs were measured for 0.5 – 5.0 kHz frequencies at 75-85 dB pe SPL. A noise rejection level of 47 dB SPL was set with a high-pass filter to improve SNR for the low frequency click response. An OAE response at least 3 dB above the noise floor for at least 3 frequency bands with a whole wave reproducibility of at least 40% was required to pass on the basis that higher specificity with no change to sensitivity was reported when the pass/refer criteria were changed from <50% to <40% (Nozza et al. 1997). Seven ears were excluded from analyses because of atresia or the child’s refusal to cooperate.
When TEOAEs were compared to pure-tone testing sensitivity was 81% and specificity 95%. When TEOAEs were compared to tympanometry results sensitivity was 60% and specificity 91%. Chi-square analyses showed a significant relationship between pure-tone and TEOAE results (df 1, 141.4, p<0.05) with a follow-up phi-coefficient showing a high positive correlation (r=0.70). A significant relationship between tympanometry and TEOAE results (df1, 50.7, p<0.05) was also found with the follow-up correlation indicating a moderately positive relationship (r=0.42). The authors suggested that the lower than expected sensitivity when comparing TEOAEs to pure-tone testing may have been because TEOAEs are not as sensitive at lower frequencies. All six false negative ears failed pure-tone testing at 1.0 kHz and with an average threshold of 30 dB, so were considered to have normal-to-mild hearing loss at that frequency. It is possible that TEOAEs are less sensitive at this level and setting a threshold of 30dB HL may have influenced the sensitivity of TEOAE testing. The authors concluded that TEOAE testing could be considered as a replacement for pure-tone testing but not tympanometry. It was recommended that the performance of TEOAE plus tympanometry protocols should be compared to pure-tone plus tympanometry protocols.
This study included children referred from speech and language centres and clinics with a potentially higher prevalence of hearing loss and the sample lacks generalisability to school-based screening programmes as a result. Children were also tested in sound-treated rooms which may have improved their performance for both pure-tone and TEOAE testing. These are ideal conditions for administering both tests, but are not necessarily of standard school test conditions and thus the level of sensitivity obtained in this study may be higher than what would be achieved in a school screening programme.

THE EFFECT OF CLASSROOM SOUND FIELD AMPLIFICATION AND THE EFFECTIVENESS OF OTOACOUSTIC EMISSION HEARING SCREENING IN
SCHOOL-AGE CHILDREN
33
Table 5 Summary of studies examining the test performance of otoacoustic emission testing
Reference Measures Frequencies Fail rate (%)
Detection rate (%), (95% CI)
False positive rate (%), (95% CI)
Davilis et al. (2005)
PTA Tympanometry TEOAE Sample = fail audiological exam
0.25 – 8 kHz ≥ 30 dB HL Type B or C SNR < 6 dB in 1.6 – 2.8 kHz Automatic validation – partial pass or fail considered abnormal TEOAE vs PTA TEOAE vs tympanometry TEOAE vs PTA + tymp
20 58 23
66.0 36.6 36.6
(56.7– 75.3) (31.0– 42.1) (31.0– 42.1)
12.3 4.8 4.8
(9.1– 15.6) (1.9– 7.6) (1.9– 7.6)
Bu et al. (2005) PTA Tympanometry TEOAE Sample = voluntary, 61% response rate
0.5 – 4 kHz > 20 dB HL averaged Type B SNR < 3 dB, REPROW <50%, 1.5 – 4 kHz TEOAE vs PTA + tympanometry
2.8 1.3 6.6
73.0
2.0
Lyons et al. (2004)
PTA Tympanometry DPOAE
0.5 – 4.0 kHz > 25 dB HL Type B or C2 DP amp/noise floor ratio varied and plotted in ROC curve for 1.1 – 3.8 kHz DPOAE vs PTA: 1.1 kHz SNR 4 dB 1.9 kHz SNR 5 dB 3.8 kHz SNR 11 dB DPOAE vs tymp: 1.9 kHz SNR 5 dB 3.8 kHz SNR 11 dB DPOAE + tymp vs PTA + tymp: 1.9 kHz SNR ≥ 5 dB + tymp 3.8 kHz SNR≥11 dB + tymp 1.9 kHz+ 3.8 kHz + tymp 1.9 kHz or 3.8 kHz + tymp
5.5 13.2
86.0 89.0 90.0 62.0 68.0 97.2 97.2 98.6 95.7
(95.2- 99.1) (95.2- 99.1) (97.2- 100) (99.4- 98.1)
52.0 19.0 22.0 14.0 17.0 14.0 16.8 25.5 5.3
(12.3- 15.6) (15.0- 18.5) (23.5- 27.6) (4.3- 6.4)
Ho et al. (2002) Tympanometry TEOAE Sample: voluntary recruitment through clinics and day care centres
Static admittance < 0.3 mmho, TW > 300 0.8 – 1.6 kHz REPROW < 50%; 2.4 – 4.0 kHz REPROW < 75% TEOAE vs tympanometry ≥ 36 months TEOAE vs tympanometry overall
26 18
78.2 68.1
(70.5– 85.9) (62.1- 74.1)
5.4 5.0
(3.5- 7.3) (3.5- 6.5)
Krueger and Ferguson (2002)
PTA Tympanometry DPOAE
0.5 – 4.0 kHz 35 dB HL 3 or more responses below 65/55 window frame DPOAE vs PTA DPOAE vs tympanometry
3.3 8.3 6.3
65.0 56.0
(44.1- 86.0) (42.2- 69.8)
4.3 1.8
(2.7- 6.0) (0.7- 2.9)
Driscoll et al. (2001)
PTA Tympanometry TEOAE
0.5 – 4.0 kHz at 25 dB HL Type B or C2 2.4 – 4.0 kHz SNR ≥ 3 dB SNR varied from 0-15 dB HL and test performance compared TEOAE vs overall PTA TEOAE vs PTA 2-4 kHz TEOAE vs PTA + tymp
8.9 17.9 20.3
65-92 79-91 51-73
7-64 6-31 7-26
Sabo et al. (2000)
PTA TEOAE
0.5 kHz at 25 dB, 1-4 kHz at 20 dB ≥ 3 dB, REPROW≥ 70% TEOAE vs PTA TEOAE vs audiogram PTA vs audiogram
25 13
25.5 63.2 86.8
(18.4- 32.6) (47.8- 78.6) 76.1- 97.6)
8.3 9.0 19.8
(5.7- 10.9) (6.6- 11.4) (16.4- 23.2)
Taylor and Brooks (2000)
PTA Tympanometry TEOAE Sample: referrals, day care centre
1.0 – 4.0 kHz at 20 dB HL Ytm<0.3mmho or Vec>1.0cm3 or TW>200 daPa SNR < 3dB 0.5 – 5.0 kHz, REPROW <40% TEOAE vs PTA TEOAE vs tympanometry
10.8 8.6 13.4
81.3 60.0
(67.7- 94.8) (40.1- 79.2)
5.3 9.1
(2.6- 8.0) (5.6- 12.5)

THE EFFECT OF CLASSROOM SOUND FIELD AMPLIFICATION AND THE EFFECTIVENESS OF OTOACOUSTIC EMISSION HEARING SCREENING IN
SCHOOL-AGE CHILDREN
34
Conclusions Otoacoustic emission testing can be used to identify hearing loss but cannot be used to diagnose the degree of hearing loss, and so follow-up diagnostic testing would still be required for children who failed the screen. Considering this, the number of false-positive results obtained using otoacoustic testing should be minimized to reduce the resources required for diagnosis and parental stress. In addition, the earlier hearing loss is identified the better the outcome for the child, and so a high sensitivity should also be a requirement of a hearing screening test.
Overall the quality of studies included in this section was mixed. This was partly because of the lack of a true gold standard in audiometric testing of children. Because of this, studies used pure-tone audiometry, tympanometry, audiograms or a combination of pure-tone and tympanometry as a substitute gold standard, making comparison between the studies more difficult. In addition, the criteria used to determine what was a normal (pass) and what was an abnormal (fail) result varied between studies. Studies which included a measure of tympanometry always considered Type B tympanograms to be a fail but some studies also considered Type C2 to be a fail. Pure-tone testing criteria varied from a 20-35 dB HL cut-off and frequencies tested varied as well, although most included at least 0.5 – 4.0 kHz. In New Zealand 26 – 30 dB HL is considered to be indicative of mild hearing loss and so studies which had a higher hearing level cut-off than this may not be as relevant to a New Zealand setting. In otoacoustic testing, the signal-to-noise ratio required for emissions to be considered present varied from 3-6 dB in most studies. These values were chosen because they were the criteria used in the Rhode Island Hearing Assessment Project (RIHAP), a large study of the effectiveness of otoacoustic testing in infants and newborns. Two studies manipulated the signal-to-noise ratio to determine the best otoacoustic emission criteria for optimal test performance in young children. The results of these studies suggest that the criteria used for infants and newborns may not be as appropriate for the assessment of young children’s hearing (Lyons et al. 2004; Driscoll et al. 2001), thus bringing into question the accuracy of the findings from studies which use a 3 dB signal-to-noise ratio cut-off, or indeed a fixed signal-to-noise cut-off for all frequencies.
While the sensitivity and false positive rate of otoacoustic emission testing varied substantially between studies, some conclusions can be drawn. Otoacoustic emission testing performed well relative to pure-tone audiometry with a high specificity and good sensitivity. One study which compared the test performances of pure-tone audiometry and otoacoustic emissions to a gold standard audiogram reported a lower sensitivity but a higher specificity for otoacoustic emissions (Sabo et al. 2000). When compared to tympanometry, otoacoustic emission testing did not perform as well and sensitivity was lower. It may be that otoacoustic emissions are not as sensitive to hearing loss caused by middle ear disorders. The recommendations of many of the studies were that otoacoustic emission testing could be used to replace pure-tone testing but not tympanometry. In addition, one study (Lyons et al. 2004) compared the performance of a test battery combining otoacoustic emissions and tympanometry findings with a battery of pure-tone audiometry plus tympanometry and found that the sensitivity increased, although the false positive rate was relatively high (14 – 25%).
Two important and well-controlled studies set in Australia (Lyons et al. 2004, Driscoll et al. 2001) varied the signal-to-noise ratio required for otoacoustic emissions to be present or the signal-to-noise ratio required for different frequencies. Sensitivity was influenced by the pass/fail criteria and optimal signal-to-noise ratios were different for different frequencies. It appears that using different pass/fail criteria for different frequencies improves the sensitivity of the test. In addition, test performance of otoacoustic emission testing was better at the higher frequencies (1.9 – 3.8 kHz) than at the lower frequencies (1.1 kHz). In all other studies a single criteria of 3-6 dB above the noise floor was required for all frequencies which may have affected test performance. Only one study (Lyons et al. 2004) compared the performance of a test battery combining distortion-produced otoacoustic emissions with tympanometry with the commonly used pure-tone plus tympanometry battery. Further studies are needed to further determine the best pass/fail criteria for optimal test performance of otoacoustic emission testing and how transient-evoked otoacoustic emissions perform in a test battery with tympanometry.
One of the criticisms of pure-tone testing is that, because it requires a behavioural response, it is reliant on the cooperation of participants as well as an understanding of the requirements of the test and sustained attention. It appears that otoacoustic testing would be especially suitable for hearing assessment in populations which are difficult to test using pure-tone audiometry, such as children with behavioural problems, or intellectual or physical impairments. It is, however, still subject to difficulties with a small number of children refusing to cooperate for both ears and testing being
THE EFFECT OF CLASSROOM SOUND FIELD AMPLIFICATION AND THE EFFECTIVENESS OF OTOACOUSTIC EMISSION HEARING SCREENING IN
SCHOOL-AGE CHILDREN
35
affected by ambient noise or breathing difficulties in some cases (Lyons et al. 2004). No studies were identified which assessed the test performance of otoacoustic testing among difficult to test populations, however studies have investigated the potential of testing these groups of children. One such study (Driscoll et al. 2002) examined the feasibility of otoacoustic emission testing in special education schools and found that testing was successful in 80% of the special needs children tested.
If one of the goals of a hearing screening programme is to identify middle ear disorders as well as hearing impairment, then tympanometry should be included in any battery. It would appear that otoacoustic emissions could be used to replace pure-tone testing in a test battery with tympanometry to screen for hearing loss but not to replace tympanometry. Transient-evoked otoacoustic emission testing has been used in a small (n=2305) community-based screening programme in Australia with some favourable results (McPherson et al. 1998). Infants and children up to 12 years of age were screened using TEOAEs and an otoscopic examination through community health clinics in Brisbane, with approximately 8% of children being between 2.5 and 5.5 years of age. Of the children in this age group, mean test time was 1-1.5 minutes and 98% of children were successfully screened. There is however, a need for further trials of community-based screening using an OAE/tympanometry test battery and comparing it to a pure-tone/tympanometry battery and further investigation of the performance of otoacoustic emission testing in difficult to test populations.

THE EFFECT OF CLASSROOM SOUND FIELD AMPLIFICATION AND THE EFFECTIVENESS OF OTOACOUSTIC EMISSION HEARING SCREENING IN SCHOOL-AGE CHILDREN
36
Table 6. Evidence table of appraised articles relating to the effectiveness of otoacoustic emissions as a method of hearing testing in school-age children
Authors Country Study Design
Sample and Interventions Methods Results Limitations and Conclusions
Davilis et al. (2005) Greece Cross sectional Grade III-2
N=5253 children resident in Kea (a Greek Island) and in a rural community (Karditsa area) and examined between March 2000 and May 2003. All children in these areas were examined with 90% coverage Mean age = 7.5 years Range 4-12 years N=5253 children who had a complete audiological examination Of those, 271 children (n=497 ears) were included in the final sample and underwent PT, tympanometry and TEOAE testing. N= 237 children included because of positive hx N= 34 children included because of signs of middle-ear pathology Medical and otolaryngologic hx of all children Audiological evaluation, PT audiometry, tympanometry, TEOAEs when one of the following conditions was present:
1) positive hx for middle-ear disease or hearing loss of any type
2) abnormal otoscopic findings suggesting middle-ear pathology
3) presence of congenital anomalies or other factors
Tests performed in a quiet but not sound-treated room
PT audiometry 2-channel Danplex DA64 portable audiometer with a pair of TDH 39 earphones PT thresholds of each ear at frequencies of 0.25, 0.5, 1, 2, 3, 4 and 8 kHz Hearing loss diagnosed if any threshold between0.25 and 8 kHz ≥ 30 dB HL. Tympanometry Welch Allyn TM62 clinical admittance meter Single frequency 85 dB SPL tone set at 226 Hz. Tympanograms classified as A, B or C (Jerger’s classification) Type B or C considered a fail/abnormal TEOAE Echocheck device (Otodynamics, London) in Quickscreen mode Automatic TEOAE validation Pass/partial pass/fail indicated Partial pass or fail considered abnormal SNR of 6 dB in 1.6 – 2.8 kHz region considered a pass
PT audiometry Fails (PTA ≥ 30 dB HL) = 100 ears (20%) Tympanometry Type A = 210 ears (42.2%) Type B = 102 ears (20.5%) Type C = 185 ears (37.2%) TEOAEs Pass = 382 ears (76.9%) Fail = 115 ears (23.1%) TEOAEs compared to PTA DR (95% CI), FPR (95% CI) Se = 66% (56.9 – 75.3) FPR = 12.3% (9.1 – 15.6) PPV = 57.4% (48.4 – 66.4) NPV = 91.1% (88.2 – 94.0) TEOAEs compared to Tympanometry DR (95% CI), FPR (95% CI) Se = 36.6% (31.0 – 42.1) FPR = 4.8% (1.9 – 7.6) PPV = 91.3% (86.1 – 96.5) NPV = 52.4% (47.4 – 57.4) TEOAEs compared to PTA + Tympanometry DR (95% CI), FPR (95% CI) Se = 36.6% (31.0 – 42.1) FPR = 4.8% (1.9 – 7.6) PPV = 91.3% (86.1 – 96.5) NPV = 52.4% (47.4 – 57.4)
Authors conclusions When TEOAEs were compared with PTA, an acceptable sensitivity of 66% and a high specificity exceeding 87% were found. The sensitivity would probably have been greater if we had used 20 dB instead of 30 dB as the cut-off point, but the specificity would decrease. Comparison with tympanometry yielded a low sensitivity of 36.6% with an excellent specificity of 95%. The same was found when comparing TEOAEs with the combination of PTA and tympanometry. In a significant number of ears with minimal pathology, TEOAEs are not affected. Measurement of TEOAEs was restricted to a pass/fail result and actual TEOAE levels were not available. The specificity of TEOAE screening was high, which shows that in ears with normal TEOAEs, normal tympanograms are most frequently recorded. The remaining 5% of FP results can be explained by interfering factors such as high ambient noise, restlessness, and bad probe fitting. Prevalence of middle-ear disease was high. PTA and tympanometry are excellent methods of screening for this age group. TEOAEs could be a useful adjunctive tool in this task. The high specificity of TEOAEs permits screening out ears with normal findings, especially in uncooperative children. However,because of its low sensitivity, it should be used in conjunction with PTA and tympanometry.
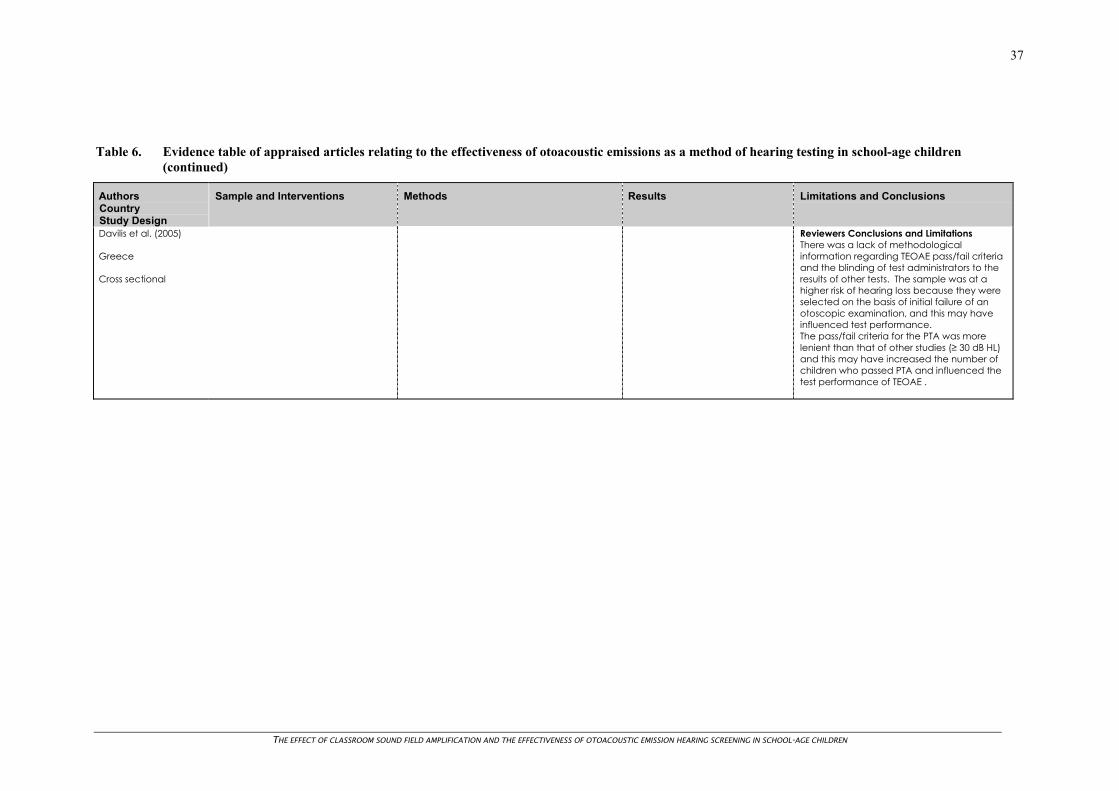
THE EFFECT OF CLASSROOM SOUND FIELD AMPLIFICATION AND THE EFFECTIVENESS OF OTOACOUSTIC EMISSION HEARING SCREENING IN SCHOOL-AGE CHILDREN
37
Table 6. Evidence table of appraised articles relating to the effectiveness of otoacoustic emissions as a method of hearing testing in school-age children (continued)
Authors Country Study Design
Sample and Interventions Methods Results Limitations and Conclusions
Davilis et al. (2005) Greece Cross sectional
Reviewers Conclusions and Limitations There was a lack of methodological information regarding TEOAE pass/fail criteria and the blinding of test administrators to the results of other tests. The sample was at a higher risk of hearing loss because they were selected on the basis of initial failure of an otoscopic examination, and this may have influenced test performance. The pass/fail criteria for the PTA was more lenient than that of other studies (≥ 30 dB HL) and this may have increased the number of children who passed PTA and influenced the test performance of TEOAE .
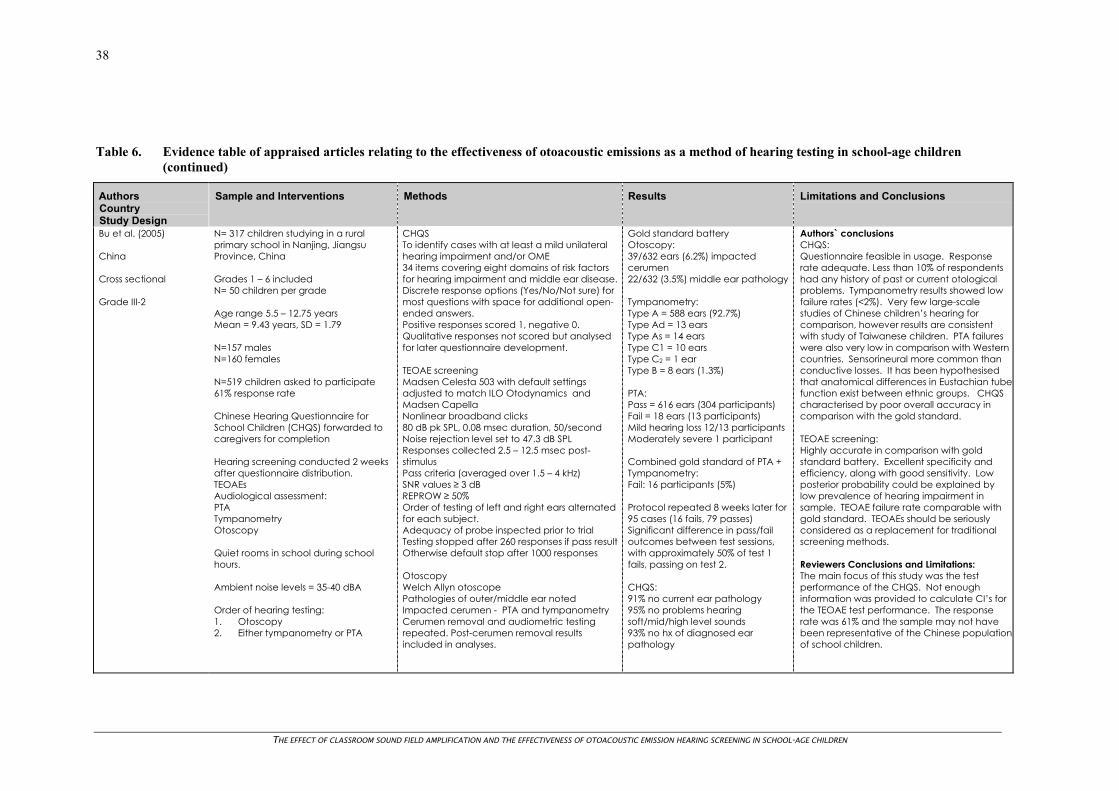
THE EFFECT OF CLASSROOM SOUND FIELD AMPLIFICATION AND THE EFFECTIVENESS OF OTOACOUSTIC EMISSION HEARING SCREENING IN SCHOOL-AGE CHILDREN
38
Table 6. Evidence table of appraised articles relating to the effectiveness of otoacoustic emissions as a method of hearing testing in school-age children (continued)
Authors Country Study Design
Sample and Interventions Methods Results Limitations and Conclusions
Bu et al. (2005) China Cross sectional Grade III-2
N= 317 children studying in a rural primary school in Nanjing, Jiangsu Province, China Grades 1 – 6 included N= 50 children per grade Age range 5.5 – 12.75 years Mean = 9.43 years, SD = 1.79 N=157 males N=160 females N=519 children asked to participate 61% response rate Chinese Hearing Questionnaire for School Children (CHQS) forwarded to caregivers for completion Hearing screening conducted 2 weeks after questionnaire distribution. TEOAEs Audiological assessment: PTA Tympanometry Otoscopy Quiet rooms in school during school hours. Ambient noise levels = 35-40 dBA Order of hearing testing: 1. Otoscopy 2. Either tympanometry or PTA
CHQS To identify cases with at least a mild unilateral hearing impairment and/or OME 34 items covering eight domains of risk factors for hearing impairment and middle ear disease. Discrete response options (Yes/No/Not sure) for most questions with space for additional open-ended answers. Positive responses scored 1, negative 0. Qualitative responses not scored but analysed for later questionnaire development. TEOAE screening Madsen Celesta 503 with default settings adjusted to match ILO Otodynamics and Madsen Capella Nonlinear broadband clicks 80 dB pk SPL, 0.08 msec duration, 50/second Noise rejection level set to 47.3 dB SPL Responses collected 2.5 – 12.5 msec post-stimulus Pass criteria (averaged over 1.5 – 4 kHz) SNR values ≥ 3 dB REPROW ≥ 50% Order of testing of left and right ears alternated for each subject. Adequacy of probe inspected prior to trial Testing stopped after 260 responses if pass result Otherwise default stop after 1000 responses Otoscopy Welch Allyn otoscope Pathologies of outer/middle ear noted Impacted cerumen - PTA and tympanometry Cerumen removal and audiometric testing repeated. Post-cerumen removal results included in analyses.
Gold standard battery Otoscopy: 39/632 ears (6.2%) impacted cerumen 22/632 (3.5%) middle ear pathology Tympanometry: Type A = 588 ears (92.7%) Type Ad = 13 ears Type As = 14 ears Type C1 = 10 ears Type C2 = 1 ear Type B = 8 ears (1.3%) PTA: Pass = 616 ears (304 participants) Fail = 18 ears (13 participants) Mild hearing loss 12/13 participants Moderately severe 1 participant Combined gold standard of PTA + Tympanometry: Fail: 16 participants (5%) Protocol repeated 8 weeks later for 95 cases (16 fails, 79 passes) Significant difference in pass/fail outcomes between test sessions, with approximately 50% of test 1 fails, passing on test 2. CHQS: 91% no current ear pathology 95% no problems hearing soft/mid/high level sounds 93% no hx of diagnosed ear pathology
Authors` conclusions CHQS: Questionnaire feasible in usage. Response rate adequate. Less than 10% of respondents had any history of past or current otological problems. Tympanometry results showed low failure rates (<2%). Very few large-scale studies of Chinese children’s hearing for comparison, however results are consistent with study of Taiwanese children. PTA failures were also very low in comparison with Western countries. Sensorineural more common than conductive losses. It has been hypothesised that anatomical differences in Eustachian tubefunction exist between ethnic groups. CHQS characterised by poor overall accuracy in comparison with the gold standard. TEOAE screening: Highly accurate in comparison with gold standard battery. Excellent specificity and efficiency, along with good sensitivity. Low posterior probability could be explained by low prevalence of hearing impairment in sample. TEOAE failure rate comparable with gold standard. TEOAEs should be seriously considered as a replacement for traditional screening methods. Reviewers Conclusions and Limitations: The main focus of this study was the test performance of the CHQS. Not enough information was provided to calculate CI’s for the TEOAE test performance. The response rate was 61% and the sample may not have been representative of the Chinese populationof school children.

THE EFFECT OF CLASSROOM SOUND FIELD AMPLIFICATION AND THE EFFECTIVENESS OF OTOACOUSTIC EMISSION HEARING SCREENING IN SCHOOL-AGE CHILDREN
39
Table 6. Evidence table of appraised articles relating to the effectiveness of otoacoustic emissions as a method of hearing testing in school-age children (continued)
Authors Country Study Design
Sample and Interventions Methods Results Limitations and Conclusions
Bu et al. (2005) China Cross sectional Continued
Test session 20 minutes long Led by otolaryngologist, assisted by one otolaryngologist, 3 audiologists, 3 nurses 95 participants received repeat gold standard assessment 8 weeks after first session
Tympanometry Madsen Zodiac 901 middle ear analyser Pass criteria: Bilateral tympanogram of Type other than B (Jerger, 1970) PTA Madsen Orbiter and Danplex audiometers TDH39 headsets Air and bone conduction thresholds at 0.5, 1, 2, and 4 kHz Pass criteria: Normal audiograms bilaterally at ≤ 20 dB averaged over four thresholds
8% ear discharge and ear pain Single item HR ranged from 0.07 – 0.42 PPV from 0.03 – 0.33 Sp = 0.76 – 0.99 EF = 0.75 – 0.95 NPV = 0.95 – 0.96 TEOAE: SNR range -1.30 to 7.00 dB REPROW range -15% to 72% (mean =60%, SD = 11) Fail (at least 1 ear) = 21 participants (6.6%) Comparison with gold standard battery: Se = 73% TN = 98% PPV = 53% NPV = 99%
Secondly, it was not possible to prevent the cohort from seeking medical treatment for otologic pathology between the questionnaireand audiological testing or between the two gold standard testing sessions. The sample had a low prevalence of ear pathology and low history of otologic problems and may havelacked generalisability because of this.

THE EFFECT OF CLASSROOM SOUND FIELD AMPLIFICATION AND THE EFFECTIVENESS OF OTOACOUSTIC EMISSION HEARING SCREENING IN SCHOOL-AGE CHILDREN
40
Table 6. Evidence table of appraised articles relating to the effectiveness of otoacoustic emissions as a method of hearing testing in school-age children (continued)
Authors Country Study Design
Sample and Interventions Methods Results Limitations and Conclusions
Lyons et al. (2004) Brisbane, Australia Cross sectional Grade III-2
N= 1003 schoolchildren 528 boys, 475 girls Mean age = 6.2 years Age range = 4.1-7.9 years (SD=0.4) Children with a short attention span, intellectual/physical impairment, learning difficulties or children who did not understand test instructions were excluded from the study. The sample included all children tested in another study comparing the test performance of TEOAEs with PTA and tympanometry (see Driscoll, 2001). Audiologist with DPOAE training conducted all testing Children tested individually, seated positions, non-sound-treated rooms at school. Ambient noise level ranged between 34 and 51 dBA. Testing stopped when noise levels exceeded 50dBA. Otoscopic examination prior to all testing. PTA, tympanometry, DPOAE administered in a balanced order.
PTA: Madsen Micromate 304 audiometer ME70 noise-excluding headphones Frequencies 0.5, 1, 2 and 4 kHz presented at an intensity level of 20 dB HL Threshold set if failure to respond to a pure tone at any frequency at 20 dB HL for 2 out of 3 presentations. Children with thresholds > 25 dB HL were considered to have failed. Tympanometry: Madsen Zodiac 901 middle ear analyser Probe tone of 226 Hz Fail criteria – any tympanogram that could be classified as Type B or C2 (modified from Jerger, 1970). DPOAEs: GSI 60 DPOAE system Adequacy of probe fit inspected Series of simultaneous pure tone pairs of frequencies f1 and f2 at intensities of 65 and 55 dB SPL Primary tones maintained within +/-1 dB of set intensity Test frequency ratio of 1.21 (f1/f2) DP-gram plotting intensity of 2f1-f2 distortion product amplitude against f2 frequency Default manufacturers protocol used to record DPOAEs. 1600 sampling rate SNR estimates based on 32Hz frequency band oneither side of emissions Frame accepted for analysis if noise level ≤ 6 dB SPL and DPOAE ≥10 dB over noise floor. Primary tones of ≤ 45 dB SPL were rejected.
PTA: Pass = 1896 Fail = 110 (5.5%) Tympanometry: Pass = 1741 Fail = 265 (13.2%) Type B = 140 ears Type C2 = 125 ears DPOAEs: DPOAE SNR = DPOAE amplitude – mean noise floor DPOAE SNR at each of the f2 frequencies of 1.1, 1.9 and 3.8 kHz were compared with the nearest audiometric frequencies (1,2,4 kHz respectively). ROC curve plotted for different pass/fail criteria. ROC curves used to identify the optimal SNR ratio value for different frequencies. HR, FPR, efficiency, Pr[D/+], Pr[N/-] were determined using different SNR cutoff values as pass criteria at each test frequency. Test performance relative to PTA + Tympanometry: 1.9kHz at 5 dB SNR Se = 62% FPR = 14% 3.8kHz at 11 dB SNR Se = 68% FPR = 17%
Authors’ conclusions Tympanometry needs to be included in any test battery which aims to detect middle ear problems as well as hearing impairment because of the high prevalence of middle ear dysfunction in this population. The results of this study showed that 13.2% of ears failed tymp. Of these, a significant number passed PTA. The ROC analysis indicated that the test performance of DPOAEs was better at high frequencies than at the low frequencies, in keeping with other studies. A high level of background noise centred at the low frequencies was the main reason for this. Interpretation of DPOAE findings at 1.1kHz should be made with caution in a school setting, considering the low DR and high FPR. The test performance indicators at 1.9 and 3.8 kHz are better and similar to TEOAE findings in the same population (DR 0.81 and 0.86, FPR 0.05 and 0.09 at 2 and 4 kHz respectively) (Driscoll et al. 2001). If the DPOAE test is to identify schoolchildren for hearing impairment in excess of 25dB HL, the best option is to minimise FPR while keeping a reasonably high DR (e.g. >0.8). This would help reduce parental anxiety and minimise resources required for running the hearing screening programme. Many clinicians have employed a fixed criterion SNR (e.g. 6dB) for all test frequencies. The present study indicates that the optimal criterion for SNR varied across the frequencies.

THE EFFECT OF CLASSROOM SOUND FIELD AMPLIFICATION AND THE EFFECTIVENESS OF OTOACOUSTIC EMISSION HEARING SCREENING IN SCHOOL-AGE CHILDREN
41
Table 6. Evidence table of appraised articles relating to the effectiveness of otoacoustic emissions as a method of hearing testing in school-age children (continued)
Authors Country Study Design
Sample and Interventions Methods Results Limitations and Conclusions
Lyons et al. (2004) Brisbane, Australia Continued
DPOAE + tympanometry compared to PTA + tympanometry: 1.9 kHz + tymp Se = 97.2% (95.2 – 99.1) FPR = 14.0% (12.3 – 15.6) 3.8 kHz + tymp Se = 97.2% (95.2 – 99.1) FPR = 16.8% (15.0 – 18.5) 1.9 + 3.8 kHz + tymp 98.6% (97.2 – 100) FPR = 25.5 (23.5 – 27.6) 1.9 or 3.8 kHz + tymp Se = 95.7% (99.4 – 98.1) FPR = 5.3% (4.3 – 6.4)
When DPOAE performance was evaluated against a gold standard using both pure-tone and tymp results, there were lower hit rates in comparison to an evaluation against pure tone testing alone. Given the high prevalence of middle ear dysfunction in school children a complete test protocol involving both DPOAEs and tymp is essential. The use of DPOAEs and tymp is superior to the use of DPOAEs alone. Since DPOAEs and tymp are objective measures of auditory function, the use of a protocol that includes both measures holds promise as an indispensable tool for testing children who do not understand test instructions. Limitations of DPOAE testing include effect of physiologic and ambient noise on results for children with heavy breathing or cleft palate. Reviewers Conclusions and Limitations The sample age group and selection were adequate and representative. The school setting while not providing optimal test conditions is reflective of the normal testing situations in schools (non-sound treated rooms). While the order of testing was randomised, one audiologist performed all the tests suggesting that this person was not blind to the results of other tests. Testing methodologies including pass/fail criteria were described in detail.

THE EFFECT OF CLASSROOM SOUND FIELD AMPLIFICATION AND THE EFFECTIVENESS OF OTOACOUSTIC EMISSION HEARING SCREENING IN SCHOOL-AGE CHILDREN
42
Table 6. Evidence table of appraised articles relating to the effectiveness of otoacoustic emissions as a method of hearing testing in school-age children (continued)
Authors Country Study Design
Sample and Interventions Methods Results Limitations and Conclusions
Ho et al. (2002) Minnesota, U.S.A. Cross sectional Grade III-2
N= 664 children from birth to 71 months (5 years 11 mths) Mean age = 37 mths (SD = 18.32 mths) 0-6 mths = 33 (5%) 6-36 mths = 274 (41%) ≥ 36 mths = 357 (54%) 56% male 44% female History of recurrent OM = 48% Hx of tympanostomy tubes = 12% Previous hearing loss = 7% 29 screening clinics throughout Minnesota Held in collaboration with Lions Clubs, daycare centres and government sponsored Women, Infants and Children clinics. Screening took place between September 1997 and May 1999. Graduate students in audiology carried out testing. Otoscopy used to identify occluding cerumen, tympanic membrane perforation, or drainage in the ear canal. Ears occluded with cerumen excluded from analyses.
Otoscopy: Fail criteria (referral to physician) if: Foreign body/occluding cerumen, drainage or TM perforation TEOAEs: ILO-88 Otodynamics analyser Quickscreen (version 5) menu option 0.8, 1.6, 2.4, 3.2 and 4.0 kHz 2.5 – 12.5 secs after stimulus Clicks presented at 80 dB peSPL (± 2 dB) 400 Hz high pass filter used to improve SNR REPROW and SNR measured Fail criteria: REPROW ≤ 50% at 0.8 and 1.6 kHz or ≤ 75% at 2.4, 3.2 and 4.0 kHz Tympanometry: Welch-Allyn middle ear analyser 226 Hz probe tone Measures: Equivalent ear canal volume Static compensated acoustic admittance Tympanometric width Tympanometric peak pressure Fail criteria: 0-24 mo: SA < 0.2 mmho > 24 mo: SA < 0.3 mmho Conservative tympanometry criteria were used to avoid over-referral Parents completed a four page questionnaire about the child’s and family members OM and hearing loss hx, risk factors, knowledge and beliefs, sociodemographic factors. Medical records obtained
Agreement between TEOAE and tympanometry results calculated using kappa. Ears occluded with cerumen were excluded from analyses because of potential interference with both tymp and TEOAE results. After exclusion, 587 children had results for both tymp and TEOAE. N=194 (33%) failed tymp in at least one ear (26% of ears) N=115 also failed TEOAE in the same ear ≥ 36 mo: 62% failed tymp and TEOAE in same ear Overall 18% ears failed TEOAE TEOAE and physician dx: 18% had an audiometric assessment 80% of physician dx were consistent with OM and/or TEOAE failure Agreement between screening results and physician dx was better for children seen within 28 days of the screening (83.1% for ≤ 14 days; 83.3% for 15-28 days; 68.0% for >28 days).
Authors conclusions: The prevalence of middle ear effusion was higher than that reported by others for this age group (35%). Variations in diagnostic criteria could explain these differences. A large proportion of children in this study reported previous history of OM (48%). Children who participated in this study may have been at a higher risk of TEOAE failure because of their higher rates of OME. There was moderate to perfect agreement between TEOAE and tympanometry (failure = TW> 300). 95% of ears with a normal tympanogram had normal TEOAEs. In contrast, 68% of children with an abnormal tympanogram failed the TEOAE testing. It would be prudent to refer children who fail TEOAE screening to their physician for treatment and to consider referral to an audiologist for testing. A normal tympanogram was highly predictive of a TEOAE pass. If the goal of a screening programme is to detect sensorineural and conductive hearing loss alone, TEOAE would be effective in accomplishing that goal. However, if the goal isto detect OME, then both tympanometry and TEOAE screening are recommended. Results of this study suggest that TEOAE is a useful complement to tympanometry screening, and that the combination is more effective than either screening alone, because both sensorineural and conductive hearing loss can be detected by a combination of screening measures. The advantage of TEOAE is that children younger than 3 years of age can be screened effectively, whereas this is difficult to accomplish in this age group by non-audiologists.

THE EFFECT OF CLASSROOM SOUND FIELD AMPLIFICATION AND THE EFFECTIVENESS OF OTOACOUSTIC EMISSION HEARING SCREENING IN SCHOOL-AGE CHILDREN
43
Table 6. Evidence table of appraised articles relating to the effectiveness of otoacoustic emissions as a method of hearing testing in school-age children (continued)
Authors Country Study Design
Sample and Interventions Methods Results Limitations and Conclusions
Ho et al. (2002) Minnesota, U.S.A. Continued
TEOAE and Tympanometry: Kappa statistic ranged from 0.64 – 0.67 with the highest kappa observed for TW > 300 (0.67). TW > 300 used as criteria for tymp failure for the age-stratified analysis. ≥ 36 mths agreement between TEOAE and tympanometry: Se = 78.2% (70.5 – 85.9) FPR = 5.4 (3.5 – 7.3) PPV = 74.8 (66.9 – 82.7) NPV = 95.5 (93.7 – 97.2) Overall agreement: Se = 68.1% (62.1 – 74.1) FPR = 5.0 (3.5 – 6.5) PPV = 79.2 (73.7 – 84.8) NPV = 91.4 (89.6 – 93.3)
Reviewers Conclusions and Limitations: A portion of the sample were recruited from hearing screening clinics and there was a relatively high rate of hearing testing failure for all the tests, suggesting the sample may have been subject to selection bias. The authors acknowledged that conservative criteria were used in the tympanometry testing protocol and this may have influenced the test performance of TEOAE testing in comparison.

THE EFFECT OF CLASSROOM SOUND FIELD AMPLIFICATION AND THE EFFECTIVENESS OF OTOACOUSTIC EMISSION HEARING SCREENING IN SCHOOL-AGE CHILDREN
44
Table 6. Evidence table of appraised articles relating to the effectiveness of otoacoustic emissions as a method of hearing testing in school-age children (continued)
Authors Country Study Design
Sample and Interventions Methods Results Limitations and Conclusions
Krueger and Ferguson (2002) Texas, USA Cross sectional Grade III-2
N= 300 second and third grade students from four schools in two school districts inTexas. N= 163 girls N= 137 boys Ethnicity: 127 whites 102 Hispanics 62 Blacks 8 Asians 1 other N=599 ears (one child had unilateral congenital atresia)
Method: Otoscopy - audiologist 3 screening methods No information provided regarding the order of the 3 screening methods PTA: 35 dBHL 0.5, 1.0, 2.0, 4.0 kHz test frequencies Fail criteria: Failure to respond to 2 of the 4 frequencies in thesame ear Tympanometry: Grason Stadler Model GSI 38 Auto Tymp DPOAE: Grason Stadler Model GSI 60 DPOAE Graded as either present or absent Fail criteria: 3 or more responses below the normal window frame as set by the Vanderbilt 65/55 test standards
Screening results: N= 532 ears with normal results for all 3 tests (88.8%) N= 12 ears with abnormal results for all 3 tests (2%) PTA: Abnormal results in 20 ears = 3.3% DPOAE: Abnormal results in 38 ears = 6.3% Tympanometry: Abnormal results in 50 ears = 8.3% PTA and DPOAE: Se = 65% (44.1 – 86.0) FPR = 4.3% (2.7 – 6.0) PPV = 34.2% (19.1 – 49.2) NPV = 98.8 (97.8 – 99.7) Tympanometry and DPOAE: Se = 56% (42.2 – 69.8) FPR = 1.8% (0.7 – 2.9) PPV = 73.7 (59.7 – 87.7) NPV = 96.1 (94.5 – 97.7)
Authors’ Conclusions PTA alone is used in most school districts. Unfortunately this testing is often performed in areas with significant ambient noise and requires the attentiveness of the student. OAE testing can provide results quickly and does notrequire student alertness, although it can also be affected by ambient noise. Audiological assessment data were not available for all children who failed any or all of the tests therefore, the sensitivity and specificity could not be calculated. qAn OAE test is a good alternative for the child who has failed PTA or who is difficult to test with conventional methods. Reviewers Conclusions and Limitations A poorer level of hearing was accepted as a pass (35 dB HL) compared to other studies. No information was provided as to whether hearing thresholds were set when a child failed this criteria. The authors did not calculate sensitivity or specificity because they had no audiological results with which to compare test findings. The author of this review calculated sensitivity and specificity of DPOAE testing relative to pure-tone and tympanometry testing for the purposes of comparison with other studies. The authors concluded that DPOAE testing is a good hearing testing option for children who are difficult to test with conventional methods. Methodological flaws or lack of details in the study make it difficult to support or reject this conclusion.

THE EFFECT OF CLASSROOM SOUND FIELD AMPLIFICATION AND THE EFFECTIVENESS OF OTOACOUSTIC EMISSION HEARING SCREENING IN SCHOOL-AGE CHILDREN
45
Table 6. Evidence table of appraised articles relating to the effectiveness of otoacoustic emissions as a method of hearing testing in school-age children (continued)
Authors Country Study Design
Sample and Interventions Methods Results Limitations and Conclusions
Krueger and Ferguson (2002) Texas, USA Continued
There was also no information provided regarding the frequencies at which DPOAEs were measured or whether results were averaged across frequencies. All of these aspects may have affected DPOAE test performance and brings into question the validity of the findings of this study. No results were provided regarding the otoscopic examination.

THE EFFECT OF CLASSROOM SOUND FIELD AMPLIFICATION AND THE EFFECTIVENESS OF OTOACOUSTIC EMISSION HEARING SCREENING IN SCHOOL-AGE CHILDREN
46
Table 6. Evidence table of appraised articles relating to the effectiveness of otoacoustic emissions as a method of hearing testing in school-age children (continued)
Authors Country Study Design
Sample and Interventions Methods Results Limitations and Conclusions
Driscoll et al. (2001) Brisbane, Australia Cross sectional Grade III-2
N= 940 children recruited from among year 1 students at 22 primary schools in Brisbane. Participation on a voluntary basis with no selection criteria. Mean age = 6.2 years (SD = 0.4) Age range = 5.2 – 7.9 years Otoscopic exam prior to testing. PTA, tympanometry and TEOAE randomly administered in six possible permutations. All testing conducted by an audiologist. Subjects tested individually in non sound-treated rooms within each school. Ambient noise levels ranged from 34 to 51 dBA. PTA: Madsen Micromate 304 with ME70 noise-excluding headphone sets. Stimuli: 0.5, 1.0, 2.0, 4.0 kHz frequencies presented at 20 dBHL. Fail criteria: Failure to respond to 3 consecutive presentations at any frequency at 20 dBHL. Tympanometry: Madsen Zodiac 901 middle ear analyser Fail criteria: Any result that could be classified as a Type B or C2 tympanogram
TEOAE screening: ILO292 Otodynamics Analyser Quickscreen programme Probe fit inspected prior to testing Noise rejection levels set at 47.3 dB but manipulated on a case by case basis to allow time efficient maximum accumulation of data in the event of high ambient noise. Wide-band Gaussian-shaped clicks of 80microsecs duration, average stimulus level of 79.88dB pe SPL (SD= 2.04, target level 80 dB pe SPL) Mean rejection level for testing = 51.02 dB (SD = 0.14) Pass criteria: TEOAE spectrum recorded ≥ 3 dB above the noise floor and halfway across the frequency bands of 2-3 and 3-4 kHz in both ears. Measures: SNR at 2.4, 3.2, 4.0 kHz TEOAE performance at each frequency with varied SNR (≥ 1, 2, 3, 4, 7, 9, 15 dB) indicating a pass were compared to pure-tone screening results. PTA thresholds at 0.5, 1.0, 2.0, and 4.0 kHz were required to be no worse than 25 dB HL to be classified an overall pass. Otoscopy: Impacted wax evident in 35 ears (1.8%) Gross signs of middle ear pathology in 20 ears (1%)
Tympanometry: Full results for 1876 ears 17.9% of subjects (13.5% of ears) failed tymp. Type B = 132 ears (7.0%) Type C2 = 122 ears (6.5%) Type C1 = 248 ears (13.2%) Type A = 1374 ears (73.3%) PTA: Fails = 84 subjects (8.9%) Overall screening results: Fails = 175 subjects (18.6%) TEOAEs: Testing unsuccessful = 5 subjects Mean stimulus stability = 79.89% (range 54 – 89%, SD= 2.03). Average test time per ear = 1 min 48 secs Fails = 191 ears (20.3% subjects) TEOAE vs PTA: SNR Se FPR PPV NPV 1 65 7 37 98 2 66 9 32 98 3 68 10 30 98 4 70 12 27 98 7 79 20 20 98 9 82 30 15 99 15 92 64 8 99
Authors’ conclusions: Comparison of overall TEOAE pass/fail with overall PTA pass/fail revealed that the use of a 3 dB SNR criterion produced a relatively low FPR(10%) with a high specificity (90%), high accuracy , high efficiency and a strong NPV (98%). A moderate sensitivity (68%), FN rate (32%) and PPV (30%) were obtained. Suggests TEOAE is not highly sensitive to the middle ear dysfunction commonly found in 6-year-old children. Perhaps tympanometry should be used to supplement TEOAE results for this population, if identifying middle ear disorder is a concurrent goal of a screening programme. The low PPV are possibly reflective of the low prevalence of hearing impairment in the test group. TEOAE testing may be particularly useful as a screening tool in schools catering for children with intellectual impairment, physical impairment, and behavioural problems. Results revealed a moderate HR of 65 – 79% for SNR values of ≥ 1-7 dB. Selection of a criterion at ≥ 1 dB produced optimal test performance for the range of SNR values examined. Modified RIHAP criterion may not produce the se or sp values of a magnitude which would allow direct application to older children. Findings of the present study lend support to the replacement of PTA with TEOAE testing for the 6-year-old age group, they do not promote the replacement of the PTA plus tympanometrybattery.

THE EFFECT OF CLASSROOM SOUND FIELD AMPLIFICATION AND THE EFFECTIVENESS OF OTOACOUSTIC EMISSION HEARING SCREENING IN SCHOOL-AGE CHILDREN
47
Table 6. Evidence table of appraised articles relating to the effectiveness of otoacoustic emissions as a method of hearing testing in school-age children (continued)
Authors Country Study Design
Sample and Interventions Methods Results Limitations and Conclusions
Driscoll et al. (2001) Brisbane, Australia Continued
Overall screening: Failure of either PTA or tympanometry indicated a failure of overall screening
TEOAE vs PTA (2-4 kHz) SNR Se FPR PPV NPV 0 79 6 29 99 1 81 8 24 99 2 82 10 20 99 3 82 11 19 99 4 86 13 17 99 6 89 18 13 99 7 91 21 12 99 9 91 31 9 99 TEOAE vs overall screening result: SNR Se FPR PPV NPV 3 51 7 63 89 4 54 9 58 89 6 60 14 50 91 7 64 17 46 91 9 73 26 39 93
Reviewers Conclusions and Limitations The sample age group and selection were adequate and representative. The school setting while not providing optimal test conditions is reflective of the normal testing situations in schools (non-sound treated rooms). While the order of testing was randomised, one audiologist performed all the tests suggesting that this person was not blind to the results of other tests. Testing methodologies including pass/fail criteria were described in detail.

THE EFFECT OF CLASSROOM SOUND FIELD AMPLIFICATION AND THE EFFECTIVENESS OF OTOACOUSTIC EMISSION HEARING SCREENING IN SCHOOL-AGE CHILDREN
48
Table 6. Evidence table of appraised articles relating to the effectiveness of otoacoustic emissions as a method of hearing testing in school-age children (continued)
Authors Country Study Design
Sample and Interventions Methods Results Limitations and Conclusions
Sabo et al. (2000) Arizona, USA Cross sectional Grade III-2
N= 583 children in grades kindergarten, 1, 2 and 3. Four schools selected representing suburban, urban, rural and a district serving primarily a Native American population. Number of children participating from each school ranged from 141 – 151. No information provided about the proportion participating from each school. Age range = 5 – 9 years N= 320 boys N= 263 girls Retest: N= 177 99 boys 78 girls PTA Pure-tone audiometers normally used by the school Pass criteria: responding correctly to all four tones in both ears TEOAE Otodynamics Echoport ILO OAE V5 systems Pass criteria: Response at 3 frequencies of ≥ 3 dB above noise floor with a minimum of 70% reproducibility and ≥ 90% stability. Based on clinical experience screening newborns and young children.
Four frequency PTA and TEOAE screening conducted on same day – test order randomised Administered by school nurse, speech pathologist or volunteers with previous experience In pure-tone screening. Each school used its established protocol. Ambient noise levels not measured. Training on TEOAE testing provided by an audiologist. Varying testing situations – e.g. in classroom during quiet time. Audiologist present but did not administer testing. All students who failed were retested by an audiologist using TEOAEs, PTA and tympanometry. No information was provided regarding the pass/fail criteria but the standard hearing testing criteria in Arizona state was included and it is assumed that these are the criteria that were used in this study: PTA 0.5 – 4.0 kHz Pass/fail criteria = 25 dB for 0.5 kHz and 20 dB for 1, 2, 4 kHz
Audiogram performed by an audiologist used as the gold standard. 573 students tested with both PTA and TEOAE. 145 (25%) failed PTA 73 (13%) failed TEOAE Of these 37 (6%) failed both. TEOAE: Se = 63.2% (47.8 – 78.6) FPR = 9.0% (6.6 – 11.4) PPV = 33.3% (22.4 – 44.2) NPV = 97.2% (95.8 – 98.7) 14 FNs PTA: Se = 86.8% (76.1 – 97.6) FPR = 19.8% (16.4 – 23.2) PPV = 23.7% (16.7 – 30.8) NPV = 98.9% (97.8 – 99.9) 5 FNs TEOAE vs. PTA: Se = 25.5% (18.4 – 32.6) FPR = 8.3% (5.7 – 10.9) PPV = 50.7% (39.2 – 62.2) NPV = 78.7% (75.1 -82.2)
Authors conclusions: Based on our findings, pure tone testing appears to be the superior hearing screening method in this broad cross section of children. Although specificity is lower when compared with TEOAE, PT testing is more sensitive in detecting children with hearing loss. Technical problems (stimulus level) and the testing environment may have reduced sensitivity. The results of this study suggest that PT testing should remain the ‘gold standard’ for screening hearing in school age children. The use of TEOAEs offers an alternative for testing those children who cannot perform the PT test. Reviewers’ Conclusions and Limitations The sensitivity and specificity of PTA and TEOAE was provided for each school. There was a wide variability in both test characteristics between schools suggesting there may have been differences in the quality of test administration and levels of ambient noise. TEOAE testing performed as well as or better than PTA in two schools and worse in terms of sensitivity in two schools. There may have been differences in test administration, protocols and test conditions between schools. While this reflects the testing situations of school-based screening programmes, it makes interpretation of the sensitivity and specificity findings for this study difficult. It is useful to assess the performance of the screening tests in naturalisticschool settings but it would be useful to have information about each of those testing situations including ambient noise levels, location of testing and the test administrators. The prevalence of hearing loss and failure rates for each of the tests in each school was not reported. These may also have affected screening performance.

THE EFFECT OF CLASSROOM SOUND FIELD AMPLIFICATION AND THE EFFECTIVENESS OF OTOACOUSTIC EMISSION HEARING SCREENING IN SCHOOL-AGE CHILDREN
49
Table 6. Evidence table of appraised articles relating to the effectiveness of otoacoustic emissions as a method of hearing testing in school-age children (continued)
Authors Country Study Design
Sample and Interventions Methods Results Limitations and Conclusions
Taylor and Brooks (2000) Alabama, USA Cross sectional Grade III-2
N=152 children selected from a sample referred by local speech and hearing centres Gender: 94 boys 58 girls Age: Mean = 5 years 5 mths Range: 3 years to 8 years N= 297 ears from possible 304 1 = unilateral atresia 6 = refused TEOAEs testing in one ear Source of sample: Local speech and hearing centres An ENT doctor Regional centre for early intervention services Children’s Rehabilitation Services Selected day-care centres Included 8 children with known sensorineural, conductive or mixed hearing losses Selection criteria required that children be cooperative throughout testing. Child considered uncooperative if they exhibited crying behaviour that prohibited accurate results. 6 ears (1.9%) could not be evaluated because of lack of patient cooperation.
PTA: Grason-Stadler model GSI-10 audiometer with TDH supraaural earphones Testing conducted in a sound-treated room Stimuli presented at 20 dBHL for frequencies of 1.0, 2.0, and 4.0 kHz in the right ear and then the left ear. Data analysed for individual ears and not individual children Fail criteria: Failure to respond to 20dB in one or more test frequencies in that ear – categorised as a refer. When the child failed to respond to a tone, a threshold was established (ensured that the child failed to hear the tone instead of simply refusing or being incapable of participation). Tympanometry: Grason-Stadler model GSI-33 226 Hz probe tone Pump speed 600/200 daPa/s Range of ear canal pressure +400 to -600 daPa Fail criteria (ASHA guidelines): Static admittance (Ytm) less than 0.3 mmho or Equivalent ear canal volume (Vec) > 1.0 cm3 when accompanied by a flat tympanogram or Tympanometric width (TW) > 200 daPa TEOAEs: Otodynamic Analyser Model ILO88 Preset mode with a low-cut filter Stimulus band width 0.5 – 5.0 kHz Stimulus intensity 75-85 dB pe SPL with 50 clicks/s Nonlinear click mode – responses to sets of four clicks sub averaged Noise rejection level of 47 dB SPL
Sensitivity and specificity analyses included 297 ears. TEOAEs vs PTA: PTA gold standard Se = 81.3% (67.7 – 94.8) FPR = 5.3% (2.6 – 8.0) PPV = 65.0% (50.2 – 79.8) NPV = 97.7% (95.8 – 99.5) Chi-square analysis showed significant relationship between results of PTA and TEOAE (1df, 141.4, p<.05) with a high correlation (r=0.70) TEOAE vs Tympanometry: Tympanometry gold standard for middle ear disorders Se = 60% (40.1 – 79.2) FPR = 9.1% (5.6 – 12.5) PPV = 38.5% (23.2 – 53.7) NPV = 96.0% (93.6 – 98.4) Chi-square analysis showed a significant relationship between results of tympanometry and TEOAE (1 df, 50.7, p< .05), with a moderate correlation ( r= 0.42).
Authors’ conclusions Inclusion of children with known hearing losses allowed calculation of sensitivity with a relatively small sample size. Use of only cooperative children and children with known hearing losses limits the ability to make some generalisations about the data. TEOAE test performance was judged good enough to consider substituting PTA. All 6 false negative ears only failed at 1.0 kHz and with an average threshold of 30dB. They were considered to have borderline normal-to-mild hearing loss in the low frequencies. TEOAE pass/fail criteria may not have been sensitive enough for low-frequency hearing losses. There is disagreement about the degree of hearing loss at which TEOAEs are not measurable (20-30 dBHL normally accepted). In this study TEOAEs were compared to PTA at 20 dB HL. TEOAEs may not be sensitive enough until thresholds meet or exceed 30 dB HL. When ease and efficiency of testing are considered, TEOAEs have advantages over PTA in some populations. TEOAEs test performance compared to tymp yielded a lower sensitivity of 60% and specificity of 91%. Tymp is not the gold standard for dx of middle ear disorders buthad to be used as such in this study. The Se, SP and phi-coefficient suggested a positive relationship between TEOAE and tymp. It is recommended that TEOAE screening should not replace tymp at this time. Protocols combining TEOAE and tympanometry need to be compared to Pure-tone + tympanometry protocols.

THE EFFECT OF CLASSROOM SOUND FIELD AMPLIFICATION AND THE EFFECTIVENESS OF OTOACOUSTIC EMISSION HEARING SCREENING IN SCHOOL-AGE CHILDREN
50
Table 6. Evidence table of appraised articles relating to the effectiveness of otoacoustic emissions as a method of hearing testing in school-age children (continued)
Authors Country Study Design
Sample and Interventions Methods Results Limitations and Conclusions
Taylor and Brooks (2000) Alabama, USA Continued
Screening personnel: 2 audiologists (ASHA certified) A single audiologist did not perform all 4 procedures for each child. Test orders randomised to avoid order effects.
400 Hz high-pass filter used to improve SNR in the low-frequency click response. Probe fit checked with dummy stimuli prior to testing. No participants eliminated because of poor probe fit. Fail criteria: OAE response < 3 dB above noise level. Presence of OAE for at least 3 of the frequency bands required. REPROW ≥ 40%
Reviewer’s Conclusions and Limitations TEOAE testing performed better compared to PTA than to tympanometry. The failure rates for each of the tests were not reported but the sample was recruited from speech and hearingcentres and rehabilitation services, suggesting it may have been subject to selection and spectrum bias. The test performance of TEOAEsmay have been influenced as a result. The sample source also means this study lacks generalisability to school screening populations

THE EFFECT OF CLASSROOM SOUND FIELD AMPLIFICATION AND THE EFFECTIVENESS OF OTOACOUSTIC EMISSION HEARING SCREENING IN
SCHOOL-AGE CHILDREN
51

THE EFFECT OF CLASSROOM SOUND FIELD AMPLIFICATION AND THE EFFECTIVENESS OF OTOACOUSTIC EMISSION HEARING SCREENING IN
SCHOOL-AGE CHILDREN
52
REFERENCES
Abdala, C., & Visser-Dumont, L. (2001). Distortion Product Otoacoustic Emissions: A Tool for Hearing Assessment and Scientific Study. Volta Review, 103, 281-302.
Arnold, P., & Canning, D. (1999). Does classroom amplification aid comprehension? British Journal of Audiology, 33, 171-178.
Bu, X., Li, X., & Driscoll, C. (2005). The Chinese Hearing Questionnaire for School Children. Journal of the American Academy of Audiology, 16, 687-697.
Davilis, D., Korres, S. G., Balatsouras, D. G., Gkoritsa, E., Stivaktakis, G., & Ferekidis, E. (2005). The efficacy of transiently evoked otoacoustic emissions in the detection of middle-ear pathology. Medical Science Monitor, 11, MT75-78.
Driscoll, C., Kei, J., Bates, D., & McPherson, B. (2002). Transient evoked otoacoustic emissions in children studying in special schools. International Journal of Pediatric Otorhinolaryngology, 64, 51-60.
Driscoll, C., Kei, J., & McPherson, B. (2001). Outcomes of transient evoked otoacoustic emission testing in 6-year-old school children: a comparison with pure tone screening and tympanometry. International Journal of Pediatric Otorhinolaryngology, 57, 67-76.
Heeney, M. (2006). Classroom sound field amplification, listening and learning, Ph.D Thesis, University of Newcastle, NSW.
Ho, V., Daly, K. A., Hunter, L. L., & Davey, C. (2002). Otoacoustic emissions and tympanometry screening among 0-5 year olds. Laryngoscope, 112, 513-519.
Kemp, D. T. (2003). 25 years of progress with OAEs - the inside story. Prepared to accompany the Audiology Featured Session on this topic at the American Speech Language Hearing Association's Convention, Chicago, 15 November 2003. American Speech Language Hearing Association (ASHA). Available from: http://www.asha.org/NR/rdonlyres/19CEF4A4-10E5-4D31-A761-87D39FA1FF81/0/25yearsOAEHandout.doc Accessed on 15.3.07
Krueger, W. W., & Ferguson, L. (2002). A comparison of screening methods in school-aged children. Otolaryngology - Head & Neck Surgery, 127, 516-519.
Lous, J., Burton, M. J., Felding, J.U., Oveson, T., Rovers, M.M., Williamson, I. (2005). Grommets (ventilation tubes) for hearing loss associated with otitis media with effusion in children. Cochrane Database of Systematic Reviews, Issue 1.
Lyons, A., Kei, J., & Driscoll, C. (2004). Distortion product otoacoustic emissions in children at school entry: a comparison with pure-tone screening and tympanometry results. Journal of the American Academy of Audiology, 15, 702-715.
Massie, R., Theodoros, D., Byrne, D., McPherson, B., & Smaldino, J. (1999). The effects of sound field classroom amplification on the communicative interactions of Aboriginal and Torres Strait Islander children. Australian Journal of Audiology, 21, 93-109.
Massie, R., Theodoros, D., McPherson, B., & Smaldino, J. (2004). Sound-field amplification: Enhancing the classroom listening environment for Aboriginal and Torres Strait Islander children. Australian Journal of Indigenous Education, 33, 47-53.
McPherson, B., Kei, J., Smyth, V., & Latham, S. (1998). Feasibility of community-based hearing screening using transient evoked otoacoustic emissions. Public Health, 112, 147-152.
McSporran, E., Butterworth, Y., & Rowson, V. J. (1997). Sound field amplification and listening behaviour in the classroom. British Educational Research Journal, 23, 81-96.
Medicare Services Advisory Committee (MSAC) (1999). Oto-acoustic emission audiometry: final assessment report. Canberra: MSAC.
National Health and Medical Research Council (2005). NHMRC additional levels of evidence and grades for recommendations for developers of guidelines. Pilot program 2005-2007 NHMRC. Available from: http://www.nhmrc.gov.au/publications/_files/levels_grades05.pdf Accessed on 20.11.06

THE EFFECT OF CLASSROOM SOUND FIELD AMPLIFICATION AND THE EFFECTIVENESS OF OTOACOUSTIC EMISSION HEARING SCREENING IN
SCHOOL-AGE CHILDREN
53
Nozza, R. J., Sabo, D. L., & Mandel, E. M. (1997). A role for otoacoustic emissions in screening for hearing impairment and middle ear disorders in school-age children. Ear & Hearing, 18, 227-239.
Cook, L. (1998). Screening programmes for the detection of otitis media with effusion and conductive hearing loss in pre-school and new entrant school children: a critical appraisal of the literature. NZHTA Report No. 3. Christchurch: New Zealand Health Technology Assessment.
Oticon Foundation in New Zealand (2002). Classroom acoustics: A New Zealand perspective. Wellington, New Zealand: The Oticon Foundation in New Zealand
Rosenberg, G. G. (1995). Sound field amplification: a comprehensive literature review. In C. C. Crandell, J. J. Smaldino & C. Flexer (Eds.), Sound-field FM amplification: applications to speech perception and classroom acoustics (pp. 72-111). Clifton Park, NY: Thomson Delmar Learning.
Rosenberg, G. G., Blake Rahter, P., Heavner, J., Allen, L., Redmond, B. M., Phillips, J., & Stigers, K. (1999). Improving classroom acoustics (ICA): a three-year FM sound field classroom amplification study. Journal of Educational Audiology, 7, 8-28.
Sabo, M. P., Winston, R., & Macias, J. D. (2000). Comparison of pure tone and transient otoacoustic emissions screening in a grade school population. American Journal of Otology, 21, 88-91.
Taylor, C. L., & Brooks, R. P. (2000). Screening for hearing loss and middle-ear disorders in children using TEOAEs. American Journal of Audiology, 9, 50-55.
Thabrew, H. (2003). Hearing and vision screening in New Zealand 2003. Wellington: Ministry of Health.
Valente, M. (1998). Effects of sound field amplification upon academic performance in college students. Journal of Educational Audiology, 6, 14-20.

THE EFFECT OF CLASSROOM SOUND FIELD AMPLIFICATION AND THE EFFECTIVENESS OF OTOACOUSTIC EMISSION HEARING SCREENING IN
SCHOOL-AGE CHILDREN
54
APPENDIX 1: LEVELS OF EVIDENCE∗
Level I Evidence obtained from a systematic review (or meta-analysis) of relevant randomised controlled trials.
Level II Evidence obtained from at least one randomised controlled trial.
Level III. 1. Evidence obtained from pseudorandomised controlled trials (alternate allocation or some other method).
2. Evidence obtained from comparative studies (including a systematic reviews of such studies) with concurrent controls and allocation not randomised, cohort studies, case control studies or interrupted time series with a control group).
3 Evidence obtained from comparative studies with historical control, two or more single-arm studies or interrupted time series without a parallel control group.
Level IV Evidence obtained from case series, either post-test or pre-test/post-test.
∗ From NHMRC (2005)

THE EFFECT OF CLASSROOM SOUND FIELD AMPLIFICATION AND THE EFFECTIVENESS OF OTOACOUSTIC EMISSION HEARING SCREENING IN
SCHOOL-AGE CHILDREN
55
APPENDIX 2: SEARCH STRATEGY
Sound field amplification The following search was used in all databases 1 sound field amplification.mp. 2 classroom amplification.mp. 3 (classroom and sound and amplif$).mp. 4 (sound and field and amplif$).mp. 5 or/1-4
Otoacoustic emission testing Medline 1 otoacoustic emissions, spontaneous/ (1864) 2 (otoacoustic or oto-acoustic or otaaco$).tw. (2584) 3 1 or 2 (2864) 4 screen$.tw. (251338) 5 mass screening/ (54618) 6 4 or 5 (269605) 7 3 and 6 (598) 8 child/ (1020515) 9 child, preschool/ (596889) 10 school$.mp. (134056) 11 child$.tw. (621786) 12 or/8-11 (1388318) 13 7 and 12 (256) 14 (newborn$ or new-born$ or neonat$ or infan$).ti. (199802) 15 13 not 14 (144) 16 limit 15 to english (92)
Embase 1 exp otoacoustic emission/ (2314) 2 (otoacoustic or oto-acoustic or otoaco$).tw. (2425) 3 1 or 2 (2786) 4 auditory screening/ (374) 5 screening/ (26711) 6 screening test/ (22306) 7 or/4-6 (49175) 8 3 and 7 (289) 9 (infan$ or neonat$ or newborn$ or new-born$).ti. (91316) 10 8 not 9 (141) 11 limit 10 to english (113)
Cinahl 1 Otoacoustic Emissions, Spontaneous/ (252) 2 (otoacoustic or oto-acoustic or otoaco$).tw. (403) 3 1 or 2 (497) 4 Hearing Screening/ (715) 5 screen$.tw. (21264) 6 4 or 5 (21535) 7 3 and 6 (195) 8 (neonat$ or newborn$ or new born$ or infan$).ti. (18038) 9 7 not 8 (72) 10 limit 9 to english (72)

THE EFFECT OF CLASSROOM SOUND FIELD AMPLIFICATION AND THE EFFECTIVENESS OF OTOACOUSTIC EMISSION HEARING SCREENING IN
SCHOOL-AGE CHILDREN
56
PsychInfo 1 (otoacoustic or oto-acoustic or otoaco$).mp. (222) 2 screen$.mp. (30724) 3 1 and 2 (38) 4 (neonat$ or newborn$ or infan$ or new-born$).ti. (21914) 5 3 not 4 (19) 6 limit 5 to all journals (18)
Current Contents TS=(Otoacoustic OR oto-acoustic OR otoaco*) TS=Screen* #1 AND #2 TI=(Infan* OR bnew born OR newborn OR neonat*) #3 NOT #4 The search terms used above were adapted for used in all other databases and sources without indexing

THE EFFECT OF CLASSROOM SOUND FIELD AMPLIFICATION AND THE EFFECTIVENESS OF OTOACOUSTIC EMISSION HEARING SCREENING IN
SCHOOL-AGE CHILDREN
57
APPENDIX 3: EXCLUDED RETRIEVED PAPERS
Abdala, C., & Visser-Dumont, L. (2001). Distortion product otoacoustic emissions: a tool for hearing assessment and scientific study. Volta Review, 103, 281-302.
Allcock, J. (1999). Report of FM soundfield study: Paremata School 1997. Study funded by Oticon Foundation. Oticon Foundation. Available from: http://www.oticon.org.nz/pdf/OTICONparamataresearchreport.pdf Accessed on 19.12.06
Allen, L. (1993). Promoting the usefulness of classroom amplification equipment. Educational Audiology Monograph, 3, 32-34.
Attias, J. (2000). Evaluating children's hearing by DPOAEs at 1-10 kHz. Journal of Basic & Clinical Physiology & Pharmacology, 11, 201-214.
Baldwin, D., & Dougherty, C. (1997). A Montana experience with classroom amplification. Journal of Educational Audiology, 5, 44-46.
Bantock, H. M., & Croxson, S. (1998). Universal hearing screening using transient otoacoustic emissions in a community health clinic. Archives of Disease in Childhood, 78, 249-252.
Beauchaine, K. L. (1996). Book review. Sound-field FM amplification: theory and practical applications - edited by Charles C Crandell, Joseph J Smaldino and Carol Flexer. Volta Review, 98, 64-65.
Bennetts, L. K., & Flynn, M. C. (2002). Improving the classroom listening skills of children with Down syndrome by using sound-field amplification. Down Syndrome: Research & Practice, 8, 19-24.
Berg, A. L., Papri, H., Ferdous, S., Khan, N. Z., & Durkin, M. S. (2006). Screening methods for childhood hearing impairment in rural Bangladesh. International Journal of Pediatric Otorhinolaryngology, 70, 107-114.
Cornwell, S., & Evans, C. J. (2001). The effects of sound-field amplification on attending behaviours. Journal of Speech Language Pathology and Audiology, 25, 135-144.
Crandell, C. C. (1993). Speech recognition in noise by children with minimal degrees of sensorineural hearing loss. Ear & Hearing, 14, 210-216.
Crandell, C. C., & Smaldino, J. J. (2000). Clinical forum. Classroom acoustics for children with normal hearing and with hearing impairment. Language, Speech, and Hearing Services in Schools, 31, 362-370.
Cullington, H. E., Kuman, B. U., & Flood, L. M. (1998). Feasibility of otoacoustic emissions as a hearing screen following grommet insertion. British Journal of Audiology, 32, 57-62.
Darai, B. (2000). Using sound field FM systems to improve literacy scores. Advance for Speech-Language Pathologists and Audiologists, 10, 5,13.
DiSarno, N. J., Schowalter, M., & Grassa, P. (2002). Classroom amplification to enhance student performance. Teaching Exceptional Children, 34, 20-25.
Driscoll, C., Kei, J., Bates, D., & McPherson, B. (2002a). Transient evoked otoacoustic emissions in children studying in special schools. International Journal of Pediatric Otorhinolaryngology, 64, 51-60.
Driscoll, C., Kei, J., Bates, D., & McPherson, B. (2003a). Tympanometry and TEOAE testing of children with down syndrome in special schools. Australian & New Zealand Journal of Audiology, 25, 85-93.
Driscoll, C., Kei, J., & McPherson, B. (2000a). Cost comparison of hearing screening programs: transient evoked otoacoscreening at school entry. Australian and New Zealand Journal of Audiology, 22, 77-84.
Driscoll, C., Kei, J., & McPherson, B. (2000b). Transient evoked otoacoustic emissions in 6-year-old school children: a normative study. Scandinavian Audiology, 29, 103-110.

THE EFFECT OF CLASSROOM SOUND FIELD AMPLIFICATION AND THE EFFECTIVENESS OF OTOACOUSTIC EMISSION HEARING SCREENING IN
SCHOOL-AGE CHILDREN
58
Driscoll, C., Kei, J., & McPherson, B. (2002b). Handedness effects on transient evoked otoacoustic emissions in schoolchildren. Journal of the American Academy of Audiology, 13, 403-406.
Driscoll, C., Kei, J., & McPherson, B. (2003b). Hearing screening for children in community settings using transient evoked otoacoustic emissions. Asia Pacific Journal of Speech, Language and Hearing, 8, 179-184.
Ellison, J. C., & Keefe, D. H. (2005). Audiometric predictions using stimulus-frequency otoacoustic emissions and middle ear measurements. Ear and Hearing, 26, 487-503.
Engdahl, B., Tambs, K., Borchgrevink, H. M., & Hoffman, H. J. (2005). Otoacoustic emissions in the general adult population of Nord-Trondelag, Norway: III. Relationships with pure-tone hearing thresholds. International Journal of Audiology, 44, 15-23.
English, K., Kasper, S., & Grunberg, Z. (2003). Sound field amplification and the teaching voice. Available from: http://www.speechpathology.com/articles/article_detail.asp?article_id=1 Accessed 19.12.06
Eriks-Brophy, A., & Ayukawa, H. (2000). The benefits of sound field amplification in classrooms of Inuit students of Nunavik: A pilot project. Language Speech and Hearing Services in Schools, 31, 324-335.
Fickes, M. (1998). Listen Up! School Planning and Management, 37, 40-42.
Fickes, M. (2003). The sounds of a sound education. School Planning & Management 42, 51-55.
Flexer, C., Biley, K. K., Hinkley, A., Harkema, C., & Holcolmb, J. (2002). Using sound-field systems to teach phonemic awareness to pres-schoolers. Hearing Journal, 55, 38-44.
Flexer, C., & Long, S. (2003). Sound-field amplification: preliminary information regarding special education referrals. Communication Disorders Quarterly, 25, 29-34.
Foerst, A., Beutner, D., Lang-Roth, R., Huttenbrink, K. B., von Wedel, H., & Walger, M. (2006). Prevalence of auditory neuropathy/synaptopathy in a population of children with profound hearing loss. International Journal of Pediatric Otorhinolaryngology, 70, 1415-1422.
Fritsch, M. H., Wynne, M. K., & Diefendorf, A. O. (2002). Transient-evoked otoacoustic emissions from ears with tympanostomy tubes. International Journal of Pediatric Otorhinolaryngology, 66, 29-36.
Gorga, M. P., Dierking, D. M., Johnson, T. A., Beauchaine, K. L., Garner, C. A., & Neely, S. T. (2005). A validation and potential clinical application of multivariate analyses of distortion-product otoacoustic emission data. Ear and Hearing, 26, 593-607.
Gorga, M. P., Neely, S. T., & Dorn, P. A. (1999). Distortion product otoacoustic emission test performance for a priori criteria and for multifrequency audiometric standards. Ear and Hearing, 20, 345-362.
Hof, J. R., Dijk, P., Chenault, M. N., & Anteunis, L. J. (2005). A two-step scenario for hearing assessment with otoacoustic emissions at compensated middle ear pressure (in children 1-7 years old). International Journal of Pediatric Otorhinolaryngology, 69, 649-655.
Janusauskas, A., Marozas, V., Engdahl, B., Hoffman, H. J., Svensson, O., & Sornmo, L. (2001). Otoacoustic emissions and improved pass/fail separation using wavelet analysis and time windowing. Medical & Biological Engineering & Computing, 39, 134-139.
Jonsdottir, V., Laukkanen, A. M., & Siikki, I. (2003). Changes in teachers' voice quality during a working day with and without electric sound amplification. Folia Phoniatrica et Logopedica, 55, 267-280.
Jonsdottir, V., Laukkanen, A. M., & Vilkman, E. (2002). Changes in teachers' speech during a working day with and without electric sound amplification. Folia Phoniatrica et Logopedica, 54, 282-287.
Jonsdottir, V. I. (2002). Cordless amplifying system in classrooms. A descriptive study of teachers' and students' opinions. Logopedics, Phoniatrics, Vocology, 27, 29-36.
Karatas, E., Kanlikama, M., & Mumbuc, S. (2006). Auditory functions in children at schools for the deaf. Journal of the National Medical Association, 98, 204-210.

THE EFFECT OF CLASSROOM SOUND FIELD AMPLIFICATION AND THE EFFECTIVENESS OF OTOACOUSTIC EMISSION HEARING SCREENING IN
SCHOOL-AGE CHILDREN
59
Keogh, T., Kei, J., Driscoll, C., & Smyth, V. (2001). Distortion-product otoacoustic emissions in schoolchildren: effects of ear asymmetry, handedness, and gender. Journal of the American Academy of Audiology, 12, 506-513.
Lin, H. C., Shu, M. T., Lee, K. S., Ho, G. M., Fu, T. Y., Bruna, S., & Lin, G. (2005). Comparison of hearing screening programs between one step with transient evoked otoacoustic emissions (TEOAE) and two steps with TEOAE and automated auditory brainstem response. Laryngoscope, 115, 1957-1962.
Llanes, E., & Chiong, C. M. (2004). Evoked otoacoustic emissions and auditory brainstem responses: Concordance in hearing screening among high-risk children. Acta Oto-Laryngologica, 124, 387-390.
Long, S., & Flexer, C. (2001). Sound field amplification for all. Advance for Speech-Language Pathologists and Audiologists, 11, 10-11.
Marttila, J. (2004). Listening technologies for individuals and the classroom. Topics in Language Disorders, 24, 31-50.
McPherson, B., Kei, J., Smyth, V., & Latham, S. (1998). Feasibility of community-based hearing screening using transient evoked otoacoustic emissions. Public Health, 112, 147-152.
Medicare Services Advisory Committee (MSAC) (1999). Oto-acoustic emission audiometry: final assessment report. Canberra: MSAC.
Mendel, L. L., Roberts, R. A., & Walton, J. H. (2003). Speech perception benefits from sound field FM amplification. American Journal of Audiology, 12, 114-124.
Nelson, D. G., & Nelson, D. K. (1997). Teacher and student satisfaction with freefield FM amplification systems. Volta Review, 99, 163-170.
Nelson, D. G., & Schmidt, M. (1993). Take anything else, but leave my classroom FM system! Perspectives in Education and Deafness, 12, 8-11.
O'Rourke, C., Driscoll, C., Kei, J., & Smyth, V. (2002). A normative study of distortion-product otoacoustic emissions in 6-year-old schoolchildren. International Journal of Audiology, 41, 162-169.
Olusanya, B. (2001). Early detection of hearing impairment in a developing country: what options? Audiology, 40, 141-147.
Palmer, C. V. (1998). Quantification of the ecobehavioral impact of a soundfield loudspeaker system in elementary classrooms. Journal of Speech, Language, and Hearing Research, 41, 819-833.
Rea, P. A., & Gibson, W. P. (2003). Evidence for surviving outer hair cell function in congenitally deaf ears. Laryngoscope, 113, 2030-2034.
Richardson, M. P., Williamson, T. J., Reid, A., Tarlow, M. J., & Rudd, P. T. (1998). Otoacoustic emissions as a screening test for hearing impairment in children recovering from acute bacterial meningitis. Pediatrics, 102, 1364-1368.
Robinette, M. S. (2003). Clinical observations with evoked otoacoustic emissions at Mayo Clinic. Journal of the American Academy of Audiology (American Academy of Audiology), 14, 213-224.
Rosenberg, G. G. (1995). Sound field amplification: a comprehensive literature review. In C. C. Crandell, J. J. Smaldino & C. Flexer (Eds.), Sound-field FM amplification: applications to speech perception and classroom acoustics (pp. 72-111). Clifton Park, NY: Thomson Delmar Learning.
Sanford, C. A. (1997). Working from within the classroom: improving the delivery of speech-language services to kindergarten at-risk students. Ed.D. Practicum. Fort Lauderdale, FL: Nova Southeastern University.
Schmuziger, N., Lodwig, A., & Probst, R. (2006). Influence of artifacts and pass/refer criteria on otoacoustic emission hearing screening. International Journal of Audiology, 45, 67-73.
Smaldino, J. J., & Crandell, C. C. (2000). Classroom amplification technology: theory and practice. Language, Speech, and Hearing Services in Schools, 31, 371-375, 394-401.

THE EFFECT OF CLASSROOM SOUND FIELD AMPLIFICATION AND THE EFFECTIVENESS OF OTOACOUSTIC EMISSION HEARING SCREENING IN
SCHOOL-AGE CHILDREN
60
APPENDIX 4: APPRAISED RETRIEVED PAPERS
Arnold, P., & Canning, D. (1999). Does classroom amplification aid comprehension? British Journal of Audiology, 33, 171-178.
Bu, X., Li, X., & Driscoll, C. (2005). The Chinese Hearing Questionnaire for School Children. Journal of the American Academy of Audiology, 16, 687-697.
Davilis, D., Korres, S. G., Balatsouras, D. G., Gkoritsa, E., Stivaktakis, G., & Ferekidis, E. (2005). The efficacy of transiently evoked otoacoustic emissions in the detection of middle-ear pathology. Medical Science Monitor, 11, MT75-78.
Driscoll, C., Kei, J., & McPherson, B. (2001). Outcomes of transient evoked otoacoustic emission testing in 6-year-old school children: a comparison with pure tone screening and tympanometry. International Journal of Pediatric Otorhinolaryngology, 57, 67-76.
Heeney, M. (2006). Classroom sound field amplification, listening and learning, Ph.D Thesis, University of Newcastle, NSW.
Ho, V., Daly, K. A., Hunter, L. L., & Davey, C. (2002). Otoacoustic emissions and tympanometry screening among 0-5 year olds. Laryngoscope, 112, 513-519.
Krueger, W. W., & Ferguson, L. (2002). A comparison of screening methods in school-aged children. Otolaryngology - Head & Neck Surgery, 127, 516-519.
Lyons, A., Kei, J., & Driscoll, C. (2004). Distortion product otoacoustic emissions in children at school entry: a comparison with pure-tone screening and tympanometry results. Journal of the American Academy of Audiology, 15, 702-715.
Massie, R., Theodoros, D., Byrne, D., McPherson, B., & Smaldino, J. (1999). The effects of sound field classroom amplification on the communicative interactions of Aboriginal and Torres Strait Islander children. Australian Journal of Audiology, 21, 93-109.
Massie, R., Theodoros, D., McPherson, B., & Smaldino, J. (2004). Sound-field amplification: Enhancing the classroom listening environment for Aboriginal and Torres Strait Islander children. Australian Journal of Indigenous Education, 33, 47-53.
McSporran, E., Butterworth, Y., & Rowson, V. J. (1997). Sound field amplification and listening behaviour in the classroom. British Educational Research Journal, 23, 81-96.
Rosenberg, G. G., Blake Rahter, P., Heavner, J., Allen, L., Redmond, B. M., Phillips, J., & Stigers, K. (1999). Improving classroom acoustics (ICA): a three-year FM sound field classroom amplification study. Journal of Educational Audiology, 7, 8-28.
Sabo, M. P., Winston, R., & Macias, J. D. (2000). Comparison of pure tone and transient otoacoustic emissions screening in a grade school population. American Journal of Otology, 21, 88-91.
Taylor, C. L., & Brooks, R. P. (2000). Screening for hearing loss and middle-ear disorders in children using TEOAEs. American Journal of Audiology, 9, 50-55.
Valente, M. (1998). Effects of sound field amplification upon academic performance in college students. Journal of Educational Audiology, 6, 14-20.