Embed Size (px)
Citation preview
AN EMPIRE LOST: SPANISH INDUSTRY AND THE EFFECT OFCOLONIAL MARKETS AND TRADE ON INNOVATION
DARIO A. ROMERO†
Job Market PaperThis version: December 2021. Latest version here.
Abstract. This paper studies how changes in access to international markets affect thedirection of technical change. I use two historical trade shocks that transformed markets forthe Spanish textile industry at the end of the 19th century, along with newly digitized dataon textile patents and production in Spain. First, after Spain effectively forced its colonies tobuy manufactured cotton goods in 1891, I document an increase in cotton textile innovationrelative to other fabrics. Second, after the Spanish-American war and the unexpected loss ofthese captive markets, I find that innovation in cotton textiles changed towards new weavingpatents relative to other parts of the cotton textile production process such as threading.After 1898, cotton industrialists entered and competed in international markets where moresophisticated fabrics were in demand. Using novel archive data from a big cotton firm, Iprovide price and quantity-based evidence of the strength of each type of technical change.Finally, I show that these new incentives to innovation translated directly into adopting newmechanized tools in the sector. I find evidence of an expansion in industrial technology dueto an increase in mechanized cotton looms used in Spain after 1900. Together, these resultsprovide some of the first causal evidence on how international trade shapes the direction ofthe technical change. Although each shock meant access to new markets for Spanish cottontextiles, their effect on innovation varied because the composition of textile demand wasdifferent.JEL Codes: F15, F63, L16, N73, O24, O32Keywords: Directed Technical Change, Induce Innovation, Trade
†Department of Economics, Columbia University. 1022 International Affairs Building, 420 West 118thStreet, New York, NY 10027. E-mail: [email protected]. I owe an enormous debt of gratitude toSuresh Naidu, Reka Juhasz, Eric Verhoogen, Michel Best for numerous insightful discussions regard-ing this work. The paper also benefit from discussions with Silvio Ravaioli, David Rosenkranz, FelipeNetto, Haaris Mateen, Tatyana Avilova, Diego Martin, Teresa Esteban-Casanelles and seminar par-ticipants at Columbia Development Colloquium. I owe a special thanks to workers at the BibliotecaNacional de Espana, Biblioteca de Catalunya and Arxiu Nacional de Catalunya. All remaining errorsare my own.
THE EFFECT OF COLONIAL MARKETS AND TRADE ON INNOVATION 1
“Opening a new and inexhaustible market to all the commoditiesin Europe, it gave occasion to new division of labour and
improvements of art, which, in the narrow circle of the ancientcommerce, could never have taken place for want of a market to take
off the greater part of their product” - Adam Smith (1776), An Inquiryinto the Nature and Causes of the Wealth of Nations
1. Introduction
The effects of international trade on growth (Smith, 1776; Marshall, 1890), rela-tive prices, and the distribution of income have been long-standing concerns amongeconomists. An important channel through which international trade fuels economicgrowth is via innovation and technological change. However, there is little researchon how trade can also alter the direction of technical change by altering the demandpatterns that producers face. My paper fills this gap using historical patents and newlycollected price data together with large changes in international markets affecting the19th century Spanish textile production.
International trade might not only affect the rate of technological change (see Rivera-Batiz and Romer, 1991; Grossman and Helpman, 1991) but also the type of technologythat innovators choose to develop (see Acemoglu, 2002; Gancia and Zilibotti, 2009;Gancia and Bonfiglioli, 2008). In this paper, I document how access to different typesof markets shapes the direction of technological progress. Previous empirical workby Hanlon (e.g. 2015) showed that shocks to inputs prices can affect the directionof technical change. Here I provide evidence that the composition of the demand inoutput can have similar effects. New markets affect the inventors’ incentives. Outof several possibilities these agents choose the most profitable sectors to introducenew machines, and, with sector differential access to new markets, those decisionsmight change. To provide this evidence, I exploit two unique historical experimentsthat vastly transformed international trade patterns in the Spanish textile industryat the end of the 19th century during the Spanish colonial period. First, I study theextensive market integration between Spain and its colonies, and second, I analyze theAmerican-Spanish war shock. While the former policy effectively forced the coloniesto buy cotton textiles mainly from Spain, the latter incident ended with these captive
THE EFFECT OF COLONIAL MARKETS AND TRADE ON INNOVATION 2
Spanish markets and led cotton producers to enter new markets with different and moresophisticated tastes. Although both shocks affected Spanish cotton textiles’ access tonew markets, their nature was different, and so were their implications for the adoptedtechnology.
These two market shocks meant different incentives to inventors. In 1891, the mar-ket size for Spanish cotton goods increased when the Spanish authorities introduced animperial protective tariff. In practice, cotton producers in Spain witnessed an increasein their benefits after the tariff system forced colonies to buy most cotton manufac-tured goods from them. Consequently, this market expansion implied more incentivesto develop cotton augmenting technology in contrast with other sectors. However, saidconditions lasted only a few years. With a significant installed production capacity andwithout a strong internal market, industrialists needed to find new external markets af-ter the colonies’ independence in 1898. New international consumers that Spain foundmainly in Argentina tended to be more willing to pay for product quality than Span-ish consumers (Markusen, 1986; Flam and Helpman, 1987; Hallak, 2006; Verhoogen,2008), and Spain responded by raising exported fabric quality to reach those wealthiermarkets. Yet these more sophisticated fabrics came with a cost. They required a moreeffective use of weavers. Ultimately, this change in production characteristics meanthigher weaving costs and a shift in innovation incentives towards the cotton-weavingproduction section.
I find evidence in the patent data that supports the previous points: the two tradeshocks affected inventors’ incentives. First, I find that the colonial trade inducedinnovation in technologies used to produce cotton goods along all production stages.Second, after Spain lost its colonies, I find a shift towards weaving technologies with arise in cotton patents designed for this production stage.
Finally, using novel archive price data from a big cotton firm (La Espana Industrial),I document price changes induced by the shocks in the textile industry. This exercisehelps me to illustrate the strength of each induced technological change. Followingthe forced colonial integration, I document a temporary rise in cotton-finished textileprices relative to textiles made with other fibers. This evidence is consistent with astrong directed technical change and substitutability between cotton and other fibers.I also show that the 1898 shock led to an increase in design-intensive cotton goods,and, in particular, I find that the prices of unfinished cotton fabrics increased relativeto cotton threads in the wake of the shock. Lastly, I show how relative wages insidethe cotton industry changed in the presence of this biased technology upgrading. Idocument a positive trend in the payments to weavers but not to spinners after 1903.
THE EFFECT OF COLONIAL MARKETS AND TRADE ON INNOVATION 3
This is consistent with a weak directed technical change and complementarities betweenweaving and other cotton textile labor.
One caveat is necessary when interpreting these results. Spanish regulation allowedtwo types of patents. A patent for the invention that protected new ideas and pro-cedures, and patents for introduction which protected ideas never implemented in thecountry despite being developed and used in other countries. This system was notexceptional, and many peripheral countries adopted it during the 19th century, as theysought to facilitate technological transfers (see Saız, 2014). I use this feature to showthat real innovation drives my results. They are not just copying foreign technologyeffects. The effects that I find hold for innovation patents as well as all patents. There-fore, I conclude that changes produced by trade structures indeed affected incentivesto create new production structures and ideas.
My findings relate to the literature on directed technical change, in particular, theempirical works that document the behavior of innovation under different shock types(Popp, 2002; Hanlon, 2015; Aghion et al., 2016). I follow the previous literature, using aclean historical experiment to isolate causal effects. I take advantage of exogenous andsurprising shocks generated by the increase in tariffs and the war on Spanish industry.However, my paper differentiates from the previous literature in two ways. I studytwo shocks on the output market. While this literature has extensively documentedthe effect of input shocks on innovation, the type of shocks I study has not beenevaluated empirically. Even though the shocks are analyzed under the same theoreticallens, their nature and implications are not the same. Also, I analyze the industrybehavior when sectors whose technology could expand are not substitutes. In thispaper, contrary to all previous empirical literature, I study innovation in sectors thatare complements. I show that this feature plays a big role when defining the bias oftechnological improvements.
Also, to my knowledge, this is the first paper showing how the presence of imperialpossessions influenced technical direction. I review how Spain responded to exogenouschanges in trade relations with its colonies. I draw on the extensive literature onWestern European colonialism that searches for the effects of this policy on both thecolonized territories and the societies that did the colonizing. In particular, I build onthe previous literature that questions how the Europeans obtained benefits from theircolonial empires (e.g. O’Brien and Escosura, 1998; Findlay, 1990; Butel and Crouzet,1998). Previous literature has argued that both slave trade profits (Williams, 1944)and the expansion of colonial trade (Inikori, 2002) are two main drivers of colonialbenefits. However, and despite the interest in the relation between North Atlantic

THE EFFECT OF COLONIAL MARKETS AND TRADE ON INNOVATION 4
trade and growth (Davis, 1973), there has been little empirical evidence of the actualimpact of trade on the economic development in western societies. Following Davisand Huttenback (1982, 1986), I show that the benefits of the imperial enterprise didnot distribute equally across all economic sectors. I provide formal empirical supportof a channel that literature has not studied before: the effects of trade on innovationincentives. According to this literature, commerce created a unique price and wagestructure that modified incentives and allowed the technological breakthroughs of the18th century in Britain (Allen, 2009, 2011). I contribute to this literature by studyingthe related mechanisms and broadening the analysis beyond the British empire. I lookat the effects of trade and innovation on the technological periphery. In this work, Isuggest that even in the presence of an institutional environment that was far fromthe best (Acemoglu, Johnson, and Robinson, 2005), colonial trade was able to inducegrowth in some economic sectors.
These results relate to many works on trade and development that analyze the be-havior of exporting firms. Although I cannot document heterogeneous effects in firmsafter they access new markets, I can provide evidence that supports the idea thattrade affects aggregate levels of technological upgrading, particularly the adoption oftechnology. Using local tax data, I find an increase in the number of cotton weavingmachines compared with other textile industries after Spain lost its colonial captivemarkets. I hypothesize that this change also derives from the demand shock that ac-counts for weaving innovation observed during the same period. Previous literature hasdocumented positive effects on the adoption of new technologies as a result of tradeagreements (Bustos, 2011; Lileeva and Trefler, 2010) or temporary trade protection(Juhasz, 2018). I complement this literature suggesting that general trade competi-tion also produced a change in industrial machinery. I suggest that trade inducedimprovements in another dimension beyond the mere product and quality upgradingas reported by anecdotal evidence. There was also an increase in the scope of thetechnology used to produce goods parallel to enlargements of the products varieties’set and the quality of goods.
Finally, this paper is related to quality improvements literature. It is a well-establishedfact that firms will produce higher-quality goods to appeal to wealthier foreign con-sumers. Since Verhoogen (2008) formalized the fact that quality upgrading is a firmdecision to compete in global markets, a growing literature has supported this empiricalfact in very different contexts. However, there is still a debate about the mechanismthat explains this change. Literature has not answered if a scale effect or a qualitychoice motivate quality improvements in trade (Verhoogen, 2021). In this paper, I
THE EFFECT OF COLONIAL MARKETS AND TRADE ON INNOVATION 5
provide supporting evidence for the latter since the quality adjustment stems from achange in demand features rather than export volumes. There is a strong correlationbetween trade and quality production, either when looking at a direct measure of qual-ities (in Egypt (Atkin, Khandelwal, and Osman, 2017) or France (Crozet, Head, andMayer, 2011)) or when drawing inferences from prices and other indirect measures (inPortugal (Bastos and Silva, 2010; Bastos, Silva, and Verhoogen, 2018), China (Manovaand Yu, 2017), France (Martin, 2012), or Hungary (Gorg, Halpern, and Murakozy,2017)). Nonetheless, there is no evidence of how quality upgrading also motivatesother upgrading mechanisms such as learning or specialization patterns. In this paper,I study this mechanism, arguing that the need to produce high-quality goods was themain driver of an increase in innovation.
2. Background
2.1. Spanish cotton industry. Cotton has been one of the most important industriesin the world. Indeed, during the 18th century, European empires used cotton as aplatform to create new industries, that is, it was a launching pad for the IndustrialRevolution (Beckert, 2015, pp.xiv). Spain was not the exception, and the cotton textileindustry was one of the few modern industries with relative success in the country.During the second part of the 19th century, it was one of the first industrialized sectorsin a period characterized by industrial productivity growth following the incorporationof new ideas and technologies (Carreras, 2006). Textile industry represented 1.7%1 ofthe entire country’s tax value (compared with 4% of industrial values) and the cottontextile employment was around 4% of total employment (29% of total employment inthe main industries)2.
After the shock on raw input global markets produced by the American Civil War,the Spanish cotton industry displayed several distinct features. First, the sector reliedcompletely on raw material imports3. Second, despite its presence in different areas,the industry was concentrated in Catalonia due to geographic advantages and historical
1Based on the payments of industrial taxes Nadal (1987) in 1856. This value was not bigger than anyother individual industry. Comparable industries were just a half of the value.2Based on the Gimenez y Guited (1862)’s study of the main industries in Spain in the most rele-vant provinces in 1860. The whole textile employment represented more than a half of industrialemployment, including wool industry (14% employment), silk industry (4.8%), and linen industry(3.5%).3There was some minimal experience in raw cotton production, such as in Motril (Granada). Still,they were unable to meet the industry demand, and disappeared during the second half of the century(Martın, 2018).

THE EFFECT OF COLONIAL MARKETS AND TRADE ON INNOVATION 6
changes one century before4. Third, most of the production was carried out in verticallyintegrated firms in which both spinning and weaving mills were under the control ofthe same firm5. Fourth, although the market was dominated by large firms6, relativelyto other countries in Europe, the size of the industry was small. Finally, firms usedpiece payment on both spinning and weaving production. Like in technological leaderssuch as England or the North American, those payments remained unchanged duringthe last part of the 19th century. When facing external shocks, firms adjusted theiroutput, hours of work, or employment (Domenech, 2008).
Those characteristics derived directly from the internal market characteristics theindustry faced. The heavily protected agricultural output sustained internal demand,and, therefore, it was small and volatile. Unable to support more prominent firms andmore considerable savings through the economies of scale, the cost structure remainedhigh in comparison to global market leaders (Nadal and Sudria, 1993). To survive, firmsfollowed a different strategy: protecting the internal market and capturing externalmarkets.
2.2. Colonial markets, tariffs and the war. After losing all continental posses-sions in America during the first half of the 19th century, Spain managed, albeit withhardship, to maintain some territories such as Cuba, the Philippines, and Puerto Rico(in addition to some other small possessions in Africa and the Pacific). After thefirst Cuban independence war (1868-1878), there was a renewed need to formulate therelation between the metropolis and the colonies. There was a tension between theCuban sugar entrepreneurs’ need for free trade and Catalan cotton industrialists’ needfor colonial market protection. The solution was a in the middle. Although the textilelobbies did not achieve a high protective tariff, they reached a change in the trade pol-icy towards the colonies7: the Antillean colonial markets and the metropolis started tobe considered as a single market. The Ley de Relaciones Comerciales con las Antillasin 1882 established a gradual yearly reduction of tariffs between the colonies and Spain
4An agrarian crisis in Catalonia between 1770-1775 forced capital to move into the production of cottontextiles due to the increase in agricultural wages and reduction of rents. Moreover, the presence ofrivers and mountains provided industrialists with a valuable power source to move mills withoutrelying on other external sources such as coal (Nadal, 1975).5According to Roses (2009), in 1860, 60% of spinning production and 69% of weaving production camefrom integrated firms.6Roses (2009) estimated that in 1860 both spinning and weaving were dominant in over 60% of firmsthat produced more than 100 output tons per year.7The tariff system did not include a protective tariff to industrial products. The system was a resultof negotiation with other European powers in exchange for low tariffs to Spanish agricultural outputsuch as wine and flour (Nadal and Sudria, 1993).
THE EFFECT OF COLONIAL MARKETS AND TRADE ON INNOVATION 7
over the course of ten years that would end with the complete elimination of trade bar-riers between the two territories8. Albeit imperfect, after this change, Spanish textilesfound a market to overcome the internal market limitations.
The real protection and market capture came in 1891 with the rise of a protectionisttariff (known as Canovas Tariff). Although a starting point in future negations toreduce French tariffs to Spanish wine, tariffs for industrial products remained highwhen negotiations failed (Sabete-Sort, 1995). In practice, there was an effective marketintegration with both the reduction of the barriers between the colonies and extremelyhigh tariffs after 1891. In this system, colonies were forced to buy overpriced metropolis’products (Nadal and Sudria, 1993)9. However, the benefit did not last much. In 1895Cuban independence movement gained strength after a widespread disappointmentwith Spanish policies (Zanetti, 2013)10. This movement ended in 1898, with the loss ofthe colonies and therefore the loss of protected markets for Spanish cotton textiles11.
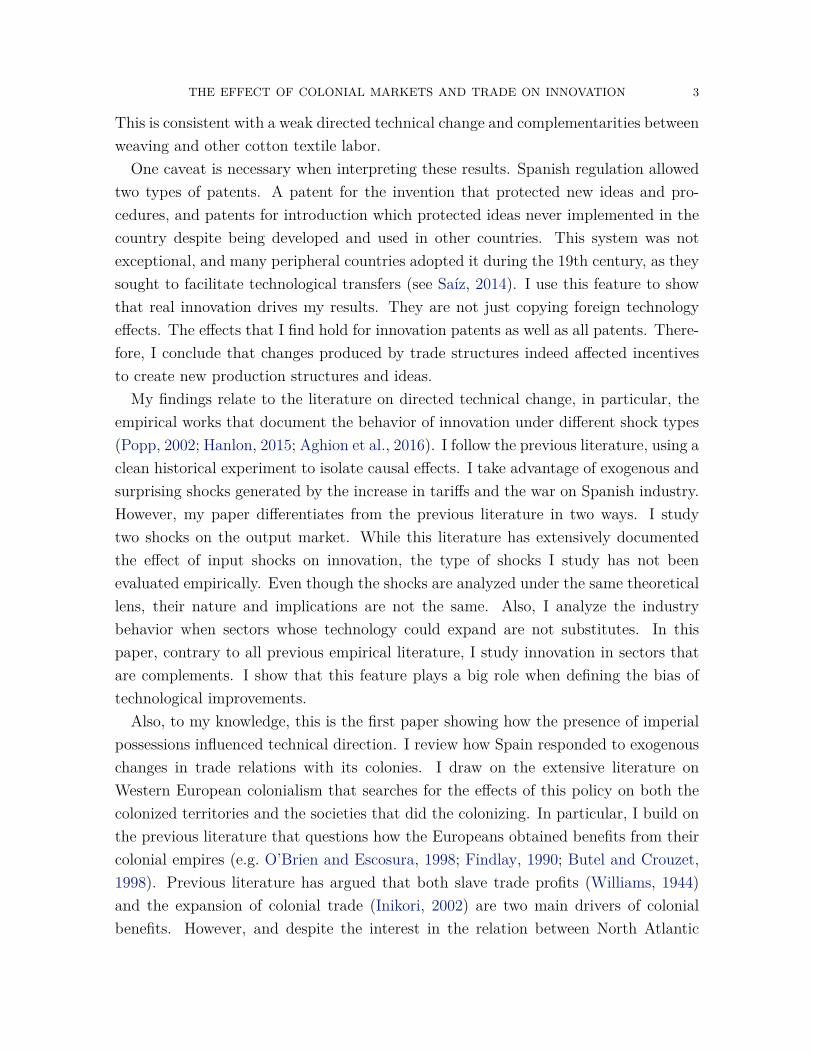
Figure 1 shows the tariff evolution of basic textiles in Spain between 1878 and 1910. Iinclude two of the fibers that, due to their characteristics, can fit the colonial market’snecessities: cotton and linen12. Cotton textiles, throughout the period, had greaterprotection than linen textiles. Before the introduction of the protective tariff in 1891,there was a downward trend in textile tariffs13. However, this pattern changed when thenew protective tariff system came into force. Cotton tariff doubled in the period andremained around 60% while the linen tariff increased by a half and remained around
8The law established a yearly 5% reduction in the original tariffs during the first three years, then a10% decrease in the next four years, followed by a 15% in the remaining three years until 1891.9This is not a distinctive feature of the Spanish colonial policy. Beckert (2015) reports several casesin which the industrial policy implied using the colonies as a captured market for textile industrialoutputs. For instance, England used this strategy to displace Indian textiles from global marketsduring the late 17th century. Belgium observed a boost in the industry during the Great Netherlandsperiod thanks to the access of Dutch colonial markets in the Pacific.10For instance, trade policy was not reciprocal. The Spanish exported a considerable amount ofproducts to the colonies, while the colonies’ main market was not the metropolis. According toZanetti (1998) in 1978, the United States represented 82.5% of Cuba’s exports destination11Despite some proposals of autonomy (which found opposition among the textile sector), after theUnited States quick intervention, Spain lost its last colonial possession in America and the Pacific.See Heraclides and Dialla (2017) for a detailed explanation of the United States intervention in theCuban and Philippine independence movement.12The to the tropical location of the colonies, generated the need is for breathable summer fabrics.Other fabrics like those made of wool and silk fail to fulfill this requirement completely. For instance,in 1895, Cuba imported a minimal amount of wool and silk manufactures. In that year, Cuba received11,796 tons of linen textiles and 4,932 tons of cotton textiles, 312 tons of wool textiles, and 19 tons ofsilk textiles (Direccion General de Hacienda, 1894-1895).13This is in line with the literature that emphasized that the goal in this period was to protect theagricultural sector.
THE EFFECT OF COLONIAL MARKETS AND TRADE ON INNOVATION 8
30%14. I exploit this fact in my analysis, and I use linen and other fibers as a “control”group to get a sense of the behavior of textiles without an extensive market capture.
Figure 1. Textile tariffs
2030
4050
6070
80%
1877
1879
1881
1883
1885
1887
1889
1891
1893
1895
1897
1899
1901
1903
1905
1907
1909
1911
Cotton Linnen
Source: Direccion General de Aduanas (1876-1898, 1899-1911)Notes: Tariff measure as the fraction of total tariff revenues on import value. Cotton tariff is measured asa weighted average on tariff on plain-woven and twilled woven fabrics either unbleached, bleached, or dyedon 2 different quality grades. After 1906 the cotton categories also include different fabric weights, and Ihave ten other quality groups. Linen tariff was measured as a weighted average on tariffs on plain-woven andtwilled weave fabrics on three different quality grades (4 after 1906). Imports’ weight in each category is usedto assess the importance of each category when constructing the series. In both cases, I show the two yearsmoving average of the raw numbers.
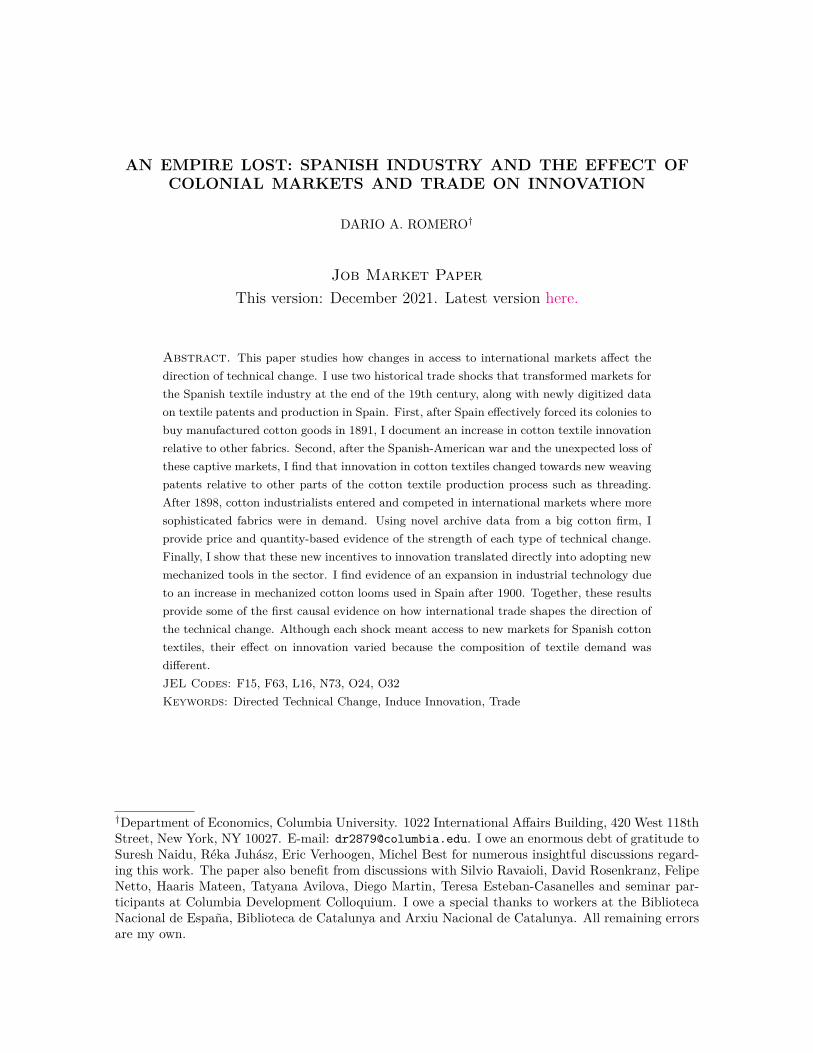
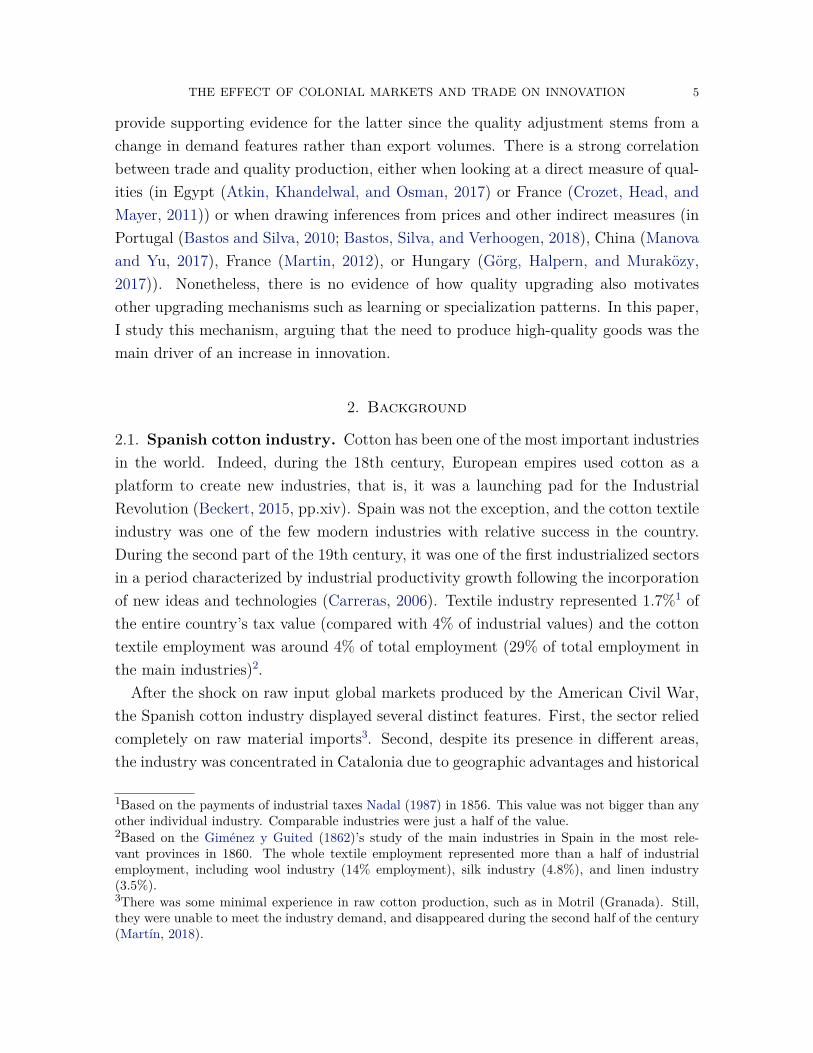
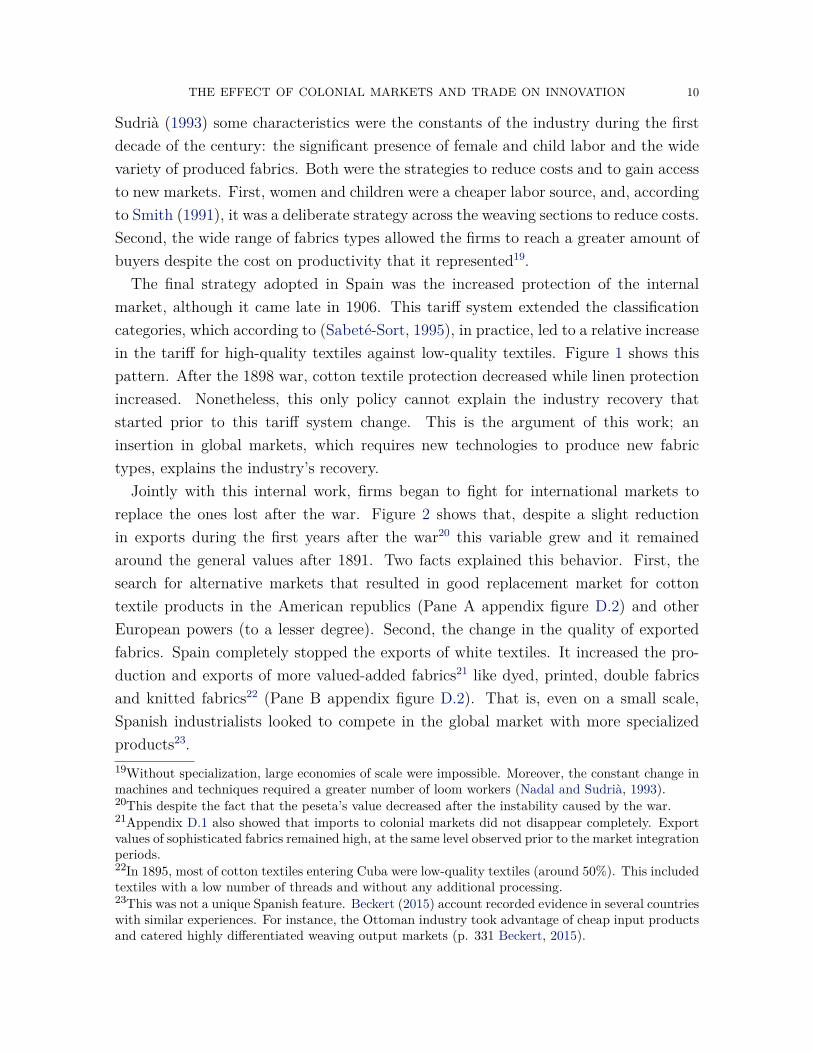
Figure 2 shows how the tariff regimen was reflected in exports’ volume and desti-nations. Cotton production and exports were very similar to their linen counterpartsprior to 1982. Cotton production and the share destined to exports started to growsimilarly after the reduction in trade barriers during that year. With the protectivesystem in 1891, the share of production destined for exports in both sectors signifi-cantly increased. For cotton, it reached a maximum of 20%, while for linen, this valuewas around 8%. However, the behavior of exports was different between the two typesof fibers. In the case of cotton, the exports growth had a similar pattern to the share ofexports. It shows an increasing capture of the colonial market with new production15.14This is even less than the cotton protection before 1891.15Contrary to linen exports that did not increase in the same proportion, showing relative constantproduction levels and a replacement of the internal market. Even more, in 1895, according to Direccion
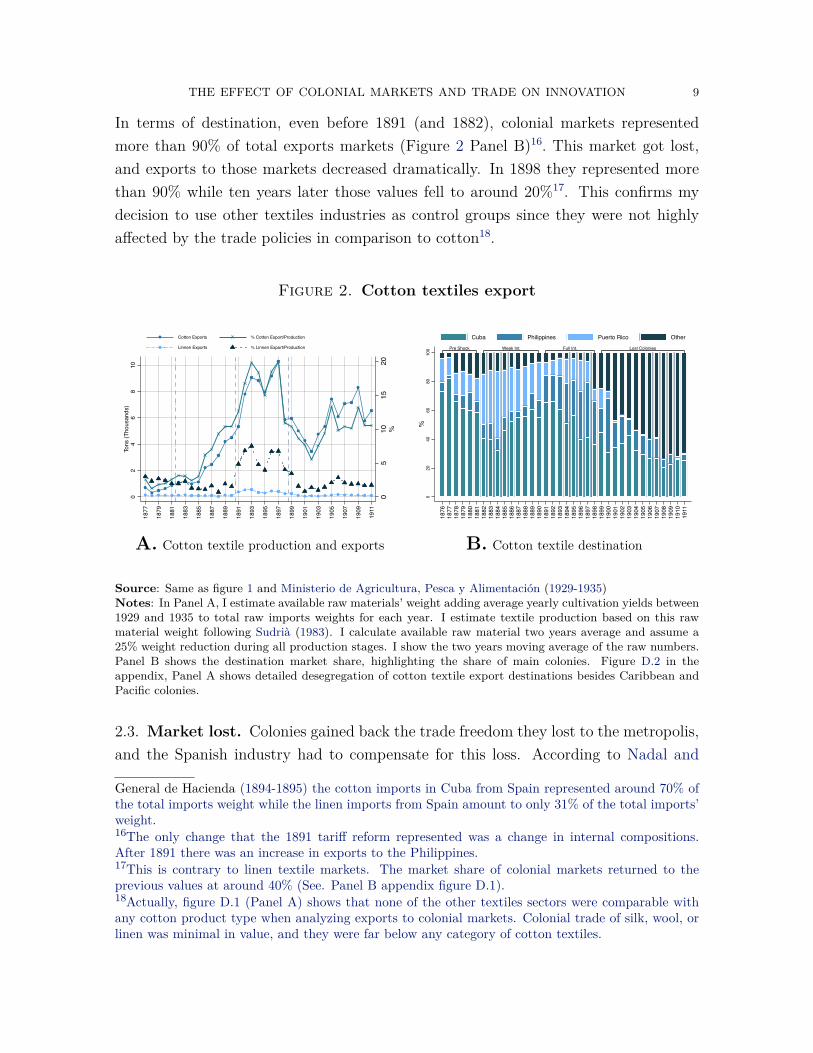
THE EFFECT OF COLONIAL MARKETS AND TRADE ON INNOVATION 9
In terms of destination, even before 1891 (and 1882), colonial markets representedmore than 90% of total exports markets (Figure 2 Panel B)16. This market got lost,and exports to those markets decreased dramatically. In 1898 they represented morethan 90% while ten years later those values fell to around 20%17. This confirms mydecision to use other textiles industries as control groups since they were not highlyaffected by the trade policies in comparison to cotton18.
Figure 2. Cotton textiles export
05
1015
20%
02
46
810
Tons
(Tho
usan
ds)
1877
1879
1881
1883
1885
1887
1889
1891
1893
1895
1897
1899
1901
1903
1905
1907
1909
1911
Cotton Exports % Cotton Export/Production
Linnen Exports % Linnen Export/Production
A. Cotton textile production and exports
Pre Shock Weak Int. Full Int. Lost Colonies
020
4060
8010
0%
1876
1877
1878
1879
1880
1881
1882
1883
1884
1885
1886
1887
1888
1889
1890
1891
1892
1893
1894
1895
1896
1897
1898
1899
1900
1901
1902
1903
1904
1905
1906
1907
1908
1909
1910
1911
Cuba Philippines Puerto Rico Other
B. Cotton textile destination
Source: Same as figure 1 and Ministerio de Agricultura, Pesca y Alimentacion (1929-1935)Notes: In Panel A, I estimate available raw materials’ weight adding average yearly cultivation yields between1929 and 1935 to total raw imports weights for each year. I estimate textile production based on this rawmaterial weight following Sudria (1983). I calculate available raw material two years average and assume a25% weight reduction during all production stages. I show the two years moving average of the raw numbers.Panel B shows the destination market share, highlighting the share of main colonies. Figure D.2 in theappendix, Panel A shows detailed desegregation of cotton textile export destinations besides Caribbean andPacific colonies.
2.3. Market lost. Colonies gained back the trade freedom they lost to the metropolis,and the Spanish industry had to compensate for this loss. According to Nadal and
General de Hacienda (1894-1895) the cotton imports in Cuba from Spain represented around 70% ofthe total imports weight while the linen imports from Spain amount to only 31% of the total imports’weight.16The only change that the 1891 tariff reform represented was a change in internal compositions.After 1891 there was an increase in exports to the Philippines.17This is contrary to linen textile markets. The market share of colonial markets returned to theprevious values at around 40% (See. Panel B appendix figure D.1).18Actually, figure D.1 (Panel A) shows that none of the other textiles sectors were comparable withany cotton product type when analyzing exports to colonial markets. Colonial trade of silk, wool, orlinen was minimal in value, and they were far below any category of cotton textiles.
THE EFFECT OF COLONIAL MARKETS AND TRADE ON INNOVATION 10
Sudria (1993) some characteristics were the constants of the industry during the firstdecade of the century: the significant presence of female and child labor and the widevariety of produced fabrics. Both were the strategies to reduce costs and to gain accessto new markets. First, women and children were a cheaper labor source, and, accordingto Smith (1991), it was a deliberate strategy across the weaving sections to reduce costs.Second, the wide range of fabrics types allowed the firms to reach a greater amount ofbuyers despite the cost on productivity that it represented19.
The final strategy adopted in Spain was the increased protection of the internalmarket, although it came late in 1906. This tariff system extended the classificationcategories, which according to (Sabete-Sort, 1995), in practice, led to a relative increasein the tariff for high-quality textiles against low-quality textiles. Figure 1 shows thispattern. After the 1898 war, cotton textile protection decreased while linen protectionincreased. Nonetheless, this only policy cannot explain the industry recovery thatstarted prior to this tariff system change. This is the argument of this work; aninsertion in global markets, which requires new technologies to produce new fabrictypes, explains the industry’s recovery.
Jointly with this internal work, firms began to fight for international markets toreplace the ones lost after the war. Figure 2 shows that, despite a slight reductionin exports during the first years after the war20 this variable grew and it remainedaround the general values after 1891. Two facts explained this behavior. First, thesearch for alternative markets that resulted in good replacement market for cottontextile products in the American republics (Pane A appendix figure D.2) and otherEuropean powers (to a lesser degree). Second, the change in the quality of exportedfabrics. Spain completely stopped the exports of white textiles. It increased the pro-duction and exports of more valued-added fabrics21 like dyed, printed, double fabricsand knitted fabrics22 (Pane B appendix figure D.2). That is, even on a small scale,Spanish industrialists looked to compete in the global market with more specializedproducts23.19Without specialization, large economies of scale were impossible. Moreover, the constant change inmachines and techniques required a greater number of loom workers (Nadal and Sudria, 1993).20This despite the fact that the peseta’s value decreased after the instability caused by the war.21Appendix D.1 also showed that imports to colonial markets did not disappear completely. Exportvalues of sophisticated fabrics remained high, at the same level observed prior to the market integrationperiods.22In 1895, most of cotton textiles entering Cuba were low-quality textiles (around 50%). This includedtextiles with a low number of threads and without any additional processing.23This was not a unique Spanish feature. Beckert (2015) account recorded evidence in several countrieswith similar experiences. For instance, the Ottoman industry took advantage of cheap input productsand catered highly differentiated weaving output markets (p. 331 Beckert, 2015).
THE EFFECT OF COLONIAL MARKETS AND TRADE ON INNOVATION 11
3. Theoretical Framework
When technical change is endogenous, trade and international markets affect the di-rection in which innovators develop new technology. Several authors have built theoriesof international trade and the effects on innovation (see Acemoglu, 2002; Gancia andZilibotti, 2009; Gancia and Bonfiglioli, 2008). These are some of the critical featuresof the theory (see appendix section A for a complete review of the theory). The the-ory focuses on two sectors (they can represent cotton textiles and other fiber textiles,for instance). Intermediate goods and machines, combined, produced each one of thetextiles, and both machines and intermediate goods are specific to each sector. Eachsector uses raw fiber (cotton (Z) or other fibers (X)) endowments to produce interme-diate goods depending on a unique sector cost structure. Ultimately, I am interestedin the number of machines since they represent the available technology in each sector.A number of them (Ai for the numbers of machines in the sector i) measures eachsector’s innovation degree. Machine developers hold an infinite patent on machinesand sell them in a monopolistic market to textile makers after producing them at amarginal cost. Developers must pay a fixed cost to enter the market and decide thenin which sector to invest. Because each sector’s market structure and demand for theirmachines affect investors’ profits, those characteristics are essential to determine inwhich sector a new machine should be introduced. Consequently, I will analyze howeach trade shock affects first the market structure and the profits innovators can makein each sector and then the incentives to expand the sector machinery.
The Spanish patent law allowed the introduction of innovations already patentedin other countries. That is, it allowed the imitation of foreign ideas. Under thisframework, developers must consider the overseas technology.Gancia and Bonfiglioli(2008) show that even in this case, local conditions determine the technological levelsadopted in the non-technological leader country. Having this in mind, I argue thatthe conclusions in this section apply. First, there was no perfect replication of foreigntechnology in Spain. Second, even when there were no total barriers to overseas tech-nological adoption, the Spanish markets’ conditions were still affecting the decision oflocal innovators when they determined the type of innovation to develop.
In the case of the market integration shock, I assume that the change in innovationincentives is through the prices of intermediate goods. When Spain forced its colonies
THE EFFECT OF COLONIAL MARKETS AND TRADE ON INNOVATION 12
to buy cotton textiles, the prices of these manufactured goods increased after the pro-duction left the country to the colonies24. Since innovators were selling their machinesin a monopolistic market, the increase in prices in the cotton sector also translatedinto an growth in the profits they can make selling the machines to this sector. Thisleaves the following prediction
Prediction 1. With fixed technology, cotton textile relative price increased after theprotective tax and the market integration. Due to this rise in cotton textile relativeprices, there was an increase in patented machines to process cotton (Az) relative tothe machines to process other fibers (Ax).
The case of Spanish textiles’ entrance into competitive global markets is more com-plicated. There are two sectors inside the cotton industry, producing intermediategoods and using two different types of labor: weavers (L) and other types of workers(H). In this case, innovators choose between introducing machines into the weavingsector (that uses weavers) or other production sectors. With the new markets’ needsand tastes, weavers’ costs increased. In the context of new conditions the demand,firms needed to expand their variety range, and it represented an increase in the costto use a weaver that has to work on more sophisticated fabrics25. Ultimately, the shocktranslated into a rise in fabrics prices, and, therefore, in more incentives to innovatorsto develop weaving machinery. However, since weavers are costly to use, producersof these goods were now less willing to produce in this sector, or, what is the same,there was less space for innovators to develop these technologies. Two contradictoryforces acted over innovation incentives producing ambiguous conclusions regarding theexpected technology direction. However, these two sectors are complements in the pro-duction of a single product (cotton textiles). The willingness to produce machinery is,therefore, not a big concern. The rise in prices’ positive effect on innovation incentivesremained. This leaves the following prediction
Prediction 2. After entering a new market where tastes were different, with fixedtechnology, weavers got relatively scarcer and the fabrics’ price increased. Since weavingand other production stages are complements, the increase in the fabric relative pricesmotivated innovators to introduce machines for weaving. Then, there was an increase
24In terms of endowments, it meant that raw cotton relative to other fibers was scarcer in the integratedmarket as compared to Spain.25When producing more varieties, weavers cannot specialize. Workers must use the same machine toproduce several types of fabrics. This requires more time to prepare the loom, and more productionstops, required to change the arrangements when producing each different fabric.
THE EFFECT OF COLONIAL MARKETS AND TRADE ON INNOVATION 13
in patented machines for weaving (Al) relative to machines needed in other sectors(Ah).
4. Data
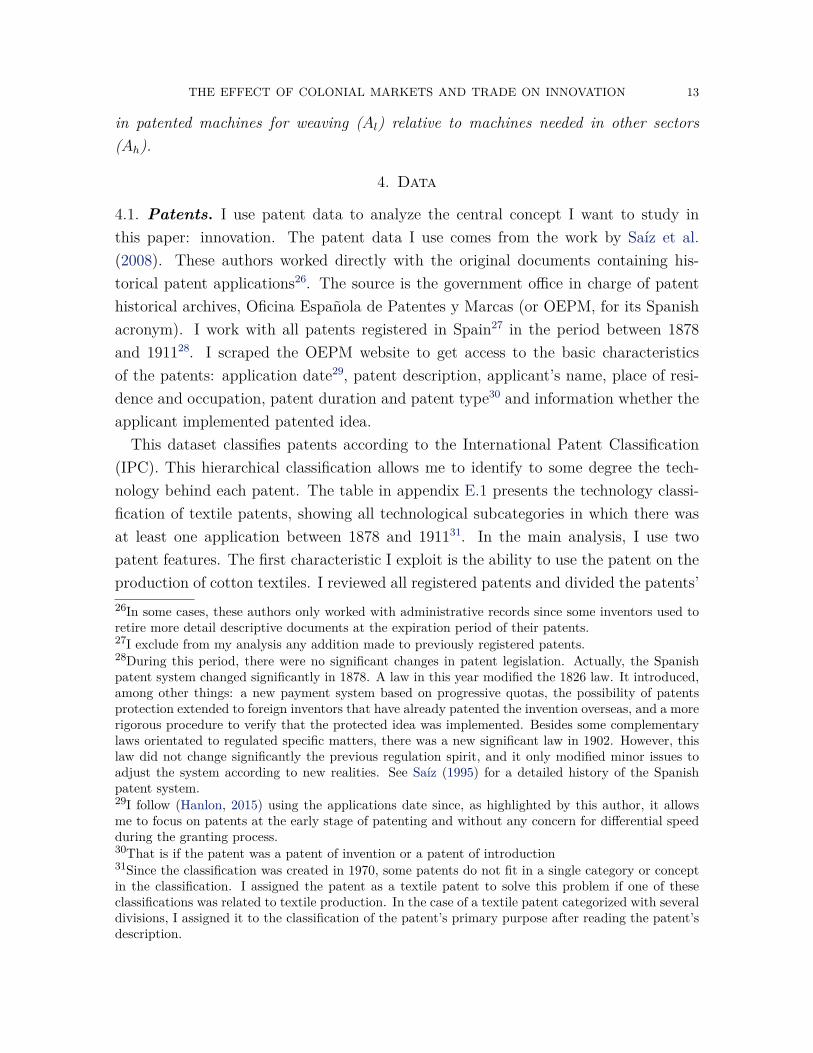
4.1. Patents. I use patent data to analyze the central concept I want to study inthis paper: innovation. The patent data I use comes from the work by Saız et al.(2008). These authors worked directly with the original documents containing his-torical patent applications26. The source is the government office in charge of patenthistorical archives, Oficina Espanola de Patentes y Marcas (or OEPM, for its Spanishacronym). I work with all patents registered in Spain27 in the period between 1878and 191128. I scraped the OEPM website to get access to the basic characteristicsof the patents: application date29, patent description, applicant’s name, place of resi-dence and occupation, patent duration and patent type30 and information whether theapplicant implemented patented idea.
This dataset classifies patents according to the International Patent Classification(IPC). This hierarchical classification allows me to identify to some degree the tech-nology behind each patent. The table in appendix E.1 presents the technology classi-fication of textile patents, showing all technological subcategories in which there wasat least one application between 1878 and 191131. In the main analysis, I use twopatent features. The first characteristic I exploit is the ability to use the patent on theproduction of cotton textiles. I reviewed all registered patents and divided the patents’26In some cases, these authors only worked with administrative records since some inventors used toretire more detail descriptive documents at the expiration period of their patents.27I exclude from my analysis any addition made to previously registered patents.28During this period, there were no significant changes in patent legislation. Actually, the Spanishpatent system changed significantly in 1878. A law in this year modified the 1826 law. It introduced,among other things: a new payment system based on progressive quotas, the possibility of patentsprotection extended to foreign inventors that have already patented the invention overseas, and a morerigorous procedure to verify that the protected idea was implemented. Besides some complementarylaws orientated to regulated specific matters, there was a new significant law in 1902. However, thislaw did not change significantly the previous regulation spirit, and it only modified minor issues toadjust the system according to new realities. See Saız (1995) for a detailed history of the Spanishpatent system.29I follow (Hanlon, 2015) using the applications date since, as highlighted by this author, it allowsme to focus on patents at the early stage of patenting and without any concern for differential speedduring the granting process.30That is if the patent was a patent of invention or a patent of introduction31Since the classification was created in 1970, some patents do not fit in a single category or conceptin the classification. I assigned the patent as a textile patent to solve this problem if one of theseclassifications was related to textile production. In the case of a textile patent categorized with severaldivisions, I assigned it to the classification of the patent’s primary purpose after reading the patent’sdescription.
THE EFFECT OF COLONIAL MARKETS AND TRADE ON INNOVATION 14
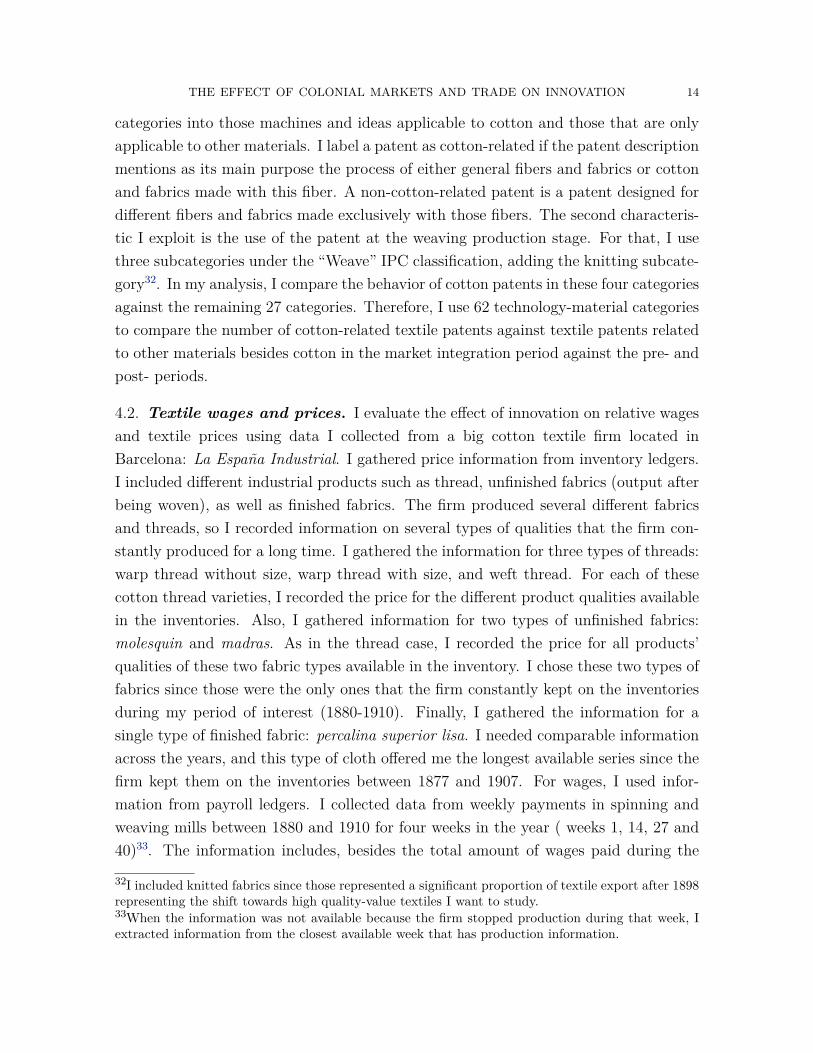
categories into those machines and ideas applicable to cotton and those that are onlyapplicable to other materials. I label a patent as cotton-related if the patent descriptionmentions as its main purpose the process of either general fibers and fabrics or cottonand fabrics made with this fiber. A non-cotton-related patent is a patent designed fordifferent fibers and fabrics made exclusively with those fibers. The second characteris-tic I exploit is the use of the patent at the weaving production stage. For that, I usethree subcategories under the “Weave” IPC classification, adding the knitting subcate-gory32. In my analysis, I compare the behavior of cotton patents in these four categoriesagainst the remaining 27 categories. Therefore, I use 62 technology-material categoriesto compare the number of cotton-related textile patents against textile patents relatedto other materials besides cotton in the market integration period against the pre- andpost- periods.
4.2. Textile wages and prices. I evaluate the effect of innovation on relative wagesand textile prices using data I collected from a big cotton textile firm located inBarcelona: La Espana Industrial. I gathered price information from inventory ledgers.I included different industrial products such as thread, unfinished fabrics (output afterbeing woven), as well as finished fabrics. The firm produced several different fabricsand threads, so I recorded information on several types of qualities that the firm con-stantly produced for a long time. I gathered the information for three types of threads:warp thread without size, warp thread with size, and weft thread. For each of thesecotton thread varieties, I recorded the price for the different product qualities availablein the inventories. Also, I gathered information for two types of unfinished fabrics:molesquin and madras. As in the thread case, I recorded the price for all products’qualities of these two fabric types available in the inventory. I chose these two types offabrics since those were the only ones that the firm constantly kept on the inventoriesduring my period of interest (1880-1910). Finally, I gathered the information for asingle type of finished fabric: percalina superior lisa. I needed comparable informationacross the years, and this type of cloth offered me the longest available series since thefirm kept them on the inventories between 1877 and 1907. For wages, I used infor-mation from payroll ledgers. I collected data from weekly payments in spinning andweaving mills between 1880 and 1910 for four weeks in the year ( weeks 1, 14, 27 and40)33. The information includes, besides the total amount of wages paid during the
32I included knitted fabrics since those represented a significant proportion of textile export after 1898representing the shift towards high quality-value textiles I want to study.33When the information was not available because the firm stopped production during that week, Iextracted information from the closest available week that has production information.
THE EFFECT OF COLONIAL MARKETS AND TRADE ON INNOVATION 15
week, the total number of workers in each section and the total number of pieces (forfabrics) or kilograms (for threads) produced. It is important to note that I do nothave information on spinning mills during 1888-1890 since the firm completely stoppedthread production during those dates.
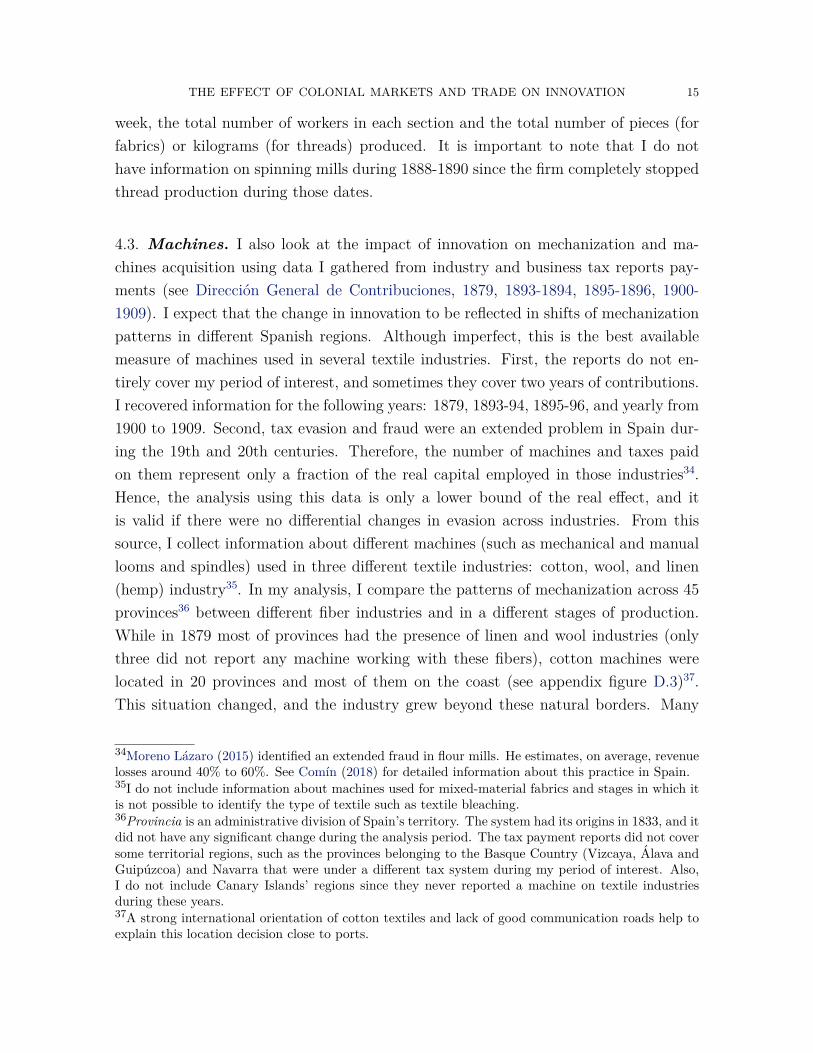
4.3. Machines. I also look at the impact of innovation on mechanization and ma-chines acquisition using data I gathered from industry and business tax reports pay-ments (see Direccion General de Contribuciones, 1879, 1893-1894, 1895-1896, 1900-1909). I expect that the change in innovation to be reflected in shifts of mechanizationpatterns in different Spanish regions. Although imperfect, this is the best availablemeasure of machines used in several textile industries. First, the reports do not en-tirely cover my period of interest, and sometimes they cover two years of contributions.I recovered information for the following years: 1879, 1893-94, 1895-96, and yearly from1900 to 1909. Second, tax evasion and fraud were an extended problem in Spain dur-ing the 19th and 20th centuries. Therefore, the number of machines and taxes paidon them represent only a fraction of the real capital employed in those industries34.Hence, the analysis using this data is only a lower bound of the real effect, and itis valid if there were no differential changes in evasion across industries. From thissource, I collect information about different machines (such as mechanical and manuallooms and spindles) used in three different textile industries: cotton, wool, and linen(hemp) industry35. In my analysis, I compare the patterns of mechanization across 45provinces36 between different fiber industries and in a different stages of production.While in 1879 most of provinces had the presence of linen and wool industries (onlythree did not report any machine working with these fibers), cotton machines werelocated in 20 provinces and most of them on the coast (see appendix figure D.3)37.This situation changed, and the industry grew beyond these natural borders. Many
34Moreno Lazaro (2015) identified an extended fraud in flour mills. He estimates, on average, revenuelosses around 40% to 60%. See Comın (2018) for detailed information about this practice in Spain.35I do not include information about machines used for mixed-material fabrics and stages in which itis not possible to identify the type of textile such as textile bleaching.36Provincia is an administrative division of Spain’s territory. The system had its origins in 1833, and itdid not have any significant change during the analysis period. The tax payment reports did not coversome territorial regions, such as the provinces belonging to the Basque Country (Vizcaya, Alava andGuipuzcoa) and Navarra that were under a different tax system during my period of interest. Also,I do not include Canary Islands’ regions since they never reported a machine on textile industriesduring these years.37A strong international orientation of cotton textiles and lack of good communication roads help toexplain this location decision close to ports.
THE EFFECT OF COLONIAL MARKETS AND TRADE ON INNOVATION 16
provinces recorded the presence of cotton machinery after 1900 (only three provincesdid not report the presence of cotton machines).
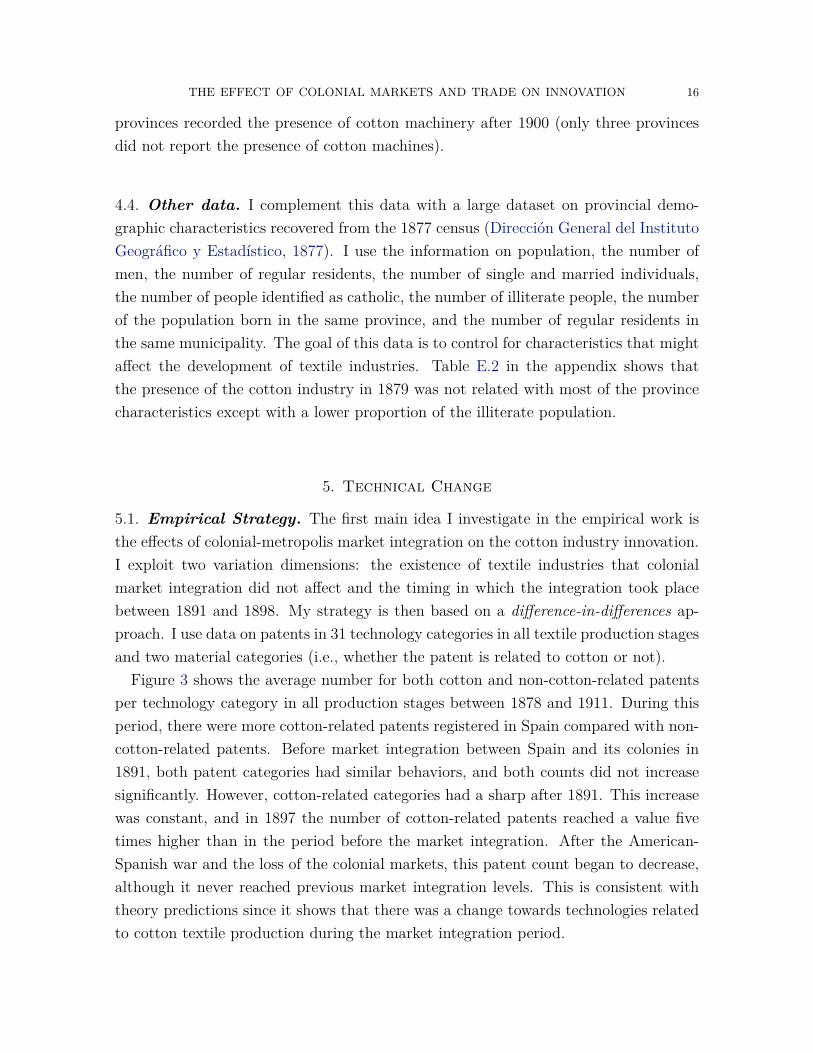
4.4. Other data. I complement this data with a large dataset on provincial demo-graphic characteristics recovered from the 1877 census (Direccion General del InstitutoGeografico y Estadıstico, 1877). I use the information on population, the number ofmen, the number of regular residents, the number of single and married individuals,the number of people identified as catholic, the number of illiterate people, the numberof the population born in the same province, and the number of regular residents inthe same municipality. The goal of this data is to control for characteristics that mightaffect the development of textile industries. Table E.2 in the appendix shows thatthe presence of the cotton industry in 1879 was not related with most of the provincecharacteristics except with a lower proportion of the illiterate population.
5. Technical Change
5.1. Empirical Strategy. The first main idea I investigate in the empirical work isthe effects of colonial-metropolis market integration on the cotton industry innovation.I exploit two variation dimensions: the existence of textile industries that colonialmarket integration did not affect and the timing in which the integration took placebetween 1891 and 1898. My strategy is then based on a difference-in-differences ap-proach. I use data on patents in 31 technology categories in all textile production stagesand two material categories (i.e., whether the patent is related to cotton or not).
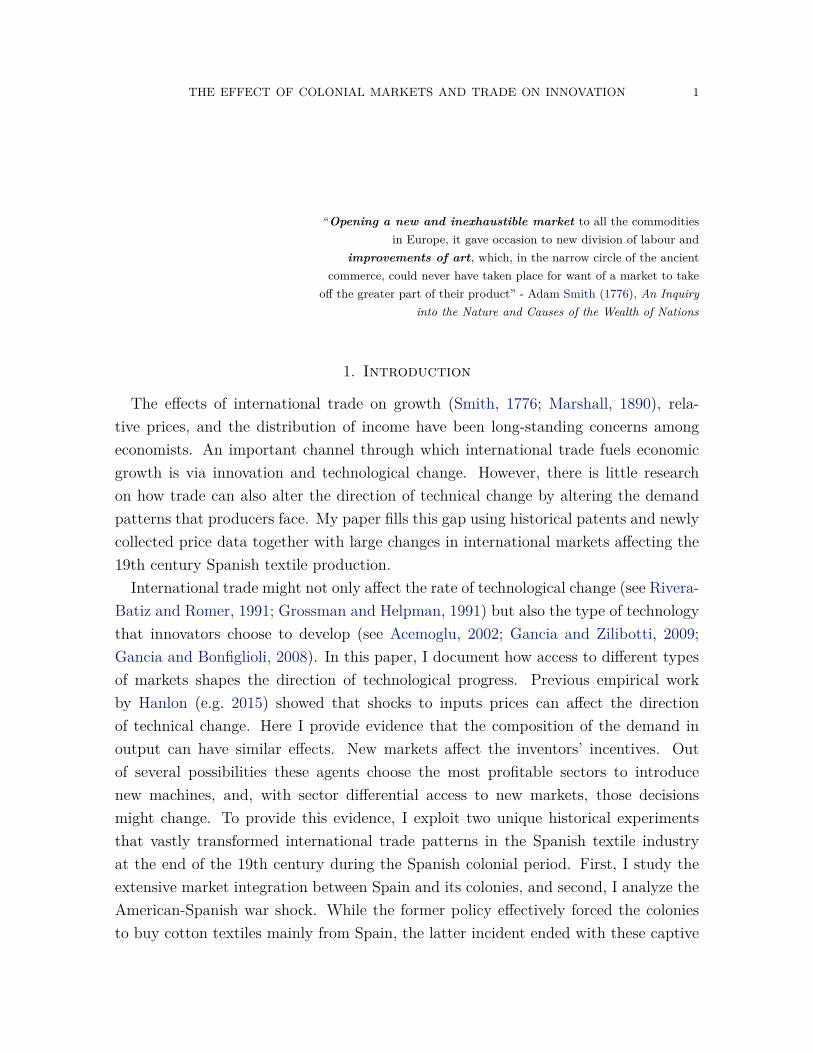
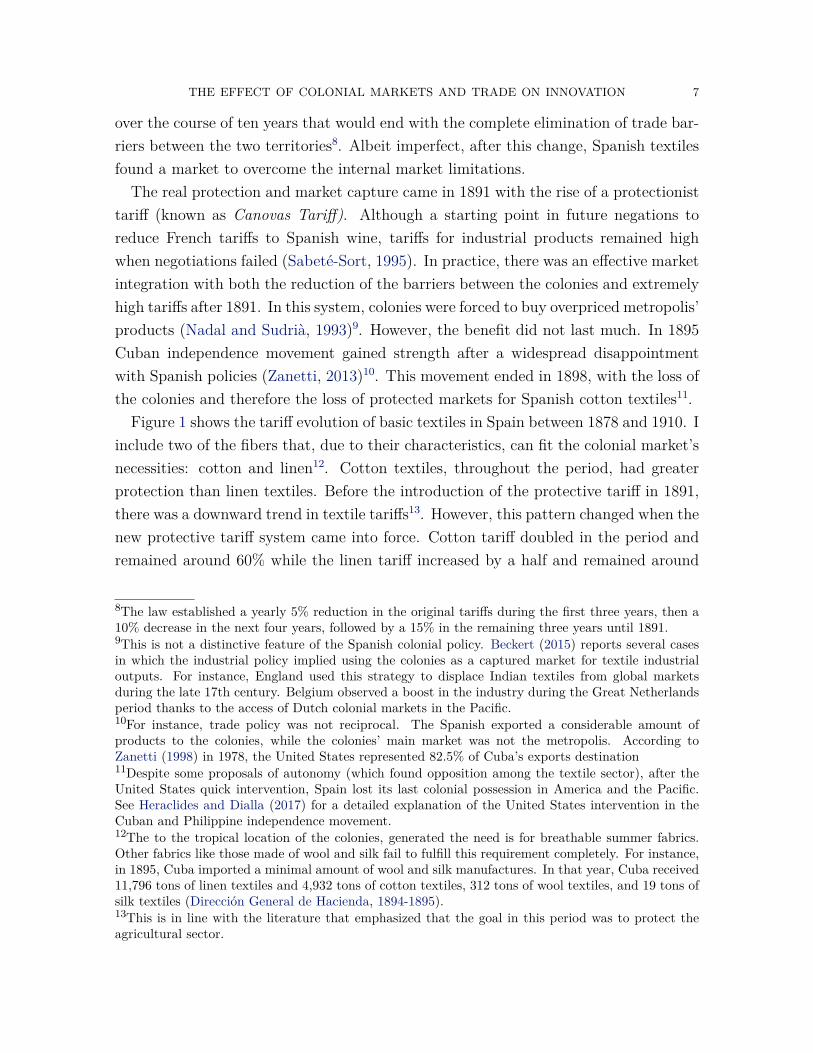
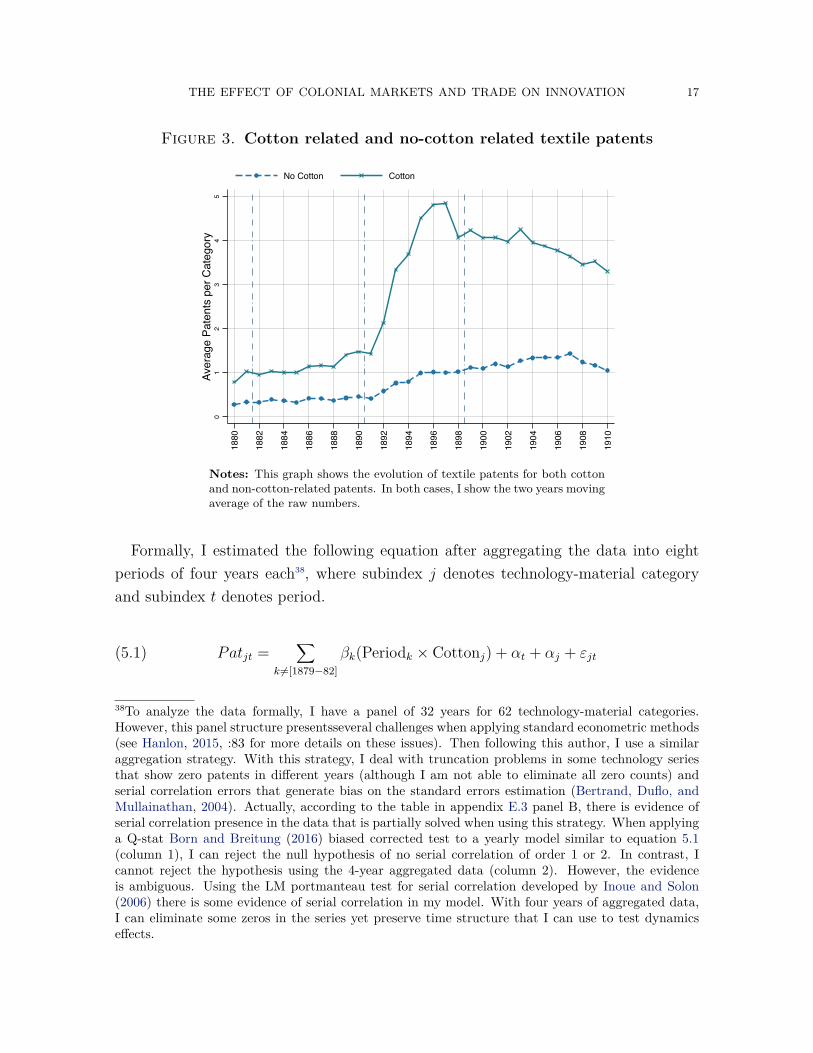
Figure 3 shows the average number for both cotton and non-cotton-related patentsper technology category in all production stages between 1878 and 1911. During thisperiod, there were more cotton-related patents registered in Spain compared with non-cotton-related patents. Before market integration between Spain and its colonies in1891, both patent categories had similar behaviors, and both counts did not increasesignificantly. However, cotton-related categories had a sharp after 1891. This increasewas constant, and in 1897 the number of cotton-related patents reached a value fivetimes higher than in the period before the market integration. After the American-Spanish war and the loss of the colonial markets, this patent count began to decrease,although it never reached previous market integration levels. This is consistent withtheory predictions since it shows that there was a change towards technologies relatedto cotton textile production during the market integration period.
THE EFFECT OF COLONIAL MARKETS AND TRADE ON INNOVATION 17
Figure 3. Cotton related and no-cotton related textile patents
01
23
45
Aver
age
Pate
nts
per C
ateg
ory
1880
1882
1884
1886
1888
1890
1892
1894
1896
1898
1900
1902
1904
1906
1908
1910
No Cotton Cotton
Notes: This graph shows the evolution of textile patents for both cottonand non-cotton-related patents. In both cases, I show the two years movingaverage of the raw numbers.
Formally, I estimated the following equation after aggregating the data into eightperiods of four years each38, where subindex j denotes technology-material categoryand subindex t denotes period.
(5.1) Patjt =∑
k 6=[1879−82]βk(Periodk × Cottonj) + αt + αj + εjt
38To analyze the data formally, I have a panel of 32 years for 62 technology-material categories.However, this panel structure presentsseveral challenges when applying standard econometric methods(see Hanlon, 2015, :83 for more details on these issues). Then following this author, I use a similaraggregation strategy. With this strategy, I deal with truncation problems in some technology seriesthat show zero patents in different years (although I am not able to eliminate all zero counts) andserial correlation errors that generate bias on the standard errors estimation (Bertrand, Duflo, andMullainathan, 2004). Actually, according to the table in appendix E.3 panel B, there is evidence ofserial correlation presence in the data that is partially solved when using this strategy. When applyinga Q-stat Born and Breitung (2016) biased corrected test to a yearly model similar to equation 5.1(column 1), I can reject the null hypothesis of no serial correlation of order 1 or 2. In contrast, Icannot reject the hypothesis using the 4-year aggregated data (column 2). However, the evidenceis ambiguous. Using the LM portmanteau test for serial correlation developed by Inoue and Solon(2006) there is some evidence of serial correlation in my model. With four years of aggregated data,I can eliminate some zeros in the series yet preserve time structure that I can use to test dynamicseffects.
THE EFFECT OF COLONIAL MARKETS AND TRADE ON INNOVATION 18
where Patjt is the count of patents and Cottonj is a dummy that takes the value ofone for technology categories related to cotton. αt and αj are time and technology-material fixed effects that capture any time-invariant category characteristics and anyaggregate time shock, and εjt is the error term. The key coefficients are βk that capturethe differential change between each period k39 and the baseline period (1879-82) in thenumber of cotton related patents relative to the change in non-cotton related patents.The identification assumption is that the number of cotton-related patents would havebehaved similarly to the number of non-cotton-related patents in the absence of marketintegration. I provide evidence that this assumption is plausible using the comparisonwith weak integration periods. I expect a zero effect since there was a gradual reductionin tariffs between the colonies and metropolis but not an effective integration becausecolonies were still allowed to trade with other foreign powers.
Figure 4. Cotton textile patents per category by stage production
Weak Int. Full Int. Lost Colonies
0.5
11.
52
2.5
3
Aver
age
Pate
nts
per C
ateg
ory
1880
1882
1884
1886
1888
1890
1892
1894
1896
1898
1900
1902
1904
1906
1908
1910
Weaving Other
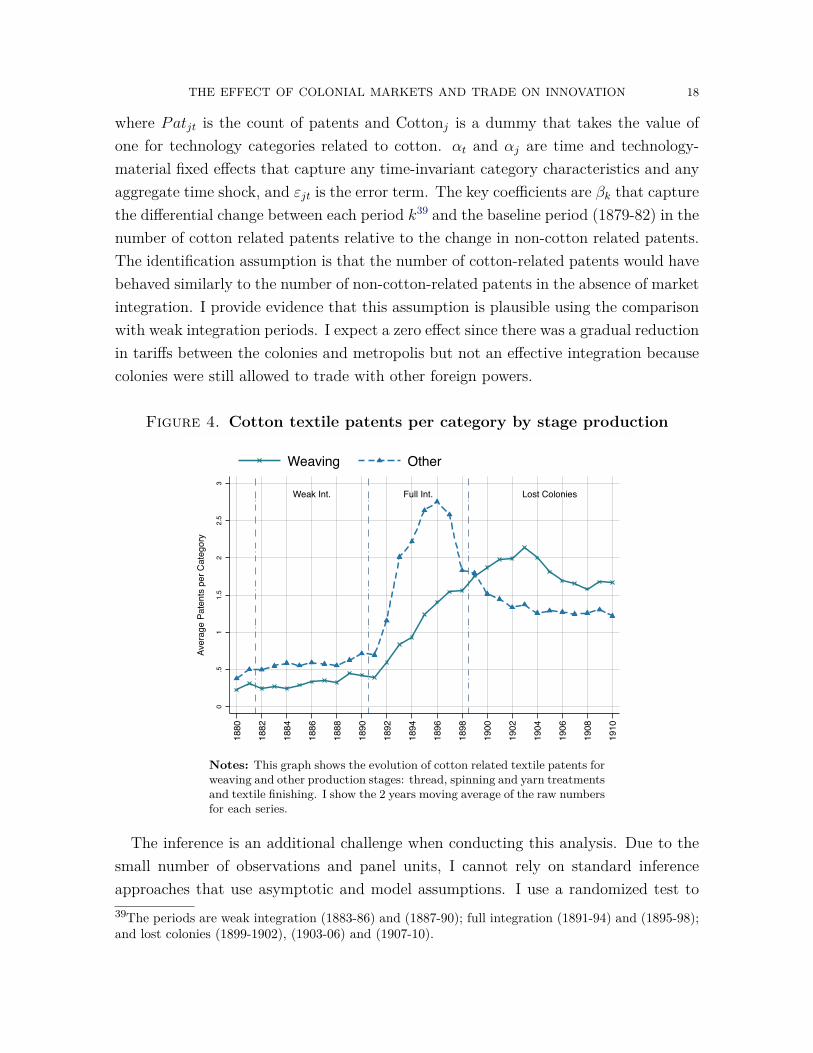
Notes: This graph shows the evolution of cotton related textile patents forweaving and other production stages: thread, spinning and yarn treatmentsand textile finishing. I show the 2 years moving average of the raw numbersfor each series.
The inference is an additional challenge when conducting this analysis. Due to thesmall number of observations and panel units, I cannot rely on standard inferenceapproaches that use asymptotic and model assumptions. I use a randomized test to39The periods are weak integration (1883-86) and (1887-90); full integration (1891-94) and (1895-98);and lost colonies (1899-1902), (1903-06) and (1907-10).
THE EFFECT OF COLONIAL MARKETS AND TRADE ON INNOVATION 19
derive significant conclusions. First, I randomly take one group in each technologycategory pair and treat it as a cotton-related technology. Second, I randomly shufflethe periods and treat them as the period assigned. I use 20,000 different realizationcombinations of these randomizations and estimated placebo coefficients. Under thenull distribution of no effect on cotton-related pattern and same time effect on bothmaterial categories, it does not mater how treatment and time are assigned. Anyof these randomization assignments would not change the observed outcomes 40. Iconstruct both p-values and confidence intervals to derive conclusions. To calculateconfidence intervals, I follow Garthwaite (1996) using an efficient search algorithm41.
The second main idea I investigate is the effect of lost colonial markets and furthercompetition in international markets on cotton industry innovation at the weavingstage. In this case, I exploit three variation dimensions: the existence of textile indus-tries that colonial market integration did not affect, the timing in which competition ininternational markets started after 1899, and the presence of 4 out of 31 technology cat-egories classified as weaving and looms. The approach is then a triple difference modelin which, besides the previous comparison, I exploit in the difference-in-differences ap-proach; I compare the additional effect on cotton-related textile patents at the weavingstage with other cotton-related patents at different stages.
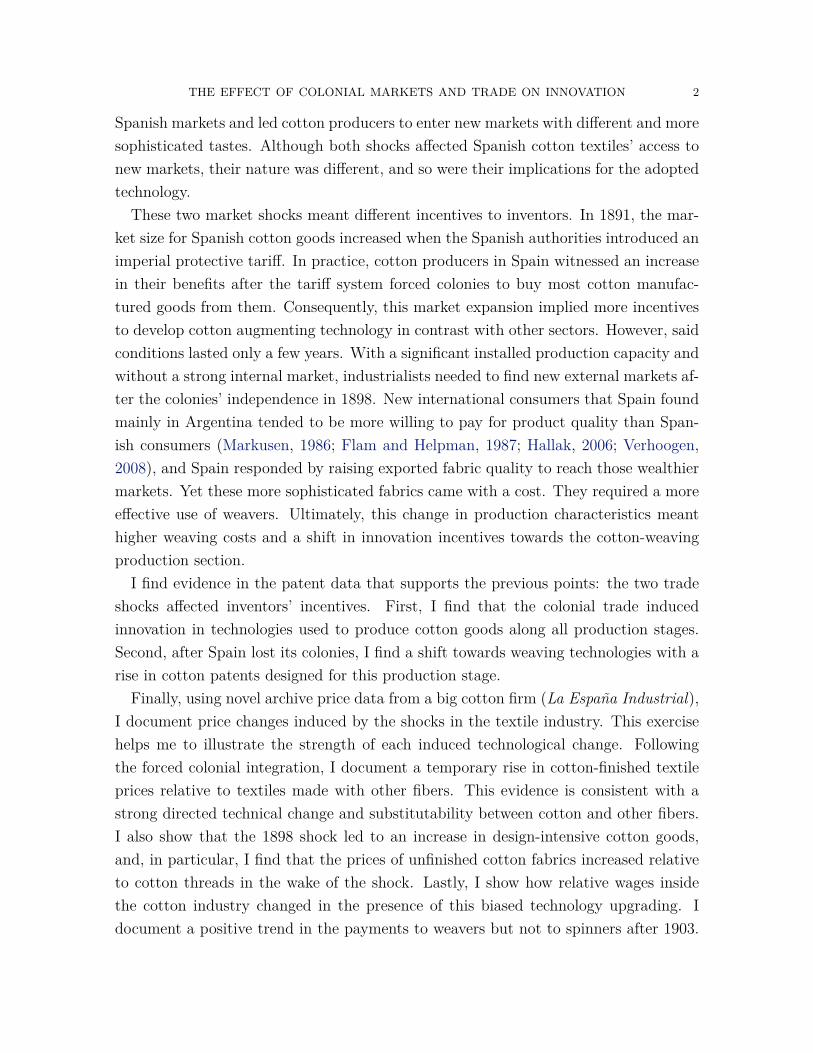
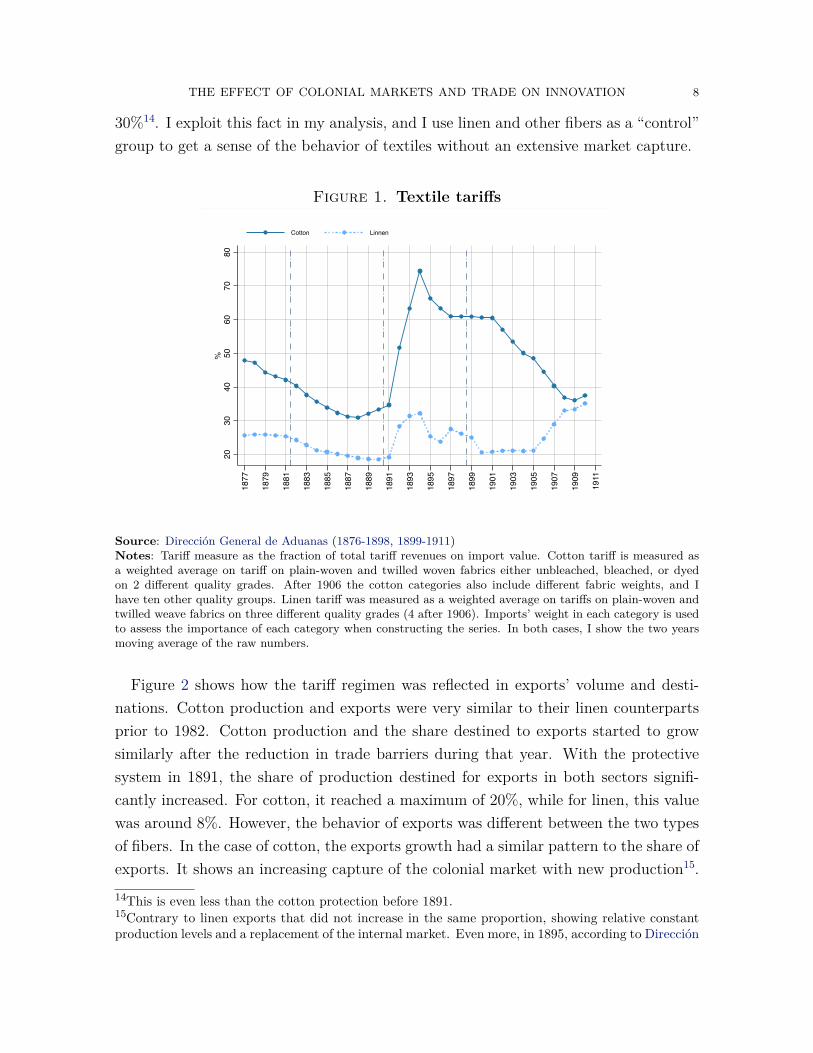
Figure 4 shows the average number of cotton-related patents per technology categorydisaggregated by textile production stage between 1878 and 1911. The number ofpatents in each one of the production stages remained relatively unchanged before themarket integration period, and the patents in all the categories started to grow after1891. However, after the colony lost in the 1898 war, the number of patents began todecrease in all production stages except for weaving. After the loss, patents at this stagecontinued growing, and the numbers never dropped below the level reached during the
40This is a similar approach used by Hanlon (2015). However, I also randomized over the period. Thisallowed me to test the hypothesis that differences in the pre-shock periods do not drive the estimatedeffects.41Randomization tests have the advantage of relying on few distributional assumptions, however find-ing CI is computationally costly. In theory, the calculation involves searching over a grid of possibletreatment effects using randomization distributions to calculate a p-value under the null hypothesisthat the treatment is equal to each value in the grid. Then the calculation involves choosing thelowest and highest value in the grid with a p-value of 0.05. Garthwaite (1996) proposed an efficientsearch process independently for each endpoint of the confidence interval. This procedure reduces thesearch dimensionality. Instead of using the whole randomization distribution for every single possibleeffect, the algorithm uses a single randomization in each search step. I follow the author’s suggestionsregarding the starting point and the length of the search.
THE EFFECT OF COLONIAL MARKETS AND TRADE ON INNOVATION 20
market integration period42. This is again consistent with theory predictions. It showsthat the effect observed during the market integration period on cotton-related patentsis exclusive to this period. During the lost colonies period, competition positivelyaffected international markets in cotton patents at the weaving stage.
I follow the same strategy as in the difference-in-differences model and aggregatethe data in 8 periods of 4 years43, and I estimate the following equation:
(5.2)
Patjt =∑
k 6=[1879−82]γ1k(Periodk × Cottonj) +
∑k 6=[1879−82]
γ2k(Periodk ×Weavej)
+∑
k 6=[1879−82]γ3k(Periodk ×Weavej × Cottonj) + αt + αj + εjt
Weavej is a dummy that takes the value of one for technology categories at the weavingstage of production. In this case, the key coefficients are γ1
k that capture the same effectas β1
k in equation 5.1 and γ3k that capture the differential change between period k and
the baseline period in the cotton related patents at the weaving production stage incomparison with other cotton production stages. The identification assumption is thatwithout the insertion of Spanish fabrics in international markets after the American-Spanish war, the difference between cotton patents and non-cotton patents for weavingwould have behaved in a similar way to the patents at different stages44. I evaluatethe plausibility of this assumption by looking at the coefficients for triple differencein the periods prior to 1998. I expect that without competition in the internationalmarket motivated by the loss of colonial markets, there is no effect on cotton patentsused in weaving technologies. Finally, for inference, I use the same approach as inthe previous model estimation. However, I add a third randomization. I randomlychose four technology groups out of the 31 technology groups and treated them asweaving technologies. Under the null distribution of no differential effect on weaving
42Figure D.4 shows this same disaggregation for non-cotton related patents. The behavior in theseindustries is different. The number of patents did not decrease after the American-Spanish war, andthey remained at the same level after the colonies’ independence.43Table E.4 shows that this aggregation seems to solve serial correlation found in the yearly model.When applying a Q-stat Born and Breitung (2016) biased corrected test to an annual model similarto equation 5.2 (column 1), I can reject the null hypothesis of no serial correlation of order 1 or 2.In contrast, I cannot reject at the 95% of confidence the hypothesis using the 4-year aggregated data(column 2). Using the LM portmanteau test for serial correlation developed by Inoue and Solon (2006)I achieve the same conclusion. I cannot reject at any level the hypothesis of no serial correlation.44Olden and Møen (2020) formalized the identification assumption for triple differences model andshowed that only one parallel trend assumption must hold to have a causal interpretation of thecoefficients.

THE EFFECT OF COLONIAL MARKETS AND TRADE ON INNOVATION 21
technologies, the assignation of these placebo categories is not relevant to the observedoutcome.
5.2. Results. I present equation 5.1 estimation in Figure 5. The results confirm theobservation in figure 3, in that there was an increase in the number of cotton patentsduring the market integration period in comparison with patents related to other fibers.During the period of incomplete market integration, before the protectionist tariff,point estimates move very close around zero. This result is in line with the theorywhere only under the complete integration there are enough incentives to change thedirection of the employed technology towards more expensive cotton textiles. Theresults are significant at the 95% confidence after the second half of the market inte-gration period45. According to these results, during the 1895-1898 period, there wereon average 13.5 more cotton-related patents per technology category when comparedwith non-cotton-related patents. The effect begins to fade, yet it remains significantduring the three periods after the American-Spanish war and the colonies’ loss46.
Figure 5. Event study: Effect market integration on cotton patentsFull Int. Lost ColoniesWeak Int.
-6.3
4-2
.84
.66
4.16
7.66
11.1
614
.66
18.1
621
.66
Coe
ffici
ent
1879-1882 1883-1886 1887-1890 1891-1894 1895-1898 1899-1902 1903-1906 1907-1910Period
Notes: This figure shows coefficients βk from regression 5.1. 95% Confidence Intervals usingrandomized inference. I followed the algorithm proposed by Garthwaite (1996) using 20.000randomization allocations. Total number of observations 496.
45Figure D.5 in the appendix shows the convergence path for the confidence interval estimation andthe distribution of placebo coefficients for each one of the coefficients plotted in Figure 3.46This pattern would evidence the path dependence on innovation (like the one theorized in Acemogluet al. (2012)) however, in the next section, I am going to evaluate this theory against the presence ofan additional effect due to the insertion of Spanish textiles in international markets.
THE EFFECT OF COLONIAL MARKETS AND TRADE ON INNOVATION 22
Figure 6 shows equation 5.2 estimation. Panel A shows the difference between cottonand non-cotton-related patents. This estimated difference is similar to the one observedin the previous results. Before the full integration period, the estimated difference isvery close to zero and is nonsignificant. During the market integration period, there isan increase in the number of cotton related patents, and it is significant at the 95%47.Actually, this point estimate is similar to the one found before. During the 1895-1898period, there were, on average, 11 more cotton-related patents per technology categorywhen compared with non-cotton-related patents. However, contrary to the previousresults, differences after the war are not significant and are approaching zero. Theseresults are against the theory of a strong path dependence on cotton textile innovation,at least in this setting.
Panel B shows an additional difference in cotton-related patents between patents atweaving production and other stages. The results confirm the observation in Figure4: The number of cotton patents designed for the weaving production stage increasedafter the war. Even more, there is no evidence of significant differences in cottonweaving patents prior to 1898. The coefficients are close to zero and are nonsignificant(although in period 1896-1898 the magnituede is considerable yet it is not significant).Four years after the 1898 crisis, there were, on average, 48 more patents used in thecotton weaving process. In the next period, the effect persisted around the samelevel (additional 33 patents), and it was significant. The protection of local marketsfor high-quality textiles cannot explain this behavior since the policy was introducedmuch later. My argument is that the insertion in international markets explains theseresults. With the entry into new markets, skilled weavers got scarcer, and firms neededto adopt technologies in the weaving sector.
5.3. Robustness. The previous results use a 4-year aggregation. However, my resultsare not driven by this specific estimation. I estimate a yearly panel from 1878 to1911 of the equation 5.2 in appendix figure D.7. In this case, due to the numberof years i estimate a more restrictive form including differential trends by technologycategory48. Finally due to the presence of serial correlation I a calculate Newey–Weststandard errors with a lag length of 3, based on Greene’s rule-of-thumb lag length ofT 1/4 rounded upwards. Also, because of the presence of cross-sectional dependence I
47See figure D.6 in the appendix for the detail of the placebo coefficients distribution and the conver-gence path of the confidence intervals estimation.48Exactly I estimate the following equation: Patjt =
∑k 6=[1881] γ
01k (Yeark × Cottonj) +∑
k 6=[1881] γ02k (Yeark×Weavej)+
∑k 6=[1881] γ
03k (Yeark×Weave×Cottonj)+
∑g∈Tech αg×t+αt+αj+εjt
where αg × t are the technology group differential trends

THE EFFECT OF COLONIAL MARKETS AND TRADE ON INNOVATION 23
Figure 6. Event study: Effect market integration and colonieslost on cotton and weaving patents
Full Int. Lost ColoniesWeak Int.
-5
0
5
10
15
20
Coe
ffici
ent
1879-1882 1883-1886 1887-1890 1891-1894 1895-1898 1899-1902 1903-1906 1907-1910Period
A. Cotton x ....
Full Int. Lost ColoniesWeak Int.
-18
-6
6
18
30
42
54
66
78
Coe
ffici
ent
1879-1882 1883-1886 1887-1890 1891-1894 1895-1898 1899-1902 1903-1906 1907-1910Period
B. Cotton x Weaving x ....
Notes: This figure presents the regression results from equation 5.2. Panel A shows γ1k coefficients and panel B
shows γ3k coefficients 95% Confidence Intervals using randomized inference. I followed the algorithm proposed
by Garthwaite (1996) using 20.000 randomization allocations. Total number of observations 496.
THE EFFECT OF COLONIAL MARKETS AND TRADE ON INNOVATION 24
include an estimation with double cluster standard errors at group and year levels49.Results do not change significantly. The estimated difference between cotton and
non-cotton patents is very close to zero before 1891. After this period, there was asignificant increase in the estimated difference until 1898, when the difference startedto decrease. However, the difference remained significant during some years after thecolonial markets lost. This is evidence of some small path dependence in innova-tion. When analyzing an additional effect on weaving patents, the estimated differencemoves around to zero before 1895. After that year, the number of weaving cottonpatents increased. This points to some anticipation effects, perhaps due to disruptionsin Cuba with the reactivation of the independence movement. This is consistent withthe historical evidence that accounts for growing concerns in Spain about the possi-ble US intervention, and the view of a possible lost of the colonies (Heraclides andDialla, 2017). Overall, this is reassuring on the previous analysis conclusions. First,the market integration motivated greater innovation in all cotton patents due to thechange towards a price determined in the integrated market. Second, the insertion inglobal markets (forced by the colonial markets that have lost) motivated an increasein weaving innovation to face the relative cost of the use of weavers.
The previous results might not capture the changes that the industry faced dueto the market integration between Spain and the colonies or the entrance of Spanishcotton manufacturers into the international markets. In particular, the effects capturedafter 1898 might be related to external forces in the international markets. First,the changes could be related to shocks on external innovating countries that tried toallocate production outside their national frontiers. To rule out this type of offshoringshock (theorized by Acemoglu, Gancia, and Zilibotti (2015)) I evaluate my results usingpatents registered only by Spanish residents (i.e., leaving out all patents registeredby foreign residents). Spanish patent law allowed ideas protection of non-residentindividuals if they plan to insert the technology in the country. Figure in appendix D.10shows the results when I estimate equation 5.2 using the patents originated in Spanishas a dependent variable. The graphs show that any type of shock that motivated capitalreallocation does not drive my main results since this new estimation does not changethe conclusions I arrived at before. Second, it might be the case that my results capturethe forces of new countries demanding new textiles after 1898. Indeed, during this sameperiod, Argentina experienced an economic boom that translated into a bigger demand
49Table E.4 shows the presence of some cross-sectional dependence between units. Pesaran’s test witha statistic of 5.3 and p-value of 0.
THE EFFECT OF COLONIAL MARKETS AND TRADE ON INNOVATION 25
for industrial goods50. To formally rule out the possibility that Argentina’s conditionsexplain my results, I estimate equation 5.2 controlling by Argentinian exports. I includea new set of variables that make the material-technology fixed effects interact with thetotal yearly import values in Argentina51. Appendix figure D.9 shows the results ofthis exercise. Again, the results’ behavior is the same as that of the original results.There is a positive increase in cotton weaving innovation that is significant during allthe periods after 1898. Then, I conclude that there are a few possibilities that someexternal shocks that occurred during the periods of the market integration or after thecolonial loss are contaminating my results.
Finally, no patent quality differences are driving my results. I use two approachesto control for the differential quality of the patent application. First, the Spanish lawrequired an inspection to corroborate that the applicant actually used the patent in-novation during the first two years after the application process. Figure D.11 in theappendix shows the results when I use only the counts of these high-quality patents,that is, patents that were used in the production of new goods. During the marketintegration period (especially during 1895-1898), high-quality cotton patents increasedcompared to non-cotton patents. However, the change in high-quality patents destinedfor cotton weaving started before the entry to global markets during the Cuban inde-pendence war (1895-1898). The difference remained stable around the same value inthe following periods: on average, nine more patents per technology category. Again,it seems that these are some of the anticipation effects. Even before the Spanish cot-ton fabrics entered a global market competition, there was an increase in high-qualitypatents directed to cotton fabric production. Second, the Spanish law allowed the in-troduction of innovation and ideas already used in other countries but not in Spain.Appendix figure D.10 shows the results when I exclude these types of patents, thatis, using only new ideas or innovations. New patents in cotton weaving also increasedafter 1898, showing that the implemented innovation was not just a copy of foreign
50Argentina became one of the most important markets for Spanish cotton fabrics. Between 1905 and1910 the Argentinean market represented 15% of total cotton exports far above other important mar-kets such as France (6.9%), Turkey (4.9%), Uruguay (4.7%) and Colombia (4%). However, economicconditions in Argentina started to improve several years before the American-Spanish war. By 1895the railroad system was already developed, and it connected several inland cities, and the importsvalues were high (see Fajgelbaum and Redding, 2021). That means that the Argentinean market wasalready available to Spanish producers by the end of the 19th century. Still, they did not activelylook to enter into the new market before the loss of colonial protected markets.51I estimate this new equation Patjt =
∑k 6=[1879−82] γ
1k(Periodk×Cottonj)+
∑k 6=[1879−82] γ
2k(Periodk×
Weavej) +∑k 6=[1879−82] γ
3k(Periodk ×Weavej ×Cottonj) + αt + αj + αj × ln(Arg Impt) + εjt, where
ln(Arg Impt) is the natural logarithm of import values in Argentina measured in constant Argentinepeso moneda nacional (source Direccion General de la Estadıstica de la Nacion, 1916)

THE EFFECT OF COLONIAL MARKETS AND TRADE ON INNOVATION 26
inventions. Overall, I can conclude that my main results are robust to different specifi-cations and account for high quality improvements in cotton textiles in all productionstages (between 1891 and 1898) and only in cotton fabrics after 1898.
6. Intermediate products prices
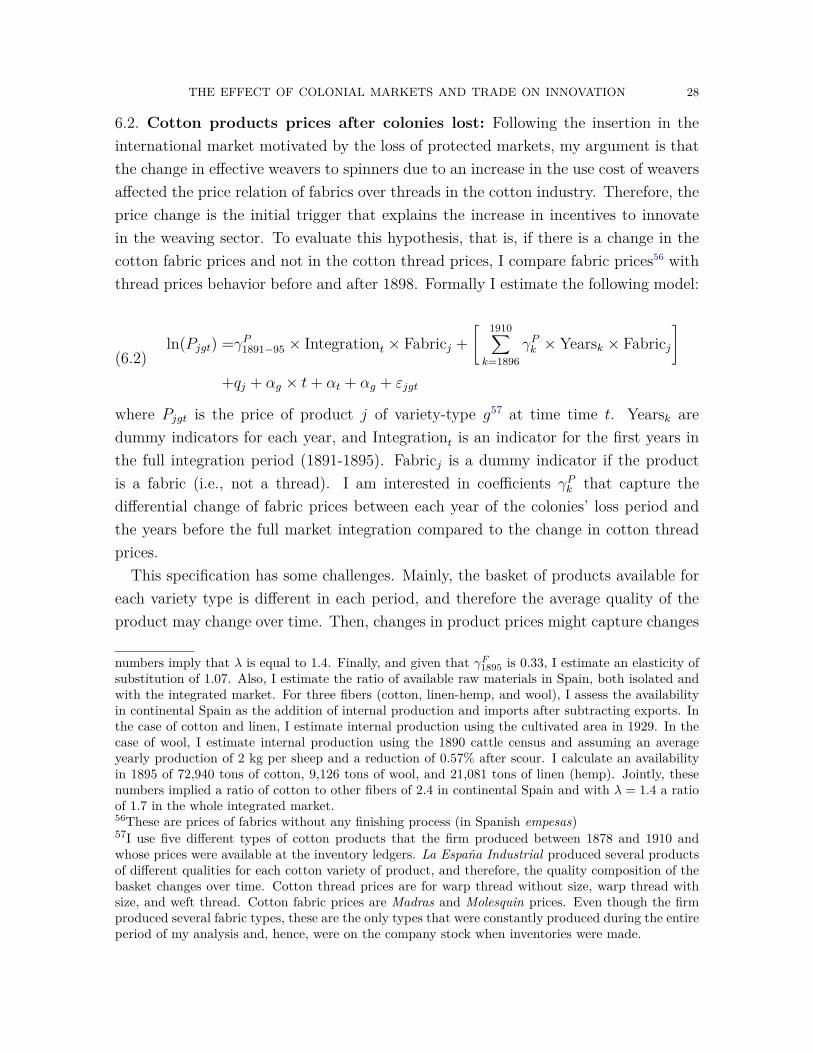
6.1. Finished textile prices after market integration: My argument is that thefull market integration between Spain and its colonial markets affected the relationbetween the price of finished cotton and other fiber fabrics. This is the mechanismthat explains the increase in innovation in the cotton sector. Once Spain exported itscotton manufactures production to their colonies, the price of this product increased inthe internal market and then the incentives on innovators to develop new mechanismsfor cotton textiles production also grew. To evaluate this hypothesis, I compare thebehavior of the price of a cotton finished fabric52 to the finished manufactures of linenand wool prices53. Formally I estimate the following model:
(6.1)ln(P F
jt ) =[ 1898∑k=1889
γFk × Yearsk × Cottonj]
+ γF99−10 × Colonies Lostt × Cottonj
+αj × t+ αt + αj + εjt
Where P Fjt is the textile price of material j at time t. Yearsk are dummy indicators for
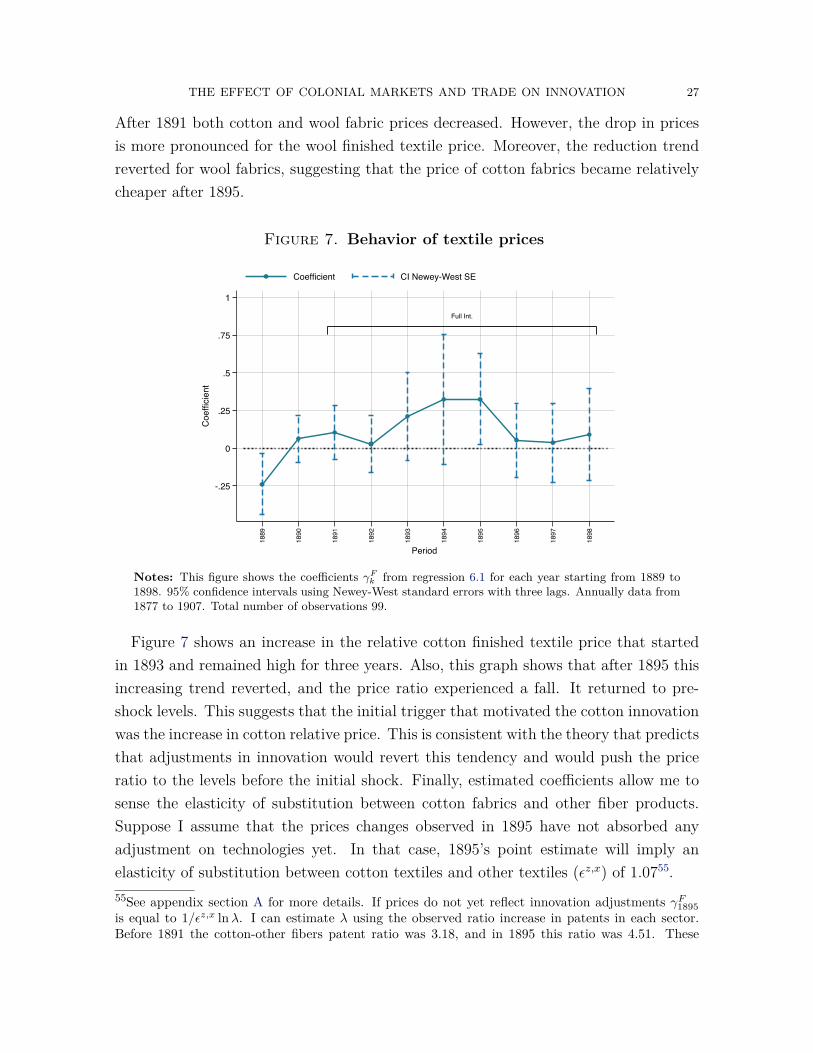
each year, and Colonies Lostt is an indicator for the years after the Spanish-Americanwar. Cottonj is a dummy indicator if the material of the textile is made from cotton. Iinclude a differential time trend in the regression since the prices of each material fabricpresented different trends before the market integration. I am interested in coefficientsγFk that captured changes in the cotton prices relative to other textiles, while comparingthe market integration years with the years before this shock54. I expect an increase incotton fabric prices after the integration period. However, with the adjustment of theinnovation, I expect these values to resume to pre-shock levels. Appendix figure D.12shows some evidence of this behavior, especially when comparing with wool prices.
52I use Percalina Lisa Superior price. The source of this information is the inventory ledgers of LaEspanna Industrial. This is the only fabric that the firm constantly produced between 1878 and 1907,and, therefore, when analyzing this price variety, I have fewer concerns about possible changes intextile quality.53Price is the average manufactures price for imported goods from England to Spain. The data wasgathered by Nadal Ferreras (1978) in pounds and converted to pesetas using historical exchange seriesprovided by Rodney Edvinsson. All prices are measured as constant pesetas per meter.54Including that the colonies lost dummy allows me to isolate the effect from the change coming tothe insertion of Spain in international markets.
THE EFFECT OF COLONIAL MARKETS AND TRADE ON INNOVATION 27
After 1891 both cotton and wool fabric prices decreased. However, the drop in pricesis more pronounced for the wool finished textile price. Moreover, the reduction trendreverted for wool fabrics, suggesting that the price of cotton fabrics became relativelycheaper after 1895.
Figure 7. Behavior of textile prices
Full Int.
-.25
0
.25
.5
.75
1
Coe
ffici
ent
1889
1890
1891
1892
1893
1894
1895
1896
1897
1898
Period
Coefficient CI Newey-West SE
Notes: This figure shows the coefficients γFk from regression 6.1 for each year starting from 1889 to1898. 95% confidence intervals using Newey-West standard errors with three lags. Annually data from1877 to 1907. Total number of observations 99.
Figure 7 shows an increase in the relative cotton finished textile price that startedin 1893 and remained high for three years. Also, this graph shows that after 1895 thisincreasing trend reverted, and the price ratio experienced a fall. It returned to pre-shock levels. This suggests that the initial trigger that motivated the cotton innovationwas the increase in cotton relative price. This is consistent with the theory that predictsthat adjustments in innovation would revert this tendency and would push the priceratio to the levels before the initial shock. Finally, estimated coefficients allow me tosense the elasticity of substitution between cotton fabrics and other fiber products.Suppose I assume that the prices changes observed in 1895 have not absorbed anyadjustment on technologies yet. In that case, 1895’s point estimate will imply anelasticity of substitution between cotton textiles and other textiles (εz,x) of 1.0755.55See appendix section A for more details. If prices do not yet reflect innovation adjustments γF1895is equal to 1/εz,x lnλ. I can estimate λ using the observed ratio increase in patents in each sector.Before 1891 the cotton-other fibers patent ratio was 3.18, and in 1895 this ratio was 4.51. These
THE EFFECT OF COLONIAL MARKETS AND TRADE ON INNOVATION 28
6.2. Cotton products prices after colonies lost: Following the insertion in theinternational market motivated by the loss of protected markets, my argument is thatthe change in effective weavers to spinners due to an increase in the use cost of weaversaffected the price relation of fabrics over threads in the cotton industry. Therefore, theprice change is the initial trigger that explains the increase in incentives to innovatein the weaving sector. To evaluate this hypothesis, that is, if there is a change in thecotton fabric prices and not in the cotton thread prices, I compare fabric prices56 withthread prices behavior before and after 1898. Formally I estimate the following model:
(6.2)ln(Pjgt) =γP1891−95 × Integrationt × Fabricj +
[ 1910∑k=1896
γPk × Yearsk × Fabricj]
+qj + αg × t+ αt + αg + εjgt
where Pjgt is the price of product j of variety-type g57 at time time t. Yearsk aredummy indicators for each year, and Integrationt is an indicator for the first years inthe full integration period (1891-1895). Fabricj is a dummy indicator if the productis a fabric (i.e., not a thread). I am interested in coefficients γPk that capture thedifferential change of fabric prices between each year of the colonies’ loss period andthe years before the full market integration compared to the change in cotton threadprices.
This specification has some challenges. Mainly, the basket of products available foreach variety type is different in each period, and therefore the average quality of theproduct may change over time. Then, changes in product prices might capture changes
numbers imply that λ is equal to 1.4. Finally, and given that γF1895 is 0.33, I estimate an elasticity ofsubstitution of 1.07. Also, I estimate the ratio of available raw materials in Spain, both isolated andwith the integrated market. For three fibers (cotton, linen-hemp, and wool), I assess the availabilityin continental Spain as the addition of internal production and imports after subtracting exports. Inthe case of cotton and linen, I estimate internal production using the cultivated area in 1929. In thecase of wool, I estimate internal production using the 1890 cattle census and assuming an averageyearly production of 2 kg per sheep and a reduction of 0.57% after scour. I calculate an availabilityin 1895 of 72,940 tons of cotton, 9,126 tons of wool, and 21,081 tons of linen (hemp). Jointly, thesenumbers implied a ratio of cotton to other fibers of 2.4 in continental Spain and with λ = 1.4 a ratioof 1.7 in the whole integrated market.56These are prices of fabrics without any finishing process (in Spanish empesas)57I use five different types of cotton products that the firm produced between 1878 and 1910 andwhose prices were available at the inventory ledgers. La Espana Industrial produced several productsof different qualities for each cotton variety of product, and therefore, the quality composition of thebasket changes over time. Cotton thread prices are for warp thread without size, warp thread withsize, and weft thread. Cotton fabric prices are Madras and Molesquin prices. Even though the firmproduced several fabric types, these are the only types that were constantly produced during the entireperiod of my analysis and, hence, were on the company stock when inventories were made.
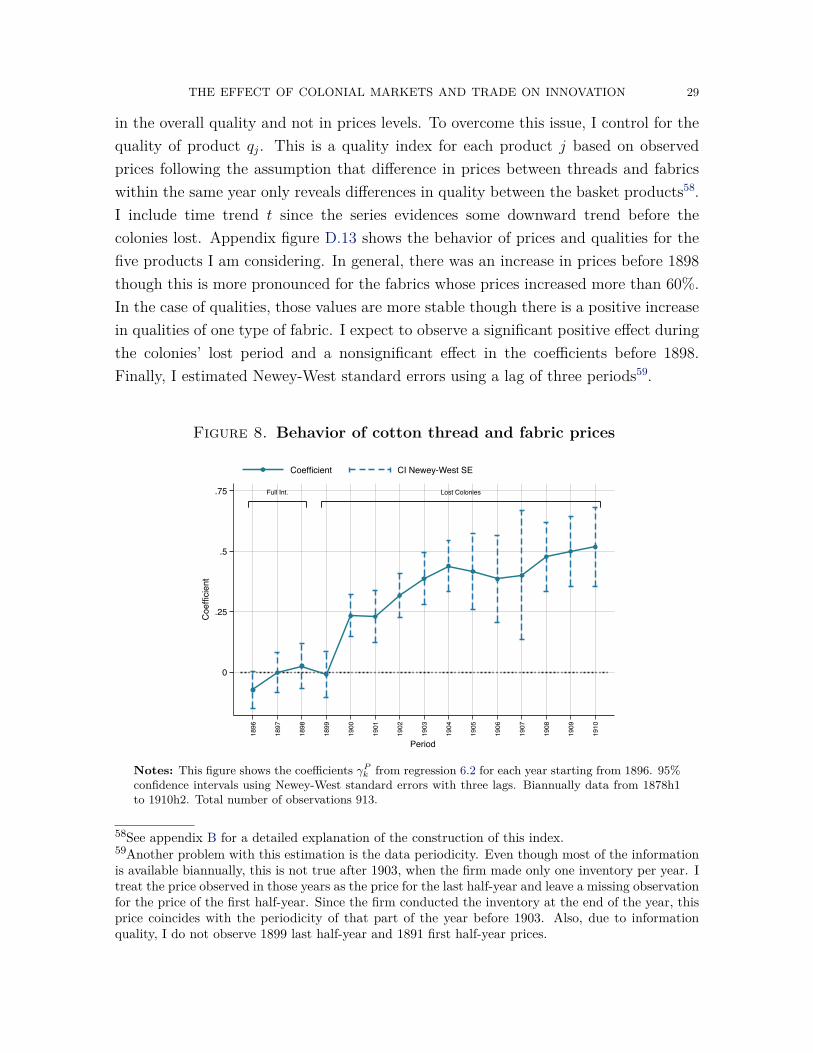
THE EFFECT OF COLONIAL MARKETS AND TRADE ON INNOVATION 29
in the overall quality and not in prices levels. To overcome this issue, I control for thequality of product qj. This is a quality index for each product j based on observedprices following the assumption that difference in prices between threads and fabricswithin the same year only reveals differences in quality between the basket products58.I include time trend t since the series evidences some downward trend before thecolonies lost. Appendix figure D.13 shows the behavior of prices and qualities for thefive products I am considering. In general, there was an increase in prices before 1898though this is more pronounced for the fabrics whose prices increased more than 60%.In the case of qualities, those values are more stable though there is a positive increasein qualities of one type of fabric. I expect to observe a significant positive effect duringthe colonies’ lost period and a nonsignificant effect in the coefficients before 1898.Finally, I estimated Newey-West standard errors using a lag of three periods59.
Figure 8. Behavior of cotton thread and fabric prices
Full Int. Lost Colonies
0
.25
.5
.75
Coe
ffici
ent
1896
1897
1898
1899
1900
1901
1902
1903
1904
1905
1906
1907
1908
1909
1910
Period
Coefficient CI Newey-West SE
Notes: This figure shows the coefficients γPk from regression 6.2 for each year starting from 1896. 95%confidence intervals using Newey-West standard errors with three lags. Biannually data from 1878h1to 1910h2. Total number of observations 913.
58See appendix B for a detailed explanation of the construction of this index.59Another problem with this estimation is the data periodicity. Even though most of the informationis available biannually, this is not true after 1903, when the firm made only one inventory per year. Itreat the price observed in those years as the price for the last half-year and leave a missing observationfor the price of the first half-year. Since the firm conducted the inventory at the end of the year, thisprice coincides with the periodicity of that part of the year before 1903. Also, due to informationquality, I do not observe 1899 last half-year and 1891 first half-year prices.
THE EFFECT OF COLONIAL MARKETS AND TRADE ON INNOVATION 30
Figure 8 shows that there are no significant changes in the relative prices duringthe metropolis-colonies integration. However, there was a substantial increase in pricesafter 1898. In particular, there is a jump in the difference after 1900. Furthermore,this increase remained stable and significant after that year. Although these resultsmight have some potential issues, as previously mentioned, there is some evidence ofan increase in relative prices that motivated the change towards weaving innovation.These results are consistent with the theory that predicts that the change remainseven after the adjustment of technology, suggesting a 25% increase in cotton weavingproduct price in relation to the period before the full market integration period.
6.3. Cotton workers’ wages after colonies lost: Finally, the relative cost of aworker in the cotton industry should also translate to a change in workers’ paymentswithin different production stages. The change in relative use cost between spinnersand weavers affected the relative demand for each type of worker and, then, salaries.My argument is that these two workers complement each other in the production ofcotton-finished textiles. Therefore, I hypothesize that this change translated into afinal increase in weavers’ wages even in the presence of endogenous changes in thesector’s innovation60.
Appendix section C shows this analysis. I show that there is a significant changein relative wages after 1898. Moreover, the increase in the wage ratio did not happenimmediately after the loss of colonial markets. Although it started to increase after1901, it is only significant after 1907. It is also interesting to note that point estimatesare smaller in this case when compared to the changes in relative prices of workers’ finalproducts. This is consistent with the two types of workers being complements and withthe biased technology theory. Two forces work together when determining the changein relative wages in the presence of innovation. First, the increase in the relative cost ofweaver translates into an increase in the price of the final product and, then, into thedemand of weavers. Second, once innovation adjusts, this change is mitigated by thechange in relative innovation in these sectors that pushed salaries down for the costlylabor sector. In fact, those two estimations allow me to get a sense of the elasticity ofsubstitution between weavers and spinners. If I assume that the changes observed in1901 do not reflect the adjustments on technology yet, these coefficients would suggest
60When the two goods complement each other, an increase in price translates into a more significantrelative demand for the costly worker, and at the same time it translates into a rise in the relativewage of these workers. This would not be the case if the two goods were substitutes. In this case, anincrease in prices translates into lower relative demand for the costly worker and, at the same time, areduction in relative wages.
THE EFFECT OF COLONIAL MARKETS AND TRADE ON INNOVATION 31
an elasticity of substitution (εh,l) of 0.24 and an implied increase of weavers’ cost dueto the entrance in new markets of 5.5%61.
7. Machines’ Acquisition
Next, I turn to installed capital and how innovation translated into a tangible adop-tion of new technologies. I look at the behavior of installed machines for differentprocesses in different industries and in the different regions. The hypothesis is that Ishould observe an increase in all machines dedicated to cotton during the 1891-1898period and an increase in loom installed after the 1898 war in comparison to other tex-tile sectors. Formally, I compare cotton machines with wool and linen machines usingthe following difference-in-differences model where subindex p denotes the province, mdenotes material, and subindex t denotes period.
(7.1)
Yptm =β1(Integrationt × Cottonm) + β2(Early lostt × Cottonm)
+β3(Late lostt × Cottonm) +[ ∑g∈Xp
∑k∈1879
γ′(g × Yearsk)]
+αm + αt + αp + εptm
Yptm is one type of the machines per 10.000 inhabitants, and Cottonm is a dummy thattakes the value of one if the machine is used in the cotton industry. Integrationt isa dummy that takes the value of one during the integration period. That is, for theyears 1893-94 and 1895-96, Early lostt is a dummy that takes the value of one afterthe colonies lost between 1900 and 1904 and Lost lostt is a dummy that takes thevalue of one after the colonies lost between 1905 and 1909. αm and αp are provinceand material fixed effects that capture any time-invariant category characteristics andαp aggregate time shock. A province with cotton industry is different from provinceswith other industries. Therefore, I combined the province characteristics measure in1877 (Xp) with the time fixed effects to control for differential trends by each one ofthose attributes. εjt is the error term that I cluster at the province-year level, that isI control for correlation between industries in the same province at the same year62.
61See appendix sections A for more details. Without a technology adjustment γW1901 is equal to(1− εl,h
εl,h
)ln(φ1901h
φ1882h
). With the same assumption γP1901 is equal to
(1εl,h
)ln(φ1901h
φ1882h
). Using these
two conditions I can compute the elasticity of substitution εl,h as 1− γW1901/γP1901 that is 1− 0.17/0.23
and the change in the relative cost as %∆φh = exp(εh,l ∗ γP1901)− 162I only have a small number of provinces (45 provinces). Therefore, I followed Imbens and Kolesar(2016) and I calculated HC2 standard errors tested against a t-distribution.
THE EFFECT OF COLONIAL MARKETS AND TRADE ON INNOVATION 32
The key coefficients are β1, β2 and β3 that capture the differential change in machinesbetween each period and the baseline period 187963.
Table 1 presents the empirical estimates of the equation model 7.1 for machinesused at the weaving stage. I compare cotton machines with machines in other textilesectors. Panel A shows the effect on machines per 10.000 inhabitants: either mechanicallooms, manual looms, or jacquard looms64.Odd columns compare against the behaviorof wool and linen machines, while even columns compare only with the wool industry.The purpose of this is to have robustness and compare the cotton industry with oneindustry that has no significant presence in the colonies (wool). This table revealsa positive effect on the capital installed at the weaving stages in all three differentperiods. All three point estimates are similar. For instance, according to them, therewere, on average around ten more mechanical looms per 10,000 inhabitants duringthe colonial-metropolis integration period. After the colonial market lost, the positiveeffect was also present. There was an increase of jacquard looms of around 0.84 cottonlooms each year after the war. When analyzing the behavior of manual looms, I do notobserve a differential effect. This shows that technical change helped the industry’smechanization. Finally, when comparing only with the wool industry, these resultsare robust. I reach the same conclusions: the results are consistent with innovationfindings, and they show that the increase in patents at the weaving stage translatedinto more mechanical and jacquard looms working on cotton fabric production.
Panel B in this table evaluates if an increase in firms using new technologies drivesthe previous findings. Columns 7 and 8 reveal an increase in firms that reported andpaid taxes on mechanical looms after 1891. This rise explains the increase in thenumber of installed looms. That means that in order to increase competitiveness,firms chose to change looms technology. On the other hand, there are no changes inthe firms reporting jacquard looms, which suggests that in this case, an existing firmwith those technologies would introduce more of those types of looms. Finally, whilethere are no changes in the reported manual looms, there seems to be a positive effecton firms reporting this type of technology which suggests that existing manual loomswere acquired for other firms and technology was not totally discarded. Overall, I canconclude that the positive effect on patent applications tended to correspond to theintroduction of new looms.63Again, the standard identification applies here. Without the market integration and the entry toglobal markets, the machines used to create cotton textiles would have behaved similarly to wool andlinen machines.64This type of technology has its own classification: patterns cards or chains and punching of cards.Jacquard looms include both manual and mechanical looms.
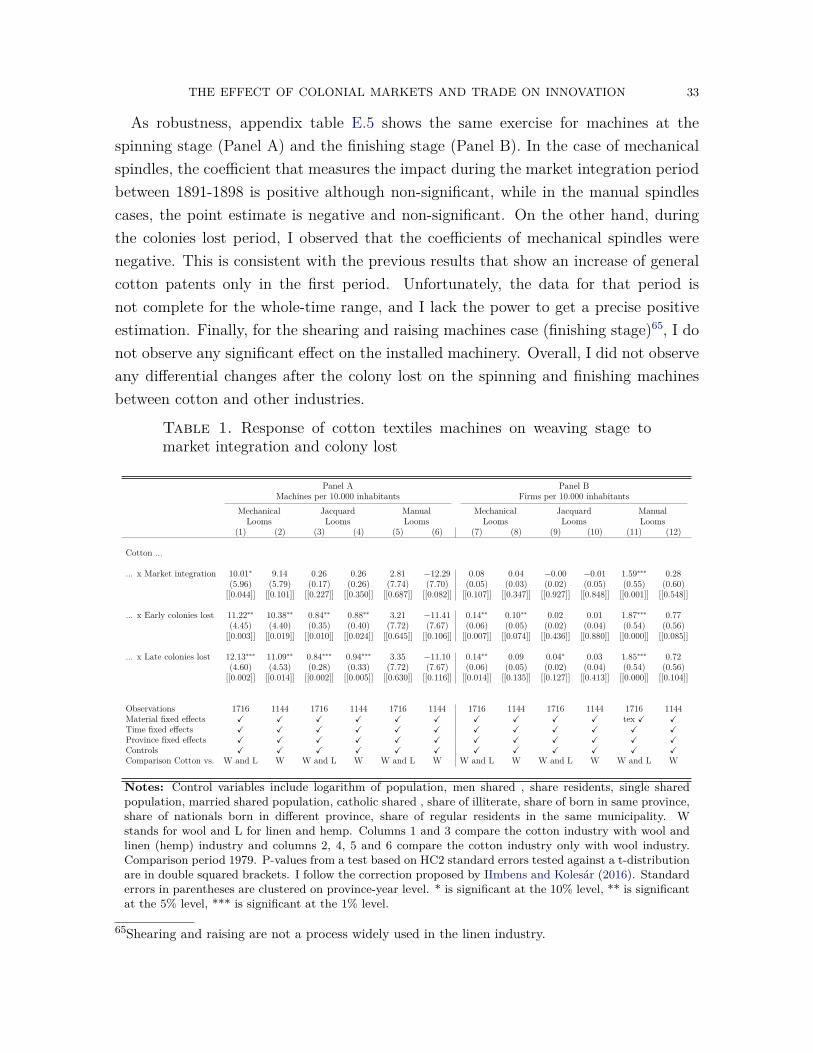
THE EFFECT OF COLONIAL MARKETS AND TRADE ON INNOVATION 33
As robustness, appendix table E.5 shows the same exercise for machines at thespinning stage (Panel A) and the finishing stage (Panel B). In the case of mechanicalspindles, the coefficient that measures the impact during the market integration periodbetween 1891-1898 is positive although non-significant, while in the manual spindlescases, the point estimate is negative and non-significant. On the other hand, duringthe colonies lost period, I observed that the coefficients of mechanical spindles werenegative. This is consistent with the previous results that show an increase of generalcotton patents only in the first period. Unfortunately, the data for that period isnot complete for the whole-time range, and I lack the power to get a precise positiveestimation. Finally, for the shearing and raising machines case (finishing stage)65, I donot observe any significant effect on the installed machinery. Overall, I did not observeany differential changes after the colony lost on the spinning and finishing machinesbetween cotton and other industries.
Table 1. Response of cotton textiles machines on weaving stage tomarket integration and colony lost
Panel A Panel BMachines per 10.000 inhabitants Firms per 10.000 inhabitants
Mechanical Jacquard Manual Mechanical Jacquard ManualLooms Looms Looms Looms Looms Looms
(1) (2) (3) (4) (5) (6) (7) (8) (9) (10) (11) (12)
Cotton ...
... x Market integration 10.01∗ 9.14 0.26 0.26 2.81 −12.29 0.08 0.04 −0.00 −0.01 1.59∗∗∗ 0.28(5.96) (5.79) (0.17) (0.26) (7.74) (7.70) (0.05) (0.03) (0.02) (0.05) (0.55) (0.60)
[[0.044]] [[0.101]] [[0.227]] [[0.350]] [[0.687]] [[0.082]] [[0.107]] [[0.347]] [[0.927]] [[0.848]] [[0.001]] [[0.548]]
... x Early colonies lost 11.22∗∗ 10.38∗∗ 0.84∗∗ 0.88∗∗ 3.21 −11.41 0.14∗∗ 0.10∗∗ 0.02 0.01 1.87∗∗∗ 0.77(4.45) (4.40) (0.35) (0.40) (7.72) (7.67) (0.06) (0.05) (0.02) (0.04) (0.54) (0.56)
[[0.003]] [[0.019]] [[0.010]] [[0.024]] [[0.645]] [[0.106]] [[0.007]] [[0.074]] [[0.436]] [[0.880]] [[0.000]] [[0.085]]
... x Late colonies lost 12.13∗∗∗ 11.09∗∗ 0.84∗∗∗ 0.94∗∗∗ 3.35 −11.10 0.14∗∗ 0.09 0.04∗ 0.03 1.85∗∗∗ 0.72(4.60) (4.53) (0.28) (0.33) (7.72) (7.67) (0.06) (0.05) (0.02) (0.04) (0.54) (0.56)
[[0.002]] [[0.014]] [[0.002]] [[0.005]] [[0.630]] [[0.116]] [[0.014]] [[0.135]] [[0.127]] [[0.413]] [[0.000]] [[0.104]]
Observations 1716 1144 1716 1144 1716 1144 1716 1144 1716 1144 1716 1144Material fixed effects X X X X X X X X X X tex X XTime fixed effects X X X X X X X X X X X XProvince fixed effects X X X X X X X X X X X XControls X X X X X X X X X X X XComparison Cotton vs. W and L W W and L W W and L W W and L W W and L W W and L W
Notes: Control variables include logarithm of population, men shared , share residents, single sharedpopulation, married shared population, catholic shared , share of illiterate, share of born in same province,share of nationals born in different province, share of regular residents in the same municipality. Wstands for wool and L for linen and hemp. Columns 1 and 3 compare the cotton industry with wool andlinen (hemp) industry and columns 2, 4, 5 and 6 compare the cotton industry only with wool industry.Comparison period 1979. P-values from a test based on HC2 standard errors tested against a t-distributionare in double squared brackets. I follow the correction proposed by IImbens and Kolesar (2016). Standarderrors in parentheses are clustered on province-year level. * is significant at the 10% level, ** is significantat the 5% level, *** is significant at the 1% level.
65Shearing and raising are not a process widely used in the linen industry.
THE EFFECT OF COLONIAL MARKETS AND TRADE ON INNOVATION 34
8. conclusion
This paper used two natural experiments to illustrate the effects of internationaltrade on technological progress direction. Indeed, I show that gaining access to foreignmarkets had different consequences in the Spanish textile industry at the end of the19th century. I found that the demand features play a significant role when identifyingthe consequences of output shocks. While privileged access to colonial markets createdincentives to develop cotton augmenting technologies, competitive access to more so-phisticated markets, due to the colonies’ independence, created incentives to developcotton-weaving augmenting technology.
This is the first paper that explores the effects of output shocks in the direction oftechnical change. I filled the gap in the literature that has focused its efforts on theanalysis of input shocks. I argue that while input shocks are alike, output shocks areunique in their own way. Thus, the answer about to how much openness to trade affectsthe development of new technologies depends on demand features and characteristicsof the new markets. Although the findings from this specific event in the history ofthe Spanish industry do not provide a unique answer about the effects of trade, theylight up the transforming mechanisms behind commerce. This point suggests that forto understand the consequences of opening and closing to foreign markets, it is alsocrucial to understand each policy’s features in their particular context.
My findings also suggest that one crucial benefit source for European empires wastrade with their colonies. My results suggest one possible explanation of the industri-alization in Western Europe during the 18th and 19th centuries in that it resides inimportant structural transformations that colonial relationships incentivized. To doso, then it is important to ununderstandthe mechanism effects through which tradeshock improves other sectors. Given that the cotton textile industry was one of thefirst industrialized industries and the driver of industrial transformation, it may be thatother economic sectors were also beneficiaries of trade shocks. The spillover effects oftrade shocks and the new technology developed after trade is a road for future work.A deeper understanding of innovation clusters and the importance of agglomerationeconomies in knowledge is important to comprehend possible multiplicative effects oftrade on economic growth.
THE EFFECT OF COLONIAL MARKETS AND TRADE ON INNOVATION 35
References
Acemoglu, D. 2002. “Directed technical change.” Review of Economic Studies 69:781–809.
Acemoglu, D., P. Aghion, L. Bursztyn, and D. Hemous. 2012. “The Environment andDirected Technical Change.” American Economic Review 102:131–66.
Acemoglu, D., G. Gancia, and F. Zilibotti. 2015. “Offshoring and Directed TechnicalChange.” American Economic Journal: Macroeconomics 7:84–122.
Acemoglu, D., S. Johnson, and J. Robinson. 2005. “The Rise of Europe: AtlanticTrade, Institutional Change, and Economic Growth.” American Economic Review95:546–579.
Aghion, P., A. Dechezlepretre, D. Hemous, R. Martin, and J. Van Reenen. 2016. “Car-bon Taxes, Path Dependency, and Directed Technical Change: Evidence from theAuto Industry.” Journal of Political Economy 124:1–51.
Allen, R.C. 2009. The British Industrial Revolution in Global Perspective. New Ap-proaches to Economic and Social History, Cambridge University Press.
—. 2011. “Why the industrial revolution was British: commerce, induced invention,and the scientific revolution.” The Economic History Review 64:357–384.
Atkin, D., A. Khandelwal, and A. Osman. 2017. “Exporting and Firm Performance:Evidence from a Randomized Experiment.” The Quarterly Journal of Economics132:551–615.
Bastos, P., and J. Silva. 2010. “The quality of a firm’s exports: Where you export tomatters.” Journal of International Economics 82:99–111.
Bastos, P., J. Silva, and E. Verhoogen. 2018. “Export Destinations and Input Prices.”American Economic Review 108:353–92.
Beckert, S. 2015. Empire of cotton: a global history. Alfred A. Knopf.Bertrand, M., E. Duflo, and S. Mullainathan. 2004. “How much should we trust
differences-In-differences estimates?*.” The Quarterly Journal of Economics 119:249–275.
Born, B., and J. Breitung. 2016. “Testing for serial correlation in fixed-effects paneldata models.” Econometric Reviews 35:1290–1316.
Bustos, P. 2011. “Trade Liberalization, Exports, and Technology Upgrading: Evidenceon the Impact of MERCOSUR on Argentinian Firms.” The American EconomicReview 101:304–340.
Butel, P., and F. Crouzet. 1998. “Empire and Economic Growth: the Case of 18thCentury France.” Revista de Historia Economica / Journal of Iberian and LatinAmerican Economic History 16:177–193.
Carreras, A. 2006. “Industria.” In A. Carreras and X. Tafunell, eds. Estadısticashistoricas de Espana: siglo XIX-XX . vol. 1, pp. 357–454.
Comın, F. 2018. “La corrupcion permanente: El fraude fiscal en Espanna.” HispaniaNova 16:481–521.
Crozet, M., K. Head, and T. Mayer. 2011. “Quality Sorting and Trade: Firm-levelEvidence for French Wine.” The Review of Economic Studies 79:609–644.
Davis, L.E., and R.A. Huttenback. 1986. Mammon and the pursuit of empire; Thepolitical economy of British imperialism, 1860–1912 . Cambridge University Press.

THE EFFECT OF COLONIAL MARKETS AND TRADE ON INNOVATION 36
—. 1982. “The Political Economy of British Imperialism: Measures of Benefits andSupport.” The Journal of Economic History 42:119–130.
Davis, R. 1973. The rise of the atlantic economies. Cornell University Press.Direccion General del Instituto Geografico y Estadıstico. 1877. “Censo de la poblacion
de Espana.” Madrid. https://www.ine.es/inebaseweb/treeNavigation.do?tn=192225.
Direccion General de Aduanas. 1876-1898. “Estadstica general del comercio exterior deEspana con sus posesiones de ultramar y potencias extranjeras en...”
—. 1899-1911. “Estadstica general del comercio exterior de Espana en ...”Direccion General de Contribuciones. 1879. “Estadstica administrativa de la con-
tribucion industrial y de comercio.”—. 1893-1894. “Estadstica administrativa de la contribucion industrial y de comercio.”—. 1895-1896. “Estadstica administrativa de la contribucion industrial y de comercio.”—. 1900-1909. “Estadstica administrativa de la contribucion industrial y de comercio.”Direccion General de Hacienda. 1894-1895. “Estadstica general del comercio la isla de
Cuba ...”Direccion General de la Estadıstica de la Nacion. 1916. “Extracto estadıstico de la
republica Argentina.”Domenech, J. 2008. “Labour market adjustment a hundred years ago: the case of the
Catalan textile industry, 1880–19131.” Economic History Review 61:1–25.Fajgelbaum, P., and S.J. Redding. 2021. “Trade, Structural Transformation and De-
velopment: Evidence from Argentina 1869-1914.” NBER Working Papers No. 20217,National Bureau of Economic Research, Inc.
Findlay, R. 1990. The ’triangular trade’ and the Atlantic economy of the eighteenth cen-tury : a simple general-equilibrium model.. Essays in international finance ; no.177,Princeton,N.J.: Princeton University.
Flam, H., and E. Helpman. 1987. “Vertical Product Differentiation and North-SouthTrade.” The American Economic Review 77:810–822.
Gancia, G., and A. Bonfiglioli. 2008. “North-South trade and directed technicalchange.” Journal of International Economics 76:276–295.
Gancia, G., and F. Zilibotti. 2009. “Technological change and the wealth of nations.”Annual Review of Economics 1:93–120.
Garthwaite, P.H. 1996. “Confidence intervals from randomization tests.” Biometrics52:1387–1393.
Gimenez y Guited, F. 1862. Guıa fabril e industrial de Espana Ano 1862.. Librerıa delPlus Ultra.
Grossman, G., and E. Helpman. 1991. Innovation and growth in the global economy..The MIT Press.
Gorg, H., L. Halpern, and B. Murakozy. 2017. “Why do within-firm–product exportprices differ across markets? Evidence from Hungary.” The World Economy 40:1233–1246.
Hallak, J.C. 2006. “Product quality and the direction of trade.” Journal of InternationalEconomics 68:238–265.
THE EFFECT OF COLONIAL MARKETS AND TRADE ON INNOVATION 37
Hanlon, W.W. 2015. “Necessity is the mother of invention: Input supplies and directedtechnical change.” Econometrica 83:67–100.
Heraclides, A., and A. Dialla. 2017. Humanitarian intervention in the long nineteenthcentury: Setting the precedent. Manchester, England: Manchester University Press.
Imbens, G., and M. Kolesar. 2016. “Robust Standard Errors in Small Samples: SomePractical Advice.” The Review of Economics and Statistics 98:701–712.
Inikori, J. 2002. Africans and the Industrial Revolution in England: A Study in Inter-national Trade and Economic Development. ACLS Humanities E-Book, CambridgeUniversity Press.
Inoue, A., and G. Solon. 2006. “A portmanteau test for serially correlated errors infixed effects models.” Econometric Theory 22:835–851.
Juhasz, R. 2018. “Temporary Protection and Technology Adoption: Evidence from theNapoleonic Blockade.” American Economic Review 108:3339–76.
Lileeva, A., and D. Trefler. 2010. “Improved access to foreign markets reaises plant-levelproductivity... for some plants.” The Quarterly Journal of Economics 125:1051–2099.
Manova, K., and Z. Yu. 2017. “Multi-product firms and product quality.” Journal ofInternational Economics 109:116–137.
Markusen, J. 1986. “Explaining the Volume of Trade: An Eclectic Approach.” AmericanEconomic Review 76:1002–11.
Marshall, A. 1890. The Principles of Economics. McMaster University Archive for theHistory of Economic Thought.
Martin, J. 2012. “Markups, quality, and transport costs.” European Economic Review56:777–791.
Martın, M. 2018. “El algodon de Motril y la industria algodonera catalana.” Revistasde Estudios Regionales 111:217–242.
Ministerio de Agricultura, Pesca y Alimentacion. 1929-1935. “Anuario de estadısticaagraria ...”
Moreno Lazaro, J. 2015. “El fraude en el pago de la contribucion industrial y de com-ercio en Espana: el caso de los harineros, 1845-1907.” Investigaciones De HistoriaEconomica 15:165–176.
Nadal, J. 1975. El fracaso de la revoluciıon indsutrial en Espana, 1814-1913 . EditorialAriel.
—. 1987. “La industria fabril espanola en 1900 Una aproximacion.” In J. Nadal, C. Su-dria, and A. Carreras, eds. La economıa espanola en el siglo xx.. Editorial Ariel, pp.23–61.
Nadal, J., and C. Sudria. 1993. “La controversia en torno al atraso economico espanol enla segunda mitad del siglo XIX (1860-1913).” Revista de Historia Industrial 17:199–224.
Nadal Ferreras, J. 1978. Comercio exterior y subdesarrollo. Espana y Gran Bretanade 1772 a 1914: Polıtica economica y relaciones comerciales. Instituto de EstudiosFiscales.
O’Brien, P.K., and L.P.d.l. Escosura. 1998. “The Costs and Benefits for Europeansfrom their Empires Overseas.” Revista de Historia Economica / Journal of Iberianand Latin American Economic History 16:29–89.
THE EFFECT OF COLONIAL MARKETS AND TRADE ON INNOVATION 38
Olden, A., and J. Møen. 2020. “The Triple Difference Estimator.” Unpublished, https://ssrn.com/abstract=3582447.
Popp, D. 2002. “Induced Innovation and Energy Prices.” American Economic Review92:160–180.
Rivera-Batiz, L.A., and P.M. Romer. 1991. “International trade with endogenous tech-nological change.” European Economic Review 35:971–1001.
Roses, J.R. 2009. “Subcontracting and vertical integration in the Spanish cotton in-dustry.” The Economic History Review 62:45–72.
Sabete-Sort, M. 1995. “La impronta industrial de la reforma arancelaria de 1906.”Revista de Historia Industrial 17:81–117.
Saız, P. 2014. “Did patents of introduction encourage technology transfer? Long-termevidence from the Spanish innovation system.” Cliometrica, pp. 49–78.
—. 1995. Propiedad industrial y revolucion liberal. Oficina Espanola de Patentes yMarcas.
Saız, P., F. Llorens, L. Blazquez, and F. Cayon. 2008. “Base de datos de solicitudes depatentes (Espana, 1878-1939).” OEPM-UAM, Madrid. http://historico.oepm.es.
Smith, A. 1776. An Inquiry into the Nature and Causes of the Wealth of Nations.McMaster University Archive for the History of Economic Thought.
—. 1991. “Social Conflict and Trade-Union Organisation in the Catalan Cotton TextileIndustry, 1890–1914.” International Review of Social History 36:331–376.
Sudria, C. 1983. “La exportacion en el desarrollo de la industria algodonera espanola,1875-1920.” Revista de Historia Econonimca 2:369–386.
Verhoogen, E.A. 2021. “Firm-level upgrading in developing countries.” Un-published, https://cdep.sipa.columbia.edu/sites/default/files/cdep/WP83Verhoogen.pdf.
—. 2008. “Trade, Quality Upgrading, and Wage Inequality in the Mexican Manufac-turing Sector*.” The Quarterly Journal of Economics 123:489–530.
Williams, E. 1944. Capitalism and slavery. Univ. of North Carolina Press.Zanetti, O. 1998. “En camino al 98: Canovas y el problema economico de cuba (1878-
1881).” Revista de Indias LVIII:195–213.—. 2013. Historia minima de Cuba. El colegio de Mexico.
THE EFFECT OF COLONIAL MARKETS AND TRADE ON INNOVATION i
ONLINE APPENDIX
Appendix A. Two models of Trade and Innovation
A.1. Cotton and other fibers textiles. In this section I show a model of innovationbetween two sectors: cotton textile and other fibers textiles.
A.1.1. Set up and assumptions. There is an unique final produced good (apparel),produced competitively using cotton textiles (Yz) and other textiles (Yx) as inputs,according to the following aggregate production function
Yf =[Y
ε−1εz,xz + Y
εz,x−1εz,x
x
] εz,x
εz,x−1
(A.1)
where εz,x ∈ (0,+∞) is the elasticity of substitution between the two inputs. Then theproducers of textiles k ∈ {Z,X} maximize their production Yk under a regular inputsconstraint giving the relative demand function:
PzPx
=(YzYx
)− 1εz,x
(A.2)
Where Pz and Px are the prices of the two textiles66. Textiles Yz and Yx are producedusing a continuum of sector specific intermediates (yz(i) and yx(i) respectively). WhereAz and Ax is the measure of machines and innovation in each sector67.
Yz = Ez
[ ˆ Az
0yz(i)αdi
] 1α
and Yx = Ex
[ ˆ Ax
0yx(i)αdi
] 1α
(A.3)
Both textile producers sell in competitive markets and they maximize profits takingintermediate goods prices pz(i) and px(i) as given. This gives the following demandsfunctions for each intermediate good
yz(i) = Yz
(A2α−1z
pz(i)
) 11−α
and yx(i) = Yx
(A2α−1x
px(i)
) 11−α
(A.4)
and the following relative demand equation
yz(i)yz(j)
=(pz(j)pz(i)
) 11−α
and yx(i)yx(j)
=(px(j)px(i)
) 11−α
(A.5)
The production function for each intermediate input is linear in the type of materialemployed ( yz(i) = Z(i)
φzand yx(i) = X(i)
φx. Where φz and φx measure the cost in terms
of the material needed to produce the intermediate good. This production is subject toresource constraints
´ Az0 z(i)di ≤ Z and
´ Ax0 x(i)di ≤ X. The intermediate good sector
66Yf is the numeraire.67Terms Ez ≡ (Az)
2α−1α and Ex ≡ (Ax) 2α−1
α are two externality terms that assures the existence of abalanced-growth path.
THE EFFECT OF COLONIAL MARKETS AND TRADE ON INNOVATION ii
is monopolistic since the producer owns a patent for this product. The monopolistface a demand curve with the constant price elasticity 1/1 − α and the optimal pricein each sector is:
pz(i) = wzφzα
and px(i) = wxφxα
(A.6)
Where wz and wx is the price of each raw material Z and X. This implies that theprofits of these firms is equal to a fraction (1− α) of the total sales
πz(i) = (1− α)pz(i)z(i)φz
and πx(i) = (1− α)px(i)x(i)φx
(A.7)
Using the market clearing conditions on the raw materials I can write the productionfunction as Yz = AzZ
φzand Yx = AxX
φx. Using these equations in the relative demand
function (A.2) I found the relative price function equation
p ≡ PzPx
=(AzZ
AxX
φxφz
)− 1εz,x
(A.8)
Using (A.4) I can rewrite intermediate prices as PzAz = pz(i) and PxAx = px(i) andthe relative profits of monopolistic in each sector as
πz(i)πx(i)
= pz(i)z(i)px(i)x(i)
φxφz
=(AxAz
) 1εz,x(φxZ
φzX
) εz,x−1εz,x
(A.9)
Using this same condition I can write the raw materials prices ratio as
ω ≡ wzwx
=(AzAx
φxφz
)1− 1εz,x(Z
X
)− 1εz,x
(A.10)
A.1.2. Endogenous technological change. Introduction of new machines has a fixedcost µ as units of the numerare. Each innovator decide between designing machinesfor one of the two sector. Patents are infinitely lived and therefor at the balancedgrowth path the discounted value in each sector (Vz and Vx) of the profit stream cannotexceed the innovation cost. This implies that innovators are indifferent between thetwo technologies. That is Vz = Vx = µ or πz
πx= 1. Using this condition jointly with A.9
I find the the technology direction that is compatible with balanced growth.
AzAx
=(φxZ
φzX
)εz,x−1
(A.11)
Also on balanced growth the textiles price ratio and and the endowments paymentratio can be written as
THE EFFECT OF COLONIAL MARKETS AND TRADE ON INNOVATION iii
p∗∗ =(φxZ
φzX
)−1
and ω∗∗ =(φxφz
)εz,x−1(Z
X
)εz,x−2
(A.12)
A.1.3. Market Integration. In this section now I develop the effect of market inte-gration. Now consider Spain with endowments ZS and XS get integrated with itscolonies that have endowment ZC and XC . The endowments of materials in the mar-ket are defined as the sum of both the metropolis and the colonies endowments (i.e.ZI = ZS + ZC and XI = XS +XC .). Then the relative price equation (A.8) from theintegrated market is
pI ≡ PzPx
=(Az(ZS + ZC)Ax(XS +XC)
φxφz
)− 1εz,x
= λ1/εz,xp(A.13)
Colonies copy technology from the metropolis without any differential cost. Adjust-ing technology equation (A.9) becomes
AIzAIx
=(φxZ
φzX
)εz,x−1
λ(A.14)
Where λ ≡ 1 +XC/XS
1 + ZC/ZS. If I assume that cotton is relative more abundant in Spain
compare with its colonies (i.e. ZS
XS >ZC
XC ) then λ > 1. Or what is the same a marketintegration produce an increase on innovation on the relative more abundant product(i.e. cotton). Also when technology is allowed to adjust the price ratio becomes equalto the levels before the market integration
pI∗∗ =(φxZ
φzX
)−1
= p∗∗(A.15)
A.1.4. Change on textile prices. Coefficients γFk in equation 6.1 identify the relativechange between other fibers and cotton (p) before and after the integration, that isln(pI/p∗∗) that can be expressed as:
ln(pI
p∗∗
)= 1εz,x
ln λ(A.16)
finally the increase on the technology after the market integration can be expressedas
AIz/AIx
Az/Ax= λ(A.17)
A.2. Spinning and weaving sectors. In this section I show a model of innovationbetween two sectors in the cotton textile industry: spinning and weaving sector.

THE EFFECT OF COLONIAL MARKETS AND TRADE ON INNOVATION iv
A.2.1. Set up and assumptions. There is an unique final good of cotton (textile),produced competitively using two inputs: threads (Yh) and fabrics (Yl). Each one isproduced using two different type of workers spinners (H) and weavers (L) respectively.The production function is expressed as
Y ∗z =[Y
εl,h−1εl,h
l + Yεl,h−1εl,h
h
] εl,h
εl,h−1(A.18)
As in the last section products Yl and Yh are produced using a continuum of sectorspecific intermediates (yl(i) and yh(i) respectively). Where Al and Ah is the measureof machines in each input produced with the two types of labor
Yl = El
[ ˆ Al
0yl(i)αdi
] 1α
and Yh = Eh
[ ˆ Ah
0yh(i)αdi
] 1α
(A.19)
The production function for each intermediate input is linear in the type of laboremployed in the world yl(i) = l(i)
φland yh(i) = h(i)
φh. Where φl and φh measure the cost
in terms of the workers need to produce either threads or fabrics. Using the samessteps as the previous model I can obtain the price relation between fabric and threads
plh ≡PlPh
=(AlL
AhH
φhφl
)− 1εl,h
(A.20)
and the wage ratio between weavers and spinner
ωlh ≡wlwh
=(AlAh
φhφl
)1− 1εl,h(L
H
)− 1εl,h
(A.21)
A.2.2. Endogenous technological change. Introduction of new machines has the samestructure as the in previous section that is fixed cost µ as units of the numerare.Therefore the technology direction compatible with balanced growth can be expressedas
AlAh
=(φhL
φlH
)εl,h−1
(A.22)
Also on balanced growth the price ratio between fabrics and threads and and thewage ratio between weavers and spinners can be written as
p∗∗lh =(φhL
φlH
)−1
and ω∗∗lh =(φhφl
)εl,h−1(L
H
)εl,h−2
(A.23)
A.2.3. Entrance to international market. In this section I develop the effect of theintroduction to global markets. I assume that with the new tastes the cost of weaverincrease since they are need to produce more varieties of products, that is an increaseof φl. Given the fact that the two sectors are complements that is εl,h < 1 it is
THE EFFECT OF COLONIAL MARKETS AND TRADE ON INNOVATION v
straightforward to observe a positive relation with innovation ratio AlAh
as well priceratio p∗∗lh and wage ratio ω∗∗lhA.2.4. Change on fabric-thread price. Coefficient γPk in equation 6.2 identify the
change between thread price and fabric price before and after the increase on weavercost (φ0
h → φ1h), that is ln(plh(φ1
h)/plh(φ0h)) that can be expressed as
ln(plh(φ1
h)plh(φ0
h)
)= 1εl,h
ln(φ1h
φ0h
)(A.24)
A.2.5. Change on weavers spinners wages. Coefficient γWk in equation C.1 identifythe change between weaver wages and spinner wavers before and after the increase onweaver cost (φ0
h → φ1h), that is ln(ωlh(φ1
h)/ωlh(φ0h)) that can be expressed as
ln(ωlh(φ1
h)ωlh(φ0
h)
)= 1− εl,h
εl,hln(φ1h
φ0h
)(A.25)
Appendix B. Cotton textile products quality index
In this section, I explain in detail the construction of the quality index for each cottonproduct observed on the inventory ledgers. During each period of time, I observe dataof two different types of products: thread and fabrics. Inside each type, I observedifferent varieties. I observe three thread varieties (warp thread without size, warpthread with size, and weft thread) and two fabric varieties (moleskin and madras).Finally, I observed the price for different products inside each variety only if the productwas available on the stock of the company. To construct the quality, I assume thatthe prices differences observer on the same product (thread or fabrics) reflect onlydifferences in the qualities. I follow the following procedure:
(1) I calculated the lower price for each product type in 1878. And calculate theprices of all prices based on that prices. This allows me to estimate the pricein terms of a first prices
(2) Then, I calculated the lower of those previously estimated price ratios for eachperiod.
(3) I calculated then a new price ratio between each period minimum and originalratio. With this estimation I measure the quality of each observed product interms of the low-quality product of each type.
(4) I estimate the average of this indicator by product across all years in which itwas observed and take the measure as the quality indicator. This estimationassumes that inside each product of type, the lower quality product was alwaysavailable in all the periods. This seems a reasonable assumption since i) forthe three varieties of cotton thread, I always observed the lower quality (threadwith numbers lower than 20, and ii) the lower fabric price was always associatedwith a madras fabric with similar characteristics.
THE EFFECT OF COLONIAL MARKETS AND TRADE ON INNOVATION vi
Appendix C. Effect of bias technology on relative wages
In this section, I show the analysis of wages of two cotton textile workers: spinnersand weavers. Figures D.14 give the first evidence that this is the case. After theSpanish-American war, weavers’ wages started to follow an upward trend, and theyconstantly increased while the spinners’ wages remained constant during this period. Ifollow a similar strategy than in equation 6.2, and I compare weavers’ wage to spinnerwage after the loss of the colonies in 1898. Formally, I estimate the following model:
(C.1)ln(Wjt) =γW1891−95 × Integrationt ×Weaverj +
[ 1910∑k=1896
γWk × Yearsk ×Weaverj]
+[ ∑l∈Xt
γ′(l ×Weaverj)]
+ αj × t+ αt + αj + εjt
where Wjt is the wage received by type of worker j (spinner or weaver) at time t, Yearskare dummy indicators for each year, Integratiot is an indicator for the first years of thefull integration period (1891-1895) and Weaverj is an indicator if the salary is forworkers at weaving stage. I include a differential trend in the estimation since the dataevidence that the two series had different trends (see Appendix figure D.14). Spinners’salaries had a downward trend before the colonies lost while the weavers remainedrelatively constant before 1899. Finally, I also control for the wages of other workersat the weaving stage like personal in charge and warpers at each period Xt. Thesetwo variables allow me to control for changes in the amount of work needed from eachweaver since both are correlated with the quality and weight of the average producedpiece (features that I do not observe in the data). Then the inclusion of those variablesreduces the concerns that salaries changes are being driven by movements in the amountof work needed to produce different fabric qualities. My interest is on coefficients γWkthat captures the change of weavers wages relative to spinner wages at each period oftime in comparison to the average relative wage before 1891.
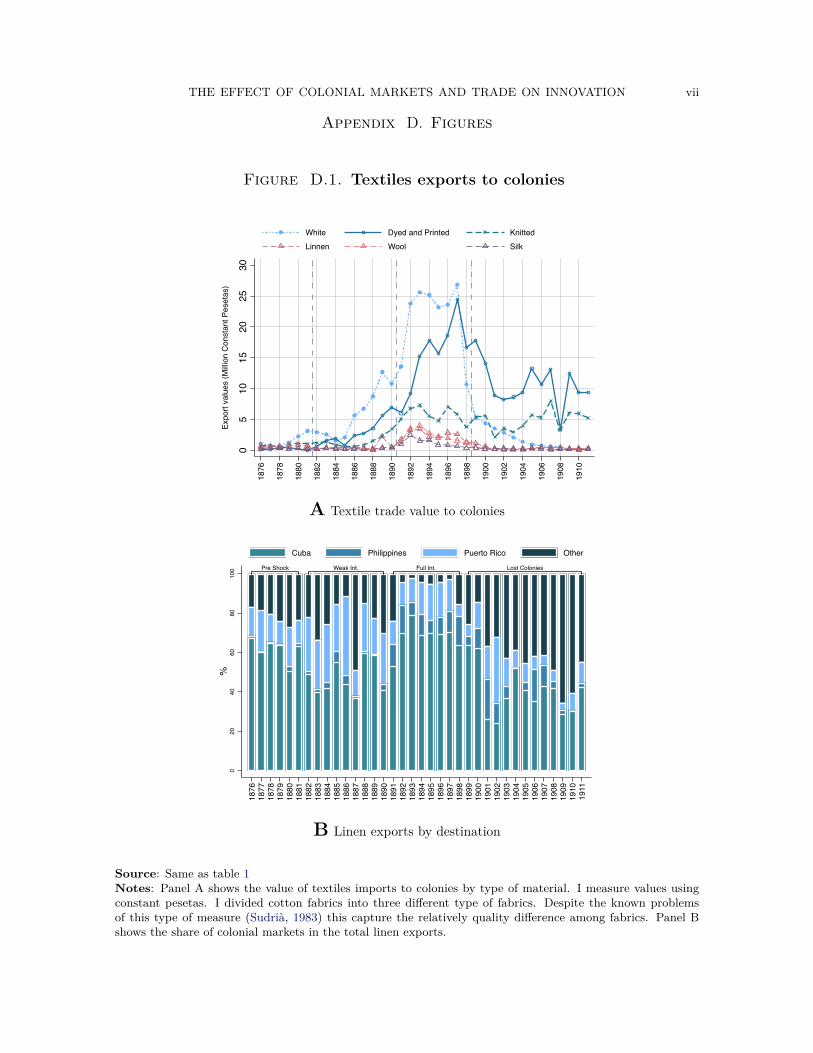
THE EFFECT OF COLONIAL MARKETS AND TRADE ON INNOVATION vii
Appendix D. Figures
Figure D.1. Textiles exports to colonies
05
1015
2025
30
Expo
rt va
lues
(Milli
on C
onst
ant P
eset
as)
1876
1878
1880
1882
1884
1886
1888
1890
1892
1894
1896
1898
1900
1902
1904
1906
1908
1910
White Dyed and Printed KnittedLinnen Wool Silk
A Textile trade value to colonies
Pre Shock Weak Int. Full Int. Lost Colonies
020
4060
8010
0%
1876
1877
1878
1879
1880
1881
1882
1883
1884
1885
1886
1887
1888
1889
1890
1891
1892
1893
1894
1895
1896
1897
1898
1899
1900
1901
1902
1903
1904
1905
1906
1907
1908
1909
1910
1911
Cuba Philippines Puerto Rico Other
B Linen exports by destination
Source: Same as table 1Notes: Panel A shows the value of textiles imports to colonies by type of material. I measure values usingconstant pesetas. I divided cotton fabrics into three different type of fabrics. Despite the known problemsof this type of measure (Sudria, 1983) this capture the relatively quality difference among fabrics. Panel Bshows the share of colonial markets in the total linen exports.
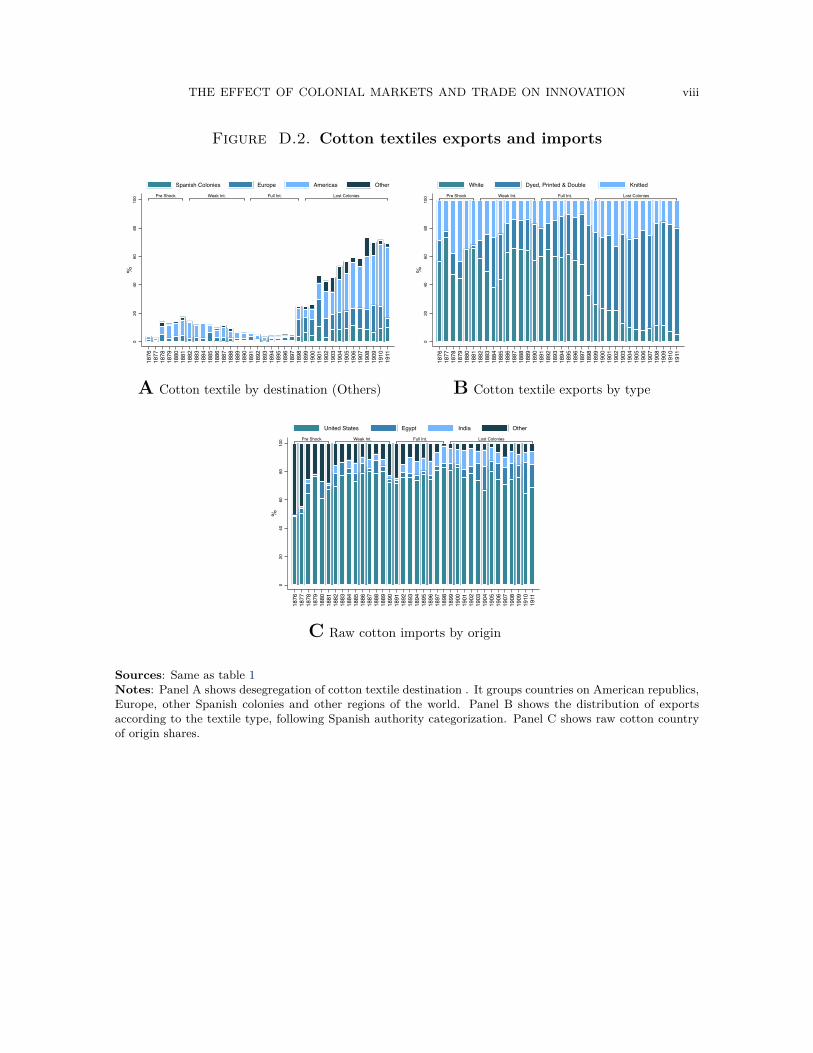
THE EFFECT OF COLONIAL MARKETS AND TRADE ON INNOVATION viii
Figure D.2. Cotton textiles exports and imports
Pre Shock Weak Int. Full Int. Lost Colonies
020
4060
8010
0%
1876
1877
1878
1879
1880
1881
1882
1883
1884
1885
1886
1887
1888
1889
1890
1891
1892
1893
1894
1895
1896
1897
1898
1899
1900
1901
1902
1903
1904
1905
1906
1907
1908
1909
1910
1911
Spanish Colonies Europe Americas Other
A Cotton textile by destination (Others)
Pre Shock Weak Int. Full Int. Lost Colonies
020
4060
8010
0%
1876
1877
1878
1879
1880
1881
1882
1883
1884
1885
1886
1887
1888
1889
1890
1891
1892
1893
1894
1895
1896
1897
1898
1899
1900
1901
1902
1903
1904
1905
1906
1907
1908
1909
1910
1911
White Dyed, Printed & Double Knitted
B Cotton textile exports by type
Pre Shock Weak Int. Full Int. Lost Colonies
020
4060
8010
0%
1876
1877
1878
1879
1880
1881
1882
1883
1884
1885
1886
1887
1888
1889
1890
1891
1892
1893
1894
1895
1896
1897
1898
1899
1900
1901
1902
1903
1904
1905
1906
1907
1908
1909
1910
1911
United States Egypt India Other
C Raw cotton imports by origin
Sources: Same as table 1Notes: Panel A shows desegregation of cotton textile destination . It groups countries on American republics,Europe, other Spanish colonies and other regions of the world. Panel B shows the distribution of exportsaccording to the textile type, following Spanish authority categorization. Panel C shows raw cotton countryof origin shares.
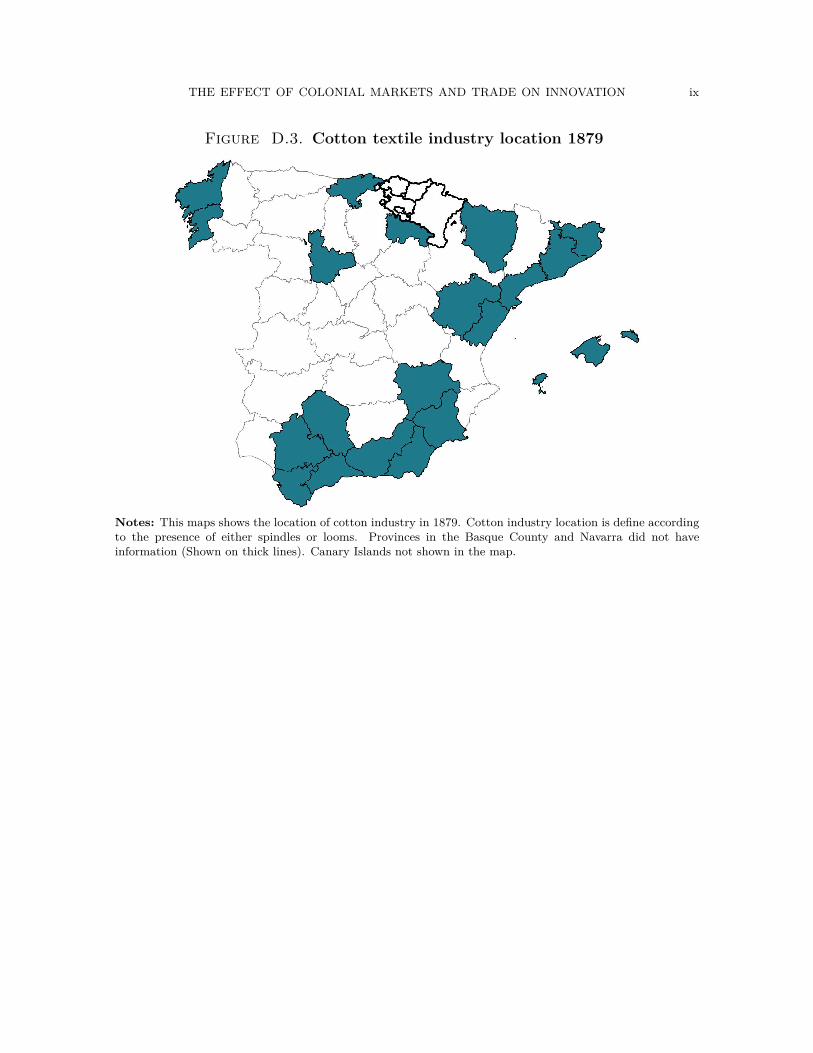
THE EFFECT OF COLONIAL MARKETS AND TRADE ON INNOVATION ix
Figure D.3. Cotton textile industry location 1879
Notes: This maps shows the location of cotton industry in 1879. Cotton industry location is define accordingto the presence of either spindles or looms. Provinces in the Basque County and Navarra did not haveinformation (Shown on thick lines). Canary Islands not shown in the map.
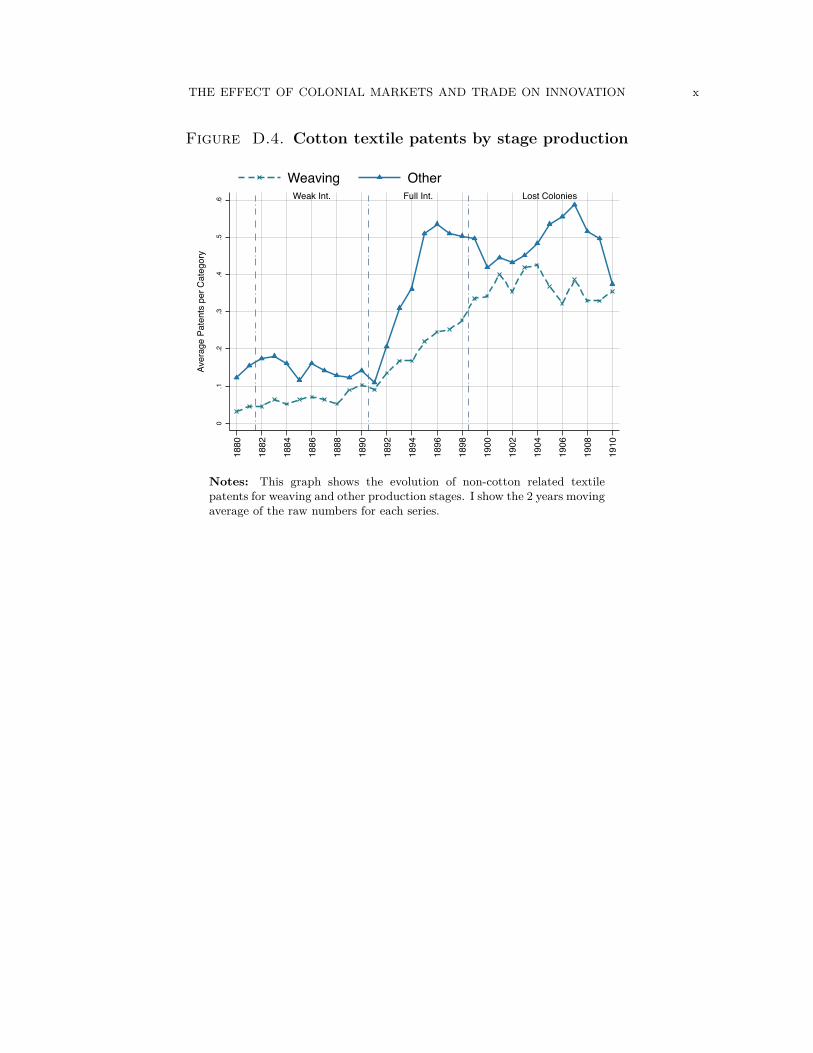
THE EFFECT OF COLONIAL MARKETS AND TRADE ON INNOVATION x
Figure D.4. Cotton textile patents by stage production
Weak Int. Full Int. Lost Colonies
0.1
.2.3
.4.5
.6
Aver
age
Pate
nts
per C
ateg
ory
1880
1882
1884
1886
1888
1890
1892
1894
1896
1898
1900
1902
1904
1906
1908
1910
Weaving Other
Notes: This graph shows the evolution of non-cotton related textilepatents for weaving and other production stages. I show the 2 years movingaverage of the raw numbers for each series.
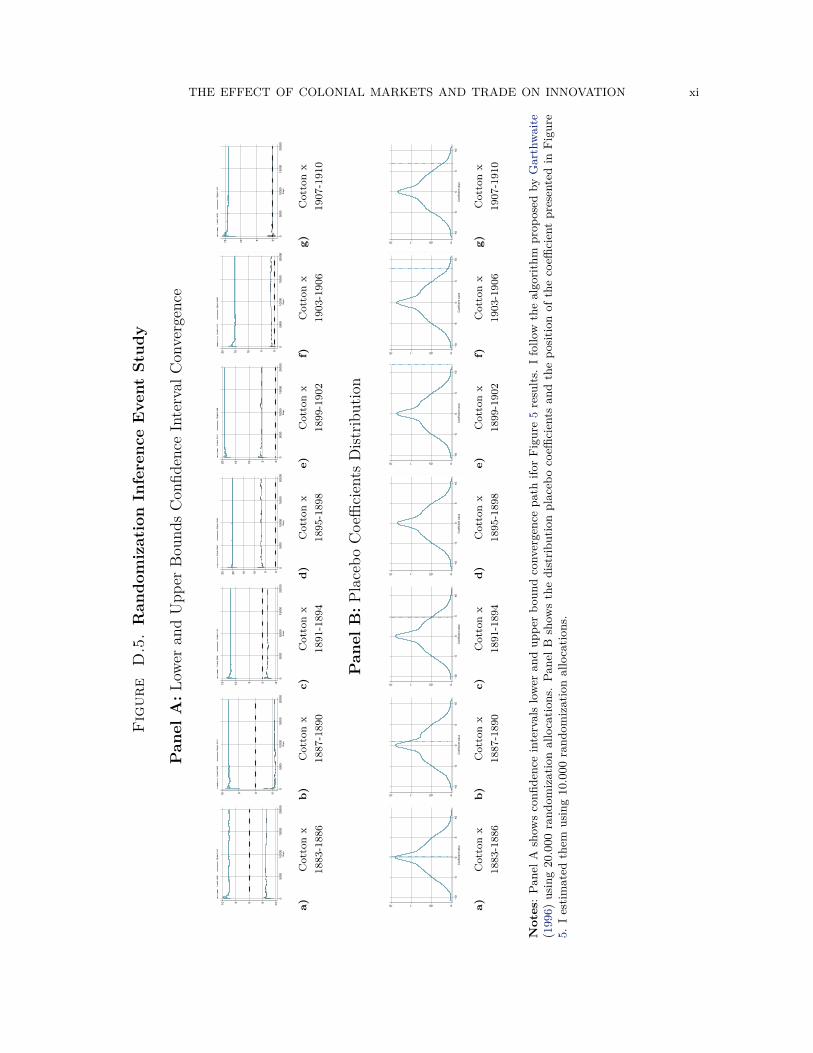
THE EFFECT OF COLONIAL MARKETS AND TRADE ON INNOVATION xi
Fig
ure
D.5
.R
ando
miz
atio
nIn
fere
nce
Eve
ntSt
udy
Pan
elA
:Low
eran
dU
pper
Boun
dsC
onfid
ence
Inte
rval
Con
verg
ence
-10-50510
050
0010
000
1500
020
000
Step
s
Low
er L
imit
Upp
er L
imit
a)C
otto
nx
1883
-188
6
-50510
050
0010
000
1500
020
000
Step
s
Low
er L
imit
Upp
er L
imit
b)
Cot
ton
x18
87-1
890
-5051015
050
0010
000
1500
020
000
Step
s
Low
er L
imit
Upp
er L
imit
c)C
otto
nx
1891
-189
4
0510152025
050
0010
000
1500
020
000
Step
s
Low
er L
imit
Upp
er L
imit
d)
Cot
ton
x18
95-1
898
05101520
050
0010
000
1500
020
000
Step
s
Low
er L
imit
Upp
er L
imit
e)C
otto
nx
1899
-190
2
05101520
050
0010
000
1500
020
000
Step
s
Low
er L
imit
Upp
er L
imit
f)C
otto
nx
1903
-190
6
051015
050
0010
000
1500
020
000
Step
s
Low
er L
imit
Upp
er L
imit
g)C
otto
nx
1907
-191
0
Pan
elB
:Pla
cebo
Coe
ffici
ents
Dist
ribut
ion
0.05.1.15
-10
-50
510
Coe
ffici
ent v
alue
a)C
otto
nx
1883
-188
6
0.05.1.15
-10
-50
510
Coe
ffici
ent v
alue
b)
Cot
ton
x18
87-1
890
0.05.1.15
-10
-50
510
Coe
ffici
ent v
alue
c)C
otto
nx
1891
-189
40.05.1.15
-10
-50
510
Coe
ffici
ent v
alue
d)
Cot
ton
x18
95-1
898
0.05.1.15
-10
-50
510
Coe
ffici
ent v
alue
e)C
otto
nx
1899
-190
2
0.05.1.15
-10
-50
510
Coe
ffici
ent v
alue
f)C
otto
nx
1903
-190
6
0.05.1.15
-10
-50
510
Coe
ffici
ent v
alue
g)C
otto
nx
1907
-191
0
Not
es:
Pane
lAsh
ows
confi
denc
ein
terv
als
low
eran
dup
per
boun
dco
nver
genc
epa
thifo
rFi
gure
5re
sults
.I
follo
wth
eal
gorit
hmpr
opos
edby
Gar
thw
aite
(199
6)us
ing
20.0
00ra
ndom
izat
ion
allo
catio
ns.
Pane
lBsh
ows
the
dist
ribut
ion
plac
ebo
coeffi
cien
tsan
dth
epo
sitio
nof
the
coeffi
cien
tpr
esen
ted
inFi
gure
5.I
estim
ated
them
usin
g10
.000
rand
omiz
atio
nal
loca
tions
.
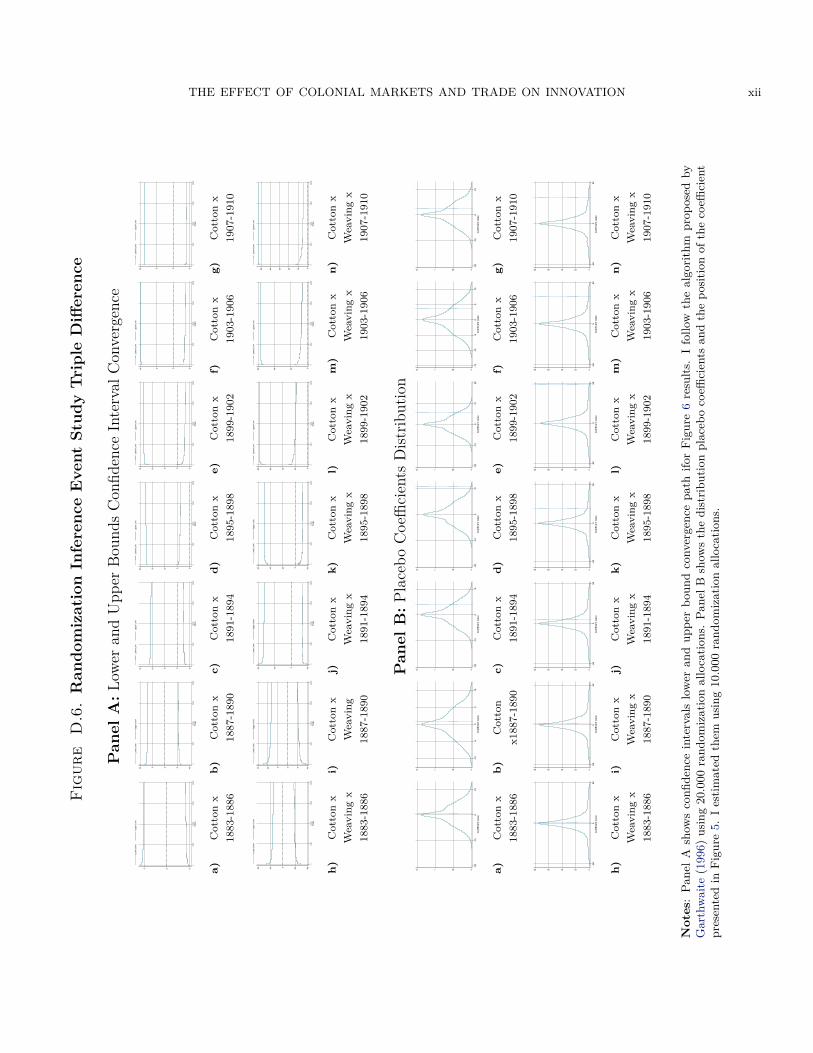
THE EFFECT OF COLONIAL MARKETS AND TRADE ON INNOVATION xiiF
igur
eD
.6.
Ran
dom
izat
ion
Infe
renc
eE
vent
Stud
yT
ripl
eD
iffer
ence
Pan
elA
:Low
eran
dU
pper
Boun
dsC
onfid
ence
Inte
rval
Con
verg
ence
-505
050
0010
000
1500
020
000
Step
s
Low
er L
imit
Upp
er L
imit
a)C
otto
nx
1883
-188
6
-10-50510
050
0010
000
1500
020
000
Step
s
Low
er L
imit
Upp
er L
imit
b)
Cot
ton
x18
87-1
890
-5051015
050
0010
000
1500
020
000
Step
s
Low
er L
imit
Upp
er L
imit
c)C
otto
nx
1891
-189
4
05101520
050
0010
000
1500
020
000
Step
s
Low
er L
imit
Upp
er L
imit
d)
Cot
ton
x18
95-1
898
-5051015
050
0010
000
1500
020
000
Step
s
Low
er L
imit
Upp
er L
imit
e)C
otto
nx
1899
-190
2
-50510
050
0010
000
1500
020
000
Step
s
Low
er L
imit
Upp
er L
imit
f)C
otto
nx
1903
-190
6
-50510
050
0010
000
1500
020
000
Step
s
Low
er L
imit
Upp
er L
imit
g)C
otto
nx
1907
-191
0
-40
-2002040
050
0010
000
1500
020
000
Step
s
Low
er L
imit
Upp
er L
imit
h)
Cot
ton
xW
eavi
ngx
1883
-188
6
-10-5051015
050
0010
000
1500
020
000
Step
s
Low
er L
imit
Upp
er L
imit
i)C
otto
nx
Wea
ving
1887
-189
0
-1001020
050
0010
000
1500
020
000
Step
s
Low
er L
imit
Upp
er L
imit
j)C
otto
nx
Wea
ving
x18
91-1
894
-200204060
050
0010
000
1500
020
000
Step
s
Low
er L
imit
Upp
er L
imit
k)C
otto
nx
Wea
ving
x18
95-1
898
020406080
050
0010
000
1500
020
000
Step
s
Low
er L
imit
Upp
er L
imit
l)C
otto
nx
Wea
ving
x18
99-1
902
0204060
050
0010
000
1500
020
000
Step
s
Low
er L
imit
Upp
er L
imit
m)
Cot
ton
xW
eavi
ngx
1903
-190
6
01020304050
050
0010
000
1500
020
000
Step
s
Low
er L
imit
Upp
er L
imit
n)
Cot
ton
xW
eavi
ngx
1907
-191
0
Pan
elB
:Pla
cebo
Coe
ffici
ents
Dist
ribut
ion
0.05.1.15
-20
-10
010
Coe
ffici
ent v
alue
a)C
otto
nx
1883
-188
6
0.05.1.15
-10
-50
510
Coe
ffici
ent v
alue
b)
Cot
ton
x188
7-18
90
0.05.1.15
-20
-10
010
Coe
ffici
ent v
alue
c)C
otto
nx
1891
-189
4
0.05.1.15
-20
-10
010
Coe
ffici
ent v
alue
d)
Cot
ton
x18
95-1
898
0.05.1.15
-20
-10
010
20C
oeffi
cien
t val
ue
e)C
otto
nx
1899
-190
2
0.05.1.15
-15
-10
-50
510
Coe
ffici
ent v
alue
f)C
otto
nx
1903
-190
6
0.05.1.15
-20
-10
010
Coe
ffici
ent v
alue
g)C
otto
nx
1907
-191
0
0.02.04.06.08
-50
050
Coe
ffici
ent v
alue
h)
Cot
ton
xW
eavi
ngx
1883
-188
6
0.02.04.06.08
-50
050
Coe
ffici
ent v
alue
i)C
otto
nx
Wea
ving
x18
87-1
890
0.02.04.06.08
-50
050
Coe
ffici
ent v
alue
j)C
otto
nx
Wea
ving
x18
91-1
894
0.02.04.06.08
-50
050
Coe
ffici
ent v
alue
k)C
otto
nx
Wea
ving
x18
95-1
898
0.02.04.06.08
-50
050
Coe
ffici
ent v
alue
l)C
otto
nx
Wea
ving
x18
99-1
902
0.02.04.06.08
-50
050
Coe
ffici
ent v
alue
m)
Cot
ton
xW
eavi
ngx
1903
-190
6
0.02.04.06.08
-50
050
Coe
ffici
ent v
alue
n)
Cot
ton
xW
eavi
ngx
1907
-191
0
Not
es:
Pane
lAsh
ows
confi
denc
ein
terv
als
low
eran
dup
per
boun
dco
nver
genc
epa
thifo
rFi
gure
6re
sults
.I
follo
wth
eal
gorit
hmpr
opos
edby
Gar
thw
aite
(199
6)us
ing
20.0
00ra
ndom
izat
ion
allo
catio
ns.
Pane
lBsh
ows
the
dist
ribut
ion
plac
ebo
coeffi
cien
tsan
dth
epo
sitio
nof
the
coeffi
cien
tpr
esen
ted
inFi
gure
5.I
estim
ated
them
usin
g10
.000
rand
omiz
atio
nal
loca
tions
.
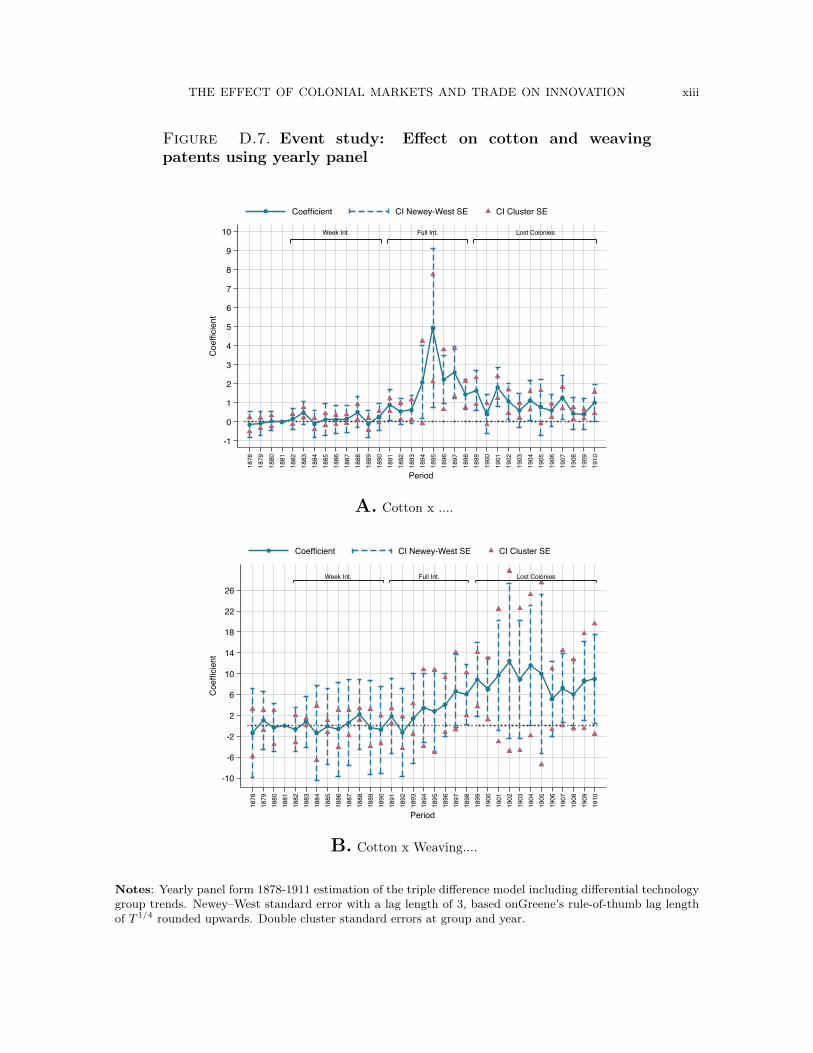
THE EFFECT OF COLONIAL MARKETS AND TRADE ON INNOVATION xiii
Figure D.7. Event study: Effect on cotton and weavingpatents using yearly panel
Full Int. Lost ColoniesWeek Int.
-1
0
1
2
3
4
5
6
7
8
9
10
Coe
ffici
ent
1878
1879
1880
1881
1882
1883
1884
1885
1886
1887
1888
1889
1890
1891
1892
1893
1894
1895
1896
1897
1898
1899
1900
1901
1902
1903
1904
1905
1906
1907
1908
1909
1910
Period
Coefficient CI Newey-West SE CI Cluster SE
A. Cotton x ....
Full Int. Lost ColoniesWeek Int.
-10
-6
-2
2
6
10
14
18
22
26
Coe
ffici
ent
1878
1879
1880
1881
1882
1883
1884
1885
1886
1887
1888
1889
1890
1891
1892
1893
1894
1895
1896
1897
1898
1899
1900
1901
1902
1903
1904
1905
1906
1907
1908
1909
1910
Period
Coefficient CI Newey-West SE CI Cluster SE
B. Cotton x Weaving....
Notes: Yearly panel form 1878-1911 estimation of the triple difference model including differential technologygroup trends. Newey–West standard error with a lag length of 3, based onGreene’s rule-of-thumb lag lengthof T 1/4 rounded upwards. Double cluster standard errors at group and year.
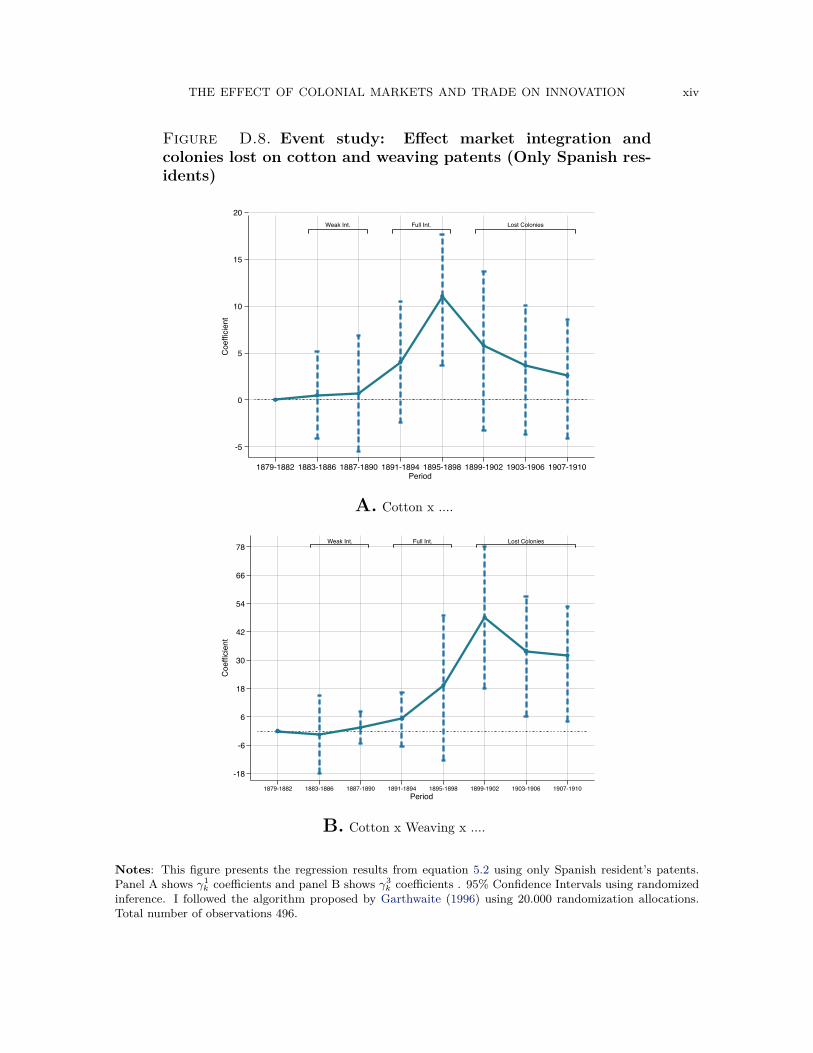
THE EFFECT OF COLONIAL MARKETS AND TRADE ON INNOVATION xiv
Figure D.8. Event study: Effect market integration andcolonies lost on cotton and weaving patents (Only Spanish res-idents)
Full Int. Lost ColoniesWeak Int.
-5
0
5
10
15
20C
oeffi
cien
t
1879-1882 1883-1886 1887-1890 1891-1894 1895-1898 1899-1902 1903-1906 1907-1910Period
A. Cotton x ....
Full Int. Lost ColoniesWeak Int.
-18
-6
6
18
30
42
54
66
78
Coe
ffici
ent
1879-1882 1883-1886 1887-1890 1891-1894 1895-1898 1899-1902 1903-1906 1907-1910Period
B. Cotton x Weaving x ....
Notes: This figure presents the regression results from equation 5.2 using only Spanish resident’s patents.Panel A shows γ1
k coefficients and panel B shows γ3k coefficients . 95% Confidence Intervals using randomized
inference. I followed the algorithm proposed by Garthwaite (1996) using 20.000 randomization allocations.Total number of observations 496.
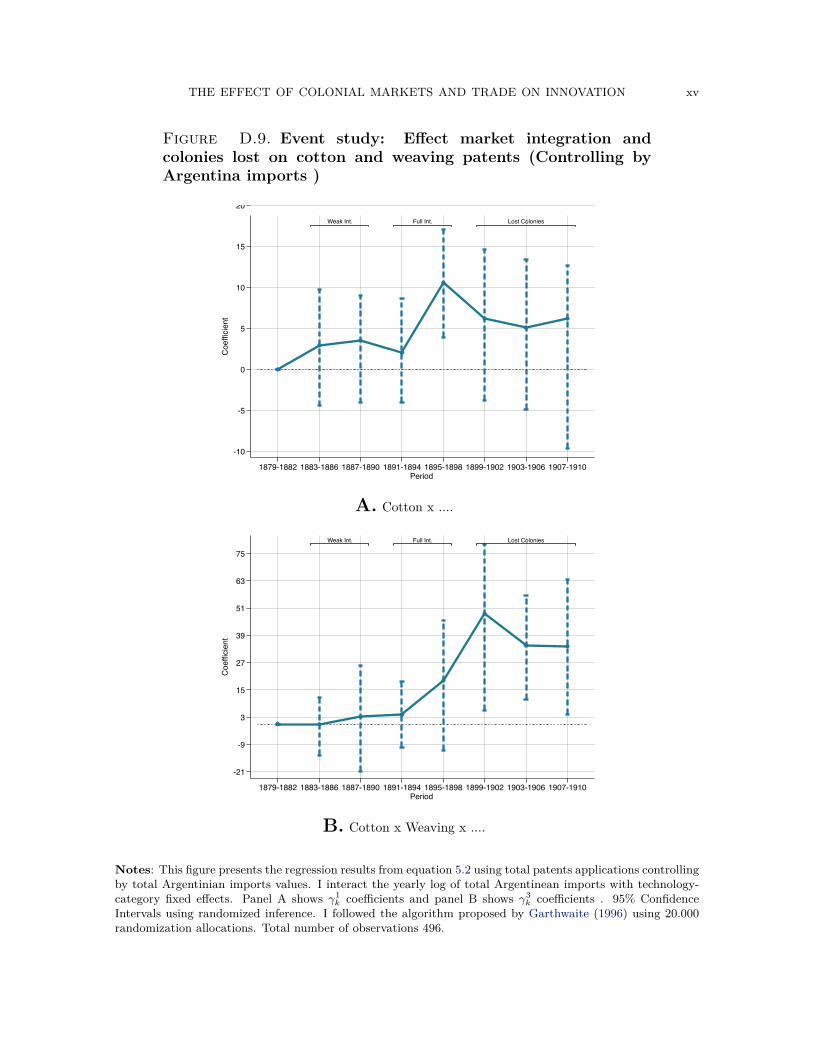
THE EFFECT OF COLONIAL MARKETS AND TRADE ON INNOVATION xv
Figure D.9. Event study: Effect market integration andcolonies lost on cotton and weaving patents (Controlling byArgentina imports )
Full Int. Lost ColoniesWeak Int.
-10
-5
0
5
10
15
20
Coe
ffici
ent
1879-1882 1883-1886 1887-1890 1891-1894 1895-1898 1899-1902 1903-1906 1907-1910Period
A. Cotton x ....
Full Int. Lost ColoniesWeak Int.
-21
-9
3
15
27
39
51
63
75
Coe
ffici
ent
1879-1882 1883-1886 1887-1890 1891-1894 1895-1898 1899-1902 1903-1906 1907-1910Period
B. Cotton x Weaving x ....
Notes: This figure presents the regression results from equation 5.2 using total patents applications controllingby total Argentinian imports values. I interact the yearly log of total Argentinean imports with technology-category fixed effects. Panel A shows γ1
k coefficients and panel B shows γ3k coefficients . 95% Confidence
Intervals using randomized inference. I followed the algorithm proposed by Garthwaite (1996) using 20.000randomization allocations. Total number of observations 496.
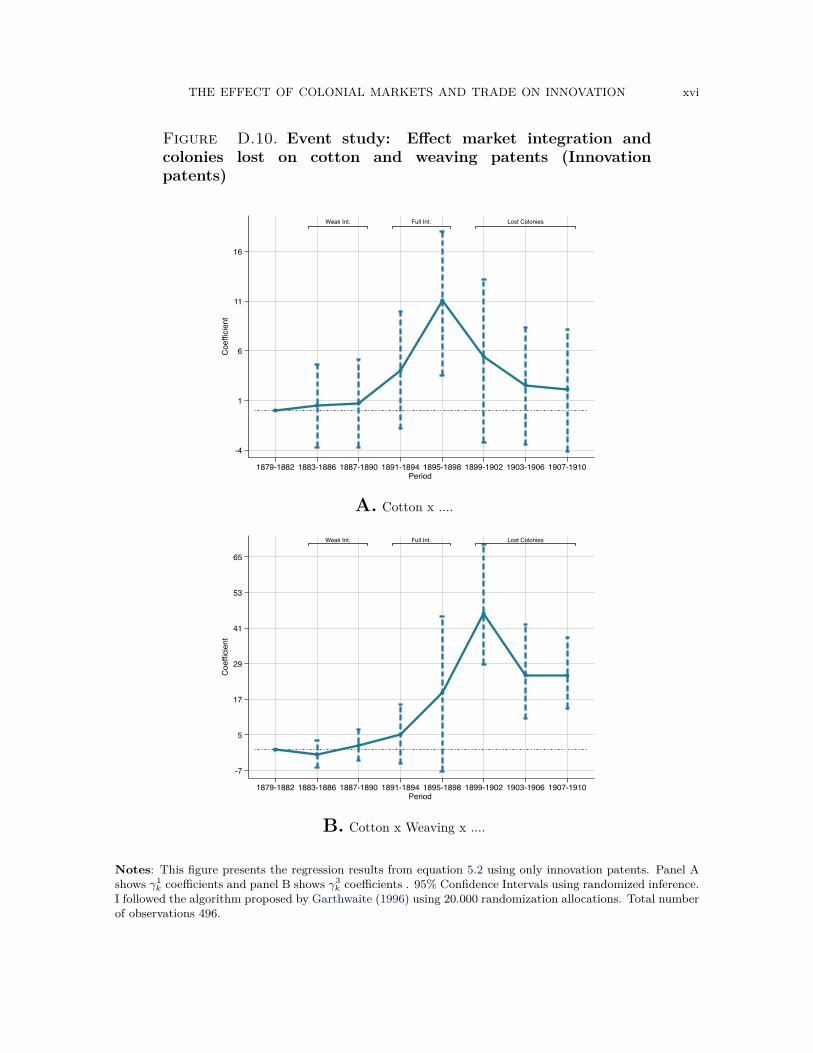
THE EFFECT OF COLONIAL MARKETS AND TRADE ON INNOVATION xvi
Figure D.10. Event study: Effect market integration andcolonies lost on cotton and weaving patents (Innovationpatents)
Full Int. Lost ColoniesWeak Int.
-4
1
6
11
16
21
Coe
ffici
ent
1879-1882 1883-1886 1887-1890 1891-1894 1895-1898 1899-1902 1903-1906 1907-1910Period
A. Cotton x ....
Full Int. Lost ColoniesWeak Int.
-7
5
17
29
41
53
65
Coe
ffici
ent
1879-1882 1883-1886 1887-1890 1891-1894 1895-1898 1899-1902 1903-1906 1907-1910Period
B. Cotton x Weaving x ....
Notes: This figure presents the regression results from equation 5.2 using only innovation patents. Panel Ashows γ1
k coefficients and panel B shows γ3k coefficients . 95% Confidence Intervals using randomized inference.
I followed the algorithm proposed by Garthwaite (1996) using 20.000 randomization allocations. Total numberof observations 496.
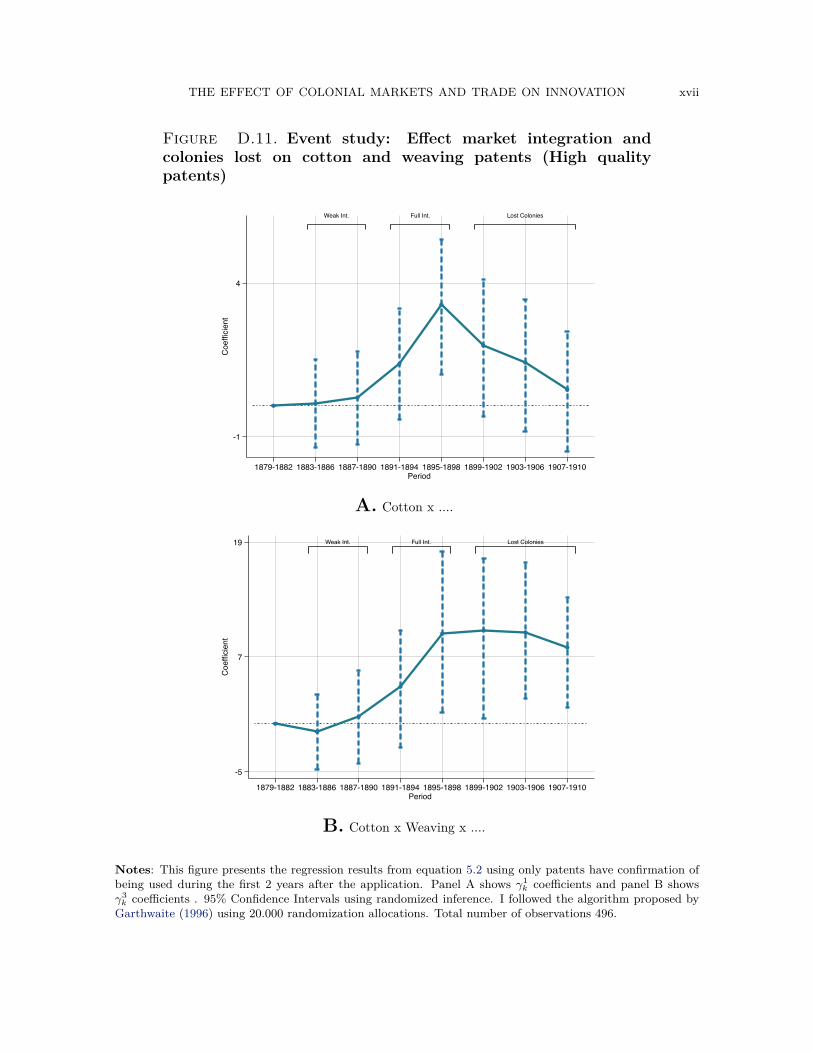
THE EFFECT OF COLONIAL MARKETS AND TRADE ON INNOVATION xvii
Figure D.11. Event study: Effect market integration andcolonies lost on cotton and weaving patents (High qualitypatents)
Full Int. Lost ColoniesWeak Int.
-1
4
Coe
ffici
ent
1879-1882 1883-1886 1887-1890 1891-1894 1895-1898 1899-1902 1903-1906 1907-1910Period
A. Cotton x ....
Full Int. Lost ColoniesWeak Int.
-5
7
19
Coe
ffici
ent
1879-1882 1883-1886 1887-1890 1891-1894 1895-1898 1899-1902 1903-1906 1907-1910Period
B. Cotton x Weaving x ....
Notes: This figure presents the regression results from equation 5.2 using only patents have confirmation ofbeing used during the first 2 years after the application. Panel A shows γ1
k coefficients and panel B showsγ3k coefficients . 95% Confidence Intervals using randomized inference. I followed the algorithm proposed by
Garthwaite (1996) using 20.000 randomization allocations. Total number of observations 496.
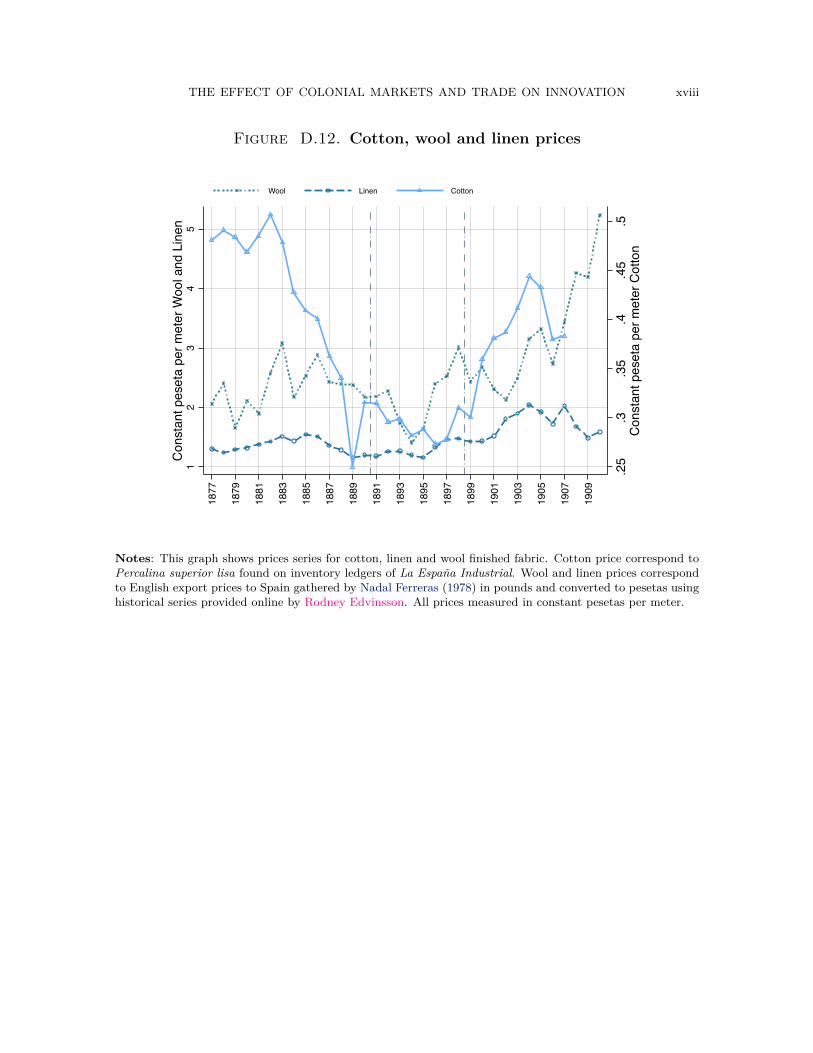
THE EFFECT OF COLONIAL MARKETS AND TRADE ON INNOVATION xviii
Figure D.12. Cotton, wool and linen prices
.25
.3.3
5.4
.45
.5C
onst
ant p
eset
a pe
r met
er C
otto
n
12
34
5C
onst
ant p
eset
a pe
r met
er W
ool a
nd L
inen
1877
1879
1881
1883
1885
1887
1889
1891
1893
1895
1897
1899
1901
1903
1905
1907
1909
Wool Linen Cotton
Notes: This graph shows prices series for cotton, linen and wool finished fabric. Cotton price correspond toPercalina superior lisa found on inventory ledgers of La Espana Industrial. Wool and linen prices correspondto English export prices to Spain gathered by Nadal Ferreras (1978) in pounds and converted to pesetas usinghistorical series provided online by Rodney Edvinsson. All prices measured in constant pesetas per meter.
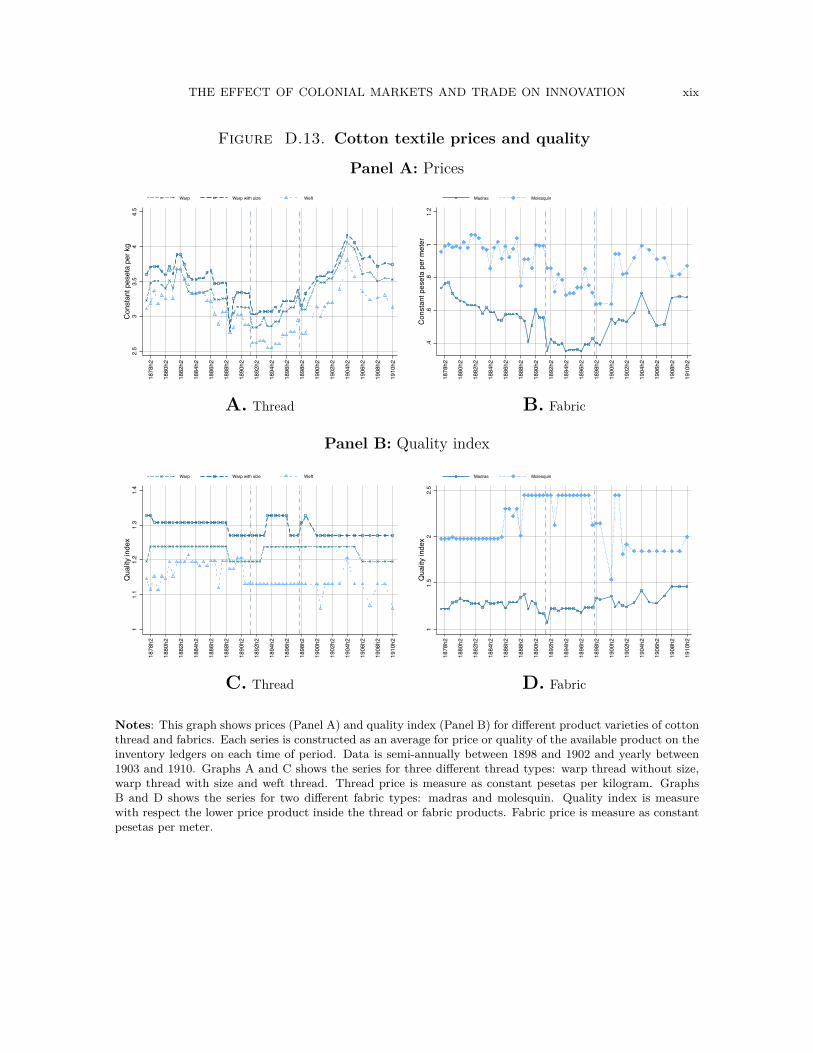
THE EFFECT OF COLONIAL MARKETS AND TRADE ON INNOVATION xix
Figure D.13. Cotton textile prices and quality
Panel A: Prices
2.5
33.
54
4.5
Con
stan
t pes
eta
per k
g
1878
h2
1880
h2
1882
h2
1884
h2
1886
h2
1888
h2
1890
h2
1892
h2
1894
h2
1896
h2
1898
h2
1900
h2
1902
h2
1904
h2
1906
h2
1908
h2
1910
h2
Warp Warp with size Weft
A. Thread.4
.6.8
11.
2C
onst
ant p
eset
a pe
r met
er
1878
h2
1880
h2
1882
h2
1884
h2
1886
h2
1888
h2
1890
h2
1892
h2
1894
h2
1896
h2
1898
h2
1900
h2
1902
h2
1904
h2
1906
h2
1908
h2
1910
h2
Madras Molesquin
B. Fabric
Panel B: Quality index
11.
11.
21.
31.
4Q
ualit
y in
dex
1878
h2
1880
h2
1882
h2
1884
h2
1886
h2
1888
h2
1890
h2
1892
h2
1894
h2
1896
h2
1898
h2
1900
h2
1902
h2
1904
h2
1906
h2
1908
h2
1910
h2
Warp Warp with size Weft
C. Thread
11.
52
2.5
Qua
lity
inde
x
1878
h2
1880
h2
1882
h2
1884
h2
1886
h2
1888
h2
1890
h2
1892
h2
1894
h2
1896
h2
1898
h2
1900
h2
1902
h2
1904
h2
1906
h2
1908
h2
1910
h2
Madras Molesquin
D. Fabric
Notes: This graph shows prices (Panel A) and quality index (Panel B) for different product varieties of cottonthread and fabrics. Each series is constructed as an average for price or quality of the available product on theinventory ledgers on each time of period. Data is semi-annually between 1898 and 1902 and yearly between1903 and 1910. Graphs A and C shows the series for three different thread types: warp thread without size,warp thread with size and weft thread. Thread price is measure as constant pesetas per kilogram. GraphsB and D shows the series for two different fabric types: madras and molesquin. Quality index is measurewith respect the lower price product inside the thread or fabric products. Fabric price is measure as constantpesetas per meter.
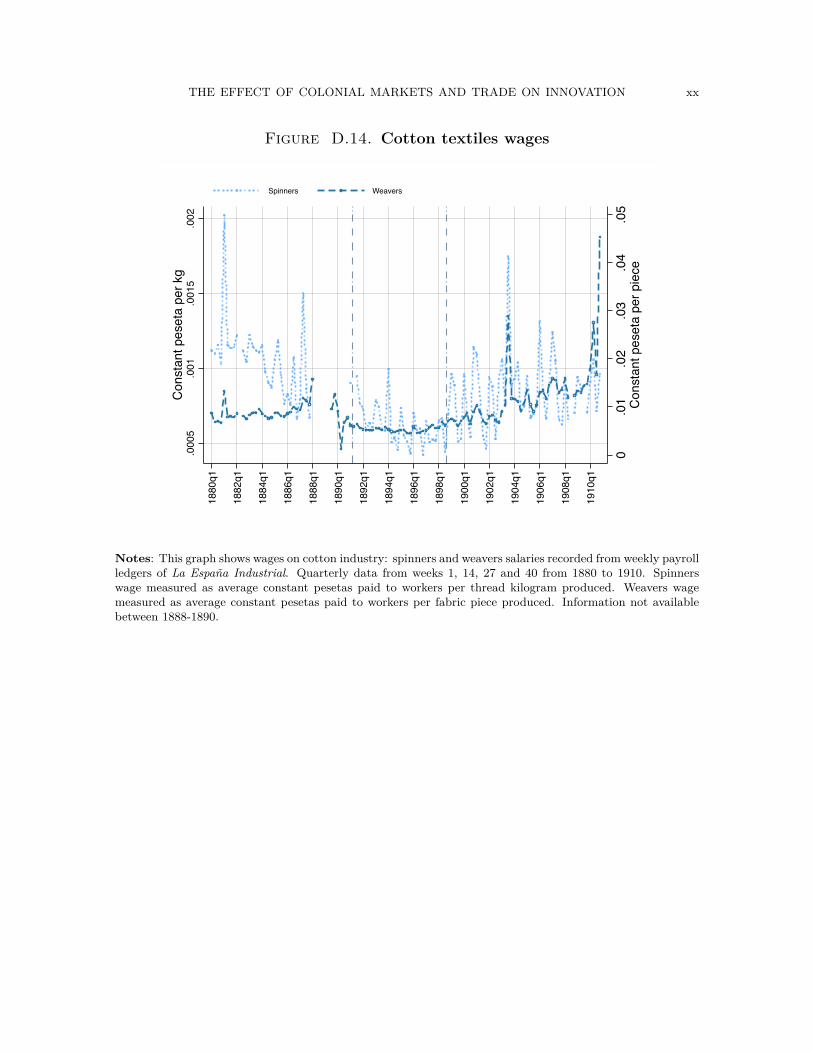
THE EFFECT OF COLONIAL MARKETS AND TRADE ON INNOVATION xx
Figure D.14. Cotton textiles wages
0.0
1.0
2.0
3.0
4.0
5C
onst
ant p
eset
a pe
r pie
ce
.000
5.0
01.0
015
.002
Con
stan
t pes
eta
per k
g
1880
q1
1882
q1
1884
q1
1886
q1
1888
q1
1890
q1
1892
q1
1894
q1
1896
q1
1898
q1
1900
q1
1902
q1
1904
q1
1906
q1
1908
q1
1910
q1
Spinners Weavers
Notes: This graph shows wages on cotton industry: spinners and weavers salaries recorded from weekly payrollledgers of La Espana Industrial. Quarterly data from weeks 1, 14, 27 and 40 from 1880 to 1910. Spinnerswage measured as average constant pesetas paid to workers per thread kilogram produced. Weavers wagemeasured as average constant pesetas paid to workers per fabric piece produced. Information not availablebetween 1888-1890.
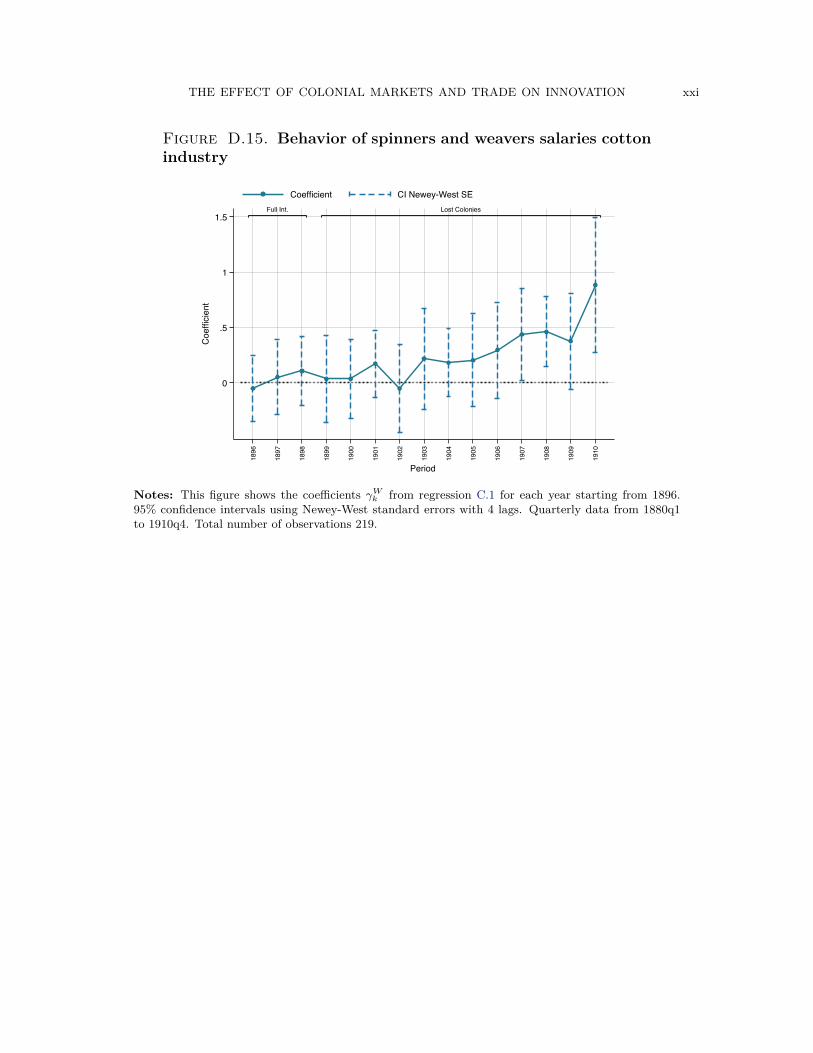
THE EFFECT OF COLONIAL MARKETS AND TRADE ON INNOVATION xxi
Figure D.15. Behavior of spinners and weavers salaries cottonindustry
Full Int. Lost Colonies
0
.5
1
1.5C
oeffi
cien
t
1896
1897
1898
1899
1900
1901
1902
1903
1904
1905
1906
1907
1908
1909
1910
Period
Coefficient CI Newey-West SE
Notes: This figure shows the coefficients γWk from regression C.1 for each year starting from 1896.95% confidence intervals using Newey-West standard errors with 4 lags. Quarterly data from 1880q1to 1910q4. Total number of observations 219.
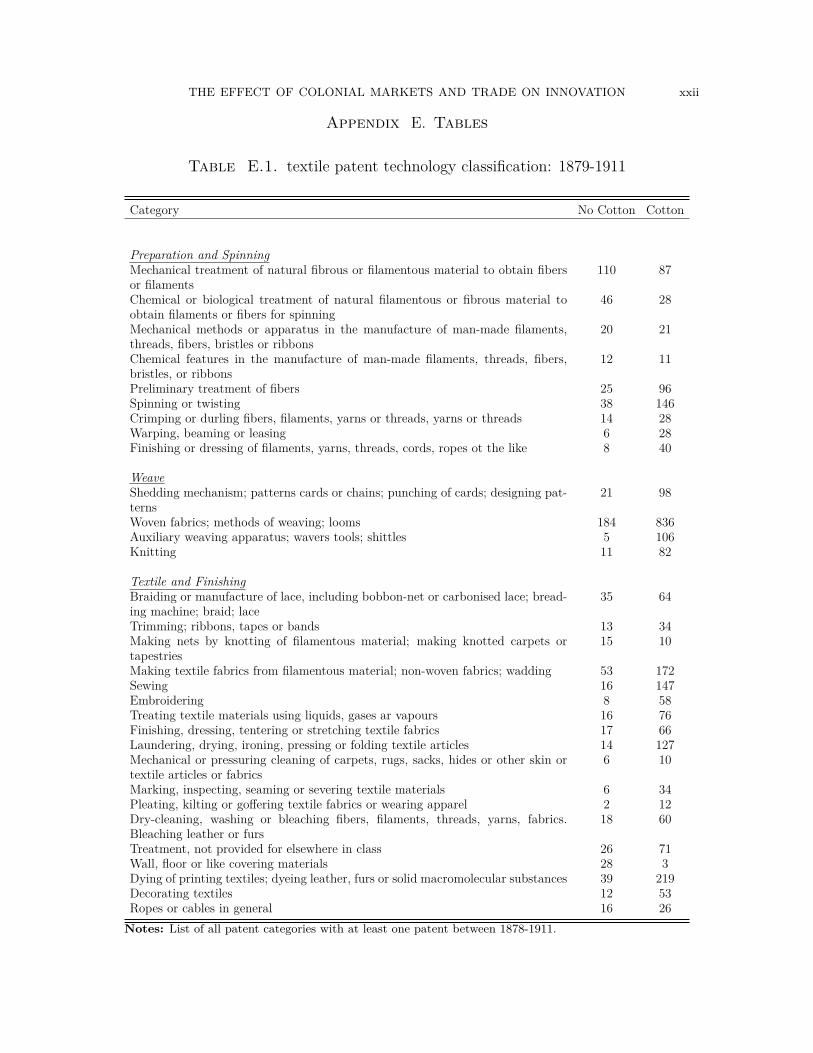
THE EFFECT OF COLONIAL MARKETS AND TRADE ON INNOVATION xxii
Appendix E. Tables
Table E.1. textile patent technology classification: 1879-1911
Category No Cotton Cotton
Preparation and SpinningMechanical treatment of natural fibrous or filamentous material to obtain fibersor filaments
110 87
Chemical or biological treatment of natural filamentous or fibrous material toobtain filaments or fibers for spinning
46 28
Mechanical methods or apparatus in the manufacture of man-made filaments,threads, fibers, bristles or ribbons
20 21
Chemical features in the manufacture of man-made filaments, threads, fibers,bristles, or ribbons
12 11
Preliminary treatment of fibers 25 96Spinning or twisting 38 146Crimping or durling fibers, filaments, yarns or threads, yarns or threads 14 28Warping, beaming or leasing 6 28Finishing or dressing of filaments, yarns, threads, cords, ropes ot the like 8 40
WeaveShedding mechanism; patterns cards or chains; punching of cards; designing pat-terns
21 98
Woven fabrics; methods of weaving; looms 184 836Auxiliary weaving apparatus; wavers tools; shittles 5 106Knitting 11 82
Textile and FinishingBraiding or manufacture of lace, including bobbon-net or carbonised lace; bread-ing machine; braid; lace
35 64
Trimming; ribbons, tapes or bands 13 34Making nets by knotting of filamentous material; making knotted carpets ortapestries
15 10
Making textile fabrics from filamentous material; non-woven fabrics; wadding 53 172Sewing 16 147Embroidering 8 58Treating textile materials using liquids, gases ar vapours 16 76Finishing, dressing, tentering or stretching textile fabrics 17 66Laundering, drying, ironing, pressing or folding textile articles 14 127Mechanical or pressuring cleaning of carpets, rugs, sacks, hides or other skin ortextile articles or fabrics
6 10
Marking, inspecting, seaming or severing textile materials 6 34Pleating, kilting or goffering textile fabrics or wearing apparel 2 12Dry-cleaning, washing or bleaching fibers, filaments, threads, yarns, fabrics.Bleaching leather or furs
18 60
Treatment, not provided for elsewhere in class 26 71Wall, floor or like covering materials 28 3Dying of printing textiles; dyeing leather, furs or solid macromolecular substances 39 219Decorating textiles 12 53Ropes or cables in general 16 26
Notes: List of all patent categories with at least one patent between 1878-1911.
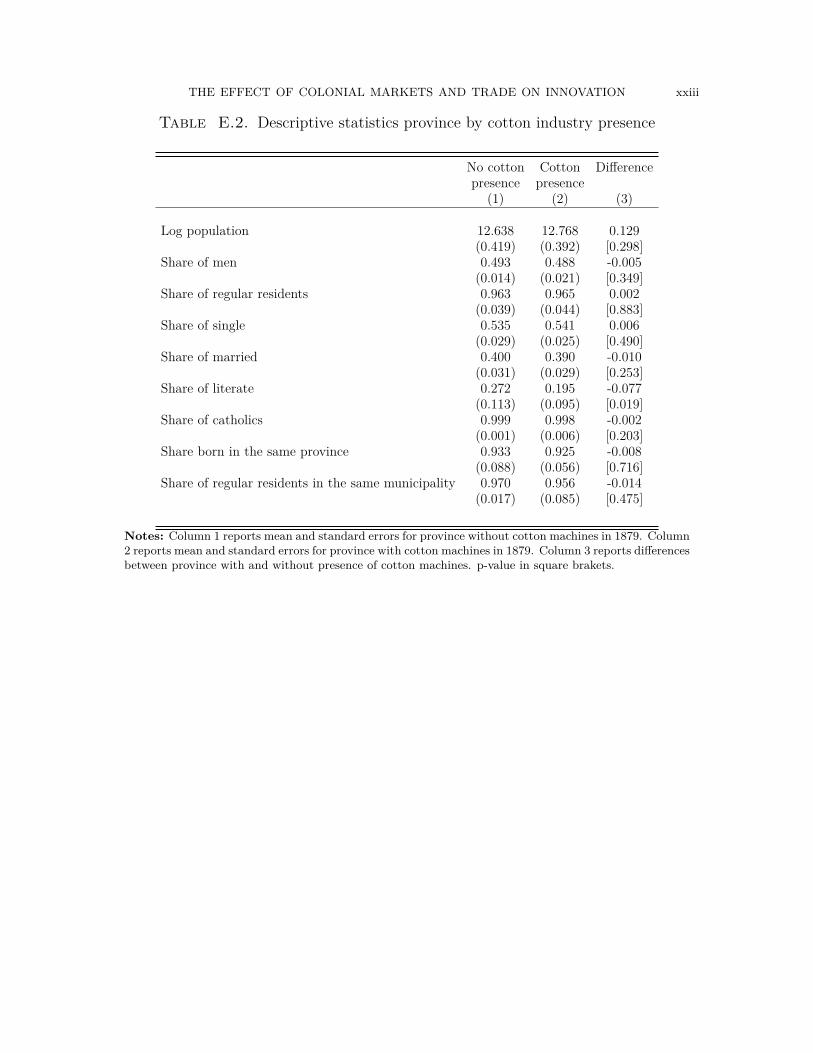
THE EFFECT OF COLONIAL MARKETS AND TRADE ON INNOVATION xxiii
Table E.2. Descriptive statistics province by cotton industry presence
No cotton Cotton Differencepresence presence
(1) (2) (3)
Log population 12.638 12.768 0.129(0.419) (0.392) [0.298]
Share of men 0.493 0.488 -0.005(0.014) (0.021) [0.349]
Share of regular residents 0.963 0.965 0.002(0.039) (0.044) [0.883]
Share of single 0.535 0.541 0.006(0.029) (0.025) [0.490]
Share of married 0.400 0.390 -0.010(0.031) (0.029) [0.253]
Share of literate 0.272 0.195 -0.077(0.113) (0.095) [0.019]
Share of catholics 0.999 0.998 -0.002(0.001) (0.006) [0.203]
Share born in the same province 0.933 0.925 -0.008(0.088) (0.056) [0.716]
Share of regular residents in the same municipality 0.970 0.956 -0.014(0.017) (0.085) [0.475]
Notes: Column 1 reports mean and standard errors for province without cotton machines in 1879. Column2 reports mean and standard errors for province with cotton machines in 1879. Column 3 reports differencesbetween province with and without presence of cotton machines. p-value in square brakets.
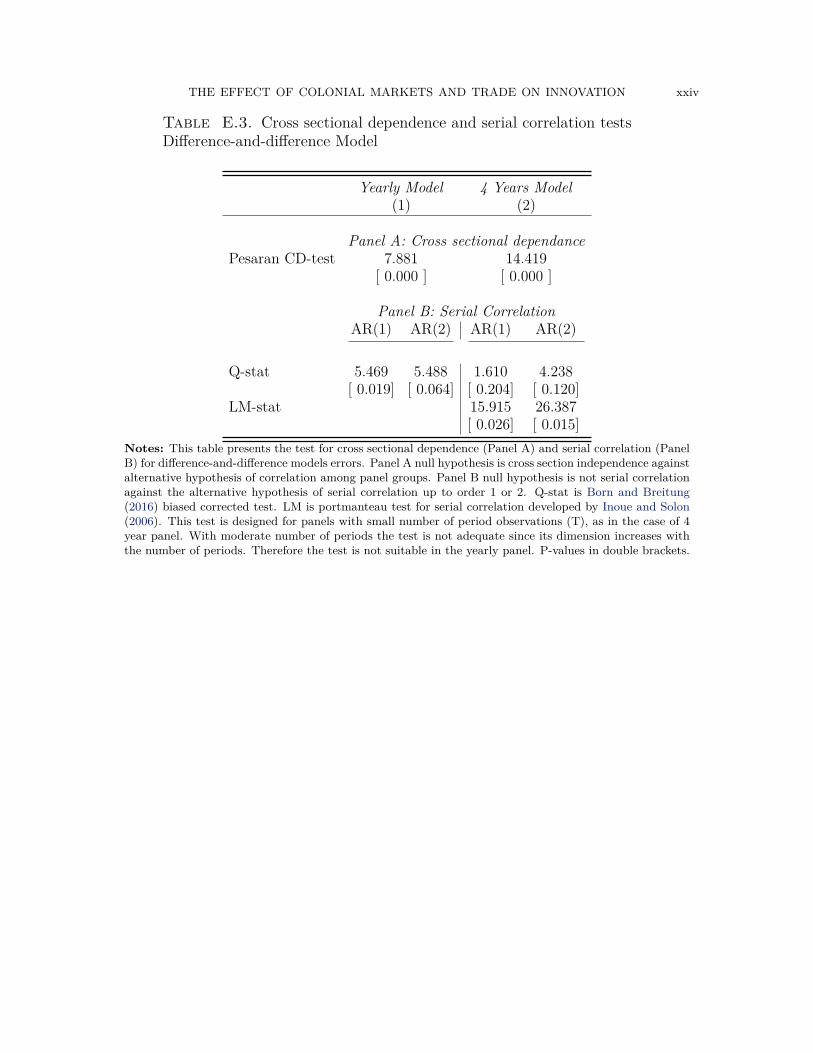
THE EFFECT OF COLONIAL MARKETS AND TRADE ON INNOVATION xxiv
Table E.3. Cross sectional dependence and serial correlation testsDifference-and-difference Model
Yearly Model 4 Years Model(1) (2)
Panel A: Cross sectional dependancePesaran CD-test 7.881 14.419
[ 0.000 ] [ 0.000 ]
Panel B: Serial CorrelationAR(1) AR(2) AR(1) AR(2)
Q-stat 5.469 5.488 1.610 4.238[ 0.019] [ 0.064] [ 0.204] [ 0.120]
LM-stat 15.915 26.387[ 0.026] [ 0.015]
Notes: This table presents the test for cross sectional dependence (Panel A) and serial correlation (PanelB) for difference-and-difference models errors. Panel A null hypothesis is cross section independence againstalternative hypothesis of correlation among panel groups. Panel B null hypothesis is not serial correlationagainst the alternative hypothesis of serial correlation up to order 1 or 2. Q-stat is Born and Breitung(2016) biased corrected test. LM is portmanteau test for serial correlation developed by Inoue and Solon(2006). This test is designed for panels with small number of period observations (T), as in the case of 4year panel. With moderate number of periods the test is not adequate since its dimension increases withthe number of periods. Therefore the test is not suitable in the yearly panel. P-values in double brackets.
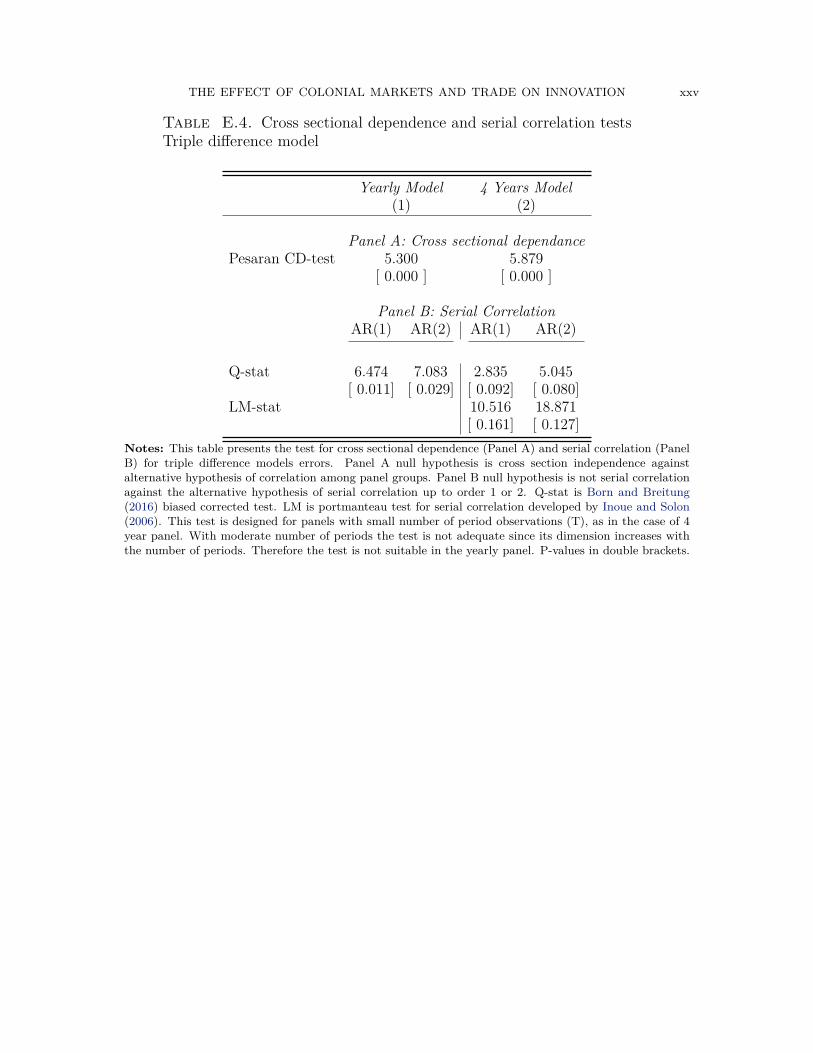
THE EFFECT OF COLONIAL MARKETS AND TRADE ON INNOVATION xxv
Table E.4. Cross sectional dependence and serial correlation testsTriple difference model
Yearly Model 4 Years Model(1) (2)
Panel A: Cross sectional dependancePesaran CD-test 5.300 5.879
[ 0.000 ] [ 0.000 ]
Panel B: Serial CorrelationAR(1) AR(2) AR(1) AR(2)
Q-stat 6.474 7.083 2.835 5.045[ 0.011] [ 0.029] [ 0.092] [ 0.080]
LM-stat 10.516 18.871[ 0.161] [ 0.127]
Notes: This table presents the test for cross sectional dependence (Panel A) and serial correlation (PanelB) for triple difference models errors. Panel A null hypothesis is cross section independence againstalternative hypothesis of correlation among panel groups. Panel B null hypothesis is not serial correlationagainst the alternative hypothesis of serial correlation up to order 1 or 2. Q-stat is Born and Breitung(2016) biased corrected test. LM is portmanteau test for serial correlation developed by Inoue and Solon(2006). This test is designed for panels with small number of period observations (T), as in the case of 4year panel. With moderate number of periods the test is not adequate since its dimension increases withthe number of periods. Therefore the test is not suitable in the yearly panel. P-values in double brackets.
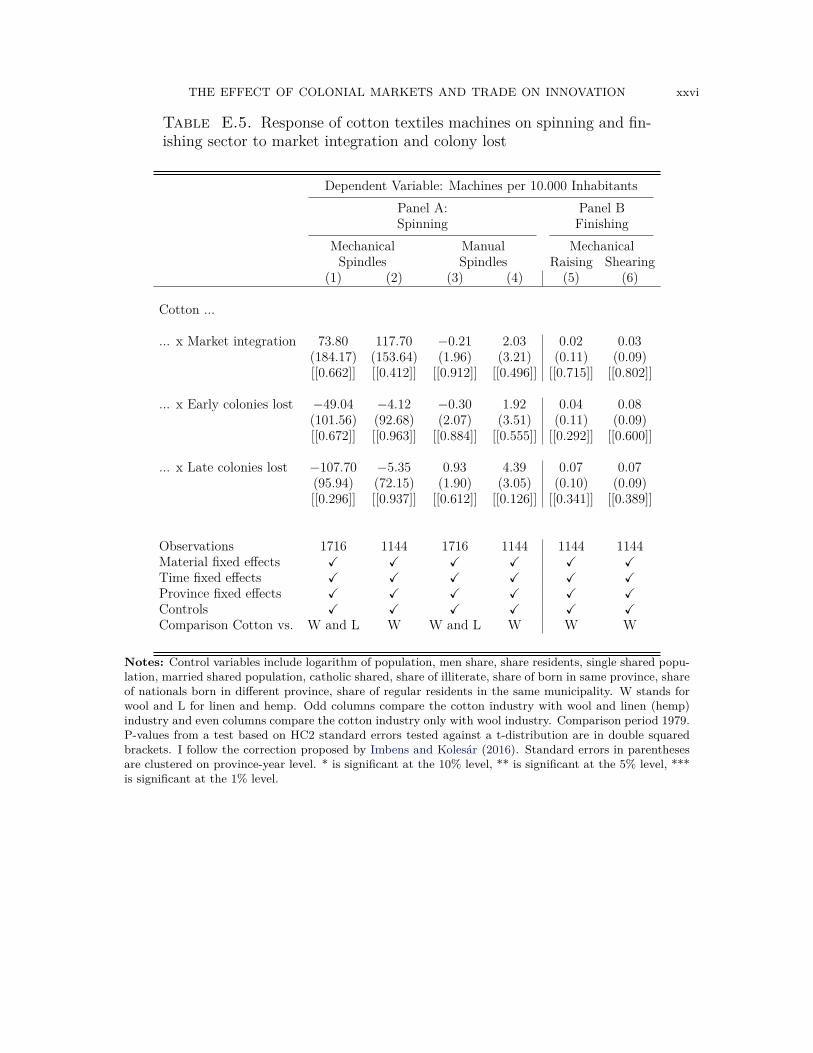
THE EFFECT OF COLONIAL MARKETS AND TRADE ON INNOVATION xxvi
Table E.5. Response of cotton textiles machines on spinning and fin-ishing sector to market integration and colony lost
Dependent Variable: Machines per 10.000 InhabitantsPanel A: Panel BSpinning Finishing
Mechanical Manual MechanicalSpindles Spindles Raising Shearing
(1) (2) (3) (4) (5) (6)
Cotton ...
... x Market integration 73.80 117.70 −0.21 2.03 0.02 0.03(184.17) (153.64) (1.96) (3.21) (0.11) (0.09)[[0.662]] [[0.412]] [[0.912]] [[0.496]] [[0.715]] [[0.802]]
... x Early colonies lost −49.04 −4.12 −0.30 1.92 0.04 0.08(101.56) (92.68) (2.07) (3.51) (0.11) (0.09)[[0.672]] [[0.963]] [[0.884]] [[0.555]] [[0.292]] [[0.600]]
... x Late colonies lost −107.70 −5.35 0.93 4.39 0.07 0.07(95.94) (72.15) (1.90) (3.05) (0.10) (0.09)[[0.296]] [[0.937]] [[0.612]] [[0.126]] [[0.341]] [[0.389]]
Observations 1716 1144 1716 1144 1144 1144Material fixed effects X X X X X XTime fixed effects X X X X X XProvince fixed effects X X X X X XControls X X X X X XComparison Cotton vs. W and L W W and L W W W
Notes: Control variables include logarithm of population, men share, share residents, single shared popu-lation, married shared population, catholic shared, share of illiterate, share of born in same province, shareof nationals born in different province, share of regular residents in the same municipality. W stands forwool and L for linen and hemp. Odd columns compare the cotton industry with wool and linen (hemp)industry and even columns compare the cotton industry only with wool industry. Comparison period 1979.P-values from a test based on HC2 standard errors tested against a t-distribution are in double squaredbrackets. I follow the correction proposed by Imbens and Kolesar (2016). Standard errors in parenthesesare clustered on province-year level. * is significant at the 10% level, ** is significant at the 5% level, ***is significant at the 1% level.