Embed Size (px)
Citation preview
The Effect of Compliance
in the Upper Airway
Marcin Buchajczyk
A thesis submitted in partial requirement for the degree of
Master of Engineering in Mechanical Engineering
University of Canterbury
Christchurch, New Zealand
2017

i

ii
Acknowledgements
First and foremost, I would like to thank my primary supervisor, Associate Professor Mark Jermy, whose expertise
and guidance made this research project possible. I am grateful for the opportunity you have given me to pursue
this research.
I would also like to extend my gratitude to my secondary supervisor, Dr. Patrick Geoghegan, and my advisor, Dr.
Callum Spence. The insight, support and mentorship that you have provided has been invaluable.
To my friends and colleagues in the airway group: Jonathan Aplin, Cletus Adams, Natalia Kabaliuk and the
remainder of the team based in The University of Auckland. Thank you for all your help, valuable advice and
banter. It has been an absolute pleasure to work alongside you.
I would also like to give a special thanks to the contributions from the technical staff in the Mechanical Engineering
department at the University of Canterbury: David Read, Kevin Stobbs, Gary Cotton, and Eric Cox. Also, thank
you to Jasgir Khera, at Fisher & Paykel Healthcare.
To MBIE Smart Ideas Grant for funding the project and to Fisher & Paykel Healthcare for giving me the
opportunity to carry out this study.
To Emma Murphy. You have motivated me through this project and have helped me through times of doubt. You
have my sincerest gratitude.
Lastly, I would like to thank my parents, whom I owe so much. All your love, support and teachings has helped
to guide me through my life. Kocham was z całego serca.

iii
iv
Abstract
Nasal high flow therapy (NHFT) has been previously studied on anatomically correct physical airway models
using a benchtop setup. In the current study it was desired to elaborate on previous work by incorporating
physiological accuracy in the model by simulating the compliance of the internal soft tissues in the airway. Three
tissues of interest were investigated: the soft palate, the tongue and the vocal folds. A multi-part mouth open airway
model was designed to fit interchangeable compliant structures and fabricated using 3D printing. The model was
tested with soft and rigid inserts to compare between compliant and rigid boundary conditions, respectively.
Compliance was simulated by fabricating the soft inserts with a silicone resin that matched the elastic modulus of
the relevant biological tissues. Pressure measurements were conducted along the airway at different points using
pressure sensing probes that were inserted in specially designed taps located along the model. Breathing was
simulated using a pulsatile pump and experiments were carried out for natural and NHFT assisted breathing. It
was discovered that the soft palate was the only compliant structure that affected the pharyngeal airway pressures
for all tested breathing cases. During natural breathing, the compliant soft palate caused pharyngeal pressures to
be more negative at peak inspiration by 15.5 ± 5.7 % to 35.3 ± 12.1 % of the corresponding peak-to-peak pressures
of the rigid airway model. Greater pressures were measured in the pharynx at peak expiration, with an increase by
3.8 ± 2.6 % to 10.7 ± 2.7 %. During NHFT assisted breathing at 30 L/min, the compliant airway experienced a
greater peak inspiratory pressure at the velopharynx only with an increase of 8.0 ± 5.5 %, and globally increased
peak expiratory pressures by 9.3 ± 1.1 % to 23.7 ± 5.5 %. During NHFT assisted breathing at 60 L/min, peak
inspiratory and expiratory pressures were greater than corresponding airway pressures in the rigid model. Peak
inspiratory pressures increased by 6.7 ± 4.6 % to 20.6 ± 7.6 % and expiratory pressures increased by 27.9 ± 4.4 %
to 45.6 ± 10.6 %. It was hypothesised that flow induced motion of the compliant soft palate increased the resistance
to the air flowing through the oral cavity and hence why it affected the pressures globally throughout the airway.
The tongue and vocal folds showed no statistically significant difference, concluding that the compliance of these
tissues does not affect breathing pressures. The capnography experiments concluded that, once again only soft
palate compliance affected CO2 gas mixing; however, this was limited to the oral cavity region and only for the
NHFT assisted conditions.

v
vi
Table of Contents
Acknowledgements ................................................................................................................................................. ii
Abstract .................................................................................................................................................................. iv
Table of Contents ................................................................................................................................................... vi
Table of Figures ........................................................................................................................................................x
Table of Tables .................................................................................................................................................... xxii
1 Introduction ......................................................................................................................................................1
1.1 Nasal High Flow Therapy.........................................................................................................................1
1.2 Project Purpose .........................................................................................................................................1
1.3 Thesis Structure ........................................................................................................................................2
2 Background Information...................................................................................................................................3
2.1 Anatomy of the Respiratory System .........................................................................................................3
2.2 Spirometry ................................................................................................................................................5
2.3 Soft Tissues in the Airway........................................................................................................................7
2.3.1 The Tongue and Soft Palate ..............................................................................................................7
2.3.2 Vocal Folds .......................................................................................................................................8
3 Literature Review ...........................................................................................................................................12
3.1 Airway Studies .......................................................................................................................................12
3.1.1 Airway Modelling...........................................................................................................................12
3.1.2 Nasal High Flow Therapy ...............................................................................................................13
3.2 Tissue Properties ....................................................................................................................................16
3.2.1 Soft Palate and Tongue ...................................................................................................................16
3.2.2 Vocal Fold Tissues .........................................................................................................................17
3.3 Studies in Compliance ............................................................................................................................19
3.3.1 Compliant Soft Palate Airway Condition .......................................................................................19
3.3.2 Compliant Tongue ..........................................................................................................................20
3.3.3 Compliant Vocal Folds ...................................................................................................................21
4 Airway Model Development ..........................................................................................................................24
4.1 Introduction ............................................................................................................................................24
4.2 Digital Airway ........................................................................................................................................24
4.2.1 Airway Geometry ...........................................................................................................................24
4.2.2 Post processing Raw STL ...............................................................................................................25
4.2.3 Processing STL into printable airway model. .................................................................................27
4.2.4 Insert Design ...................................................................................................................................30
4.3 3D Printing of Rigid Components ..........................................................................................................35
vii
4.3.1 Airway and Rigid Inserts ................................................................................................................35
4.3.2 Realignment ....................................................................................................................................36
4.4 Compliant Insert Fabrication ..................................................................................................................37
4.4.1 Simulating Compliance ..................................................................................................................37
4.4.2 Casting Process ...............................................................................................................................39
4.5 Assembling and Sealing .........................................................................................................................44
4.5.1 Leak Testing and Gasket Selection.................................................................................................44
4.5.2 Seal Protrusion ................................................................................................................................48
4.6 Conclusion ..............................................................................................................................................49
4.7 Future Model Considerations .................................................................................................................50
4.7.1 Designs to Minimize Warping Effects ...........................................................................................50
4.7.2 Gasket Material...............................................................................................................................51
5 Experimental System Components .................................................................................................................52
5.1 Introduction ............................................................................................................................................52
5.2 Pulsatile Lung Pump ...............................................................................................................................52
5.3 Physiological Breath Pattern ..................................................................................................................54
5.4 Pressure testing elements ........................................................................................................................55
5.5 Capnography and CO2 ............................................................................................................................56
5.6 Optiflow Nasal Cannula and Airvo ........................................................................................................58
5.6.1 Airvo ...............................................................................................................................................58
5.6.2 Cannula Size ...................................................................................................................................58
5.6.3 Cannula Positions ...........................................................................................................................60
5.7 Miscellaneous Components ....................................................................................................................61
6 Flow Rate Distribution in an Open Mouth Airway ........................................................................................64
6.1 Introduction ............................................................................................................................................64
6.2 Experimental Procedure .........................................................................................................................64
6.3 Data Processing ......................................................................................................................................65
6.4 Flow Rate Pattern and Measurements ....................................................................................................65
7 Static Pressure Experimental Procedure and Data Processing .......................................................................70
7.1 Experimental Procedure .........................................................................................................................70
7.2 Data processing ......................................................................................................................................72
8 Pressure Test: Compliant Soft Palate .............................................................................................................74
8.1 Introduction ............................................................................................................................................74
8.2 Natural Breathing: Inspiration ................................................................................................................75
8.3 Natural Breathing: Expiration ................................................................................................................81
8.4 NHFT at 30 L/min with a Compliant Soft Palate: Inspiration ................................................................86
viii
8.5 Compliant Soft Palate NHFT 30 L/min: Expiration ...............................................................................92
8.6 NHFT 60 L/min with a Compliant Soft Palate: Inspiration ...................................................................97
8.7 NHFT 60 L/min with a Compliant Soft Palate: Expiration ..................................................................103
8.8 Supine vs Prone ....................................................................................................................................107
8.8.1 Natural Breathing .........................................................................................................................107
8.8.2 NHFT 30 L/min ............................................................................................................................108
8.8.3 NHFT 60 L/min ............................................................................................................................110
8.9 Conclusion ............................................................................................................................................112
9 Pressure Test: Compliant Tongue .................................................................................................................114
9.1 Introduction ..........................................................................................................................................114
9.2 Results ..................................................................................................................................................114
9.2.1 Natural Breathing .........................................................................................................................114
9.2.2 NHFT 30 L/min ............................................................................................................................116
9.2.3 NHFT 60 L/min ............................................................................................................................117
9.3 Discussion .............................................................................................................................................118
9.4 Conclusion ............................................................................................................................................120
10 Pressure Test: Compliant Vocal Folds .....................................................................................................121
10.1 Introduction ..........................................................................................................................................121
10.2 Results ..................................................................................................................................................122
10.2.1 Natural Breathing .........................................................................................................................122
10.2.2 NHFT at 30 L/min ........................................................................................................................124
10.2.3 NHFT 60 L/min ............................................................................................................................127
10.3 Discussion .............................................................................................................................................129
10.4 Conclusion ............................................................................................................................................132
11 Capnography .............................................................................................................................................133
11.1 Introduction ..........................................................................................................................................133
11.2 Experimental Procedure .......................................................................................................................134
11.3 Data Processing ....................................................................................................................................134
11.4 Rigid Open Mouth Airway ...................................................................................................................135
11.5 Compliant Soft Palate ...........................................................................................................................142
11.5.1 Natural Breathing .........................................................................................................................142
11.5.2 NHFT 30 L/min ............................................................................................................................143
11.5.3 NHFT 60 L/min ............................................................................................................................145
11.6 Compliant Tongue ................................................................................................................................146
11.7 Compliant Vocal Folds .........................................................................................................................148
11.8 Conclusion ............................................................................................................................................150

ix
12 Conclusion ................................................................................................................................................152
13 Future Work ..............................................................................................................................................156
References ............................................................................................................................................................158
x
Table of Figures
Figure 1. Anatomical planes and terms of location. Adapted from Boundless (2016) .............................................3
Figure 2. Human respiratory system. Adapted from Tortora and Derrickson (2011). .............................................4
Figure 3. Anatomy of the upper airway. Image created by the author. ....................................................................5
Figure 4. Lung volumes in adult humans. The capacities in brackets correspond to female physiology. Image
created by the author. ..................................................................................................................................6
Figure 5. The soft palate structure and location. Adapted from www.headandneckcancerguid.org ........................7
Figure 6. Anatomy of the human tongue. Adapted from Drake et al. (2009) ...........................................................8
Figure 7. Frontal cross-section of the larynx (left), axial view of the vocal folds, as would be seen with a
laryngoscope (right). Adapted from Tortora and Derrickson (2011). .........................................................9
Figure 8. Coronal cross-section of a single vocal fold showing the histology. Adapted from Rosen et al. (2008)..9
Figure 9. Axial view of the connective and muscular tissue located in the larynx. Adapted from Gray (2009) ....10
Figure 10. Coronal cross-section of the vocal folds illustrating the vibration of the tissues during phonation.
Adapted from Rosen et al. (2008) .............................................................................................................11
Figure 11. In vitro airway model to replicate a compliant tongue condition. Adapted from Chouly et al. (2009).
...................................................................................................................................................................20
Figure 12. Vocal fold model adapted from Thomson et al. (2005) ........................................................................23
Figure 13. A sagittal slice of a CT scan (left) and an extracted geometry (right) ..................................................25
Figure 14. Edited STL with streak artefact about the mouth region.......................................................................26
Figure 15. Airway STL with artefact removal and trachea truncation. ..................................................................26
Figure 16. Airway shell after surface extrusion......................................................................................................27
Figure 17. Map of pressure tap locations in the airway model. The numbers represent the taps, and the coloured
lines correspond to their position on the airway. Red = left sagittal, orange = right sagittal and green =
posterior or superior. The coloured airway sections correspond to the different regions in the upper airway.
...................................................................................................................................................................28
xi
Figure 18. Dimensions for the pressure ports along the airway .............................................................................29
Figure 19. Digital model of completed airway. Grey and brown regions in the right image correspond to right and
left halves, respectively. ............................................................................................................................29
Figure 20. Airway half (grey) showing the tissue region cavities and the female mating interfaces (left), and airway
showing soft palate (purple), tongue (brown) and vocal fold (green) inserts fitted into model (right). ....30
Figure 21. Raw soft palate geometry (left) and a soft palate insert design (right). A boss was extruded on both
sagittal sides of the soft palate body, following the contour of the soft palate shape. A stepped, ‘T’ shaped
flange was extruded on top of the insert. ...................................................................................................31
Figure 22. Soft palate insert (shown in purple) fitting into the airway (shown in grey). .......................................31
Figure 23. Airway sample of left soft palate mating region (Left). Quality of join test for the soft palate insert
(right) .........................................................................................................................................................32
Figure 24. Process of tongue extraction from CT scan (left), to raw 3D model (middle) to edited STL (right). ...32
Figure 25. Transition of tongue geometry (left) to a printable insert (right). .........................................................33
Figure 26. Depiction of how the tongue insert (brown) fits into the airway model (grey). ....................................33
Figure 27. Raw vocal folds from raw airway model (left), final vocal fold insert (middle) and sagittal cross-section
of insert illustrating the internal airway passage (left). .............................................................................34
Figure 28. Vocal fold insert fitting into the airway model. ....................................................................................34
Figure 29. 3D printed rigid inserts. From left to right: Soft palate, tongue and larynx ..........................................35
Figure 30. 3D printed airway half with inserts .......................................................................................................36
Figure 31. 3D printed airway, pre-alignment .........................................................................................................37
Figure 32. Soft palate mould (top left), mould immersed in silicone resin (top right), tongue mould (bottom left)
tongue mould immersed in silicone resin (bottom right)...........................................................................40
Figure 33. Compliant tongue (left) and soft palate (right) casts .............................................................................41
Figure 34. The completed compliant tongue insert (left) and compliant soft palate insert (right) .........................42
Figure 35. Schematic of the complaint fold insert. Vocal fold insert with an intersecting coronal plane (left) and
the corresponding, posterior coronal section view showing the internal compliant region (right). ..........42
xii
Figure 36. Compliant vocal fold casting. The sacrificial internal mould (top left), the rigid frame (top right), the
assembled mould (bottom left) and a bottom view of the mould (bottom right).......................................43
Figure 37. Laser cut latex gasket ............................................................................................................................45
Figure 38. Seal and leak test setup .........................................................................................................................46
Figure 39. Results for open airway leak test ..........................................................................................................46
Figure 40. Results for closed airway leak test ........................................................................................................47
Figure 41. Complete Airway Model .......................................................................................................................48
Figure 42 Perspex template and PVC gasket ..........................................................................................................48
Figure 43 Perspex plate for gasket trimming ..........................................................................................................49
Figure 44. Schematic of the experimental setup. Note: The pressure sensors and capnography are represented by
one component in this diagram. These are actually two separate systems. ...............................................52
Figure 45. Lung pump setup ...................................................................................................................................53
Figure 46. Breath pattern supplied by the pump, measured with a TSI 4040 flowmeter .......................................55
Figure 47. The second pressure sensing system used for the static pressure experiments. Single pressure sensor
(left) and ten pressure sensor setup (right) ................................................................................................56
Figure 48. Example of a sealed tab with pressure sensing probe. ..........................................................................56
Figure 49. Oridian Microstream™ microMediCO2™ capnography used for the CO2 experiments ......................57
Figure 50. Small cannula (left) and medium cannula (right) adapted to the airway model. ..................................59
Figure 51. Left shows a large cannula adapted to airway model .Cannula outlet region cannot be seen due to the
depth of insertion. Right shows an axial cross-section of the nasal cavity illustrated in green with large
nasal cannula and regions where prong deformation occurs. ....................................................................59
Figure 52. Nasal cannula positions left-most, middle and right-most positions (from left to right). .....................60
Figure 53. Airway pressures for one averaged breath cycle with different cannula positions. ..............................61
Figure 54. Airway model testing position. .............................................................................................................61
Figure 55. TSI 4040 flowmeter ..............................................................................................................................62
Figure 56. Honeywell Flowmeter ...........................................................................................................................63

xiii
Figure 57. Endoscopic Camera ...............................................................................................................................63
Figure 58. Flow measurement setup for the airway model. The setup for the mouth (left), used for both natural and
NHFT breathing condition, and the setup for the nose, with the nasal mask (right) for the natural breathing
condition only. The figures depict the setup for a natural breathing condition. ........................................65
Figure 59. Diagram of the sagittal cross-section of the upper airway. Illustration of air flow streamlines for natural
breathing during inspiratory (left) and expiratory (right) phases. .............................................................66
Figure 60. Diagram of the sagittal cross-section of the upper airway. Illustration of air flow streamlines for NHFT
30 L/min breathing during inspiratory (left) and expiratory (right) phases. ..............................................67
Figure 61. Diagram of the sagittal cross-section of the upper airway. Illustration of air flow streamlines for NHFT
60 L/min breathing during inspiratory (left) and expiratory (right) phases. ..............................................68
Figure 62. Tap locations along the airway. The numbers represent the taps, and the coloured lines correspond to
their position on the airway. Red = left sagittal, orange = right sagittal and green = posterior or superior.
The coloured airway sections correspond to the different regions in the upper airway. ...........................71
Figure 63. Savitzky-Golay filter implementation on a raw pressure signal. ..........................................................72
Figure 64. An example of a mean pressure profile for a single breath at an arbitrary airway location. .................73
Figure 65. Airway Tap Location Map ....................................................................................................................75
Figure 66. Peak inspiratory static pressures measured along the airway during natural breathing for both an open
mouth rigid and compliant soft palate airway condition, and a closed mouth rigid airway. Error bars
correspond to an uncertainty of 2 standard deviations. .............................................................................76
Figure 67. Difference in peak inspiratory pressures between open mouth rigid and compliant soft palate airway
conditions (compliant minus rigid). The results are for natural breathing. Error bars correspond to an
uncertainty of 2 standard deviations. .........................................................................................................76
Figure 68. Airflow schematic peak inspiration.......................................................................................................77
Figure 69. Air flow distribution during peak inspiration in natural breathing, with the absolute difference between
the two. The error bars correspond to an uncertainty of 2 standard deviations. ........................................78
xiv
Figure 70. Peak expiratory static pressures measured along the airway during natural breathing for both an open
mouth rigid and compliant soft palate airway condition, and a closed mouth rigid airway. Error bars
correspond to an uncertainty of 2 standard deviations. .............................................................................82
Figure 71. Difference in peak inspiratory pressures between open mouth rigid and compliant soft palate airway
conditions (compliant minus rigid). The results are for natural breathing. Error bars correspond to an
uncertainty of 2 standard deviations. .........................................................................................................82
Figure 72. Airflow schematic during natural breathing peak expiration ................................................................83
Figure 73. Flow rates in the rigid and compliant soft palate airway during natural breathing at peak expiration and
absolute difference between the two. Error bars correspond to an uncertainty of 2 standard deviations. .84
Figure 74. Peak inspiratory static pressures measured along the airway during NHFT assisted breathing at 30
L/min. This shows pressure measurements for an open mouth rigid and compliant soft palate airway
condition. Error bars correspond to an uncertainty of 2 standard deviations. ...........................................86
Figure 75. Difference between rigid and compliant pressures on peak inspiration (compliant minus rigid). The
error bars correspond to an uncertainty of 2 standard deviations ..............................................................87
Figure 76. Flow distribution in the rigid and compliant soft palate condition airway during inspiration with NHFT
at 30 L/min. Positive direction corresponds to flow entering the airway, negative directions corresponds
to flow leaving the airway. Also shows absolute difference between rigid and compliant flow rate. Error
bars correspond to an uncertainty of 2 standard deviations. ......................................................................87
Figure 77. Air flow schematic illustrating flow distribution during inspiration with NHFT at 30 L/min ..............88
Figure 78. Diagram showing a mid-sagittal cross-section of the airway to illustrate hypothesis I. The yellow soft
palate represents the position for a rigid condition, and the super-imposed, pink soft palate represents the
compliant condition with the motion described for hypothesis I. The arrows illustrate the direction of air
flow (blue = atmospheric air, red = NHFT air). ........................................................................................89
Figure 79. Diagram coronal section view of the soft palate insert from the posterior direction of the CAD model
(left) and a schematic of the mid-sagittal cross-section to illustrate hypothesis II (right). In the right image,
the yellow soft palate represents the position for a rigid condition, and the super-imposed, pink soft palate
xv
represents the compliant condition with the motion described for hypothesis II. The arrows illustrate the
direction of air flow (blue = atmospheric air, red = NHFT air). ................................................................90
Figure 80. Diagram showing a mid-sagittal cross-section of the airway to illustrate hypothesis III. The yellow soft
palate represents the position for a rigid condition, and the super-imposed, pink soft palate represents the
compliant condition with the motion described for hypothesis III. The arrows illustrate the direction of air
flow (blue = atmospheric air, red = NHFT air). ........................................................................................91
Figure 81. Peak expiratory gauge pressures measured along the airway during NHFT assisted breathing at 30
L/min. This shows pressure measurements for an open mouth rigid and compliant soft palate airway
condition. Error bars correspond to an uncertainty of 2 standard deviations. ...........................................93
Figure 82. Pressure difference between compliant and rigid soft palate conditions on peak expiration (compliant
minus rigid) with NHFT 30 L/min. The error bars correspond to an uncertainty of 2 standard deviations.
...................................................................................................................................................................93
Figure 83. PIV data for open mouth breathing at peak expiration with NHFT 30 L/min. Adapted from Spence
(2011) ........................................................................................................................................................94
Figure 84. Airflow schematic during NHFT 30 L/min peak expiration .................................................................94
Figure 85. Flow distribution in the rigid and compliant soft palate condition airway during expiration with NHFT
at 30 L/min. Positive direction corresponds to flow entering the airway, negative directions corresponds
to flow entering the airway. Error bars correspond to an uncertainty of 2 standard deviations. ...............95
Figure 86. Diagram showing a mid-sagittal cross-section of the airway. The yellow soft palate represents the
position for a rigid condition, and the super-imposed, pink soft palate represents the compliant condition
with the anterior motion. The arrows illustrate the direction of air flow...................................................96
Figure 87. Peak inspiratory pressures along the airway for NHFT 60 L/min. The results are shown for an airway
with a rigid and compliant soft palate condition The error bars correspond to an uncertainty of 2 standard
deviations. ..................................................................................................................................................98
Figure 88. Pressure difference between compliant and rigid soft palate conditions on peak inspiration with NHFT
at 60 L/min (compliant – rigid). The error bars correspond to an uncertainty of 2 standard deviations. ..98
xvi
Figure 89. Schematic illustrating the direction of air flow during inspiration with NHFT at 60 L/min. ...............99
Figure 90. Flow rate partitioning in rigid and compliant soft palate condition airway during inspiration with NHFT
at 60 L/min. Negative flow rates indicate that flow is travelling outward from the airway. The error bars
correspond to an uncertainty of 2 standard deviations. ...........................................................................100
Figure 91. Diagram showing a mid-sagittal cross-section of the airway. The yellow soft palate represents the
position for a rigid condition, and the super-imposed, pink soft palate represents the compliant condition
with hypothesis I. The arrows illustrate the direction of air flow. ...........................................................101
Figure 92. Diagram showing a mid-sagittal cross-section of the airway. The yellow soft palate represents the
position for a rigid condition, and the super-imposed, pink soft palate represents the compliant condition
with hypothesis II. The arrows illustrate the direction of air flow. .........................................................102
Figure 93. Peak expiratory pressures along compliant and rigid airway for NHFT assisted breathing at 60 L/min.
The error bars correspond to an uncertainty of 2 standard deviations. ....................................................104
Figure 94. Pressure difference between compliant and rigid soft palate conditions on peak expiration with NHFT
at 60 L/min (compliant minus rigid). The error bars correspond to an uncertainty of 2 standard deviations.
.................................................................................................................................................................104
Figure 95. Flow rate partitioning in rigid and compliant soft palate condition airway at peak expiration with NHFT
at 60 L/min. Negative flow rates indicate that flow is travelling outward from the airway while positive
flow rates indicate an inward flow. The error bars correspond to an uncertainty of 2 standard deviations.
.................................................................................................................................................................105
Figure 96. Prone vs supine for a compliant soft palate airway condition during natural breathing. The error bars
correspond to an uncertainty of 2 standard deviations ............................................................................107
Figure 97. Prone vs supine for a compliant soft palate condition, and supine results for a rigid airway. Breathing
with NHFT at 30 L/min. The error bars correspond to an uncertainty of two standard deviations. ........108
Figure 98. Soft palate motion during inspiration with NHFT 30 L/min. Soft palate motion in the supine position
(left) and the prone position (left) under the premise of hypothesis III. The yellow soft palate represents
xvii
the position for a rigid condition, and the super-imposed, pink soft palate represents the compliant
condition. .................................................................................................................................................109
Figure 99. Prone vs supine for compliant soft palate condition, and supine results for a rigid airway. Breathing
with NHFT at 60 L/min. The error bars correspond to an uncertainty of 2 standard deviations. ............110
Figure 100. Hypothesis II for NHFT 60 L/min inspiration with a compliant soft palate. This shows the soft palate
motion for a supine position (left) and prone position (right). ................................................................112
Figure 101. Summary of mean peak expiratory and inspiratory pressures during natural breathing for rigid and
compliant tongue conditions. The peak pressures shown correspond to the tap locations in the pharynx.
The error bars correspond to an uncertainty of 2 standard deviations. ....................................................115
Figure 102. Differences in peak airway pressures between rigid and compliant tongue conditions during natural
breathing. .................................................................................................................................................115
Figure 103. Summary of mean peak expiratory and inspiratory pressures during NHFT 30 L/min assisted breathing
for rigid and compliant tongue conditions. The peak pressures shown correspond to the tap locations in
the pharynx. The error bars correspond to an uncertainty of 2 standard deviations. ...............................116
Figure 104. Difference in peak airway pressures between rigid and compliant tongue conditions during NHFT
assisted breathing at 30 L/min. error bars correspond to an uncertainty of 2 standard deviations. .........116
Figure 105. Summary of mean peak expiratory and inspiratory pressures during NHFT 60 L/min assisted breathing
for rigid and compliant tongue conditions. The peak pressures shown correspond to tap locations in the
pharynx. The error bars correspond to an uncertainty of 2 standard deviations. .....................................117
Figure 106. Differences in peak airway pressures between rigid and compliant tongue conditions during NHFT
assisted breathing at 60 L/min. Error bars correspond to an uncertainty of 2 standard deviations. ........117
Figure 107. A truncated diagram of the airway. This illustrates the pressure tap locations in the laryngopharynx,
larynx and the trachea. .............................................................................................................................121
Figure 108. Peak expiratory and inspiratory airway pressures throughout the pharynx during natural breathing.
The plot shows a comparison between rigid and compliant vocal fold conditions. The error bars correspond
to an uncertainty of 2 standard deviations. ..............................................................................................122
xviii
Figure 109. The mean transient pressure profiles during natural breathing. The measurements are shown in the
laryngopharynx, larynx and trachea (taps 21, 22, 23, 24, 27 and 28) for rigid and compliant vocal fold
conditions. The error bars correspond to an uncertainty of 2 standard deviations. .................................123
Figure 110. Difference between rigid and compliant vocal fold airway pressures at peak expiration and peak
inspiration during natural breathing. The error bars correspond to an uncertainty of 2 standard deviations.
.................................................................................................................................................................124
Figure 111. Peak expiratory and inspiratory airway pressures throughout the pharynx during NHFT assisted
breathing at 30 L/min. The plot shows a comparison between rigid and compliant vocal fold conditions.
The error bars correspond to an uncertainty of 2 standard deviations. ....................................................125
Figure 112. The mean transient pressure profiles during NHFT assisted breathing at 30 L/min. The measurements
are shown in the laryngopharynx, larynx and trachea (taps 21, 22, 23, 24, 27 and 28) for rigid and
compliant vocal fold conditions. The error bars correspond to an uncertainty of 2 standard deviations.
.................................................................................................................................................................126
Figure 113. Difference between rigid and compliant vocal fold airway pressures at peak expiration and peak
inspiration during NHFT assisted breathing at 30 L/min. The error bars correspond to an uncertainty of 2
standard deviations. .................................................................................................................................127
Figure 114. Peak expiratory and inspiratory airway pressures throughout the pharynx during NHFT assisted
breathing at 60 L/min. The plot shows a comparison between rigid and compliant vocal fold conditions.
The error bars correspond to an uncertainty of 2 standard deviations. ....................................................127
Figure 115. The mean transient pressure profiles during NHFT assisted breathing at 60 L/min. The measurements
are shown in the laryngopharynx, larynx and trachea (taps 21, 22, 23, 24, 27 and 28) for rigid and
compliant vocal fold conditions. Error bars correspond to an uncertainty of 2 standard deviations. ......128
Figure 116. Difference between rigid and compliant vocal fold airway pressures at peak expiration and peak
inspiration during NHFT assisted breathing at 60 L/min. The error bars correspond to an uncertainty of 2
standard deviations. .................................................................................................................................129
xix
Figure 117. An example of a time dependent CO2 concentration profile in the upper airway for a single breath.
.................................................................................................................................................................133
Figure 118. Mean EtCO2 throughout the rigid, open mouth airway. This is shown for natural breathing and NHFT
at 30 L/min and 60 L/min. It should be noted that the EtCO2 for the NP and VP regions reduce to 0 % for
the NHFT cases. Error bars correspond to an uncertainty of 2 standard deviations. ...............................135
Figure 119. PIV obtained flow profile adapted from Spence (2011), for open mouth breathing with NHFT at 30
L/min. This shows a sagittal cross section of the oral cavity, nasopharynx, velopharynx and oropharynx.
Each image shows a different phase of the respiratiory cycle. Images a to e correspond to expiratory phase
and images f to h correspond to inspiratory phase. .................................................................................136
Figure 120. CO2 concentration profiles in the laryngopharynx (tap 23), for natural breathing and NHFT at 30 L/min
and 60 L/min. Error bars correspond to an uncertainty of 2 standard deviations. ...................................138
Figure 121. Mean EtCO2 in the airway carried out for natural breathing and NHFT ( flow rates at 10, 20 30 and 60
L/min). Error bars correspond to an uncertainty of 2 standard deviations. .............................................139
Figure 122. CO2 concentration profiles in the oral cavity (tap 5 (left) and tap 6 (right)) for natural breathing and
NHFT at 30 L/min and 60 L/min. Error bars correspond to an uncertainty of 2 standard deviations. ....141
Figure 123. Airway section model with dashed line denoting sectioning on the coronal plane (left) and resultant
coronal section view of the soft palate insert from the posterior direction (right). .................................141
Figure 124. Mean EtCO2 concentrations along the airway during natural breathing for rigid and compliant soft
palate airway conditions. This also shows the absolute difference in EtCO2 between compliant and rigid
conditions. The error bars correspond to an uncertainty of 2 standard deviations. .................................142
Figure 125. Mean EtCO2 concentrations along the airway during NHFT assisted breathing at 30 L/min. The results
show for rigid and compliant soft palate airway conditions. This also shows the absolute difference in
EtCO2 between compliant and rigid conditions. The error bars correspond to an uncertainty of 2 standard
deviations. ................................................................................................................................................143
xx
Figure 126. Mean CO2 concentration profiles between rigid and compliant soft palate conditions in the oral cavity
for NHFT 30 L/min. The graphs show the oral cavity left (left) and oral cavity right (right). The error bars
correspond to an uncertainty of 2 standard deviations. ...........................................................................144
Figure 127. Mean EtCO2 concentrations along the airway during NHFT assisted breathing at 60 L/min. The results
show for rigid and compliant soft palate airway conditions. This also shows the absolute difference in
EtCO2 between compliant and rigid conditions. The error bars correspond to 2 standard deviations. ....145
Figure 128. Mean CO2 concentration profiles between rigid and compliant soft palate conditions in the oral cavity
for NHFT at 60 L/min. The graphs show the oral cavity left (left) and oral cavity right (right). The error
bars correspond to an uncertainty of 2 standard deviations. ....................................................................146
Figure 129. Mean EtCO2 during natural breathing for rigid and compliant tongue airway conditions. This also
shows the absolute difference in EtCO2 between compliant and rigid conditions. The error bars correspond
to an uncertainty of 2 standard deviations. ..............................................................................................147
Figure 130. Mean EtCO2 during NHFT assisted breathing at 30 L/min for rigid and compliant tongue airway
conditions. This also shows the absolute difference in EtCO2 between compliant and rigid conditions. The
error bars correspond to an uncertainty of 2 standard deviations. ...........................................................147
Figure 131. Mean EtCO2 during NHFT assisted breathing at 60 L/min for rigid and compliant tongue airway
conditions. This also shows the absolute difference in EtCO2 between compliant and rigid conditions. The
error bars correspond to an uncertainty of 2 standard deviations. ...........................................................148
Figure 132. Mean EtCO2 during natural breathing for rigid and compliant vocal fold airway conditions. This also
shows the absolute difference in EtCO2 between compliant and rigid conditions. The error bars correspond
to an uncertainty of 2 standard deviations. ..............................................................................................149
Figure 133. Mean EtCO2 during NHFT assisted breathing at 30 L/min for rigid and compliant vocal fold airway
conditions. This also shows the absolute difference in EtCO2 between compliant and rigid conditions. The
error bars correspond to an uncertainty of 2 standard deviations. ...........................................................149

xxi
Figure 134. Mean EtCO2 during NHFT assisted breathing at 60 L/min for rigid and compliant vocal fold airway
conditions. This also shows the absolute difference in EtCO2 between compliant and rigid conditions. The
error bars correspond to an uncertainty of 2 standard deviations. ...........................................................150
xxii
Table of Tables
Table 1. Summary of reported elastic modulus values for the tongue and soft palate ...........................................17
Table 2. Reported elastic moduli for the vocal folds from different studies ..........................................................19
Table 3. Summary of tissue elasticity .....................................................................................................................37
Table 4. Summary of data for available flexible 3D printable materials ................................................................38
Table 5. Summary of silicone A341 elasticity .......................................................................................................38
Table 6. Selected tissue elasticity and the corresponding silicone A341 composition for compliance simulation 39
Table 7. Summary of the gasket candidates ...........................................................................................................45
Table 8 Summary of leak test results ......................................................................................................................47
Table 9. Summary of challenges and solutions for developing a compliant airway model. ..................................50
Table 10. Measured NHFT flow rates ....................................................................................................................58
Table 11. Flow rates during peak inspiration and peak expiration for all breathing cases. These area summarised
for the airway with a rigid and compliant soft palate condition (denoted by Comp SP). ..........................69
Table 12. Airway tap locations and the corresponding abbreviations used in the graphs ......................................74
Table 13. Summary of resistance in different airway conditions during natural inspiration ..................................80
Table 14. Summary of results .................................................................................................................................81
Table 15. Airway resistance at expiration for different conditions ........................................................................85
Table 16. Summary of results .................................................................................................................................85
Table 17. Summary of results .................................................................................................................................92
Table 18. Summary of results .................................................................................................................................97
Table 19. Summary of results ...............................................................................................................................103
Table 20. Summary of results ...............................................................................................................................106
Table 21. Summary of results for the compliant soft palate pressure tests ..........................................................113
Table 22. A summary of the regions and tap locations used to present results in the current section .................114
xxiii
Table 23. Regions in close proximity to the vocal folds. The table shows the corresponding pressure tap number
and abbreviation that are used to denote each region. .............................................................................121
Table 24. Airway test regions for the capnography experiments .........................................................................134
Table 25. Summary of mean EtCO2. The results by Van Hove et al. (2016) are the mean of their measured EtCO2
values in all tested pharyngeal regions (nasopharynx, velopharynx, oropharynx and trachea). The results
for the current study show the mean of the EtCO2 values in the lower pharynx (taps 18, 23, 24 and 28).
.................................................................................................................................................................137
1
1 Introduction
1.1 Nasal High Flow Therapy
Nasal high flow therapy (NHFT) is a respiratory intervention method, which administers supplementary air at high
flow rates. It is a non-invasive breathing therapy, supplied to the patient via a nasal cannula. It is generally applied
to a patient that can breathe spontaneously, however suffers a respiratory disorder, such as chronic obstructive
pulmonary disease (COPD) or asthma, which has increased the patient’s work of breathing. The delivered gas is
treated to 37°C and 100 % relative humidity, to match body conditions, which allows safe application of air at
high flow rates between 10 – 60 L/min in adults and up to 12 L/min in infants. This is a relatively new therapy,
and it is not entirely understood, however Dysart et al. (2009) proposed five mechanisms of action:
1. The washout of the nasopharyngeal dead space by flushing out CO2.
2. Reduction of work of breathing due to adequately high flow rates which match inspiratory demand.
3. Humidified and warmed air improves pulmonary conductance, compared to dry, cold gases.
4. Humidified and warmed air reduces the metabolic cost of conditioning inspired air.
5. High flow rates increase positive pressure in the airway and promote lung recruitment.
1.2 Project Purpose
There have been numerous studies in the past which have endeavoured to understand the air flow mechanics in
the human upper airway during natural breathing and NHFT assisted breathing. These studies have used in vitro
experimental techniques and computational methods on anatomically correct human upper airway models (Adams
et al., 2016; Dey, 2014; Spence et al., 2011; Spence et al., 2010; Stringer et al., 2010; Van Hove et al., 2016). The
airway models in the past studies have been based on computed tomography (CT) scans, hence their anatomical
accuracy. However, due to the limitations of the methods used in the past studies, it has been assumed that the
airway passage had a rigid boundary condition. The in vitro studies fabricated airway models by either 3D printing
from rigid plastic material, or cast in rigid silicone, and in the computational studies, a non-deformable mesh had
been used. Modelling the airway as a rigid passage is not a realistic boundary condition, as the airway is surrounded
by soft, compliant tissues. In physiology, compliance is a biological tissues’ tendency to recoil to its original
dimensions.
2
The purpose of the current research project was to scrutinize the rigid airway boundary assumption, by
investigating the effects of compliance during natural and NHFT assisted breathing. It was hypothesised that
during respiration, the internal, compliant tissues would undergo flow-induced deformation, due to the force
exerted from wall shear stress and static pressure. Deformation of the compliant regions will in turn alter the flow
pattern in the airway. Three compliant tissues were investigated in this project, these were: the soft palate, tongue
and the vocal folds. In this project, airway compliance was experimentally investigated with a physical airway
model which was designed to replicate the compliance of the tissues of interest and a rigid boundary condition.
Pressure tests and capnography were carried out on both rigid and compliant airway conditions during simulated
breathing, to assess the influence of compliance. The research project proposed the following questions:
How do you simulate compliance in a benchtop model?
What compliant structures affect airway pressures and CO2 gas mixing during respiration and to what
extent?
How does this vary with NHFT?
1.3 Thesis Structure
The thesis is comprised of the following sections. Chapter 2 sheds light on the anatomy and physiology of the
respiratory system. The anatomy of the compliant tissues of interest is also explained. Chapter 3 reviews previous
studies that are relevant to the project. This involves airway modelling and studies into NHFT. It also explores
previous studies into airway compliance and mechanical properties of the compliant tissues of interest. Chapter 4
explains the procedures carried out to fabricate the compliant airway model. Chapter 5 explains the system
hardware and software used in the experiments. Chapter 6 describes the flow measurements to measure the
distribution of inspired and expired air flow rate in the outlets of the airway model. Chapter 7 explains the
experimental procedure for the pressure tests and chapters 8- 10 goes through the pressure results. Chapter 11
describes the experimental procedure for the capnography and the results.
3
2 Background Information
2.1 Anatomy of the Respiratory System
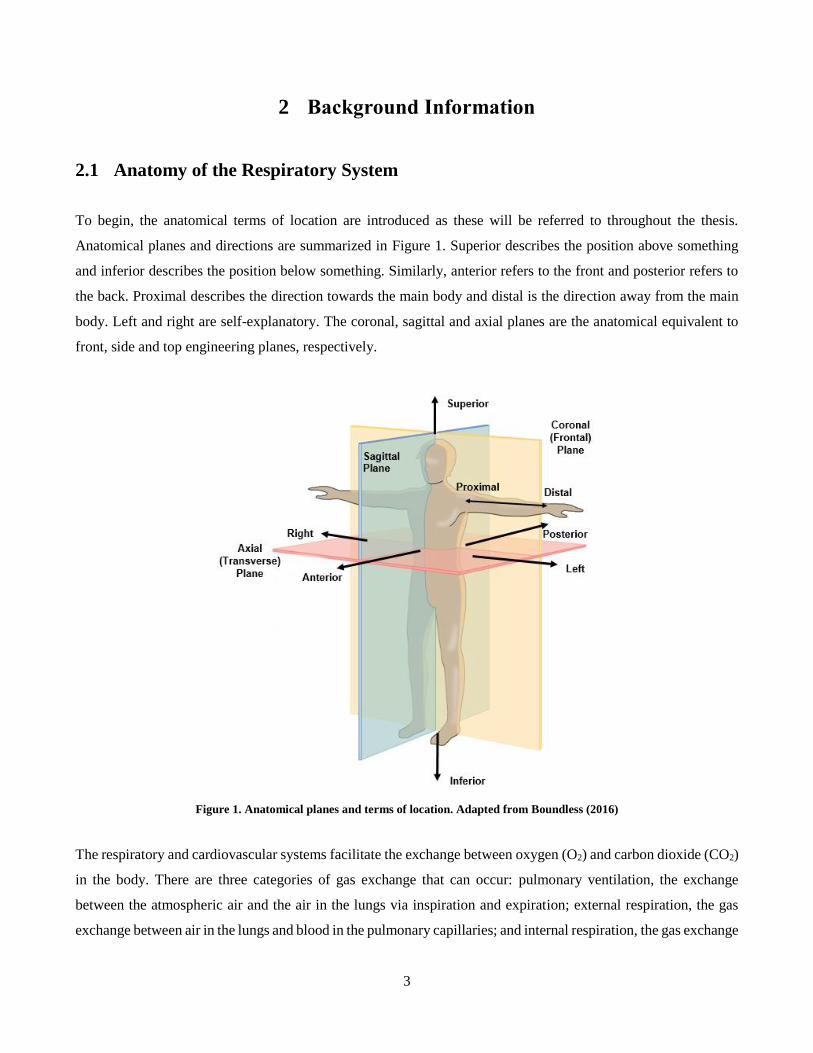
To begin, the anatomical terms of location are introduced as these will be referred to throughout the thesis.
Anatomical planes and directions are summarized in Figure 1. Superior describes the position above something
and inferior describes the position below something. Similarly, anterior refers to the front and posterior refers to
the back. Proximal describes the direction towards the main body and distal is the direction away from the main
body. Left and right are self-explanatory. The coronal, sagittal and axial planes are the anatomical equivalent to
front, side and top engineering planes, respectively.
Figure 1. Anatomical planes and terms of location. Adapted from Boundless (2016)
The respiratory and cardiovascular systems facilitate the exchange between oxygen (O2) and carbon dioxide (CO2)
in the body. There are three categories of gas exchange that can occur: pulmonary ventilation, the exchange
between the atmospheric air and the air in the lungs via inspiration and expiration; external respiration, the gas
exchange between air in the lungs and blood in the pulmonary capillaries; and internal respiration, the gas exchange
4
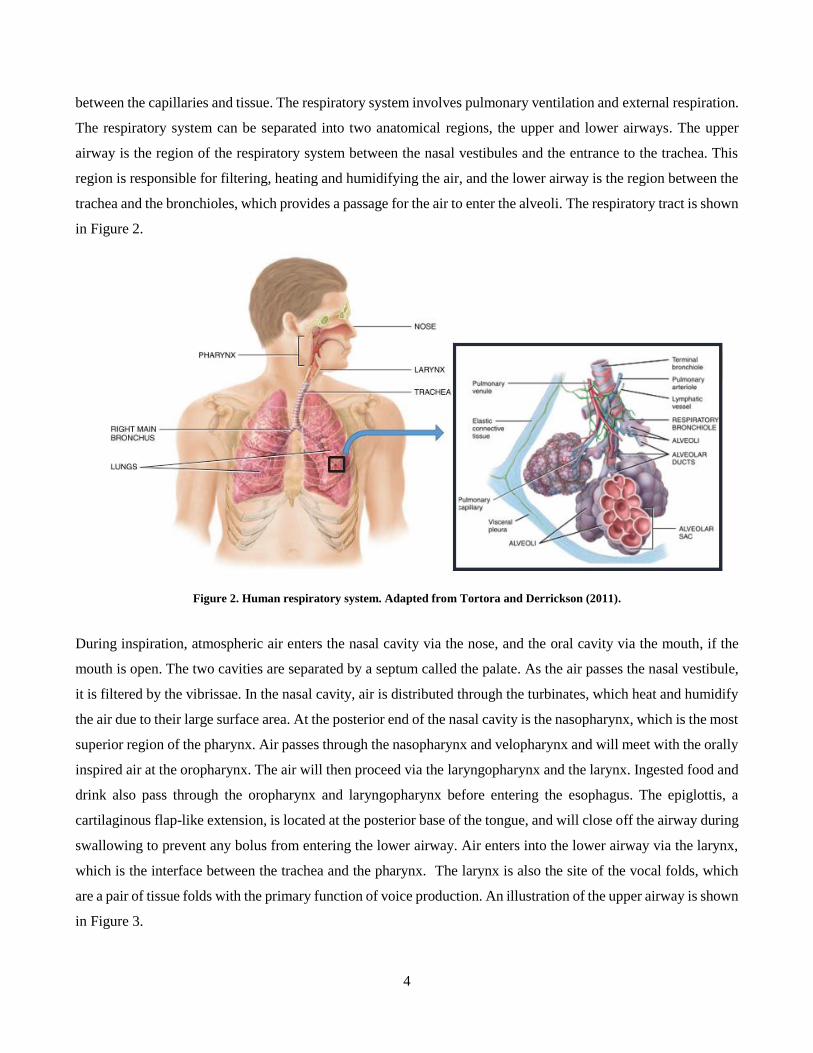
between the capillaries and tissue. The respiratory system involves pulmonary ventilation and external respiration.
The respiratory system can be separated into two anatomical regions, the upper and lower airways. The upper
airway is the region of the respiratory system between the nasal vestibules and the entrance to the trachea. This
region is responsible for filtering, heating and humidifying the air, and the lower airway is the region between the
trachea and the bronchioles, which provides a passage for the air to enter the alveoli. The respiratory tract is shown
in Figure 2.
Figure 2. Human respiratory system. Adapted from Tortora and Derrickson (2011).
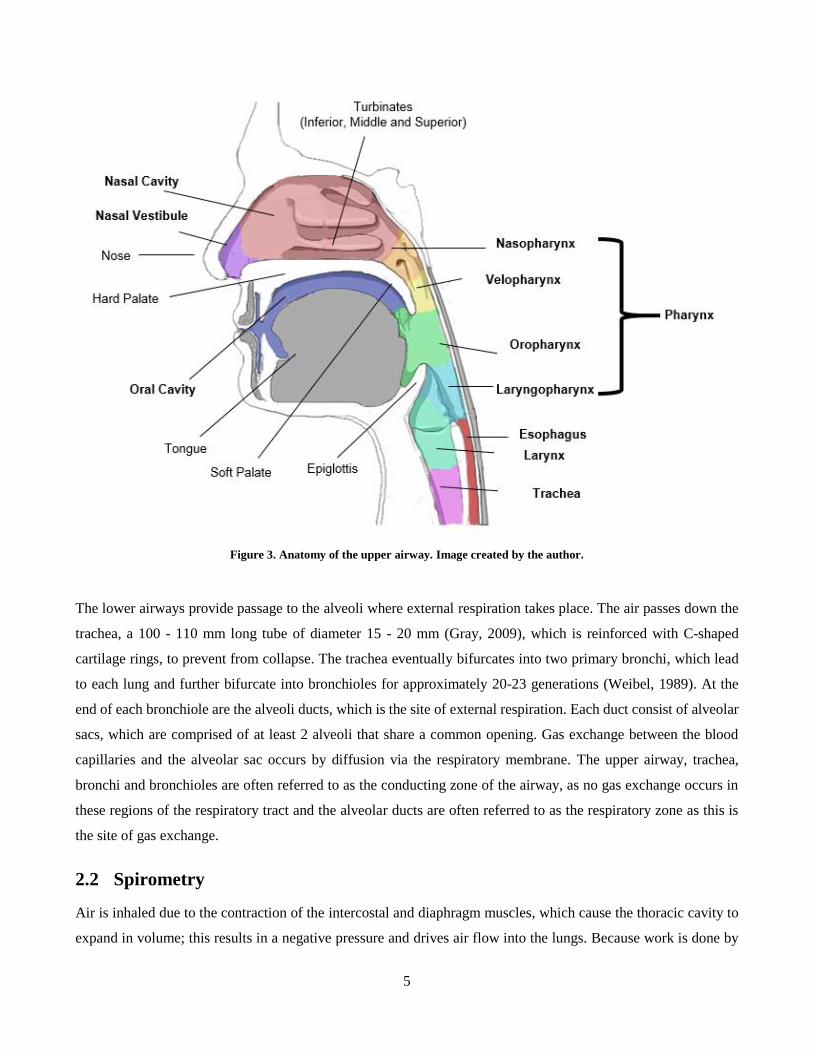
During inspiration, atmospheric air enters the nasal cavity via the nose, and the oral cavity via the mouth, if the
mouth is open. The two cavities are separated by a septum called the palate. As the air passes the nasal vestibule,
it is filtered by the vibrissae. In the nasal cavity, air is distributed through the turbinates, which heat and humidify
the air due to their large surface area. At the posterior end of the nasal cavity is the nasopharynx, which is the most
superior region of the pharynx. Air passes through the nasopharynx and velopharynx and will meet with the orally
inspired air at the oropharynx. The air will then proceed via the laryngopharynx and the larynx. Ingested food and
drink also pass through the oropharynx and laryngopharynx before entering the esophagus. The epiglottis, a
cartilaginous flap-like extension, is located at the posterior base of the tongue, and will close off the airway during
swallowing to prevent any bolus from entering the lower airway. Air enters into the lower airway via the larynx,
which is the interface between the trachea and the pharynx. The larynx is also the site of the vocal folds, which
are a pair of tissue folds with the primary function of voice production. An illustration of the upper airway is shown
in Figure 3.
5
Figure 3. Anatomy of the upper airway. Image created by the author.
The lower airways provide passage to the alveoli where external respiration takes place. The air passes down the
trachea, a 100 - 110 mm long tube of diameter 15 - 20 mm (Gray, 2009), which is reinforced with C-shaped
cartilage rings, to prevent from collapse. The trachea eventually bifurcates into two primary bronchi, which lead
to each lung and further bifurcate into bronchioles for approximately 20-23 generations (Weibel, 1989). At the
end of each bronchiole are the alveoli ducts, which is the site of external respiration. Each duct consist of alveolar
sacs, which are comprised of at least 2 alveoli that share a common opening. Gas exchange between the blood
capillaries and the alveolar sac occurs by diffusion via the respiratory membrane. The upper airway, trachea,
bronchi and bronchioles are often referred to as the conducting zone of the airway, as no gas exchange occurs in
these regions of the respiratory tract and the alveolar ducts are often referred to as the respiratory zone as this is
the site of gas exchange.
2.2 Spirometry
Air is inhaled due to the contraction of the intercostal and diaphragm muscles, which cause the thoracic cavity to
expand in volume; this results in a negative pressure and drives air flow into the lungs. Because work is done by
6
the muscles, inhalation is an active process. In contrast, exhalation occurs as the respiratory muscles relax and
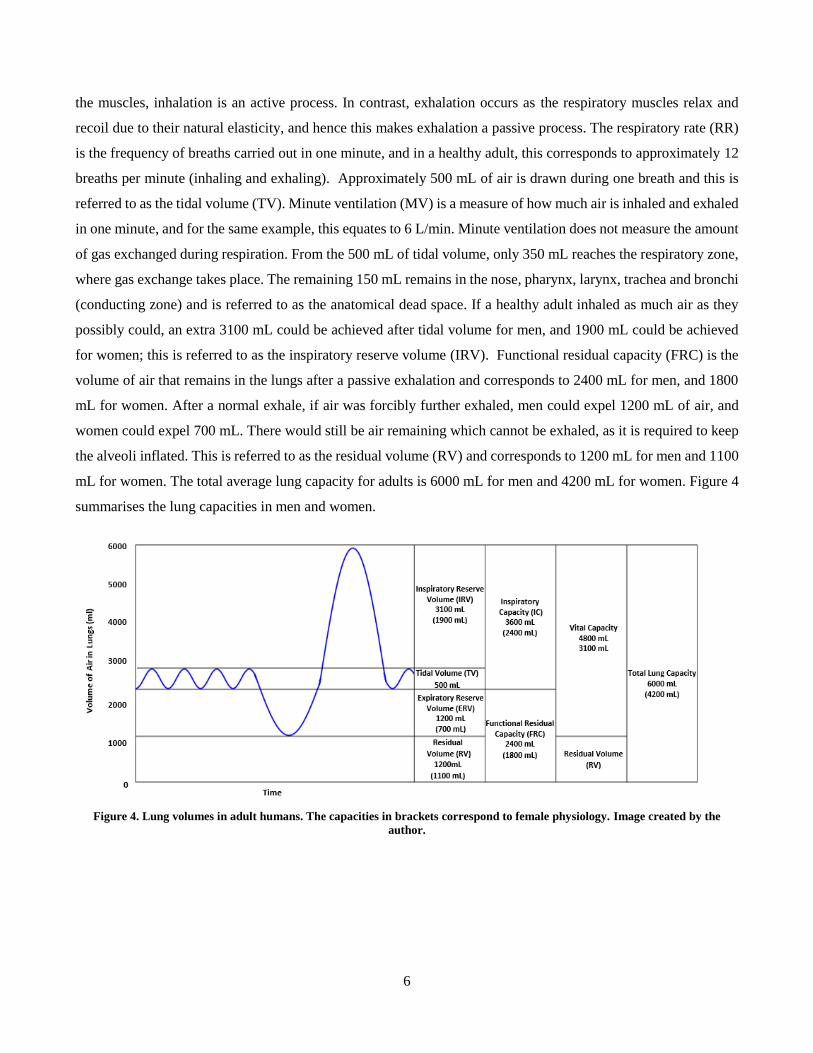
recoil due to their natural elasticity, and hence this makes exhalation a passive process. The respiratory rate (RR)
is the frequency of breaths carried out in one minute, and in a healthy adult, this corresponds to approximately 12
breaths per minute (inhaling and exhaling). Approximately 500 mL of air is drawn during one breath and this is
referred to as the tidal volume (TV). Minute ventilation (MV) is a measure of how much air is inhaled and exhaled
in one minute, and for the same example, this equates to 6 L/min. Minute ventilation does not measure the amount
of gas exchanged during respiration. From the 500 mL of tidal volume, only 350 mL reaches the respiratory zone,
where gas exchange takes place. The remaining 150 mL remains in the nose, pharynx, larynx, trachea and bronchi
(conducting zone) and is referred to as the anatomical dead space. If a healthy adult inhaled as much air as they
possibly could, an extra 3100 mL could be achieved after tidal volume for men, and 1900 mL could be achieved
for women; this is referred to as the inspiratory reserve volume (IRV). Functional residual capacity (FRC) is the
volume of air that remains in the lungs after a passive exhalation and corresponds to 2400 mL for men, and 1800
mL for women. After a normal exhale, if air was forcibly further exhaled, men could expel 1200 mL of air, and
women could expel 700 mL. There would still be air remaining which cannot be exhaled, as it is required to keep
the alveoli inflated. This is referred to as the residual volume (RV) and corresponds to 1200 mL for men and 1100
mL for women. The total average lung capacity for adults is 6000 mL for men and 4200 mL for women. Figure 4
summarises the lung capacities in men and women.
Figure 4. Lung volumes in adult humans. The capacities in brackets correspond to female physiology. Image created by the
author.
7
2.3 Soft Tissues in the Airway
2.3.1 The Tongue and Soft Palate
Soft Palate
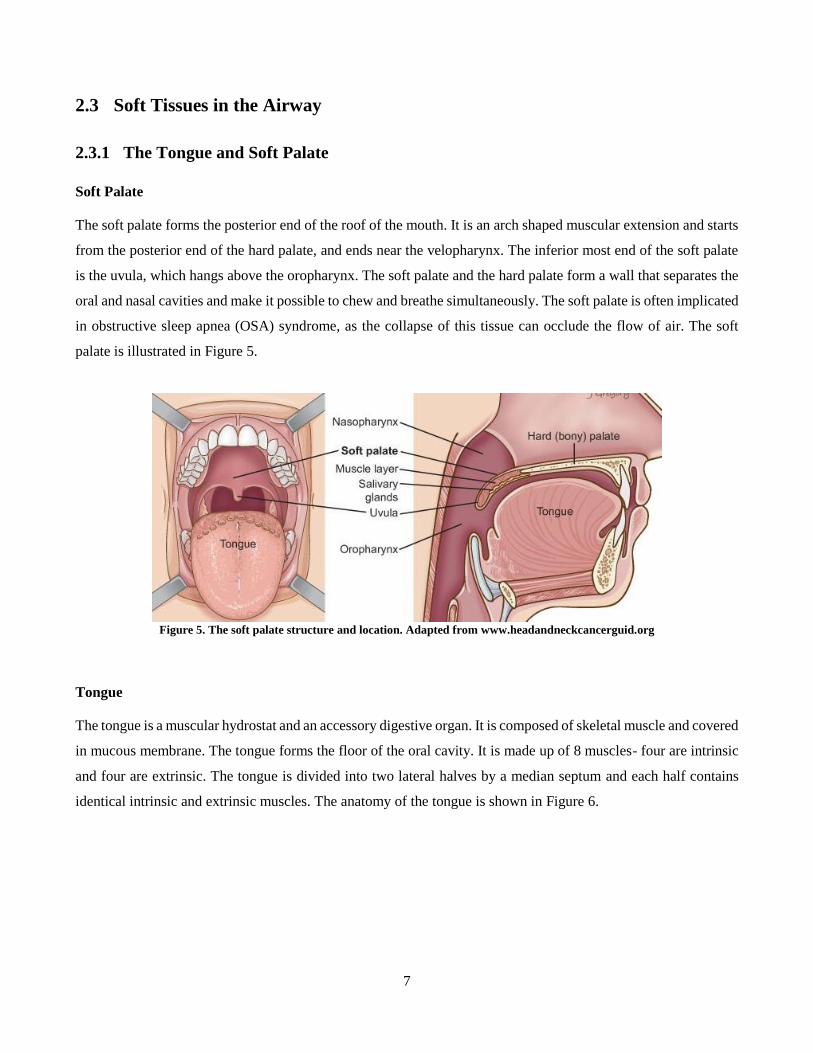
The soft palate forms the posterior end of the roof of the mouth. It is an arch shaped muscular extension and starts
from the posterior end of the hard palate, and ends near the velopharynx. The inferior most end of the soft palate
is the uvula, which hangs above the oropharynx. The soft palate and the hard palate form a wall that separates the
oral and nasal cavities and make it possible to chew and breathe simultaneously. The soft palate is often implicated
in obstructive sleep apnea (OSA) syndrome, as the collapse of this tissue can occlude the flow of air. The soft
palate is illustrated in Figure 5.
Figure 5. The soft palate structure and location. Adapted from www.headandneckcancerguid.org
Tongue
The tongue is a muscular hydrostat and an accessory digestive organ. It is composed of skeletal muscle and covered
in mucous membrane. The tongue forms the floor of the oral cavity. It is made up of 8 muscles- four are intrinsic
and four are extrinsic. The tongue is divided into two lateral halves by a median septum and each half contains
identical intrinsic and extrinsic muscles. The anatomy of the tongue is shown in Figure 6.
8
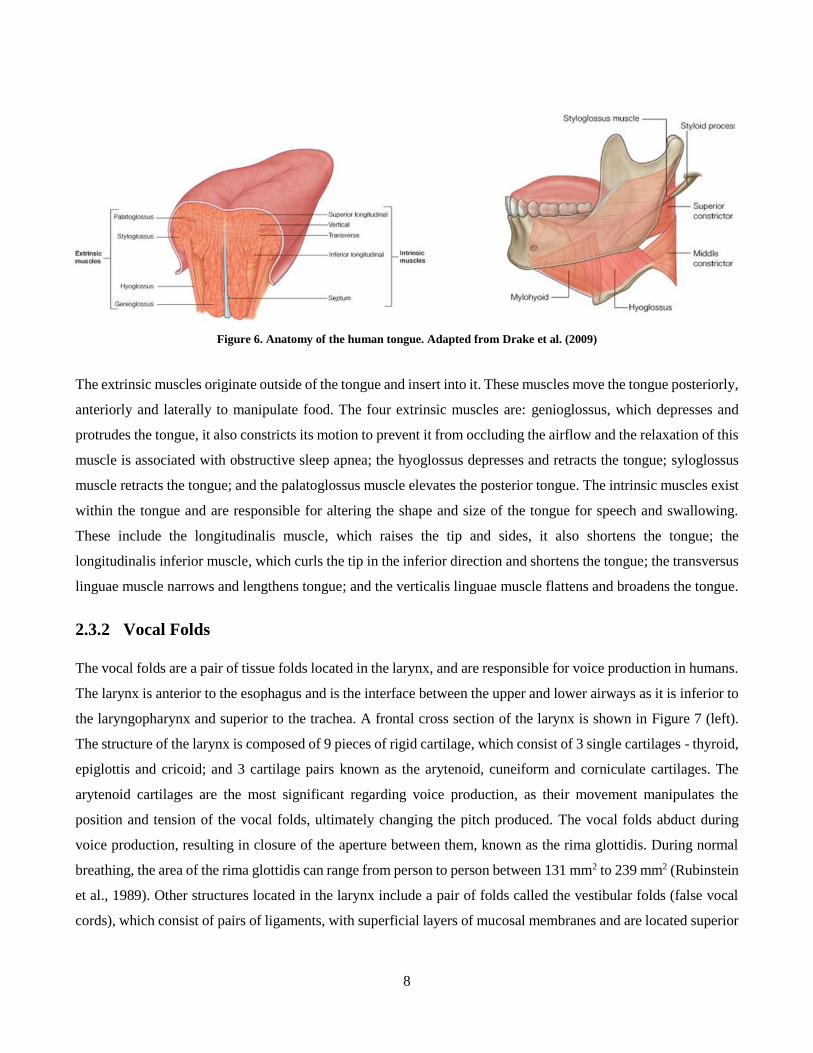
Figure 6. Anatomy of the human tongue. Adapted from Drake et al. (2009)
The extrinsic muscles originate outside of the tongue and insert into it. These muscles move the tongue posteriorly,
anteriorly and laterally to manipulate food. The four extrinsic muscles are: genioglossus, which depresses and
protrudes the tongue, it also constricts its motion to prevent it from occluding the airflow and the relaxation of this
muscle is associated with obstructive sleep apnea; the hyoglossus depresses and retracts the tongue; syloglossus
muscle retracts the tongue; and the palatoglossus muscle elevates the posterior tongue. The intrinsic muscles exist
within the tongue and are responsible for altering the shape and size of the tongue for speech and swallowing.
These include the longitudinalis muscle, which raises the tip and sides, it also shortens the tongue; the
longitudinalis inferior muscle, which curls the tip in the inferior direction and shortens the tongue; the transversus
linguae muscle narrows and lengthens tongue; and the verticalis linguae muscle flattens and broadens the tongue.
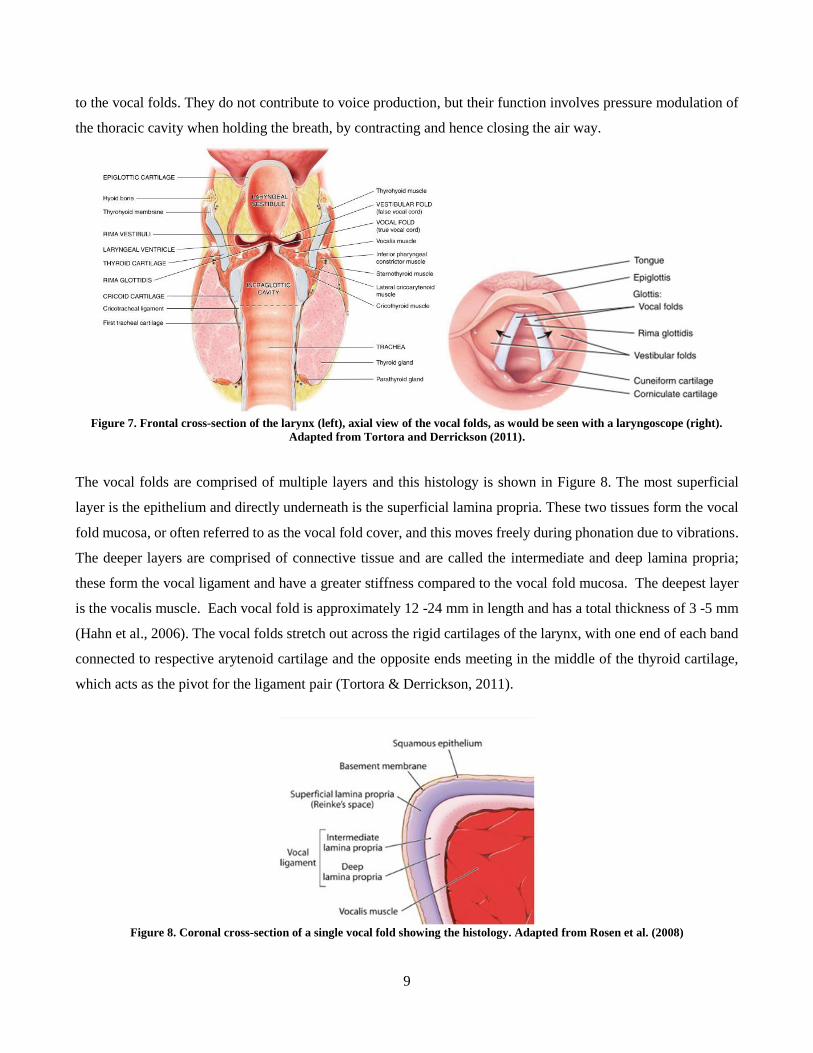
2.3.2 Vocal Folds
The vocal folds are a pair of tissue folds located in the larynx, and are responsible for voice production in humans.
The larynx is anterior to the esophagus and is the interface between the upper and lower airways as it is inferior to
the laryngopharynx and superior to the trachea. A frontal cross section of the larynx is shown in Figure 7 (left).
The structure of the larynx is composed of 9 pieces of rigid cartilage, which consist of 3 single cartilages - thyroid,
epiglottis and cricoid; and 3 cartilage pairs known as the arytenoid, cuneiform and corniculate cartilages. The
arytenoid cartilages are the most significant regarding voice production, as their movement manipulates the
position and tension of the vocal folds, ultimately changing the pitch produced. The vocal folds abduct during
voice production, resulting in closure of the aperture between them, known as the rima glottidis. During normal
breathing, the area of the rima glottidis can range from person to person between 131 mm2 to 239 mm2 (Rubinstein
et al., 1989). Other structures located in the larynx include a pair of folds called the vestibular folds (false vocal
cords), which consist of pairs of ligaments, with superficial layers of mucosal membranes and are located superior
9
to the vocal folds. They do not contribute to voice production, but their function involves pressure modulation of
the thoracic cavity when holding the breath, by contracting and hence closing the air way.
Figure 7. Frontal cross-section of the larynx (left), axial view of the vocal folds, as would be seen with a laryngoscope (right).
Adapted from Tortora and Derrickson (2011).
The vocal folds are comprised of multiple layers and this histology is shown in Figure 8. The most superficial
layer is the epithelium and directly underneath is the superficial lamina propria. These two tissues form the vocal
fold mucosa, or often referred to as the vocal fold cover, and this moves freely during phonation due to vibrations.
The deeper layers are comprised of connective tissue and are called the intermediate and deep lamina propria;
these form the vocal ligament and have a greater stiffness compared to the vocal fold mucosa. The deepest layer
is the vocalis muscle. Each vocal fold is approximately 12 -24 mm in length and has a total thickness of 3 -5 mm
(Hahn et al., 2006). The vocal folds stretch out across the rigid cartilages of the larynx, with one end of each band
connected to respective arytenoid cartilage and the opposite ends meeting in the middle of the thyroid cartilage,
which acts as the pivot for the ligament pair (Tortora & Derrickson, 2011).
Figure 8. Coronal cross-section of a single vocal fold showing the histology. Adapted from Rosen et al. (2008)
10
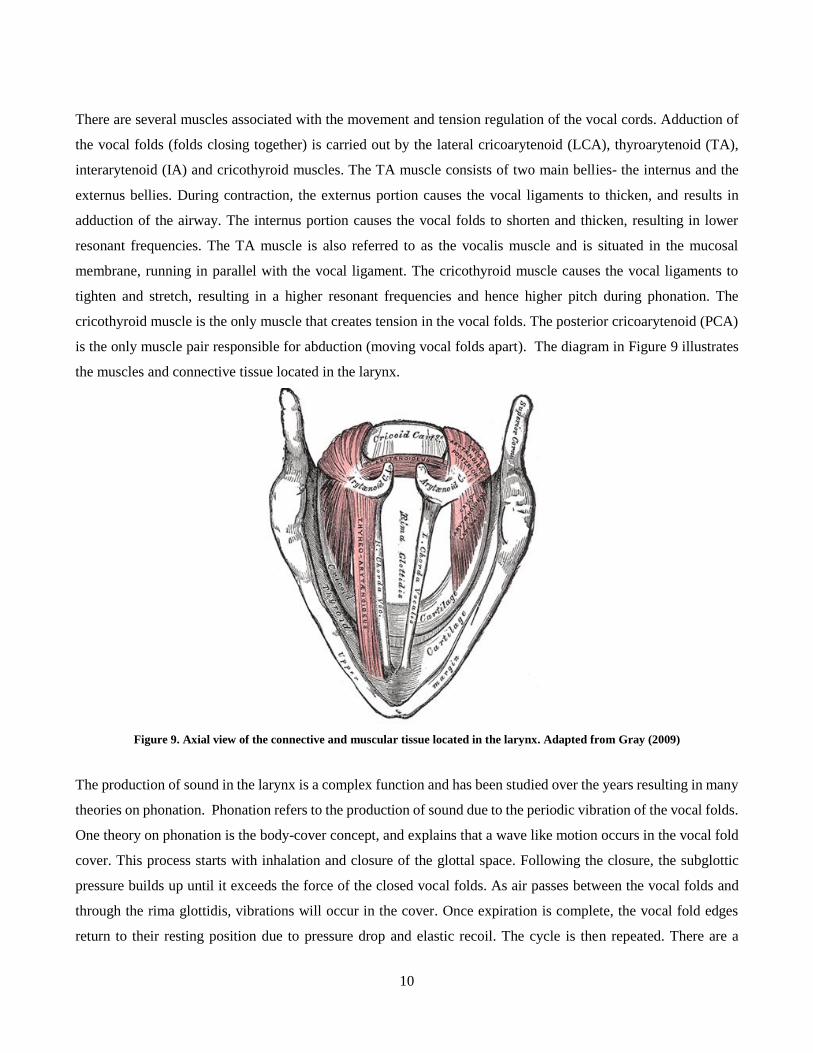
There are several muscles associated with the movement and tension regulation of the vocal cords. Adduction of
the vocal folds (folds closing together) is carried out by the lateral cricoarytenoid (LCA), thyroarytenoid (TA),
interarytenoid (IA) and cricothyroid muscles. The TA muscle consists of two main bellies- the internus and the
externus bellies. During contraction, the externus portion causes the vocal ligaments to thicken, and results in
adduction of the airway. The internus portion causes the vocal folds to shorten and thicken, resulting in lower
resonant frequencies. The TA muscle is also referred to as the vocalis muscle and is situated in the mucosal
membrane, running in parallel with the vocal ligament. The cricothyroid muscle causes the vocal ligaments to
tighten and stretch, resulting in a higher resonant frequencies and hence higher pitch during phonation. The
cricothyroid muscle is the only muscle that creates tension in the vocal folds. The posterior cricoarytenoid (PCA)
is the only muscle pair responsible for abduction (moving vocal folds apart). The diagram in Figure 9 illustrates
the muscles and connective tissue located in the larynx.
Figure 9. Axial view of the connective and muscular tissue located in the larynx. Adapted from Gray (2009)
The production of sound in the larynx is a complex function and has been studied over the years resulting in many
theories on phonation. Phonation refers to the production of sound due to the periodic vibration of the vocal folds.
One theory on phonation is the body-cover concept, and explains that a wave like motion occurs in the vocal fold
cover. This process starts with inhalation and closure of the glottal space. Following the closure, the subglottic
pressure builds up until it exceeds the force of the closed vocal folds. As air passes between the vocal folds and
through the rima glottidis, vibrations will occur in the cover. Once expiration is complete, the vocal fold edges
return to their resting position due to pressure drop and elastic recoil. The cycle is then repeated. There are a
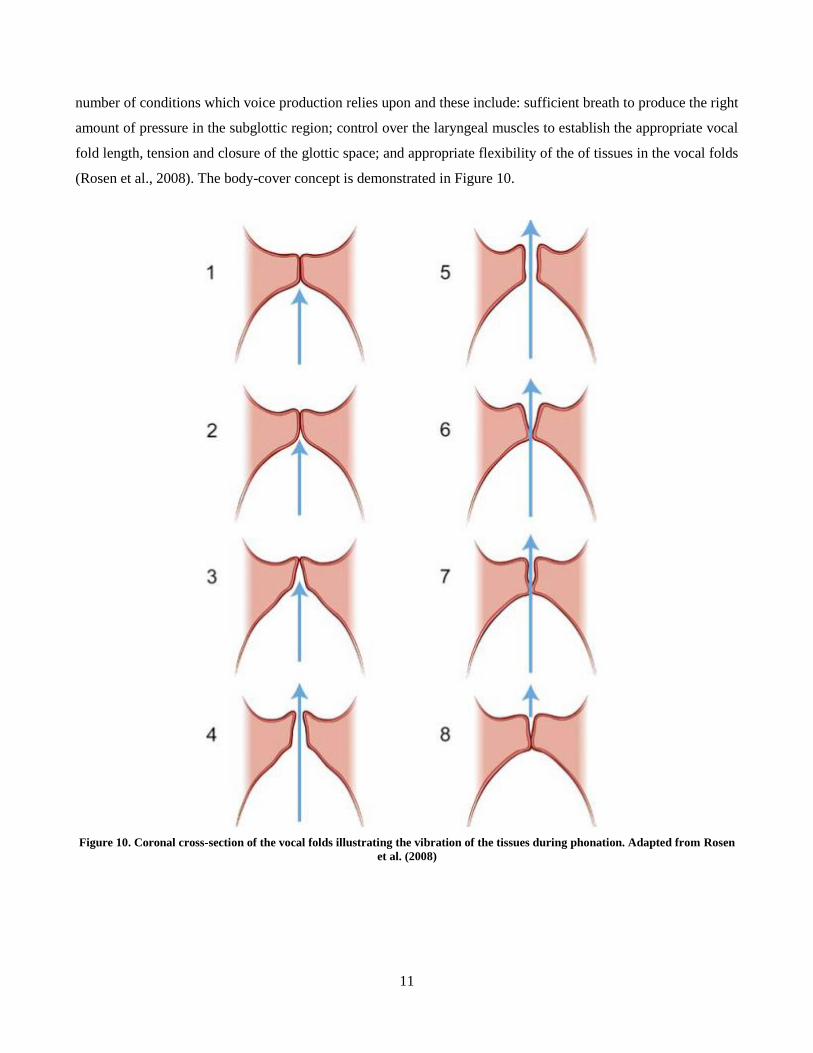
11
number of conditions which voice production relies upon and these include: sufficient breath to produce the right
amount of pressure in the subglottic region; control over the laryngeal muscles to establish the appropriate vocal
fold length, tension and closure of the glottic space; and appropriate flexibility of the of tissues in the vocal folds
(Rosen et al., 2008). The body-cover concept is demonstrated in Figure 10.
Figure 10. Coronal cross-section of the vocal folds illustrating the vibration of the tissues during phonation. Adapted from Rosen
et al. (2008)
12
3 Literature Review
3.1 Airway Studies
3.1.1 Airway Modelling
The earliest methods of flow modelling in the airways involved ex vivo flow visualisations in the nasal passages
of cadavers. One method that was carried out entailed the distribution of red litmus paper in the airway and
pumping ammonia saturated air into the nasal cavity of a cadaver. Air flow was tracked by noting where the litmus
paper turned blue (Paulsen, 1882). Other methods involved dividing a cadaveric head and replacing the septal wall
with a glass plate. A problem with this is that it did not reproduce the joining of the two streams (left and right) at
the pharynx. The first in vitro experiment was carried out by Proetz (1953) who created a cadaver-based cast model
of the nasal cavity for reusability. Proetz (1953) concluded that there is a typical pattern of the air flow during
breathing, but it is also dependent on the anatomy specific to the individual. Other in vitro visualisation
experiments include the study by Simmen et al. (1999) who used physiologic breathing cycles rather than the
steady flow velocities used in previous studies. The studies by Proetz (1953) and Simmen et al. (1999) used smoke-
laden air for flow visualisation which was difficult to image. Further studies have utilised dye in water filled
models to track the streamlines (Weinhold & Mlynski, 2004).
Although flow visualisation is a robust way to investigate nasal air flow patterns, it provides qualitative results,
and hence it is difficult to compare and analyse with other studies. Modern experiments have employed more
advanced in vitro techniques resulting in physical measurements of flow characteristics in the nasal airway.
Accurate nasal airway geometries can be modelled using of magnetic resonance imaging (MRI) and computed
tomography (CT) scan images. Hahn et al. (1993) conducted a study using a 20x scale right half adult nasal model
based on medical imaging. They used hot wire anemometry to assess airflow when administering steady flow rates
of 0.6, 10.8, 33.6 and 66 L/min They determined that air flows ranged from disturbed laminar to turbulent as the
flow rates increased. In recent years, the emerging technology of 3D printing has allowed accurate fabrication of
medical image based, anatomically correct upper airway models. Recent studies have used such models to perform
static pressure testing and capnography at various points along the airway (Adams et al., 2016; Dey, 2014; Van
Hove et al., 2016). The airway models had been specially designed with pressure taps along regions of the pharynx
to allow for pressure and capnography measurements. Particle image velocimetry (PIV) has been used as a more
advanced method of flow visualization, and has allowed mapping of the air velocity throughout the airway. In the
past, PIV studies investigated steady flows on one side of the upper airway (Hörschler et al., 2006; Kelly et al.,
2000; Kook Kim et al., 2006; Park et al., 1997). More recently, PIV studies were carried out on complete upper
13
airway models and simulated natural and nasal high flow assisted breathing using both steady and oscillatory flows
(Spence et al., 2012; Spence et al., 2011; Spence et al., 2010).
The constant progression in computing technology has increased the power of computational fluid dynamics
(CFD) which has proven to be a useful method to investigate nasal air flow patterns. It is a feasible option as it is
non-invasive, relatively quick, and a cheap method to study the complicated flow pattern in the airway. The studies
are almost exclusively carried out on simplified medical image based geometric models with steady flow
conditions (Hörschler et al., 2006; Jeong et al., 2007; Stringer et al., 2010). Previous CFD studies have simplified
geometry by focussing on nares to nasopharynx (Hörschler et al., 2006; Ishikawa et al., 2006), one half along the
sagittal plane (Gambaruto et al., 2009) or have modelled the full upper airway region (Jeong et al., 2007). Air flow
simulations have been known to utilize Reynolds-averaged Navier-Stokes (RANS) settings (Ishikawa et al., 2006;
Stringer et al., 2010; Taylor et al., 2010) and Large Eddy Simulations (LES) (Lee et al., 2010; Mylavarapu et al.,
2009). The complicated geometry within the nasal cavity requires a high density mesh to accurately simulate the
flow, and this has restricted the application of Direct Numerical Simulations (DNS) for upper airway flow
simulations.
3.1.2 Nasal High Flow Therapy
The nasal cannula was invented by Wilfred Jones in 1949 and is a method of delivering supplementary oxygen for
patients with respiratory difficulty. The nasal cannula originally administered cold, dry gas and was limited to
delivering at flow rates between 1-6 L/min. High flow rates of unconditioned air is prone to irritating and damaging
the internal tissue of the nasal cavity as it would dry out the nasal mucosa (Campbell et al., 1988). Humidified
respiratory therapy was invented by Dr Matt Spence at Auckland hospital in the 1960s, and brought to the market
by Fisher and Paykel Ltd. This began the introduction of nasal high flow therapy (NHFT) as a mode for non-
invasive ventilation and involves delivery of air at relatively high flow rates via the nasal cannula. High flow rates
between 10 – 60 L/min can be delivered to adults and up to 12 L/min for infants, because the air is heated to 37ºC
and humidified to 100 % relative humidity, which is tolerable by the body. Dysart et al. (2009) proposed that
NHFT has five mechanisms that contribute to its efficacy. These are the washout of nasopharyngeal dead space,
reduction of inspiratory resistance and improved lung mechanics through the supply of adequately warmed and
humidified gas, reduction in the metabolic cost of gas conditioning, and provision of distending pressure.
As explained previously (Chapter 2, section 2.2), anatomical dead space is the volume of air which remains in the
conducting zone of the airway after expiration, and is rebreathed on inspiration. Anatomical dead space contains
‘stale’ CO2 rich gas at similar concentrations to the alveoli (Tortora & Derrickson, 2011). NHFT can increase the
efficiency of respiration as the washout mechanism can flush CO2 gas; this can improve alveolar ventilation by
14
increasing its proportion with respect to minute ventilation, hence increasing oxygenation (Dysart et al., 2009).
Chatila et al. (2004) compared the effects of low flow oxygen (LFO) and high flow oxygen (HFO) therapy in
COPD affected patients. They found that patients that HFO had higher oxygenation and could exercise longer.
Similarly, Dewan and Bell (1994) compared HFO and LFO, and administered the therapy via a nasal cannula and
transtracheal catheter (TTC) in COPD effected patients. They agreed with Chatila et al. (2004), that HFO therapy
significantly increased the exercise tolerance of the patients compared to LFO therapy. Adams et al. (2016)
performed capnography experiments on a benchtop upper airway model to investigate the washout mechanism of
NHFT. They used a closed mouth airway and replicated the oscillatory flow of respiration by using a pump that
was programmed by a Fourier waveform that was faithful to the physiological breath pattern. They measured CO2
concentration at the tracheal entrance of the upper airway and found that NHFT reduced the CO2 concentration by
17 % and 24 % for 30 L/min and 60 L/min therapy flow rates, respectively. Van Hove et al. (2016) also studied
the washout mechanism using a computational approach on a 3D, closed mouth, airway model, and validated it
with in vitro experimentation, identical to Adams et al. (2016). During natural breathing, it was found that the CO2
concentration throughout the upper airway was approximately 5 % volume fraction which is similar to the CO2
concentration in the alveoli. With the application of NHFT, the anterior portion of the nasal cavity had much lower
CO2 concentrations. This region of low CO2 concentrations would extend posteriorly with higher therapy flows,
as the cannula jet would penetrate further in the nasal cavity. With the application of 60 L/min NHFT, the CO2
concentrations in the pharynx reduced up to 4.4 % volume fraction and when comparing natural breathing, and
with NHFT at 60 L/min, the volume of inspired CO2 gas decreased by 65 %. However, the effects of washout
would plateau with flow rates of 40 L/min and greater. They mentioned that CO2 rich air escaped via the nostrils
reducing anatomical dead space due to circulation features caused by the cannula jet on expiration. This was also
noted by Spence et al. (2012) who used PIV to investigate the flow pattern in an upper airway models for both
natural and NHFT assisted breathing. Spence et al. (2012) observed recirculation regions above and below the
cannula jet during NHFT, and found that this continuously flushed the dead space in the nasopharynx.
The second mechanism proposed by Dysart et al. (2009) is that NHFT reduces the work of breathing (WOB).
Work of breathing describes the body’s effort to inhale and exhale air for respiration. Currently, there are no
publications of the mechanism in adults as the studies have been limited to children and infants. Rubin et al. (2014)
studied the effects of NHFT on WOB in small children. They measured the respiratory rate, and the esophageal
pressure, which acted as a surrogate for pleural pressure, on paediatric ICU patients with administered therapy
flows of 2, 5 and 8 L/min. They quantified the WOB with pressure rate product (PRP), which was calculated by
multiplying the change in pleural pressure by respiratory rate. They found that PRP would decrease with increasing
therapy flows with an approximate reduction of 25 % when therapy flow rate increased from 2 to 8 L/min flows.
It is likely that the reduction in PRP was partly due to the other mechanisms, such as the generation in positive
15
airway pressure and dead space washout. However, they found that the baseline pleural pressure, the pressure
measured at the end of an exhalation, increased by 1 cm H2O between 2 and 8 L/min therapy flows, which was
not significant enough to be fully responsible for the 25 % PRP decrement. Pham et al. (2015) investigated the
WOB on infants with bronchiolitis and post-cardiac surgery infants. They measured PRP, pressure time product
(PTP) during inspiration, and the peak electrical activity of the diaphragm (Edimax) with administered NHFT at 2
L/kg/min for each infant. The PTP during inspiration was defined as the integral of the esophageal pressure curve
during the inspiratory phase. With no therapy, Edimax was greater in bronchiolitis affected infants, and in cardiac
infants this resembled a normal range, indicating that they showed no clinical signs of increased WOB. However,
with NHFT, the Edimax decreased for both infant groups. It should be noted that reduction in Edimax did not take
into account reduction in RR on NHFT. The PRP and PTP was shown to reduce by 38 % and 44 % for bronchiolitis
affected infants, respectively; and for cardia infants, this reduced by 35 % and 34 % respectively. Hence NHFT
reduced the WOB breathing on both infant groups, with more pronounced effects on the bronchiolitis affected
group.
Dysart et al. (2009) proposed that NHFT improves pulmonary conductance, compared to cold, dry gases. To date,
there are no such publications which have explicitly investigated this mechanism. However, this mechanism has
been implied by studies which have shown that when breathing cold, dry gas, the body induces a
bronchoconstriction as a protective response in both normal and asthmatic patients (Fontanari et al., 1996;
Fontanari et al., 1997).
During respiration, air must be heated and humidified in the conducting zone of the respiratory tract, and hence
there must be some associated energy expenditure in the generation of heat and mucus in the internal airway
surface. Because the air from NHFT is already conditioned it is more tolerable for the body, and hence this would
contribute to the reduction in WOB; however, it has been shown that the conditioning of the air is more important
for patient comfort and mucosal secretion clearance, rather than caloric expenditure. NHFT studies report a
decrease in nose, throat and mouth dryness due to improvement in upper airway mucosa dryness compared to
conventional oxygen therapy (Cuquemelle et al., 2012; Nava & Hill, 2009; Roca et al., 2010; Sztrymf et al., 2011).
In disorders such as COPD and bronchiectasis, which impair mucociliary transport, and cause mucus retention,
NHFT has been shown to improve mucociliary clearance (Hasani et al., 2008; Rea et al., 2010).
The fifth mechanism of NHFT proposed by Dysart et al. (2009) suggests that elevated pressures are achieved.
Continuous positive airway pressure (CPAP) is a method to maintain an open passage for breathing. It was
originally intended to treat obstructive sleep apnoea (OSA), as the positive air pressure in the pharynx prevents
the collapse of the soft palate. However, CPAP has been used to assist ventilation as the positive pressure increases
16
alveolar recruitment in patients with respiratory failure, allowing for more gaseous exchange to take place. There
have been a number of in vivo experiments that support the fifth mechanism proposed by Dysart et al. (2009)
(Groves & Tobin, 2007; Parke et al., 2011; Ritchie et al., 2011). Groves and Tobin (2007) measured the expiratory
and inspiratory pressures at the pharynx for both mouth open and closed breathing in 10 adult subjects, with
intranasal flow rates between 0 – 60 L/min. It was found that pharyngeal pressures would increase with flow rates,
and mouth closed breathing resulted in greater pressures compared to mouth open. For a nasal flow rate of 40
L/min for mouth open and mouth closed breathing, the end expiratory pressures were found to be 2.2 and 5 cm
H2O in male subjects, respectively. This result agrees with intrinsic positive end expiratory pressure. The women
subjects exhibited greater pressures then the male subjects, which is thought to be due to their smaller nasal
geometries. Ritchie et al. (2011) and Parke et al. (2011a) conducted similar experiments with healthy volunteers
and post cardiac surgery patients, respectively. Ritchie et al. (2011) obtained expiratory pressures that agreed with
Groves et al. (2007) and concluded that there is a linear relationship between increasing flowrate and increasing
pressures in the upper airway. Parke et al. (2011a) recorded pressures in the nasopharynx and these were found to
be approximately half of Groves et al. (2007). Difference in results may have been due to the difference in catheter
locations in the subjects, and due to specific differences in nasal geometries. However all three studies agreed with
the correlation between nasal flow rates and pressures in the air way.
3.2 Tissue Properties
3.2.1 Soft Palate and Tongue
There have been several studies that have investigated the mechanical properties of the soft palate and tongue.
These involve estimation from numerical modelling; ex vivo testing on excised tissues from animals or cadavers;
and in vivo testing. In a study performed by Cheng et al. (2011), magnetic resonance elastography (MRE) was
carried out as a means of obtaining viscoelastic properties of the tongue and soft palate. Cheng et al. (2011)
measured the shear modulus of the tongue and soft palate to be 2.7 ± 0.3 kPa and 2.5 ± 0.3 kPa (mean ± SD),
respectively. Malhotra et al. (2002) studied pharyngeal collapse tendencies in during OSA, by monitoring
anatomic and pathophysiological features of the upper airway in healthy subjects. They performed standard
polysomnography and magnetic resonance imaging (MRI) and developed a finite element (FE) model of the
airway using the signal averaged anatomic data. They used reverse algorithms to determine the mechanical
properties of tongue and soft palate based on the motions and exerted pressure. The FE model was simplified by
assuming uniform stiffness throughout the entire region. During a sleeping condition the elastic modulus for the
tongue and soft palate was 12.4 kPa and for a paralyzed condition with no muscle activation, it was 6 kPa. Xu et
al. (2005) also used an MRI based FE model to calculate the elastic modulus of the tongue and soft palate. Their
value of 5 kPa for soft palate, agreed with Malhotra et al. (2002), and but the 3.5 kPa they calculated for the tongue
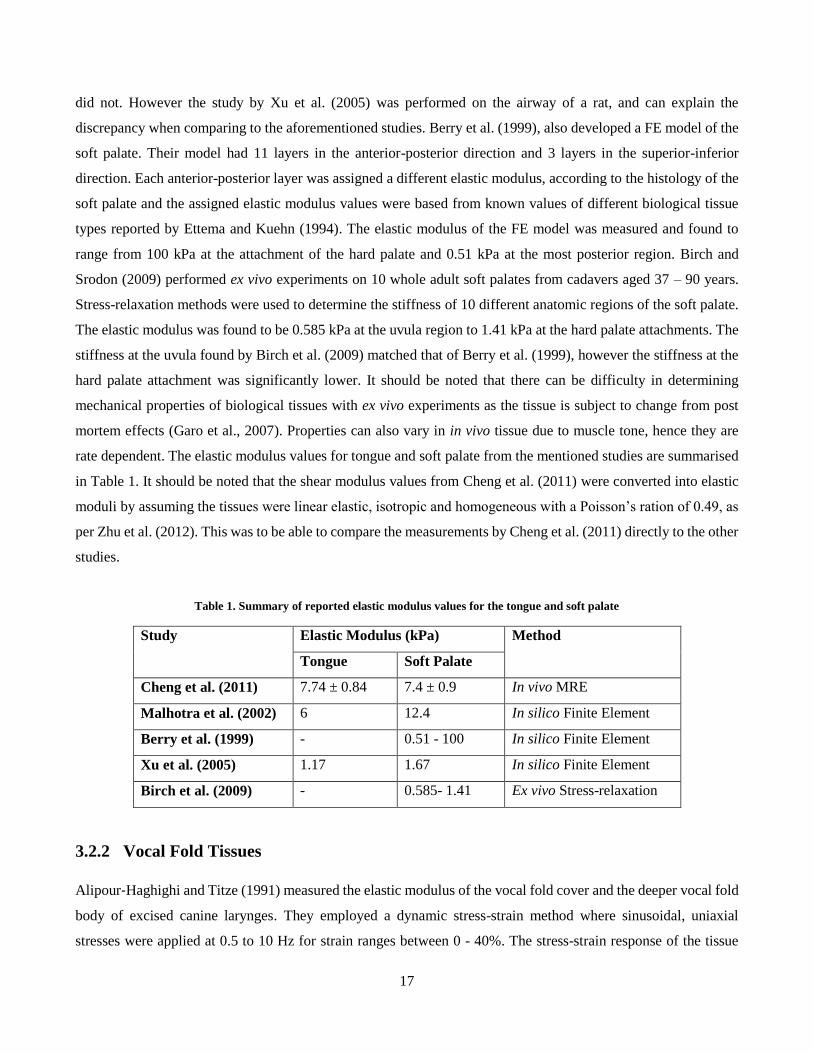
17
did not. However the study by Xu et al. (2005) was performed on the airway of a rat, and can explain the
discrepancy when comparing to the aforementioned studies. Berry et al. (1999), also developed a FE model of the
soft palate. Their model had 11 layers in the anterior-posterior direction and 3 layers in the superior-inferior
direction. Each anterior-posterior layer was assigned a different elastic modulus, according to the histology of the
soft palate and the assigned elastic modulus values were based from known values of different biological tissue
types reported by Ettema and Kuehn (1994). The elastic modulus of the FE model was measured and found to
range from 100 kPa at the attachment of the hard palate and 0.51 kPa at the most posterior region. Birch and
Srodon (2009) performed ex vivo experiments on 10 whole adult soft palates from cadavers aged 37 – 90 years.
Stress-relaxation methods were used to determine the stiffness of 10 different anatomic regions of the soft palate.
The elastic modulus was found to be 0.585 kPa at the uvula region to 1.41 kPa at the hard palate attachments. The
stiffness at the uvula found by Birch et al. (2009) matched that of Berry et al. (1999), however the stiffness at the
hard palate attachment was significantly lower. It should be noted that there can be difficulty in determining
mechanical properties of biological tissues with ex vivo experiments as the tissue is subject to change from post
mortem effects (Garo et al., 2007). Properties can also vary in in vivo tissue due to muscle tone, hence they are
rate dependent. The elastic modulus values for tongue and soft palate from the mentioned studies are summarised
in Table 1. It should be noted that the shear modulus values from Cheng et al. (2011) were converted into elastic
moduli by assuming the tissues were linear elastic, isotropic and homogeneous with a Poisson’s ration of 0.49, as
per Zhu et al. (2012). This was to be able to compare the measurements by Cheng et al. (2011) directly to the other
studies.
Table 1. Summary of reported elastic modulus values for the tongue and soft palate
Study Elastic Modulus (kPa) Method
Tongue Soft Palate
Cheng et al. (2011) 7.74 ± 0.84 7.4 ± 0.9 In vivo MRE
Malhotra et al. (2002) 6 12.4 In silico Finite Element
Berry et al. (1999) - 0.51 - 100 In silico Finite Element
Xu et al. (2005) 1.17 1.67 In silico Finite Element
Birch et al. (2009) - 0.585- 1.41 Ex vivo Stress-relaxation
3.2.2 Vocal Fold Tissues
Alipour‐Haghighi and Titze (1991) measured the elastic modulus of the vocal fold cover and the deeper vocal fold
body of excised canine larynges. They employed a dynamic stress-strain method where sinusoidal, uniaxial
stresses were applied at 0.5 to 10 Hz for strain ranges between 0 - 40%. The stress-strain response of the tissue
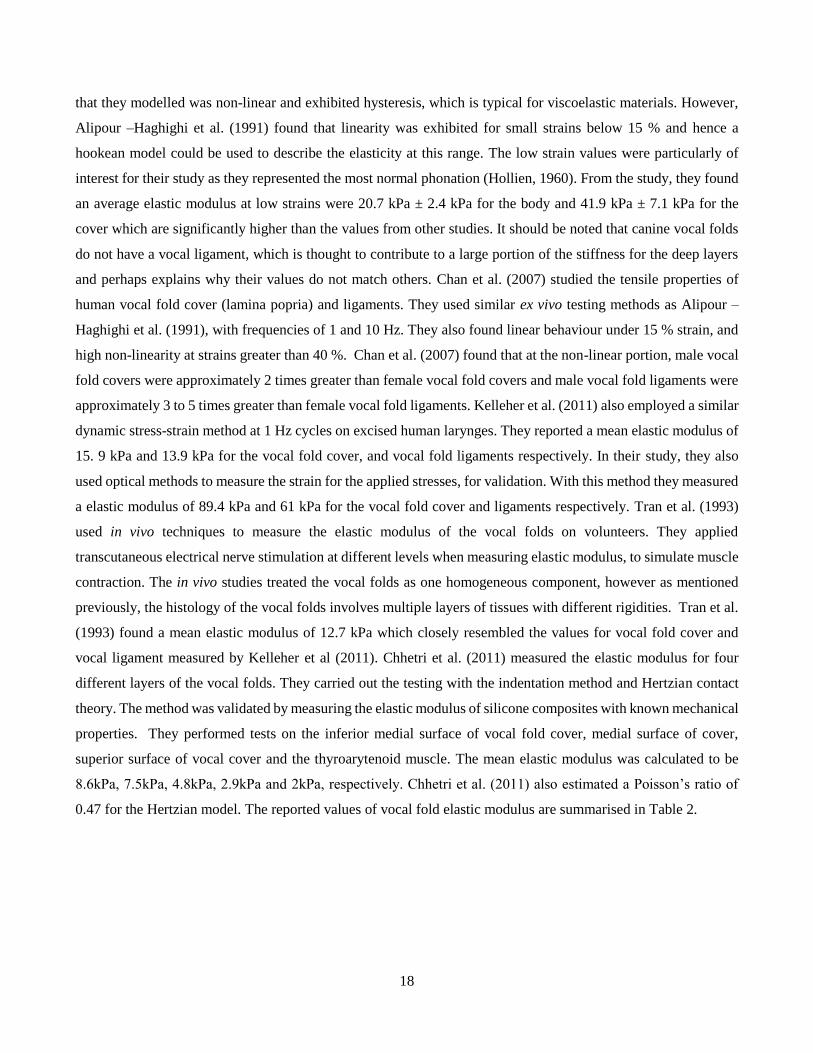
18
that they modelled was non-linear and exhibited hysteresis, which is typical for viscoelastic materials. However,
Alipour –Haghighi et al. (1991) found that linearity was exhibited for small strains below 15 % and hence a
hookean model could be used to describe the elasticity at this range. The low strain values were particularly of
interest for their study as they represented the most normal phonation (Hollien, 1960). From the study, they found
an average elastic modulus at low strains were 20.7 kPa ± 2.4 kPa for the body and 41.9 kPa ± 7.1 kPa for the
cover which are significantly higher than the values from other studies. It should be noted that canine vocal folds
do not have a vocal ligament, which is thought to contribute to a large portion of the stiffness for the deep layers
and perhaps explains why their values do not match others. Chan et al. (2007) studied the tensile properties of
human vocal fold cover (lamina popria) and ligaments. They used similar ex vivo testing methods as Alipour –
Haghighi et al. (1991), with frequencies of 1 and 10 Hz. They also found linear behaviour under 15 % strain, and
high non-linearity at strains greater than 40 %. Chan et al. (2007) found that at the non-linear portion, male vocal
fold covers were approximately 2 times greater than female vocal fold covers and male vocal fold ligaments were
approximately 3 to 5 times greater than female vocal fold ligaments. Kelleher et al. (2011) also employed a similar
dynamic stress-strain method at 1 Hz cycles on excised human larynges. They reported a mean elastic modulus of
15. 9 kPa and 13.9 kPa for the vocal fold cover, and vocal fold ligaments respectively. In their study, they also
used optical methods to measure the strain for the applied stresses, for validation. With this method they measured
a elastic modulus of 89.4 kPa and 61 kPa for the vocal fold cover and ligaments respectively. Tran et al. (1993)
used in vivo techniques to measure the elastic modulus of the vocal folds on volunteers. They applied
transcutaneous electrical nerve stimulation at different levels when measuring elastic modulus, to simulate muscle
contraction. The in vivo studies treated the vocal folds as one homogeneous component, however as mentioned
previously, the histology of the vocal folds involves multiple layers of tissues with different rigidities. Tran et al.
(1993) found a mean elastic modulus of 12.7 kPa which closely resembled the values for vocal fold cover and
vocal ligament measured by Kelleher et al (2011). Chhetri et al. (2011) measured the elastic modulus for four
different layers of the vocal folds. They carried out the testing with the indentation method and Hertzian contact
theory. The method was validated by measuring the elastic modulus of silicone composites with known mechanical
properties. They performed tests on the inferior medial surface of vocal fold cover, medial surface of cover,
superior surface of vocal cover and the thyroarytenoid muscle. The mean elastic modulus was calculated to be
8.6kPa, 7.5kPa, 4.8kPa, 2.9kPa and 2kPa, respectively. Chhetri et al. (2011) also estimated a Poisson’s ratio of
0.47 for the Hertzian model. The reported values of vocal fold elastic modulus are summarised in Table 2.
19
Table 2. Reported elastic moduli for the vocal folds from different studies
Study Elastic Modulus Method
Alipouri-Haghighi et al. (1991) 41.9 kPA (cover)
20.7 kPa (Body)
Ex vivo (canine)
Dynamic stress-strain
Tran et al. (1992) 12.7 kPa In vivo Strss-strain
Kelleher et al. (2011) 16.1 kPa and 89 kPa (cover)
17.6 kPa and 61 kPa (ligament)
Ex vivo
Dynamic stress-strain
Chhetri et al. (2011) 2 kPa - 8.6 kPa Ex vivo Indentation
Chan et al. (2007) 4.7 kPa – 6.7 kPa (ligament),
8.1 kPa - 14.9 kPa (cover)
Ex vivo
Dynamic stress-strain
3.3 Studies in Compliance
3.3.1 Compliant Soft Palate Airway Condition
There have been several past studies that have investigated how soft palate compliance affects breathing. These
have all been limited to computational studies which use fluid-structure interaction (FSI) methods. Studies have
been exclusive to natural breathing conditions with a closed mouth airway.
Pirnar et al. (2015) carried out an FSI study on an upper airway model based on CT image data. They investigated
the collapse of pharyngeal tissues implicated by OSA, and simulated soft palate compliance by assigning a
realistic, previously reported elastic modulus to the tissue region (Cheng et al., 2011). On inspiration, the greatest
negative pressure occurred in the velopharynx, which was the narrowest section. The force from the negative static
pressure caused the soft palate to tend toward the posterior direction, reducing the cross-sectional area by 10 %,
and causing a more negative pressure in the region (Bernoulli’s law). On expiration the positive pressure in the
velopharynx exerted a force on the soft palate, causing it to move toward the anterior and increasing the
velopharyngeal cross-sectional area by 4 %. They compared the FSI studies to CFD simulation, which assumed a
completely rigid airway condition. At the peak inspiratory phase the compliant airway experienced a net airway
pressure of -44 Pa, and the rigid experienced – 39 Pa. At peak expiration, the FSI simulation predicted a net airway
pressure approximately 45 Pa whereas the CFD results predicted approximately 48 Pa. They also found that the
soft palate would vibrate at approximately 17.8 Hz which was consistent with snoring frequencies found by
Osborne et al. (1999).
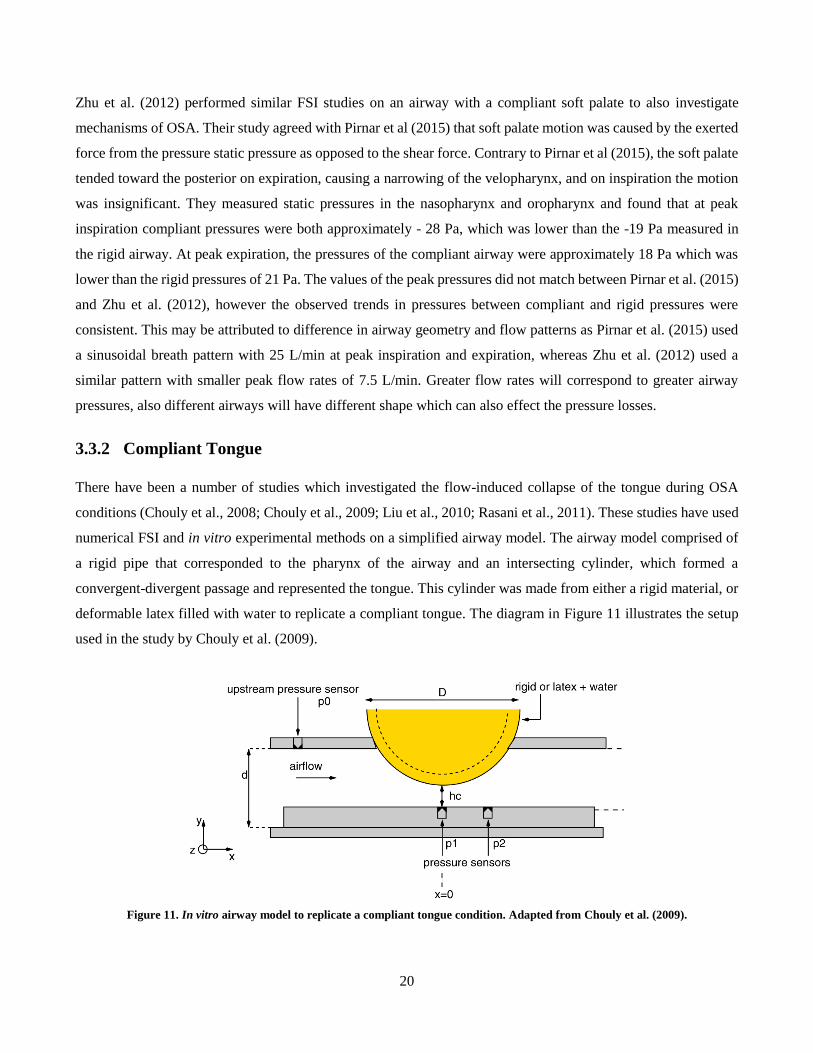
20
Zhu et al. (2012) performed similar FSI studies on an airway with a compliant soft palate to also investigate
mechanisms of OSA. Their study agreed with Pirnar et al (2015) that soft palate motion was caused by the exerted
force from the pressure static pressure as opposed to the shear force. Contrary to Pirnar et al (2015), the soft palate
tended toward the posterior on expiration, causing a narrowing of the velopharynx, and on inspiration the motion
was insignificant. They measured static pressures in the nasopharynx and oropharynx and found that at peak
inspiration compliant pressures were both approximately - 28 Pa, which was lower than the -19 Pa measured in
the rigid airway. At peak expiration, the pressures of the compliant airway were approximately 18 Pa which was
lower than the rigid pressures of 21 Pa. The values of the peak pressures did not match between Pirnar et al. (2015)
and Zhu et al. (2012), however the observed trends in pressures between compliant and rigid pressures were
consistent. This may be attributed to difference in airway geometry and flow patterns as Pirnar et al. (2015) used
a sinusoidal breath pattern with 25 L/min at peak inspiration and expiration, whereas Zhu et al. (2012) used a
similar pattern with smaller peak flow rates of 7.5 L/min. Greater flow rates will correspond to greater airway
pressures, also different airways will have different shape which can also effect the pressure losses.
3.3.2 Compliant Tongue
There have been a number of studies which investigated the flow-induced collapse of the tongue during OSA
conditions (Chouly et al., 2008; Chouly et al., 2009; Liu et al., 2010; Rasani et al., 2011). These studies have used
numerical FSI and in vitro experimental methods on a simplified airway model. The airway model comprised of
a rigid pipe that corresponded to the pharynx of the airway and an intersecting cylinder, which formed a
convergent-divergent passage and represented the tongue. This cylinder was made from either a rigid material, or
deformable latex filled with water to replicate a compliant tongue. The diagram in Figure 11 illustrates the setup
used in the study by Chouly et al. (2009).
Figure 11. In vitro airway model to replicate a compliant tongue condition. Adapted from Chouly et al. (2009).
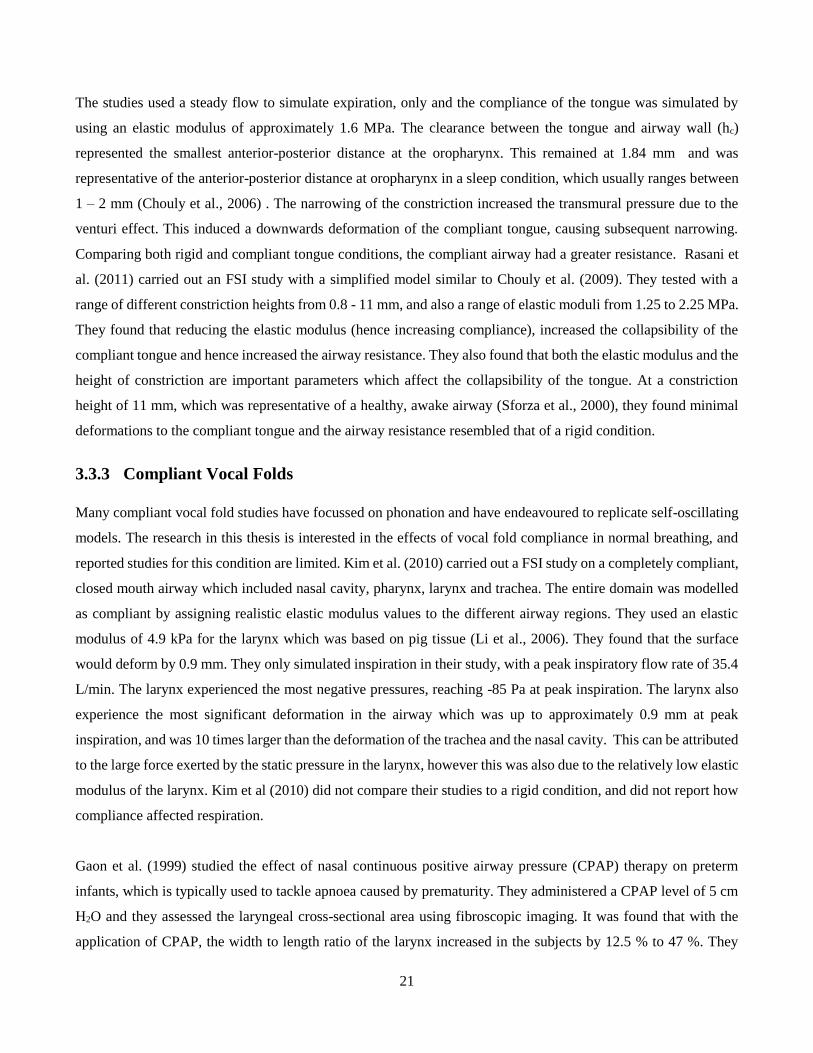
21
The studies used a steady flow to simulate expiration, only and the compliance of the tongue was simulated by
using an elastic modulus of approximately 1.6 MPa. The clearance between the tongue and airway wall (hc)
represented the smallest anterior-posterior distance at the oropharynx. This remained at 1.84 mm and was
representative of the anterior-posterior distance at oropharynx in a sleep condition, which usually ranges between
1 – 2 mm (Chouly et al., 2006) . The narrowing of the constriction increased the transmural pressure due to the
venturi effect. This induced a downwards deformation of the compliant tongue, causing subsequent narrowing.
Comparing both rigid and compliant tongue conditions, the compliant airway had a greater resistance. Rasani et
al. (2011) carried out an FSI study with a simplified model similar to Chouly et al. (2009). They tested with a
range of different constriction heights from 0.8 - 11 mm, and also a range of elastic moduli from 1.25 to 2.25 MPa.
They found that reducing the elastic modulus (hence increasing compliance), increased the collapsibility of the
compliant tongue and hence increased the airway resistance. They also found that both the elastic modulus and the
height of constriction are important parameters which affect the collapsibility of the tongue. At a constriction
height of 11 mm, which was representative of a healthy, awake airway (Sforza et al., 2000), they found minimal
deformations to the compliant tongue and the airway resistance resembled that of a rigid condition.
3.3.3 Compliant Vocal Folds
Many compliant vocal fold studies have focussed on phonation and have endeavoured to replicate self-oscillating
models. The research in this thesis is interested in the effects of vocal fold compliance in normal breathing, and
reported studies for this condition are limited. Kim et al. (2010) carried out a FSI study on a completely compliant,
closed mouth airway which included nasal cavity, pharynx, larynx and trachea. The entire domain was modelled
as compliant by assigning realistic elastic modulus values to the different airway regions. They used an elastic
modulus of 4.9 kPa for the larynx which was based on pig tissue (Li et al., 2006). They found that the surface
would deform by 0.9 mm. They only simulated inspiration in their study, with a peak inspiratory flow rate of 35.4
L/min. The larynx experienced the most negative pressures, reaching -85 Pa at peak inspiration. The larynx also
experience the most significant deformation in the airway which was up to approximately 0.9 mm at peak
inspiration, and was 10 times larger than the deformation of the trachea and the nasal cavity. This can be attributed
to the large force exerted by the static pressure in the larynx, however this was also due to the relatively low elastic
modulus of the larynx. Kim et al (2010) did not compare their studies to a rigid condition, and did not report how
compliance affected respiration.
Gaon et al. (1999) studied the effect of nasal continuous positive airway pressure (CPAP) therapy on preterm
infants, which is typically used to tackle apnoea caused by prematurity. They administered a CPAP level of 5 cm
H2O and they assessed the laryngeal cross-sectional area using fibroscopic imaging. It was found that with the
application of CPAP, the width to length ratio of the larynx increased in the subjects by 12.5 % to 47 %. They
22
hypothesised that the changes in the glottis were either due to the CPAP stimulating the vocal fold abductor
muscles, or due to the therapy’s distending effects on the compliant larynx.
During respiration, there are involuntary muscle movements in the larynx, which cause small abductions and
adductions, to modulate the air flow. During inspiration, there is a dilation of the cross-sectional area in the larynx
reduces the airways’ resistance to air flow. On expiration, a narrowing of the cross-sectional area in the larynx
maintains the end-expiratory pressure in the lower airway and prevents alveoli collapse (Brancatisano et al., 1983;
Shiba, 2010). Scheinherr et al. (2015) studied glottal area variation during respiration. They assessed the glottal
motion in 20 volunteers (10 male, 10 female) using a nasal fiberscope, during different breathing tasks. They
confirmed that the laryngeal cross-sectional area would increase on inspiration and decrease on expiration. They
concluded that their subjects could be grouped into two categories, based on the extent of the glottal motion: static
group and dynamic group. The static group corresponded to a glottal area change of less than 10 % between
inspiration and expiration, and the dynamic group corresponded to glottal area change of over 10 %. The dynamic
group reached a mean glottal variation of 24 % and 46 % during slow breathing, in males and females, respectively.
In rapid breathing this corresponded to 24 % and 39 % in males and females respectively.
Previous studies in phonation have fabricated compliant vocal folds to investigate the acoustics of the larynx and
the influence of air flow through the glottis. These models were often simplified, one-layered, homogeneous
models. Most of these studies used the generic dimensions proposed by Scherer et al. (2001) to make vocal fold
models with idealized geometries. Other simplifications include elastic, materially linear, and isotropic material
properties, as opposed to viscoelastic, materially-nonlinear, anisotropic properties of human vocal fold tissue.
Despite all these idealizations, these models have shown to vibrate at pressures and frequencies typical of human
phonation (Pickup & Thomson, 2009). Thomson et al. (2005) used a self-oscillating model to explore transfer of
aerodynamic energy from glottal airflow to the vocal folds. The vocal fold replica was a simplified one layer model
portraying properties mentioned previously in the paragraph. The study aimed to replicate a vocal fold model that
portrayed realistic characteristics which include onset pressure, oscillation frequency, geometry and material
properties. The 3 part silicone solution that was used to cast the models had an elastic modulus of 13.7 kPa, similar
to that proposed by Tran et al. (1993). The physical model designed by Thomson et al. (2005) has been used by
several other similar studies that have investigated laryngeal aerodynamics and vocal fold vibration (Berry et al.,
2006; Neubauer et al., 2007; Zhang et al., 2006a,b) and is depicted in Figure 12. In most mammals, vocal folds
consist of at least two layers: a superficial vocal cover and a muscular body layer (Hirano & Kakita, 1985). Human
vocal folds are known to also have a vocal ligament between the cover and the body. A level of sophistication has
been implemented in other studies by using two-layered models to mimic the soft tissue cover layer and the stiff
body layer of the vocal folds (Drechsel & Thomson, 2008; Riede et al., 2008). These models were adaptations of
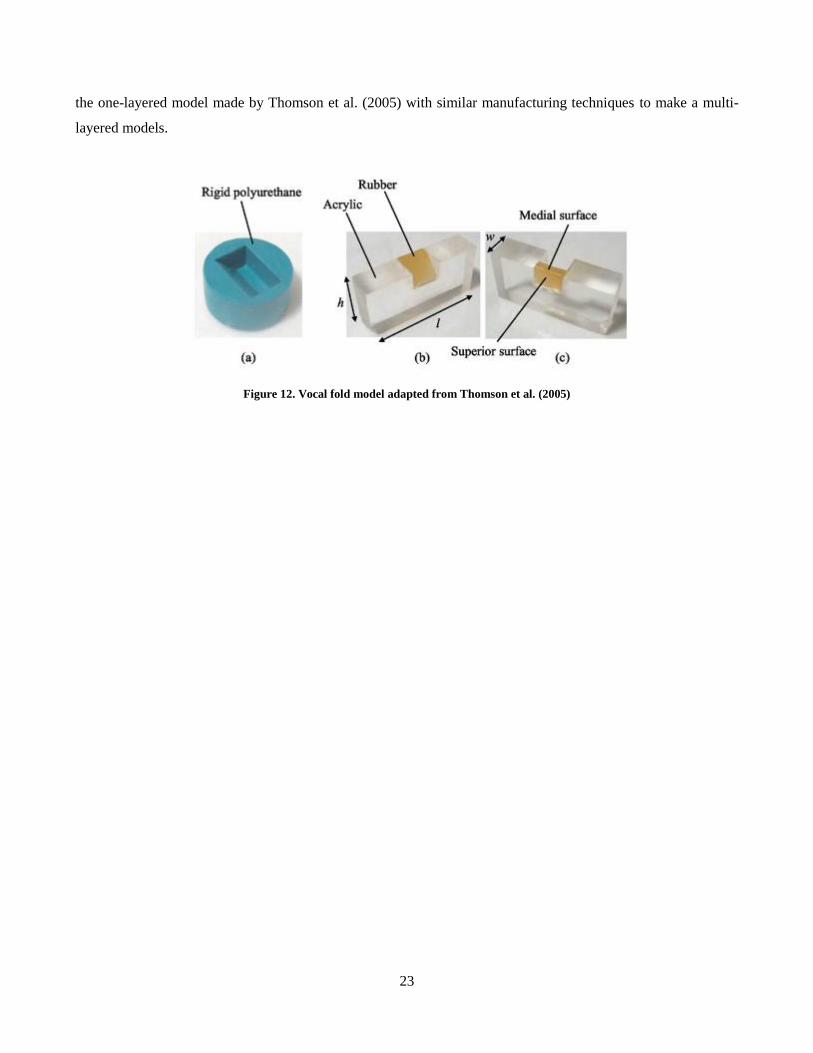
23
the one-layered model made by Thomson et al. (2005) with similar manufacturing techniques to make a multi-
layered models.
Figure 12. Vocal fold model adapted from Thomson et al. (2005)
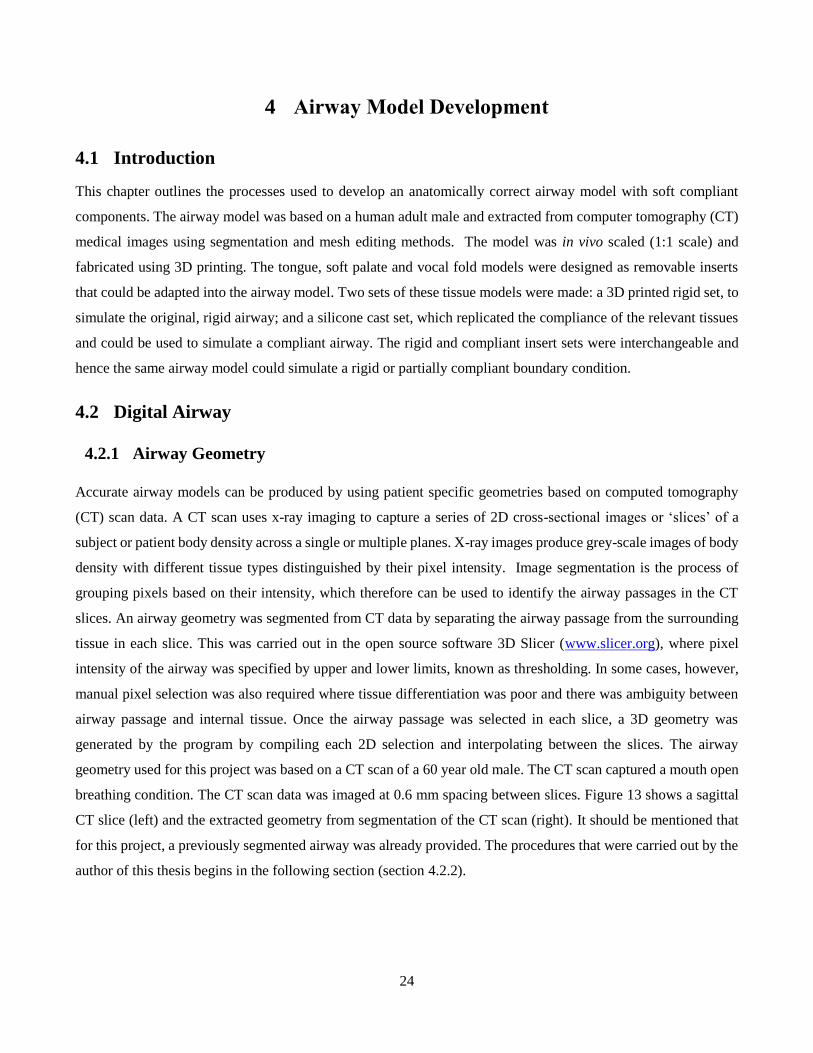
24
4 Airway Model Development
4.1 Introduction
This chapter outlines the processes used to develop an anatomically correct airway model with soft compliant
components. The airway model was based on a human adult male and extracted from computer tomography (CT)
medical images using segmentation and mesh editing methods. The model was in vivo scaled (1:1 scale) and
fabricated using 3D printing. The tongue, soft palate and vocal fold models were designed as removable inserts
that could be adapted into the airway model. Two sets of these tissue models were made: a 3D printed rigid set, to
simulate the original, rigid airway; and a silicone cast set, which replicated the compliance of the relevant tissues
and could be used to simulate a compliant airway. The rigid and compliant insert sets were interchangeable and
hence the same airway model could simulate a rigid or partially compliant boundary condition.
4.2 Digital Airway
4.2.1 Airway Geometry
Accurate airway models can be produced by using patient specific geometries based on computed tomography
(CT) scan data. A CT scan uses x-ray imaging to capture a series of 2D cross-sectional images or ‘slices’ of a
subject or patient body density across a single or multiple planes. X-ray images produce grey-scale images of body
density with different tissue types distinguished by their pixel intensity. Image segmentation is the process of
grouping pixels based on their intensity, which therefore can be used to identify the airway passages in the CT
slices. An airway geometry was segmented from CT data by separating the airway passage from the surrounding
tissue in each slice. This was carried out in the open source software 3D Slicer (www.slicer.org), where pixel
intensity of the airway was specified by upper and lower limits, known as thresholding. In some cases, however,
manual pixel selection was also required where tissue differentiation was poor and there was ambiguity between
airway passage and internal tissue. Once the airway passage was selected in each slice, a 3D geometry was
generated by the program by compiling each 2D selection and interpolating between the slices. The airway
geometry used for this project was based on a CT scan of a 60 year old male. The CT scan captured a mouth open
breathing condition. The CT scan data was imaged at 0.6 mm spacing between slices. Figure 13 shows a sagittal
CT slice (left) and the extracted geometry from segmentation of the CT scan (right). It should be mentioned that
for this project, a previously segmented airway was already provided. The procedures that were carried out by the
author of this thesis begins in the following section (section 4.2.2).
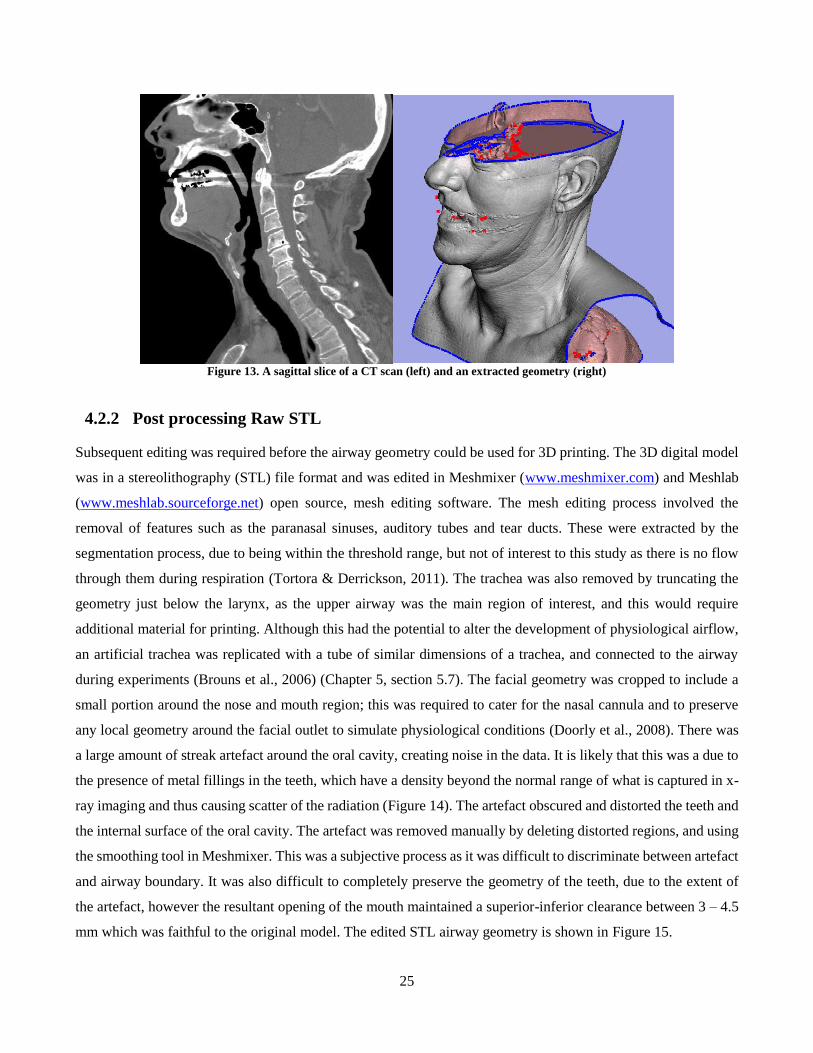
25
Figure 13. A sagittal slice of a CT scan (left) and an extracted geometry (right)
4.2.2 Post processing Raw STL
Subsequent editing was required before the airway geometry could be used for 3D printing. The 3D digital model
was in a stereolithography (STL) file format and was edited in Meshmixer (www.meshmixer.com) and Meshlab
(www.meshlab.sourceforge.net) open source, mesh editing software. The mesh editing process involved the
removal of features such as the paranasal sinuses, auditory tubes and tear ducts. These were extracted by the
segmentation process, due to being within the threshold range, but not of interest to this study as there is no flow
through them during respiration (Tortora & Derrickson, 2011). The trachea was also removed by truncating the
geometry just below the larynx, as the upper airway was the main region of interest, and this would require
additional material for printing. Although this had the potential to alter the development of physiological airflow,
an artificial trachea was replicated with a tube of similar dimensions of a trachea, and connected to the airway
during experiments (Brouns et al., 2006) (Chapter 5, section 5.7). The facial geometry was cropped to include a
small portion around the nose and mouth region; this was required to cater for the nasal cannula and to preserve
any local geometry around the facial outlet to simulate physiological conditions (Doorly et al., 2008). There was
a large amount of streak artefact around the oral cavity, creating noise in the data. It is likely that this was a due to
the presence of metal fillings in the teeth, which have a density beyond the normal range of what is captured in x-
ray imaging and thus causing scatter of the radiation (Figure 14). The artefact obscured and distorted the teeth and
the internal surface of the oral cavity. The artefact was removed manually by deleting distorted regions, and using
the smoothing tool in Meshmixer. This was a subjective process as it was difficult to discriminate between artefact
and airway boundary. It was also difficult to completely preserve the geometry of the teeth, due to the extent of
the artefact, however the resultant opening of the mouth maintained a superior-inferior clearance between 3 – 4.5
mm which was faithful to the original model. The edited STL airway geometry is shown in Figure 15.
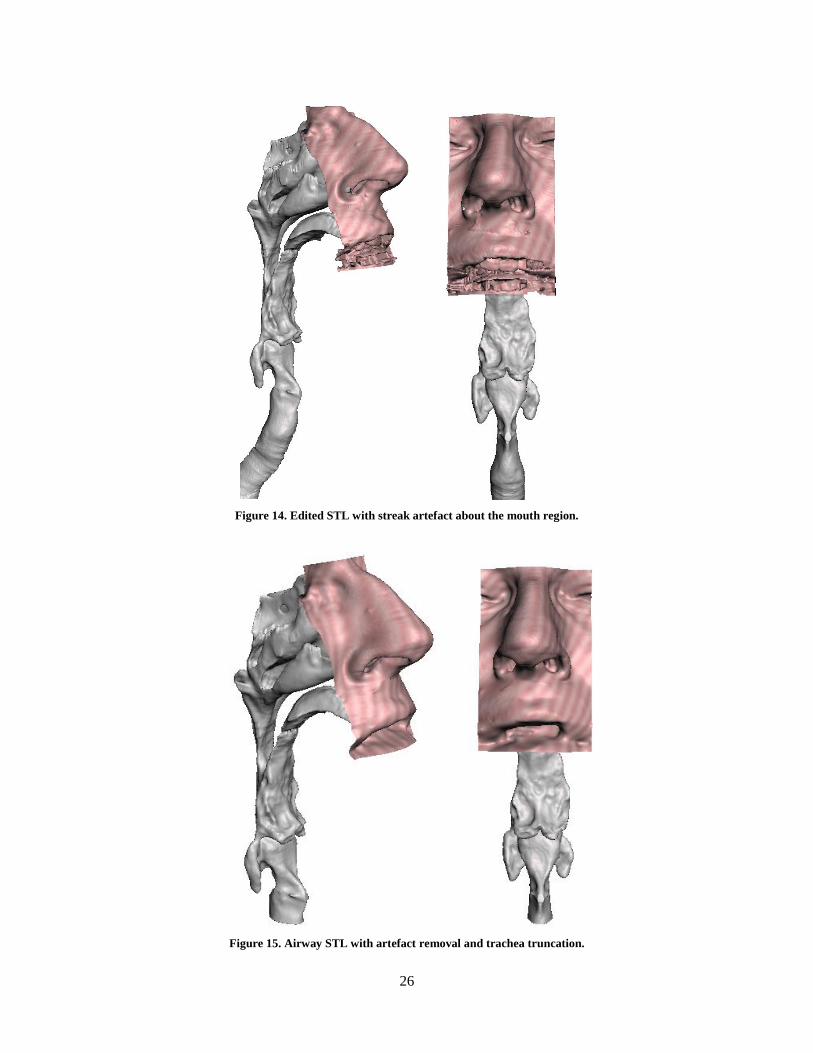
26
Figure 14. Edited STL with streak artefact about the mouth region.
Figure 15. Airway STL with artefact removal and trachea truncation.
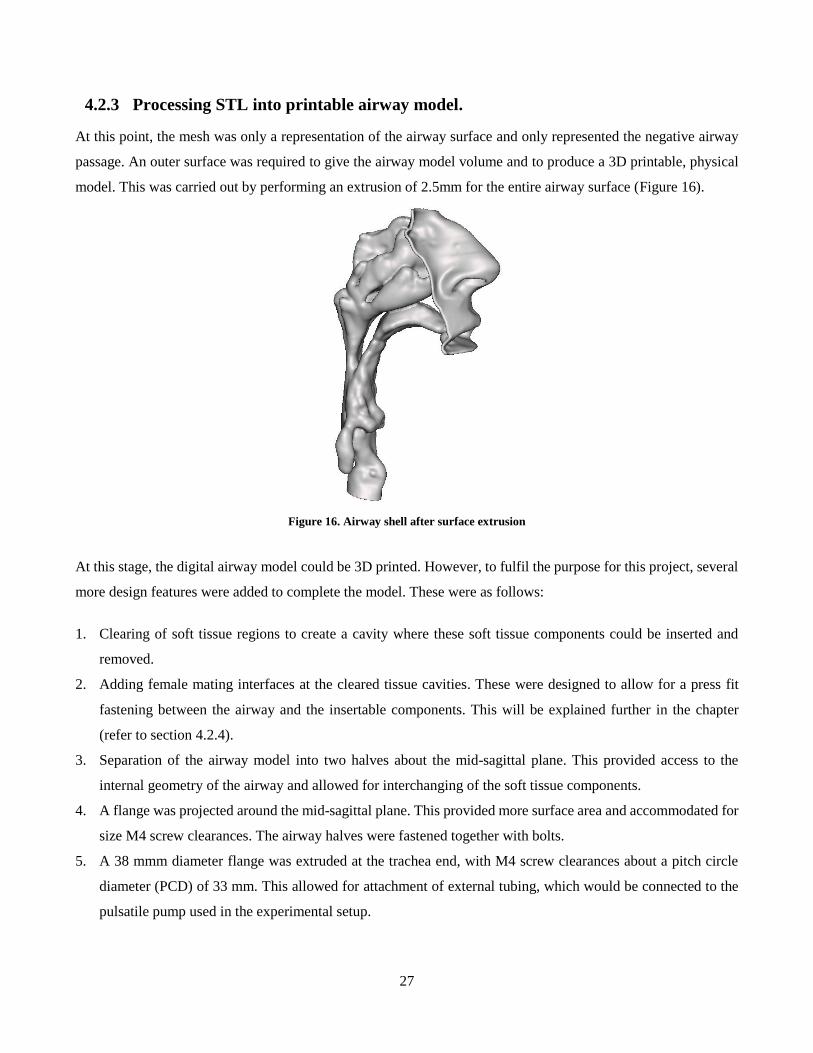
27
4.2.3 Processing STL into printable airway model.
At this point, the mesh was only a representation of the airway surface and only represented the negative airway
passage. An outer surface was required to give the airway model volume and to produce a 3D printable, physical
model. This was carried out by performing an extrusion of 2.5mm for the entire airway surface (Figure 16).
Figure 16. Airway shell after surface extrusion
At this stage, the digital airway model could be 3D printed. However, to fulfil the purpose for this project, several
more design features were added to complete the model. These were as follows:
1. Clearing of soft tissue regions to create a cavity where these soft tissue components could be inserted and
removed.
2. Adding female mating interfaces at the cleared tissue cavities. These were designed to allow for a press fit
fastening between the airway and the insertable components. This will be explained further in the chapter
(refer to section 4.2.4).
3. Separation of the airway model into two halves about the mid-sagittal plane. This provided access to the
internal geometry of the airway and allowed for interchanging of the soft tissue components.
4. A flange was projected around the mid-sagittal plane. This provided more surface area and accommodated for
size M4 screw clearances. The airway halves were fastened together with bolts.
5. A 38 mmm diameter flange was extruded at the trachea end, with M4 screw clearances about a pitch circle
diameter (PCD) of 33 mm. This allowed for attachment of external tubing, which would be connected to the
pulsatile pump used in the experimental setup.
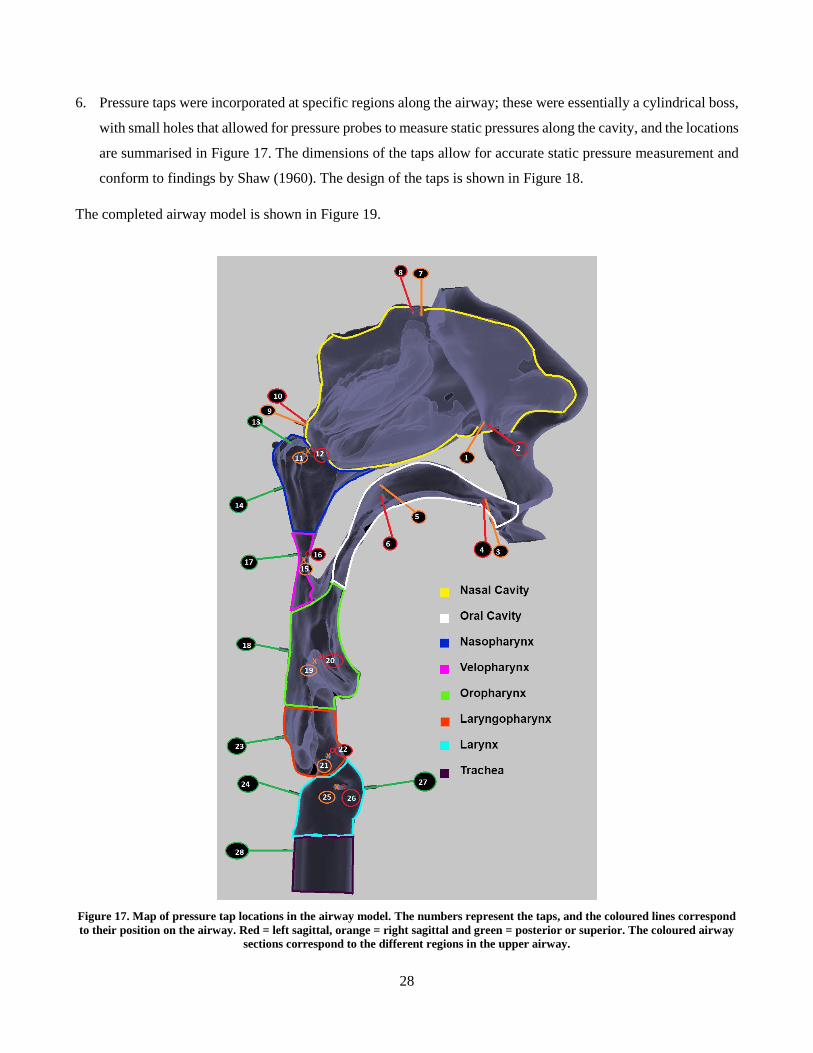
28
6. Pressure taps were incorporated at specific regions along the airway; these were essentially a cylindrical boss,
with small holes that allowed for pressure probes to measure static pressures along the cavity, and the locations
are summarised in Figure 17. The dimensions of the taps allow for accurate static pressure measurement and
conform to findings by Shaw (1960). The design of the taps is shown in Figure 18.
The completed airway model is shown in Figure 19.
Figure 17. Map of pressure tap locations in the airway model. The numbers represent the taps, and the coloured lines correspond
to their position on the airway. Red = left sagittal, orange = right sagittal and green = posterior or superior. The coloured airway
sections correspond to the different regions in the upper airway.
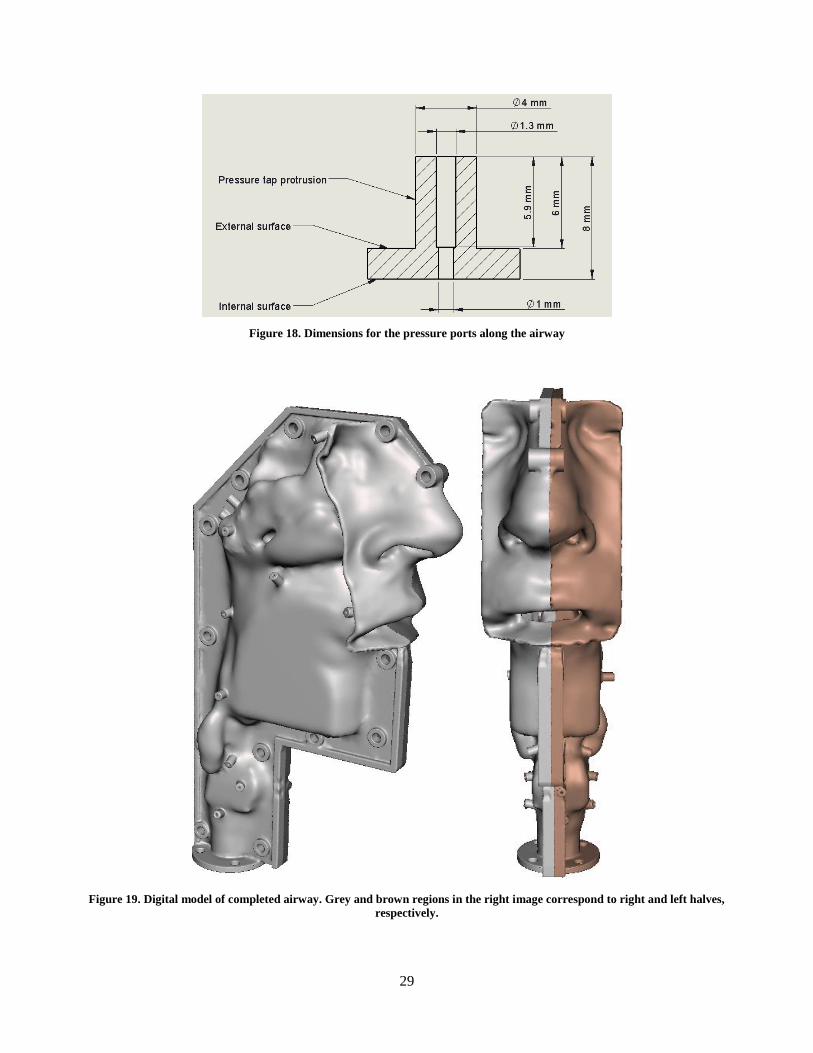
29
Figure 18. Dimensions for the pressure ports along the airway
Figure 19. Digital model of completed airway. Grey and brown regions in the right image correspond to right and left halves,
respectively.
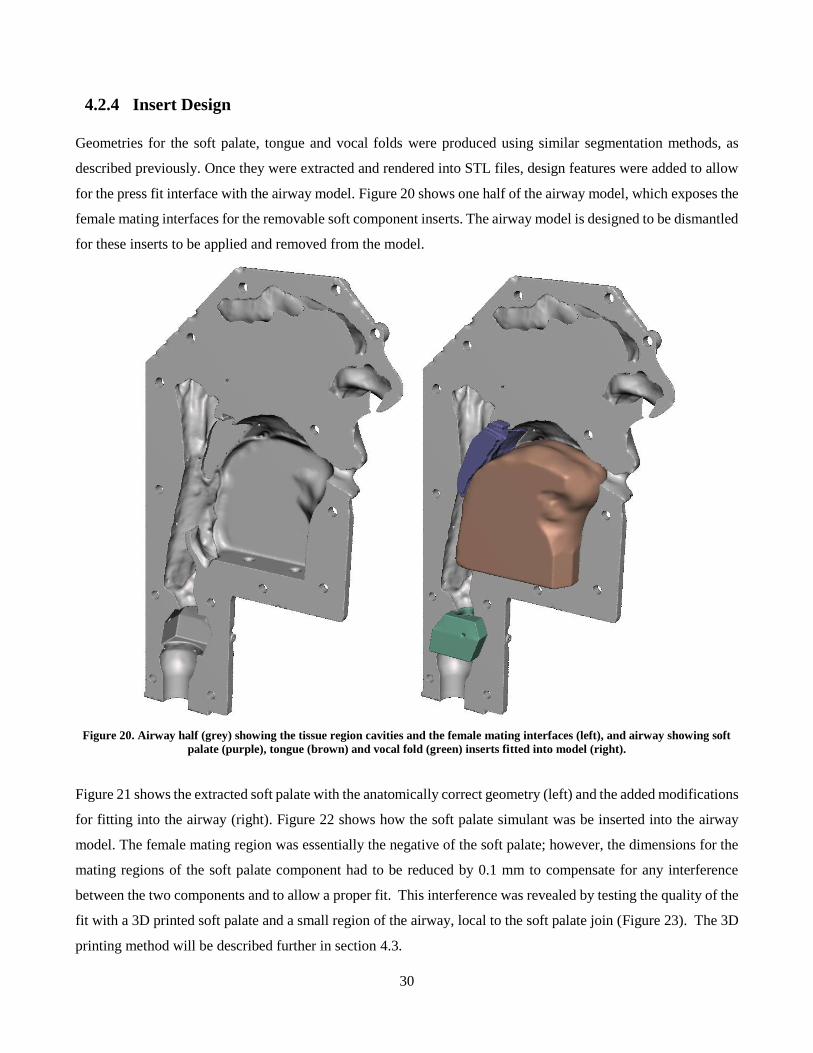
30
4.2.4 Insert Design
Geometries for the soft palate, tongue and vocal folds were produced using similar segmentation methods, as
described previously. Once they were extracted and rendered into STL files, design features were added to allow
for the press fit interface with the airway model. Figure 20 shows one half of the airway model, which exposes the
female mating interfaces for the removable soft component inserts. The airway model is designed to be dismantled
for these inserts to be applied and removed from the model.
Figure 20. Airway half (grey) showing the tissue region cavities and the female mating interfaces (left), and airway showing soft
palate (purple), tongue (brown) and vocal fold (green) inserts fitted into model (right).
Figure 21 shows the extracted soft palate with the anatomically correct geometry (left) and the added modifications
for fitting into the airway (right). Figure 22 shows how the soft palate simulant was be inserted into the airway
model. The female mating region was essentially the negative of the soft palate; however, the dimensions for the
mating regions of the soft palate component had to be reduced by 0.1 mm to compensate for any interference
between the two components and to allow a proper fit. This interference was revealed by testing the quality of the
fit with a 3D printed soft palate and a small region of the airway, local to the soft palate join (Figure 23). The 3D
printing method will be described further in section 4.3.
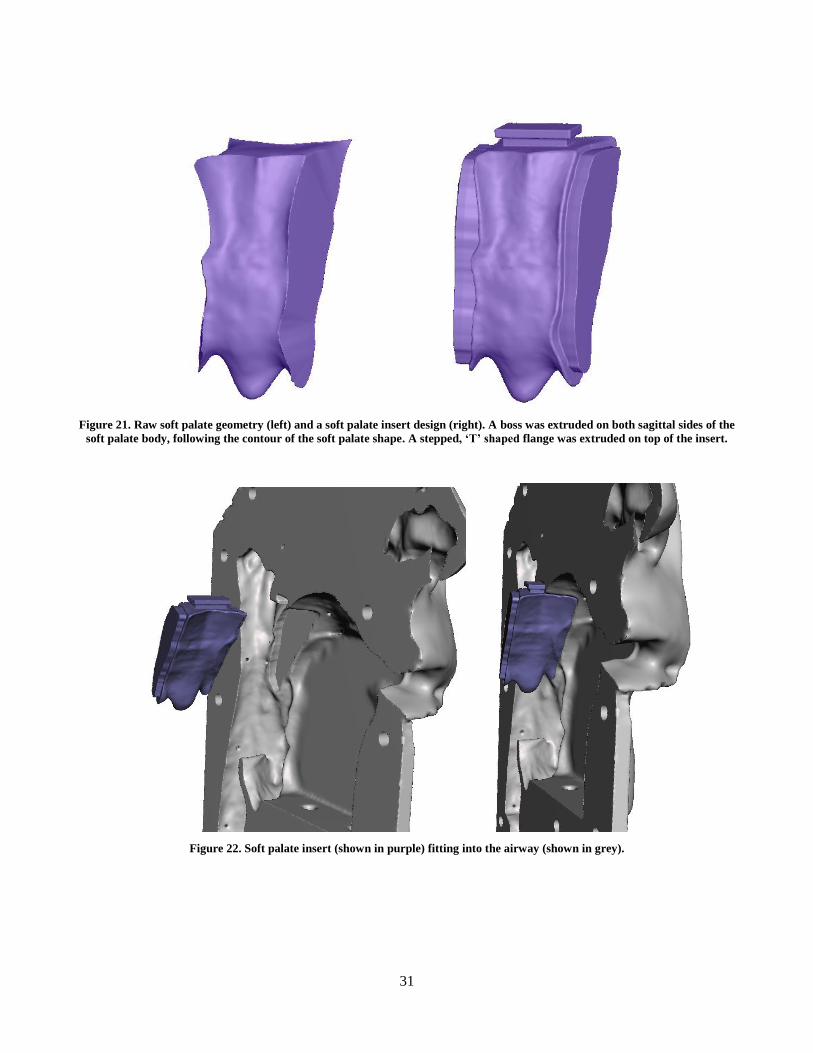
31
Figure 21. Raw soft palate geometry (left) and a soft palate insert design (right). A boss was extruded on both sagittal sides of the
soft palate body, following the contour of the soft palate shape. A stepped, ‘T’ shaped flange was extruded on top of the insert.
Figure 22. Soft palate insert (shown in purple) fitting into the airway (shown in grey).
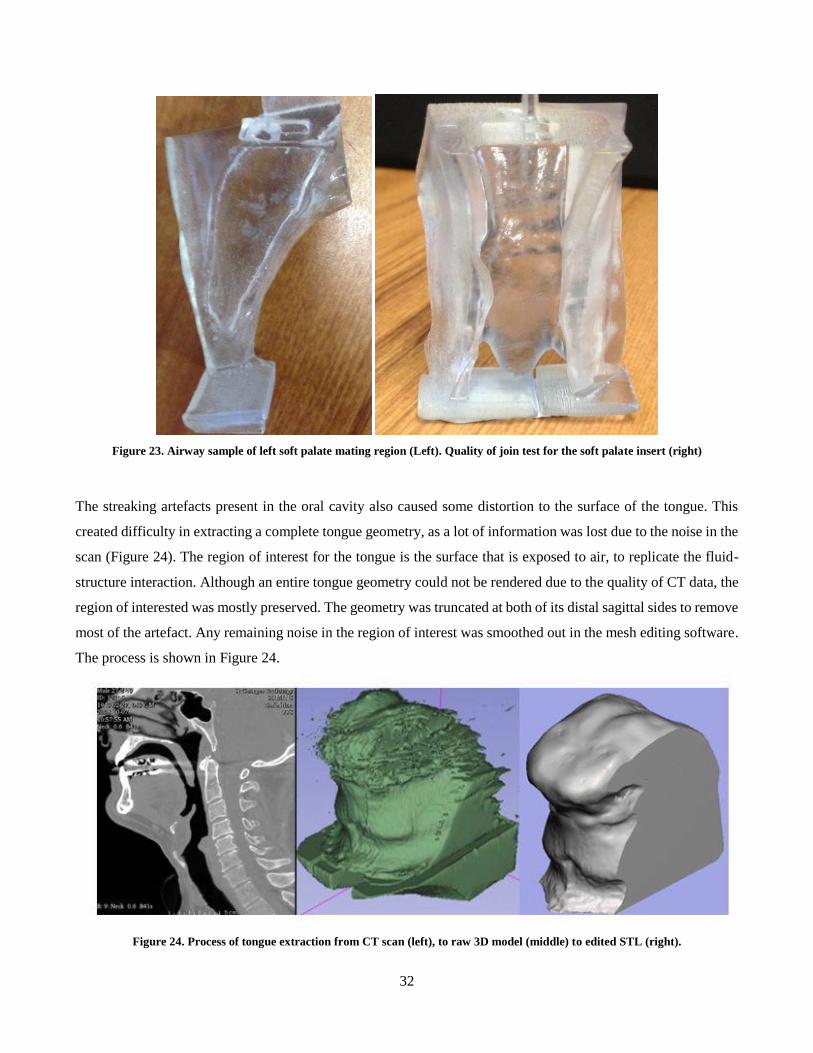
32
Figure 23. Airway sample of left soft palate mating region (Left). Quality of join test for the soft palate insert (right)
The streaking artefacts present in the oral cavity also caused some distortion to the surface of the tongue. This
created difficulty in extracting a complete tongue geometry, as a lot of information was lost due to the noise in the
scan (Figure 24). The region of interest for the tongue is the surface that is exposed to air, to replicate the fluid-
structure interaction. Although an entire tongue geometry could not be rendered due to the quality of CT data, the
region of interested was mostly preserved. The geometry was truncated at both of its distal sagittal sides to remove
most of the artefact. Any remaining noise in the region of interest was smoothed out in the mesh editing software.
The process is shown in Figure 24.
Figure 24. Process of tongue extraction from CT scan (left), to raw 3D model (middle) to edited STL (right).
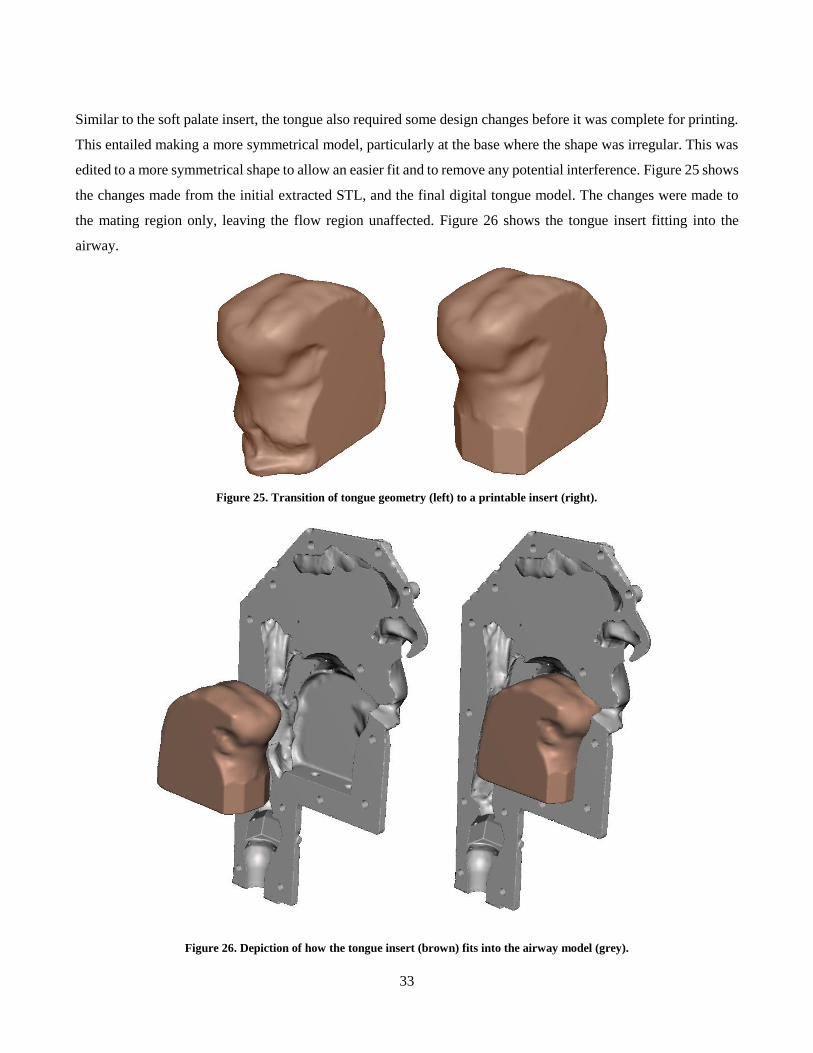
33
Similar to the soft palate insert, the tongue also required some design changes before it was complete for printing.
This entailed making a more symmetrical model, particularly at the base where the shape was irregular. This was
edited to a more symmetrical shape to allow an easier fit and to remove any potential interference. Figure 25 shows
the changes made from the initial extracted STL, and the final digital tongue model. The changes were made to
the mating region only, leaving the flow region unaffected. Figure 26 shows the tongue insert fitting into the
airway.
Figure 25. Transition of tongue geometry (left) to a printable insert (right).
Figure 26. Depiction of how the tongue insert (brown) fits into the airway model (grey).
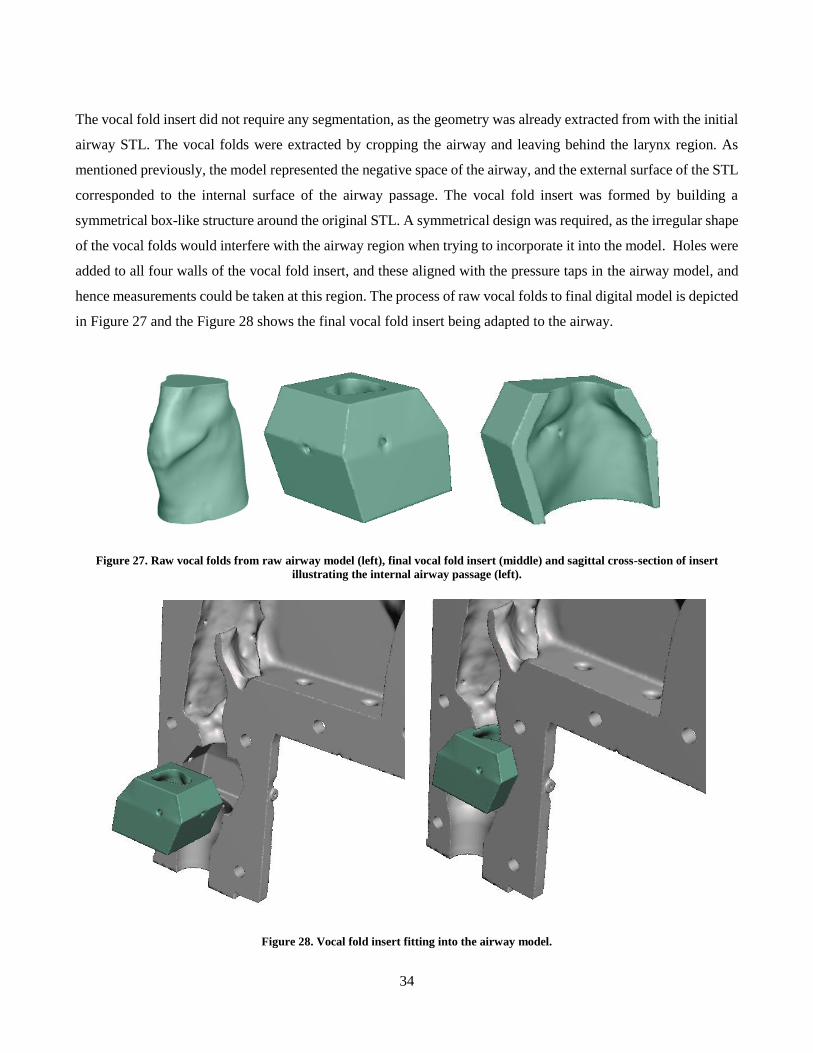
34
The vocal fold insert did not require any segmentation, as the geometry was already extracted from with the initial
airway STL. The vocal folds were extracted by cropping the airway and leaving behind the larynx region. As
mentioned previously, the model represented the negative space of the airway, and the external surface of the STL
corresponded to the internal surface of the airway passage. The vocal fold insert was formed by building a
symmetrical box-like structure around the original STL. A symmetrical design was required, as the irregular shape
of the vocal folds would interfere with the airway region when trying to incorporate it into the model. Holes were
added to all four walls of the vocal fold insert, and these aligned with the pressure taps in the airway model, and
hence measurements could be taken at this region. The process of raw vocal folds to final digital model is depicted
in Figure 27 and the Figure 28 shows the final vocal fold insert being adapted to the airway.
Figure 27. Raw vocal folds from raw airway model (left), final vocal fold insert (middle) and sagittal cross-section of insert
illustrating the internal airway passage (left).
Figure 28. Vocal fold insert fitting into the airway model.
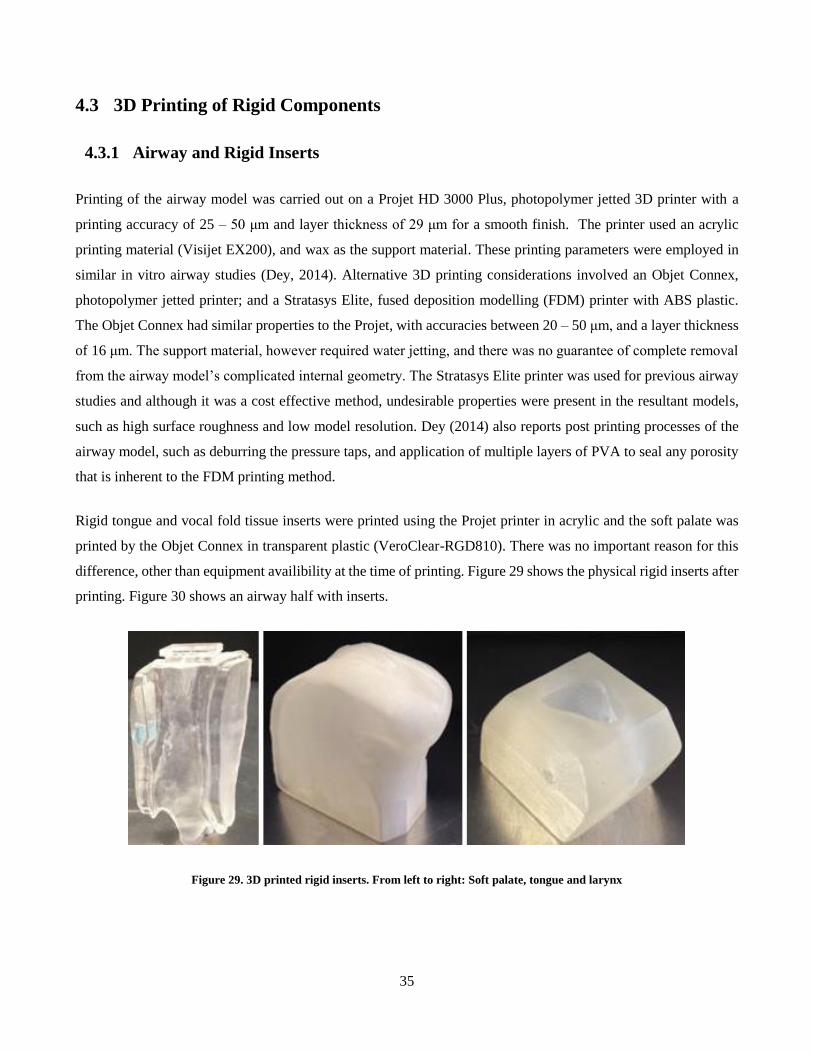
35
4.3 3D Printing of Rigid Components
4.3.1 Airway and Rigid Inserts
Printing of the airway model was carried out on a Projet HD 3000 Plus, photopolymer jetted 3D printer with a
printing accuracy of 25 – 50 μm and layer thickness of 29 μm for a smooth finish. The printer used an acrylic
printing material (Visijet EX200), and wax as the support material. These printing parameters were employed in
similar in vitro airway studies (Dey, 2014). Alternative 3D printing considerations involved an Objet Connex,
photopolymer jetted printer; and a Stratasys Elite, fused deposition modelling (FDM) printer with ABS plastic.
The Objet Connex had similar properties to the Projet, with accuracies between 20 – 50 μm, and a layer thickness
of 16 μm. The support material, however required water jetting, and there was no guarantee of complete removal
from the airway model’s complicated internal geometry. The Stratasys Elite printer was used for previous airway
studies and although it was a cost effective method, undesirable properties were present in the resultant models,
such as high surface roughness and low model resolution. Dey (2014) also reports post printing processes of the
airway model, such as deburring the pressure taps, and application of multiple layers of PVA to seal any porosity
that is inherent to the FDM printing method.
Rigid tongue and vocal fold tissue inserts were printed using the Projet printer in acrylic and the soft palate was
printed by the Objet Connex in transparent plastic (VeroClear-RGD810). There was no important reason for this
difference, other than equipment availibility at the time of printing. Figure 29 shows the physical rigid inserts after
printing. Figure 30 shows an airway half with inserts.
Figure 29. 3D printed rigid inserts. From left to right: Soft palate, tongue and larynx
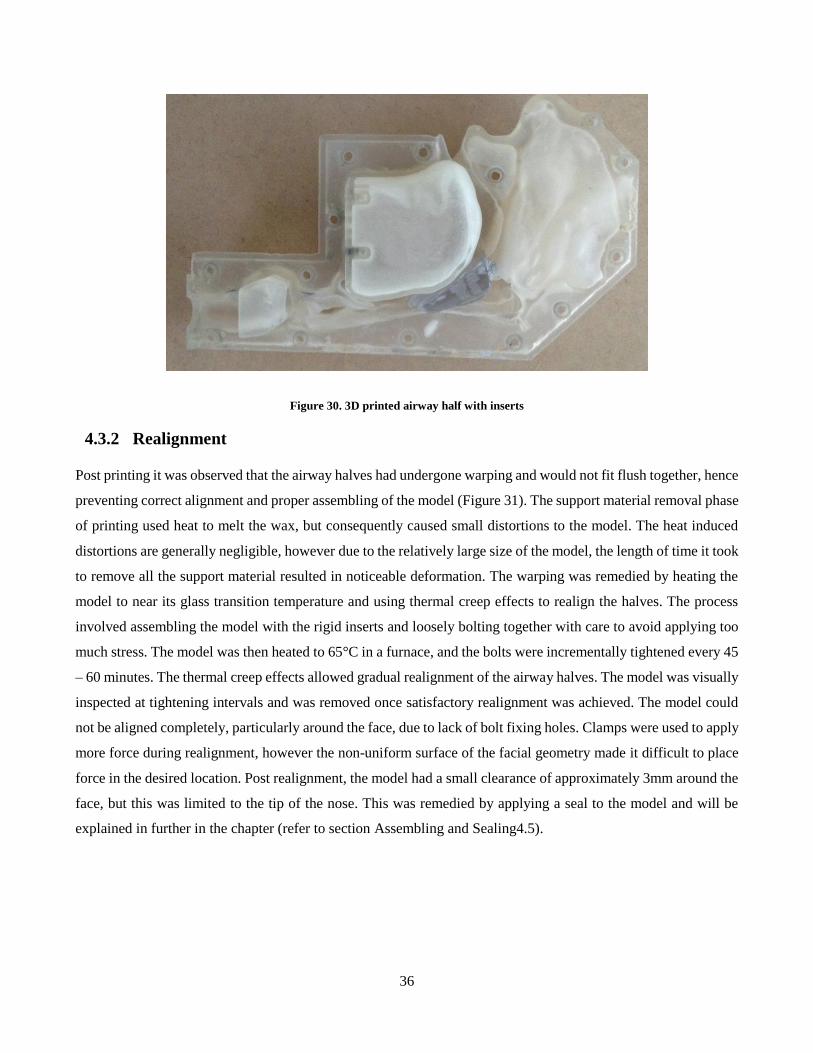
36
Figure 30. 3D printed airway half with inserts
4.3.2 Realignment
Post printing it was observed that the airway halves had undergone warping and would not fit flush together, hence
preventing correct alignment and proper assembling of the model (Figure 31). The support material removal phase
of printing used heat to melt the wax, but consequently caused small distortions to the model. The heat induced
distortions are generally negligible, however due to the relatively large size of the model, the length of time it took
to remove all the support material resulted in noticeable deformation. The warping was remedied by heating the
model to near its glass transition temperature and using thermal creep effects to realign the halves. The process
involved assembling the model with the rigid inserts and loosely bolting together with care to avoid applying too
much stress. The model was then heated to 65°C in a furnace, and the bolts were incrementally tightened every 45
– 60 minutes. The thermal creep effects allowed gradual realignment of the airway halves. The model was visually
inspected at tightening intervals and was removed once satisfactory realignment was achieved. The model could
not be aligned completely, particularly around the face, due to lack of bolt fixing holes. Clamps were used to apply
more force during realignment, however the non-uniform surface of the facial geometry made it difficult to place
force in the desired location. Post realignment, the model had a small clearance of approximately 3mm around the
face, but this was limited to the tip of the nose. This was remedied by applying a seal to the model and will be
explained in further in the chapter (refer to section Assembling and Sealing4.5).
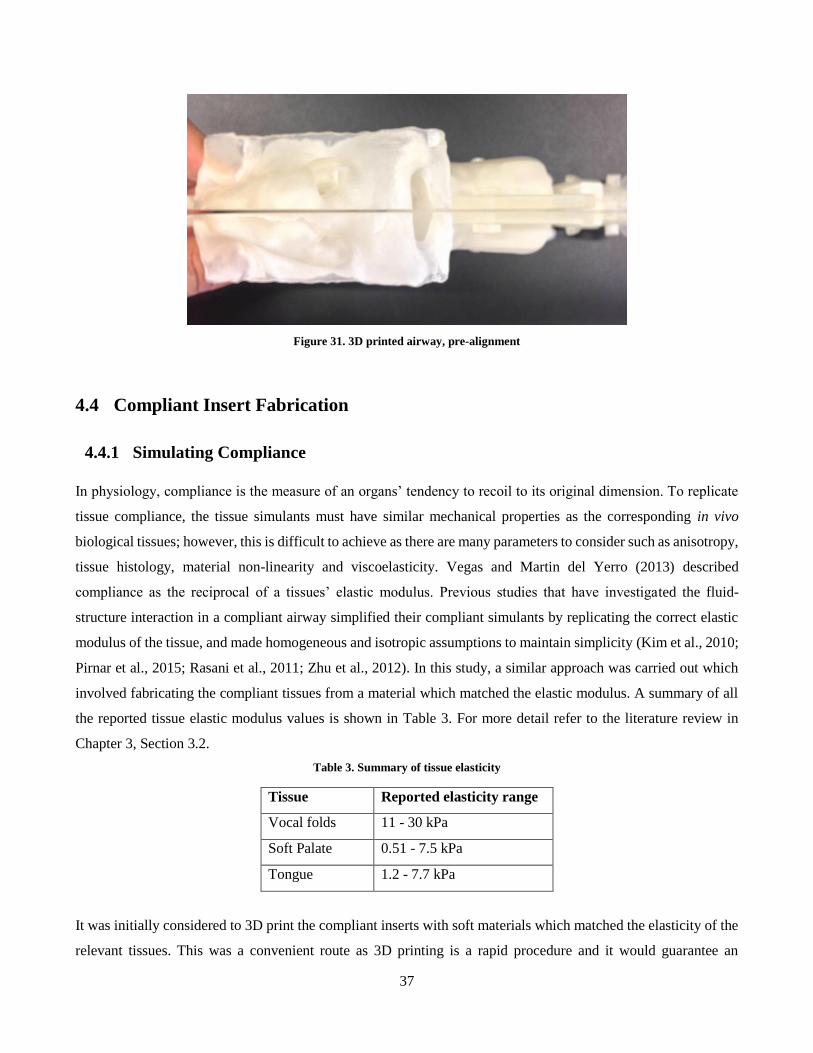
37
Figure 31. 3D printed airway, pre-alignment
4.4 Compliant Insert Fabrication
4.4.1 Simulating Compliance
In physiology, compliance is the measure of an organs’ tendency to recoil to its original dimension. To replicate
tissue compliance, the tissue simulants must have similar mechanical properties as the corresponding in vivo
biological tissues; however, this is difficult to achieve as there are many parameters to consider such as anisotropy,
tissue histology, material non-linearity and viscoelasticity. Vegas and Martin del Yerro (2013) described
compliance as the reciprocal of a tissues’ elastic modulus. Previous studies that have investigated the fluid-
structure interaction in a compliant airway simplified their compliant simulants by replicating the correct elastic
modulus of the tissue, and made homogeneous and isotropic assumptions to maintain simplicity (Kim et al., 2010;
Pirnar et al., 2015; Rasani et al., 2011; Zhu et al., 2012). In this study, a similar approach was carried out which
involved fabricating the compliant tissues from a material which matched the elastic modulus. A summary of all
the reported tissue elastic modulus values is shown in Table 3. For more detail refer to the literature review in
Chapter 3, Section 3.2.
Table 3. Summary of tissue elasticity
Tissue Reported elasticity range
Vocal folds 11 - 30 kPa
Soft Palate 0.51 - 7.5 kPa
Tongue 1.2 - 7.7 kPa
It was initially considered to 3D print the compliant inserts with soft materials which matched the elasticity of the
relevant tissues. This was a convenient route as 3D printing is a rapid procedure and it would guarantee an
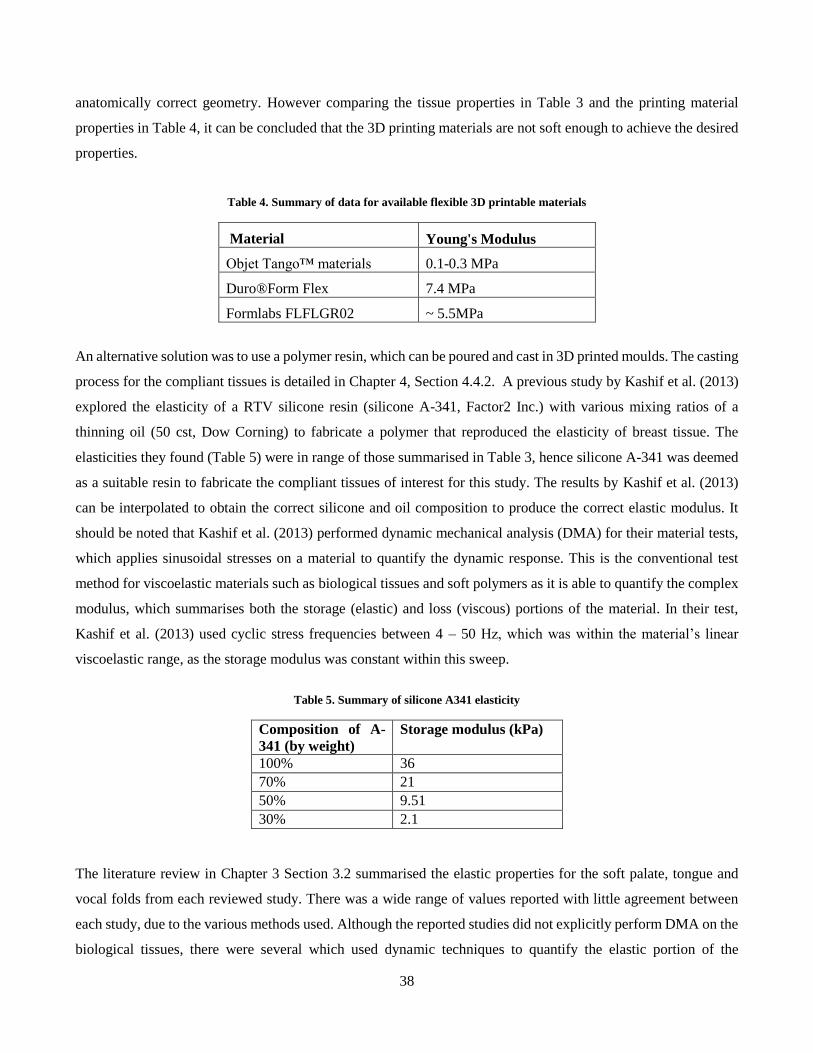
38
anatomically correct geometry. However comparing the tissue properties in Table 3 and the printing material
properties in Table 4, it can be concluded that the 3D printing materials are not soft enough to achieve the desired
properties.
Table 4. Summary of data for available flexible 3D printable materials
Material Young's Modulus
Objet Tango™ materials 0.1-0.3 MPa
Duro®Form Flex 7.4 MPa
Formlabs FLFLGR02 ~ 5.5MPa
An alternative solution was to use a polymer resin, which can be poured and cast in 3D printed moulds. The casting
process for the compliant tissues is detailed in Chapter 4, Section 4.4.2. A previous study by Kashif et al. (2013)
explored the elasticity of a RTV silicone resin (silicone A-341, Factor2 Inc.) with various mixing ratios of a
thinning oil (50 cst, Dow Corning) to fabricate a polymer that reproduced the elasticity of breast tissue. The
elasticities they found (Table 5) were in range of those summarised in Table 3, hence silicone A-341 was deemed
as a suitable resin to fabricate the compliant tissues of interest for this study. The results by Kashif et al. (2013)
can be interpolated to obtain the correct silicone and oil composition to produce the correct elastic modulus. It
should be noted that Kashif et al. (2013) performed dynamic mechanical analysis (DMA) for their material tests,
which applies sinusoidal stresses on a material to quantify the dynamic response. This is the conventional test
method for viscoelastic materials such as biological tissues and soft polymers as it is able to quantify the complex
modulus, which summarises both the storage (elastic) and loss (viscous) portions of the material. In their test,
Kashif et al. (2013) used cyclic stress frequencies between 4 – 50 Hz, which was within the material’s linear
viscoelastic range, as the storage modulus was constant within this sweep.
Table 5. Summary of silicone A341 elasticity
Composition of A-
341 (by weight)
Storage modulus (kPa)
100% 36
70% 21
50% 9.51
30% 2.1
The literature review in Chapter 3 Section 3.2 summarised the elastic properties for the soft palate, tongue and
vocal folds from each reviewed study. There was a wide range of values reported with little agreement between
each study, due to the various methods used. Although the reported studies did not explicitly perform DMA on the
biological tissues, there were several which used dynamic techniques to quantify the elastic portion of the
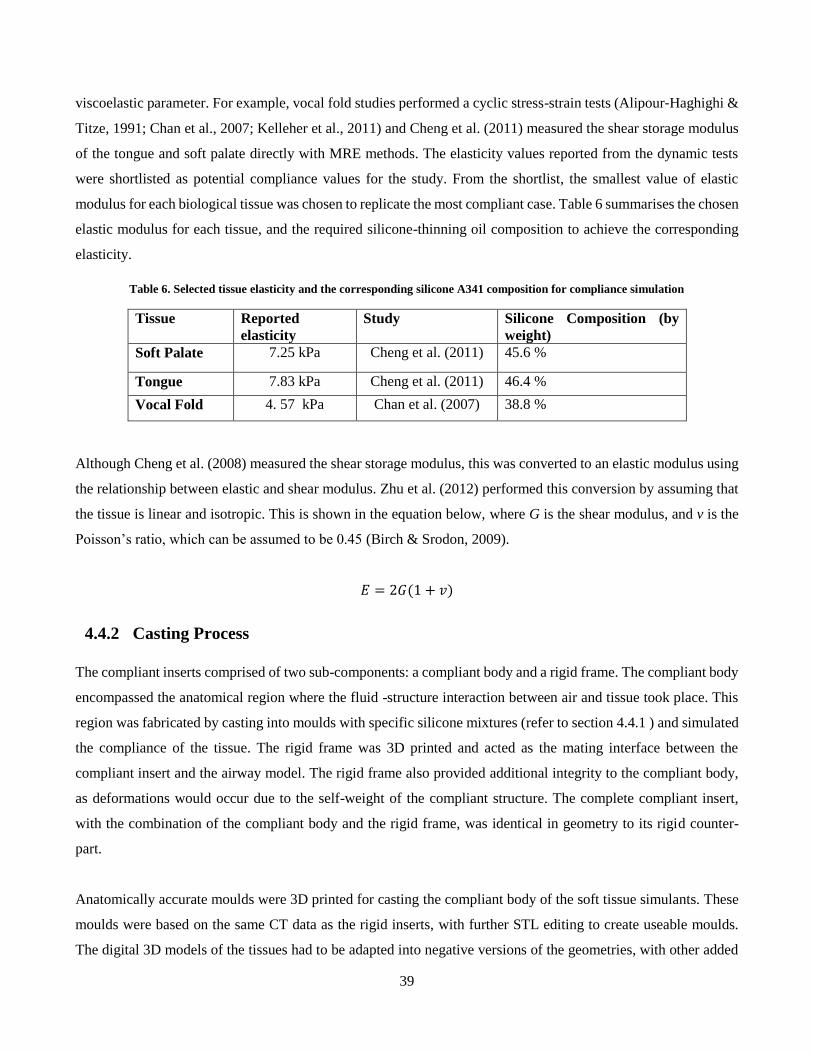
39
viscoelastic parameter. For example, vocal fold studies performed a cyclic stress-strain tests (Alipour‐Haghighi &
Titze, 1991; Chan et al., 2007; Kelleher et al., 2011) and Cheng et al. (2011) measured the shear storage modulus
of the tongue and soft palate directly with MRE methods. The elasticity values reported from the dynamic tests
were shortlisted as potential compliance values for the study. From the shortlist, the smallest value of elastic
modulus for each biological tissue was chosen to replicate the most compliant case. Table 6 summarises the chosen
elastic modulus for each tissue, and the required silicone-thinning oil composition to achieve the corresponding
elasticity.
Table 6. Selected tissue elasticity and the corresponding silicone A341 composition for compliance simulation
Tissue Reported
elasticity
Study Silicone Composition (by
weight)
Soft Palate 7.25 kPa Cheng et al. (2011) 45.6 %
Tongue 7.83 kPa Cheng et al. (2011) 46.4 %
Vocal Fold 4. 57 kPa Chan et al. (2007) 38.8 %
Although Cheng et al. (2008) measured the shear storage modulus, this was converted to an elastic modulus using
the relationship between elastic and shear modulus. Zhu et al. (2012) performed this conversion by assuming that
the tissue is linear and isotropic. This is shown in the equation below, where G is the shear modulus, and v is the
Poisson’s ratio, which can be assumed to be 0.45 (Birch & Srodon, 2009).
𝐸 = 2𝐺(1 + 𝑣)
4.4.2 Casting Process
The compliant inserts comprised of two sub-components: a compliant body and a rigid frame. The compliant body
encompassed the anatomical region where the fluid -structure interaction between air and tissue took place. This
region was fabricated by casting into moulds with specific silicone mixtures (refer to section 4.4.1 ) and simulated
the compliance of the tissue. The rigid frame was 3D printed and acted as the mating interface between the
compliant insert and the airway model. The rigid frame also provided additional integrity to the compliant body,
as deformations would occur due to the self-weight of the compliant structure. The complete compliant insert,
with the combination of the compliant body and the rigid frame, was identical in geometry to its rigid counter-
part.
Anatomically accurate moulds were 3D printed for casting the compliant body of the soft tissue simulants. These
moulds were based on the same CT data as the rigid inserts, with further STL editing to create useable moulds.
The digital 3D models of the tissues had to be adapted into negative versions of the geometries, with other added
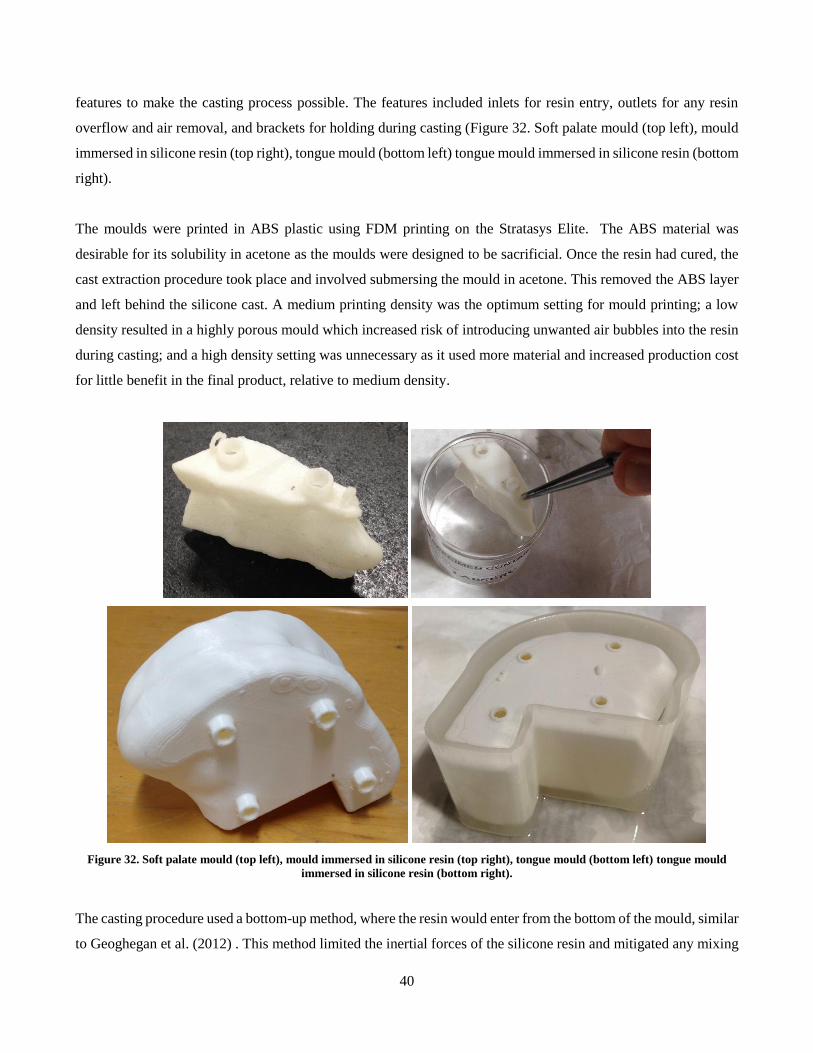
40
features to make the casting process possible. The features included inlets for resin entry, outlets for any resin
overflow and air removal, and brackets for holding during casting (Figure 32. Soft palate mould (top left), mould
immersed in silicone resin (top right), tongue mould (bottom left) tongue mould immersed in silicone resin (bottom
right).
The moulds were printed in ABS plastic using FDM printing on the Stratasys Elite. The ABS material was
desirable for its solubility in acetone as the moulds were designed to be sacrificial. Once the resin had cured, the
cast extraction procedure took place and involved submersing the mould in acetone. This removed the ABS layer
and left behind the silicone cast. A medium printing density was the optimum setting for mould printing; a low
density resulted in a highly porous mould which increased risk of introducing unwanted air bubbles into the resin
during casting; and a high density setting was unnecessary as it used more material and increased production cost
for little benefit in the final product, relative to medium density.
Figure 32. Soft palate mould (top left), mould immersed in silicone resin (top right), tongue mould (bottom left) tongue mould
immersed in silicone resin (bottom right).
The casting procedure used a bottom-up method, where the resin would enter from the bottom of the mould, similar
to Geoghegan et al. (2012) . This method limited the inertial forces of the silicone resin and mitigated any mixing
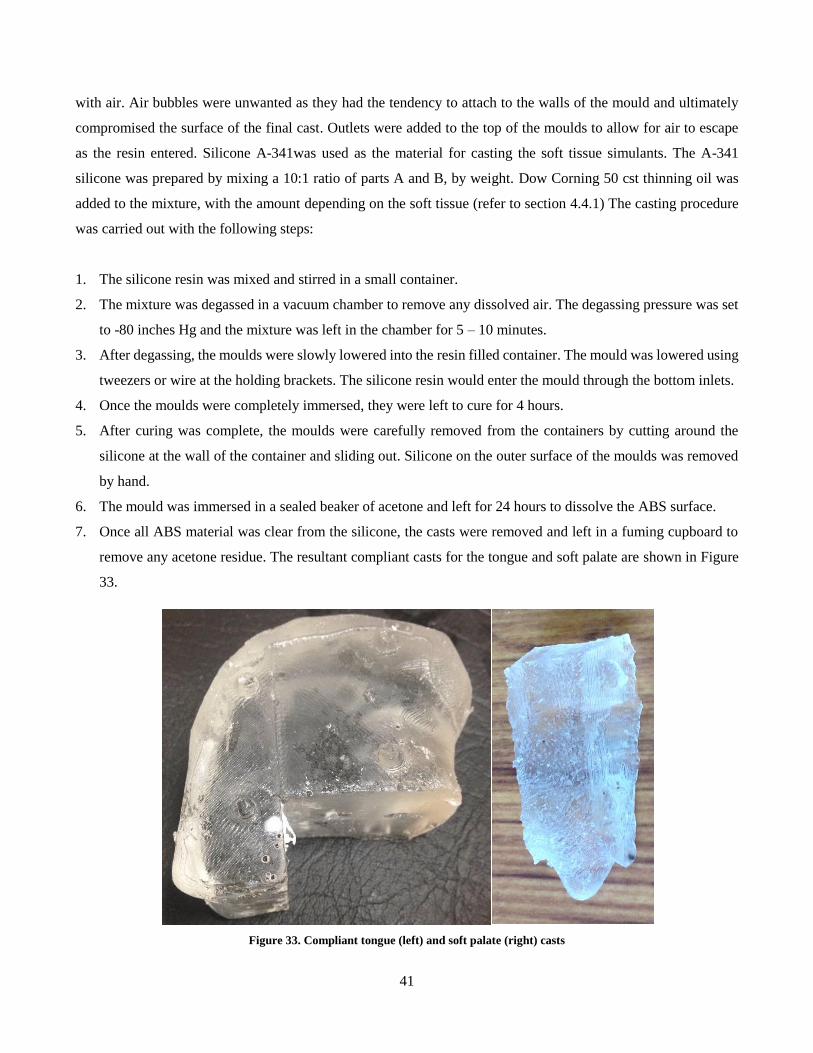
41
with air. Air bubbles were unwanted as they had the tendency to attach to the walls of the mould and ultimately
compromised the surface of the final cast. Outlets were added to the top of the moulds to allow for air to escape
as the resin entered. Silicone A-341was used as the material for casting the soft tissue simulants. The A-341
silicone was prepared by mixing a 10:1 ratio of parts A and B, by weight. Dow Corning 50 cst thinning oil was
added to the mixture, with the amount depending on the soft tissue (refer to section 4.4.1) The casting procedure
was carried out with the following steps:
1. The silicone resin was mixed and stirred in a small container.
2. The mixture was degassed in a vacuum chamber to remove any dissolved air. The degassing pressure was set
to -80 inches Hg and the mixture was left in the chamber for 5 – 10 minutes.
3. After degassing, the moulds were slowly lowered into the resin filled container. The mould was lowered using
tweezers or wire at the holding brackets. The silicone resin would enter the mould through the bottom inlets.
4. Once the moulds were completely immersed, they were left to cure for 4 hours.
5. After curing was complete, the moulds were carefully removed from the containers by cutting around the
silicone at the wall of the container and sliding out. Silicone on the outer surface of the moulds was removed
by hand.
6. The mould was immersed in a sealed beaker of acetone and left for 24 hours to dissolve the ABS surface.
7. Once all ABS material was clear from the silicone, the casts were removed and left in a fuming cupboard to
remove any acetone residue. The resultant compliant casts for the tongue and soft palate are shown in Figure
33.
Figure 33. Compliant tongue (left) and soft palate (right) casts
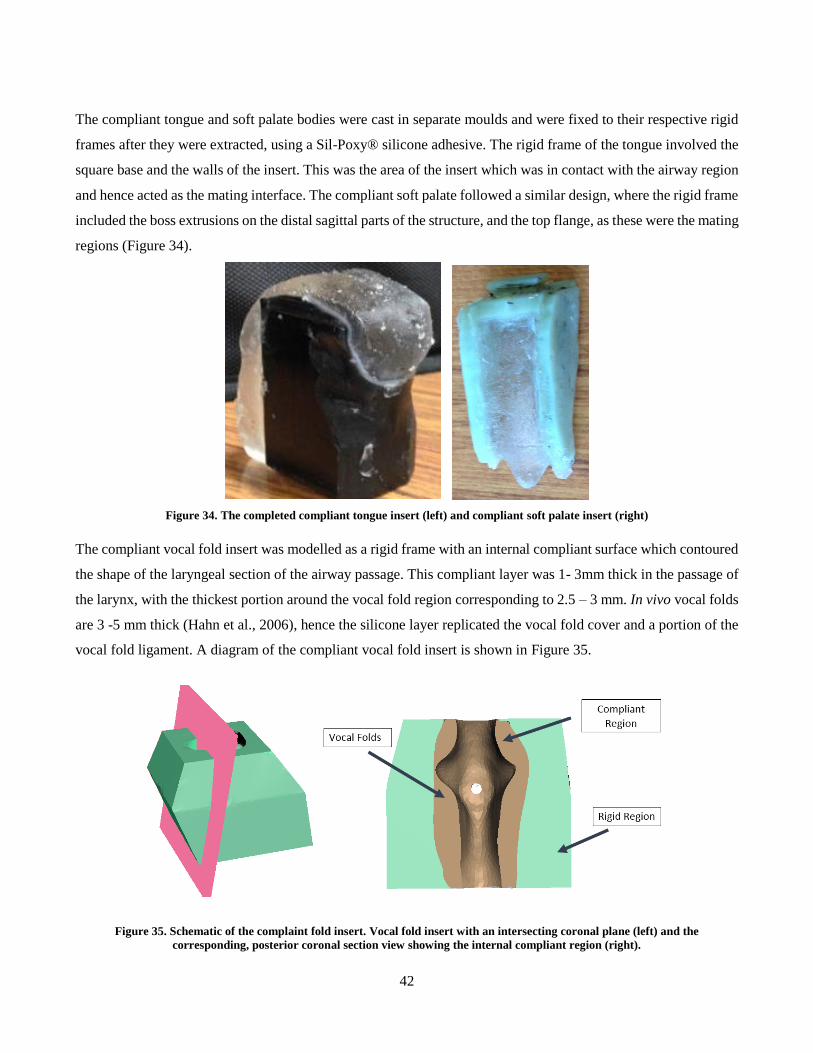
42
The compliant tongue and soft palate bodies were cast in separate moulds and were fixed to their respective rigid
frames after they were extracted, using a Sil-Poxy® silicone adhesive. The rigid frame of the tongue involved the
square base and the walls of the insert. This was the area of the insert which was in contact with the airway region
and hence acted as the mating interface. The compliant soft palate followed a similar design, where the rigid frame
included the boss extrusions on the distal sagittal parts of the structure, and the top flange, as these were the mating
regions (Figure 34).
Figure 34. The completed compliant tongue insert (left) and compliant soft palate insert (right)
The compliant vocal fold insert was modelled as a rigid frame with an internal compliant surface which contoured
the shape of the laryngeal section of the airway passage. This compliant layer was 1- 3mm thick in the passage of
the larynx, with the thickest portion around the vocal fold region corresponding to 2.5 – 3 mm. In vivo vocal folds
are 3 -5 mm thick (Hahn et al., 2006), hence the silicone layer replicated the vocal fold cover and a portion of the
vocal fold ligament. A diagram of the compliant vocal fold insert is shown in Figure 35.
Figure 35. Schematic of the complaint fold insert. Vocal fold insert with an intersecting coronal plane (left) and the
corresponding, posterior coronal section view showing the internal compliant region (right).
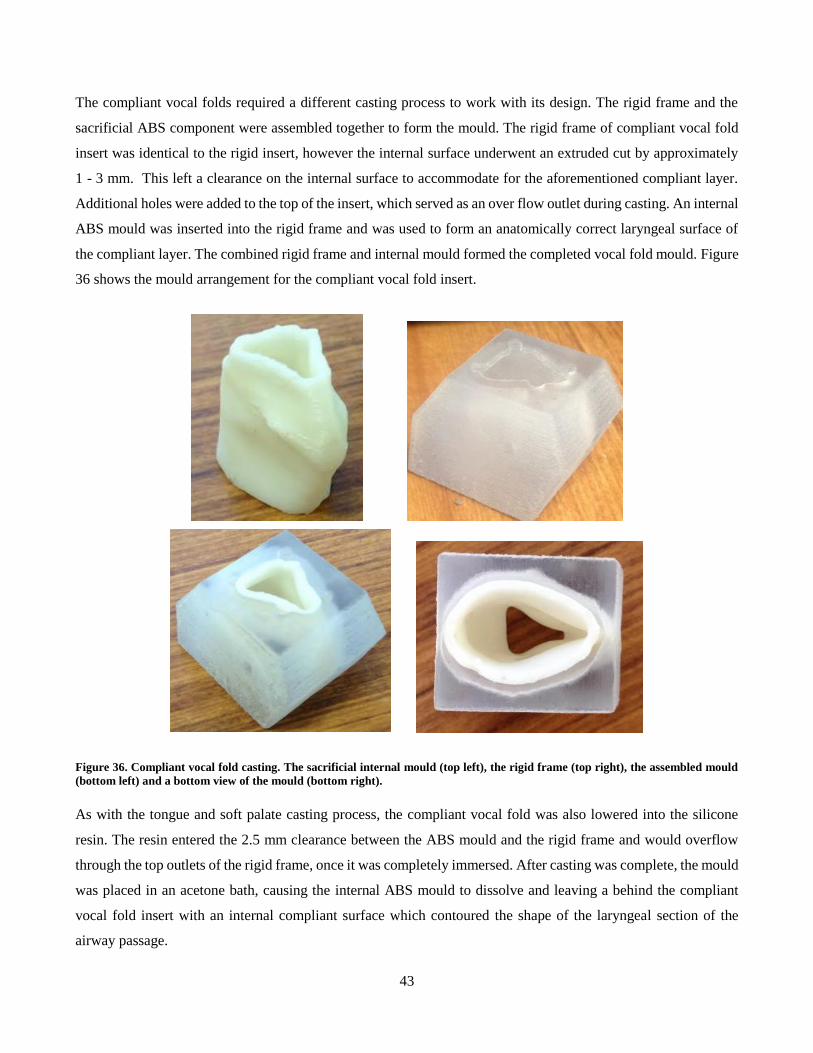
43
The compliant vocal folds required a different casting process to work with its design. The rigid frame and the
sacrificial ABS component were assembled together to form the mould. The rigid frame of compliant vocal fold
insert was identical to the rigid insert, however the internal surface underwent an extruded cut by approximately
1 - 3 mm. This left a clearance on the internal surface to accommodate for the aforementioned compliant layer.
Additional holes were added to the top of the insert, which served as an over flow outlet during casting. An internal
ABS mould was inserted into the rigid frame and was used to form an anatomically correct laryngeal surface of
the compliant layer. The combined rigid frame and internal mould formed the completed vocal fold mould. Figure
36 shows the mould arrangement for the compliant vocal fold insert.
Figure 36. Compliant vocal fold casting. The sacrificial internal mould (top left), the rigid frame (top right), the assembled mould
(bottom left) and a bottom view of the mould (bottom right).
As with the tongue and soft palate casting process, the compliant vocal fold was also lowered into the silicone
resin. The resin entered the 2.5 mm clearance between the ABS mould and the rigid frame and would overflow
through the top outlets of the rigid frame, once it was completely immersed. After casting was complete, the mould
was placed in an acetone bath, causing the internal ABS mould to dissolve and leaving a behind the compliant
vocal fold insert with an internal compliant surface which contoured the shape of the laryngeal section of the
airway passage.
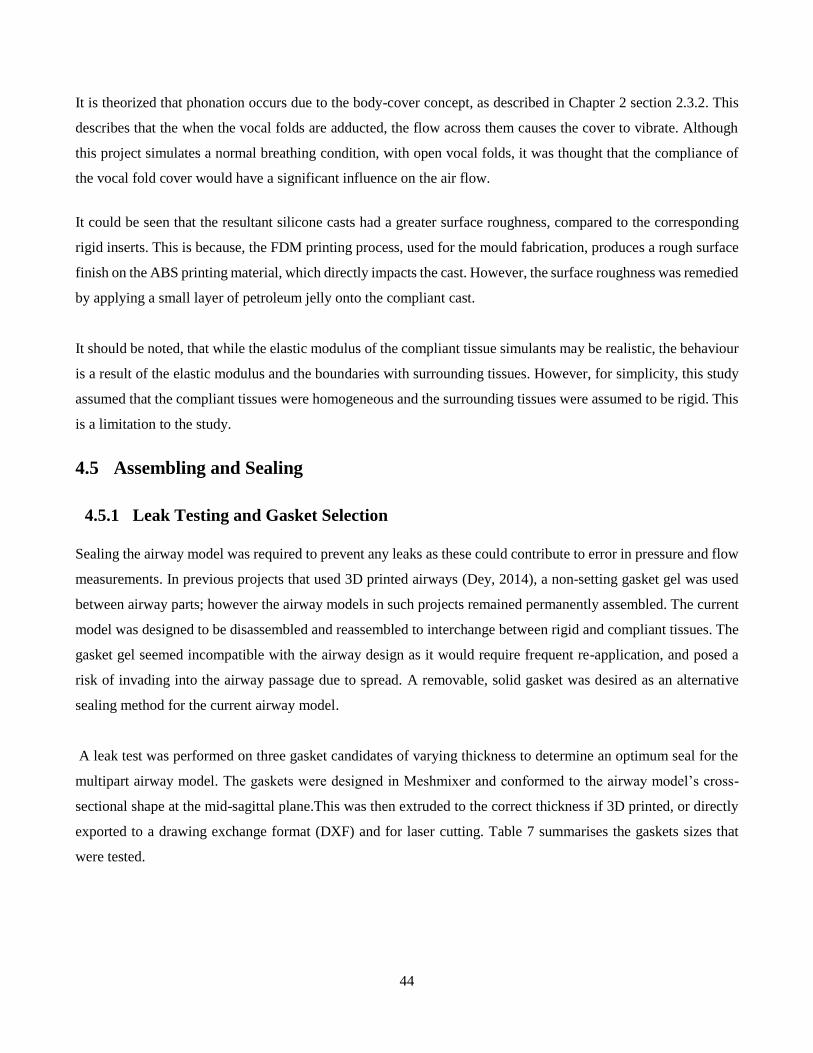
44
It is theorized that phonation occurs due to the body-cover concept, as described in Chapter 2 section 2.3.2. This
describes that the when the vocal folds are adducted, the flow across them causes the cover to vibrate. Although
this project simulates a normal breathing condition, with open vocal folds, it was thought that the compliance of
the vocal fold cover would have a significant influence on the air flow.
It could be seen that the resultant silicone casts had a greater surface roughness, compared to the corresponding
rigid inserts. This is because, the FDM printing process, used for the mould fabrication, produces a rough surface
finish on the ABS printing material, which directly impacts the cast. However, the surface roughness was remedied
by applying a small layer of petroleum jelly onto the compliant cast.
It should be noted, that while the elastic modulus of the compliant tissue simulants may be realistic, the behaviour
is a result of the elastic modulus and the boundaries with surrounding tissues. However, for simplicity, this study
assumed that the compliant tissues were homogeneous and the surrounding tissues were assumed to be rigid. This
is a limitation to the study.
4.5 Assembling and Sealing
4.5.1 Leak Testing and Gasket Selection
Sealing the airway model was required to prevent any leaks as these could contribute to error in pressure and flow
measurements. In previous projects that used 3D printed airways (Dey, 2014), a non-setting gasket gel was used
between airway parts; however the airway models in such projects remained permanently assembled. The current
model was designed to be disassembled and reassembled to interchange between rigid and compliant tissues. The
gasket gel seemed incompatible with the airway design as it would require frequent re-application, and posed a
risk of invading into the airway passage due to spread. A removable, solid gasket was desired as an alternative
sealing method for the current airway model.
A leak test was performed on three gasket candidates of varying thickness to determine an optimum seal for the
multipart airway model. The gaskets were designed in Meshmixer and conformed to the airway model’s cross-
sectional shape at the mid-sagittal plane.This was then extruded to the correct thickness if 3D printed, or directly
exported to a drawing exchange format (DXF) and for laser cutting. Table 7 summarises the gaskets sizes that
were tested.
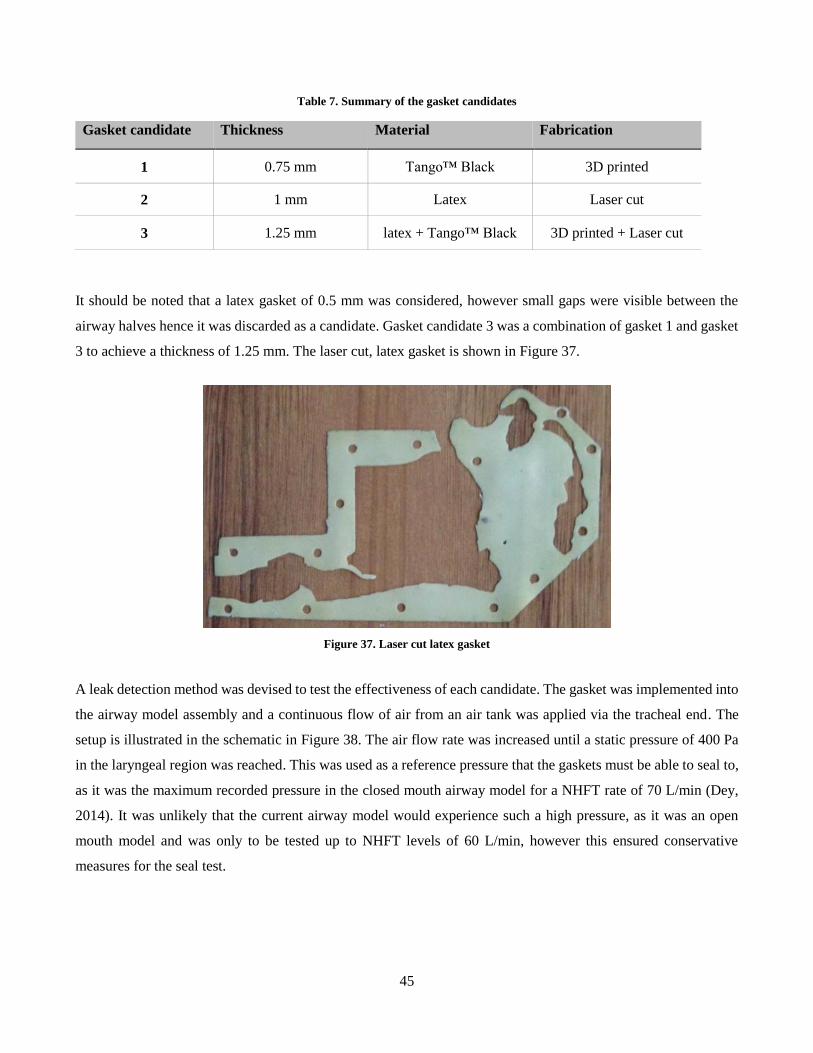
45
Table 7. Summary of the gasket candidates
Gasket candidate Thickness Material Fabrication
1 0.75 mm Tango™ Black 3D printed
2 1 mm Latex Laser cut
3 1.25 mm latex + Tango™ Black 3D printed + Laser cut
It should be noted that a latex gasket of 0.5 mm was considered, however small gaps were visible between the
airway halves hence it was discarded as a candidate. Gasket candidate 3 was a combination of gasket 1 and gasket
3 to achieve a thickness of 1.25 mm. The laser cut, latex gasket is shown in Figure 37.
Figure 37. Laser cut latex gasket
A leak detection method was devised to test the effectiveness of each candidate. The gasket was implemented into
the airway model assembly and a continuous flow of air from an air tank was applied via the tracheal end. The
setup is illustrated in the schematic in Figure 38. The air flow rate was increased until a static pressure of 400 Pa
in the laryngeal region was reached. This was used as a reference pressure that the gaskets must be able to seal to,
as it was the maximum recorded pressure in the closed mouth airway model for a NHFT rate of 70 L/min (Dey,
2014). It was unlikely that the current airway model would experience such a high pressure, as it was an open
mouth model and was only to be tested up to NHFT levels of 60 L/min, however this ensured conservative
measures for the seal test.
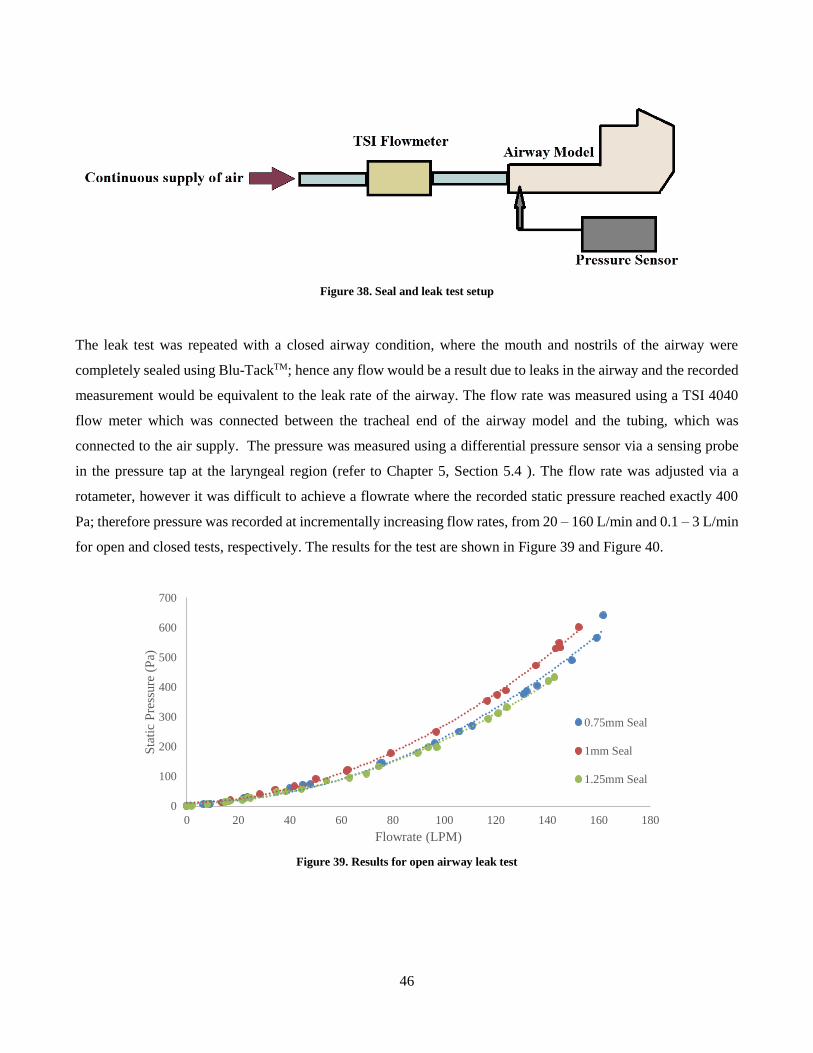
46
Figure 38. Seal and leak test setup
The leak test was repeated with a closed airway condition, where the mouth and nostrils of the airway were
completely sealed using Blu-TackTM; hence any flow would be a result due to leaks in the airway and the recorded
measurement would be equivalent to the leak rate of the airway. The flow rate was measured using a TSI 4040
flow meter which was connected between the tracheal end of the airway model and the tubing, which was
connected to the air supply. The pressure was measured using a differential pressure sensor via a sensing probe
in the pressure tap at the laryngeal region (refer to Chapter 5, Section 5.4 ). The flow rate was adjusted via a
rotameter, however it was difficult to achieve a flowrate where the recorded static pressure reached exactly 400
Pa; therefore pressure was recorded at incrementally increasing flow rates, from 20 – 160 L/min and 0.1 – 3 L/min
for open and closed tests, respectively. The results for the test are shown in Figure 39 and Figure 40.
Figure 39. Results for open airway leak test
0
100
200
300
400
500
600
700
0 20 40 60 80 100 120 140 160 180
Sta
tic
Pre
ssure
(P
a)
Flowrate (LPM)
0.75mm Seal
1mm Seal
1.25mm Seal
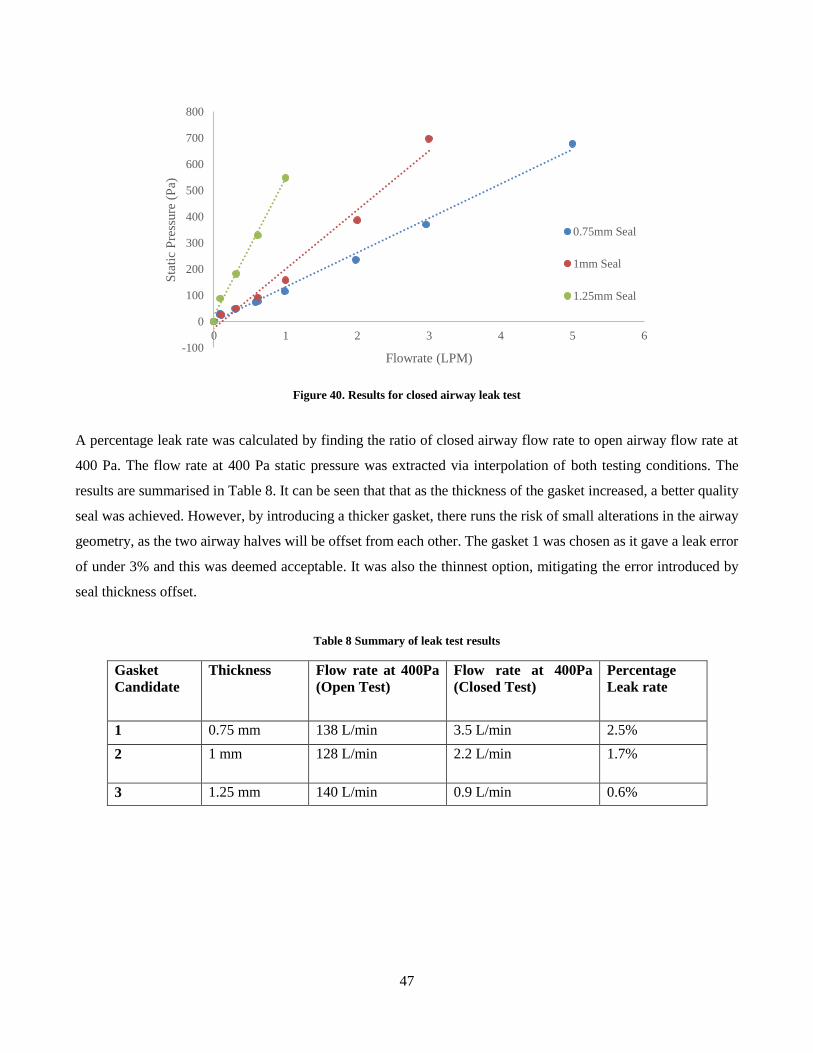
47
Figure 40. Results for closed airway leak test
A percentage leak rate was calculated by finding the ratio of closed airway flow rate to open airway flow rate at
400 Pa. The flow rate at 400 Pa static pressure was extracted via interpolation of both testing conditions. The
results are summarised in Table 8. It can be seen that that as the thickness of the gasket increased, a better quality
seal was achieved. However, by introducing a thicker gasket, there runs the risk of small alterations in the airway
geometry, as the two airway halves will be offset from each other. The gasket 1 was chosen as it gave a leak error
of under 3% and this was deemed acceptable. It was also the thinnest option, mitigating the error introduced by
seal thickness offset.
Table 8 Summary of leak test results
Gasket
Candidate
Thickness Flow rate at 400Pa
(Open Test)
Flow rate at 400Pa
(Closed Test)
Percentage
Leak rate
1 0.75 mm 138 L/min 3.5 L/min 2.5%
2 1 mm 128 L/min 2.2 L/min 1.7%
3 1.25 mm 140 L/min 0.9 L/min 0.6%
-100
0
100
200
300
400
500
600
700
800
0 1 2 3 4 5 6
Sta
tic
Pre
ssure
(P
a)
Flowrate (LPM)
0.75mm Seal
1mm Seal
1.25mm Seal
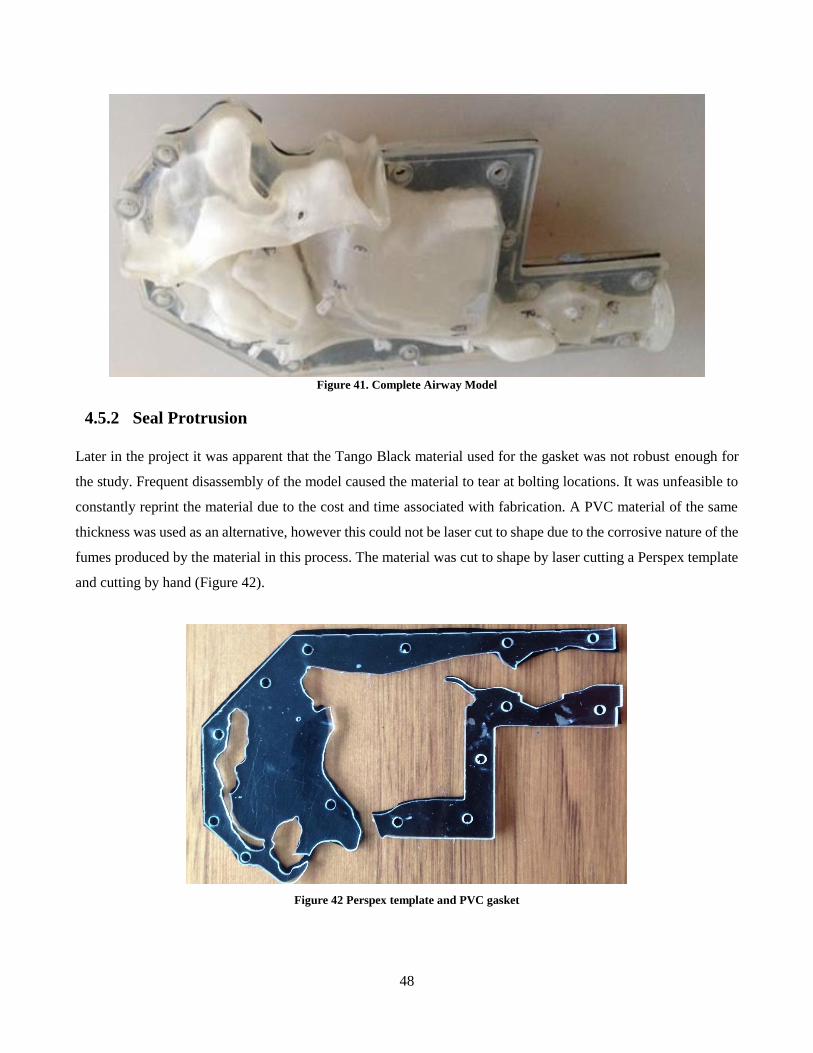
48
Figure 41. Complete Airway Model
4.5.2 Seal Protrusion
Later in the project it was apparent that the Tango Black material used for the gasket was not robust enough for
the study. Frequent disassembly of the model caused the material to tear at bolting locations. It was unfeasible to
constantly reprint the material due to the cost and time associated with fabrication. A PVC material of the same
thickness was used as an alternative, however this could not be laser cut to shape due to the corrosive nature of the
fumes produced by the material in this process. The material was cut to shape by laser cutting a Perspex template
and cutting by hand (Figure 42).
Figure 42 Perspex template and PVC gasket
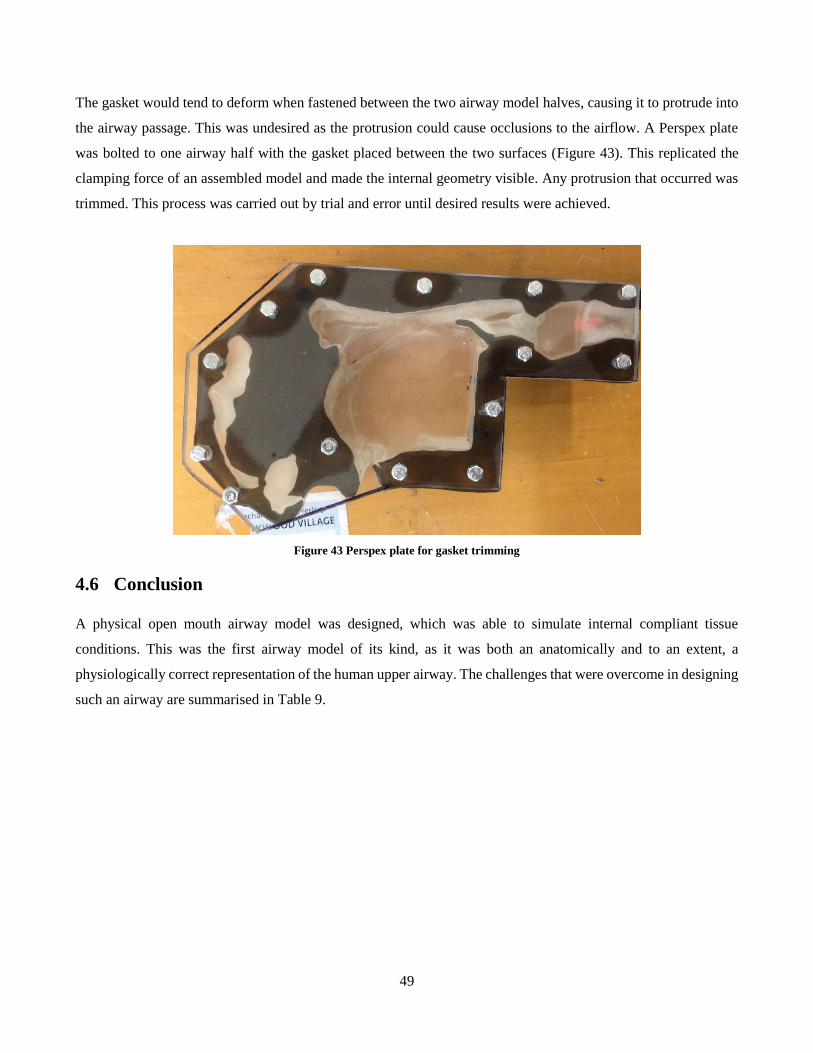
49
The gasket would tend to deform when fastened between the two airway model halves, causing it to protrude into
the airway passage. This was undesired as the protrusion could cause occlusions to the airflow. A Perspex plate
was bolted to one airway half with the gasket placed between the two surfaces (Figure 43). This replicated the
clamping force of an assembled model and made the internal geometry visible. Any protrusion that occurred was
trimmed. This process was carried out by trial and error until desired results were achieved.
Figure 43 Perspex plate for gasket trimming
4.6 Conclusion
A physical open mouth airway model was designed, which was able to simulate internal compliant tissue
conditions. This was the first airway model of its kind, as it was both an anatomically and to an extent, a
physiologically correct representation of the human upper airway. The challenges that were overcome in designing
such an airway are summarised in Table 9.
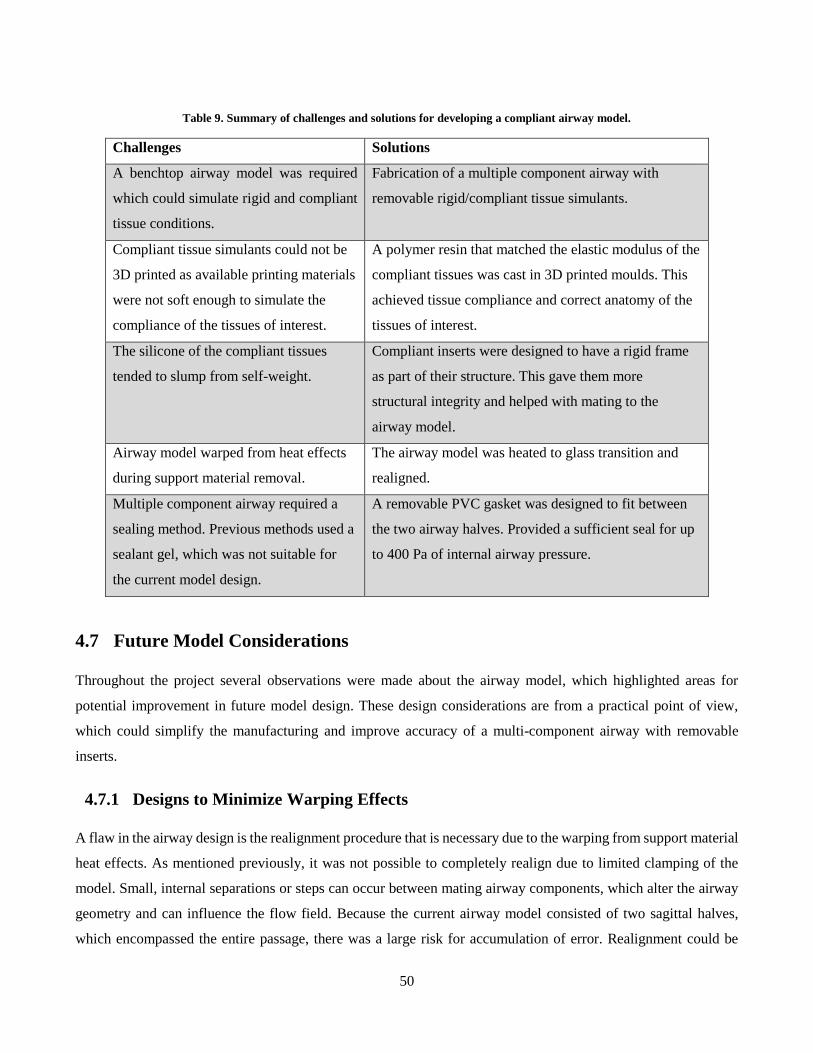
50
Table 9. Summary of challenges and solutions for developing a compliant airway model.
Challenges Solutions
A benchtop airway model was required
which could simulate rigid and compliant
tissue conditions.
Fabrication of a multiple component airway with
removable rigid/compliant tissue simulants.
Compliant tissue simulants could not be
3D printed as available printing materials
were not soft enough to simulate the
compliance of the tissues of interest.
A polymer resin that matched the elastic modulus of the
compliant tissues was cast in 3D printed moulds. This
achieved tissue compliance and correct anatomy of the
tissues of interest.
The silicone of the compliant tissues
tended to slump from self-weight.
Compliant inserts were designed to have a rigid frame
as part of their structure. This gave them more
structural integrity and helped with mating to the
airway model.
Airway model warped from heat effects
during support material removal.
The airway model was heated to glass transition and
realigned.
Multiple component airway required a
sealing method. Previous methods used a
sealant gel, which was not suitable for
the current model design.
A removable PVC gasket was designed to fit between
the two airway halves. Provided a sufficient seal for up
to 400 Pa of internal airway pressure.
4.7 Future Model Considerations
Throughout the project several observations were made about the airway model, which highlighted areas for
potential improvement in future model design. These design considerations are from a practical point of view,
which could simplify the manufacturing and improve accuracy of a multi-component airway with removable
inserts.
4.7.1 Designs to Minimize Warping Effects
A flaw in the airway design is the realignment procedure that is necessary due to the warping from support material
heat effects. As mentioned previously, it was not possible to completely realign due to limited clamping of the
model. Small, internal separations or steps can occur between mating airway components, which alter the airway
geometry and can influence the flow field. Because the current airway model consisted of two sagittal halves,
which encompassed the entire passage, there was a large risk for accumulation of error. Realignment could be
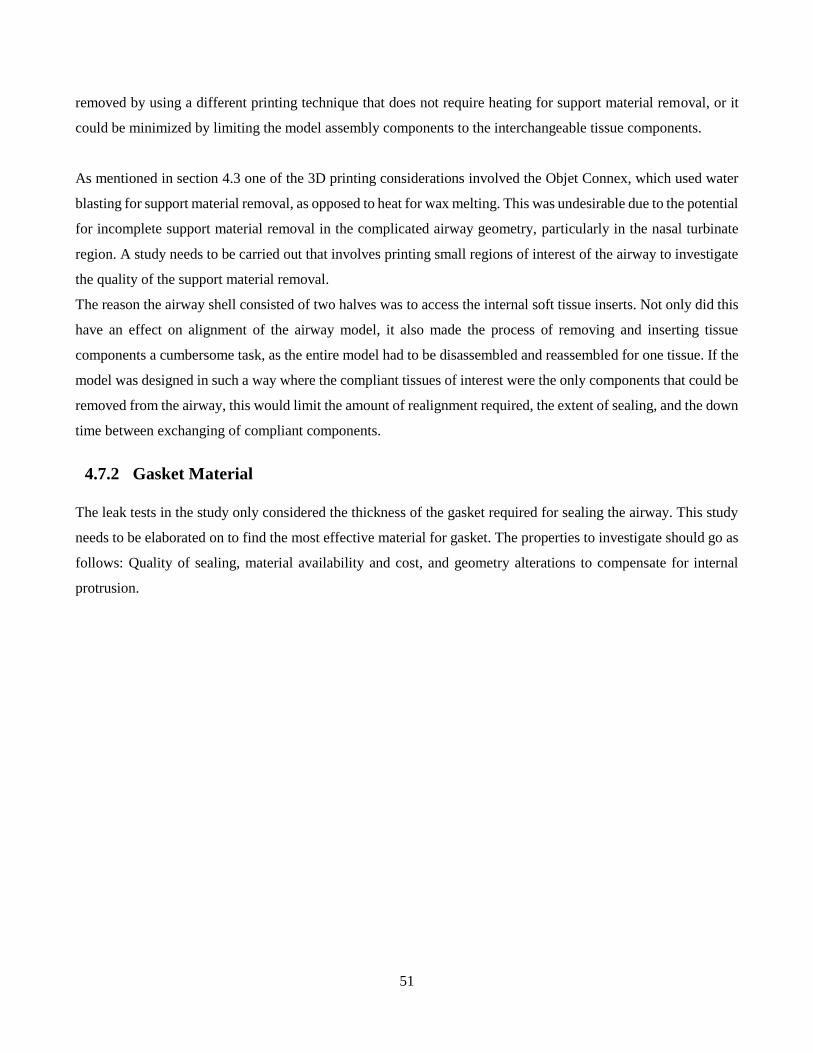
51
removed by using a different printing technique that does not require heating for support material removal, or it
could be minimized by limiting the model assembly components to the interchangeable tissue components.
As mentioned in section 4.3 one of the 3D printing considerations involved the Objet Connex, which used water
blasting for support material removal, as opposed to heat for wax melting. This was undesirable due to the potential
for incomplete support material removal in the complicated airway geometry, particularly in the nasal turbinate
region. A study needs to be carried out that involves printing small regions of interest of the airway to investigate
the quality of the support material removal.
The reason the airway shell consisted of two halves was to access the internal soft tissue inserts. Not only did this
have an effect on alignment of the airway model, it also made the process of removing and inserting tissue
components a cumbersome task, as the entire model had to be disassembled and reassembled for one tissue. If the
model was designed in such a way where the compliant tissues of interest were the only components that could be
removed from the airway, this would limit the amount of realignment required, the extent of sealing, and the down
time between exchanging of compliant components.
4.7.2 Gasket Material
The leak tests in the study only considered the thickness of the gasket required for sealing the airway. This study
needs to be elaborated on to find the most effective material for gasket. The properties to investigate should go as
follows: Quality of sealing, material availability and cost, and geometry alterations to compensate for internal
protrusion.
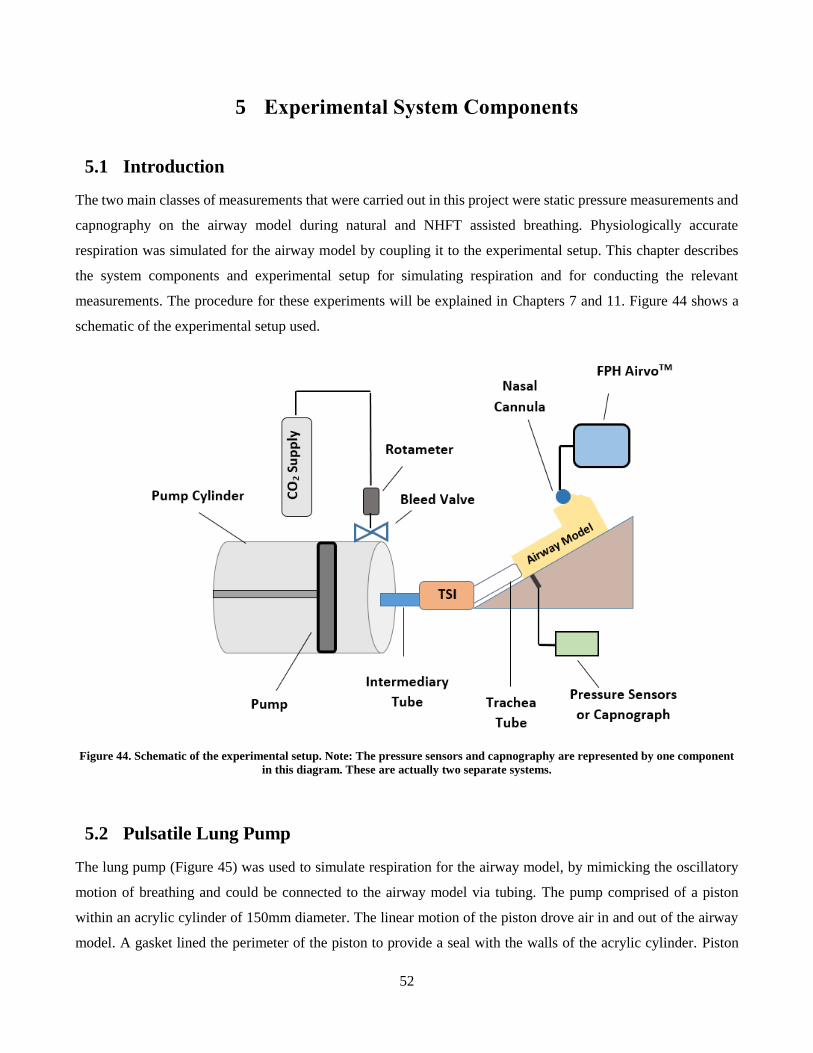
52
5 Experimental System Components
5.1 Introduction
The two main classes of measurements that were carried out in this project were static pressure measurements and
capnography on the airway model during natural and NHFT assisted breathing. Physiologically accurate
respiration was simulated for the airway model by coupling it to the experimental setup. This chapter describes
the system components and experimental setup for simulating respiration and for conducting the relevant
measurements. The procedure for these experiments will be explained in Chapters 7 and 11. Figure 44 shows a
schematic of the experimental setup used.
Figure 44. Schematic of the experimental setup. Note: The pressure sensors and capnography are represented by one component
in this diagram. These are actually two separate systems.
5.2 Pulsatile Lung Pump
The lung pump (Figure 45) was used to simulate respiration for the airway model, by mimicking the oscillatory
motion of breathing and could be connected to the airway model via tubing. The pump comprised of a piston
within an acrylic cylinder of 150mm diameter. The linear motion of the piston drove air in and out of the airway
model. A gasket lined the perimeter of the piston to provide a seal with the walls of the acrylic cylinder. Piston
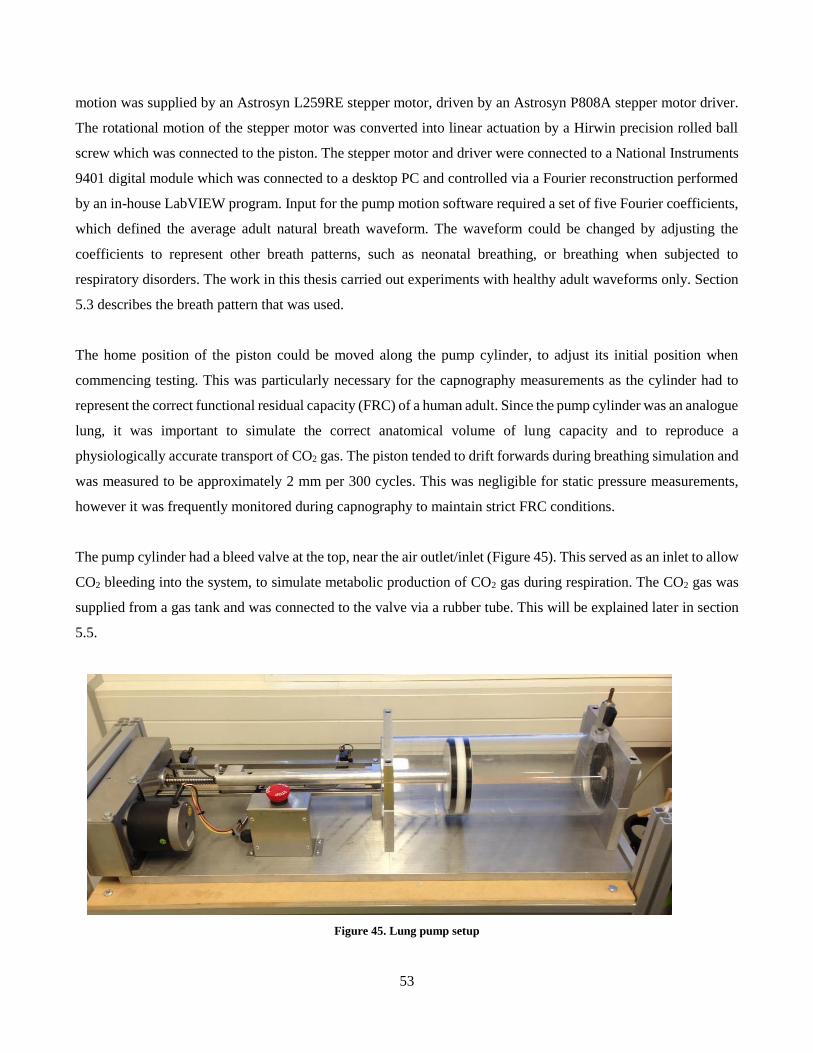
53
motion was supplied by an Astrosyn L259RE stepper motor, driven by an Astrosyn P808A stepper motor driver.
The rotational motion of the stepper motor was converted into linear actuation by a Hirwin precision rolled ball
screw which was connected to the piston. The stepper motor and driver were connected to a National Instruments
9401 digital module which was connected to a desktop PC and controlled via a Fourier reconstruction performed
by an in-house LabVIEW program. Input for the pump motion software required a set of five Fourier coefficients,
which defined the average adult natural breath waveform. The waveform could be changed by adjusting the
coefficients to represent other breath patterns, such as neonatal breathing, or breathing when subjected to
respiratory disorders. The work in this thesis carried out experiments with healthy adult waveforms only. Section
5.3 describes the breath pattern that was used.
The home position of the piston could be moved along the pump cylinder, to adjust its initial position when
commencing testing. This was particularly necessary for the capnography measurements as the cylinder had to
represent the correct functional residual capacity (FRC) of a human adult. Since the pump cylinder was an analogue
lung, it was important to simulate the correct anatomical volume of lung capacity and to reproduce a
physiologically accurate transport of CO2 gas. The piston tended to drift forwards during breathing simulation and
was measured to be approximately 2 mm per 300 cycles. This was negligible for static pressure measurements,
however it was frequently monitored during capnography to maintain strict FRC conditions.
The pump cylinder had a bleed valve at the top, near the air outlet/inlet (Figure 45). This served as an inlet to allow
CO2 bleeding into the system, to simulate metabolic production of CO2 gas during respiration. The CO2 gas was
supplied from a gas tank and was connected to the valve via a rubber tube. This will be explained later in section
5.5.
Figure 45. Lung pump setup
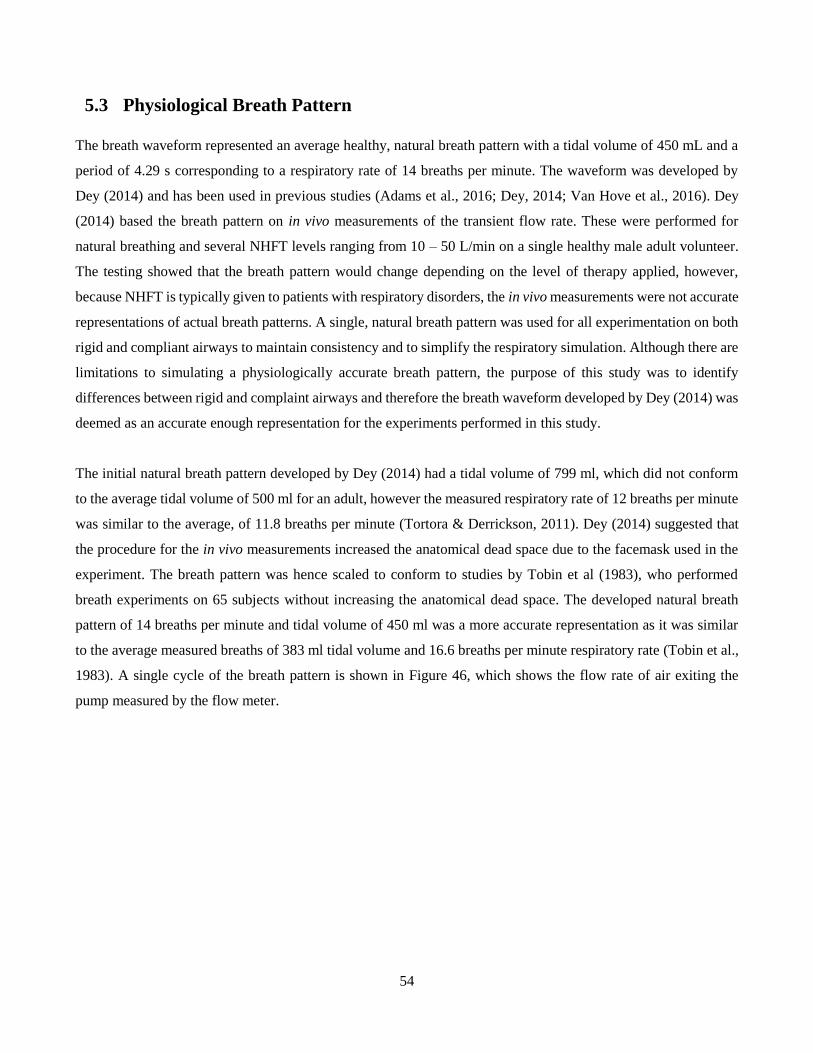
54
5.3 Physiological Breath Pattern
The breath waveform represented an average healthy, natural breath pattern with a tidal volume of 450 mL and a
period of 4.29 s corresponding to a respiratory rate of 14 breaths per minute. The waveform was developed by
Dey (2014) and has been used in previous studies (Adams et al., 2016; Dey, 2014; Van Hove et al., 2016). Dey
(2014) based the breath pattern on in vivo measurements of the transient flow rate. These were performed for
natural breathing and several NHFT levels ranging from 10 – 50 L/min on a single healthy male adult volunteer.
The testing showed that the breath pattern would change depending on the level of therapy applied, however,
because NHFT is typically given to patients with respiratory disorders, the in vivo measurements were not accurate
representations of actual breath patterns. A single, natural breath pattern was used for all experimentation on both
rigid and compliant airways to maintain consistency and to simplify the respiratory simulation. Although there are
limitations to simulating a physiologically accurate breath pattern, the purpose of this study was to identify
differences between rigid and complaint airways and therefore the breath waveform developed by Dey (2014) was
deemed as an accurate enough representation for the experiments performed in this study.
The initial natural breath pattern developed by Dey (2014) had a tidal volume of 799 ml, which did not conform
to the average tidal volume of 500 ml for an adult, however the measured respiratory rate of 12 breaths per minute
was similar to the average, of 11.8 breaths per minute (Tortora & Derrickson, 2011). Dey (2014) suggested that
the procedure for the in vivo measurements increased the anatomical dead space due to the facemask used in the
experiment. The breath pattern was hence scaled to conform to studies by Tobin et al (1983), who performed
breath experiments on 65 subjects without increasing the anatomical dead space. The developed natural breath
pattern of 14 breaths per minute and tidal volume of 450 ml was a more accurate representation as it was similar
to the average measured breaths of 383 ml tidal volume and 16.6 breaths per minute respiratory rate (Tobin et al.,
1983). A single cycle of the breath pattern is shown in Figure 46, which shows the flow rate of air exiting the
pump measured by the flow meter.
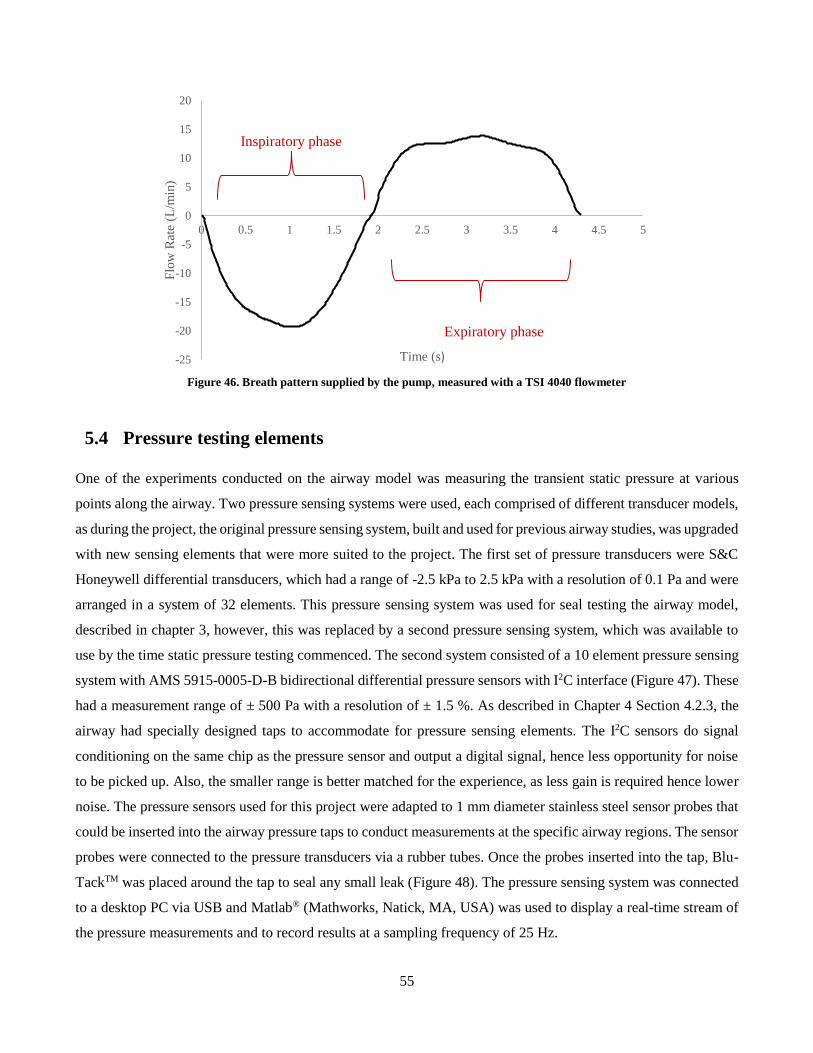
55
Figure 46. Breath pattern supplied by the pump, measured with a TSI 4040 flowmeter
5.4 Pressure testing elements
One of the experiments conducted on the airway model was measuring the transient static pressure at various
points along the airway. Two pressure sensing systems were used, each comprised of different transducer models,
as during the project, the original pressure sensing system, built and used for previous airway studies, was upgraded
with new sensing elements that were more suited to the project. The first set of pressure transducers were S&C
Honeywell differential transducers, which had a range of -2.5 kPa to 2.5 kPa with a resolution of 0.1 Pa and were
arranged in a system of 32 elements. This pressure sensing system was used for seal testing the airway model,
described in chapter 3, however, this was replaced by a second pressure sensing system, which was available to
use by the time static pressure testing commenced. The second system consisted of a 10 element pressure sensing
system with AMS 5915-0005-D-B bidirectional differential pressure sensors with I2C interface (Figure 47). These
had a measurement range of ± 500 Pa with a resolution of ± 1.5 %. As described in Chapter 4 Section 4.2.3, the
airway had specially designed taps to accommodate for pressure sensing elements. The I2C sensors do signal
conditioning on the same chip as the pressure sensor and output a digital signal, hence less opportunity for noise
to be picked up. Also, the smaller range is better matched for the experience, as less gain is required hence lower
noise. The pressure sensors used for this project were adapted to 1 mm diameter stainless steel sensor probes that
could be inserted into the airway pressure taps to conduct measurements at the specific airway regions. The sensor
probes were connected to the pressure transducers via a rubber tubes. Once the probes inserted into the tap, Blu-
TackTM was placed around the tap to seal any small leak (Figure 48). The pressure sensing system was connected
to a desktop PC via USB and Matlab® (Mathworks, Natick, MA, USA) was used to display a real-time stream of
the pressure measurements and to record results at a sampling frequency of 25 Hz.
-25
-20
-15
-10
-5
0
5
10
15
20
0 0.5 1 1.5 2 2.5 3 3.5 4 4.5 5
Flo
w R
ate
(L/m
in)
Time (s)
Inspiratory phase
Expiratory phase
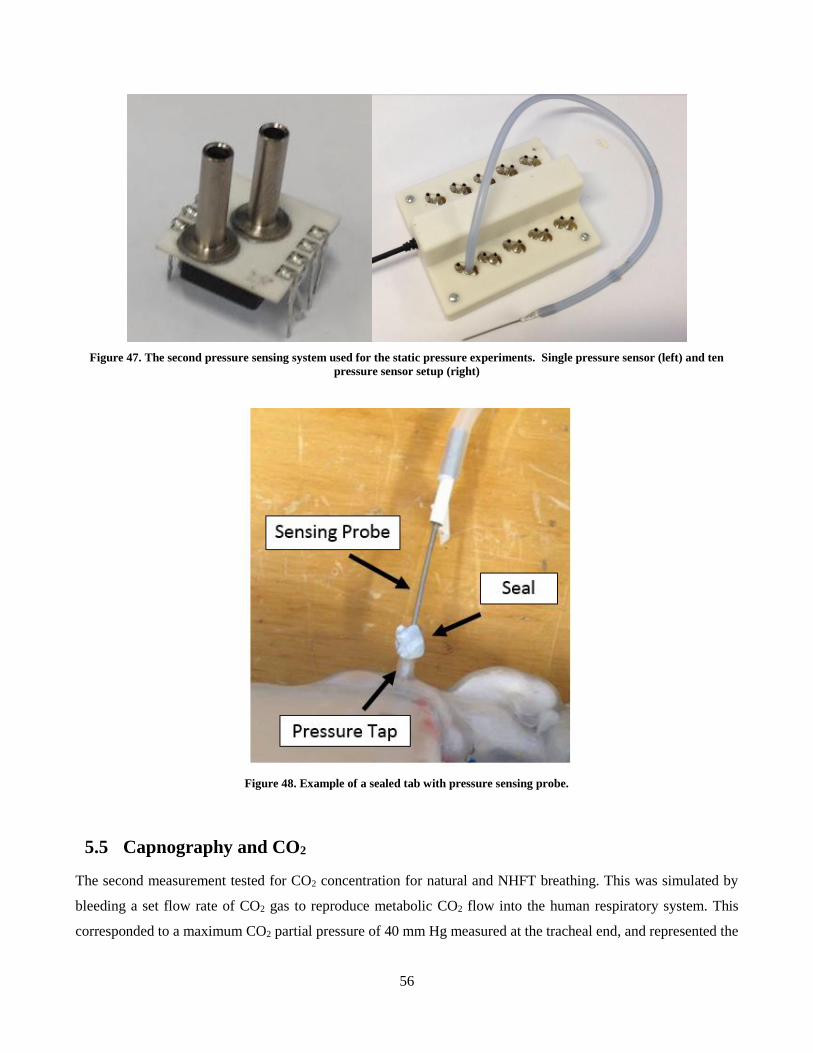
56
Figure 47. The second pressure sensing system used for the static pressure experiments. Single pressure sensor (left) and ten
pressure sensor setup (right)
Figure 48. Example of a sealed tab with pressure sensing probe.
5.5 Capnography and CO2
The second measurement tested for CO2 concentration for natural and NHFT breathing. This was simulated by
bleeding a set flow rate of CO2 gas to reproduce metabolic CO2 flow into the human respiratory system. This
corresponded to a maximum CO2 partial pressure of 40 mm Hg measured at the tracheal end, and represented the
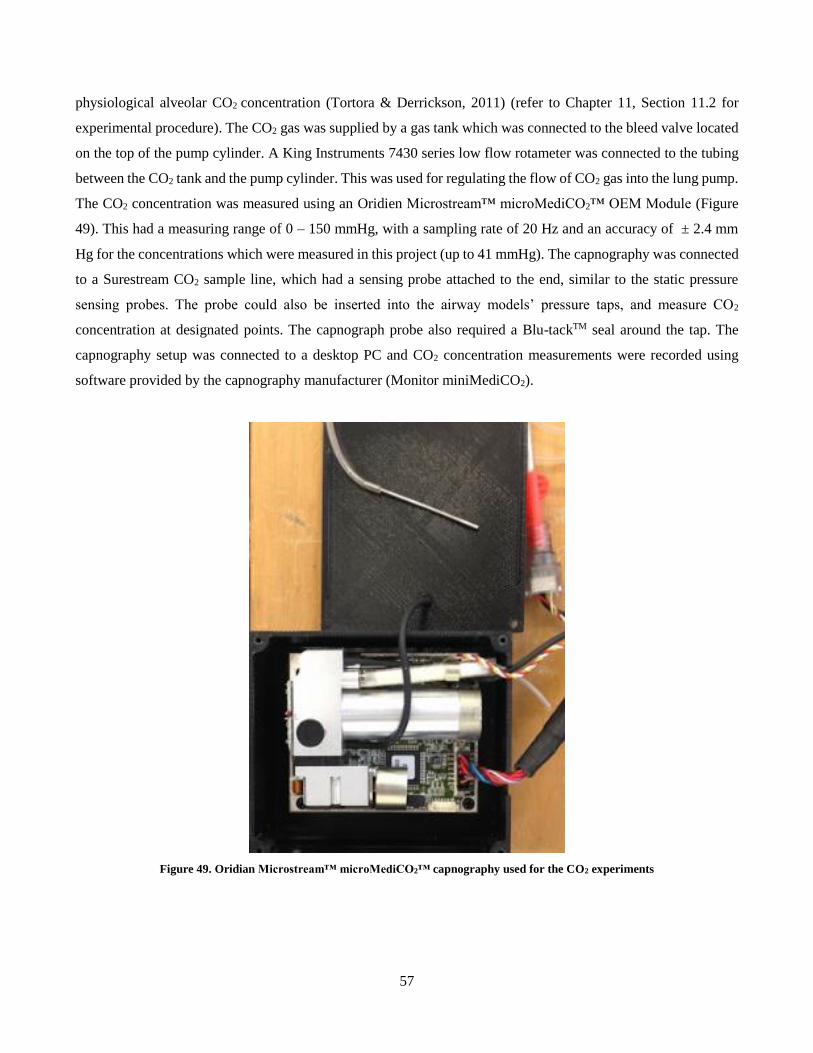
57
physiological alveolar CO2 concentration (Tortora & Derrickson, 2011) (refer to Chapter 11, Section 11.2 for
experimental procedure). The CO2 gas was supplied by a gas tank which was connected to the bleed valve located
on the top of the pump cylinder. A King Instruments 7430 series low flow rotameter was connected to the tubing
between the CO2 tank and the pump cylinder. This was used for regulating the flow of CO2 gas into the lung pump.
The CO2 concentration was measured using an Oridien Microstream™ microMediCO2™ OEM Module (Figure
49). This had a measuring range of 0 – 150 mmHg, with a sampling rate of 20 Hz and an accuracy of ± 2.4 mm
Hg for the concentrations which were measured in this project (up to 41 mmHg). The capnography was connected
to a Surestream CO2 sample line, which had a sensing probe attached to the end, similar to the static pressure
sensing probes. The probe could also be inserted into the airway models’ pressure taps, and measure CO2
concentration at designated points. The capnograph probe also required a Blu-tackTM seal around the tap. The
capnography setup was connected to a desktop PC and CO2 concentration measurements were recorded using
software provided by the capnography manufacturer (Monitor miniMediCO2).
Figure 49. Oridian Microstream™ microMediCO2™ capnography used for the CO2 experiments
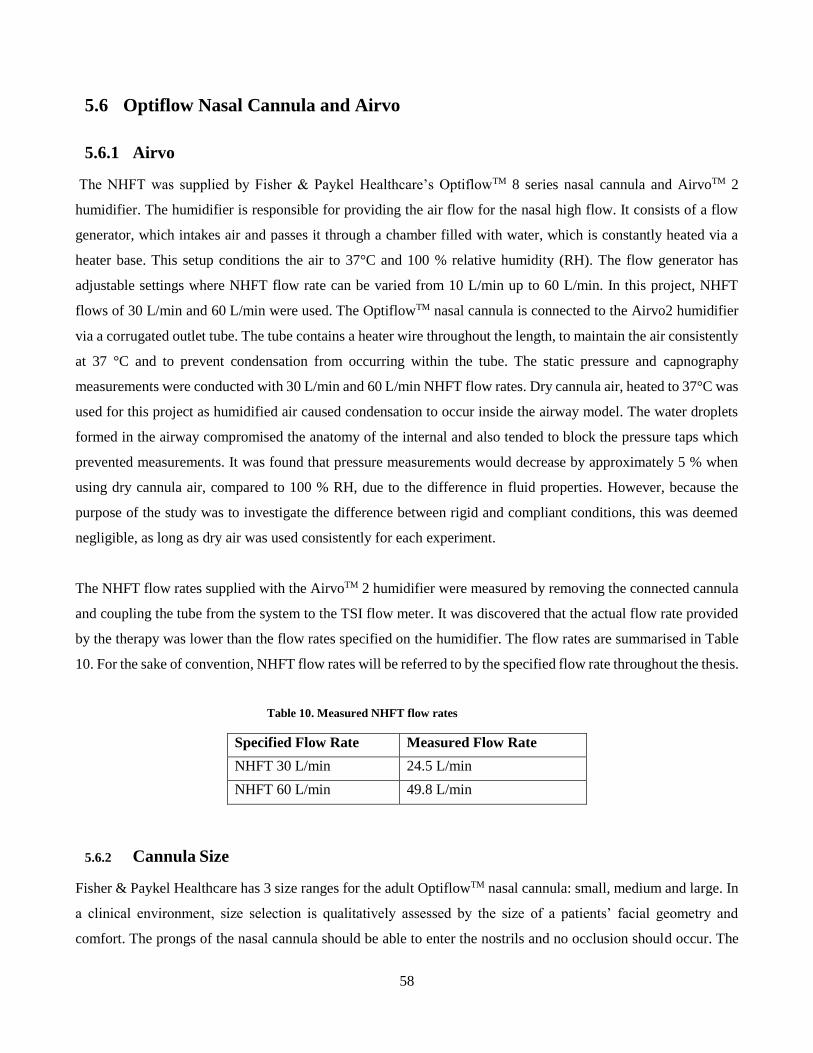
58
5.6 Optiflow Nasal Cannula and Airvo
5.6.1 Airvo
The NHFT was supplied by Fisher & Paykel Healthcare’s OptiflowTM 8 series nasal cannula and AirvoTM 2
humidifier. The humidifier is responsible for providing the air flow for the nasal high flow. It consists of a flow
generator, which intakes air and passes it through a chamber filled with water, which is constantly heated via a
heater base. This setup conditions the air to 37°C and 100 % relative humidity (RH). The flow generator has
adjustable settings where NHFT flow rate can be varied from 10 L/min up to 60 L/min. In this project, NHFT
flows of 30 L/min and 60 L/min were used. The OptiflowTM nasal cannula is connected to the Airvo2 humidifier
via a corrugated outlet tube. The tube contains a heater wire throughout the length, to maintain the air consistently
at 37 °C and to prevent condensation from occurring within the tube. The static pressure and capnography
measurements were conducted with 30 L/min and 60 L/min NHFT flow rates. Dry cannula air, heated to 37°C was
used for this project as humidified air caused condensation to occur inside the airway model. The water droplets
formed in the airway compromised the anatomy of the internal and also tended to block the pressure taps which
prevented measurements. It was found that pressure measurements would decrease by approximately 5 % when
using dry cannula air, compared to 100 % RH, due to the difference in fluid properties. However, because the
purpose of the study was to investigate the difference between rigid and compliant conditions, this was deemed
negligible, as long as dry air was used consistently for each experiment.
The NHFT flow rates supplied with the AirvoTM 2 humidifier were measured by removing the connected cannula
and coupling the tube from the system to the TSI flow meter. It was discovered that the actual flow rate provided
by the therapy was lower than the flow rates specified on the humidifier. The flow rates are summarised in Table
10. For the sake of convention, NHFT flow rates will be referred to by the specified flow rate throughout the thesis.
Table 10. Measured NHFT flow rates
Specified Flow Rate Measured Flow Rate
NHFT 30 L/min 24.5 L/min
NHFT 60 L/min 49.8 L/min
5.6.2 Cannula Size
Fisher & Paykel Healthcare has 3 size ranges for the adult OptiflowTM nasal cannula: small, medium and large. In
a clinical environment, size selection is qualitatively assessed by the size of a patients’ facial geometry and
comfort. The prongs of the nasal cannula should be able to enter the nostrils and no occlusion should occur. The
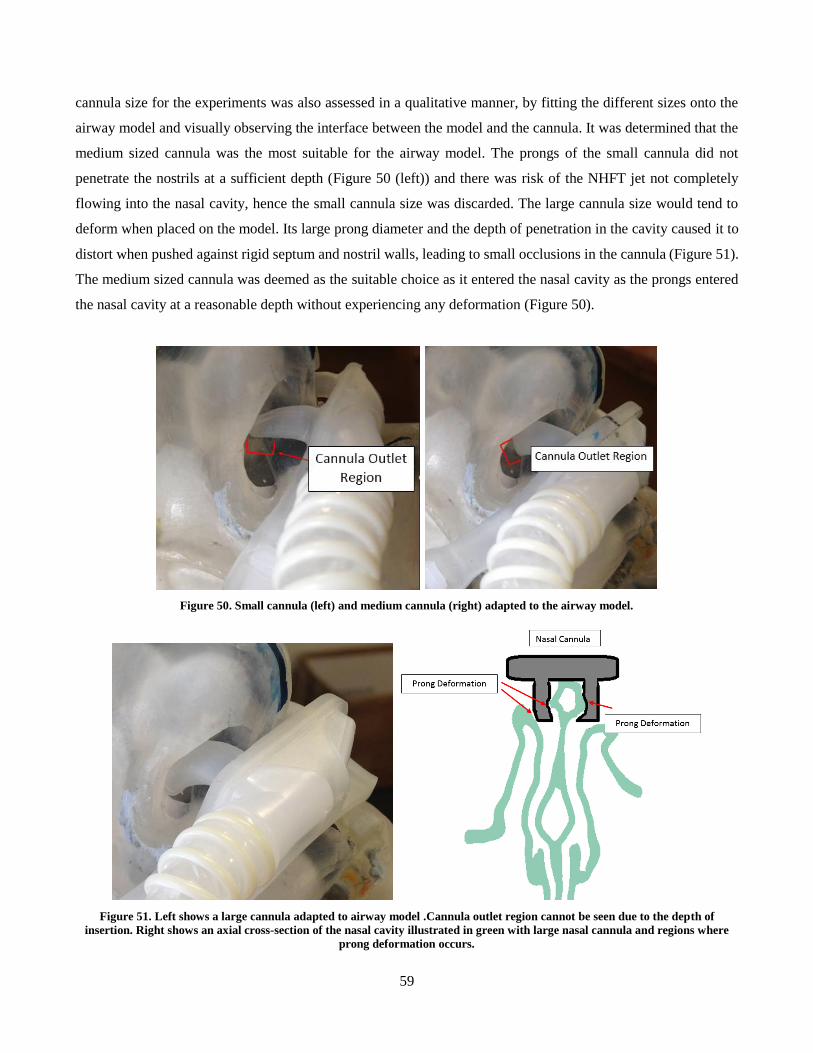
59
cannula size for the experiments was also assessed in a qualitative manner, by fitting the different sizes onto the
airway model and visually observing the interface between the model and the cannula. It was determined that the
medium sized cannula was the most suitable for the airway model. The prongs of the small cannula did not
penetrate the nostrils at a sufficient depth (Figure 50 (left)) and there was risk of the NHFT jet not completely
flowing into the nasal cavity, hence the small cannula size was discarded. The large cannula size would tend to
deform when placed on the model. Its large prong diameter and the depth of penetration in the cavity caused it to
distort when pushed against rigid septum and nostril walls, leading to small occlusions in the cannula (Figure 51).
The medium sized cannula was deemed as the suitable choice as it entered the nasal cavity as the prongs entered
the nasal cavity at a reasonable depth without experiencing any deformation (Figure 50).
Figure 50. Small cannula (left) and medium cannula (right) adapted to the airway model.
Figure 51. Left shows a large cannula adapted to airway model .Cannula outlet region cannot be seen due to the depth of
insertion. Right shows an axial cross-section of the nasal cavity illustrated in green with large nasal cannula and regions where
prong deformation occurs.
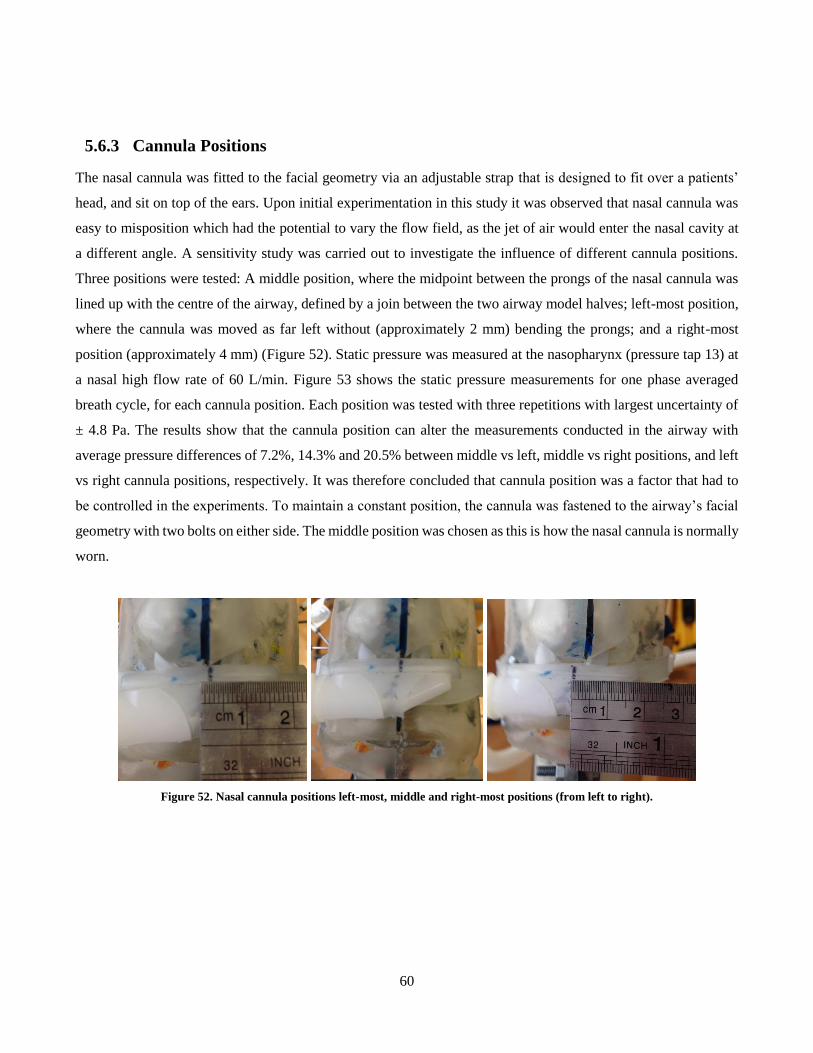
60
5.6.3 Cannula Positions
The nasal cannula was fitted to the facial geometry via an adjustable strap that is designed to fit over a patients’
head, and sit on top of the ears. Upon initial experimentation in this study it was observed that nasal cannula was
easy to misposition which had the potential to vary the flow field, as the jet of air would enter the nasal cavity at
a different angle. A sensitivity study was carried out to investigate the influence of different cannula positions.
Three positions were tested: A middle position, where the midpoint between the prongs of the nasal cannula was
lined up with the centre of the airway, defined by a join between the two airway model halves; left-most position,
where the cannula was moved as far left without (approximately 2 mm) bending the prongs; and a right-most
position (approximately 4 mm) (Figure 52). Static pressure was measured at the nasopharynx (pressure tap 13) at
a nasal high flow rate of 60 L/min. Figure 53 shows the static pressure measurements for one phase averaged
breath cycle, for each cannula position. Each position was tested with three repetitions with largest uncertainty of
± 4.8 Pa. The results show that the cannula position can alter the measurements conducted in the airway with
average pressure differences of 7.2%, 14.3% and 20.5% between middle vs left, middle vs right positions, and left
vs right cannula positions, respectively. It was therefore concluded that cannula position was a factor that had to
be controlled in the experiments. To maintain a constant position, the cannula was fastened to the airway’s facial
geometry with two bolts on either side. The middle position was chosen as this is how the nasal cannula is normally
worn.
Figure 52. Nasal cannula positions left-most, middle and right-most positions (from left to right).
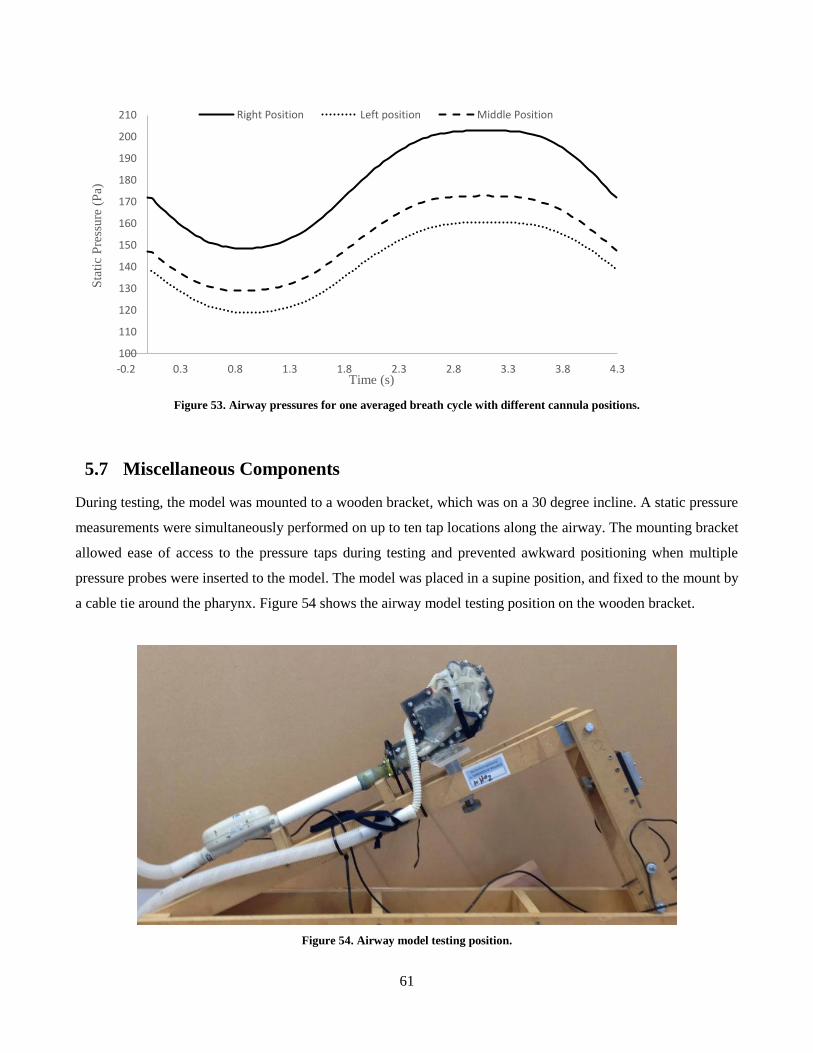
61
Figure 53. Airway pressures for one averaged breath cycle with different cannula positions.
5.7 Miscellaneous Components
During testing, the model was mounted to a wooden bracket, which was on a 30 degree incline. A static pressure
measurements were simultaneously performed on up to ten tap locations along the airway. The mounting bracket
allowed ease of access to the pressure taps during testing and prevented awkward positioning when multiple
pressure probes were inserted to the model. The model was placed in a supine position, and fixed to the mount by
a cable tie around the pharynx. Figure 54 shows the airway model testing position on the wooden bracket.
Figure 54. Airway model testing position.
100
110
120
130
140
150
160
170
180
190
200
210
-0.2 0.3 0.8 1.3 1.8 2.3 2.8 3.3 3.8 4.3
Sta
tic
Pre
ssure
(P
a)
Time (s)
Right Position Left position Middle Position
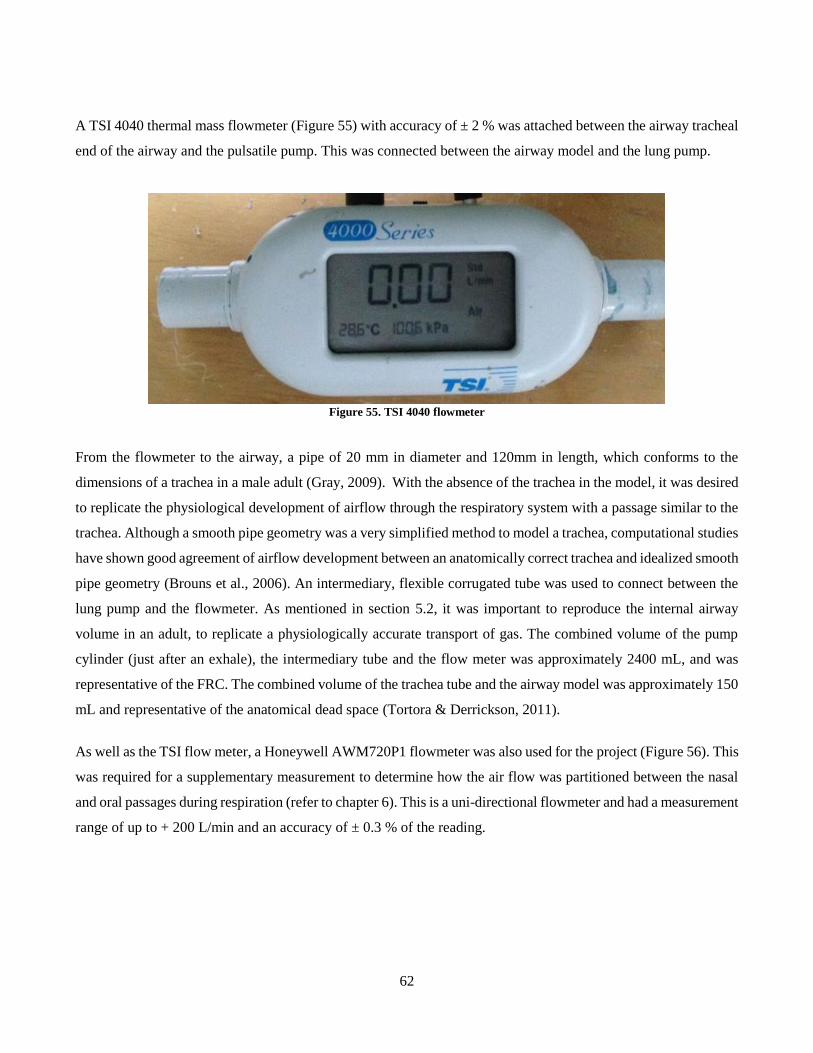
62
A TSI 4040 thermal mass flowmeter (Figure 55) with accuracy of ± 2 % was attached between the airway tracheal
end of the airway and the pulsatile pump. This was connected between the airway model and the lung pump.
Figure 55. TSI 4040 flowmeter
From the flowmeter to the airway, a pipe of 20 mm in diameter and 120mm in length, which conforms to the
dimensions of a trachea in a male adult (Gray, 2009). With the absence of the trachea in the model, it was desired
to replicate the physiological development of airflow through the respiratory system with a passage similar to the
trachea. Although a smooth pipe geometry was a very simplified method to model a trachea, computational studies
have shown good agreement of airflow development between an anatomically correct trachea and idealized smooth
pipe geometry (Brouns et al., 2006). An intermediary, flexible corrugated tube was used to connect between the
lung pump and the flowmeter. As mentioned in section 5.2, it was important to reproduce the internal airway
volume in an adult, to replicate a physiologically accurate transport of gas. The combined volume of the pump
cylinder (just after an exhale), the intermediary tube and the flow meter was approximately 2400 mL, and was
representative of the FRC. The combined volume of the trachea tube and the airway model was approximately 150
mL and representative of the anatomical dead space (Tortora & Derrickson, 2011).
As well as the TSI flow meter, a Honeywell AWM720P1 flowmeter was also used for the project (Figure 56). This
was required for a supplementary measurement to determine how the air flow was partitioned between the nasal
and oral passages during respiration (refer to chapter 6). This is a uni-directional flowmeter and had a measurement
range of up to + 200 L/min and an accuracy of ± 0.3 % of the reading.
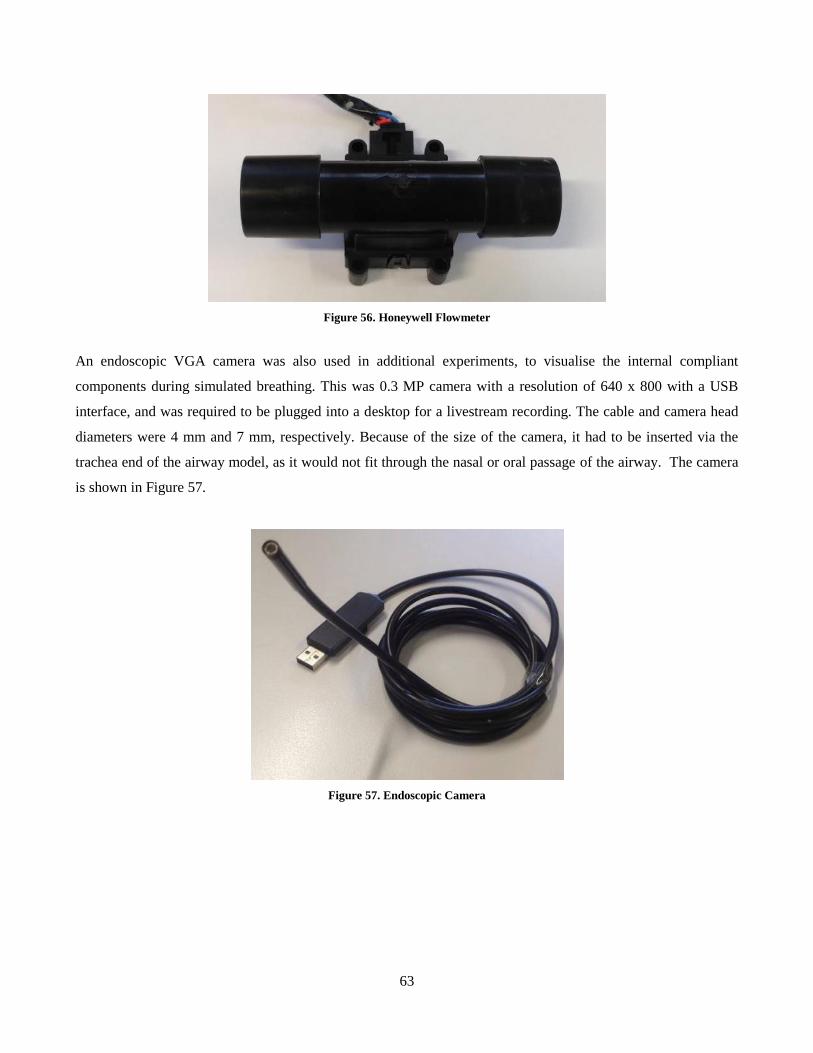
63
Figure 56. Honeywell Flowmeter
An endoscopic VGA camera was also used in additional experiments, to visualise the internal compliant
components during simulated breathing. This was 0.3 MP camera with a resolution of 640 x 800 with a USB
interface, and was required to be plugged into a desktop for a livestream recording. The cable and camera head
diameters were 4 mm and 7 mm, respectively. Because of the size of the camera, it had to be inserted via the
trachea end of the airway model, as it would not fit through the nasal or oral passage of the airway. The camera
is shown in Figure 57.
Figure 57. Endoscopic Camera
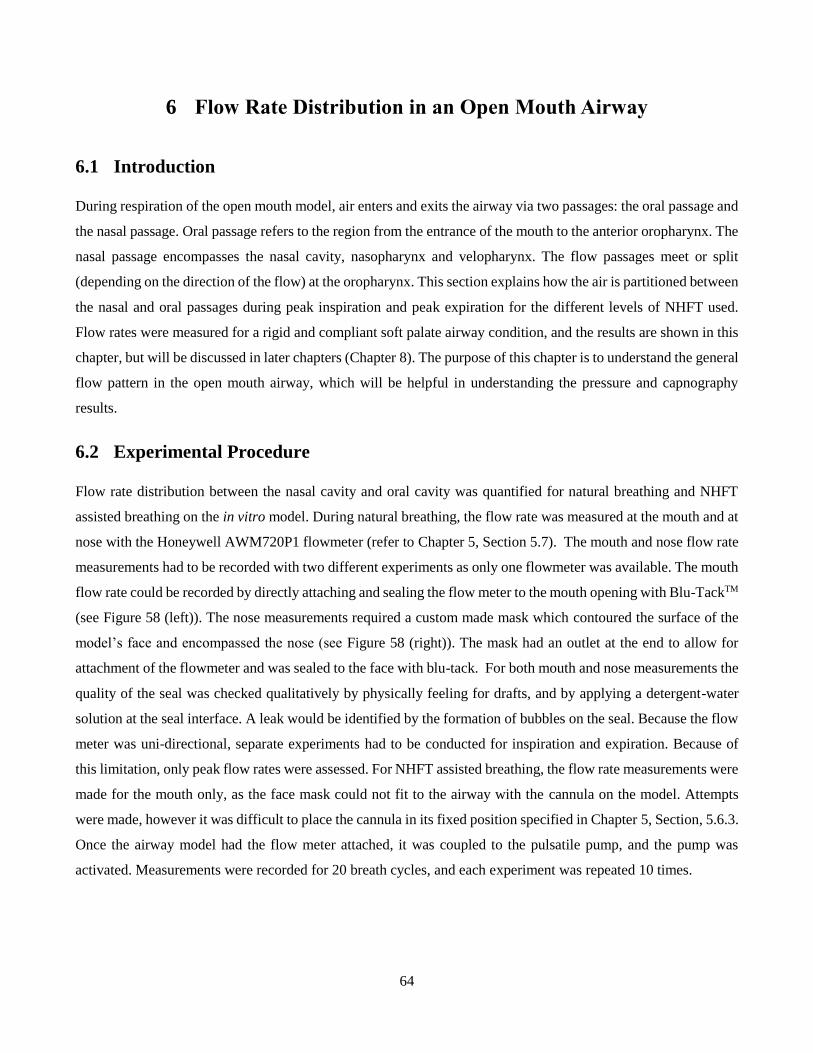
64
6 Flow Rate Distribution in an Open Mouth Airway
6.1 Introduction
During respiration of the open mouth model, air enters and exits the airway via two passages: the oral passage and
the nasal passage. Oral passage refers to the region from the entrance of the mouth to the anterior oropharynx. The
nasal passage encompasses the nasal cavity, nasopharynx and velopharynx. The flow passages meet or split
(depending on the direction of the flow) at the oropharynx. This section explains how the air is partitioned between
the nasal and oral passages during peak inspiration and peak expiration for the different levels of NHFT used.
Flow rates were measured for a rigid and compliant soft palate airway condition, and the results are shown in this
chapter, but will be discussed in later chapters (Chapter 8). The purpose of this chapter is to understand the general
flow pattern in the open mouth airway, which will be helpful in understanding the pressure and capnography
results.
6.2 Experimental Procedure
Flow rate distribution between the nasal cavity and oral cavity was quantified for natural breathing and NHFT
assisted breathing on the in vitro model. During natural breathing, the flow rate was measured at the mouth and at
nose with the Honeywell AWM720P1 flowmeter (refer to Chapter 5, Section 5.7). The mouth and nose flow rate
measurements had to be recorded with two different experiments as only one flowmeter was available. The mouth
flow rate could be recorded by directly attaching and sealing the flow meter to the mouth opening with Blu-TackTM
(see Figure 58 (left)). The nose measurements required a custom made mask which contoured the surface of the
model’s face and encompassed the nose (see Figure 58 (right)). The mask had an outlet at the end to allow for
attachment of the flowmeter and was sealed to the face with blu-tack. For both mouth and nose measurements the
quality of the seal was checked qualitatively by physically feeling for drafts, and by applying a detergent-water
solution at the seal interface. A leak would be identified by the formation of bubbles on the seal. Because the flow
meter was uni-directional, separate experiments had to be conducted for inspiration and expiration. Because of
this limitation, only peak flow rates were assessed. For NHFT assisted breathing, the flow rate measurements were
made for the mouth only, as the face mask could not fit to the airway with the cannula on the model. Attempts
were made, however it was difficult to place the cannula in its fixed position specified in Chapter 5, Section, 5.6.3.
Once the airway model had the flow meter attached, it was coupled to the pulsatile pump, and the pump was
activated. Measurements were recorded for 20 breath cycles, and each experiment was repeated 10 times.
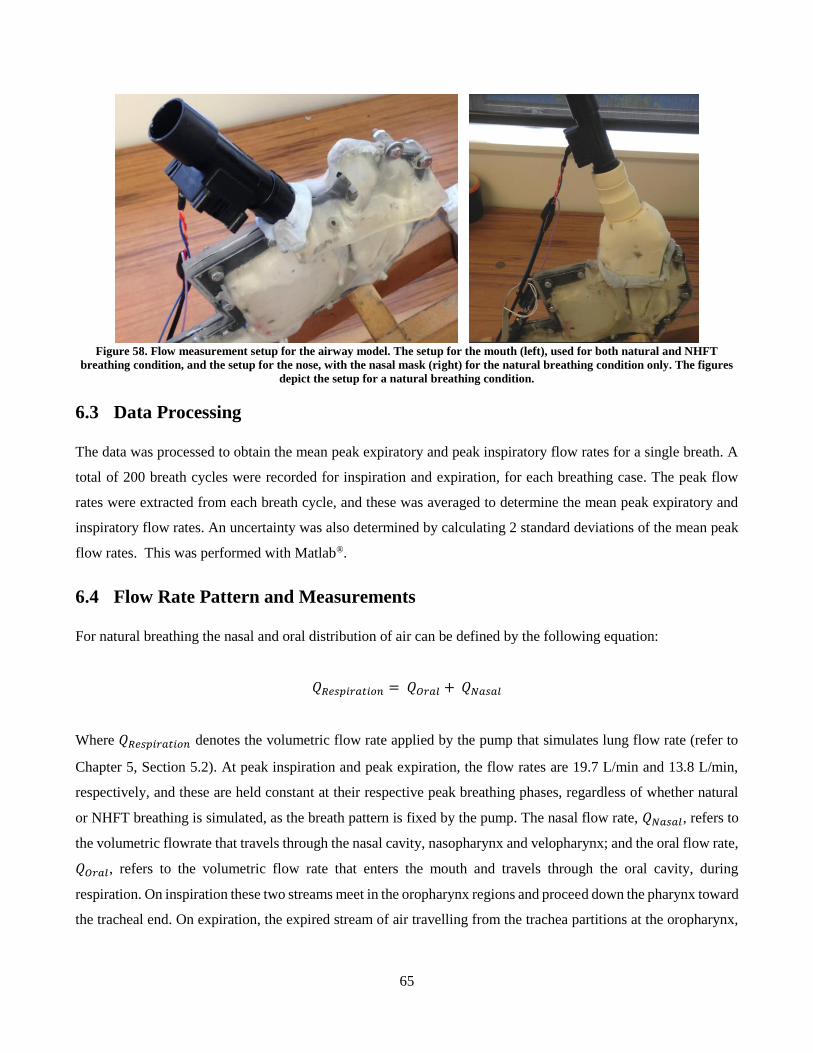
65
Figure 58. Flow measurement setup for the airway model. The setup for the mouth (left), used for both natural and NHFT
breathing condition, and the setup for the nose, with the nasal mask (right) for the natural breathing condition only. The figures
depict the setup for a natural breathing condition.
6.3 Data Processing
The data was processed to obtain the mean peak expiratory and peak inspiratory flow rates for a single breath. A
total of 200 breath cycles were recorded for inspiration and expiration, for each breathing case. The peak flow
rates were extracted from each breath cycle, and these was averaged to determine the mean peak expiratory and
inspiratory flow rates. An uncertainty was also determined by calculating 2 standard deviations of the mean peak
flow rates. This was performed with Matlab®.
6.4 Flow Rate Pattern and Measurements
For natural breathing the nasal and oral distribution of air can be defined by the following equation:
𝑄𝑅𝑒𝑠𝑝𝑖𝑟𝑎𝑡𝑖𝑜𝑛 = 𝑄𝑂𝑟𝑎𝑙 + 𝑄𝑁𝑎𝑠𝑎𝑙
Where 𝑄𝑅𝑒𝑠𝑝𝑖𝑟𝑎𝑡𝑖𝑜𝑛 denotes the volumetric flow rate applied by the pump that simulates lung flow rate (refer to
Chapter 5, Section 5.2). At peak inspiration and peak expiration, the flow rates are 19.7 L/min and 13.8 L/min,
respectively, and these are held constant at their respective peak breathing phases, regardless of whether natural
or NHFT breathing is simulated, as the breath pattern is fixed by the pump. The nasal flow rate, 𝑄𝑁𝑎𝑠𝑎𝑙, refers to
the volumetric flowrate that travels through the nasal cavity, nasopharynx and velopharynx; and the oral flow rate,
𝑄𝑂𝑟𝑎𝑙, refers to the volumetric flow rate that enters the mouth and travels through the oral cavity, during
respiration. On inspiration these two streams meet in the oropharynx regions and proceed down the pharynx toward
the tracheal end. On expiration, the expired stream of air travelling from the trachea partitions at the oropharynx,
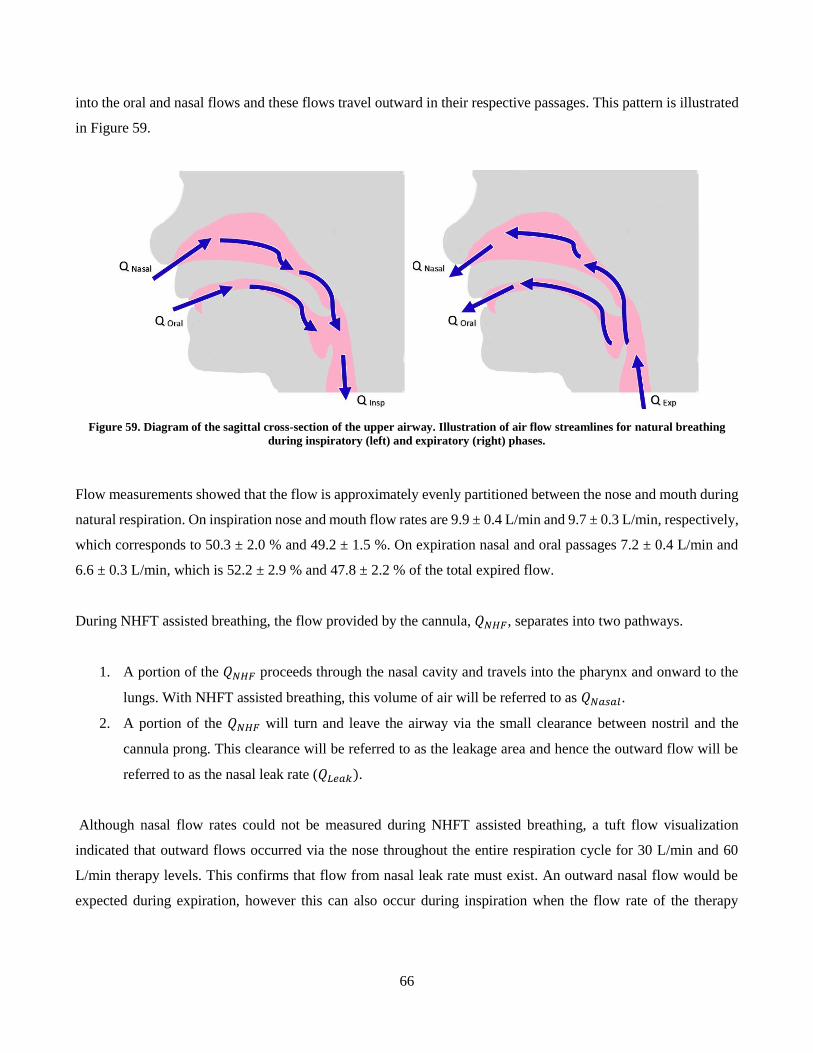
66
into the oral and nasal flows and these flows travel outward in their respective passages. This pattern is illustrated
in Figure 59.
Figure 59. Diagram of the sagittal cross-section of the upper airway. Illustration of air flow streamlines for natural breathing
during inspiratory (left) and expiratory (right) phases.
Flow measurements showed that the flow is approximately evenly partitioned between the nose and mouth during
natural respiration. On inspiration nose and mouth flow rates are 9.9 ± 0.4 L/min and 9.7 ± 0.3 L/min, respectively,
which corresponds to 50.3 ± 2.0 % and 49.2 ± 1.5 %. On expiration nasal and oral passages 7.2 ± 0.4 L/min and
6.6 ± 0.3 L/min, which is 52.2 ± 2.9 % and 47.8 ± 2.2 % of the total expired flow.
During NHFT assisted breathing, the flow provided by the cannula, 𝑄𝑁𝐻𝐹, separates into two pathways.
1. A portion of the 𝑄𝑁𝐻𝐹 proceeds through the nasal cavity and travels into the pharynx and onward to the
lungs. With NHFT assisted breathing, this volume of air will be referred to as 𝑄𝑁𝑎𝑠𝑎𝑙.
2. A portion of the 𝑄𝑁𝐻𝐹 will turn and leave the airway via the small clearance between nostril and the
cannula prong. This clearance will be referred to as the leakage area and hence the outward flow will be
referred to as the nasal leak rate (𝑄𝐿𝑒𝑎𝑘).
Although nasal flow rates could not be measured during NHFT assisted breathing, a tuft flow visualization
indicated that outward flows occurred via the nose throughout the entire respiration cycle for 30 L/min and 60
L/min therapy levels. This confirms that flow from nasal leak rate must exist. An outward nasal flow would be
expected during expiration, however this can also occur during inspiration when the flow rate of the therapy
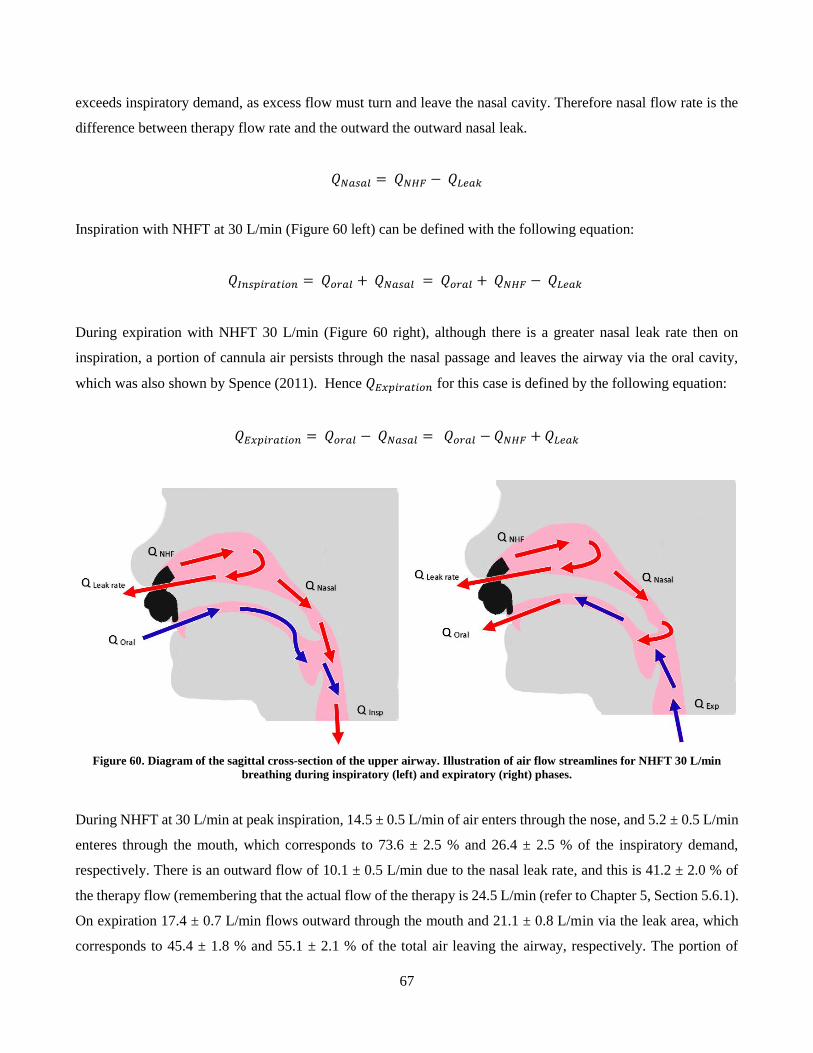
67
exceeds inspiratory demand, as excess flow must turn and leave the nasal cavity. Therefore nasal flow rate is the
difference between therapy flow rate and the outward the outward nasal leak.
𝑄𝑁𝑎𝑠𝑎𝑙 = 𝑄𝑁𝐻𝐹 − 𝑄𝐿𝑒𝑎𝑘
Inspiration with NHFT at 30 L/min (Figure 60 left) can be defined with the following equation:
𝑄𝐼𝑛𝑠𝑝𝑖𝑟𝑎𝑡𝑖𝑜𝑛 = 𝑄𝑜𝑟𝑎𝑙 + 𝑄𝑁𝑎𝑠𝑎𝑙 = 𝑄𝑜𝑟𝑎𝑙 + 𝑄𝑁𝐻𝐹 − 𝑄𝐿𝑒𝑎𝑘
During expiration with NHFT 30 L/min (Figure 60 right), although there is a greater nasal leak rate then on
inspiration, a portion of cannula air persists through the nasal passage and leaves the airway via the oral cavity,
which was also shown by Spence (2011). Hence 𝑄𝐸𝑥𝑝𝑖𝑟𝑎𝑡𝑖𝑜𝑛 for this case is defined by the following equation:
𝑄𝐸𝑥𝑝𝑖𝑟𝑎𝑡𝑖𝑜𝑛 = 𝑄𝑜𝑟𝑎𝑙 − 𝑄𝑁𝑎𝑠𝑎𝑙 = 𝑄𝑜𝑟𝑎𝑙 − 𝑄𝑁𝐻𝐹 + 𝑄𝐿𝑒𝑎𝑘
Figure 60. Diagram of the sagittal cross-section of the upper airway. Illustration of air flow streamlines for NHFT 30 L/min
breathing during inspiratory (left) and expiratory (right) phases.
During NHFT at 30 L/min at peak inspiration, 14.5 ± 0.5 L/min of air enters through the nose, and 5.2 ± 0.5 L/min
enteres through the mouth, which corresponds to 73.6 ± 2.5 % and 26.4 ± 2.5 % of the inspiratory demand,
respectively. There is an outward flow of 10.1 ± 0.5 L/min due to the nasal leak rate, and this is 41.2 ± 2.0 % of
the therapy flow (remembering that the actual flow of the therapy is 24.5 L/min (refer to Chapter 5, Section 5.6.1).
On expiration 17.4 ± 0.7 L/min flows outward through the mouth and 21.1 ± 0.8 L/min via the leak area, which
corresponds to 45.4 ± 1.8 % and 55.1 ± 2.1 % of the total air leaving the airway, respectively. The portion of
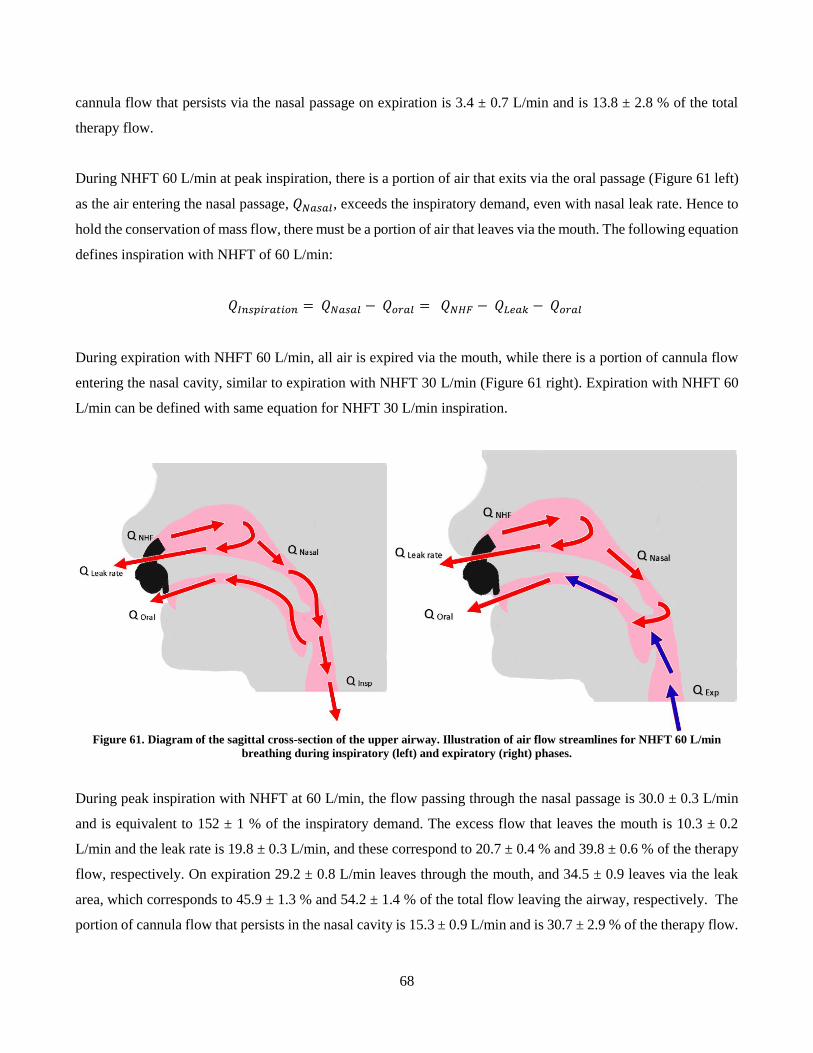
68
cannula flow that persists via the nasal passage on expiration is 3.4 ± 0.7 L/min and is 13.8 ± 2.8 % of the total
therapy flow.
During NHFT 60 L/min at peak inspiration, there is a portion of air that exits via the oral passage (Figure 61 left)
as the air entering the nasal passage, 𝑄𝑁𝑎𝑠𝑎𝑙, exceeds the inspiratory demand, even with nasal leak rate. Hence to
hold the conservation of mass flow, there must be a portion of air that leaves via the mouth. The following equation
defines inspiration with NHFT of 60 L/min:
𝑄𝐼𝑛𝑠𝑝𝑖𝑟𝑎𝑡𝑖𝑜𝑛 = 𝑄𝑁𝑎𝑠𝑎𝑙 − 𝑄𝑜𝑟𝑎𝑙 = 𝑄𝑁𝐻𝐹 − 𝑄𝐿𝑒𝑎𝑘 − 𝑄𝑜𝑟𝑎𝑙
During expiration with NHFT 60 L/min, all air is expired via the mouth, while there is a portion of cannula flow
entering the nasal cavity, similar to expiration with NHFT 30 L/min (Figure 61 right). Expiration with NHFT 60
L/min can be defined with same equation for NHFT 30 L/min inspiration.
Figure 61. Diagram of the sagittal cross-section of the upper airway. Illustration of air flow streamlines for NHFT 60 L/min
breathing during inspiratory (left) and expiratory (right) phases.
During peak inspiration with NHFT at 60 L/min, the flow passing through the nasal passage is 30.0 ± 0.3 L/min
and is equivalent to 152 ± 1 % of the inspiratory demand. The excess flow that leaves the mouth is 10.3 ± 0.2
L/min and the leak rate is 19.8 ± 0.3 L/min, and these correspond to 20.7 ± 0.4 % and 39.8 ± 0.6 % of the therapy
flow, respectively. On expiration 29.2 ± 0.8 L/min leaves through the mouth, and 34.5 ± 0.9 leaves via the leak
area, which corresponds to 45.9 ± 1.3 % and 54.2 ± 1.4 % of the total flow leaving the airway, respectively. The
portion of cannula flow that persists in the nasal cavity is 15.3 ± 0.9 L/min and is 30.7 ± 2.9 % of the therapy flow.
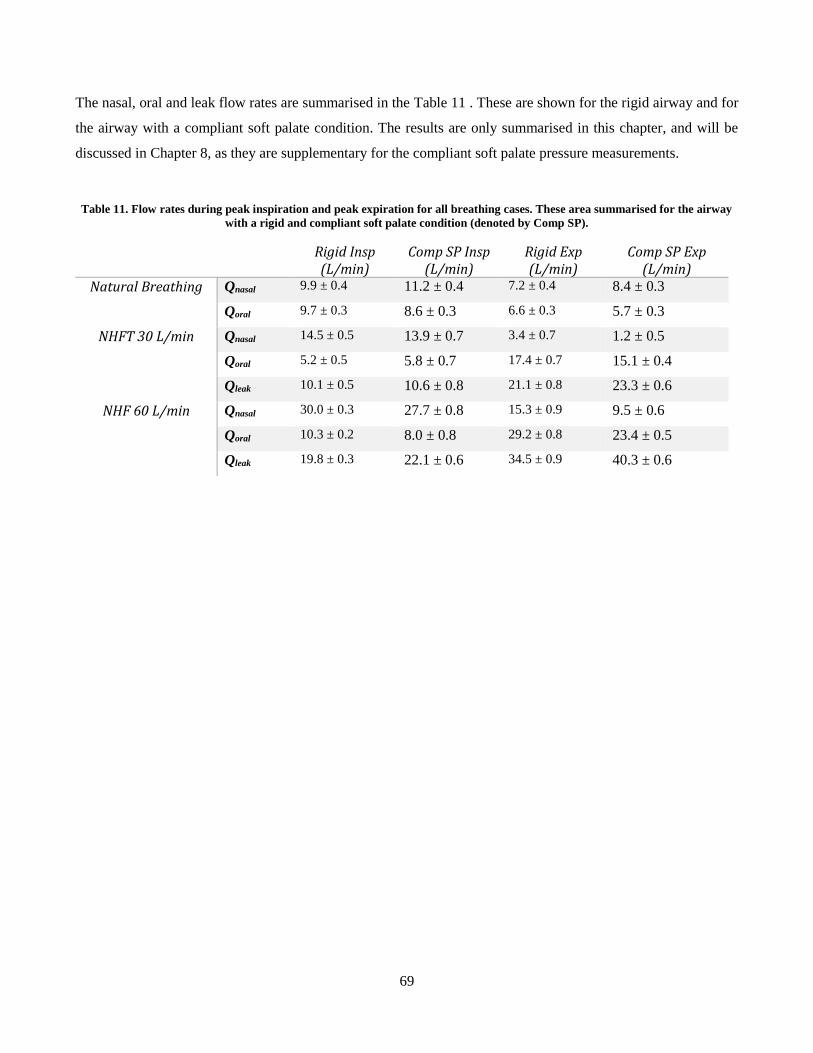
69
The nasal, oral and leak flow rates are summarised in the Table 11 . These are shown for the rigid airway and for
the airway with a compliant soft palate condition. The results are only summarised in this chapter, and will be
discussed in Chapter 8, as they are supplementary for the compliant soft palate pressure measurements.
Table 11. Flow rates during peak inspiration and peak expiration for all breathing cases. These area summarised for the airway
with a rigid and compliant soft palate condition (denoted by Comp SP).
Rigid Insp (L/min)
Comp SP Insp (L/min)
Rigid Exp (L/min)
Comp SP Exp (L/min)
Natural Breathing Qnasal 9.9 ± 0.4 11.2 ± 0.4 7.2 ± 0.4 8.4 ± 0.3
Qoral 9.7 ± 0.3 8.6 ± 0.3 6.6 ± 0.3 5.7 ± 0.3
NHFT 30 L/min Qnasal 14.5 ± 0.5 13.9 ± 0.7 3.4 ± 0.7 1.2 ± 0.5
Qoral 5.2 ± 0.5 5.8 ± 0.7 17.4 ± 0.7 15.1 ± 0.4
Qleak 10.1 ± 0.5 10.6 ± 0.8 21.1 ± 0.8 23.3 ± 0.6
NHF 60 L/min Qnasal 30.0 ± 0.3 27.7 ± 0.8 15.3 ± 0.9 9.5 ± 0.6
Qoral 10.3 ± 0.2 8.0 ± 0.8 29.2 ± 0.8 23.4 ± 0.5
Qleak 19.8 ± 0.3 22.1 ± 0.6 34.5 ± 0.9 40.3 ± 0.6
70
7 Static Pressure Experimental Procedure and Data Processing
7.1 Experimental Procedure
Static pressure tests were carried out with pulsatile lung pump and the pressure testing elements described in
Chapter 5. The airway model was fixed on the inclined wooden bracket in supine position and coupled to the
pulsatile pump via the tubing. The pressure probes were connected to the airway pressure taps, and Blu-TackTM
was applied between the interface of the probe and the tap to prevent potential leaks. Given the number of pressure
sensing elements that were available, up to ten taps could be measured simultaneously. The pulsatile pump was
initialized and the pressure measurements were recorded after the pump completed 5 initial cycles. This was to
allow the breathing pattern in the airway to reach a steady cycle. The pressures were recorded for approximately
30 breath cycles for each pressure tap. Each test was repeated 10 times. The static pressure tests were also carried
out for the NHFT assisted breathing at 30 L/min and 60 L/min with the exact same procedure only with a nasal
cannula fitted to the airway. Before a test was repeated, all pressure probes were removed and replaced back into
the taps and nasal cannula was refitted for the NHFT assisted tests. Four configurations were tested for: The rigid
airway model and each compliant tissue condition. This was to isolate each specific compliant component and to
investigate how each individual tissue affected breathing.
Two supplementary tests were also carried out with the pressure experiments. The first test involved the rigid
airway with the mouth completely sealed with Blu-TackTM to approximate a closed mouth condition. The second
test was for the compliant soft palate airway condition, with a ‘face-down’, prone orientation, to investigate
potential gravitational effects. The exact same pressure testing procedures that are explained in the previous
paragraph were implemented for these two tests.
Figure 62 shows the locations of the taps on the airway model. Each airway region had 3 – 5 pressure taps
designated to it. Due to the large amount of taps pressure results in each region of the pharynx will be represented
by the posterior pressure tap. Although there was there was a small amount of variation between pressure taps
within the same the region, this variation was of little use for the compliant vs rigid tests. The extra taps were used
as validation to confirm whether a tap was producing correct results when an outlier measurement was suspected.
The pressure taps at the nostrils and mouth opening (pressure taps 1 – 4) had a low signal-to-noise ratio and made
it difficult to extract useful information and were omitted from testing. This may have been due to turbulence from
the cannula, flow separation in the oral cavity or recirculation in the oral cavity. The taps on the left and right side
of the oral cavity (taps 5 and 6) were used during natural breathing, however were omitted for NHFT tests they
did not produce any distinguishable results due to large amount of noise. The taps at the superior nasal concha of
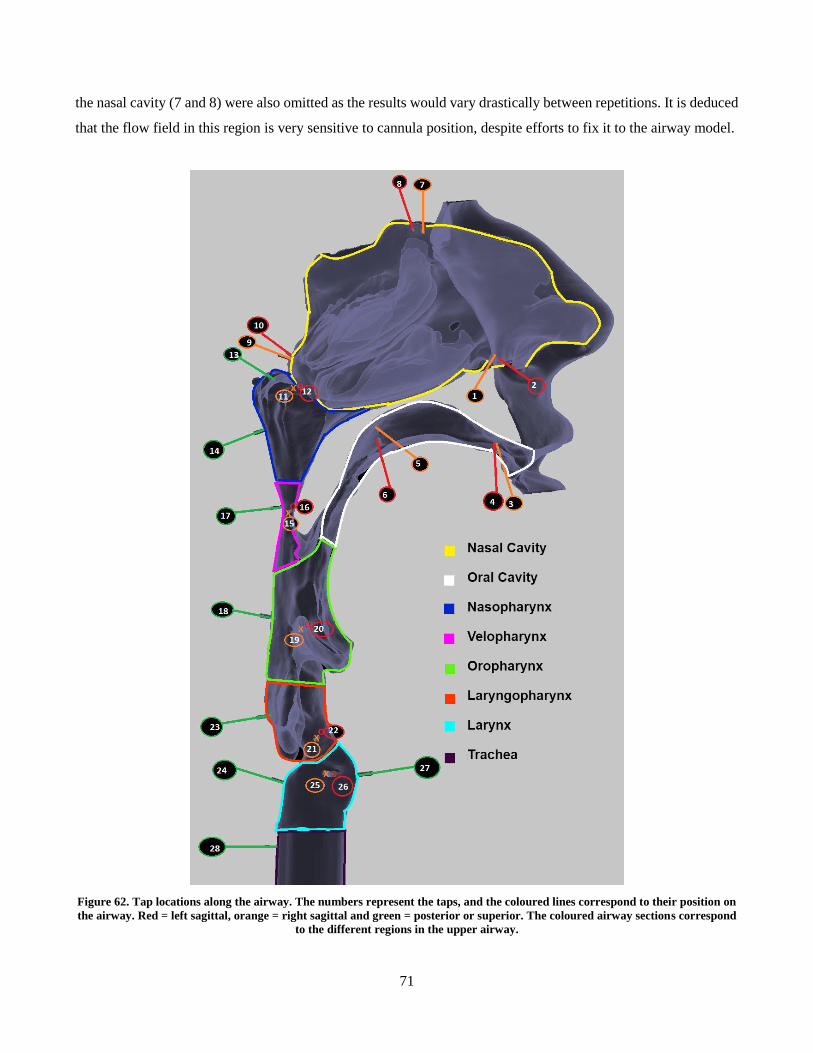
71
the nasal cavity (7 and 8) were also omitted as the results would vary drastically between repetitions. It is deduced
that the flow field in this region is very sensitive to cannula position, despite efforts to fix it to the airway model.
Figure 62. Tap locations along the airway. The numbers represent the taps, and the coloured lines correspond to their position on
the airway. Red = left sagittal, orange = right sagittal and green = posterior or superior. The coloured airway sections correspond
to the different regions in the upper airway.
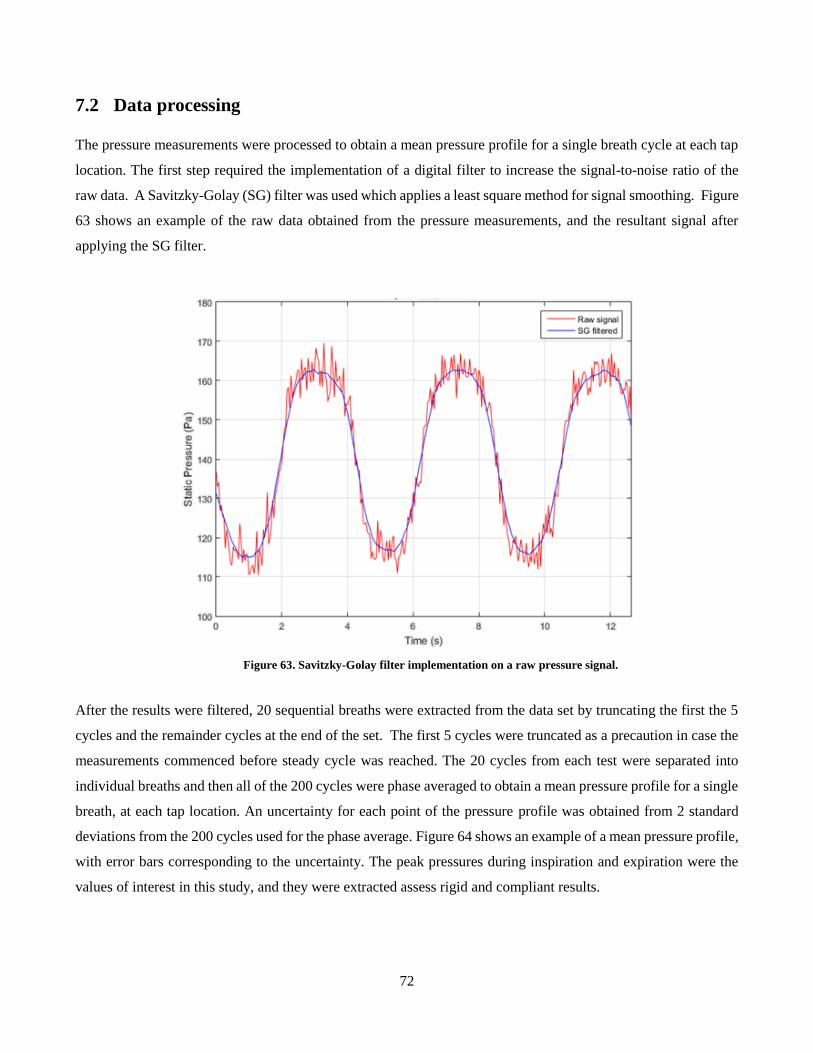
72
7.2 Data processing
The pressure measurements were processed to obtain a mean pressure profile for a single breath cycle at each tap
location. The first step required the implementation of a digital filter to increase the signal-to-noise ratio of the
raw data. A Savitzky-Golay (SG) filter was used which applies a least square method for signal smoothing. Figure
63 shows an example of the raw data obtained from the pressure measurements, and the resultant signal after
applying the SG filter.
Figure 63. Savitzky-Golay filter implementation on a raw pressure signal.
After the results were filtered, 20 sequential breaths were extracted from the data set by truncating the first the 5
cycles and the remainder cycles at the end of the set. The first 5 cycles were truncated as a precaution in case the
measurements commenced before steady cycle was reached. The 20 cycles from each test were separated into
individual breaths and then all of the 200 cycles were phase averaged to obtain a mean pressure profile for a single
breath, at each tap location. An uncertainty for each point of the pressure profile was obtained from 2 standard
deviations from the 200 cycles used for the phase average. Figure 64 shows an example of a mean pressure profile,
with error bars corresponding to the uncertainty. The peak pressures during inspiration and expiration were the
values of interest in this study, and they were extracted assess rigid and compliant results.
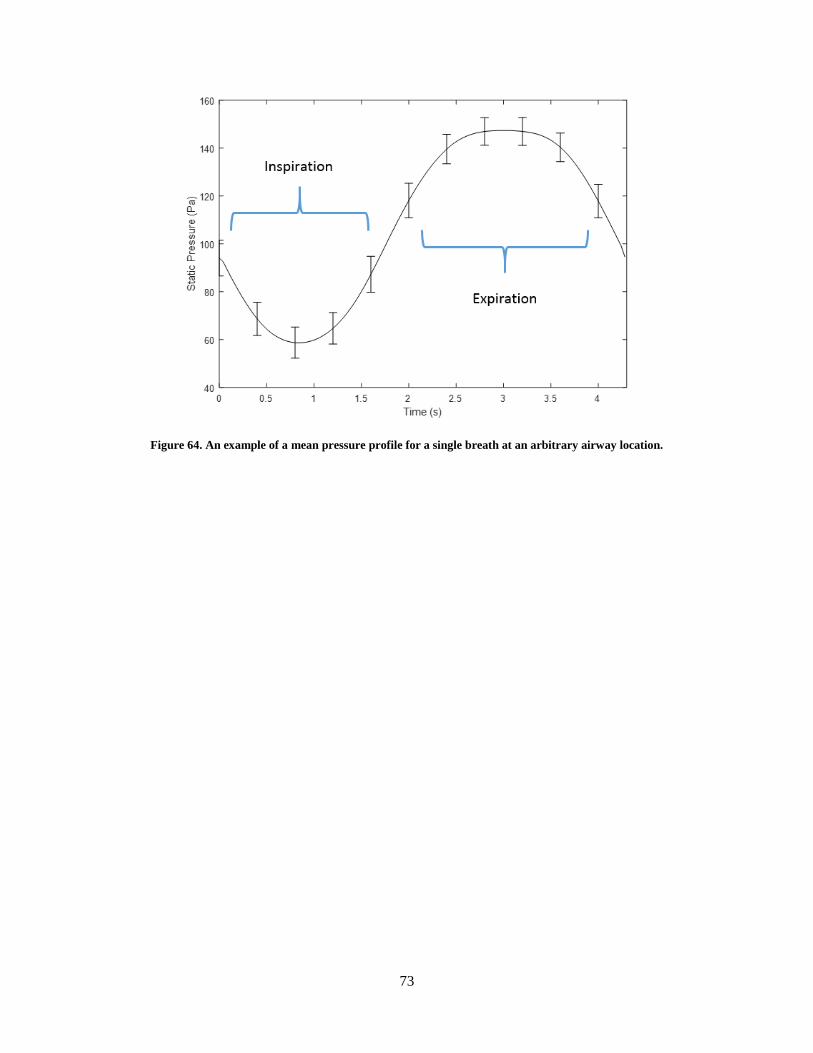
73
Figure 64. An example of a mean pressure profile for a single breath at an arbitrary airway location.
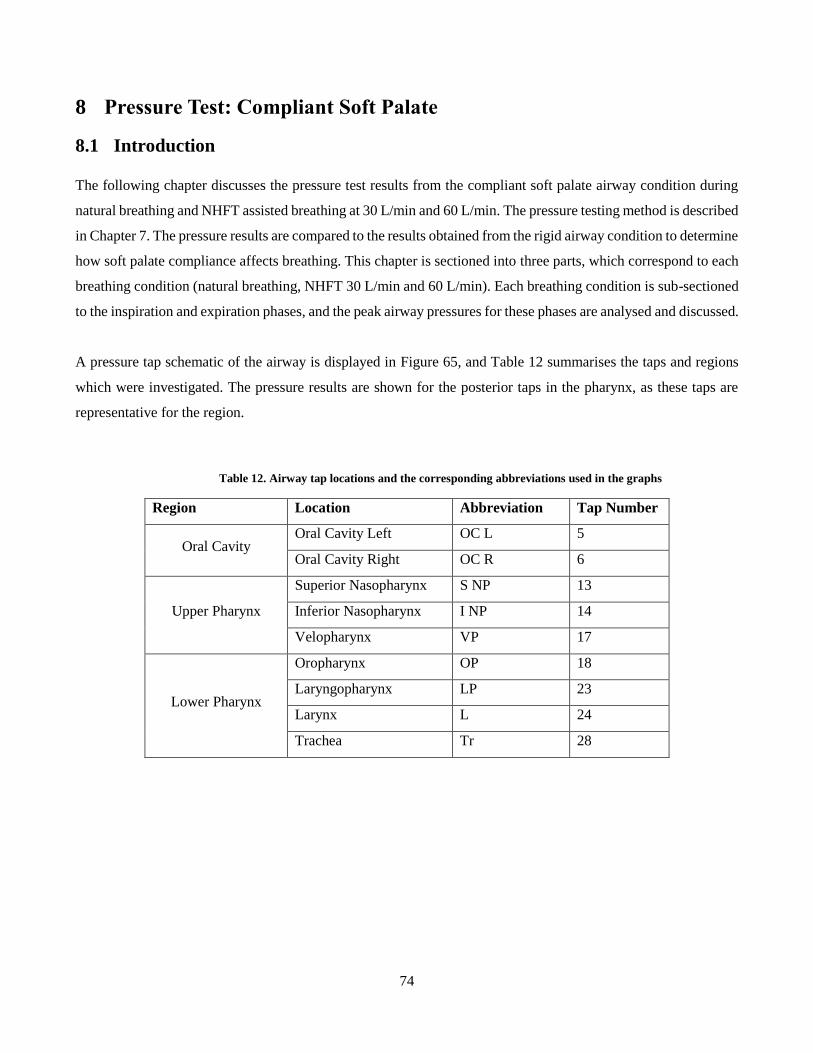
74
8 Pressure Test: Compliant Soft Palate
8.1 Introduction
The following chapter discusses the pressure test results from the compliant soft palate airway condition during
natural breathing and NHFT assisted breathing at 30 L/min and 60 L/min. The pressure testing method is described
in Chapter 7. The pressure results are compared to the results obtained from the rigid airway condition to determine
how soft palate compliance affects breathing. This chapter is sectioned into three parts, which correspond to each
breathing condition (natural breathing, NHFT 30 L/min and 60 L/min). Each breathing condition is sub-sectioned
to the inspiration and expiration phases, and the peak airway pressures for these phases are analysed and discussed.
A pressure tap schematic of the airway is displayed in Figure 65, and Table 12 summarises the taps and regions
which were investigated. The pressure results are shown for the posterior taps in the pharynx, as these taps are
representative for the region.
Table 12. Airway tap locations and the corresponding abbreviations used in the graphs
Region Location Abbreviation Tap Number
Oral Cavity Oral Cavity Left OC L 5
Oral Cavity Right OC R 6
Upper Pharynx
Superior Nasopharynx S NP 13
Inferior Nasopharynx I NP 14
Velopharynx VP 17
Lower Pharynx
Oropharynx OP 18
Laryngopharynx LP 23
Larynx L 24
Trachea Tr 28
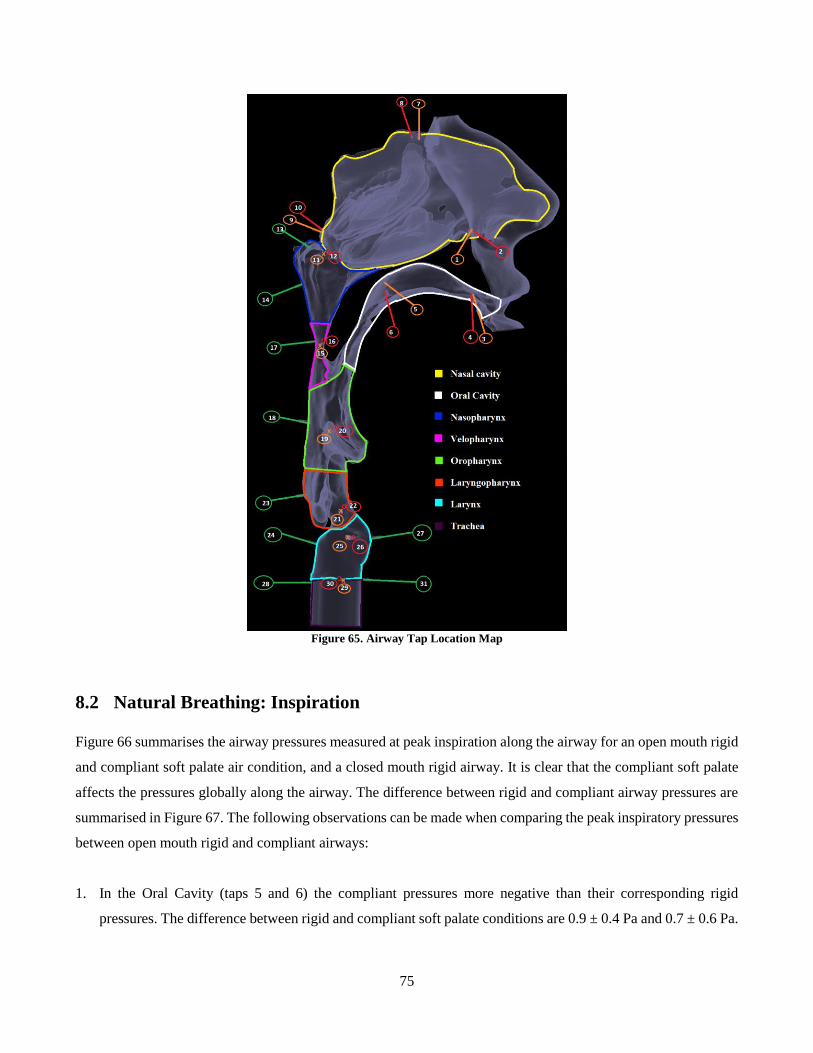
75
Figure 65. Airway Tap Location Map
8.2 Natural Breathing: Inspiration
Figure 66 summarises the airway pressures measured at peak inspiration along the airway for an open mouth rigid
and compliant soft palate air condition, and a closed mouth rigid airway. It is clear that the compliant soft palate
affects the pressures globally along the airway. The difference between rigid and compliant airway pressures are
summarised in Figure 67. The following observations can be made when comparing the peak inspiratory pressures
between open mouth rigid and compliant airways:
1. In the Oral Cavity (taps 5 and 6) the compliant pressures more negative than their corresponding rigid
pressures. The difference between rigid and compliant soft palate conditions are 0.9 ± 0.4 Pa and 0.7 ± 0.6 Pa.
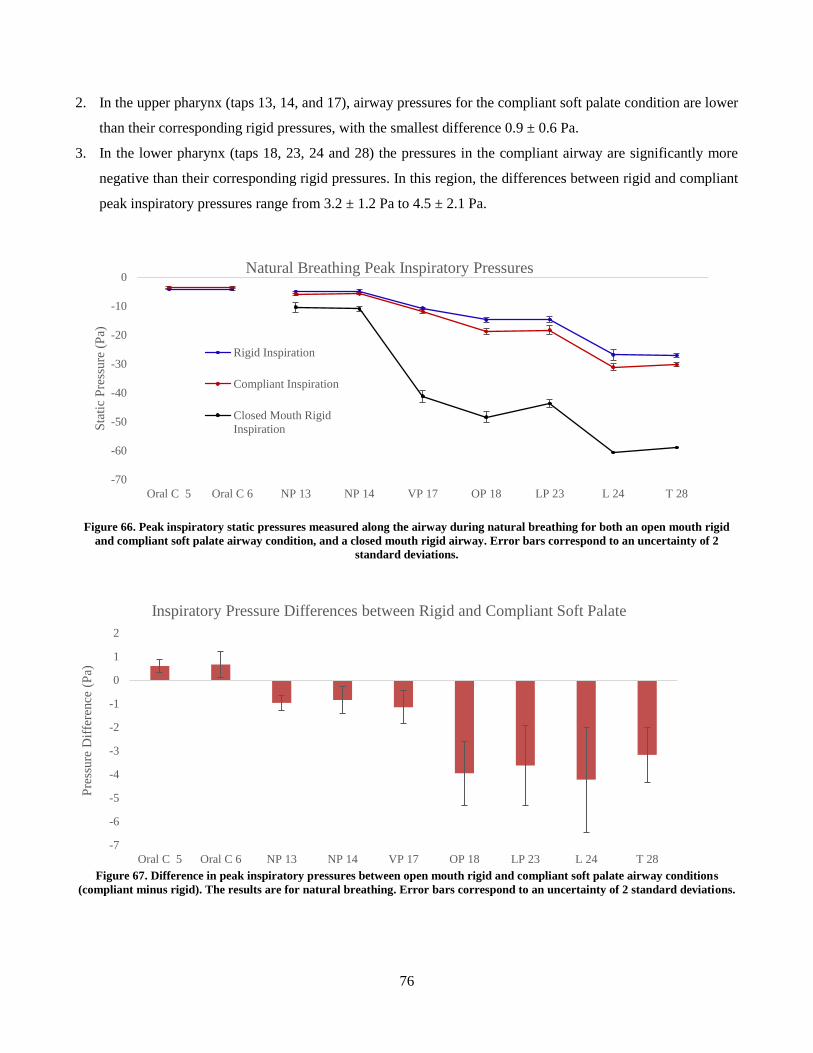
76
2. In the upper pharynx (taps 13, 14, and 17), airway pressures for the compliant soft palate condition are lower
than their corresponding rigid pressures, with the smallest difference 0.9 ± 0.6 Pa.
3. In the lower pharynx (taps 18, 23, 24 and 28) the pressures in the compliant airway are significantly more
negative than their corresponding rigid pressures. In this region, the differences between rigid and compliant
peak inspiratory pressures range from 3.2 ± 1.2 Pa to 4.5 ± 2.1 Pa.
Figure 66. Peak inspiratory static pressures measured along the airway during natural breathing for both an open mouth rigid
and compliant soft palate airway condition, and a closed mouth rigid airway. Error bars correspond to an uncertainty of 2
standard deviations.
Figure 67. Difference in peak inspiratory pressures between open mouth rigid and compliant soft palate airway conditions
(compliant minus rigid). The results are for natural breathing. Error bars correspond to an uncertainty of 2 standard deviations.
-70
-60
-50
-40
-30
-20
-10
0
Oral C 5 Oral C 6 NP 13 NP 14 VP 17 OP 18 LP 23 L 24 T 28
Sta
tic
Pre
ssure
(P
a)
Natural Breathing Peak Inspiratory Pressures
Rigid Inspiration
Compliant Inspiration
Closed Mouth Rigid
Inspiration
-7
-6
-5
-4
-3
-2
-1
0
1
2
Oral C 5 Oral C 6 NP 13 NP 14 VP 17 OP 18 LP 23 L 24 T 28
Pre
ssure
Dif
fere
nce
(P
a)
Inspiratory Pressure Differences between Rigid and Compliant Soft Palate
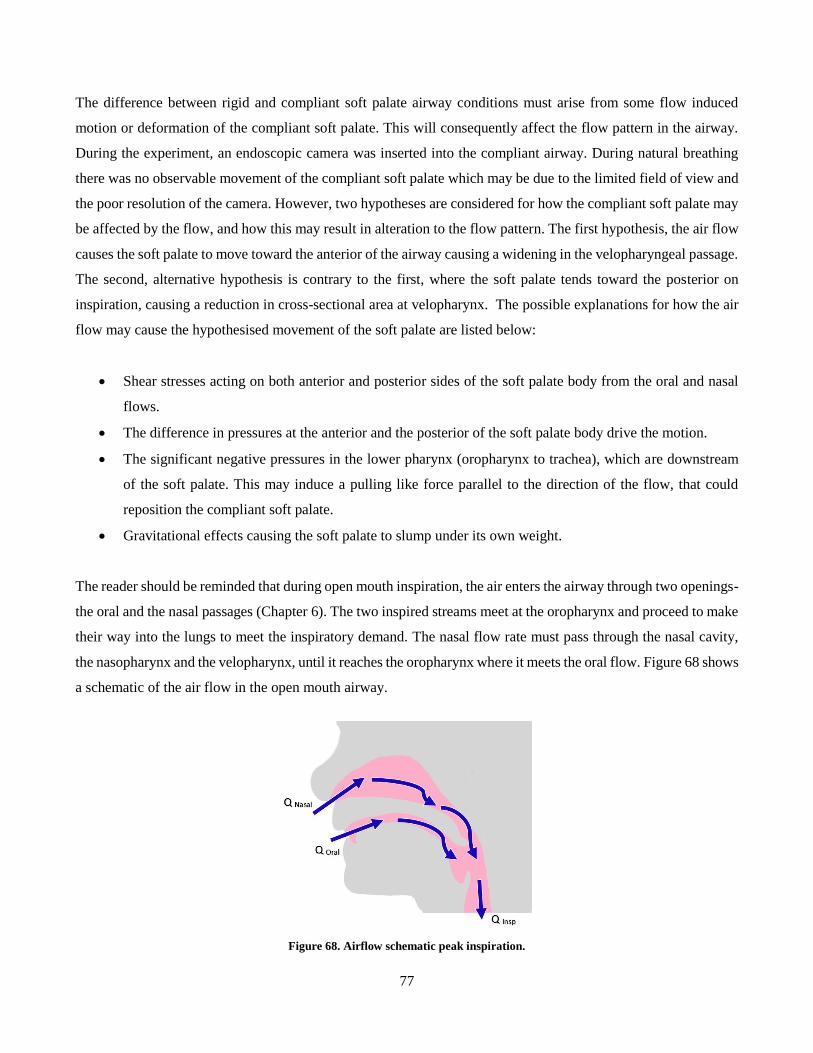
77
The difference between rigid and compliant soft palate airway conditions must arise from some flow induced
motion or deformation of the compliant soft palate. This will consequently affect the flow pattern in the airway.
During the experiment, an endoscopic camera was inserted into the compliant airway. During natural breathing
there was no observable movement of the compliant soft palate which may be due to the limited field of view and
the poor resolution of the camera. However, two hypotheses are considered for how the compliant soft palate may
be affected by the flow, and how this may result in alteration to the flow pattern. The first hypothesis, the air flow
causes the soft palate to move toward the anterior of the airway causing a widening in the velopharyngeal passage.
The second, alternative hypothesis is contrary to the first, where the soft palate tends toward the posterior on
inspiration, causing a reduction in cross-sectional area at velopharynx. The possible explanations for how the air
flow may cause the hypothesised movement of the soft palate are listed below:
Shear stresses acting on both anterior and posterior sides of the soft palate body from the oral and nasal
flows.
The difference in pressures at the anterior and the posterior of the soft palate body drive the motion.
The significant negative pressures in the lower pharynx (oropharynx to trachea), which are downstream
of the soft palate. This may induce a pulling like force parallel to the direction of the flow, that could
reposition the compliant soft palate.
Gravitational effects causing the soft palate to slump under its own weight.
The reader should be reminded that during open mouth inspiration, the air enters the airway through two openings-
the oral and the nasal passages (Chapter 6). The two inspired streams meet at the oropharynx and proceed to make
their way into the lungs to meet the inspiratory demand. The nasal flow rate must pass through the nasal cavity,
the nasopharynx and the velopharynx, until it reaches the oropharynx where it meets the oral flow. Figure 68 shows
a schematic of the air flow in the open mouth airway.
Figure 68. Airflow schematic peak inspiration.
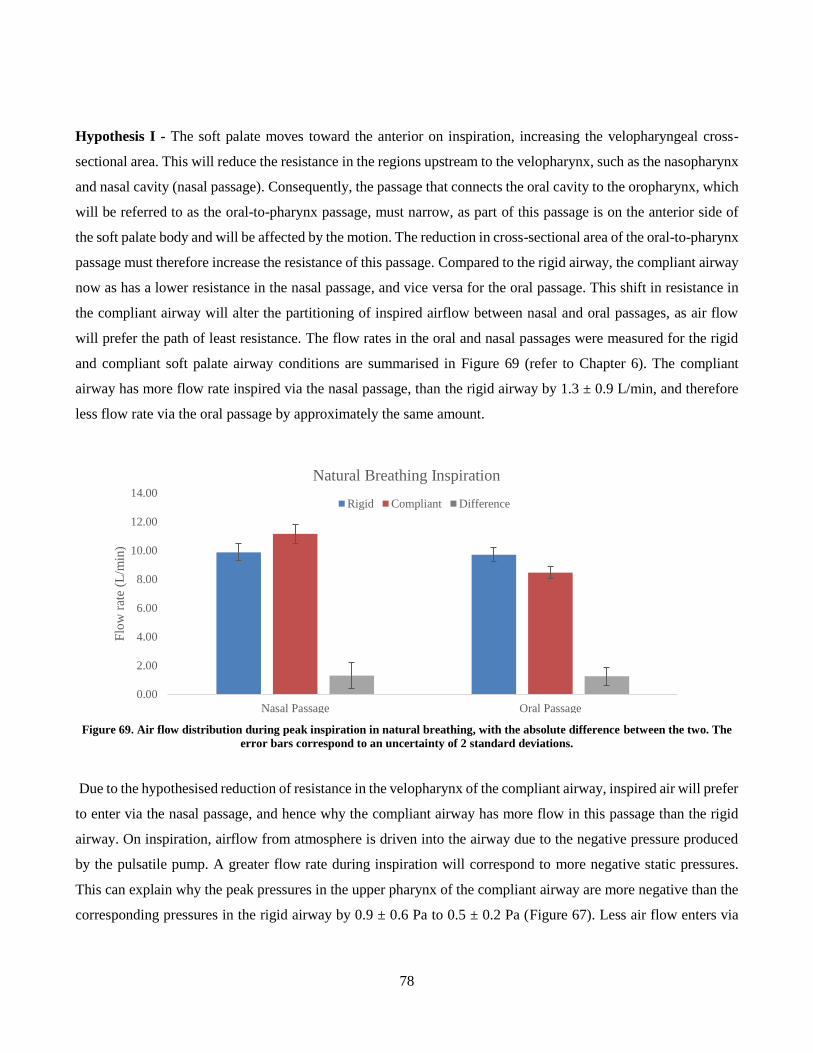
78
Hypothesis I - The soft palate moves toward the anterior on inspiration, increasing the velopharyngeal cross-
sectional area. This will reduce the resistance in the regions upstream to the velopharynx, such as the nasopharynx
and nasal cavity (nasal passage). Consequently, the passage that connects the oral cavity to the oropharynx, which
will be referred to as the oral-to-pharynx passage, must narrow, as part of this passage is on the anterior side of
the soft palate body and will be affected by the motion. The reduction in cross-sectional area of the oral-to-pharynx
passage must therefore increase the resistance of this passage. Compared to the rigid airway, the compliant airway
now as has a lower resistance in the nasal passage, and vice versa for the oral passage. This shift in resistance in
the compliant airway will alter the partitioning of inspired airflow between nasal and oral passages, as air flow
will prefer the path of least resistance. The flow rates in the oral and nasal passages were measured for the rigid
and compliant soft palate airway conditions are summarised in Figure 69 (refer to Chapter 6). The compliant
airway has more flow rate inspired via the nasal passage, than the rigid airway by 1.3 ± 0.9 L/min, and therefore
less flow rate via the oral passage by approximately the same amount.
Figure 69. Air flow distribution during peak inspiration in natural breathing, with the absolute difference between the two. The
error bars correspond to an uncertainty of 2 standard deviations.
Due to the hypothesised reduction of resistance in the velopharynx of the compliant airway, inspired air will prefer
to enter via the nasal passage, and hence why the compliant airway has more flow in this passage than the rigid
airway. On inspiration, airflow from atmosphere is driven into the airway due to the negative pressure produced
by the pulsatile pump. A greater flow rate during inspiration will correspond to more negative static pressures.
This can explain why the peak pressures in the upper pharynx of the compliant airway are more negative than the
corresponding pressures in the rigid airway by 0.9 ± 0.6 Pa to 0.5 ± 0.2 Pa (Figure 67). Less air flow enters via
0.00
2.00
4.00
6.00
8.00
10.00
12.00
14.00
Nasal Passage Oral Passage
Flo
w r
ate
(L/m
in)
Natural Breathing Inspiration
Rigid Compliant Difference
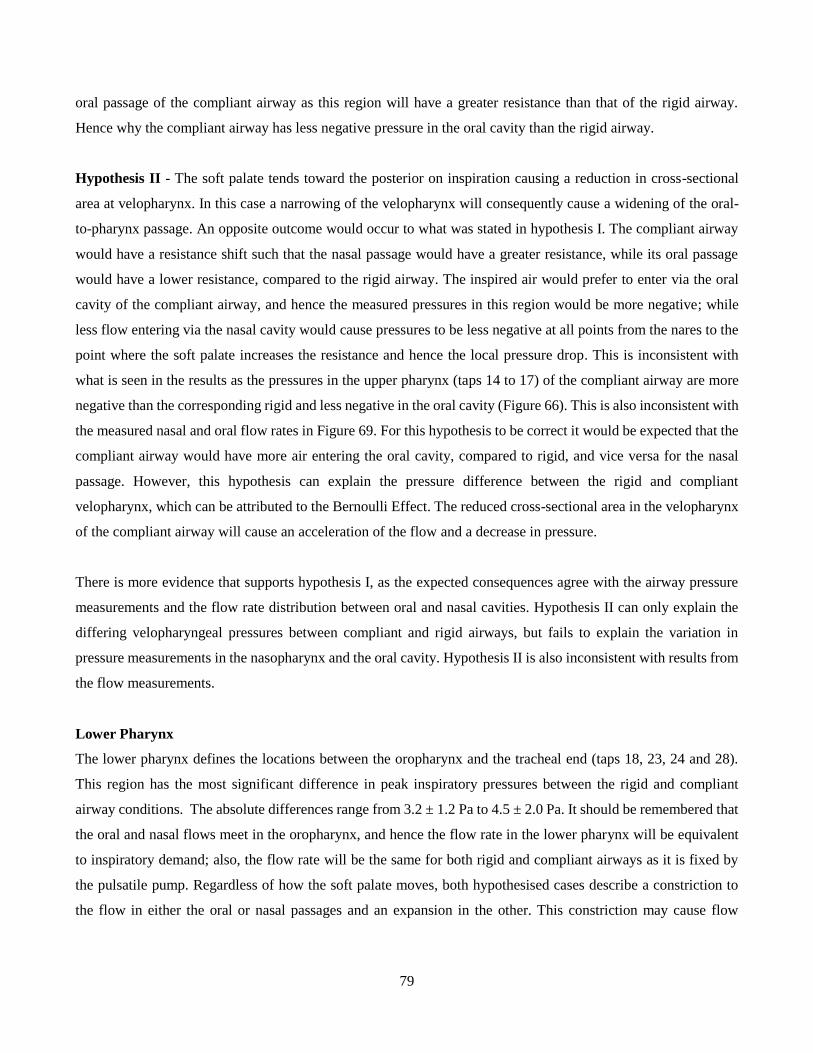
79
oral passage of the compliant airway as this region will have a greater resistance than that of the rigid airway.
Hence why the compliant airway has less negative pressure in the oral cavity than the rigid airway.
Hypothesis II - The soft palate tends toward the posterior on inspiration causing a reduction in cross-sectional
area at velopharynx. In this case a narrowing of the velopharynx will consequently cause a widening of the oral-
to-pharynx passage. An opposite outcome would occur to what was stated in hypothesis I. The compliant airway
would have a resistance shift such that the nasal passage would have a greater resistance, while its oral passage
would have a lower resistance, compared to the rigid airway. The inspired air would prefer to enter via the oral
cavity of the compliant airway, and hence the measured pressures in this region would be more negative; while
less flow entering via the nasal cavity would cause pressures to be less negative at all points from the nares to the
point where the soft palate increases the resistance and hence the local pressure drop. This is inconsistent with
what is seen in the results as the pressures in the upper pharynx (taps 14 to 17) of the compliant airway are more
negative than the corresponding rigid and less negative in the oral cavity (Figure 66). This is also inconsistent with
the measured nasal and oral flow rates in Figure 69. For this hypothesis to be correct it would be expected that the
compliant airway would have more air entering the oral cavity, compared to rigid, and vice versa for the nasal
passage. However, this hypothesis can explain the pressure difference between the rigid and compliant
velopharynx, which can be attributed to the Bernoulli Effect. The reduced cross-sectional area in the velopharynx
of the compliant airway will cause an acceleration of the flow and a decrease in pressure.
There is more evidence that supports hypothesis I, as the expected consequences agree with the airway pressure
measurements and the flow rate distribution between oral and nasal cavities. Hypothesis II can only explain the
differing velopharyngeal pressures between compliant and rigid airways, but fails to explain the variation in
pressure measurements in the nasopharynx and the oral cavity. Hypothesis II is also inconsistent with results from
the flow measurements.
Lower Pharynx
The lower pharynx defines the locations between the oropharynx and the tracheal end (taps 18, 23, 24 and 28).
This region has the most significant difference in peak inspiratory pressures between the rigid and compliant
airway conditions. The absolute differences range from 3.2 ± 1.2 Pa to 4.5 ± 2.0 Pa. It should be remembered that
the oral and nasal flows meet in the oropharynx, and hence the flow rate in the lower pharynx will be equivalent
to inspiratory demand; also, the flow rate will be the same for both rigid and compliant airways as it is fixed by
the pulsatile pump. Regardless of how the soft palate moves, both hypothesised cases describe a constriction to
the flow in either the oral or nasal passages and an expansion in the other. This constriction may cause flow
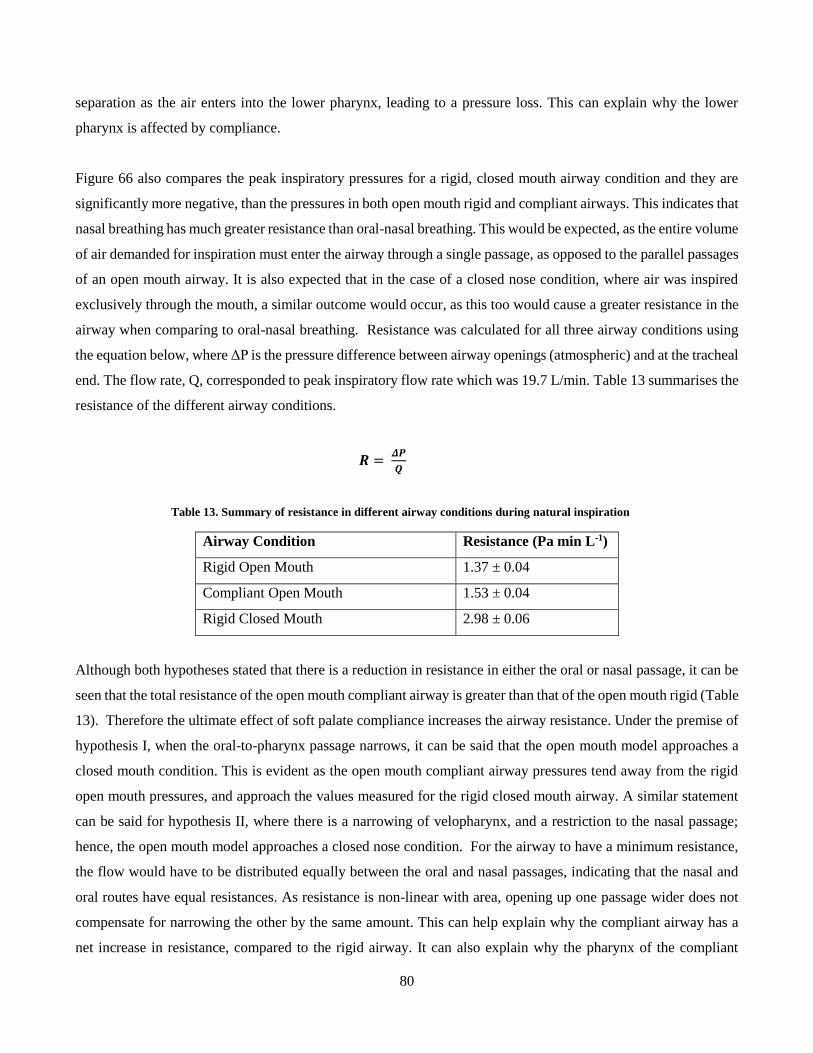
80
separation as the air enters into the lower pharynx, leading to a pressure loss. This can explain why the lower
pharynx is affected by compliance.
Figure 66 also compares the peak inspiratory pressures for a rigid, closed mouth airway condition and they are
significantly more negative, than the pressures in both open mouth rigid and compliant airways. This indicates that
nasal breathing has much greater resistance than oral-nasal breathing. This would be expected, as the entire volume
of air demanded for inspiration must enter the airway through a single passage, as opposed to the parallel passages
of an open mouth airway. It is also expected that in the case of a closed nose condition, where air was inspired
exclusively through the mouth, a similar outcome would occur, as this too would cause a greater resistance in the
airway when comparing to oral-nasal breathing. Resistance was calculated for all three airway conditions using
the equation below, where ΔP is the pressure difference between airway openings (atmospheric) and at the tracheal
end. The flow rate, Q, corresponded to peak inspiratory flow rate which was 19.7 L/min. Table 13 summarises the
resistance of the different airway conditions.
𝑹 = 𝜟𝑷
𝑸
Table 13. Summary of resistance in different airway conditions during natural inspiration
Airway Condition Resistance (Pa min L-1)
Rigid Open Mouth 1.37 ± 0.04
Compliant Open Mouth 1.53 ± 0.04
Rigid Closed Mouth 2.98 ± 0.06
Although both hypotheses stated that there is a reduction in resistance in either the oral or nasal passage, it can be
seen that the total resistance of the open mouth compliant airway is greater than that of the open mouth rigid (Table
13). Therefore the ultimate effect of soft palate compliance increases the airway resistance. Under the premise of
hypothesis I, when the oral-to-pharynx passage narrows, it can be said that the open mouth model approaches a
closed mouth condition. This is evident as the open mouth compliant airway pressures tend away from the rigid
open mouth pressures, and approach the values measured for the rigid closed mouth airway. A similar statement
can be said for hypothesis II, where there is a narrowing of velopharynx, and a restriction to the nasal passage;
hence, the open mouth model approaches a closed nose condition. For the airway to have a minimum resistance,
the flow would have to be distributed equally between the oral and nasal passages, indicating that the nasal and
oral routes have equal resistances. As resistance is non-linear with area, opening up one passage wider does not
compensate for narrowing the other by the same amount. This can help explain why the compliant airway has a
net increase in resistance, compared to the rigid airway. It can also explain why the pharynx of the compliant
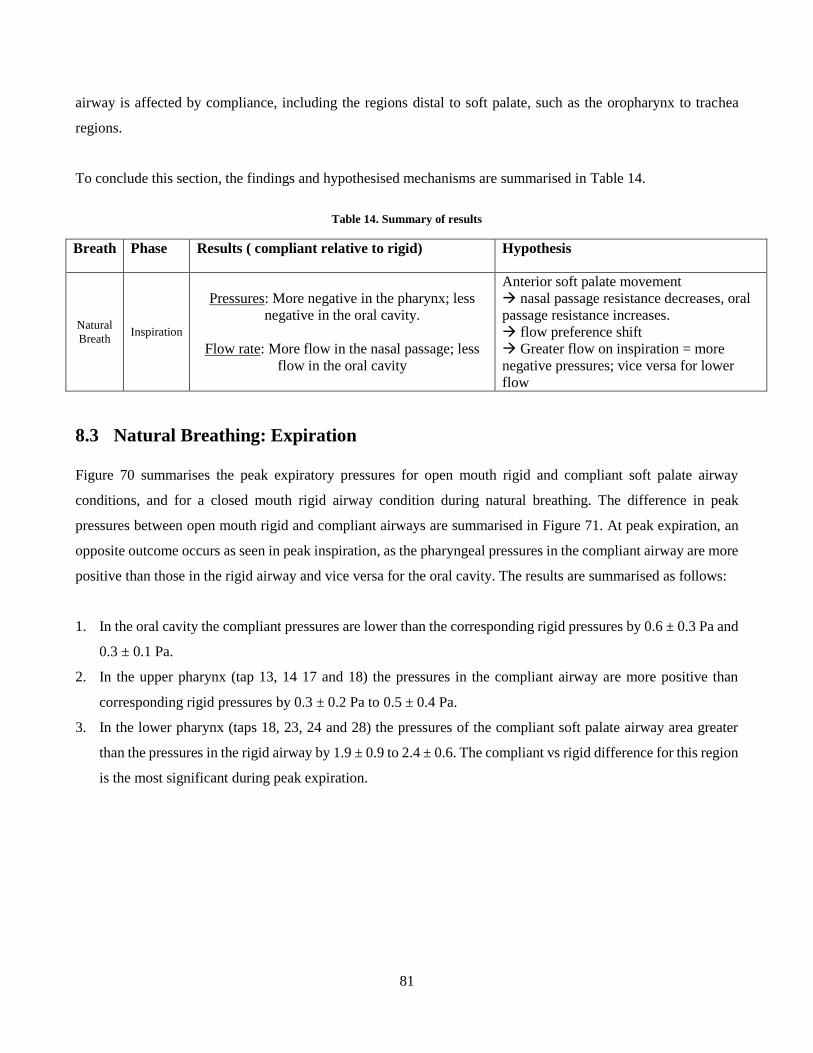
81
airway is affected by compliance, including the regions distal to soft palate, such as the oropharynx to trachea
regions.
To conclude this section, the findings and hypothesised mechanisms are summarised in Table 14.
Table 14. Summary of results
Breath Phase Results ( compliant relative to rigid) Hypothesis
Natural
Breath Inspiration
Pressures: More negative in the pharynx; less
negative in the oral cavity.
Flow rate: More flow in the nasal passage; less
flow in the oral cavity
Anterior soft palate movement
nasal passage resistance decreases, oral
passage resistance increases.
flow preference shift
Greater flow on inspiration = more
negative pressures; vice versa for lower
flow
8.3 Natural Breathing: Expiration
Figure 70 summarises the peak expiratory pressures for open mouth rigid and compliant soft palate airway
conditions, and for a closed mouth rigid airway condition during natural breathing. The difference in peak
pressures between open mouth rigid and compliant airways are summarised in Figure 71. At peak expiration, an
opposite outcome occurs as seen in peak inspiration, as the pharyngeal pressures in the compliant airway are more
positive than those in the rigid airway and vice versa for the oral cavity. The results are summarised as follows:
1. In the oral cavity the compliant pressures are lower than the corresponding rigid pressures by 0.6 ± 0.3 Pa and
0.3 ± 0.1 Pa.
2. In the upper pharynx (tap 13, 14 17 and 18) the pressures in the compliant airway are more positive than
corresponding rigid pressures by 0.3 ± 0.2 Pa to 0.5 ± 0.4 Pa.
3. In the lower pharynx (taps 18, 23, 24 and 28) the pressures of the compliant soft palate airway area greater
than the pressures in the rigid airway by 1.9 ± 0.9 to 2.4 ± 0.6. The compliant vs rigid difference for this region
is the most significant during peak expiration.
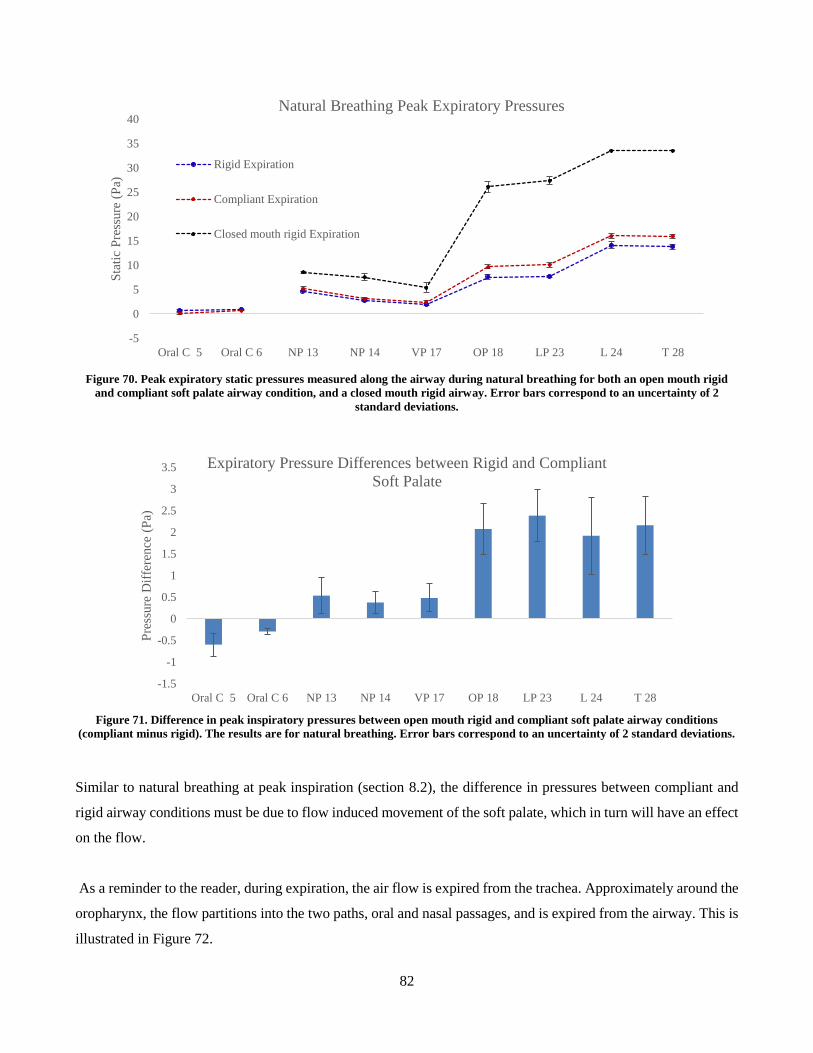
82
Figure 70. Peak expiratory static pressures measured along the airway during natural breathing for both an open mouth rigid
and compliant soft palate airway condition, and a closed mouth rigid airway. Error bars correspond to an uncertainty of 2
standard deviations.
Figure 71. Difference in peak inspiratory pressures between open mouth rigid and compliant soft palate airway conditions
(compliant minus rigid). The results are for natural breathing. Error bars correspond to an uncertainty of 2 standard deviations.
Similar to natural breathing at peak inspiration (section 8.2), the difference in pressures between compliant and
rigid airway conditions must be due to flow induced movement of the soft palate, which in turn will have an effect
on the flow.
As a reminder to the reader, during expiration, the air flow is expired from the trachea. Approximately around the
oropharynx, the flow partitions into the two paths, oral and nasal passages, and is expired from the airway. This is
illustrated in Figure 72.
-5
0
5
10
15
20
25
30
35
40
Oral C 5 Oral C 6 NP 13 NP 14 VP 17 OP 18 LP 23 L 24 T 28
Sta
tic
Pre
ssure
(P
a)Natural Breathing Peak Expiratory Pressures
Rigid Expiration
Compliant Expiration
Closed mouth rigid Expiration
-1.5
-1
-0.5
0
0.5
1
1.5
2
2.5
3
3.5
Oral C 5 Oral C 6 NP 13 NP 14 VP 17 OP 18 LP 23 L 24 T 28
Pre
ssure
Dif
fere
nce
(P
a)
Expiratory Pressure Differences between Rigid and Compliant
Soft Palate
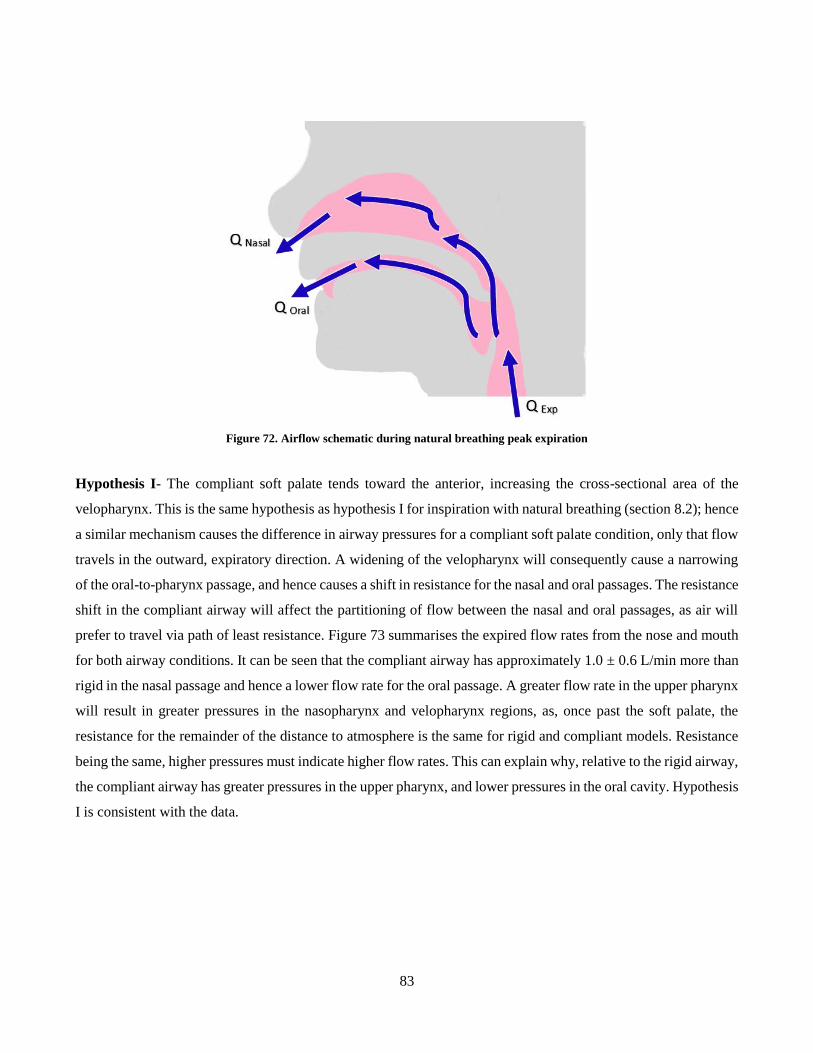
83
Figure 72. Airflow schematic during natural breathing peak expiration
Hypothesis I- The compliant soft palate tends toward the anterior, increasing the cross-sectional area of the
velopharynx. This is the same hypothesis as hypothesis I for inspiration with natural breathing (section 8.2); hence
a similar mechanism causes the difference in airway pressures for a compliant soft palate condition, only that flow
travels in the outward, expiratory direction. A widening of the velopharynx will consequently cause a narrowing
of the oral-to-pharynx passage, and hence causes a shift in resistance for the nasal and oral passages. The resistance
shift in the compliant airway will affect the partitioning of flow between the nasal and oral passages, as air will
prefer to travel via path of least resistance. Figure 73 summarises the expired flow rates from the nose and mouth
for both airway conditions. It can be seen that the compliant airway has approximately 1.0 ± 0.6 L/min more than
rigid in the nasal passage and hence a lower flow rate for the oral passage. A greater flow rate in the upper pharynx
will result in greater pressures in the nasopharynx and velopharynx regions, as, once past the soft palate, the
resistance for the remainder of the distance to atmosphere is the same for rigid and compliant models. Resistance
being the same, higher pressures must indicate higher flow rates. This can explain why, relative to the rigid airway,
the compliant airway has greater pressures in the upper pharynx, and lower pressures in the oral cavity. Hypothesis
I is consistent with the data.
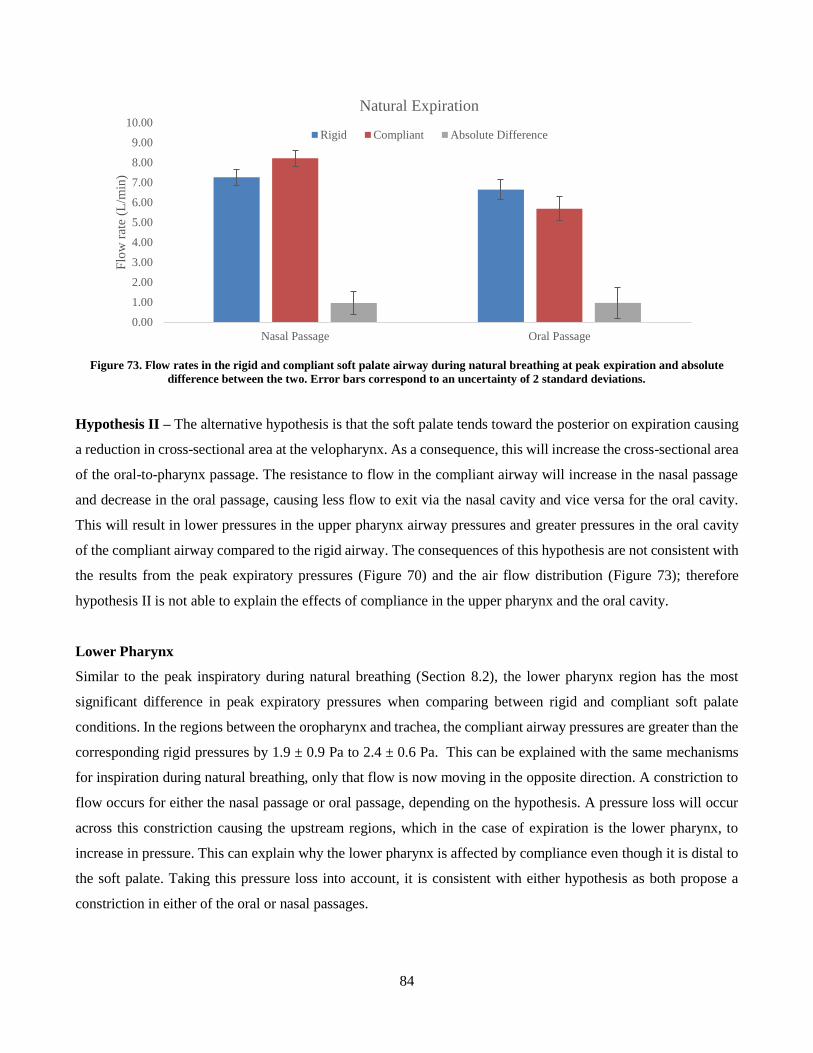
84
Figure 73. Flow rates in the rigid and compliant soft palate airway during natural breathing at peak expiration and absolute
difference between the two. Error bars correspond to an uncertainty of 2 standard deviations.
Hypothesis II – The alternative hypothesis is that the soft palate tends toward the posterior on expiration causing
a reduction in cross-sectional area at the velopharynx. As a consequence, this will increase the cross-sectional area
of the oral-to-pharynx passage. The resistance to flow in the compliant airway will increase in the nasal passage
and decrease in the oral passage, causing less flow to exit via the nasal cavity and vice versa for the oral cavity.
This will result in lower pressures in the upper pharynx airway pressures and greater pressures in the oral cavity
of the compliant airway compared to the rigid airway. The consequences of this hypothesis are not consistent with
the results from the peak expiratory pressures (Figure 70) and the air flow distribution (Figure 73); therefore
hypothesis II is not able to explain the effects of compliance in the upper pharynx and the oral cavity.
Lower Pharynx
Similar to the peak inspiratory during natural breathing (Section 8.2), the lower pharynx region has the most
significant difference in peak expiratory pressures when comparing between rigid and compliant soft palate
conditions. In the regions between the oropharynx and trachea, the compliant airway pressures are greater than the
corresponding rigid pressures by 1.9 ± 0.9 Pa to 2.4 ± 0.6 Pa. This can be explained with the same mechanisms
for inspiration during natural breathing, only that flow is now moving in the opposite direction. A constriction to
flow occurs for either the nasal passage or oral passage, depending on the hypothesis. A pressure loss will occur
across this constriction causing the upstream regions, which in the case of expiration is the lower pharynx, to
increase in pressure. This can explain why the lower pharynx is affected by compliance even though it is distal to
the soft palate. Taking this pressure loss into account, it is consistent with either hypothesis as both propose a
constriction in either of the oral or nasal passages.
0.00
1.00
2.00
3.00
4.00
5.00
6.00
7.00
8.00
9.00
10.00
Nasal Passage Oral Passage
Flo
w r
ate
(L/m
in)
Natural Expiration
Rigid Compliant Absolute Difference
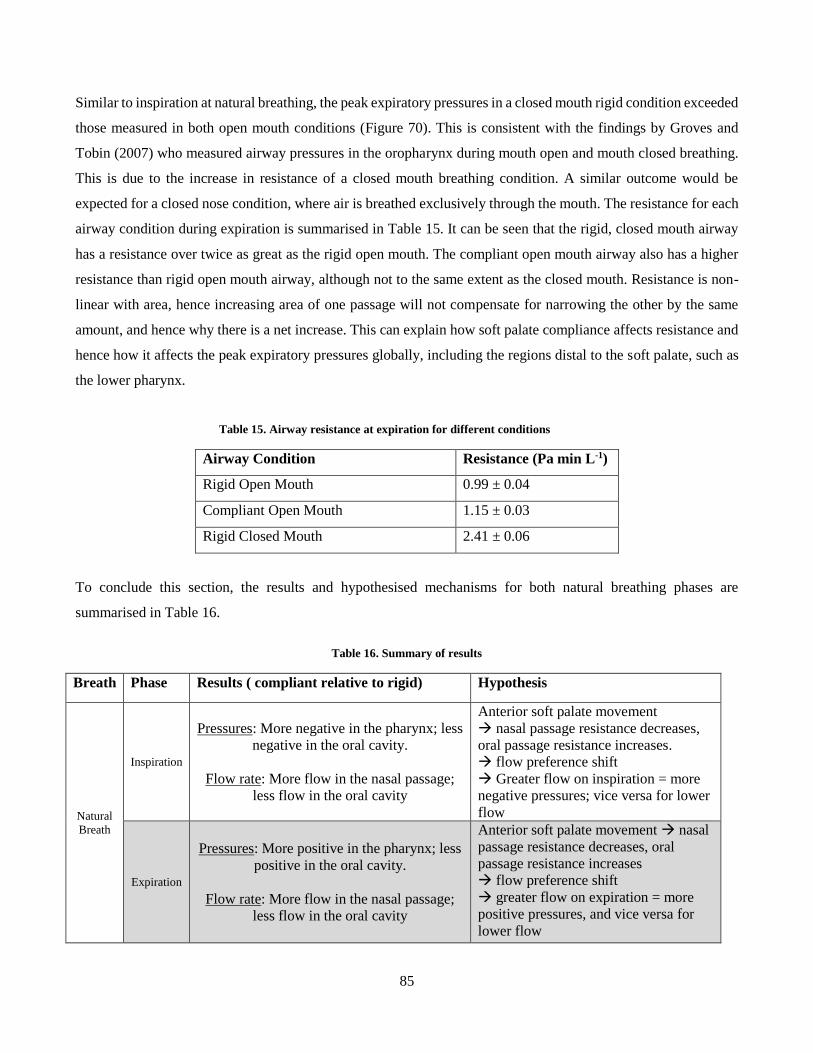
85
Similar to inspiration at natural breathing, the peak expiratory pressures in a closed mouth rigid condition exceeded
those measured in both open mouth conditions (Figure 70). This is consistent with the findings by Groves and
Tobin (2007) who measured airway pressures in the oropharynx during mouth open and mouth closed breathing.
This is due to the increase in resistance of a closed mouth breathing condition. A similar outcome would be
expected for a closed nose condition, where air is breathed exclusively through the mouth. The resistance for each
airway condition during expiration is summarised in Table 15. It can be seen that the rigid, closed mouth airway
has a resistance over twice as great as the rigid open mouth. The compliant open mouth airway also has a higher
resistance than rigid open mouth airway, although not to the same extent as the closed mouth. Resistance is non-
linear with area, hence increasing area of one passage will not compensate for narrowing the other by the same
amount, and hence why there is a net increase. This can explain how soft palate compliance affects resistance and
hence how it affects the peak expiratory pressures globally, including the regions distal to the soft palate, such as
the lower pharynx.
Table 15. Airway resistance at expiration for different conditions
Airway Condition Resistance (Pa min L-1)
Rigid Open Mouth 0.99 ± 0.04
Compliant Open Mouth 1.15 ± 0.03
Rigid Closed Mouth 2.41 ± 0.06
To conclude this section, the results and hypothesised mechanisms for both natural breathing phases are
summarised in Table 16.
Table 16. Summary of results
Breath Phase Results ( compliant relative to rigid) Hypothesis
Natural
Breath
Inspiration
Pressures: More negative in the pharynx; less
negative in the oral cavity.
Flow rate: More flow in the nasal passage;
less flow in the oral cavity
Anterior soft palate movement
nasal passage resistance decreases,
oral passage resistance increases.
flow preference shift
Greater flow on inspiration = more
negative pressures; vice versa for lower
flow
Expiration
Pressures: More positive in the pharynx; less
positive in the oral cavity.
Flow rate: More flow in the nasal passage;
less flow in the oral cavity
Anterior soft palate movement nasal
passage resistance decreases, oral
passage resistance increases
flow preference shift
greater flow on expiration = more
positive pressures, and vice versa for
lower flow
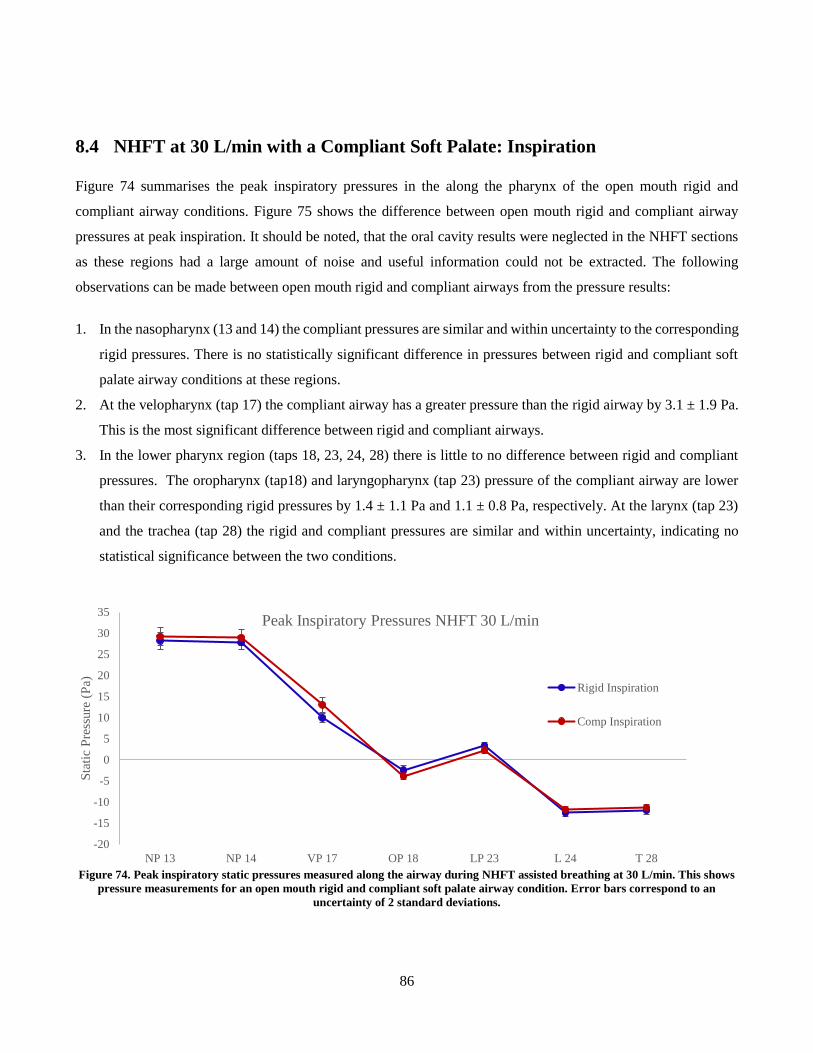
86
8.4 NHFT at 30 L/min with a Compliant Soft Palate: Inspiration
Figure 74 summarises the peak inspiratory pressures in the along the pharynx of the open mouth rigid and
compliant airway conditions. Figure 75 shows the difference between open mouth rigid and compliant airway
pressures at peak inspiration. It should be noted, that the oral cavity results were neglected in the NHFT sections
as these regions had a large amount of noise and useful information could not be extracted. The following
observations can be made between open mouth rigid and compliant airways from the pressure results:
1. In the nasopharynx (13 and 14) the compliant pressures are similar and within uncertainty to the corresponding
rigid pressures. There is no statistically significant difference in pressures between rigid and compliant soft
palate airway conditions at these regions.
2. At the velopharynx (tap 17) the compliant airway has a greater pressure than the rigid airway by 3.1 ± 1.9 Pa.
This is the most significant difference between rigid and compliant airways.
3. In the lower pharynx region (taps 18, 23, 24, 28) there is little to no difference between rigid and compliant
pressures. The oropharynx (tap18) and laryngopharynx (tap 23) pressure of the compliant airway are lower
than their corresponding rigid pressures by 1.4 ± 1.1 Pa and 1.1 ± 0.8 Pa, respectively. At the larynx (tap 23)
and the trachea (tap 28) the rigid and compliant pressures are similar and within uncertainty, indicating no
statistical significance between the two conditions.
Figure 74. Peak inspiratory static pressures measured along the airway during NHFT assisted breathing at 30 L/min. This shows
pressure measurements for an open mouth rigid and compliant soft palate airway condition. Error bars correspond to an
uncertainty of 2 standard deviations.
-20
-15
-10
-5
0
5
10
15
20
25
30
35
NP 13 NP 14 VP 17 OP 18 LP 23 L 24 T 28
Sta
tic
Pre
ssure
(P
a)
Peak Inspiratory Pressures NHFT 30 L/min
Rigid Inspiration
Comp Inspiration
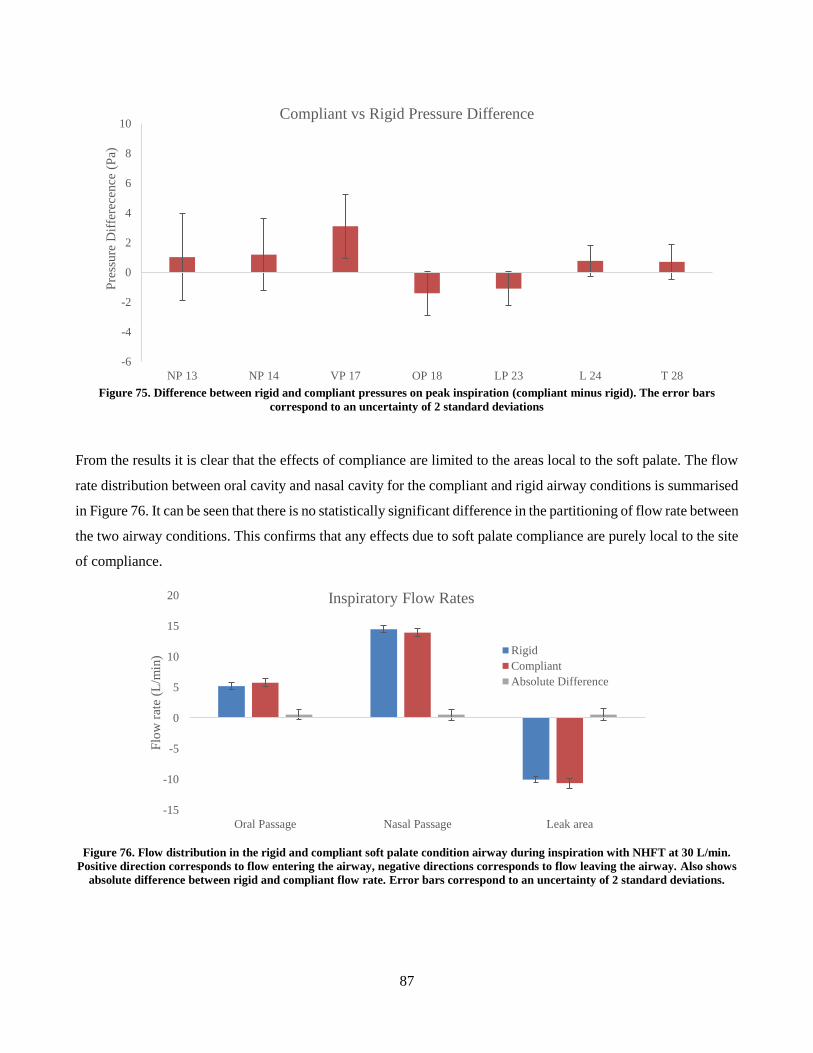
87
Figure 75. Difference between rigid and compliant pressures on peak inspiration (compliant minus rigid). The error bars
correspond to an uncertainty of 2 standard deviations
From the results it is clear that the effects of compliance are limited to the areas local to the soft palate. The flow
rate distribution between oral cavity and nasal cavity for the compliant and rigid airway conditions is summarised
in Figure 76. It can be seen that there is no statistically significant difference in the partitioning of flow rate between
the two airway conditions. This confirms that any effects due to soft palate compliance are purely local to the site
of compliance.
Figure 76. Flow distribution in the rigid and compliant soft palate condition airway during inspiration with NHFT at 30 L/min.
Positive direction corresponds to flow entering the airway, negative directions corresponds to flow leaving the airway. Also shows
absolute difference between rigid and compliant flow rate. Error bars correspond to an uncertainty of 2 standard deviations.
-6
-4
-2
0
2
4
6
8
10
NP 13 NP 14 VP 17 OP 18 LP 23 L 24 T 28
Pre
ssure
Dif
fere
cence
(P
a)Compliant vs Rigid Pressure Difference
-15
-10
-5
0
5
10
15
20
Oral Passage Nasal Passage Leak area
Flo
w r
ate
(L/m
in)
Inspiratory Flow Rates
Rigid
Compliant
Absolute Difference
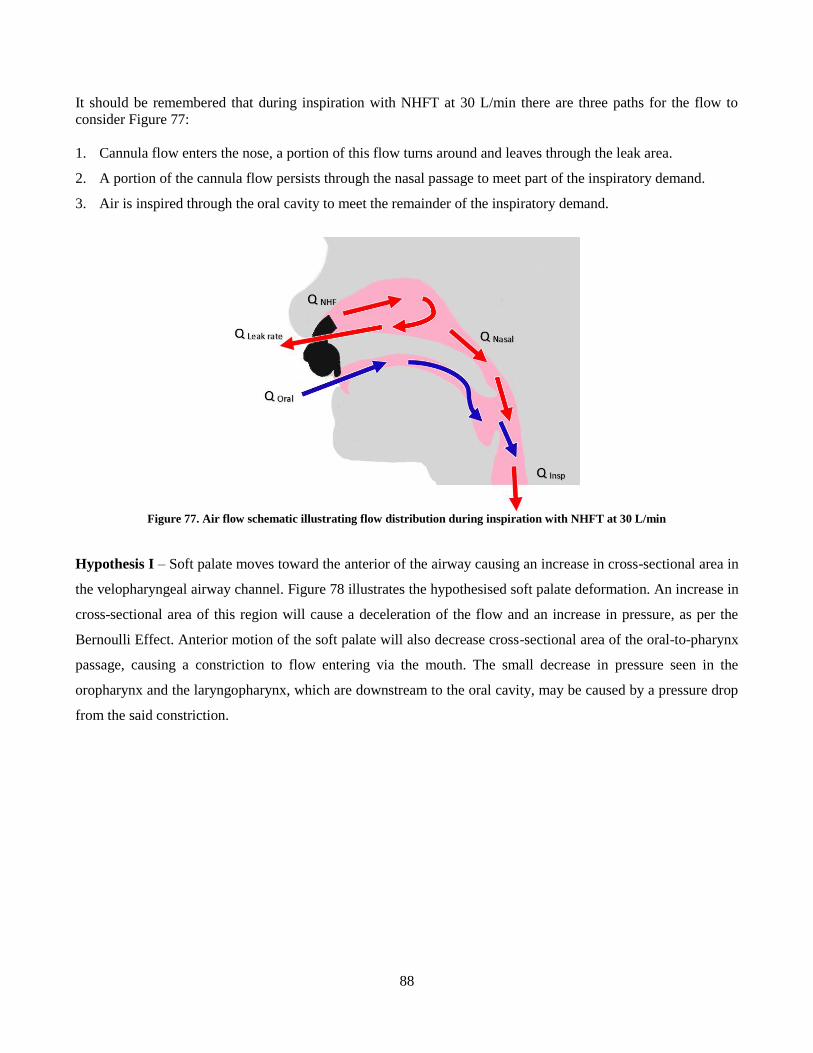
88
It should be remembered that during inspiration with NHFT at 30 L/min there are three paths for the flow to
consider Figure 77:
1. Cannula flow enters the nose, a portion of this flow turns around and leaves through the leak area.
2. A portion of the cannula flow persists through the nasal passage to meet part of the inspiratory demand.
3. Air is inspired through the oral cavity to meet the remainder of the inspiratory demand.
Figure 77. Air flow schematic illustrating flow distribution during inspiration with NHFT at 30 L/min
Hypothesis I – Soft palate moves toward the anterior of the airway causing an increase in cross-sectional area in
the velopharyngeal airway channel. Figure 78 illustrates the hypothesised soft palate deformation. An increase in
cross-sectional area of this region will cause a deceleration of the flow and an increase in pressure, as per the
Bernoulli Effect. Anterior motion of the soft palate will also decrease cross-sectional area of the oral-to-pharynx
passage, causing a constriction to flow entering via the mouth. The small decrease in pressure seen in the
oropharynx and the laryngopharynx, which are downstream to the oral cavity, may be caused by a pressure drop
from the said constriction.
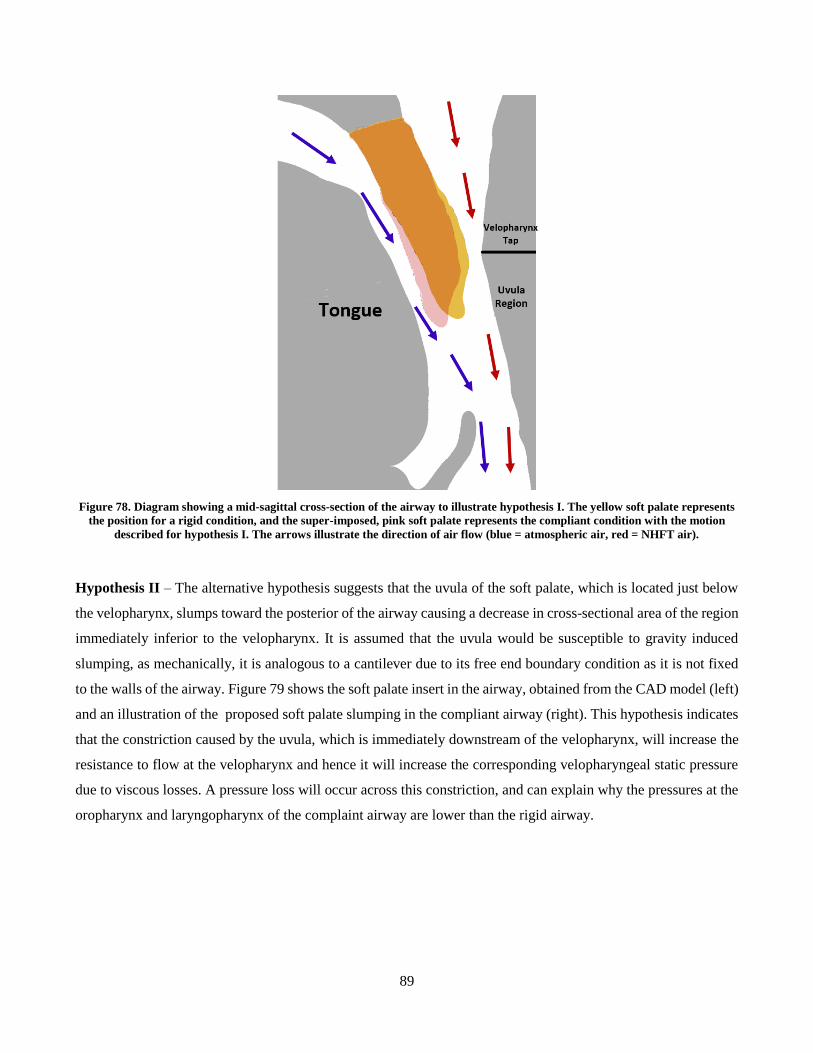
89
Figure 78. Diagram showing a mid-sagittal cross-section of the airway to illustrate hypothesis I. The yellow soft palate represents
the position for a rigid condition, and the super-imposed, pink soft palate represents the compliant condition with the motion
described for hypothesis I. The arrows illustrate the direction of air flow (blue = atmospheric air, red = NHFT air).
Hypothesis II – The alternative hypothesis suggests that the uvula of the soft palate, which is located just below
the velopharynx, slumps toward the posterior of the airway causing a decrease in cross-sectional area of the region
immediately inferior to the velopharynx. It is assumed that the uvula would be susceptible to gravity induced
slumping, as mechanically, it is analogous to a cantilever due to its free end boundary condition as it is not fixed
to the walls of the airway. Figure 79 shows the soft palate insert in the airway, obtained from the CAD model (left)
and an illustration of the proposed soft palate slumping in the compliant airway (right). This hypothesis indicates
that the constriction caused by the uvula, which is immediately downstream of the velopharynx, will increase the
resistance to flow at the velopharynx and hence it will increase the corresponding velopharyngeal static pressure
due to viscous losses. A pressure loss will occur across this constriction, and can explain why the pressures at the
oropharynx and laryngopharynx of the complaint airway are lower than the rigid airway.
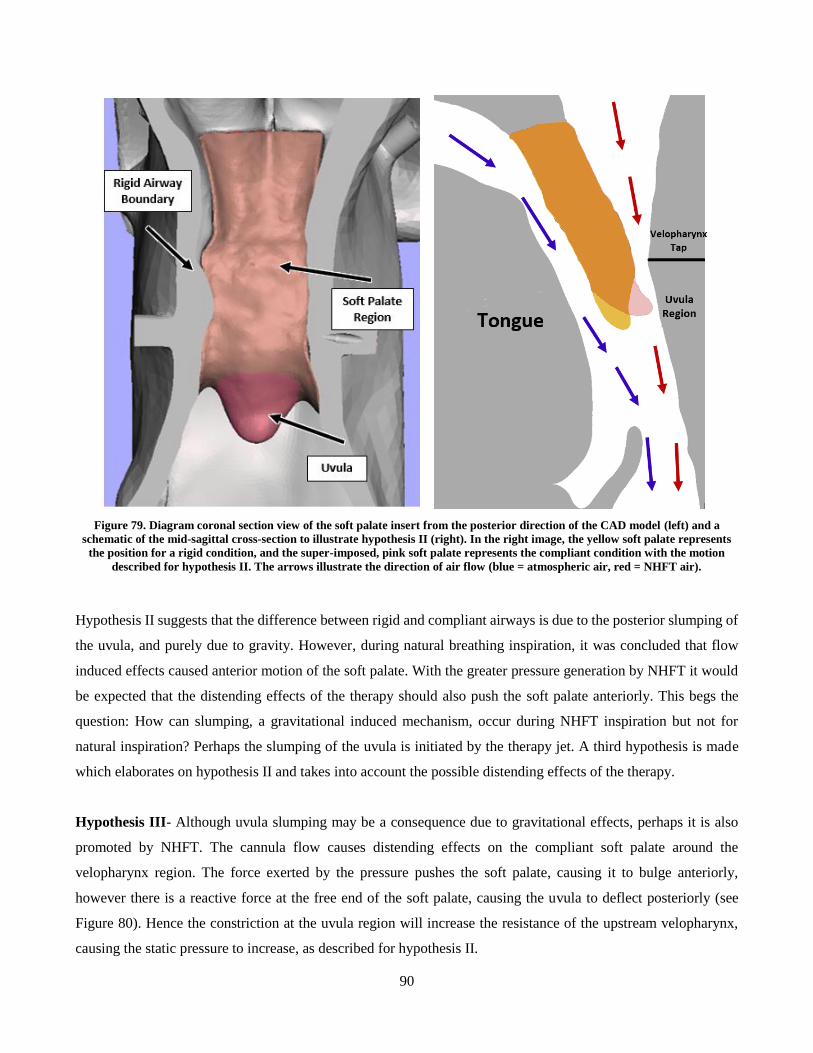
90
Figure 79. Diagram coronal section view of the soft palate insert from the posterior direction of the CAD model (left) and a
schematic of the mid-sagittal cross-section to illustrate hypothesis II (right). In the right image, the yellow soft palate represents
the position for a rigid condition, and the super-imposed, pink soft palate represents the compliant condition with the motion
described for hypothesis II. The arrows illustrate the direction of air flow (blue = atmospheric air, red = NHFT air).
Hypothesis II suggests that the difference between rigid and compliant airways is due to the posterior slumping of
the uvula, and purely due to gravity. However, during natural breathing inspiration, it was concluded that flow
induced effects caused anterior motion of the soft palate. With the greater pressure generation by NHFT it would
be expected that the distending effects of the therapy should also push the soft palate anteriorly. This begs the
question: How can slumping, a gravitational induced mechanism, occur during NHFT inspiration but not for
natural inspiration? Perhaps the slumping of the uvula is initiated by the therapy jet. A third hypothesis is made
which elaborates on hypothesis II and takes into account the possible distending effects of the therapy.
Hypothesis III- Although uvula slumping may be a consequence due to gravitational effects, perhaps it is also
promoted by NHFT. The cannula flow causes distending effects on the compliant soft palate around the
velopharynx region. The force exerted by the pressure pushes the soft palate, causing it to bulge anteriorly,
however there is a reactive force at the free end of the soft palate, causing the uvula to deflect posteriorly (see
Figure 80). Hence the constriction at the uvula region will increase the resistance of the upstream velopharynx,
causing the static pressure to increase, as described for hypothesis II.
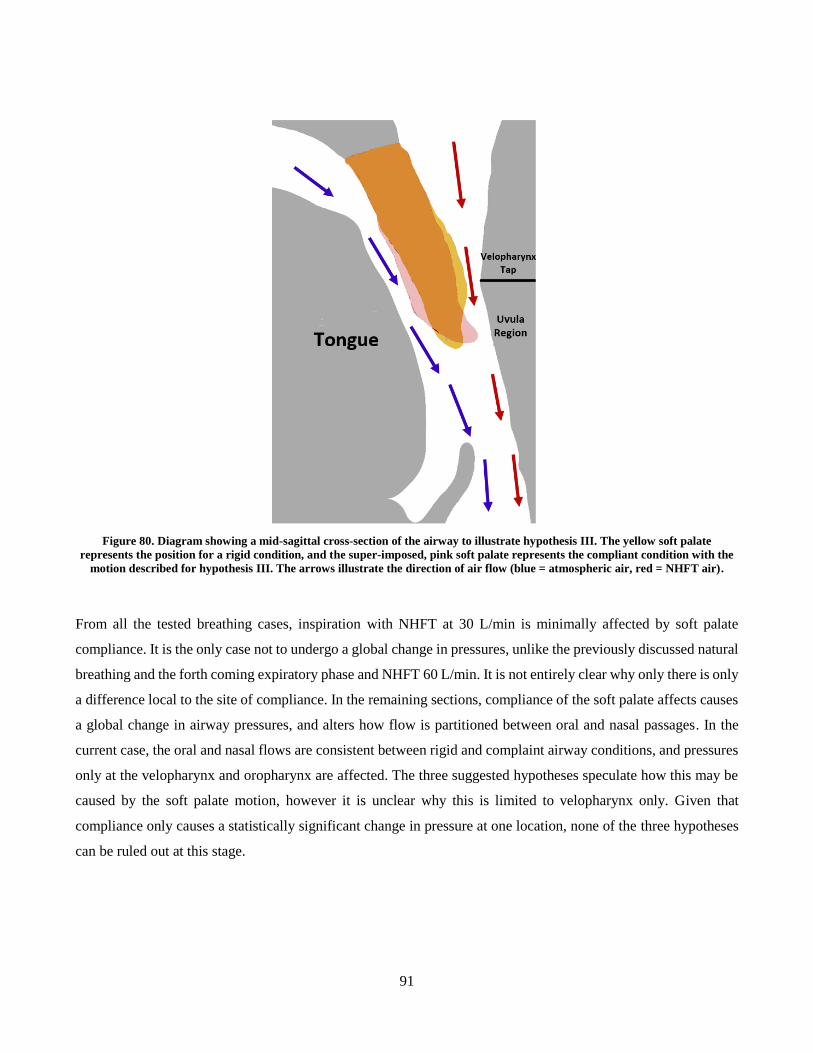
91
Figure 80. Diagram showing a mid-sagittal cross-section of the airway to illustrate hypothesis III. The yellow soft palate
represents the position for a rigid condition, and the super-imposed, pink soft palate represents the compliant condition with the
motion described for hypothesis III. The arrows illustrate the direction of air flow (blue = atmospheric air, red = NHFT air).
From all the tested breathing cases, inspiration with NHFT at 30 L/min is minimally affected by soft palate
compliance. It is the only case not to undergo a global change in pressures, unlike the previously discussed natural
breathing and the forth coming expiratory phase and NHFT 60 L/min. It is not entirely clear why only there is only
a difference local to the site of compliance. In the remaining sections, compliance of the soft palate affects causes
a global change in airway pressures, and alters how flow is partitioned between oral and nasal passages. In the
current case, the oral and nasal flows are consistent between rigid and complaint airway conditions, and pressures
only at the velopharynx and oropharynx are affected. The three suggested hypotheses speculate how this may be
caused by the soft palate motion, however it is unclear why this is limited to velopharynx only. Given that
compliance only causes a statistically significant change in pressure at one location, none of the three hypotheses
can be ruled out at this stage.
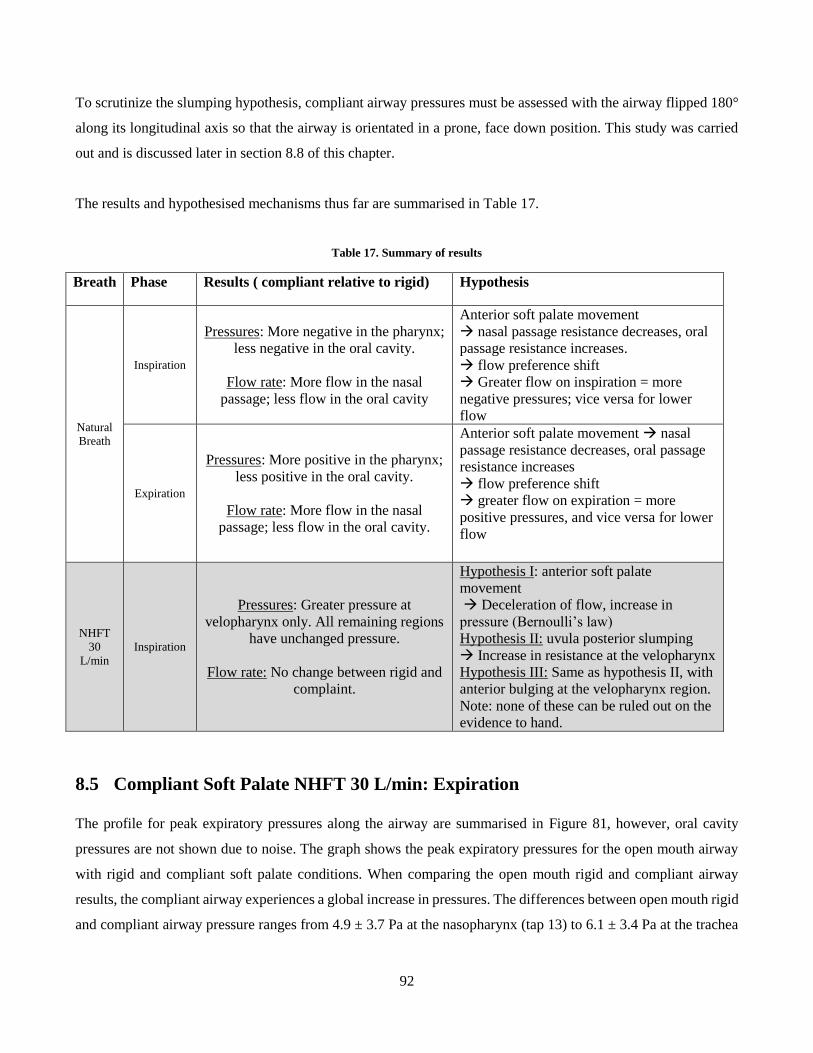
92
To scrutinize the slumping hypothesis, compliant airway pressures must be assessed with the airway flipped 180°
along its longitudinal axis so that the airway is orientated in a prone, face down position. This study was carried
out and is discussed later in section 8.8 of this chapter.
The results and hypothesised mechanisms thus far are summarised in Table 17.
Table 17. Summary of results
Breath Phase Results ( compliant relative to rigid) Hypothesis
Natural
Breath
Inspiration
Pressures: More negative in the pharynx;
less negative in the oral cavity.
Flow rate: More flow in the nasal
passage; less flow in the oral cavity
Anterior soft palate movement
nasal passage resistance decreases, oral
passage resistance increases.
flow preference shift
Greater flow on inspiration = more
negative pressures; vice versa for lower
flow
Expiration
Pressures: More positive in the pharynx;
less positive in the oral cavity.
Flow rate: More flow in the nasal
passage; less flow in the oral cavity.
Anterior soft palate movement nasal
passage resistance decreases, oral passage
resistance increases
flow preference shift
greater flow on expiration = more
positive pressures, and vice versa for lower
flow
NHFT
30
L/min
Inspiration
Pressures: Greater pressure at
velopharynx only. All remaining regions
have unchanged pressure.
Flow rate: No change between rigid and
complaint.
Hypothesis I: anterior soft palate
movement
Deceleration of flow, increase in
pressure (Bernoulli’s law)
Hypothesis II: uvula posterior slumping
Increase in resistance at the velopharynx
Hypothesis III: Same as hypothesis II, with
anterior bulging at the velopharynx region.
Note: none of these can be ruled out on the
evidence to hand.
8.5 Compliant Soft Palate NHFT 30 L/min: Expiration
The profile for peak expiratory pressures along the airway are summarised in Figure 81, however, oral cavity
pressures are not shown due to noise. The graph shows the peak expiratory pressures for the open mouth airway
with rigid and compliant soft palate conditions. When comparing the open mouth rigid and compliant airway
results, the compliant airway experiences a global increase in pressures. The differences between open mouth rigid
and compliant airway pressure ranges from 4.9 ± 3.7 Pa at the nasopharynx (tap 13) to 6.1 ± 3.4 Pa at the trachea
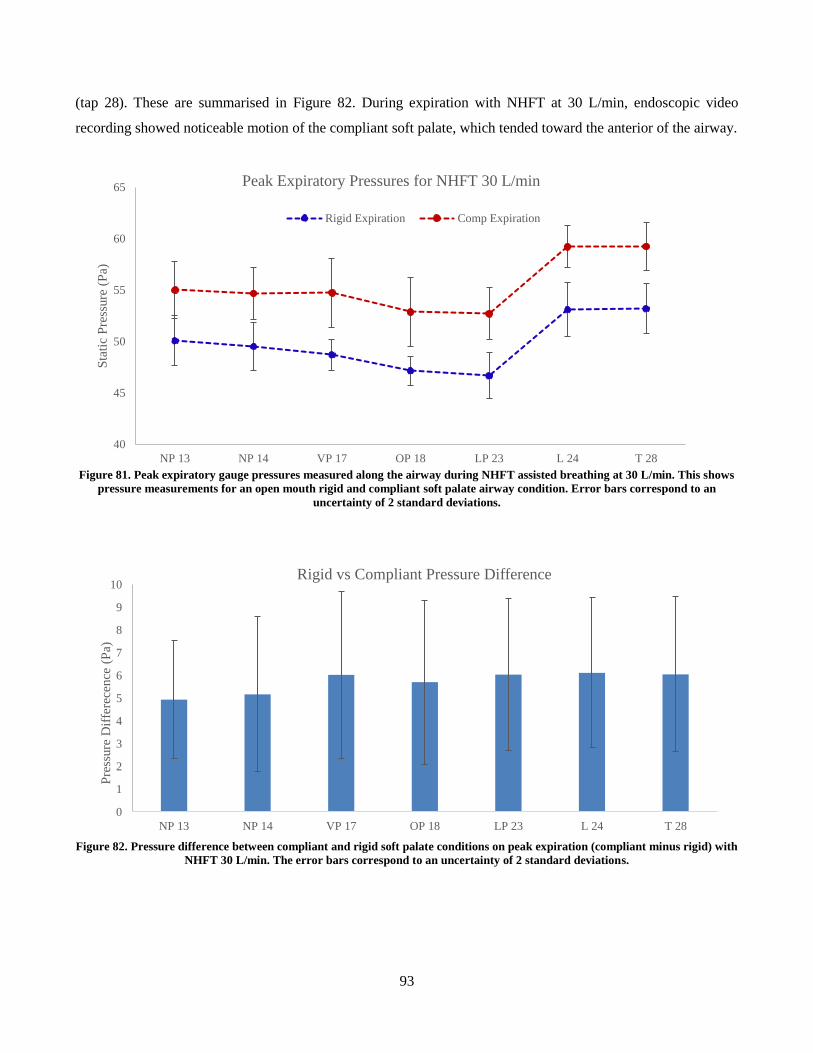
93
(tap 28). These are summarised in Figure 82. During expiration with NHFT at 30 L/min, endoscopic video
recording showed noticeable motion of the compliant soft palate, which tended toward the anterior of the airway.
Figure 81. Peak expiratory gauge pressures measured along the airway during NHFT assisted breathing at 30 L/min. This shows
pressure measurements for an open mouth rigid and compliant soft palate airway condition. Error bars correspond to an
uncertainty of 2 standard deviations.
Figure 82. Pressure difference between compliant and rigid soft palate conditions on peak expiration (compliant minus rigid) with
NHFT 30 L/min. The error bars correspond to an uncertainty of 2 standard deviations.
40
45
50
55
60
65
NP 13 NP 14 VP 17 OP 18 LP 23 L 24 T 28
Sta
tic
Pre
ssure
(P
a)
Peak Expiratory Pressures for NHFT 30 L/min
Rigid Expiration Comp Expiration
0
1
2
3
4
5
6
7
8
9
10
NP 13 NP 14 VP 17 OP 18 LP 23 L 24 T 28
Pre
ssure
Dif
fere
cence
(P
a)
Rigid vs Compliant Pressure Difference
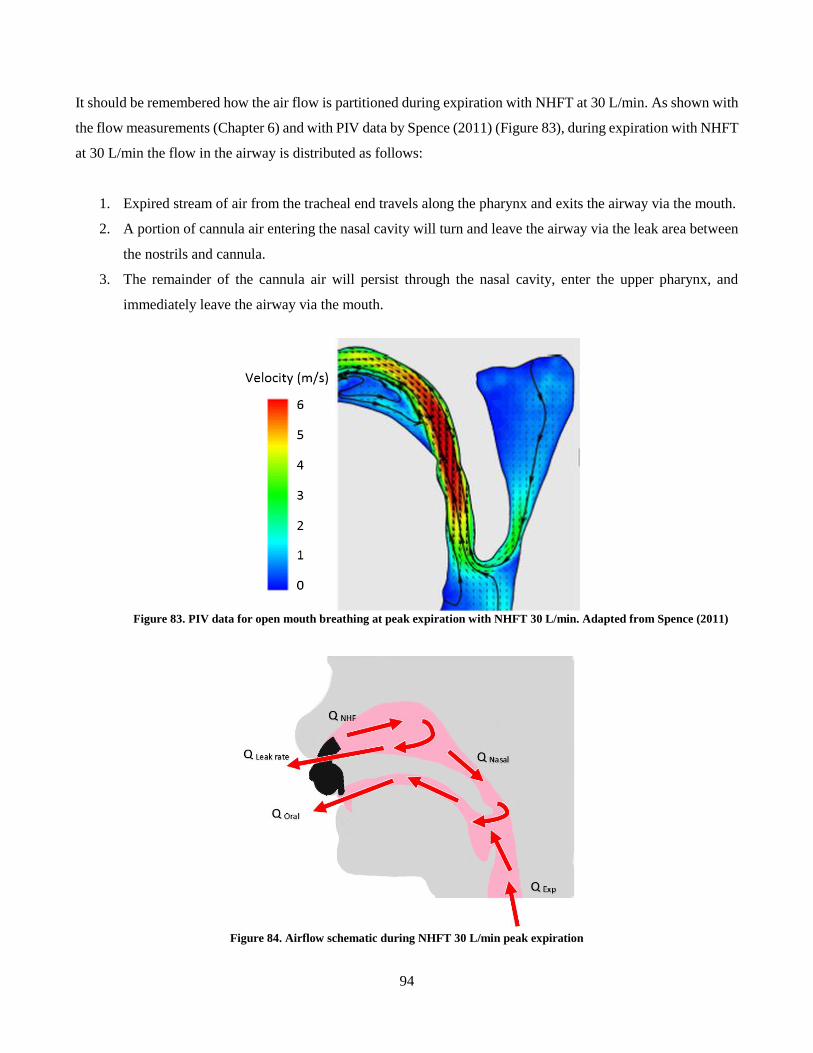
94
It should be remembered how the air flow is partitioned during expiration with NHFT at 30 L/min. As shown with
the flow measurements (Chapter 6) and with PIV data by Spence (2011) (Figure 83), during expiration with NHFT
at 30 L/min the flow in the airway is distributed as follows:
1. Expired stream of air from the tracheal end travels along the pharynx and exits the airway via the mouth.
2. A portion of cannula air entering the nasal cavity will turn and leave the airway via the leak area between
the nostrils and cannula.
3. The remainder of the cannula air will persist through the nasal cavity, enter the upper pharynx, and
immediately leave the airway via the mouth.
Figure 83. PIV data for open mouth breathing at peak expiration with NHFT 30 L/min. Adapted from Spence (2011)
Figure 84. Airflow schematic during NHFT 30 L/min peak expiration
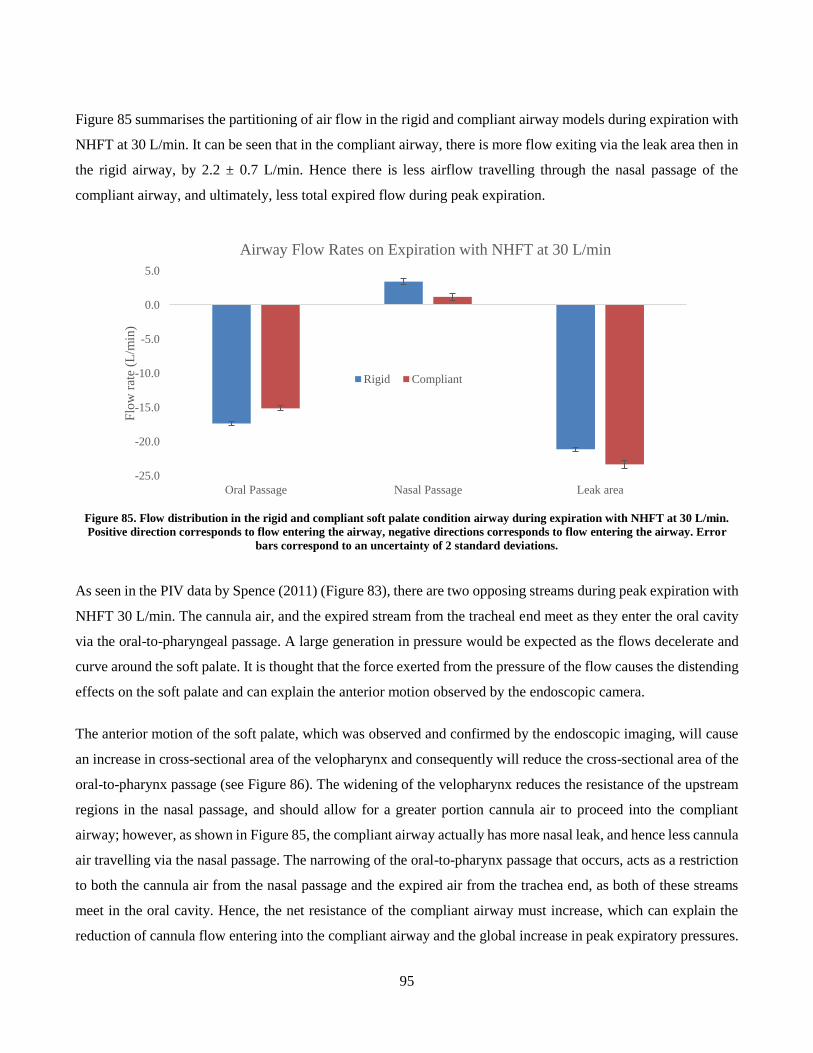
95
Figure 85 summarises the partitioning of air flow in the rigid and compliant airway models during expiration with
NHFT at 30 L/min. It can be seen that in the compliant airway, there is more flow exiting via the leak area then in
the rigid airway, by 2.2 ± 0.7 L/min. Hence there is less airflow travelling through the nasal passage of the
compliant airway, and ultimately, less total expired flow during peak expiration.
Figure 85. Flow distribution in the rigid and compliant soft palate condition airway during expiration with NHFT at 30 L/min.
Positive direction corresponds to flow entering the airway, negative directions corresponds to flow entering the airway. Error
bars correspond to an uncertainty of 2 standard deviations.
As seen in the PIV data by Spence (2011) (Figure 83), there are two opposing streams during peak expiration with
NHFT 30 L/min. The cannula air, and the expired stream from the tracheal end meet as they enter the oral cavity
via the oral-to-pharyngeal passage. A large generation in pressure would be expected as the flows decelerate and
curve around the soft palate. It is thought that the force exerted from the pressure of the flow causes the distending
effects on the soft palate and can explain the anterior motion observed by the endoscopic camera.
The anterior motion of the soft palate, which was observed and confirmed by the endoscopic imaging, will cause
an increase in cross-sectional area of the velopharynx and consequently will reduce the cross-sectional area of the
oral-to-pharynx passage (see Figure 86). The widening of the velopharynx reduces the resistance of the upstream
regions in the nasal passage, and should allow for a greater portion cannula air to proceed into the compliant
airway; however, as shown in Figure 85, the compliant airway actually has more nasal leak, and hence less cannula
air travelling via the nasal passage. The narrowing of the oral-to-pharynx passage that occurs, acts as a restriction
to both the cannula air from the nasal passage and the expired air from the trachea end, as both of these streams
meet in the oral cavity. Hence, the net resistance of the compliant airway must increase, which can explain the
reduction of cannula flow entering into the compliant airway and the global increase in peak expiratory pressures.
-25.0
-20.0
-15.0
-10.0
-5.0
0.0
5.0
Oral Passage Nasal Passage Leak area
Flo
w r
ate
(L/m
in)
Airway Flow Rates on Expiration with NHFT at 30 L/min
Rigid Compliant
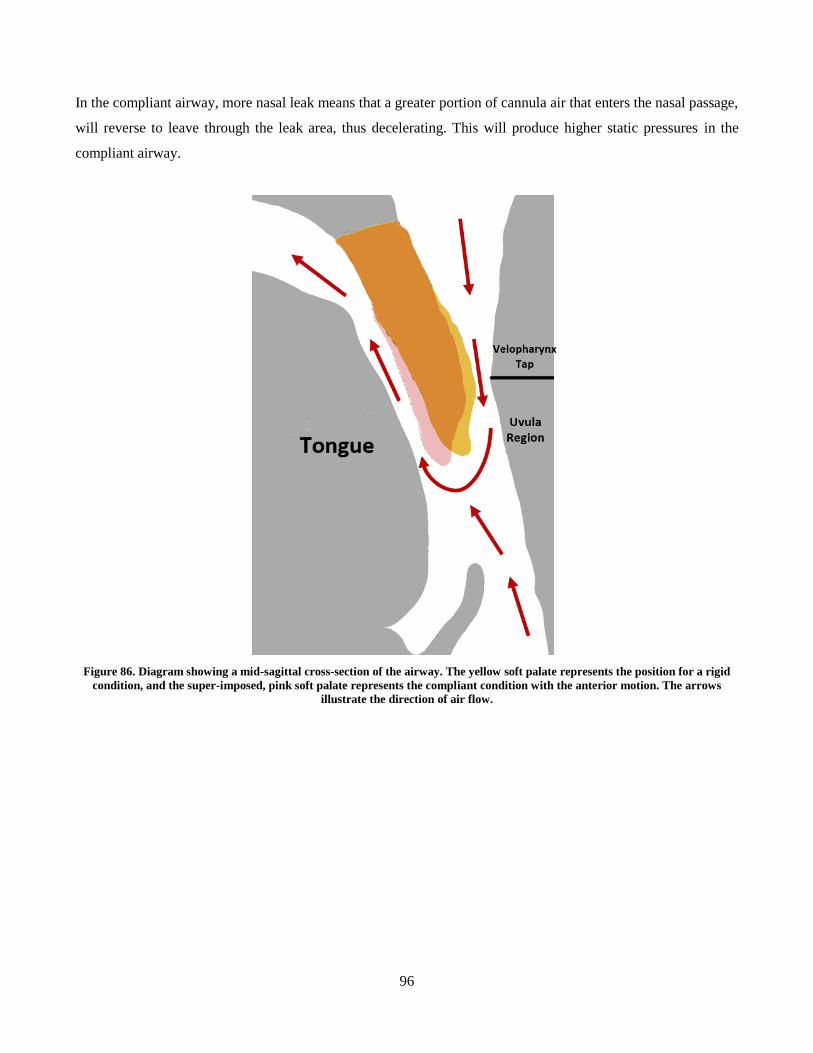
96
In the compliant airway, more nasal leak means that a greater portion of cannula air that enters the nasal passage,
will reverse to leave through the leak area, thus decelerating. This will produce higher static pressures in the
compliant airway.
Figure 86. Diagram showing a mid-sagittal cross-section of the airway. The yellow soft palate represents the position for a rigid
condition, and the super-imposed, pink soft palate represents the compliant condition with the anterior motion. The arrows
illustrate the direction of air flow.
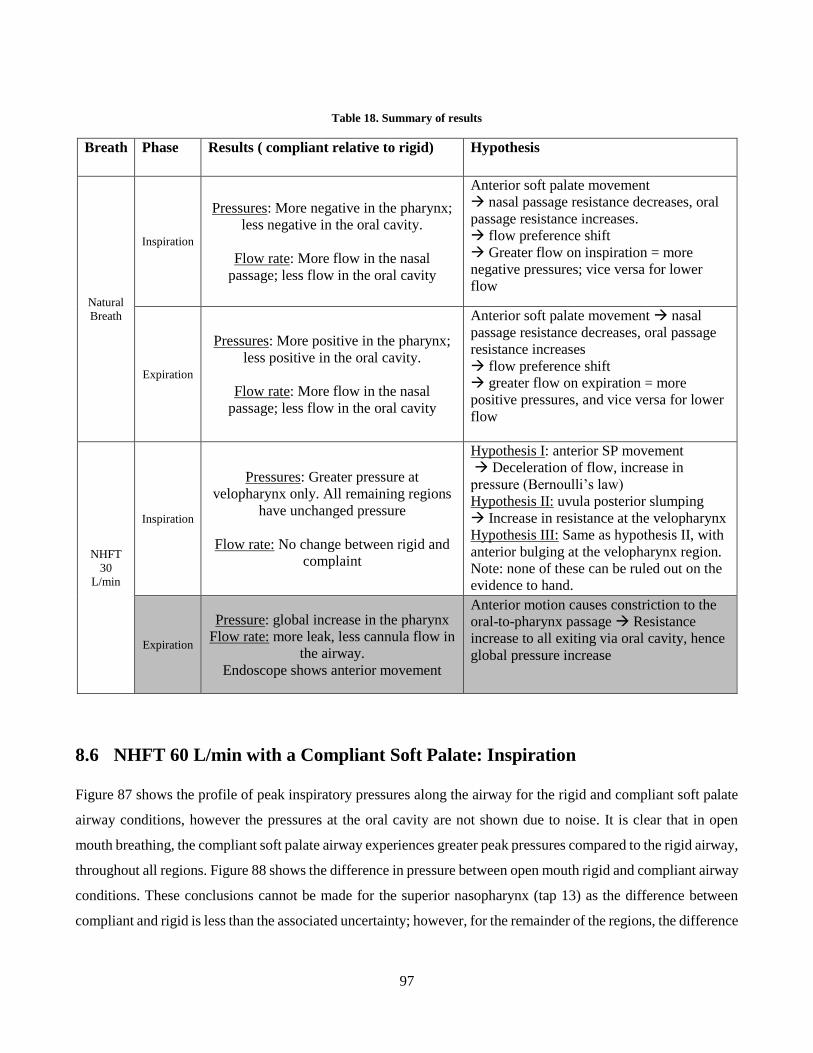
97
Table 18. Summary of results
Breath Phase Results ( compliant relative to rigid) Hypothesis
Natural
Breath
Inspiration
Pressures: More negative in the pharynx;
less negative in the oral cavity.
Flow rate: More flow in the nasal
passage; less flow in the oral cavity
Anterior soft palate movement
nasal passage resistance decreases, oral
passage resistance increases.
flow preference shift
Greater flow on inspiration = more
negative pressures; vice versa for lower
flow
Expiration
Pressures: More positive in the pharynx;
less positive in the oral cavity.
Flow rate: More flow in the nasal
passage; less flow in the oral cavity
Anterior soft palate movement nasal
passage resistance decreases, oral passage
resistance increases
flow preference shift
greater flow on expiration = more
positive pressures, and vice versa for lower
flow
NHFT
30
L/min
Inspiration
Pressures: Greater pressure at
velopharynx only. All remaining regions
have unchanged pressure
Flow rate: No change between rigid and
complaint
Hypothesis I: anterior SP movement
Deceleration of flow, increase in
pressure (Bernoulli’s law)
Hypothesis II: uvula posterior slumping
Increase in resistance at the velopharynx
Hypothesis III: Same as hypothesis II, with
anterior bulging at the velopharynx region.
Note: none of these can be ruled out on the
evidence to hand.
Expiration
Pressure: global increase in the pharynx
Flow rate: more leak, less cannula flow in
the airway.
Endoscope shows anterior movement
Anterior motion causes constriction to the
oral-to-pharynx passage Resistance
increase to all exiting via oral cavity, hence
global pressure increase
8.6 NHFT 60 L/min with a Compliant Soft Palate: Inspiration
Figure 87 shows the profile of peak inspiratory pressures along the airway for the rigid and compliant soft palate
airway conditions, however the pressures at the oral cavity are not shown due to noise. It is clear that in open
mouth breathing, the compliant soft palate airway experiences greater peak pressures compared to the rigid airway,
throughout all regions. Figure 88 shows the difference in pressure between open mouth rigid and compliant airway
conditions. These conclusions cannot be made for the superior nasopharynx (tap 13) as the difference between
compliant and rigid is less than the associated uncertainty; however, for the remainder of the regions, the difference
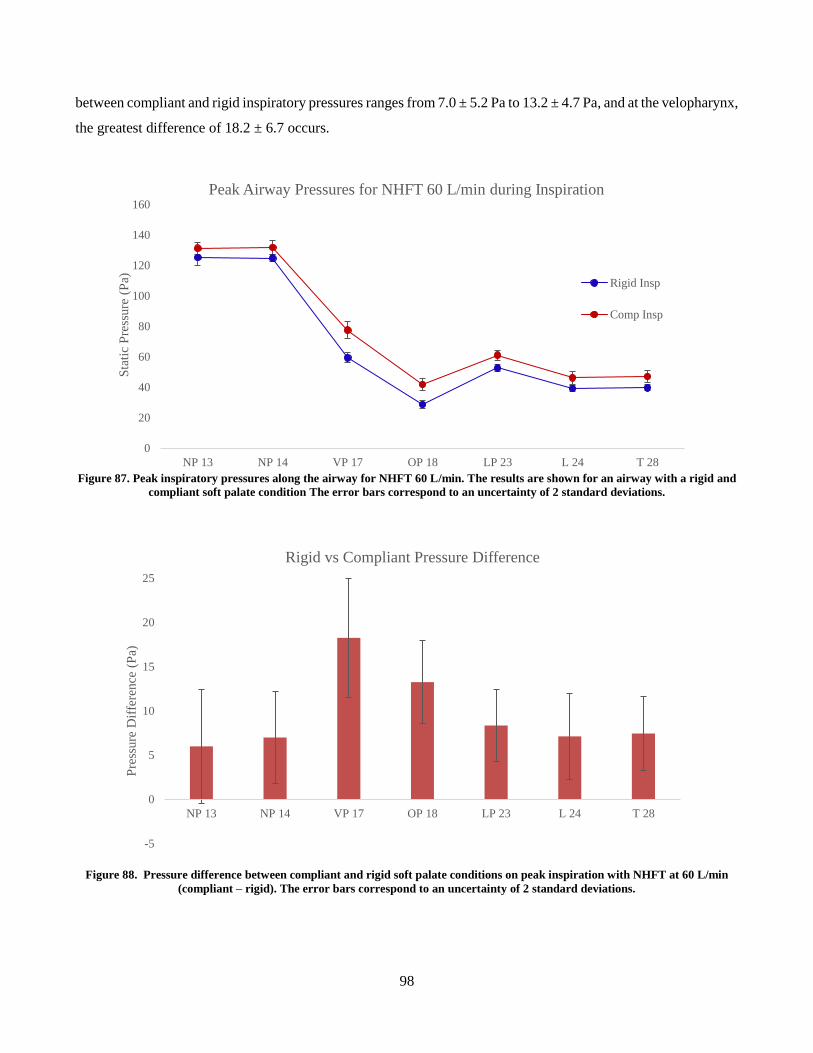
98
between compliant and rigid inspiratory pressures ranges from 7.0 ± 5.2 Pa to 13.2 ± 4.7 Pa, and at the velopharynx,
the greatest difference of 18.2 ± 6.7 occurs.
Figure 87. Peak inspiratory pressures along the airway for NHFT 60 L/min. The results are shown for an airway with a rigid and
compliant soft palate condition The error bars correspond to an uncertainty of 2 standard deviations.
Figure 88. Pressure difference between compliant and rigid soft palate conditions on peak inspiration with NHFT at 60 L/min
(compliant – rigid). The error bars correspond to an uncertainty of 2 standard deviations.
0
20
40
60
80
100
120
140
160
NP 13 NP 14 VP 17 OP 18 LP 23 L 24 T 28
Sta
tic
Pre
ssure
(P
a)
Peak Airway Pressures for NHFT 60 L/min during Inspiration
Rigid Insp
Comp Insp
-5
0
5
10
15
20
25
NP 13 NP 14 VP 17 OP 18 LP 23 L 24 T 28
Pre
ssure
Dif
fere
nce
(P
a)
Rigid vs Compliant Pressure Difference
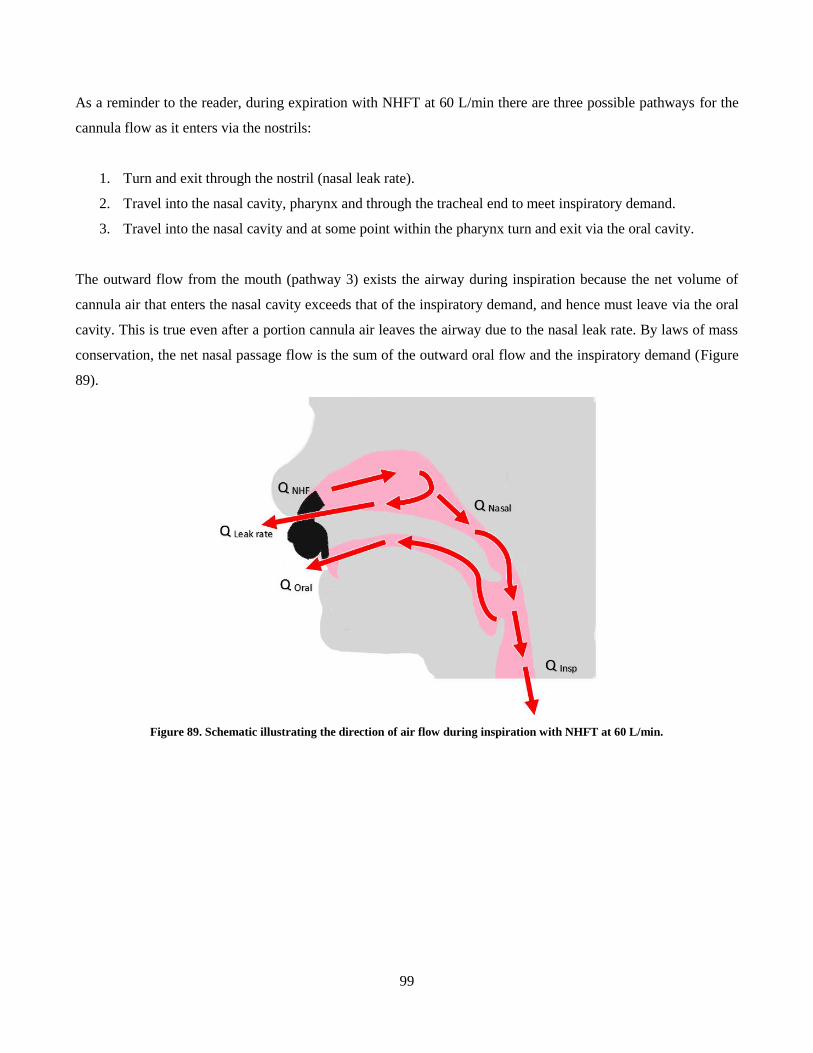
99
As a reminder to the reader, during expiration with NHFT at 60 L/min there are three possible pathways for the
cannula flow as it enters via the nostrils:
1. Turn and exit through the nostril (nasal leak rate).
2. Travel into the nasal cavity, pharynx and through the tracheal end to meet inspiratory demand.
3. Travel into the nasal cavity and at some point within the pharynx turn and exit via the oral cavity.
The outward flow from the mouth (pathway 3) exists the airway during inspiration because the net volume of
cannula air that enters the nasal cavity exceeds that of the inspiratory demand, and hence must leave via the oral
cavity. This is true even after a portion cannula air leaves the airway due to the nasal leak rate. By laws of mass
conservation, the net nasal passage flow is the sum of the outward oral flow and the inspiratory demand (Figure
89).
Figure 89. Schematic illustrating the direction of air flow during inspiration with NHFT at 60 L/min.
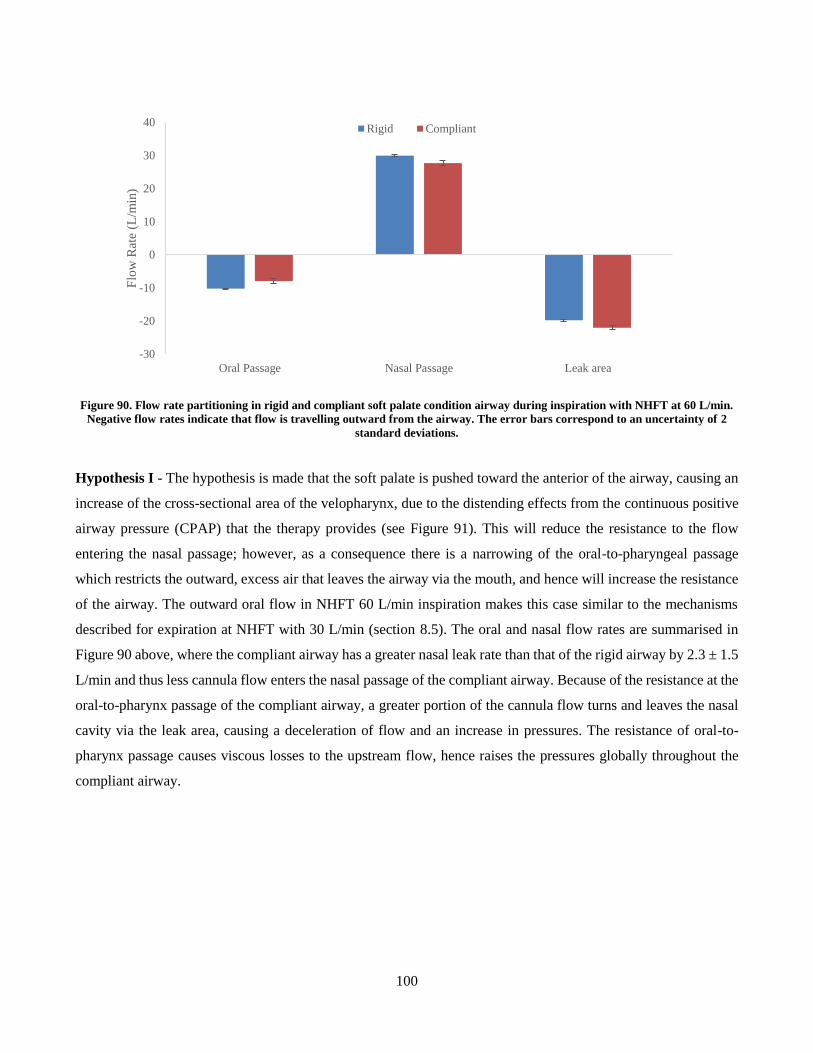
100
Figure 90. Flow rate partitioning in rigid and compliant soft palate condition airway during inspiration with NHFT at 60 L/min.
Negative flow rates indicate that flow is travelling outward from the airway. The error bars correspond to an uncertainty of 2
standard deviations.
Hypothesis I - The hypothesis is made that the soft palate is pushed toward the anterior of the airway, causing an
increase of the cross-sectional area of the velopharynx, due to the distending effects from the continuous positive
airway pressure (CPAP) that the therapy provides (see Figure 91). This will reduce the resistance to the flow
entering the nasal passage; however, as a consequence there is a narrowing of the oral-to-pharyngeal passage
which restricts the outward, excess air that leaves the airway via the mouth, and hence will increase the resistance
of the airway. The outward oral flow in NHFT 60 L/min inspiration makes this case similar to the mechanisms
described for expiration at NHFT with 30 L/min (section 8.5). The oral and nasal flow rates are summarised in
Figure 90 above, where the compliant airway has a greater nasal leak rate than that of the rigid airway by 2.3 ± 1.5
L/min and thus less cannula flow enters the nasal passage of the compliant airway. Because of the resistance at the
oral-to-pharynx passage of the compliant airway, a greater portion of the cannula flow turns and leaves the nasal
cavity via the leak area, causing a deceleration of flow and an increase in pressures. The resistance of oral-to-
pharynx passage causes viscous losses to the upstream flow, hence raises the pressures globally throughout the
compliant airway.
-30
-20
-10
0
10
20
30
40
Oral Passage Nasal Passage Leak area
Flo
w R
ate
(L/m
in)
Rigid Compliant
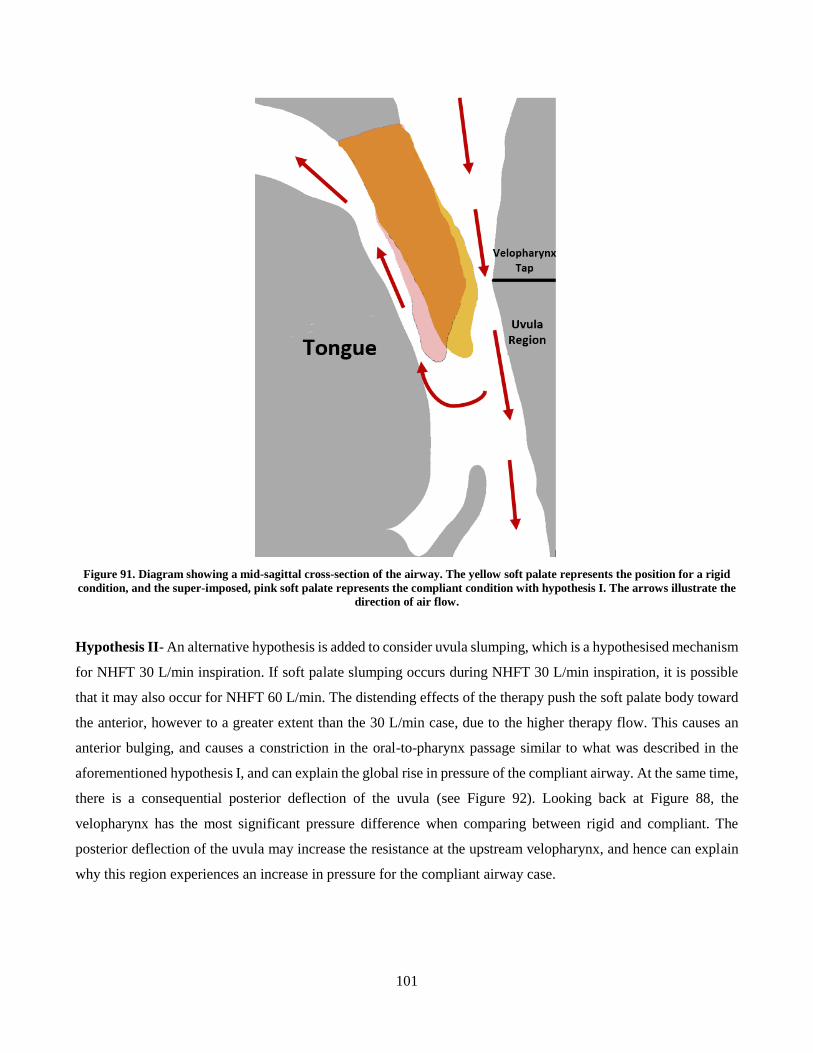
101
Figure 91. Diagram showing a mid-sagittal cross-section of the airway. The yellow soft palate represents the position for a rigid
condition, and the super-imposed, pink soft palate represents the compliant condition with hypothesis I. The arrows illustrate the
direction of air flow.
Hypothesis II- An alternative hypothesis is added to consider uvula slumping, which is a hypothesised mechanism
for NHFT 30 L/min inspiration. If soft palate slumping occurs during NHFT 30 L/min inspiration, it is possible
that it may also occur for NHFT 60 L/min. The distending effects of the therapy push the soft palate body toward
the anterior, however to a greater extent than the 30 L/min case, due to the higher therapy flow. This causes an
anterior bulging, and causes a constriction in the oral-to-pharynx passage similar to what was described in the
aforementioned hypothesis I, and can explain the global rise in pressure of the compliant airway. At the same time,
there is a consequential posterior deflection of the uvula (see Figure 92). Looking back at Figure 88, the
velopharynx has the most significant pressure difference when comparing between rigid and compliant. The
posterior deflection of the uvula may increase the resistance at the upstream velopharynx, and hence can explain
why this region experiences an increase in pressure for the compliant airway case.
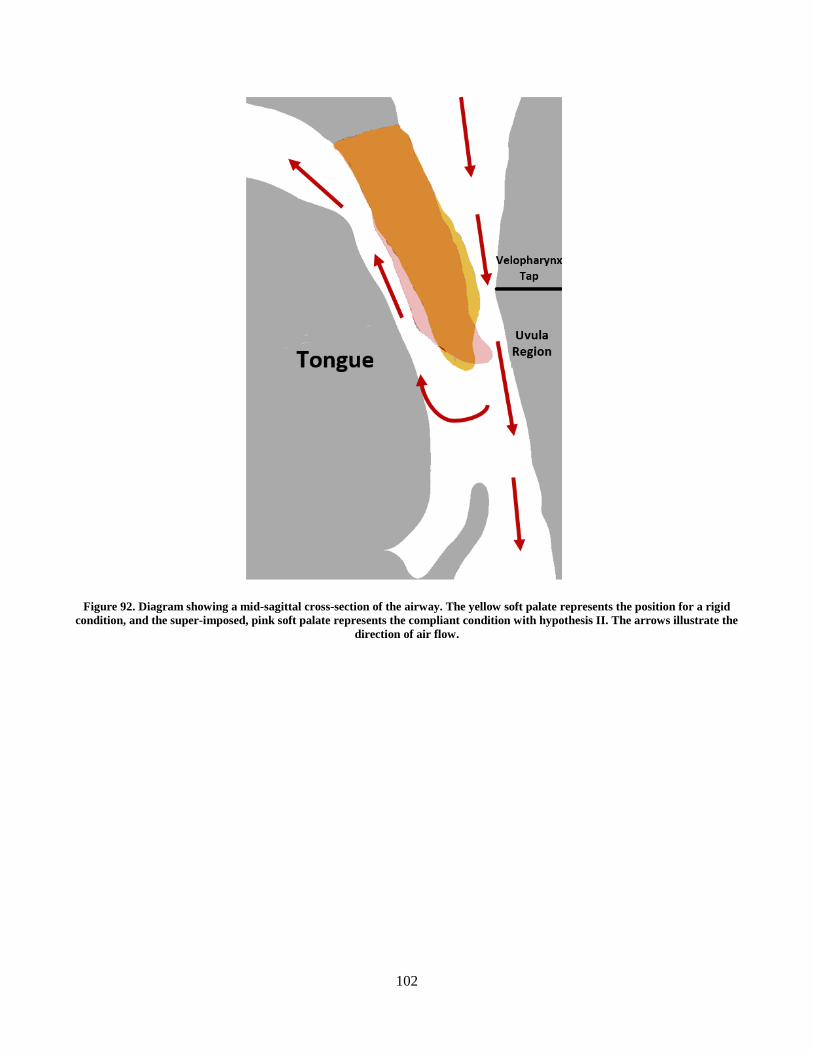
102
Figure 92. Diagram showing a mid-sagittal cross-section of the airway. The yellow soft palate represents the position for a rigid
condition, and the super-imposed, pink soft palate represents the compliant condition with hypothesis II. The arrows illustrate the
direction of air flow.
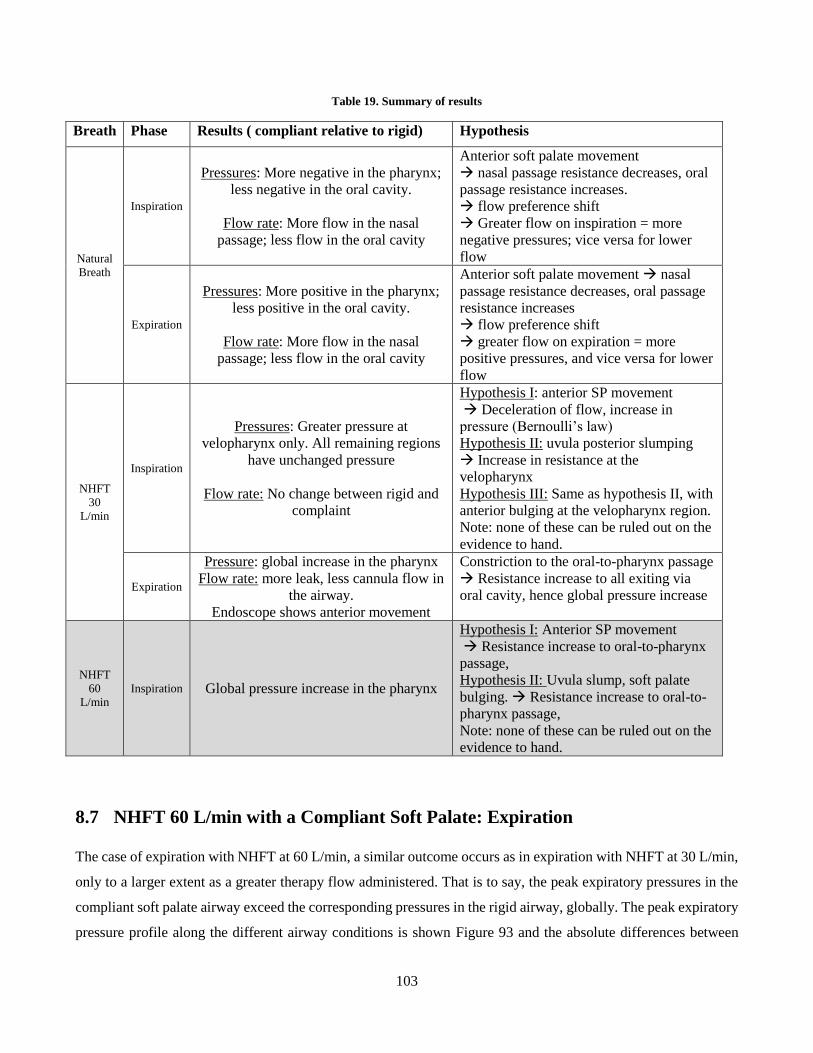
103
Table 19. Summary of results
Breath Phase Results ( compliant relative to rigid) Hypothesis
Natural
Breath
Inspiration
Pressures: More negative in the pharynx;
less negative in the oral cavity.
Flow rate: More flow in the nasal
passage; less flow in the oral cavity
Anterior soft palate movement
nasal passage resistance decreases, oral
passage resistance increases.
flow preference shift
Greater flow on inspiration = more
negative pressures; vice versa for lower
flow
Expiration
Pressures: More positive in the pharynx;
less positive in the oral cavity.
Flow rate: More flow in the nasal
passage; less flow in the oral cavity
Anterior soft palate movement nasal
passage resistance decreases, oral passage
resistance increases
flow preference shift
greater flow on expiration = more
positive pressures, and vice versa for lower
flow
NHFT
30
L/min
Inspiration
Pressures: Greater pressure at
velopharynx only. All remaining regions
have unchanged pressure
Flow rate: No change between rigid and
complaint
Hypothesis I: anterior SP movement
Deceleration of flow, increase in
pressure (Bernoulli’s law)
Hypothesis II: uvula posterior slumping
Increase in resistance at the
velopharynx
Hypothesis III: Same as hypothesis II, with
anterior bulging at the velopharynx region.
Note: none of these can be ruled out on the
evidence to hand.
Expiration
Pressure: global increase in the pharynx
Flow rate: more leak, less cannula flow in
the airway.
Endoscope shows anterior movement
Constriction to the oral-to-pharynx passage
Resistance increase to all exiting via
oral cavity, hence global pressure increase
NHFT
60
L/min
Inspiration Global pressure increase in the pharynx
Hypothesis I: Anterior SP movement
Resistance increase to oral-to-pharynx
passage,
Hypothesis II: Uvula slump, soft palate
bulging. Resistance increase to oral-to-
pharynx passage,
Note: none of these can be ruled out on the
evidence to hand.
8.7 NHFT 60 L/min with a Compliant Soft Palate: Expiration
The case of expiration with NHFT at 60 L/min, a similar outcome occurs as in expiration with NHFT at 30 L/min,
only to a larger extent as a greater therapy flow administered. That is to say, the peak expiratory pressures in the
compliant soft palate airway exceed the corresponding pressures in the rigid airway, globally. The peak expiratory
pressure profile along the different airway conditions is shown Figure 93 and the absolute differences between
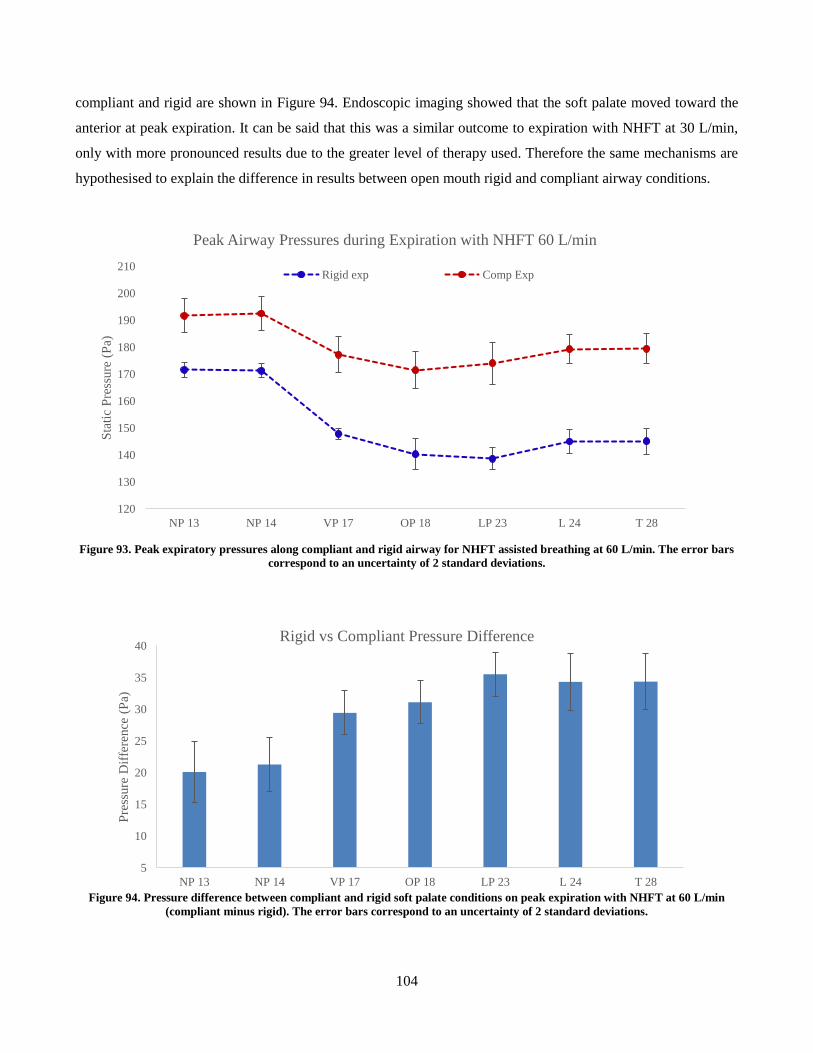
104
compliant and rigid are shown in Figure 94. Endoscopic imaging showed that the soft palate moved toward the
anterior at peak expiration. It can be said that this was a similar outcome to expiration with NHFT at 30 L/min,
only with more pronounced results due to the greater level of therapy used. Therefore the same mechanisms are
hypothesised to explain the difference in results between open mouth rigid and compliant airway conditions.
Figure 93. Peak expiratory pressures along compliant and rigid airway for NHFT assisted breathing at 60 L/min. The error bars
correspond to an uncertainty of 2 standard deviations.
Figure 94. Pressure difference between compliant and rigid soft palate conditions on peak expiration with NHFT at 60 L/min
(compliant minus rigid). The error bars correspond to an uncertainty of 2 standard deviations.
120
130
140
150
160
170
180
190
200
210
NP 13 NP 14 VP 17 OP 18 LP 23 L 24 T 28
Sta
tic
Pre
ssure
(P
a)
Peak Airway Pressures during Expiration with NHFT 60 L/min
Rigid exp Comp Exp
5
10
15
20
25
30
35
40
NP 13 NP 14 VP 17 OP 18 LP 23 L 24 T 28
Pre
ssure
Dif
fere
nce
(P
a)
Rigid vs Compliant Pressure Difference
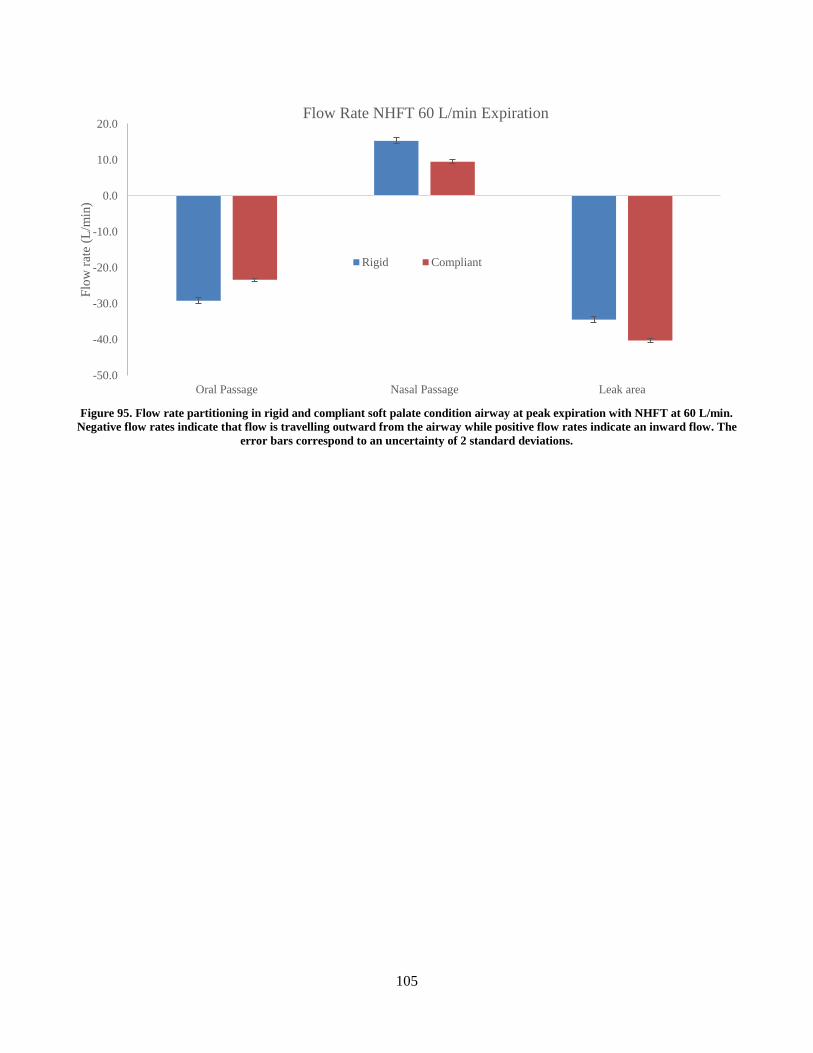
105
Figure 95. Flow rate partitioning in rigid and compliant soft palate condition airway at peak expiration with NHFT at 60 L/min.
Negative flow rates indicate that flow is travelling outward from the airway while positive flow rates indicate an inward flow. The
error bars correspond to an uncertainty of 2 standard deviations.
-50.0
-40.0
-30.0
-20.0
-10.0
0.0
10.0
20.0
Oral Passage Nasal Passage Leak area
Flo
w r
ate
(L/m
in)
Flow Rate NHFT 60 L/min Expiration
Rigid Compliant
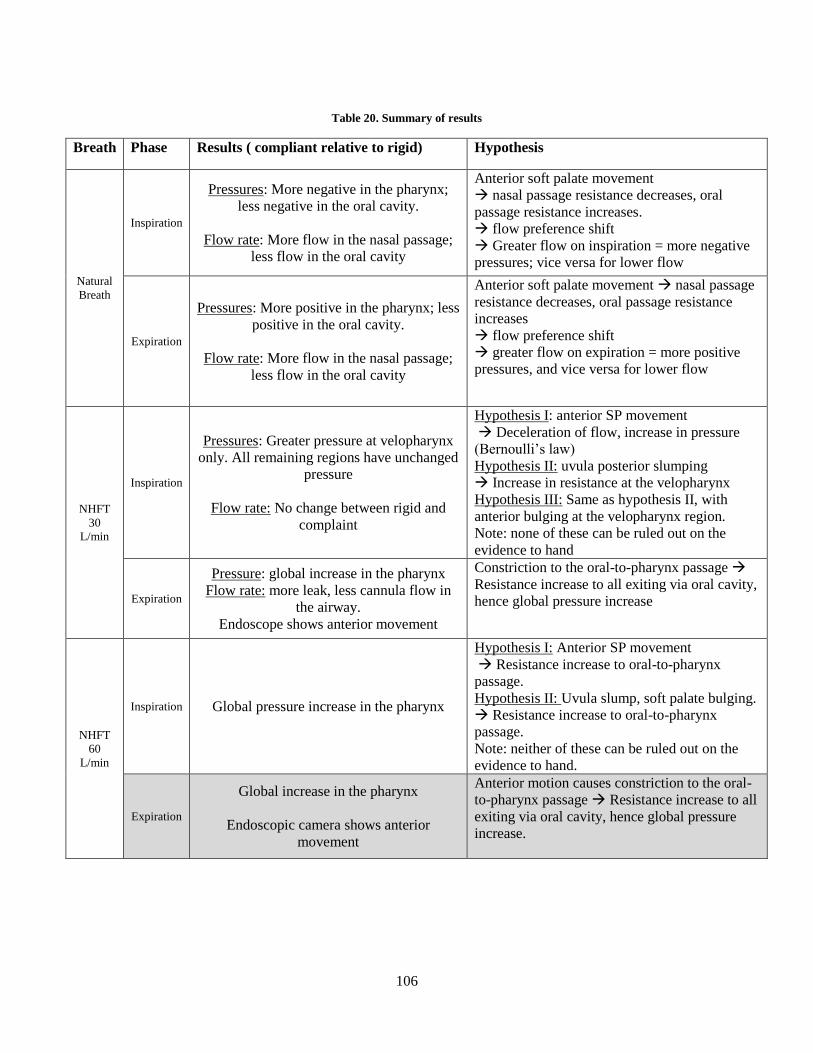
106
Table 20. Summary of results
Breath Phase Results ( compliant relative to rigid) Hypothesis
Natural
Breath
Inspiration
Pressures: More negative in the pharynx;
less negative in the oral cavity.
Flow rate: More flow in the nasal passage;
less flow in the oral cavity
Anterior soft palate movement
nasal passage resistance decreases, oral
passage resistance increases.
flow preference shift
Greater flow on inspiration = more negative
pressures; vice versa for lower flow
Expiration
Pressures: More positive in the pharynx; less
positive in the oral cavity.
Flow rate: More flow in the nasal passage;
less flow in the oral cavity
Anterior soft palate movement nasal passage
resistance decreases, oral passage resistance
increases
flow preference shift
greater flow on expiration = more positive
pressures, and vice versa for lower flow
NHFT
30
L/min
Inspiration
Pressures: Greater pressure at velopharynx
only. All remaining regions have unchanged
pressure
Flow rate: No change between rigid and
complaint
Hypothesis I: anterior SP movement
Deceleration of flow, increase in pressure
(Bernoulli’s law)
Hypothesis II: uvula posterior slumping
Increase in resistance at the velopharynx
Hypothesis III: Same as hypothesis II, with
anterior bulging at the velopharynx region.
Note: none of these can be ruled out on the
evidence to hand
Expiration
Pressure: global increase in the pharynx
Flow rate: more leak, less cannula flow in
the airway.
Endoscope shows anterior movement
Constriction to the oral-to-pharynx passage
Resistance increase to all exiting via oral cavity,
hence global pressure increase
NHFT
60
L/min
Inspiration Global pressure increase in the pharynx
Hypothesis I: Anterior SP movement
Resistance increase to oral-to-pharynx
passage.
Hypothesis II: Uvula slump, soft palate bulging.
Resistance increase to oral-to-pharynx
passage.
Note: neither of these can be ruled out on the
evidence to hand.
Expiration
Global increase in the pharynx
Endoscopic camera shows anterior
movement
Anterior motion causes constriction to the oral-
to-pharynx passage Resistance increase to all
exiting via oral cavity, hence global pressure
increase.
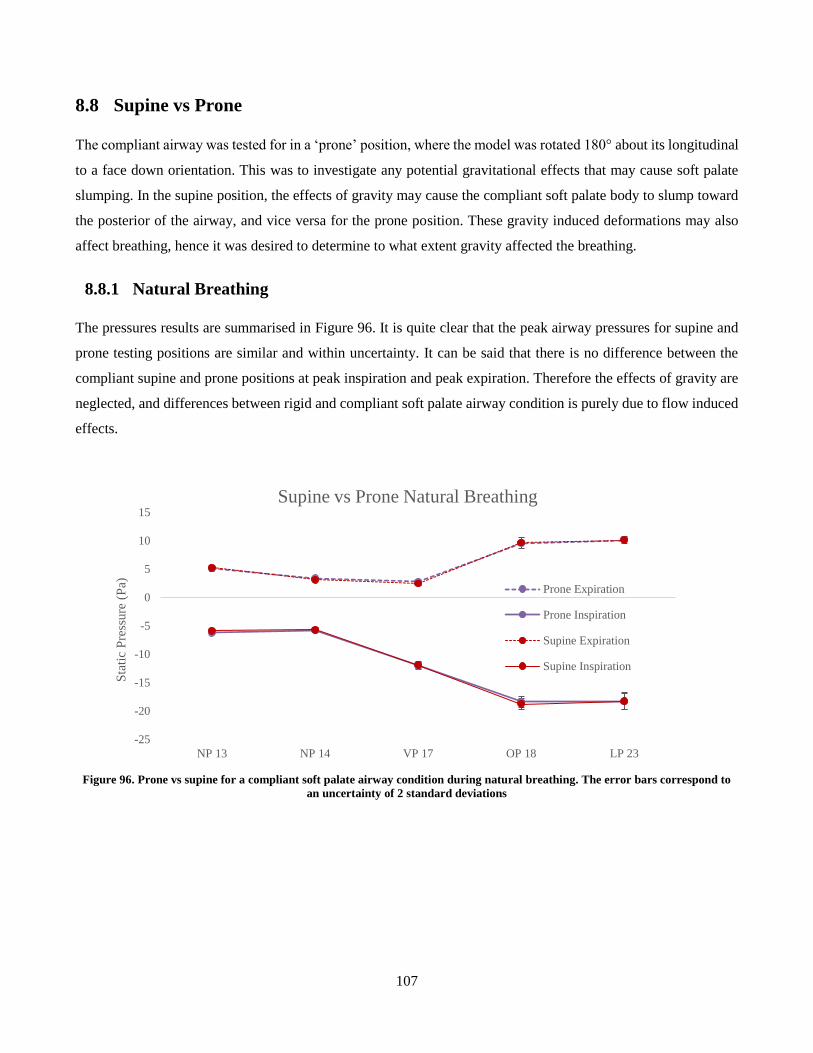
107
8.8 Supine vs Prone
The compliant airway was tested for in a ‘prone’ position, where the model was rotated 180° about its longitudinal
to a face down orientation. This was to investigate any potential gravitational effects that may cause soft palate
slumping. In the supine position, the effects of gravity may cause the compliant soft palate body to slump toward
the posterior of the airway, and vice versa for the prone position. These gravity induced deformations may also
affect breathing, hence it was desired to determine to what extent gravity affected the breathing.
8.8.1 Natural Breathing
The pressures results are summarised in Figure 96. It is quite clear that the peak airway pressures for supine and
prone testing positions are similar and within uncertainty. It can be said that there is no difference between the
compliant supine and prone positions at peak inspiration and peak expiration. Therefore the effects of gravity are
neglected, and differences between rigid and compliant soft palate airway condition is purely due to flow induced
effects.
Figure 96. Prone vs supine for a compliant soft palate airway condition during natural breathing. The error bars correspond to
an uncertainty of 2 standard deviations
-25
-20
-15
-10
-5
0
5
10
15
NP 13 NP 14 VP 17 OP 18 LP 23
Sta
tic
Pre
ssure
(P
a)
Supine vs Prone Natural Breathing
Prone Expiration
Prone Inspiration
Supine Expiration
Supine Inspiration
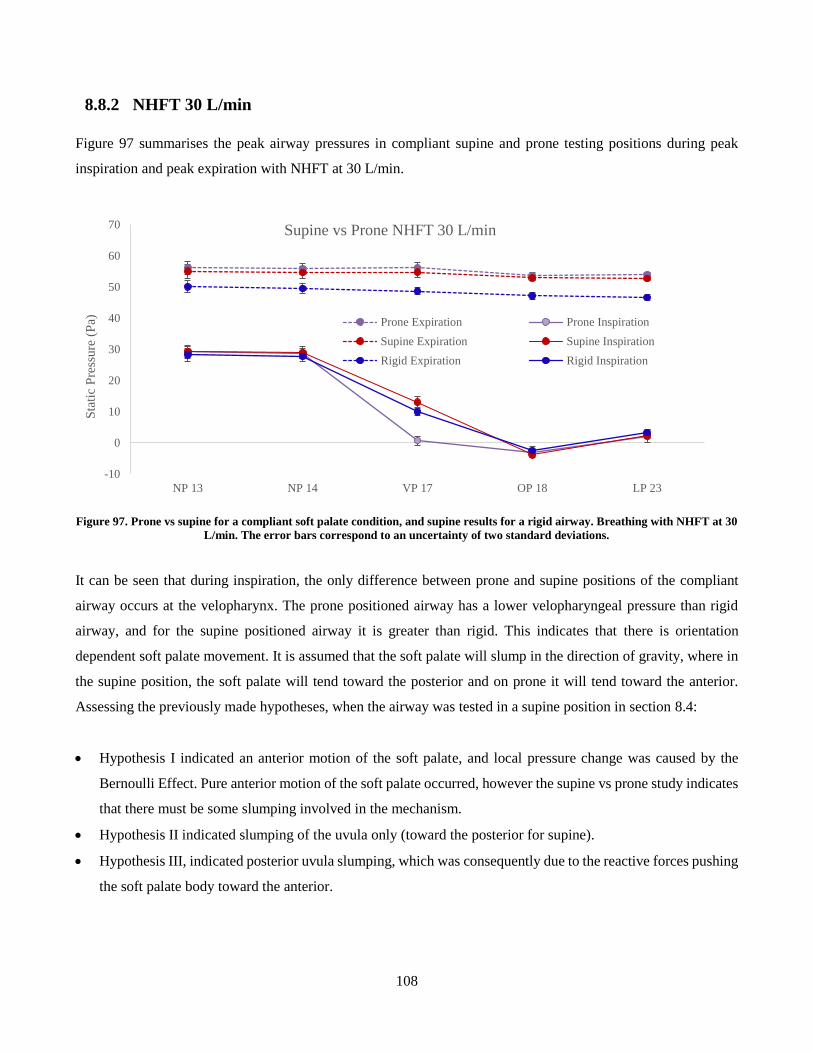
108
8.8.2 NHFT 30 L/min
Figure 97 summarises the peak airway pressures in compliant supine and prone testing positions during peak
inspiration and peak expiration with NHFT at 30 L/min.
Figure 97. Prone vs supine for a compliant soft palate condition, and supine results for a rigid airway. Breathing with NHFT at 30
L/min. The error bars correspond to an uncertainty of two standard deviations.
It can be seen that during inspiration, the only difference between prone and supine positions of the compliant
airway occurs at the velopharynx. The prone positioned airway has a lower velopharyngeal pressure than rigid
airway, and for the supine positioned airway it is greater than rigid. This indicates that there is orientation
dependent soft palate movement. It is assumed that the soft palate will slump in the direction of gravity, where in
the supine position, the soft palate will tend toward the posterior and on prone it will tend toward the anterior.
Assessing the previously made hypotheses, when the airway was tested in a supine position in section 8.4:
Hypothesis I indicated an anterior motion of the soft palate, and local pressure change was caused by the
Bernoulli Effect. Pure anterior motion of the soft palate occurred, however the supine vs prone study indicates
that there must be some slumping involved in the mechanism.
Hypothesis II indicated slumping of the uvula only (toward the posterior for supine).
Hypothesis III, indicated posterior uvula slumping, which was consequently due to the reactive forces pushing
the soft palate body toward the anterior.
-10
0
10
20
30
40
50
60
70
NP 13 NP 14 VP 17 OP 18 LP 23
Sta
tic
Pre
ssure
(P
a)
Supine vs Prone NHFT 30 L/min
Prone Expiration Prone Inspiration
Supine Expiration Supine Inspiration
Rigid Expiration Rigid Inspiration
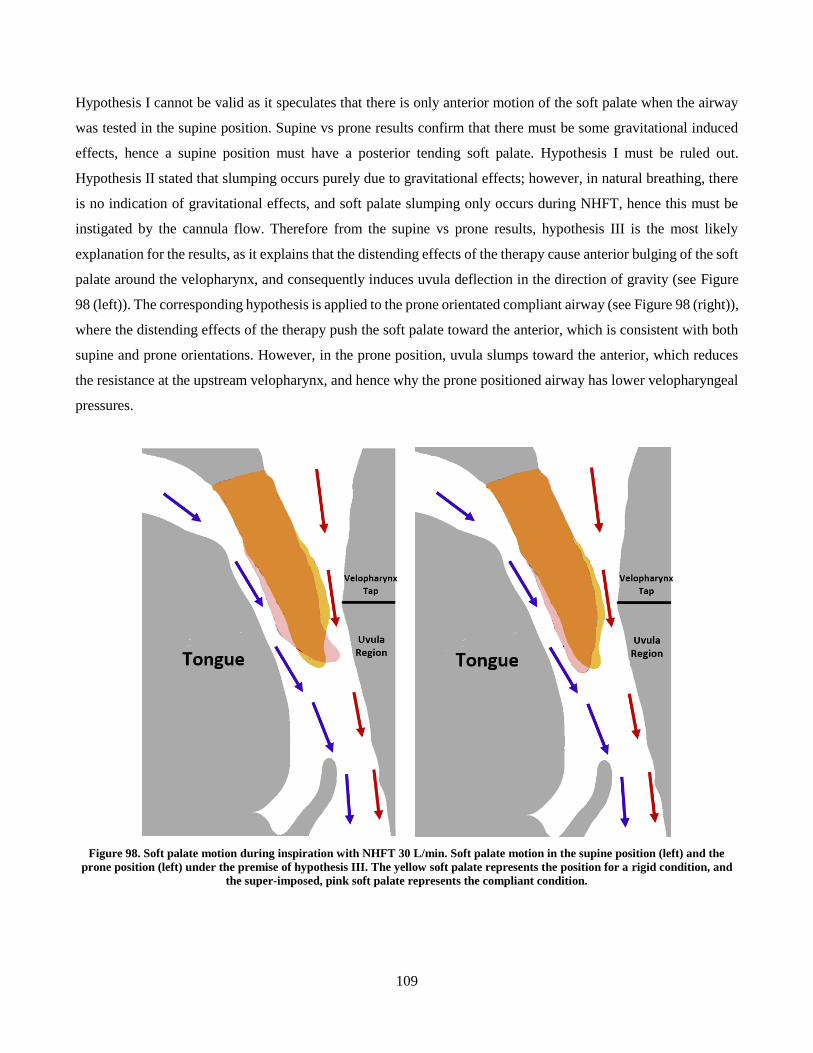
109
Hypothesis I cannot be valid as it speculates that there is only anterior motion of the soft palate when the airway
was tested in the supine position. Supine vs prone results confirm that there must be some gravitational induced
effects, hence a supine position must have a posterior tending soft palate. Hypothesis I must be ruled out.
Hypothesis II stated that slumping occurs purely due to gravitational effects; however, in natural breathing, there
is no indication of gravitational effects, and soft palate slumping only occurs during NHFT, hence this must be
instigated by the cannula flow. Therefore from the supine vs prone results, hypothesis III is the most likely
explanation for the results, as it explains that the distending effects of the therapy cause anterior bulging of the soft
palate around the velopharynx, and consequently induces uvula deflection in the direction of gravity (see Figure
98 (left)). The corresponding hypothesis is applied to the prone orientated compliant airway (see Figure 98 (right)),
where the distending effects of the therapy push the soft palate toward the anterior, which is consistent with both
supine and prone orientations. However, in the prone position, uvula slumps toward the anterior, which reduces
the resistance at the upstream velopharynx, and hence why the prone positioned airway has lower velopharyngeal
pressures.
Figure 98. Soft palate motion during inspiration with NHFT 30 L/min. Soft palate motion in the supine position (left) and the
prone position (left) under the premise of hypothesis III. The yellow soft palate represents the position for a rigid condition, and
the super-imposed, pink soft palate represents the compliant condition.
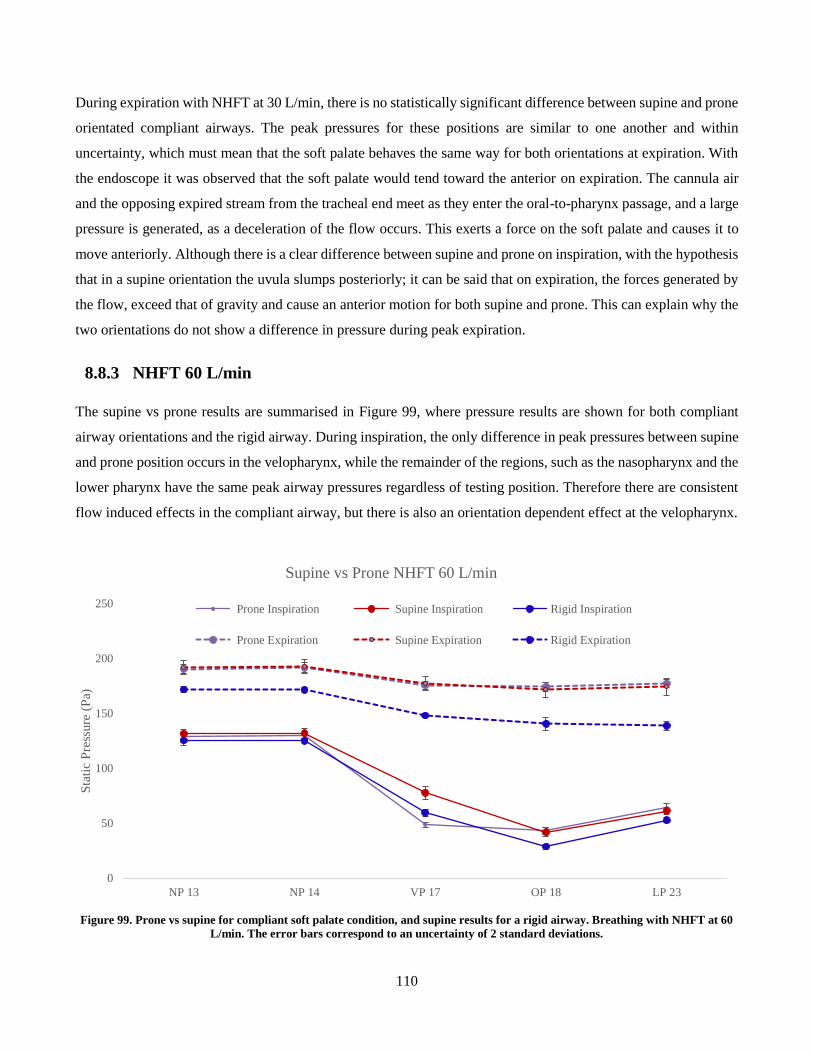
110
During expiration with NHFT at 30 L/min, there is no statistically significant difference between supine and prone
orientated compliant airways. The peak pressures for these positions are similar to one another and within
uncertainty, which must mean that the soft palate behaves the same way for both orientations at expiration. With
the endoscope it was observed that the soft palate would tend toward the anterior on expiration. The cannula air
and the opposing expired stream from the tracheal end meet as they enter the oral-to-pharynx passage, and a large
pressure is generated, as a deceleration of the flow occurs. This exerts a force on the soft palate and causes it to
move anteriorly. Although there is a clear difference between supine and prone on inspiration, with the hypothesis
that in a supine orientation the uvula slumps posteriorly; it can be said that on expiration, the forces generated by
the flow, exceed that of gravity and cause an anterior motion for both supine and prone. This can explain why the
two orientations do not show a difference in pressure during peak expiration.
8.8.3 NHFT 60 L/min
The supine vs prone results are summarised in Figure 99, where pressure results are shown for both compliant
airway orientations and the rigid airway. During inspiration, the only difference in peak pressures between supine
and prone position occurs in the velopharynx, while the remainder of the regions, such as the nasopharynx and the
lower pharynx have the same peak airway pressures regardless of testing position. Therefore there are consistent
flow induced effects in the compliant airway, but there is also an orientation dependent effect at the velopharynx.
Figure 99. Prone vs supine for compliant soft palate condition, and supine results for a rigid airway. Breathing with NHFT at 60
L/min. The error bars correspond to an uncertainty of 2 standard deviations.
0
50
100
150
200
250
NP 13 NP 14 VP 17 OP 18 LP 23
Sta
tic
Pre
ssure
(P
a)
Supine vs Prone NHFT 60 L/min
Prone Inspiration Supine Inspiration Rigid Inspiration
Prone Expiration Supine Expiration Rigid Expiration
111
Similar to NHFT 30 L/min inspiration, there is a clear difference between supine and prone positions at the
velopharynx only. Supine has greater pressures than rigid and prone has lower pressures than rigid. It can be
assumed that there is uvula slumping which tends toward the direction of gravity, and that there are orientation
dependent effects at the velopharynx only. However, given that the pressures in all remaining regions are consistent
in the compliant airway, regardless of orientation, there must be consistent flow induced effects in the compliant
airway. The two hypotheses that were made for this mode of breathing with in a supine position were as follows:
Hypothesis I: anterior motion of the soft palate body, widening the velopharyngeal cross-sectional area,
and consequently constricting the oral-to-pharynx region.
Hypothesis II: NHFT causes anterior bulging of the soft palate at the velopharynx which constricts the
oral-to-pharynx passage, and the uvula deflected toward the posterior.
For the same reasons as described for NHFT 30 L/min inspiration, hypothesis I can be ruled out. Hypothesis II
explains that the CPAP from the therapy pushes the soft palate body toward the anterior, causing a bulge which
constricts the oral-to-pharynx passage, hence causing the global increase on airway pressures, relative to rigid, as
described previously in section 8.6. This part of the soft palate motion is consistent with supine and prone positions,
hence all airway regions, with the exception of the velopharynx, experience an increase in pressures. However,
depending on prone or supine position, there is uvula deflection in the direction of gravity. In the supine position,
uvula tends posteriorly, which will increase the pressure at the velopharynx, with respect to rigid; and in the prone
position, uvula tends toward anterior direction causing a decrease in resistance at the velopharynx and hence
decrease in this regions’ pressure. The hypothesised soft palate position is illustrated for supine and prone positions
in Figure 100.
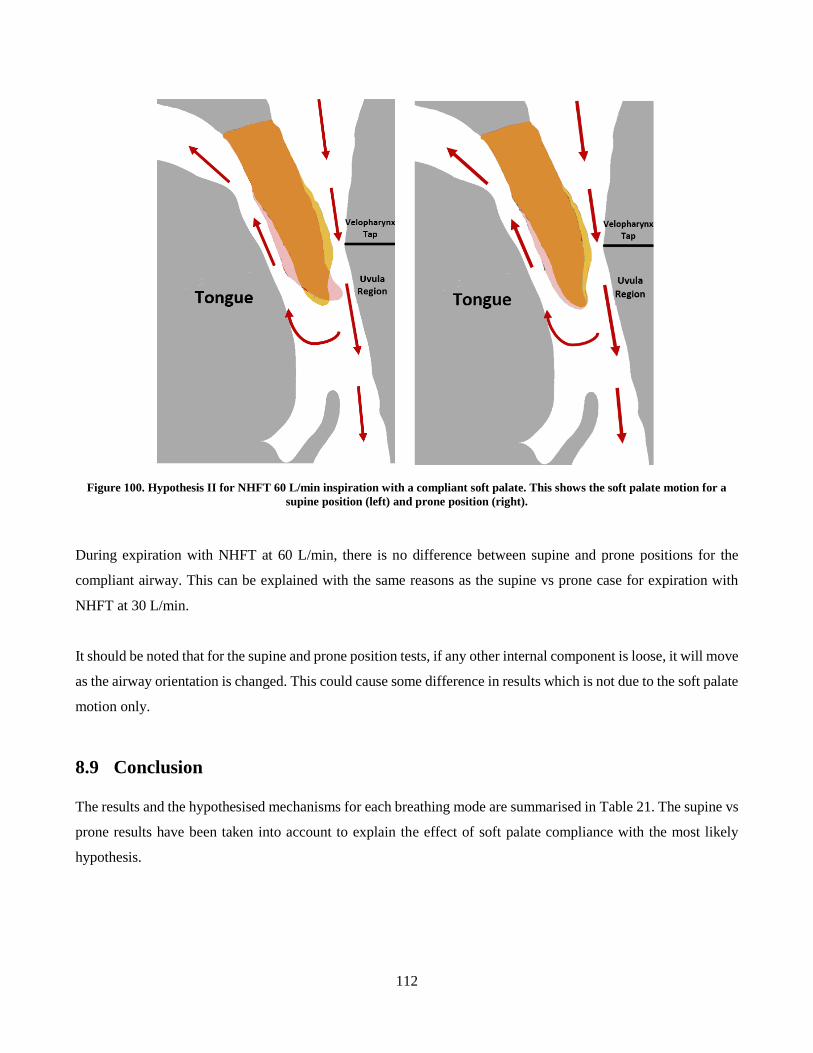
112
Figure 100. Hypothesis II for NHFT 60 L/min inspiration with a compliant soft palate. This shows the soft palate motion for a
supine position (left) and prone position (right).
During expiration with NHFT at 60 L/min, there is no difference between supine and prone positions for the
compliant airway. This can be explained with the same reasons as the supine vs prone case for expiration with
NHFT at 30 L/min.
It should be noted that for the supine and prone position tests, if any other internal component is loose, it will move
as the airway orientation is changed. This could cause some difference in results which is not due to the soft palate
motion only.
8.9 Conclusion
The results and the hypothesised mechanisms for each breathing mode are summarised in Table 21. The supine vs
prone results have been taken into account to explain the effect of soft palate compliance with the most likely
hypothesis.
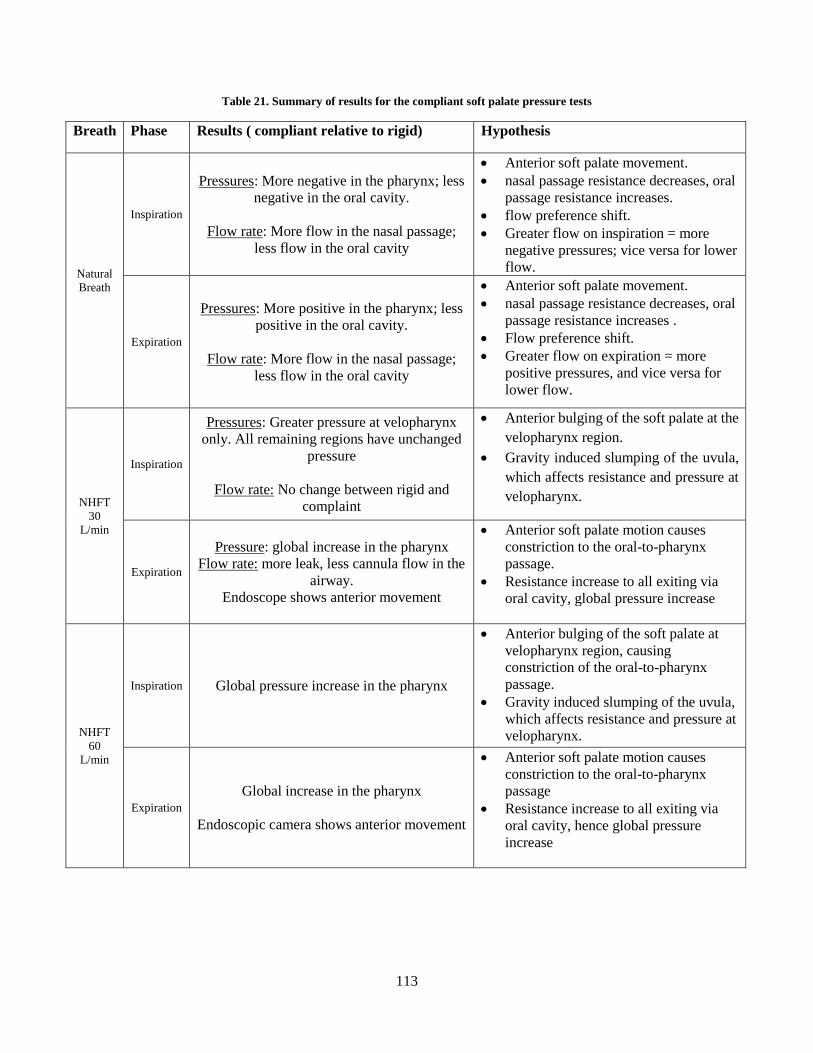
113
Table 21. Summary of results for the compliant soft palate pressure tests
Breath Phase Results ( compliant relative to rigid) Hypothesis
Natural
Breath
Inspiration
Pressures: More negative in the pharynx; less
negative in the oral cavity.
Flow rate: More flow in the nasal passage;
less flow in the oral cavity
Anterior soft palate movement.
nasal passage resistance decreases, oral
passage resistance increases.
flow preference shift.
Greater flow on inspiration = more
negative pressures; vice versa for lower
flow.
Expiration
Pressures: More positive in the pharynx; less
positive in the oral cavity.
Flow rate: More flow in the nasal passage;
less flow in the oral cavity
Anterior soft palate movement.
nasal passage resistance decreases, oral
passage resistance increases .
Flow preference shift.
Greater flow on expiration = more
positive pressures, and vice versa for
lower flow.
NHFT
30
L/min
Inspiration
Pressures: Greater pressure at velopharynx
only. All remaining regions have unchanged
pressure
Flow rate: No change between rigid and
complaint
Anterior bulging of the soft palate at the
velopharynx region.
Gravity induced slumping of the uvula,
which affects resistance and pressure at
velopharynx.
Expiration
Pressure: global increase in the pharynx
Flow rate: more leak, less cannula flow in the
airway.
Endoscope shows anterior movement
Anterior soft palate motion causes
constriction to the oral-to-pharynx
passage.
Resistance increase to all exiting via
oral cavity, global pressure increase
NHFT
60
L/min
Inspiration Global pressure increase in the pharynx
Anterior bulging of the soft palate at
velopharynx region, causing
constriction of the oral-to-pharynx
passage.
Gravity induced slumping of the uvula,
which affects resistance and pressure at
velopharynx.
Expiration
Global increase in the pharynx
Endoscopic camera shows anterior movement
Anterior soft palate motion causes
constriction to the oral-to-pharynx
passage
Resistance increase to all exiting via
oral cavity, hence global pressure
increase
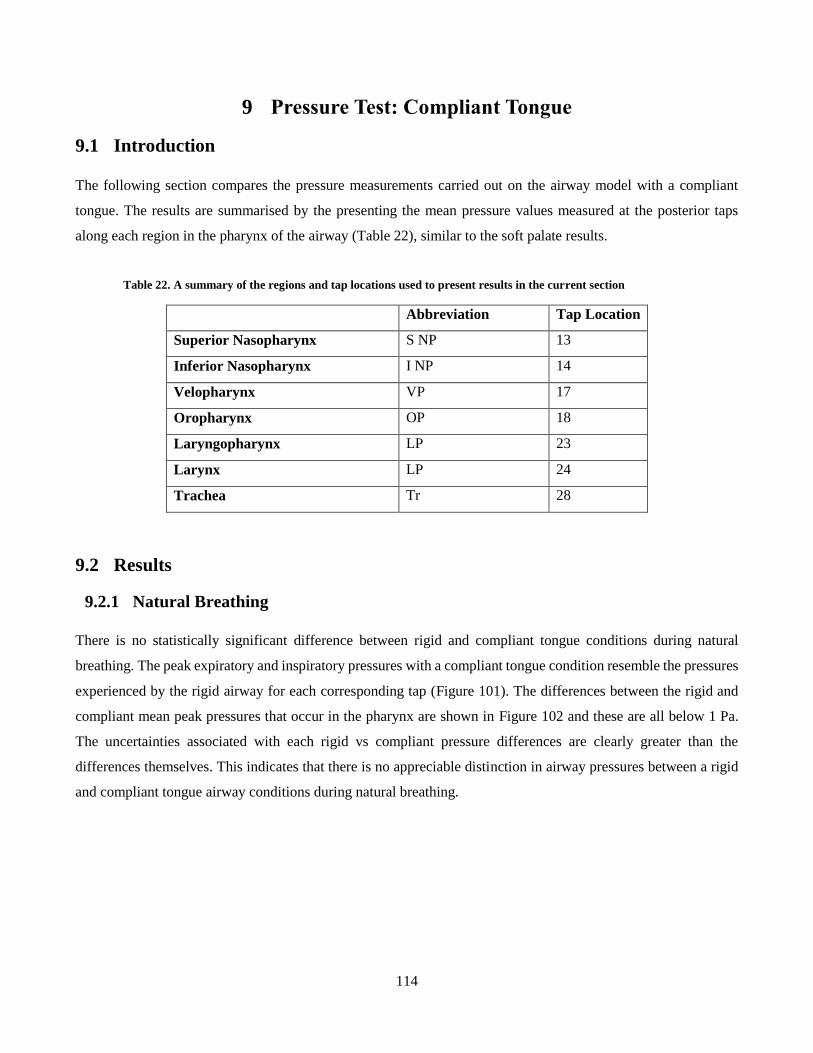
114
9 Pressure Test: Compliant Tongue
9.1 Introduction
The following section compares the pressure measurements carried out on the airway model with a compliant
tongue. The results are summarised by the presenting the mean pressure values measured at the posterior taps
along each region in the pharynx of the airway (Table 22), similar to the soft palate results.
Table 22. A summary of the regions and tap locations used to present results in the current section
Abbreviation Tap Location
Superior Nasopharynx S NP 13
Inferior Nasopharynx I NP 14
Velopharynx VP 17
Oropharynx OP 18
Laryngopharynx LP 23
Larynx LP 24
Trachea Tr 28
9.2 Results
9.2.1 Natural Breathing
There is no statistically significant difference between rigid and compliant tongue conditions during natural
breathing. The peak expiratory and inspiratory pressures with a compliant tongue condition resemble the pressures
experienced by the rigid airway for each corresponding tap (Figure 101). The differences between the rigid and
compliant mean peak pressures that occur in the pharynx are shown in Figure 102 and these are all below 1 Pa.
The uncertainties associated with each rigid vs compliant pressure differences are clearly greater than the
differences themselves. This indicates that there is no appreciable distinction in airway pressures between a rigid
and compliant tongue airway conditions during natural breathing.
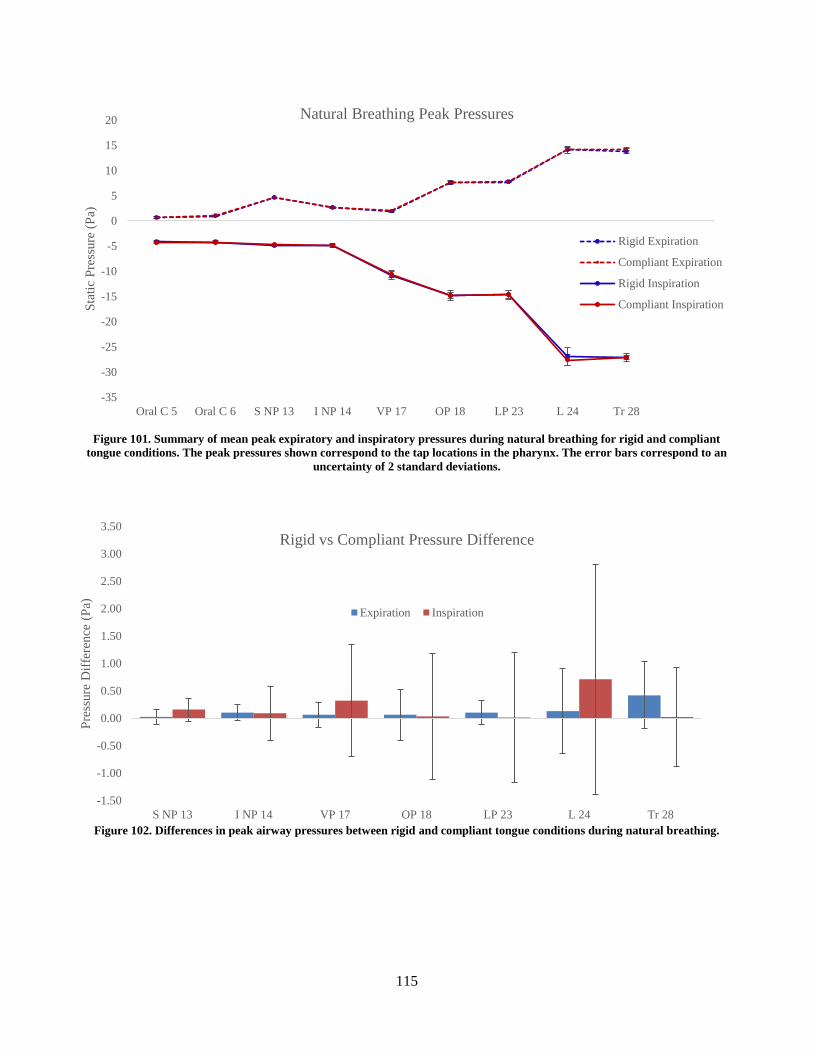
115
Figure 101. Summary of mean peak expiratory and inspiratory pressures during natural breathing for rigid and compliant
tongue conditions. The peak pressures shown correspond to the tap locations in the pharynx. The error bars correspond to an
uncertainty of 2 standard deviations.
Figure 102. Differences in peak airway pressures between rigid and compliant tongue conditions during natural breathing.
-35
-30
-25
-20
-15
-10
-5
0
5
10
15
20
Oral C 5 Oral C 6 S NP 13 I NP 14 VP 17 OP 18 LP 23 L 24 Tr 28
Sta
tic
Pre
ssure
(P
a)
Natural Breathing Peak Pressures
Rigid Expiration
Compliant Expiration
Rigid Inspiration
Compliant Inspiration
-1.50
-1.00
-0.50
0.00
0.50
1.00
1.50
2.00
2.50
3.00
3.50
S NP 13 I NP 14 VP 17 OP 18 LP 23 L 24 Tr 28
Pre
ssure
Dif
fere
nce
(P
a)
Rigid vs Compliant Pressure Difference
Expiration Inspiration
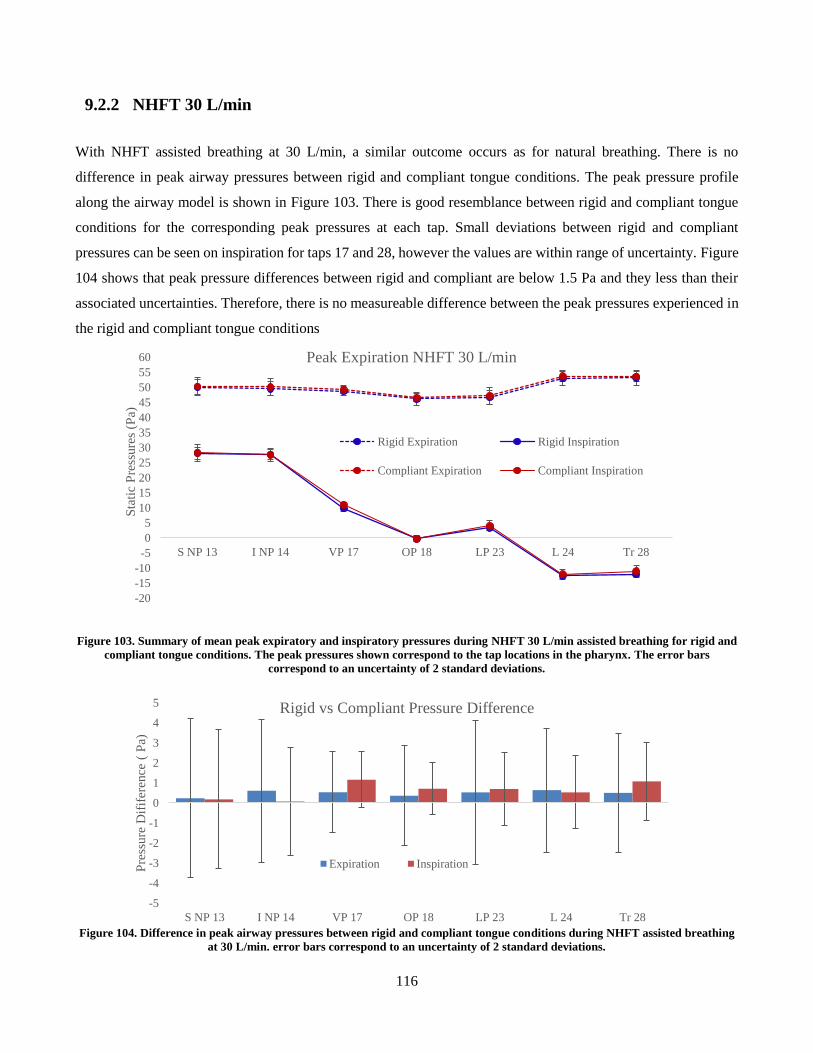
116
9.2.2 NHFT 30 L/min
With NHFT assisted breathing at 30 L/min, a similar outcome occurs as for natural breathing. There is no
difference in peak airway pressures between rigid and compliant tongue conditions. The peak pressure profile
along the airway model is shown in Figure 103. There is good resemblance between rigid and compliant tongue
conditions for the corresponding peak pressures at each tap. Small deviations between rigid and compliant
pressures can be seen on inspiration for taps 17 and 28, however the values are within range of uncertainty. Figure
104 shows that peak pressure differences between rigid and compliant are below 1.5 Pa and they less than their
associated uncertainties. Therefore, there is no measureable difference between the peak pressures experienced in
the rigid and compliant tongue conditions
Figure 103. Summary of mean peak expiratory and inspiratory pressures during NHFT 30 L/min assisted breathing for rigid and
compliant tongue conditions. The peak pressures shown correspond to the tap locations in the pharynx. The error bars
correspond to an uncertainty of 2 standard deviations.
Figure 104. Difference in peak airway pressures between rigid and compliant tongue conditions during NHFT assisted breathing
at 30 L/min. error bars correspond to an uncertainty of 2 standard deviations.
-20
-15
-10
-5
0
5
10
15
20
25
30
35
40
45
50
55
60
S NP 13 I NP 14 VP 17 OP 18 LP 23 L 24 Tr 28
Sta
tic
Pre
ssure
s (P
a)
Peak Expiration NHFT 30 L/min
Rigid Expiration Rigid Inspiration
Compliant Expiration Compliant Inspiration
-5
-4
-3
-2
-1
0
1
2
3
4
5
S NP 13 I NP 14 VP 17 OP 18 LP 23 L 24 Tr 28
Pre
ssure
Dif
ifer
ence
( P
a)
Rigid vs Compliant Pressure Difference
Expiration Inspiration
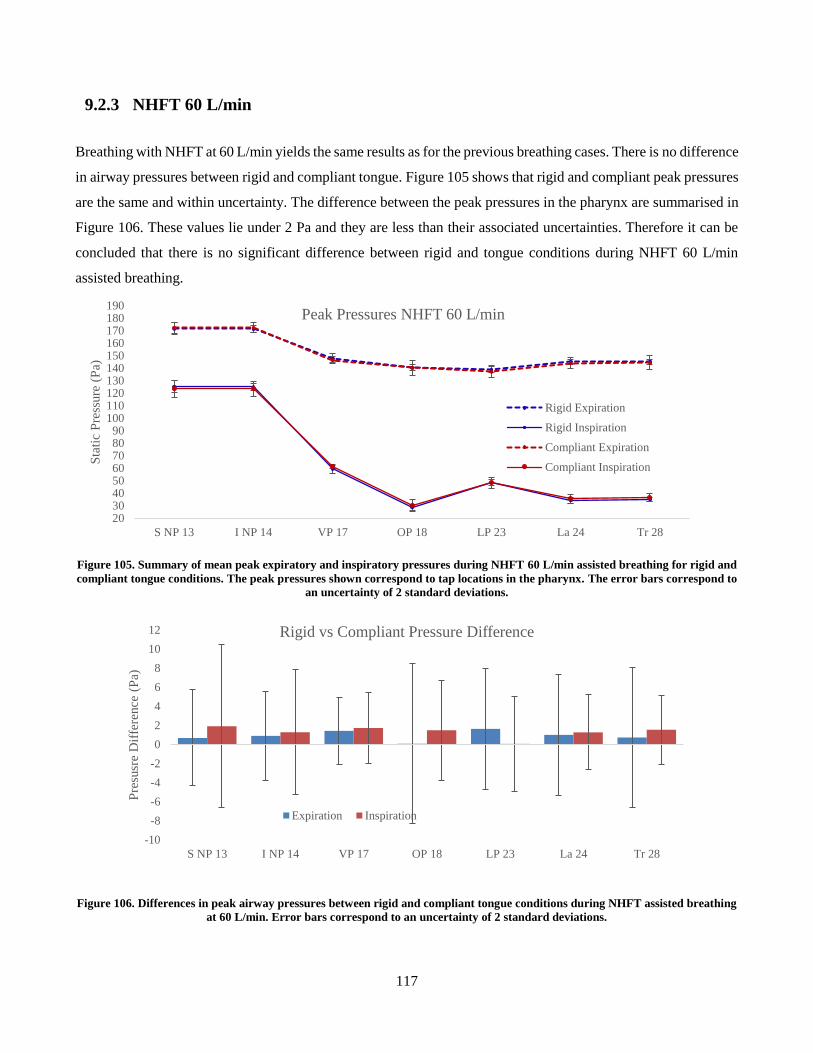
117
9.2.3 NHFT 60 L/min
Breathing with NHFT at 60 L/min yields the same results as for the previous breathing cases. There is no difference
in airway pressures between rigid and compliant tongue. Figure 105 shows that rigid and compliant peak pressures
are the same and within uncertainty. The difference between the peak pressures in the pharynx are summarised in
Figure 106. These values lie under 2 Pa and they are less than their associated uncertainties. Therefore it can be
concluded that there is no significant difference between rigid and tongue conditions during NHFT 60 L/min
assisted breathing.
Figure 105. Summary of mean peak expiratory and inspiratory pressures during NHFT 60 L/min assisted breathing for rigid and
compliant tongue conditions. The peak pressures shown correspond to tap locations in the pharynx. The error bars correspond to
an uncertainty of 2 standard deviations.
Figure 106. Differences in peak airway pressures between rigid and compliant tongue conditions during NHFT assisted breathing
at 60 L/min. Error bars correspond to an uncertainty of 2 standard deviations.
2030405060708090
100110120130140150160170180190
S NP 13 I NP 14 VP 17 OP 18 LP 23 La 24 Tr 28
Sta
tic
Pre
ssure
(P
a)
Peak Pressures NHFT 60 L/min
Rigid Expiration
Rigid Inspiration
Compliant Expiration
Compliant Inspiration
-10
-8
-6
-4
-2
0
2
4
6
8
10
12
S NP 13 I NP 14 VP 17 OP 18 LP 23 La 24 Tr 28
Pre
susr
e D
iffe
rence
(P
a)
Rigid vs Compliant Pressure Difference
Expiration Inspiration
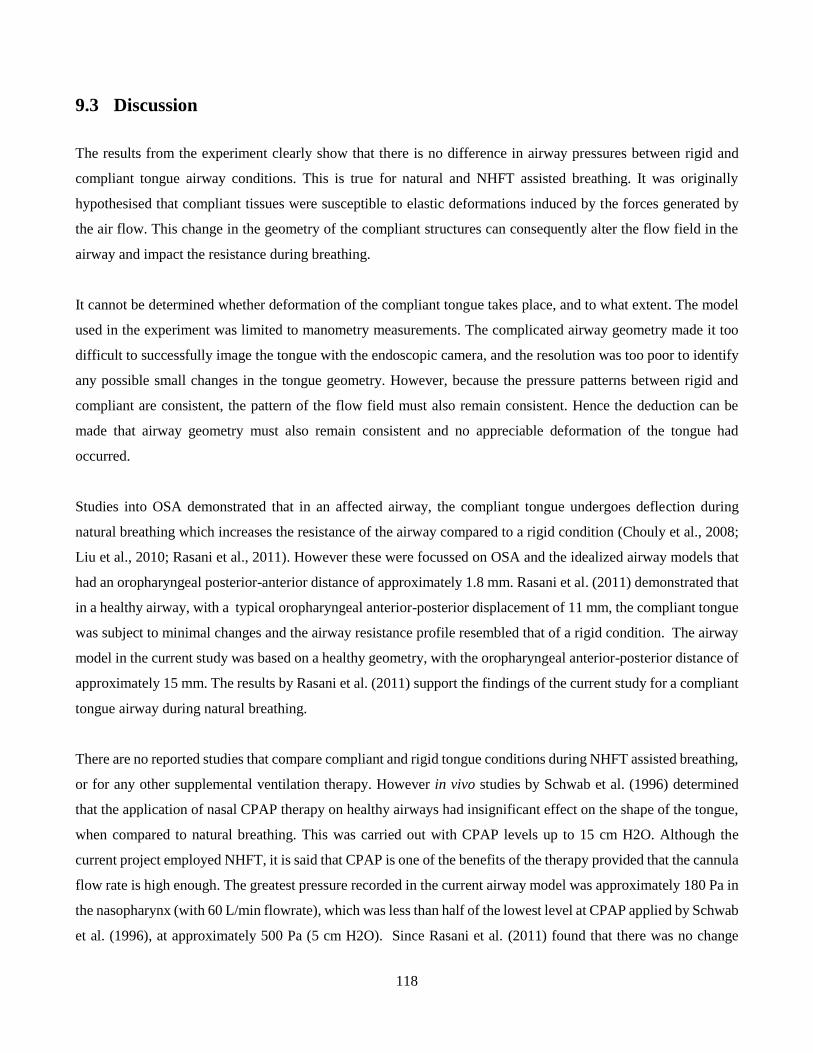
118
9.3 Discussion
The results from the experiment clearly show that there is no difference in airway pressures between rigid and
compliant tongue airway conditions. This is true for natural and NHFT assisted breathing. It was originally
hypothesised that compliant tissues were susceptible to elastic deformations induced by the forces generated by
the air flow. This change in the geometry of the compliant structures can consequently alter the flow field in the
airway and impact the resistance during breathing.
It cannot be determined whether deformation of the compliant tongue takes place, and to what extent. The model
used in the experiment was limited to manometry measurements. The complicated airway geometry made it too
difficult to successfully image the tongue with the endoscopic camera, and the resolution was too poor to identify
any possible small changes in the tongue geometry. However, because the pressure patterns between rigid and
compliant are consistent, the pattern of the flow field must also remain consistent. Hence the deduction can be
made that airway geometry must also remain consistent and no appreciable deformation of the tongue had
occurred.
Studies into OSA demonstrated that in an affected airway, the compliant tongue undergoes deflection during
natural breathing which increases the resistance of the airway compared to a rigid condition (Chouly et al., 2008;
Liu et al., 2010; Rasani et al., 2011). However these were focussed on OSA and the idealized airway models that
had an oropharyngeal posterior-anterior distance of approximately 1.8 mm. Rasani et al. (2011) demonstrated that
in a healthy airway, with a typical oropharyngeal anterior-posterior displacement of 11 mm, the compliant tongue
was subject to minimal changes and the airway resistance profile resembled that of a rigid condition. The airway
model in the current study was based on a healthy geometry, with the oropharyngeal anterior-posterior distance of
approximately 15 mm. The results by Rasani et al. (2011) support the findings of the current study for a compliant
tongue airway during natural breathing.
There are no reported studies that compare compliant and rigid tongue conditions during NHFT assisted breathing,
or for any other supplemental ventilation therapy. However in vivo studies by Schwab et al. (1996) determined
that the application of nasal CPAP therapy on healthy airways had insignificant effect on the shape of the tongue,
when compared to natural breathing. This was carried out with CPAP levels up to 15 cm H2O. Although the
current project employed NHFT, it is said that CPAP is one of the benefits of the therapy provided that the cannula
flow rate is high enough. The greatest pressure recorded in the current airway model was approximately 180 Pa in
the nasopharynx (with 60 L/min flowrate), which was less than half of the lowest level at CPAP applied by Schwab
et al. (1996), at approximately 500 Pa (5 cm H2O). Since Rasani et al. (2011) found that there was no change
119
between compliant and rigid tongue conditions for natural breathing, and Schwab et al. (1996) concluded that there
was no difference in tongue shape between natural breathing and CPAP assisted breathing, connecting these two
statements, it can be said that there is no change between compliant and rigid tongue conditions for all levels of
therapy.
This study was representative of a single person, and therefore it cannot be said that tongue compliance will not
affect breathing in a healthy airway. Variation in airway anatomy between different people may produce different
results. As mentioned previously in the discussion that tongue compliance will have minimal effects on breathing
for a posterior-anterior distance of 11 mm. Although this is typical for a healthy airway, this value can vary between
people, and for smaller anterior-posterior distances, tongue compliance may affect breathing pressures. The effects
of tongue compliance was also tested for an open mouth airway condition only. During closed mouth breathing,
airway resistance increases and the peak pressures significantly increase in magnitude. It is possible that these may
be great enough to cause deformation of the compliant tongue, therefore the conclusion made in this study, that
there is no difference between rigid and compliant tongue airway conditions, can only be stated for an open mouth
breathing and is not yet known for a closed mouth condition.
The geometry of the tongue insert was truncated on the sagittal sides, as the information for the entire shape was
lost in the noise of the CT scan. However, the tongue surface which composed part of the airway passage in the
oropharynx and oral cavity, was included in the insert design. The truncated sagittal sides were never exposed to
airflow, so it is unlikely that they would affect the flow field. The compliant tongue insert was also made from a
single material composition and was assumed to be a homogenous structure. In reality the tongue is comprised of
several intrinsic and extrinsic muscles and likely to vary in stiffness. The contrast of the CT scans used to model
the tongue made it difficult to distinguish between the different tissue layers, hence it was modelled as single
structure for simplicity. Reported tongue elasticity in literature was also limited, therefore a single value was used.
It is unknown as to what extent the tongue compliance may vary between the tissue layers; but given that in the
current study there was no indication that a uniformly compliant tongue showed a difference, it is unlikely that
incorporating multiple tissue layers would change results, unless the deeper tissues were of significantly lower
compliance (less than 7.7 kPa).
The tongue is an airway dilator and during respiration there are small involuntary muscle movements. This is to
maintain airway patency during breathing. In reality, the tongue would undergo small geometric changes, and
changes to the stiffness, as muscles in the structure would activate and change the muscle tone. The current project
simulated a static tongue as muscular motions were not replicated, and the stiffness of the material was held
120
constant. However, the purpose of the project was to investigate the passive movements of the tongue induced by
air flow during respiration, and muscle activity was neglected in replicating a compliant airway.
9.4 Conclusion
The pressure experiments were carried out for an airway with a compliant tongue condition. Comparing the airway
pressures for a rigid and compliant tongue airway condition, it was clear that there was no statistically significant
difference between the two cases. This was consistent for all three tested breathing cases. This was also consistent
with reported studies, who also found that in natural breathing, the tongue does not affect breathing, except for the
case of OSA, where there is a difference in tongue geometry and properties compared to healthy subject. There
are no reported studies on tongue compliance and NHFT breathing, however studies with CPAP therapy have
shown that tongue experiences geometric changes when breathing was assisted with therapy.
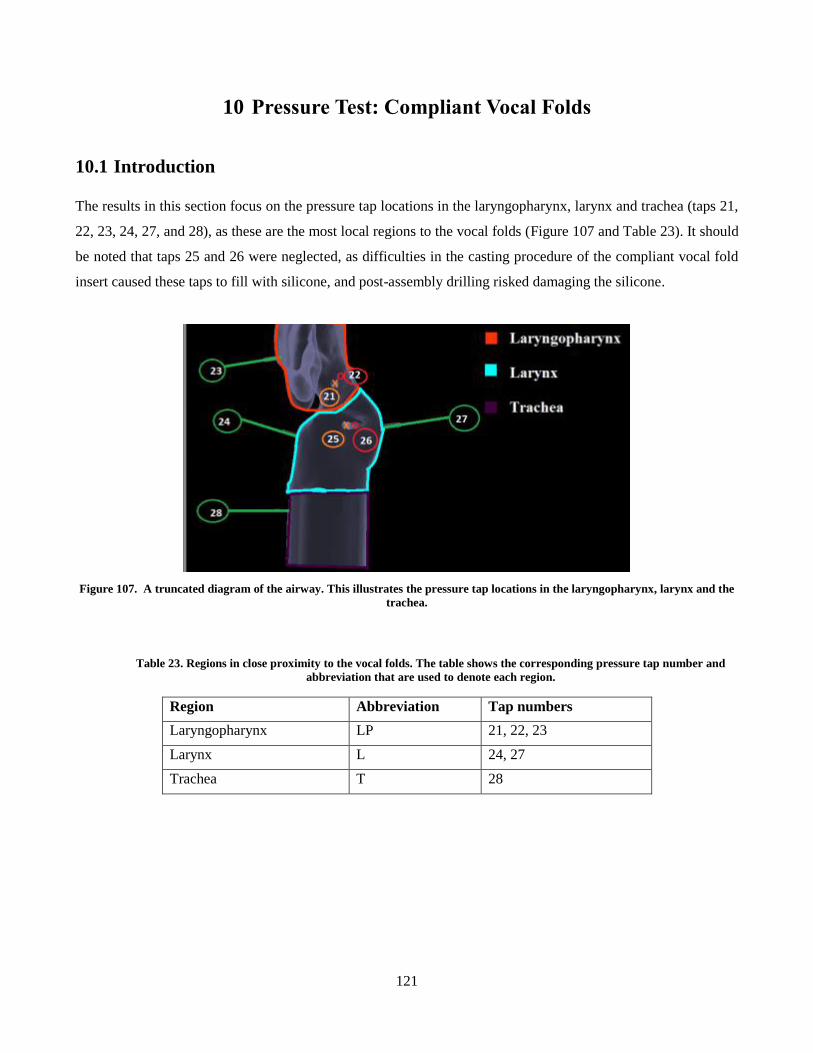
121
10 Pressure Test: Compliant Vocal Folds
10.1 Introduction
The results in this section focus on the pressure tap locations in the laryngopharynx, larynx and trachea (taps 21,
22, 23, 24, 27, and 28), as these are the most local regions to the vocal folds (Figure 107 and Table 23). It should
be noted that taps 25 and 26 were neglected, as difficulties in the casting procedure of the compliant vocal fold
insert caused these taps to fill with silicone, and post-assembly drilling risked damaging the silicone.
Figure 107. A truncated diagram of the airway. This illustrates the pressure tap locations in the laryngopharynx, larynx and the
trachea.
Table 23. Regions in close proximity to the vocal folds. The table shows the corresponding pressure tap number and
abbreviation that are used to denote each region.
Region Abbreviation Tap numbers
Laryngopharynx LP 21, 22, 23
Larynx L 24, 27
Trachea T 28
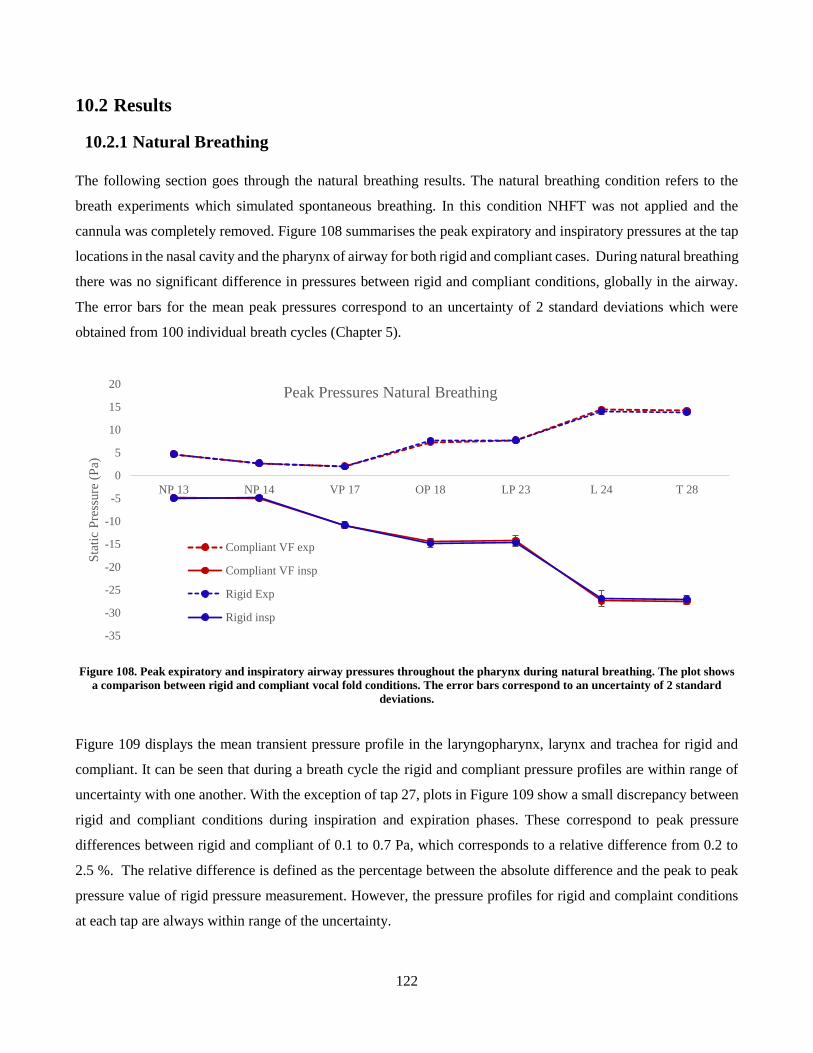
122
10.2 Results
10.2.1 Natural Breathing
The following section goes through the natural breathing results. The natural breathing condition refers to the
breath experiments which simulated spontaneous breathing. In this condition NHFT was not applied and the
cannula was completely removed. Figure 108 summarises the peak expiratory and inspiratory pressures at the tap
locations in the nasal cavity and the pharynx of airway for both rigid and compliant cases. During natural breathing
there was no significant difference in pressures between rigid and compliant conditions, globally in the airway.
The error bars for the mean peak pressures correspond to an uncertainty of 2 standard deviations which were
obtained from 100 individual breath cycles (Chapter 5).
Figure 108. Peak expiratory and inspiratory airway pressures throughout the pharynx during natural breathing. The plot shows
a comparison between rigid and compliant vocal fold conditions. The error bars correspond to an uncertainty of 2 standard
deviations.
Figure 109 displays the mean transient pressure profile in the laryngopharynx, larynx and trachea for rigid and
compliant. It can be seen that during a breath cycle the rigid and compliant pressure profiles are within range of
uncertainty with one another. With the exception of tap 27, plots in Figure 109 show a small discrepancy between
rigid and compliant conditions during inspiration and expiration phases. These correspond to peak pressure
differences between rigid and compliant of 0.1 to 0.7 Pa, which corresponds to a relative difference from 0.2 to
2.5 %. The relative difference is defined as the percentage between the absolute difference and the peak to peak
pressure value of rigid pressure measurement. However, the pressure profiles for rigid and complaint conditions
at each tap are always within range of the uncertainty.
-35
-30
-25
-20
-15
-10
-5
0
5
10
15
20
NP 13 NP 14 VP 17 OP 18 LP 23 L 24 T 28
Sta
tic
Pre
ssure
(P
a)
Peak Pressures Natural Breathing
Compliant VF exp
Compliant VF insp
Rigid Exp
Rigid insp
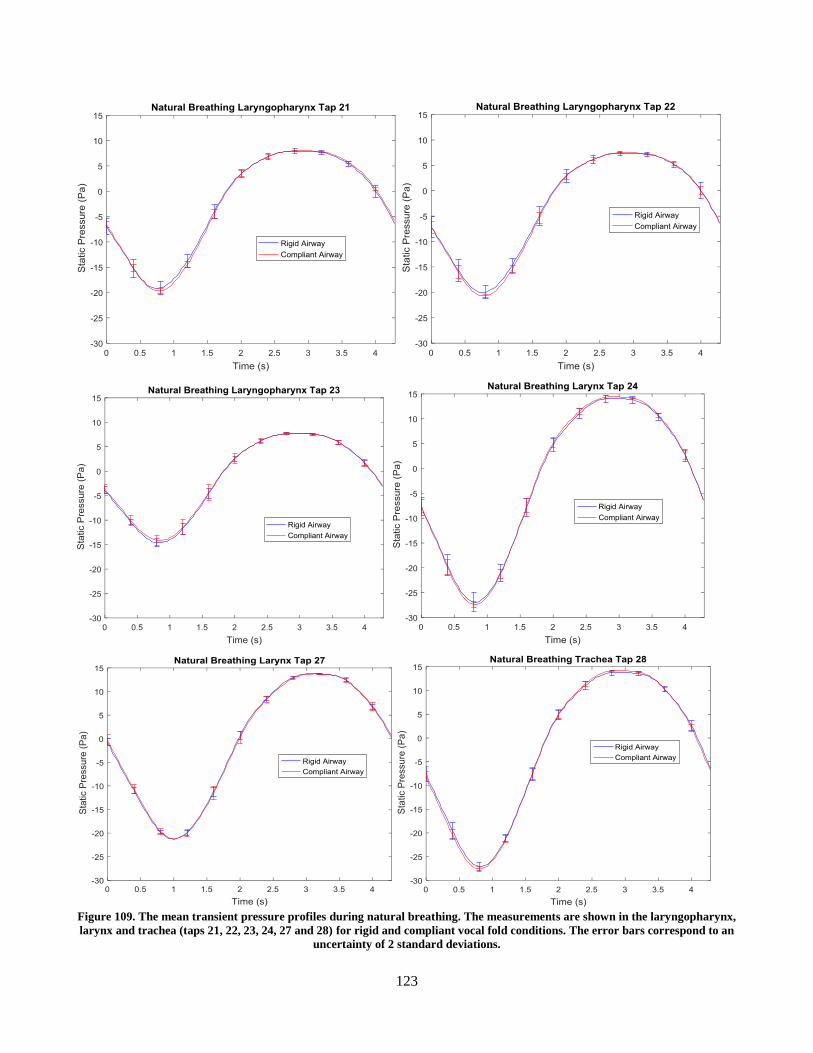
123
Figure 109. The mean transient pressure profiles during natural breathing. The measurements are shown in the laryngopharynx,
larynx and trachea (taps 21, 22, 23, 24, 27 and 28) for rigid and compliant vocal fold conditions. The error bars correspond to an
uncertainty of 2 standard deviations.
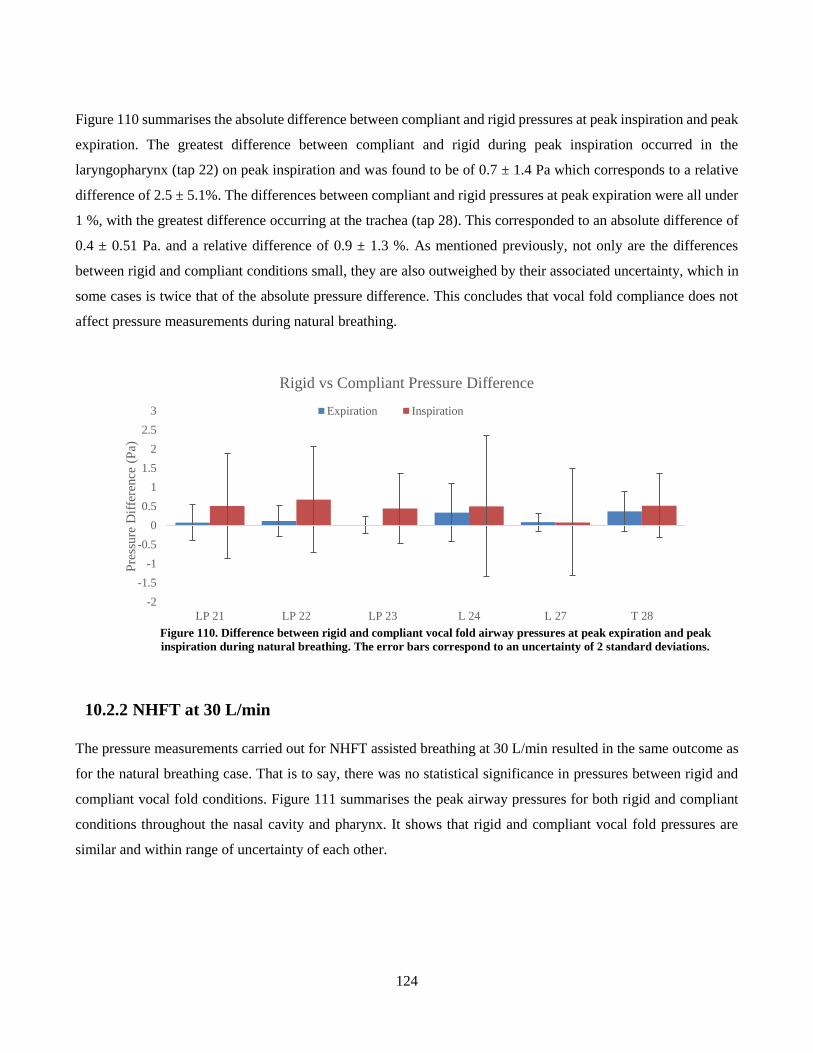
124
Figure 110 summarises the absolute difference between compliant and rigid pressures at peak inspiration and peak
expiration. The greatest difference between compliant and rigid during peak inspiration occurred in the
laryngopharynx (tap 22) on peak inspiration and was found to be of 0.7 ± 1.4 Pa which corresponds to a relative
difference of 2.5 ± 5.1%. The differences between compliant and rigid pressures at peak expiration were all under
1 %, with the greatest difference occurring at the trachea (tap 28). This corresponded to an absolute difference of
0.4 ± 0.51 Pa. and a relative difference of 0.9 ± 1.3 %. As mentioned previously, not only are the differences
between rigid and compliant conditions small, they are also outweighed by their associated uncertainty, which in
some cases is twice that of the absolute pressure difference. This concludes that vocal fold compliance does not
affect pressure measurements during natural breathing.
Figure 110. Difference between rigid and compliant vocal fold airway pressures at peak expiration and peak
inspiration during natural breathing. The error bars correspond to an uncertainty of 2 standard deviations.
10.2.2 NHFT at 30 L/min
The pressure measurements carried out for NHFT assisted breathing at 30 L/min resulted in the same outcome as
for the natural breathing case. That is to say, there was no statistical significance in pressures between rigid and
compliant vocal fold conditions. Figure 111 summarises the peak airway pressures for both rigid and compliant
conditions throughout the nasal cavity and pharynx. It shows that rigid and compliant vocal fold pressures are
similar and within range of uncertainty of each other.
-2
-1.5
-1
-0.5
0
0.5
1
1.5
2
2.5
3
LP 21 LP 22 LP 23 L 24 L 27 T 28
Pre
ssure
Dif
fere
nce
(P
a)
Rigid vs Compliant Pressure Difference
Expiration Inspiration
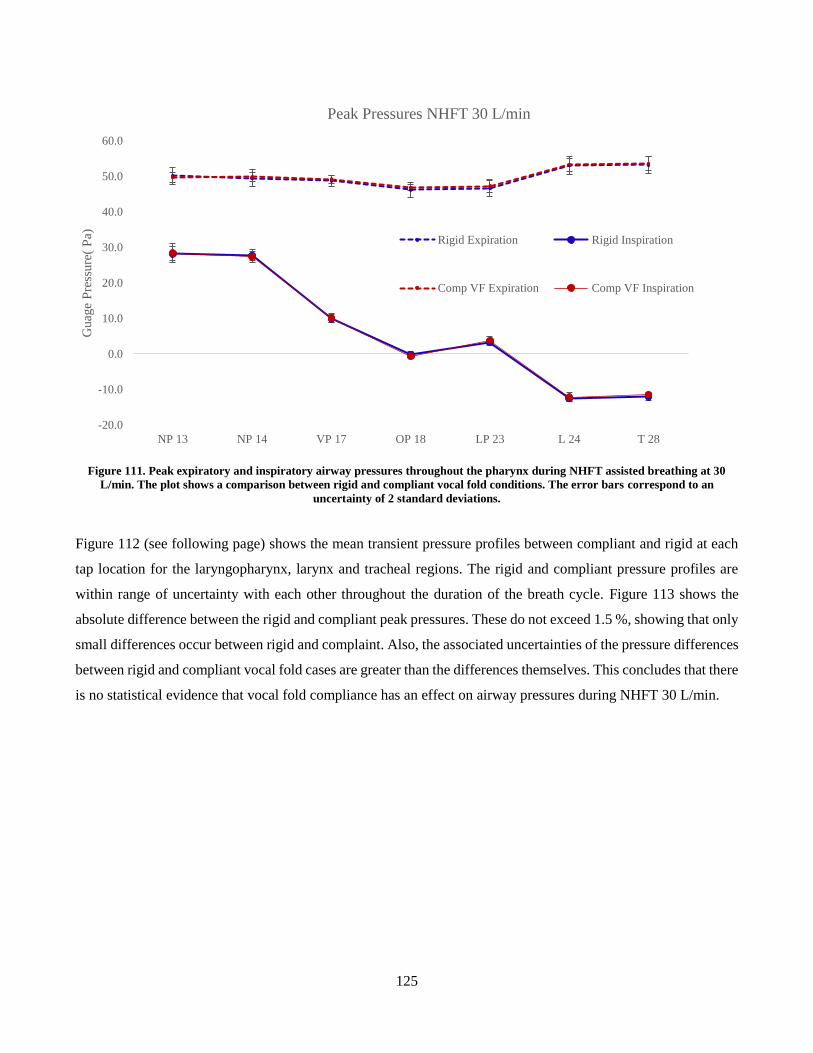
125
Figure 111. Peak expiratory and inspiratory airway pressures throughout the pharynx during NHFT assisted breathing at 30
L/min. The plot shows a comparison between rigid and compliant vocal fold conditions. The error bars correspond to an
uncertainty of 2 standard deviations.
Figure 112 (see following page) shows the mean transient pressure profiles between compliant and rigid at each
tap location for the laryngopharynx, larynx and tracheal regions. The rigid and compliant pressure profiles are
within range of uncertainty with each other throughout the duration of the breath cycle. Figure 113 shows the
absolute difference between the rigid and compliant peak pressures. These do not exceed 1.5 %, showing that only
small differences occur between rigid and complaint. Also, the associated uncertainties of the pressure differences
between rigid and compliant vocal fold cases are greater than the differences themselves. This concludes that there
is no statistical evidence that vocal fold compliance has an effect on airway pressures during NHFT 30 L/min.
-20.0
-10.0
0.0
10.0
20.0
30.0
40.0
50.0
60.0
NP 13 NP 14 VP 17 OP 18 LP 23 L 24 T 28
Guag
e P
ress
ure
( P
a)
Peak Pressures NHFT 30 L/min
Rigid Expiration Rigid Inspiration
Comp VF Expiration Comp VF Inspiration
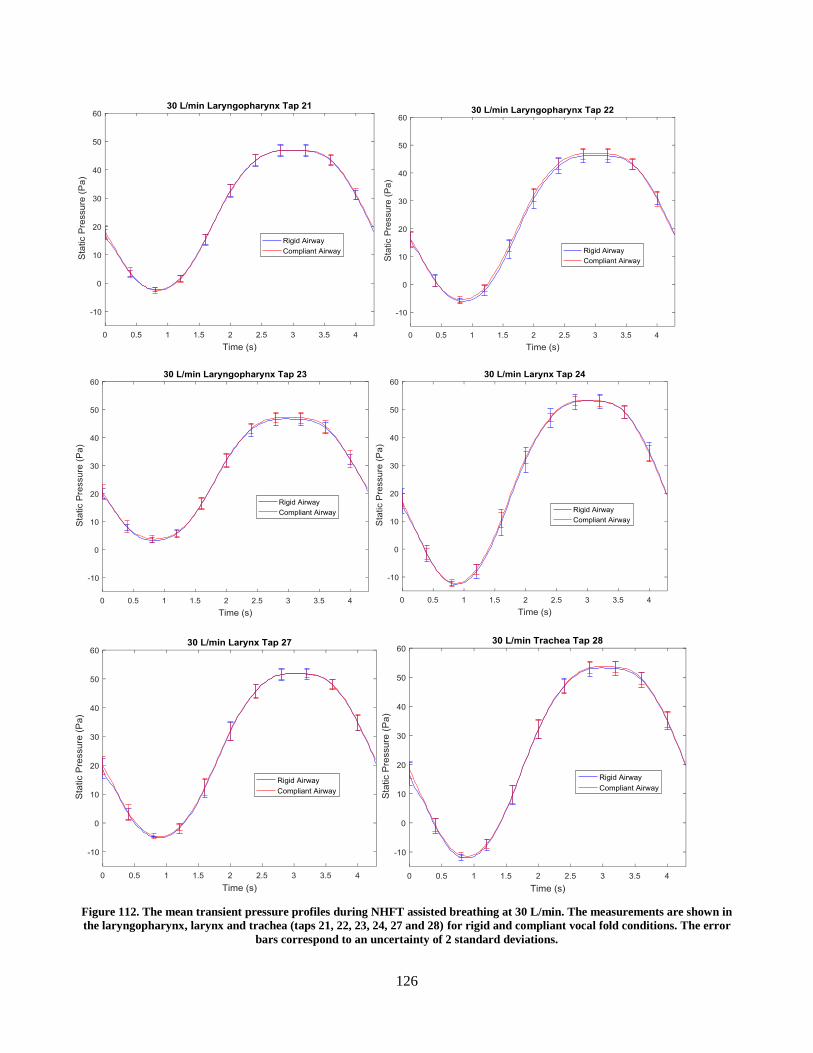
126
Figure 112. The mean transient pressure profiles during NHFT assisted breathing at 30 L/min. The measurements are shown in
the laryngopharynx, larynx and trachea (taps 21, 22, 23, 24, 27 and 28) for rigid and compliant vocal fold conditions. The error
bars correspond to an uncertainty of 2 standard deviations.
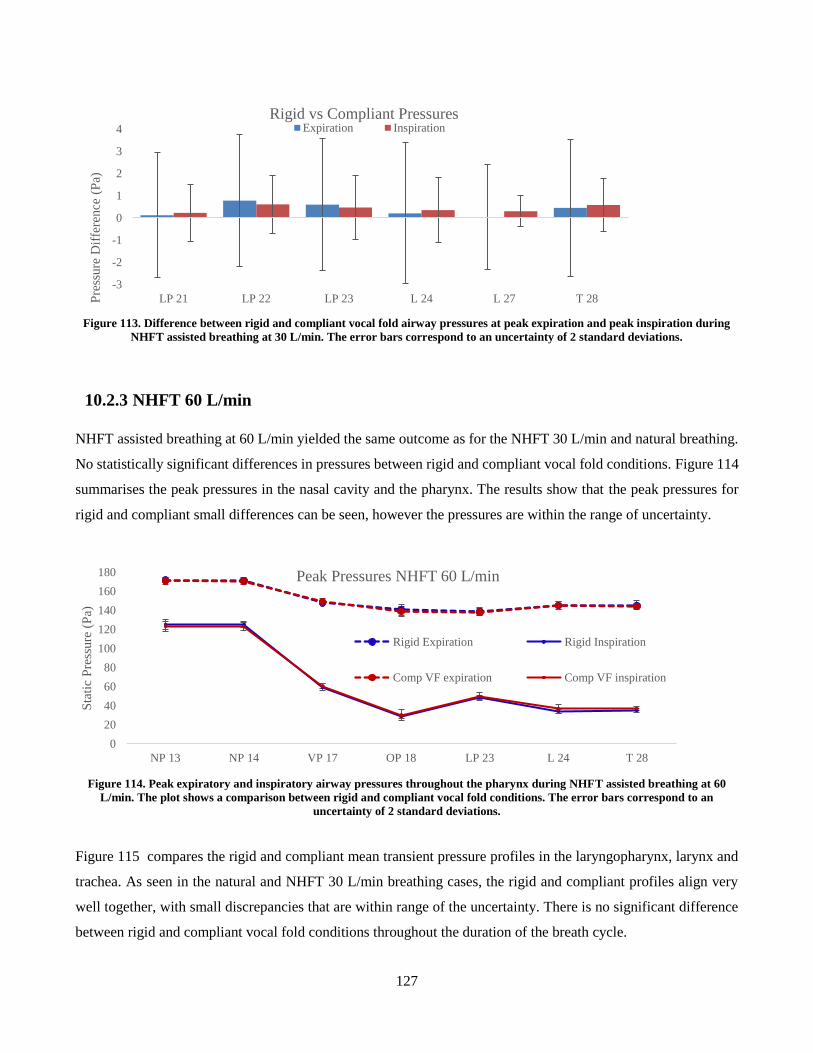
127
Figure 113. Difference between rigid and compliant vocal fold airway pressures at peak expiration and peak inspiration during
NHFT assisted breathing at 30 L/min. The error bars correspond to an uncertainty of 2 standard deviations.
10.2.3 NHFT 60 L/min
NHFT assisted breathing at 60 L/min yielded the same outcome as for the NHFT 30 L/min and natural breathing.
No statistically significant differences in pressures between rigid and compliant vocal fold conditions. Figure 114
summarises the peak pressures in the nasal cavity and the pharynx. The results show that the peak pressures for
rigid and compliant small differences can be seen, however the pressures are within the range of uncertainty.
Figure 114. Peak expiratory and inspiratory airway pressures throughout the pharynx during NHFT assisted breathing at 60
L/min. The plot shows a comparison between rigid and compliant vocal fold conditions. The error bars correspond to an
uncertainty of 2 standard deviations.
Figure 115 compares the rigid and compliant mean transient pressure profiles in the laryngopharynx, larynx and
trachea. As seen in the natural and NHFT 30 L/min breathing cases, the rigid and compliant profiles align very
well together, with small discrepancies that are within range of the uncertainty. There is no significant difference
between rigid and compliant vocal fold conditions throughout the duration of the breath cycle.
-3
-2
-1
0
1
2
3
4
LP 21 LP 22 LP 23 L 24 L 27 T 28Pre
ssure
Dif
fere
nce
(P
a)
Rigid vs Compliant PressuresExpiration Inspiration
0
20
40
60
80
100
120
140
160
180
NP 13 NP 14 VP 17 OP 18 LP 23 L 24 T 28
Sta
tic
Pre
ssure
(P
a)
Peak Pressures NHFT 60 L/min
Rigid Expiration Rigid Inspiration
Comp VF expiration Comp VF inspiration
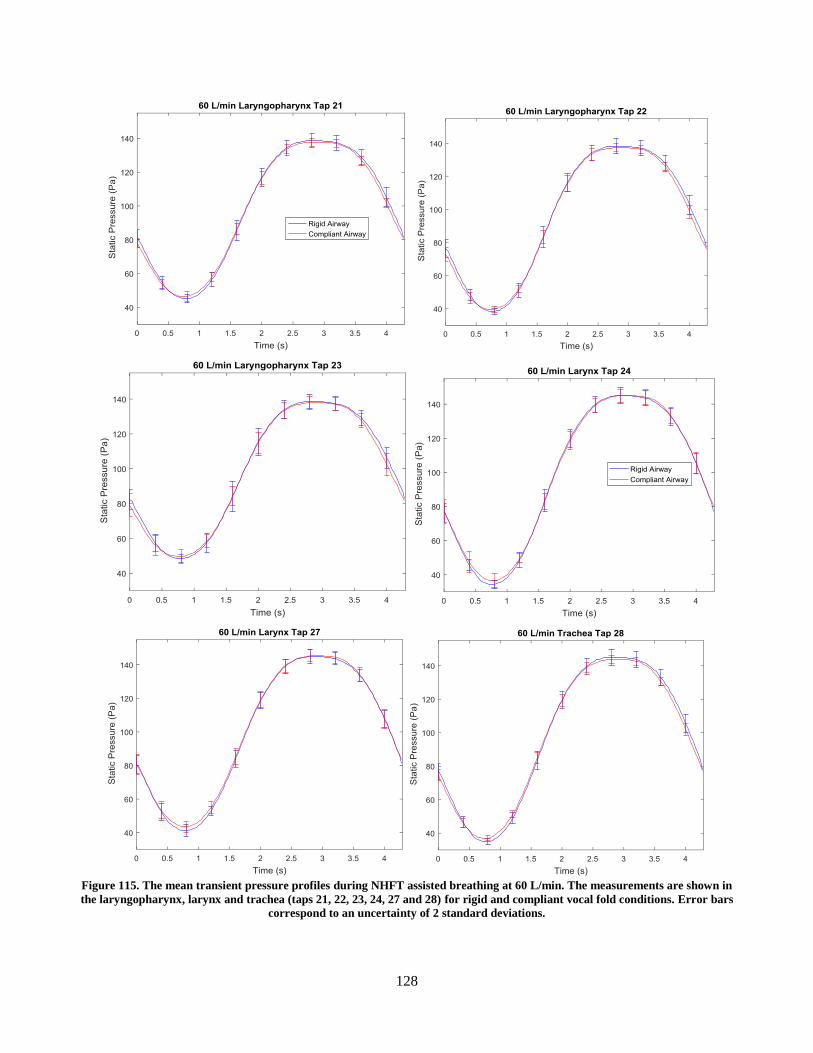
128
Figure 115. The mean transient pressure profiles during NHFT assisted breathing at 60 L/min. The measurements are shown in
the laryngopharynx, larynx and trachea (taps 21, 22, 23, 24, 27 and 28) for rigid and compliant vocal fold conditions. Error bars
correspond to an uncertainty of 2 standard deviations.
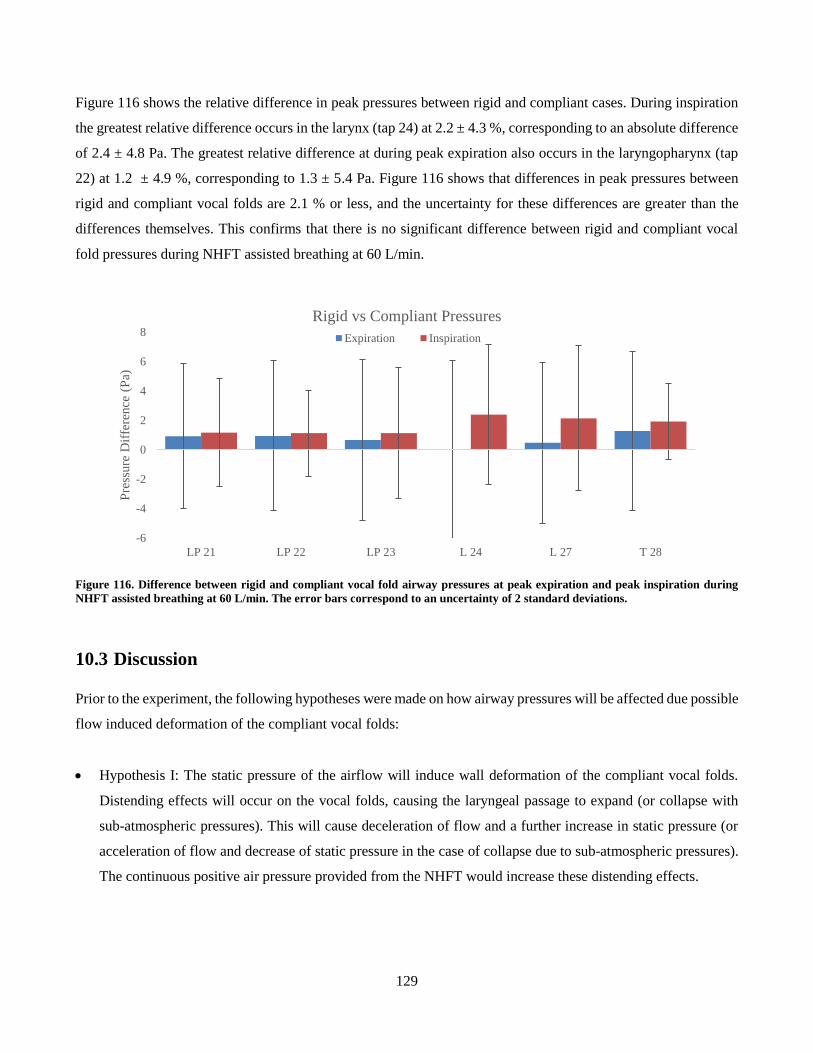
129
Figure 116 shows the relative difference in peak pressures between rigid and compliant cases. During inspiration
the greatest relative difference occurs in the larynx (tap 24) at 2.2 ± 4.3 %, corresponding to an absolute difference
of 2.4 ± 4.8 Pa. The greatest relative difference at during peak expiration also occurs in the laryngopharynx (tap
22) at 1.2 ± 4.9 %, corresponding to 1.3 ± 5.4 Pa. Figure 116 shows that differences in peak pressures between
rigid and compliant vocal folds are 2.1 % or less, and the uncertainty for these differences are greater than the
differences themselves. This confirms that there is no significant difference between rigid and compliant vocal
fold pressures during NHFT assisted breathing at 60 L/min.
Figure 116. Difference between rigid and compliant vocal fold airway pressures at peak expiration and peak inspiration during
NHFT assisted breathing at 60 L/min. The error bars correspond to an uncertainty of 2 standard deviations.
10.3 Discussion
Prior to the experiment, the following hypotheses were made on how airway pressures will be affected due possible
flow induced deformation of the compliant vocal folds:
Hypothesis I: The static pressure of the airflow will induce wall deformation of the compliant vocal folds.
Distending effects will occur on the vocal folds, causing the laryngeal passage to expand (or collapse with
sub-atmospheric pressures). This will cause deceleration of flow and a further increase in static pressure (or
acceleration of flow and decrease of static pressure in the case of collapse due to sub-atmospheric pressures).
The continuous positive air pressure provided from the NHFT would increase these distending effects.
-6
-4
-2
0
2
4
6
8
LP 21 LP 22 LP 23 L 24 L 27 T 28
Pre
ssure
Dif
fere
nce
(P
a)
Rigid vs Compliant Pressures
Expiration Inspiration
130
Hypothesis II: The wall shear stress from the airflow acting on the surface and the complaint vocal folds will
cause the silicone layer to deform parallel to the flow and deform in shear. It is difficult to determine how
shear induced deformation would affect the breathing pressures.
Hypothesis III: A combination of both I and II will contribute to changes in airway pressures between
compliant and rigid vocal fold conditions.
Hypothesis IV: Compliant vocal folds do not affect the airway pressures during natural and NHFT assisted
breathing.
The results conclude that there was no statistically significant difference in airway pressures between rigid and
compliant vocal folds for all three tested breathing cases. The relative differences of the peak airway pressures
between rigid and compliant condition airway models were under 2.5 % and were always less than the associated
uncertainty. The uncertainty of the pressure differences obtained from 2 standard deviations from the experiment
reached as high as ± 6 % when taken relative to the peak to peak pressure of the mean rigid pressure profiles. It is
possible that there were differences in airway pressures between rigid and compliant vocal fold conditions,
however the experimental method may lack the accuracy to successfully detect these.Although the conclusion to
this study states that there were no significant changes in airway pressures for rigid vs compliant, it cannot be ruled
out that airflow does not induce deformation of the compliant vocal folds. It is possible that some deformation of
the compliant vocal fold simulant may have occurred in the experiment, but was not sufficient enough to induce
significant static pressure changes for the tested breathing conditions.
There are limited studies in literature that have investigated how the compliant vocal folds affect breathing. Kim
et al. (2010) carried out a FSI on a compliant larynx for natural inspiration only and found significant deformation
of the larynx of up to 0.9 mm. It was unclear what mode of deformation this was, and the study was not compared
against rigid airway simulations, hence it is unknown how this deformation affected breathing. The pressure in the
larynx observed by Kim et al. (2010) was approximately – 80 Pa, which is significantly greater than the – 28 Pa
laryngeal pressure of the current study, measured during natural inspiration. This difference is most likely due to
the difference in airway anatomy, as Kim et al. (2010) used a closed mouth airway, which tend to experiences
greater peak expiratory pressures, and more negative peak inspiratory pressures during inspiration, compared to
open mouth. They also used a greater peak inspiratory flow rate corresponded to 35 L/min, while the current study
had a peak inspiratory flow 19.7 L/min, which would have affected the airway pressures.
The vocal folds are located in the larynx, and they are comprised of several tissue layers, which are anchored to
cartilage. The tissue layers can be grouped by two categories corresponding to depth: the vocal fold cover, which
are the superficial layers, and the vocal fold body, comprised of the vocal fold ligament, and the deeper vocal fold
131
muscle. In the current study, the compliant vocal fold insert was comprised of an outer rigid frame with an internal
compliant surface which replicated the laryngeal airway passage. The compliant surface was comprised of 2.5 mm
thick silicone layer, which simulated the compliance of the vocal fold cover and the superficial layer of the vocal
fold ligament. The model in the current study neglected the deeper, compliant tissues, such as the deep lamina
propria (vocal fold ligament) and vocal fold muscle, as these layers were part of the rigid frame insert. The CT
scan that was used was limited as it did not have enough contrast to differentiate between tissue types and hence
the histology of the deeper tissues could not be replicated in the insert. For more accurate replication of the tissue
layer anatomy, a better quality medical scan is required which successfully captures the tissue histology. However,
it was thought that simulating the vocal fold cover would be a sufficient enough representation of vocal fold
compliance. The vocal fold body-cover concept theorizes that phonation occurs due to the vibration of the vocal
fold cover. Though this study replicated vocal folds in a normal breathing state with no voice production, it was
assumed that the vocal fold cover would be the most significant contributor to any potential compliant effects on
the flow. Limiting the compliant vocal fold insert to the vocal fold cover also maintained simplicity in its design
and manufacturing process.
The compliant vocal folds can be analogous to flow through a compliant tube. For expansion or collapse of the of
the compliant tube to occur, the magnitude of pressure in the flow must exceed the atmospheric pressure outside
the tube, and great enough to deform the compliant boundary. It is possible that the boundary condition of the
vocal fold inserts’ rigid frame prevented significant distending or collapsing effects on the compliant vocal fold
as it acted as reinforcement to the compliant surface. Or perhaps flow induced deformation of the compliant vocal
folds did occur, however the total volume of the compliant region was too small for geometrical distortions to
significantly affect airway pressures. If the compliant boundary was extended to replicate the deeper tissues, there
would be a greater compliant-layer-to-rigid-boundary thickness ratio, and there would be a greater volume of
deformable region, which could possibly affect the flow with the aforementioned hypotheses. A phenomenon often
seen in flows through complaint tubes is wave propagation. Previous studies, reported in literature, have
investigated the effects of internal compliant surfaces in a rigid tube and found that for a greater compliant layer
thickness, an increase in wall shear stress of the air flow would occur, and hence initiate unstable waves on the
compliant surface (Clarke et al., 1970; Evrensel et al., 1993). The waves along the compliant lining were shown
to increase resistance to the flow. There was no indication that such a phenomenon had occurred in the current
study with the compliant vocal fold airway condition. However, it is possible that with a greater compliant region,
which encompasses the deeper vocal fold tissues, this phenomenon may occur in a complaint vocal fold airway
condition, causing an increase in airway resistance and hence an increase airway pressures.
132
It should be noted that the current study did not replicate an accurate model, only the passive properties of the
muscles. In a real human airway, there is involuntary activity of the intrinsic muscles that maintain airway patency,
and prevent collapse. Muscle activity would cause the tissue elasticity to vary, as a contracted muscle would have
a greater stiffness than a relaxed muscle, hence vocal fold compliance would also vary over time. However, the
purpose of this study was to investigate how the passive, flow induced motion of compliant tissues affected
breathing. The elastic modulus of the compliant vocal fold insert was based on excised vocal fold tissue properties,
reported by Chan et al. (2007), therefore it can be said that the compliant insert represented the vocal folds at their
residual tension. Also studies have shown that during respiration, the muscle activity causes variation in glottal
area, indicating that there are small actuations in the vocal folds (Scheinherr et al., 2015). Due to the limits of the
model, these muscle induced anatomical changes in the vocal folds were not simulated. The model was a static,
passive approximation of the compliant vocal fold airway condition.
It should be made clear that the anatomy of the vocal folds in the current airway model is specific to a single
person. Anatomical variation between people always exists, and variations in vocal fold geometry may result in
an increase in susceptibility to flow induced deformation. The rima glottidis, which is the airway space in the
larynx, between the vocal folds, can vary in area between 131 mm2 to 239 mm2 in healthy airways (Rubinstein et
al., 1989). For the airway model used in this research, this area was approximately 149 mm2. Vocal folds with a
smaller glottal area would experience larger pressure drops across the glottis, which may result in significant
compliant deformations. Therefore compliant vocal folds with variations in anatomy should be considered in future
studies. Compliant vocal folds should also be considered for a closed mouth model, as it was been documented in
the current study and previous studies that closed mouth airways have a greater resistance, and experience higher
pressures. This may have a greater impact on compliance.
10.4 Conclusion
The pressure experiment was performed for the airway model with compliant vocal folds. The results yielded that
there was no statistically significant difference in airway pressures between rigid and compliant vocal fold
conditions, for all three tested breathing modes. It is possible that this was due to the limitations of the vocal fold
model used, which only simulated the superficial compliant tissues. The vocal fold model should be further
developed to replicate the deeper tissues in the larynx. It cannot be stated that compliance of the vocal folds does
not affect natural and NHFT assisted breathing. It is also possible that the results are specific for the current airway
model. Anatomical variation must be considered, and tests should be carried out on vocal folds with smaller glottal
areas.
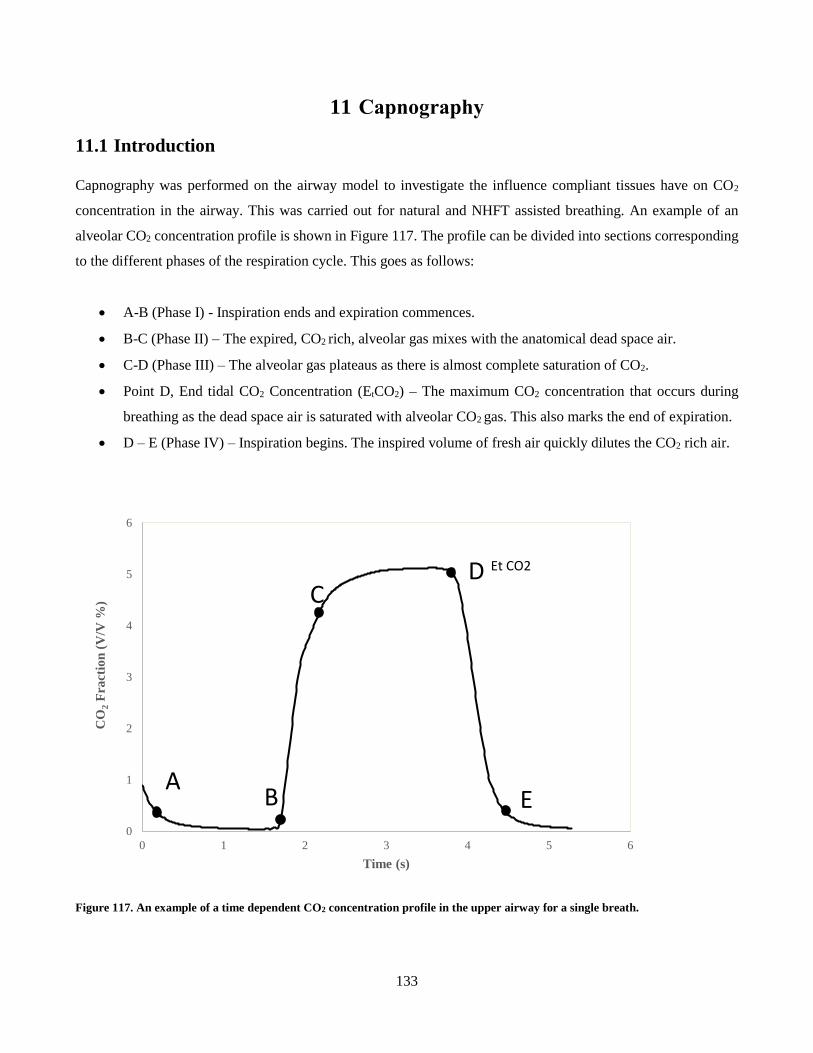
133
11 Capnography
11.1 Introduction
Capnography was performed on the airway model to investigate the influence compliant tissues have on CO2
concentration in the airway. This was carried out for natural and NHFT assisted breathing. An example of an
alveolar CO2 concentration profile is shown in Figure 117. The profile can be divided into sections corresponding
to the different phases of the respiration cycle. This goes as follows:
A-B (Phase I) - Inspiration ends and expiration commences.
B-C (Phase II) – The expired, CO2 rich, alveolar gas mixes with the anatomical dead space air.
C-D (Phase III) – The alveolar gas plateaus as there is almost complete saturation of CO2.
Point D, End tidal CO2 Concentration (EtCO2) – The maximum CO2 concentration that occurs during
breathing as the dead space air is saturated with alveolar CO2 gas. This also marks the end of expiration.
D – E (Phase IV) – Inspiration begins. The inspired volume of fresh air quickly dilutes the CO2 rich air.
Figure 117. An example of a time dependent CO2 concentration profile in the upper airway for a single breath.
0
1
2
3
4
5
6
0 1 2 3 4 5 6
CO
2F
ract
ion
(V
/V %
)
Time (s)
Et CO2
AB
CD
E
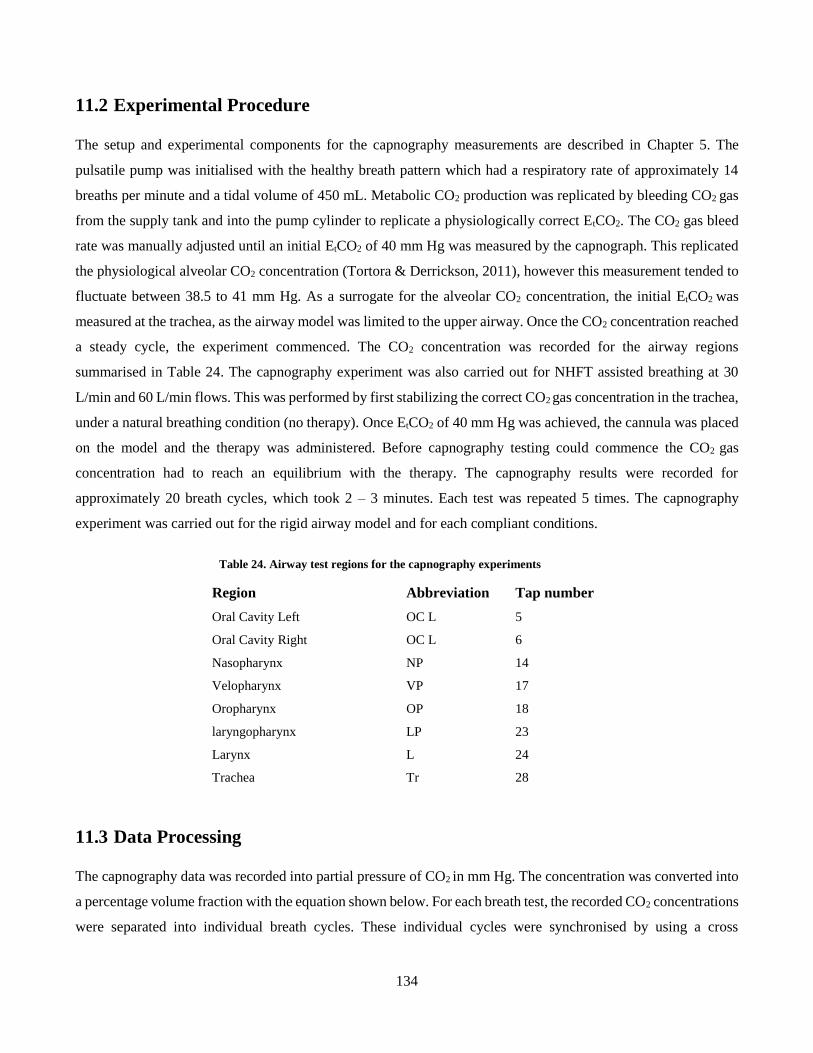
134
11.2 Experimental Procedure
The setup and experimental components for the capnography measurements are described in Chapter 5. The
pulsatile pump was initialised with the healthy breath pattern which had a respiratory rate of approximately 14
breaths per minute and a tidal volume of 450 mL. Metabolic CO2 production was replicated by bleeding CO2 gas
from the supply tank and into the pump cylinder to replicate a physiologically correct EtCO2. The CO2 gas bleed
rate was manually adjusted until an initial EtCO2 of 40 mm Hg was measured by the capnograph. This replicated
the physiological alveolar CO2 concentration (Tortora & Derrickson, 2011), however this measurement tended to
fluctuate between 38.5 to 41 mm Hg. As a surrogate for the alveolar CO2 concentration, the initial EtCO2 was
measured at the trachea, as the airway model was limited to the upper airway. Once the CO2 concentration reached
a steady cycle, the experiment commenced. The CO2 concentration was recorded for the airway regions
summarised in Table 24. The capnography experiment was also carried out for NHFT assisted breathing at 30
L/min and 60 L/min flows. This was performed by first stabilizing the correct CO2 gas concentration in the trachea,
under a natural breathing condition (no therapy). Once EtCO2 of 40 mm Hg was achieved, the cannula was placed
on the model and the therapy was administered. Before capnography testing could commence the CO2 gas
concentration had to reach an equilibrium with the therapy. The capnography results were recorded for
approximately 20 breath cycles, which took 2 – 3 minutes. Each test was repeated 5 times. The capnography
experiment was carried out for the rigid airway model and for each compliant conditions.
Table 24. Airway test regions for the capnography experiments
Region Abbreviation Tap number
Oral Cavity Left OC L 5
Oral Cavity Right OC L 6
Nasopharynx NP 14
Velopharynx VP 17
Oropharynx OP 18
laryngopharynx LP 23
Larynx L 24
Trachea Tr 28
11.3 Data Processing
The capnography data was recorded into partial pressure of CO2 in mm Hg. The concentration was converted into
a percentage volume fraction with the equation shown below. For each breath test, the recorded CO2 concentrations
were separated into individual breath cycles. These individual cycles were synchronised by using a cross
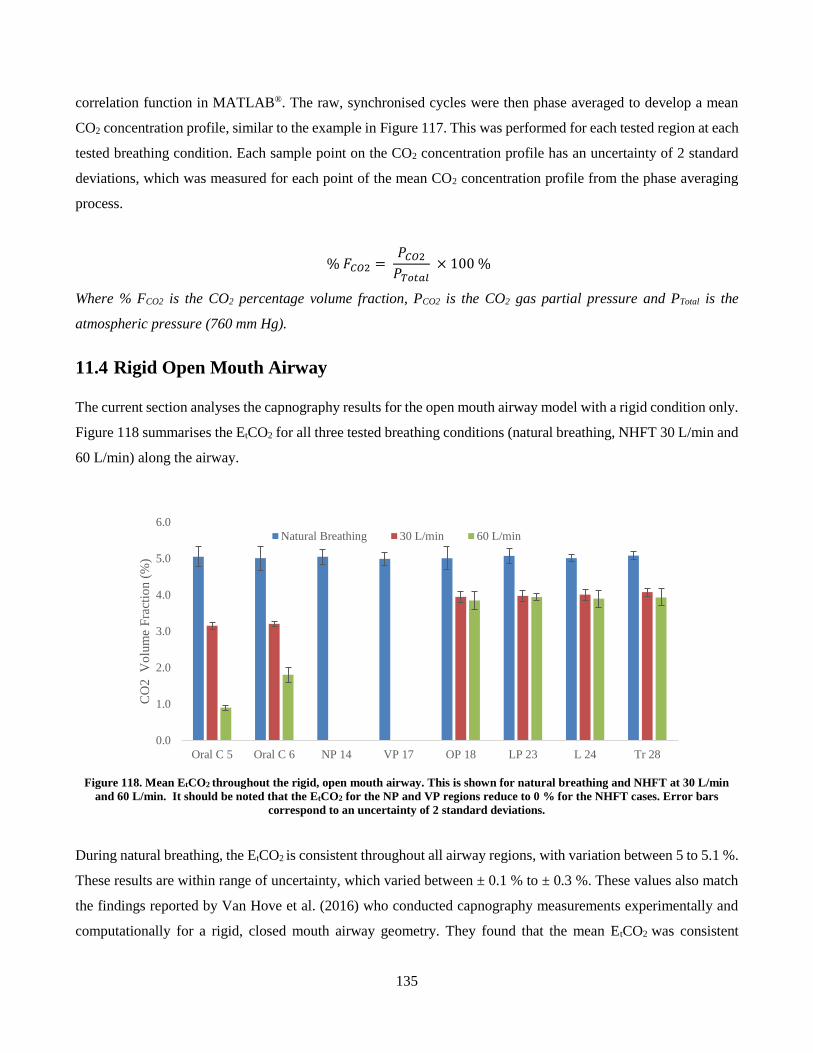
135
correlation function in MATLAB®. The raw, synchronised cycles were then phase averaged to develop a mean
CO2 concentration profile, similar to the example in Figure 117. This was performed for each tested region at each
tested breathing condition. Each sample point on the CO2 concentration profile has an uncertainty of 2 standard
deviations, which was measured for each point of the mean CO2 concentration profile from the phase averaging
process.
% 𝐹𝐶𝑂2 = 𝑃𝐶𝑂2
𝑃𝑇𝑜𝑡𝑎𝑙 × 100 %
Where % FCO2 is the CO2 percentage volume fraction, PCO2 is the CO2 gas partial pressure and PTotal is the
atmospheric pressure (760 mm Hg).
11.4 Rigid Open Mouth Airway
The current section analyses the capnography results for the open mouth airway model with a rigid condition only.
Figure 118 summarises the EtCO2 for all three tested breathing conditions (natural breathing, NHFT 30 L/min and
60 L/min) along the airway.
Figure 118. Mean EtCO2 throughout the rigid, open mouth airway. This is shown for natural breathing and NHFT at 30 L/min
and 60 L/min. It should be noted that the EtCO2 for the NP and VP regions reduce to 0 % for the NHFT cases. Error bars
correspond to an uncertainty of 2 standard deviations.
During natural breathing, the EtCO2 is consistent throughout all airway regions, with variation between 5 to 5.1 %.
These results are within range of uncertainty, which varied between ± 0.1 % to ± 0.3 %. These values also match
the findings reported by Van Hove et al. (2016) who conducted capnography measurements experimentally and
computationally for a rigid, closed mouth airway geometry. They found that the mean EtCO2 was consistent
0.0
1.0
2.0
3.0
4.0
5.0
6.0
Oral C 5 Oral C 6 NP 14 VP 17 OP 18 LP 23 L 24 Tr 28
CO
2
Vo
lum
e F
ract
ion (
%)
Natural Breathing 30 L/min 60 L/min
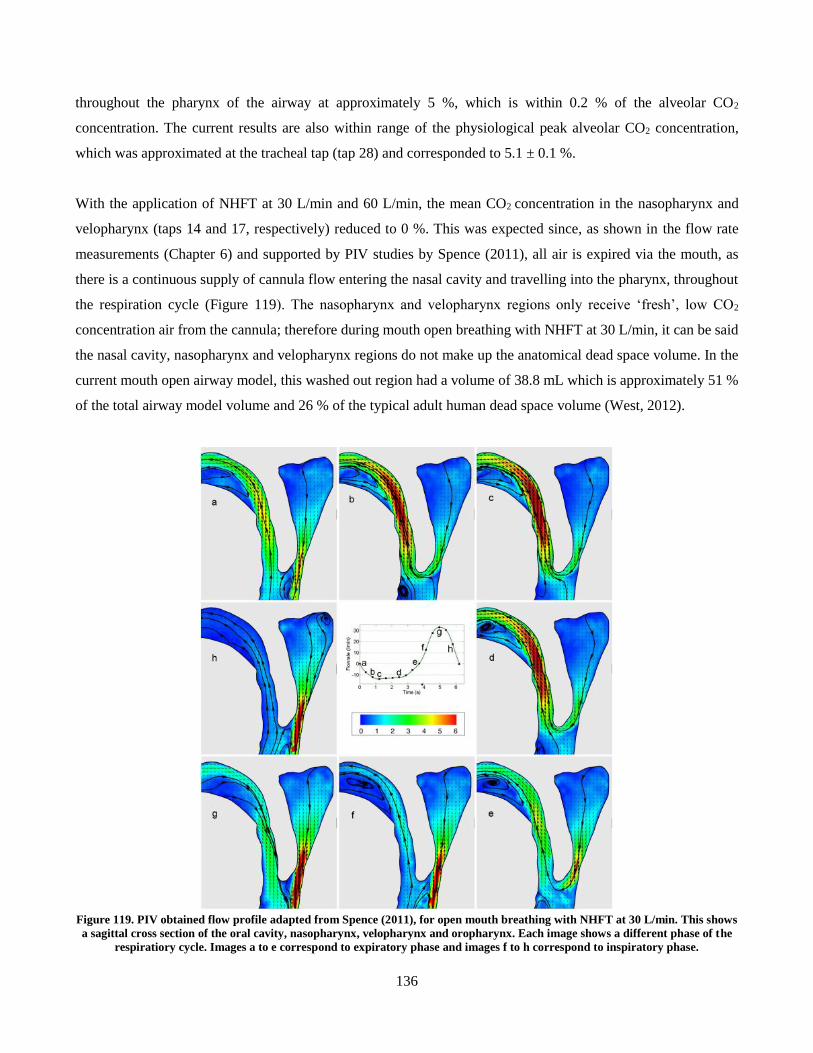
136
throughout the pharynx of the airway at approximately 5 %, which is within 0.2 % of the alveolar CO2
concentration. The current results are also within range of the physiological peak alveolar CO2 concentration,
which was approximated at the tracheal tap (tap 28) and corresponded to 5.1 ± 0.1 %.
With the application of NHFT at 30 L/min and 60 L/min, the mean CO2 concentration in the nasopharynx and
velopharynx (taps 14 and 17, respectively) reduced to 0 %. This was expected since, as shown in the flow rate
measurements (Chapter 6) and supported by PIV studies by Spence (2011), all air is expired via the mouth, as
there is a continuous supply of cannula flow entering the nasal cavity and travelling into the pharynx, throughout
the respiration cycle (Figure 119). The nasopharynx and velopharynx regions only receive ‘fresh’, low CO2
concentration air from the cannula; therefore during mouth open breathing with NHFT at 30 L/min, it can be said
the nasal cavity, nasopharynx and velopharynx regions do not make up the anatomical dead space volume. In the
current mouth open airway model, this washed out region had a volume of 38.8 mL which is approximately 51 %
of the total airway model volume and 26 % of the typical adult human dead space volume (West, 2012).
Figure 119. PIV obtained flow profile adapted from Spence (2011), for open mouth breathing with NHFT at 30 L/min. This shows
a sagittal cross section of the oral cavity, nasopharynx, velopharynx and oropharynx. Each image shows a different phase of the
respiratiory cycle. Images a to e correspond to expiratory phase and images f to h correspond to inspiratory phase.
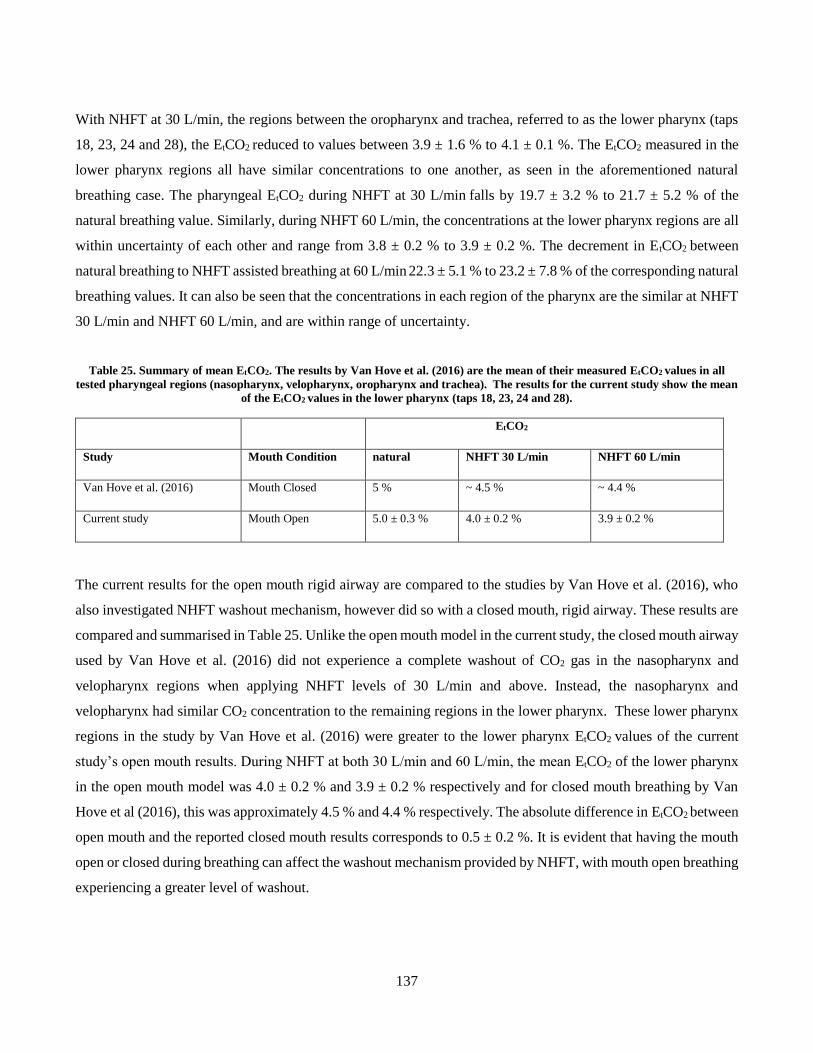
137
With NHFT at 30 L/min, the regions between the oropharynx and trachea, referred to as the lower pharynx (taps
18, 23, 24 and 28), the EtCO2 reduced to values between 3.9 ± 1.6 % to 4.1 ± 0.1 %. The EtCO2 measured in the
lower pharynx regions all have similar concentrations to one another, as seen in the aforementioned natural
breathing case. The pharyngeal EtCO2 during NHFT at 30 L/min falls by 19.7 ± 3.2 % to 21.7 ± 5.2 % of the
natural breathing value. Similarly, during NHFT 60 L/min, the concentrations at the lower pharynx regions are all
within uncertainty of each other and range from 3.8 ± 0.2 % to 3.9 ± 0.2 %. The decrement in EtCO2 between
natural breathing to NHFT assisted breathing at 60 L/min 22.3 ± 5.1 % to 23.2 ± 7.8 % of the corresponding natural
breathing values. It can also be seen that the concentrations in each region of the pharynx are the similar at NHFT
30 L/min and NHFT 60 L/min, and are within range of uncertainty.
Table 25. Summary of mean EtCO2. The results by Van Hove et al. (2016) are the mean of their measured EtCO2 values in all
tested pharyngeal regions (nasopharynx, velopharynx, oropharynx and trachea). The results for the current study show the mean
of the EtCO2 values in the lower pharynx (taps 18, 23, 24 and 28).
EtCO2
Study Mouth Condition natural NHFT 30 L/min NHFT 60 L/min
Van Hove et al. (2016) Mouth Closed 5 % ~ 4.5 % ~ 4.4 %
Current study Mouth Open 5.0 ± 0.3 % 4.0 ± 0.2 % 3.9 ± 0.2 %
The current results for the open mouth rigid airway are compared to the studies by Van Hove et al. (2016), who
also investigated NHFT washout mechanism, however did so with a closed mouth, rigid airway. These results are
compared and summarised in Table 25. Unlike the open mouth model in the current study, the closed mouth airway
used by Van Hove et al. (2016) did not experience a complete washout of CO2 gas in the nasopharynx and
velopharynx regions when applying NHFT levels of 30 L/min and above. Instead, the nasopharynx and
velopharynx had similar CO2 concentration to the remaining regions in the lower pharynx. These lower pharynx
regions in the study by Van Hove et al. (2016) were greater to the lower pharynx EtCO2 values of the current
study’s open mouth results. During NHFT at both 30 L/min and 60 L/min, the mean EtCO2 of the lower pharynx
in the open mouth model was 4.0 ± 0.2 % and 3.9 ± 0.2 % respectively and for closed mouth breathing by Van
Hove et al (2016), this was approximately 4.5 % and 4.4 % respectively. The absolute difference in EtCO2 between
open mouth and the reported closed mouth results corresponds to 0.5 ± 0.2 %. It is evident that having the mouth
open or closed during breathing can affect the washout mechanism provided by NHFT, with mouth open breathing
experiencing a greater level of washout.
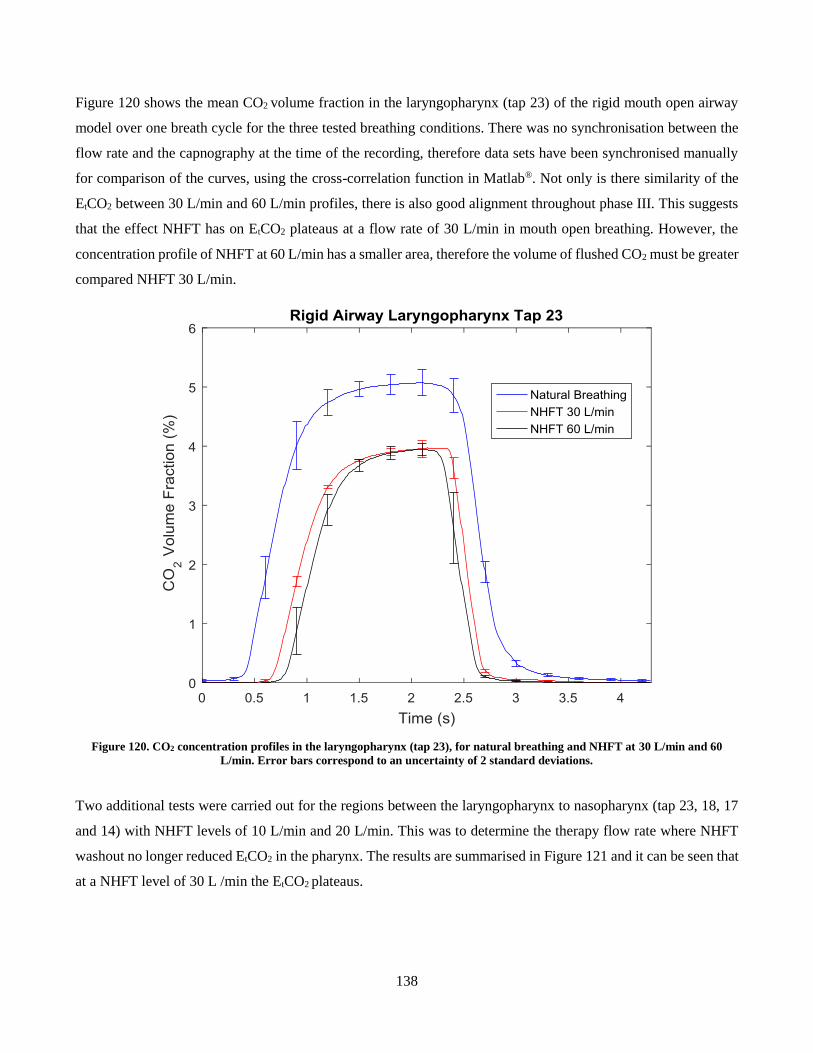
138
Figure 120 shows the mean CO2 volume fraction in the laryngopharynx (tap 23) of the rigid mouth open airway
model over one breath cycle for the three tested breathing conditions. There was no synchronisation between the
flow rate and the capnography at the time of the recording, therefore data sets have been synchronised manually
for comparison of the curves, using the cross-correlation function in Matlab®. Not only is there similarity of the
EtCO2 between 30 L/min and 60 L/min profiles, there is also good alignment throughout phase III. This suggests
that the effect NHFT has on EtCO2 plateaus at a flow rate of 30 L/min in mouth open breathing. However, the
concentration profile of NHFT at 60 L/min has a smaller area, therefore the volume of flushed CO2 must be greater
compared NHFT 30 L/min.
Figure 120. CO2 concentration profiles in the laryngopharynx (tap 23), for natural breathing and NHFT at 30 L/min and 60
L/min. Error bars correspond to an uncertainty of 2 standard deviations.
Two additional tests were carried out for the regions between the laryngopharynx to nasopharynx (tap 23, 18, 17
and 14) with NHFT levels of 10 L/min and 20 L/min. This was to determine the therapy flow rate where NHFT
washout no longer reduced EtCO2 in the pharynx. The results are summarised in Figure 121 and it can be seen that
at a NHFT level of 30 L /min the EtCO2 plateaus.
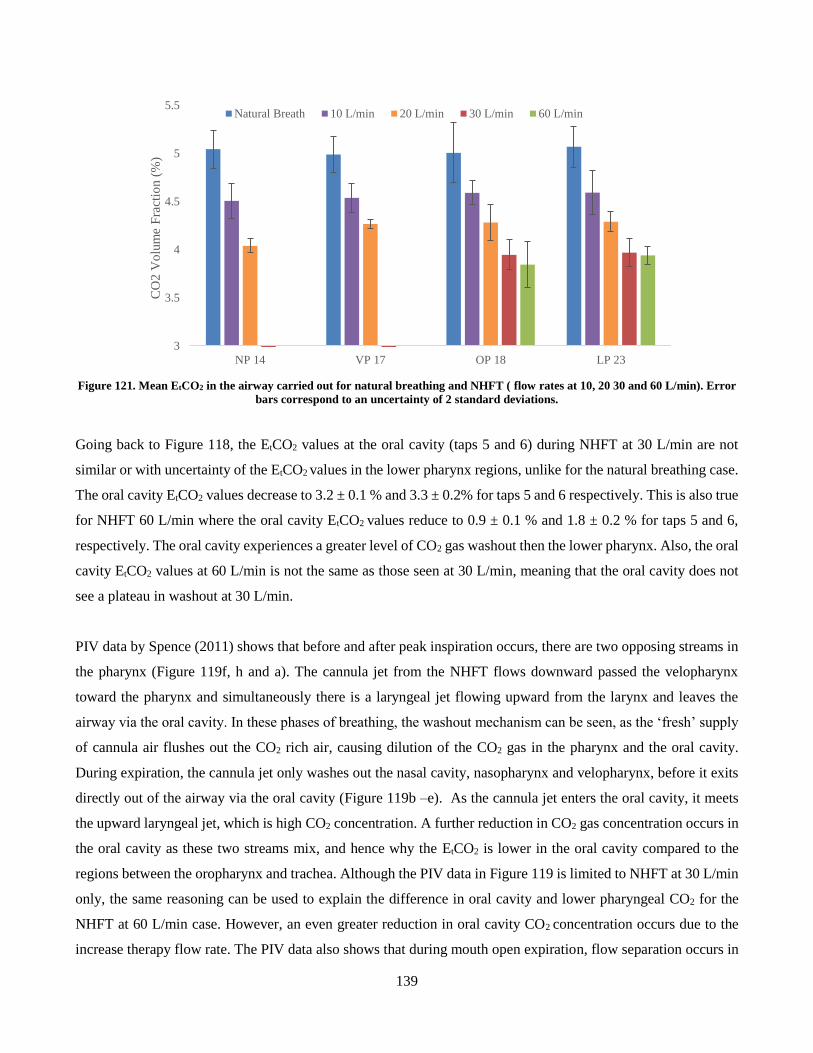
139
Figure 121. Mean EtCO2 in the airway carried out for natural breathing and NHFT ( flow rates at 10, 20 30 and 60 L/min). Error
bars correspond to an uncertainty of 2 standard deviations.
Going back to Figure 118, the EtCO2 values at the oral cavity (taps 5 and 6) during NHFT at 30 L/min are not
similar or with uncertainty of the EtCO2 values in the lower pharynx regions, unlike for the natural breathing case.
The oral cavity EtCO2 values decrease to 3.2 ± 0.1 % and 3.3 ± 0.2% for taps 5 and 6 respectively. This is also true
for NHFT 60 L/min where the oral cavity EtCO2 values reduce to 0.9 ± 0.1 % and 1.8 ± 0.2 % for taps 5 and 6,
respectively. The oral cavity experiences a greater level of CO2 gas washout then the lower pharynx. Also, the oral
cavity EtCO2 values at 60 L/min is not the same as those seen at 30 L/min, meaning that the oral cavity does not
see a plateau in washout at 30 L/min.
PIV data by Spence (2011) shows that before and after peak inspiration occurs, there are two opposing streams in
the pharynx (Figure 119f, h and a). The cannula jet from the NHFT flows downward passed the velopharynx
toward the pharynx and simultaneously there is a laryngeal jet flowing upward from the larynx and leaves the
airway via the oral cavity. In these phases of breathing, the washout mechanism can be seen, as the ‘fresh’ supply
of cannula air flushes out the CO2 rich air, causing dilution of the CO2 gas in the pharynx and the oral cavity.
During expiration, the cannula jet only washes out the nasal cavity, nasopharynx and velopharynx, before it exits
directly out of the airway via the oral cavity (Figure 119b –e). As the cannula jet enters the oral cavity, it meets
the upward laryngeal jet, which is high CO2 concentration. A further reduction in CO2 gas concentration occurs in
the oral cavity as these two streams mix, and hence why the EtCO2 is lower in the oral cavity compared to the
regions between the oropharynx and trachea. Although the PIV data in Figure 119 is limited to NHFT at 30 L/min
only, the same reasoning can be used to explain the difference in oral cavity and lower pharyngeal CO2 for the
NHFT at 60 L/min case. However, an even greater reduction in oral cavity CO2 concentration occurs due to the
increase therapy flow rate. The PIV data also shows that during mouth open expiration, flow separation occurs in
3
3.5
4
4.5
5
5.5
NP 14 VP 17 OP 18 LP 23
CO
2 V
olu
me
Fra
ctio
n (
%)
Natural Breath 10 L/min 20 L/min 30 L/min 60 L/min
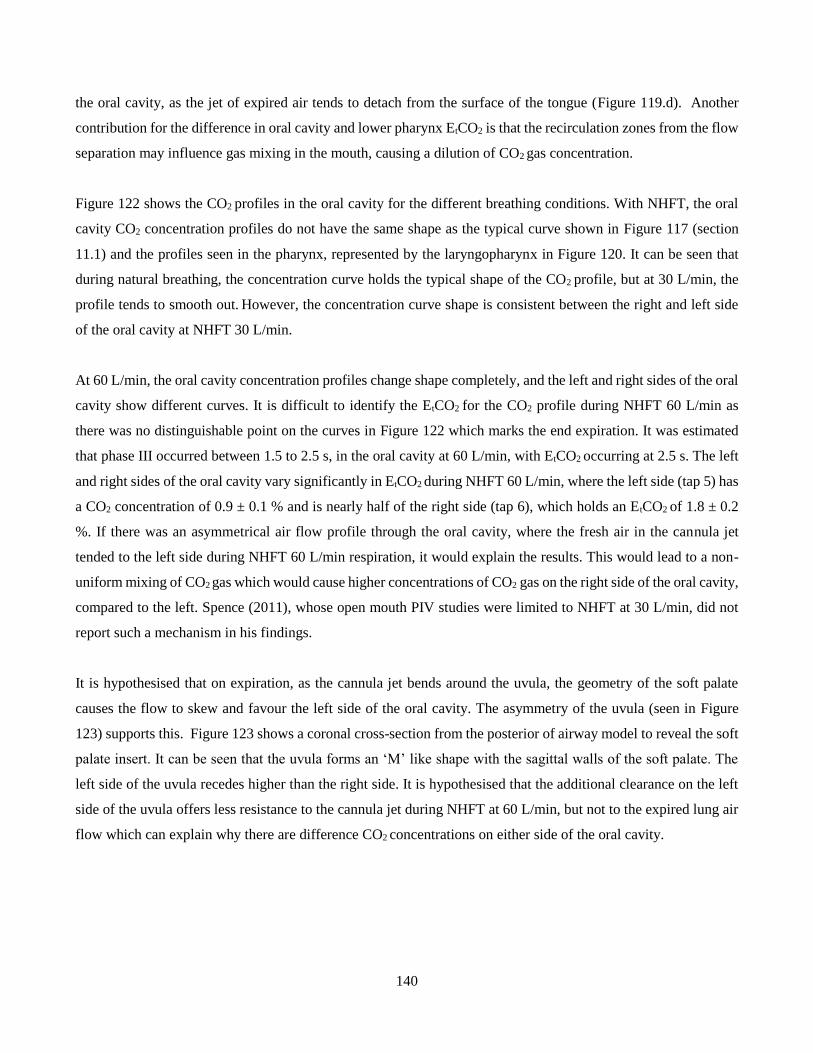
140
the oral cavity, as the jet of expired air tends to detach from the surface of the tongue (Figure 119.d). Another
contribution for the difference in oral cavity and lower pharynx EtCO2 is that the recirculation zones from the flow
separation may influence gas mixing in the mouth, causing a dilution of CO2 gas concentration.
Figure 122 shows the CO2 profiles in the oral cavity for the different breathing conditions. With NHFT, the oral
cavity CO2 concentration profiles do not have the same shape as the typical curve shown in Figure 117 (section
11.1) and the profiles seen in the pharynx, represented by the laryngopharynx in Figure 120. It can be seen that
during natural breathing, the concentration curve holds the typical shape of the CO2 profile, but at 30 L/min, the
profile tends to smooth out. However, the concentration curve shape is consistent between the right and left side
of the oral cavity at NHFT 30 L/min.
At 60 L/min, the oral cavity concentration profiles change shape completely, and the left and right sides of the oral
cavity show different curves. It is difficult to identify the EtCO2 for the CO2 profile during NHFT 60 L/min as
there was no distinguishable point on the curves in Figure 122 which marks the end expiration. It was estimated
that phase III occurred between 1.5 to 2.5 s, in the oral cavity at 60 L/min, with EtCO2 occurring at 2.5 s. The left
and right sides of the oral cavity vary significantly in EtCO2 during NHFT 60 L/min, where the left side (tap 5) has
a CO2 concentration of 0.9 ± 0.1 % and is nearly half of the right side (tap 6), which holds an EtCO2 of 1.8 ± 0.2
%. If there was an asymmetrical air flow profile through the oral cavity, where the fresh air in the cannula jet
tended to the left side during NHFT 60 L/min respiration, it would explain the results. This would lead to a non-
uniform mixing of CO2 gas which would cause higher concentrations of CO2 gas on the right side of the oral cavity,
compared to the left. Spence (2011), whose open mouth PIV studies were limited to NHFT at 30 L/min, did not
report such a mechanism in his findings.
It is hypothesised that on expiration, as the cannula jet bends around the uvula, the geometry of the soft palate
causes the flow to skew and favour the left side of the oral cavity. The asymmetry of the uvula (seen in Figure
123) supports this. Figure 123 shows a coronal cross-section from the posterior of airway model to reveal the soft
palate insert. It can be seen that the uvula forms an ‘M’ like shape with the sagittal walls of the soft palate. The
left side of the uvula recedes higher than the right side. It is hypothesised that the additional clearance on the left
side of the uvula offers less resistance to the cannula jet during NHFT at 60 L/min, but not to the expired lung air
flow which can explain why there are difference CO2 concentrations on either side of the oral cavity.
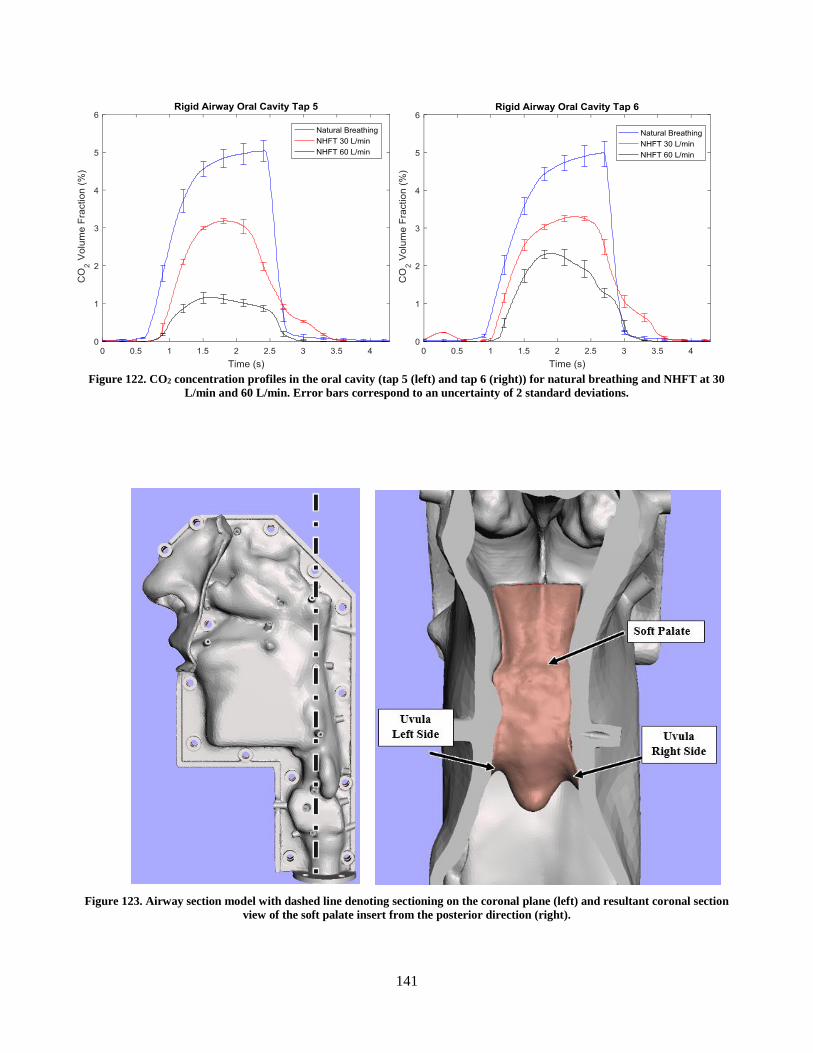
141
Figure 122. CO2 concentration profiles in the oral cavity (tap 5 (left) and tap 6 (right)) for natural breathing and NHFT at 30
L/min and 60 L/min. Error bars correspond to an uncertainty of 2 standard deviations.
Figure 123. Airway section model with dashed line denoting sectioning on the coronal plane (left) and resultant coronal section
view of the soft palate insert from the posterior direction (right).
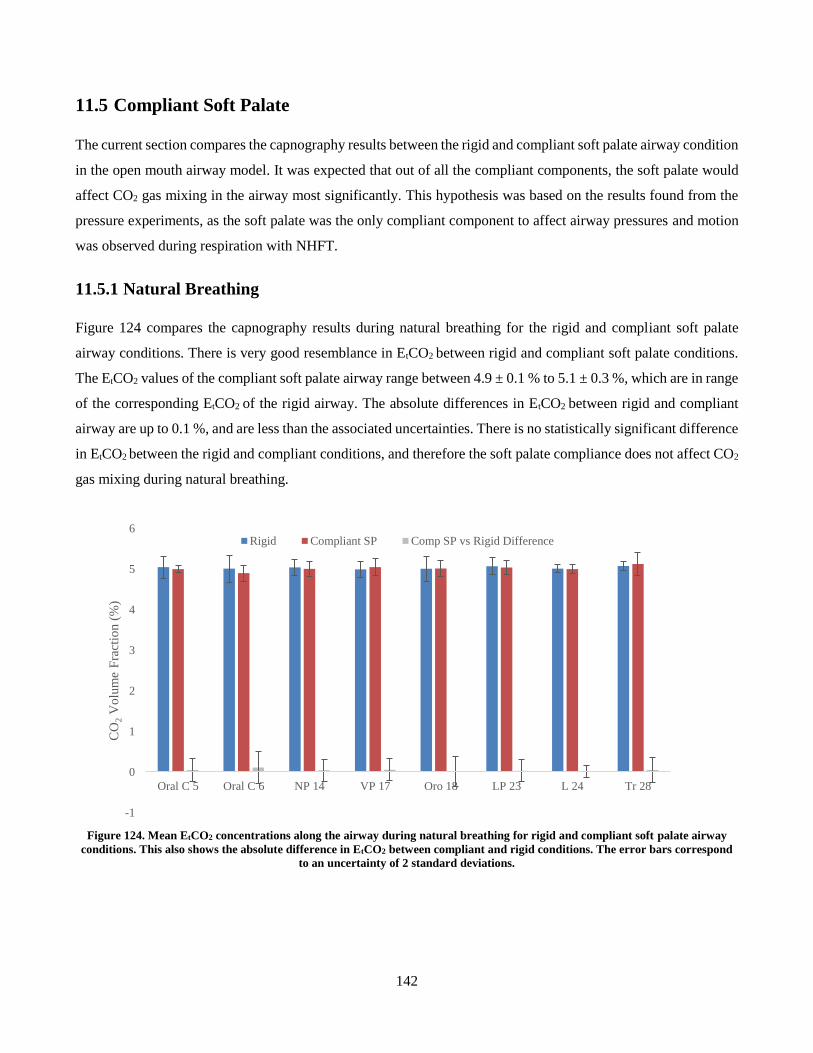
142
11.5 Compliant Soft Palate
The current section compares the capnography results between the rigid and compliant soft palate airway condition
in the open mouth airway model. It was expected that out of all the compliant components, the soft palate would
affect CO2 gas mixing in the airway most significantly. This hypothesis was based on the results found from the
pressure experiments, as the soft palate was the only compliant component to affect airway pressures and motion
was observed during respiration with NHFT.
11.5.1 Natural Breathing
Figure 124 compares the capnography results during natural breathing for the rigid and compliant soft palate
airway conditions. There is very good resemblance in EtCO2 between rigid and compliant soft palate conditions.
The EtCO2 values of the compliant soft palate airway range between 4.9 ± 0.1 % to 5.1 ± 0.3 %, which are in range
of the corresponding EtCO2 of the rigid airway. The absolute differences in EtCO2 between rigid and compliant
airway are up to 0.1 %, and are less than the associated uncertainties. There is no statistically significant difference
in EtCO2 between the rigid and compliant conditions, and therefore the soft palate compliance does not affect CO2
gas mixing during natural breathing.
Figure 124. Mean EtCO2 concentrations along the airway during natural breathing for rigid and compliant soft palate airway
conditions. This also shows the absolute difference in EtCO2 between compliant and rigid conditions. The error bars correspond
to an uncertainty of 2 standard deviations.
-1
0
1
2
3
4
5
6
Oral C 5 Oral C 6 NP 14 VP 17 Oro 18 LP 23 L 24 Tr 28
CO
2V
olu
me
Fra
ctio
n (
%)
Rigid Compliant SP Comp SP vs Rigid Difference
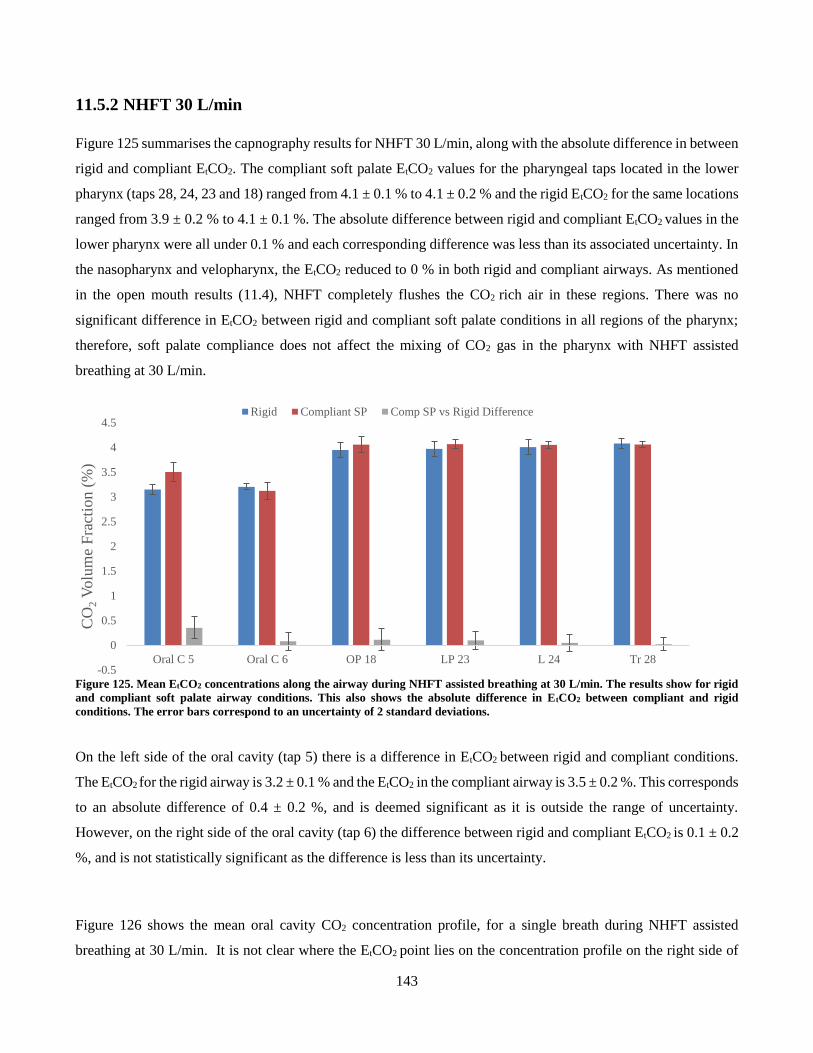
143
11.5.2 NHFT 30 L/min
Figure 125 summarises the capnography results for NHFT 30 L/min, along with the absolute difference in between
rigid and compliant EtCO2. The compliant soft palate EtCO2 values for the pharyngeal taps located in the lower
pharynx (taps 28, 24, 23 and 18) ranged from 4.1 ± 0.1 % to 4.1 ± 0.2 % and the rigid EtCO2 for the same locations
ranged from 3.9 ± 0.2 % to 4.1 ± 0.1 %. The absolute difference between rigid and compliant EtCO2 values in the
lower pharynx were all under 0.1 % and each corresponding difference was less than its associated uncertainty. In
the nasopharynx and velopharynx, the EtCO2 reduced to 0 % in both rigid and compliant airways. As mentioned
in the open mouth results (11.4), NHFT completely flushes the CO2 rich air in these regions. There was no
significant difference in EtCO2 between rigid and compliant soft palate conditions in all regions of the pharynx;
therefore, soft palate compliance does not affect the mixing of CO2 gas in the pharynx with NHFT assisted
breathing at 30 L/min.
Figure 125. Mean EtCO2 concentrations along the airway during NHFT assisted breathing at 30 L/min. The results show for rigid
and compliant soft palate airway conditions. This also shows the absolute difference in EtCO2 between compliant and rigid
conditions. The error bars correspond to an uncertainty of 2 standard deviations.
On the left side of the oral cavity (tap 5) there is a difference in EtCO2 between rigid and compliant conditions.
The EtCO2 for the rigid airway is 3.2 ± 0.1 % and the EtCO2 in the compliant airway is 3.5 ± 0.2 %. This corresponds
to an absolute difference of 0.4 ± 0.2 %, and is deemed significant as it is outside the range of uncertainty.
However, on the right side of the oral cavity (tap 6) the difference between rigid and compliant EtCO2 is 0.1 ± 0.2
%, and is not statistically significant as the difference is less than its uncertainty.
Figure 126 shows the mean oral cavity CO2 concentration profile, for a single breath during NHFT assisted
breathing at 30 L/min. It is not clear where the EtCO2 point lies on the concentration profile on the right side of
-0.5
0
0.5
1
1.5
2
2.5
3
3.5
4
4.5
Oral C 5 Oral C 6 OP 18 LP 23 L 24 Tr 28
CO
2V
olu
me
Fra
ctio
n (
%)
Rigid Compliant SP Comp SP vs Rigid Difference
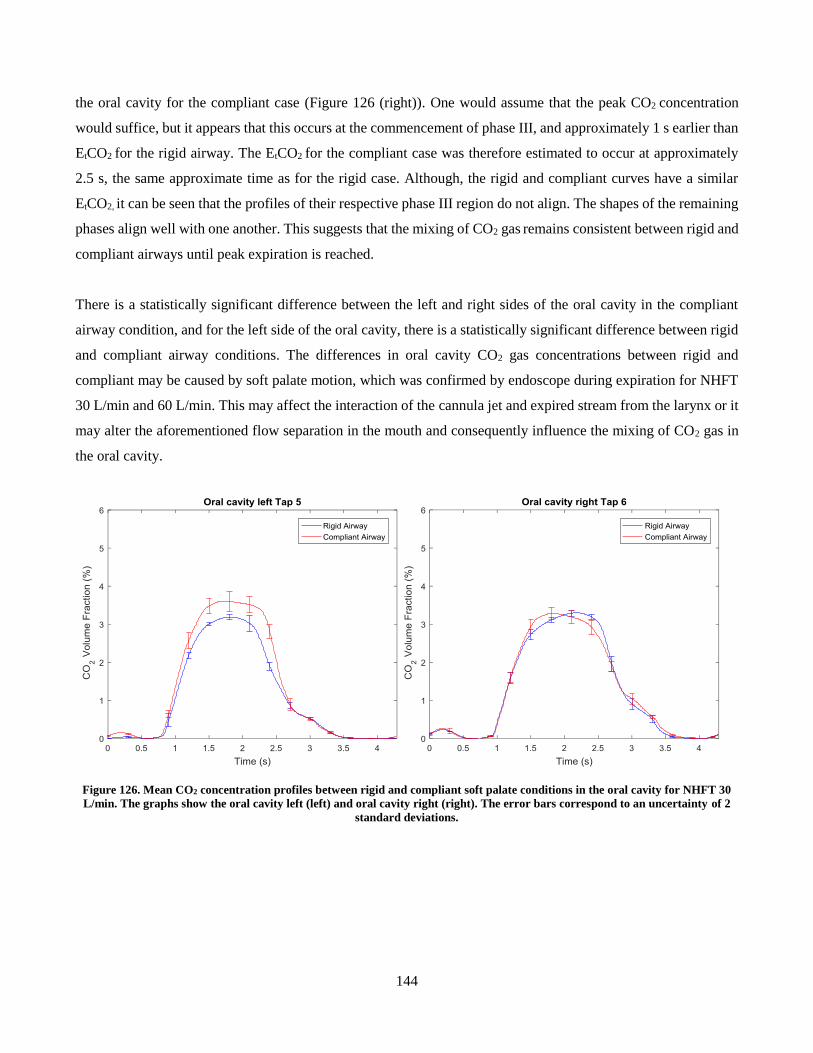
144
the oral cavity for the compliant case (Figure 126 (right)). One would assume that the peak CO2 concentration
would suffice, but it appears that this occurs at the commencement of phase III, and approximately 1 s earlier than
EtCO2 for the rigid airway. The EtCO2 for the compliant case was therefore estimated to occur at approximately
2.5 s, the same approximate time as for the rigid case. Although, the rigid and compliant curves have a similar
EtCO2, it can be seen that the profiles of their respective phase III region do not align. The shapes of the remaining
phases align well with one another. This suggests that the mixing of CO2 gas remains consistent between rigid and
compliant airways until peak expiration is reached.
There is a statistically significant difference between the left and right sides of the oral cavity in the compliant
airway condition, and for the left side of the oral cavity, there is a statistically significant difference between rigid
and compliant airway conditions. The differences in oral cavity CO2 gas concentrations between rigid and
compliant may be caused by soft palate motion, which was confirmed by endoscope during expiration for NHFT
30 L/min and 60 L/min. This may affect the interaction of the cannula jet and expired stream from the larynx or it
may alter the aforementioned flow separation in the mouth and consequently influence the mixing of CO2 gas in
the oral cavity.
Figure 126. Mean CO2 concentration profiles between rigid and compliant soft palate conditions in the oral cavity for NHFT 30
L/min. The graphs show the oral cavity left (left) and oral cavity right (right). The error bars correspond to an uncertainty of 2
standard deviations.
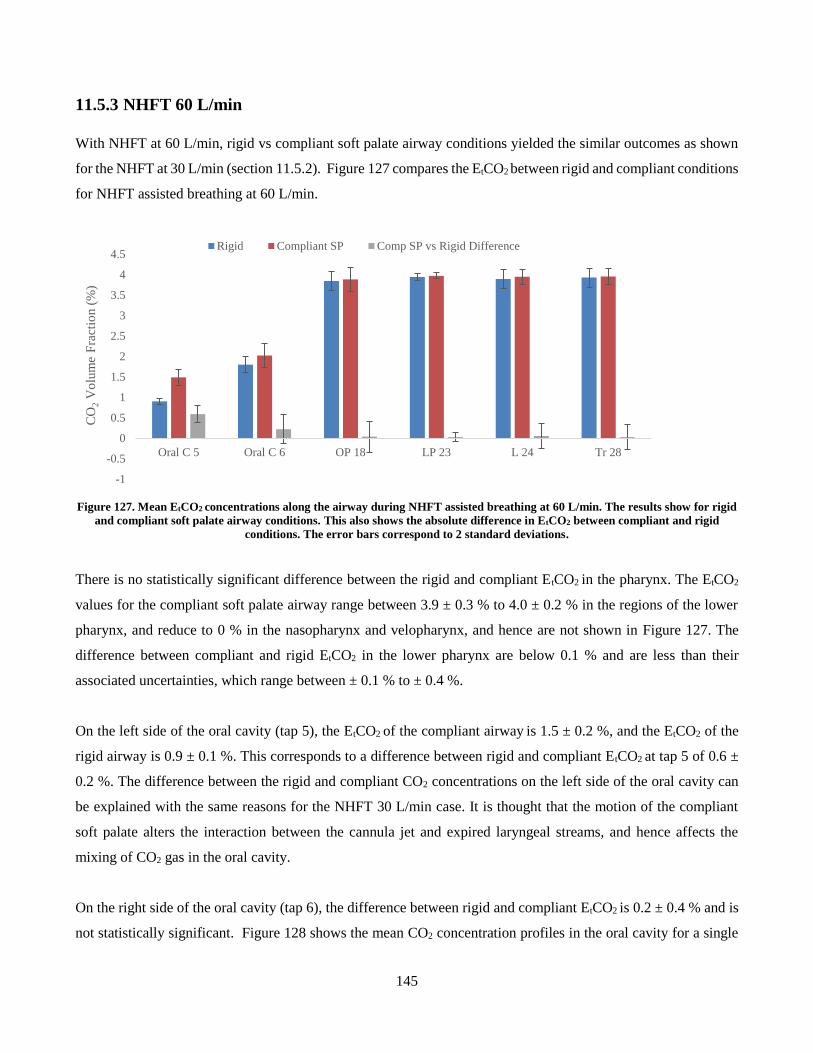
145
11.5.3 NHFT 60 L/min
With NHFT at 60 L/min, rigid vs compliant soft palate airway conditions yielded the similar outcomes as shown
for the NHFT at 30 L/min (section 11.5.2). Figure 127 compares the EtCO2 between rigid and compliant conditions
for NHFT assisted breathing at 60 L/min.
Figure 127. Mean EtCO2 concentrations along the airway during NHFT assisted breathing at 60 L/min. The results show for rigid
and compliant soft palate airway conditions. This also shows the absolute difference in EtCO2 between compliant and rigid
conditions. The error bars correspond to 2 standard deviations.
There is no statistically significant difference between the rigid and compliant EtCO2 in the pharynx. The EtCO2
values for the compliant soft palate airway range between 3.9 ± 0.3 % to 4.0 ± 0.2 % in the regions of the lower
pharynx, and reduce to 0 % in the nasopharynx and velopharynx, and hence are not shown in Figure 127. The
difference between compliant and rigid EtCO2 in the lower pharynx are below 0.1 % and are less than their
associated uncertainties, which range between ± 0.1 % to ± 0.4 %.
On the left side of the oral cavity (tap 5), the EtCO2 of the compliant airway is 1.5 ± 0.2 %, and the EtCO2 of the
rigid airway is 0.9 ± 0.1 %. This corresponds to a difference between rigid and compliant EtCO2 at tap 5 of 0.6 ±
0.2 %. The difference between the rigid and compliant CO2 concentrations on the left side of the oral cavity can
be explained with the same reasons for the NHFT 30 L/min case. It is thought that the motion of the compliant
soft palate alters the interaction between the cannula jet and expired laryngeal streams, and hence affects the
mixing of CO2 gas in the oral cavity.
On the right side of the oral cavity (tap 6), the difference between rigid and compliant EtCO2 is 0.2 ± 0.4 % and is
not statistically significant. Figure 128 shows the mean CO2 concentration profiles in the oral cavity for a single
-1
-0.5
0
0.5
1
1.5
2
2.5
3
3.5
4
4.5
Oral C 5 Oral C 6 OP 18 LP 23 L 24 Tr 28
CO
2V
olu
me
Fra
ctio
n (
%)
Rigid Compliant SP Comp SP vs Rigid Difference
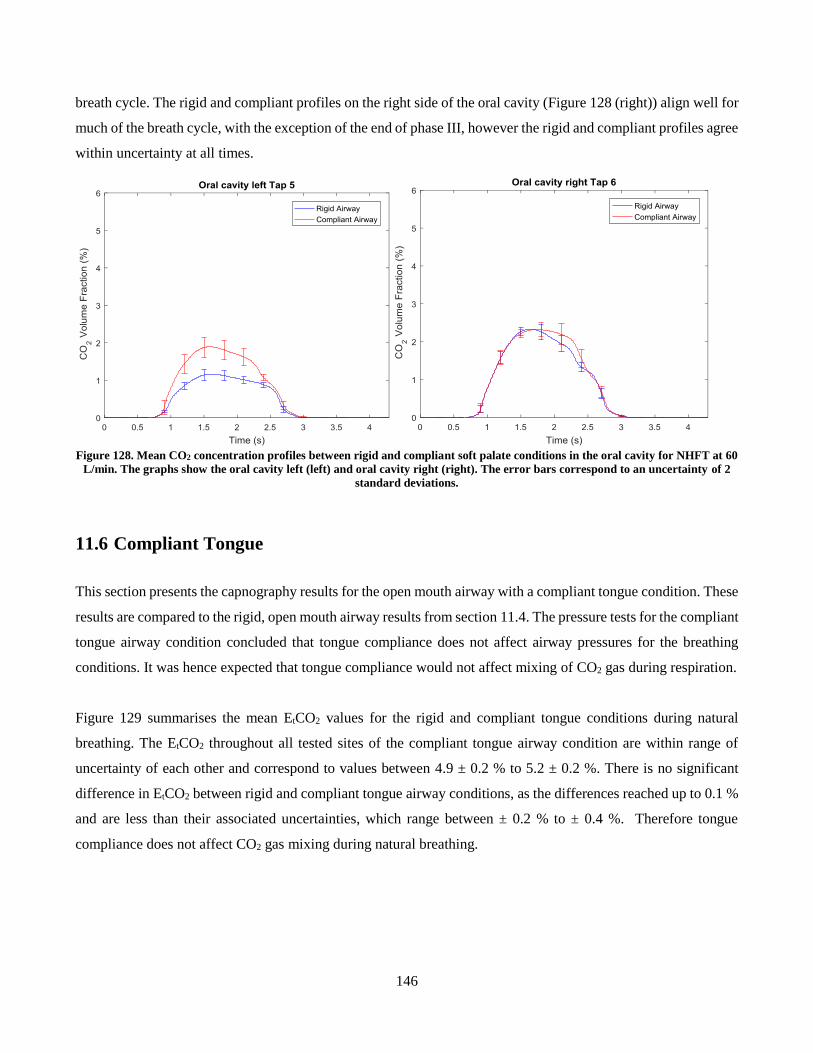
146
breath cycle. The rigid and compliant profiles on the right side of the oral cavity (Figure 128 (right)) align well for
much of the breath cycle, with the exception of the end of phase III, however the rigid and compliant profiles agree
within uncertainty at all times.
Figure 128. Mean CO2 concentration profiles between rigid and compliant soft palate conditions in the oral cavity for NHFT at 60
L/min. The graphs show the oral cavity left (left) and oral cavity right (right). The error bars correspond to an uncertainty of 2
standard deviations.
11.6 Compliant Tongue
This section presents the capnography results for the open mouth airway with a compliant tongue condition. These
results are compared to the rigid, open mouth airway results from section 11.4. The pressure tests for the compliant
tongue airway condition concluded that tongue compliance does not affect airway pressures for the breathing
conditions. It was hence expected that tongue compliance would not affect mixing of CO2 gas during respiration.
Figure 129 summarises the mean EtCO2 values for the rigid and compliant tongue conditions during natural
breathing. The EtCO2 throughout all tested sites of the compliant tongue airway condition are within range of
uncertainty of each other and correspond to values between 4.9 ± 0.2 % to 5.2 ± 0.2 %. There is no significant
difference in EtCO2 between rigid and compliant tongue airway conditions, as the differences reached up to 0.1 %
and are less than their associated uncertainties, which range between ± 0.2 % to ± 0.4 %. Therefore tongue
compliance does not affect CO2 gas mixing during natural breathing.
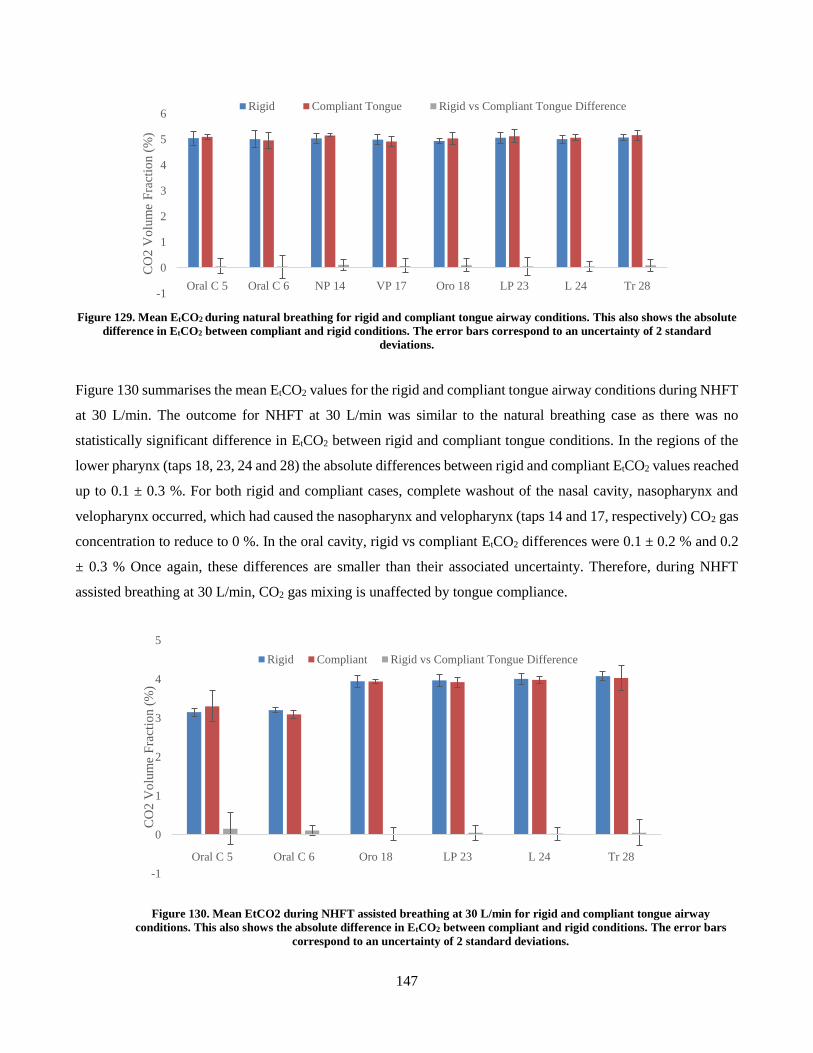
147
Figure 129. Mean EtCO2 during natural breathing for rigid and compliant tongue airway conditions. This also shows the absolute
difference in EtCO2 between compliant and rigid conditions. The error bars correspond to an uncertainty of 2 standard
deviations.
Figure 130 summarises the mean EtCO2 values for the rigid and compliant tongue airway conditions during NHFT
at 30 L/min. The outcome for NHFT at 30 L/min was similar to the natural breathing case as there was no
statistically significant difference in EtCO2 between rigid and compliant tongue conditions. In the regions of the
lower pharynx (taps 18, 23, 24 and 28) the absolute differences between rigid and compliant EtCO2 values reached
up to 0.1 ± 0.3 %. For both rigid and compliant cases, complete washout of the nasal cavity, nasopharynx and
velopharynx occurred, which had caused the nasopharynx and velopharynx (taps 14 and 17, respectively) CO2 gas
concentration to reduce to 0 %. In the oral cavity, rigid vs compliant EtCO2 differences were 0.1 ± 0.2 % and 0.2
± 0.3 % Once again, these differences are smaller than their associated uncertainty. Therefore, during NHFT
assisted breathing at 30 L/min, CO2 gas mixing is unaffected by tongue compliance.
Figure 130. Mean EtCO2 during NHFT assisted breathing at 30 L/min for rigid and compliant tongue airway
conditions. This also shows the absolute difference in EtCO2 between compliant and rigid conditions. The error bars
correspond to an uncertainty of 2 standard deviations.
-1
0
1
2
3
4
5
6
Oral C 5 Oral C 6 NP 14 VP 17 Oro 18 LP 23 L 24 Tr 28
CO
2 V
olu
me
Fra
ctio
n (
%)
Rigid Compliant Tongue Rigid vs Compliant Tongue Difference
-1
0
1
2
3
4
5
Oral C 5 Oral C 6 Oro 18 LP 23 L 24 Tr 28
CO
2 V
olu
me
Fra
ctio
n (
%)
Rigid Compliant Rigid vs Compliant Tongue Difference
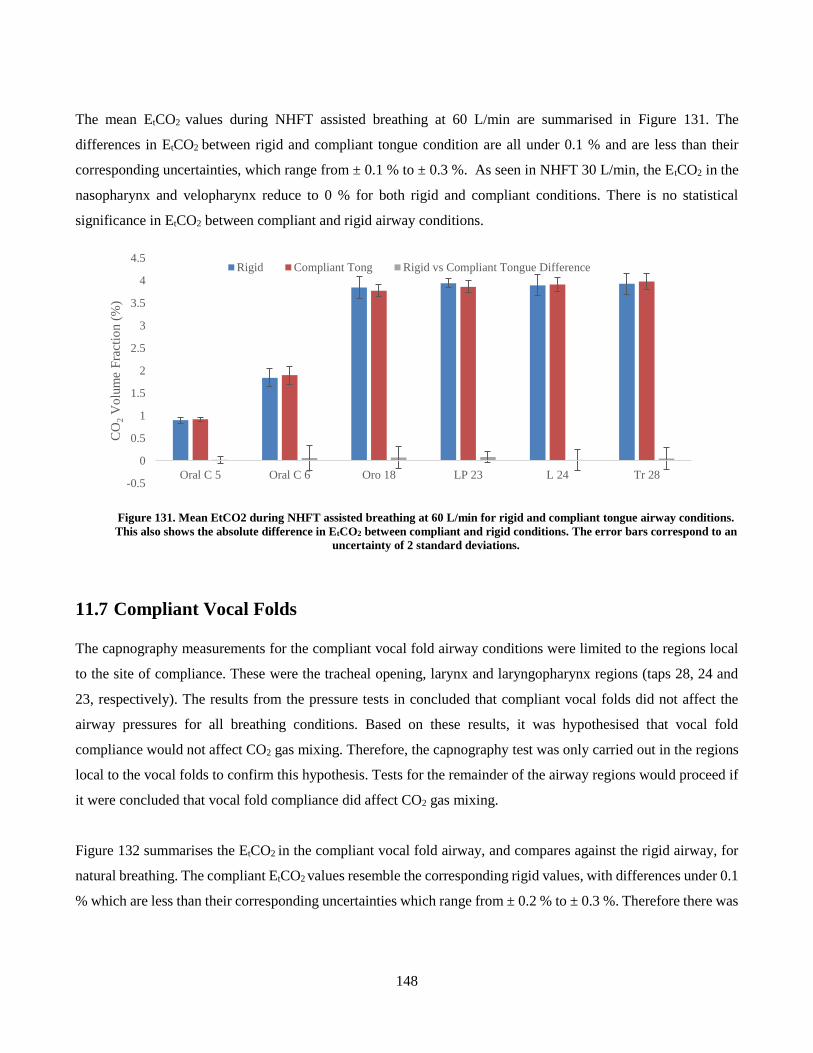
148
The mean EtCO2 values during NHFT assisted breathing at 60 L/min are summarised in Figure 131. The
differences in EtCO2 between rigid and compliant tongue condition are all under 0.1 % and are less than their
corresponding uncertainties, which range from ± 0.1 % to ± 0.3 %. As seen in NHFT 30 L/min, the EtCO2 in the
nasopharynx and velopharynx reduce to 0 % for both rigid and compliant conditions. There is no statistical
significance in EtCO2 between compliant and rigid airway conditions.
Figure 131. Mean EtCO2 during NHFT assisted breathing at 60 L/min for rigid and compliant tongue airway conditions.
This also shows the absolute difference in EtCO2 between compliant and rigid conditions. The error bars correspond to an
uncertainty of 2 standard deviations.
11.7 Compliant Vocal Folds
The capnography measurements for the compliant vocal fold airway conditions were limited to the regions local
to the site of compliance. These were the tracheal opening, larynx and laryngopharynx regions (taps 28, 24 and
23, respectively). The results from the pressure tests in concluded that compliant vocal folds did not affect the
airway pressures for all breathing conditions. Based on these results, it was hypothesised that vocal fold
compliance would not affect CO2 gas mixing. Therefore, the capnography test was only carried out in the regions
local to the vocal folds to confirm this hypothesis. Tests for the remainder of the airway regions would proceed if
it were concluded that vocal fold compliance did affect CO2 gas mixing.
Figure 132 summarises the EtCO2 in the compliant vocal fold airway, and compares against the rigid airway, for
natural breathing. The compliant EtCO2 values resemble the corresponding rigid values, with differences under 0.1
% which are less than their corresponding uncertainties which range from ± 0.2 % to ± 0.3 %. Therefore there was
-0.5
0
0.5
1
1.5
2
2.5
3
3.5
4
4.5
Oral C 5 Oral C 6 Oro 18 LP 23 L 24 Tr 28
CO
2V
olu
me
Fra
ctio
n (
%)
Rigid Compliant Tong Rigid vs Compliant Tongue Difference
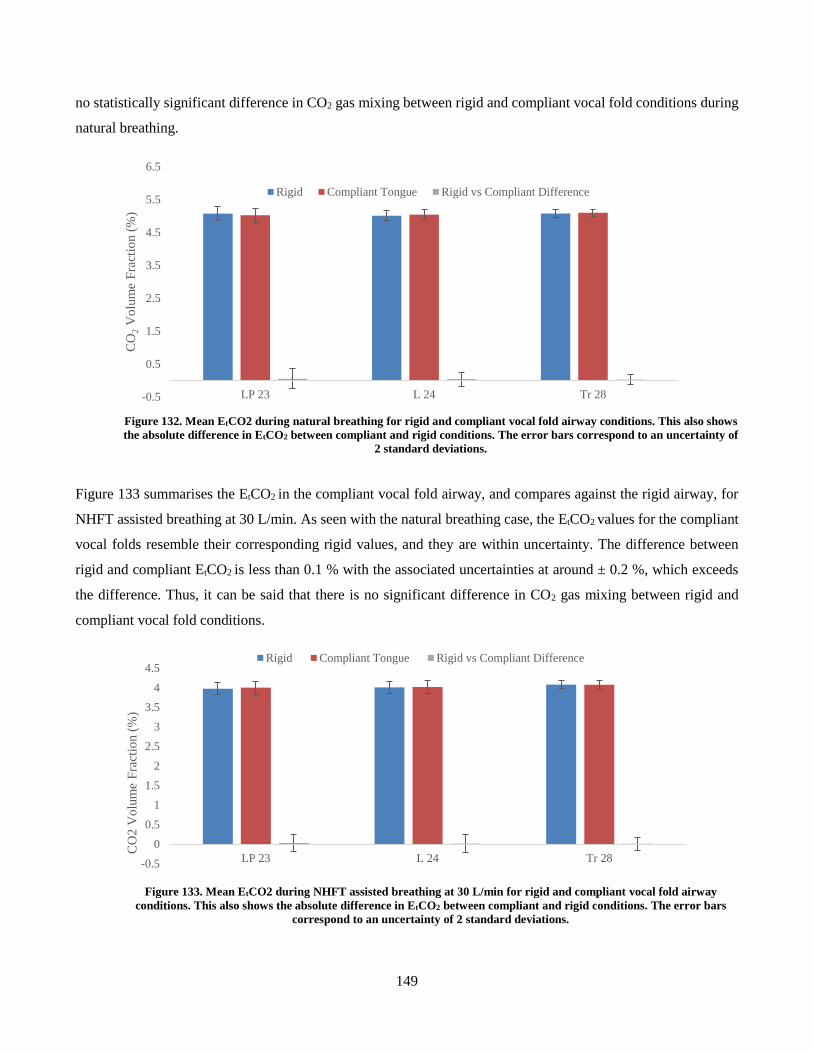
149
no statistically significant difference in CO2 gas mixing between rigid and compliant vocal fold conditions during
natural breathing.
Figure 132. Mean EtCO2 during natural breathing for rigid and compliant vocal fold airway conditions. This also shows
the absolute difference in EtCO2 between compliant and rigid conditions. The error bars correspond to an uncertainty of
2 standard deviations.
Figure 133 summarises the EtCO2 in the compliant vocal fold airway, and compares against the rigid airway, for
NHFT assisted breathing at 30 L/min. As seen with the natural breathing case, the EtCO2 values for the compliant
vocal folds resemble their corresponding rigid values, and they are within uncertainty. The difference between
rigid and compliant EtCO2 is less than 0.1 % with the associated uncertainties at around ± 0.2 %, which exceeds
the difference. Thus, it can be said that there is no significant difference in CO2 gas mixing between rigid and
compliant vocal fold conditions.
Figure 133. Mean EtCO2 during NHFT assisted breathing at 30 L/min for rigid and compliant vocal fold airway
conditions. This also shows the absolute difference in EtCO2 between compliant and rigid conditions. The error bars
correspond to an uncertainty of 2 standard deviations.
-0.5
0.5
1.5
2.5
3.5
4.5
5.5
6.5
LP 23 L 24 Tr 28
CO
2V
olu
me
Fra
ctio
n (
%)
Rigid Compliant Tongue Rigid vs Compliant Difference
-0.5
0
0.5
1
1.5
2
2.5
3
3.5
4
4.5
LP 23 L 24 Tr 28
CO
2 V
olu
me
Fra
ctio
n (
%)
Rigid Compliant Tongue Rigid vs Compliant Difference
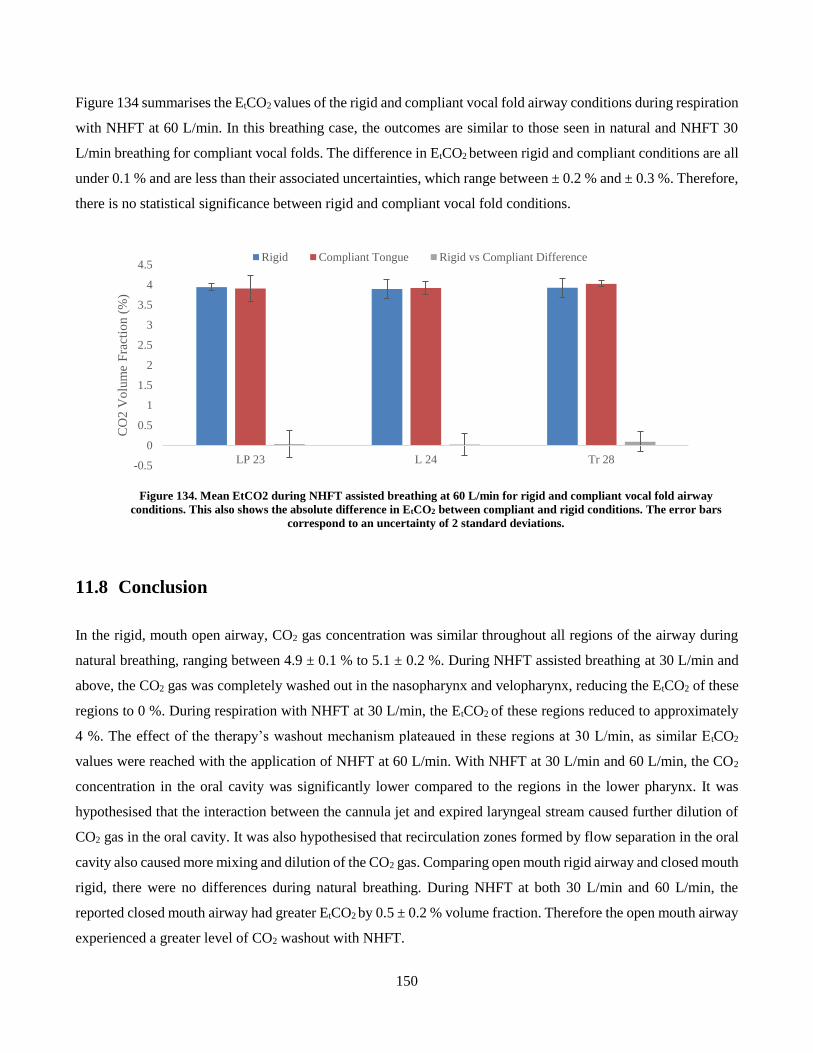
150
Figure 134 summarises the EtCO2 values of the rigid and compliant vocal fold airway conditions during respiration
with NHFT at 60 L/min. In this breathing case, the outcomes are similar to those seen in natural and NHFT 30
L/min breathing for compliant vocal folds. The difference in EtCO2 between rigid and compliant conditions are all
under 0.1 % and are less than their associated uncertainties, which range between ± 0.2 % and ± 0.3 %. Therefore,
there is no statistical significance between rigid and compliant vocal fold conditions.
Figure 134. Mean EtCO2 during NHFT assisted breathing at 60 L/min for rigid and compliant vocal fold airway
conditions. This also shows the absolute difference in EtCO2 between compliant and rigid conditions. The error bars
correspond to an uncertainty of 2 standard deviations.
11.8 Conclusion
In the rigid, mouth open airway, CO2 gas concentration was similar throughout all regions of the airway during
natural breathing, ranging between 4.9 ± 0.1 % to 5.1 ± 0.2 %. During NHFT assisted breathing at 30 L/min and
above, the CO2 gas was completely washed out in the nasopharynx and velopharynx, reducing the EtCO2 of these
regions to 0 %. During respiration with NHFT at 30 L/min, the EtCO2 of these regions reduced to approximately
4 %. The effect of the therapy’s washout mechanism plateaued in these regions at 30 L/min, as similar EtCO2
values were reached with the application of NHFT at 60 L/min. With NHFT at 30 L/min and 60 L/min, the CO2
concentration in the oral cavity was significantly lower compared to the regions in the lower pharynx. It was
hypothesised that the interaction between the cannula jet and expired laryngeal stream caused further dilution of
CO2 gas in the oral cavity. It was also hypothesised that recirculation zones formed by flow separation in the oral
cavity also caused more mixing and dilution of the CO2 gas. Comparing open mouth rigid airway and closed mouth
rigid, there were no differences during natural breathing. During NHFT at both 30 L/min and 60 L/min, the
reported closed mouth airway had greater EtCO2 by 0.5 ± 0.2 % volume fraction. Therefore the open mouth airway
experienced a greater level of CO2 washout with NHFT.
-0.5
0
0.5
1
1.5
2
2.5
3
3.5
4
4.5
LP 23 L 24 Tr 28
CO
2 V
olu
me
Fra
ctio
n (
%)
Rigid Compliant Tongue Rigid vs Compliant Difference
151
The CO2 concentrations in a compliant soft palate airway were the same as rigid during natural breathing. During
NHFT assisted breathing at both 30 L/min and 60 L/min, the EtCO2 values in the pharynx of the compliant airway
had no statistically significant difference when compared to the corresponding rigid values. The only region that
was affected by soft palate compliance was the oral cavity. In the compliant soft palate airway, the left side of the
oral cavity (tap 5) had greater CO2 concentrations than the rigid airway. There was no statistically significant
difference in EtCO2 between rigid and compliant airway for the right side of the oral cavity (tap 6). However, there
was a statistically significant difference in CO2 concentration profiles between rigid and compliant soft palate
airways for both sides of the oral cavity and at both NHFT flows. It was hypothesised that during NHFT assisted
breathing, the motion of the compliant soft palate altered the flow profile of the cannula and laryngeal streams as
they entered the oral cavity on expiration, and ultimately affected the mixing of CO2 gas in this region.
There was no statistically significant difference in EtCO2 between rigid and compliant tongue conditions, for all
breathing conditions. Therefore, it can be concluded that tongue compliance did not have any effect on the mixing
of CO2 gas during respiration. This was also true for the compliant vocal fold condition.
152
12 Conclusion
This project explored how the passive properties of compliant soft tissues affected the upper airway during natural
respiration and NHFT assisted respiration at 30 L/min and 60 L/min flows. A physical, open mouth airway model
was constructed, which was anatomically accurate as it was based on medical CT scans, and fabricated with 3D
printing processes. The model was designed to fit interchangeable tissue components, which could either simulate
a rigid condition or a compliant condition. The purpose of this study was to evaluate whether the rigid airway
assumption, which was used in previous computational and experimental studies, was a valid assumption. It was
initially hypothesised that compliant airway tissues may be susceptible to flow induced motion or deformation and
affect breathing. The compliant regions of interest, which this study focussed on, was the soft palate, tongue and
the vocal folds. Two sets of these tissue components, which were referred to as inserts, were fabricated: a rigid set
and a compliant set. The compliant inserts were cast in 3D printed moulds with a silicone resin at specific mixing
ratios with a thinning oil. The mixing ratios achieved a material elastic modulus which matched that of the
biological tissue, and hence compliance could be simulated. Each compliant tissue was individually tested for, and
hence four airway conditions were studied: A rigid airway, compliant soft palate airway, compliant tongue airway
and a compliant vocal fold airway. The casts gave accurate representations of the tissue components, however they
tended to have a greater surface roughness than their rigid counterparts. The ABS moulds had a lower quality
surface finish, which is inherent to the printer, and this directly impacted the casts. The airway model also
underwent warping due to the heat effects from support material removal. Realignment was achieved, however
not completely, hence the model was not an exact representation of the original geometry used. A removable
gasket was also designed for the airway which sufficiently sealed the model as it gave a leak rate of 3 % at an
internal pressure of 400 Pa, which was over twice as high as the greatest airway pressure measured in this project.
Flow rate at the mouth and nose were measured at peak expiration and peak inspiration during breathing, to
understand how flow was partitioned. During natural inspiration, distribution between mouth and nose was 49 %
and 52 % of the inspiratory demand, respectively and with NHFT at 30 L/min this changed to 26.4 % and 73.6 %,
respectively. This was because NHFT biases inspiration towards the noses. During NHFT 60 L/min, 152 % of
inspiratory demand entered via the nasal passage, as therapy was over twice that of inspiratory demand. The excess
air exited the airway via the mouth. During natural expiration, the distribution between mouth and nose was 47.8
% and 52.2 % of all air exiting the airway, respectively; and with NHFT 30 L/min, this changed to 55 % and 45
% of the total flow leaving the airway, respectively. In the nasal passage, 13.8 % of the therapy flow persisted. At
NHFT 60 L/min the outward flow from the leak area and mouth corresponded to 45.9 % and 54.2 % of the total
flow leaving the airway, respectively, with 30.7 % of therapy flow persisting through the nasal passage.
153
The static pressure tests determined that the soft palate was the only compliant tissue that affected the airway
pressures, for both natural and NHFT assisted breathing. During natural breathing at peak inspiration the compliant
soft palate airway condition had more negative pressures in the pharynx, than the rigid condition by 15.5 ± 5.7 %
to 35.3 ± 12.1 % of the corresponding peak-to-peak rigid pressures. The compliant airway had greater pressures
in the oral cavity, than the rigid, by an average of 25.0 ± 22.1 %. During peak expiration, the compliant soft palate
airway had greater pressures in pharynx, than rigid airway, by 3.8 ± 2.6 % to 10.7 ± 2.7 %, and lower pressures in
the oral cavity by 9.0 ± 5.5 %, compared to rigid. Although no soft palate motion was observed with the endoscopic
camera during natural breathing, it was hypothesised that the compliant soft palate moved to the posterior on
inspiration, causing a narrowing of the velopharynx and widening of the oral-to-pharynx passage; and it moved
anterior on expiration, causing the opposite change in geometry. This influenced the partitioning of the airflow
between oral and nasal passages, and increased the overall resistance of the airway, hence more pronounced
pressures at peak inspiration and expiration. During inspiration with NHFT at 30 L/min, the only difference
between rigid and compliant airway pressures was at the velopharynx, local to the site of compliance. The pressure
at the velopharynx was greater in the compliant airway by 8.0 ± 5.5 %, compared to the rigid. The hypothesis was
made that the uvula tended posteriorly due to slumping, which acted as a constriction, increasing the local
resistance only, and hence the local upstream pressure. During peak expiration with NHFT at 30 L/min, the
compliant soft palate airway condition had greater pressures than the rigid, by 9.3 ± 1.1 % to 23.7 ± 5.5 %
throughout the entire airway. The endoscopic camera revealed that the soft palate tended to move toward the
anterior upon expiration. Because all air was expired via the mouth with NHFT at 30 L/min, the hypothesis was
made that the soft palate motion restricted the exiting flow causing an increase in resistance and hence a global
increase in airway pressure. During peak inspiration with NHFT at 60 L/min, the compliant airway also
experienced a global increase in airway pressures and were greater than the rigid pressures by 6.7 ± 4.6 % to 20.6
± 7.6 %. No observable motion of the soft palate was seen with the endoscope but it was hypothesised that there
was a combination of anterior bulging at the velopharynx due the distending effects of the therapy, and posterior
uvula slumping. As there was a portion of air exiting via the mouth during inspiration with NHFT 60 L/min, the
soft palate motion restricted this airflow and caused an increase in the resistance of the compliant airway and hence
increase the peak inspiratory airway pressures. During peak expiration with NHFT at 60 L/min, once again, a
global increase in peak pressures occurred for the compliant airway, and these were greater than rigid pressures
by 27.9 ± 4.4 % to 45.6 ± 10.7 %. The endoscopic camera revealed a greater anterior motion of the soft palate,
which was cycled with inspiration and expiration. The global pressure increase of the compliant airway can be
explained with the same mechanisms as in expiration at 30 L/min, only that the effects were more pronounced due
to a greater therapy flow. The pressure results from the compliant tongue and compliant vocal fold conditions
showed that there was no statistically significant difference when comparing against the results from the rigid
model. Therefore, the tongue and vocal fold compliance did not affect breathing.
154
The capnography results for a rigid mouth open airway were compared to reported closed mouth airway data.
During natural breathing the rigid, open mouth airway the EtCO2 varied between 5.0 to 5.1 % but they were within
uncertainty and within the alveolar CO2 concentration. With NHFT at 30 L/min the EtCO2 for the nasopharynx
and the velopharynx reduced to 0 %, indicating that with mouth open breathing, the CO2 gas in the nasal cavity,
nasopharynx and velopharynx regions is completely flushed and these regions are removed from the dead space.
This was due to a continuous cannula flow through the nasal passage, even during inspiration. In the lower pharynx
regions, EtCO2 was between 3.9 to 4.1 %, and these were within range of uncertainty with each other. The same
outcomes were seen for NHFT at 60 L/min as the washout mechanism of the therapy plateaued after 30 L/min.
The oral cavity experienced the most significant washout, with an average EtCO2 of 3.3 ± and 1.4 ± for NHFT 30
L/min and 60 L/min respectively. The CO2 rich expirated laryngeal stream met with fresh cannula air in the oral
cavity, causing further dilution of the CO2 gas. The capnography results for the open mouth rigid model were
compared to reported results obtained from a closed mouth airway. During natural breathing there was no
difference in CO2 concentration throughout the pharynx of the airway, between the current study’s open mouth
model and the reported study’s closed mouth model. With the application of NHFT at 30 L/min and 60 L/min, it
was found that the reported results for the closed mouth model had greater EtCO2 values in the lower pharynx by
0.5 ± 0.2 % volume fraction. The nasopharynx and velopharynx of the closed mouth airway experienced the same
EtCO2 measured in the lower pharynx regions.
The soft palate was the only compliant tissue to affect CO2 gas mixing and this was limited to the left side of the
oral cavity only, during NHFT assisted breathing. The EtCO2 of the left side of the oral cavity in the compliant
airway was greater than that of the rigid airway by 0.4 ± 0.2 % during NHFT 30 L/min respiration and greater by
0.6 ± 0.2 % during NHFT 60 L/min respiration. It was hypothesised that the motion of the compliant soft palate
affected the laryngeal and cannula stream as they entered the oral cavity, and hence affected the mixing of CO2
gas. There was no statistical significance in CO2 concentration between rigid and compliant soft palate conditions
for the entire airway during natural breathing, and for the pharynx of the airway during NHFT assisted breathing.
The compliant tongue and the compliant vocal folds did not affect the mixing of gas for all breathing conditions.
This study can conclude that out of the three tested tissues, only soft palate compliance affected breathing pressures
and CO2 gas mixing. Therefore, a rigid condition for the soft palate is not a valid assumption when modelling the
human upper airway, but it is a valid assumption for the tongue and vocal folds. However, the study into
compliance was limited to an open mouth airway geometry and it has been shown, both by previous studies and
in the current study that closed mouth breathing causes greater airway pressures. It would be expected that with
greater airway pressures, the flow would exert a greater force on the compliant regions; therefore it cannot stated
that that vocal fold and tongue compliance do not effect breathing in a closed mouth case. Also, the airway in this
155
study was based on a single person. Although the elastic modulus was a realistic replication for the biological
tissues, the behaviour of the tissues is a result of material properties, and geometry of the tissue and the surrounding
airway region. There will always be variation in airway geometry between people, therefore the findings from this
study are not representative of an entire population. Tissue compliance was simulated by replicating the elastic
portion of the tissue’s viscoelastic properties. The viscous (loss) portion was neglected due to the limited
information for both tissue and resin properties. The compliant tissue simulants were also assumed to be
homogeneous and isentropic; but in reality the tissues are comprised of multiple layers with varying levels of
compliance, and they may exhibit different behaviour in different directions. It is unknown to what extent these
parameters may have on the behaviour of the tissues, however, to replicate compliance with more accuracy, they
must be considered. In an in vivo airway there is constant involuntary muscle activity in the compliant regions.
This alters the shape of the airway. Also, muscle activation changes the tone of the tissue, and tissues’ compliance
is rate dependent. In the current study, the compliant tissues represented a passive state, and muscle activation was
not considered.
.
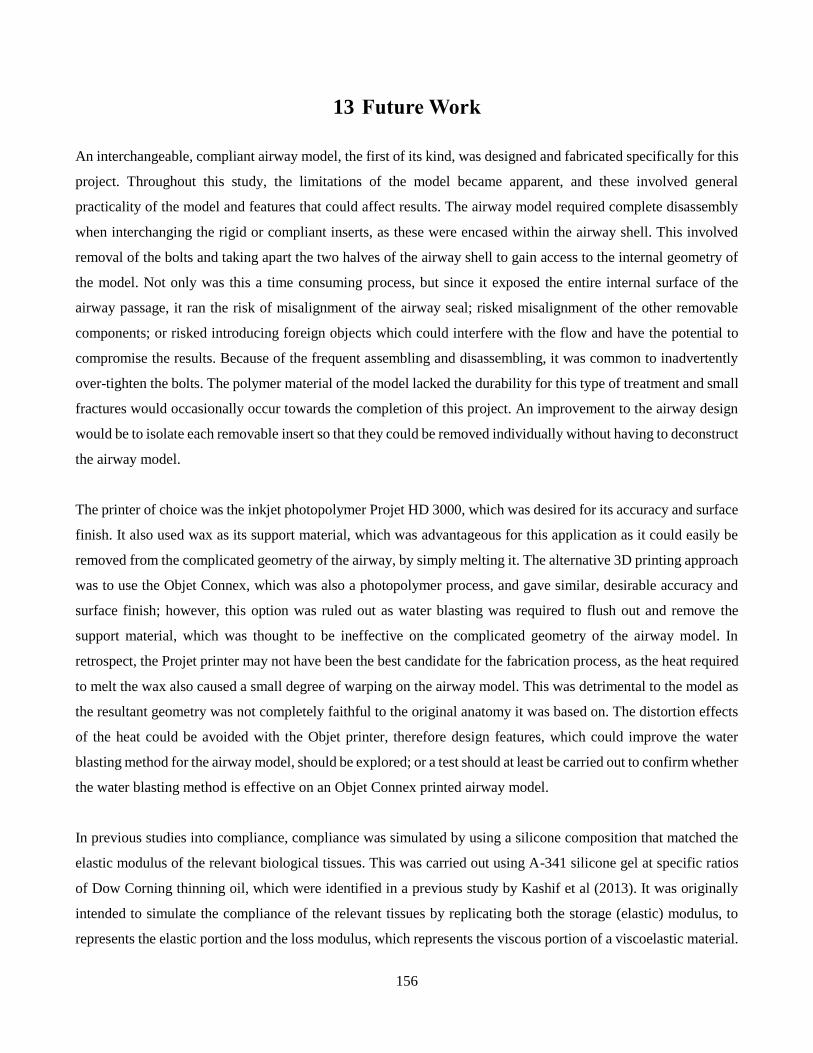
156
13 Future Work
An interchangeable, compliant airway model, the first of its kind, was designed and fabricated specifically for this
project. Throughout this study, the limitations of the model became apparent, and these involved general
practicality of the model and features that could affect results. The airway model required complete disassembly
when interchanging the rigid or compliant inserts, as these were encased within the airway shell. This involved
removal of the bolts and taking apart the two halves of the airway shell to gain access to the internal geometry of
the model. Not only was this a time consuming process, but since it exposed the entire internal surface of the
airway passage, it ran the risk of misalignment of the airway seal; risked misalignment of the other removable
components; or risked introducing foreign objects which could interfere with the flow and have the potential to
compromise the results. Because of the frequent assembling and disassembling, it was common to inadvertently
over-tighten the bolts. The polymer material of the model lacked the durability for this type of treatment and small
fractures would occasionally occur towards the completion of this project. An improvement to the airway design
would be to isolate each removable insert so that they could be removed individually without having to deconstruct
the airway model.
The printer of choice was the inkjet photopolymer Projet HD 3000, which was desired for its accuracy and surface
finish. It also used wax as its support material, which was advantageous for this application as it could easily be
removed from the complicated geometry of the airway, by simply melting it. The alternative 3D printing approach
was to use the Objet Connex, which was also a photopolymer process, and gave similar, desirable accuracy and
surface finish; however, this option was ruled out as water blasting was required to flush out and remove the
support material, which was thought to be ineffective on the complicated geometry of the airway model. In
retrospect, the Projet printer may not have been the best candidate for the fabrication process, as the heat required
to melt the wax also caused a small degree of warping on the airway model. This was detrimental to the model as
the resultant geometry was not completely faithful to the original anatomy it was based on. The distortion effects
of the heat could be avoided with the Objet printer, therefore design features, which could improve the water
blasting method for the airway model, should be explored; or a test should at least be carried out to confirm whether
the water blasting method is effective on an Objet Connex printed airway model.
In previous studies into compliance, compliance was simulated by using a silicone composition that matched the
elastic modulus of the relevant biological tissues. This was carried out using A-341 silicone gel at specific ratios
of Dow Corning thinning oil, which were identified in a previous study by Kashif et al (2013). It was originally
intended to simulate the compliance of the relevant tissues by replicating both the storage (elastic) modulus, to
represents the elastic portion and the loss modulus, which represents the viscous portion of a viscoelastic material.
157
Material additives would need to be explored, so that the silicone could produce the desired elastic and loss
properties of the relevant biological tissues. It was also desired to replicate the shear modulus and the Poisson’s
ratio of the compliant tissues of interest. To carry out this material study, dynamic material analysis (DMA) was
required, which is used to quantify viscoelastic properties of polymers. In DMA a cyclic stress is applied on a
material sample, and the material is characterized by examining its dynamic response. This aspect of the project
was discontinued as the appropriate equipment to proceed with the DMA testing was unavailable, hence it is
intended as a future study.
From this project there is now a better understanding of how compliance can affect natural and NHFT assisted
breathing. However, the research was limited to one airway geometry, representative of a single person. This raises
the question: are the effects that have been observed specific to the current patient, or would similar trends be
expected for other airway geometries? To properly answer this question, the sample size of the study needs to be
expanded, or a similar study should be conducted on a mean airway model which is representative of a sub-group
or population. Also, the compliance tests were limited to an open mouth airway geometry. It has been discussed
that for a closed mouth breathing condition, airway resistance increases, and hence greater pressures are observed.
It would be interesting to investigate how compliance affects breathing in closed mouth airway. In this project the
breath waveform used was representative of a healthy adult. Further testing should be carried out on a breathing
waveforms which can simulate respiratory disorders such as COPD or asthma.
Now that it has been shown that soft palate compliance affects breathing, a more rigorous testing approach can be
applied to further understand the mechanisms in play and the flow pattern within a compliant airway. Particle
imaging velocimetry (PIV) is a flow visualization technique that can quantify the velocity field in a flow domain.
This experimental method has been used previously in various airway studies, however it has been limited to rigid
boundary conditions. The use of PIV to test airway compliance would introduce new challenges in the airway
model design process. As PIV is based on imaging data, the models used need to be made from a transparent
material with a refractive index that matches the working fluid so that the boundaries of the model do not disturb
transmitted light. A compliant PIV airway model would require an investigation into a material which can match
a working fluid, and an elastic modulus which matches the biological tissue.
158
References
Adams, C, Jermy, M, Geoghegan, P & Spence, C 2016, 'Effect of Nasal High Flow Therapy on CO2
Tension - Physico-Mathematical Modelling', in Biotechno 2016, The Eighth International
Conference on Bioinformatics, Biocomputational Systems and Biotechnologies. IARIA, Lisbon,
Portugal, pp. 16 - 20, 26 -30 June 2016.
Alipour‐Haghighi, F & Titze, IR 1991, 'Elastic models of vocal fold tissues', The Journal of the
Acoustical Society of America, vol. 90, no. 3, pp. 1326-1331.
Berry, DA, Moon, JB & Kuehn, DP 1999, 'A Finite Element Model of the Soft Palate', The Cleft Palate-
Craniofacial Journal, vol. 36, no. 3, pp. 217-223.
Berry, DA, Zhang, Z & Neubauer, J 2006, 'Mechanisms of irregular vibration in a physical model of the
vocal folds', The Journal of the Acoustical Society of America, vol. 120, no. 3, pp. EL36-EL42.
Birch, MJ & Srodon, PD 2009, 'Biomechanical Properties of the Human Soft Palate', The Cleft Palate-
Craniofacial Journal, vol. 46, no. 3, pp. 268-274.
Boundless 2016, Boundless Biology.
Brancatisano, T, Collett, P & Engel, L 1983, 'Respiratory movements of the vocal cords', Journal of
Applied Physiology, vol. 54, no. 5, pp. 1269-1276.
Brouns, M, Verbanck, S, Van Beeck, J, Vanlanduit, S, Vanherzeele, J & Lacor, C 2006, 'PIV on the flow
of a simplified upper airway model', Proceedings of the 13th International Symposium on
Applications of Laser Techniques to Fluid Mechanics. Lisbon, Portugal: IN+ Center for
Innovation, Technology and Policy Research
Campbell, EJ, Baker, MD & Crites-Silver, P 1988, 'SUbjective effects of humidification of oxygen for
delivery by nasal cannula. a prospective study', Chest, vol. 93, no. 2, pp. 289-293.
Chan, RW, Fu, M, Young, L & Tirunagari, N 2007, 'Relative contributions of collagen and elastin to
elasticity of the vocal fold under tension', Annals of biomedical engineering, vol. 35, no. 8, pp.
1471-1483.
Chatila, W, Nugent, T, Vance, G, Gaughan, J & Criner, GJ 2004, 'The effects of high-flow vs low-flow
oxygen on exercise in advanced obstructive airways disease', CHEST Journal, vol. 126, no. 4,
pp. 1108-1115.
Cheng, S, Butler, J, Gandevia, S & Bilston, L 2008, 'Movement of the tongue during normal breathing
in awake healthy humans', The Journal of physiology, vol. 586, no. 17, pp. 4283-4294.
159
Cheng, S, Gandevia, SC, Green, M, Sinkus, R & Bilston, LE 2011, 'Viscoelastic properties of the tongue
and soft palate using MR elastography', Journal of Biomechanics, vol. 44, no. 3, pp. 450-454.
Chouly, F, Van Hirtum, A, Lagrée, P-Y, Paoli, J-R, Pelorson, X & Payan, Y 2006, 'Simulation of the
retroglossal fluid-structure interaction during obstructive sleep apnea', International Symposium
on Biomedical Simulation, Springer, pp. 48-57
Chouly, F, Van Hirtum, A, Lagrée, P-Y, Pelorson, X & Payan, Y 2008, 'Numerical and experimental
study of expiratory flow in the case of major upper airway obstructions with fluid–structure
interaction', Journal of Fluids and Structures, vol. 24, no. 2, pp. 250-269.
Chouly, F, Van Hirtum, A, Lagrée, P-Y, Pelorson, X & Payan, Y 2009, 'Modelling the human pharyngeal
airway: validation of numerical simulations using in vitro experiments', Medical & biological
engineering & computing, vol. 47, no. 1, pp. 49-58.
Clarke, S, Jones, J & Oliver, D 1970, 'Resistance to two-phase gas-liquid flow in airways', Journal of
applied physiology, vol. 29, no. 4, pp. 464-471.
Cuquemelle, E, Pham, T, Papon, J-F, Louis, B, Danin, P-E & Brochard, L 2012, 'Heated and humidified
high-flow oxygen therapy reduces discomfort during hypoxemic respiratory failure', Respiratory
Care, vol. 57, no. 10, pp. 1571-1577.
Dewan, NA & Bell, CW 1994, 'Effect of low flow and high flow oxygen delivery on exercise tolerance
and sensation of dyspnea: a study comparing the trastracheal catheter and nasal prongs', Chest,
vol. 105, no. 4, pp. 1061-1066.
Dey, KM 2014, 'Anatomic Dead Space Washout and Flow Effects during Breathing with Nasal High
Flow Therapy'
Doorly, DJ, Taylor, DJ & Schroter, RC 2008, 'Mechanics of airflow in the human nasal airways',
Respiratory Physiology & Neurobiology, vol. 163, no. 1–3, pp. 100-110.
Drake, R, Vogl, AW & Mitchell, AW 2009, Gray's anatomy for students, Elsevier Health Sciences.
Drechsel, JS & Thomson, SL 2008, 'Influence of supraglottal structures on the glottal jet exiting a two-
layer synthetic, self-oscillating vocal fold model', The Journal of the Acoustical Society of
America, vol. 123, no. 6, pp. 4434-4445.
Dysart, K, Miller, TL, Wolfson, MR & Shaffer, TH 2009, 'Research in high flow therapy: mechanisms
of action', Respiratory medicine, vol. 103, no. 10, pp. 1400-1405.
Ettema, SL & Kuehn, DP 1994, 'A quantitative histologic study of the normal human adult soft palate',
Journal of Speech, Language, and Hearing Research, vol. 37, no. 2, pp. 303-313.
Evrensel, C, Khan, M, Elli, S & Krumpe, P 1993, 'Viscous Airflow through a Rigid Tube with a
Compliant Lining: A Simple Model for the Air-Mucus Interaction in Pulmonary Airways',
160
Transactions-American Society of Mechanical Engineers Journal of Biomechanical Engineering,
vol. 115, pp. 262-262.
Fontanari, P, Burnet, H, Zattara-Hartmann, MC & Jammes, Y 1996, 'Changes in airway resistance
induced by nasal inhalation of cold dry, dry, or moist air in normal individuals', Journal of Applied
Physiology, vol. 81, no. 4, pp. 1739-1743.
Fontanari, P, Zattara-Hartmann, M, Burnet, H & Jammes, Y 1997, 'Nasal eupnoeic inhalation of cold,
dry air increases airway resistance in asthmatic patients', European Respiratory Journal, vol. 10,
no. 10, pp. 2250-2254.
Gambaruto, A, Taylor, D & Doorly, D 2009, 'Modelling nasal airflow using a Fourier descriptor
representation of geometry', International Journal for Numerical Methods in Fluids, vol. 59, no.
11, pp. 1259-1283.
Gaon, P, Lee, S, Hannan, S, Ingram, D & Milner, A 1999, 'Assessment of effect of nasal continuous
positive pressure on laryngeal opening using fibre optic laryngoscopy', Archives of Disease in
Childhood-Fetal and Neonatal Edition, vol. 80, no. 3, pp. F230-F232.
Garo, A, Hrapko, M, Van Dommelen, J & Peters, G 2007, 'Towards a reliable characterisation of the
mechanical behaviour of brain tissue: the effects of post-mortem time and sample preparation',
Biorheology, vol. 44, no. 1, pp. 51-58.
Geoghegan, PH, Buchmann, NA, Spence, CJT, Moore, S & Jermy, M 2012, 'Fabrication of rigid and
flexible refractive-index-matched flow phantoms for flow visualisation and optical flow
measurements', Experiments in Fluids, vol. 52, no. 5, pp. 1331-1347.
Gray, H 2009, Gray's anatomy: with original illustrations by Henry Carter, Arcturus Publishing.
Groves, N & Tobin, A 2007, 'High flow nasal oxygen generates positive airway pressure in adult
volunteers', Australian Critical Care, vol. 20, no. 4, pp. 126-131.
Hahn, I, Scherer, PW & Mozell, MM 1993, 'Velocity profiles measured for airflow through a large-scale
model of the human nasal cavity', Journal of Applied Physiology, vol. 75, no. 5, pp. 2273-2287.
Hahn, MS, Teply, BA, Stevens, MM, Zeitels, SM & Langer, R 2006, 'Collagen composite hydrogels for
vocal fold lamina propria restoration', Biomaterials, vol. 27, no. 7, pp. 1104-1109.
Hasani, A, Chapman, T, McCool, D, Smith, R, Dilworth, J & Agnew, J 2008, 'Domiciliary humidification
improves lung mucociliary clearance in patients with bronchiectasis', Chronic respiratory
disease, vol. 5, no. 2, pp. 81-86.
Hirano, M & Kakita, Y 1985, 'Cover-body theory of vocal fold vibration', Speech science: Recent
advances, pp. 1-46.
Hollien, H 1960, 'Vocal pitch variation related to changes in vocal fold length', Journal of Speech,
Language, and Hearing Research, vol. 3, no. 2, pp. 150-156.
161
Hörschler, I, Brücker, C, Schröder, W & Meinke, M 2006, 'Investigation of the impact of the geometry
on the nose flow', European Journal of Mechanics-B/Fluids, vol. 25, no. 4, pp. 471-490.
Ishikawa, S, Nakayama, T, Watanabe, M & Matsuzawa, T 2006, 'Visualization of flow resistance in
physiological nasal respiration: Analysis of velocity and vorticities using numerical simulation',
Archives of Otolaryngology–Head & Neck Surgery, vol. 132, no. 11, pp. 1203-1209.
Jeong, S-J, Kim, W-S & Sung, S-J 2007, 'Numerical investigation on the flow characteristics and
aerodynamic force of the upper airway of patient with obstructive sleep apnea using
computational fluid dynamics', Medical engineering & physics, vol. 29, no. 6, pp. 637-651.
Kashif, AS, Lotz, TF, McGarry, MD, Pattison, AJ & Chase, JG 2013, 'Silicone breast phantoms for
elastographic imaging evaluation', Medical physics, vol. 40, no. 6, p. 063503.
Kelleher, JE, Siegmund, T, Chan, RW & Henslee, EA 2011, 'Optical measurements of vocal fold tensile
properties: Implications for phonatory mechanics', Journal of biomechanics, vol. 44, no. 9, pp.
1729-1734.
Kelly, J, Prasad, A & Wexler, A 2000, 'Detailed flow patterns in the nasal cavity', Journal of Applied
Physiology, vol. 89, no. 1, pp. 323-337.
Kim, S, Kim, SK, Chung, SK & Na, Y 2010, 'Numerical Investigation of the Flow-Induced Deformation
in the Human Respiratory Airway', in CT Lim & JCH Goh (eds), 6th World Congress of
Biomechanics (WCB 2010). August 1-6, 2010 Singapore: In Conjunction with 14th International
Conference on Biomedical Engineering (ICBME) and 5th Asia Pacific Conference on
Biomechanics (APBiomech), Springer Berlin Heidelberg, Berlin, Heidelberg, pp. 694-697.
Kook Kim, J, Yoon, J-H, Hoon Kim, C, Wook Nam, T, Bo Shim, D & Ae Shin, H 2006, 'Particle image
velocimetry measurements for the study of nasal airflow', Acta oto-laryngologica, vol. 126, no.
3, pp. 282-287.
Lee, J-H, Na, Y, Kim, S-K & Chung, S-K 2010, 'Unsteady flow characteristics through a human nasal
airway', Respiratory physiology & neurobiology, vol. 172, no. 3, pp. 136-146.
Li, X, Wang, G, Huang, L & Zhang, G 2006, 'Young's modulus extraction methods for soft tissue from
ultrasound measurement system', Instrumentation Science and Technology, vol. 34, no. 4, pp.
393-404.
Liu, Z, Xu, X, Lim, FFJ, Luo, X, Van Hirtum, A & Hill, N 2010, 'Modeling and Simulation of Human
Upper Airway', 6th World Congress of Biomechanics (WCB 2010). August 1-6, 2010 Singapore,
Springer, pp. 686-689
Malhotra, A, Huang, Y, Fogel, RB, Pillar, G, Edwards, JK, Kikinis, R, Loring, SH & White, DP 2002,
'The male predisposition to pharyngeal collapse: importance of airway length', American Journal
of Respiratory and Critical Care Medicine, vol. 166, no. 10, pp. 1388-1395.
162
Mylavarapu, G, Murugappan, S, Mihaescu, M, Kalra, M, Khosla, S & Gutmark, E 2009, 'Validation of
computational fluid dynamics methodology used for human upper airway flow simulations',
Journal of Biomechanics, vol. 42, no. 10, pp. 1553-1559.
Nava, S & Hill, N 2009, 'Non-invasive ventilation in acute respiratory failure', The Lancet, vol. 374, no.
9685, pp. 250-259.
Neubauer, J, Zhang, Z, Miraghaie, R & Berry, DA 2007, 'Coherent structures of the near field flow in a
self-oscillating physical model of the vocal folds', The Journal of the Acoustical Society of
America, vol. 121, no. 2, pp. 1102-1118.
Osborne, J, Osman, E, Hill, P, Lee, B & Sparkes, C 1999, 'A new acoustic method of differentiating
palatal from non-palatal snoring', Clinical otolaryngology and allied sciences, vol. 24, no. 2, pp.
130-133.
Park, K, Brucker, C & Limberg, W 1997, 'Experimental study of velocity fields in a model of human
nasal cavity by DPIV', Proceedings 7th International Conference on Laser Anemometry,
Advances and Applications, Karlsruhe, Germany, pp. 617-626
Parke, RL, Eccleston, ML & McGuinness, SP 2011, 'The effects of flow on airway pressure during nasal
high-flow oxygen therapy', Respiratory care, vol. 56, no. 8, pp. 1151-1155.
Paulsen, E 1882, Experimentelle Untersuchungen über die Strömung der Luft in der Nasenhöhle, KK
Staatsdruckerei in Wien.
Pham, TM, O'malley, L, Mayfield, S, Martin, S & Schibler, A 2015, 'The effect of high flow nasal
cannula therapy on the work of breathing in infants with bronchiolitis', Pediatric pulmonology,
vol. 50, no. 7, pp. 713-720.
Pickup, B & Thomson, S 2009, 'Influence of asymmetric stiffness on the structural and aerodynamic
response of synthetic vocal fold models', Journal of biomechanics, vol. 42, no. 14, pp. 2219-2225.
Pirnar, J, Dolenc-Grošelj, L, Fajdiga, I & Žun, I 2015, 'Computational fluid-structure interaction
simulation of airflow in the human upper airway', Journal of biomechanics, vol. 48, no. 13, pp.
3685-3691.
Proetz, AW 1953, Essays on the Applied Physiology of the Nose, Annals Publishing Company.
Rasani, M, Inthavong, K & Tu, J 2011, 'Simulation of pharyngeal airway interaction with air flow using
low-re turbulence model', Modelling and Simulation in Engineering, vol. 2011, p. 5.
Rea, H, McAuley, S, Jayaram, L, Garrett, J, Hockey, H, Storey, L, O'Donnell, G, Haru, L, Payton, M &
O'Donnell, K 2010, 'The clinical utility of long-term humidification therapy in chronic airway
disease', Respiratory medicine, vol. 104, no. 4, pp. 525-533.
163
Riede, T, Tokuda, IT, Munger, JB & Thomson, SL 2008, 'Mammalian laryngseal air sacs add variability
to the vocal tract impedance: Physical and computational modeling', The Journal of the
Acoustical Society of America, vol. 124, no. 1, pp. 634-647.
Ritchie, J, Williams, A, Gerard, C & Hockey, H 2011, 'Evaluation of a humidified nasal high-flow
oxygen system, using oxygraphy, capnography and measurement of upper airway pressures',
Anaesthesia and intensive care, vol. 39, no. 6, pp. 1103-1110.
Roca, O, Riera, J, Torres, F & Masclans, JR 2010, 'High-flow oxygen therapy in acute respiratory failure',
Respiratory Care, vol. 55, no. 4, pp. 408-413.
Rosen, CA, Leden, H, Ossoff, RH & SIMPSON, B 2008, Operative techniques in laryngology, Springer
Science & Business Media.
Rubin, S, Ghuman, A, Deakers, T, Khemani, R, Ross, P & Newth, CJ 2014, 'Effort of breathing in
children receiving high-flow nasal cannula', Pediatric Critical Care Medicine, vol. 15, no. 1, pp.
1-6.
Rubinstein, I, England, S, Zamel, N & Hoffstein, V 1989, 'Glottic dimensions in healthy men and
women', Respiration physiology, vol. 77, no. 3, pp. 291-299.
Scheinherr, A, Bailly, L, Boiron, O, Lagier, A, Legou, T, Pichelin, M, Caillibotte, G & Giovanni, A
2015, 'Realistic glottal motion and airflow rate during human breathing', Medical engineering &
physics
Scherer, RC, Shinwari, D, De Witt, KJ, Zhang, C, Kucinschi, BR & Afjeh, AA 2001, 'Intraglottal
pressure profiles for a symmetric and oblique glottis with a divergence angle of 10 degrees', The
Journal of the Acoustical Society of America, vol. 109, no. 4, pp. 1616-1630.
Schwab, RJ, Pack, AI, Gupta, KB, Metzger, LJ, Oh, E, Getsy, JE, Hoffman, EA & Gefter, WB 1996,
'Upper airway and soft tissue structural changes induced by CPAP in normal subjects', American
journal of respiratory and critical care medicine, vol. 154, no. 4, pp. 1106-1116.
Sforza, E, Bacon, W, Weiss, T, Thibault, A, Petiau, C & Krieger, J 2000, 'Upper airway collapsibility
and cephalometric variables in patients with obstructive sleep apnea', American journal of
respiratory and critical care medicine, vol. 161, no. 2, pp. 347-352.
Shaw, R 1960, 'The influence of hole dimensions on static pressure measurements', Journal of Fluid
Mechanics, vol. 7, no. 04, pp. 550-564.
Shiba, K 2010, '.1-Functions of larynx in breathing, vocalization and airway protective reflexes',
Handbook of Behavioral Neuroscience, vol. 19, pp. 373-381.
Simmen, D, Scherrer, JL, Moe, K & Heinz, B 1999, 'A dynamic and direct visualization model for the
study of nasal airflow', Archives of Otolaryngology–Head & Neck Surgery, vol. 125, no. 9, pp.
1015-1021.
164
Spence, C, Buchmann, N & Jermy, M 2012, 'Unsteady flow in the nasal cavity with high flow therapy
measured by stereoscopic PIV', Experiments in fluids, vol. 52, no. 3, pp. 569-579.
Spence, C, Buchmann, N, Jermy, M & Moore, S 2011, 'Stereoscopic PIV measurements of flow in the
nasal cavity with high flow therapy', Experiments in fluids, vol. 50, no. 4, pp. 1005-1017.
Spence, C, Geoghegan, P, Lu, X, Jermy, M, Hunter, P & Cater, J 2010, 'Stereoscopic Particle Image
Velocimetry Measurement of Articulatory Airflow for Validation of a Computer Model of
Speech', 17th Australasian Fluid Mechanics Conference
Spence, CJT 2011, 'Experimental Investigations of Airflow in the Human Upper Airways During Natural
and Assisted Breathing'
Stringer, N, Cater, J, Eaton-Evans, J & White, C 2010, 'Numerical Comparison of Air Flow Patterns in
the Upper Airways of Adults and Neonates'
Sztrymf, B, Messika, J, Bertrand, F, Hurel, D, Leon, R, Dreyfuss, D & Ricard, J-D 2011, 'Beneficial
effects of humidified high flow nasal oxygen in critical care patients: a prospective pilot study',
Intensive care medicine, vol. 37, no. 11, pp. 1780-1786.
Taylor, D, Doorly, D & Schroter, R 2010, 'Inflow boundary profile prescription for numerical simulation
of nasal airflow', Journal of the Royal Society Interface, vol. 7, no. 44, pp. 515-527.
Thomson, SL, Mongeau, L & Frankel, SH 2005, 'Aerodynamic transfer of energy to the vocal folds', The
Journal of the Acoustical Society of America, vol. 118, no. 3, pp. 1689-1700.
Tobin, MJ, Chadha, TS, Jenouri, G, Birch, SJ, Gazeroglu, HB & Sackner, MA 1983, 'Breathing patterns.
1. Normal subjects', Chest Journal, vol. 84, no. 2, pp. 202-205.
Tortora, GJ & Derrickson, B 2011, Principles of anatomy and physiology, Wiley, Hoboken, N.J.
Tran, QT, Gerratt, BR, Berke, GS & Kreiman, J 1993, 'Measurement of Young's modulus in the in vivo
human vocal folds', Annals of Otology, Rhinology & Laryngology, vol. 102, no. 8, pp. 584-591.
Van Hove, S, Storey, J, Adams, C, Dey, K, Geoghegan, P, Kabaliuk, N, Oldfield, S, Spence, C, Jermy,
M & Suresh, V 2016, 'An Experimental and Numerical Investigation of CO2 Distribution in the
Upper Airways During Nasal High Flow Therapy', Annals of biomedical engineering, pp. 1-13.
Vegas, MR & Martin del Yerro, JL 2013, 'Stiffness, Compliance, Resilience, and Creep Deformation:
Understanding Implant-Soft Tissue Dynamics in the Augmented Breast: Fundamentals Based on
Materials Science', Aesthetic Plastic Surgery, vol. 37, no. 5, pp. 922-930.
Weibel, E 1989, 'Lung morphometry and models in respiratory physiology', Lung biology in health and
disease, vol. 40, pp. 1-56.
Weinhold, I & Mlynski, G 2004, 'Numerical simulation of airflow in the human nose', European Archives
of Oto-Rhino-Laryngology and Head & Neck, vol. 261, no. 8, pp. 452-455.
165
West, JB 2012, Respiratory physiology: the essentials, Lippincott Williams & Wilkins.
Xu, C, Brennick, MJ & Wootton, DM 2005, 'Image-based three-dimensional finite element modeling
approach for upper airway mechanics', Engineering in Medicine and Biology Society, 2005.
IEEE-EMBS 2005. 27th Annual International Conference of the, pp. 2587-2590
Zhang, Z, Neubauer, J & Berry, DA 2006a, 'Aerodynamically and acoustically driven modes of vibration
in a physical model of the vocal folds', The Journal of the Acoustical Society of America, vol.
120, no. 5, pp. 2841-2849.
Zhang, Z, Neubauer, J & Berry, DA 2006b, 'The influence of subglottal acoustics on laboratory models
of phonation', The Journal of the Acoustical Society of America, vol. 120, no. 3, pp. 1558-1569.
Zhu, JH, Lee, HP, Lim, KM, Lee, SJ, Teo, LSL & Wang, DY 2012, 'Passive movement of human soft
palate during respiration: A simulation of 3D fluid/structure interaction', Journal of
Biomechanics, vol. 45, no. 11, pp. 1992-2000.


![Airway: 2 Airway Management and Ventilation: 11]/2-1.pdf · 2-1.3 Identify the anatomy of the upper and lower airway. (C-1) ... 2-1.88 Demonstrate suctioning the upper airway by selecting](https://img.pdfslide.net/doc/110x75/5abfd8b27f8b9aca388b47d3/airway-2-airway-management-and-ventilation-1-12-1pdf2-13-identify-the-anatomy.jpg)