Embed Size (px)
Citation preview

NELLCONELLCO Legal Scholarship RepositoryNew York University Law and Economics WorkingPapers New York University School of Law
9-1-2013
The Effect of Content on Global Internet Adoptionand the Global “Digital Divide”V. Brian ViardCheung Kong Graduate School of Business, [email protected]
Nicholas EconomidesNew York University, [email protected]
Follow this and additional works at: http://lsr.nellco.org/nyu_lewpPart of the Antitrust and Trade Regulation Commons, and the Internet Law Commons
This Article is brought to you for free and open access by the New York University School of Law at NELLCO Legal Scholarship Repository. It has beenaccepted for inclusion in New York University Law and Economics Working Papers by an authorized administrator of NELLCO Legal ScholarshipRepository. For more information, please contact [email protected].
Recommended CitationViard, V. Brian and Economides, Nicholas, "The Effect of Content on Global Internet Adoption and the Global “Digital Divide”"(2013). New York University Law and Economics Working Papers. Paper 248.http://lsr.nellco.org/nyu_lewp/248

The Effect of Content on Global Internet Adoption and the Global “Digital Divide”*
Abstract
A country’s human capital and economic productivity increasingly depend on the Internet due to its expanding role in providing information and communications. This has prompted a search for ways to increase Internet adoption and narrow its disparity across countries – the global “digital divide.” Previous work has focused on demographic, economic, and infrastructure determinants of Internet access difficult to change in the short run. Internet content increases adoption and can be changed more quickly; however, the magnitude of its impact and therefore its effectiveness as a policy and strategy tool is previously unknown.
Quantifying content’s role is challenging because of feedback (network effects) between content and adoption: more content stimulates adoption which in turn increases the incentive to create content. We develop a methodology to overcome this endogeneity problem. We find a statistically and economically significant effect, implying that policies promoting content creation can substantially increase adoption. Because it is ubiquitous, Internet content is also useful to affect social change across countries. Content has a greater effect on adoption in countries with more disparate languages, making it a useful tool to overcome linguistic isolation.
Our results offer guidance for policy makers on country characteristics that influence adoption’s responsiveness to content and for Internet firms on where to expand internationally and how to quantify content investments.
Keywords: Internet, technology adoption, economic development, two-sided markets, network effects, technology diffusion, digital divide, language.
JEL Classification: O30, O57, L86, L96.
V. Brian Viard Cheung Kong Graduate School of Business
Beijing 100738 China [email protected]
Tel: 86-10-8518-8858
Nicholas Economides Stern School of Business
New York University New York, NY 10012
[email protected]: 1-212-998-0864
This Draft: 9/18/2013
* We would like to thank Steve Berry, Avi Goldfarb, Guido Meyerhans, Hongbin Cai, Yuxin Chen, Li Gan, Fiona Scott Morton, Stéphane Straub, Noam Yuchtman for helpful comments as well as seminar and conference participants at CKGSB, Peking University, Yale University, Southwestern University of Finance and Economics, Zhejiang University, University of California, San Diego, the IDEI Conference on the Economics of the Software and Internet Industries, the Second Annual Internet Search and Innovation Conference, and the 2009 International Industrial Organization Conference. We thank Wang Xin and Qin Mian for excellent research assistance. All errors are our own.
Forthcoming,Management Science
1. Introduction
The number of Internet users has exploded since its commercialization in the early 1990s. From
approximately 10.1 million users in early 1992, the Internet had expanded to almost 1.6 billion by 2009.1
However, this growth has been very uneven across countries with penetration rates varying from 90% to
nearly 0% (see Figure 1). This global “digital divide” is of concern because Internet access is increasingly
important for economic productivity and a well-informed citizenry as more information is accessed
online.2 As a consequence, there is a large literature examining economic and social determinants of
cross-country Internet adoption, but focusing almost exclusively on factors that are fixed in the short run.
We focus on a factor that can be changed quickly: Internet content.
It is well understood that more Internet content in a language will lead to more adopters who use
that language. As a United Nations (UN) report asserts, “Availability of content, in an appropriate
language also affects the diffusion of the Internet. After all if you cannot find content in your language
and you do not read other languages, how can you use the Internet?”3 What is not known is the magnitude
of content’s effect on adoption. This has important policy implications. Because content is more easily
altered than economic, educational, or infrastructure conditions, it offers governments and non-
governmental organizations (NGOs) a means to more quickly influence Internet diffusion. The exact
magnitude of the effect is also relevant for Internet firms that rely on a user base for advertising or
subscription revenue. It is important in evaluating the tradeoff between investing in content creation to
build the user base indirectly versus marketing efforts to attract new users directly. Our estimates quantify
the effectiveness of this “build content and they will adopt” strategy and allow us to offer some guidance
to Internet firms in making such investments.
If content sufficiently stimulates adoption, the ability to target content by language suggests a
useful strategy to narrow the global “digital divide.” The UN has suggested content’s role in reducing this
divide stating: “The dominance of European languages has limited the spread of Internet use by excluding
those not fully literate in those languages.”4 It would also suggest that content production is an effective
strategy for firms to expand their user base. However, the question remains how effectively content
stimulates adoption.
Content has a statistically and economically significant effect on adoption, implying that it is an
effective policy and strategic tool. Our estimates explicitly recognize language as the conduit from
1 International Telecommunications Union in World Development Indicators, World Bank. 2 For an aggregate study on the link between the Internet and productivity see Litan and Rivlin (2001) but a critique by Gordon (2000). Industry-specific studies include Goolsbee (2002) in health insurance and Scott Morton, et al.(2001) in car retail. ITU (1999) provides a policy perspective on its economic and social role. 3 ITU (1999), page 4, italics in original. 4 “Harnessing the Internet for Development: African Countries Seek to Widen Access, Produce Content,” AfricaRenewal, United Nations, Vol. 20, No. 2, July 2006, page 14.

2
content to adoption, confirming that creating content in underserved languages is an effective policy to
address the global “digital divide.” We quantify content’s effect on adoption in four different ways but all
indicate a large effect. First, we find an elasticity of adoption with respect to content of 0.31 – about
three-fourths the price elasticity of adoption. Second, a country one standard deviation above the mean
level of relevant content has an adoption rate 2.0 percentage points or 20% higher than the mean adoption
rate of 9.9 percentage points in the sample. Third, the magnitude of content’s effect is about one-third that
of GDP (the most significant driver) and stronger or of similar strength to that of other economic,
infrastructure, and demographic factors that significantly affect adoption. Fourth, the annual rate of
content creation in our sample increased adoption by 6.0 to 7.8% annually.
To further inform policy making and firm strategies, our model can identify country
characteristics that affect adoption’s sensitivity to content. Content has greater influence in countries with
better infrastructure as measured by the extensiveness of the domestic phone system and international
gateway speeds. This suggests Internet content providers wishing to access international markets should
target such countries and infrastructure investment is a means for governments to stimulate adoption.
Content also has more influence in countries with weaker intellectual property protection consistent with
less costly and more widely available content. Thus, content providers who can sufficiently protect their
content will experience greater uptake in international markets with weaker protections and that
governments setting copyright policies face a tradeoff between dynamic incentives to create content and
its usage once created.
We also identify an important role for the Internet in overcoming linguistic isolation. Content
affects adoption more in countries with more disparate languages. This suggests that creating content
targeted at populations that speak languages uncommon in their surroundings may reduce their isolation.
The predominance of English-language Internet content has been cited as an important dimension of
inequality between social and linguistic groups (see DiMaggio et al., 2004). This result parallels that of
Sinai and Waldfogel (2004) who find that the Internet helps overcome racial isolation in the United States.
This also suggests an opportunity for Internet firms to target such populations.
Internet service is a two-sided market – user adoption depends on content availability and vice-
versa. This feedback makes it difficult to empirically isolate content’s effect on adoption. Estimating the
causal effect of content is further complicated by the likely presence of unobserved country-specific
factors that drive both content production and adoption. In particular, populations of countries with a high
desire for Internet usage for unobserved reasons may also create more content for the same reasons. We
develop a methodology to control for the endogeneity of content with respect to the installed base of
Internet users, while controlling for a host of factors known to affect adoption. This approach also helps

3
eliminate sources of spurious correlation that explain both content and adoption. To further reduce the
possibility of spurious correlation we include an extensive set of fixed effects in our estimation.
Our identification approach uses “large”-country content as an instrument for relevant content
when estimating the effect of content on adoption for “small” countries, where we define “small” and
“large” based on the number of potential adopters in a country. We argue and provide empirical evidence
that content production by “large” countries is exogenous to Internet adoption in “small” countries. We
assume that potential adopters value most content in their own language. Therefore, to identify content
relevant to a country’s potential adopters, we use the distribution of their language usage and measure
content based on the storage capacity of computers hosting Internet content in those languages. Previous
papers support our use of language to define Internet content relevance. ITU (1999) uses aggregate web-
traffic statistics to show that language determines Internet content’s relevance. Gandal (2006) shows that
language usage heavily influences the languages of websites visited during individual-level browsing and
provides evidence that English-language dominance in Internet content may continue based on bilingual
users’ online behavior.
Using “large”-country content to instrument “small”-country relevant content also helps eliminate
sources of spurious correlation that might bias our results. Instrumenting sterilizes the estimates from
unobserved factors that drive both content and adoption within each “small” country. Any remaining
spurious correlation must be across “small” and “large” countries. We include an extensive set of fixed
effects that makes this unlikely. Country fixed effects remove country-specific time-constant
unobservables, while year fixed effects eliminate time-specific unobservables operating across the
“small” and “large” countries. Finally, language fixed effects remove language-specific unobservables
that drive adoption in “small” countries and content production by “large” countries with which they are
instrumented.
Our results have implications for government policies that affect Internet content production.
Governments directly create content, so much so that its quantity has raised concerns about effective
archiving.5 Much of this is generated as a part of regular government business, but some is specifically
targeted at underserved languages. Qatar’s government is developing digital archives of major Arabic
texts to increase Arabic content.6 NGOs have also targeted underserved languages. One NGO described
5 “Website Archives to be Fast-Tracked,” The Guardian, December 27, 2009 and “National Archives: The Challenge of Electronic Records Management,” General Accounting Office, Report #T-GGD-00-24, October 20, 1999. 6 “Qatar Initiative to Increase Arabic Content on Internet,” Gulf Times, February 10, 2010.

4
content development efforts in Uganda as, “. . . increasingly important and valuable to the market.”7 Arab
countries working with NGOs have established rewards for high-quality, Arabic content and encouraged
collaboration between universities and research centers to produce content.8 Other efforts are targeted at
underserved populations. In the U.S. the Federal Communications Commission announced in late 2011 a
policy to promote job and education information relevant to households who had not yet adopted
broadband.9
Perhaps more important than governments’ direct content creation are the indirect effects of their
policies. Decisions on Internet technical standards have far-reaching effects on content creation.
Originally architected in English, the Internet does not easily accommodate developing or finding content
in languages using non-Latin characters. In response, the Internet Governance Forum approved a multi-
year effort to allow non-Latin characters in website addresses.10 Similarly, many Internet browsers will
not properly display Arabic content due to a lack of agreement among Arab countries on a uniform
format.11 Our results also offer guidance to firms in evaluating their content investments. The estimates of
adoption’s sensitivity to content can be used to quantify the tradeoff between marketing investments to
increase usage directly and content investments to increase it indirectly. These are especially useful for
firms relying on user-generated content to evaluate investments in customer acquisition.
2. Identification Strategy
Simply relating adoption and content will overstate content’s effect as it will conflate content’s
effect on adoption with the feedback effect of adoption on content. At the same time, unobserved
heterogeneity across countries may introduce spurious correlation. Our identification approach addresses
both of these issues.
To disentangle content’s effect on adoption we use the subset of content created by “large” (in
terms of number of language users but not necessarily geographic area) countries as an instrument for
relevant content when estimating the effect of content on adoption for “small” countries only.12
7 Canada’s International Development Research Centre (IDRC) described in Funding and Implementing Universal Access: Innovation and Experience from Uganda, Uganda Communications Commission, International Development Research Centre, Ottawa, Ontario (Chapter 3). 8 “Arabic Content on Internet . . . Obstacles and Solutions,” The Emirates Center for Strategic Studies and Research, April 22, 2008. 9 “F.C.C. Push to Expand Net Access Gains Help,” New York Times, November 9, 2011. 10 “International Net Domains ‘Risky,’” BBC News, October 30, 2006. Methods of using non-Latin characters in website addresses emerged in 2003 but without standardization or official approval. 11 “Arabic Content on Internet . . . Obstacles and Solutions,” The Emirates Center for Strategic Studies and Research, April 22, 2008. 12 We use number of language users as a measure of potential adopters in that language. We do not use the actual number of adopters using the language because it is endogenous.

5
Identification relies on the assumption that content creation by “large” countries is exogenous to adoption
in “small” countries. Intuitively, we assume that the number of adopters in “small” countries is small
enough that content creators in the “large” countries focus only on the number of adopters in the “large”
countries.13 That is, we assume that content created in “large” countries is relevant to and therefore
consumed by those in “small” countries who share the same language even though the latter are typically
ignored by the content creators when choosing the profit-maximizing level of content.
We justify this assumption based on two related arguments. First, even if content creators can
collect revenues from users in “small” countries these represent such a small fraction that they do not
affect content creation decisions. Second, it is frequently difficult to collect revenues from users in
“small” countries because of legal impediments, high fixed costs of collecting subscription fees across
country boundaries, and difficulty in targeting online advertising to these small groups. Relevancy of
content to users in “small” countries has been reported to create a financial conundrum for major content
providers such as Facebook and YouTube who must provide the additional bandwidth to support these
users despite difficulty in collecting revenues.14 Besides these qualitative arguments, we provide
quantitative evidence that this assumption holds when we present our data and results. At the same time,
the instrument’s inclusion restriction is met because relevant content consumed in “small” countries is
affected by “large”-country content given its ubiquity. We must omit the “large” countries from
estimation to maintain exogeneity. Therefore, our results may not extrapolate to “large” countries;
however, the combined population of our “small” countries is 2.0 billion.
We assume that an Internet user is most interested in content of her primary language and define
“small” and “large” countries accordingly. We identify countries that comprise a large percentage of the
worldwide users of a language as “large.” The remaining countries with small populations using that
language we identify as “small.” Identification requires languages with a skewed distribution of users – a
few countries represent most of the worldwide users while a large number of countries have a small
13 Two previous papers use related identification schemes. Gowrisankaran and Stavins (2004) estimate network effects in adoption of the automated clearinghouse system (ACH) by clusters of U.S. banks. One method to isolate the network effect from a strong local preference for ACH is to examine the effect of adoption by small branches of large banks on the adoption decisions of rival banks in the same local markets. Identification relies on the fact that a bank must implement ACH at all its branches simultaneously. Shriver, Nair, and Hofstetter (2012) examine the effect of online content production on the formation of social ties and Internet usage among surfers. They use exogenous wind speed changes as an instrument to break the feedback loop between social ties and production of user-generated content. 14 “In Developing Countries, Web Grows Without Profit,” New York Times, April 27, 2009. For example, the article states, “Facebook is in a particularly difficult predicament. Seventy percent of its 200 million members live outside the United States, many in regions that do not contribute much to Facebook’s bottom line,” and quotes the chief executive officer of a San Diego-based video-sharing site who says of its users in Africa, Asia, Latin America, and Eastern Europe: “They sit and watch and watch and watch. The problem is that they are eating up bandwidth and it’s very difficult to derive revenue from it.”

6
percentage of the users. This provides a large number of observations while satisfying the exogeneity
assumption.
For each “small” country, relevant content includes worldwide content (produced by both “small”
and “large” countries) in the language(s) of its population. Since a “small” country’s population may use
a mixture of languages, we construct a weighted-average measure of the relevant content based on the
fraction using each language. For example, in Belgium 38% of people speak Dutch, 33% French, 9%
Walloon, 9% Vlaams, 5% Limburgisch, and 2% Italian as their primary language.15 Relevant content for
Belgium would equal 0.38 times the worldwide quantity of Dutch content plus 0.33 times the worldwide
quantity of French content and so on. As a byproduct, the language usage distributions provide significant
cross-sectional variation in relevant content. The instrument for each “small” country is constructed
analogously – a weighted-average of “large”-country content based on the language distribution of the
“small” country’s population.
Identification may also be affected by the presence of country-level unobservables that affect
both content production and adoption but are separate from the indirect network feedback loop. If
unaccounted for these will induce correlation between relevant content and the error in our adoption
equation and bias the coefficients on relevant content and the control variables. Our instrumenting
approach combined with the large number of controls we include makes this unlikely. In our estimation
we include year and country fixed effects in addition to a wide range of control variables. This means that
any unobserved factors cannot be common to countries within the same year or result from country-
specific characteristics. Thus, our estimation approach is robust to among others: country-specific policies
that promote adoption or content production; changes in standards that promote adoption or content
production Internet-wide; and secular trends in adoption or content production due to factors such as
technological changes in storage or transmission of data.
The content variable, once instrumented, will only be correlated with the adoption error if the
unobserved factors drive both “large”-country content production and “small”-country adoption.
Moreover, our instrumenting approach groups “small” and “large” countries based on the distributions of
language usage across countries. Bias would require that adoption and content production be correlated
within these groupings but in a way such that there is no common correlation across the “small” countries
and no common correlation across the “large” countries because these would be absorbed by the year
fixed effects. Importantly, these languages, and therefore the set of “large” countries within each group,
differ for each “small” country according to its language distribution which is exogenous with respect to
Internet adoption and content. Since the grouping of a “small” adopting country with “large” content
15 The remaining 4% use languages that each represents less than 1% of Belgium’s population.

7
producers is mediated through language, a possible way for bias to enter is through language-specific
unobservables. To address this, we show that our results are robust to adding language fixed effects.
3. Econometric Model
We model the simultaneous determination of a country’s content production in a language and
adoption in that country by people using that language. The fraction of a language’s users adopting the
Internet in a country is a function of the worldwide content available in that language since Internet
content is accessible anywhere.16 Internet content produced by a country in a language is a function of the
worldwide adopters using that language since the content is accessible worldwide.17
Let 1,2,...,i I index countries, 1, 2,...,j J languages, and 1,2,...,t T years. We model
adoption and content production according to the simultaneous system of stochastic equations:
(1a)1
AdoptersContent
Users
I Aijt A A A A A A Aijtit i t i kjt
kij
X Z
(1b) 1
Content Adopters ,I CC C C C C C C
ijtijt it i t i kjtk
X Z
where Adoptersijt is the number of Internet adopters who use language j in country i at time t ,
Usersij is the number of users of language j in country i which does not vary over time in our data, and
Content ijt is the content available in language j at time t produced by country i . AitX and C
itX include
possibly overlapping sets of time-varying factors affecting Internet adoption and content, while AiZ and
CiZ are the same for time-constant factors.
The parameters to be estimated are , , , , ,A A A C C C . The latent year effects, At and
Ct , capture unobserved time-specific factors affecting adoption and content respectively. The latent
country effects, Ai and C
i , are time-invariant random variables that capture unobserved factors
affecting adoption and content respectively. We discuss the statistical properties of these fixed effects
below. The error terms, Aijt and
Cijt , are independently and identically distributed across countries,
languages, and time periods. We expect , 0A C . This specification assumes that content’s effect on
16 We control for government restrictions on Internet access in our estimation. 17 As explained below, the content is not necessarily hosted on a computer located physically within the country.

8
adoption is the same across languages. While in theory we could allow the effect to vary by language, in
practice there is insufficient data to identify this.
If AitX and C
itX each contain at least one variable not contained in the other, a system method of
estimation for (1a) and (1b) may be feasible. Unfortunately, we do not have available any variables
thought to affect content but not adoption. Instead we estimate (1a) using limited-information estimation
methods and use equation (1b) to inform our search for an appropriate instrument for the content variable
in equation (1a).
For a set of the most frequently used languages, FJ , we divide countries into “large” Li I
and “small” Si I based on the number of language users with ,S LI I I . Our identification
assumption is that content production by “large” countries is unaffected by adoption in “small” countries.
More formally, 1
Adopters AdoptersL
I
kjt kjtk I k
so that:
(1b') Content Adopters , , .L
CC C C C C C Cijtijt it i t i kjt L F
k IX Z i I j J
If equation (1b') holds then ContentL
kjtk I
(“large”-country content) is a valid instrument for
1Content
I
kjtk
(worldwide relevant content) in equation (1a) estimated on the set of “small” countries:
(1a') 1
AdoptersContent , .
Users
I Aijt A A A A A A Aijtit i t i kjt S
kij
X Z i I
To preserve degrees of freedom we use only the world’s most pervasive languages to construct
the instrument. Enlarging this set involves a tradeoff between decreasing available data and increasing the
instrument’s power. Including an additional language reduces the available data because “large” content
producers for that language must be excluded to maintain the exogeneity assumption. On the other hand,
it increases the instrument’s power since more languages means the instrument is more highly correlated
with the “small” countries’ consumed content. In Section 5 we empirically assess the exogeneity and
relevance conditions for our instrument. Our choice of languages for the instrument is discussed in
Section 4.
Since we observe only the aggregate number of Internet adopters in each county, we transform
Equation (1a') into one which we can estimate. Multiplying through by the number of users of language
j and then summing across all languages we obtain:

9
(2)1 1 1
1 1
Adopters Users Users
Users Content , .
J J J AA A A A A Aijtijt it i t ij ij i
j j j
J IA
ij kjt Sj k
X Z
i I
Since1Users =Population
J
ij ij
:
(3)1 1 1Adopters Users Adopters Population =Penetration ,
J J J
ijt ij ijt i itj j j
where Penetrationit is the fraction of country i ’s population that have adopted the Internet at time t ,
which we observe. Dividing both sides of Equation (2) by Populationi we get:18
(4) 1 1Users Content
Penetration , .Population
J I
ij kjtj kA A A A A A A A
it it i t i it Si
X Z i I
We call the weighted-average measure of content in Equation (4) the relevant content for “small”
country i in year t :
(5) 1 1Users Content
, .Population
J I
ij kjtj k
it Si
relcon i I
This includes content produced worldwide in each of the languages used within country iweighted by the proportion of the population using that language. This includes content produced in
country i as well as content in relevant languages produced outside the country. The instrument for
relevant content is defined similarly but includes only content produced by “large” countries:
(6)1
1
Users Content, .
Users
L
J
ij kjtj k I
it SJ
ijj
instrument i I
18 Transforming Equation (1a') into Equation (4) introduces country-level heteroskedasticity since the distribution of languages varies across countries. This is difficult to accommodate in the Hausman-Taylor estimates. However, our fixed-effects estimates in Table 5, which are consistent, are robust to general forms of heteroskedasticity and yield similar results to the Hausman-Taylor estimates.

10
Ait is a country-time period unobservable that affects adoption in country i at time t . We
distinguish, on a priori grounds, columns of X and Z that are asymptotically uncorrelated with Ai
from those that are not so that our assumptions about the random terms in the model are:
(7) 1 1, 0A A A Ait i it itE E X Z but 2 2, 0A A A
i it itE X Z , 21 1 2 2, , ,A A A A A
i it it it itVar X Z X Z ,
1 1 2 2, , , , 0A A A A A Ait i it it it itCov X Z X Z , 2 2 2
1 1 2 2, , ,A A A A A Ait i it it it itVar X Z X Z ,
2 21 1 2 2, , , ,A A A A A A A A
it i is i it it it itCorr X Z X Z .
This error structure allows the Hausman and Taylor (1981) (HT) estimator. HT refer to 1AitX as
time-varying exogenous, 2AitX as time-varying endogenous, 1
AitZ as time-invariant exogenous, and 2
AitZ as
time-invariant endogenous variables. We discuss these classifications and justify our use of the HT
estimator vis-à-vis a fixed-effects and random-effects estimator in Section 5.
The exogeneity of “large”-country content suggests a simpler estimation approach: regress
“small”-country adoption on “large”-country content. However, this has an important practical limitation.
“Large” countries for all included languages must be dropped from the analysis to meet the exogeneity
condition. To maintain a sufficient sample size, not all languages can be included and therefore it is not
possible to include all external (outside the country) content for each “small” country. This introduces an
omitted variable bias the sign of which depends on the correlation between the included and excluded
external content net of the effect of the control variables. While the sign of this correlation is theoretically
indeterminate, it is likely negative since more included external content for a “small” country implies less
excluded content. Our instrumenting strategy frees us from producing inconsistent estimates because now
we can include all content (internal and external) for each “small” country while solving the endogeneity
problem. We still must exclude “large” countries from the analysis but this can be minimized as we need
only enough included languages to adequately satisfy the instrument’s inclusion restriction.
Ideally we would estimate adoption’s effect of content using a similar strategy – use adoption
rates in “large” countries as an instrument for “small”-country adoption rates when predicting “small”-
country content production. This is not possible for two reasons – one methodological and the other
practical. “Large”-country adoption rates as an instrument fails the exclusion restriction. Since content is
ubiquitous, “large” and “small” county content are substitutes. We also face a practical problem; we do
not observe language-specific adoption rates. Therefore, only time-series variation would identify
adoption’s effect on content.

11
4. Data
Our sample includes data on 176 “small” countries and 31 “large” countries from 1998 to 2004.19
Table 1 contains summary statistics on the main variables. Online Appendix B contains more details on
variables and their sources.
Internet Users: Our dependent variable is the fraction of country i ’s population with Internet
access at time t (see Figure 2 for 2004 “small”-country adoption rates in the sample). The International
Telecommunications Union (ITU) collects this data and does not distinguish speeds or modes of access.
During our sample years, virtually all access was through one of three modes: narrowband (or dial-up)
access through a phone line, broadband (or digital subscriber line) access through a phone line, and
broadband access through cable lines. The ITU data measures all Internet users regardless of location.20
Unfortunately, the data do not allow us to control for access speed since content may drive adoption of
higher-quality access. During our sample period most relevant content is textual minimizing this
concern;21 however, if non-textual content were significant it would bias our estimate of content’s effect
downward. There would tend to be less content created in languages whose users have slow connections.
We would overstate this content even though adoption would actually be lower due to less available
content.
Content: We measure content by the number of host computers connected to the Internet in each
year for each country. Host computers contain accessible content and the total quantity of content is
19 Online Appendix A contains a list of the “small” countries. These include twelve non-self-governing territories: overseas territories (Bermuda), overseas regions (French Guiana, Guadeloupe, Martinique), overseas collectivities (French Polynesia, Mayotte), sui generic collectivities (New Caledonia), special administrative regions (Hong Kong, Macao), disputed territories (Palestinian West Bank and Gaza), unincorporated organized commonwealths (Puerto Rico), overseas departments (Reunion), and unincorporated organized territories (Guam, U.S. Virgin Islands). We include these because we believe their social and economic conditions differ substantially enough from their governing countries that they represent independent observations. Content measures are not available for Hong Kong, Macao, and Mayotte so they do not identify the effect of content. 20 ITU’s data distinguishes between “Estimated Internet Users” and “Internet Subscribers.” Users of Internet cafes, for example, would be included in the former, which is our variable, but not in the latter. 21 Of file space for publicly-available Internet data in 2003, text-related files (Excel, text, Word, Powerpoint, pdf, PHP, and HTM/HTML) represented 41%, image data 23%, and audio and movie files 7%. The remaining 29% were of unknown type or executable files (Lyman and Varian, 2003). Since images may also contain text a lower bound for text files as a fraction of known file types is 58% and of all (classifiable and unknown) is 41%. Since 2003 is near the end of our sample period, text is likely an even higher fraction in earlier years as faster access speeds over time have led to increased use of images and video. This data is for the “surface” web. There is a large amount of data in the “deep” web but most of it is not publicly accessible during our sample period either because it is behind corporate firewalls or is not indexed by search engines (see Bergman (2001)). Our measure of hosts includes the “surface” but not “deep” web. For a later period, Bohn and Short (2008) estimate that in 2008 Internet text comprised 178 hours of usage for the average Internet user while video comprised two hours. In terms of storage, they estimate that in 2008 there were 8.0 exabytes of Internet text compared to 0.9 of video. Video would play an even smaller role during our sample period when Internet connections were much slower.

12
proportional to the number of computers.22 This does not measure content quality; however, for our
estimates it need only be the case that quality is proportional to storage capacity across different
languages. We do not directly observe the language of these computers’ content but rather infer it from
the registration country as explained below.
Internet host numbers are based on data from the Internet Systems Consortium, Inc. (ISC).
During our sample period, ISC took an annual census of host computers connected to the Internet. ISC
maintained the same sampling procedure throughout our sample years, ensuring comparability. However,
since computer storage capacity may change over time, we include year dummies in all our estimates and
also estimate separate yearly effects as a robustness check.
The ISC data also allocates each host to a country which allows us to allocate them to languages.
Assignment of a host to a country does not necessarily mean that the computer is physically located
within the country; however, our estimation requires only that the computer contains content created
within that country. The rules for assigning hosts make this likely. Although the rules differ slightly
across countries, most require a local presence requirement such as citizenship, resident address, or local
administrative contact.23
Since more than one language is used in most countries we allocate the total hosts to each
language based on the fraction of the country’s population using each language.24 This assumes that all
content is language-specific. As discussed earlier, Internet content during our sample period is primarily
textual; moreover, much non-textual content is language-specific as images often contain text and videos
language-specific dialogue. Nonetheless, Online Appendix D shows that our model accommodates non-
language specific content assuming that each country’s language-specific content is produced in the same
proportion as language users in that country and that language-specific and non-language specific content
affect adoption equally on the margin. The former assumption is the same required when we allocate
hosts to languages within countries so only the latter is potentially restrictive. If adoption is more
responsive to language-specific than non-language specific content then our estimates will understate
content’s effect. If the opposite is true we will overstate it. Combining this measure of content for each
country in each year with the language data we construct the relevant content and instrument for each
country-year pair based on Equations (5) and (6).
22 Host computers are connected to the Internet and contain accessible content. There are many more computers connected indirectly to the Internet through local area networks (intranets). Computers on an intranet can access the Internet but cannot host content. 23 Online Appendix C contains more detail on how ISC collects the host data and allocates it to countries. 24 This is not a major concern for our instrument as the populations of virtually all of the “large” countries are dominated by a single language. We assume that all the host computers in “large” countries pertain to that country’s dominant language.

13
Prior to 1999, if ITU could not find an independent estimate of Internet users in a country it based
its estimate on a multiple of the number of host computers in the country, which would pose problems for
our estimation. After this, ITU used only surveys to quantify users.25 To see if this is a problem, we re-
estimated our baseline estimates dropping the year 1998 data. The results were virtually identical.
Language Users: Our source for language data is Ethnologue (Gordon, 2005), which offers the
most comprehensive catalogue of the world’s languages (for linguistic reviews see Campbell and
Grondona (2008), Hammarström (2005), and Paolillo and Das (2006)). Ethnologue provides detailed and
comprehensive estimates of first-language speakers of each language by country.26 Its data is not
complete enough to estimate using second-language speakers.
Since Internet content was primarily textual during our sample period, we ideally would use
numbers of literate users of each language to create our relevant content measure. Since we do not
observe language-specific literacy rates by country we use numbers of speakers of each language in a
country and include the country’s overall literacy rate as a control variable. We combine spoken dialects
whose users employ the same written language. For example, we combine speakers of the many Chinese
dialects that all utilize simplified Chinese for writing. Ethnologue is a thorough accounting of the world’s
languages. As a result some are spoken by very few people. To make data entry manageable, for each
country we added languages in descending order of the most-spoken and kept adding until the next
language would contribute less than one percent of the country’s population or all languages were
exhausted. Across all countries this comprised 811 languages or spoken dialects.
To choose instrument languages, we apply the two criteria discussed in Section 2: it is spoken in
many countries and its usage distribution is skewed with a few countries comprising a significant fraction
of total users. Based on these criteria we use fourteen languages to construct our instrument:27
(8), , , , , , ,
., , , , , ,F
Chinese Spanish English Hindi Portuguese Russian JapaneseJ
German French Hausa Zulu Nyanja Pulaar Pular
The first eight are among the top ten most-spoken languages in the world based on Ethnologue.28
French is the seventeenth most-spoken language. The usage of the languages between the tenth and
seventeenth (Javanese, Telugu, Marathi, Vietnamese, Korean, and Tamil) is either not widespread or is
fairly uniformly distributed across countries. The last five languages were chosen to include African
25 “Measuring the Diffusion of the Internet” at: www.itu.int/ITU-D/ict/papers/1999/MM-Inet99-Jun99.ppt.26 Ethnologue does not distinguish between native and primary first-language speakers. This should be considered in interpreting our results. 27 To check the robustness to the choice of instrument languages we randomly divided these into two groups of seven languages each and re-estimated our baseline results in Column 3 of Table 5 using each of these two sets to construct the instrument. The coefficient on relevant content for both estimates was within 1.6% of our baseline estimate and the coefficients remained significant at below the 0.01% level. 28 Arabic (fourth) and Bengali (seventh) were not included because their usage was not skewed enough.
14
languages subject to meeting our two criteria. Each of these five is spoken in at least four countries and
the two most populous countries using the language represent at least 82% of total users. Column 3 of
Table 2 shows the total number of users for the fourteen languages used to construct our instrument: 2.7
billion people or 44% of the 6.1 billion world population in 2000.
We use the number of potential adopters (i.e., population using a language) in a country to
identify “large” and “small” countries. We choose the “large” countries (the set LI ) for our instrument
(Equation (6)) by the following procedure. For each language, sort the countries in descending order by
the number of users. Starting at the top, add countries until the last country added brings us above 75% of
worldwide users. There were three exceptions when we kept adding above 75%.29 Column 5 of Table 2
shows the 31 “large” countries chosen, while Columns 6 through 8 show the number of users in the
“large” countries and as a percentage of worldwide users. Identification relies on the Column 8
percentages being large so that these countries are unaffected by adoption in “small” countries (the 31
“large” countries will be excluded from our analysis). The “large” countries represent 80% or more of the
world’s users of each language.
The last three columns of Table 2 show data for each language’s largest “small” country.
Columns 10 and 11 show the number of users in the largest “small” country and as a fraction of
worldwide users. Identification depends on the Column 11 percentages being small so that Internet
adoption in these countries does not affect “large” countries’ content production. The largest “small”
countries represent eight percent or fewer of the world’s users for each language. The percentages for all
other “small” countries are below this.
Control Variables: We include as many control variables from previous studies of Internet
adoption as possible so as to isolate content’s effect. Therefore, subject to preserving enough degrees of
freedom to discern content’s effect, our goal is to maximize the variance explained by our regressions
rather than the significance of individual coefficients. To identify control variables we rely on previous
papers estimating cross-country Internet adoption.
Time-varying factors include measures of wealth, education, infrastructure, cost of access, and
freedom of expression. Per-capita GDP measures a country’s wealth, which we expect to positively affect
adoption. Internet access is likely more highly valued in countries with more educated populations so we
include the fraction of eligible children enrolled in primary school. We include the fraction of the
29 The three exceptions were because there was an obvious large drop between two countries. For Chinese, mainland China alone would bring us above 75% but we added Taiwan because it had 5.2 times as many Chinese speakers as the next largest country, Malaysia. For English, the U.S. and the U.K. alone would bring us above 75% but we added Canada and Australia because Australia was 4.9 times as large as the next largest country, New Zealand. For Portuguese, Brazil alone would bring us above 75% but we added Portugal because it is 15.6 times as large as the next largest country, Paraguay.

15
population with fixed phone lines to measure telecommunications infrastructure quality. While there are
other ways to access the Internet during this time, these were either rare (satellite and wi-fi) or likely
highly correlated with telephone infrastructure (cable television). We include Freedom House’s measure
of citizens’ freedom to engage in expression to control for the degree of government restrictions on
content access. The measure ranges from one to seven with seven being the most free.30
We include average monthly Internet access prices normalized by per-capita GDP to control for
cost of access. Unfortunately, prices are available only for three years (1998, 2000, and 2001) and not for
all countries. Since each year’s data measures a different type and amount of usage, we cannot pool it
across years. Internet access prices and adoption may both be higher in countries with higher unobserved
access quality, which would bias the price coefficient toward zero. We therefore instrument with variables
affecting price but affecting adoption only through price. Since we include fixed effects in our final
estimation we use three time-varying instruments. Corporate tax rates directly affect the cost of providing
Internet access. The ratio of government tax receipts to GDP captures the regulatory atmosphere in which
the Internet service providers operate. The number of telephone employees per fixed line proxies for the
productivity of or labor-capital ratio in the telecommunications industry.
We also include a number of time-constant controls. These are “time-constant” in that we observe
only one year of data, although they likely change slowly. The Gini coefficient of income controls for the
wealth distribution within a country and we expect higher inequality (higher Gini coefficient) to
negatively affect adoption. The fraction of a country’s population living in urban areas measures
infrastructure, demand, or both. More densely-populated areas can be served more cheaply on a per-
customer basis than more dispersed. At the same time, it may be that Internet access demand by urban
residents differs from that by rural. Since familiarity with the Internet is likely age-dependent, we control
for the country’s age distribution using the population fraction in four age brackets. Average household
size allows for potential economies of scale in adopting Internet access within households. Literacy rate
controls for the ability of a country’s population to read content.
These control variables are drawn from a variety of papers. Wallsten (2006) explains broadband
penetration for OECD countries, while Wallsten (2005) assesses the impact of regulation on developing
countries’ Internet adoption rates and prices. Ford, et al. (2007) produce a broadband performance index
for OECD countries based on the predicted values from an adoption regression. Chinn and Fairlie (2006)
explain cross-country Internet and computer adoption rates.
We know of only three papers that include language to explain Internet adoption all of which
include only a single language (English) and do not control for endogeneity. Hargittai (1999) explains
30 Freedom House defines seven as the least free. We reverse the order for ease in interpretation.

16
Internet adoption by OECD countries and includes English-language usage as an explanatory variable
because of its importance in the media and computing fields. The effect of language is not significant.
Kiiski and Pohjola (2002) estimate a diffusion model of Internet adoption by OECD countries and include
English-language proficiency for the same reason but estimate a negative effect. Wunnava and Leiter
(2008) also estimate a diffusion model of Internet adoption but with more countries. They include
English-language proficiency to measure the accessibility of English-language content. They find a
positive and significant effect.
5. Main Results
Content availability has a positive and statistically significant effect on adoption. Since content is
not directly measurable, there is no single right way to quantify its effect. We provide several ways and
find an important role regardless. First, we compute an elasticity of adoption with respect to content and
compare it to other markets. Second, we compare content’s effect to that of other adoption determinants.
Third, we quantify the additional adoption that results from the annual average content production in our
sample.
Before we formally estimate the effect of content on adoption, we examine the correlations
between adoption and the various measures of content including the instrument. These are shown in Table
3. A country’s own content is highly positively correlated with its own Internet adoption, consistent with
a two-sided market. Relevant content is also highly positively correlated with adoption, consistent with
the ubiquity of Internet content (this content is produced both within and outside the country but in the
languages of its population). However, relevant content and own content are not significantly correlated.
This is consistent with a country’s own content production being determined by two-sided market effects
within the country while relevant content is determined by two-sided market effects across many
countries sharing common languages.
Finally, “large”-country content (the instrument) is highly correlated with both adoption and
relevant content but is much less correlated with a county’s own content. This is consistent with “large”-
country content influencing a country’s content production only indirectly through adoption. The low
correlation between “large”-country and own-country content is informal evidence that the exclusion
restriction is met, while the high correlation between “large”-country and relevant content is informal
evidence of its relevance. We provide more formal tests of the instrument’s validity below.
First-Stage Results: Columns 1 through 3 of Table 4 show the first-stage results for Internet
access prices. Given the small number of observations in each year, the coefficients are noisy. Number of
telephone employees has a positive effect and is significant in two of the three years consistent with

17
higher prices from lower productivity. Government tax receipts has a significantly negative effect in all
three years, consistent with greater subsidies for Internet access in countries with greater government
revenues.
We allow for a flexible functional form in the first-stage regression of relevant content. We use a
second-order, Taylor-series expansion of the instrument as shown in Column 4 of Table 4.31 Both the
linear and quadratic terms are positive although only the quadratic term is significant. Specification tests
indicate the exclusion restriction and the relevance condition are likely met. A Hausman specification test
of exogeneity yields a test statistic of 47.1 compared to a critical value of 0.1 and the F-value for our first-
stage regression is 111 which greatly exceeds the critical value of 10 specified in Staiger and Stock (1997)
to rule out weak instruments. To test the sensitivity of our results to the quadratic functional form, we re-
estimated using the linear first-stage specification shown in Column 5 of Table 4. “Large”-country
content has a significantly positive effect on relevant content and very similar second-stage results were
obtained.
Panel Data Results: Although we control for many factors thought to affect Internet adoption, we
also include country fixed effects to control for country-level unobservables. A within-groups estimate of
Equation (4) provides consistent estimates of the time-varying variables in the model including content.
To compare content’s effect to that of as many variables as possible, we also include time-constant
variables. Since we believe that we have plausibly exogenous time-invariant factors available we use an
HT estimator.
Of the time-varying variables, telephone infrastructure and civil liberties are likely endogenous in
the HT sense (i.e., correlated with country-level unobservables). A country that invests heavily in
technology (more than commensurate with its per-capita GDP) likely has high Internet adoption and high
fixed-phone line penetration. A society with greater unobserved preferences for Internet access may also
have a greater preference for civil liberties. Price and relevant content are exogenous by design. Neither
per–capita GDP nor school enrollment is likely affected by unobserved preferences for Internet adoption
in the short-run.
Of the time-invariant variables, all are likely exogenous in the HT sense except for literacy. The
income distribution, age distribution, average household size, and urban density are not likely affected by
unobserved preferences for Internet adoption. Measuring literacy is subjective as there are no standard
criteria across countries. Countries with low literacy rates may report artificially high rates and also have
a low unobserved preference for Internet access.
31 A cubic term was not significant.

18
Column 1 of Table 5 shows the second-stage results of a random-effects specification with
standard errors clustered by country and robust to general heteroskedasticity. The table is divided into
four panels classifying the variables as time-varying versus time-invariant and exogenous versus
endogenous. We will not discuss the results in detail since this is rejected in favor of a fixed-effects
specification, but relevant content has a highly statistically significant effect (below the 0.01% level).
Column 2 of Table 5 shows the second-stage results of a fixed-effects regression with standard
errors clustered at the country level and robust to general heteroskedasticity. The regression yields an 2Rof 0.917, consistent with a wide range of control variables. Only a few of the control variables are
significant but there are two reasons why. First, given the country fixed effects identification comes only
from time-series variation. Second, we include more control variables than previous studies (conditional
on including country fixed effects). Since the results are similar to those obtained in the HT specification
we postpone their discussion. The fixed-effects estimates are consistent even if included variables are
correlated with the country-level unobservables, allowing a Hausman specification test for the
consistency of the random-effects estimates. The null hypothesis of consistency is rejected below the
0.01% level with a chi-squared statistic of 69.7, consistent with correlation between unobserved country-
level effects and the regressors.
Column 3 of Table 5 contains HT estimates. Since the fixed-effects specification provides
consistent estimates and our model is over-identified we can perform a Hausman specification test of the
exogeneity of our HT instruments. The null hypothesis that our instruments are uncorrelated with the
country-level unobservables is not rejected (16% significance level with a chi-squared statistic of 20.3).
Thus, both the fixed-effects and HT estimators provide consistent estimates of the time-varying factors;
however, the HT estimator is more efficient and provides consistent estimates of the time-invariant
factors. This is our preferred specification, although content’s effect is similar across both.
Per-capita GDP has a positive and highly significant effect on adoption. An additional $958 in
annual per capita GDP is associated with one percentage point higher adoption.32 A country one standard
deviation above the mean per-capita GDP has 9.7 percentage points higher adoption than one at the mean.
This is a large effect given the mean adoption level of 9.9% in the sample.
Internet prices for two of the three years are negative but only the year 2000 prices are borderline
significant (at the 12% level). The lack of significance is likely due to the lack of data. A country one
standard deviation above the year 2000 mean log price has 2.5 percentage points lower adoption (25.0%
of the mean adoption level). The estimates imply a price elasticity of -0.42 for Internet adoption. School
enrollment and civil liberties are not significant although there is little time-series variation in these. 32 The effects of changes in independent variables are calculated at the mean values of all other variables unless otherwise noted.

19
Telephone infrastructure has a significant negative effect on adoption inconsistent with prior expectations.
This may be because countries with heavily-subsidized and inefficient telephone industries have high
Internet access prices and poor telephone infrastructure. Consistent with this, telephone infrastructure and
instrumented prices are significantly negatively correlated. We also show below that the time-series
impact from this variable is small.
Content has a positive and significant (below the 0.01% level) effect on adoption. A country one
standard deviation above the mean in relevant content has 2.0 percentage points higher adoption or 20.0%
of the mean adoption level. Countries with users of languages with more worldwide accessible content
have higher adoption rates. The unreported coefficients on the year dummies are consistent with higher
Internet adoption rates over time (and all but year 1999 are significant); however this should be
interpreted with caution since the content measure is not necessarily consistent over time.33
Of the time-invariant variables, only urbanization is significant at the 10% level or better;
although the age bracket dummies are jointly significant at the 12% level. Fraction of urban population
has a positive and very significant effect, consistent with either easier construction of Internet
infrastructure in more densely populated areas, or greater demand for access relative to more rural areas,
or both. Each additional one percent of population living in urban areas is associated with 0.1 percentage
points higher adoption. A country one standard deviation above the mean has 2.5 percentage points higher
adoption or 24.8% of the average adoption rate in the sample. Although the age variables are not highly
statistically significant, they have a large economic impact. Countries with a smaller fraction of people
above 65 years of age (the omitted age category) have higher adoption levels with the greatest effect both
statistically and economically in the age 40 to 64 category. Increasing the fraction of population in the age
40 to 64 category by one standard deviation and spreading an equivalent decrease equally across the other
three categories results in a 9.3 percentage point increase in adoption (93.6% of the average adoption rate
in the sample). Running the same experiment (increasing a category by one standard deviation and
decreasing the other three categories equally by the same total amount) results in: below 20 category a
36.1% increase, 20 – 39 category a 21.2% decrease, and above 64 category a 73.0% decrease.
Interpreting Content’s Effect: Content has a large impact on the equilibrium level of adoption.
Our estimates imply an elasticity of 0.046 of adoption with respect to relevant content. For an elasticity of
adoption with respect to hosts we need to estimate how much relevant content increases with one
additional host as determined by the language distributions across countries. We measure this by the ratio
33 If some countries add more hosts earlier when computers have smaller capacity while other countries add more hosts later when computers have greater capacity, this could bias our results. We re-estimated Equation (4) using a three-year moving-average of instrumented relevant content. This allows relevant content to depend on both the current and previous stocks of host computers. We tried moving averages of 1/4, 1/3, and 1/2 and found results very similar to our baseline estimates.

20
of relevant content to hosts across all countries (“small” and “large”) and all years yielding 6.72.
Therefore the elasticity of adoption with respect to hosts is 0.31. This is more powerful than the indirect
network effect estimated by Gandal, Kende, and Rob (2000) in the compact disk (CD) market (an
elasticity of CD players with respect to the number of CD titles of 0.033) but below that estimated by
Dranove and Gandal (2003) for the digital video disc (DVD) market (an elasticity of DVD players with
respect to fraction of movie titles released on DVD of 1.13).34 Using our year 2000 price elasticity of -
0.42 adoption is 0.74 times as responsive to content as price – above that in the CD market (the ratio of
content and price elasticities is 0.54) but below that in the DVD market (a ratio of 1.2).35
We can also compare content’s impact to that of other factors. Its effect is below that of GDP and
some age-group redistributions but is comparable to the other significant control variables. A country one
standard deviation above the mean in relevant content has 20.0% higher adoption. For time-varying
factors the effects of a one standard deviation increase are: per-capita GDP a 98.2% increase, year 2000
normalized prices a 25.0% decrease, and telephone infrastructure a 36.8% decrease. For time-constant
factors the effects are: fraction urban population a 24.8% increase and age distribution a 73.0% decrease
to a 93.6% increase depending on the age category that is increased.
This has important implications for countries wishing to stimulate Internet adoption. Increasing
GDP will increase Internet adoption dramatically, but this is difficult. Similarly, short-run changes in the
age distribution would require dramatic immigration policy changes. Stimulating relevant content, either
directly or indirectly, is easier and less costly. In addition, governments and NGOs can influence adoption
in other countries by creating relevant content in the target country’s languages.
There are two issues with this comparison. First, moving any of these variables by one standard
deviation is a lot. Therefore, it is useful to estimate the effect of “reasonable” changes. Second, it assumes
that it is equally easy to move the variables by one standard deviation. Therefore, it is useful to gauge the
speed at which these variables change over time. To do so, we compute annual changes in the time-
varying factors and the effects such changes would have on adoption. Since we do not have a comparable
price measure over time, GDP and telephone infrastructure are the only variables to which we can
compare (although we cannot measure yearly changes in the age distribution or fraction urban population
these are likely small implying small changes in adoption).
34 Although these two markets are not directly analogous to the Internet they are similar in that a CD or DVD title is replicated multiple times just as a host of content is “replicated” by multiple users accessing it. 35 Other papers estimate the magnitude of two-sided network effects on firms’ market shares (Corts and Lederman (2007), Nair, Chintagunta, and Dubé (2003), Ohashi (2003), and Park (2003)). These results are not directly comparable to ours since we estimate the effect on overall demand while they estimate the effect on firms’ residual demands.
21
The top panel of Table 6 summarizes these changes for the “small” countries. Adoption increased
on average 2.2 percentage points per year in “small” countries. The two rightmost columns compute the
effect that the annual changes in each of the explanatory variables would have on “small”-country
adoption evaluated at the mean of all other variables. For example, per-capita GDP increased $398 per
year on average in the “small” countries. This would increase adoption by 0.42 percentage points or
19.1% of the average yearly increase of 2.2 percentage points for the “small” countries. Similar
calculations for telephone infrastructure reveal a minimal 1.0% annual decrease. Relevant content for the
“small” countries increased on average by 885 thousand hosts per year. This would increase “small”-
country adoption by 6.0% of the average yearly increase in their adoption.
The bottom panel of Table 6 summarizes annual effects based on the “large” countries. Per-capita
GDP increased $493 per year on average for these countries. Such an increase would stimulate “small”-
country adoption by 23.6% of the 2.2 percentage point annual increase in adoption for the “small”
countries. A similar calculation for telephone infrastructure yields a 5.9% decrease. The annual increase
in “large”-country content – the content produced by the countries themselves – is 1.2 million hosts. This
would increase “small”-country adoption by 7.8% of the 2.2 percentage points annual change in adoption
for the “small” countries. Whether the top or bottom panel of Table 6 is more appropriate depends on
which more accurately predicts annual changes. However, they are similar. In both, content is an
important factor in affecting adoption – it has about one-third GDP’s impact.
Linguistic Isolation: Internet content may act as a substitute for or complement to isolation. If
isolated populations use the Internet to access people with similar interests or characteristics, content
would have a greater effect on adoption by more isolated groups. On the other hand, if people learn about
the Internet through word-of-mouth and this is less likely if one is isolated, content would have a smaller
effect on adoption by more isolated groups. We distinguish these alternatives using linguistic isolation, as
measured by linguistic heterogeneity. We implement this using a Herfindahl index (HHI) of language
usage in each “small” country:
(9)2
1 1HHI Users Users
J J
i ij ij Sj j
i I .
A country with an HHI close to zero is linguistically very heterogeneous while a county with an
HHI of one is completely homogeneous. To identify content’s importance in linguistically homogeneous
versus heterogeneous countries, we interact instrumented relevant content with a dummy variable
indicating whether a “small” country has an above-average HHI.
Column 4 of Table 5 shows the results. The baseline effect of language heterogeneity is
insignificant. Relevant content has a positive and significant effect but the effect is lower for countries

22
above the mean language HHI. Content has a smaller effect in countries with more homogeneous
language users. A “small” country one standard deviation above the mean in relevant content has 5.2
percentage points higher adoption if it is below the mean language HHI, but only 1.5 percentage points if
it is above. This is consistent with the Internet being a tool to overcome linguistic isolation. In
contemplating the future of the online encyclopedia Wikipedia, its founder, Jimmy Wales, asked in mid-
2009: “Is it more important to get to 10 million articles in English, or 10,000 in Wolof?”36 Our results
imply that in terms of adoption – the latter.
Robustness: To see whether our relevant content measure simply proxies for the “small”
country’s own content production we add a measure of the latter to our estimation:
(10) 1Users Content
, .Population
J
ij ijtj
it Si
owncontent i I
This differs from relevant content in Equation (5) in excluding content produced outside the
country. Since this variable is endogenous, its coefficient should be interpreted with caution. Columns 1
and 2 of Table 7 show the results. Relevant content’s coefficient and significance is very close to that in
our baseline results in Column 3 of Table 5. This is consistent with instrumented relevant content
measuring content that affects but is not affected by “small”-country adoption. The other coefficients are
not greatly affected except that the age variables are more significant. Own content is associated with
higher adoption and is highly statistically significant as would be expected in a two-sided market. The
magnitude is not interpretable since it is endogenous, but it exceeds that of instrumented relevant content
since it reflects the feedback between adoption and content.
Our main results assume that content’s effect on adoption is the same across years. In Columns 3
and 4 of Table 7 we relax this assumption and allow for differential effects in each year. The content
coefficients are all positive and jointly very significant (at the 1% level). The magnitudes are similar
across years (the effect of a one standard deviation increase in content ranges from 2.1 to 4.4 percentage
points) and generally greater than that obtained when restricted to be equal in all years (2.2 percentage
points).
If there are language-specific unobservables that drive adoption and content production this may
bias our estimates. For example, if users of certain languages have higher preferences for adoption not
captured by our control variables this will lead to higher adoption in “small” countries whose populations
use that language and at the same time lead “large” countries to produce more content in that language to
serve the higher “large”-country demand. To address this, we add language along with country and year
36 “Wikipedia Looks Hard at its Culture,” New York Times, August 31, 2009.
23
fixed effects to Equation (1a). Once transformed into Equation (4) this is equivalent to including as a
regressor the fraction of each “small” country’s population using each language. Since including fixed
effects for all languages is infeasible, we include them only for the 14 instrument languages. These are
the languages that link “small” and “large” countries in our instrumenting approach and are most likely to
introduce endogeneity. The results are shown in Columns 5 and 6 of Table 7 and are similar to our
baseline estimates in Column 2 of Table 5.37
6. Applications
Our model can be used to measure how country characteristics influence adoption’s sensitivity to
content. Including an interaction between country characteristics and instrumented relevant content in
Equation (4) captures whether content plays a smaller or larger role as these characteristics vary.
Although some of these results are descriptive, others such as those for international gateways are explicit
hypothesis tests because “natural experiments” induce exogenous cross-country differences. Since we
worry about the quality of instruments available for these interactions in an HT specification, we use
fixed-effects specifications. Also, there is insufficient data to simultaneously identify multiple interactions
so we estimate each effect separately.38 Thus, the effects are not conditional on the other interaction
effects.
These results have important implications for public policy. Content plays a larger role in driving
adoption in poor countries, suggesting that direct network effects may play a larger role in rich countries.
The results suggest that lowering income inequality enhances content’s effect on adoption. Developing
both an ubiquitous domestic telephone network and high-speed international links appear to enhance
content access and stimulate adoption.
These results also have important implications for firm strategies. They inform which countries
Internet content providers should target in expanding internationally. A country in which adoption is more
sensitive to content suggests that its population finds content more appealing. If so, countries with well-
developed telecommunications networks and lower income inequality are better targets. Poorer countries
are also better targets although revenue recovery is likely problematic. Our results for intellectual
property (IP) protection have interesting policy and strategy implications. Not unexpectedly, weaker IP 37 An alternative explanation of our results is that countries affect each other’s adoption through a direct network effect: a common language between countries leads to increased economic activity and therefore more communication via the Internet such as email or instant messaging resulting in increased adoption. Adding a trade-weighted measure of trading partners’ adoption rates to Equation (4) as a proxy for the economic closeness between country pairs has minimal effect on the estimated effect of content, consistent with indirect and direct network effects being orthogonal. 38 In a regression combining all of the interaction effects the coefficients on the interaction terms have similar magnitudes as in the separate regressions although not all of them are significant.

24
protection allows content to more heavily influence adoption. Therefore, regulators face a tradeoff in
strengthening IP protection – while increasing the incentive for content creation it discourages content
dissemination. For firms, targeting countries with weaker protections is a good strategy if the firm can
sufficiently protect its own content.
Per-Capita GDP: Column 1 of Table 8 shows that relevant content’s effect on adoption declines
in a country’s wealth. A one standard deviation increase in relevant content increases adoption by 1.9
percentage points less (19.0%)39 for a country one standard deviation above the mean per-capita GDP
than for a country at the mean. Although there are alternative explanations, one possibility is that adoption
in poor countries relies more on externally-produced content while adoption in rich countries depends
more on greater direct network effects within the country.
Telephone Infrastructure: Column 2 of Table 8 shows that relevant content’s effect on adoption
increases in a country’s telephone infrastructure quality (although the direct effect remains negative). A
one standard deviation increase in relevant content increases adoption by 2.4 percentage points more
(24.7%) for a country one standard deviation above the mean level of telephone main lines in use than for
a country at the mean. As the telephone network is the primary means of Internet access during our
sample period, this is consistent with a more pervasive network allowing widespread content access to
thereby stimulate adoption.
Gini Coefficient: Column 3 of Table 8 reveals that greater income inequality in a country
dampens content’s influence on adoption. A one standard deviation increase in relevant content increases
adoption by 1.4 percentage points less (13.8%) for a country one standard deviation above the mean Gini
coefficient than for a country at the mean. This is consistent with more evenly distributed wealth leading
to a broader desire to access content. Although we find no direct effect of income inequality on adoption
there is an indirect negative effect via content.
Intellectual Property Protection: Column 4 of Table 8 investigates the role of a country’s IP
protection based on the Intellectual Property Rights (IPR) component of the Intellectual Property Rights
Index (Horst, 2006). The index rates each country’s level of IP protection on a 0 to 10 scale with 10 being
the strongest. Greater protection diminishes content’s influence. A one standard deviation increase in
relevant content increases adoption by 0.9 percentage points less (9.4%) for a country one standard
deviation above the mean IPR than for a country at the mean. This is consistent with greater protection
making content less freely available to stimulate adoption. Of course, weaker IP protection reduces the
dynamic incentives to create content but our results suggest that it stimulates usage of extant content.
39 All comparisons in this section are to the average adoption level (0.099) in the sample.

25
High-Speed Infrastructure: During our sample period, over 95% of Internet traffic between
countries traveled over submarine cables.40 Landing points for these high-speed cables must be in
countries adjacent to the ocean. As a result, land-locked countries connect through generally slower
terrestrial cables to access external content providing exogenous differences in geographic advantage.
This allows us to estimate the causal indirect network effect of international gateway capacity.
We identified the major telecommunications submarine cables, their years of operation, capacity,
and landing points (see Online Appendix B for sources). From this we calculated each country’s gateway
capacity in each year and interacted it with relevant content. The results are shown in Column 5 of Table
8. International gateway capacity has an insignificant direct effect on adoption. This is consistent with
international gateways being located exogenously – based on geography rather than Internet access
demand. However, adoption in a country with greater capacity is more affected by relevant content than a
country with lower. A one standard deviation increase in relevant content increases adoption by 1.9
percentage points more (19.1%) for a country one standard deviation above the mean log capacity than
for a country at the mean.41
Managerial: Our results provide some rough guidelines for firms evaluating content investments.
We estimate an elasticity of 0.31 of adoption with respect to number of hosts. This is the effect on the
extensive margin (an increased number of adopters) but assuming that the usage of these additional
adopters is spread across websites in proportion to their content this translates into an elasticity of usage
on a particular website.42 If traffic is the goal (as it is for most Internet firms) then increasing content by a
given percentage has about one-third the effect of increasing adoption by the same percentage. Therefore,
investments can be evaluated by comparing the marketing cost of increasing the user base by a certain
percentage to the cost of increasing content by the same percentage. If this ratio exceeds about three then
the firm should focus on content production – otherwise adoption. For firms relying on user-generated
content, our estimates provide a means for adjusting a user’s lifetime value to the company. On average,
each percentage increase in the user base will ultimately yield roughly 1.3 times that because of the
increased adoption from content that these users create. Of course, not all content is created equal.
Higher-quality or more-targeted content will lead to a greater elasticity and lower-quality or less-targeted
to a smaller.
40 “Submarine Cables and the Oceans: Connecting the World,” The United Nations Environment Programme World Conservation Monitoring Center, 2009. 41 An alternative explanation is that countries adjacent to the ocean were easier to colonize and gained closer associations with “large” countries sharing the same language. We estimated our results in Column 3 of Table 5 excluding “small” countries adjacent to the ocean. The results were virtually identical. 42 The effect on the intensive margin – increased usage by pre-existing adopters – means that this will understate the elasticity of usage with respect to content. A firm-level elasticity of usage would be still greater because it includes business-stealing effects (shifting usage from other sites without increasing aggregate usage).

26
It would be preferable to have firm-level estimates of the effect of content on usage. This is
possible given firm-level data during episodes in which a firm adds discrete chunks of content but does
not otherwise alter its marketing efforts to encourage usage. Such estimates will reflect not only net
increases in aggregate usage but also business-stealing effects (usage diverted from other Internet sites).
6. Conclusion
Internet content plays a significant role in stimulating Internet adoption. Its effect is on par with
many other important social, demographic, and economic factors. Thus, content can play a crucial policy
role in encouraging Internet diffusion even in the short run, and some countries are already taking action.
ITU, the UN body responsible for information technologies, reports that, “. . . some countries are
launching initiatives to subsidize the production of local content in its initial stages. Several of them are
also revising and upgrading key legal instruments that would allow them to protect and promote the
production of local content.”43
Governments and NGOs can influence adoption, and thereby encourage social change, in other
countries through this mechanism. In fact, this is implicit in our estimation strategy. Policymakers can use
content targeted at particular countries and in the appropriate language to stimulate adoption in countries
adversely affected by the global “digital divide.” Internet content can also play an important role in
overcoming social isolation. Countries with more disparate language usage are more affected by content
than are those with more homogeneous. More targeted Internet content is likely to have even greater
effects than we find since we treat all content in a given language as equally relevant.
For Internet firms wishing to predict Internet adoption at the country level, we provide estimates
for a more comprehensive list of factors driving adoption – factors that vary rapidly over time as well as
those more slowly changing. For firms attempting to target countries with high Internet adoption rates,
our results suggest that content will influence adoption more heavily in countries with lower income
inequality, better telephone infrastructure, weaker IP protection, and larger gateways connecting the
country to externally-produced content. This last effect is likely to increase in importance over time as
Internet information includes more video and audio. Our results also suggest that targeting linguistically-
isolated populations offer higher expected usage of a firm’s content.
Because of the need to ensure exogenous changes in content production we are unable to estimate
the effects of content on “large”-country adoption. This also prevents us from distinguishing the effect of
content produced within a country from that produced externally. To estimate this would require different
data than is available to us. It would require an exogenous change in content or its availability in “large”
43 ITU (1999), page 121.

27
countries that affects adoption only via content. We can speculate on a few possibilities. The official use
of non-Latin characters in web addresses became feasible in 2010 due to a regulatory change. This
potentially provides an abrupt exogenous change in the availability of pre-existing Internet content within
“large” countries such as China, Russia, India, and Japan. At the same time it does not directly affect the
incentive to adopt Internet access. Discrete changes in countries’ intellectual property laws or their
enforcement may suddenly increase or decrease availability of pre-existing content within the country
without otherwise changing incentives for Internet adoption. Government subsidies to produce content or
bring it online might provide exogenous geographic variation if they target local populations (such as
schools or local governments). These and other possibilities will have to await future research.
Bibliography
Bergman, M. K. (2001). “White Paper: The Deep Web: Surfacing Hidden Value,” Journal of Electronic Publishing, Volume 7, Issue 1, August 2001.
Bohn, R. E. and J. E. Short (2009). “How Much Information? 2009 Report on American Consumers,” manuscript available at http://hmi.ucsd.edu/howmuchinfo_research_report_consum.php.
Campbell, L. and V. Grondona (2008). “Ethnologue: Languages of the World (Review),” Language, 84, 636 – 641.
Chinn, M. D. and R. W. Fairlie (2006). “The Determinants of the Global Digital Divide: A Cross-Country Analysis of Computer and Internet Penetration,” Oxford Economic Papers, 59, 16 – 44.
Corts, K. and M. Lederman (2009). “Software Exclusivity and the Scope of Indirect Network Effects in the U.S. Home Video Game Market,” International Journal of Industrial Organization, 27, 121 – 136.
DiMaggio, P., E. et al. (2004). “From Unequal Access to Differentiated Use: A Literature Review and Agenda for Research on Digital Inequality,” in Social Inequality, Kathryn Neckerman ed., Russell Sage Foundation, New York.
Dranove, D. and N. Gandal (2003). “The DVD-vs.-DIVX Standard War: Empirical Evidence of Network Effects and Preannouncement Effects,” Journal of Economics & Management Strategy, 12, 363 – 386.
Ford, G., Koutsky T. and L. Spiwak (2007). “The Broadband Performance Index: A Policy-Relevant Method of Comparing Broadband Adoption among Countries,” working paper.
Gandal, N. (2006). “Native Language and Internet Use,” International Journal of the Sociology of Language, 182, 25 – 40.
Gandal, N., M. Kende, and R. Rob (2000). “The Dynamics of Technological Adoption in Hardware/Software Systems: The Case of Compact Disc Players,” RAND Journal of Economics,31, 43 – 61.
Goolsbee, A. (2002). “Does the Internet Make Markets More Competitive? Evidence from the Life Insurance Industry,” Journal of Political Economy, 110, 481 – 507.
Gordon, R., editor (2005). Ethnologue: Languages of the World, 15th edition, SIL International, Dallas, Texas. Online version: http://www.ethnologue.com/ accessed in May 2009.
Gordon, R. J. (2000). “Does the ‘New Economy’ Measure up to the Great Inventions of the Past?” Journal of Economic Perspectives, 14, 49 – 74.
Gowrisankaran, G. and J. Stavins (2004). “Network Externalities and Technology Adoption: Lessons from Electronic Payments,” RAND Journal of Economics, 35, 260 – 276.
Hammarström, H. (2005). “Review of Raymond J. Gordon, Jr. (ed.) 2005 Ethnologue: Languages of the World, SIL International,” working paper.

28
Hargittai, E. (1999). “Weaving the Western Web: Explaining Differences in Internet Connectivity Among OECD Countries,” Telecommunications Policy, 23, 701 – 718.
Hausman, J. A. and W. E. Taylor (1981). “Panel Data and Unobservable Individual Effects,” Econometrica, 49, 1377 – 1398.
Horst, A. C. (2006). “Intellectual Property Rights Index (IPRI): 2007 Report,” manuscript available at www.InternationalPropertyRightsIndex.org.
International Telecommunications Union (ITU) (1999). “Challenges to the Network: Internet for Development.”
_________ (2001). “IP Telephony.” _________ (2002). “Internet for a Mobile Generation.” _________ (2003). “Birth of Broadband.” _________ (2004). “Portable Internet.” _________ (2005). “Key Indicators of the Telecommunication/ITC Sector.” Kiiski, S. and M. Pohjola (2002). “Cross-Country Diffusion of the Internet,” Information Economics &
Policy, 14, 297 – 310. Litan, R. E. and A. M. Rivlin (2001). “Projecting the Economic Impact of the Internet,” American
Economic Review, 91, 313 – 317. Lyman, P. and H. R. Varian (2003). “How Much Information?, 2003,” manuscript available at
http://www2.sims.berkeley.edu/research/projects/how-muchinfo-2003/).Nair, H. P. Chintagunta, and J. Dubé (2004). “Empirical Analysis of Indirect Network Effects in the
Market for Personal Digital Assistants,” Quantitative Marketing and Economics, 2, 23 -58. OECD (2009). Internet Access for Development, OECD Publishing, available at www.oecdbookshop.org.Ohashi, H. (2003). “The Role of Network Effects in the US VCR Market,” Journal of Economics &
Management Strategy, 12, 447 – 494. Park, S. (2004). “Quantitative Analysis of Network Externalities in Competing Technologies: The VCR
Case,” The Review of Economics & Statistics, 86, 937 – 945. Paolillo, J. C. and A. Das (2006). “Evaluating Language Statistics: The Ethnologue and Beyond,”
working paper. Scott Morton, F., F. Zettelmeyer, and J. Silva-Risso (2001). “Internet Car Retailing,” Journal of
Industrial Economics, 49, 501 – 519. Shriver, S. K., H. S. Nair, and R. Hofstetter (2012). “Social Ties and User-Generated Content: Evidence
from an Online Social Network,” working paper. Sinai, T. and J. Waldfogel (2004). “Geography and the Internet: Is the Internet a Substitute or a
Complement for Cities?” Journal of Urban Economics, 56, 1 – 24. Staiger, D. and J. H. Stock (1997). “Instrumental Variables Regressions with Weak Instruments,”
Econometrica, 65, 557 – 586. Wallsten, S. (2005). “Regulation and Internet Use in Developing Countries,” Economic Development and
Cultural Change, 53, 501 – 523. Wallsten, S. (2006). “Broadband and Unbundling Regulations in OECD Countries,” working paper. Wunnava, P. and D. Leiter (2009). “Determinants of Inter-Country Internet Diffusion Rates,” American
Journal of Economics and Sociology, April 2009.

Figure 1 Internet Penetration across Countries in 2008
0.0%
10.0%
20.0%
30.0%
40.0%
50.0%
60.0%
70.0%
80.0%
90.0%
100.0%
Iceland
Bermuda
German
y
Austria
Hong Kong
Ireland
Jamaica
Lithua
niaMalt
a
Portugal
Colombia
New Caledo
nia
Costa Rica
Ecuado
r
Tunisia
Vietnam
Grenada
Dominican
Republic
Kyrgyz
Republic
Honduras
Pakista
nSud
anKen
ya
Uganda
Philippin
es
NamibiaEritr
ea
Cote d'Ivoire
Kiribati
Nepal
Turkmen
istan
Guinea
Central
African Rep
ublic
Inte
rnet
Pen
etra
tion
Source: International Telecommunications Union in World Development Indicators, World Bank. Internet penetration (fraction of population with Internet access) for 197 countries sorted from highest to lowest penetration. Not all country names displayed due to lack of space.
Figure 2 Internet Penetrations in Sample “Small” Countries in 2004
0.0%
10.0%
20.0%
30.0%
40.0%
50.0%
60.0%
70.0%
80.0%
Sweden
Bermud
a
Icelan
d
Monac
o
Belgium
Cyprus
Slovak
ia
Martini
que
Reunio
n
Kuwait
Israe
l
Roman
ia
Guade
loupe
Bulgari
a
Jorda
n
Moldov
a
Ukraine
South
Africa
Panam
a
Philipp
ines
Azerba
ijan
Georgi
a
Botswan
aKen
ya
Gabon
Leso
tho
Zambia
Sri Lan
ka
Eritrea
Equato
rial G
uinea
Turkmen
istan
Guinea
Maurita
nia
Malawi
Centra
l Afric
an R
epub
lic
Ethiop
ia
Inte
rnet
Pen
etra
tion
Source: International Telecommunications Union in World Development Indicators, World Bank. Internet penetration (fraction of population with Internet access) for 176 sample “small” countries sorted from highest to lowest penetration. Not all country names displayed due to lack of space.

Table 1 Descriptive Statistics, 176 “Small” Countries, 1998 – 2004
Variable N MeanStandard Deviation Min Max
Time-Varying CovariatesInternet Users (per 100 people) 1,169 0.099 0.143 0.000 0.755Per-Capita GDP (US$ thousands) 958 8.392 9.323 0.450 60.249Telephone Infrastructure 776 0.240 0.209 0.000 0.908Log Normalized Internet Price (1998) 25 -5.935 0.578 -6.644 -4.496Log Normalized Internet Price (2000) 25 -6.457 0.601 -7.167 -4.981Log Normalized Internet Price (2001) 111 -4.562 1.517 -7.279 -1.526Fraction School Enrollment 653 0.872 0.160 0.278 1.000Civil Liberties Index 1,055 4.495 1.794 1.000 7.000
Time-Constant CovariatesLiteracy Rate 753 0.795 0.197 0.240 1.000Gini Coefficient 688 0.406 0.106 0.247 0.743Age Below 20 1,078 0.424 0.117 0.196 0.605Age 20 to 39 1,078 0.302 0.034 0.244 0.480Age 40 to 64 1,078 0.208 0.071 0.110 0.341Age Above 64 1,078 0.066 0.044 0.011 0.182Fraction Urban Population 1,168 0.546 0.241 0.077 1.000Household Size 678 4.525 1.413 2.000 10.500
Content MeasuresRelevant Content (millions of relevant hosts) 1,114 3.047 13.442 0.000 172.503Own Content (millions of hosts) 1,114 0.081 0.343 0.000 5.434"Large" Country Content (millions of hosts) 926 22.525 45.152 0.000 206.814Language Herfindahl 926 0.868 0.197 0.378 1.000
Supplementary VariablesLog[Gateway Capacity (gigabits per second)] 1,169 0.331 1.154 0.000 8.144IP Protection 321 5.090 1.973 0.300 8.600
Price InstrumentsGovernment Tax Receipts (% of GDP) 519 16.908 7.153 0.958 43.705Corporate Tax Rate (%) 499 27.783 9.609 0.000 54.000Telephone Employees (per 1,000 fixed lines) 922 12.000 20.789 0.068 175.385
See Online Appendix B for a description of the variables and their sources.

Tab
le 2
Pr
ofile
s of “
Lar
ge”
and
“Sm
all”
Cou
ntri
es fo
r In
clud
ed L
angu
ages
Tota
l #To
tal
# of
Tota
l #To
tal #
User
sC
onte
ntUs
ers
User
s%
of
User
s%
of
Ran
king
1La
ngua
ge(m
illio
ns)
(100
0s h
osts
)2C
ount
ry(m
illio
ns)
(mill
ions
)W
orld
wide
Cou
ntry
(mill
ions
)W
orld
wide
1Ch
ines
e1,
204.
762,
674.
68Ch
ina
1,17
1.05
1,19
3.74
99.1
%M
alay
sia
4.39
0.36
%Ta
iwan
22.6
92
Span
ish
322.
3011
,100
.00
Mex
ico
86.2
125
6.16
79.5
%D
omin
can
Rep.
6.89
2.14
%Co
lum
bia
34.0
0A
rgen
tina
33.0
0Sp
ain
28.1
7Ve
nezu
ala
21.4
8Pe
ru20
.00
Chile
13.8
0Cu
ba10
.00
Ecua
dor
9.50
3En
glis
h30
9.35
89,3
00.0
0U
nite
d St
ates
210.
0029
7.78
96.3
%N
ew Z
eala
nd3.
211.
04%
Uni
ted
Kin
gdom
55.0
0Ca
nada
17.1
0A
ustra
lia15
.68
5H
indi
180.
7737
.01
Indi
a18
0.77
180.
7710
0.0%
Nep
al0.
110.
06%
6Po
rtugu
ese
177.
462,
538.
54Br
azil
163.
1517
3.15
97.6
%Pa
ragu
ay0.
640.
36%
Portu
gal
10.0
08
Russ
ian
145.
0367
7.62
Russ
ia14
5.03
145.
0310
0.0%
Ukr
aine
11.3
47.
82%
9Ja
pane
se12
2.43
8,37
0.64
Japa
n12
2.43
122.
4310
0.0%
Sing
apor
e0.
020.
02%
10Ge
rman
95.3
95,
289.
15Ge
rman
y75
.30
82.8
086
.8%
Kaz
akhs
tan
0.96
1.00
%A
ustri
a7.
5017
Fren
ch64
.86
2,95
3.88
Fran
ce64
.86
64.8
610
0.0%
Belg
ium
4.00
6.17
%H
ausa
24.1
60.
26N
iger
ia18
.53
23.5
397
.4%
Chad
0.10
0.41
%N
iger
5.00
Zulu
9.56
60.7
2So
uth
Afri
ca9.
209.
2096
.2%
Leso
tho
0.25
2.59
%N
yanj
a9.
350.
35M
alaw
i7.
008.
6092
.0%
Moz
ambi
que
0.50
5.32
%Za
mbi
a1.
60Pu
laar
3.24
0.36
Sene
gal
2.39
2.65
81.7
%Gu
inea
-Bas
sau
0.25
7.56
%Ga
mbi
a0.
26Pu
lar
2.92
0.12
Guin
ea2.
552.
5587
.4%
Sier
ra L
eone
0.18
6.12
%
2,67
1.58
123,
003.
322,
563.
252,
563.
2595
.9%
32.8
11.
23%
All
Lang
uage
s6,
070.
503
138,
648.
221 M
ost-s
poke
n la
ngua
ges
by fi
rst-l
angu
age
spea
kers
acc
ordi
ng to
Gor
don
(200
5). I
f bla
nk n
ot ra
nked
.2 A
vera
ge n
umer
of h
osts
acr
oss
six y
ears
of d
ata.
3 Bas
ed o
n ye
ar 2
000
data
from
"W
orld
Pop
ulat
ion
to 2
300,
" U
nite
d N
atio
ns, N
ew Y
ork,
200
4.
Wor
ldwi
deLa
rges
t "Sm
all"
Cou
ntry
"Lar
ge"
Cou
ntri
es

Table 3 Adoption/Content Correlation Matrix for Sample Countries, 1998 – 2004 (N = 779)
Internet Own RelevantUsers Content Content
Own Content 0.532(0.000)
Relevant Content 0.348 0.033(0.000) (0.366)
"Large" Country Content 0.293 0.083 0.517(Instrument) (0.000) (0.021) (0.000)
Signficance levels are in parentheses.
Table 4 First-Stage Regressions for Internet Access Prices and Relevant Content
Intercept -4.5397 *** -5.1697 *** -4.3932 *** 1.2422 *** 0.5514(0.5632) (0.7015) (0.2037) (0.3084) (0.4485)
"Large" Country Content 0.0266 0.1379 **
(0.0250) (0.0566)
("Large" Country Content)2 0.0007 *
(0.0004)
Government Tax Receipts (% of GDP) -0.0359 * -0.0438 ** -0.0601 ***
(0.0193) (0.0216) (0.0124)
Corporate Tax Rate (%) -0.0219 -0.0138 0.0030(0.0144) (0.0195) (0.0707)
Telephone Employees (per fixed line) 0.0692 ** 0.1493 ** 0.13710.0345 0.0588 0.1162
R2
N 134
Log Prices ContentLog Prices
0.1946926
RelevantContent
0.3000 0.1803
1998 Relevant
Standard errors in parentheses. * = 10% significance, ** = 5% significance, *** = 1% significance. Standard errors for relevant content regressions clustered at the country level. Dummy variables for missing values included for all variables in price regressions.
2000
0.390992644
Log Prices
0.256344
2001

Table 5 Effect of Content on Internet Adoption for All Sample Countries, 1998 – 2004, Second-Stage, Panel Data Estimates
Time-Varying Exogenous
Per-Capita GDP 0.0101 *** 0.0115 *** 0.0104 *** 0.0105 ***
(0.0008) (0.0014) (0.0010) (0.0010)Log Normalized Internet 0.0131 0.0033 0.0063 0.0108 Price (1998) (0.0423) (0.0416) (0.0417) (0.0416)Log Normalized Internet -0.0363 -0.0447 -0.0413 -0.0399 Price (2000) (0.0290) (0.0286) (0.0286) (0.0285)Log Normalized Internet -0.0012 -0.0016 -0.0013 -0.0014 Price (2001) (0.0062) (0.0061) (0.0061) (0.0061)Fraction School Enrollment 0.0051 0.0022 -0.0006 -0.0023
(0.0218) (0.0224) (0.0222) (0.0222)Relevant Content 0.0015 *** 0.0016 *** 0.0015 *** 0.0050 ***
(0.0004) (0.0004) (0.0004) (0.0011)(Language HHI Above Mean)* -0.0039 ***
Relevant Content (0.0011)
Time-Varying Endogenous
Telephone Infrastructure -0.1579 *** -0.1723 *** -0.1745 *** -0.1716 ***
(0.0167) (0.0171) (0.0169) (0.0168)Civil Liberties Index 0.0028 0.0002 -0.0007 -0.0001
(0.0030) (0.0039) (0.0038) (0.0038)
Time-Invariant Exogenous
Gini Coefficient -0.0247 0.0015 -0.0166(0.0790) (0.1020) (0.1013)
Fraction Urban Population 0.0582 * 0.1018 ** 0.0920 *
(0.0342) (0.0499) (0.0489)Age Below 20 0.1609 0.9908 0.9698
(0.4155) (0.6393) (0.6319)Age 20 to 39 0.0720 0.2976 0.2820
(0.3357) (0.4368) (0.4361)Age 40 to 64 0.5408 1.7489 * 1.6693 *
(0.6158) (0.9401) (0.9289)Household Size -0.0138 * -0.0070 -0.0056
(0.0072) (0.0103) (0.0102)Language HHI Above Mean 0.0117
(0.0178)Time-Invariant Endogenous
Literacy Rate -0.0549 0.0936 0.1247(0.0450) (0.1279) (0.1249)
R2
N 1,169 1,169 1,169 1,169 Wald 2-statisticSpecification Test
0.9170.7880.0450.045
0.695 0.8270.0440.785
0.045
HT-GLSRE FE HT-GLS
Standard errors in parentheses. * = 10% significance, ** = 5% significance, *** = 1% significance. Year dummes and dummy variables for missing values included for all variables in all regressions. Prices and relevant content instrumented in all regressions. Standard errors are clustered by country and allow for general heteroskedasticity in the random-effects (RE) and fixed-effects (FE) specifications. The Hausman-Taylor (HT) estimates use the covariance matrix specified in Hausman and Taylor (1981).
1,785.3 1,719.3 1,743.669.7 20.3

Table 6 Estimated Effects of Variables on Adoption by “Small” Countries
Variable N1
Average Annual Change
1998 - 2004
Implied Increase in
Adoption for "Small"
Countries2
% of Annual Increase in
Internet Usage by "Small"
Countries3
"Small" CountriesInternet Users 157 0.022Per-Capita GDP (US$ thousands) 136 0.398 0.0042 19.1%Telephone Infrastructure 41 0.001 -0.0002 -1.0%Relevant Content (millions of hosts) 152 0.885 0.0013 6.0%
"Large" CountriesPer-Capita GDP (US$ thousands) 28 0.493 0.0051 23.6%Telephone Infrastructure 7 0.007 -0.0013 -5.9%Own Content (millions of hosts) 29 1.150 0.0017 4 7.8% 4
1 Data are missing for some countries in some years.2 Marginal effect evaluated at the means of all other independent variables.3 Relative to the average annual increase in Internet users in "small" countries (0.022).4 Assumes all content is "relevant" as defined in the text."Large" countries are identified in Table 2 and "small" countries in Online Appendix A.

Table 7 Effect of Content on Internet Adoption for All Sample Countries, 1998 – 2004, Second-Stage Estimates
Coeff. S.E. Coeff. S.E. Coeff. S.E.
Time-Varying Exogenous
Per-Capita GDP 0.0095 *** 0.0010 0.0104 *** 0.0010 0.0119 *** 0.0015Log Norm. Internet Price (1998) -0.0102 0.0419 0.0101 0.0414 0.0121 0.0416Log Norm. Internet Price (2000) -0.0408 0.0287 -0.0419 0.0281 -0.0387 0.0285Log Norm. Internet Price (2001) -0.0028 0.0061 -0.0015 0.0060 -0.0007 0.0061Fraction School Enrollment 0.0008 0.0222 0.0016 0.0218 0.0031 0.0224Own Content 0.0311 *** 0.0074Relevant Content 0.0014 *** 0.0004 0.0018 *** 0.0004Relevant Content (1998) 0.0093 0.0079Relevant Content (1999) 0.0059 0.0045Relevant Content (2000) 0.0033 0.0025Relevant Content (2001) 0.0027 * 0.0016Relevant Content (2002) 0.0030 ** 0.0014Relevant Content (2003) 0.0023 *** 0.0008Relevant Content (2004) 0.0019 *** 0.0006
Time-Varying Endogenous
Telephone Infrastructure -0.1720 *** 0.0169 -0.1721 *** 0.0166Civil Liberties Index 0.0001 0.0038 -0.0010 0.0038
Time-Invariant Exogenous
Gini Coefficient -0.0018 0.0988 -0.0066 0.1088Fraction Urban Population 0.1185 ** 0.0482 0.0539 0.0510Age Below 20 1.1436 * 0.6161 0.3947 0.6444Age 20 to 39 0.4665 0.4194 0.0835 0.4626Age 40 to 64 1.9370 ** 0.8979 0.7969 0.9474Household Size -0.0038 0.0100 -0.0087 0.0106
Time-Invariant Endogenous
Literacy Rate 0.0856 0.1247 0.0715 0.1289
R2
NWald 2-statistic
1,169
Language
* = 10% significance, ** = 5% significance, *** = 1% significance. Prices and relevant content instrumented in all regressions. Dummy variables for missing values included for all variables in all regressions. Estimates in Columns 2 and 4 use the covariance matrix specified in Hausman and Taylor (1981). Standard errors in Column 6 are clustered by country and allow for general heteroskedasticity. Columns 1 through 4 also contain country and year fixed-effects while Columns 5 and 6 also include country, year, and language fixed-effects.
Hausman-Taylor
0.919
Fixed-Effects
0.0450.832
0.0440.774
1,757.5
0.045
Own Content
0.817
1,747.1
Year Effects
1,169 1,169

Table 8 Effect of Content and Interactions between Content and Country Characteristics on Internet Adoption for All Sample Countries, 1998 - 2004, Second-Stage, Fixed-Effects Estimates
Per-Capita GDP 0.0134 ***
(0.0015)Telephone Infrastructure -0.2064 ***
(0.0186)Log[Gateway Capacity] -0.0028
(0.0018)Relevant Content 0.0027 *** 0.0013 *** 0.0028 *** 0.0020 *** 0.0017 ***
(0.0005) (0.0004) (0.0005) (0.0004) (0.0004)Per-Capita GDP*Relevant -0.0001 ***
Content (0.0000)Telephone Infrastructure* 0.0071 ***
Relevant Content (0.0017)Gini Coefficient* -0.0078 ***
Relevant Content (0.0019)Intellectual Property Protection* -0.0003 **
Relevant Content (0.0001)Log[Gateway Capacity]* 0.0010 **
Relevant Content (0.0005)
R2
NStandard errors in parentheses. * = 10% significance, ** = 5% significance, *** = 1% significance. All control variables shown in Column 2 of Table 5, year dummies, and dummy variables for missing values for all variables included in all regressions. Prices and relevant content instrumented in all regressions. Standard errors are clustered by country and allow for general heteroskedasticity.
Per-Capita Telephone GatewayGini IP
1,169 1,169
GDPInteraction
InfrastructureInteraction
0.0450.837
0.0450.8280.918
0.826
Interaction
0.045
0.919
0.0450.8250.918 0.917
1,169 1,169
CoefficientInteraction
0.0450.8260.9191,169
Protection CapacityInteraction

Onl
ine
App
endi
x A
“S
mal
l” C
ount
ries
Incl
uded
in A
naly
sis
Afri
ca1
The
Am
eric
as1
Asi
a1Eu
rope
1Th
e Pa
cific
1
Alg
eria
Ant
igua
and
Bar
badu
Arm
enia
Alb
ania
Fiji
Ang
ola
Aru
baA
zerb
aija
nA
ndor
raFr
ench
Pol
ynes
iaBe
nin
Baha
mas
Bahr
ain
Bela
rus
Guam
Bots
wan
aBa
rbad
osBa
ngla
desh
Belg
ium
Kiri
bati
Burk
ina
Faso
Beliz
eBh
utan
Bosn
ia a
nd H
erze
govi
naM
arsh
all I
slan
dsBu
rund
iBe
rmud
aBr
unei
Dar
ussa
lam
Bulg
aria
Mic
rone
sia
Cam
eroo
nBo
livia
Cam
bodi
aCr
oatia
New
Cal
edon
iaCa
pe V
erde
Isla
nds
Cost
a Ri
caCy
prus
Czec
h Re
publ
icN
ew Z
eala
ndCe
ntra
l Afri
can
Repu
blic
Dom
inic
aGe
orgi
aD
enm
ark
Papu
a N
ew G
uine
aCh
adD
omin
ican
Rep
ublic
Indo
nesi
aEs
toni
aSa
moa
Com
oros
El S
alva
dor
Iran
Finl
and
Solo
mon
Isla
nds
Cong
oFr
ench
Gui
ana
Iraq
Gree
ceTo
nga
Cote
dIv
oire
Gree
nlan
dIs
rael
Hun
gary
Vanu
atu
Dem
ocra
tic R
epub
lic o
f the
Con
g oGr
enad
aJo
rdan
Icel
and
Djib
outi
Guad
elou
peK
azak
hsta
nIre
land
Egyp
tGu
atem
ala
Kuw
ait
Italy
Equi
toria
l Gui
nea
Guya
naK
yrgy
zsta
nLa
tvia
Eritr
eaH
aiti
Laos
Lith
uani
aEt
hiop
iaH
ondu
ras
Leba
non
Luxe
mbo
urg
Gabo
nJa
mai
caM
alay
sia
Mac
edon
iaGh
ana
Mar
tiniq
ueM
aldi
ves
Mal
taGu
inea
-Bis
sau
Net
herla
nds
Ant
illes
Mon
golia
Mol
dova
Ken
yaN
icar
agua
Nep
alN
ethe
rland
sLe
soth
oPa
nam
aO
man
Nor
way
Libe
riaPa
ragu
ayPa
kist
anPo
land
Liby
aPu
erto
Ric
oPa
lest
inia
n W
est B
ank
and
Gaza
Rom
ania
Mad
agas
car
Sain
t Kitt
s &
Nev
isPh
ilipp
ines
Slov
akia
Mal
iSa
int L
ucia
Qat
arSl
oven
iaM
aurit
ania
Sain
t Vin
cent
& th
e Gr
enad
ines
Saud
i Ara
bia
Swed
enM
aurit
ius
Surim
ane
Sing
apor
eSw
itzer
land
Mor
occo
Trin
idad
& T
obag
oSo
uth
Kor
eaU
krai
neM
ozam
biqu
eU
rugu
aySr
i Lan
kaN
amib
iaU
. S. V
irgin
Isla
nds
Syria
Reun
ion
Tajik
ista
nRw
anda
Thai
land
Sao
Tom
e e
Prin
cipe
Turk
eySe
yche
lles
Turk
men
ista
nSi
erra
Leo
neU
nite
d A
rab
Emira
tes
Som
alia
Uzb
ekis
tan
Suda
nVi
et N
amSw
azila
ndYe
men
Tanz
ania
Togo
Tuni
sia
Uga
nda
Zim
babw
e
# Co
untri
es46
3341
3113
Ethn
olog
ue #
Cou
ntrie
s57
5150
4525
1 Cla
ssifi
catio
ns a
ccor
ding
to G
ordo
n (2
005)
. Reg
ress
ions
als
o in
lcud
e th
e fo
llow
ing
coun
tries
and
terri
torie
s w
ith m
issi
ng la
ngua
ge in
form
atio
n: A
fgha
nist
an, F
aroe
Isla
nds,
Fal
klan
d Is
land
s, H
ong
Kon
g, L
iech
tens
tein
, Mac
ao, M
ayot
te, M
onac
o, M
yanm
ar, S
an M
arin
o, S
erbi
a an
d M
onte
negr
o, a
nd T
uval
u.
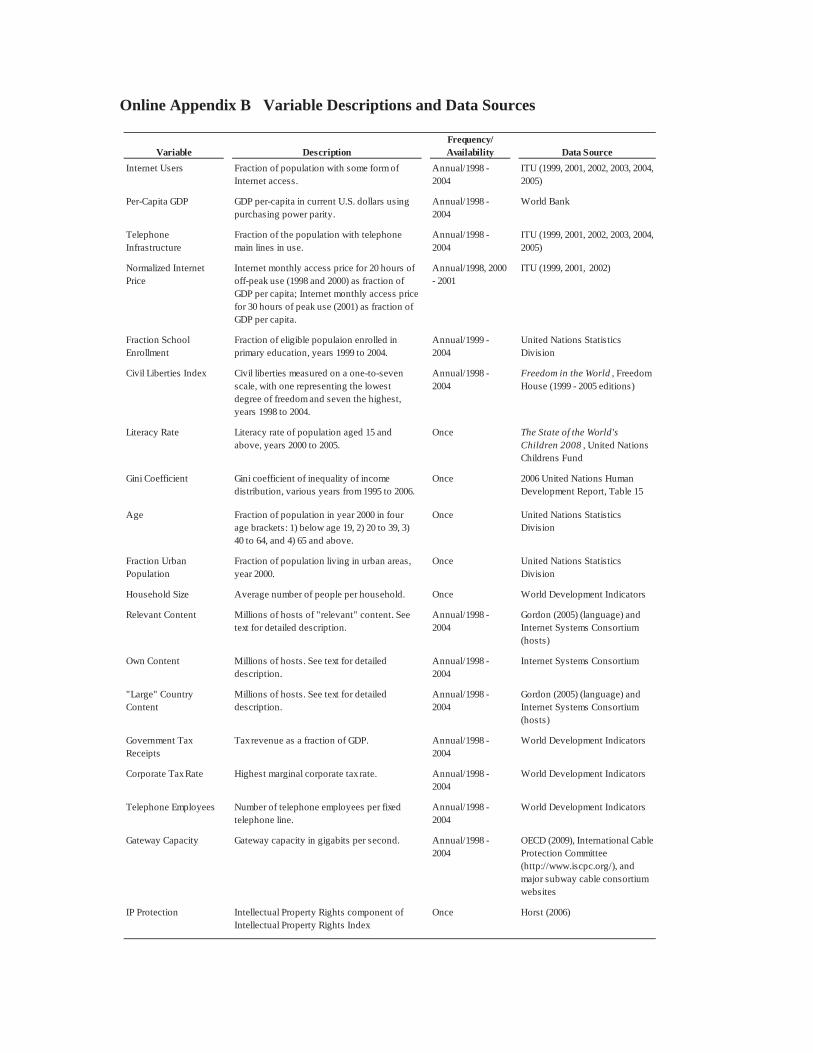
Online Appendix B Variable Descriptions and Data Sources
Frequency/Variable Description Availability Data Source
Internet Users Fraction of population with some form of Internet access.
Annual/1998 - 2004
ITU (1999, 2001, 2002, 2003, 2004, 2005)
Per-Capita GDP GDP per-capita in current U.S. dollars using purchasing power parity.
Annual/1998 - 2004
World Bank
Telephone Infrastructure
Fraction of the population with telephone main lines in use.
Annual/1998 - 2004
ITU (1999, 2001, 2002, 2003, 2004, 2005)
Normalized Internet Price
Internet monthly access price for 20 hours of off-peak use (1998 and 2000) as fraction of GDP per capita; Internet monthly access price for 30 hours of peak use (2001) as fraction of GDP per capita.
Annual/1998, 2000 - 2001
ITU (1999, 2001, 2002)
Fraction School Enrollment
Fraction of eligible populaion enrolled in primary education, years 1999 to 2004.
Annual/1999 - 2004
United Nations Statistics Division
Civil Liberties Index Civil liberties measured on a one-to-seven scale, with one representing the lowest degree of freedom and seven the highest, years 1998 to 2004.
Annual/1998 - 2004
Freedom in the World , Freedom House (1999 - 2005 editions)
Literacy Rate Literacy rate of population aged 15 and above, years 2000 to 2005.
Once The State of the World's Children 2008 , United Nations Childrens Fund
Gini Coefficient Gini coefficient of inequality of income distribution, various years from 1995 to 2006.
Once 2006 United Nations Human Development Report, Table 15
Age Fraction of population in year 2000 in four age brackets: 1) below age 19, 2) 20 to 39, 3) 40 to 64, and 4) 65 and above.
Once United Nations Statistics Division
Fraction Urban Population
Fraction of population living in urban areas, year 2000.
Once United Nations Statistics Division
Household Size Average number of people per household. Once World Development Indicators
Relevant Content Millions of hosts of "relevant" content. See text for detailed description.
Annual/1998 - 2004
Gordon (2005) (language) and Internet Systems Consortium (hosts)
Own Content Millions of hosts. See text for detailed description.
Annual/1998 - 2004
Internet Systems Consortium
"Large" Country Content
Millions of hosts. See text for detailed description.
Annual/1998 - 2004
Gordon (2005) (language) and Internet Systems Consortium (hosts)
Government Tax Receipts
Tax revenue as a fraction of GDP. Annual/1998 - 2004
World Development Indicators
Corporate Tax Rate Highest marginal corporate tax rate. Annual/1998 - 2004
World Development Indicators
Telephone Employees Number of telephone employees per fixed telephone line.
Annual/1998 - 2004
World Development Indicators
Gateway Capacity Gateway capacity in gigabits per second. Annual/1998 - 2004
OECD (2009), International Cable Protection Committee (http://www.iscpc.org/), and major subway cable consortium websites
IP Protection Intellectual Property Rights component of Intellectual Property Rights Index
Once Horst (2006)

Online Appendix C Technical Details of Hosts Data Collection
The technical details of ISC’s data collection are complex due to the sheer size of the Internet but ISC essentially counts the number of Internet Protocol (IP) addresses that have been assigned a Uniform Resource Locator (URL), which is the website address that users enter into a browser to locate content. An IP address is associated with a single host which is how ISC finds the host names. A request is sent to each active IP address requesting the unique host name. A host may have more than one IP address associated with it so ISC resolves these duplicates. Each computer on the Internet is assigned an IP address between 1 and 232 but only those that have been assigned a URL are in use. To determine which have been assigned a URL, ISC must send a query to that address. Since it would take too long for ISC to query every possible address in use, it uses a sophisticated sampling algorithm to reduce the time.1
In its survey ISC gathers the URL of each host computer. This address contains a two-digit country code (e.g., .za for New Zealand, .uk for United Kingdom, and .ca for Canada) called a country-code Top Level Domain (ccTLD). ISC assigns each domain to a country based on the ccTLD.2 The ccTLD does not necessarily imply that the computer is physically located within the country. Instead, assigning a ccTLD requires a local presence such as citizenship, resident address, or local administrative contact.
The relationship between hosts and addresses (URLs) is complicated. All web pages have a unique URL and are part of a sub-domain which is in turn part of a domain. A domain name such as “google.com” can have many sub-domains such as “www.google.com,” “video.google.com,” “appengine.google.com,” and “investor.google.com”. In the early days of the Internet a host commonly had a single sub-domain name. However, sub-domains now commonly map to multiple IP addresses and therefore multiple hosts. The domain naming system is not critical to ISC’s host counting since the hosts are uniquely named and have a unique IP address. ISC identifies the sub-domain associated with each host for purposes of allocating hosts to countries.
Online Appendix D Distinguishing Language-Specific and Non-Language Specific Content
Our model will accommodate non-language specific content if: 1) in each country, language-specific content is produced proportional to the fraction of the country’s population using each language,3 and 2) in each country, language-specific and non-language specific content have the same marginal effect on adoption. Total content in country k at time t includes language-specific content across all languages and non-language specific content (Assumption 2 ensures that we can add these without weights):
(A1)1
J
kt kjt ktj
Content LContent NLContent .
Assumption 1 implies:
(A2) kj ktkjt
k
Users LContentLContent
Population and
1
Jkj kt
ktj k
Users LContentLContent
Population.
1 More details can be read at http://www.isc.org/index.pl?/ops/ds/.2 ISC also adjusts for “generic” ccTLD’s, such as .com, .edu., and .org, that do not always have a country suffix.3 This is the same assumption required when we allocate hosts to languages within countries.

Substituting Equation (A2) into (A1) and using the fact that 1
J
k kjj
Population Users we get:
(A3)1
Jkj kt kt
ktj k
Users LContent NLContentContent
Population.
The term in brackets is total content for country k at time t so:
(A4)1
Jkj kt
ktj k
Users ContentContent
Population.
This implies that we can measure country k ’s content produced at time t in language j by allocating total content according to the fraction of the country’s population using each language:
(A5) kj ktkjt
k
Users ContentContent
Population,
consistent with our procedure described on page 5 of the main text.
If Assumption 2 does not hold, the direction of bias due to the presence of non-language specific content will depend on the relative sensitivities. If adoption is more responsive to language-specific content then we will understate content’s effect. If the opposite is true we will overstate it.