Embed Size (px)
Citation preview

Science and Mathematics Education Centre
The Effect of Cooperative Group Work and Assessment on the
Attitudes of Students towards Science in New Zealand
John Paul Lowe
This thesis is presented for the degree of
Doctor of Philosophy
of the
Curtin University of Technology
May 2004

ii
ABSTRACT
The improvement of secondary-level students’ attitude to science is encouraged in
the New Zealand curriculum document. It is also noteworthy that employers in
scientific institutions and commercial organisations place great value on group or
teamwork. However, it is apparent that some teachers have reservations about
cooperative group work, particularly problems with classroom management. There
has been significant research done on cooperative learning and student attitudes, but
investigations about the use of cooperative group work to improve the science-
related attitudes of our younger secondary school students are rare.
This thesis focuses on the effect of cooperative group work and assessment on the
attitudes of 312 science students in four rural secondary schools in New Zealand.
The cooperative groups were established using a simplified protocol which was non
intrusive on curriculum delivery to help ensure wide acceptance by secondary
science teachers. The students’ attitudes were assessed quantitatively using the Test
of Science Related Attitudes (TOSRA) while qualitative results were obtained
through teacher and student interviews along with researcher observations.. The data
were collected before and after three terms of cooperative learning in a variety of
activities including practical classes, fieldwork, and written assignments and class
tests. This part of the study revealed that group work and group assessment
enhanced students’ attitudes to science, with both the teachers and students seeing
real value in such activities, especially the formative group testing opportunities.
The study also confirmed the reliability and validity of the TOSRA in New Zealand
schools for the first time. The TOSRA was also used to make comparisons of the
science-related attitudes of several subgroups within the study population. Such
comparisons included the effects of gender, grade level and band along with
consideration of the roles of the teacher and classroom environment on student
attitudes.
Finally, a teacher friendly set of guidelines for the implementation of cooperative
group work and assessment in the classroom has been prepared as result of this
ongoing research.
iii
ACKNOWLEDGEMENTS
Any research is never a solo effort and tackling a doctoral programme is no
exception especially while teaching fulltime. I would like to acknowledge a number
of people for their support. Firstly, my wife, Wendy for her continued
encouragement along with that of my three children, Natalie, Matthew and Danny
who were all keen to see me complete this thesis.
My supervisor, Professor Darrell Fisher, of the Science and Mathematics Education
Centre, Curtin University of Technology for the outstanding guidance, support and
advice given so willingly over a long period of time. The support of the Science and
Mathematics Education Centre staff has been outstanding in completing this study
(especially Beverly Webster for her statistics work). Professors Barry Fraser and
David Treagust also of Curtin University of Technology whose encouragement at
conferences and during my time at Curtin certainly helped keep me going.
Curtin University of Technology for their continued financial support including the
fantastic opportunity to present at ASERA, Sydney 2001. This would not have been
possible without their help.
My brother David, (Associate Professor at Waikato University Earth Sciences
Department) for his assistance, encouragement and proof reading.
To my school Morrinsville College, who so willingly released me during my study
leave year in 1998 and have been supportive of my work.
I also gratefully acknowledge the enthusiastic and devoted teachers who assisted so
willingly with the study and helped with valuable advice and suggestions, as did
many students with their contributions and valuable comments.

iv
CONTENTS
PAGE
Abstract ii
Acknowledgements iii
List of Tables viii
List of Figures x List of Appendices xi
CHAPTER 1 INTRODUCTION 1
1.1. Background to the Study 2
1.2. The Current Situation in New Zealand 4
1.2.1 Research Projects 4
1.2.2 Laboratory Work and Practical Exams 6
1.2.3 Written Research Projects 7
1.2.4 Written Tests and Examinations 7
1.3. Aim 8
1.4. Objectives 10
1.5. Significance of the Study 10
1.6. Overview of Thesis 11
CHAPTER 2 LITERATURE REVIEW 13
2.1 Chapter Overview 14
2.2 Cooperative Group Work 15
2.2.1 Early Research 15
2.2.2 The Modern Era 16
2.2.3 Overview of Cooperative Group Work 42
2.3 Attitudes 43
2.3.1 The Evolution of The Modern Concept of Attitudes 43
2.3.2 The Development of Instruments for the Measurement of Attitudes 45
2.3.3 The Changing Attitudes of Boys and Girls Towards Science 49
2.3.4 Self-efficacy, Science Literacy and Group Work 51
2.3.5 Attitudes and the Classroom Environment 53
2.4 Conclusion 53

v
CHAPTER 3 METHODOLOGY 56
3.1 Overview 57
3.2 School Selection 59
3.2.1 Pilot Study 59
3.2.2 Description of Schools Selected 59
3.3 Selection of Classes 62
3.4 How the Groups were established within the Classes 63
3.4.1 Protocol for Group Organization 64
3.4.2 Instructions to Teachers 64
3.4.3 Ethical Considerations 66
3.5 Quantitative and Qualitative Data 66
3.5.1 Quantitative Data: TOSRA Application 67
3.5.2 Qualitative Data 67
3.6 Data Collection Timeline 70
3.7 Data Analysis 71
3.8 Ongoing Study 72
CHAPTER 4 VALIDATION OF THE TOSRA 73
4.1 Overview 74
4.2 Reliability and Validity of the Test of Science Related Attitudes (TOSRA) 75
4.2.1 Factor Analysis 75
4.2.2 Validation of the TOSRA 77
4.2.3 Mean Correlations 78
4.3 Comparison with Studies of Fraser (1981) 78
4.4 Conclusion 79
CHAPTER 5 GENDER AND ATTITUDES TO SCIENCE: SCHOOL, YEAR
AND BAND 81
5.1 Overview 82
5.2 Gender and Science Related Attitudes Using the TOSRA 83
5.2.1 Gender and Attitudes 83
5.2.2 Gender and Attitudes: Years and Bands 85

vi
5.2.3 Gender and Attitudes: School, Year and Band 92
5.2.4 Attitudes: Year Level Differences 111
5.3 Discussion of the Analysis of Attitudes to Science 112
CHAPTER 6 THE EFFECT OF COOPERATIVE GROUP WORK AND
ASSESSMENT ON THE ATTITUDES OF STUDENTS TOWARDS SCIENCE 113
6.1 Overview 114
6.2 Data Collection with the TOSRA 115
6.3 Results 116
6.3.1 Quantitative Results: TOSRA 116
6.3.2 Qualitative Results: Student Interviews 118
6.3.3 Qualitative Results: Teacher Interviews 127
6.4 Longitudinal Case Study 130
6.4.1 Introduction 130
6.4.2 Quantitative Results: TOSRA 130
6.4.3 Qualitative Results: Student Interviews 132
6.5 The Attitudes of Lower Band Students: School 4 134
6.5.1 Introduction 134
6.5.2 Quantitative Data 135
6.5.3 Student Interviews 136
6.5.4 Teacher Interviews 142
6.6 Observation by the Researcher and Video Analysis 143
6.6.1 Introduction 143
6.6.2 Practical Work 144
6.6.3 Group Testing 144
6.7 Summary: The Effect of Cooperative Group Work and Assessment
on the Attitudes of Students Towards Science 145
CHAPTER 7 CONCLUSION 147
7.1 Introduction 148
7.2 Overview of the Study 149
7.3 Major findings of the Study 151

vii
7.3.1 Objective One 151
7.3.2 Objective Two 152
7.3.3 Objective Three 153
7.4 Significant Improvements 154
7.4.1 Review Testing 154
7.4.2 League Tables and Group Names 155
7.4.3 Senior Students: Revision Tests 156
7.4.4 Team Practical Examination 156
7.4.5 Problem-based Learning 157
7.4.6 Concept Cartoons 158
7.5 Implications of the Study 158
7.6 Limitations of the Study 160
7.7 Suggestions for further Research 161
7.7.1 Cognitive outcomes of Cooperative Group Work and Assessment 161
7.7.2 Student-teacher Interaction 161
7.7.3 City Schools 162
7.7.4 Māori Students and other Cultural Groups 162
7.8 Final Comments 162
References 164
Appendices 176

viii
LIST OF TABLES
Table 1.1
Techniques for the Assessment of Practical Skills (TAPS)
6
Table 2.1 The Likert Scale 46
Table 2.2 Fraser’s Scales and Klopfer’s Classification 47
Table 2.3 Items in the Attitude to this Class (Enjoyment of Science Lessons) Scale
49
Table 3.1 Summary of Teachers Selected 63
Table 3.2 Student Instructions 64
Table 3.3 Teacher Instructions 65
Table 3.4 Questions for Interviews with Students 69
Table 3.5 Data Collection Timeline 71
Table 4.1 Factor Analysis of the TOSRA 76
Table 4.2 Items Changed after Factor Analysis 77
Table 4.3 Scale Means: Standard Deviations, Internal Consistency (Cronbach Alpha Coefficient), and Discriminant Validity (Mean Correlation with Other Scales) for the TOSRA
78
Table 4.4 Comparison of New Zealand and Australian Means for TOSRA 79
Table 5.1 Gender and Attitudes: TOSRA Results for the Entire Sample 83
Table 5.2 Gender: Year 9 Middle Band 86
Table 5.3 Gender: Year 9 Upper Band 87
Table 5.4 Gender: Year 10 Middle Band 88
Table 5.5 Gender: Year 10 Upper Band 89
Table 5.6 Summary of Gender Differences for Years and Bands: Year and Band Data
90
Table 5.7 Gender Comparisons: School, Year and Band 92
Table 5.8 Gender: Year 9 Middle Band School 1 93
Table 5.9 Gender: Year 9 Middle Band School 2
94
Table 5.10 Gender: Year 9 Middle Band School 3 95
Table 5.11 Gender: Year 9 Upper Band School 1 97
Table 5.12 Gender: Year 9 Upper Band School 2 98

ix
LIST OF TABLES (Continued)
Table 5.13 Gender: Year 9 Upper Band School 3 99
Table 5.14 Gender: Year 10 Middle Band School 1 101
Table 5.15 Gender: Year 10 Middle Band School 2 102
Table 5.16 Gender: Year 10 Middle Band School 3 103
Table 5.17 Gender: Year 10 Upper Band School 1 105
Table 5.18 Gender: Year 10 Upper Band School 2 106
Table 5.19 Gender: Year 10 Upper Band School 3 107
Table 5.20 Summary of Gender Differences: School, Year and Band 109
Table 5.21 Attitudes: Year 9 and Year 10 111
Table 6.1 Pre- and Post-Test Means on TOSRA Scales 117
Table 6.2 Small Scale Longitudinal Study at School 3 131
Table 6.3 TOSRA Results for the Year 10 Lower Band Class 135

x
LIST OF FIGURES
Figure 4.1 TOSRA Mean Scores for New Zealand and Australia 79
Figure 5.1 Gender and attitude (all students) 84
Figure 5.2 Gender: Year 9 middle band 86
Figure 5.3 Gender: Year 9 upper band 87
Figure 5.4 Gender: Year 10 middle band 88
Figure 5.5 Gender: Year 10 upper band 89
Figure 5.6.1 Gender: School 1 Year 9 middle band (Mike <2y) 93
Figure 5.6.2 Gender: School 2 Year 9 middle band (Truby >15y) 94
Figure 5.6.3 Gender: School 3 Year 9 middle band (Barbara <5y) 95
Figure 5.7.1 Gender: School 1 Year 9 upper band (Mike<2y) 97
Figure 5.7.2 Gender: School 2 Year 9 upper band (Sandra <5y) 98
Figure 5.7.3 Gender: School 3 Year 9 upper band (Linda <2y) 99
Figure 5.8.1 Gender: School 1 Year 10 middle band (Brian >15y) 101
Figure 5.8.2 Gender: School 2 Year 10 middle band (Sandra <5y) 102
Figure 5.8.3 Gender: School 3 Year 10 middle band (Tuk >15y) 103
Figure 5.9.1 Gender: School 1 Year 10 upper band (Brian >15y) 105
Figure 5.9.2 Gender: School 2 Year 10 upper band (Truby >15y) 106
Figure 5.9.3 Gender: School 3 Year 10 upper band (Ken >15y) 107
Figure 5.10 Attitudes: Year 9 and Year 10 111
Figure 6.1 Plot of TOSRA results pre and post group work study 117
Figure 6.2 Small scale longitudinal study at School 3 131
Figure 6.3 Plot of pre and post group work for Year 10 lower band 135

xi
LIST OF APPENDICES
A Research Project Report 177
B School Codes: Class, Year, and Band 178
C TOSRA Questions and Marking Schedule 179
D An Example of A League Table 182
E Year 9 Team Practical Exam 183

1
CHAPTER 1
INTRODUCTION

2
1.1 BACKGROUND TO THE STUDY
Research into cooperative group work and assessment in science is not new and is
fully reviewed in Chapter 2. However, the ways in which group work and assessment
can be linked to create an environment which students find both stimulating and
rewarding forms the basis of this research.
While positive cognitive outcomes are very important for secondary school students
as they progress through their college years, without positive attitudes towards their
science subjects they are unlikely to pursue a science-related career or maintain a
lifelong interest in science. In fact, many will often have negative attitudes towards
the activities of scientists and science-related issues. If we wish people to be able to
make informed and non-emotive decisions on many of the science-based issues
likely to face society in the 21st Century then positive attitudes are important. In
many countries, the promotion of favourable attitudes towards science is viewed as a
central aim of science education (Fraser, 1981b; Kelly, 1986).
Many successful modern companies spend a lot of time, money, and effort in
developing the 'team ethos'. Team-building activities are fundamental to their staff
development programmes and are seen as invaluable. Over the past 20 years the
number of providers of these activities has risen significantly. The employment
officer of Grayson's Laboratories (personal communication, September, 1995) stated
that the single-most important factor, when they consider employing staff, is the
ability to work cooperatively in a team. Whereas there are some jobs that can be
filled by individuals that prefer to work on their own, these are rare and often of a
temporary nature and so the good team member is often the most prudent staff
selection.
Wellins (1991) in his modern business book ‘Empowered Teams’ perhaps best
summarises how effective teams can work in the following quote (p. 146):
Effective teams are not just collections of people. Rather they comprise an entity that is greater than the sum of its parts. This means that team members

3
must work together closely and make every effort to cooperate and support one another.
Similarly, the Charter of the East Waikato Science Fair, New Zealand (described in
section 1.2) includes the following aim: ‘To foster the ability among students to work
cooperatively to achieve a common goal’. It is very likely then that the development
of good teamwork and positive attitudes in science are both important and necessary
as far as employers and students are concerned.
Kroll, Masinglia, and Mau (1992) observed that we should use evaluation procedures
that match the instructional format that is used and hence if students frequently work
in small groups then they should be assessed in those small groups.
Gilbert (1990) observed that activities in which students manipulate ideas and
materials themselves lead to deeper processing of ideas. There is a need to find
viable and practical alternatives to the passive activity of listening to the teacher and
answering short factual questions.
Both of these viewpoints lead to the conclusion that educationalists should be doing
more group work and group assessment in our secondary schools. As far as testing is
concerned, Murray (1990) recommended alternative methods such as allowing group
discussion prior to testing could be the subject of further research. Similarly, Atkins
(1993) recommended that current assessment methods should be changed to include
increased emphasis on the assessment of small group work. Thus, there is a need for
more research in this area.
In the Science in the New Zealand Curriculum document (Ministry of Education,
1993) it was suggested (in the section on enhancing achievement) that learning is
enhanced when (p. 10): ‘Students have the opportunity to clarify their ideas, to share
and compare, question, evaluate, and modify these ideas, leading to scientific
understanding’.
This document further stated that the primary purpose of school-based assessment is
to improve students’ learning and the quality of learning programmes.

4
Assessment tasks and procedures should be consistent with the general aims of
science education and be compatible with regular classroom activity. In this way,
assessment will be an integral part of the learning programme. This in many ways
supports the need for more group assessment as a follow up to students’ cooperative
group work in the classroom. This thesis responds to these new directions by
examining the effects of both group work and assessment on the attitudes and
motivation of students in science in New Zealand.
1.2 THE CURRENT SITUATION IN NEW ZEALAND
In most New Zealand schools, Year 9 and 10 science students (Year 9 students in
New Zealand are typically 13 years of age on entry) are taught primarily as
individuals but with some cooperative group work often included to ease resource
management. Laboratory work is usually undertaken in cooperative group situations
of two, three or four students. Usually this is done in order to promote cooperative
work and to manage laboratory resources. Group work is also used in fieldwork and
other tasks involving data collection. Sharing of the work throughout the group is
actively encouraged, although as this is not usually assessed because there tend to be
‘doers’ and ‘watchers’ in many of the groups.
The following section contains a summary of the main types of activities found in
New Zealand schools at Year 9 and 10 together with the types of assessment
normally employed for each activity.
1.2.1 Research Projects
There are two main types of open-ended research activities usually undertaken in
New Zealand schools. These are the Science Fair and CREST programmes.

5
Science Fair
Students try to solve problems, which they find of interest to them, usually by
experiment. They are encouraged to use valid research methods. The results are
presented on display boards along with logbooks and any other relevant material.
Most schools have a school-based fair from which the best projects are selected to go
to a regional fair. The best project from these is sent on to the New Zealand Fair
(there are 30 finalists from throughout New Zealand). The best few national exhibits
often get trips overseas to display their work internationally. Students are able to
work in pairs or as individuals.
Judges using set descriptors usually make the assessment but marks are not usually
given. Some schools, however, do assign marks for these projects, often on a five-
point scale, using aspects such as scientific content and communication and
investigative skills. A typical report using this achievement based assessment can be
seen in Appendix A.
CREST
Creativity in Science and Technology (CREST), like the Science Fair, represents an
opportunity for students to undertake research within a framework of assistance. At
secondary school there are three levels of achievement - bronze, silver, and gold -
with increasing rigor at each level. At the silver and gold levels, external assessors
and consultants are appointed, usually university or industry based. For example, the
University of Waikato and the National Institute of Water and Atmospheric Research
are both involved in running the Waikato branch of the awards. The gold awards are
very prestigious, with only a few such awards made nationally each year. Any
student who perseveres with their project can achieve bronze awards. CREST has
been managed in New Zealand by Massey University and the New Zealand Science
Teachers’ Association and originates from the United Kingdom. The Royal Society
of New Zealand currently manages CREST.
CREST work can be undertaken in pairs or as individuals although there is provision
for ‘Team CREST’ where groups of up to five or six can work together.
6
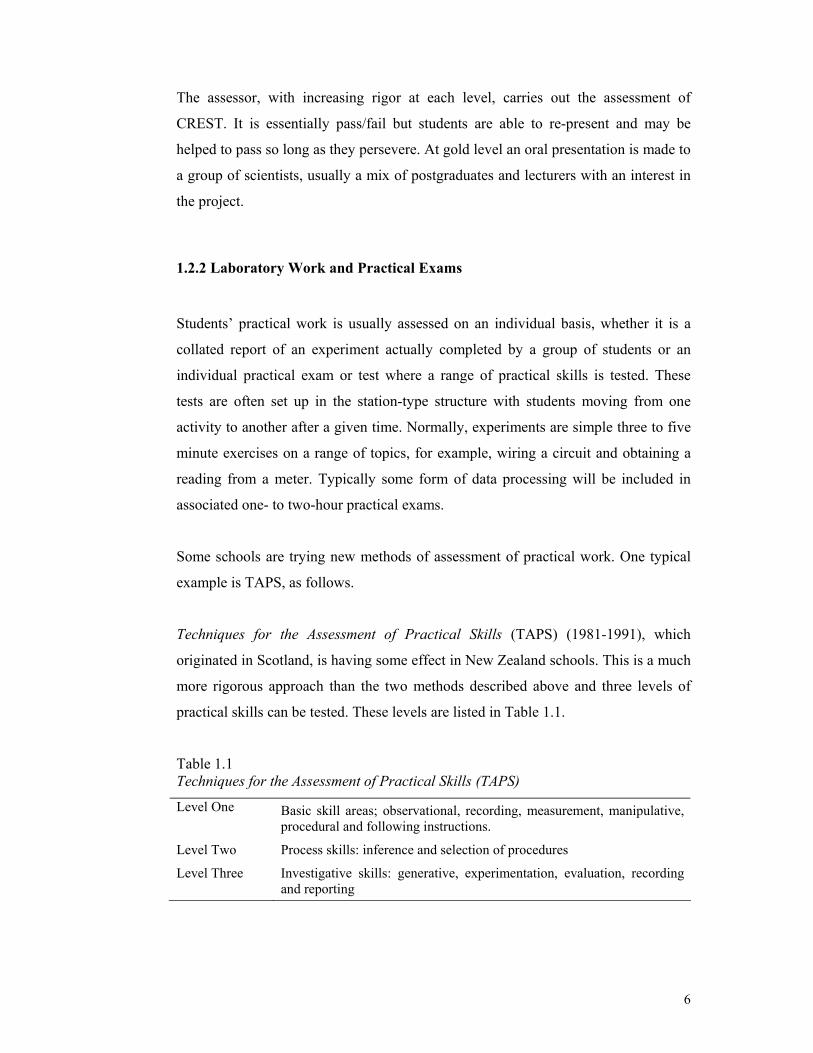
The assessor, with increasing rigor at each level, carries out the assessment of
CREST. It is essentially pass/fail but students are able to re-present and may be
helped to pass so long as they persevere. At gold level an oral presentation is made to
a group of scientists, usually a mix of postgraduates and lecturers with an interest in
the project.
1.2.2 Laboratory Work and Practical Exams
Students’ practical work is usually assessed on an individual basis, whether it is a
collated report of an experiment actually completed by a group of students or an
individual practical exam or test where a range of practical skills is tested. These
tests are often set up in the station-type structure with students moving from one
activity to another after a given time. Normally, experiments are simple three to five
minute exercises on a range of topics, for example, wiring a circuit and obtaining a
reading from a meter. Typically some form of data processing will be included in
associated one- to two-hour practical exams.
Some schools are trying new methods of assessment of practical work. One typical
example is TAPS, as follows.
Techniques for the Assessment of Practical Skills (TAPS) (1981-1991), which
originated in Scotland, is having some effect in New Zealand schools. This is a much
more rigorous approach than the two methods described above and three levels of
practical skills can be tested. These levels are listed in Table 1.1.
Table 1.1 Techniques for the Assessment of Practical Skills (TAPS)
Level One Basic skill areas; observational, recording, measurement, manipulative, procedural and following instructions.
Level Two Process skills: inference and selection of procedures
Level Three Investigative skills: generative, experimentation, evaluation, recording and reporting

7
1.2.3 Written Research Projects
These are the types of projects that are based on a literature search usually in the
school library or based on the Internet. They are typically undertaken in either pairs
or as individuals and presented as a folder, a written report, or in the case of pairs or
groups, as a poster. Some schools require students to produce a computer-based
report. Some schools require an oral presentation and some include the use of
programmes such as ‘PowerPoint’.
Assessment of these projects does vary but is often carried out on an individual basis
even though the data may have been collected in pairs or groups.
1.2.4 Written Tests and Examinations
These are carried out by individuals and marked as such. There has been a trial over
recent years of different methods for assessing student scripts. However, most of
these ‘new’ methods are simply attempts to vary from norm-referenced assessment.
Overview of Assessment in Science
The use of both individual and cooperative group practical work is becoming more
common while the assessment method varies from individual to group assessment.
The latter is much more common when the work is presented as a poster, a group
presentation or in a format where contributions of individuals cannot be accurately
measured. In many cases, group projects are consequently incompletely assessed.
Teachers sometimes see this as a flaw in the assessment process and as a result
students do not always see these assessments as important because they do not get a
significant mark for their efforts. It is of interest to note that Osborne and Freyberg
(1985) claimed that the teaching style preferred by most teachers involves large
amounts of teacher input. This is followed by student activity and practice, and then
more teacher input often in the form of feedback and evaluation. Such a preference
is possibly the reason why teachers are at times reluctant to use group assessment.

8
Individuals throughout the year sit the majority of tests formally. Tests are usually of
about one hour duration and follow the end of each unit of work. There are usually
eight to ten units in a course with a major exam at the end of the year also assessed
on an individual basis.
The Science in the New Zealand Curriculum (Ministry of Education, 1993)
document does encourage much more varied assessment methods than has been the
case in the past. Such methods include reports, investigations, interviews with key
people, experimental designs (including fair testing), and ability to work
cooperatively in groups. Most of these methods involve individuals working as a
cooperative group, but many schools still assess the individual’s work rather than the
collated report arising from his/her group.
Essentially, group assessment has low status in New Zealand secondary schools at
this time.
1.3 AIM
The aim and objectives of this thesis have arisen out from my observations of student
attitudes over the course of my teaching career in science and the need to make
science more achievable and relevant to the students. The central aim was to
determine the effect of cooperative group work and assessment on the attitudes and
motivation of students towards science in New Zealand. My research set out to gauge
the effects of the following on the motivation and attitudes towards science of Year 9
and 10 students.
9
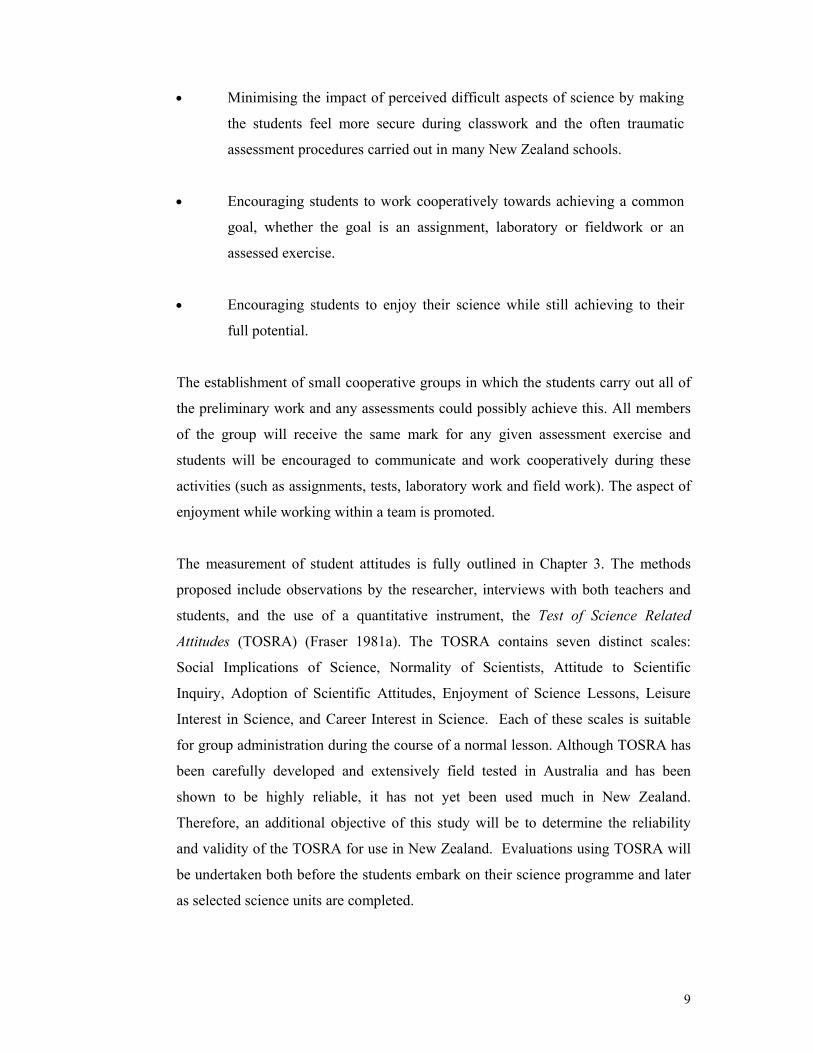
• Minimising the impact of perceived difficult aspects of science by making
the students feel more secure during classwork and the often traumatic
assessment procedures carried out in many New Zealand schools.
• Encouraging students to work cooperatively towards achieving a common
goal, whether the goal is an assignment, laboratory or fieldwork or an
assessed exercise.
• Encouraging students to enjoy their science while still achieving to their
full potential.
The establishment of small cooperative groups in which the students carry out all of
the preliminary work and any assessments could possibly achieve this. All members
of the group will receive the same mark for any given assessment exercise and
students will be encouraged to communicate and work cooperatively during these
activities (such as assignments, tests, laboratory work and field work). The aspect of
enjoyment while working within a team is promoted.
The measurement of student attitudes is fully outlined in Chapter 3. The methods
proposed include observations by the researcher, interviews with both teachers and
students, and the use of a quantitative instrument, the Test of Science Related
Attitudes (TOSRA) (Fraser 1981a). The TOSRA contains seven distinct scales:
Social Implications of Science, Normality of Scientists, Attitude to Scientific
Inquiry, Adoption of Scientific Attitudes, Enjoyment of Science Lessons, Leisure
Interest in Science, and Career Interest in Science. Each of these scales is suitable
for group administration during the course of a normal lesson. Although TOSRA has
been carefully developed and extensively field tested in Australia and has been
shown to be highly reliable, it has not yet been used much in New Zealand.
Therefore, an additional objective of this study will be to determine the reliability
and validity of the TOSRA for use in New Zealand. Evaluations using TOSRA will
be undertaken both before the students embark on their science programme and later
as selected science units are completed.

10
1.4 OBJECTIVES
The objectives of the study were:
1.5 SIGNIFICANCE OF THE STUDY
This study focused on the effect that group work in both classroom activities and
assessment tasks had on the attitudes towards science of Year 9 and 10 students.
While group activities are not new, the use of teamwork during assessment tasks was
a significant variation from the norm.
Some significant contributions also were made to the study of group work and
attitudes. Firstly, the instrument used to study attitudes towards science (TOSRA)
was validated for the first time with a large sample in New Zealand, and this finding
should encourage further research into attitudes towards science in this country.
Secondly, qualitative methods, such as interviews and videotaping were applied to
students in order to establish any changes in attitudes towards science. These
methods represent an attempt to get students to say exactly what they felt about their
science programmes. The third significant contribution this study made was an in-
depth look at the effect gender had on students’ attitudes towards science.
The fourth and perhaps most significant contribution of the study was the ongoing
involvement and testing by the researcher in order to establish a teacher-friendly set
1. to provide validation data for the use of the Test of Science Related
Attitudes (TOSRA) in New Zealand;
2. to determine relationships of grade and gender of students with their
attitudes to science; and
3. to determine the effect of a cooperative approach to learning and
assessment on the attitudes of students to science.

11
of guidelines for the implementation of cooperative group work and assessment in
the classroom. Such guidelines, supported by the other research findings, are clearly
very useful to classroom teachers.
1.6 OVERVIEW OF THESIS
This chapter has provided the background to the study, aims, objectives, and
significance of the study. Chapter 2 provides a review of the literature and shows that
although there has been some excellent work on cooperative learning there have been
very few studies which tie together cooperative group work, assessment and student
attitudes.
The methodology used in this study is outlined in Chapter 3. It includes a description
of how the schools and classes, which constituted the sample for the research, were
selected. Guidelines on the setting up the groups within their classes and how they
were expected to work together during various activities including a range of
assessment tasks are described. Details of how the early pilot study was conducted
are included. There is an outline of how quantitative and qualitative data were
collected about students’ attitudes. The Test of Science Related Attitudes (TOSRA)
was the instrument used to collect the quantitative data, and observations, student
and teacher interviews along with video tapes were used to collect qualitative data.
In Chapter 4 the focus is on the validity of the TOSRA. This was the first time the
TOSRA had been used in a significant number of schools in New Zealand, and
descriptive statistics were used to validate its application.
Relationships between grade, gender, and attitudes towards science are discussed in
Chapter 5 by exploring the sub-populations of the sample of students in the study.
The significance of these relationships is discussed at the end of the chapter.
The main objective of the study is addressed in Chapter 6, namely the effect of the
cooperative group work and assessment on the attitudes of students towards science.

12
The quantitative data collected by TOSRA during the course of the study are fully
analysed and discussed. The qualitative data from the taped interviews and
observations are analysed and conclusions are drawn. A summary of the chapter
gives a comprehensive overview of the results integrating all of the data.
Finally, Chapter 7 provides a broad overview of the findings of the thesis and
discusses any limitations. The chapter then looks at recommendations and teaching
practices that the classroom teacher can use to implement the recommendations.
These practices include modifications to the classroom environment as a result of
further trials undertaken since completion of the main study. This section is intended
to be user friendly to the teachers who wish to pursue an active cooperative learning
programme at Year 9 and 10 in New Zealand secondary schools.
13
CHAPTER 2
LITERATURE REVIEW

14
2.1 CHAPTER OVERVIEW
This chapter comprises a review of the history of relevant studies in cooperative
group work, and of attitudes and gender found in the science education literature.
The primary focus of this review is on the research objectives of the study outlined in
Chapter 1 (p. 9). The work of some of the major contributors in recent times is
summarised and in many cases significant features of many of their findings are used
to establish the methodology for this study found in Chapter 3.
The first section of this chapter looks at how cooperative group based work has
developed over time, and how recent researchers have contributed to our
understanding of how to get optimal work from students in group-work situations.
There are variations in the way cooperative groups can be established and operated
in different studies but there are some underlying fundamentals that are carried
through into the establishing the best methodology.
The second section looks at attitudes, initially from a historical perspective and then
with the development of an understanding of attitudes as viewed today. Several
studies consider the effect of gender, age and background on the resulting attitudes
towards science. The ongoing development of instruments designed to quantify
science-related attitudes is tracked along with the significant findings pertaining to
the subsequent use of these instruments both by the developer and other researchers.
Researchers have found that some significant changes in attitudes towards science
occur between Year 6 and Year 10. The age, gender, in school and out of school
experiences of the students all appear to contribute to these changes. Relevant
studies have been documented in the third section in order to establish what factors
may influence student attitudes.
The conclusion outlines the unique nature of this study in that it combines many of
the key elements found in the literature to ascertain the effect of cooperative group
work on the science related attitudes of young students.

15
2.2 COOPERATIVE GROUP WORK
2.2.1 Early Research
Cooperative learning has been recognized as an effective learning tool for a very
long time, even as long ago as the reign of the Babylonian Talmudin times BC. In
the first century BC, the Roman philosopher Seneca Quintillion advocated
cooperative learning with statements such as ‘Qui Docet Discet’ which means,
‘When you teach you learn twice’. Johann Amos Comenius (Komensky) (1592-
1670) was a theologian and educationalist from Czechoslovakia and Poland. He was
considered very modern at the time in his thinking and believed that students would
benefit by being taught and teaching other students. In the late 1700s the Reverend
Dr. Andrew Bell (1753-1832) (Bell, 2001) pioneered cooperative work while
teaching in Madras, India (Bell, 2001). While this was forced upon the teaching
profession through teacher shortage, the idea of basically older students (called
‘monitors’) cooperatively teaching younger ones was a great success. On his return
to England he encouraged schools to adopt ‘the Madras System’. By the time of his
death in 1832, some 10,000 schools were using his method. At the same time Joseph
Lancaster forced by a shortage of teachers, was developing a similar system of
‘monitors’ (Lancaster, 2001). Lancaster was funded to travel to America to set up
‘monitorial schools’ in New York and Philadelphia.
Also during the eighteenth century, the University of Glasgow’s professor of logic
and philosophy, George Jardine, used ‘peer review’ to assist the skill development of
his students in preparation for the entry into the world of work. To achieve this,
Jardine had to teach communication skills. In the late 1800s, Colonel Francis Parker
(1832-1902) was a strong advocate of cooperative learning. His ‘Quincy method’
was actually the releasing of the old fashioned bonds that restrained both the teacher
and the child. It was Colonel Parker's intent to make the school a place of happiness
and exploration (Gaillett, 1994, Brown & Thomson, 2000).

16
John Dewey (1922, 1924) used cooperative learning groups and student committees
to ‘harness the powers’ of students to solve problems (Johnson, Johnson, & Holubec,
1994a). In his twin papers on cooperation and competition, Deutsh (1949a, 1994b)
concluded that there would be more productivity from a group where the members
were cooperative rather than competitive.
Following this, the ‘modern’ era of research into cooperative group work can be
considered to start with the initial work by Johnson and Johnson at the University of
Minnesota in the mid-1960s. Many investigations into cooperative group work have
been undertaken since then. Such investigations have many components in common
but often are subtly different in style.
2.2.2 The Modern Era
Many modern researchers share common ideas and goals for their cooperative
learning strategies. Their research is tailored to investigate the effect of their
particular environmental set-up on these ideas. The developmentally appropriate
academic skills and better interpersonal skills are often the main focus of research.
The competitive structure of most classrooms is seen as excellent for the winners,
who become well-motivated students with high status (Ames & Ames, 1984), but in
order to have winners you must have losers who become low-status students. These
students often become resentful and may often use attention-seeking ploys to cover
their low status.
The following section outlines the work of some key researchers in the modern era.
William Glasser
William Glasser (1969, 1986) suggests in his books, such as Schools Without Failure
and Control Theory in the Classroom a slightly different approach to the other
researchers. He approaches the problem by trying to address the large number of
failures in high schools.
Unless you have your head in the sand, you cannot fail to agree that about half of the secondary students in your regular classes make no consistent

17
effort to learn. In fact if you take a close look at the young people in your greater family, you will see that close to half of them are firmly entrenched in this no effort group. (Glasser, 1986, p. 8)
Glasser (1986) is very critical of the contemporary education system. He states that
to address the problems of this ‘failure group’ requires great effort and huge cost. He
says that most schools exhibit an unnecessary proliferation of administrators,
counselors, psychologists, special educators and reading specialists. He was also
critical of so-called alternative schools. This second tier ‘safety net’ (of alternative
schools) usually involves classes of no more than five or six students. Glasser
maintains that even these low numbers are unhelpful to learning by the majority of
students, and Glasser maintains that the failures continue to fill prison and welfare
rolls and drug rehabilitation centres.
Glasser (1986) maintains that the traditional stimulus-response (s-r) theory on which
most schools, and society in general, base human learning is in fact badly flawed.
This theory maintains that people or events around us motivate what we do. These
do things to us or for us and we act accordingly. People tend to believe that a reward
or a punishment, threat or hurt can force us to behave differently. Rewards and
punishments are still used as basic control techniques.
Control Theory
Glasser’s (1986) ‘control theory’ is ‘all about payoff’ (p. 10). When students and
teachers get more satisfaction from more immediate payoff they will perform better
than otherwise. According to Glasser, the control theory of behavior is that ‘we
always choose to do what is most satisfying to us at the time’ (p. 19). That is the
personal satisfaction of the basic needs of all higher animals: (1) to survive and
reproduce, (2) to belong, (3) to gain power, (4) to be free, and (5) to have fun. He
emphasises the fun aspect of education and that many people remember how much
fun they had learning from their best teachers and are often able to recall what they
were taught in spite of perhaps having little need for what they learnt.
18
Learning Teams
Glasser (1986) states that ‘in a control theory learning–team school, where the
teacher is less of a lecturer and more of a facilitator-manager, there would be few
major discipline problems’ (p. 56). This is because in learning teams, where the
students gain immediate satisfaction, it makes no sense to disrupt. With the teacher
helping student teams to realize that there are better ways to handle frustration than
choosing anger, any students who are temporarily frustrated can in fact be helped.
Glasser also comments on the relevance of the material students are taught.
Teaching can be more ‘empowering’ to the students if they can relate to such
material.
Unlike a sports team where better players are respected and admired by lesser players, classroom achievers are much more likely to be resented than accepted for their academic success. What they gain in power they lose in friendship (Glasser 1986, p. 70).
This philosophy is the basis for the formation of Glasser’s so-called learning teams.
According to Glasser (1986), there are eight basic reasons that learning teams will
succeed in motivating most students:
1. Students gain a sense of belonging by working in teams of two to five. The
teams should be selected by the teacher and comprise students with a range of
abilities.
2. Belonging is the initial motivation for students to work and as they achieve
success those who had not achieved previously sense that knowledge is power
and will want to work.
3. Stronger students find it satisfying to help weaker ones because of the power and
friendship associated with a high-performing team.
4. Weaker students find it satisfying because every little effort helps the team cause.
When they worked alone, a little effort received no reward.
5. Students have less dependence on the teacher. They are encouraged to depend
more on themselves, their own creativity and on other team members. Such a
level of interdependence gives the students both power and freedom.

19
6. Learning teams provide a structure that helps the pupils get past the superficiality
that plagues our schools today. Without this structure, there is less chance for
students to learn enough in depth knowledge to make the important ‘knowledge
is power’ connection.
7. The teams are free to decide how to convince the teacher, other students and
parents that they have learned the material. Teachers encourage teams to offer
evidence (other than tests) that the material has been learned.
8. The teacher is to ensure that all students have a chance of being in a high scoring
team and will change teams on a regular basis. High performing teams tend to
follow high-achieving students. This creates incentive regardless of any team
strength.
Glasser considers that one of the most difficult tasks for teachers trying to learn to
manage learning-teams, or even consider trying them, is to understand the difference
between a modern manager, who is willing to share power and always on the
lookout for better ways to do this, and a traditional manager, who never willingly
gives up power and is always looking for more.
Robert Slavin
Robert Slavin and his co-workers developed STL (Student Team Learning) methods
at the John Hopkins University. Slavin shares the view of other researchers that
students’ peers often drive the change in attitudes from primary school to secondary
school. Slavin (1995, p. 3) stated that:
As students enter adolescence, the peer group becomes all-important, and most students accept their peers’ belief that doing more than is needed to get by is for suckers. Research clearly shows that academic success is not what gets students accepted by their peers, especially in junior high school.
He goes on to comment about the problems of low achievers. ‘After a while, they
learn that academic success is not within their grasp, so they choose other avenues in
which they may develop a positive self image. Many of these other avenues lead to
anti social, delinquent behavior’ (Slavin, 1995, p. 4).

20
Slavin was instrumental in developing STL methods, some of which were based on
the work by DeVries and Edwards (1973), also at Hopkins University. There are
three main concepts central to all STL methods (Slavin, 1995), as follows:
1. Individual accountability. This essentially means that the success of the team
depends on individual learning by all team members. Team members are
encouraged to ensure that they help one another learn and that every team
member is ready for any quiz or assessment that he or she may take without
teammate help.
2. There are equal opportunities for success. Students of varying abilities, high,
average and low achievers, are all encouraged to improve on their own past
performances by setting their own goals. All contributions to the overall team
effort are valued regardless of the size or importance.
3. Team rewards. Teams are able to gain rewards without necessarily competing
for them. Provided that they achieve the set criteria, all, some or none of the
teams can gain the reward.
Team rewards and incentives are still a controversial issue. Johnson and Johnson
(1989) suggest a cautious use of incentives. Meloth and Deering (1994) have shown
that setting the right conditions for cooperative learning can be just as effective as
rewards.
Slavin (1983a; 1983b; 1989) maintained that just getting students to work together is
not enough and that they must have a good reason to take one another seriously. His
research showed that rewards and individual accountability are essential elements of
any effective cooperative learning programme.
Slavin (1995) developed five main STL methods. Three of these methods are of a
general nature and suitable for use in most subjects and levels. The remaining two
are more subject- and grade-specific.
Student Teams – Achievement Division (STAD)
Students are assigned to four- or five-member teams mixed in performance level,
gender, and ethnicity. The teacher presents a lesson on which the students then work
in their teams. The students try to ensure that all team members have mastered the

21
lesson and they then take the test or quiz as individuals without any outside help.
The students’ scores are then compared to their own previous test result averages and
points are then awarded on the basis of how much the students have exceeded their
previous scores. These points are then awarded as the team score. The procedure
usually takes between three and five periods, for the presentation, team practice, and
the test.
The main thrust of STAD is to motivate students to help each other master the skill
presented to them by the teacher. They are encouraged to work together comparing
answers to problems, quizzing each other in preparation for the final quiz or test.
STAD has been used in a huge range of subjects at all levels. It is most appropriate
for topics with well-defined objectives, such as science concepts and mathematical
computations and applications.
Teams-Games-Tournament (TGT)
This was one of the first cooperative learning methods used at John Hopkins
University and was developed originally by DeVries and Edwards (1973). It is
similar to STAD but quizzes or tests are replaced by weekly tournaments where
academic games are played and points are accumulated for their team score. Test
results are used to match students for the next test. Successful students must face a
student of higher ability next time. This process of ‘bumping’ helps ensure equal
opportunities for success. The extra dimension of excitement adds to the fun of this
work while individual accountability is retained.
Jigsaw II
The Jigsaw technique was originally developed by Aronson, Stephen, Blaney, Sikes
and Snapp (1978) and has been adapted by Slavin into Jigsaw II. Here the same
Learning Team structure as in STAD and TGT is retained. Individual students are
assigned a topic of a unit and are then asked to study it in detail and become an
expert. The experts on each of these common topics from all of the teams then meet
and discuss their topic. They then return to their own teams and teach the topic to
their teammates. Finally there is a quiz or test on the total unit including all of the
individual topics learned. Scoring is the same as for STAD. Some units of work
lend themselves more to this than others. The unit needs to be easily sub-divided
into separate topics ensuring an even amount of work for each team member.
22
The remaining Learning Team methods are subject and grade specific. They are:
1. Cooperative Integrated Reading and Composition (CIRC) used in junior reading
and writing.
2. Team Accelerated Instruction, which is used in junior mathematics.
Spencer Kagan
Spencer Kagan, the director of Cooperative Learning in California, devised and
developed a structural approach to cooperative learning. Kagan’s approach has
similar concepts and basic beliefs to the Johnson and Johnson model (see below) and
teachers are able to quite freely integrate the two approaches. In his more recent
work, Kagan (1998) refered to ‘new cooperative learning’ where teachers are
encouraged to use simple cooperative structures and strategies to convert existing
lessons into cooperative ones. This approach is more likely to be readily accepted
than having to devise specific cooperative lessons.
New Zealand researchers Brown and Thomson, both at Victoria University of
Wellington, New Zealand, noted that Kagan’s approach fits well with the nature of
New Zealand teachers. They saw New Zealand teachers as being creative and active,
and prepared to try a range of structures. Brown and Thomson (2000) have observed
the extremely innovative way in which they are able to apply Kagan’s structure to
their regular classroom activities.
Kagan (1992, 1994) maintains that there are six key concepts. Not all cooperative
lessons will use all of them but teachers need to have confidence in all of them if
they are to successfully implement cooperative learning as envisaged by Kagan.
Six Key Concepts
1. Teams
Kagan maintains that there is a clear distinction between a group and a cooperative
learning team. A group can vary in size and does not endure or have much of an
identity while a team will endure and have a strong positive identity. Kagan
maintains that four is the ideal number of team members as this allows for
subdivision into two pairs, which is a bonus for some teamwork, whereas having
more team members makes it harder to keep them all on task. Teams can be formed
23
by a number of methods such as friendships or interests, and randomly formed by a
draw. Teacher assignment to teams is seen as having a number of benefits such as a
guaranteed heterogeneous group, which is seen as important by some researchers.
2. Cooperative Management
Management of the cooperative learning classroom varies a little from that of a
regular classroom. Most of these variations involve issues such as ideal seating of
the teams where all team members can access one another. Noise control and ways
to ensure that all team members are on task are a few of the common issues.
3. Will to Cooperate
There are three ways in which the ‘will to cooperate’ can be created or maintained:
team-building, class-building and reward or suitable recognition structures. Kagan
suggested that group grades can motivate students but some problems can occur. If
the group grade is an average of individual grades then there may be some
resentment towards low scoring students. When a group grade is used to report on
an individual student Kagan sees this as unacceptable since other students have
contributed to the grade.
4. Skill to Cooperate
These are seen as important and can be improved in a number of ways including
modelling, defining, role-playing, observing, reinforcing, processing and specific
social skill practice.
5. Basic Principles
According to Kagan there are four basic underlying principles:
Positive interdependence
All team members must contribute if they are to have success. When one team
member gains they all gain.
Individual accountability
Each individual must be able to perform the task alone.

24
Equal participation
There is relatively equal participation from all team members.
Simultaneous interaction
Most of the team members are active at any one moment.
Kagan refers to these principles with the acronym PIES. The first two principles are
synonymous with those in the Johnson approach. Teachers use these principles when
deciding if a particular structure is suitable for cooperative work.
6. Structures
Structures are essentially how the cooperative lesson is taught and they are content
free.
Kagan divides the teaching and learning process into three main parts as follows:
• A structure is a format for working
• Content is what you work on
• Activities are the result of structures and content brought together.
When combining the curriculum content with a learning activity provided, a teacher
is able to follow Kagan’s PIES principles. Kagan identifies six primary purposes for
the structures as follows:
• Class building
• Team building
• Communication
• Information sharing
• Mastery
• Concept development/thinking skills
Kagan refer to these structures as ‘domains of usefulness’.
David and Roger Johnson
Brothers David and Roger Johnson from the University of Minnesota are often
viewed as modern day ‘heavyweights’ in the field of cooperative learning. Much of

25
their recent work is modelled on their original work (Johnson, Johnson, Holubec, &
Roy, 1984). Since then Johnson and Johnson have established a basic model for
cooperative learning in the classroom. Johnson and Johnson (1987, 1989, 1991,
1994) established the basic idea of three-goal structures and suggested that there is
no reason why these structures cannot be integrated into the same lesson. The goal
structures are competitive, individualistic and cooperative. The following statement
summarises feelings about students and these goal structures.
We believe that all students should be able to compete for fun and enjoyment, work autonomously on their own, and cooperate effectively with others. Just as important, students should know when to compete, when to work on their own, when to cooperate. Johnson and Johnson (1999, p. x).
Johnson and Johnson (1999) go on to define these structured learning goals in a
classroom context where these lessons are structured so that students:
1. engage in a win-lose struggle to see who is best in completing the assignment;
2. work independently to complete the assignment; and
3. work together in small groups, ensuring all members complete the assignment.
Structured learning goals can be thought of as a combination of the following:
• A learning goal is where mastery or competence in a particular subject area
can be demonstrated.
• A goal structure is the way in which students interact to achieve their goals.
They may have either no effect on the success or failure of others or a
positive effect. The students essentially engage in competitive,
individualistic or cooperative efforts.
Group Size
The size of the group may vary according to various factors, Johnson and Johnson
(1999) use the acronym TEAM to help when deciding on the size of a team as
follows:

26
T Time limits
E Students Experience in working in groups
A Students’ Age
M Materials and equipment available
Johnson and Johnson maintained that as a basic rule smaller groups were better and
that many teachers use groups of four, five or six before they have the skills to
competently work in groups of this size. While there is no ideal size, a number
between two and four is seen as sound for most beginning students.
Johnson and Johnson supported such small groups for most activities with the
following comments:
• With additional members of a group the resources required to ensure success
also increases.
• If there is a shorter time available this means that small groups are more
efficient with each member getting more opportunity to contribute.
• There will be more accountability with small groups as there is less
opportunity to ‘hide’.
• With larger groups, other than sheer manageability of the increased number
of possible interactions, there is usually less team unity and fewer
friendships.
• Smaller groups are easier to monitor for any problems that may occur such
as disputes and fair contributions by all group members
Assigning students to groups
Johnson and Johnson (1985, 1999) suggest a variety of ways of group selection all of
which have some appeal to the classroom teacher as follows:
• Random assignment is the easiest teacher-organized method. This involves
simply assigning all students a number, for example, 1 to 10 if there are to be
10 groups; those with the same numbers then form a group. A variation on
this method is to group the students according to their interests such as a
favourite sport; their common interests then form the basis of the groups.
• Random stratified assignment is where the entire class is ranked on some
relevant unit test or pretest and then the groups are formed by firstly selecting

27
the top, lowest and middle students, then the next highest and lowest and
middle until all of the students are assigned to a mixed ability group.
• Teacher selected groups involve the teacher organizing the groups in a way
that he/she thinks is most suitable for all students. Johnson and Johnson have
suggested that their favourite method is to select all of the non achievement-
orientated students and assign each individual to two other supportive and
caring students, which forms the basis of the group.
• Johnson and Johnson do not favour self-selected groupings, as they are often
homogenous for ability, ethnic minority and gender, and which may result in
more off-task behaviour. A suggestion, which may avert some of these
problems, is for students to list the students they would like to work with and
then they are grouped with one from their list plus one other.
Cooperative groups versus other groups
Johnson, Johnson and Holubec (1994b) identify the need for teachers to be aware of
the features of a truly cooperative group and how this awareness can affect any
learning or achievement outcomes of any group. The four main types of cooperative
groups often found in regular classrooms have been identified as follows:
1. The Pseudo-Learning group: These students are grouped to work together but
have no genuine interest to do so. They often believe that they will be ranked as
individuals and hence have no interest in cooperation. They are in fact often
undermining and distrusting one another and would perform better working as
individuals.
2. The traditional classroom learning group: Students are grouped and realise that
they need to work together but assignments are structured in such a way that
little cooperative work is really required. They believe that they will be assessed
and rewarded as individuals, so helping and sharing of each other’s information
is minimal. There are ‘free riders’ that want to exploit the more conscientious
group members who subsequently feel less inclined to put in their usual effort
and in fact would probably be better off working alone.
3. The cooperative learning group: Students are again grouped and are happy to
work together. They appreciate that their group’s success depends upon the

28
effort of all members. Johnson, Johnson and Holubec (1994b) suggest that there
are five main features of such a group.
• They all realize that they can achieve better with a good combined effort
than as individuals and that they ‘sink or swim together, and if one fails they
all fail’ (p. 6)
• They all know that they have individual accountability for producing work of
a high standard to realize their group’s potential.
• They will work face-to-face producing good work together assisting one
another to achieve through active encouragement, helping and sharing.
• They learn the appropriate skills, which enable them to reach their goals
through appropriate teamwork and responsibility.
• They continually assess how they are progressing towards their goals
through working together.
‘As a result, the group is more than the sum of its parts, and all students perform
better academically than they would if they had worked alone’
(p. 7).
4. The high performance group: this group is outstanding and rare, easily
achieving the standards of a full cooperative group but they have hugely
increased commitment to one another and to the group’s success. As a result
they exceed expectations and enjoy themselves.
Skills in Cooperative Group Work: - Assigning Roles
Johnson and Johnson (1994) insisted that if groups are to perform to their potential
then members must learn the essential skills of cooperative group work. Such skills
may be achieved by assigning prescribed roles that group members can expect from
one another and which will be expected of them.
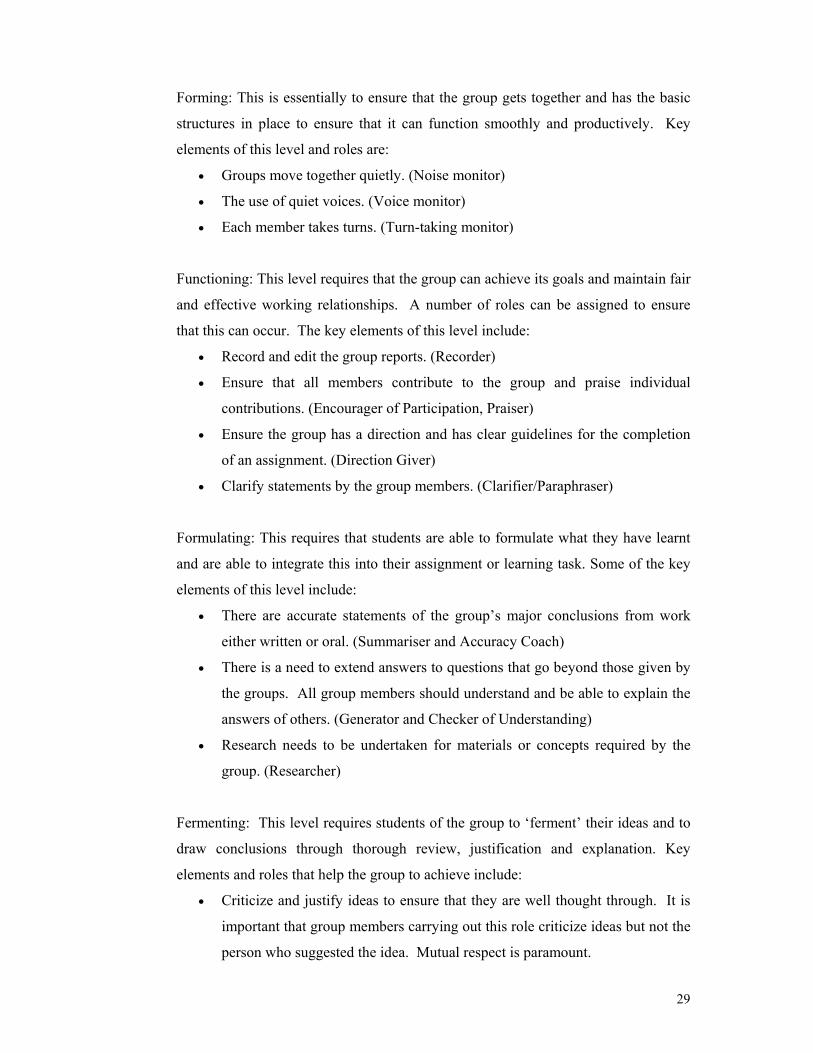
There are four levels of group functioning and the roles of group members are
changed to suit both the skills of the group and according to their age. The four
levels of group functioning are forming, functioning, formulating and fermenting.
The roles assigned include adding various monitors to ensure that the group carries
the key elements of each level.
29
Forming: This is essentially to ensure that the group gets together and has the basic
structures in place to ensure that it can function smoothly and productively. Key
elements of this level and roles are:
• Groups move together quietly. (Noise monitor)
• The use of quiet voices. (Voice monitor)
• Each member takes turns. (Turn-taking monitor)
Functioning: This level requires that the group can achieve its goals and maintain fair
and effective working relationships. A number of roles can be assigned to ensure
that this can occur. The key elements of this level include:
• Record and edit the group reports. (Recorder)
• Ensure that all members contribute to the group and praise individual
contributions. (Encourager of Participation, Praiser)
• Ensure the group has a direction and has clear guidelines for the completion
of an assignment. (Direction Giver)
• Clarify statements by the group members. (Clarifier/Paraphraser)
Formulating: This requires that students are able to formulate what they have learnt
and are able to integrate this into their assignment or learning task. Some of the key
elements of this level include:
• There are accurate statements of the group’s major conclusions from work
either written or oral. (Summariser and Accuracy Coach)
• There is a need to extend answers to questions that go beyond those given by
the groups. All group members should understand and be able to explain the
answers of others. (Generator and Checker of Understanding)
• Research needs to be undertaken for materials or concepts required by the
group. (Researcher)
Fermenting: This level requires students of the group to ‘ferment’ their ideas and to
draw conclusions through thorough review, justification and explanation. Key
elements and roles that help the group to achieve include:
• Criticize and justify ideas to ensure that they are well thought through. It is
important that group members carrying out this role criticize ideas but not the
person who suggested the idea. Mutual respect is paramount.

30
• Differentiate between different group members’ ideas ensuring that everyone
is clear on differences between various viewpoints.
• Probe and extend through in-depth questioning leading to deeper
understanding and obtaining more information to achieve this.
• Integrate the ideas and opinions into single statements that the group can
agree on and ensure that such statements match the requirements of the
assignment or task set.
Johnson and Johnson (1999) suggest that higher-level roles such as formulating and
fermenting do not occur naturally within a group but will develop over time. It is
often better to introduce these roles later.
The Five Basics of Cooperative Learning
Johnson and Johnson (1999) maintain that many educators fail to create effective
cooperative learning groups by simply listing a few of the characteristics of good
group work such as ‘work together’ or ‘be a team’. They argue that effective
cooperative learning ‘is a regime that if followed rigorously, will produce the
conditions that are required for cooperative learning’ (p. 75).
Brown and Thomson (2000) in their review of the Johnson’s work coined the
acronym PIGSF (Pigs Fly) to list the basics of cooperative learning.
1. Positive interdependence
2. Individual accountability
3. Group processing
4. Small group and interpersonal skills
5. Face to face promotive interaction
1. Positive interdependence
This is essential if a group is to succeed and the quote from Alexandre Dumas, cited
by Johnson and Johnson (1999), stated ‘All for one and one for all’ as one of the
keys to the success of a cooperative learning team. The philosophy of ‘sink or swim
together’ (p. 5) requires a suitable structure in place to enable the group to properly
develop these skills. Three steps have been put in place in order to accomplish
something beyond individual success.

31
The first step is assigning clear measurable tasks so that all group members know
what is expected of them and that they must each contribute to the tasks if the group
is to succeed. It is critical to understand that effort is required from all members for
the group to succeed, and that there are no ‘free riders’.
The second step is to structure positive goal interdependence in such a way as to
ensure that all group members know that they cannot succeed unless all group
members of their group succeed. The group members must be united in their
aspiration towards a common goal, and need to ensure that they all learn the assigned
material. Some of the indicators used to ensure that this occurs include monitoring
their relative scores as individuals with time; they should be improving and above a
set standard. The sum of individual scores within the group should be above
specified criteria and members must successfully complete a single set of answers for
the group if that is required.
The third step is supplementing positive goal interdependence with other types of
positive interdependence such as tangible rewards when a task is successfully
completed. The learning of each member of a group needs to be observed,
recognized and rewarded. Positive rewards can include celebration of their joint
success when all members reach a set criterion, or the addition of bonus points to the
scores of all members when the group reaches set criterion. Non-academic rewards
such as time out, stickers and food, are also options. Another suggestion is to assign
a single grade for the combined efforts of the group, but Johnson and Johnson (1999)
recommend caution when using this option until all students and parents are familiar
with cooperative learning.
Johnson and Johnson (1999) have found a range of teaching strategies that encourage
various types of positive interdependence. Some of these strategies include:
Positive identity interdependence: This is where a mutual identity can be established
through a team name, motto, icon or song. Brown and Thomson (2000) go a step
further with a range of suggestions on how a real team can be established (see the
section on Brown and Thomson below).
32
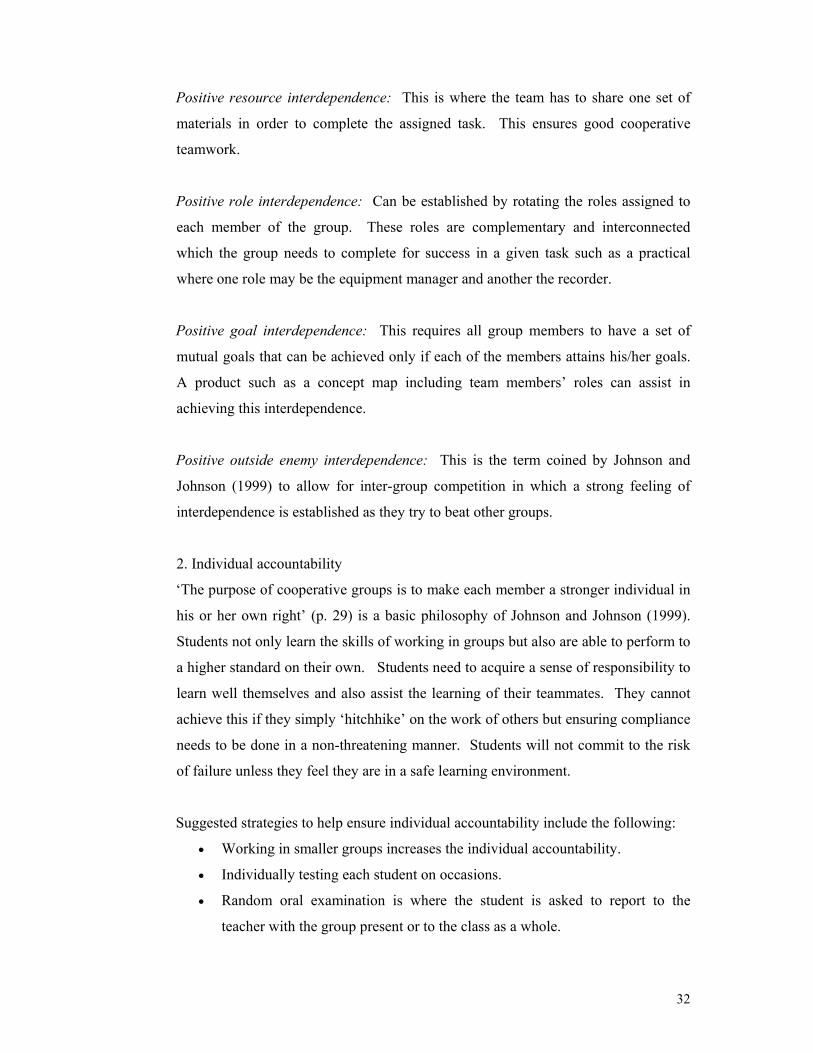
Positive resource interdependence: This is where the team has to share one set of
materials in order to complete the assigned task. This ensures good cooperative
teamwork.
Positive role interdependence: Can be established by rotating the roles assigned to
each member of the group. These roles are complementary and interconnected
which the group needs to complete for success in a given task such as a practical
where one role may be the equipment manager and another the recorder.
Positive goal interdependence: This requires all group members to have a set of
mutual goals that can be achieved only if each of the members attains his/her goals.
A product such as a concept map including team members’ roles can assist in
achieving this interdependence.
Positive outside enemy interdependence: This is the term coined by Johnson and
Johnson (1999) to allow for inter-group competition in which a strong feeling of
interdependence is established as they try to beat other groups.
2. Individual accountability
‘The purpose of cooperative groups is to make each member a stronger individual in
his or her own right’ (p. 29) is a basic philosophy of Johnson and Johnson (1999).
Students not only learn the skills of working in groups but also are able to perform to
a higher standard on their own. Students need to acquire a sense of responsibility to
learn well themselves and also assist the learning of their teammates. They cannot
achieve this if they simply ‘hitchhike’ on the work of others but ensuring compliance
needs to be done in a non-threatening manner. Students will not commit to the risk
of failure unless they feel they are in a safe learning environment.
Suggested strategies to help ensure individual accountability include the following:
• Working in smaller groups increases the individual accountability.
• Individually testing each student on occasions.
• Random oral examination is where the student is asked to report to the
teacher with the group present or to the class as a whole.

33
• Observing each group to record the frequency with which each member
contributes to his or her group.
• Assign a role of checker who asks other group members for an explanation of
the group answers.
• Ask students to teach others what they have learnt (simultaneous learning).
3. Group processing
Groups are to reflect on their own progress and analyse their functioning in a
particular group session. The purpose of group processing is to clarify and improve
the effectiveness of members’ contributions to the collaborative efforts to achieve
their group’s goals. Johnson and Johnson (1999) recommend that some student-
based starter ideas be provided to help them with the reflection process. These
include specifying aspects their group did well and others that they could improve
on, the need to reflect on things that each member may have done to improve the
group effectiveness, and the process of self-assessment by individuals on how they
have contributed in a particular skill area such as encouraging others and telling
others how their contributions are appreciated.
There are five steps outlined below on how to structure group processing in order to
continuously improve the quality of the groups task work and teamwork as suggested
by Johnson, Johnson, and Holubec, (1993). The first step is systematic observation
of the students at work, which allows an insight into how the groups and their
members think and operate. The degree of understanding of major concepts and
strategies being learned as a group, along with the ability of members to work
effectively together, are useful observations in terms of improving their cooperative
learning. Such observations can be made by the teacher or by students appointed on
a rotational basis. A simple checklist will help students to establish patterns of
interaction and contributions amongst the group.
The second step is to provide feedback on the process by which the group does its
work. Using checklists of data collected to ensure that the contributions of all
members are recognised can provide such feedback. Feedback helps to establish
good working relationships and facilitates the learning of cooperative skills.

34
Reflection is an essential part of self-evaluation and a key to maintaining a high
standard of work and cooperation among the group members.
The third step is for the members to set goals for themselves and their groups on how
to improve the effectiveness of the group. Goal setting should come from
suggestions that the group decides to adopt.
The fourth step is to measure how the whole class is performing. This can be a
simple summary near the end of a lesson by the teacher or from student observers
within each of the groups.
The fifth is the celebration of success by both individual groups and the whole class.
Success has a big impact on how students perform in later activities. Reflection is
very important and can be best summarized by a quote from the ex-coaching director
of the New Zealand Rugby Union, Bill Freeman who said, ‘feedback is the breakfast
food of champions’ (NZRFU rugby coaching conference Wellington, New Zealand,
1993).
4. Small group and interpersonal skills
Students need to be taught the cooperative skills necessary to succeed. Simply
placing unskilled students into a group does not guarantee success. Students need to
learn the academic subject matter in their group along with the skills of working in
an effective team. They will not learn academic material if their teamwork is inept.
The need to engage in task work and teamwork simultaneously requires that
members must know and trust each other, communicate succinctly, and be able to
resolve any conflicts in a constructive manner.
5. Face-to-face promotive interaction
The physical environment provided for the students is important to help the group to
succeed. Students need to be seated to ensure that they can establish eye contact
with one another while working. Their meetings need to be appropriately scheduled.
The progress of the group can be easily observed in this way. It is easy to observe if
students are encouraging one another and reviewing their ideas. Oral summaries by
the students of their group’s work should be used along with evaluation and

35
challenges if required. The good groups will be seen to lean towards each other and
concentrate on what is being said.
Reducing problem behaviours
When a group member is not contributing or exhibiting negative influences such as
off task behaviour and disrupting other members, Johnson and Johnson (1999) have
a range of simple corrective strategies. These include structuring the task to ensure
that it cannot be completed or a reward is withheld if all members do not contribute.
Jigsaw tasks, reward structure and the careful assigning of key roles for group
members all work well.
Summary
Johnson and Johnson (1987, 1989, 1991, 1994, 1999) are regarded as leaders in the
field of cooperative learning and they often provide analogies with the key elements
of successful sports teams where members will often exhibit loyalty, commitment
and effort well beyond what would be expected from an individual acting alone.
Playing on in the face of serious injury in a key rugby or basketball game are
common examples. They establish structures and conditions where a successful
cooperative team is most likely to succeed as opposed to a pseudo-learning group
where students are simply put into groups to perform various tasks. It is
acknowledged that while high performance cooperative groups are rare, educators
can move their groups towards this goal through a well-structured cooperative
learning programme.
Elizabeth Cohen
Elizabeth Cohen (1986) focuses mainly on how a cooperative group operates. She
states that if the group is to work to its potential, a group needs to work within a
well-established structure, and therefore should be more effective than individuals
working alone. Most students will have had limited exposure to effective cooperative
group work and as a result need to be taught this. Cohen used the concept of a norm,
which is simply a rule for how one ought to behave. When the group members
accept and display evidence that they are operating to a suitable set of norms the
norms have become internalised.
36
Cohen emphasises the need to ensure that all students in a group participate equally,
including less successful students (usually of low status within the classroom) who
often struggle to contribute to discussions and learn less. High-status students tend
to dominate group discussions. Groups need to review their own performance for the
contribution of individuals within the groups. Are group members all talking,
listening and asking questions about other members’ ideas or suggestions? Cohen
(1984) found that students who talked and worked together more learned more from
the curriculum than those who talked and worked together less.
Cohen (1994) later establishes strategies to help students of differing ability to
become integrated into the group (referred to as multiple ability groups). Such
integration is achieved mainly through carefully designing tasks and assigning
expectations to each student according to ability. Providing taylor-made tasks for
them gives all members competence to achieve. Cohen considered that there are two
major patterns of working together, namely, pure cooperation and collegial model
and within these basic structures there are some variations that help them to become
more effective.
Pure cooperation
This requires students to come to a consensus on the group’s response to a question.
Students must harmonise and compromise while working closely together to achieve
the task. Consequently, group members may have to give up some of their ideas.
Cohen suggested that because the group may have to deal with emotions and
conflicts, which can hurt feelings, other methods are used to modify this model. One
such modification is to appoint a facilitator whose role is to ensure that the task is
completed and everyone participates without anyone’s feelings being hurt.
Collegial model
This model requires students to assist one another while working on the same task.
At the basic level students will assist each other with skills such as comprehension,
reading and problem solving. At a higher level, students who understand more
difficult problems get to explain and teach others in their group. These more able
students are also often able to convince others who may normally think that even

37
their best effort will lead to failure. Cohen (1986) sees this type of peer motivation
as an important element of the collegial model.
Students can and do teach each other in the collegial model. This is undoubtedly its major advantage over the conventional method of requiring individuals to work alone. Peer explanations are often excellent, and those who explain often show intellectual gains as a consequence (p. 56).
Cohen points out that while there may be drawbacks in the group receiving a group
grade for group efforts, many teachers feel that the group members may lack the
motivation required to perform to their best. It is also unwise to evaluate individual
student’s contributions to a group product because factors beyond the individual
student’s control may have contributed to this. Failure of an individual should be
viewed as a failure of a group-work technique.
Cohen also advocates the use of competition between teams as an additional
motivational factor while Slavin (1995) advocates that individual member marks in
an examination should be added to make up the group score. Essentially both Cohen
and Slavin advocated the use of competition between groups as a motivational tool
for individuals within each group.
Brown and Thomson
Don Brown has vast experience in the fields of psychology and education in New
Zealand, whereas Charlotte Thomson has a background as a teacher and a
psychologist. Both are involved in the teacher development programme at Victoria
University of Wellington.
Skills and the New Zealand curriculum
Brown and Thomson in New Zealand place a high emphasis on teaching of the
relevant skills that enable students to operate effectively in a cooperative group.
Much of their work (Brown and Thompson, 2000) is based on the structure set up by
Johnson and Johnson (1987, 1989, 1991, 1999), and clearly acknowledged as very
influential. Brown and Thomson (2000) also refer to the work of Kagan (1994),
which states that students must have both the will and the skill to work effectively in
38
a group. After careful examination the essential skills listed in the New Zealand
Curriculum Framework (NZCF) document (Ministry of Education, 1993) Brown and
Thomson see that while the primary school sector often addresses the skills of
teamwork and interpersonal skills this is not always the case in the secondary sector
where many teachers see their responsibility as being subject-based only. Brown and
Thomson examine both international and national trends in the development of the
modern curriculum where there is a trend to integrate skills, attitudes and values
along with ‘deep’ thinking and learning processes.
The NZCF recognizes that competence and achievement are strongly associated with
attitudes to learning and there are also frequent references to equity, life-long
learning skills, cooperation and achievement. It is argued that many of these
attitudes and skills, along with individual responsibility, are difficult to learn
effectively in the competitive, individualistic environment typically encountered in
New Zealand secondary schools.
Whereas New Zealand maybe viewed as multicultural, its bicultural foundations are
seen as very important in our education. Brown and Thomson refer to the work by
Glyn and Bishop (1995), which suggests that Māori-preferred teaching and learning
styles, along with cultural practices, are largely supported by cooperative learning
strategies. The adoption of such styles and practices could be advantageous to both
Māori and other students.
In some of his earlier work, Brown (1992) was able to establish that many New
Zealand secondary school students value the help they receive from their peers.
After a six month trial in some New Zealand secondary schools one of the students
working in cooperative groups made the statement: ‘Other people were able to help
me to better understand the topic. It helped me also to be teaching other people
because it helps me to remember a large amount of work (p. 19)’.
Brown and Thomson (2000) maintain that all students’ thinking is stimulated by
cooperative learning processes, supporting studies by Johnson and Johnson (1992)
and Cohen (1994). That some students are able to explain concepts and ideas to
students of lower ability is mutually advantageous.
39
Establishing effective cooperative groups
Brown and Thomson (2000) suggest that time, thought and effort must be invested in
the students to get them to work cooperatively. The needs for successful cooperative
work have already been described in detail; Brown and Thomson list the following
four common threads.
1. Build positive relationships and a sense of belonging to the group.
2. Encourage mutual support for each other in their learning.
3. Ensure that all students’ efforts are seen to matter through empowerment and the
fostering of self-responsibility.
4. Learning needs to be an enjoyable experience with an element of having fun.
Some aspects of an effective cooperative classroom, which apply throughout the
entire room, include involving students in the establishment of class rules and norms
for all to operate under. The students then ‘own the rules’. Once the link between
rights and responsibility is established the class should forge ahead.
Individual group establishment
Brown and Thomson (2000) outline three key aspects when initially establishing
their cooperative groups as follows:
1. The type of group (based on the work of Johnson and Johnson, 1994) where the
group can be:
• Informal: This is used for quick and short-term work or tasks, possibly for
less than one lesson.
• Formal/generic groups: This type of grouping is the most common where
students get the opportunity to work on longer-term tasks or projects; there is
often a demand for higher-level thinking.
• Base Groups: This is like a long-term home for the students or more like a
family, which can endure the entire year.
2. There are also three recommended methods of assigning students to their groups
(Brown and Thomson, 2000)
• Random selection: This is seen as a fun way to establish the teams (as noted
earlier). Such a selection process is recommended for use at the beginning of
the year when students can get to know other students in the class.
40
• Student Selection: This is really social grouping in that students chose their
own group. Brown and Thomson (2000) suggest that caution is needed when
using this method of group selection. They suggest that there can be more
off-task behaviour and at times some students are left out and feel ‘loners’.
• Teacher Selection: The teacher is in charge of this type of group with a
number of options open to them such as whether they are going to be of
mixed ability and how the high achieving students fit in. Heterogeneous
groups are generally considered the best for learning.
4. The size of the group is important with a general suggestion of Brown and
Thomson (2000) that ‘four and no more’ (p. 67) is a good rule of thumb.
Equipment supply and the relative experience of the students also need to be
taken into account. One of the advantages of starting with pairs is that they
can be doubled up later to make fours.
Teaching the Skills
Brown and Thomson (2000) follow the paradigm that teaching relevant skills and
applying them is an integral part of successful cooperative learning. This is a view
shared to a large extent by Johnson and Johnson (1987, 1989, 1991, 1999), and
Kagan (1994), who maintain that the best place to teach teamwork skills is in the
context of authentic teamwork activities. The teacher needs to know which skills to
teach and how to teach them.
Brown and Thomson break down teamwork skills into task skills and working
relationship skills.
Task Skills
Task skills are focused on the content of the task such as writing reports, planning
and analyzing data. Other task skills include the generation and elaboration of ideas,
an ability to remain focused on the task, time management, an ability to follow
instructions, and continued planning and reviewing of the process. Groups
exhibiting these skills are invariably successful in their outcomes.

41
Working Relationship Skills
These skills are focused on the building of positive relationships within the group in
an atmosphere of mutual support and care. Examples of working relationship skills
include acknowledging the contribution of individuals, checking for agreement or
disagreement in a non-confrontational manner, encouragement and appreciation of
other team members.
Stages in Teaching the Skills
Brown and Thomson (2000) believe that the teaching of cooperative skills is no
different from the teaching of other skills to students. The main steps to achieve this
are:
Step 1. Establish the need for the skill. Teachers and students need to be aware of
the skills required for successful cooperative group work. One of the most effective
methods found by teachers for establishing such a need is to undertake some
cooperative group work and then to reflect as a group or even as a class on its
success or otherwise. Identifying the skills required for a group to function
successfully is often established by the students themselves and hence it could be
argued, gives them ‘ownership’ of these skills and thus a greater desire to acquire
them.
Step 2. Define the skill. Students need to be clear as to which specific skill is being
taught, for example, ‘encouraging participation’. There are many activities and
methods that can be used to help students define various skills.
Step 3. Guided practice. Teachers need to provide opportunities for groups to
practice skills, and then observe and monitor each of the groups in action ensuring
that they get appropriate and positive feedback.
Step 4. Generalised application of the skill. Students need to given opportunities to
apply the skills learnt in a wide range of contexts. Student reflection and
understanding of other potential applications of the skills are also important.

42
Brown and Thomson also suggest that the use of roles in their groups is also helpful
in helping them take responsibility for their own group management. Roles such as
timekeeper, on-task monitor, recorder and organiser are frequently used over the full
range of student ages.
2.2.3 Overview of cooperative group work
While the concept of cooperative group work may be thousands of years old there
has been a considerable amount of research done within the last century in the so-
called ‘modern era’. While there are a number of differences in the establishment
and organization of cooperative groups between the various researchers there are a
number of common elements, which include:
1. The need for the group to enjoy learning and have fun working together with
a real sense of belonging.
2. The need for the group to have achievable and measurable goals.
3. The need to work cooperatively together in order to achieve higher levels
than would be achieved as individuals.
4. The need to try to ensure that all members of the group contribute to the
group and are individually accountable.
5. The need to ensure that there are suitable structures and tasks in place to
assist students in the development of the appropriate cooperative skills
required for group success.
Many of the tasks and structures suggested by various researchers, while successful
require a considerable input of teacher time and expertise, which may present some
difficulties for the modern secondary school teacher.
The following section looks at the development of the concept of attitudes and how
they may in fact be measured. This is essential if there is in fact a link between
successful cooperative group work and improved attitudes towards science.

43
2.3 ATTITUDES
2.3.1 The Evolution of the Modern Concept of Attitudes
Shrigley, Koballa and Simpson (1988) suggest that Fleming (1967) provided the
most significant study about attitude as a modern concept. Fleming (1967) points out
that around the turn of the 18th century artists used the term attitude largely to
describe the posture of a stationary figure and later actors and dancers performing.
This sense is still retained in a secondary role today where the term attitude is used to
describe events such as an aircraft in flight. Fleming credited Charles Darwin as
being the first to associate emotion with the concept of attitude when he used it to
describe the emotional readiness of animals in a state of crisis. Shrigley, Koballa and
Simpson use the work by Thomas and Znaniecki (1918) to explain the attitudes and
morale of the early Polish immigrant farmers in the United Sates. Thomas and
Znaniecki (1918) tried to understand unexpected results in productivity that arose
when the physical demands of workers and work conditions were changed. They
eventually invoked attitudinal and psychological explanations when physical reasons
such as fatigue did not sufficiently explain production figures in the industry.
Fleming (1967) claims that it was primarily Thurstone (1928), with his manifesto
‘Attitudes can be measured’, who ensured that attitude would remain because it
could now be quantified. Shrigley (1983) notes that Likert who followed Thurstone,
simplified the process with an item analysis technique, which allowed the data of
respondents of statements to also serve as measures of validation (Likert, 1932).
Despite the term ‘attitude’ having very popular current usage, the meanings given to
it can vary considerably (Koballa, 1988). Its widest meaning includes many
educational objectives and outcomes other than those that are essentially cognitive or
physical (Mathews, 1974). Shrigley (1983) maintains that attitude is central to
human activity yet education researchers have had considerable difficulty
understanding it, because it often appears inconsistent and even fickle. Some are
tempted to abandon it or even deny its existence. Shrigley stated that it is generally
agreed that attitude is not innate, but learned as part of culture. Shrigley (1988)

44
suggested that feelings are central to attitudes towards science or toward a particular
scientific concept or phenomenon. The three parts of the attitude trilogy are
affection, cognition, and conation.
Some of the critical differences in the reactions of one child with those of another to
their schools expectations are often a function of their intelligence and differences in
their preferences, attitudes, drives, needs, interests and values. Often a student may
exhibit a disinterest in a particular subject and as a result be viewed as a poor student
while in another subject in which they are interested, may be seen as intelligent. A
positive attitude towards a subject may not necessarily equate to an interest though
an attitude implies a disposition to react in a particular manner towards that subject.
Getzels (1969) maintains that it is our interests rather than our attitudes that drive us.
The attitude ‘behaviour-link’ appeals to many science education researchers but there
is an element of uncertainty surrounding this link in the eyes of some researchers.
Shrigley, et al (1988) suggest that ‘the relationship of attitude and behaviour is
probably correlational rather than literal.’ (p. 676)
Education research has focused attention recently on affective outcomes particularly
attitudes. This attention has arisen because affective variables are seen to be just as
important as cognitive variables in influencing, and possibly predicting, learning and
other outcomes (Koballa, 1988). Shrigley, et al (1988) suggest that there is much
confusion surrounding the fundamental principles of attitudes. Some of this
confusion involves mixing concepts of attitude with belief and value with opinion.
Shrigley (1983) derives the following composite definitions of the key elements to
the attitude concept:
1. Attitudes are learned; cognition is involved.
2. Attitudes predict behaviour.
3. The social influences of others affect attitudes.
4. Attitudes are readiness to respond.
5. Attitudes are evaluative; emotion is involved. (p. 438)

45
2.3.2 The Development of Instruments for the Measurement of Attitudes
In a study to revise and validate a Likert (1932) science attitude scale for young
scientists by researchers, Misiti, Shrigley, and Hanson, (1991) comment that ‘during
the middle school years attitudes are formed that influence science course selections
in the high school and college’ (p. 525). Following on from this, if there is not a
positive student attitude towards science then career choices of the best students
probably will not include the sciences and engineering. Consequently, development
and validation of attitude measuring instruments needs to be maintained if research
into attitudes is to be continued. According to Germann (1988) attitude researchers
must clearly define the construct being investigated and its place within the larger
theoretical framework. They must then demonstrate the reliability and validity of the
instruments used to measure it. This has not always been the case and there are
difficulties comparing findings that use different terminology but measure similar
attributes or, conversely, using similar terminology but measuring different attributes
(Brophy & Good, 1986). Fraser (1978c) points out that there are three important
problems associated with several instruments to assess attitudes to science. These
include low statistical reliability, a lack of economy of items, and often conceptually
distinct attitude dimensions being combined into a single scale and thus presenting a
confusing mixture of variables.
Attitudes towards the science disciplines have been assessed since the 1960s and one
of the earliest and frequently quoted examples was a study by Perrodin (1966).
Perrodin (1966) examined over 500 fourth, sixth and eighth-grade students in the
United States. His assessment was in the form of open-ended statements such as
‘The study of science is more important than…’. The students completed these
questionnaires and then the data were summarised and categorized by Perrodin to
make final qualitative judgments.
Moore and Sutman (1970) developed and field-tested the Scientific Attitude
Inventory (SAI) for use with secondary school students to test for intellectual and
emotional attitudes towards science. The SAI comprises 60 items ranging from
knowledge of laws or theories of science to feelings about being a scientist. After
investigating 30 studies of the SAI, Munby (1983) questioned its validity, noting that

46
it was the most popular attitude instrument at that time. Baker (1985) described the
SAI as having two scales, one positive and one negative. He calculated the total
attitude score by subtracting the negative scale from the positive. Other studies using
the SAI did not report the method of calculation nor separate scales (Munby, 1982).
Moore and Foy (1997) revised SAI but did not report any changes to these
conceptual difficulties. Thus, doubts of validity continue to be raised (Munby, 1997).
Many instruments for the measurement of attitudes have now been developed, with
the majority following Likert’s (1932) style that sums rating scales (Gardner, 1975a,
1975b). Fisher’s (1973) 20-item Likert scale for junior high students was developed
using a jury of science curriculum experts to generate area of interest within the
attitude object. Statements were then written to match each subcomponent. This
instrument had good correlations, reliability and internal consistency. The Likert
scale has a different point scale for positive and negative statements reflecting their
degree of agreement with that statement. It should be noted that an important feature
of the Likert scale is that their intention is often obvious to respondents who could
fake the responses to reflect more positive or negative responses. This is why it is
important that the students know that there are no ‘marks’ for this and their response
sheets are anonymous if possible. The Likert scale is presented in Table 2.1.
Table 2.1. The Likert Scale
Statement Strongly Agree
Agree Undecided Disagree Strongly Disagree
Negative Statement
1 point 2 3 4 5
Positive Statement
5 points 4 3 2 1
Klopfer (1976) alleviated the semantic problems caused by the multiple meanings
attached to the term ‘attitude’ to science. Klopfer classified six categories of
conceptually different attitudinal aims (Shulman & Tamir, 1972).
Development of the Test of Science Related Attitudes (TOSRA)
The above format was chosen by Fraser (1977a, 1977b, 1977c, 1978a, 1978b) in the
development of TOSRA which itself is based on the affective part of Klopfer’s

47
(1971) taxonomic classification of objects in science. Fraser distinguished seven
distinct school science-related attitude scales following Klopfer (1976). The
relationship between Klopfer’s classification and Fraser’s TOSRA scale is illustrated
in Table 2.2.
Table 2.2
Fraser’s Scales (TOSRA) and Klopfer’s Classification
Scale name (TOSRA) Klopfer (1971) classification
Social Implications of Science Normality of Scientists
H.1 Manifestation of favorable attitudes towards science and scientists
Attitude to Scientific Inquiry H.2 Acceptance of scientific enquiry as a way of thought Adoption of Scientific Attitudes
H.3 Adoption of scientific attitudes
Enjoyment of Science Lessons H.4 Enjoyment of science learning experiences Leisure Interest in Science H.5 Development of interest in science and science related
activities Career Interest in Science H.6 Development of interest in pursuing a career in
science
Fraser (1978b) supports his scales by noting that Klopfer’s ‘Manifestation of
Favourable Attitudes Towards Science and Scientists’ were in fact two distinct sub-
categories with some related attitudes. Fraser included the ‘Social Implications of
Science’ because it was supported in the literature (Zoller and Watson, 1974; Fraser,
1977a) as being important in that it measured attitude towards the social benefits and
problems often associated with scientific progress. The Normality of Scientists scale
was linked to Klopfer’s manifestation of favourable attitudes towards scientists
because the students almost invariably depict scientists as eccentrics rather than
normal people (Mead & Metraux, 1957; Fraser, 1977b). Klopfer’s H2 scale is
directly reflected in Fraser’s Attitude to Scientific Inquiry scale.
Cohen (1971) suggests that Australian scientists see the Adoption of Scientific
Attitudes as very important in their work as scientists hence this scale is included by
Fraser in the TOSRA. The final three scales in the TOSRA, Enjoyment of Science
Lessons, Leisure Interest in Science, and Career Interest in Science, are directly
related to those of Klopfer H4, H5, and H6 (Table 2.2). Fraser then selected a pool
of items from groups of science teachers and experts in educational measurement for
each of the seven scales. This pool generated a 14-item version of TOSRA, which

48
was, then field-tested and reduced to 10 items per scale after statistical item analysis
outlined in Fraser (1977c).
Other researchers have constructed well-designed attitude scales. Simpson and
Oliver (1985) produced a seven-item Likert scale that measured the attitudes of
students in grades 6-10. Wareing (1982) developed a 50-item scale for students in
grades 4-12 and included validity tests involving a jury process and a readability test.
Misiti, Shrigley and Hansen (1991) revised and validated an older unpublished Likert
science attitude scale for young students. They made comments about juries used
and the readability of items. They held informal discussions with sixth graders and
identified words that expressed positive and negative feelings towards science.
Positive words were cool, radical, decent, far out, out of sight, gnarly and bad.
Words denoting negative feelings were: weird, dumb, a drag, boring, lame and
retarded. These terms may change over time and location but, along with readability,
are very important in the development of an instrument for the measurement of
science-related attitudes.
There are some contradictory results from various studies on science attitudes.
These may simply be due to measurement of different concepts. Attitude differences
were often noted for girls and boys (Simpson & Oliver, 1990). Of 120 eighth grade
school students, females were reported to have had a more positive attitude toward
science than males (Baker, 1985). In an investigation using the SAI, Willson &
Lawrenz, (1980) reported, ‘increased positive student attitude toward science’ and
‘attitude toward the learning environment’. These are both vague terms and difficult
to compare with other studies, so results of these studies should be interpreted with
caution.
The Enjoyment of Science Lessons scale (see Appendix C) from Fraser (1981a) has
often been modified by some researchers and used as the basis for scales to assess
student attitudes. A recent example of this is the 7-item scale on Attitude To This
Class (Table 2.3). This scale has been used by Fisher, Rickards, Goh, & Wong
(1997a, 1997b), Henderson, Fisher, & Fraser (1994, 1995, 2000), Henderson & Reid
(2000), Kim, Fisher, & Fraser (1999, 2000), and Yaxley, Fisher & Fraser (2000).

49
Table 2.3
Items in the ‘Attitude to this Class’ (Enjoyment of Science Lessons) Scale (Fraser, 1981a)
1.
I look forward to this class
2. I feel confused in this class 3. The class is a waste of time 4. This class is among the most interesting at this school 5. The work is hard in this class 6. The thought of this class makes me tense 7. I enjoy this class
The Enjoyment of Science Lessons scale (also named Attitude to This Class) has
been widely used in its own right and in statistically significant associations with
other classroom environment instruments such as the Questionnaire for Teacher
Interaction (QTI) in many studies including the original Dutch study by Brekelmans,
Wubbels and Créton (1990).
2.3.3 The Changing Attitudes of Boys and Girls Towards Science
Students often experience substantial changes in their learning environment between
Year 6 and 10. This includes late primary (often intermediate schools in New
Zealand) and the early secondary school systems. This time also marks a period of
significant other changes in the students’ lives, which may also influence their
attitudes. Whereas there have not been many studies which have focused entirely on
this transition there have been a number of significant studies.
Gender, age and changes in attitudes
In a comprehensive study of three state schools in Hawaii, Greenfield (1997)
concludes that ‘younger students expressed more positive attitudes towards science
than did older students’ (p. 268). His research involved the use of observation in
categories such as off-task, on-task or misbehaving along with the use of detailed
surveys, which were based on three short questionnaires. The first questionnaire the
Student Attitude Questionnaire developed by Simpson and Troost (1982). This
instrument assessed student attitudes about various aspects towards science in school
and included several subscales such as attitude towards curriculum, and science

50
anxiety. The second and third surveys (Mason & Kahle, 1988) included the
Perceptions of Science and Scientists Survey and the Experiences Survey in which
the students identified the type and frequency of science activities in which they have
participated outside school. The main points were that whereas boys and girls had
similar attitudes toward science younger students were more positive than older ones.
The girls’ attitudes, however, did decline more over the years than did those of the
boys. There was little difference in their perceptions of scientists and careers in
science except that the boys were more likely to view science as a masculine career
requiring a high level of intelligence. Boys suggested that they had more experience
in science related activities outside the classroom and within the classroom there was
a perception that boys received more attention than girls but girls still sought it as
often as the boys. There was also a suggestion that carefully constructed laboratory
work can be effective in ensuring that girls are as active during practical work as
boys.
Changes in attitudes during the transition from primary to secondary school
Ferguson and Fraser (1998) examined the effect of gender and school size on the
changing perceptions of science-learning environments during the transition from
primary school to secondary school. This study was fuelled by the growing concern
that some secondary school subjects, in particular the sciences, are perceived
negatively by some students, predominantly girls (e.g. Speering & Rennie, 1996).
Other studies have also noted that gender may influence learning environment
perception (e.g. Terwel, Brekelmans, Wubbels, & van den Eeden 1994; Fisher,
Fraser, and Rickards, 1997). Student responses during the transition from primary to
secondary may be influenced by gender (Speering & Rennie, 1996; Ferguson &
Speering, 1997), and further, gender-based experiences resulting from the transition
may in fact lead to girls developing persistently negative attitudes towards the
science curriculum. Furthermore, Cotterell (1992) suggested that the relative change
in school size might be an important factor in student perceptions.
These findings, based on quantitative data, therefore suggested a negative change in
student perception of the learning environment during the transition from primary to
secondary school. The boys had a more negative perception of the primary school
learning environment than did the girls. The qualitative data also supported this

51
conclusion. The perceptions both of boys and girls of the learning environment
moved much closer together at secondary school.
Qualitative data collected suggested that boys and girls had different priorities when
describing the ‘positives’ about the school environment with the girls placing more
importance on relationships within the school contexts, both with peers and teachers.
Boys, however, were more concerned with equipment and facilities and the type of
experiences. Teacher relationships were not seen as important unless they were very
poor. Boys saw only peer relationships as important when they allowed for specific
shared activities such as sport.
In conclusion, there is a considerable body of research that suggests that many of the
learning environment perception changes are related in some way to the transition
pathways in particular school size change. Most transition programmes treat all
students in the same way and assume that any difficulties encountered are the same
across the particular cohorts. In general, students who have experienced a greater
relative change in school size find that classroom cohesiveness is considerably
reduce Cotterell d (, 1992).
Assessment and ‘test anxiety’
Research on equitable assessment strategies by Parker and Rennie (1998) looked at
the effect of the test-taking situation on attitudes and in particular ‘test anxiety’
which varies according to the situation. Parker and Rennie highlighted the work of
Adams (1986) and others who showed that the success of students in a stressful
testing situation is dependent on the degree to which they are confident that they will
succeed and that boys in these situations tend to be more confident than the girls.
Hembree (1988) suggests that test anxiety could be exaggerated when students are
uncomfortable with the test-taking situation.
2.3.4 Self-Efficacy, Science Literacy and Group Work
No study on attitudes and young people would be complete without some reference
to self-efficacy. Prof Albert Bandura of Stanford University, regarded by many

52
researchers as a top world authority on self-efficacy, defines self-efficacy (Bandura,
1986, p. 391) as “peoples judgments of their capabilities to organize and execute
courses of action required to attain designated types of performance.” Essentially it
is confidence in ones own ability which in turn can influence (Bandura, 2004):
• The choices we make. • The effort we put forth. • How long we persist when we confront obstacles (and in the face of failure). • How we feel. Bandura (1994) maintains that self-efficacy is one of the key factors in self-motivation.
Self-beliefs of efficacy play a key role in the self-regulation of motivation. Most human motivation is cognitively generated. People motivate themselves and guide their actions anticipatorily by the exercise of forethought. They form beliefs about what they can do. They anticipate likely outcomes of prospective actions. They set goals for themselves and plan courses of action designed to realize valued futures (p. 75).
Unlike attitudes, science self-efficacy has only been investigated in recent years with
work by researchers such as Baldwin, Elbert-May and Burns (1999) who developed
an instrument to measure science self-efficacy.
There has been little research in New Zealand on the development and validation of
instruments to measure self-efficacy although Dalgety, Coll and Jones (2000)
developed and validated an instrument for use with tertiary chemistry students,
Chemistry, Attitudes and Experiences Questionnaire (CAED). The effect on self-
efficacy of cooperative group work and assessment could be significant but is
regarded as beyond the scope of this study.
Science literacy also has an effect on the attitudes of the entire population towards
science and how they might view any science-related issues. Many students find
science difficult because of a lack of science literacy. Whitaker and Salend (1991)
investigate the effectiveness of collaborative peer writing groups and make the
statement that “students with disabilities frequently lack the self-esteem and
interpersonal skills important to collaboration” (p. 132). They go on to establish that
students can improve literacy through work in cooperative groups.

53
2.3.5 Attitudes and the Classroom Environment
When changes are made to the learning environment of a classroom through
strategies such as cooperative group work it is also likely that there will a shift in the
general classroom environment. While the focus of this study is on the effect of
cooperative work and assessment on student attitudes an awareness of research that
can link an improvement in classroom environment with better student learning
outcomes is valuable. In a literature review by Fraser (1998) the existence of
associations between classroom environment and student outcomes is supported.
The Questionnaire on Teacher Interaction (QTI) originally developed in the
Netherlands and was later followed by a shorter version for the Australian Science
education scene (Wubbels. Creton & Hooymayers, 1985; Wubbels & Levy, 1993).
One of the features of QTI which makes it so useful (Coll & Taylor, 2000) is the fact
it has two versions, one which measures the students perceptions of the actual
teaching style achieved in the classroom and the second version which measures the
preferred teaching style. This enables classroom teachers to readily identify any
specific areas of mis-match and make appropriate adjustments to their teaching style.
There has been little use of the QTI made in New Zealand at secondary school level
although there was a significant study by Coll and Fisher (2000) at tertiary level in
some chemical technology classes at second and third year. This revealed any
discrepancy between teachers’ and students’ perceptions of the learning environment
and the students’ actual and preferred environments. QTI could be a useful
instrument in the assessment of cooperative work on the classroom environment.
2.4 CONCLUSION
Cooperative group work has been shown in the literature to have ancient beginnings
however it really began in earnest from the early 1970s. There have been many
significant contributions from researchers of how cooperative groups can be best
established and maintained in an efficient and productive manner. Many of the

54
outlined techniques may be very effective in a primary school where students remain
with one teacher for extended periods of time. However these techniques are not
always suitable in secondary schools where students are with a teacher for periods of
less than one hour and then followed up by a new class of students usually of a
different year grouping. Glasser (1969, 1986) suggests that there are many failures
at secondary school level and effective group work is possibly an effective method to
best address this issue. There are some elements of the group work outlined in the
literature which are suitable for use in secondary schools without a significant
increase in teacher workload in the management of cooperative learning in his or her
classroom. Kagan (1998) suggests that cooperative group work without changing the
content or curriculum delivery is a good way forward for many teachers who may
not want to set up elaborate cooperative based lessons. The cooperative group work
structures used in this study are outlined in the methodology (Chapter 3).
Koballa (1988) states that there has been a shift in the focus of education research in
the past few decades to affective outcomes particularly attitudes. This shift has
arisen as affective variables are now seen as being as important as cognitive
variables in influencing (and possibly predicting), learning and other outcomes. The
review of research leading to the modern understanding of attitudes is followed by
attempts to quantify this through the development of a range of instruments. Several
of these are more suited to science-related attitudes such as the TOSRA by Fraser
(1981a) than others. It should be noted that the term ‘science’ in these instruments
encompasses many aspects of science such as student interest in science outside the
school laboratory environment and general impressions of scientists. The impact of
assessment and its effect on student attitudes is also included in the review with the
suggestion by researchers such as Adams (1986) that the ‘stress’ encountered by
students during assessments can be reduced if the students are more confident of
success. The literature review certainly supports the concept of cooperative group
work and the importance of student attitudes is seen as paramount. There is however
no reported research into how simple cooperative group work suitable for
implementation by secondary school teachers may in fact influence the science-
related attitudes of students. The combination of cooperative group work and
assessment is not always seen by researchers such as Kagan (1994) as ideal where
students gain a combined mark for some assessments, however there is significant
55
research to suggest that ‘embedded assessment’ does in fact lead to improved science
learning rather than just summative assessment (Treagust, Jacobowitz, Gallagher &
Parker, J. 2001).
This study is unique in that it attempts to change students’ attitudes and to measure
such changes, through the use of the simplest form of cooperative group work in
predominantly laboratory work and assessed activities such as tests and assignments.
Chapter 3 describes the methodology used in this study.
It is hoped that this study will:
• Provide secondary school teachers with a simple effective method of
improving the science related attitudes of our younger students without a
subsequent increase in workload. In fact if followed through the workload
would in face be significantly reduced.
• Provide a positive environment where students can gain the rewards of
working with their friends, better grades in their assessments, and the benefits
of peer explanations and discussions while in their groups. This should have
a positive effect on their understanding and hence enjoyment of science so
often perceived by students as too difficult.

56
CHAPTER 3
METHODOLOGY

57
3.1 OVERVIEW
Whereas a significant amount of research has targeted cooperative group work and
the changing attitudes of students during their formative years at secondary school,
there has been little research carried out into effective and simple ways to attempt to
reverse the well-documented deterioration in student attitudes towards science
(Yarrow, Millwater, & Fraser, 1997). Therefore, in this regard, this study is valuable
in that it focuses on this problem by using a triangulated approach to assessing
student attitudes. Qualitative data are collected from two sources, the students and
the teachers through interviews and after thorough examination of the available
instruments the TOSRA (Fraser 1981a) was seen as most suitable for use in New
Zealand to assess student science-related attitudes quantitatively. The TOSRA has
been extensively field tested in Australia and the United States and by providing
validation data teachers and researchers throughout New Zealand can then use this
instrument with confidence to assess attitudes towards science in New Zealand
schools (Appendix C).
This chapter is comprised of a discussion of the early pilot study at the author’s own
school, which led this study being continued as a worthwhile project which could
make a difference to students’ science-related attitudes. There is a description of how
the other schools for the study were selected together with how extraneous variables
were minimised. The selection of year levels and the bands of classes are then
discussed along with an account of the teachers who were able and willing to take
part in the study.
Protocol for the establishment of the groups (learning teams) within the classes is
discussed followed by the guidelines given to students and their teachers on how to
work together during activities such as practical sessions, assignments and tests
(written and practical). Ethical considerations are also discussed in the chapter.
The method of quantitative data collection using the TOSRA is then discussed
because this was administered before the students embarked on their group work and
assessment study in term one and again later in term four when the study was

58
completed. The qualitative data collection methods are outlined and include
techniques such as student and teacher interviews, video taping of assessment
activities and personal observations.
The aim of this study was to determine the effect of cooperative group work and
assessment on the attitudes of students towards science in New Zealand. Specifically,
the research set out to gauge the effects of group work and assessment on the
attitudes towards science of Year 9 and Year 10 students.
In the long term it was hoped that the following might be achieved:
• minimising the impact of the perceived difficult aspects of science by
making the students feel more secure during class work and during the
assessment procedures carried out in many New Zealand schools; and
• encouraging students to work cooperatively towards achieving a common
goal, whether the goal is to complete an assignment, a practical activity,
fieldwork, or an assessed exercise.
Establishing small cooperative groups in which the students performed all their
assignments, tests, laboratory work and fieldwork was the basis for this. All
members of the group received the same mark for any given assessment exercise and
students were encouraged to communicate and work cooperatively during these
activities. Increased teacher input to the groups during these activities was also
encouraged.
The bulk of this thesis is based around the period of study in 1998, however
following suggestions from teachers’ who participated in study, and the researcher’s
own more recent classroom teaching, there have been a number of modifications
made to the basic format for cooperative group work. Many of these additional
approaches have proved to be a successful addition to the basic philosophy outlined
in the study and as such have been included in Chapter 7 later in this thesis.
59
3.2 SCHOOL SELECTION
3.2.1 Pilot Study
There was a significant amount of preliminary investigation conducted at a rural
New Zealand school termed School 3. This pilot study involved testing a class of
Year 10 science students taught by the researcher in 1996. This gave the researcher
some data, which suggested cooperative group work and assessment had real
potential and as such demanded further investigation.
The science staff were enthusiastic about new methods and approaches to their
teaching incorporating cooperative group work and assessment and was willing to
participate in further study on a more formal basis. Hence School 3 was targeted for
more extensive study.
It was also recognized that it was not possible for the researcher to control all of the
variables in this research. There are a several aspects of the classroom-learning
environment and student-teacher interpersonal behaviour, which cannot be controlled
during the study and the best that can be hoped for is to minimize the effect of these
independent variables.
3.2.2 Description of Schools Selected
Since School 3 was already targeted for more extensive study it was wise to look
carefully at its general features to ensure the prudent selection of other similar
schools hence reducing the variables and improving the statistics.
School 3
School 3 and its farmland (mainly dairy) community are situated 30 kilometres from
Hamilton, located centrally in the Waikato region of New Zealand. The surrounding
farmland is one of the most closely settled rural areas in New Zealand, and consists
mainly of dairy farms with lesser numbers of beef, sheep, deer, and goat and

60
horticulture units. The size of the retail and service centre of the town reflects the
closely settled farmland, and the high level of associated industries. Between 10%
and 20% of the population is of Māori descent. There are four marae (in New
Zealand a marae is a traditional Māori communal meeting place of spiritual
significance) within the town’s community.
There is a smaller but significant community of Dutch origin, and a number of
Indians and Chinese. The school is coeducational with a population that ranges
between 610 and 750 students. Approximately 50% of the students travel to school
by bus.
In New Zealand a decile rating is a measure of the school’s community wealth.
School communities are rated on a scale of 1 to 10, with 1 being the poorest and 10
the wealthiest (the lower scales are further subdivided into 1A, 1B, etc, for funding
purposes) (Education Review Office, personal communication, August 7, 1999,).
School 3 has a decile rating of 6 and is State owned and operated.
It was decided to try to work with similar schools in the Waikato region for ease of
travel and observation during the study and fortunately the two closest rural
coeducational schools were willing and enthusiastic about participating in the
research. These two schools had a similar mix of students and the junior school (Year
9 and 10) in particular was structured in the same way in terms of banding and ability
of their students. The structure of the classes for Year 9 and 10 students was similar
for each of the three schools. Each school allocated students into ability bands, with
a top ability band of two or three classes followed by three or four mixed-ability
classes. The Heads of Science at each of the participating schools had enthusiastic
staff keen to contribute and help with the research and were able to select the classes
without having to take staffing into account. A description of each of the selected
schools follows. Both Schools 1 and 2 are within 25 minutes by car of School 3.
These three rural Waikato schools had no lower bands of students (classes of lower
ability band students at the time of this research were very rare anywhere within New
Zealand) that would be able to participate in the research hence School 4 was
selected. School 4 is in southern South Island.

61
School 1
School 1 is situated in a mainly dairying community situated 45 kilometres from
Hamilton on the edges of the Waikato and Thames Valley provinces. The town
services the region with the retail turnover closely reflecting the needs of the nearby
farmland. The ethnic composition is predominantly Pakeha (people of European
descent) with approximately 8% of the population of Māori descent from one main
marae. There are a few Indian students and several Polynesians. From time to time
there are South East Asian students from refugee backgrounds. There are significant
Dutch and Swiss cultural minorities who maintain close contact with their home
countries. A number of these are recent immigrants whose English is limited. The
college is coeducational with a population that varies between 420 and 460 students
with close to 50% traveling to school by bus. School 1 has a decile rating of 5.
School 2
School 2 is situated 45 kilometres from Hamilton on the plains of the Waikato
region. It has been the home of one main tribe of people for many generations.
Pakeha settlement since 1895 has been based on farming – dairying, and horse
breeding on the plains and sheep and cattle on the rolling hill country. With this
background, the area is viewed today as a farming community with an urban service
town. Recently, vigorous and significant industrial activities have developed and
these serve the town, New Zealand and international markets. The school is
approximately 13% Māori. The school population is around 760 students and close
to 50% of the pupils travel to school by bus. School 2 has a decile rating of 7.
School 4
School 4 was selected, as it is one of the few schools, which has a selected lower
ability class. Schools 1, 2 and 3 all have broad banding consisting of a top band and a
mixed ability band. School 4 had the same structure but also contained a lower band
of 18 students, none of whom had behaviour problems that are common among
lower band classes. However, it is a slightly different type of school from the others.
It still is an essentially rural coeducational school but it has a larger population of
close to 1,200 students. There are only a few Māori students at this school. It is
situated in the town of Invercargill, significantly larger than any of the other towns

62
associated with this study, in mainly sheep farming country. School 4 has a decile
rating of 8.
3.3 SELECTION OF CLASSES
Twelve Year 9 and 10 classes from Schools 1, 2 and 3 were used for the data
collection, four classes from each school. Since these schools used a broad-banding
system for the streaming of their students, an upper band of two classes and then
mixed ability classes, it was decided to use one class from each of these bands at
each year. The rationale behind the selection of bands of students at all years was
that it was important to see the effect of cooperative group learning and assessment
on students of all abilities, not just the top students. Each of the classes contained
between 25 and 30 students, as is most common in state rural secondary schools. A
lower ability class of 18 students from School 4 was added to the study and this class
was selected on the basis that it contained students who were finding progress
difficult but did not pose any significant behavioral problem.
The selected teachers were enthusiastic and willing to participate in the research and
a significant number were often teaching classes at each ability level, both mixed
ability and the upper band within the same year. This was helpful as the students in
both ability bands received the same classroom procedures at each year, which
helped to reduce the variables, and would give a valuable comparison between ability
bands.
Even though there were limited numbers of teachers available to participate in the
study at each school, it was possible to select teachers with a range of experience and
of both genders (Table 3.1).

63
Table 3.1 Summary of Teachers Selected
Teacher Gender Teaching Experience (Years) School, Class, Year and Band A Male < 5 years S1: Year 9M, Year 9U B Male > 15 years S1: Year 10U, Year 10 M C Male > 15 years S2: Year 9M, Year 10U D Female < 5 years S2: Year 9U, Year 10M E Female < 5 years S3: Year 9M F Female < 5 years S3: Year 9U G Male > 15 years S3: Year 10M H Male > 15 years S3: Year 10U I Female 5 to 10 years S4: Year 10L
Bands U = Upper M = Middle L = Lower
3.4 HOW THE GROUPS WERE ESTABLISHED WITHIN THE CLASSES
While much of the research outlined in Chapter 2 suggests that self-selected groups
do not always make the best learning teams, the twin ideals of simplicity for the
teacher and fun-but-purposeful for the students were seen as paramount. The
teachers were instructed to use their own ‘common sense’ as their students selected
their groups. Assisting students to establish their groups in a fair manner was seen as
an important part of the process.
The use of triads for the purposes of this work was a student recommendation
following the pilot study at School 3. Students saw this as an ideal number for
ensuring that they were all involved with less chance of having ‘passengers’ during
any team activities. The use of the terms ‘group’ or ‘learning team’ is of interest.
The literature in general refers to a ‘learning team’ as a group, which has progressed
to become a ‘learning team’ through more effective communications and operation.
The term group is used in general throughout this study.
Students were each given a handout, which outlined the practical details of how they
were to choose their groups and what would be expected of them during class work
and assessments (Table 3.2).

64
3.4.1 Protocol For Group Organisation
Table 3.2 Student Instructions
1 Students are able to select their own group of preferably three.
2 They are to do all practical, fieldwork, assignments and tests working in these groups.
3 Each member of the group receives the same mark for tests, assignments, fieldwork and any other assessments.
4 Students are given handouts regarding each type of assessment.
5 All work and assessment is essentially cooperative, students are encouraged to share the workload and enjoy working together, whether it is an assessed activity or a simple experiment.
6 Students will be instructed in suitable ways of ensuring that all group members participate and have a sense of ownership of the results. For example, tasks such as collecting and using equipment are always rotated to make sure that everyone has a turn.
7 Students are instructed to ensure that each group member is given a specific task and that they are responsible for completing that task on time. The group then collates all of the contributions from each group member (this is often one member’s task). The master assignment is marked and each member receives the same mark along with a copy of the final assignment
8 For written tests, students are arranged in their groups at the laboratory benches to allow them to work together with a minimum of contact with other groups. Eye contact should be possible among group members. Talk within the group is permissible but talk between groups is not. Answers are to be handed in and marked. All group members receive the same grade.
3.4.2 Instructions to Teachers
There was significant dialogue between the researcher and the teachers to try to
ensure that the approach towards the work during this study was consistent.
The teachers all agreed with the basic philosophy of trying to ensure that the students
found science an enjoyable and rewarding experience. The group testing aspect of
the study was seen as very important as they had found students were often ‘stressed’
when doing tests in the past. Many of the teachers said during discussions that they
had often felt uncomfortable giving our Year 9 students formal tests when many of
these students had never experienced tests other than Australian Science tests.
(Australian Science is a multiple choice resource based testing programme set up by
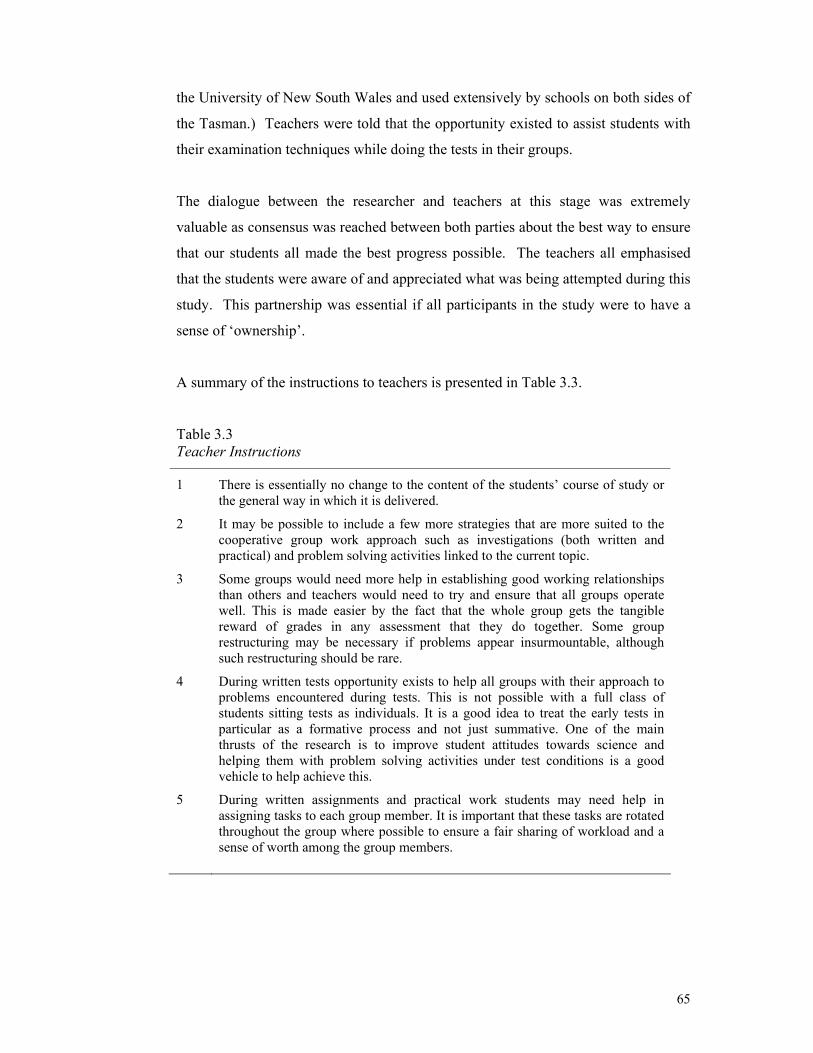
65
the University of New South Wales and used extensively by schools on both sides of
the Tasman.) Teachers were told that the opportunity existed to assist students with
their examination techniques while doing the tests in their groups.
The dialogue between the researcher and teachers at this stage was extremely
valuable as consensus was reached between both parties about the best way to ensure
that our students all made the best progress possible. The teachers all emphasised
that the students were aware of and appreciated what was being attempted during this
study. This partnership was essential if all participants in the study were to have a
sense of ‘ownership’.
A summary of the instructions to teachers is presented in Table 3.3.
Table 3.3 Teacher Instructions
1 There is essentially no change to the content of the students’ course of study or the general way in which it is delivered.
2 It may be possible to include a few more strategies that are more suited to the cooperative group work approach such as investigations (both written and practical) and problem solving activities linked to the current topic.
3 Some groups would need more help in establishing good working relationships than others and teachers would need to try and ensure that all groups operate well. This is made easier by the fact that the whole group gets the tangible reward of grades in any assessment that they do together. Some group restructuring may be necessary if problems appear insurmountable, although such restructuring should be rare.
4 During written tests opportunity exists to help all groups with their approach to problems encountered during tests. This is not possible with a full class of students sitting tests as individuals. It is a good idea to treat the early tests in particular as a formative process and not just summative. One of the main thrusts of the research is to improve student attitudes towards science and helping them with problem solving activities under test conditions is a good vehicle to help achieve this.
5 During written assignments and practical work students may need help in assigning tasks to each group member. It is important that these tasks are rotated throughout the group where possible to ensure a fair sharing of workload and a sense of worth among the group members.

66
3.4.3 Ethical Considerations
Participation of the teachers was voluntary. The parents of students involved in this
study were informed about the study and had the opportunity to withdraw their
children from aspects of the study if they so wished. This would have meant that the
students would continue with their regular course work but would not be asked to
complete a TOSRA form or agree to be interviewed. They would have still
completed any assessments, however, because the study only focused on the way the
students were assessed and worked together. No problems were anticipated if all the
involved parties were well informed.
Confidentiality was maintained during the course of the study and numbers rather
than names were recorded. Anonymity and confidentiality were accorded to all
participants and they were encouraged but not forced to contribute to this study.
Before the teaching programme began, the selected classes were fully informed and
then profiled. Additional data collected included the year grouping and gender. The
participants were briefed on the type of work and assessment procedures they were to
experience over the next three terms. These briefings provided an outline of the type
of approach that the classroom teachers used in the programme. It was not the
intention to alter the content of the material that was normally presented to the class
or the assessment programme, only the way students were organised and completed
their assessments.
3.5 QUANTITATIVE AND QUALITATIVE DATA
Both quantitative and qualitative data were collected for this study over the first three
terms of the school year (to avoid the end-of-year examinations held during
November). The student's class, band and year, along with the school were obtained.
The gender of the student was also collected (Appendix B).

67
3.5.1. Quantitative Data: TOSRA Application
The TOSRA was seen as the most appropriate instrument for use with the Year 9 and
10 New Zealand students. A full description of the TOSRA and its development as a
valid instrument to measure the attitudes of students can be found in Chapter 2.
Teachers administered the TOSRA in early May of 1998 and repeated this in late
November in the same year when their work with the cooperative groups was
concluded. The students' names were not recorded on the TOSRA answer sheets to
help ensure the students answered the questions frankly. The teachers ensured that
the students had plenty of time to complete the TOSRA and any student questions
were answered during this time thus helping to ensure the accuracy of the student
responses. The lower level class at School 4 was given more help during the
administration to ensure that they fully understood what was being asked before they
responded.
3.5.2. Qualitative Data
As with any study involving humans and their behaviour there will always be
considerable variation of ideas and thoughts expressed by individuals. A range of
methods of collecting qualitative data was used.
Observed sessions and videotaping
The researcher made first-hand observations of students working in their groups (as
did their teachers on a more regular basis). Some sessions were videotaped. The
videotapes allowed for later examination to see how many students were on or off
task in each group and who were contributing most, at least verbally (although the
most verbal may not always be on task all of the time). Once the students realised
that their initial concerns about the camera were unfounded, they simply got on with
their work.

68
Audio taped student and teacher interviews
Student Interviews
The second approach to collecting qualitative data involved interviewing students
and teachers. There were two groups of students randomly selected for interviews
from each class giving a total of 26 groups in the four schools. There were usually
nine groups of three in each class. The interviews were all taped in a quiet room or
outside in a quiet spot where the students felt comfortable and able to answer the
questions freely. As is the accepted practice with all of this type of research, students
were always asked if they were happy to be interviewed. They were usually very
positive about the possibility of interviews and in the end provided the researcher
with good knowledge of their basic feelings about many aspects of the project.
A set of basic questions was asked of all groups (Table 3.4). There were some more
open-ended questions, which could be asked of any groups who seemed keen to
expand on the previous questions for example. The prompts were used to ensure
questions were always fully answered. Students were also given plenty of
opportunity to comment on any issues arising from the study; this included any
recommendations from a student perspective seen as important or indeed any ideas
seen as worth pursuing. As is the normal protocol for interviews, the question was
always put first to the learning team before the tape was started. This meant that the
students could ask any questions about what was meant by any particular question
without long pauses and continual rewinding of the audiotape.

69
Table 3.4 Questions for Interviews with Students:
Q Student questions
1.
Group work: Establishment. a. How did you sort out your group? b. How are you enjoying working in your group? c. Are there any things that you have changed since your group was first formed?
2. Practical work, research & assignments: When you are doing practicals, research or assignments, how do you divide up the jobs? Prompts:
• Do you keep changing the jobs? • Has it changed? • What do you do if one of your group is slacking a bit? Do you, give them a
rev, etc. etc
3. Group work: Effectiveness. Do you think that your group efforts are better than you would produce as individuals? Prompts:
• Why? [If yes] • Why not [If no]
4.
During tests: a. Does the same person write up the answers? b. Has one person become ‘the boss’? c. How do you sort out your group's answer, if some of you group disagree with other members of the group? d. How do you think your results are compared to sitting the tests as individuals, better or worse? Prompt:
• Why? e. Do you think you will do better at the end of year exams having worked in groups than you would if you had done all of your tests as individuals? Prompt:
• Why? Prompt: [If necessary]
• Do you think that by doing your tests in groups you are also learning? f. If you were given the choice of working in groups or as individuals for the next test what would you choose?
5. Ease and enjoyment a. Do you find science easier when you work in groups? b. Do you find science more enjoyable when you work in groups?
6. Relevance Does group or teamwork have any application to being in the ‘workforce’?

70
Teacher Interviews
Each of the participating teachers was invited to be interviewed and all responded
positively. A basic set of questions was used but they were not as structured as for
the students, thus allowing teachers an opportunity for significant input into the
study. The teachers had been helpful in helping to ascertain and justify the types of
research questions that needed to be asked during a study such as this. Teachers
were asked to monitor any of the modifications that were made to any groups and
why this had occurred. During the observation phase, and along with any
videotaping of students at work in their teams, teachers were also asked if there were
any special and successful ways of managing the teams through different strategies
that they found to be particularly useful.
The heads of science at each of the study schools also allocated time during their
regular Science Department meetings for all of their science teaching staff to make
comments and recommendations on the study as they saw it.
3.6 DATA COLLECTION TIMELINE
The data were collected on five occasions during the year (Table 3.5). Schools were
visited during term one where data was obtained on class composition, bands, year
and general observations on how the classes were operating before the study. There
were other observation visits during the latter part of term two and the early part of
term three. On these occasions videotaping of tests and other team based activities
also occurred. The teachers administered the TOSRA early in term two and again
towards the end of the year, well before the final school examinations.
Qualitative data were collected from student and teacher interviews near the end of
the year in November. The teacher interviews were held after the student interviews.
The classroom teachers, following instructions from the researcher, administered the
TOSRA. They were administered in the early part of the day to try to get all the
students to take them seriously. The questionnaires were given to the teacher in an

71
envelope with clear instructions on it. The completed questionnaires were often
collected by students and were then placed straight into the sealed envelope. This
helped to ease any student anxiety about their teachers reading the responses. The
researcher discarded any informal responses. The personal data collected on the
TOSRA sheet were sufficient to allow a statistical analysis of the responses.
Table 3.5 Data Collection Timeline
1998 Action
Term 1 Observation and class composition data collected
Term 2
Term 3
Term 4
Early term 2 first administration of science attitudes instrument (TOSRA)
Observation and videotaping of team activities
Term 4 second administration of science attitudes instrument (TOSRA) Student interviews for qualitative data. Staff interviews for qualitative data
There were some changes in class numbers and some moving of students because
some changed schools (usually 1 or 2 students from each school in the study). These
changes, when considered against the total number of students participating in the
study, were seen as insignificant and as such were deleted from the records.
3.7 DATA ANALYSIS
The data analysis focuses on the objectives of the study, the first part of which was to
provide validation data for the use of the TOSRA in New Zealand. The measures
used to validate the TOSRA were a factor analysis, the Cronbach alpha coefficient
(Cronbach, 1951), to assess the internal consistency of the scales, and the mean
correlation of a scale with the other six scales (discriminant validity).
Having validated the TOSRA, the second objective was to determine the effect of a
cooperative approach to learning and assessment on attitudes of students to science.
The scale means and the t test scores were used to identify any statistically
significant variations among the results (p<0.05 and p<0.01). These results were

72
backed up with qualitative data obtained from student and teacher interviews to give
a three-pronged approach to the significant variations.
The third objective was to determine relationships of grade and gender of students
with their attitudes to science and look for any other possible contributing factors
such as school and teacher on the science attitudes of the students in the sample
population. The data were analysed using the SPSS software package.
3.8 ONGOING STUDY
A number of the students who participated in the pilot study have progressed well
beyond the time of main study and there are some significant data available on the
success of these students. This essentially allows a longitudinal study of the results.
From the group of 31 Year 10 students involved in the preliminary study by the
researcher at School 3 in 1996 a significant number (13) were still at school as Year
13 students in November 2000 when more quantitative TOSRA and qualitative data
were collected to add a small yet significant group of students to the overall study.
The results of this longitudinal case study are outlined in Chapter 6.

73
CHAPTER 4
VALIDATION OF THE TOSRA

74
4.1 OVERVIEW
The first object of this study was ‘to provide validation data for the use of the Test of
Science Related Attitudes (TOSRA) in New Zealand’. The development of
instruments to measure attitudes has been outlined in Chapter 2 where the TOSRA
was found to have wide use and acceptance by education researchers.
Validation of an instrument is essential in any research that needs to make
statistically significant comparisons between any groups of students. A significant
part of this study is the collection of quantitative data collected by the administration
of the TOSRA to the students involved in the study.
However, even though students from different countries including Australia may
exhibit similar attitudes, it cannot be assumed that an instrument shown to be valid
beyond New Zealand would necessarily apply to New Zealand students. There is a
need to validate the TOSRA before any results from research can be considered
valid.
The attitudes of the students towards science were measured using the TOSRA
(Fraser 1981a). This instrument consists of 70 items with items spread equally
between seven distinct scales, Social Implications of Science, Normality of
Scientists, Attitude to Scientific Inquiry, Adoption of Scientific Attitudes, Enjoyment
of Science Lessons, Leisure Interest in Science, and Career Interest in Science. Each
of these items had five possible responses based on the Likert (1932) scale, which the
students simply circled. The possible responses were: Strongly Agree, Agree, Not
Sure, Disagree, and Strongly Disagree. There are a number of negative items for
which the scoring is reversed. These are randomly distributed throughout the scales.
The TOSRA is suitable for group administration during the course of a normal
lesson. Some of the students at times did find that this was a bit confusing, as they
had ‘already been asked that question’. It was always made clear that they were to
answer each question as a separate item regardless of what had been asked
previously. Most of the students were able to complete the TOSRA easily within the

75
35-minute time slot allocated for it. The lower band of students at School 4 had their
questions read to them and hence their questionnaires took about 50 minutes to
complete.
The TOSRA has been carefully developed and extensively field-tested in Australia
and the USA. It has been shown to be highly reliable, however, it has not yet been
used extensively in New Zealand. Therefore, one objective of this study was to
determine its reliability and validity for use in New Zealand schools. The TOSRA
was used before and after the students embarked on their cooperative group work and
assessment tasks. This chapter uses the data gathered in 13 classes in Years 9 and 10
in four coeducational schools in New Zealand. The validation of TOSRA makes a
significant contribution to the assessment of science related attitudes in New Zealand.
A comparison of the mean scores of the New Zealand sample with similar groupings
from Fraser's (1981a) work has been made at the end of this section. While they are
only mean scores it does give us a quick overall comparison between the groups of
Years 9 and 10 students within the two countries.
4.2. RELIABILITY AND VALIDITY OF THE TEST OF SCIENCE RELATED
ATTITUDES (TOSRA)
The TOSRA was administered to a sample of 312 Year 9 and Year10 students in 13
coeducational science classes in rural New Zealand. The measures used to validate
the TOSRA were a factor analysis, the Cronbach alpha coefficient (Cronbach, 1951)
to assess the internal consistency of the scales, and the mean correlation of a scale
with the other six scales (discriminant validity).
4.2.1 Factor Analysis
A further analysis of the instrument involved a principal components analysis with
varimax rotation (Table 4.1). The 70 items were analysed to determine the

76
Table 4.1
Factor Analysis of the TOSRA
Scale Item Number
Factor 1 Leisure
Factor 2 Inquiry
Factor 3 Social
Factor 4 Enjoyment
Factor 5 Normality
Factor 6 Adoption
Factor 7 Career
4 0.44 0.39 11 18 0.39 25 0.34 0.31 32 0.57 39 0.5 0.31 46 0.47 53 0.59 60 0.34 0.33
Adoption of Scientific Attitudes
67 0.41 7 0.56 14 0.55 21 0.58 28 0.57 35 0.53 0.34 42 0.59 49 0.57 0.46 56 0.56 63 0.33
Career Interest in Science
70 0.64 5 0.38 0.55 12 0.47 0.56 19 0.64 26 0.36 0.37 0.35 33 0.49 0.54 40 0.37 0.34 0.32 47 0.47 0.48 54 0.39 61 0.47 0.45
Enjoyment of Science Lessons
68 0.48 3 0.64 10 0.45 17 0.69 24 0.60 31 0.66 38 0.68 45 0.69 52 0.65 59 0.46 0.21
Attitude to Scientific Inquiry
66 0.55 6 0.66 13 0.51 20 0.67 27 0.64 34 0.63 41 0.59 48 0.65 55 0.56 62 0.64
Leisure Interest in Science
69 0.50 2 0.39 9 0.59 16 0.39 0.41 23 0.61 30 0.33 0.55 37 0.53 44 0.44 51 0.66 58 0.54 0.35
Normality of Scientists
65 0.43 0.31 1 0.53 8 0.36 0.31 15 0.31 0.49 22 0.47 29 0.48 0.35 36 0.38 43 0.44 0.34 50 0.73 57 0.35
Social Implications of Science
64 0.63

77
commonality of factors measured. The seven factors are listed across the top of the
table with the items and scales down the side. It was noted that a number of items
appeared in the 'wrong' scale column and it was felt best to delete these items from
the original scale and rework the statistics since the responses were not specific to a
given question. There was some thought given to combining Leisure Interest in
Science and Career Interest in Science since many of the items were factored into the
same scale, but with a total of 19 items in a new combined scale it was a lot bigger
than the other scales. All of the correlations were greater than 0.31 with the bulk of
them being at least 0.55 or greater, which can be considered as a satisfactory
correlation.
As a result of the factor analysis a number of items were omitted from a number of
the scales (table 4.2).
Table 4.2 Items Changed after Factor Analysis
Attitude scale Item(s) retained Item(s) omitted
Social Implications of Science 50, 64, 22, 43, 36, 8, 57 1, 15, 29 Normality of Scientists 51, 23, 9, 30, 58, 37, 44, 65, 16 2 Attitude To Scientific Inquiry 38, 31, 52, 3, 24, 66, 59, 10, 17, 45 None Adoption of Scientific Attitudes 25, 53, 32, 18,67 4, 11, 39, 46, 60 Enjoyment of Science Lessons 40, 47, 12, 5, 33, 26 19, 54, 61, 68 Leisure Interest in Science 20, 6, 48, 62, 27, 34, 41, 55, 13, 69 None Career Interest in Science 70, 42, 21, 28, 56, 7, 14, 35, 63 49
4.2.2 Validation of the TOSRA
Table 4.2 shows that there was an acceptable level of reliability, i.e., greater than
0.60 for six of the seven scales (Nunnally 1978), when the individual student is used
as the unit of analysis with alpha coefficients ranging from 0.75 to 0.88 for these six
scales. This is well within acceptable values for this type of application. The
exception was the Adoption of Scientific Attitudes scale, where only four of the
original questions remained after the factor analysis and which had an alpha
reliability of 0.52, which is on the lower side of acceptable limits. Results using this
scale need to be treated with some caution. Generally, however, these results are

78
similar to the original of a range of 0.69 to 0.84, reported by Fraser (1977c) and attest
to the internal consistency reliability of the TOSRA.
4.2.3 Mean Correlations
The discriminant validity of the instrument was measured using each scale’s mean
correlation with the other scales. The mean correlations range from 0.25 to 0.42
using the individual as the unit of analysis (Table 4.3). This range indicates that the
items used in the instrument correlate far more with items in the same scale than with
items in other scales. Consequently, the instrument has satisfactory discriminant
validity and each scale measures generally distinct although somewhat overlapping
attitudes.
Table 4.3 Scale Means: Standard Deviations, Internal Consistency (Cronbach Alpha Coefficient), and Discriminant Validity (Mean Correlation with Other Scales) for the TOSRA
TOSRA Scales Number of Items
Scale Means
Standard Deviation
Alpha Reliability
Mean Correlation with
other Scales
Social Implications of Science 7 3.27 0.58 0.75 0.40 Normality of Scientists 9 3.44 0.56 0.76 0.25 Attitude to Scientific Inquiry 10 3.77 0.65 0.83 0.24 Adoption of Scientific Attitudes 5 3.41 0.51 0.52 0.42 Enjoyment of Science Lessons 6 2.95 0.83 0.88 0.40 Leisure Interest in Science 10 2.43 0.78 0.85 0.37 Career Interest in Science 9 2.75 0.74 0.80 0.33
(n = 312)
4.3 COMPARISON WITH PREVIOUS STUDIES IN 1981
Because this is the first time TOSRA has been used extensively and validated in New
Zealand, it is well worth comparing these results with a similar grouping from
Fraser's (1981a) original use of the TOSRA in a range of schools in Brisbane and
Sydney where the sample size ranged between 324 and 340 Year 9 and 10 students
(Table 4.4; Figure 4.1).

79
New Zealand vs Australia TOSRA Scores Years 9 & 10
1.5
2
2.5
3
3.5
4
4.5
SocialImplications
of Science
Normality ofScientists
Attitude toScientificInquiry
Adoption ofScientificAttitudes
Enjoymentof ScienceLessons
LeisureInterest in
Science
CareerInterest in
Science
Attitude Scale
Scal
e M
ean
(max
5)
New Zealand
Australia
Table 4.4 Comparison of New Zealand and Australian Means for TOSRA
Attitude Scale New Zealand Study Scale mean
Australian studies Scale Mean
Social Implications of Science 3.27 3.65 Normality of Scientists 3.44 3.61 Attitude to Scientific Inquiry 3.77 3.71 Adoption of Scientific Attitudes 3.41 3.82 Enjoyment of Science Lessons 2.95 3.24 Leisure Interest in Science 2.43 2.59 Career Interest in Science 2.75 2.77
n = 312 n = 324
Figure 4.1. TOSRA mean scores for New Zealand and Australia
4.4 CONCLUSION
It has been one of the purposes of this study to validate the TOSRA and this chapter
has outlined through descriptive statistics how this was achieved. It has shown that
the TOSRA with some modifications is a reliable and valid instrument for New
Zealand conditions and students.

80
The original 70 items have been reduced to 56 to ensure that the items with the
strongest interscale correlations are retained. The scale for Attitude to Scientific
Enquiry has changed the most with only five of the original ten items being retained
in the final form of the instrument. However overall, the results of the validation
indicate that the TOSRA can be used with confidence with the students throughout
the study.
The findings for this instrument in New Zealand are similar to previous findings from
Australian samples of secondary school science students of the same age and year
level. A comparison of the two sets of results shows that generally the New Zealand
results may be a slightly lower for most of the TOSRA scales, except for the Attitude
to Scientific Enquiry and Career Interest in Science, where the results are essentially
identical. It should however be noted that the drawing of conclusions about these
small differences on student attitudes in different countries and in a time frame
spanning two decades is probably only speculation.
Overall, the final version of the TOSRA, with some modification, is a valid and
reliable instrument for the measurement of students’ attitudes towards science in
New Zealand Schools. The pattern and trends are very similar to those shown by
Fraser (1981a) and as such its use is justifiable.
81
CHAPTER 5
GENDER AND ATTITUDES TO SCIENCE: SCHOOL, YEAR AND BAND

82
5.1 OVERVIEW
The second objective of this study was ‘to determine relationships of grade and
gender of students with their attitudes to science’.
Quantitative data were collected using TOSRA on two different occasions
throughout the school year with the first administration occurring in May, which was
before the cooperative group work was started, and the second in November at the
completion of the work. Total student numbers were 312. The decision was taken to
investigate comparisons of science related attitudes within the various subgroups
using the November TOSRA results because the patterns and attitudes of students
within the particular class environment would have been well established by then and
the students had been working in cooperative groups for three terms.
This chapter explores the use of the TOSRA in firstly comparing the relative
attitudes of boys and girls within the whole sample. Then the effects of gender are
considered in bands and years, with any significant variations in the TOSRA scales
between the genders being discussed. The significance of the school, along with the
year and bands, are then analysed and discussed. There is some consideration given
to possible effects of the science teacher on the attitudes towards science in any
given class.
The final analysis reported in this chapter is the comparison of all student attitudes
by band. Finally, the significance of all the results is considered in the chapter
discussion.
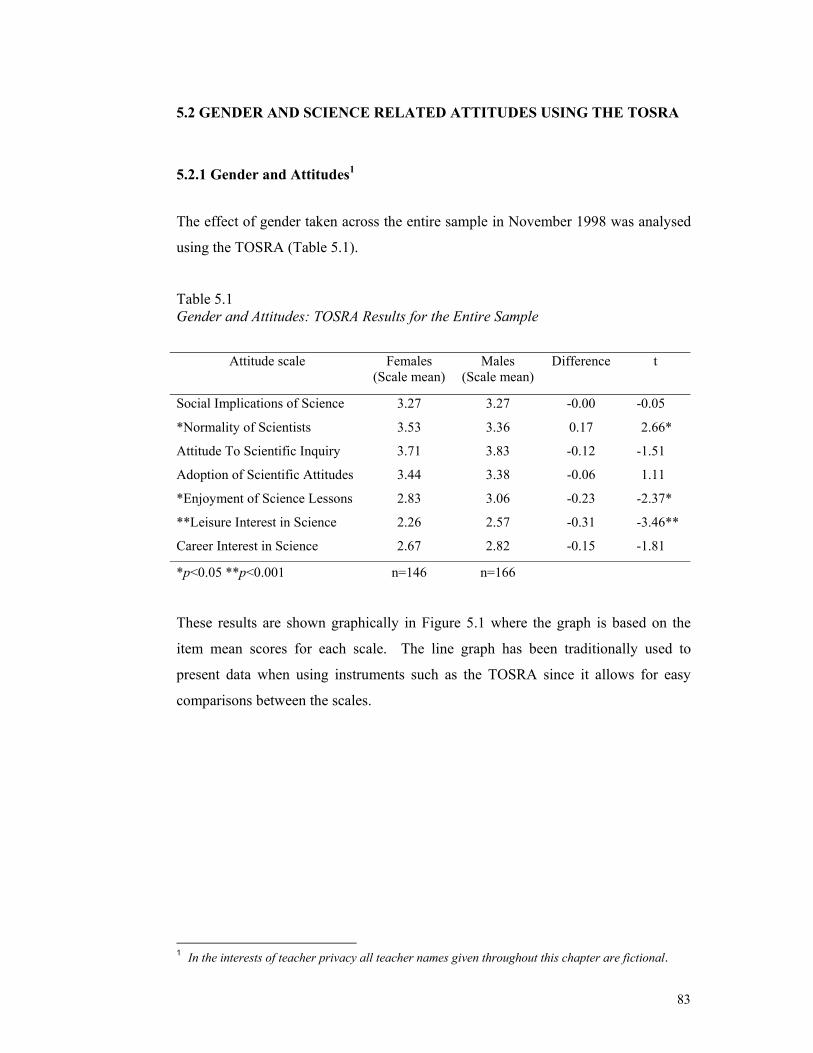
83
5.2 GENDER AND SCIENCE RELATED ATTITUDES USING THE TOSRA
5.2.1 Gender and Attitudes1
The effect of gender taken across the entire sample in November 1998 was analysed
using the TOSRA (Table 5.1).
Table 5.1 Gender and Attitudes: TOSRA Results for the Entire Sample
These results are shown graphically in Figure 5.1 where the graph is based on the
item mean scores for each scale. The line graph has been traditionally used to
present data when using instruments such as the TOSRA since it allows for easy
comparisons between the scales.
1 In the interests of teacher privacy all teacher names given throughout this chapter are fictional.
Attitude scale Females (Scale mean)
Males (Scale mean)
Difference t
Social Implications of Science 3.27 3.27 -0.00 -0.05
*Normality of Scientists 3.53 3.36 0.17 2.66*
Attitude To Scientific Inquiry 3.71 3.83 -0.12 -1.51
Adoption of Scientific Attitudes 3.44 3.38 -0.06 1.11
*Enjoyment of Science Lessons 2.83 3.06 -0.23 -2.37*
**Leisure Interest in Science 2.26 2.57 -0.31 -3.46**
Career Interest in Science 2.67 2.82 -0.15 -1.81
*p<0.05 **p<0.001 n=146 n=166
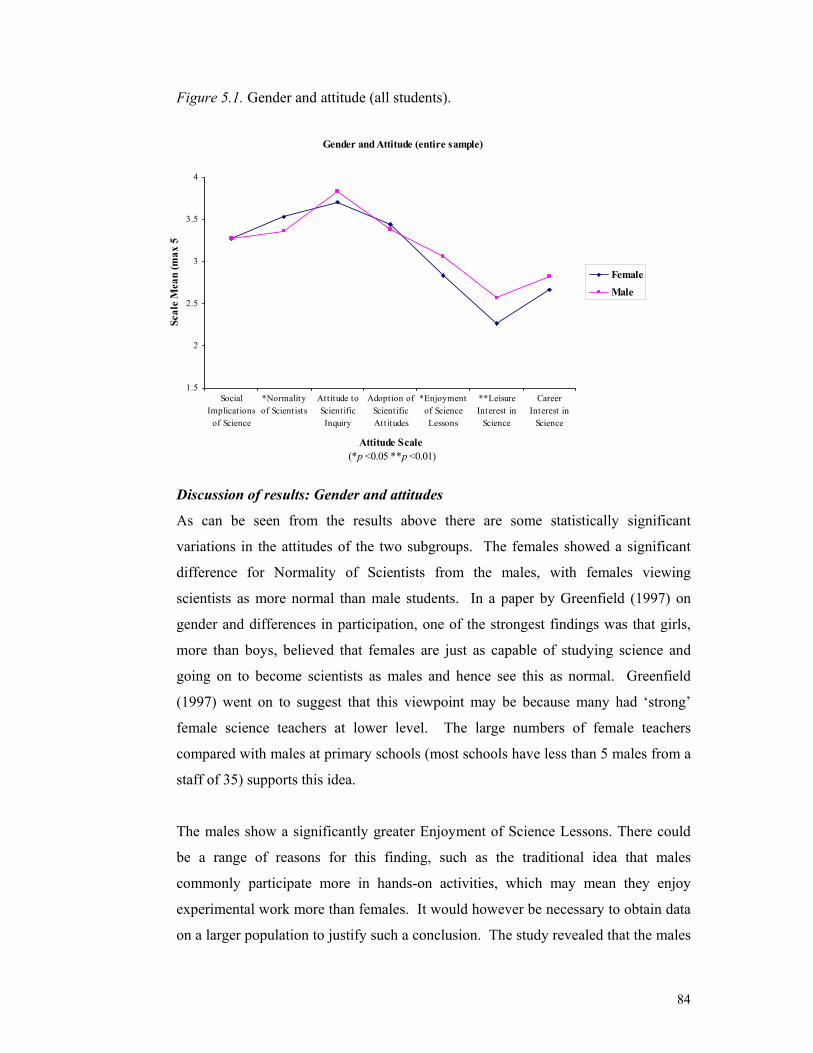
84
Gender and Attitude (entire sample)
1.5
2
2.5
3
3.5
4
SocialImplications
of Science
*Normalityof Scientists
Attitude toScientificInquiry
Adoption ofScientificAttitudes
*Enjoymentof ScienceLessons
**LeisureInterest in
Science
CareerInterest in
Science
Attitude Scale (*p <0.05 **p <0.01)
Scal
e M
ean
(max
5)
FemaleMale
Figure 5.1. Gender and attitude (all students).
Discussion of results: Gender and attitudes
As can be seen from the results above there are some statistically significant
variations in the attitudes of the two subgroups. The females showed a significant
difference for Normality of Scientists from the males, with females viewing
scientists as more normal than male students. In a paper by Greenfield (1997) on
gender and differences in participation, one of the strongest findings was that girls,
more than boys, believed that females are just as capable of studying science and
going on to become scientists as males and hence see this as normal. Greenfield
(1997) went on to suggest that this viewpoint may be because many had ‘strong’
female science teachers at lower level. The large numbers of female teachers
compared with males at primary schools (most schools have less than 5 males from a
staff of 35) supports this idea.
The males show a significantly greater Enjoyment of Science Lessons. There could
be a range of reasons for this finding, such as the traditional idea that males
commonly participate more in hands-on activities, which may mean they enjoy
experimental work more than females. It would however be necessary to obtain data
on a larger population to justify such a conclusion. The study revealed that the males
85
scored higher on Leisure Interest in Science scale than did the females. Fraser
(1981a) noted that the highest scale inter-correlations occur between the scales
Enjoyment of Science Lessons, Leisure Interest in Science and Career Interest in
Science. While these scales are conceptually distinct, they are expected to be
reasonably well correlated because there would be a tendency for a student who
enjoys science lessons to be more likely to have leisure and career interests in
science. In a study by Jones, Howe, and Rua (2000) on the attitudes and experiences
of 437 11 and 12 year old students, males reported more extracurricular activities
with a variety of items such as batteries, electric toys, fuses, microscopes and
pulleys. They also had more interest than the females did in atomic bombs, atoms,
cars, computers and X-rays. Their female counter-parts were more likely to have
experiences with bread making, knitting, sewing and planting seeds. The females
also had more general interest in animal communications, rainbows, healthy eating,
weather and AIDS. Females wanted more ‘to help other people’ while the males
reported that science was often destructive, dangerous and more suitable for boys.
This possibly leads to boys expressing a greater degree of leisure interest and
enjoyment in science.
5.2.2 Gender and Attitudes: Years and Bands
This population was derived from all of the schools except School 4, which consisted
of only a lower ability band and so was excluded from this analysis. The other
schools all had two distinct ability bands of students at each year level. There was an
upper ability and a middle ability band class selected from each year level, Year 9
and Year 10. Hence the total population of the sample used in this analysis was 294
with each year level ability band coming from three classes.
The results follow in Tables 5.2, 5.3, 5.5 and Figures 5.2, 5.3, 5.5 with a summary
Table 5.6 and then the discussion of the results.

86
Gender: Year 9 Middle Band
1.5
2
2.5
3
3.5
4
4.5
*SocialImplications of
Science
Normality ofScientists
Attitude toScientificInquiry
Adoption ofScientificAttitudes
*Enjoyment ofScienceLessons
Leisure Interestin Science
Career Interestin Science
Attitude Scale (*p <0.05)
Scal
e M
ean
(Max
. 5)
Female
Male
Table 5.2 Gender: Year 9 Middle Band
Figure 5.2. Gender: Year 9 middle band.
Attitude scale Females (Scale mean)
Males (Scale mean)
Difference t
Social Implications of Science 3.13 3.39 -0.26 -2.01*
Normality of Scientists 3.40 3.40 0.00 0.00
Attitude to Scientific Inquiry 3.54 3.78 -0.24 -1.48
Adoption of Scientific Attitudes 3.55 3.50 -0.05 -1.08
*Enjoyment of Science Lessons 2.77 3.25 -0.48 -2.33*
Leisure Interest in Science 2.24 2.48 -0.24 -1.30
Career Interest in Science 2.63 2.72 -0.09 -0.58
*p<0.05 n=31 n=34
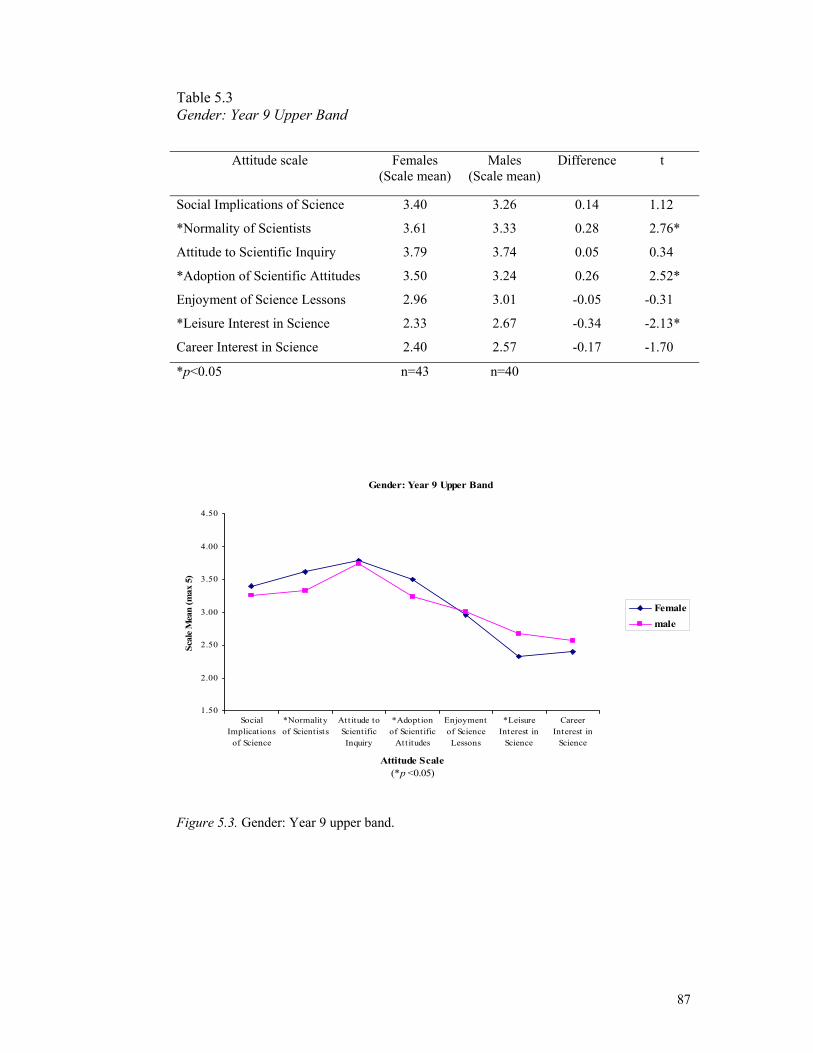
87
Table 5.3 Gender: Year 9 Upper Band
Figure 5.3. Gender: Year 9 upper band.
Attitude scale Females (Scale mean)
Males (Scale mean)
Difference t
Social Implications of Science 3.40 3.26 0.14 1.12
*Normality of Scientists 3.61 3.33 0.28 2.76*
Attitude to Scientific Inquiry 3.79 3.74 0.05 0.34
*Adoption of Scientific Attitudes 3.50 3.24 0.26 2.52*
Enjoyment of Science Lessons 2.96 3.01 -0.05 -0.31
*Leisure Interest in Science 2.33 2.67 -0.34 -2.13*
Career Interest in Science 2.40 2.57 -0.17 -1.70
*p<0.05 n=43 n=40
Gender: Year 9 Upper Band
1.50
2.00
2.50
3.00
3.50
4.00
4.50
SocialImplications
of Science
*Normalityof Scientists
Attitude toScientificInquiry
*Adoptionof Scientific
Attitudes
Enjoymentof ScienceLessons
*LeisureInterest in
Science
CareerInterest in
Science
Attitude Scale (*p <0.05)
Scal
e M
ean
(max
5)
Femalemale

88
Gender: Year 10 Middle Band
1.5
2
2.5
3
3.5
4
4.5
SocialImplications
of Science
*Normalityof Scientists
Attitude toScientificInquiry
Adoption ofScientificAttitudes
Enjoymentof ScienceLessons
*LeisureInterest in
Science
CareerInterest in
Science
Attitude Scale (p <0.05)
Scal
e M
ean
(max
5)
FemaleMale
Table 5.4 Gender: Year 10 Middle Band
Figure 5.4. Gender: Year 10 middle band.
Attitude scale Females (Scale mean)
Males (Scale mean)
Difference t
Social Implications of Science 3.27 3.15 0.12 0.86
*Normality of Scientists 3.58 3.31 0.29 2.05*
Attitude to Scientific Inquiry 3.85 3.82 0.03 0.20
Adoption of Scientific Attitudes 3.42 3.32 0.10 0.68
Enjoyment of Science Lessons 2.91 2.96 -0.05 -0.20
*Leisure Interest in Science 2.13 2.55 -0.42 -2.25*
Career Interest in Science 2.48 2.66 -0.18 -0.95
*p<0.05 n=23 n=41

89
Table 5.5 Gender: Year 10 Upper Band
Figure 5.5. Gender: Year 10 upper band.
Attitude scale Females (Scale mean)
Males (Scale mean)
Difference t
Social Implications of Science 3.26 -3.33 0.07 -0.56
Normality of Scientists 3.52 3.40 0.12 0.95
Attitude to Scientific Inquiry 3.66 -3.95 0.29 -1.80
Adoption of Scientific Attitudes 3.50 3.50 0.00 0.02
Enjoyment of Science Lessons 2.78 -3.05 0.27 -1.49
Leisure Interest in Science 2.40 -2.57 0.17 -0.92
Career Interest in Science 2.78 -2.87 0.09 -0.52
No significant differences n=43 n=39
Gender: Year 10 Upper Band
1.50
2.00
2.50
3.00
3.50
4.00
4.50
SocialImplications
of Science
Normality ofScientists
Attitude toScientificInquiry
Adoption ofScientificAttitudes
Enjoyment ofScienceLessons
LeisureInterest in
Science
CareerInterest in
Science
Attitude Scale (nil significance)
Scal
e M
ean
(max
5)
FemaleMale

90
Table 5.6 Summary of Gender Differences for Years and Bands: Year and Band Data
Attitude Scale Y9 Middle
Y9 Upper
Y10 Middle
Y10 Upper
All Students
Social Implications of Science p<0.05 Males
Normality of Scientists p<0.01 Females
p<0.05 Females
p<0.05 Females
Attitude to Scientific Inquiry
Adoption of Scientific Attitudes p<0.05 Males
Enjoyment of Science Lessons p<0.05 Males
p<0.05 Males
Leisure Interest in Science p<0.05
Males p<0.05 Males
p<0.01 Males
Career Interest in Science
n=65 n=83 n=64 n=82 n=294
Discussion of results: Summary of gender differences for Years and Bands
There are some consistent threads running through the gender differences at different
levels. The upper band Year 9 girls (Table 5.3 and Figure 5.3) and middle Year 10
girls (Table 5.4 and fig. 5.4) exhibit significantly higher scores for the Normality of
Scientists attitude (p<0.01 and p<0.05, respectively) when compared with boys. As
mentioned earlier this may in part be due to the boys preoccupation with scientists
being people who make bombs and other such destructive devices. It should be
noted, however, that by the time upper Year 10 (Table 5.5 and Figure 5.5) is reached
this gap is considerably reduced with the boys thinking more about such sweeping
statements.
As Fraser (1981a) reported there are highest scale inter-correlations between
Enjoyment of Science Lessons and Leisure Interest in Science and Career Interest in
Science. This trend in the relative leisure interest of boys and girls as they go
through the junior school can be related to the findings of Baker and Leary (1995).
They reported in their study that Year 9 girls in general liked science but in fact
thought that their friends would not support the idea of a career (and hence leisure
interest) in science. By the time they are going into Year 11 this trend is reversed
with their friends supportive of science as a career. This helps to explain the lack of

91
any significant differences at the upper band of Year 10 where the more able and
mature students think more this way.
There is quite a marked difference between the students at each of the bands at
Year 9. The middle band boys (Table 5.2 and Figure 5.2) showed significant
differences (p<0.05) in the scales Social Implications of Science and Enjoyment of
Science Lessons. This is probably due to the interest in hands-on work in science
and the observation by the researcher that boys tend to be the ‘doers’ during the
initial years at secondary school, especially in the mixed ability classes where girls
often tend to ‘stand back’ because they tend to have less confidence in the laboratory
in general (see Chapter 6). Research by Okebukola (1986) on the effects of
cooperative learning on the attitudes of students towards laboratory work found that
there was a significant difference in gender with the boys having more positive
attitudes than girls for both the cooperative and non-cooperative learning groups.
This is probably because of differences in earlier experiences reported earlier in this
chapter. The significant difference in the Social Implications of Science (p<0.05)
reflects the observations by Kahle and Lakes (1983) that boys indicated that they had
read more science articles and watched more science related television shows than
had the girls and would hence consider the social implications more.
At the upper Year 9 level the boys show a significant difference (p<0.05) in the
Adoption of Scientific Attitudes and this perhaps reflects the experiences they have
had through their formative years and that they are in the top band. The relative
improvement of the girls in the upper band of Year 10 (Table 5.5 and Figure 5.5) is
shown by the fact that the girls have now improved in this aspect when compared
with the boys both exhibiting exactly the same mean scale score of 3.5. This is
similarily consistent right throughout the entire upper band of Year 10 where there
are no significant differences between the attitudes of males and females.

92
5.2.3 Gender and Attitudes: School, Year and Band Science related-attitudes and gender were compared between classes at each of the
three schools for the same year level and band. The range of classes analysed is
outlined in Table 5.7.
Table 5.7 Gender Comparisons: School, Year and Band
Year Ability Band School: Teacher of the class (years experience) Figure School 1 School 2 School 3
9 Middle 1 (Mike <2y) 2 (Truby >15y) 3 (Barbara <5y) 5.6
9 Upper 1 (Mike <2y) 2 (Sandra <5y) 3 (Linda <2y) 5.7
10 Middle 1 (Brian >15y) 2 (Sandra <5y) 3 (Tuk <15y) 5.8
10 Upper 1 (Brian >15y) 2 (Truby >15y) 3 (Ken >15y) 5.9
The teacher profiles for gender and experience teaching are listed in the summary
Table 5.20. In this section the discussion of the three schools at a particular band and
year level can be found at the end of the three tables and plots of the results.

93
Gender: Year 9 Middle Band School 1
1.5
2
2.5
3
3.5
4
4.5
SocialImplicationsof Science
Normality ofScientists
Attitude toScientificInquiry
Adoption ofScientificAttitudes
Enjoyment ofScienceLessons
LeisureInterest in
Science
CareerInterest in
Science
Attitude Scale (nil significance)
Scal
e M
ean
(max
5)
Female (11)Male (12)
Gender: Year 9 middle ability band classes for Schools 1, 2, 3
The data for this year level and band are presented in Tables 5.8, 5.9, 5.10 and
Figures 5.6.1, 5.6.2 and 5.6.3. This is then followed by a discussion of the results.
School 1 Table 5.8 Gender: Year 9 Middle Band School 1
Figure 5.6.1. Gender: School 1 Year 9 middle band (Mike <2y).
Year 9 Middle Band School 1 Attitude Scale
Females (Scale Mean)
Males (Scale Mean) Difference t
Social Implications of Science 3.25 3.53 -0.28 -1.07 Normality of Scientists 3.28 3.64 -0.36 -1.34 Attitude to Scientific Inquiry 3.28 3.61 -0.33 -1.019 Adoption of Scientific Attitudes 3.16 3.58 -0.42 -1.54 Enjoyment of Science Lessons 2.80 3.13 -0.33 -0.91 Leisure Interest in Science 2.42 2.72 -0.30 -2.21 Career Interest in Science 2.59 2.78 -0.19 -0.68 (nil significance) n=11 n=12

94
Gender: Year 9 Middle Band School 2
1.5
2
2.5
3
3.5
4
4.5
SocialImplications
of Science
Normality ofScientists
Attitude toScientificInquiry
Adoption ofScientificAttitudes
Enjoyment ofScienceLessons
LeisureInterest in
Science
CareerInterest in
Science
Attitude Scale (nil significance)
Scal
e M
ean
(max
5)
Female (9)Male (11)
School 2 Table 5.9 Gender: Year 9 Middle Band School 2
Figure 5.6.2. Gender: School 2 Year 9 middle band (Truby >15y).
Year 9 Middle Band School 2 Attitude Scale
Females (Scale Mean)
Males (Scale Mean) Difference t
Social Implications of Science 3.17 3.15 0.02 0.10 Normality of Scientists 3.56 3.32 0.24 0.87 Attitude to Scientific Inquiry 3.67 3.80 -0.13 -0.51 Adoption of Scientific Attitudes 3.90 3.35 0.55 0.18 Enjoyment of Science Lessons 2.38 2.87 -0.49 -0.144 Leisure Interest in Science 1.79 2.46 -0.33 -2.95 Career Interest in Science 2.26 2.86 -0.60 -2.03 (nil significance) n=9 n=11

95
Gender: Year 9 Middle Band School 3
1.50
2.00
2.50
3.00
3.50
4.00
4.50
*SocialImplications
of Science
Attitude toScientificInquiry
*Enjoymentof ScienceLessons
CareerInterest in
ScienceAttitude Scale
(p <0.05)
Scal
e M
ean
(max
5) Fenale (11)
Male (11)
School 3 Table 5.10 Gender: Year 9 Middle Band School 3
Figure 5.6.3. Gender: School 3 Year 9 middle band (Barbara <5y).
Year 9 Middle Band School 3 Attitude Scale
Females (Scale mean)
Males (Scale mean) Difference t
*Social Implications of Science 3.00 3.50 -0.50 -2.77* Normality of Scientists 3.40 3.23 0.27 0.72 Attitude to Scientific Inquiry 3.68 3.95 -0.27 -0.99 Adoption of Scientific Attitudes 3.51 3.56 -0.05 -0.19 *Enjoyment of Science Lessons 3.05 3.77 -0.72 -2.21* Leisure Interest in Science 2.42 2.24 0.18 0.58 Career Interest in Science 2.95 2.52 0.43 1.49 (*p<0.05) n=11 n=11

96
Discussion of results: Year 9 Middle Band Schools 1, 2, 3
On comparison of these equivalent (middle band) classes at Year 9 (Tables 5.8, 5.9,
5.10 and Figures 5.6.1, 5.6.2, 5.6.3) it can be seen that the science-related attitudes of
the boys and girls are similar with the exception of the boys showing more
Enjoyment of Science Lessons than the girls. However, the only statistically
significant variation is found in School 3. A young teacher, Barbara taught this class
while School 1 had another young teacher, Mike, School 2 had the more experienced
teacher, Truby. The pattern for the rest of the attitudes is similar with the exception
of School 2. The researcher made observations in these classrooms and noted that the
teachers had differing styles. Barbara had her groups very well organised, especially
in practical work, where the students knew who was allocated to each of the jobs as
equipment manager, technician and recorder. The boys in particular seemed to enjoy
this because they were usually far less organised than the girls, which may account
for the higher scores for the Enjoyment of Science Lessons attitude. Truby’s class
was run in a very traditional manner and students respected what was being done and
simply worked well in their groups while Mike, a very enthusiastic second-year
teacher, tried hard to enthuse his students. All of the students seemed to enjoy being
in his class and the boys and girls operated in a similar fashion during practical work.
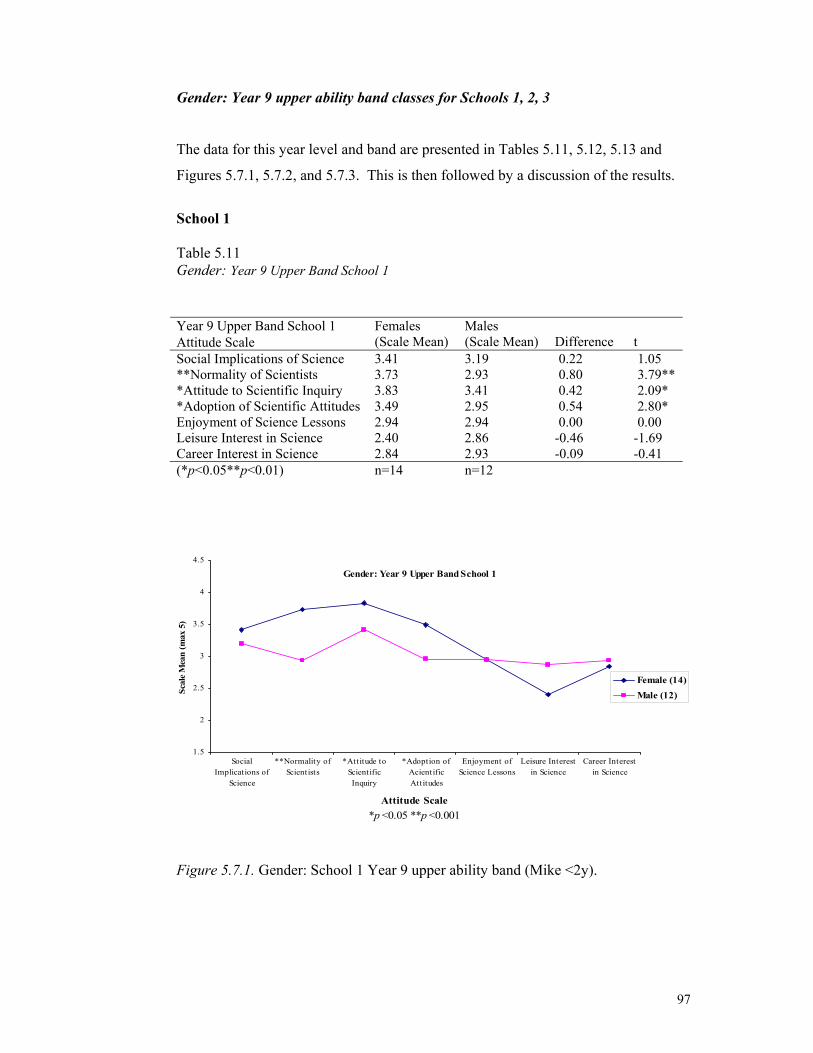
97
Gender: Year 9 Upper Band School 1
1.5
2
2.5
3
3.5
4
4.5
SocialImplications of
Science
**Normality ofScientists
*Attitude toScientificInquiry
*Adoption ofAcientificAttitudes
Enjoyment ofScience Lessons
Leisure Interestin Science
Career Interestin Science
Attitude Scale *p <0.05 **p <0.001
Scal
e M
ean
(max
5)
Female (14)Male (12)
Gender: Year 9 upper ability band classes for Schools 1, 2, 3
The data for this year level and band are presented in Tables 5.11, 5.12, 5.13 and
Figures 5.7.1, 5.7.2, and 5.7.3. This is then followed by a discussion of the results.
School 1 Table 5.11 Gender: Year 9 Upper Band School 1
Figure 5.7.1. Gender: School 1 Year 9 upper ability band (Mike <2y).
Year 9 Upper Band School 1 Attitude Scale
Females (Scale Mean)
Males (Scale Mean) Difference t
Social Implications of Science 3.41 3.19 0.22 1.05 **Normality of Scientists 3.73 2.93 0.80 3.79** *Attitude to Scientific Inquiry 3.83 3.41 0.42 2.09* *Adoption of Scientific Attitudes 3.49 2.95 0.54 2.80* Enjoyment of Science Lessons 2.94 2.94 0.00 0.00 Leisure Interest in Science 2.40 2.86 -0.46 -1.69 Career Interest in Science 2.84 2.93 -0.09 -0.41 (*p<0.05**p<0.01) n=14 n=12

98
Gender: Year 9 Upper Band School 2
1.5
2
2.5
3
3.5
4
4.5
SocialImplications
of Science
Normality ofScientists
Attitude toScientificInquiry
Adoption ofAcientificAttitudes
*Enjoymentof ScienceLessons
LeisureInterest in
Science
CareerInterest in
ScienceAttitude Scale
*p <0.05
Scal
e M
ean
(max
5)
Female (15)Male (15)
School 2 Table 5.12 Gender: Year 9 Upper Band School 2
Figure 5.7.2. Gender: School 2 Year 9 upper ability band (Sandra <5y).
Year 9 Upper Band School 2 Attitude Scale
Females (Scale Mean)
Males (Scale Mean) Difference t
Social Implications of Science 3.31 3.56 -0.25 -1.13 Normality of Scientists 3.47 3.54 -0.07 -0.43 Attitude to Scientific Inquiry 3.70 4.01 -0.31 -1.07 Adoption of Scientific Attitudes 3.39 3.47 -0.08 -0.45 *Enjoyment of Science Lessons 2.50 3.31 -0.81 -2.29* Leisure Interest in Science 2.19 2.65 -0.46 -1.53 Career Interest in Science 2.64 3.11 -0.47 -1.90 (*p<0.05) n=15 n=15
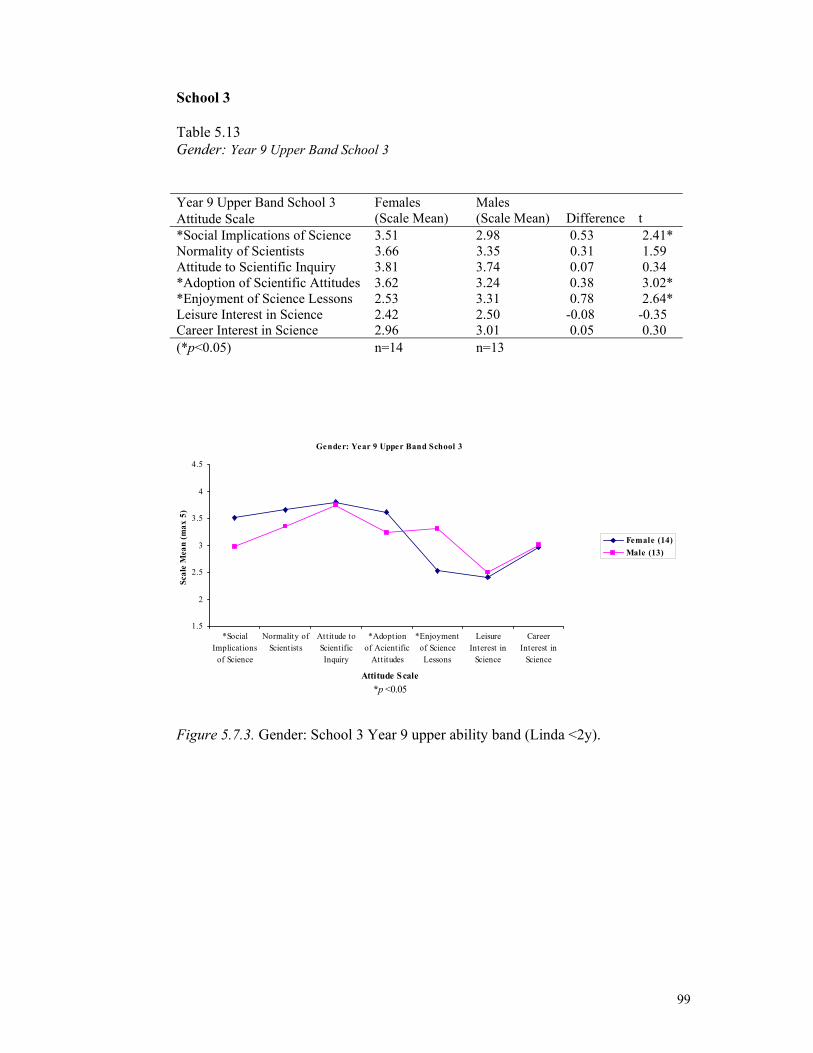
99
Gender: Year 9 Upper Band School 3
1.5
2
2.5
3
3.5
4
4.5
*SocialImplications
of Science
Normality ofScientists
Attitude toScientificInquiry
*Adoptionof Acientific
Attitudes
*Enjoymentof ScienceLessons
LeisureInterest in
Science
CareerInterest in
Science
Attitude Scale *p <0.05
Scal
e M
ean
(max
5)
Female (14)Male (13)
School 3 Table 5.13 Gender: Year 9 Upper Band School 3
Figure 5.7.3. Gender: School 3 Year 9 upper ability band (Linda <2y).
Year 9 Upper Band School 3 Attitude Scale
Females (Scale Mean)
Males (Scale Mean) Difference t
*Social Implications of Science 3.51 2.98 0.53 2.41* Normality of Scientists 3.66 3.35 0.31 1.59 Attitude to Scientific Inquiry 3.81 3.74 0.07 0.34 *Adoption of Scientific Attitudes 3.62 3.24 0.38 3.02* *Enjoyment of Science Lessons 2.53 3.31 0.78 2.64* Leisure Interest in Science 2.42 2.50 -0.08 -0.35 Career Interest in Science 2.96 3.01 0.05 0.30 (*p<0.05) n=14 n=13

100
Discussion of results: Year 9 Upper Band Schools 1, 2, 3
When comparisons of students in the upper band of Year 9 (Tables 5.11, 5.12, 5.13
and Figures 5.7.1, 5.7.2, 5.7.3) are made it can be seen that there are some
statistically significant differences. All of these teachers are young and in their first
five years of teaching. Mike is an enthusiastic male early in his teaching career and
is well organised. The girls in his class showed significantly significant positive
attitudes towards the Normality of Scientists (p<0.001), Attitude to Scientific
Enquiry (p<0.05) and Adoption of Scientific Attitudes when compared with the boys
of this class. In the classes of the two young female teachers (Sandra and Linda), the
attitudes of the girls and the boys for these scales are essentially the same. In New
Zealand as with many other countries students experience very few science teachers
during their pre secondary school days and most of their teachers are in fact female.
This could mean that Mike is one of the first male scientists the girls have
experienced. The boys may simply see him as ‘another guy’.
On the enjoyment scale the roles are reversed, however, with the boys showing
considerably more enjoyment of science in Linda and Sandra’s classes (p<0.05).
The boys enjoyed being in Sandra and Linda’s classes where the teaching styles of
are different from those of Mike. Sandra and Linda were both more structured and
precise in their set up of classes for laboratory work and the boys seem to find that
this is easier and a better experience for them (according to both Sandra and Linda).
Some of the qualitative data collected by Ferguson and Fraser (1998) suggested that
boys were more concerned about the equipment and facilities and the types of
experiences supports this to a certain extent.

101
Gender: Year 10 Middle Band School 1
0
0.5
1
1.5
2
2.5
3
3.5
4
4.5
SocialImplications
of Science
*Normalityof Scientists
Attitude toScientificInquiry
Adoption ofAcientificAttitudes
Enjoymentof ScienceLessons
LeisureInterest in
Science
CareerInterest in
Science
Attitude Scale *p <0.05
Scal
e M
ean
(max
5)
Female (8)Male (14)
Gender: Year 10 middle ability band classes for Schools 1, 2, 3
The data for this year level and band are presented in Tables 5.13, 5.15, 5.16 and
Figures 5.8.1, 5.8.2 and 5.8.3. This is then followed by a discussion of the results.
School 1 Table 5.14 Gender: Year 10 Middle Band School 1
Figure 5.8.1. Gender: School 1 Year 10 middle ability band (Brian >15y).
Year 10 Middle Band School 1 Attitude Scale
Females (Scale Mean)
Males (Scale Mean) Difference t
Social Implications of Science 3.43 3.31 0.12 0.63 *Normality of Scientists 3.75 3.28 0.47 2.98*Attitude to Scientific Inquiry 3.93 3.94 -0.01 -0.06 Adoption of Scientific Attitudes 3.59 3.29 0.20 1.26 Enjoyment of Science Lessons 3.44 3.09 0.35 1.42 Leisure Interest in Science 2.32 2.29 0.03 0.09 Career Interest in Science 2.69 2.48 0.19 0.64 (*p<0.05) n=8 n=14
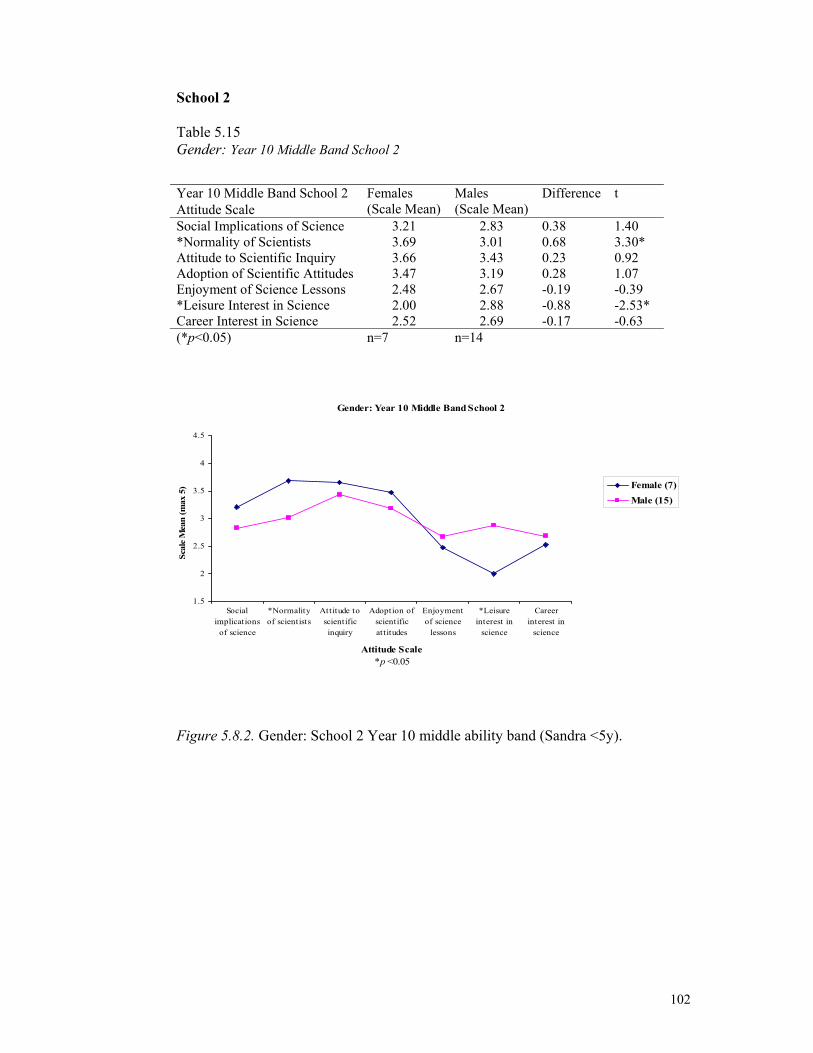
102
School 2 Table 5.15 Gender: Year 10 Middle Band School 2
Figure 5.8.1. School 1 Year 10 middle band (Brian).
Figure 5.8.2. Gender: School 2 Year 10 middle ability band (Sandra <5y).
Year 10 Middle Band School 2 Attitude Scale
Females (Scale Mean)
Males (Scale Mean)
Difference t
Social Implications of Science 3.21 2.83 0.38 1.40 *Normality of Scientists 3.69 3.01 0.68 3.30* Attitude to Scientific Inquiry 3.66 3.43 0.23 0.92 Adoption of Scientific Attitudes 3.47 3.19 0.28 1.07 Enjoyment of Science Lessons 2.48 2.67 -0.19 -0.39 *Leisure Interest in Science 2.00 2.88 -0.88 -2.53* Career Interest in Science 2.52 2.69 -0.17 -0.63 (*p<0.05) n=7 n=14
Gender: Year 10 Middle Band School 2
1.5
2
2.5
3
3.5
4
4.5
Socialimplications
of science
*Normalityof scientists
Attitude toscientificinquiry
Adoption ofscientificattitudes
Enjoymentof science
lessons
*Leisureinterest in
science
Careerinterest in
science
Attitude Scale *p <0.05
Scal
e M
ean
(max
5) Female (7)
Male (15)

103
School 3 Table 5.16 Gender: Year 10 Middle Band School 3
Figure 5.8.3. Gender: School 3 Year 10 middle ability band (Tuk >15y).
Year 10 Middle Band School 3 Attitude Scale
Females (Scale Mean)
Males (Scale Mean) Difference t
Social implications of science 3.18 3.37 -0.19 -0.65 Social Implications of Science 3.31 3.73 -0.44 -1.57 Normality of Scientists 3.95 4.16 -0.21 -0.72 Attitude to Scientific Inquiry 3.21 3.52 -0.31 -0.98 Adoption of Scientific Attitudes 2.76 3.18 -0.42 -1.05 Enjoyment of Science Lessons 2.04 2.44 -0.40 -1.10 Leisure Interest in Science 2.25 2.84 0.69 -1.49 (*p<0.05) n=8 n=12
Gender: Year 10 Middle Band School 3
1.5
2
2.5
3
3.5
4
4.5
Socialimplications
of science
Normality ofscientists
Attitude toscientificinquiry
Adoption ofscientificattitudes
Enjoymentof science
lessons
Leisureinterest in
science
Careerinterest in
science
Attitude Scale (nil significance)
Sacl
e M
ean
(max
5)
Female (8)Male (12)

104
Discussion of results: Year 10 Middle Band Schools 1, 2, 3
A comparison between the students in the Year 10 middle ability band (Tables 5.13,
5.15, 5.16 and Figures 5.8.1, 5.8.2, 5.8.3) does reveal some significant differences.
The teaching style of various teachers was established through observation and
discussions with both the teachers and the head of department. Two experienced
teachers, Brian and Tuk, teach in School 1 and 3 whereas Sandra, a young teacher,
takes the college 2 class. The only statistically significant difference between the
boys and girls in Brian’s and Tuk’s classes is for Brian where the girls score higher
in the Normality of Scientists scale (p<0.05). Brian and Tuk are similar teachers in
many ways, both running a more relaxed yet organised classroom environment using
their experience to keep students on task. This approach appears to have a less
polarizing effect on the boys and girls in their classes with the girls showing more
positive attitudes towards the Normality of Scientists only in Brian’s class. Sandra’s
teaching style, described previously, is organised and efficient and may have lead to
the girls being more positive towards the Normality of Scientists and the boys
showing a more positive attitude towards Leisure Interest in Science. On the
occasions that the researcher observed this class Sandra did make use of anecdotal
examples in her teaching, which may have influenced the boys’ interest more than
the girls. Johnson and Johnson (1987) and Kahle and Lakes (1983) suggest that
boys of this age often tend to have more ‘tinkering’ experiences (playing with
gadgets) outside the classroom than do girls.
The influence of the teacher and resulting classroom environment along with
preconceived ideas students bring to school with them go some of the way to helping
explain some of these gender attitude differences exhibited.

105
Gender: Year 10 Upper Band School 1
1.5
2
2.5
3
3.5
4
4.5
SocialImplications
of Science
Normality ofScientists
*Attitude toScientificInquiry
Adoption ofAcientificAttitudes
Enjoyment ofScienceLessons
LeisureInterest in
Science
CareerInterest in
Science
Attitude Scale *p <0.05
Scal
e M
ean
(max
5)
Female (14)Male (15)
Gender: Year 10 upper ability band classes for Schools 1, 2, 3
The data for this year level and band are presented in Tables 5.17, 5.18, 5.19 and
Figures 5.9.1, 5.9.2 and 5.9.3. This is then followed by a discussion of the results.
School 1
Table 5.17
Gender: Year 10 Upper Band School 1
Figure 5.9.1. Gender: School 1 Year 10 upper ability band (Brian >15y).
Year 10 Upper Band School 1 Attitude Scale
Females (Scale Mean)
Males (Scale Mean) Difference t
Social Implications of Science 3.14 3.35 -0.21 -0.92 Normality of Scientists 3.51 3.26 0.25 1.10 *Attitude to Scientific Inquiry 3.69 4.35 -0.76 -2.17* Adoption of Scientific Attitudes 3.48 3.51 -0.03 -0.17 Enjoyment of Science Lessons 2.87 3.08 -0.21 -0.52 Leisure Interest in Science 2.06 2.62 -0.56 -1.92 Career Interest in Science 2.52 2.87 -0.35 -1.11 (*p<0.05) n=14 n=15

106
Gender: Year 10 Upper Band School 2
1.5
2
2.5
3
3.5
4
4.5
SocialImplications
of Science
Normality ofScientists
Attitude toScientificInquiry
Adoption ofAcientificAttitudes
Enjoymentof ScienceLessons
LeisureInterest in
Science
CareerInterest in
Science
Attitude Scale(nil significance)
Scal
e M
ean
(max
5)
Female (13)Male (13)
School 2 Table 5.18 Gender: Year 10 Upper Band School 2
Figure 5.9.2. Gender: School 2 Year 10 upper ability band (Truby >15y).
Year 10 Upper Band School 2 Attitude Scale
Females (Scale Mean)
Males (Scale Mean) Difference t
Social Implications of Science 3.55 3.39 0.16 0.70 Normality of Scientists 3.88 3.65 0.23 1.23 Attitude to Scientific Inquiry 4.11 3.94 0.17 0.69 Adoption of Scientific Attitudes 3.75 3.64 -0.11 -0.64 Enjoyment of Science Lessons 2.74 2.97 -0.23 -0.77 Leisure Interest in Science 2.44 2.31 0.13 0.37 Career Interest in Science 2.81 2.68 0.13 0.35 (nil significance) n=13 n=13

107
Gender: Year 10 Upper Band School 3
1.5
2
2.5
3
3.5
4
4.5
SocialImplications
of Science
Normality ofScientists
Attitude toScientificInquiry
Adoption ofAcientificAttitudes
Enjoymentof ScienceLessons
LeisureInterest in
Science
CareerInterest in
Science
Attitude Scale (nil significance)
Scal
e M
ean
(max
5)
Female (16)Male (11)
School 3 Table 5.19 Gender: Year 10 Upper Band School 3
Figure 5.9.3. Gender: School 3 Year 10 upper ability band (Ken >15y).
Year 10 Upper Band School 3 Attitude Scale
Females (Scale Mean)
Males (Scale Mean) Difference t
Social Implications of Science 3.15 3.24 -0.09 -0.47 Normality of Scientists 3.23 3.27 -0.04 -0.21 Attitude to Scientific Inquiry 3.26 3.41 -0.15 -0.77 Adoption of Scientific Attitudes 3.33 3.33 0.00 0.03 Enjoyment of Science Lessons 2.74 3.10 -0.36 -1.70 Leisure Interest in Science 2.67 2.79 -0.12 -0.54 Career Interest in Science 2.98 3.09 -0.11 -0.45 (nil significance) n=16 n=11

108
Discussion of results: Year 10 Upper Band Schools 1, 2, 3
In the Year 10 upper band (Tables 5.17, 5.18, 5.19 and Figures 5.9.1, 5.9.2, 5.9.3)
there is one statistically significant difference between the attitude scales of the boys
and girls. This is for Brian’s class at School 1, where the boys show statistically
significant more positive Attitude to Scientific Enquiry (p<0.05) than do the girls.
There is some difference noted in the Leisure Interest in Science attitude scale with
the boys being more positive than the girls but this difference is not statistically
significant (p = 0.067). The classes of Ken and Truby showed little variation in
attitudes between the girls and the boys. Both Ken and Truby are traditional and
efficient teachers while Brian is more relaxed with possibly a more friendly
approachable manner towards his students. Such a manner may give the boys their
more positive attitudes.
Overall, however, at this level of more able students at Year 10 there is little
difference shown between the boys and the girls in their attitudes. In an analysis of
gender differences in student attitudes towards science from the literature 1970 to
1991, Weinburgh (1995) noted that in general high performance students indicate a
greater positive attitude for girls. This would close the gap normally seen for attitude
scales such as the Enjoyment of Science where boys of lower ability were usually
ahead.

109
Summary of gender attitude differences: school, year and ability band Table 5.20 Summary of Gender Differences: School, Year and Band Statistically significant variation: t test results Year/ Band
School Teacher
Social Implications of Science
Normality of
Scientists
Attitude to
Scientific Inquiry
Adoption of
Scientific Attitudes
Enjoyment of Science Lessons
Leisure Interest in Science
Career Interest in Science
School 1 Mike
School 2 Truby
Year 9 Middle
School 3 Barbara
p<0.05 Males
p<0.05 Males
School 1 Mike
p<0.001 Female
p<0.05 Female
p<0.05 Female
School 2 Sandra
p<0.05 Males
Year 9 Upper
School 3 Linda
p<0.05 Female
p<0.05 Males
School 1 Brian
p<0.05 Female
School 2 Sandra
p<0.05 Female
p<0.05 Males
Year 10 Middle
School 3 Tuk
School 1 Brian
p<0.05 Males
School 2 Truby
Year 10 Upper
School 3 Ken
n=294
Teachers:
Mike Beginning teacher less than 2 years experience
Brian Experienced teacher over 15 years
Truby Experienced teacher over 15 years
Sandra Less than 5 years experience
Barbara Less than 5 years experience
Linda Beginning teacher less than 2 years experience
Tuk Experienced teacher over 15 years
Ken Experienced teacher over 15 years
Sue Experienced between 5 and 10 years
Table 5.20 above is a summary of the results of the application of the TOSRA across
students from different year, band and school. Some general conclusions can be
drawn from these results.
110
• The younger teachers seem to have a more polarizing effect on the students
with more statistically significant differences in the attitudes of boys and
girls.
• The girls show more positive attitudes towards the Normality of Scientists
and at times Attitude to Scientific Enquiry
• The boys’ showed more positive attitudes to Enjoyment of Science Lessons
and Leisure Interest in Science (there is a correlation between these two
attitudes).
• The boys only showed a significant difference in positive attitudes towards
the Enjoyment of Science Lessons when taught by younger female teachers.
This occurred in all three classes taught by young female teachers (of the 9
classes in the sample).
Discussion
Whereas a number of researchers such as Terwel, Brekelmans, Wubbels, and van den
Eeden (1994) and Fisher, Fraser, and Rickards (1997) have noted that student gender
may in fact influence learning environment perception there has been little research
done on the relative influence of the teacher gender. The use of some of the
classroom environment instruments such at the Questionnaire on Teacher Interaction
(QTI) (Wubbels, Creton, & Hooymayers, 1985) could be valuable in determining
how student attitudes reflect the relationship with the teacher.

111
Attitudes: Year 9 and Year 10
1.5
2
2.5
3
3.5
4
4.5
Socialimplications
of science
Normality ofscientists
Attitude toscientificinquiry
Adoption ofscientificattitudes
Enjoymentof science
lessons
Leisureinterest in
science
Careerinterest in
science
Attitude Scale (nil significance)
Scal
e M
ean
(max
5)
Year 9 (148)Year 10 (146)
5.2.4 Attitudes: Year Level Differences
Table 5.21
Attitudes: Year 9 and Year 10
Figure 5.10. Attitudes: Year 9 and Year 10.
A comparison of all students in the study working at Year 9 and 10 (Table 5.21 and
Figure 5.10) shows no statistically significant differences in attitudes towards science
near the end of their respective years.
Attitude Scale Year 9
(Scale mean) Year 10
(Scale mean) Difference t Social Implications of Science 3.31 3.25 0.06 0.817
Normality of Scientists 3.44 3.44 0.00 -0.07
Attitude to Scientific Inquiry 3.72 3.81 -0.09 -1.18
Adoption of Scientific Attitudes 3.40 3.44 -0.04 -0.68
Enjoyment of Science Lessons 3.00 2.93 0.07 0.78
Leisure Interest in Science 2.44 2.44 0.00 -0.058
Career Interest in Science 2.81 2.72 0.09 1.02
n=148 n=146

112
5.3 DISCUSSION OF THE ANALYSIS OF ATTITUDES TO SCIENCE
This chapter has investigated the use of the TOSRA in establishing any statistically
significant differences in science related attitudes between students of different
schools, year level, band and gender. The findings have illustrated some differences
particularly with the gender of the students. The influence of student background,
which is often difficult to change (if in fact it does need to be modified) within the
confines of a science classroom for one hour a day, can still dominate. Research by
Jones, Howe and Rua (2000) also showed that there continue to be significant gender
differences in science experiences, attitudes and perceptions of science courses and
careers and that boys and girls in their study and in fact everywhere are shaped by
their culture. The out of school experiences available and selected by them are often
simply an expression of the attitudes and values of the larger culture. However, girls
who may not like science still choose to pursue science and, in a series of interviews
carried out by Baker and Leary (1995) in the United States, girls did not like science
and thought some of its applications were suspicious but they still liked ‘real’ science
and some had plans to become a scientist who would ‘do good’.
The current plight of boys (the fact that boys are being left behind academically by
girls) in science in New Zealand has been well documented (Hassell, 1998) in the
New Zealand media and some of the problems encountered by boys are undoubtedly
contributed to by negative attitudes towards science.
The TOSRA has proved to be a useful instrument in the establishment of statistically
significant differences in the attitudes of various groups of students towards science.
113
CHAPTER 6
THE EFFECT OF COOPERATIVE GROUP WORK AND ASSESSMENT ON
THE ATTITUDES OF STUDENTS TOWARDS SCIENCE
114
6.1. OVERVIEW
The third objective of this study was ‘to determine the effect of a cooperative
approach to learning and assessment on the attitudes of students to science’.
In the literature review there is a significant body of evidence that supports the
effectiveness of students working in teams. Most of this research is focused on the
cognitive outcomes of working in such teams. This study focused on the simplest
possible group structure, one which the students enjoy being a part of, and one that
was easy to establish. With a number of assessed tasks, such as tests, students gain a
sense of purpose that helps to ensure they remain focused and enjoy working
together towards achieving a common goal.
Also embedded in the literature are the changing views of education researchers on
how important attitudes are and the fact that they have a major impact on student
cognitive outcomes. There has been the development of a number of instruments for
the measurement of these attitudes and that help provide the means to gather
quantitative data on students and the effect of various classroom environments.
Qualitative data gathered through the interview process and systematic observation
form a significant part of the overall picture on attitudes. This chapter discusses
attitudes and part of the effect of cooperative group work as a triangulation research
process. The outcomes of the following investigations are reported within this
chapter.
1. The results of TOSRA taken before the students embarked on their three-term
cooperative learning programme and the results obtained immediately after
this programme.
2. Student interviews after their work in cooperative learning teams.
3. Interviews with teachers about how they saw the students work during the
course of the cooperative study. As with the students these were conducted in

115
late in the year, although there was some contact with them throughout the
year.
These three views of the students’ attitudes along with observations of lessons and
assessments in the classroom both in person and by video analysis provided a good
insight into the attitudes of the students participating in the study.
6.2 DATA COLLECTION WITH THE TOSRA
In Chapter 4 the instrument TOSRA validation information was provided for one of
the first times in New Zealand conditions and after extensive trailing in Australia and
the USA. The TOSRA proved to be an extremely reliable and valid instrument.
As outlined in the methodology, the TOSRA was administered to the students before
(pre) they commenced their three-term course of cooperative group work and then
again after (post). Three hundred and twenty six students from the four schools and
13 classes responded to the TOSRA during May and these numbers had declined to
312 by the time the second application of TOSRA was given in November. This was
mainly due to students leaving the district with family commitments; often farming
where farms in New Zealand change over during the winter season when the cows
are dry.
The conditions in which the students sat the first test were repeated as closely as
possible given the constraints of working within a secondary school. The following
factors remained consistent for the applications of the pre- and post-tests.
• Time of the day. This could have a marked effect on students’ such as their
attention span and relative restlessness. For example, it was decided to avoid
last period on Fridays.
• The relative help given to the students in reading the questions also remained
consistent. The reading level of the TOSRA was found by the students to be

116
reasonable. However, on each administration of the TOSRA, the lower band
of students at School 4 needed the questions to be read out and explained.
• The time to take the test remained within a 30 to 40 minute time span.
• On each occasion, the same teacher administered the TOSRA and recorded
all relevant data on the envelope cover sheet.
A number of the students did ask about the fact the same question was often asked
but in another way (reflecting the nature of the TOSRA having positive and negative
items). The students were happy when the situation was explained to them and that
they were not expected to think about changing their response to the reverse item.
There were only few ‘invalid’ TOSRA sheets handed in by students (ticking all the
same column to save them reading and thinking about the response was the main
example). The researcher later discarded these during the routine checking of papers
for any anomalies that might exist and alter the nature of the responding sample.
6.3 RESULTS
6.3.1 Quantitative Results: TOSRA
The data collected from both the pre and post administrations of the TOSRA were
analysed and the results are summarised in Table 6.1 below and also represented
graphically in Figure 6.1.

117
TOSRA Results Pre and Post Teamwork
1.50
2.00
2.50
3.00
3.50
4.00
4.50
SocialImplicationsof Science
Normality ofScientis ts
Attitude toScientific
Inquiry
Adoption ofScientificAttitudes
Enjoyment ofScienceLessons
LeisureInteres t inScience
CareerInteres t inScience
Attitude Scale (nil significance)
Scal
e M
ean
(max
5)
TO SRA means PreTO SRA means Post
Table 6.1 Pre- and Post-Test Means on TOSRA Scales
Figure 6.1. Plot of TOSRA results pre and post group work study.
As can be seen in table 6.1 and figure 6.1 there are no statistically significant changes
in attitudes towards science between the two sampling periods. The t tests for paired
samples showed there had been no changes within the sample over the time frame of
the trial.
Pre-Test Post -Test
Attitude scale Mean Standard deviation
Mean Standard deviation
Social Implications of Science 3.32 0.56 3.27 0.58 Normality of Scientists 3.40 0.55 3.44 0.56 Attitude to Scientific Inquiry 3.79 0.65 3.77 0.68 Adoption of Scientific Attitudes 3.37 0.55 3.41 0.51 Enjoyment of Science Lessons 2.95 0.87 2.95 0.84 Leisure Interest in Science 2.71 0.78 2.43 0.78 Career Interest in Science 2.65 0.64 2.76 0.74 n=326 n=312

118
B. J. Fraser (2000) suggests that it is common for student attitude with this age group
of students to decrease during their schooling hence no change in attitude is in effect
an improvement on the norm and the figures can be looked at as encouraging. This
is because the attitudes to science of these students typically decline over the school
year. Work by researcher Greenfield (1997) at a cluster of three schools where boys
and girls of various grades were both observed and surveyed using an abbreviated
version of instruments on attitudes developed and validated by Mason and Kahle
(1988) and Simpson and Troost (1982) concluded that younger students of this age
grouping express more positive attitudes than the older students. Research by
Yarrow, Millwater, & Fraser, B. J. (1997), and Ferguson and Fraser (1998) also
support this assertion.
The study is perhaps not really a truly longitudinal study and such a study is required
to investigate whether significant changes to attitudes with a group over time as
measured by TOSRA occur.
6.3.2 Qualitative Results: Student Interviews
Introduction1
The protocol for the interviews is fully outlined in Chapter 3, but one of the key
elements was having the students talk in a secure and comfortable environment.
They were always given the question before a response was taped and this proved to
be an important feature in the students’ eyes. They often did not need any further
clarification and generally warmed very well to the interview process as it proceeded.
The researcher was impressed with the thought given by the students to their
responses to the interview questions. The cohesiveness of many of the groups was
apparent from the time they first sat down for the interview. While a few groups had
an obvious leader, most of them were based on cooperative principles. The groups
formed were almost entirely single sex because the students seemed happiest to work
in this way.
1 In the interests of student privacy all names given in the following transcripts are fictional.

119
Student responses
Students were always given the opportunity to add to their responses if they felt a
need to expand on their original comment. There were additional questions asked by
the researcher if there was any particular feature of the group which he felt could be
expanded on in order to better understand how they operated. The questions and
responses have been grouped under three general headings to enable the students’
comments to be interpreted.
Group functioning
These questions were asked to help to establish how the group operated on a day-to-
day basis and if there were any major differences in the basic set up. Simple group
operational factors such as the role of the individual during various tasks and whether
the group had become hierarchical were asked. The issue of a potentially non-
compliant group member was addressed and the students were asked how their group
would have dealt with such a problem if it had arisen.
How did you first form your group?
Basically we’re friends aren’t we (Natasha).
Yeah, friends (Jodie).
Oh Mr. Smith let us choose our friends sort of thing (Sam).
Mainly all friends so decided that we’d go together as we usually hang around with
each other at lunch times and during class (Mathias).
These were the common responses and all groups had in fact established themselves
on the same basis. (Some teachers did try some composite groups later in the trial.)
Okay when you’re doing practical or research assignments, how do you divide the
jobs up?
Typical responses from the members of some groups were:

120
Each time we just go in a group and a different person goes up and gets the gear and
then someone else will set it up (Steven).
We just do whatever we want to and argue about it if somebody wants to do the same
thing, we just argue about it (Michelle).
Well we roster. But now we just kind of share it all around we don’t have to have our
own little jobs and stuff (Joe).
Well if say you’re the technician you do the practical bit of it and the equipment
manager gets all the gear and the reporter reports the results (Leah).
Changed every week, way that it’s sorted into the group the jobs (Amie).
The majority of groups simply sorted out the jobs as they went along and changed
this if they thought one person was doing the same thing all of the time. The only
exceptions were the groups from one class whose teacher organised students on a
weekly roster basis with assigned jobs such as, equipment manager, technician and
reporter for practical work.
It may not have happened but what would happen if one of your team were slacking
a bit, how would you encourage them to improve their work output?
Tell them to get their act together (Susan).
Hurry up and do something or just give them a hand and tell them what to do
(Emily).
Well yeah we just tell them to get on with it and keep to the job (Hiku).
Give them a job that they enjoy and then they will keep going, get more motivated
and stuff (Mia).
We do the fun jobs and we give them the…. of the harder jobs (Peter).

121
These responses were typical with most teams choosing to sort out any of these
issues themselves to the satisfaction of their team members. Jobs such as who does
the writing for a team during tests were, however, often assigned to the team member
who was quick and wrote legibly although one group selected their scribe on her
ability to best summarise the answer.
She’s got the neatest writing and because Anne like knows how to write it down like
we don’t say things in a way it should be written down (Leah).
Has one person become the boss?
Typical responses from the members of some groups were:
Everyone works together (Mark).
No we don’t have that sort of thing (Mathias).
No we all work our answers out together (Susan)
Not really all just work as team together (Amie).
There was only one team of the 14 interviewed that considered that they had a ‘boss’;
two others had mixed responses within the group.
The responses from the members of this group were:
Sonya (Toni).
Yes definitely Sonya (Michelle).
Overall, the day-to-day running of the teams was by consensus with the students
working through any issues that should arise in a cooperative manner. Other
advances included the fact that during assignments, groups with reluctant
contributors (which was rare) developed strategies to ensure equal input. The

122
students saw little need to elaborate on the simple straightforward answers to these
questions.
Group dynamics and change
These questions helped to establish how the students have adapted to better
functioning as a group over the duration of the trial. This also helped to determine
how this has benefited them both as individuals and as a group and if in fact this sort
of ‘teamwork’ have any application to the real world. These questions also give an
indication of the attitudes of the students towards each other, themselves and their
science.
If one member of the group has a different answer from the others during a test how
do you sort that out and has that changed over the course of time? Has this changed
over the course of the year?
Yes majority rules but we discuss and what’s reasonable sort of (Jane).
We sort of discuss it all and see if what they’ve got to back up their answer and then
you just find, see if they’re right or not and back up the answer (Tiffany).
We usually do majority of the group but we’ve started to more, have like talk about
between, try to prove your answers right to others (Linda).
We’ve got better at it as expressing our own opinions and more confidence and stuff
in each other and ourselves (Jane).
It’s like majority wins but if someone is really kind of dead set on it they try to
explain it to others (Steven).
When we do the test if someone’s got a different idea we all explain it and see what’s
just best. Yes we have got better at this (Jesse).
Yep. If they disagree we ask them how they got the answer and you work through it
again (Shane).

123
To start with we, if most people thought the answer was right, write it down but then
we talk it through more (Mathias).
This was generally the pattern with all of the groups; almost all the boys said they
had changed the way their group operated during tests.
Do you think you will do better in the exams as a result of having worked in groups
than you would have as individuals, in other words is group testing a learning
exercise as well as just doing a test?
Yes I think we will do better in the exam if we’ve worked in groups because we’ve
listened to each other (Natasha).
Yes and better ideas of the question and it’s explained in the way that we can
understand because it’s between our age (Sandy).
I think we will; do better than we would because we’ve sort of learned as we’ve done
the tests, doing with the group and other people’s ideas (Mia).
Yes we probably will because we’ve learned from other members of our group and
gained more from them as well, from what they’ve (John).
I think I will do better in the exam because we worked in groups because you’re like
remember things as Mike said…. came out and remember oh that’s right (George).
I reckon we will (Mike)
These were typical answers for most of the groups with the boys generally being
much briefer in their answers. There was only one group of girls who in general
suggested that they would not do better in their groups. One of these girls (Ingrid)
was a very able student who while she recognized the need to work with others she
did not think it helped her grades.

124
My marks have essentially gone down. Like I was getting 82% and then like its
going down to about 70 (Ingrid).
Not really (Wendy).
Especially with kids, we argue pretty much, it’s like if I was doing the test I’d like
you know what you’re going to put down but like in a group discussion you have to
sort of take into account the others ideas so you may lose, but even if you really think
you know it you have to sort of take into consideration what other people will say
(Ingrid again).
Does group or teamwork have any application to being in the workforce like working
at McDonalds, working in a lab or working at an aircraft factory or the hospital?
Yeah you work in a team wherever you’re going to work (Sonya).
Yes because in the workforce you have to learn to work with other people so it helps
you get ready for that (Sarah).
Yes it teaches you how to work as a group that’s a base skill at the end of the course
(Jane).
The things that we’re doing if…something it would be a lot easier in a group because
you get more ideas, more feedback (Sam).
Gives you better people skills (Liam).
Oh yeah like job advertisements it always says must be able to work in a team or
work well with others (Barry).
These responses were typical of most groups with some groups. The relevance of
good teamwork was seen as important in the outside world.
Overall, the students did adapt very well to the group environment and virtually all of
the groups showed considerable improvement and an appreciation of the skills that

125
they had learned as members of their group. The students said that they discussed
disputed answers more vigorously, rather than accepting the answer offered by the
most able student. The vast majority saw definite benefits in their learning outcomes
as individuals through their learning from their peers during group testing exercises
in particular. There was a real appreciation of where the team skills fit into the
workplace.
The benefits
These questions set out to establish the students’ feelings about their experiences of
working in cooperative teams and if they found the experience to be a positive one
that they would like to continue. They were asked about various aspects of their
work as a group member such as enjoyment, anxiety and stress levels when
completing assessments.
If you were given the option of working in groups or as individuals for the next test
what would you choose?
Groups because we get better results working together (Jane).
Probably in groups again I’d say (James).
The above responses were typical of the sample interviewed with most simply saying
‘groups’..
Do you find science easier when you’re working in groups?
Yes because it takes a lot of stress off you, you can all share the jobs around
(Mathias).
Yeah it is easier because the groups can help you out if you don’t understand a
question or something like that (Mark).
All students responded in this way, the majority simply said ‘yes’.

126
Do you find science more enjoyable working in groups?
Yes (Mark).
Yeah, more fun more fun doing tests (Joe).
It is and tests are the worst part and it’s a bit better to do them in groups, they’re a
lot better (Mathias).
This was again the most common set of responses for this question, a small number
of students made the comment the ‘we can talk more’ but this was not a usual
response.
Summary of student interviews
There is strong evidence from these interviews that the students have certainly
developed good cooperative techniques and skills along with a sense of enjoyment.
This is evident from what they said about the establishment and organisation of their
groups. They were also very aware of how they had changed the way their group
operates in light of more experience working together for longer. The researcher
noted the enthusiasm that emanated from many groups as they spoke about how they
had improved on various aspects of cooperative work. The enjoyment they obtained
from working together and achieving much better results showed how positive they
were about this type of learning environment. One of the rare exceptions was a high-
achieving female from one group who said that while she preferred to work on her
own, she realised that she needed to learn to work with others in a group situation.
The gender of the groups did affect how they operated particularly at the start of their
group work with the girls being much more cooperative early on than were the boys.
The boys did say in many of the interviews, some of which have been reported
previously, that they did improve the way that they worked together in tests
especially with more group consultation occurring before just writing the answer
(often submitted by the dominant male). The groups all had an appreciation of the
wider implications of being a ‘good team person’ when they eventually leave school
and go into the work force and this sort of experience is very useful training.
127
6.3.3 Qualitative Results: Teacher Interviews
Introduction2
The teacher interviews were usually conducted outside the school building and away
from any distractions with which teachers so often have to deal. The questions were
not structured but of the same basic theme ensuring that all of the key points were
covered. Prompts were used if required to ensure that this occurred. The teacher’s
responses to questions about their students can be grouped but most of the interest
centered on how the students performed in their formal tests although laboratory
work and assignments were also mentioned.
Could you tell me how well the groups cooperated and what happened over the
course of the study?
They really got on quite well, I sorted them into groups and I organised them into
their groups, told them what they were going to do and told them it was the same test
situation as far as they could talk within their groups but not between groups and
they adhered to that really, really well, actually all year, I haven’t had to clamp
down on them at that point at all. And they just worked really well in the groups and
as I came around they were all on task they were all contributing and in general I’ve
got a really positive feeling about how the group tests have gone and I think I will
definitely be using it in the future (Mike).
I’ve been really quite interested in this as it has worked far better than I thought it
and before we got onto the trials. What really impressed me was when we were
doing the first lots of tests how actually there was a real working atmosphere in the
class and you give them individual work to do and they can be distracting each other
and they can be sort of mucking around but I found that they got on, got with the task
and they had really quite a sense of purpose about it (Brian).
Yeah they have, it’s sort of I reckon there’s more sort of interaction between them, at
the start it was sort of a little bit the brightest person in the group doing their own
2 In the interests of teacher privacy all teacher names given in the following transcripts are fictional.

128
thing basically and the others hanging off to the side whereas now they seem more
willing to contribute (Truby).
I saw a lot of discussion going on but I didn’t see that the stronger personalities were
prevailing all the time, I found that it was quite often it might be a strong personality
who put forward an answer and they would fight quite strongly for it but they’d
always come to a group consensus and generally come up with the correct answer or
a more sensible answer. So yeah I didn’t see it as arguing at all I saw it as yeah on
path discussion. I suppose more than any conflict going on at all (Sandra).
And as far as the marking goes I think it has been very consistent as to I think some
of the lower marks probably have picked up but those who do well are still doing
well and those who do poorly have been dragged up a little bit and they’re possibly
getting more enjoyment and more achievement out of science because of that but
generally those students who do excel are still the same ones who are excelling now
even, they’ve just dragged other people up with them I think. I don’t think the bottom
has dragged anyone down (Mike).
The comments of the teachers cited above suggest that they were very pleased and in
fact surprised at how well the students took to the group testing in particular. They
remained on task, focused and got better at genuine cooperative work as time went
on. The evolutionary nature of the groups is reflected in the teachers’ comments
such as how the students learned to work through other possibilities for answers
before committing them to paper. The improved interaction between the students
was another pleasing aspect in their teachers’ eyes.
How well have the students been motivated and enjoyed their work in groups?
You know; they seem keener because they know they’re going to get better marks.
Before the test they know they’re going to get a reasonable mark… some of those
kids by themselves they’d be doing pretty poorly (Mike).

129
Get a buzz too when they go through all their scoring and they’re getting 20% more.
They seem a bit more positive, pretty positive on it. The marks they’re getting now
are pretty good. One top class gets 80s and 90% for most of these groups. Whereas
by themselves they would probably get below 65 or so I guess (Brian).
I’ve given them a couple of individual tests to get them on task for their 3rd form
exam and it was all positive, they were all moaning when I said they were going to
have an individual test again and they’d really enjoyed the experience of doing it in
groups (Truby).
Teachers saw that the marks that the groups were able to achieve were in fact a
significant motivational factor along with the enjoyment of actually working together
on a group task.
Has this type of group work become a teaching tool?
Yeah what it seems to have done for me is that now in a test situation it’s also
becoming a learning situation as well I can wander around and if they’re discussing
things I can become involved in the discussion and they can bounce ideas off me and
I can bounce ideas back off them sort of thing and say well what do you think about
this or have you thought about this ideas. Yeah I think it becomes more another
learning opportunity or there’s learning going on in the classroom where in a
normal test it’s just stress going on in the classroom (Mike).
Yep well as I was saying you can get away with doing less marking or you can do
more assessments with the same amount of marking (Brian)
These were typical responses from all of the teachers; essentially the ability to walk
around the room and assist with problem solving approach and teach students how to
answer questions without telling them the answers. It was pointed out during
informal discussions with teachers that this was rarely done in a ‘normal’ testing
situation. The reduction by a third in the marking load was also seen as an
opportunity to undertake more formative assessment in teams ‘since the kids enjoy it
and learn at the same time’ and still do less marking.
130
6.4 LONGITUDINAL CASE STUDY
6.4.1 Introduction
The researcher conducted a pilot study with a group of 31 Year 10 School 3 students
in 1996 using cooperative teamwork and the TOSRA. This was part of the
groundwork leading up to the design and carrying out of the full study in 1998. After
the extensive study of 1998, the opportunity was taken to retest those students still at
school remaining from the original pilot study group. Most were still doing science
and showed a real interest in the work being done by the researcher. They were
happy to do the TOSRA again and be interviewed about their experiences as juniors
and in the ensuing years. This sample of students had a significant amount of
cooperative group work in science during their time at School 3 (see Chapter 7 for
the type of cooperative teamwork able to be undertaken by senior examination
students).
6.4.2 Quantitative Results: TOSRA
The results of this small study do look promising although the number of students
(n=13) in the study is too small to be statistically conclusive. It is of interest to note
that many of this group had gone on to science related careers. These students stated
that some of the TOSRA questions were specific to the classroom but they had
answered them as well as they could but they said that they still took an interest in
science and that things they learnt were useful to them. The figures were generated
using the results of the TOSRA for the same 13 students (9 girls and 4 boys) in both
samples. These results are summarised Table 6.2 and Figure 6.2

131
Longitudinal Study School 3 1996-1999
1.5
2
2.5
3
3.5
4
4.5
SocialImplications of
Science
Normality ofScientists
Att itude toScientific Inquiry
Adoption ofScientificAttitudes
Enjoyment ofScience Lessons
Leisure Interest inScience
Career Interest inScience
Attitudes Scale
Scal
e M
ean
(max
5)
19961999
Table 6.2 Small Scale Longitudinal Study at School 3
Figure 6.2. Small scale longitudinal study at School 3.
The number of students is small, therefore, these results should be treated with
caution but they do show a marked improvement in a number of attitudes with
significant t scores for the Normality of Scientists and very close to significant
(t=0.06) for the Leisure Interest in Science, which tend to affect the career choices of
students. The classroom-based attitudes of Attitude to Scientific Enquiry, Adoption
of Scientific Attitudes and the Enjoyment of Science Lessons have remained at
Attitude Scale 6/8/96 Year10 19/11/99 Year13 Scale mean Scale mean t
Social Implications of Science 3.53 3.76 NS
**Normality of Scientists 3.53 4.12 P<0.001
Attitude to Scientific Inquiry 3.79 3.57 NS
Adoption of Scientific Attitudes 3.66 3.79 NS
Enjoyment of Science Lessons 2.85 3.14 NS
Leisure Interest in Science 2.31 2.91 P=0.06
Career Interest in Science 2.33 3.05 NS
n=13 n=13

132
similar levels for this group of students. Overall these TOSRA results look most
encouraging.
6.4.3 Qualitative Results: Student Interviews
Six of these students were interviewed in November of 1999 during their last weeks
of school at School 3. The interview questions were not strictly scripted but they
followed the same pattern for each interview session. General questions about
whether or not they could actually remember working in teams as juniors led to more
detail, such as the enjoyment they got from working in teams. They were then asked
about whether they preferred working in teams to working as individuals and what
affect this had on their stress levels and enjoyment of science. They were asked to
comment on whether or not they had learned more as a result of this style of teaching
and if it had any place in the ‘real world’. They were also asked if the current Year 9
and Year 10 students should experience this style of learning, there was always the
opportunity to discuss these ideas in more detail. The final question was about where
they were going in the following year and what they intended doing. The students
were interviewed individually except for one pair.
The results were of real interest with all of the students interviewed remembering
their teamwork in the junior school. With the question of enjoyment, stress and
learning the responses below of female 1 and male 1 were typical.
Can you remember whether you enjoyed doing it that way (the tests) or would you
prefer to have done it as individuals?
Nah, I think the group thing coz you get help as a group and it’s not too serious, it’s
a bit laid back, easy to learn (Melanie).
Yes, it’s less stressful and it’s easier, there’s somebody around, you’re more likely to
get it, remember all of it (Daniel).

133
Do you think working in those groups has helped you now in any aspects of science,
whether it is enjoyment or, carrying on with it or whatever?
I think I prefer to work in groups now I feel supported. Just coz it helps you
understand more if you’ve got your friends and stuff to help (Melanie).
I’d have to go with that (Daniel).
On the question of learning, questioning the answers of others and peer support the
following responses sum up the general feeling of this group of students.
Do you think you learn the syllabus better by talking to each other in that group in
that test situation?
Yep, coz when you see a question on it you just think back to the big arguments you
had on that, that’s right (Linda).
And do you think the enjoyment part of it was worthwhile, what about the pressure
on individual students to succeed, was that reduced? In your case you always
succeeded anyway but how do you think it affected other students? (To Carol the
school dux).
I think it’s good because you learn more when someone else, a peer explains
something to you. I think, yeah, people do better in a team situation (Carol).
Can you remember if you enjoyed that way or what are your memories of that sort of
setup?
It was pretty good. It was different at the start coz we always used to do it singularly
but I found especially with Carol she was new she could teach us the answers. If I
didn’t understand stuff like that the others would help explain it and that was always
good and yeah, I found it quite good (Louise).

134
When they were asked about the relevance of teamwork to scientists working in the
real world the responses certainly supported the concept of group work at school.
You mentioned working with each other, do you think it’s important in today’s
scientific world in particular, working with other people?
Yep, definitely, coz I think any work in science today is people working in a team, it
will be a team effort to achieve big things, so yep (Carol).
Looking back on working in groups that way, do you think that’s got any
implications in the real world?
Oh, absolutely, like I want to design and I’m sure that I’ll have to work in groups to
decide on how things should be designed, and yeah, listening to other people’s point
of views and things and coming to a decision from that always helps. Getting your
ideas and coz you always solve problems like that and yep (Louise).
Overall these students were very positive about their experiences in the learning
teams and saw them as useful as a learning tool, enjoyable and relevant to the world
of science.
6.5 THE ATTITUDES OF LOWER BAND STUDENTS: SCHOOL 4
6.5.1 Introduction
This group of students was of particular interest as motivation of lower achieving
students was a continuing concern for their teachers and parents. As outlined in the
Chapter 3, there were few if any behavioral problems in this class but some students
were of limited academic ability.

135
S4Y9 Lower Band Pre versus Post Group Work
1.50
2.00
2.50
3.00
3.50
4.00
4.50
Socialimplications of
science
Normality ofscientists
Attitude toscientific inquiry
Adoption ofscientificattitudes
Enjoyment ofscience lessons
Leisure interestin science
Career interest inscience
Attitude Scale
Scal
e M
ean
(max
5)
Pre Post
6.5.2 Quantitative Data
The students were read the questions in TOSRA and were able to ask questions if
they needed help with any of the words or phrases. The same teacher administered
the TOSRA on each of the occasions in April (term 1) and November (term 4) 1998.
She is only identified as Sue and had close to 10 years of experience in the classroom
teaching both at senior and junior level science.
The results are outlined below in Table 6.3 and Figure 6.3. Table 6.3 TOSRA Results for the Year 10 Lower Band Class
Figure 6.3. Plot of pre and post group work for Year10 lower band.
Pre: T1/1998 Post: T4 1998 Attitude scale (Scale mean) (Scale mean) Difference t
Social Implications of Science 3.14 3.12 -0.02 NS Normality of Scientists 3.25 3.47 0.22 NS Attitude to Scientific Inquiry 3.75 3.92 0.17 NS Adoption of Scientific Attitudes 3.51 3.26 -0.25 NS Enjoyment of Science Lessons 2.42 2.68 0.26 NS Leisure Interest in Science 2.12 2.24 0.12 NS Career Interest in Science
2.51 2.44 -0.07 NS
n=17 n=18

136
These results are of interest as they do show some positive movement in a few of the
attitude scales but with no significant t scores. However, the small sample number of
students (n=17) is too small to generalise too much but they certainly did not go
down when this may be expected to be the case, again based on observation by many
researchers such as such as Greenfield (1997), Mason and Kahle (1988) and
Ferguson and Fraser (1998). So these results can also be seen as encouraging.
6.5.3 Student Interviews
This college was in a more remote area of New Zealand and the researcher was
unable to travel for the interviews, and therefore the regular teacher did the
questioning which was probably better given the nature of the students and the
rapport she had built up with them over the year. The questions asked of these
students were essentially the same as for the upper and middle bands but at times for
clarification the teacher expanded on them as she saw fit. The questions and
responses have again been grouped under the same three general headings to enable
more directed analysis. The interviews at this school were held after the end of year
examinations, which were all sat as individuals.
Group functioning
The girl’s group interviewed was typical of most groups during the study. They
showed a consistent approach to dealing with the day-to-day running of their group.
How did you first form your group (Sue)?
We were just friends and sort of decided (Christina).
And you’ve been happy working together (Sue)?
Yes (Nicole).
Any reason why (Sue)?
Because we are all like good friends (Clarissa).

137
Well we normally sit together in most classes so (Nicole).
Is it because you are friends and you get on well together and you think that works
better than if you were put into groups (Sue)?
Yes (Christina).
Yep (Nicole).
So when we look at practical work, research assignments and that sort of thing how
do you divide the jobs up (Sue)?
We normally…we sort of take turns (Nicole).
So one person does one thing and the other does another (Sue)?
If you look at something and one person picks one thing and the other person and the
last person is stuck with the last thing (Nicole).
What about in experiments is the same person doing the same job all the time (Sue)?
No (Christina).
No (Clarissa).
Spread it out (Nicole).
What do you do if someone in the group is slacking a bit (Sue)?
Probably leave the work for them that didn’t get done (Nicole).
The boy’s group, however, encountered early problems at the initial set up of their
group but to their credit they worked their way through any issues in a fair and
cooperative manner. The comments below support this assertion.

138
How did you first form your group (Sue)?
It was actually me and Ricky at the front until … and then we split paths and said
righty oh we’d go in different groups. Me and Ricky stayed together and Phil came
over to our group (Andy).
Because I got kicked out of the Zane. and that’s when I decided to link up with Andy
because I get on quite well (Phil).
Do you think you’ve worked quite well together as a group (Sue)?
Yep we may have had our differences but Yep (Andy).
But you think you’ve worked through them adequately (Sue).
Yes (Phil).
So you’re enjoying working in your groups (Sue)?
Yep (Ricky).
Yeah (Andy).
Practical work. When you’re doing practical, research or assignments, how do you
divide up the jobs (Sue)?
Like one does the writing, one gets the gear and maybe the other does the experiment (Andy).
So you keep changing jobs (Sue)?
Yes (Phil).
What would you do if one person in your group were slacking a bit? Has that
happened (Sue)?

139
Yep. We told him well you’d better do that or you will be letting the whole team
down (Andy).
Has one person become the boss (Sue)?
No (Ricky).
No all (Andy).
Overall the day-to-day running of the teams was well organized and when given the
opportunity it can be seen from the response of the students above that they took
their group work seriously.
Group dynamics and change
The students from this class showed that they had also evolved the way their group
operates and followed good cooperative principles; the evidence for this is
documented in their responses below.
Do you think that as a group your results have been better than if you’re working by
yourself (Sue)?
Yep (Clarissa).
Yes (Nicole).
Why do you think that (Sue)?
Because you’ve got three people’s brains not just one (Nicole).
And you know different things (Christina).
And sometimes where there are situations where two people don’t agree (Sue)?
Yeah (Christina).

140
What do you do then (Sue)?
Compromise (Clarissa).
So you go on a majority rule thing (Sue)?
Yep (Clarisa).
Does group or teamwork have any application to being in the workforce do you think
(Sue)?
Yes (Christina).
Why (Sue)?
Heaps of people work in teams (Clarissa).
Like if you’ve got a group of people working, it doesn’t necessarily be a team
(Nicole).
The boys also responded in a similar way to these questions. They also showed a
mature approach towards their group work.
How do you sort out your groups answer if you disagree (Sue)?
We contribute to it and then sort of churn it and mix it up and say well it’s such and
such (Phil).
Do you think doing this group work has any application to the workforce (Sue)?
Yes it would because any job you have to work as a team and if you’re stressed out
you can still go to your friend (Andy).
It’s not an individual job it’s always a team (Phil).

141
It’s a hundred people not a hundred individuals (Ricky).
The benefits
The students showed obvious enjoyment in working together in their groups. They
also showed an appreciation of how the group work had been beneficial to them.
The following comments help to illustrate this.
If you were given the option of working in groups or as individuals for the next year
what would you prefer?
I’d say groups (Nicole).
Go for groups (Clarissa).
Do you find science easier working in groups (Sue)?
Yes (Clarissa).
The vast majority of the respondents simply replied ‘yes’ to this question with the
boys’ responses very similar in nature again showing enjoyment in their group work.
If you were given the option of working in groups or as individuals for the next year
what would you prefer (Sue)?
Definitely a group (Andy).
Do you find science easier and more enjoyable in groups (Sue)?
Probably more enjoyable, because you can say funny jokes (Andy).
Yes (Phil).
All of the students interviewed said that they would prefer to work in groups and that
it was in fact more enjoyable to work in groups.

142
How do you think your results compare from your group work compared to what you
did in the exam, I mean by that. Do you think you would have done better in the end
of year exam if you’d done al the work by yourself or do you you’ve done better
having worked in groups?
Groups like if you didn’t know something and someone wrote it down you’d be able
to read it and learn (Christina).
This response shows that the students appreciated some of the benefits for having
worked in groups.
6.5.4 Teacher Interviews
The teacher of this class was impressed with how well the students responded to this
type of work. The students passed their own class tests and were able to pass tests set
for the mixed-ability classes in the next highest band. Some responses to questions
illustrate the teachers’ perceptions of how well this class has performed.
How do you think their work in groups affected their self-esteem (researcher)?
Self-esteem improved significantly. They were no longer leaving gaps in tests; the
assessments were learning experiences for them when they could share what they
knew with others. Science still wasn’t necessarily their favourite subject, that would
be physical education, but they were enjoying it a lot more (Sue).
You have mentioned that they were performing a lot better in the tests (researcher)?
Yes they did. In the end of year exam they outperformed themselves really. The head
of junior science approached me and said how well they had done compared to
similar classes in other years, and that was in an exam they had to sit as individuals
(Sue).
143
Do you think it is worthwhile doing their work and assessment in this way
(researcher)?
I do, and if I had another bottom-band class I would use that type of assessment
again. In the school I am in now all the classes are of mixed ability. However, I am
looking at carrying out some, not all, of their assessment in this manner as well. I am
still considering this (Sue).
Long-term benefits
The teacher of this class was very enthusiastic about the students’ progress while on
this programme which is evident from her interview at the time. She did also make a
comment that science in fact became their second most favourite subject, only being
edged out by physical education. A significant number of the students over the next
two years continued to show good progress in their science and some of them sat and
passed School Certificate Science (this was a nation-wide examination for Year 11
students). The self-esteem, confidence in their own ability and attitude to their
science can be inferred from this to have improved significantly.
6.6 OBSERVATION BY THE RESEARCHER AND VIDEO ANALYSIS
6.6.1 Introduction
Observation of the students at work in their groups was undertaken to establish how
well they were operating as teams. These took place in the middle part of the year
when the group dynamics were well established. The best occasions to observe the
groups were during practical work, where good teamwork is paramount, and team
testing where cooperation and contributions can be easily observed. The key
indicators of group functionality looked for by the researcher during observations
both in person and by video were:
• Enjoyment and enthusiasm exhibited while working together.

144
• The establishment of relevant procedures to ensure the effective operation of
the group.
• Relative contribution to the group effort by its individual members.
6.6.2 Practical Work
During practical work the cooperative nature of the groups was in most cases very
apparent, equipment was collected and returned efficiently by the designated person,
the experiment was set up and performed well. The buzz of chatter, most of it on
task, was also apparent. There was some off task talk but it was usually restricted to
short comments to each other and the work being undertaken was never
compromised, essentially a group of friends at work. There was also opportunity
here for the researcher to informally talk to students about how they were enjoying
working in their teams and most were very positive about the experience at this time.
Some groups were better organised than others with the poorer groups coming from
the mid band classes, but they still worked effectively and there were no seriously
dysfunctional groups observed. The mid band groups, which operated best during
practical work, were always from classes where basic routines had been well
established by the teacher. These students seemed to get more confidence from clear
guidelines and worked better together. The clear roles of each of group members
such as, equipment manager, technician and recorder helped to ensure that all
students had a role during the practical work and there were no ‘freeloaders’.
In classes with less defined roles some groups of girls in particular sometimes had a
very competent technician who liked doing the experiment while the others stood
back. The teachers usually tried to ensure that there was an even workload through
out the group.
6.6.3 Group Testing
The ‘on task’ nature of students engaged in a team test was universal in all classes
observed by the researcher, both in person and by video analysis. There was
invariably a lot of communication within groups occurring with the entire group

145
being involved and contributing. Generally the girls talked through possible
solutions to problems more than the boys who usually arrived very quickly at the
‘correct’ answer. The boys’ teamwork certainly improved significantly over the
course of the study. From informal discussions with the boys and their teachers they
were aware that in general the girls initially were better than the boys in the
teamwork aspect but the boys had clearly improved.
Teachers usually circulated around their students during these group tests. They
were able to get around all of the groups helping with problem solving techniques
and keeping an eye on the group functioning. In most cases there were only nine
groups of three students to assist and the students seemed to enjoy this additional
contact with their teacher on an almost individual basis. The students said that it was
good having some teacher help on how to answer some questions.
Overall both the teachers and the students enjoyed the cooperative work of the
students during group tests as both a testing and learning experience. The standard
of cooperative work was very good with the reward of good marks for their team
being a key focal point.
6.7 SUMMARY: THE EFFECT OF COOPERATIVE GROUP WORK AND ASSESSMENT ON THE ATTUTUDES OF STUDENTS TOWARDS SCIENCE
This chapter has outlined how students’ attitudes towards science have changed over
the course of the study using a range of methods both quantitative and qualitative.
The attitudes of students within two broad bands, the upper, middle band along with
the lower band has been investigated and results analysed. While the study has
focused mainly on the time frame of one year the opportunity to look at a
longitudinal case study has also been included in the results. Overall the study has
used a diverse approach to generate meaningful data on student attitudes towards
science. The results from this study suggest that cooperative learning and group
assessment provides an effective means of improving student attitudes towards
science. The results of the TOSRA throughout the study may not reflect dramatic

146
changes over the time frame of the study, but they do support the suggestion that
changes of student attitudes have occurred. The students and teacher interviews add
significant weight to the assertion that positive changes have occurred to student
attitudes and that they enjoyed working in their cooperative groups. The inclusion of
the lower band of students has led to results which show considerable promise for
this group of students who often struggle for motivation in a regular classroom
structure.
While improvement in cognitive learning was not a focus of this study some
indications from student and teacher interviews suggest that this may in fact be the
case and as such be worthy of further investigation. Remarkably this style of
cooperative learning may actually result in reduced teacher workload with
considerably less marking during formative assessments in cooperative groups.
Furthermore, the process is non-intrusive on the effective delivery of the curriculum
and the day to day running of the classes which the participating teachers have said,
are important considerations when considering use of cooperative learning in
secondary schools.
The establishment of cooperative group work and assessment, which is most unusual
in secondary schools, may in fact be a simple yet effective method of improving
student cognitive learning outcomes and attitudes.

147
CHAPTER 7
CONCLUSION

148
7.1 INTRODUCTION
This thesis reports on how cooperative group work and assessment can be used to
positively influence the science related attitudes of Year 9 and 10 students in New
Zealand secondary schools. While the use of cooperative group work is not new, the
simple method of group establishment and the incorporation of all assessment
activities and practical work during the year provided the basis for this unique study.
The initial thrust for this study was generated through the researcher’s own teaching
and observation of student attitudes towards science. Students throughout most New
Zealand schools are assessed as individuals on a regular basis from the first time they
enter secondary school. For many, this is not always a positive experience. The
students who exhibit less positive attitudes towards what should in fact be a
fascinating and relevant subject reflect this. They are expected to work well in teams
when they enter the work force and yet are given little significant training for this.
After some preliminary work by the researcher and some work on group testing by
Atkins (1993), this study to further investigate cooperative group work and its effect
on student attitudes was initiated.
During the course of the study to establish the effect on student attitudes of
cooperative group work and assessment, a number of significant contributions have
been made to the growing pool of knowledge on this topic.
The first significant contribution is in the validation of the Test of Science Related
Attitudes (TOSRA) after initial development and validation in schools in both
Australia and the USA by Fraser (1981a), for the first time in New Zealand schools.
A second significant contribution is made in the comparisons of the science-related
attitudes of several subgroups of the study population. The effects of gender, grade
level and band on student attitudes were investigated along with consideration of the
role of the teacher and general classroom environment. The TOSRA yields separate
scores for a number of distinct attitudinal aims instead of a single score, this means

149
that a profile of attitudinal scores of the various subgroups have been able to be
accurately assessed for any statistically significant variations.
The triangulation approach to the effect of group work and assessment on the
science-related attitudes of Year 9 and 10 students makes a third significant
contribution. The quantitative data generated through the use of the TOSRA along
with qualitative data obtain through student and teacher interviews all help to build
an accurate picture of student attitudes.
Much of this work was carried out during the period of the study in 1998, however
there have been some significant results, modifications and improvements during the
ensuing period with some of this reported in Chapter 6 (longitudinal case study and
the lower band students). There have been a number of new initiatives introduced in
more recent times and these are reported later in the body of this chapter.
Consequently, this study is distinct in its contribution to the fields of cooperative
group work and assessment along with the assessment of science-related attitudes of
our students.
Perhaps the most significant contribution is the addition of a simple, effective
method of improving the attitudes and enjoyment that students obtain from their
science lessons. The ensuing improvement in understanding and teamwork through
working with their peers is most likely to occur as a result of this work. Teachers
can easily incorporate these techniques into their current teaching with no
corresponding increase in stress or workload.
7.2 OVERVIEW OF THE STUDY
The context of this study is in the field of cooperative group work and attitudes
towards science. Chapter 2 outlined the literature in this area and while there was
significant work as early as the 1700s the modern era is generally considered to have
started in the mid-1960s by Johnson and Johnson of the University of Minnesota.
150
There have been significant contributions to cooperative group work by several
researchers and these were outlined in the chapter. There was a focus on how groups
are best structured and the conditions in which they are found to operate most
effectively by a number of significant researchers.
The research into attitudes was traced in Chapter 2 starting with some initial
problems with getting a widely accepted definition of the term. The first attempts to
make quantitative measurements of attitudes also were traced with some identified as
early as 1928, but the birth of the modern era is considered to be the mid –1960s.
Attention is given to the development of various instruments including the TOSRA
by Fraser (1981a), which yielded a separate score for a number of attitudinal aims
rather than just one overall score.
The methodology to establish cooperative groups on a simple yet effective basis and
the selection of the schools, teachers, classes and students along with the subsequent
measurement of students’ attitudes was outlined in Chapter 3. Selections of
appropriate procedures for the collection of quantitative and qualitative data from the
study were discussed along with any additional information from the longitudinal
studies running over a longer time frame.
With the TOSRA being the instrument selected to collect quantitative data on student
attitudes, its validation and reliability was outlined through in Chapter 4. The
profiles and subsequent comparisons of various subgroups students based on gender,
school, grade and band were reported in Chapter 5. Significant differences and
possible explanations were also discussed within this chapter.
Underlying the research is a desire to improve the attitudes of students towards
science. Consequently Chapter 6 described how cooperative group work and
assessment affects the science-related attitudes of the students who took part in this
study. Thorough examination of quantitative data from the TOSRA and qualitative
data from the interviews of students and teachers along with researcher observations
yielded a reasonable picture of the attitudes of the various student groups who
participated in the study.

151
7.3 MAJOR FINDINGS OF THE STUDY
7.3.1 Objective One
The first objective of this study was:
to provide validation data for the use of the Test of Science Related Attitudes
(TOSRA) in New Zealand.
The TOSRA was developed to measure the science related attitudes of students, in
this case those in Years 9 and 10. It has the advantage over other science attitude
tests of providing distinct attitudinal aims rather than a single overall score. This
means that student attitudinal profiles can be drawn and any statistically significant
changes can be inferred. Comparisons between individuals or groups of students can
be made or if the test is taken on two separate occasions any attitudinal changes,
even if for only one of the scales, can be monitored and assessed. Hence there was a
need to validate the TOSRA for New Zealand students.
The statistical validation of the instrument was reported in Chapter 4 and several
measures were used in the validation of the TOSRA. In the factor analysis where a
correlation matrix of all 70 original TOSRA items was presented and then
manipulated to leave a 55 item instrument with satisfactory correlations with most
being at least 0.55. The internal consistency of all of the scales was shown to be well
above the minimum acceptable levels through the use of the Cronbach alpha
coefficient. The only exception was the Adoption of Scientific Attitudes scale,
which was reduced to only four items as a result of the factor analysis. The
discriminant validity of TOSRA was measured using the scale’s mean correlation
with other scales and this showed that the items used in the instrument correlate far
more with items in the same scale than with items in other scales. Overall the
instrument TOSRA was found to have satisfactory discriminant validity. These
results compared favourably with those from Australia schools reported by Fraser
(1981a). The overall conclusion that can be drawn from the descriptive statistics is
that the TOSRA is a reliable and valid instrument for use in New Zealand schools.
152
7.3.2 Objective Two
The second objective of this study was:
to determine relationships of grade and gender of students with their attitudes
to science.
The quantitative data generated by the TOSRA were useful in the establishment of
some trends and patterns within the subgroups of the population and this was fully
reported within Chapter 5. When the science related attitudes of boys and girls
across the entire population are compared, the girls exhibited more positive attitudes
towards the Normality of Scientists scale while the boys were more positive towards
the Enjoyment of Science Lessons and the Leisure Interest in Science.
When students are further split into classes and levels, the results show that the
gender and experience of the teacher could in fact also have some bearing on some of
the attitude scales of boys and girls. The younger teachers, both male and female,
generally have a more polarizing effect on the boys and girls within their classes.
There were often no corresponding statistically significant differences in science-
related attitudes between the boys and girls when the teacher was older and more
experienced.
Recent work by researchers such as Jones, Howe, and Rua (2000) has shown that
background including aspects such as culture and the out of school experiences
continues to make a significant contribution to boys’ and girls’ attitudes and
perceptions of science. This is still likely to over ride any of the experiences students
may experience during their science lessons at school until perhaps they reach the
senior school when they are mature enough to form attitudes on a more informed
basis.

153
7.3.3 Objective Three
The final objective of this study was:
to determine the effect of a cooperative approach to learning and assessment
on the attitudes of students to science.
There is significant and varied evidence presented in Chapter 6 to support the
assertion that cooperative group work and assessment does in fact have a positive
effect on the science-related attitudes of Year 9 and 10 students. Data from the
TOSRA and student and teacher comments during both formal and informal
interviews have supported this work as both enjoyable and effective. Observations
by the researcher also support this statement.
The key to the success of any cooperative learning programme is the way the groups
are established, how they operate and the types of tasks they are set. In a secondary
school, group work needs to be simple and non-intrusive on the regular delivery of
the curriculum or it will not be done given current teacher workloads and conditions.
Johnson and Johnson (1999) suggest that student selected groups may result in more
off-task behaviour but the tasks such as laboratory work and tests have to be done in
a set time frame and as such there is little opportunity for off-task behaviour. The
group mark is an incentive to work well and while Johnson and Johnson (1989)
suggest the cautious use of incentives Slavin (1989) maintains that students must
have a good reason to take each other seriously. The way that students assist each
other with explanations, particularly during group tests, certainly helps them learn
more. Group testing falls into line well with the collegial model proposed by Cohen
(1986) where the statement ‘Peer explanations are often excellent, and those who
explain often show intellectual gains as a consequence’ (p. 56) perhaps best sums up
students working cooperatively on a difficult problem during a group test. Work by
New Zealand researchers Brown and Thomson (2000) also supports peer teaching
and they go on to suggest that one of the four ideals teachers and students need to
build on while establishing their groups is the need to have fun. ‘Enjoyment in
learning is one the big pluses of cooperative learning. In cooperative classrooms it is
easy to meet the students’ need to have fun’ (p. 59).

154
7.4 SIGNIFICANT IMPROVEMENTS
Much of the research presented in this thesis is based on the data collected over a
one-year period involving 13 classes from the four schools participating in the study.
There have been some significant developments by the researcher during the course
of his regular teaching programme. A number of these are improvements, which add
significantly to the study and the implementation of a more successful and rewarding
cooperative learning programme. These will be discussed here, as research of this
type should perhaps be best viewed as seamless in nature with no finite ending. The
year of implementation of these changes at the researchers own school has been
noted along with each of the recommendations.
7.4.1 Review Testing
After students have completed a test, the going over of the answers is often seen as a
waste of time by students yet teachers know that reviewing where you have gone
wrong in a test is very important as we learn from our mistakes. One of the
strategies introduced to help this and build the teamwork is the review test. Johnson
and Johnson (1994) suggest that one of the four levels of group functioning,
fermenting, requires students to ‘ferment’ their ideas through thorough review,
justification and explanation. The review test does this with the added incentive of
increased marks for the group. This was first trialed during 1999 by the researcher at
School 3.
Groups are returned their test scripts with their marks including those questions to
which they have incorrect responses. The groups are given approximately 15
minutes to go over the test in their groups noting which ones were incorrect. They
are then given the opportunity to go home and prepare for their review test, in which
they are given the same test again with reduced time. They then resubmit their tests
for marking and the new mark as a fraction of 100, is multiplied by half of what they
missed out on the first time and added to their original mark. This is their new mark
with a maximum of their original mark plus half of what they missed should they
score 100 percent in the review test. Hence, a team who scored 60 percent would be

155
able to raise their mark to a maximum of 80 percent should they get 100 percent in
the review (Murray 1990). There are obviously variations to this, such as the
students doing the review test in class as soon as they get their scripts back using an
‘open book’ policy where they have to use their notes and texts to work out the
missing answers.
This strategy has been very successful with the students enjoying the opportunity to
increase their group mark. The increased cooperation and opportunity to learn more
as they try for more marks has proved to be worthwhile. The teacher does have to re-
mark the tests but it is reduced the second time and since there are only 9 or 10
scripts in a class this is still less onerous than tests taken by individuals.
7.4.2 League Tables and Group Names
The students certainly enjoy naming their group or learning team and come up with
some imaginative titles. A natural extension of this is the introduction of ‘league
tables’ where each groups place is listed on a chart in rank order. The groups are
given a mark for their placing in each event (any task that is marked) such as 10 for
first and one for last. The teacher can set up tasks such as a practical activity where
the identity of various chemicals has to be found and the first group with the correct
mark provided to the teacher receives the top mark and so on. If there is a range of
tasks, every group will have an opportunity for their moment of glory. Students
enjoy this aspect of their group work and even the lower ranked students enjoy the
chances they get. They are working together to achieve more but not on their own.
A sample ‘league table’ can be found in Appendix E and again this was first trialed
in 1999 by the reseacher.
Johnson and Johnson (1999) suggest that all three structures: competitive,
individualistic and cooperative can be integrated within one lesson. They believe
that students should be able to compete for fun and enjoyment. The use of names
and league tables falls into line with these statements.
156
7.4.3 Senior Students: Revision Tests
As students progress through from the junior school (Years 9 and 10) to the senior
school their main focus is the passing of external examinations and as the subjects
become more abstract they find this more difficult. The researcher found during
1999 and 2000 that students who have been in his junior classes and experienced
group testing will often ask after a chemistry or physics unit, ‘Can we do this test in
our teams please as we are finding this harder and want to learn off each other?’ This
gives them an opportunity to work through difficulties with their peers as the teacher
circulates around the class. The students can do more of these formative assessments
with no corresponding increase in teacher workload since fewer scripts need to be
marked. Teachers do not usually use assessment and the data generated to alter their
curriculum delivery (Gallagher, 1987: Salish, 1997). In a study on assessment on
middle school science classes by Treagust, Jacobowitz, Gallagher and Parker (2001)
the implication was drawn that it is possible to develop an assessment culture in
schools, as opposed to a testing culture. This type of assessment has been described
as ‘ongoing embedded assessment’ (Gallagher, Parker & Ngwenya, 1999; Wiggins,
1998). Treagust et. al. (2001) also make the statement that ‘the integration of
teaching with assessment does lead to improvement of science teaching’ (p. 137).
Some aspects of group assessment can be carried out in the senior school and the
students find this very helpful of their study programme. This has been trialed
7.4.4 Team Practical Examination
A team practical examination for all Year 9 students initiated by the researcher has
been operating very successfully in School 3 since 1997. The students operate in
their usual groups and are roistered into two adjoining laboratories where the
experiments are set up. The experiments are new to the students and involve rotating
around each of the workstations. They complete one paper for their group during
which the tasks for each group member are carefully defined with their names being
listed on the first page under each of the following headings: equipment manager,
technician and recorder. These roles are rotated at each workstation to ensure all
members get an opportunity in each of the roles. The experiments are balanced

157
between each of the science disciplines with a molecular modeling exercise also
included. The examination can be found in Appendix F.
The students really did enjoy working in this examination; they were able to talk
among their group but not between groups as with their regular group tests. The top
students were often not from the upper bands as would be the case in a written
examination done as individuals but from a range of classes. The practical was very
easy to administer and mark.
7.4.5 Problem-Based Learning
The researcher at School 3 has implemented problem-based learning in cooperative
groups. This has been with upper band students at Year 10 and was first
implemented in 2000. The students are given a problem or scenario, which they are
required to solve in their groups. In order to solve this they need to study various
aspects of the unit being studied. Resources are provided along with the teacher to
help them achieve this. The students have found this a really enjoyable way of
learning the unit and they have produced excellent notes and resources, which can
then be used as a reference later in the year. Units such as the human body studied in
the context of their favorite sports team have proved very successful. This has also
been implemented very successfully at tertiary level in New Zealand and Australia in
Physiotherapy. Students in teams of three or four are assigned to the case study of a
patient who has presented with a particular disorder, which is described. The
students have to suggest the possible causes, followed by suitable diagnosis
sequences, and then a treatment and management plan over a suitable time frame.
The students studying under this process have learned far more effectively than those
in conventional classes according to Reid (2004), Acting Head, Division of
Rehabilitation and Occupation Studies, Auckland University of Technology, New
Zealand. Problem-based learning in groups is powerful means of giving students
more ownership and enjoyment from discovering for themselves key aspects of a
unit.

158
7.4.6 Concept Cartoons
This use of argumentation in science through concept cartoons (Naylor, Keogh, &
Downing, 2001) has proved to a valuable tool for use in cooperative group work and
has been a regular part of the programme at School 3 for Year 10 students since
2002. Some excellent discussions among group members have lead to a better
understanding of concepts which students often find more difficult.
7.5 IMPLICATIONS OF THE STUDY
One of the immediate implications of this study is that an instrument, which has been
demonstrated to clearly differentiate between various groups of students, has now
been validated for New Zealand conditions. Whether it is for comparing various
subpopulations or monitoring changes in attitudes it is a powerful instrument in that
it can look at the various aspects of attitudes rather than just an overall attitude score.
Hence, it is useful instrument for New Zealand researchers in science education.
Implications for the teachers of science are that there is now a simple, easy to
manage cooperative group structure, which can readily be established in a regular
science classroom. There is no need to make any changes to the way that the
curriculum is delivered and teacher workload may in fact decrease.
Some teachers have expressed a concern that each test the students take does not
generate an individual mark for each student but a group mark. Teachers involved in
the study found that this became much less of a concern as they saw the academic
progress and enjoyment that the students obtained from their cooperative group
work.
Essentially, students are assessed as individuals at the end of each year and it is our
job as teachers to choose the path that allows the students to achieve the best possible
result in the final end-of-year assessment. The choice of a path where students have
worked together as a valued member of a cooperative learning team during the

159
course of the year and also emerged with more positive attitudes towards science
would appear to be more sensible. Treagust, Jacobowitz, Gallagher and Parker
(2001) see the development in the middle school of an assessment culture as opposed
to a testing culture as desirable for student cognitive outcomes. Baker (1998) notes
that the test-taking situation does interact to some extent with the format of the
assessment task.
New Zealand has moved away from a norm-referenced assessment system to a
standards-based assessment system. The NCEA (National Certificate in Educational
Achievement) was implemented for the first time for Year 11 students in 2002
followed by Year 12 in 2003 and finally Year 13 in 2004. This system is a
combination of internal work during the course of the year and also external
examinations at the end of the year. Group testing of students in the lead up to both
internal and external assessments for NCEA is ideal preparation as students and their
teachers work together during the tests in a formative manner. If the students have
been involved in a cooperative learning culture of this nature in the junior school
they should be better prepared for their science from Year 11 onwards with better
cognitive and attitudinal outcomes.
Some schools in New Zealand are now implementing a more rigorous testing
programme in order to better prepare students for the NCEA style of testing they will
experience. This may in fact have the reverse effect for our lower ability students if
they are to perceive even more failure in the junior school. Meece and Jones (1996)
make the statement that ‘the task for teachers is to create classroom environments
where low-ability students can put forth effort without fear of failing or appearing
dumb’ (p. 403). This statement supports the concept of cooperative group work and
assessment for lower ability students. This study proved to be an outstanding
success with the group of students of this nature.
Finally, we do little training of students for working in teams yet several managers
and CEOs have explained to the researcher that the ability to work as part of a team
is the most important aspect to consider of a potential employee. Ellis (2003),
General Manager of the highly successful Republik advertising and marketing
company based in Auckland, New Zealand, explained how important it was that
160
various strands of advertising are linked together by the people responsible from
several different departments to produce a final advertising and marketing strategy.
They must work together as a team to achieve this effectively or they will not
compete.
He was asked the following question. When hiring new staff what are you looking
for as important qualities and if possible rank these?
Most important is that they fit the culture of our company and after that their
qualifications and experience.
Hence some training of our students in cooperative group work is a useful tool to
them for their future employment opportunities.
7.6 LIMITATIONS OF THE STUDY
An obvious limitation of this study is that any of the conclusions drawn from the data
relate only to this sample of students. The schools selected were all of a similar
nature in order to manage the variables to allow meaningful comparisons of students
within this population. City schools did not form part of the study and as such the
impact of such a group cannot really be ignored when considering any inferences
made from the results.
A second limitation lies in the size of the samples as the numbers are broken down
into smaller subgroups of the original population. Statistically, some of the results
and implications may need to be treated with caution. The other size limitation
imposed is that when the effects of the longitudinal study conducted by the
researcher are considered and conclusions drawn. This group was initially set up as a
pilot trial prior to the main study, but since the students involved were still at School
3 and keen to be involved it was seen as an opportunity to evaluate cooperative group
work and assessment over a longer time frame. The results from this have been
treated cautiously. The same applies to the group of 18 students in the lower band of
students at college 4. There were very few of these groups in existence in New

161
Zealand schools at the time of the main study with most of these students being
‘mainstreamed’. There has, however, been a swing towards more of them again with
these students struggling to achieve in mainstream classes and still suffering from
poor self-esteem as a consequence.
7.7 SUGGESTIONS FOR FURTHER RESEARCH
7.7.1 Cognitive Outcomes of Cooperative Group Work and Assessment
This study has focused on the change in Year 9 and 10 students’ attitudes when
working in cooperative groups for their class work and assessment activities. There
have been some inferred improvements from statements by students and teachers;
however, investigations on the effect of cooperative group work and assessment on
the cognitive outcomes of this group of students would be an exciting possibility. In
New Zealand during 2002 and 2003, there has been a national testing programme
established to monitor the relative achievement of Year 9 and 10 students. This is
known by the acronym MIDYIS (Middle Years Information Systems) developed by
Durham University in the UK and is administered by Canterbury University, New
Zealand. This is standardised and around a third of New Zealand schools are using it
but this is expected to increase rapidly. This would provide an excellent and
consistent means of comparing groups of students involved in such a study.
7.7.2 Student-Teacher Interaction
The possible effect of the teacher on students’ attitudes was alluded to in Chapter 5
where several observations as a result of the TOSRA results of various subgroups of
students were made. In a study by Rickards (1998), the statement ‘for a more
positive student attitude to class, the behaviours of leadership, helping/friendly,
understanding and student responsibility and freedom were positively associated to
attitude to class’ (p. 152.) outlines one of his implications. This would provide the
basis for an interesting follow-up study looking at cooperative group work and

162
assessment alongside student/teacher data generated through the use of some of the
classroom environment instruments such at the Questionnaire on Teacher Interaction
(QTI) (Wubbels, Creton, & Hooymayers, 1985).
7.7.3 City Schools
As mentioned previously in the limitations of this study, the students within our city
schools have not been part of this study and as such would be an interesting
extension to the data collected on basically rural students. While the two groups are
perhaps not as distinct as they were before the advent of communications such as text
messages cell phones, instant computer messaging, a comparison of the two groups
would make for interesting research.
7.7.4 Māori Students and other Cultural Groups
As with most state secondary schools the lower achievement of our Māori students is
of concern. A number of schools including School 3 have a Māori initiative where
Year 9 Māori students are taught as a group enabling much of the teaching to be in a
Māori context. This provides the opportunity to teach using cooperative group work
and assessment to a class of Māori students. The Māori culture has a lot of tradition
in cooperative work as part of day-to-day life, as do a number of other cultures
within New Zealand. A study of any such minority groups whose culture is perhaps
predisposed towards cooperative group work would be an interesting and useful
contribution to New Zealand society which has become truly multicultural.
7.8 FINAL COMMENTS
This study has identified an association between cooperative group work and
assessment for Year 9 and 10 students and their science related attitudes. This is the
first study of this nature and with such encouraging results and such a simple format
for the effective establishment of student groups it is hoped that teachers will

163
consider this approach for their science teaching. The opportunity to allow students
to develop their interpersonal skills in a team environment, along with their
understanding and enjoyment of science, is well worth the effort required to establish
cooperative group work. As teachers we cannot sit back and allow significant
numbers of our students to have negative attitudes towards the exciting and vital
subject of science without trying to improve this.

164
REFERENCES

165
Adams, R. (1986). Some contributions to sex differences in scholastic aptitude
scores. Studies in Educational Evaluation, 12, 267-274.
Ames, C., & Ames, R. (1984). Goal structures and motivation. The Elementary
School Journal. 85, 1, 39-52.
Aronson, E., Blaney. N., Stephen, C., Sikes, J., & Snapp, M. (1978). The jigsaw
classroom. Beverly Hills, CA: Sage Publications.
Atkins, S.G. (1993). Cooperative testing in secondary school sciences Research
Report, University of Waikato
Baker, D. R. (1985). Predictive value of attitude, cognitive ability, and personality to
science achievement in the middle school. Journal of Research in Science
Teaching, 22, 103-113.
Baker, D. R. (1998). Equity issues in science education. International Handbook of
Science Education, 2, 860-895.
Baker, D., & Leary, R. (1995). Letting girls speak out about science. Journal of
Research in Science Teaching, 32, 3-27.
Baldwin, J. A., Ebert-May, D., & Burns, D. J. (1999). The development of a college
biology self-efficacy instrument for non majors. Science Education, 83(4),
397-408.
Bandura, A. (1986). Social foundations of thought and action: A social cognitive
theory. Englewood Cliffs, NJ: Prentice-Hall.
Bandura, A. (1994). Self-efficacy. In V. S. Ramachaudran (Ed.),
Encyclopedia of human behavior (Vol. 4, pp. 71-81). New York:
Academic Press.
Bandura, A. (2004). Information on Self-Efficacy: A Community of Scholars.
Retrieved August 29, 2004, from www.emory.edu/EDUCATION/mfp/self-
efficacy
Bell, A. (2001). The history of the School. Retrieved December 20, 2001, from
http://www.madras.fife.sch.uk/schoolhist
Brekelmans, M., Wubbels, T., & Créton, H. (1990). A study of student perceptions
of physics teacher behavior. Journal of Research in Science Teaching, 27,
335-350.
166
Brophy, J., & Good, T. L (1986). Teacher behavior and student achievement. In M.
C. Wittrock (Ed.), Handbook on research on teaching (3rd ed.). (pp. 328-
375). New York: Macmillan.
Brown, D.F. (1992). The development of strategic classrooms in two secondary
schools. Waikanae: Wordsmiths.
Brown, D.F., & Thomson, C. (2000). Cooperative learning in New Zealand schools.
Palmerston North, N.Z. Dunmore Press.
Cohen, D. (1971). Can scientific attitudes be evaluated? Research, 135-143.
Cohen, E. G. (1984). Talking and working together: Status, intereaction and learning.
In P. L. Peterson, L. C. Wilkinson, & M. Halinan (Eds.), The social context of
instruction: Group organization and group processes. (pp. 171-187). New York:
Academic Press.
Cohen, E. G. (1986). Designing groupwork: Strategies for the heterogeneous
classroom. NY: Teachers College Press, Columbia University.
Cohen, E. G. (1994). Designing groupwork: Strategies for the heterogeneous
classroom. New York: Teachers College Press.
Coll, R. K., & Fisher, D. L. (2000). Learning environment instruments and their
relevance for tertiary science teachers. Journal of Science and Mathematics
Education in S.E. Asia, 23(1), 33-47.
Coll, R. K., & Taylor, T. G. N., (2000). How do we see ourselves? : Measuring
perceptions of teaching style using the questionnaire on teacher interaction (QTI)
instrument. Teaching and learning, 2(2), 20-30.
Cotterell, J. L. (1992). School size as a factor in adolescents’ adjustment to the
transition to high school. Journal of Early Adolescence, 12(1), 28-45.
Cronbach, L.J. (1951) Coefficient alpha and the internal structure of tests.
Psychometrika, 16, 297-334.
Dalgety, J. A.,Coll, R, K., & Jones, A. T. (2000, November). The influence of
tertiary learning experiences on student attitude and self-efficacy. Paper presented
to Annual New Zealand Association for Research in Education Conference,
Hamilton, NZ.
Deutsh, M. (1949a). The theory of cooperation and competition. Human Relations,
II. 2, 129-152.
Deutsh, M. (1949b). An experimental study of the effects of cooperation and
competition upon group processes. Human Relations, II. 3, 199-231.

167
DeVries, D. L., & Edwards, K.J. (1973). Learning games and student teams: Their
effects on classroom processes. American educational research journal. 10(4),
307-318.
Dewey, J. (1922). Democracy in education. NY: Macmillan.
Dewey, J. (1924). The school and society. Chicago: University of Chicage Press.
Ellis, S. P. (2003, November). Personal communication.
Ferguson, P. D., & Fraser, B. J. (1998). Student gender, school size and changing
perceptions of science learning environments during the transition from
primary to secondary school. Research in Science Education, 28(4), 387-397.
Ferguson, P. D., & Speering, W. (1997). Great expectations: Grim realities.
Secondary school initiates perceptions of science. Proceedings of the 1997
International Conference on Science, Mathematics and technology Education
(pp. 189-198). Hanoi, Vietnam.
Fisher, D. L., Fraser, B. J., & Rickards, T. (1997, April). Gender and cultural
differences in teacher-student interpersonal behaviour. Paper presented at the
annual meeting of the American Educational Research association, Chicago.
Fisher, D. L., Rickards, T. W., Goh, S. C., & Wong, A. F. L. (1997a). Perceptions of
interpersonal teacher behaviour in secondary science classrooms in Singapore
and Australia. Journal of Applied Research in Education, 1, 2–13.
Fisher, D. L., Rickards, T. W., Goh, S. C., & Wong, A. F. L. (1997b). Perceptions of
interpersonal teacher behaviour in secondary science classrooms:
Comparisons between Australia and Singapore. In D. L. Fisher & T. Rickards
(Eds.), Science, Mathematics and Technology Education and National
Development (pp. 136-140). Perth: Curtin University of Technology.
Fisher, T. H. (1973). The development of an attitude survey for junior high science.
School Science and Mathematics, 73, 379-384.
Fleming, D. (1967). Attitude: The history of a concept. Perspectives in American
History, 1, 287-365.
Fraser, B. J. (1977a). Attitude to the social implications of science: Its measurements
and correlates. Australian Science Teachers Journal, 23(2), 96-99.
Fraser, B. J. (1977b). Perceptions of the normality of scientists among junior high
school students, Search, 8, 240-241.
Fraser, B. J. (1977c). Selection and validation of attitude scales for curriculum
evaluation. Science Education, 61, 317-329.

168
Fraser, B. J. (1978a). Environmental factors affecting attitude toward different
sources of scientific information. Journal of Research in Science Teaching,
15, 491-497.
Fraser, B. J. (1978b). Development of a test of science-related attitudes. Science
Education, 62, 509-515.
Fraser, B. J. (1978c). Some attitude scales for ninth grade science. School Science
and Mathematics, 78, 379-384.
Fraser, B.J. (1981a). Test of Science-Related Attitudes (TOSRA). Melbourne:
Australian Council for Educational Research.
Fraser, B. J. (1981b). Using environmental assessments to make better classrooms.
Journal of Curriculum Studies, 13, 131-144.
Fraser, B. J. (1998). Science learning environments: Assessment, effects and
determinants. In B. J. Fraser & K. Tobin (Eds.) International handbook of science
education (pp. 527-564). Dordrecht, The Netherlands: Kluwer.
Fraser, B. J. (2000, May). Personal communication.
Gaillett, L.L. (1994). An historical perspective on collaborative learning. Journal of
Advanced Composition. 14(1), 93-110.
Gallagher, J. J. (1987). Secondary science teachers and constructivist practice. In K.
Tobin (Ed.), The practice of constructivism in science education (pp. 181-191).
Washington. DC: American Association for the Advancement of Science.
Gallagher, J. J., Parker, J., & Ngwenya, J. (1999). Embedded assessment and reform
in science teaching and learning. East Lansing, MI: Michigan State University,
USA.
Gardner, P. L. (1975a). Attitude measurement: A critique of some recent research.
Educational Research, 17, 101-109.
Gardner, P. L. (1975b). Attitudes to science: A review. Studies in Science Education,
2, 1-41.
Germann, P. J. (1988). Development of the attitude toward science in school
assessment and its use to investigate the relationship between science
achievement and attitude toward science in school. Journal of Research in
Science Teaching, 25, 689-703.
Getzels, J. W. (1969). A social psychology of education. In G. Lindzey., & E.
Aronson (Eds.), The handbook of social psychology Volume 5 (2nd ed; pp. 459-
537). London: Addison-Wesley.
169
Gilbert, J. (1990). Secondary school students talking about science: Language
functions, gender and interactions in small group discussions. Unpublished
(MEd) Thesis: Victoria University, Wellington, New Zealand.
Glasser, W. 1969. Schools without failure. New York: Harper.
Glasser, W. 1986. Control theory in the classroom. New York: Harper.
Glynn, T., & Bishop, R. (1995). Cultural issues in educational research: A New
Zealand perspective. He Pukenga Korero. 1(1), 37-43.
Greenfield, T. A. (1997). Gender and grade level differences in science interest and
participation. Science Education, 81, 259-276.
Hembree, R. (1988). Correlates, causes, effects and treatment of ‘test anxiety’.
Review of Educational Research, 58, 41-77.
Hassell, S. (1998, November 19). Male students falling behind – but only if we let
them. Waikato Times, New Zealand.
Henderson, D., Fisher, D. L., & Fraser, B. J. (1994, March). Learning environments
and student outcomes in senior high school biology classes. Paper presented
at the annual meeting of the National Association for Research in Science
Teaching, Anaheim, CA.
Henderson, D., Fisher, D. L., & Fraser, B. J. (1995, April). Associations between
learning environments and student outcomes in biology. Paper presented at the
annual meeting of the American Education Research Association, San Francisco,
CA.
Henderson, D., Fisher, D. L., & Fraser, B. J. (2000). Interpersonal behavior,
laboratory learning environments, and student outcomes in senior biology
classes. Journal of Research in Science Teaching, 37, 26-43.
Henderson, D., & Reid, K. (2000, January). Learning environments in senior
secondary science classes. Paper presented at the second international conference
on Science, Mathematics and Technology Education, Taipei, Taiwan.
Johnson, D.W., & Johnson, R. (1985). The internal dynamics of cooperative learning
groups. In Slavin, R., Sharin, S., Kagan, S., Lazarowitz, R., Webb, C., &
Schumck, R. (Eds.). (1985). Learning to cooperate, cooperating to learn (pp. 103-
124).
Johnson, D.W., & Johnson, R. (1987). Learning together and alone. Co-operative,
competitive, and individualistic learning (3rd ed.) Englewood Cliffs, NJ: Prentice-
Hill.
170
Johnson, D.W., & Johnson, R. (1989). Cooperation and competition: Theory and
research. Edina, MN: Interaction Book Company.
Johnson, D.W., & Johnson, R. (1991). Cooperative learning and classroom and
school climate. In B. Fraser & H. Walberg (Eds.). Educational environments,
Evaluation, antecedents and consequences (pp. 55-74). New York: Permangon
Press.
Johnson, D.W., & Johnson, R. (1992). What to say to advocates for the gifted.
Educational Leadership. 50, 2, 44-47.
Johnson, D.W., & Johnson, R. (1994). Leading the cooperative school (2nd ed.).
Edina, MN: Interaction Book Company.
Johnson, D.W., & Johnson, R. (1999). Learning together and alone: Cooperative,
competitive, and individual learning. Boston: Allyn and Nacon.
Johnson, D.W., Johnson, & R., Holubec, E. (1993). Cooperation in the classroom
(6th ed.). Edina, MN: Interaction Book Company.
Johnson, D.W., Johnson, R., & Holubec, E. (1994a). The new circles of learning:
cooperation in the classroom and school. VA: Association for Supervision and
Curriculum Development.
Johnson, D.W., Johnson, & R., Holubec, E. (1994b). Cooperative learning in the
classroom. VA: Association for Supervision and Curriculum Development.
Johnson, D.W., Johnson, R., & Holubec, E., & Roy, P. (1984). Circles of learning.
VA: Association for Supervision and Curriculum Development.
Jones, G. M., Howe, A., & Rua, M. J. (2000). Gender differences in students’
experiences, interests, and attitudes toward science and scientists. Science
Edcucation. 84: 180-192.
Kagan, S. (1992). Cooperative learning. San Juan Capistrano, CA: Kagan
Cooperative Learning.
Kagan, S. (1994). Cooperative learning resources for teachers. San Juan Capistrano,
CA: Resources for Teachers.
Kagan, S. (1998). New cooperative learning, multiple intelligences, and inclusion. In
J. Putman (Ed.). Cooperative learning and strategies for inclusion. Baltimore,
MD: Paul Brookes publishing Co.
Kahle, J., & Lakes, M. (1983). The myth of equality in science classrooms. Journal
of Research in Science Teaching, 20, 131-140.

171
Kelly, A. (1986). The development of girls’ and boys’ attitudes to science: A
longitudinal study. European Journal of Science Education, 8, 399-412.
Kim, H.-B., Fisher, D. L., & Fraser, B. J. (1999). Assessment and investigation of
constructivist science learning environments in Korea. Research in Science &
Technological Education, 17, 239-249.
Kim, H-B., Fisher, D. L., & Fraser, B. J. (2000). Classroom environment and teacher
interpersonal behaviour in secondary science classes in Korea. Evaluation
and Research in Education, 14, 3-22.
Koballa, T. R. (1988). Attitude and related concepts in science education, Science
Education, 72, 115-126.
Kroll, D.L., Masinglia, J.O., & Mau, S. (1992). Cooperative problem solving: But
what about grading? Arithmetic Teacher, 39(6), 17-23.
Klopfer, L. E. (1971). Evaluation of learning in science. In B. S. Bloom, J. T.
Hastings, and G. F. Madus (Eds), Hanbook on Summative and Formative
Evaluation of Student Learning. New York: McGraw-Hill, 1971.
Klopfer, L. E. (1976). A structure for the affective domain in relation to science
education, Science Education, 60, 299-312.
Lancaster, J. About Joseph Lancaster. Retrieved December 20, 2001, from
http://www.madras.fife.sch.uk/schoolhist/
Likert, R. A. (1932). Technique for the measurement of attitudes. Archives of
Psychology, 140, 1-55.
Mason, C. L., & Kahle, J. (1988). Student attitudes toward science and science-
related careers: A programme designed to promote a stimulating gender-free
learning environment. Journal of Research in Science Teaching. 26, 25-39.
Mathews, J. C. (1974) The assessment of attitudes. In H. G. Macintosh (Ed.),
Techniques and problems of assessment (pp. 172-185). London: Arnold.
Mead, M. & Metraux, R. (1957). Image of the scientist among high school students.
Science, 126, 384-390.
Meece, J. L. & Jones, M. (1996). Gender differences in motivation and strategy use
in science: Are girls rote learners? Journal of Research in Science Teaching.
33(4). 393-406.
Meloth, M., & Deering, P. (1994) Task talk and task awareness under different
cooperative learning conditions. American Educational Research Journal, 31, 1,
138-165.

172
Ministry of Education (1993). Science in the New Zealand Curriculum. Wellington,
New Zealand: Learning Media.
Misiti, F. L., Shrigley, R. L., & Hanson, L. (1991). Science attitude scale for middle
school students. Science Education, 75(5), 525-540.
Moore, R. W., & Foy, R. L. (1997). The Scientific Attitude Inventory: A revision
(SAI II). Journal of Research in Science Teaching, 34, 327–336.
Moore, R. W. & Sutman, F. X. (1970). The development, field test and validation of
an inventory of scientific attitudes. Journal of Research in Science Teaching,
7, 85-94.
Munby, H. (1982). The impropriety of “panel of judges” validation in science
attitude scales: A research comment. Journal of Research in Science
Teaching, 19, 617-619.
Munby, H. (1983). Thirty studies involving the “Scientific Attitude Inventory”: What
confidence can we have in this instrument? Journal of Research in Science
Teaching, 20, 141–162.
Munby, H. (1997). Issues in validity of science attitude measurement. Journal of
Research in Science Teaching, 34, 337-341.
Murray, J.P. (1990). Better testing for better learning. College Teaching, 38(4), 148-
152.
Naylor, S., Keogh, B., & Downing, B. (2001, July). Dennis likes a good argument:
concept cartoons, argumentation and science education. Paper presented at the
Australian Science Education Research Association conference, Sydney,
Australia.
Nunnally, J.C. (1978). Psychometric theory (2nd ed.). New York: McGraw Hill.
Okebukola, P. A. (1986). Cooperative learning and students’ attitudes to laboratory
work. School Science and Mathematics, 86, 582-590.
Osbourne, R. & Freyberg, P. (1985). Learning in Science: The Implications of
Children’s Science. Auckland: Heineman Educational Books.
Parker, L. H. & Rennie, L. J. (1998). Equitable assessment strategies International
Handbook of Science Education, 897-910.
Perrodin, A. F. (1966). Children’s attitudes towards science. Science Education, 50,
214-218.
Reid, D. J. (2004, January). Personal communication.

173
Rickards, T. W. (1998). The relationship of teacher-student interpersonal behaviour
with student sex, cultural background and student outcomes. Unpublished
doctoral thesis, Curtin University of Technology, Perth, Australia.
Salish, (1997). Secondary science and mathematics teacher preparation
programmes: Influences on new teachers and their students. Final report of
the Salish 1 research project. Iowa City: University of Iowa, USA.
Shrigley, R. L. (1983). The attitude concept and science teaching. Science Education,
67, 425-442.
Shrigley, R. L., Koballa, T. R., & Simpson, R. D. (1988). Defining attitude for
science educators. Journal of Research in Science Teaching, 25, 659-678.
Shulman, L. S., & Tamir, P. (1972). Research on teaching in the natural sciences. In
R. M. W. Travers, (Ed.), Second handbook of research on teaching (pp. 1098-
1148). Chicago, IL: Rand McNally.
Simpson, R. D., & Oliver, J. S. (1985). Attitude toward science and achievement
motivation profiles of male and female students in grades six through ten.
Science Education. 69, 511-526.
Simpson, R. D., & Oliver, J. S. (1990). A summary of major influences on attitude
toward and achievement in science among adolescent students. Science
Education, 74, 1-18.
Simpson, R. D., & Troost, K. M. (1982). Influences on commitment to and learning
of science among adolescent students. Science Education, 74, 1-18.
Slavin, R. E. (1983a). Cooperative learning. New York: Longman.
Slavin, R. E. (1983b). When does cooperative learning increase student
achievement? Psychological Bulletin, 94, 429-445.
Slavin, R. E. (1989). Cooperative learning and achievements: Six theoretical
persectives. In C. Ames and M. L. Maehr (Eds.), Advances in motivation and
achievement (pp. 161-177). Greenwich, CT: JAI Press.
Slavin, R. E. (1995). Cooperative learning: Thoery, Research, and Practice (3rd.Ed.).
London: Allyn and Bacon.
Speering, W., & Rennie, L. J. (1996, April). Transition to secondary school: The
impact of curriculum changes on students’ perceptions of science. Paper
presented at the annual general meeting of the American Educational
Research Association, New York.

174
Techniques for the Assessment of Practical Skills (TAPS) (1981-1991). London:
Heineman Educational Books.
Terwel, J., Brekelmans, M., Wubbels, T., & van der Eeden, P. (1994). Gender
differences in perceptions of the learning environment in physics and
mathematics education. In D. L. Fisher (Ed.), The study of learning
environments Volume 8 (pp. 39-51). Perth: Curtin University of Technology.
Thurstone, L. L. (1928). Attitudes can be measured. American Journal of Sociology,
33, 529-544.
Thomas, W., & Znaniecki, F. (1918). The Polish peasant in Europe and America.
Chicago: Chicago University Press.
Treagust, D. F., Jacobowitz, R. Gallagher, J. L., & Parker, J. (2001). Using
assessment as a guide in teaching for understanding: A case study of a middle
school science class learning about sound. Science 85(20), 137-157.
Wiggins, (1998). Educative assessment. San Francisco: Jossey-Bass.
Willson, V. L., & Lawrenz, F. (1980). Relationship between teacher participation in
NSF institutes and student attitudes and perception of the classroom learning
environment. Journal of Research in Science Teaching, 17, 289-294.
Wellins, R. S. (1991). Empowering teams: Creating self-directed work groups that
improve quality, productivity, and participation. San Francisco: Jossey-Bass.
Weinberg, M. (1995). Gender differences in student attitudes towards science: A
meta-analysis of the literature from 1970 to 1991. Journal of Research in
Science Teaching, 32, 387-398.
Wareing, C. (1982). Developing the WASP: Wareing attitudes toward science
protocol. Journal of research in Science Teaching, 19, 639-646.
Whitaker, C. R. & Salend, S. J. (1991), Collaborative Peer Writing Groups.
Reading,Writing and Learning Disabilities, 7: 125-136. Hemisphere
Publishing Corporation.
Wubbels, T., Créton, H., & Hooymayers, H. (1985, March). Discipline problems of
beginning teachers, interactional teacher behavior mapped out. Paper
presented at the annual meeting of the American Educational Research
Association, Chicago, USA. (ERIC Document 260040).
Wubbels, T., & Levy, J. (Eds.). (1993). Do you know what you look like?
Interpersonal relationships in education. London: The Falmer Press.
175
Yarrow, A., Millwater, J., & Fraser, B. J. (1997). Improving university and primary
school environments through preservice teachers’ action research.
International Journal of practical Experiences in professional Education,
1(1), 68-93.
Yaxley, B. G., Fisher, D. L., & Fraser, B. J. (2000, January). Student perceptions of
classroom learning environments and attitude to science at the post-
compulsory level. Paper presented at the second International Conference on
Science, Mathematics and Technology Education, Taipei, Taiwan.
Zoller, U., and Watson, F. G. (1974). Teacher training for the ‘second generation’ of
science curricula: The curriculum-proof teacher. Science Education, 58, 93-
103.

176
APPENDICES

177
Appendix A Research Project Report
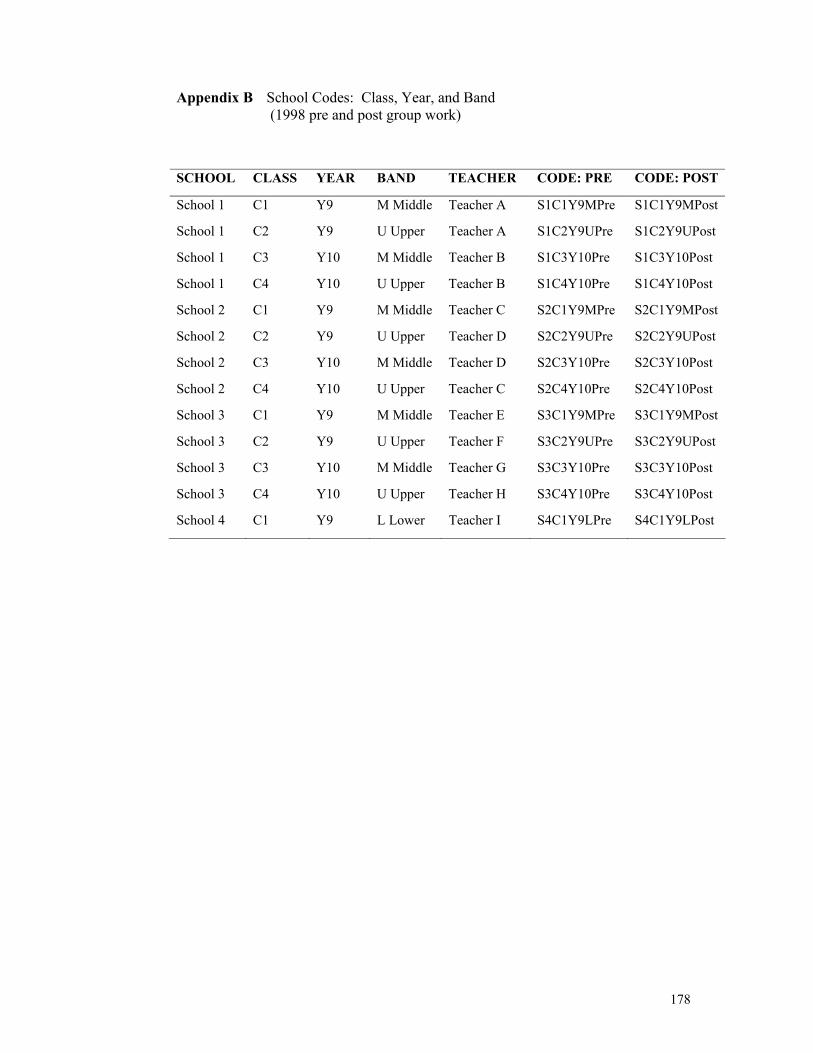
178
Appendix B School Codes: Class, Year, and Band (1998 pre and post group work)
SCHOOL CLASS YEAR BAND TEACHER CODE: PRE CODE: POST
School 1 C1 Y9 M Middle Teacher A S1C1Y9MPre S1C1Y9MPost
School 1 C2 Y9 U Upper Teacher A S1C2Y9UPre S1C2Y9UPost
School 1 C3 Y10 M Middle Teacher B S1C3Y10Pre S1C3Y10Post
School 1 C4 Y10 U Upper Teacher B S1C4Y10Pre S1C4Y10Post
School 2 C1 Y9 M Middle Teacher C S2C1Y9MPre S2C1Y9MPost
School 2 C2 Y9 U Upper Teacher D S2C2Y9UPre S2C2Y9UPost
School 2 C3 Y10 M Middle Teacher D S2C3Y10Pre S2C3Y10Post
School 2 C4 Y10 U Upper Teacher C S2C4Y10Pre S2C4Y10Post
School 3 C1 Y9 M Middle Teacher E S3C1Y9MPre S3C1Y9MPost
School 3 C2 Y9 U Upper Teacher F S3C2Y9UPre S3C2Y9UPost
School 3 C3 Y10 M Middle Teacher G S3C3Y10Pre S3C3Y10Post
School 3 C4 Y10 U Upper Teacher H S3C4Y10Pre S3C4Y10Post
School 4 C1 Y9 L Lower Teacher I S4C1Y9LPre S4C1Y9LPost

179
Appendix C TOSRA Questions and Marking Schedule TOSRA Test of Science Related Attitudes (Fraser 1981a) DIRECTIONS 1. This test contains a number of statements about science. You will be asked what you yourself think about these statements. There are no 'right' or 'wrong' answers. Your opinion is what is wanted. 2. All answers should be given on the separate Answer Sheet. Please do not write on this booklet. 3 For each statement, draw a circle around SA if you STRONGLY AGREE with the statement; A if you AGREE with the statement; N if you are NOT SURE; D if you DISAGREE with the statement; SD if you STRONGLY DISAGREE with the statement. The TOSRA questions 1. Money spent on science is well worth spending. 2. Scientists usually like to go to their laboratories when they have a day off. 3. 1 would prefer to find out why something happens by doing an experiment than by being told. 4. 1 enjoy reading about things which disagree with my previous ideas. 5. Science lessons are fun. 6. 1 would like to belong to a science club. 7. 1 would dislike being a scientist after I leave school. 8. Science is man's worst enemy. 9. Scientists are about as fit and healthy as other people. 10. Doing experiments is not as good as finding out information from teachers. 11. I dislike repeating experiments to check that 1 get the same results. 12. 1 dislike science lessons. 13. 1 get bored when watching science programme on TV at home. 14. When 1 leave school, 1 would like to work with people who make discoveries in science. 15. Public money spent on science in the last few years has been used wisely. 16. Scientists do not have enough time to spend with their families. 17. I would prefer to do experiments than to read about them. 18. I am curious about the world in which we live. 19. School should have more science lessons each week. 20. 1 would like to be given a science book or a piece of scientific equipment as a present. 21. I would dislike a job in a science laboratory after 1 leave school. 22. Scientific discoveries are doing more harm than good. 23. Scientists like sport as much as other people do. 24. 1 would rather agree with other people than do an experiment to find out for myself. 25. Finding out about new things is unimportant.

180
TOSRA (Questions continued) 26. Science lessons bore me. 27. 1 dislike reading books about science during my holidays. 28. Working in a science laboratory would be an interesting way to earn a living. 29. The government should spend more money on scientific research. 30. Scientists are less friendly than other people. 31. 1 would prefer to do my own experiments than to find out information from a teacher. 32. 1 like to listen to people whose opinions are different from mine. 33. Science is one of the most interesting school subjects. 34. 1 would like to do science experiments at home. 35. A career in science would be dull and boring. 36. Too many laboratories are being built at the expense of the rest of education. 37. Scientists can have a normal family life. 38. 1 would rather find out about things by asking an expert than by doing an experiment. 39. 1 find it boring to hear about new ideas. 40. Science lessons are a waste of time. 41. Talking to friends about science after school would be boring. 42. 1 would like to teach science when 1 leave school. 43. Science helps to make life better. 44. Scientists do not care about their working conditions. 45. 1 would rather solve a problem by doing an experiment than be told the answer. 46. In science experiments, I like to use new methods which I have not used before. 47. 1 really enjoy going to science lessons. 48. 1 would enjoy having a job in a science laboratory during my school holidays. 49. A job as a scientist would be boring. 50. This country is spending too much money on science. 51. Scientists are just as interested in art and music as other people are. 52. It is better to ask the teacher the answer than to find it out by doing experiments. 53. 1 am unwilling to change my ideas when evidence shows that the ideas are poor. 54. The material covered in science lessons is uninteresting. 55. Listening to talk about science on the radio would be boring. 56. A job as a scientist would be interesting. 57. Science can help to make the world a better place in the future. 58. Few scientists are happily married. 59. 1 would prefer to do an experiment on a topic than to read about it in science magazines. 60. In science experiments, 1 report unexpected results as well as expected ones. 61. I look forward to science lessons. 62. 1 would enjoy visiting a science museum at the weekend. 63. I would dislike becoming a scientist because it needs too much education. 64. Money used on scientific projects is wasted. 65. If you met a scientist, he would probably look like anyone else you might meet. 66. It is better to be told scientific facts than to find them out from experiments 67. I dislike listening to other people's opinions. 68. 1 would enjoy school more if there were no science lessons. 69. 1 dislike reading newspaper articles about science. 70. 1 would like to be a scientist when 1 leave school.

181
TOSRA (Continued)
SCALE ALLOCATION AND SCORING FOR EACH ITEM
For positive items (+), responses SA, A, N, D, SD are scored 5, 4, 3, 2, 1, respectively. For negative items (-) responses SA, A, N, D, SD, are scored 1, 2, 3, 4, 5, respectively. Omitted or invalid responses are scored 3.
S Social Implications of Science
N Normality of Scientists
I Attitude to Scientific Enquiry
A Adoption of Scientific Attitudes
E Enjoyment of Science Lessons
L Leisure Interest in Science
C Career Interest in Science
1 (+) 2 3 (+) 4 (+) 5 (+) 6 (+) 7 8 9 (+) 10 11 12 13 14 (+) 15 (+) 16 17 (+) 18 (+) 19 (+) 20 (+) 21 22 23 (+) 24 25 26 27 28 (+) 29 (+) 30 31 (+) 32 (+) 33 (+) 34 (+) 35 36 37 (+) 38 39 40 41 42 (+) 43 (+) 44 45 (+) 46 (+) 47 (+) 48 (+) 49 50 51 (+) 52 53 54 55 56 (+) 57 (+) 58 59 (+) 60 (+) 61 (+) 62 (+) 63 64 65 (+) 66 67 68 69 70 (+)

182
Appendix D An Example of a League Table
EVENT and POINTS (10 for 1st Place, 1 for 10th)
Total
Num
ber
Learning Team Name
Test1 Chem.
Prac 1 Sherlock
Test 2 Phys.
Issue Invest.
Test 3 Bio. Place
31 1 BLUES 10 2 8 5 6
4th
39 6 RUG RATZ 9 7 9 7 7
1st =
39 7 THE SPICE BOYS
8 9 10 4 8
1st =
26 8 CHIEFS 7 1 5 3 10
5th
36 9 HSV.HOLDEN 6 4 7 10 9
3rd
25 10 HURRICANES 5 3 6 9 2
6th
20 2 WONDER WEASILS
4 10 4 1 1
8th
22 3 SPACE GOOFS 3 5 1 8 5
7th=
19 4 RAGS 2 8 3 2 4
9th
18 5 SLIPPERY EELS 1 6 2 6 3
10th =

183
Appendix E Year 9 Team Practical Exam
Science Class: Teacher: Learning Team Name:
1 2
Your names & number
3
Time Allowed: 1 Hour • You will be stationed at the same workstation for the entire practical. • You must change your roles so that each member of your team gets a turn at each
of the roles. The roles you are to do are in the table for each experiment. • You will get marks for results and team work (ie cooperation) Roles • Equipment manager; Organises the equipment and ensure that it is all in order. • Technician; Actually does the experiment • Recorder; Records all the data, and results. Experiment one: The Pendulum The pendulum has a period of motion, which is measured from the starting point out and back. Brief: You are to make a pendulum with a period of one second and measure the length of the string in mm. using the equipment supplied.
JOBS
Equipment manager
1
Technician 2
Recorder 3
Length of string l =
Slotted mass
Retort Stand, boss head and clamp
Expt 1 Total Mark
184
Experiment Two: Making a Microscope slide You are to make a slide of some onion cell, stain them with iodine and focus the microscope on them. Equipment supplied: Scalpel, onion, microscope slides and cover slips (2X each), seeker, Iodine stain.
JOBS
Equipment manager
3
Technician 1
Recorder 2
Teamwork! Method: Try to ensure the following ideals are followed. • The cover slip is central on the slide. • The onion cells are only one cell thick. • The onion sample covers no more than 1/3rd of the width and length of the cover
slip. • There are no air pockets or folds in the onion. • There are no fingerprints on the slide. • Make sure you put your team name onto the slide with the sticker provided. • When you have focussed your slide using the microscope on low power, get a
teacher to look at it and sign it off.
Microscope OK Signed:
Expt 2 Total Mark:
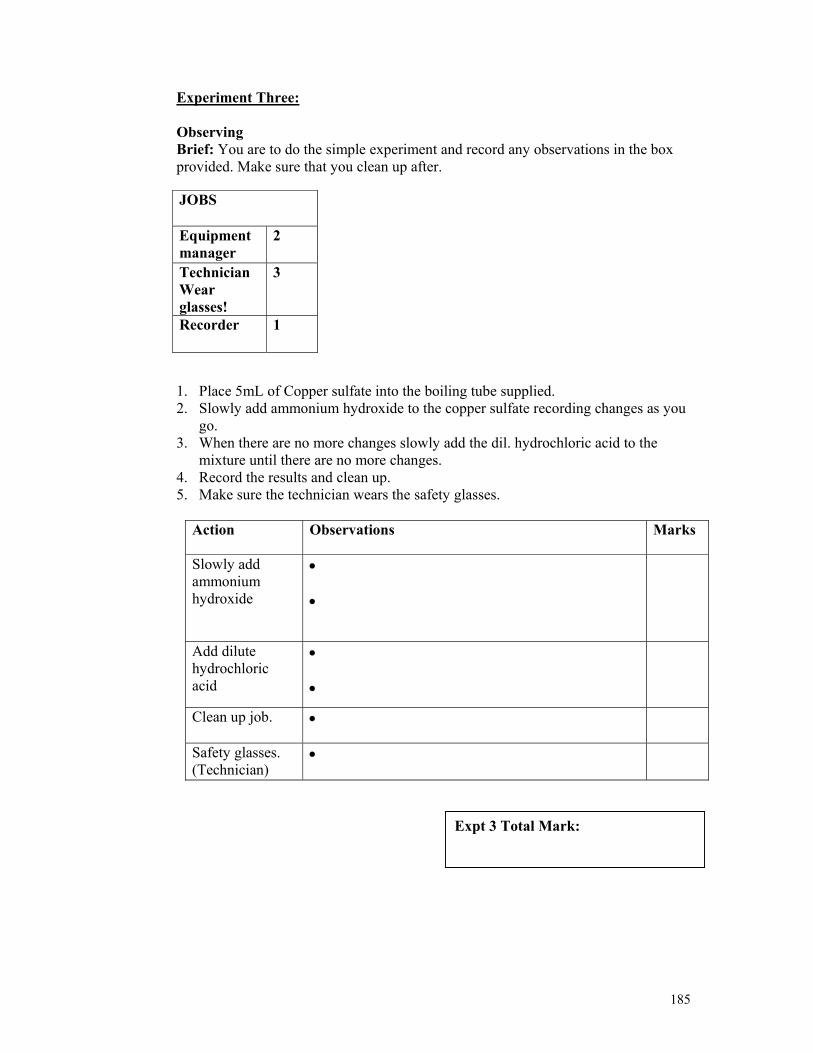
185
Experiment Three: Observing Brief: You are to do the simple experiment and record any observations in the box provided. Make sure that you clean up after.
1. Place 5mL of Copper sulfate into the boiling tube supplied. 2. Slowly add ammonium hydroxide to the copper sulfate recording changes as you
go. 3. When there are no more changes slowly add the dil. hydrochloric acid to the
mixture until there are no more changes. 4. Record the results and clean up. 5. Make sure the technician wears the safety glasses.
Action Observations Marks
Slowly add ammonium hydroxide
• •
Add dilute hydrochloric acid
• •
Clean up job. •
Safety glasses. (Technician)
•
JOBS
Equipment manager
2
Technician Wear glasses!
3
Recorder 1
Expt 3 Total Mark:

186
Experiment four: Making molecules You are to use the molymod supplied to make the following molecules. Make sure that you follow the rules. Rules: • Make sure you use the correct colour for each molecule. • There are to be no unfilled holes. • There are to be no ‘bonds’ left unattached. • Leave them in the tray supplied with your groups name and sticker on it. • If there is more than one carbon join these first.
Name of molecule Formula Mark
water H2O
Oxygen O2
Methane CH4
Nitrogen N2
Ethanol CH3CH2OH
Ammonia gas NH3
Carbon Dioxide CO2
Well done team!
Atom Colour
Carbon Black
Hydrogen White
Oxygen White
Nitrogen Blue
Expt 4 Total Mark:
Practical Exam Total Mark: