Embed Size (px)
Citation preview

NUTRITION RESEARCH, Vol. 11, pp. 621-632,1991 0271-5317/91 $3.00 + .00 Printed in the USA. Copyright (c) 1991 Pergamon Press plc. All rights reserved.
THE EFFECT OF DIETARY GUAR GUM AND CELLULOSE ON MINERAL EXCRETION AND STATUS IN YOUNG MALE FISCHER 344 RATS
Frederick E. Wood, Ph.D. I, and Sally J. Stoll The Procter & Gamble Company
Miami Valley Laboratories Cincinnati, OH 45239-8707
A 31-day feeding study in young, male Fischer 344 rats was conducted to compare the effect of guar gum, a representative soluble fiber, with that of cellulose, a widely used insoluble fiber, on calcium excretion and status. Calcium was fed at a marginally sufficient level (0.25%) to maximize the potential for observing effects, and at 0.5%, the NRC Requirement. Effects on the excretion of P, Mg, Cu, Fe, Mn, and Zn, all fed at NRC levels, were also investigated. Diets were fiber free, or supplemented with guar, cellulose, or mixtures of the two. The addition of fiber to the 0.5% calcium basal diet generally resulted in directionally or significantly decreased fecal excretion of minerals. Fecal excretion of Ca, P, Mg, and Cu was significantly decreased with increasing guam in groups receiving 0.25% calcium; this was reflected in increased serum, but not bone, levels of these minerals except P. Serum and bone P and Zn increased with increasing guar and 0.5% cal- cium, while serum Zn showed the same dependence among groups fed 0.25% calcium. Bone ~m was negatively correlated with guar level in groups fed 0.5% calcium, but serum levels in all groups were similar.
KEY WORDS: Dietary Fiber, Mineral Excretion, Guar Gum, Cellulose, Rats
INTRODUCTION
Various dietary fibers have been shown to be effective in the treatment of irritable bowel syndrome (i), maintaining regularity (see references 2 and 3 for reviews), lowering serum cholesterol levels (4, 5), and reducing postpran- dial peak plasma glucose levels in diabetics (6, 7). Increasing dietary fiber consumption is one of the recommendations made by the National Cancer Institute and the National Institutes of Health to reduce the risks of cancer and coro- nary heart disease, respectively.
Some investigators have, however, questioned whether increased dietary fiber intake might lead to negative mineral balances. Numerous studies have been conducted to resolve this (see references 8-13 for reviews); however, there is no clear consensus in this area. Rarely have two studies used the same experimental design in terms of the species and its age, the type and dose of fiber, the basal diet and mineral intake, any temporal separation of the fiber and mineral consumption, and the method used to assess changes in mineral
ITowhom reprint requests should be addressed.
621
622 F.E. WOOD and S.J. STOLL
status. These variables are important in determining a) whether an effect occurs, and b) more significantly, whether such an effect can be observed.
Of critical importance in assessing an animal's ability to compete with the intestinal contents for mineral availability is the level of the mineral(s) in the diet, since excess levels of minerals could mask potential effects. To minimize this possibility, the present study used diets containing a marginally sufficient (0.25%, low calcium, LC) level of dietary calcium to compare the effects of soluble fiber, guar gum, and an insoluble fiber, cellulose, on calcium absorption and status in young growing rats. Diets containing the NRC Requirement for calcium (0.5%, normal calcium, NC) were also used. The effect of these dietary fibers on the absorption of other minerals (P, Mg, Cu, Fe, Mn, and Zn), although possibly present at levels in excess of the animals" needs, was also investigated. The levels of these were not varied from the NRC Requirements, since doing so for more than one mineral at a time could yield confounding results.
Multiple dietary levels of guar were used, since the nature of the dose response is important in assessing the biological significance of any observed effects. The use of more than one treatment group, like the use of several consecutive balance periods (14), serves to minimize the possibility of effects being observed due to normal biological variability.
MATERIALS AND METHODS
Seven-week-old male Fischer 344 rats (Charles River Laboratories, Inc., Kingston) were randomized into twelve groups of five rats/group and fed semi-purified diets supplemented with guar, cellulose, or no fiber (Table i) for 31 days. Guar gum (Type CM, Pakistan) was supplied by the Meet Corporation (North Bergen, NJ), and cellulose (Solka Floc, BW-200, FCC) was supplied by the James River Corporation.
Fresh food and distilled water were presented to all animals twice each week and were available ad libitum. All animals were observed daily for gross signs of abnormal health. Body weights and food consumption were determined weekly. Beginning on Day 29, feces and urine were collected and weighed over 3 consecutive 24-hour periods. Final body weights were recorded on day 32 of the study. Each animal was anesthetized with diethyl ether and then exsanguinated via the posterior vena cava. Serum and femur samples were taken. Femur samples were defatted using a Soxhlet apparatus.
A diet sample from each groupand the 3-day fecal and urine samples, serum, and defatted femur from each rat were weighed into Vycor crucibles, dried, and ashed in a muffle furnace. Each sample was sohbilized in an appropriate vol- ume of 5% HC1, filtered, and analyzed for Ca, Mg, Fe, P, Zn, Mn, and Cuvia inductively coupled argon-plasma atomic emission spectrometry (ICAP, Thermo Jarrell Ash Plasma 300 Sequential). A standard curve was constructed each day for each mineral, and standards were run every tenth sample. Total fecal and total urinary excretion of minerals for each animal were calculated by multiply- ing the analyzed values by the 3-day sample weight; then normalized for intake (expressed as mg excreted per mg consumed, multiplied by I00; effectively yielding percent of dose). Mineral intake was based on diet analyses and food consumption. Atomic absorption analysis of the distilled drinking water used in this study revealed a calcium content of < 0.5 ug/ml. Intake of minerals via the drinking water was considered to be negligible compared to that from the diet, and was not considered in any intake calculations.
MINERAL EXCRETION STATUS 623
Inter-group comparisons of body weight, food consumption, fecal and urinary mineral excretion, and serum and bone mineral concentrations were performed using analysis of variance techniques (15). Linear regression for guar dose was conducted according to Draper and Smith (16). While trends are discussed in terms of increasing guar dose, the possibility that effects are due to decreasing cellulose cannot be ruled out. All statistical tests were conducted at a 5%, two-sided risk level.
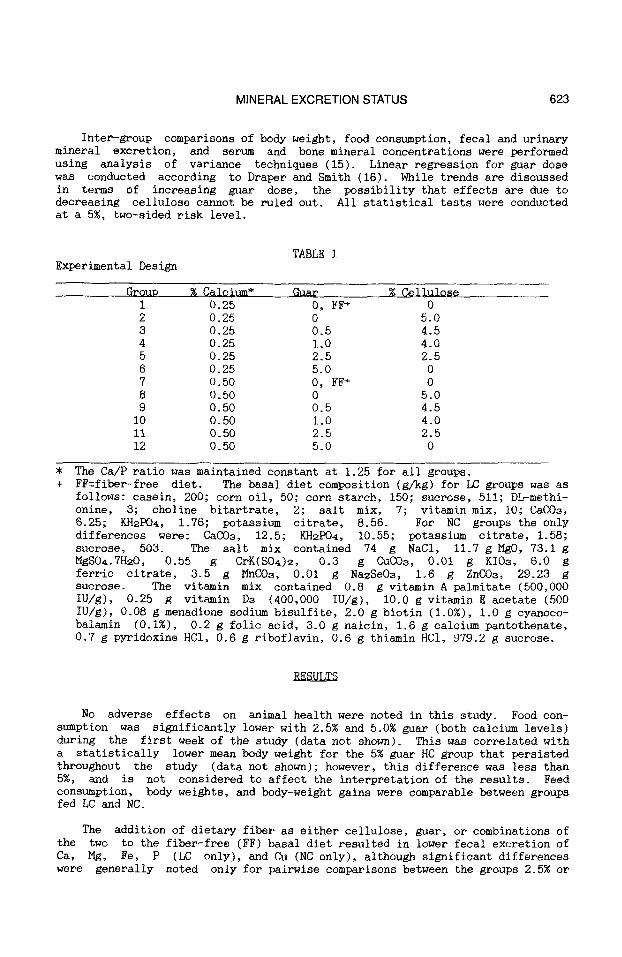
Experimental Design TABLE 1
Group % Calcium* Guar % Cellulose 1 0.25 O, FF § 0 2 O.25 0 5.O 3 0.25 0.5 4.5 4 0.25 1.0 4.0 5 0.25 2.5 2.5 6 0.25 5.0 0 7 0.50 O, FF § 0 6 0.50 0 5.0 9 0.50 0.5 4.5 I0 0.50 1.0 4.0 ii 0.50 2.5 2.5 12 0.50 5.0 0
The Ca/P ratio was maintained constant at 1.25 for all groups. FF=fiber-free diet. The basal diet composition (g/kg) for LC groups was as follows: casein, 200; corn oil, 50; corn starch, 150; sucrose, 511; DL-methi- onine, 3; choline bitartrate, 2; salt mix, 7; vitamin mix, i0; CaCOs, 6.25; KH2P04, 1.76; potassium citrate, 8.56. For NC groups the only differences were: CaC08, 12.5; KH2P04, 10.55; potassium citrate, 1.58; sucrose, 503. The salt mix contained 74 g NaCI, ii.7 g MgO, 73.1 g MgSO4.7H20, 0.55 g CrK(S04)2, 0.3 g CuC03, 0.01 g KIO~, 6.0 g ferric citrate, 3.5 g MnCOs, 0.01 g Na2SeOs, 1.6 g ZnC08, 29.23 g sucrose. The vitamin mix contained 0.8 g vitamin A palmitate (500,000 IU/g), 0.25 g vitamin D8 (400,000 IU/g), I0.0 g vitamin E acetate (500 IU/g), 0.08 g menadione sodium bisulfite, 2.0 g biotin (1.0%), 1.0 g cyanoco- balamin (0.1%), 0.2 g folic acid, 3.0 g naicin, 1.6 g calcium pantothenate, 0.7 g pyridoxine HC1, 0.6 g riboflavin, 0.6 g thiamin HCI, 979.2 g sucrose.
RESULTS
No adverse effects on animal health were noted in this study. Food con- sumption was significantly lower with 2.5% and 5.0% guar (both calcium levels) during the first week of the study (data not shown). This was correlated with a statistically lower mean body weight for the 5% guar HC group that persisted throughout the study (data not shown); however, this difference was less than 5%, and is not considered to affect the interpretation of the results. Feed consumption, body weights, and body-weight gains were comparable between groups fed LC and NC.
The addition of dietary fiber as either cellulose, guar, or combinations of the two to the fiber-free (FF) basal diet resulted in lower fecal excretion of Ca, Mg, Fe, P (LC only), and Ckl (NC only), although significant differences were generally noted only for pairwise comparisons between the groups 2.5% or

624 F.E. WOOD and S.J. STOLL
5.0% guar and those fed no guar (either with 5% cellulose or with no added fiber) (Table 2). These differences frequently resulted in a significant trend test for decreasing mineral excretion with increasing guar dose. Groups fed NC (and 0.4% P) showed increased fecal excretion of Ca, P, and Mg, and decreased excretion of Cu compared to respective groups fed LC (and 0.2% P). The rela- tively low fecal excretion of calciL~ (15-30% of intake) among the LC groups is consistent with a high demand for available calcium, as intended.
TABLE 2 Fecal Mineral Excretion ([mg Excreted/mg Consumed] x i00)
Group Ca P M~ Fe Cu Zn Mn
1 FF 30. O" 24.2" 34.3" 84.8 98.2 90.5 I01.2 3.0 1.8 2.8 4.9 5.4 5.5 6.0
2 0% G 28.6"8 24.4"8 34.08 76.3 101.4"8 92.3 103.8 5% # 1.2 l.l 2.6 3.5 4.2 3.6 4.5
3 0.5% G 29.4" 27.2" 31.1 79.9 101.7" 95.3 107.9 4.5% C 5.4 4.4 7.3 13.3 14.6 13.6 15.7
4 i. 0% G 27.6" 25.9" 31.3" 78.3 102. O" 93.6 107.1 4.0% C 2.6 2.5 1.9 2.1 2.9 2.8 3.3
5 2.5% G 21.6 +" 21.9" 25.5 +" 71.0" 89.5 +" 82.3 93.8 2.5% C 2.1 1.8 2.2 3.1 4.1 3.9 4.0
6 5% G 15.7 *+" 16.9 +" 21.5 67.6*" 80.2 *+ 90.3 100.8 0% C 3.4 3.6 4.7 5.2 5.8 15.5 19.0
7 FF 72.5" 39.0" 47.3" 92.8 84.0 102.7 115.0 7.8 3.2 4.8 9.7 10.6 9.9 Ii.0
8 0% G 59.4" 34.9"~ 35.0 66.4*8 70.4"8 85.7 96.3 5% C 3.7 2.4 2.2 3.5 3.7 4.6 5.3
9 O. 5% G 62.8" 37.7" 36.4* 69. O* 72.7" 89.9 i00.8 4.5% C 2.7 1.6 1.8 2.9 3.4 3.8 4.3
i0 1.0% G 67.1" 41.3" 40.1" 73.6 71.8" 92.1 102.3 4.0% C 3.2 2.2 1.9 3.8 4.0 3.6 3.9
ii 2.5% G 55. i" 35.7" 34.4 ~" 68.8 ~ 68.0" 79.9 90.4 2.5% C 1.8 1.4 0.9 1.8 1.4 2.1 2.3
12 5% G 62.8" 45.4 +" 31.3" 90.2 +" 91.1 + 96.5 107.4 0% C 4.8 2.7 3.9 5.4 4.2 6.0 7.1
Values are Mean • S. E. for 5 animals. * Statistically different (p<.05) from respective FF group (I or 7) + Statistically different (p<.05) from respective 5% cellulose group (2 or 8) # Statistically significant differences (p<.05) between respective LC and NC
groups w Positive trend test for guar dose (p<.05) among Groups 2-6 or 8-12

MINERAL EXCRETION STATUS 625
The significant trend test for increased fecal Fe and Cu excretion with increasing guar among groups receiving NC is largely the result of the high excretion for one group (5% guar), and is not considered biologically signifi- cant. This group was directionally different from others receiving guar with NC and from the 5% guar LC group in several fecal mineral values. The reason for this is not clear at this time.
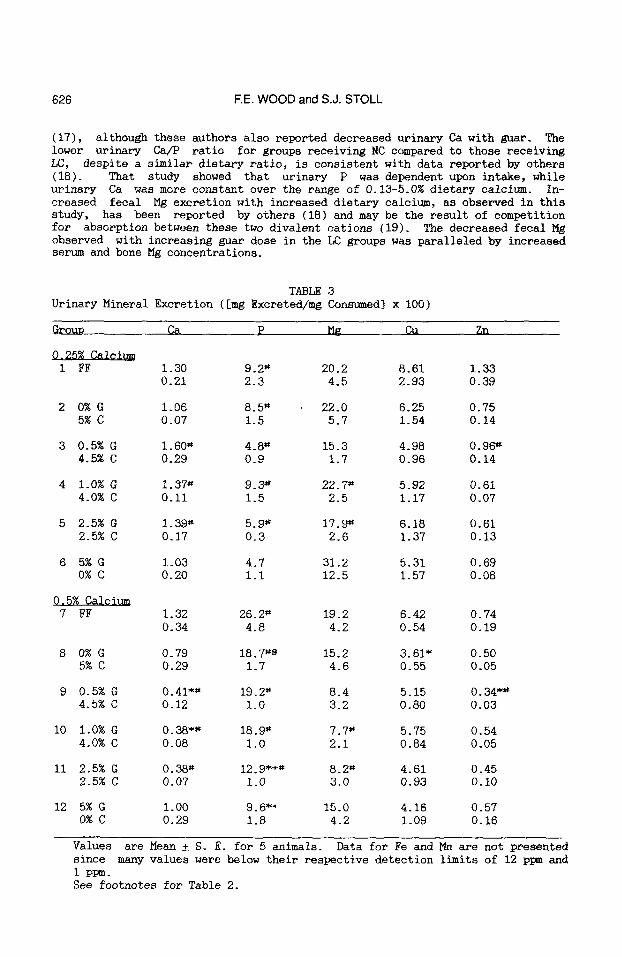
Higher levels of guar, relative to 5% cellulose, resulted in directionally decreased urinary excretion of P at both dietary Ca levels, and of Ca and Mg among groups fed NC (Table 3). There was a significant trend for urinary P to be decreased with increasing guar among groups fed NC. Although the dietary Ca/P ratio was the same for all groups, the percentage of Ca excreted in the urine was generally lower with NC compared to LC, while the percentage of P excreted was significantly higher. This resulted in a decreased Ca/P ratio for Groups 7-12 compared to Groups 1-6. Groups 7-12 also excreted a directionally or significantly lower percentage of Mg in their urine than did Groups 1-6, but only in the presence of fiber.
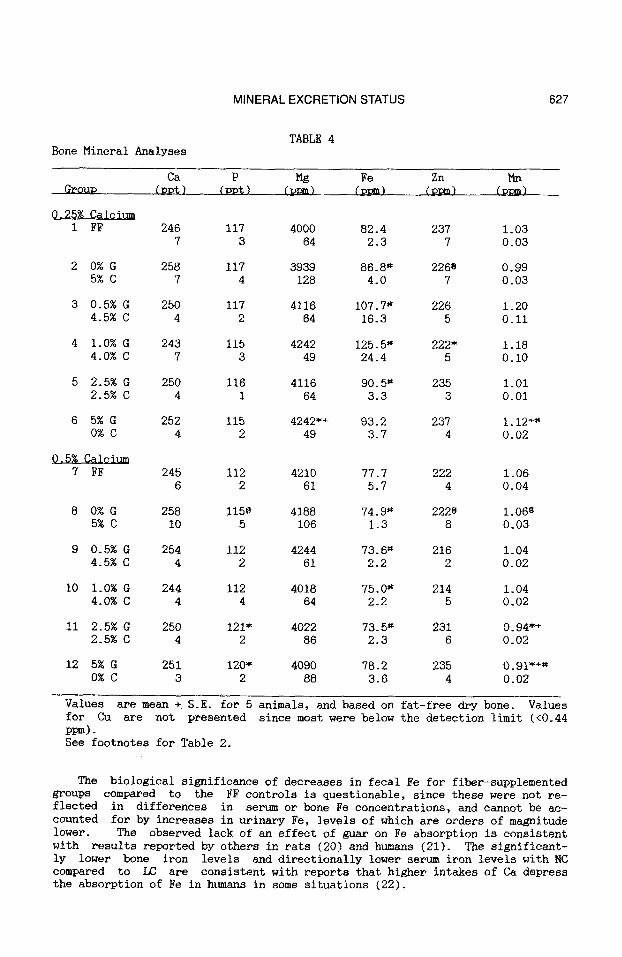
Guar had no effect on bone Ca or Fe in any group (Table 4). Bone Mg was only slightly increased in groups receiving guar and LC. With NC diets, bone P was highest and bone Mn was lowest in groups fed 2.5 and 5.0% gnar. Bone Fe was significantly lower with diets containing NC compared to those containing LC. Bone Cu levels were below detection for most animals, and effects of treatment could not be assessed.
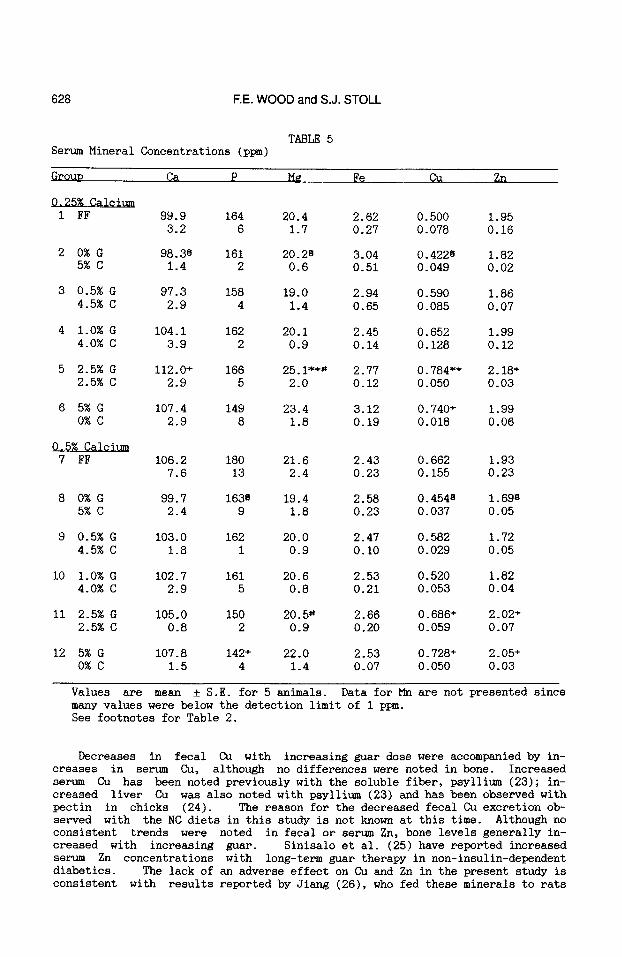
With serum minerals (Table 5), there was a trend for serum Ca to increase with guar dose; this was statistically significant with the LC diets. Serum P was lowest in groups fed 5% guar, with a significant trend for increasing guar dose seen with groups fed NC. Serum Cu was statistically higher in groups re- ceiving 2.5 and 5% guar diets (both levels of Ca), with a significant trend in this direction for NC groups. The same was observed for Zn, with the exception that 5% guar with LC was not significantly greater. No other consistent statis- tically significant differences were noted.
DISCUSSION
The effects of cellulose, guar, and combinations of the two on mineral ab- sorption were assessed in this study by examining a composite picture resulting from mineral excretion patterns, and bone and serum mineral concentrations. Mineral balance was not calculated since these values frequently represent small differences between relatively large numbers; the variability between these differences can be considerably greater than that in the actual measured fecal and urine excretion values.
The fact that the percentage of dose excreted in the feces for Ca and P was higher for groups receiving NC (and 0.4% P) compared to those fed LC (and 0.2% P) was expected. This reflects the adaptation of the LCgroups in absorbing a relatively greater percentage of the dose compared to the NC groups. The replacement of cellulose by guar resulted in decreased fecal excretion of Ca only when dietary Ca was low; this was Paralleled by relatively higher serum Ca levels, but had no effect on bone Ca. Thus, a significant effect of guar on fecal and serum Ca was not reflected in a change in bone Ca. This and similar apparent inconsistencies with other minerals may be due to their equlibra- tion/incorporation into tissues and bodypools not measured in this study.
Decreased urinary P excretion with increasing guar, observed among groups fed NC in this study, has been observed previously with guar in female rats
626 F.E. WOOD and S.J. STOLL
(17), although these authors also reported decreased urinary Ca with guar. The lower urinary Ca/P ratio for groups receiving NC compared to those receiving LC, despite a similar dietary ratio, is consistent with data reported by others (18). That study showed that urinary P was dependent upon intake, while urinary Ca was more constant over the range of 0.13-5.0% dietary calcium. In- creased fecal Mg excretion with increased dietary calcium, as observed in this study, has been reported by others (18) and may be the result of competition for absorption between these two divalent cations (19). The decreased fecal Mg observed with increasing guar dose in the LC groups was paralleled by increased serum and bone Mg concentrations.
TABLE 3 Urinary Mineral Excretion ([mg Excreted/mg Consumed] x I00)
~rouo
1 FF
Ca P Mg Cu Zn
1.30 9.2" 20.2 8.61 1.33 0.21 2.3 4.5 2.93 0.39
2 0% G i. 06 8.5" 22.0 6.25 O. 75 5% C 0.07 1.5 5.7 1.54 0.14
3 O. 5% G i. 60" 4.8 ~ 15.3 4.98 O. 96 # 4.5% C 0.29 0.9 1.7 0.96 0.14
4 1.0% G I. 37 ~ 9.3 ~ 22.7 ~ 5.92 O. 61 4.0% C 0.Ii 1.5 2.5 1.17 0.07
5 2.5% G 1.39~ 5.9 ~ 17.9" 6.18 0.61 2.5% C 0.17 0.3 2.6 1.37 0.13
6 5% G 1.03 4.7 31.2 5.31 0.69 0% C O. 20 i. 1 12.5 i. 57 O. 08
7 FF i. 32 26.2 ~ 19.2 6.42 O. 74 0.34 4.8 4.2 0.54 0.19
8 0% G O. 79 18.7 ~s 15.2 3.61 ~ 0.50 5% C 0.29 1.7 4.6 0.55 0.05
9 0.5% G 0.41 *~ 19.2 ~ 8.4 5.15 0.34 ~" 4.5% C 0.12 1.0 3.2 0.80 0.03
i0 1.0% G 0.88 *~ 18.9 ~ 7.7 ~ 5.75 0.54 4.0% C 0.08 1.0 2.1 0.84 0.05
ii 2.5% G 0.38 ~ 12.9 *+~ 8.2 ~ 4.61 0.45 2.5% C 0.07 1.0 3.0 0.93 0.i0
12 5% G 1.00 9.6 *§ 15.0 4.16 0.57 0% C 0.29 1.8 4.2 1.09 0.16
Values are Mean • S. E. for 5 animals. Data for Fe and Mn are not presented since many values were below their respective detection limits of 12 ppm and Ippm. See footnotes for Table 2.
MINERAL EXCRETION STATUS 627
Bone Mineral Analyses TABLE 4
Ca P Mg Fe Zn Mn Group (ppt) (DDt) (p~m) (p_Dm) (uDm) (ppm)
1 FF 246 117 4000 82.4 237 1.03 7 3 64 2.3 7 0.03
2 0% G 258 117 3939 86.8 ~ 2268 0.99 5% C 7 4 128 4.0 7 0.03
3 0.5% G 250 117 4116 107.7 ~ 226 1.20 4.5% C 4 2 64 16.3 5 0.ii
4 1.0% G 243 115 4242 125.5 ~ 222* 1.18 4.0% C 7 3 49 24.4 5 0.i0
5 2.5% G 250 116 4116 90.5 ~ 235 1.01 2.5% C 4 1 64 3.3 3 O.O1
6 5% G 252 115 4242 *+ 93.2 237 1.12 *~ 0% C 4 2 49 3.7 4 0.02
7 FF 245 112 4210 77.7 222 1.06 6 2 61 5.7 4 0.04
8 0% G 258 i15~ 4188 74.9 ~ 2228 1.06~ 5% C I0 5 106 1.3 8 0.03
9 0.5% G 254 112 4244 73.6 ~ 216 1.04 4.5% C 4 2 61 2.2 2 0.02
i0 1.0% G 244 112 4018 75.0 ~ 214 1.04 4.0% C 4 4 64 2.2 5 0.02
ii 2.5% G 250 121" 4022 73.5 ~ 231 0.94 *§ 2.5% C 4 2 86 2.3 6 0.02
12 5% G 251 120" 4090 78.2 235 0.91 *+~ 0% C 3 2 88 3.6 4 0.02
Values are mean + S.E. for 5 animals, and based on fat-free dry bone. Values for Cu are not presented since most were below the detection limit (<0.44 ppm). See footnotes for Table 2.
The biological significance of decreases in fecal Fe for fiber-supplemented groups compared to the FF controls is questionable, since these were not re- flected in differences in serum or bone Fe concentrations, and cannot be ac- counted for by increases in urinary Fe, levels of which are orders of magnitude lower. The observed lack of an effect of guar on Fe absorption is consistent with results reported byothers in rats (20) and humans (21). The significant- ly lower bone iron levels and directionally lower serum iron levels with NC compared to LC are consistent with reports that higher intakes of Ca depress the absorption of Fe in humans in some situations (22).
628 F.E. WOOD and S.J. STOLL
Serum Mineral Concentrations (ppm) TABLE 5
Group Ca P Mg Fe Cu Zn
1 FF 99.9 164 20.4 2.62 0.500 1.95 3.2 6 1.7 0.27 0.078 0.16
2 0% G 98.3~ 161 20.2w 3.04 0.422w 1.82 5% C 1.4 2 0.6 0.51 0.049 0.02
3 0.5% G 97.3 158 19.0 2.94 0.590 1.86 4.5% C 2.9 4 1.4 0.65 0.085 0.07
4 1.0% G 104.1 162 20.1 2.45 0.652 1.99 4.0% C 3.9 2 0.9 0.14 0.128 0.12
5 2.5% G 112.0 + 166 25.1 *+" 2.77 0.784 ~+ 2.18 + 2.5% C 2.9 5 2.0 0.12 0.050 0.03
6 5% G 107.4 149 23.4 3.12 0.740 § 1.99 0% C 2.9 8 1.8 0.19 0.018 0.06
7 FF 106.2 180 21.6 2.43 0.662 1.93 7.6 13 2.4 0.23 0.155 0.23
8 0% G 99.7 163s 19.4 2.58 0.4540 1.698 5% C 2.4 9 1.8 0.23 0.037 0.05
9 0.5% G 103.0 162 20.0 2.47 0.582 1.72 4.5% C 1.8 1 0.9 0.i0 0.029 0.05
I0 1.0% G 102.7 161 20.6 2.53 0.520 1.82 4.0% C 2.9 5 0.8 0.21 0.053 0.04
ii 2.5% G 105.0 150 20.5" 2.66 0.686 + 2.02 + 2.5% C 0.8 2 0.9 0.20 0.059 0.07
12 5% G 107.8 142 + 22.0 2.53 0.728 + 2.05 + 0% C 1.5 4 1.4 0.07 0.050 0.03
Values are mean • S.E. for 5 animals. Data for Mn many values were below the detection limit of 1 ppm. See footnotes for Table 2.
are not presented since
Decreases in fecal Cu with increasing guar dose were accompanied by in- creases in serum Cu, although no differences were noted in bone. Increased serum Cu has been noted previously with the soluble fiber, psyllium (23); in- creased liver Cu was also noted with psyllium (23) and has been observed with pectin in chicks (24). The reason for the decreased fecal Cu excretion ob- served with the NC diets in this study is not known at this time. Although no consistent trends were noted in fecal or serum Zn, bone levels generally in- creased with increasing guar. Sinisalo et al. (25) have reported increased serum Zn concentrations with long-term guar therapy in non-insulin-dependent diabetics. The lack of an adverse effect on Cu and Zn in the present study is consistent with results reported by Jiang (26), who fed these minerals to rats

MINERAL EXCRETION STATUS 629
at very low levels. The biological significance of the decreased bone Mn with increasing guar among NC groups is questionable, since consistent changes were not noted in serum feces of these groups or in bone levels os LC groups. Fur- thermore, it has been reported that Mn stat,Js is tightly regulated, with signi- fic~L compensation occurring in the fecal excretion of both endogenous and exogenous Mn (27).
The numerous instances of lower fecal excretion of minerals with increasing guar imply increased mineral absorption. This was unexpected, since such an effect has never been reported previously. The apparently greater absorption may be due to either an increase in transit time (28, 29) with guar or the potential release and absorption of minerals in the cecum and/or colon as the guar is fermented (30, 31). The role of these factors in the present study was not determined. The absence of any adverse effect of dietary fiber on minerals in this study is consistent with the conclusion reached by Gordon in a recent review (32).
The results of this study show that differences in fecal excretion of minerals may not necessarily be indicative of effects ~n serL~ or bone and vice versa. Others (33) have observed no difference in total-carcass minerals of rats fed semi-purified diets containing lO%guar or 4% cellulose, despite sig- nificant differences in fecal mineral excretion. Although it was prem~ed by these authors (33) that differences in urinary mineral excretion could account for the apparent inconsistency, this would be unlikely given the relatively high fecal/urine mineral-excretion ratios in the present study. Thus, conclu- sions regarding the effects of dietary fiber on minerals must take into account the results of several measurements, and should not rely solely upon either fecal excretion values or serL~ values. It is beyond the scope of this study to make a conclusion or recommendation regarding the most sensitive indicators of those employed here, or among parameters such as plasma or red blood cell metallothionein (for Zn), liver levels or Cu-Zn superoxide dismutase activity (for Cu), liver non-home Fe, plasma ferritin or transferrin (for Fe), or Mn superoxide dismutase activity in heart (for Mn) which have been suggested by others.
When the fecal, urine, bone, and serum data from this study are viewed together, it can be concluded that the addition of either guar gum or cellulose to a semi-purified diet had no adverse effects on the mineral status of young growing rats. In many cases, dietary fiber had a beneficial effect and, with LC in particular, there is evidence to suggest that guar was more beneficial than cellulose.
The authors wish to thank Robert D. Bruce and Pat Sprong for conducting the statistical analyses, the staff at Research Diets, Inc. for their cooperation in preparing diets, and Hazleton Laboratories America for their cooperation in performing the mineral analyses.

630 F.E. WOOD and S.J. STOLL
I. Bray MR, Harland BF, Hassner MI. Dietary fiber in irritable bowel syndrome. Fed Proc 1986; 45:596.
2. Pilch SM. Physiological effects and health consequences of dietary fiber. Bethesda, MD: FASEB, Life Sciences Research Office, 1987.
3. Jenkins DJA (Chairman). The Re~ort of the Exuert Advisorv Committee on Dietary Fiber. Health Protection Branch, Health and Welfare, Canada, 1985.
4. Judd PA, Truswell AS. Dietary fiber and blood lipids in man, In: Leeds, AR, Avenell, A, eds. Dietary Fibre Perspectives - Reviews and Bibliography. London: John Libby, 1985: 23-39.
5. Chen WJL, Anderson JW. Hypocholesterolemic effects of soluble fibers, In: Vahouny, GV, Kritchevsky, D, eds. Dietary Fiber, Basic and Clinical Asuects. New York: PlenL~ Press, 1986: 275-286.
6. Jenkins DJA. Dietary carbohydrates and their glycemic responses. J. Am Med Assoc 1984; 251:2829-2831.
7. Bantle JP, Laine DC, Castle GW, Thomas JW, Hoogworf BJ, Goetz FE. Post-prandial glucose and insulin responses to meals containing different carbohydrates in normal and diabetic subjects. N Eng J Med 1983; 309:7-12.
8. Vahouny GV. Dietary fibers - Aspects of nutrition, pharmacology, and pathology, In: Sidransky, H, ed. Nutrition~1Pathologv - Pathobiochemistrv of Dietarv Imbalances. New York: Marcel Dekker, Inc., 1985: 207-277.
9. Kelsay JL. Effects of Fiber on Mineral and Vitamin Bioavailability, In: Vahouny, GV, Kritchevsky, D, eds. Dietary Fiber in Health and Disease. New York: Plenum Press, 1982: 91-103.
i0. Marlett JA. Dietary fiber and mineral bioavailability. Int Med Spec 1984; 5(12):99-114.
Ii. Toma RB, Curtis DJ. Dietary fiber: Effect on mineral bioavailability. Food Technol, 1986: 111-116.
12. Walker ARP. Dietary fibre and mineral metabolism. Molec Aspects Med 1987; 9:69-87.
13. Kies C. Effect of dietary fat and fiber on calcium bioavailability, In: Kies C, ed. Nutritional Bioavailabilitv of Calcium. Washington, DC: American Chemical Society, 1985: 175-187.
14. Gordon DT, Besch-Williford C, Ellersieck MR. The action of cellulose on the intestinal mucosa and element absorption by the rat. J Nutr 1983; 113:2545-2556.
15. Snedecor GW, Cochran WG. Statistical Methods (7th ed.). Ames, Iowa: Iowa State University Press, 1980.
16. Draper NR, Smith H. Applied Regression Analysis (2nd ed.). New York: Wiley, 1981: 8-40.
MINERAL EXCRETION STATUS 631
17. Anderson RL, Kanerva RL, Francis WR. Effect of dietary fiber composition on renal mineralization in female rats ingesting purified diet - AIN. Nutr Rep Int 1985; 31(6):1331-1339.
18. Hoek AC, Lemmens AG, Mullink JWMA, Beynen AC. Influence of dietary calcium:phosphorus ratio on mineral excretion and nephrocalcinosis in female rats. J Nutr 1988; 118:1210-1216.
19. Greger JL, Smith SA, Snedeker SM. Effect of dietary calcium and phosphorus levels on the utilization of calcium, phosphorus, magnesium, manganese, and selenium by adult males. Nutr Res 1981; 1:315-325.
20. Swindell TE, Johnson IT. The effect of prolonged dietary supplementation with guar gum on subsequent iron absorption and retention in rats. Br J Nutr 1987; 57:245-253.
21. Rossander L. Effect of dietary fiber on iron absorption in man. Scand J Gastroenterol 1987; 22(129S):68-72.
22. Snedeker SM, Smith SA, Greger JL. Effect of dietary calcium and phosphorus levels on the utilization of iron, copper, and zinc by adult males. J Nutr 1982; i12:136-143.
23. Jacobs LR. Dose response of serum cholesterol in rats fed psyllium fiber and its relationship to increased hepatic and serum copper (abstract). American Gastroenterological Association annual meeting, May 14-17, 1989.
24. van der Aar PJ, Fahey GC Jr, Ricke SC, Allen SE, Berger LL. Effects of dietary fibers on mineral status of chicks. J Nutr 1983; 113:653-661.
25. Sinisalo M, Aro A, Ebeling P, Groop P-H, Koivisto VA. Effect of guar gum on zinc and magnesium status of diabetic patients. Trace Elem Med 1989; 6(i):12-17.
26. Jiang KS. Effects of dietary cellulose and xylan on absorption and tissue contents of zinc and copper in rats. J Nutr 1986; 116:999-1006.
27. Weigand E, Kirchgessner M, Helbig U. True absorption and endogenous fecal excretion of manganese in relation to its dietary supply in growing rats. Biol Trace Element Res 1986; 10:265-279.
28. Brown NJ, Worlding J, Rumsey RDE, Read NW. The effect of guar on the distribution of a radiolabelled meal in the gastrointestinal tract of the rat. Br J Nutr 1988; 59:223-231.
29. Jenkins DJA, Wolever TMS, Leeds AR, Gassul MA, Haisman P, Dilawari J, Goff DV, Metz GL, Alberti KGMM. Dietary fibres, fibre analogues, and glucose tolerance: importance of viscosity. Br Med J 1978: 1:1392-1394.
30. Cummings JH, Southgate DAT, Branch WJ, Wiggins HS. The digestion of pectin in the human gut and its effect on calcium absorption and large bowel function. Br J Nutr 1979; 41:477-485.
31. Tulung B, R~m~sy C, Demign@ C. Specific effects of guar gum or gum arabic on adaptation of cecal digestion to high fiber diets in the rat. J Nutr 1987; 117:1556-1561.

632 F.E. WOOD and S.J. STOLL
32. Gordon, D T. Total dietary fiber and mineral absorption, In: Kritchevsky, D, Bonfield, C, and Anderson, JW, eds. Dietary Fiber: Chemistry, Phv~iologv, and Health Effects. New York: Plenum Press, 1990: 105-128.
33. Harmuth-Hoene A-E, Schelenz R. Effect of dietary fiber on mineral absorption in growing rats. J Nutr 1980; I10:1774-1784.
Accepted for publ icat ion January 23, 1991.