Embed Size (px)
Citation preview

The effect of differing financial aid processing policies on the
retention and success of students at the California
community colleges
• Mike MacCallum, PhD
• Long Beach City College
• Strengthening Student Success Conference
• October 4, 2007

Purpose
• Doctoral dissertation
• PhD International/Intercultural Education
• University of Southern California

Background
• Personal observation– Regional meetings/conferences
– Counseling vs. business model
• Whistler’s Financial Aid Office Survey--Spring 2002– Telephone survey of all CCC Financial Aid
Offices
• Chancellor’s Office Data Mart

Whistler’s Fin. Aid Office Survey
• Factors in financial aid processing– Institutional support
– Service policies
– Financial aid delivery

Whistler’s Fin. Aid Office Survey
• Factors in financial aid processing• Institutional support--22 factors
• Director salaries
• Access to the administration
• Staffing
• Applications per FTE
• Location
• Non-financial aid responsibilities

Whistler’s Fin. Aid Office Survey
• Factors in financial aid processing• Service policies--36 factors
• BOGW-B verification
• Verification level
• Processing time
• Relations with other offices
• Outreach
• Obstacles and frustrations

Whistler’s Fin. Aid Office Survey
• Factors in financial aid processing• Financial aid delivery--8 factors
• Processing time
• First check delivery
• Pell book advance
• Emergency loans
• Disbursements per semester

External Factors
• Chancellor’s Office Data Mart– Institutional differences--16 factors
• Ethnicity
• Gender
• Location (Peterson’s)
• Loan percent of students
• Pell percent of students
• Zero EFC percent of students

External Factors
• Sources of data• Department of Education
• Number of applications
• Loan default rates
• Chancellor’s Office Data Mart• Ethnicity data
• Gender data
• Retention and success data
• Financial aid data
• Peterson’s Guide to Colleges & Universities• College location

Dependent Variables
• Enrollment Rate• The percentage of ISIRs that resulted in a Pell
Eligible enrollment
• Retention• The percentage of classes taken by financial aid
students resulting in grades of A, B, C, Cr, D, F, I, or NC.
• Success• The percentage of classes taken by financial aid
students resulting in grades of A, B, C, or Cr.

Definitions
• Student• A student enrolled in at least one class as per
the MIS data, during 2001/02
• Financial Aid Student• A student enrolled in at least one class as per
the MIS data, during 2001/02, with an EFC of 3550 or less (Pell eligible)

The Model

Institutional Support
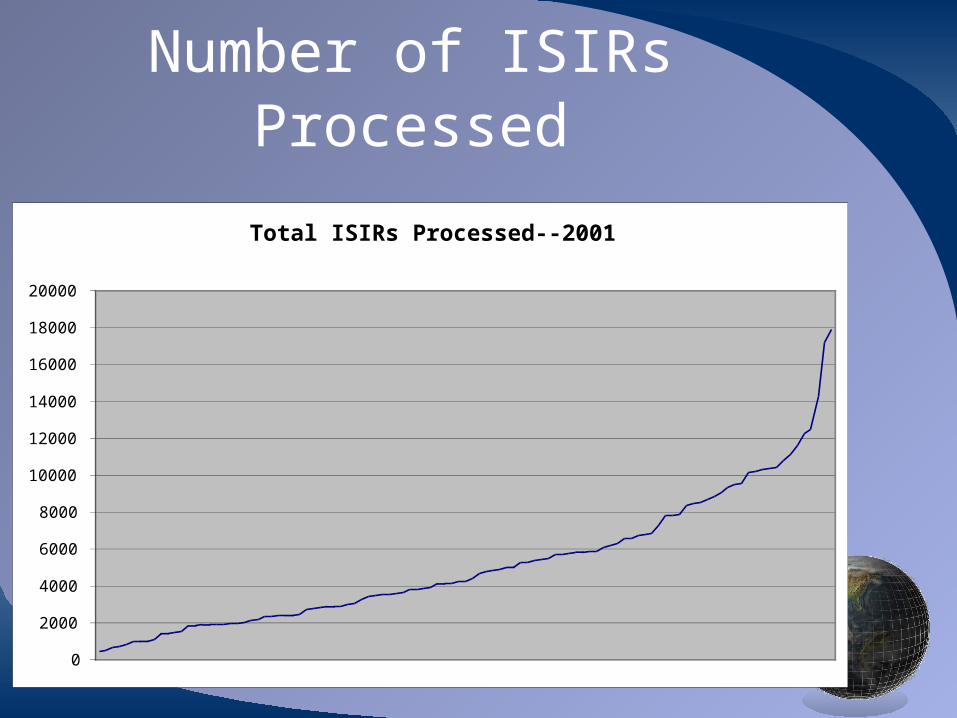
Number of ISIRs Processed
Total ISIRs Processed--2001/02
0
2000
4000
6000
8000
10000
12000
14000
16000
18000
20000

Financial Aid FTEs
Financial Aid Office Total FTE
0
5
10
15
20
25
30
35

ISIRs per FTE
ISIRs per FTE
0
200
400
600
800
1000
1200
1400
1600

Fin. Aid Administrators’ Salaries
Chief Financial Aid Administrator Annual Salary
$20,000
$40,000
$60,000
$80,000
$100,000
$120,000

Chief Financial Aid Position
•FA Officer 11FA Supervisor 9FA Manager 11FA Coordinator 2FA Director Only 45FA Director + Other Areas of Resp. 16Assistant Dean 2Associate Dean 6Dean 6

FA Director Reports To
•Director 4Assistant Dean 2Associate Dean 4Dean 51Vice President 47

Service Policies

Verification of Income
0
10
20
30
40
50
60
70
80
90
100% Other Minimum
Fee Waiver
DOE

Total Level of Verification
Total Level of Verification
0
5
10
15
20
25
30
35
40
100% 1 2 3 Minimum

Relations with Other Offices
0
5
10
15
20
25
30
35
1 = Poor 2 = OK 3 = Good 4 = Very Good 5 = Excellent
Business
IT

Processing Time
Processing Time (weeks)
0
2
4
6
8
10
12
14
16

Level of Verification and Processing Time
• No statistically significant relation

Financial Aid Disbursement

First Pell Disbursement
First Pell Disbursement
0
5
10
15
20
25
30
35
40
Before start ofschool
First day First week Second week After second week

Pell Advance/Book Grants
0
10
20
30
40
50
60
70
80
90
Pell Advance Book Grant
No
Yes

Pell Advances/Book Grants
0
10
20
30
40
50
60
70
None One Both

External Factors

Financial Aid Enrollment Rate
Financial Aid Enrollment--Percent of ISIRs Processed
0%
10%
20%
30%
40%
50%
60%
70%

Retention and Success
Retention and Success
0%
10%
20%
30%
40%
50%
60%
70%
80%
90%
Retention Success
Non-Financial Aid Students
Financial Aid Students

External Factors
Retention Rates by Ethnicity
65%
70%
75%
80%
85%
90%
Asian BlackHispanic
Native Amer
OtherUnknown
White Total
Non-Financial Aid
Financial Aid

External Factors
Success Rates by Ethnicity
50%
55%
60%
65%
70%
75%
Asian BlackHispanic
Native Amer
OtherUnknown
White Total
Non-Financial Aid
Financial Aid

External Factors
Retention Rate by Gender
0.7
0.72
0.74
0.76
0.78
0.8
0.82
0.84
Female Male Unknown Total
Financial Aid
Other Students

External Factors
Success Rate by Gender
0.56
0.58
0.6
0.62
0.64
0.66
0.68
0.7
Female Male Unknown Total
Financial Aid
Other Students
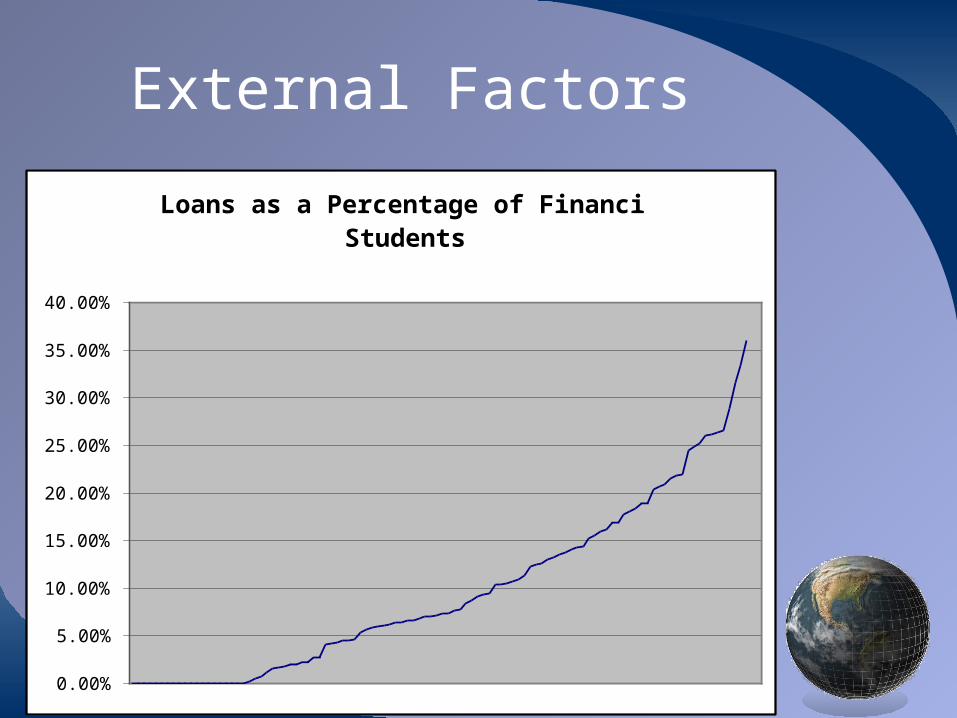
External Factors
Loans as a Percentage of Financial Aid Students
0.00%
5.00%
10.00%
15.00%
20.00%
25.00%
30.00%
35.00%
40.00%

External Factors
Financial Aid Students as Percent of Total Enrollment
0%
10%
20%
30%
40%
50%
60%
FA Students
Zero EFC

Stepwise Analysis of Variance Results

Factors Related to Enrollment Rate
• Factor BetaPercent of Students Receiving Pell .798Total ISIRs Processed -.238FA Director Business Major -.204Asian (total college enrollment) -.184Overall Verification Level -.168FTE Student Workers .127ISIRs per FTE -.125 r2 = .730

Factors Related to FA Retention
• Factor BetaDean Level .311Percent of Students Receiving Loans .299Pell Advance -.279Large Computer System -.226Need Staff Training -.181Processing Time (weeks) .176FA Director Business Major .152Need to Upgrade Staff -.137 r2 = .398

Factors Related to FA Success
• Factor BetaPercent of Students with Zero EFC -.282Large Computer System -.270Need to Upgrade Staff -.214ISIRs per FTE -.199BOGFW per Pell -.122 r2 = .307

Factors Related to Loan Default
• Factor BetaNative Americans .347FA Director Administration Major .247Pell pct. of Students .243Disbursements per Semester .203 r2 = .349

CCC Loan Default Rates
• Weak, non-significant correlation between loan volume and default rate: r = .16
Default Rates
0%
5%
10%
15%
20%
25%
30%
Caveat
• This was a correlational study
• Correlational studies do not prove causality
• Findings may not apply outside of the California community college system

Obstacles and Frustrations
• Factor No. Pct.Need Additional Staff 78 72%Need to Simplify Regulations 71 66% Lack of Integration in College 61 57% Lack of IT Support 60 56% Need to Improve FAO 48 44%Improve Working Conditions 42 39%Funding to do Outreach 40 37%Need Staff Training 29 27% Need to Upgrade Staff 26 24% Funds for Students 24 22%

Obstacles and Frustrations
• Factor No. Pct.Have 1 Factor 1 0.9%Have 2 Factors 9 8.3% Have 3 Factors 2119.4% Have 4 Factors 2926.9% Have 5 Factors 2321.3% Have 6 Factors 1413.0% Have 7 Factors 7 6.5% Have 8 Factors 3 2.8% Have 9 Factors 1 0.9% Total 479 Average 4.4

CCCs vs. the University• Universities--Financial aid is crucial to:
– Enrollment
– Income
– Recruitment
– Selecting the student population
• California Community Colleges– Disconnect between FA and enrollment
– Disconnect between FA and college income
– Little or no perceived need for recruitment or student selection
Implications for Policy Action-1
• More fully integrate the FAO into the administrative structure of the college
• Raise the status of the director– Salary
– Position title
– Report to a vice president
• Provide professional leadership training
• Improve image of the Financial Aid Office
• Improve image of Financial Aid students

Implications for Policy Action-2
• Reconsider a staffing formula for financial aid offices.
• Consider the establishment of minimum position levels for financial aid, similar to those of EOPS.– The Chief Financial Aid Administrator
– Technical staff
• Consider categorical funding for financial aid offices
Implications for Policy Action-3
• Evaluate the impact of large computer systems (Banner, PeopleSoft, Datatel) on the community colleges and their students
• Significant outlay of funds and staff
• Study transitory and long-range effects on students
• Chancellor’s Office should evaluate and make recommendations to the colleges

Implications for Policy Action-4
• Continue to provide opportunities for staff training and development
• Encourage institutions to let their financial aid staff attend
• Mandate minimum training hours per year?

Implications for Policy Action-5
• Business vs. Counseling Model
• Evaluate Financial Aid Offices from a customer service standpoint
• Hire counselors to work in Financial Aid- or create a strong liaison with Counseling
• Hire students to serve other students
• Share “best practices” at conferences
• Eliminate all extra verification

Implications for Policy Action-6
• Continue to improve and expand outreach
• Early understanding saves FAOs time and effort
• Integrate students into the college from first contact--Missing Information Letter- Welcome the student to the college
- Advantages of going to a CC first
• Continue to provide additional funding for outreach
Implications for Policy Action-7
• Continue to work to reduce the complexity of the financial aid programs through
• State financial aid organizations
• The Chancellor’s Office

Implications for Policy Action-8
• Inevitably, socioeconomic status is found to be a factor in student retention and success
• Provide training to increase understanding and sensitivity to cultural differences– Ethnicity
– Low income

Since 2001/02
• With the enrollment fee increase, additional funds have been provided to California community college financial aid offices for outreach activities
• Toni DuBois, Dean of Financial Aid at LBCC is planning to study the effect of that increase for her doctoral dissertation

The Customer• A customer is the most important
person in any business• A customer is not dependent upon us.
We are dependent upon him.• A customer is not an interruption of our
work. He is the sole purpose of it.• A customer does us a favor when he
comes in. We aren't doing him a favor by waiting on him.

The Customer• A customer is an essential part of our
business--not an outsider.• A customer is not just money in the cash
register. He is a human being with feelings and deserves to be treated with respect.
• A customer is a person who comes to us with his needs and his wants. It is our job to fill them.
• A customer deserves the most courteous attention we can give him. He is the lifeblood of this and every business. He pays your salary. Without him we would have to close our doors. Don't ever forget it.

The Customer• Our colleges are not businesses• Yet customer service is a business
characteristic worth adopting• We are in the business of changing
lives• The topics of this conference are
extremely important in that work• We need more than just another
program, we need a campus-wide commitment to customer service

Acknowledgements
• Tim Bonnell, Student Services Specialist, CCCCO
• Toni DuBois, Dean LBCC Financial Aid
• Dr. Linda Hagedorn, Dissertation Chair
• Tom Norbert, CCCCO Data Mart
• Victoria Whistler, Consultant

Thank you for your attendance
Discussion