Embed Size (px)
Citation preview

1
The Effect of Ethiopian Orthodox
Christians ‘Abiy Tsom’ (Lent
fasting) on Metabolic Syndrome Indices and Serum Electrolytes
BY CHALA KENENISA
A THESIS SUBMITTED TO DEPARTMENT OF
MEDICAL BIOCHEMISTRY, ADDIS ABABA UNIVERSITY
IN PARTIAL FULFILLMENT OF the degree of MASTER
OF SCIENCE IN MEDICAL BIOCHEMISTRY
ADDIS ABABA, ETHIOPIA
AUGUST, 2017
i
ADDIS ABABA UNIVERSITY
COLLEGE OF HEALTH SCIENCES
DEPARTMENT OF
BIOCHEMISTRY
The Effect of Ethiopian Orthodox
Christians ‘Abiy Tsom’ (Lent
fasting) on Metabolic Syndrome Indices and Serum Electrolytes
BY CHALA KENENISA EDAE
SUPERVISORS: -1) DR SOLOMON GENET
2) MRS MARIA DEGEF

ii
SIGNATURE PAGE
This is to certify that the thesis prepared by Chala Kenenisa Edae entitled; The effects
of Ethiopian Orthodox Christians ‘Abiy tsom’ (Lent fasting) on metabolic
syndrome indices and serum electrolytes and submitted in partial fulfillment of the
Degree of Masters of Science in Medical Biochemistry complies with the regulations
of the University and meets the accepted standards with respect to originality and
quality.
Signed by Examining committee:
Examiner____________________________Signature __________Date___________
Advisor Dr Solomon Genet Signature _________________Date __________
Advisor Mrs Maria Degef Signature __________Date ___________
Department Chairman or Graduate program coordinator

iii
ACKNOWLEDGEMENT
First of all, I want to praise my Almighty Lord for His continual support and provision
of all things, materials, opportunities and wisdom.
Next, I extend my deepest gratitude to my supervisors Dr Solomon Genet and Mrs
Maria Degef.
I also thank Dr Wondyfrew Mekonnen and Dr Diresebechew Haile for their
collaboration and networking during my project work without which this work will not
have been concluded on time and with this quality.
I forward my gratitude also to Mrs Bethlehem Tefera laboratory personnel at Core lab
of College of Health Sciences and Fikedu, Jilal and Workineh, laboratory technicians
of diagnostic lab Tikur Anbessa specialized Hospital for their cooperation during my
laboratory work.
I also express my heartfelt thanks for my study participants and appreciate their good
and kind heart.
I would like to thank Jimma University for sponsoring my study and Addis Ababa
University for teaching me and funding my project. I specifically express my gratitude
for Department of Biochemistry, College of Health Sciences, Addis Ababa University
for their vital role.
At last but not least, I want to thank my family members, friends and classmates for all-
time encouragement and comfort they gave me.

iv
TABLE OF CONTENTS
LIST OF FIGURES ............................................................................................................... vii
LIST OF TABLES .................................................................................................................. viii
Acronyms .................................................................................................................................. ix
1. Introduction .......................................................................................................................... 2
1.1 Background ...................................................................................................................... 2
1.2. Statement of the problem ................................................................................................ 5
1.3. Significance of study ....................................................................................................... 8
2. Literature review .................................................................................................................... 9
2.1. Definition and pathogenesis of metabolic syndrome ...................................................... 9
2.2. Factors Associated with Metabolic Syndrome .............................................................. 10
2.3. Religious Fasting and its effect on metabolic syndrome indices and level of serum
electrolytes ........................................................................................................................... 12
2.3.1. Religious fasting .................................................................................................... 12
2.4. Fasting in Ethiopian Orthodox Christianity .................................................................. 21
3. Hypothesis and objectives .................................................................................................... 22
3.1. Hypothesis .................................................................................................................... 22
3.2. Objectives ..................................................................................................................... 22
3.2.1. General objective ................................................................................................... 22
3.2.2. Specific objectives ................................................................................................. 22
4. Materials and methods ......................................................................................................... 23
4.1. Study area and period .................................................................................................... 23
4.2. Study design .................................................................................................................. 23
4.3. Study populations and subjects ..................................................................................... 23
4.4. Sample size Determination and sampling technique .................................................... 23
4.5. Inclusion and exclusion criteria .................................................................................... 26
4.5.1. Inclusion criteria .................................................................................................... 26
4.5.2. Exclusion criteria ................................................................................................... 26
4.6. Measurements / variables .............................................................................................. 26
4.6.1. Dependent variable ................................................................................................ 26
4.6.2. Independent variable .............................................................................................. 27
4.7. Data Collection and Instruments for Data Collection ................................................... 27
v
4.8. Anthropometry measurements ...................................................................................... 27
4.9. Physical/ Clinical examination ..................................................................................... 28
4.10. Laboratory Test ........................................................................................................... 28
4.10.1. Specimen Collection and Handling ...................................................................... 28
4.10.2. DETERMINATION OF FASTING BLOOD GLUCOSE (GOD-PAP METHOD)
......................................................................................................................................... 28
4.10.3. DETERMINATION OF LIPID PROFILE .......................................................... 29
4.10.4. TOTAL CHOLESTEROL ................................................................................... 29
4.10.5. TRIGLYCERIDES .............................................................................................. 30
4.10.6. HIGH DENSITY LIPOPROTEIN (HDL) CHOLESTEROL .............................. 30
4.10.7. LDL-CHOLESTEROL ........................................................................................ 31
4.10.8. DETERMINATION OF TOTAL PROTEIN BY BIURET METHOD............... 32
4.10.9. UREA ASSAY ..................................................................................................... 33
4.10.10. ASSAY OF ELECTROLYTES (Na+, K+, Ca2+ and Cl-) ................................... 35
4.11. Ethical Consideration .................................................................................................. 36
4.12. Data Quality Control ................................................................................................... 36
4. 13. Data Management ...................................................................................................... 37
4.14. Data Analysis and Report ........................................................................................... 37
4.15. Dissemination of the result ......................................................................................... 37
5. RESULTS ............................................................................................................................ 38
5.1. Socio demographic Characteristics of the Study participants ....................................... 38
5.2. Fasting type of study participants ................................................................................. 39
5.3. Comparison of Anthropometric Measurements During fasting and Non- Fasting ....... 40
5.4. Comparison of Systolic/Diastolic blood pressure and Pulse rate of the study
participants ........................................................................................................................... 41
5.5. Comparison of Lipid Profile of the study subjects ....................................................... 42
5.6. Comparison of Urea level and total protein of the study participants ........................... 43
Comparison of Blood glucose of the study subjects ............................................................ 44
5.7. The effect of Ethiopian Orthodox Christians fasting on the levels of serum electrolytes
(Na+, K+, Ca+2 and Cl-) ......................................................................................................... 44
6. DISCUSSION ...................................................................................................................... 46
7. CONCLUSION .................................................................................................................... 49
8. Strengths and Limitations of the study ................................................................................ 50
9. RECOMMENDATION ....................................................................................................... 51
References ................................................................................................................................ 52
Annex I: - CONSENT FORM ................................................................................................. 62

vi
Annex II: - Questionnaire ........................................................................................................ 63
Annex III: - Laboratory test result ........................................................................................... 65
Annex IV. DECLARATION ................................................................................................... 66
Annex V: Ethical Clearance ..................................................................................................... 67

vii
LIST OF FIGURES
Figure 1: Compositions of lipoproteins. …………………………………………...13
Figure 2: Summary of the fates of lipoproteins produced by the liver: VLDL and
chylomicrons…………………………………………………………………...…...15
Figure 3: Schematic representation of Cu2+- Peptide complex……………...…….28
Figure 4: Principle of determination of urea level in the serum…………….……….30
Figure 5: Fasting type of the study participants……………………………………...35
Figure 6: comparison of anthropometric means during fasting and non-fasting
periods………………………………………………………………………………36
Figure 7: comparison of means of lipid profiles during fasting and non-fasting
period………………………………………………………………………………...39
Figure 8. Comparison of mean levels of serum electrolytes during fasting and non-
fasting……………………...………………………………………………………...42

viii
LIST OF TABLES
Table 1: Paired samples T-test with mean pre-fasting values compared to mean end-
fasting results from Sarie and their colleagues ………………………....……...…... 21
Table 2. Reaction mixture for determination of blood glucose………………………25
Table 3. Reaction mixture for determination of Total Protein……………………...…29
Table 4: Reaction mixture for the determination of urea………………………….…30
Table 5: Socio demographic characteristic of the study participants………………...34
Table 6: Paired sample t test Comparison of means of Anthropometric measurements
of the study participants……………………………………………………………...37
Table 7: Paired sample t test comparison of means of Systolic blood pressure, Diastolic
blood pressure and Pulse rate of the study
participants………………………………………………………………………….38
Table 8: Paired sample t test comparison of means of lipid profiles of the study
participants…………………………………………………………………………...40
Table 9: paired sample t test comparison of means of Total protein and Urea level of
study participants………………………………………………………………......…41
Table 10: Paired sample t test comparison of blood glucose of participants…...…….41
Table 11: paired samples t test comparison of levels of serum electrolytes of study
participants………………………………………………………………………...…43

ix
Acronyms
ASF:- Animal Source Foods
BMI: - Body Mass Index
CAD:- Coronary Arterial Diseases
CHD:- Coronary Heart Diseases
CNCD: - Chronic Non Communicable Diseases
COC: - Coptic Orthodox Christians
CR: - Caloric Restriction
CVD: - Cardio Vascular Diseases
GOC: - Greek Orthodox Christians
HC:- Hip Circumference
HDL: - High Density Lipoprotein
IDF:- International Diabetic Federation
LDL: - Low Density Lipoprotein
MetS: - Metabolic syndrome
NCD: - Non Communicable Diseases
NCE: ATPIII: - National Cholesterol Education Program's Adult Treatment Panel III
TG: - Triglycerides
T2DM: - Type 2 Diabetes Mellitus
WC:- Waist Circumference
WHR:- Waist Hip Ratio
WHO: - World Health Organization
x
ABSTRACT
Background: -Fasting, the voluntary abstention from all restricted foods, is a feature
of many religions, and the putative health benefits have attracted both scientific and
popular interest. There is clear understanding that religious fasting has great effects on
metabolic syndrome. There are no available literatures that give information concerning
Ethiopian Orthodox Christians fasting influence on metabolic syndrome indices and
serum electrolytes to date.
Objective: -To determine effect of ‘Abiy tsom’ (lent fasting) of Ethiopian Orthodox
Christians on metabolic syndrome indices and serum electrolytes in Addis Ababa,
Ethiopia
Methodology: - 88 Study subjects were included conveniently who were followers of
Ethiopian orthodox Christianity faith and fasting “lent” from April 15 to June 15 and
longitudinal cross-sectional study design was employed. Data were collected twice, the
first during last week of the fasting months and the second during the last week of two
months’ time after returning to usual diet. The data and sample was collected, analyzed,
interpreted and was displayed by using descriptive and analytical statistical methods.
Results: The study found that, Ethiopian Orthodox lent fasting had significant effects
on Anthropometric measurements, systolic blood pressure, lipid profiles and Urea. It
was also found that this fasting had significant effect on the levels of Calcium and
Chloride ions while Serum sodium and potassium were influenced insignificantly.
Conclusion: Ethiopian Orthodox Christians lent fasting is beneficial for weight loss
and fighting metabolic syndrome.
Recommendation: stakeholders are recommended to consider fasting as one strategy
for prevention and treatment of metabolic syndrome.

2
1. Introduction
1.1 Background
Metabolic syndrome constitutes a group of clinical and laboratory diagnostic test
abnormalities, which are associated with the increased risk of cardiovascular diseases
(CVDs) and diabetes mellitus. Metabolic syndrome is not a disease by itself, but rather a
set of undesirable conditions, rooted in one’s poor lifestyle; it is also associated with the
increased prevalence of obesity (1).
The common symptoms of metabolic syndrome include excessive accumulation of fat,
especially in the abdomen, high blood pressure, and high levels of triglyceride (TG),
blood glucose, and low-density lipoprotein-cholesterol (LDL-C), which can increase the
risk of CVDs and diabetes mellitus. American Heart Association and the National Heart,
Lung, and Blood Institute have defined metabolic syndrome as consisting of at least three
of the above mentioned conditions (2, 3).
Metabolic syndrome is a cluster of metabolically related cardiovascular disease (CVD)
risk factors that increases the risk of CVD by 2-folds and the risk of developing type 2
diabetes mellitus by 3folds. The cluster includes various combinations of obesity (total
body obesity measured by body mass index, or central obesity measured by waist-to hip
ratio or waist circumference), atherogenic dyslipidemia (increased triglycerides,
decreased high-density lipoprotein cholesterol), elevated blood pressure (systolic and
diastolic), abnormal glucose tolerance, an insulin resistance measured by the homeostasis
model assessment (HOMAIR) or fasting insulin. The syndrome has been given different
names such as the insulin resistance syndrome, or syndrome X and the deadly quartet, the
most popular being metabolic syndrome (4).
The associated risk factors with metabolic syndrome can be divided into modifiable and
non-modifiable types. The major modifiable types include high blood pressure,
disturbances in sex hormones ( e.g., polycystic ovary syndrome (POS), mental ill health,
hyperandrogenism in pre- and postmenopausal women, energy excess (higher
carbohydrate, high fat, low dietary fiber, high meat intake, family history (diabetes,
hypertension, obesity , overweight) life style characteristics (tobacco use, alcohol
consumption, physical inactivity, snoring and obstructive sleep apnea syndrome,
psychosocial and personality factors (lower social class , difficulty in coping with stress
3
low socioeconomic status, alcohol) etc. On the other hand, the non-modifiable risk factors
include age, sex, ethnicity, family history and previous stroke and heart attack (5).
Fasting, the voluntary abstention from all restricted foods, is a feature of many religions,
and the putative health benefits have attracted both scientific and popular interest.
Commonly, religious doctrines proscribe foods from animal sources permanently or for
particular periods (6).
Greek Orthodox Christian holy books recommend a total of 180–200 days of fasting per
year. The faithful are advised to avoid olive oil, meat, fish, milk and dairy products every
Wednesday and Friday throughout the year. Additionally, there are three principal fasting
periods per year: i) a total of 40 days preceding Christmas (meat, dairy products and eggs
are not allowed, while fish and olive oil are allowed except on Wednesdays and Fridays),
ii) a period of 48 days preceding Easter (Lent). During Lent fish is allowed only two days
whereas meat, dairy products and eggs are not allowed. Olive oil consumption is allowed
only at weekends, iii) a total of 15 days in August (the Assumption) when the same dietary
rules apply as for Lent with the exception of fish consumption which is allowed only on
August 6th. Seafood such as shrimps, squid, cuttlefish, octopus, lobsters, crabs as well as
snails are allowed on all fasting days throughout the year (7).
The Greek Orthodox fasting practices can therefore be characterized as requiring a
periodic vegetarian diet including fish and seafood. The variant of vegetarianism
followed during fasting periods by Orthodox Christians, with a diet of vegetables,
legumes, nuts, fruits, olives, bread, snails and seafood, is a type of the so-called
Mediterranean diet (7,8).
The Coptic Orthodox Christian (COC) dietary regulations are an important component of
the Mediterranean diet of Egypt, which is close to the Greek Orthodox Christian (GOC)
diets, but low in some of its constituents, mainly olive oil and nuts, on the other hand, it
is rich in whole-grain brown bread (Egyptian pita bread), beans (Fava beans) and sesame
(as “tahini” and “helva” made from a paste of sesame seeds). The four major fasting
periods are: Christmas (40 days, with sea food), lent (48 days, without sea food), apostles’
fast (varies from 15 to 49 days without sea food) and assumption (15 days, with sea food).
The dietary pattern is unique in that it regularly interchanges between an omnivorous to

4
a vegetarian (with sea food) or vegan (without sea food) type of diet over the course of
the ecclesiastical year (8).
These religious fasting due to their direct influence on food habits and life style of the
concerned population, they are found to have effects on their health. However, a relatively
small proportion of research studies conducted to date have explored the effect of
religious fasting (9). Among religions those have been studied regarding their relation to
health, Judaism (10-11), Islam (12-15), Seventh-Day-Adventists (16,17), and Greek
Orthodox Christians (7).
Unlike the Greek, Ethiopian Orthodox Christians (EOC) in addition to animal source
foods proscription, calorie restriction has also been practiced by most of the fasters.
However, to the best of the researcher’s knowledge, there is no study conducted on the
role Ethiopian Orthodox Christians’ fasting practice in relation to metabolic syndrome
indices and level of serum electrolytes.
This study assesses the effects of Ethiopian Orthodox Christians Abiy tsom (lent fasting)
on metabolic syndrome indices and level of serum electrolytes.
5
1.2. Statement of the problem
Metabolic syndromes are among the leading causes of morbidity and mortality worldwide
(18). The prevalence of chronic diseases in general and metabolic syndrome in particular
is increasing in alarming rate in Ethiopia (19). Unhealthy dietary behaviors like
consumption of calorie-dense foods are among the responsible risk factors for the
increased prevalence of metabolic syndrome (19).
The global statistics shows that approximately a quarter of adult populations suffer from
this clinical entity. According to various studies the prevalence of MetS in general
population in the United States, Saudi Arabia, and Turkey are 24%, 39.3%, and 33.4%,
respectively. The literature also reveals that the prevalence of MS in Tehran is 30.1%
while prevalence of MS in three major cities in center of Iran is 23.3%. A more interesting
part of the MetS story in Iran is that 45% of adult the population in Khorasan (Northeast
Iran) has MetS. Similarly, the prevalence of the metabolic syndrome according to the
WHO definition in seven European countries was estimated to be 23%. In Canada, more
than a quarter of the population between the ages of 35 to 75 years was affected by the
metabolic syndrome based on the ATP III criteria. At least 12% of the population aged
25 years and above was found to have three or more risk factors in Australia (20-23).
The third National Health and Nutrition Examination Survey in the United States reported
the prevalence of Met S is 24 per cent in healthy adults and found that cardiovascular and
all-cause mortalities to be increased in men and risk of coronary disease increased in
women. The men with Met S have been reported to be 2-4 times more likely to die of any
cause than those without Met S, even after adjustment for conventional risk factors
(23,25).
Metabolic syndrome is evolving into a pandemic, contributing to approximately 67% for
all-cause mortality,12– 17% for cardiovascular disease, and 30–52% for diabetes in the
population. In populations free of cardiovascular disease at baseline, cardiovascular
morbidity and mortality increases 1.5- to 3fold in the presence of the metabolic syndrome.
According to International Diabetes Federation (IDF) a quarter of the world’s adults have
metabolic syndrome. People with metabolic syndrome are twice as likely to die from, and
three times as likely to have a heart attack or stroke compared with people without the
syndrome. People with metabolic syndrome have a fivefold greater risk of developing
type 2 diabetes mellitus. Up to 80% of the 200 million people with diabetes globally will

6
die of cardiovascular disease. This puts metabolic syndrome and diabetes way ahead of
HIV/AIDS in morbidity and mortality terms yet the problem is not as well recognized.
The main reason behind this is that the combination of MetS risk factors interacts
synergistically to start or accelerate the progression of atherosclerosis (26).
In Africa, the first reported MetS study conducted in the mid-90s in Cameroon found a
1.5% and 1.3% prevalence of MetS among urban dwelling women and men using IDF
criteria; however, the study did not measure HDL-C concentrations (27). A second study
conducted in 2004 in Seychelles, found a high prevalence of MS where 25%–30% of
their study population had the syndrome (28). A recent study involving adults in semi-
urban and rural communities in Nigeria found a prevalence of MS to be 18% (29). A
community based study conducted in Tanzania in 2009 reported a 38% prevalence of
MetS (30). The prevalence of Met S in children and adolescents is relatively low (4%)
when compared to the adult population (24%), except amongst overweight and obese
adolescents where the prevalence of the metabolic syndrome has been reported as high
as 29% (31).
Another important issue of MetS is that early diagnosis and efficient management of the
disease will result in the reduced risk of future development of CAD. Previous research
indicated that the risk for CHD and stroke was increased threefold in subjects with
metabolic syndrome (P<0.001). Cardiovascular mortality was also markedly increased in
subjects with metabolic syndrome (12.0 vs. 2.2%, P < 0.001). Another study showed that
patients with even one or two metabolic syndrome components were at increased risk for
mortality from CHD and CVD. Moreover, metabolic syndrome overall more strongly
predicts CHD, CVD, and total mortality than its individual components. Similarly, the
risk of incident CVD increased in conjunction with rising numbers of the components of
metabolic syndrome; 2.5% of individuals with one component developed CVD, whereas
14.9% of those who had four or more components developed the disease (32).
In Ethiopia only single cross-sectional study among working adults conducted in Addis
Ababa, revealed that the overall prevalence of MetS was 12.5% and 17.9% according to
ATP III and IDF definitions respectively. Using ATP III criteria, the prevalence of MetS
was 10.0% in men and 16.2% in women. Application of the IDF criteria resulted in a MS
prevalence of 14.0% in men and 24.0% in women (33). But still no population based
study has systematically evaluated the prevalence of MetS among Ethiopians.

7
Unlike the Greek, Ethiopian Orthodox Christians (EOC) in addition to animal source
foods prescription, calorie restriction has also been practiced by most of the followers
and the duration of lent fasting period is prolonged by one week. However, to the best of
the researcher’s knowledge, there is no study conducted on the role Ethiopian Orthodox
Christians’ fasting practice in relation to metabolic syndrome indices and level of serum
electrolytes (34,35).
To date, only very few investigations have examined the health-related effects of these
fasting periods. Those few studies in Greek again presented conflicting findings on blood
pressure (36,37), similar inconsistent findings on lipid profile, blood glucose levels and
anthropometric measurements (38-39) that additionally highlights that more work
remains to be performed.

8
1.3. Significance of study
Metabolic syndrome (MetS) is a disease condition which is alarmingly rising both in
developing and developed countries but there is very limited information and attention to
it in Ethiopia, hence it is important to make a study and raise awareness regarding fasting
and its benefits among people.
It is well established that dietary habits, caloric restrictions, and religious fasting have
beneficial effect in prevention and treatment of metabolic syndrome. Most religions have
long established fasting periods that convey religious identity; however, the importance
of dietary rules and the degree to which they are observed by followers vary considerably
over time, often in response to a changing environment and hence, it is important to
investigate and document the role of religious fasting with respect to health. Therefore,
study is needed to observe the effect of religious fasting on metabolic syndrome indices
and level of serum electrolytes.
Moreover, the findings of the study will provide baseline data for elucidating the effect
of Ethiopian Orthodox Christians fasting on metabolic syndrome indices and serum
electrolytes that will serve as background information for future studies.

9
2. Literature review
2.1. Definition and pathogenesis of metabolic syndrome
Metabolic syndrome is a constellation of interrelated abnormalities (namely obesity,
dyslipidemia, hyperglycemia, and hypertension) that increase the risk for cardiovascular
disease and type 2 diabetes. This is a common metabolic disorder which increases in
prevalence as the population becomes more obese. Metabolic syndrome was introduced
as a diagnostic category to identify the individuals that satisfy arbitrary chosen criteria to
initiate lifestyle changes, and drug treatment when needed, with the goal of decreasing
risk of cardiovascular disease and type 2 DM (46). The diagnostic criteria have been
established in various ways as indicated below:
a. World Health Organisation, 1998
Diabetes or impaired fasting glycaemia or impaired glucose tolerance or insulin resistance
(hyperinsulinaemic, euglycaemic clamp-glucose uptake in lowest 25%) Plus any two of
the following: Obesity: BMI > 30 or waist-to-hip ratio > 0.9 (male) or > 0.85 (female)
Dyslipidaemia: triglycerides ≥ 1.7 mmol/L or HDL cholesterol < 0.9 (male) or < 1.0
(female) mmol/L Hypertension: blood pressure > 140/90 mm Hg Microalbuminuria:
albumin excretion > 20 μg/min
b. National Cholesterol Education Program's Adult Treatment Panel III (NCEP:
ATP III), 2001
Any 3 of the following: Central obesity: waist circumference > 102 cm (male), > 88 cm
(female) Hypertriglyceridaemia: triglycerides ≥ 1.7 mmol/L Low HDL cholesterol: < 1.0
mmol/L (male), < 1.3 mmol/L (female) Hypertension: blood pressure ≥ 135/85 mmhg

10
c. International Diabetes Federation, 2005
Central obesity (defined as waist circumference ≥ 94 cm for Europoid men and ≥ 80 cm
for Europoid women) Plus any two of the following: Raised triglycerides > 1.7 mmol/L,
or specific treatment for this lipid abnormality Reduced HDL cholesterol: < 1.03 mmol/L
in males, and 1.29 mmol/L in females, or specific treatment for this lipid abnormality
Raised blood pressure: systolic blood pressure ≥ 130mmHg or diastolic blood pressure ≥
85 mmHg
Raised fasting plasma glucose, or previously diagnosed diabetes mellitus
The pathogenesis of metabolic syndrome is complex with interactions between genetic
and lifestyle factors. Overweight and abdominal obesity are principal and recurrent
clinical characteristics which, together with insulin resistance in skeletal muscles, adipose
tissue and liver, play a central role in the development of metabolic syndrome. A typical
dyslipidemia with high levels of triglycerides, low HDL and high ApoB plus small, dense,
oxidation prone and very atherogenic LDL particles is a common and important
subcomponent of metabolic syndrome. Post-prandial (following food intake)
hyperlipidemia and high levels of serum free fatty acids have also been found.
Hypertension is another recurrent condition. Other subcomponents include a reduced
fibrinolytic capacity, inflammatory activity, high levels of uric acid, a reduced endothelial
function and fatty liver (41).
2.2. Factors Associated with Metabolic Syndrome
A majority of studies indicate a strong link between the level of physical activity or fitness
and the prevalence of metabolic syndrome. A Swedish study of men and women aged 60
showed a strong dose-response relationship between reported physical activity in leisure
time and metabolic syndrome. The relationship was not affected by factors such as
gender, education, civil status, smoking or intake of fruit, vegetables and alcohol (42).
Similar findings were made in other cross-sectional studies and prospective studies where
an inactive lifestyle and/or poor fitness were closely linked to the existence of metabolic
syndrome (43).

11
Many national and international reports indicate an increase in overweight and obesity
among both children and adults. The waist circumference of children and adults has
increased comparatively more than their weight. Abdominal obesity is closely linked to
metabolic syndrome. Dietary factors have a major influence on metabolic syndrome.
Indeed, nutritional imbalance due to high energy, fat and cholesterol intakes are
considered to be a risk factor for the occurrence of this syndrome (44).
Increased consumption of energy dense and processed foods that are high in fat, sugar
and salt is major reason for the raising prevalence of metabolic syndrome. This fast-paced
lifestyle changes seems to be a major factor in the growing epidemic of non-
communicable diseases in the world. Unhealthy diets are considered major causes of
diseases, such as cardiovascular disease and type 2 diabetes mellitus, contributing
substantially to the global burden of diseases and mortality in Middle-East countries. In
Saudi Arabia, 66% of adult men and 71% of adult women are either overweight or obese.
These countries spend nearly 5.6 billion USD on diabetes-related healthcare. The
available data suggest that metabolic syndrome is an increasingly common problem in
the Arab population, and the estimates of its prevalence vary from 20.8% to 40% (45,46).
A study by Al-Daghri and colleagues (45, 47) in Saudi adults observed that the prevalence
of metabolic syndrome remains high, but has considerably decreased, reaching 37% as
compared to the previously recorded 44.1%. However, among the metabolic syndrome
components, low high-density lipoprotein (HDL)-cholesterol and hypertriglyceridemia
were the most prevalent, affecting 88.6% and 34% of the subjects, respectively.
In 2005, Al-Nozha and colleagues reported that the prevalence of metabolic syndrome
was almost 40% in Saudi Arabia. In addition, several epidemiological studies also
demonstrated an increase in the prevalence of metabolic syndrome in other Middle-
Eastern countries (46).
In addition to the findings of NCEP ATP III, several studies also suggest that lifestyle
modifications could be an important element for reducing and managing metabolic
syndrome risk factors. Several clinical and epidemiological studies suggest that among
the therapeutic lifestyle changes, dietary factors could play a very important and
beneficial role in combating several chronic diseases. It has also been shown that the
various risk factors contributing to metabolic syndrome differ between genders and in
different countries (40).
12
A study conducted in Addis Ababa Ethiopia revealed that the prevalence of MetS was
14.0% in men and 24.0% in women and showed consumption of calorie-dense foods,
sedentary lifestyle, tobacco consumption, and use of antiretroviral medications as risk
factors for MetS and concluded that the burden of metabolic syndrome and mortality from
Chronic non-communicable diseases(CNCDs) that are linked to life styles changes is
increasing in the country (48).
2.3. Religious Fasting and its effect on metabolic syndrome indices and
level of serum electrolytes
2.3.1. Religious fasting
Fasting has been practiced for millennia, but studies have shed light on its role in adaptive
cellular responses that reduce oxidative damage and inflammation, optimize energy
metabolism and bolster cellular protection. In lower eukaryotes, chronic fasting extends
longevity in part by reprogramming metabolic and stress resistance pathways. In rodents
intermittent or periodic fasting protects against diabetes, cancers, heart disease and
neurodegeneration, while in humans it helps to reduce obesity, hypertension, asthma and
rheumatoid arthritis. Thus, fasting has the potential to delay aging and help prevent and
treat chronic diseases while minimizing the side effects caused by chronic dietary
interventions (49).
In humans, fasting is achieved by ingesting no or minimal amounts of food and caloric
beverages for periods that typically range from 12 hours to three weeks. Many religious
groups incorporate periods of fasting into their rituals including Muslims who fast from
dawn until dusk during the month of Ramadan, and Christians, Jews, Buddhists and
Hindus who traditionally fast on designated days of the week or calendar year. In many
clinics, patients are now monitored by physicians while undergoing water only or very
low calorie (less than 200 kcal/day) fasting periods lasting from 1 week or longer for
weight management, and for disease prevention and treatment (6).
Fasting is distinct from caloric restriction (CR) in which the daily caloric intake is reduced
chronically by 20–40%, but meal frequency is maintained. Starvation is instead a chronic
nutritional insufficiency that is commonly used as a substitute for the word fasting,
particularly in laboratory animals, but that is also used to define extreme forms of fasting,
13
which can result in degeneration and death. We now know that fasting results in
ketogenesis that promotes potent changes in metabolic pathways and cellular processes
such as stress resistance, lipolysis and autophagy, and can have medical applications that
in some cases are as effective as those of approved drugs such as the dampening of
seizures and seizure associated brain damage and the amelioration of rheumatoid arthritis
(2).
Islamic Ramadan, the three principal fasting periods of Greek Orthodox Christianity, and
the Daniel Fast each provide a unique and interesting vantage point for evaluating the
effects of food restriction/modification. The majority of findings related to Ramadan
fasting are mixed, and these discrepancies are most likely due to the differences in cultural
norms - particularly dietary norms - of the groups studied (50). The three Greek Orthodox
Christian fasting seasons appear to decrease body mass and lower both total and LDL
cholesterol levels, although these fasts minimally affect the intake of most vitamins and
minerals. The Daniel Fast is also associated with profound and favorable effects on a
variety of markers related to human health, including blood pressure, serum lipids, insulin
sensitivity, and biomarkers of oxidative stress (6,7).
Most studies on GOC have reported a decreased caloric intake during the fasting periods,
which may result in lowered body mass. Percentage wise, carbohydrate intake appears to
increase while both protein and fat intake decrease. Both saturated fat and trans-fatty acid
consumption appear to decrease during fasting periods while both monounsaturated and
polyunsaturated fat consumption do not change (7).
The intake of most vitamins and minerals do not appear to change during these periods,
although riboflavin and calcium intake each appear to decrease, and magnesium intake
appears to increase. Both riboflavin and calcium intake appear to decrease during fasting
periods, while magnesium intake appears to increase. The intake of the following
vitamins and minerals do not appear to change during fasting periods: vitamin A; thiamin;
niacin; vitamin B12; vitamin C; vitamin E; phosphorus; potassium; and zinc. Mixed
results have been recorded regarding the intake of both folate and sodium (51-53).
2.3.1.1. Religious fasting and anthropometric measurements
Religious fasts are partaken primarily for spiritual purposes; they also have the potential
to greatly affect one's physical health. Regarding anthropometric outcomes, Greek
14
Orthodox Christian monks were observed to decrease significantly during fasting periods
(35).
Anthropometric measures of adiposity such as body mass index (BMI), waist
circumference (WC), and waist-to-hip ratio (WHR) have been shown to correlate
differently with CVD risk. The risk of death from cardiovascular disease increases with
excessive fat (54-58) and obesity is shown to adversely affect cardiac function, increases
the risk factors for coronary heart disease, and is an independent risk factor for
cardiovascular disease (59). Dyslipidemia, hypertension, and other CVD risk factors are
highly correlated with increasing BMI (60,61) and excessive abdominal adiposity is also
a strong independent predictor (62).
BMI is the most frequently used measure of adiposity in epidemiologic studies; however,
some investigators have reported that using BMI alone is not the most accurate measure
of increased CVD risk; instead, other studies argued that WC as a better predictors of
future CVD risk (63,64).
BMI does not accurately reflect the degree of body fat and body fat distribution (65,66).
There is a large body of evidence that suggests abdominal fat distribution measured by
waist circumference (WC) may be more closely tied to metabolic risks than BMI (67,68).
To this effect, the US National Institutes of Health has recommended combined
measurements of WC and BMI as an assessment tool for CVD risk (69). Thresholds of
BMI in accordance with WHO protocol (Underweight: <18.5 kg/m2; Normal: 18.5–24.9
kg/m2; Overweight: 25.0–29.9 kg/m2; Obese ≥30 kg/m2). Abdominal obesity is explained
by having a waist circumference of ≥94 cm for men and ≥80 cm for women (48).
Waist to hip ratio (i.e. the waist circumference divided by hip circumference) suggested
as an additional measure of body distribution. This ratio can be measured more precisely
than skin fold and it provides an index for both subcutaneous and intra-abdominal adipose
tissue. The cutoff point for risk of metabolic complication, WHR >0.90 for males and
>0.85 for females (68).
2.3.1.2. Religious fasting and Blood glucose and Blood pressure
Cardiovascular diseases due to hypertension and diabetes mellitus or elevated glucose
level are among the top causes (69). Hypertension is a growing public health problem,

15
with remarkable contribution to cardiovascular diseases morbidity (70) and it is major
risk factor of causing heart attack (71).
Cardiovascular complications are now the leading causes of diabetes-related morbidity
and mortality. The public health impact of cardiovascular disease in patients with diabetes
is already enormous and is increasing. The adverse influence of diabetes extends to all
components of the cardiovascular system: the microvasculature, the larger arteries, and
the heart, as well as the kidneys (73). Cut off values with mean systolic blood pressure
(SBP) ≥ 140 mmHg (millimeters of mercury) or diastolic blood pressure (DBP) ≥ 90
mmHg are considered to be hypertensive, while fasting blood sugar level >110mg/dL are
considered as hyperglycemic (74).
Greek Orthodox Christian fasting appears to have no effect on blood glucose levels,
although fiber intake increases during fasting periods (7).
There are conflicting findings on the effects of Greek Orthodox Christian fasting on blood
pressure. One study found that systolic blood pressure increased during fasting periods
(75), while another study found no change in systolic blood pressure when fasters were
compared with non-fasters (76). One study reported that non-fasters’ diastolic blood
pressure decreased significantly during fasting periods when compared to the changes in
fasters’ diastolic blood pressure (76), while another study reported that fasters’ diastolic
blood pressure did not change during fasting period (75).
More research remains to be performed on hematological variables and blood pressure
during fasting periods due to both the lack of previous research and the inconclusive
findings. Also, future studies should examine each of the three principal fasting periods
both separately and aggregately, because each fasting period has unique food
prescriptions and durations (76,77,78).
2.3.1.3. Lipid profiles and religious fasting
Lipids are characterized by their insolubility in water and include a family of compounds;
triglycerides, phospholipids, and sterols. Sterols are compounds with a multiple ring
structure; the most common sterol is cholesterol (74).
Cholesterol is an essential substance involved in many functions, such as maintaining cell
membranes where it is mainly incorporated in to the plasma membranes of cells and

16
regulates membrane fluidity conferring a higher degree of rigidity. Furthermore, it is the
precursor for the synthesis of fat soluble vitamins, all steroid hormones, bile acid and help
cell connections in the brain (79). While in circulation, cholesterol, being a lipid, requires
a transport vesicle to shield it from the aqueous nature of plasma. Complex, micelle-like
join up of various proteins and lipids achieve cholesterol transport through the vascular
system. These particles are known as lipoproteins (79).
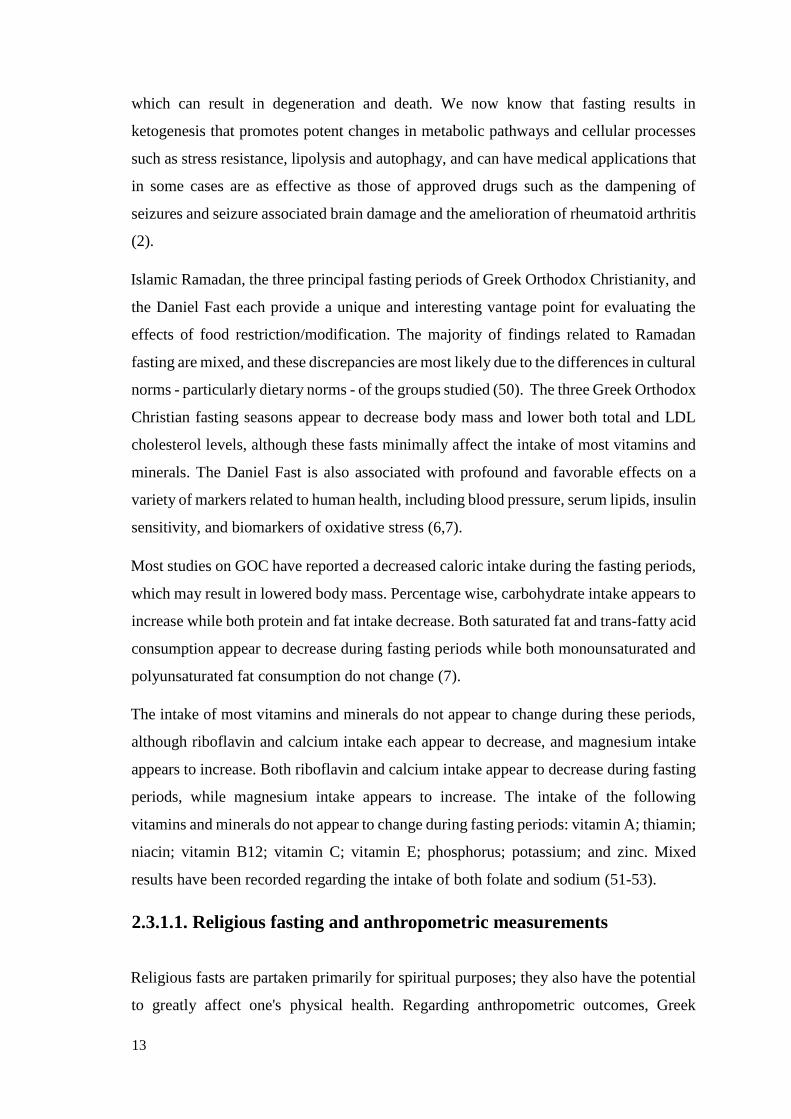
Lipoproteins are heterogeneous in size, shape, composition, function, and perhaps most
importantly, their contribution to vascular disease. All types of lipoproteins carry all
classes of lipids: triacylglycerides, cholesterol, phospholipids and amphipathic proteins
called apolipoproteins (79). Lipoproteins can be differentiated on the basis of their
density, as depicted in Figure 1, the degree of lipid in a lipoprotein affects its density—
the lower the density of a lipoprotein, the more lipid it contains relative to protein. The
four major types of lipoproteins are chylomicrons, very low-density lipoprotein (VLDL),
low-density lipoprotein (LDL), and high-density lipoprotein (HDL) (74,79).
Chylomicrons and VLDL: These two lipoproteins are rich in triglyceride. Chylomicrons
are synthesized by enterocytes from lipids absorbed in the small intestine and VLDL is
synthesized in the liver. Their function is to deliver energy-rich triacylglycerol (TAG) to
cells in the body. TAG is stripped from chylomicrons and VLDL through the action of
lipoprotein lipase, an enzyme that is found on the surface of endothelial cells. This
enzyme digests the TAG to fatty acids and monoglycerides, which can then diffuse into
the cell to be oxidized, or in the case of an adipose cell, to be re-synthesized into TAG
and stored in the cell (74,79).

17
Figure 1: Compositions of lipoproteins (74).
Low Density Lipoproteins (LDL): As VLDL particles are stripped of triacylglycerol,
they become denser and these particles are remodeled at the liver and transformed into
LDL. The function of LDL is to deliver cholesterol to cells, where it is used in
membranes, or for the synthesis of steroid hormones. Cells take up cholesterol by
receptor-mediated endocytosis when LDL binds to its receptor and internalized in an
endocytic vesicle. Receptors are recycled to the cell surface, while hydrolysis in an
endolysosome releases cholesterol for use in the cell (74,79). High levels of LDL
cholesterol (the so-called “bad cholesterol”) greatly increase the risk for atherosclerosis
because LDL particles contribute to the formation of atherosclerotic plaques (79).
High Density Lipoprotein (HDL): Excess cholesterol is eliminated from the body via
the liver, as excess cholesterol from cells is brought back to the liver by HDL in a process
known as reverse cholesterol transport. HDL is synthesized and secreted by the liver and
it travels in the circulation where it gathers cholesterol to form mature HDL, which then
returns the cholesterol to the liver via various pathways (79). Cholesterol delivered to the
liver via HDL enters the bile acid synthesis pathway also known as the cholesterol
catabolic pathway (79). Low HDL levels ("good cholesterol") are an independent risk
factor, because reverse cholesterol transport works to prevent plaque formation, or even
cause regression of plaques once they have formed. HDL may also have anti-
inflammatory properties that help reduce the risk of atherosclerosis and thereby promote
vascular health (79).

18
Liver is central to the regulation of cholesterol levels in the body; the liver is not only
synthesizing cholesterol for export to other cells, but it also removes cholesterol from the
body by converting it to bile salts and putting it into the bile where it can be eliminated
in the feces. Furthermore, the liver synthesizes the various lipoproteins involved in
transporting cholesterol and lipids throughout the body. Cholesterol synthesis in
hepatocytes is under negative feedback regulation; increased cholesterol in the cell
decreases the activity of 3-hydroxy-3-methyl glutaryl-coenzyme A (HMG-CoA
reductase), the rate-limiting enzyme in cholesterol synthesis (44). When cholesterol
levels rise in the blood, they can, however, have dangerous consequences. Homeostasis
of cholesterol is centered on the metabolism of lipoproteins, which mediate transport of
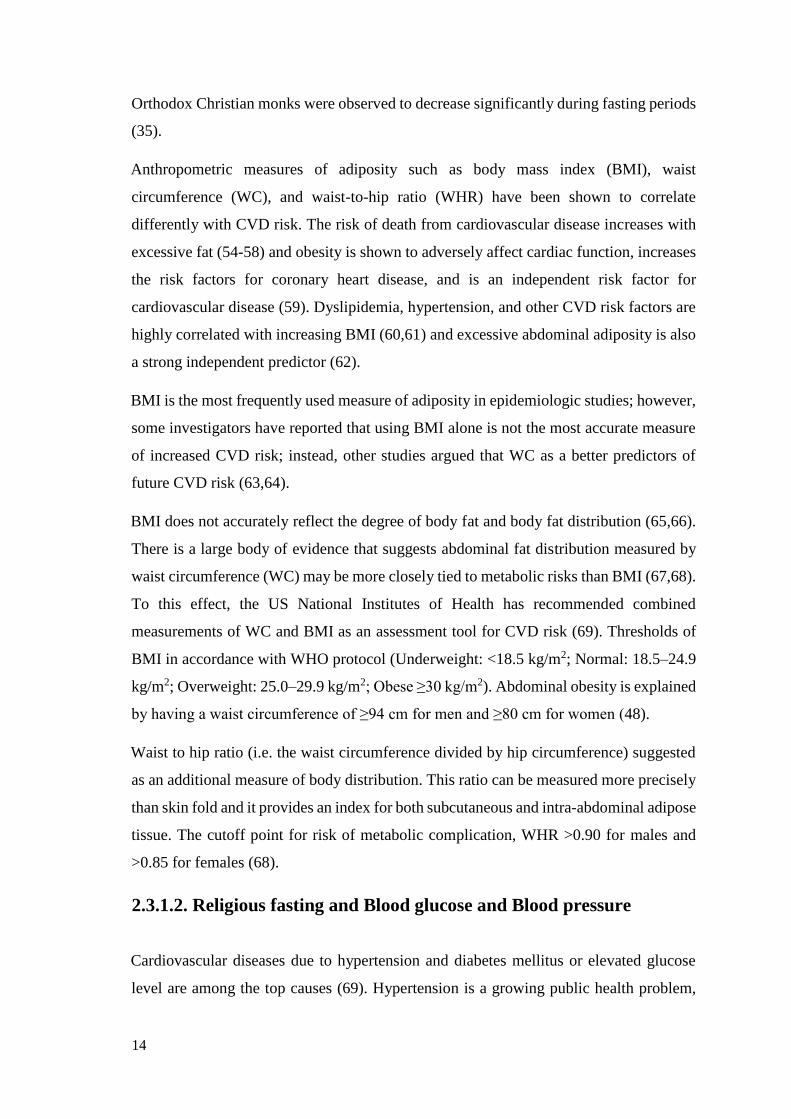
the lipid to and from tissues (79). Figure 2 below summarizes the fates of lipoproteins
produced by the liver.
Abnormal levels of these lipoproteins in blood are linked to increase risk of
atherosclerosis. Atherosclerosis is a cardiovascular disease in which lipids and
inflammatory cells accumulate in plaques within the walls of blood vessels. As a result,
vessel walls are narrowed and clots may form, impeding blood flow and oxygen delivery
and causing tissue injury. Heart disease occurs because the coronary arteries supplying
the heart are a major site where atherosclerotic plaques form. Although atherogenesis is
a multifactorial process, abnormalities in lipoprotein metabolism are one of the key
factors, representing around 50% of the population-attributable risk of developing
cardiovascular disease (80).
Serum lipid profile is measured for cardiovascular risk prediction and has now become
almost a routine test including four basic parameters: total cholesterol (TC), high density
lipoproteins (HDL) cholesterol, low density lipoproteins (LDL) cholesterol and
triglycerides (16). However, lipoproteins ratios, TC/HDL cholesterol and LDL/HDL
cholesterol, are being used as risk indicators with greater predictive value than isolated
parameters used independently, particularly the former. These two indices can be
regarded as similar; since two thirds of plasma cholesterol is found in LDL, total and
LDL cholesterol are closely correlated. Moreover, an increased in the level of the
denominator, HDL cholesterol is more prevalently associated with plaque regression,
while a decrease in LDL cholesterol would slow down progression. Both predict greater
cardiovascular risk for a wide range of cholesterol concentrations. However, when there

19
is no reliable determination of LDL cholesterol, as in cases of hypertriglyceridemia, it is
preferable to use the total/HDL cholesterol ratio (80).
Figure 2: Summary of the fates of lipoproteins produced by the liver: VLDL and
chylomicrons (74).
In the presence of infection or inflammation, the level of total cholesterol and HDL
decreases and triglyceride level increases (81) whereas the ratio of total cholesterol to
HDL (TC/HDL) remains relatively stable (82). This ratio may therefore serve as a more
reliable measure of serum lipid level (83). Individuals with a high TC/HDL or LDL/HDL
ratio have greater cardiovascular risk owing to the imbalance between the cholesterol
carried by atherogenic and protective lipoproteins; this may be due to an increase in the
atherogenic component contained in the numerator, a decrease in the anti-atherosclerotic
trait of the denominator, or both. TC/HDL ratio is a more sensitive and specific index of
cardiovascular risk than total cholesterol; for this reason, the ratio is also known as
atherogenic or Castelli index (80).
Lipid profile measurement is usually done in fasting blood specimen, fasting refers to 12–
14 h overnight complete dietary restriction with the exception of water and medication.
This may hold true due to two main reasons: the first being postprandial triglycerides

20
remain elevated for several hours (84), and secondly, most reference values for serum
lipids are established on fasting blood specimen (81).
Desirable blood lipid profiles are total cholesterol <200mg/dL, LDL cholesterol
<100mg/dL, HDL cholesterol >60mg/dL, and triglycrides <150mg/dL. Low HDL-C was
defined to be <40 mg/dL in men and <50 mg/dL in women (3, 79, 46). Lipoprotein ratios
therapeutic target cut-off values are < 3.7 for LDL/HDL cholesterol and < 5 for TC/HDL
cholesterol ratio (80).
A study conducted on Greek Christian Orthodox Church fasting found the decreased level
of LDL and LDL to HDL ratio and Total Cholesterol. In various literatures, results for
Triglycerides is conflicting (7).
2.3.1.4. Effects of religious fasting on Urea and Total protein
Most of the studies conducted on Greek Orthodox Christians, Ramadan, and Coptic
Christians fasting revealed the fact that, urea level is affected significantly by religious
fasting while none attributed Total protein level alteration to religious fasting (7, 8).
2.3.1.5. Effects of religious fasting on Serum electrolytes
Studies underwent during Ramadan fasting on electrolyte imbalance reported
contradictory results for Sodium, some showed normal, and others decreased amount of
total Na+ excretion throughout the fasting and their justification was decreased intake of
food. The results for K+ were also conflicting. Some of them showed normal level and in
other studies increased value during fasting and reasoned that common practice of
drinking large volumes of fruit juices, eating dates and dried fruits as well as reduced
potassium excretion. Literatures indicated increased level during Ramadan fasting for
Ca+2 (63,64). In Greek Orthodox Christians decreased level of Ca+2 and unchanged level
of Cl- during fasting was reported (85).

21
2.4. Fasting in Ethiopian Orthodox Christianity
Ethiopian Orthodox Church has seven fasting periods to be observed by all believers and
during those periods, the believers are not allowed to eat any animal or dairy source foods
unless exempted from these fasts because of serious sickness, breastfeeding mothers, and
children less than seven years of age (86). Greek Orthodox Christians fast for a total of
180 - 200 days each year (6), while Ethiopian Orthodox Christians fast for 250 days each
year, of which about 180 are obligatory for all, and the rest are only for special groups in
the church (priests, monks, and nuns) and their main fasting periods are the Fast of
Prophets (Tsome Nebiyat or Gena 40 days prior to Christmas), the Great Lent (55 days
prior to Easter), the fasting of Salivation (all Wednesdays and Fridays, except for the fifty
days after Easter) and the Assumption of the Virgin Mary (Tsome Filseta, 15 days in
August) (87).
The Great Lent or Abye Tsome, also called Hudade is the longest fasting period and the
major fast of the church. This Lent is observed as a remembrance of the 40 days and
nights fasting of Lord Jesus Christ after His baptism. Later the Ethiopian church added
15 more days to it and made it 55 days (87).
The effect of Ethiopian Orthodox Christian fasting on metabolic syndrome indices and
level of serum electrolytes had not been studied. So the aim of this Study is to assess the
effect of the longest fasting period of Ethiopian orthodox Christians, “Abiy tsom” (lent
fasting) on the metabolic syndrome indices and level of serum electrolytes.

22
3. Hypothesis and objectives
3.1. Hypothesis
Ethiopian Orthodox Christian ‘Abiy tsom’ (lent Fasting) alters Biochemical
parameters related to metabolic syndrome and serum electrolytes.
3.2. Objectives
3.2.1. General objective
To determine effect of ‘Abiy tsom’ (lent fasting) of Ethiopian Orthodox Christians on
metabolic syndrome indices and serum electrolytes in residents of Addis Ababa, Ethiopia
3.2.2. Specific objectives
To compare anthropometric measurements during fasting and non-fasting periods.
To compare Systolic/Diastolic blood pressure and pulse rate during fasting and non-
fasting periods.
To determine effect of lent fasting of Ethiopian Orthodox Christians on Lipid profiles.
To compare Blood Glucose level between two months fasting and non-fasting periods.
To determine the effect of Ethiopian Orthodox Christian lent fasting on level of Total
protein and Urea level.
To assess the effect of Ethiopian Orthodox Christians lent fasting on serum electrolytes.
23
4. Materials and methods
4.1. Study area and period
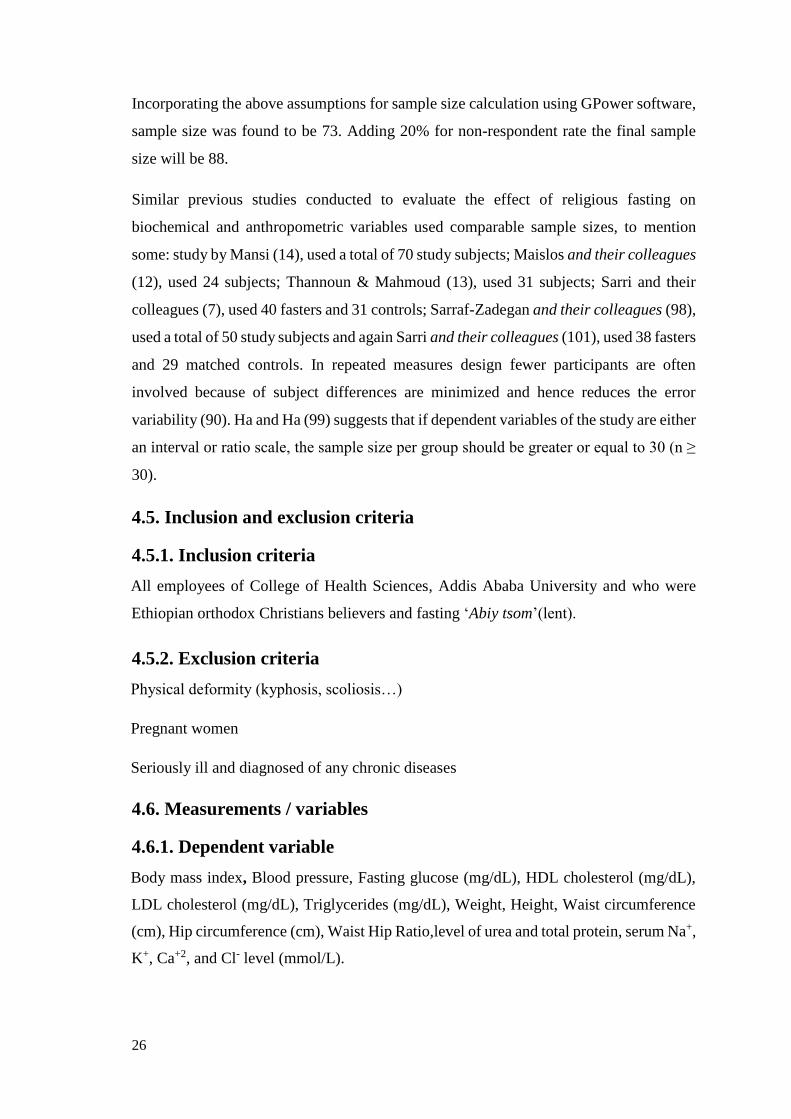
Study was conducted at Addis Ababa University, college of health sciences, from March
15 to June 15, 2017. It is located in the City of Addis Ababa, capital city of Federal
Republic of Ethiopia and Head Quarter of Africa Union. According to the Ethiopian
National Population and Housing Census of 2007 (29), Addis Ababa has a total
population of 2,737,551. About 23% of the total urban population of Ethiopia lives in
Addis Ababa and with respect to religion 74.7% are Orthodox Christians, 16.2% Islam
and 7.8% are Protestants (29).
4.2. Study design
Community based Longitudinal comparative cross sectional study was employed.
Different measurements and data of voluntarily selected participants from eligible
population were taken twice; the first during the last week of fasting period and the second
during last week of the second month counted from Easter (last day of lent fasting). A
major advantage of this, within subject, study design is that participants serve as their
own controls, thus reducing the error variance and increasing the statistical power of the
test with considerably fewer participants (89-91). Measurements include fasting blood
collection for biochemical tests, anthropometric and blood pressure measurements, and
the completion of questionnaires.
4.3. Study populations and subjects
Study populations were Orthodox Christians living in Addis Ababa and were chosen
using convenience sampling technique on the basis of their willingness to participate and
satisfying the inclusion criteria of the study. Employees and students of College of Health
Sciences, Addis Ababa University and who are Ethiopian orthodox Christians believers
and fasting ‘Abiy tsom’(lent) were selected as study subjects purposively for they are
easily available around for the data and sample collection.
4.4. Sample size Determination and sampling technique
To determine sample size, the study used GPowerVersion3.1.9.2 as a tool, this software
provides sample size and power analyses for tests that use F, t, chi-square, or z
distributions and various distributions for nonparametric applications. GPower is one of
the software packages that performs sample size calculations like Minitab and Epi-info

24
covering a wider range of study designs (92,93). As an input GPower requires selecting
appropriate test family (t-test in our case), type of statistical test within test family
(dependent sample t-test), specifying α error probability, power (1-β error probability),
and determining effect size (94).
An effect size is the difference between two means (e.g., treatment minus control) divided
by the standard deviation of the two conditions. It is the division by the standard deviation
that enables us to compare effect sizes across experiments (95). Effect size can be used
at planning stage to find the sample size required for sufficient power for study and for
the purpose of calculating a reasonable sample size and effect size can be estimated by
pilot study results, similar work published by others, or the minimum difference that
would be considered important by experts (96). To calculate effect sizes from similar
published research articles, a simplified methodology by Thalheimer and Cook (95) was
used, employing equations 1 and 2;
Eq. 1
d= Cohen’s d effect size
X = mean (average of treatment or comparison conditions)
S = standard deviation
Subscripts: t refers to the treatment condition and c refers to the comparison condition
(or control condition).
Eq. 2
Where: S = standard deviation
n = number of subjects

25
Subscripts: t refers to the treatment condition and c refers to the comparison condition
……. (or control condition).
From the study done by Sarie and their colleagues (7), fasters, as compared to their pre-
fasting status, have showed a decreased levels of end total cholesterol, LDL-c and BMI
as presented in Table 1. From that study, calculating for effect size among the three
variables using equations 1 and 2 indicated that BMI (with mean difference of 0.4 and
pooled standard deviation of 0.7) had relatively smaller or least detected difference with
Cohen’s d effect size of 0.56.
Table 1: Paired samples T-test with mean pre-fasting values compared to mean
end-fasting results from Sarie and their colleagues (7).
Generally, effect sizes of 0.20 are considered small, 0.50 are medium, 0.80 are large and
1.3 are very large (96,97), these known benchmarks enable us to compare the above
calculated effect size (0.56) to be categorized around medium effect size. Therefore, the
present study considers medium effect size (0.5); power (1-β) of the study (0.85) and α-
error probability (0.05) to have a sufficient sample size so as to detect differences that
might present in the study variables; since sample size increases with increase in power,
with a decrease in effect size and with decreasing level of significance.
Variables Mean Stan
Dev
Mean Stan
Dev
P-value Pre-Fasting
(n=43)
End-
Fasting
(n=43) Effect
Size (d)
Total cholesterol
(mmol/L) 5.6 0.15 5.1 0.14 <0.001 3.40
LDL cholesterol
(mmol/L) 3.3 0.1 3.2 0.1 <0.001 0.61
BMI (kg/m2) 28 0.7 27.6 0.7 <0.001 0.56
26
Incorporating the above assumptions for sample size calculation using GPower software,
sample size was found to be 73. Adding 20% for non-respondent rate the final sample
size will be 88.
Similar previous studies conducted to evaluate the effect of religious fasting on
biochemical and anthropometric variables used comparable sample sizes, to mention
some: study by Mansi (14), used a total of 70 study subjects; Maislos and their colleagues
(12), used 24 subjects; Thannoun & Mahmoud (13), used 31 subjects; Sarri and their
colleagues (7), used 40 fasters and 31 controls; Sarraf-Zadegan and their colleagues (98),
used a total of 50 study subjects and again Sarri and their colleagues (101), used 38 fasters
and 29 matched controls. In repeated measures design fewer participants are often
involved because of subject differences are minimized and hence reduces the error
variability (90). Ha and Ha (99) suggests that if dependent variables of the study are either
an interval or ratio scale, the sample size per group should be greater or equal to 30 (n ≥
30).
4.5. Inclusion and exclusion criteria
4.5.1. Inclusion criteria
All employees of College of Health Sciences, Addis Ababa University and who were
Ethiopian orthodox Christians believers and fasting ‘Abiy tsom’(lent).
4.5.2. Exclusion criteria
Physical deformity (kyphosis, scoliosis…)
Pregnant women
Seriously ill and diagnosed of any chronic diseases
4.6. Measurements / variables
4.6.1. Dependent variable
Body mass index, Blood pressure, Fasting glucose (mg/dL), HDL cholesterol (mg/dL),
LDL cholesterol (mg/dL), Triglycerides (mg/dL), Weight, Height, Waist circumference
(cm), Hip circumference (cm), Waist Hip Ratio,level of urea and total protein, serum Na+,
K+, Ca+2, and Cl- level (mmol/L).

27
4.6.2. Independent variable
Socio demographic characteristics
Age, Sex, Education status, Marital status
Life style Characteristics and Dietary Practices
Fasting animal source food, Smoking status/ Tobacco use, coffee drinking, Alcohol
consumption, Khat chewing
4.7. Data Collection and Instruments for Data Collection
The instruments used for data collection were adapted mainly from the WHO’s stepwise
(STEPs) approach for non-communicable disease surveillance (102) and partly from Sarri
and their colleagues (7). STEPs is the WHO-recommended surveillance tool for chronic
disease risk factors and chronic disease-specific morbidity and mortality which is
intended to serve as an entry point for low and middle-income countries into surveillance
of chronic diseases and their risk factors (102). This approach is characterized by the use
of questionnaires to gain information on risk factors, simple physical measurements
(anthropometric and blood pressure measurements) and biochemical measurements (lipid
profile and glucose level).
Data and Samples were collected twice, one at the last week of two months fasting period
and the second at the end week of the second month after fasters returned to usual diet.
After overnight fasting, sample were collected in the morning between 8 AM and 10 AM
(7).
4.8. Anthropometry measurements
Body weight was measured two times at pre-stage and end of fasting by a digital scale
(Seca, Hamburg, Germany) to the nearest 100g, placed in flat surface. Subjects were
weighed barefoot in very light clothing. Standing height was measured with an adjustable
wooden measuring board once, without shoes to the nearest 0.1 cm with the shoulders in
relaxed position, arms hanging freely, feet together, heels against the back board and
knees straight. Body Mass Index (BMI) was calculated by dividing weight (kg) by height
squared (m2) (7).

28
Waist circumference was measured at the midpoint between the lower margin of the least
palpable rib and the top of the hip or minimal waist using stretch-resistant tape. Hip
circumference was measured around the widest portion of the buttocks, with the tape
parallel to the floor. For both measurements, the subject stand with feet close together
thereby body weight evenly distributed, arms at the side and wearing light clothing. When
the subject become at relaxed state measurement was taken at the end of normal
expiration and these measurements were done in a private place (102). The cut-off points
for waist to hip ratio above 0.90 for males and above 0.85 for females used to indicate
CVD risk (102).
4.9. Physical/ Clinical examination
Blood pressure was measured digitally (Microlife BP A50, Microlife AG, Switzerland)
The BP was taken using a mercury sphygmomanometer from the right upper arm after
the subject was seated quietly for 5 min. Pulse rate was counted from radial artery and
the count per minute was registered (102).
4.10. Laboratory Test
4.10.1. Specimen Collection and Handling
10ml of blood was drawn from fasting individuals using serum separator tube. The drawn
sample stayed for 30 minutes and then centrifuged at a speed of 4000 rpm for 10 minutes.
Then serum was taken and stored under -800C till the time of biochemical analysis. The
serum levels of glucose, TC, HDL-c, LDL-c and TG were measured using COBAS
INTEGRA 400 (Roche Diagnostics GmbH, Sandhofer Strasse 116, D-68305 Mannheim
Germany) random access full automated auto analyzer.
4.10.2. DETERMINATION OF FASTING BLOOD GLUCOSE (GOD-PAP
METHOD)
Test principle
Enzymatic colorimetric determination of Glucose according to the following reactions:
Glucose + O2 +H2O H2O2 +Gluconate
2H2O2 + Phenol + 4-Aminoantipyrine 4-(P-benzoquinone-mono-imino) phenazone
+ 4H2O

29
Glucose is oxidized by Glucose Oxidase, Phenol reacts with 4-Aminoantipyrine and
Hydrogen Peroxide to produce a quinonimin dye, the intensity of color produced
measured at 505nm, is proportional to the concentration of glucose in the sample.
Procedure
Mix, incubate for 8 min. at 37 °C or 12 min. at 20 - 25 °C. Read the absorbance (A). The final
color is stable for 1 hour.
Table 2. Reaction mixture for determination of blood glucose
4.10.3. DETERMINATION OF LIPID PROFILE
After all the specimens are collected the serum is packed with ice and transported for
the biochemical analysis and the lipid profile tests were done by spectrophotometer.
Lipid profiles were analyzed by experienced hand and quality was assured. Samples were
analyzed using fully automated biochemistry analyzers by the direct end point enzymatic
method.
4.10.4. TOTAL CHOLESTEROL
Cholesterol is measured enzymatically in serum or plasma in a series of coupled reactions
that hydrolyze cholesteryl esters and oxidize the 3-OH group of cholesterol. One of the
reaction by products H2O2 is measured quantitatively in a peroxidase catalyzed reaction
that produces a color. Absorbance is measured at 500 nm. The color intensity is
proportional to cholesterol concentration. The reaction sequence is as follows:
Cholesteryl ester + H2O --------->cholesterol + fatty acid
Blank Calibrator /
Standard
Sample
Distilled water 10 l -- --
Calibrator/ Standard -- 10 l --
Sample -- -- 10 l
Reagent 1000 l 1000 l 1000 l

30
Cholesterol + O2 ----------> cholest-4-en-3-one +H2O2
2H2O2+ 4-aminophenazone + phenol -------> 4-(p-benzoquinone- monoimino)-
phenazone + 4H2O
Desirable cholesterol levels are considered to be those below 200 mg/dL in adults and
below 170 mg/dL in children.
4.10.5. TRIGLYCERIDES
Triglycerides are measured enzymatically in serum or plasma using a series of coupled
reactions in which triglycerides are hydrolyzed to produce glycerol. Glycerol is then
oxidized using glycerol oxidase, and H2O2, one of the reaction products, is measured as
described above for cholesterol. Absorbance is measured at 500 nm. The reaction
sequence is as follows:
Triglycerides + 3H2O ------------> glycerol + fatty acids
Glycerol + ATP ----------------------> glycerol-3-phosphate + ADP
Glycerol-3-phosphate + O2 ---------------------> dihydroxyacetone phosphate + H2O2H2O2
+ 4-aminophenazone + 4-chlorophenol ---------> 4-(p-benzoquinone-monoimino)-
phenazone + 2H2O + HCl.
Desirable fasting triglyceride levels are considered to be those below 200 mg/dL, and are
further categorized as Borderline, 200-400 mg/dL; High, 400-1,000 mg/dL; and Very
High (> 1000 mg/dL). Triglycerides are also measured because the value is used to
calculate low density lipoprotein (LDL)-cholesterol concentrations.
4.10.6. HIGH DENSITY LIPOPROTEIN (HDL) CHOLESTEROL
HDL is measured directly in serum. The basic principle of the method is as follows. The
apoB containing lipoproteins in the specimen are reacted with a blocking reagent that
renders them non-reactive with the enzymatic cholesterol reagent under conditions of the
assay. The apoB containing lipoproteins are thus effectively excluded from the assay and
only HDL-chol is detected under the assay conditions. The method uses sulfated alpha-
cyclodextrin in the presence of Mg+2, which forms complexes with apoB containing
lipoproteins, and polyethylene glycol-coupled cholesteryl esterase and cholesterol
oxidase for the HDL-cholesterol measurement. The reactions are as follows:

31
(1) ApoB containing lipoproteins + α-cyclodextrin + Mg+2 + dextran SO4 ---> soluble
non-reactive complexes with apoB-containing lipoproteins
(2) HDL-cholesteryl esters -----------> HDL-unesterified cholesterol + fatty acid
(3) Unesterified chol + O2 ------------> cholestenone + H2O2
(4) H2O2 + 5-aminophenazone + N-ethyl-N-(3-methylphenyl)-N’_succinyl ethylene
diamine + H2O+ H+ -------------> qunoneimine dye + H2O
Absorbance is measured at 600 nm.
4.10.7. LDL-CHOLESTEROL
Most of the circulating cholesterol is found in three major lipoprotein fractions: very low
density lipoproteins (VLDL), LDL and HDL.
[Total chol] = [VLDL-chol] + [LDL-chol] + [HDL-chol]
LDL-cholesterol is calculated from measured values of total cholesterol, triglycerides and
HDL cholesterol according to the relationship: [LDL-chol] = [total chol] - [HDL-chol] -
[TG]/5 where [TG]/5 is an estimate of VLDL-cholesterol and all values are expressed in
mg/dL.
Desirable levels of LDL-chol are those below 130 mg/dL in adults and 110 mg/dL in
children.

32
4.10.8. DETERMINATION OF TOTAL PROTEIN BY BIURET
METHOD
Principle:
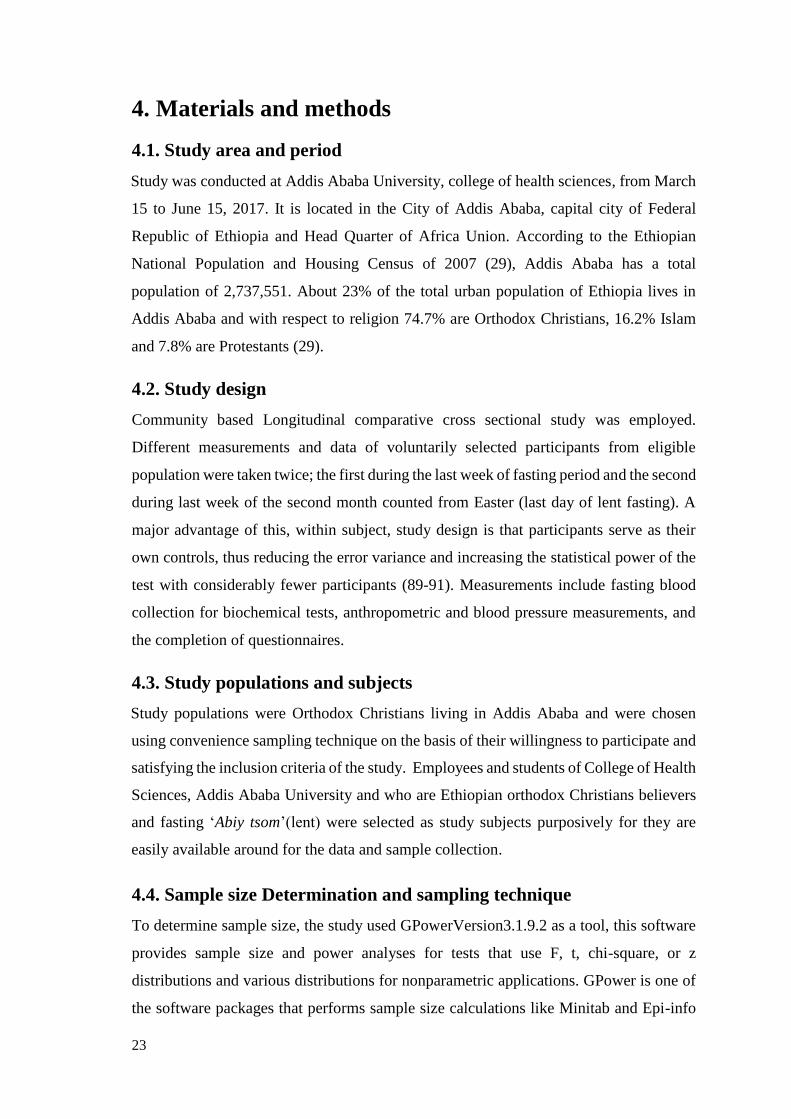
Peptide bonds react with Cu2+ ions in alkaline solution to form a colored product.
A colored chelate is formed between the Cu2+ ion, the carbonyl oxygen and amide
hydrogen atoms (Fig 3). One Cu2+ion is linked to 6 peptide bonds. Tripeptides,
oligopeptides, and polypeptides react to yield pink to reddish-violet products.
The intensity of the color is proportional to the number of peptide bonds that are
reacting and therefore to the amount of protein present in the medium, the absorbance of
which is measured spectrophotometrically at 546 nm.
Figure 3: Schematic representation of Cu2+- Peptide complex
Reagents:
A. Biuret reagent:
I. Stock reagent
12mM CuSO4.5H2O, 32mMPotassium-Sodium tartarate dihydroxide, 30mM KI, 100ml
of 6M NaOH
II. Working Reagent: The above stock reagent is dissolved in water until the volume
reaches 1 liter.
B. Biuret Blank:

33
I. Stock reagent: 32mMPotassium-Sodium tartarate4H2O, 30mM KI, 100mlof 6M
NaOH
II. Working reagent: The above stock reagent is dissolved in water until the volume
reaches 1 liter.
Procedure
To the labeled test tubes, 10 μL of serum sample or standard and 2.5 ml of
working reagent was added (table 2). After mixing and incubation for 20 minutes at room
temperature, concentration was measured at 546 nm.
Table 3. Reaction mixture for determination of Total Protein.
Blank Standard Sample
Standard --- 10 L ---
Sample --- --- 10L
Working Reagent 2.5 ml 2.5 ml 2.5 ml
Incubation: 20 minutes at room temperature.
OD reading: 546 nm.
Normal Value
Adults: 6.3-8.6 g/dL Children: 4.6-7.0 g/dL
4.10.9. UREA ASSAY
Principle
Urea in the sample is hydrolyzed enzymatically into ammonia (NH4+) and carbon
dioxide (CO2). Ammonium ion formed reacts with salicylate and sodium hypochlorite
(NaOCl), in the presence of nitroprusside, to form a green indophenol. The intensity of
the color formed is proportional to the urea concentration in the sample.
+ 2H2O Urease 2NH4+ + CO2
Urea

34
Figure 4: Principle of determination of urea level in the serum.
Reagents
I. R1/Buffer: 50 mmol/L Phosphate buffer pH 6.7, 2 mmol/L EDTA, 60 mmol/L Sodium
salicylate, 3.2 mmol/L Sodium nitroprusside
II. R2 /NaOCl: 140 mmol/L Sodium hypochlorite (NaClO), 150 mmol/L Sodium
hydroxide
III. R3: 30000 IU/L Urease
IV. R4: 50 mg/dl urea standard.
Procedure: To the labeled test tubes, 1.0 ml of R1 was mixed with 10 µl of sample or
standard. After incubation for 5 minute at 370C, 1 ml of R2 was added to all test tubes
and incubated for 5 minutes at 37 0C. After adjusting the instrument to zero with distilled
water, the absorbance was measured against the blank at 546 nm.
Table 4: Reaction mixture for the determination of urea
Blank Standard Sample
R1(ml) 1.0 1.0 1.0
Standard (l) -- 10 --
Sample (l) -- -- 10
Incubation : 37 oC, 5 min.
R2 (ml) 1.0 1.0 1.0
Incubation : 37 oC , 5 min.
Calculation (Urea concentration)
Urea (mg / dL) = (A sample / A standard) X Concentration of the standard
Normal Values: 15-45 mg/dl

35
4.10.10. ASSAY OF ELECTROLYTES (Na+, K+, Ca2+ and Cl-)
Principle-
Analysis methodology is based on ion-selective electrode. There are six different
electrodes used in the analyzer: Na+, K+, Cl-, Ca2+, Li+, and a reference electrode. Each
electrode has an ion-selective membrane that interacts specifically with the
corresponding ions contained in the sample. The membrane is an ion exchanger, reacting
to the electrical charge generating membrane potential, or voltage. A difference in ion
concentrations between the inner electrolyte and the sample causes formation of
electrochemical potential across the membrane of the active electrode. The potential is
transferred by a highly conductive, inner electrode to an amplifier. The reference
electrode is connected to ground as well as the amplifier. The ion concentration in the
sample is then determined by using a calibration curve determined by standard curve
generated using standards (64).
Reagents
Ion selective electrode (ISE) SnapPakTM: containing150 mmol/L Na2+, 5.0
mmol/L K+, 115 mmol/L Cl-, 0.9 mmol/L Ca2+, 0.3 mmol/L Li+.
Procedure
After switching on the instrument, a brief count down began. After countdown was
completed, the prompt ‘Open Sample Door Introduce Sample’ was displayed. The door
was lifted and 100l of sample was introduced in to the probe and closed sample door.
The pump started to aspirate and the electrolyte results were displayed.
Reference range
Na+:136-145 mmol/L, K+:3.5-5.1 mmol/L, Cl- : 97-111 mmol/L, Ca2+:0.8-1.1 mmol/L
for adults and 0.9 -1.2 mmol/L for children.

36
4.11. Ethical Consideration
Before starting the research ethical review committee of Department of Medical
Biochemistry approved this research project and a letter of supports and ethical
clearance was obtained from the ethical board with protocol Number MSC 4/2017. The
nature of the study was fully explained to the study participant. After getting permission
from the study participant, written consent was obtained from each study participant.
Each study participant was informed about the research, their right to abandon the
involvement at any time and confidentiality of information was maintained during data
collection, analysis, interpretation and publication of results.
4.12. Data Quality Control
The principal investigator was with data and specimen collectors, directly involved, and
controlled any kind of procedures and processes that may affect the result. The specimen
was collected, stored and transported according to the guideline and the suspected
specimen in terms of poor quality were rejected automatically. Working and acceptable
commercial kits were used. The daily performances were reported to supervisors and
checked and cross checked timely.
Anthropometric measuring instruments and biochemical analyzers were calibrated by
their respective reference materials. Blood pressure was measured using gold standard
method for measuring blood pressure, mercury sphygmomanometer.
Two assistant data collectors were involved one Health Officer for BP measurement and
one laboratory professional for drawing blood specimen and anthropometric
measurement. Two days training on the contents of the questionnaire, data collection
techniques, and research ethics was given for those assistants and any doubts/question in
the method they were going to undertake was clarified.
Pretest of the questionnaire was conducted in 10 volunteer subjects (~10% study sample
size) for validation of questionnaire two weeks prior to actual data collection and some
adjustment on additional preparations was made. During the actual data collection period,
the questionnaire was checked for completeness every night after data collection.
Feedback on previous day activities was given for the assistant data collectors before the

37
next day data collection and the overall coordination was made by the principal
investigator.
4. 13. Data Management
Data was checked for completeness and entered into SPSS version 21 computer software
package. After complete entry of all the questionnaires, soft copy was checked with its
hard copy to see the consistency. After cross checking, cleaning was made to avoid
missing values, outliers and inconsistencies were removed before analysis. Study
participant who could not complete their end status measurement because of various
reasons were also excluded from analysis.
4.14. Data Analysis and Report
Data obtained from laboratory results and anthropometry measurements were entered to
Epi data version 3.1 and exported to SPSS version 21 for statistical analysis. Normality
of continuous variables was checked by using graphic methods (Histograms with
normality curves and QQ plots). Models were selected based on the type of variables and
to compare the data during fasting period and non-fasting period, Paired sample t test was
used and P value < 0.05 was considered significant. Mean average of data was calculated
and used for comparison.
4.15. Dissemination of the result
The result of this study will be disseminated to different concerned bodies including
Addis Ababa University, College of Health Sciences and will be available as baseline
informative document. Also the principal investigator will do his best with supervisors to
publish the result on respective scientific journals and will make available for all online
users and will consider presentation at national and international scientific conferences.
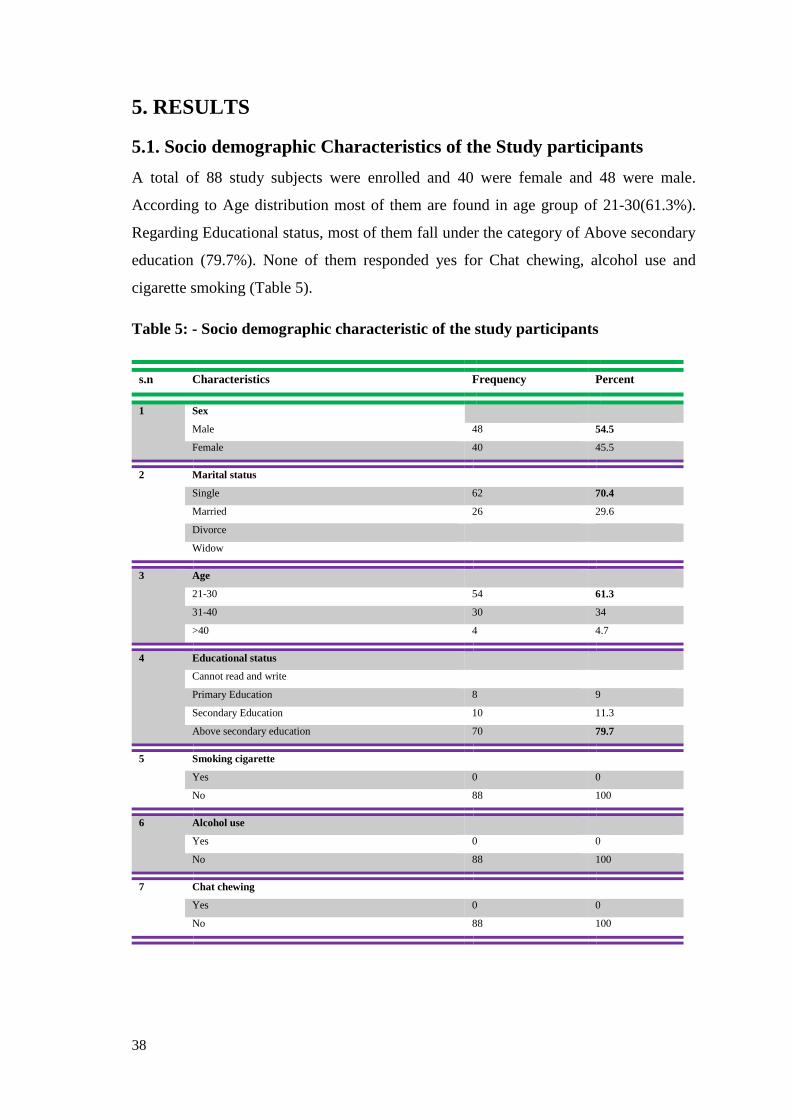
38
5. RESULTS
5.1. Socio demographic Characteristics of the Study participants
A total of 88 study subjects were enrolled and 40 were female and 48 were male.
According to Age distribution most of them are found in age group of 21-30(61.3%).
Regarding Educational status, most of them fall under the category of Above secondary
education (79.7%). None of them responded yes for Chat chewing, alcohol use and
cigarette smoking (Table 5).
Table 5: - Socio demographic characteristic of the study participants
s.n Characteristics Frequency Percent
1 Sex
Male 48 54.5
Female 40 45.5
2 Marital status
Single 62 70.4
Married 26 29.6
Divorce
Widow
3 Age
21-30 54 61.3
31-40 30 34
>40 4 4.7
4 Educational status
Cannot read and write
Primary Education 8 9
Secondary Education 10 11.3
Above secondary education 70 79.7
5 Smoking cigarette
Yes 0 0
No 88 100
6 Alcohol use
Yes 0 0
No 88 100
7 Chat chewing
Yes 0 0
No 88 100
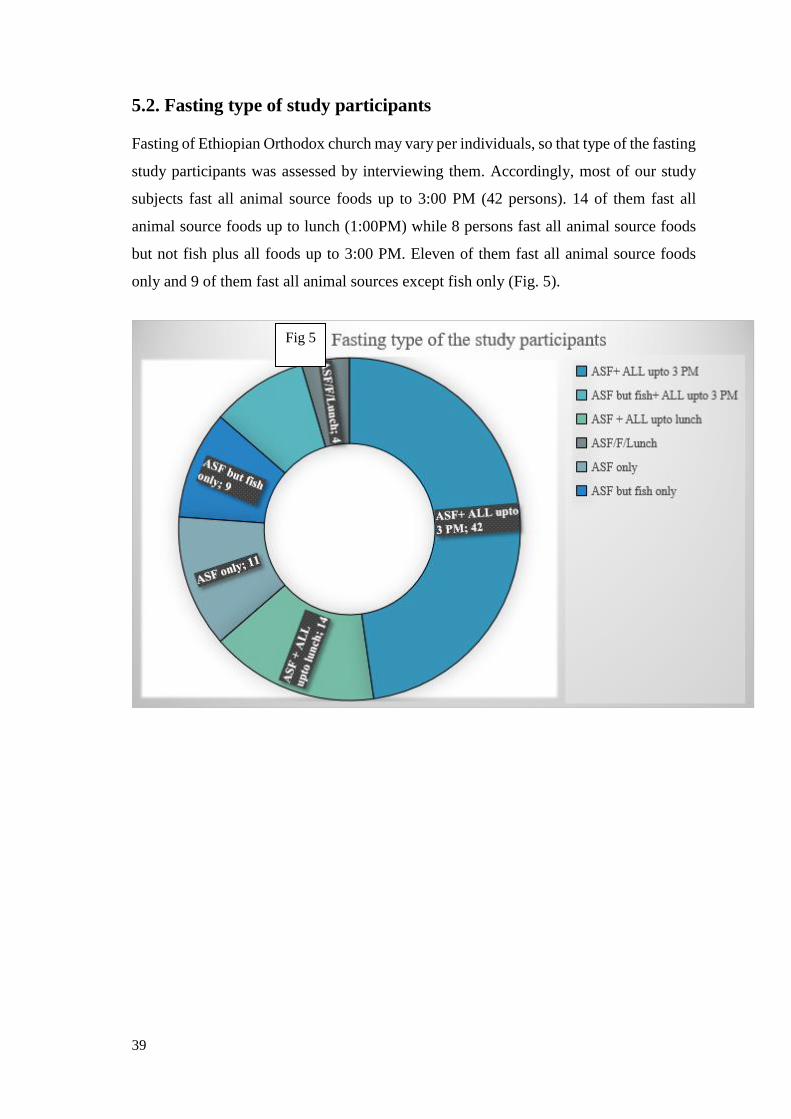
39
5.2. Fasting type of study participants
Fasting of Ethiopian Orthodox church may vary per individuals, so that type of the fasting
study participants was assessed by interviewing them. Accordingly, most of our study
subjects fast all animal source foods up to 3:00 PM (42 persons). 14 of them fast all
animal source foods up to lunch (1:00PM) while 8 persons fast all animal source foods
but not fish plus all foods up to 3:00 PM. Eleven of them fast all animal source foods
only and 9 of them fast all animal sources except fish only (Fig. 5).
Fig 5
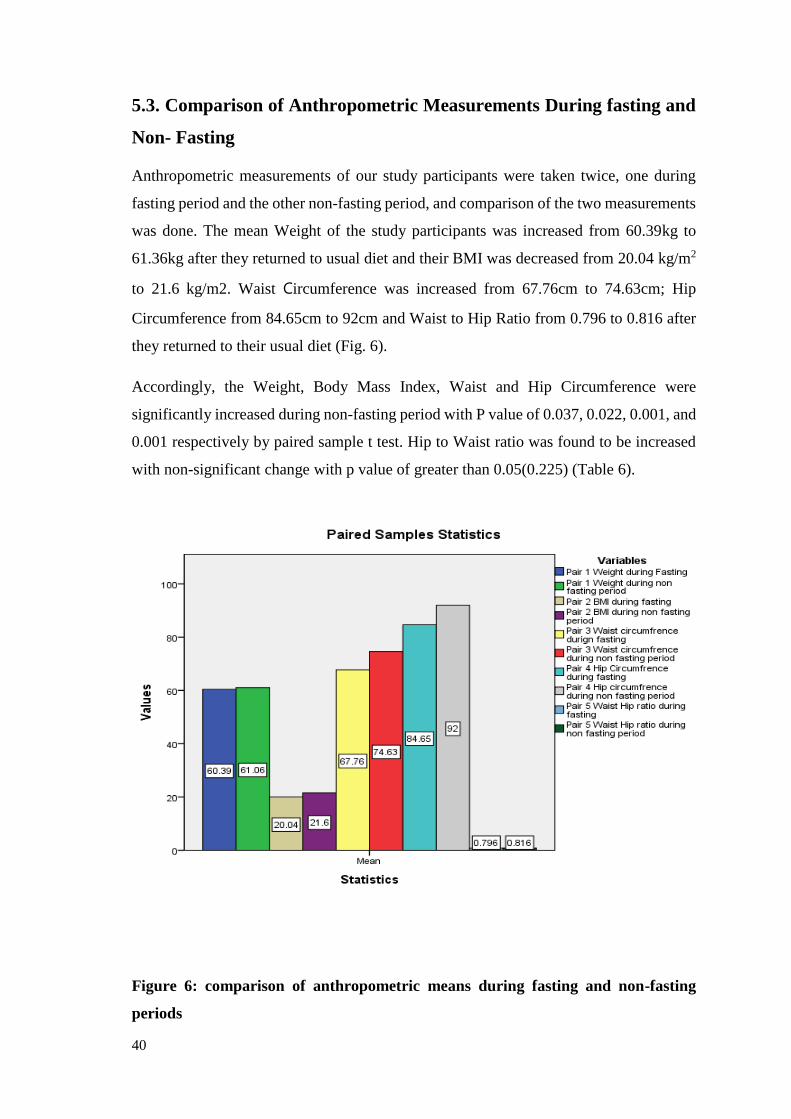
40
5.3. Comparison of Anthropometric Measurements During fasting and
Non- Fasting
Anthropometric measurements of our study participants were taken twice, one during
fasting period and the other non-fasting period, and comparison of the two measurements
was done. The mean Weight of the study participants was increased from 60.39kg to
61.36kg after they returned to usual diet and their BMI was decreased from 20.04 kg/m2
to 21.6 kg/m2. Waist Circumference was increased from 67.76cm to 74.63cm; Hip
Circumference from 84.65cm to 92cm and Waist to Hip Ratio from 0.796 to 0.816 after
they returned to their usual diet (Fig. 6).
Accordingly, the Weight, Body Mass Index, Waist and Hip Circumference were
significantly increased during non-fasting period with P value of 0.037, 0.022, 0.001, and
0.001 respectively by paired sample t test. Hip to Waist ratio was found to be increased
with non-significant change with p value of greater than 0.05(0.225) (Table 6).
Figure 6: comparison of anthropometric means during fasting and non-fasting
periods

41
Table 6: Paired sample t test Comparison of means of Anthropometric
measurements of the study participants
Variables Mean average during
fasting period
Mean average
during non-fasting
period
t df p-value
WT 60.386 61.06 -2.119 76 0.037
BMI 20.04 21.6 -2.343 83 0.022
WC 67.76 74.62 -3.434 79 0.001
HC 84.65 92 -3.555 79 0.001
WHR 0.796 0.816 -1.224 79 0.225
5.4. Comparison of Systolic/Diastolic blood pressure and Pulse rate of
the study participants
Paired sample t test analysis of comparison of means of systolic blood pressure,
diastolic blood pressure and pulse rate indicated that systolic blood pressure was
significantly changed with P value of 0.001 while the rest were not affected (Table 7)
Table 7: Paired sample t test Comparison of means of Blood pressure and pulse rate
of the study participants
Variables Mean average during
fasting period
Mean average
during non-fasting
period
t df p-value
SBP 91.15 109.13 -3.379 65 0.001
DBP 76.0 75.24 0.455 53 0.651
PR 79.18 78.41 0.576 78 0.566

42
5.5. Comparison of Lipid Profile of the study subjects
Means of Lipid profiles were compared and changes were observed. Total cholesterol
was decreased from 156.8mg/dl during fasting period to 144.4mg/dl after returning to
usual diet. Triglyceride level was increased from 104.4mg/dl during fasting period to
105.1mg/dl after returning to usual meal. LDL cholesterol level was increased from
107.9mg/dl during fasting to 109.9mg/dl during non-fasting and HDL cholesterol level
increased to 42.22mg/dl to 45.36mg/dl after fasting gone (Fig. 7).
Statistical Analysis of lipid profiles of the study participants by paired sample test
indicates that, Total cholesterol, High Density Lipoprotein, LDL to HDL ratio and Total
Cholesterol to HDL ratio were significantly changed with P value of 0.044, 0.0001, 0.015
and 0.035 respectively. Low density lipoprotein and Triglycerides level were not
significantly affected (Table 8).
Figure 7: comparison of means of lipid profiles during fasting and non-fasting
period

43
Table 8: Paired sample t test comparison of means of lipid profiles of the study
participants
5.6. Comparison of Urea level and total protein of the study participants
As the table below clearly shows, Urea level of the study subjects was significantly
affected during two periods with P value of 0.028 while Total Protein remained
unaffected (Table 9).
Table 9: paired sample t test comparison of means of Total protein and Urea level
of study participants
Variables Mean average during
fasting period
Mean average
during non-fasting
period
t df p-value
TC 156.8 144.4 1.88 83 0.044
TRI 104.4 105.1 0.115 73 0.909
LDL 107.9 109.9 -0.67 73 0.503
HDL 42.22 45.36 -4.0 73 0.0001
LDL/HDL 2.616 2.473 2.49 73 0.015
TC/HDL 3.79 3.642 2.15 73 0.035
Variables Mean average
during fasting
period
Mean average
during non-fasting
period
t df p-value
UREA 18.89 20.31 -2.236 73 0.028
TOTAL
PROTEIN
7.82 7.74 0.878 73 0.383

44
Comparison of Blood glucose of the study subjects
As shown below, the analysis made, revealed that Blood glucose level was not
significantly affected after the fasting ceased for two months (Table 10)
Table 10: Paired sample t test comparison of blood glucose of participants
5.7. The effect of Ethiopian Orthodox Christians fasting on the levels
of serum electrolytes (Na+, K+, Ca+2 and Cl-)
The analysis made to determine the effect of fasting on the levels of serum electrolytes
indicated that, the average means of Sodium and Potassium ions were slightly higher
during fasting period than the non- fasting period (142 mmol/L, 141 mmol/L) and (4.508
mmol/L, 4.426 mmol/L). It was also found that serum calcium and chloride ions were
sharply decreased after the study participants ceased the fasting and returned to usual diet
(1.510 mmol/L,1.047 mmol/L) and (107.7 mmol/L, 105.9 mmol/L) (Fig. 8).
Paired samples t test was done to check whether this effect was significant and showed
that the effect on calcium and chloride ions were significant with P value 0.015 and 0.033
respectively (Table 11).
Variables Mean average
during fasting
period
Mean average
during non-fasting
period
t df p-value
FBS 91.59 93.15 -0.830 73 0.409

45
Figure 8. Comparison of mean levels of serum electrolytes during fasting and non-
fasting.
Table 11: paired samples t test comparison of levels of serum electrolytes of study
participants
Variables Mean average during
fasting period
Mean average
during non-fasting
period
t df p-value
Na+ 142.2 141.0 1.545 80 0.126
K+ 4.508 4.426 1.678 80 0.097
Ca+2 1.51 1.047 2.478 80 0.015
Cl- 107.7 105.9 2.165 80 0.033

46
6. DISCUSSION
This study found that Ethiopian orthodox Christian fasting significantly decreased
anthropometric measurements like weight, Body Mass Index, Waist and Hip
Circumference. These findings are supported by various studies. A study undergone to
assess effects of Greek Orthodox Christian church fasting revealed that Body mass index
was decreased during fasting period (7). Another interventional study conducted on a
strict vegetarian diet for five weeks on 35 women found significantly decreased Body
Mass Index (76). Other researchers that investigated seventh day Adventist who were
strict vegetarians, found decreased weight, Body mass index and Waist to Hip ratio of
the subjects (74,78). This significant change of Weight, Body Mass Index, Waist
circumference and Hip circumference can be attributed to decreased protein intake and
caloric restriction of Ethiopian Orthodox Christians fasters and insignificant influence on
Waist and Hip ratio may be due to increment of both waist and Hip circumferences
simultaneously keeping the ratio almost constant.
Regarding the effect of Ethiopian orthodox Christian fasting on systolic blood pressure,
diastolic blood pressure and pulse rate, we found that the fasting significantly affected
systolic blood pressure while diastolic blood pressure and Pulse rate remain unchanged.
A literature reported that Ramadan fasting had no significant effect on all of these three
parameters (68). In contrary, other study found that Ramadan fasting had significantly
affected systolic blood pressure and the latter two remain unaltered which supports our
finding (70). Similar to that of Ramadan, the results from studies conducted on Greek
Orthodox Christians are conflicting. A study found that systolic blood pressure increased
during fasting periods (69), while another study found no change in blood pressure when
fasters were compared with non-fasters (7). One study reported that non-fasters’ diastolic
blood pressure decreased significantly during fasting periods when compared to the
changes in fasters’ diastolic blood pressure (7), while another study reported that fasters’
diastolic blood pressure did not change during fasting periods (69). But all of them
revealed that Pulse rate at rest was not affected significantly.
The comparison of the lipid profile of the fasters during period of two months fasting and
non-fasting period indicates that most of the parameters were affected significantly.
Specifically, our study showed that Total cholesterol, High density lipoprotein, Total

47
cholesterol to HDL ratio and LDL to HDL ratio were significantly influenced by fasting
with P value 0.044, 0.001, 0.015 and 0.035 respectively. However, the level of Low
density lipoprotein and triglycerides were not decreased significantly during the fasting
period.
A study conducted on Greek orthodox Christians fasting also found the decreased level
of LDL and LDL to HDL ratio. But in this study after the fasters returned to usual diet,
sharp increment in LDL and Total Cholesterol was witnessed. The reduction in HDL we
found is the common finding with low fat and vegetarian diet. Conflicting with our study,
a study reported the ratio of Total cholesterol to HDL and LDL to HDL were remain
unchanged (76). Another literature also found decreased Lipid profile parameters in their
study on low fat and vegan group for 12 weeks (77). The disparity may be due to different
study setting, where they studied by intervention diet and also the population samples
differ with possible genetic variation.
Concerning total cholesterol, a group of researchers reported decreased level during
Greek Orthodox fasting and also in catholic Christian during lent. The difference may be
due to the fasting style of Catholics which is different from that of orthodox (7,66). In
various literatures, results for Triglycerides is conflicting (77). In our case, we didn’t get
significant change. This may be because during fasting the body may synthesize
Triglycerides from carbon skeletons of amino acids and metabolites from carbohydrate
metabolism.
The other crucial effect we observed is that urea level which was significantly increased
during Fasting period. This is well supported by a study carried out in district of
Maharashtra, India that underwent among Judo athletes (71,72). Many dietitians consider
the diet of plant origin consumed by vegans to be “lighter” and “more healthful” for the
kidneys than the diet of both plant and animal origin consumed by omnivores (71). The
present findings agree with these conclusions.
Additionally, significant changes of Total protein and blood glucose were not observed.
This is also similar finding of various studies among different fasting season of religious
groups during Ramadan fasting and in Greek orthodox Christian church fasting (7,73).
Normally this is expected result because Ethiopian Orthodox Christian fasters do not
restrict protein from plant sources and in the same way the carbohydrates, except that of
animal sources.

48
This study observed the effect of Ethiopian Orthodox Christians fasting on serum
electrolytes and found that, Serum Sodium and Potassium ions were insignificantly
increased while Calcium and Chloride ions were significantly raised during fasting
season with P value of 0.015 and 0.035 respectively.
Studies underwent during Ramadan fasting on electrolyte imbalance reported
contradictory results for Sodium i.e., some showed normal, and others decreased value
of total Na+ excretion throughout the fasting and reasoned decreased intake of food. The
results for K+ were also conflicting. Some of the studies showed normal level while others
studies increased value during fasting and reasoned that common practice of drinking
large volumes of fruit juices, eating dates and dried fruits as well as reduced potassium
excretion. Literatures indicated increased level during Ramadan fasting for Ca+2 and Cl-
which is similar to our findings (81,82)
In Greek Orthodox Christians decreased level of Ca+2 and unchanged level of Cl- during
fasting was reported. This may be due to difference of the study setting. In line with our
findings, the level of Na+ and K+ were not affected significantly (83).
Generally, lent fasting of Ethiopian Orthodox Christians affected several parameters
significantly. The variation of our findings from previous studies conducted among Greek
Christians fasting, Ramadan fasting, Adventists fasting and catholic fasting may be
attributed to differences in study setting, the type and period of fasting, type of food
avoided during fasting period and environmental variations.
49
7. CONCLUSION
This study was an effort to assess effect of Ethiopian orthodox Christians fasting of two
months’ period on some metabolic syndrome indices.
Ethiopian orthodox Christians fasting has a considerable effect on those metabolic indices
changing various parameters. It is observed that, anthropometric parameters like weight,
Body mass index, Waist circumference and Hip circumference were significantly
decreased during fasting season indicating that fasting is beneficial for weight loss and
combating against metabolic syndrome.
Systolic blood pressure was decreased during fasting period while diastolic blood
pressure and pulse rate were remained unchanged.
The fasting also caused significant change in lipid profiles decreasing multiple
biochemical parameters which again shines green light on using fasting as a strategy to
fight disorders caused by increased consumption of fats specifically animal fats.
Fasting affected the serum electrolytes which was not significant in Na+ and K+, and
significant in Ca+2 and Cl-.
In general, Ethiopian orthodox Christian fasting was found to causes significant
alterations of biochemical parameters and our study findings were very congruent to
findings of different studies carried among Greek orthodox Christians.

50
8. Strengths and Limitations of the study
The study assessed the effect of religious fasting to metabolic syndrome indices and level
of serum electrolytes and therefore will serve as a baseline for future studies.
The study used participants selected through non-probability sampling method, and thus
may affect the external validity of the findings. However, the study used a within-subject
design that helped see changes before and after fasting. This study didn’t check for
the geographical and seasonal factors that may affect the results. Data were collected
during different season one in autumn (April) and the other summer (June) and thus, the
result may be affected by environmental variations (weather condition).
51
9. RECOMMENDATION
This study found that Ethiopian Orthodox Christians fasting has considerable effect on
Metabolic syndrome indices and level of serum electrolytes and therefore:
- Ethiopian Orthodox Christians Church is recommended to intensify teaching its
believers the benefit of fasting regarding health in addition to that of spiritual
relevance.
- Researchers are recommended to undertake this kind of study with wide ranges
of parameters.
- All stake holders are also recommended to carry out extensive behavioral change
communication and life style modification promotion; including decreasing the
consumption of animal source foods.

52
References
1. Amanda J Baxter BAppSc, Terry Coyne and Christine McClintock. Dietary patterns
and metabolic syndrome - a review of epidemiologic evidence. 15, Brisbane: Quens land
institute of medical research, Asia Pac J Clin Nut, 2006, 2, 134-142.
2. Trepanowski JF, Robert EC, Kate EM, Mohammad MK and Richard JB. Impact of
caloric and dietary restriction regimens on markers of health and longevity in humans and
animals: a summary of available findings. 107, memphis: bmc, 2011,10.
3. Valter DL and Mark PM. Fasting: Molecular Mechanisms and Clinical Applications. 2,
Los Angeles: NIH, February 4, 2014, Cell Metab, 19, 181–192
4. Expert Panel on Detection, Evaluation, and Treatment of High Blood Cholesterol in
Adults. Executive summary of the Third Report of the National Cholesterol Education
Program (NCEP) Expert Panel on Detection, Evaluation, and Treatment of High Blood
Cholesterol in Adults (Adult Treatment Panel III). JAMA. 2001; 285: 2486–2497.
5. Ozsahin AK, Gokcel A, Sezgin N,Prevalence of the metabolic syndrome in a Turkish
adult population. Diabetes Nutr Metab. 2004 Aug;17(4):230-234.
6. Trepanowski JFand Bloomer RJ. The impact of religious fasting on human health. Nutr
J. 2010; 9:57.
7. Sarri KO, Tzanakis NE, Linardakis MK, Mamalakis GD and Kafatos AG. Effects of
Greek Orthodox Christian Church fasting on serum lipids and obesity. BMC Public
Health. 2003; 3:16.
8. Morcos NY, Seoudi DM, Kamel I and Youssef MM. Effect of Coptic Orthodox
Christian church fasting on healthy and diabetic subjects. Int J Nutr Pharmacol Neurol Dis
2013;3:375-82.
9. Shatenstein B and Ghadirian P. Influences on diet, health behaviors and their outcome
in select ethno cultural and religious groups. Nutrition 1998; 14(2):223-30.
10. Friedlander Y, Kark JD, Kaufmann NA and Stein Y. Coronary heart disease risk
factors among religious groupings in a Jewish population sample in Jerusalem. Am J Clin
Nutr 1985; 42(3):511-21.

53
11. Friedlander Y, Kark JD and Stein Y. Religious observance and plasma lipids and
lipoproteins among 17-year-old Jewish residents of Jerusalem. Prev Med 1987; 16(1): 70-
79.
12. Maislos M, Khamavsi N, Assali A, Abou-Rabiah Y, Zvili I and Shany S. Marked
increase in plasma high-density-lipoprotein cholesterol after prolonged fasting during
Ramadan. Am J Clin Nutr 1993; 57:640-2
13. Temizhan A, Donderici O, Ouz D and Demirbas B. Is there any effect of Ramadan
fasting on acute coronary heart disease events? Int J Cardiol 1999; 70(2):149-53
14. Mansi KMS. Study the Effects of Ramadan Fasting on the Serum Glucose and Lipid
Profile among Healthy. Jordanian Students. American Journal of Applied Sciences 2007;
4 (8): 565-569.
15. Thannoun AM and Mahmoud ES. Effect of Fasting in Ramadan on Blood Glucose and
Lipid Profile. Mesopotamia J of Agric 2010; 38 (2): 1-7.
16. Fraser GE. Diet as Primordial Prevention in Seventh-Day Adventists. Prev Med 1999;
29(6 Pt 2):S18-23.
17. Fraser GE. Associations between diet and cancer, ischemic heart disease, and all-cause
mortality in non-Hispanic white California Seventh-day Adventists. Am J Clin Nutr 1999;
70(3 Suppl):532S-538S.
18. WHO. The global burden of disease: 2004 update. World Health Organization Press, 20
Avenue Appia, 1211 Geneva 27, Switzerland 2008; 1-160.
19. Wai WS, Dhami RS, Gelaye B, Girma B, Lemma S, Berhane Y and et al. Comparison
of Measures of Adiposity in Identifying Cardiovascular Disease Risk Among Ethiopian
Adults. Obesity 2011; 1-9. doi:10.1038/oby.2011.103. Accessed on June4, 2017 from
URL:http://www.addiscontinental.edu.et/files/aciph_STEPS_Obesity_Paper.pdf
20. International Diabetic Federation: The IDF consensus worldwide definition of the
metabolic syndrome. 2006; Available at http://www.idf.org/webdata/docs/metabolic
syndrome.
21. Ozsahin AK, Gokcel A, Sezgin N, Prevalence of the metabolic syndrome in a Turkish
adult population. Diabetes Nutr. Metab.2004 Aug; 17(4):230-234
54
22. Ghayour-Mobarhan M, Aziminezhad M, Kazemi SM, et al. Comparing different
definitions of metabolic syndrome in Iranian population. Abstract.76th Congress of the
European Atherosclerosis Society, June 10-13, 2007
23. AusDiab Steering Committee. Diabesity & associated disorders in Australia – 2000: the
accelerating epidemic. The International Diabetes Institute, Melbourne, Australia. 2001.
24. Syndrome among US adults: findings from the Third National Health and Nutrition
Examination Survey. JAMA 2002; 287 : 356359.
25. Hu G, Qiao Q, Tuomilehto J, Balkau B, Borch-Johnsen K, 5. Pyorala K; DECODE
study group. Prevalence of the metabolic syndrome and its relation to all-cause and
cardiovascular mortality in nondiabetic European men and women. Arch Intern Med 2004;
164 : 1066-1076.
26. Arega R. (2009). Fasting in the Ethiopian Orthodox Church. Ethiopian Orthodox
Tewahdo Church Sunday School Department – Mahibere Kidusan. Accessed on June 16,
2017 from URL: http://www.eotcmk.org/site-en/index.php?option=
com_content&task=view &id=56&Itemid=1
27. Sarri K, Linardakis M, Codrington C and Kafatos A. Does the periodic vegetarianism
of Greek Orthodox Christians benefit blood pressure? Prev Med 2007; 44(4):341-8.
[Abstract]
28. Sarri K, Bertsias G, Linardakis M, Tsibinos G, Tzanakis N and Kafatos A. The effect
of periodic vegetarianism on serum retinol and alpha-tocopherol levels. Int J Vitam Nutr
Res2009; 79:271-280. [Abstract]
29. Ethiopian Census Report 2007. Accessed on june 2, 2017 from URL:
http://www.csa.gov.et/
30. Ethiopian Orthodox Church Information. Seven Official Liturgical Fasting Days,
Ethiopian Orthodox Liturgical Calendar Holy Days. Accessed on June 2, 2017 from URL:
http://www.ethiopianorthodoxchurch.info/CalanderFastsFeastsDays.html# anchor_89
31. Yu Z, Nissinen A, Vartiainen E, Song G, Guo Z, Zheng G andet al Associations
between socioeconomic status and cardiovascular risk factors in an urban population in
China. Bulletin of the World Health Organization 2000; 78(11):1296–1305.

55
32. WHO. Waist Circumference and Waist-Hip Ratio Report of a WHO Expert Consultation
Geneva, December 2008b. Accessed on June 5, 2017 from URL:
http://whqlibdoc.who.int/publications/2011/9789241501491_eng.pdf
33. Getahun W, Gedif T and Tesfaye F. Regular Khat (Catha edulis) chewing is associated
with elevated diastolic blood pressure among adults in Butajira, Ethiopia: a comparative
study. BMC Public Health 2010; 10:390.
34. Getahun W, Gedif T and Tesfaye F. Regular Khat (Catha edulis) chewing is associated
with elevated diastolic blood pressure among adults in Butajira, Ethiopia: a comparative
study. BMC Public Health 2010; 10:390.
35. Fenske JN, Van Harrison R, Jackson EJ and Marcelino MA. UMHS Lipid Therapy
Guideline Update, May 2014. Accessed July 19, 2015
from,http://www.med.umich.edu/1info/FHP/practiceguides/lipids/lipidsupdate.pdf
36. Wong ND. Epidemiological studies of CHD and the evolution of preventive cardiology.
Nature Reviews Cardiology 2014; 11:276–289. doi:10.1038/nrcardio.2014.26
37. Calle EE, Rodriguez C and Walker-Thurmond K. Overweight, obesity, and mortality
from cancer in a prospectively studied cohort of U.S. adults. N Engl J Med 2003; 348:
16251638.
38. Rabkin SW, Chen Y, Leiter L. Risk factor correlates of body mass index. Canadian
Heart Health Surveys Research Group. CMAJ 1997; 157(suppl1): S26-31.
39. World Health Organization. Obesity: preventing and managing the global epidemic.
Report of a WHO consultation. World Health Organ Tech Rep Ser 2000; 894:1-253. i-xii.
40. Despres JP, Lemieux I and Prudhomme D. Treatment of obesity: need to focus on high
risk abdominally obese patients. BMJ 2001; 322: 716-20.
41. Menke A, Muntner P, Wildman RP, Reynolds K and He J. Measures of adiposity and
cardiovascular disease risk factors. Obesity 2007; 15:785–795.
42. Lee CM, Huxley RR, Wildman RP and Woodward M. Indices of abdominal obesity
are better discriminators of cardiovascular risk factors than BMI: a meta-analysis. J Clin
Epidemiol 2008; 61:646–653.
43. Song-Ming DU, Guan-Sheng MA, Yan-Ping LI, Fang H, Xiao-Qi HU, Yang X and
et al. Relationship of Body Mass Index, Waist Circumference and Cardiovascular Risk
Factors in Chinese Adult. BMES 2010; 23: 92-101

56
44. Hsieh SD, Yoshinaga H and Muto T. Waist-to-height ratio, a simple and practical index
for assessing central fat distribution and metabolic risk in Japanese men and women. Int J
Obes Relat Metab Disord 2003; 27(5):610-6.
45. Ardern CI, Katzmarzyk PT, Janssen I and Ross R. Discrimination of health risk by
combined body mass index and waist circumference. Obes Res 2003; 11(1):135-42.
46. Janssen I, Katzmarzyk PT and Ross R. Body mass index, waist circumference, and
health risk: evidence in support of current National Institutes of Health guidelines. Arch
Intern Med 2002; 162(18):2074-9.
47. National Institute of Health. The Practical Guide. Identification, Evaluation, and
Treatment of Overweight and Obesity in Adults. NHLBI Obesity Education Initiative.
NIH Publication Number 00-4084. October 2000; 1-97. Accessed on November 5, 2014
from URL: http://www.nhlbi.nih.gov/files/docs/guidelines/prctgd_c.pdf
48. Huma S, Tariq R, Amin F and Mahmood KT. Modifiable and Non-modifiable
predisposing Risk Factors of Myocardial Infarction - A Review. J Pharm Sci & Res 2012;
4(1): 16491653.
49. Joint Editorial Statement Diabetes Mellitus: A Major Risk Factor for Cardiovascular
Disease. A Joint Editorial Statement by the American Diabetes Association; the National
Heart, Lung, and Blood Institute; the Juvenile Diabetes Foundation International; the
National Institute of Diabetes and Digestive and Kidney Diseases; and the American Heart
Association. Circulation 1999; 100: 1132-1133. doi: 10.1161/01.CIR.100.10.1132.
50. Alberti KG, Zimmet P and Shaw J. Metabolic syndrome – a new world-wide definition.
A Consensus Statement from the International Diabetes Federation. Diabet Med 2006;
23:469–480.
51. Whitney E and Rolfes SR. Understanding nutrition. 11th Edition. 2008, Thomson
Learning, Inc., ISBN-13: 978-0-495-11669-1, 10 Davis Drive, Belmont, CA 94002-3098,
USA. Page 139-169.
52. Daniels TF, Killinger KM, Michal JJ, Wright Jr. RW and Jiang Z. Lipoproteins,
cholesterol homeostasis and cardiac health. Int J Biol Sci 2009; 5(5):474-488.
doi:10.7150/ijbs.5.474.
57
53. Zimmet P, Alberti KG MM and Serrano RMA new international diabetes federation
worldwide definition of the metabolic syndrome: the rationale and the results 12, 2005,
Rev Esp Cardiol, 58, 1371-6.
54. Izet Aganović and Tina Dušek.Pathophysiology of Metabolic Syndrome. Zagreb,
Croatia: University Hospital Center, 2006.
55. Kallings L, Leijon M. and FaR. [Experiences of Prescribed Physical Activity, FaR.]
Report 2003; 53. Stockholm: Swedish: NIPH, 2003.
56. Ford ES, Kohl HW, Mokdad AH and Ajani UA. Sedentary behavior, physical activity
and the metabolic syndrome among U.S. adults. 2005: Obesity Research, 13, 608-14.
57. Laaksonen DE, Lindstrom J, Lakka TA, Eriksson JG, Niskanen L, Wikstrom K
and et al. Physical activity in the prevention of Type 2 diabetes s.l.: The Finnish diabetes
prevention study., 2005, 54, 158-65.
58. Nasser M. Al-Daghri, Nasir Uddin Khan, Khalid M. Alkharfy, Omar S. Al-Attas,
Majed S. Alokail ,Hanan A. Alfawaz, Abdulaziz Alothman and Paul M.
Vanhoutte.Selected Dietary Nutrients and the Prevalence of Metabolic Syndrome in
Adult Males andFemales in Saudi Arabia: A Pilot Study.2013, Nutrients, 5, 4587-4604.
59. Al-Nozha, M.; Al-Khadra, A.; Arafah, M.R.; AlMaatouq, M.A.; Khalil, M.Z.;
Khan, N.B.; Al-Mazrou, Y.Y.; Al-Marzouki, K.; AlHarthi, S.S. and Abdullah, M.
Metabolic syndrome in Saudi Arabia. 2005, Saudi Med. J., 26, 1918–1925.
60. Al-Daghri, N.M.; Al-Attas, O.S.; Alokail, M.S.; Alkharfy, K.M.; Sabico, S.L. and
Chrousos, G.P. Decreasing prevalence of the full metabolic syndrome but a persistently
high prevalence of dyslipidemia among adult Arabs. e12159, s.l.: PLoS One, 2010, 5.
61. Maughan RJ, Fallah J S andCoyle EF. The effects of fasting on metabolism
and performance. s.l.: Ramadan and sport, 2010, J Sports Med, 44, 490–494.
62. Seyyed Reza Attarzadeh Hosseini and Keyvan Hejazi. A Review of the Effects
of Ramadan Fasting and Regular Physical Activity on Metabolic Syndrome Indices 1,
2016, J Fasting Health, 4, 1-16.
63. Tran A, Gelaye B and Girma B. Prevalence of Metabolic Syndrome among
Working Adults in Ethiopia. 2011, International J. Hypertension.
64. Guder WG and awta B. The quality of Diagnostic Samples. 1st ed. Darmstadt:
GIT Verlag; 2001., 22-3.

58
65. Papadaki A, Vardavas C, Hatzis C and Kafatos A. Calcium, nutrient and food
intake of Greek Orthodox Christian monks during a fasting and non-fasting week. Public
Health Nutr. 2008;11(10):1022-9.
66. Sow AK, Agne FD, Tiendrébéogo AJF, Diaw M, Ouédraogo V and Toure M.
Effects of lenten fasting on body composition and biochemical parameters. Int J Res Med
Sci 2016; 4:4724-9.
67. Aksungar FB, Eren A, Ure S, Teskin O and Ates G. Effects of intermittent
fasting on serum lipid levels, coagulation status and plasma homocysteine levels. Ann
Nutr Metab. 2005;49(2):77-82.
68. Attarzadeh Hosseini SR, Motahari Rad M and Hejazi K. The effects of
Ramadan fasting and physical activity on body com ects of Ramadan fasting and physical
activity on body composition and hematological biochemical parameters. J Fasting Health,
2014;2(3): 96-103.
69. Paul AK, Khan MA and Fariduddin M. Effect of Ramadan fasting on
anthropometric measures and metabolic profiles among type 2 diabetic subjects. J Enam
Med College. 2015; 5(2):93-8.
70. Kamal S, Ahmad QS, Sayedda K and Haque M. Effect of Islamic fasting on
lipid profile, total protein and albumin on healthy Muslim male subjects of Shri Ram Murti
Samrak institute of medical sciences, bareilly, uttar pradesh. Nat J Med Res. 2012;
2(4):407-10.
71. Salahuddin M and Javed MH; Effects of Ramadan on some physiological and
biochemical parameters in healthy and hypertensive subjects in Aurangabad district of
Maharashtra: India, JFH, 2014;2(1): 7-13.
72. Deguitte F, Jouanel P, Begue RJ, Colombier M, Lac G and Pequignot JM.
Food restriction, performance, biochemical, physiological and endocrine changes in Judo
athletes. Int J sports med 2006:27(1): 38-48.
73. Bernieh B, Boobes Y and Alhakim MR. Fasting Ramadan in kidney patients is
safe. Saudi J Kidney Dis transpl. 2009;20(2): 198-200.
74. Nieman DC Dietary status of seventh- day Adventist vegetarian and non-
vegetarians’ elderly women. J Am Diet Assoc 1989, 89(12): 1763-9.

59
75. Samad F, Qazi F, Pervaiz MB, Kella DK, Mansoor M and Osmani BZ. Effects
of Ramadan fasting on blood pressure in normotensive males. J Ayub Med coll
Abbottabad. 2015;27(2): 338-42.
76. Barnand ND. Effectiveness of low fat vegetarian diet in altering serum lipids and
in health premenouposal women. Am J cardiol 2000, 85(8): 969-72.
77. Nicholson AS. Toward improved management of NIDDM: a randomized,
controlled, pilot intervention using a low fat vegetarian diet. Prev med 1999; 29(2): 87-
91.
78. Toohey ML. Cardiovascular disease risk factors are lower in African American
vegans compared to lacto-ovo-vegetarians: J Am coll. Nutr; 1998,17(5): 425-34.
79. Haddad EH. Dietary intake and biochemical, hematological and immune status
of vegans compared with non-vegetarians. Am J clin Nutri; 1999, 70(3): 5865-5935.
80. Azizi F. Research in Islamic fasting and health. Ann Saudi Med. 2002;22(3-4):
186-91
81. Miladipour AH, Shakhssalim N, Parvin M and Azadvari M. Effect of
Ramadan fasting on Urinary risk factors of calculus formation. Iran J Kidney Dis.
2012;6(1): 33-8
82. Sarri K, Linardakis M, Codrington C and Kafatos A: Does the periodic
vegetarianism of Greek Orthodox Christians benefit blood pressure? Prev Med 2007,
44:341-348.
83. Sarri KO, Linardakis MK, Bervanaki FN, Tzanakis NE and Kafatos AG:
Greek Orthodox fasting rituals: a hidden characteristic of the Mediterranean diet of Crete.
Br J Nutr 2004, 92:277-284. 154.
84. Sarri KO, Kafatos AG and Higgins S: Is religious fasting related to iron status
in Greek Orthodox Christians? Br J Nutr 2005, 94:198-203.
85. MillanJ, PintoX, MunozA, ZunigaM, Rubies-Prat J, Pallardo LF and et al.
Lipoprotein ratios: Physiological significance and clinical usefulness in cardiovascular
prevention. Vasc Health Risk Manag 2009; 5: 757–765.
86. Nigam PK. Serum Lipid Profile: Fasting or Non-fasting? Ind J Clin Biochem
2011; 26(1): 96–97. DOI10.1007/s12291-010-0095-x

60
87. Alvarez C and Ramos A. Lipids, lipoproteins and apolipoproteins in serum
during infection. Clin Chem1986; 32: 142–145.
88. Nawaz H, Comerford BP, Njike VY, Dhond AJ, Plavec M and KatzDL.
Repeated serum lipid measurements during the peri-hospitalization period. Am J Cardiol
2006; 98(10):1379-82.
89. Campose H, Khoo C and Sacks FM. Diurnal and acute pattern of postprandial
apolipoprotein B-48 in VLDL, IDL and LDL from normolipidemic human.
Atherosclerosis 2005; 181: 345–51.
90. NCEP: Third report of the national cholesterol education program (NCEP) expert
panel on detection, evaluation, and treatment of high blood cholesterol in adults (Adult
Treatment Panel III) final report. Circulation 2002;106(25):3143-3421.
91. National Institute for Health and Clinical Excellence (NICE). 3rd Ed. NICE,
Mid City Place, 71 High Holborn, London WC1V 6NA. 2012; 185-195. Retrieved
November 22, 2014, from: http://www.nice.org.uk/article/pmg4/resources/non-guidance-
methods-for-thedevelopment-of-nice-public-health-guidance-third-edition-pdf
92. Brown KW, Cozby CP, Kee DW and Worden PE. Research Methods in
Human Development. 2nd ed, Mayfield Publishing Company, 1280 Villa Street, Mountain
View, California 94041. 1999; 216-227. Accessed on June 10, 2017, from URL:
https://www.csusm.edu/psychology/docs/ResearchMethodsInHumanDevelopment.pdf
93. Ellis MV. Repeated Measures Designs. The Counseling Psychologist 1999;
27(4): 552578.
94. Cunningham JB and McCrum-Gardner E (2007) Power, effect and sample
size using GPower: practical issues for researchers and members of research ethics
committees. Evidence Based Midwifery 2007; 5(4): 132–6.
95. McCrum-Gardner, E. Sample size and power calculations made simple.
International Journal of Therapy and Rehabilitation, January 2010; 17(1): 10-14.
96. GPower Version 3.1.9.2. Program written by Franz Faul, Universitak Kiel,
Germany. Copyright (C) 1992-2014. Accessed on June 12, 2017 from URL:
http://www.gpower.hhu.de/fileadmin/redaktion/Fakultaeten/Mathematisch-
Naturwissenschaftliche_Fakultaet/Psychologie/AAP/gpower/GPowerWin_3.1.9.2.zi
97. Thalheimer W and Cook S. How to calculate effect sizes from published
research articles: A simplified methodology. A Work-Learning Research Publication.

61
2002;1-9. Retrieved June 13, 2017 from
http://www.bwgriffin.com/gsu/courses/edur9131/content/ Effect_ Sizes_pdf5.pdf
98. Sullivan GM and Feinn R. Using Effect Size or Why the P Value Is Not Enough.
Journal of Graduate Medical Education. 2012 September; 279–282.
Doi:http://dx.doi.org/10.4300/JGME-D-12-00156.1 Accessed on June 12, 2017 from:
http://www.ncbi.nlm.nih.gov/pmc/articles/PMC3444174/pdf/i1949-8357-4-3-279. pdf
99. Cohen J. A power primer. Psychological Bulletin. 1992; 112(1): 155-159. Retrieved
June13, 2017 from URL: http://drsmorey.org/bibtex/upload/Cohen:1992.pdf
100. Sarraf-Zadegan N, Atashi M, Naderi GA, Baghai AM, Asgary S, Fatehifar
MR and et al. The Effect of Fasting in Ramadan on the Values and Interrelations
between Biochemical, Coagulation and Hematological Factors. Ann Saudi Med 2000;
20(5-6):377-381.
101. Ha RR and Ha JC.Integrative Statistics for the Social and Behavioral Sciences,
Introduction to Hypothesis Testing, Two-Sample Tests, SAGE Publications, Inc,
ISBN: 141298744X. 2012; 145-182. Accessed on June 10, 2017, from:
http://www.sagepub.com/upmdata/40287_Chapter9.pdf
102. World Health Organization. Chronic diseases and health promotion. STEPwise
approach to surveillance (STEPS). STEPS Manual. Geneva, World Health
Organization; 2008. Accessed on April 3, 2017, from URL:
http://new.paho.org/hq/dmdocuments/2009/ STEPSmanual.pdf

62
Annex I: - CONSENT FORM
Code of study subject ______________________________________
I have been informed about a study plan that is entitled with “the effect of Ethiopian
Orthodox Christians “Abiy tsom” (lent fasting) on metabolic syndrome indices and level
of serum electrolytes” and for this purpose some information and blood sample will be
taken from me. The aims of this study were explained to me. Collection of the sample
would follow the usual procedure for laboratory investigation but there might be some
pain that is associated with the blood collection.
I am also informed that all the information contained within the questionnaire is to be
kept confidential. Moreover, I have also been well informed of my right to keep hold of
information, decline to cooperate and make myself withdraw from the study. I have been
informed that laboratory results will be disclosed to me whenever the result is ready and
incase the result had any pathological indication, I am told that I will be linked to
appropriate place for further diagnosis and treatment.
It is therefore with full understanding of the situation that I gave the informed consent
voluntarily to the researcher to use the specimen taken from me for the investigation.
Moreover, I have had the opportunity to ask questions about it and received clarification
to my satisfaction.
Signature (participant)_______________________ Signature(investigator)_________
Witness name_____________________________ Signature ________________

63
Annex III: Questionnaire
I. Socio- demographic characteristics
1. Study participant identification number_________________________________
2. Date of interview__________________________________
3. Place of interview__________________________________
4. Age (in year) _____________
5. Gender 1. Male 2. Female
6. Educational Status ___________________________________
7. Marital Status ___________
8. Address ____________________________________________
9. Household wealth income_______________________________
II. Previous medical related conditions
1) Have you diagnosed with any of the following diseases previously?
A. Diabetes
B. Hypertension
C. Cardiac vascular diseases
D. Renal diseases
E. Liver disease
F. Other, specify__________________________
2) Have you any previous surgical history?
A. YES
B. NO
3) Have you taken any medications recently? If yes,
specify____________________
III. Dietary and behavioral related questions

64
1. Would the person use the following items, if so how frequent?
a. Alcohol Frequently Sometimes Never
b. Smoking Frequently Sometimes Never
c. cigarette Frequently Sometimes Never
d. Chat Frequently Sometimes Never
2. What was your most utilized food type during this fasting period?
Specify________
3. Which of the following resembles your fasting situation of this period?
A. Abandon all type of animal source foods since the beginning of fasting
period and daily consumed non animal source foods as usual.
B. Abandon all type of animal source foods and restrict all food daily up
to 6:00 local time
C. Abandon all type of animal source foods and restrict diet daily up to
9:00 local time
D. Other, specify. _____________________________
IV. Anthropometric measurements
A) Body weight______________________________________
B) Height___________________________________________
C) Body mass index___________________________________
D) Waist circumference ________________________________
E) Hip circumference__________________________________
F) Systolic blood pressure_______________________________
G) Diastolic blood pressure______________________________

65
Annex III: - Laboratory test result
1. Fasting glucose___________________________________
2. High density lipoprotein____________________________
3. Low density lipoprotein_____________________________
4. Total cholesterol____________________________________
5. Triglyceride________________________________________
6. Total protein________________________________________
7. Urea______________________________________________
8. Na+ _______________________________________________
9. K+________________________________________________
10. Ca +2 ______________________________________________
11. Cl-________________________________________________

66
Annex IV. DECLARATION
I, the undersigned, declare that this thesis is my original work and that all sources of
materials used for the thesis have been dully acknowledged.
Name: Chala Kenenisa
Signature: _____________________ Date: ________________________

67
Annex V: Ethical Clearance