Embed Size (px)
Citation preview
.. \ .
:-1,'
THE EFFECT OF FASTENER PITCH'..'
IN LONG STRUCTURAL JOINTS
by
Roger M. Hansen
This work has been done in conjunction with the' Large Bolted J.oints Project
. at Lehigh University· which is sponsoredfinanc.ially by the Pennsylvania Department of Highways, Bureau of Public Roads,and the American Institute of Steel Con- 'struction, and in· an advisory capacity bythe Research Council on Riveted and BoltedStructural Joints •.
Fritz Engineering LaboratoryDepartment of Civil Engineering
Lehigh UniversityBethlehem, Pennsylvania
May 196~
Fritz Engineering Laboratory Report No. 271.17
fRITZ ENGINIERO~G LABORATORY~~t~ LEHIGH UNIVERSITY ;
BE~HLEHEM, PENNSYLVANIA
·.~::-
{)
TABLE OF CONTENTS
SYNOPSIS
Page
1. INTRODUCTION 1
1.1 General 1
1.2 Review of Literature 1
1.3 Objective of Thesis 4
2. THEORETICAL SOLUTION 5
2.1 Origin 5
., 2.2 Development of Equilibrium Equation 5l
2.3 Development· of Compatibility Equations 7
2.4 Calibration Procedures 9
2.5 Solution of Equations 11
3. BEHAVIOR OF LONG BOLTED JOINTS 14I" .\
3.1 Theoretical and Experimental Work 14
3.2 Other Experimental Work Related tothe Variation of Pitch 16
..
4. BEHAVIOR OF LONG RIVETED JOINTS
4.1 Application of Theory
4.2 Theoretical and Experimental Work
19
19
19

Page
"5. THEORETICAL AND EXPERIMENTAL RESULTS 23
5.1 Connector Forces 23
5.2 Ultimate Strength and UnbuttoningFactor 25
5.3 Bolt Deformation 28
5.4 Distribution of Connector Forces 29
5.5 Comparison of Ductility 30
6. SUMMARY AND CONCLUSIONS 32
1
7. NOMENCLATURE
8. ACKNOWLEDGMENTS
35
36a
9. TABLES AND FIGURES 37
Table 5.1 38
Figure 2.1 to Figure 2.9 39
Figure 3.1 to Figure 3.2 46
Figure 4.1 .to Figure 4.2 48
Figure 5.1 to figure 5.11 50
'10. LIST OF REFERENCES 61
"
..

SYNOPSIS
This paper is a detailed report of a theoretical
study of ten hypothetical long structural joints. Four
of the joints were fabricated and tested and the data
from these tests are used to check the theoretical re
sults. The joints were fabricated ofA7 steel and
fastened with Al4l rivets or A325'bolts. The major
variables were fastener pitch and joint length. Com
parisons of the riveted and bolted connections are
-also presented.
An additional series of three A7 steel joints
fastened with A325 bolts were tested. In this series
pitch was the main variable and the results of these
tests are used to verify conclusions of the theoretical
study.
-")
'J
1. INTRODUCTION
1.1 General
One of the many variables affecting the behavior of
structural connections is the spacing of the fasteners parallel
to the direction of the applied load. This spacing is commonly
called the pitch. Some investigations have been concerned
with the effect of fastener spacing on the behavior of the(1) .
connected material but the important factor in this case is
the transverse spacing, called the gage. The pitch plays a
secondary role in cases where the material failure may be a
tear along a sawtooth line through holes of the first and
second rows.
In the case of fastener performance, pitch plays a more
important part. The design specifications of the American
Institute of Steel Construction(2) include a section on the
spacing of rivets which is of interest at this point. The
minimum allowable pitch is set by such things as clearance,
driving conditions and fabrication technique. Also, there is
a maximum pitch for compression members which is set to preventI
local buckling in built up members. However, there is no
-1-
,
-2
provision for maximum pitch in tension members and it would
be possible to. design a connection with the fasteners at a
twelve-inch pi~ch or more.
Silence on this subject might lead one to believe that
the pitch, or overall length of a joint (which is a summa
tion of the pitch distances) has no influence on the behavior
of such a connection. Some would say that there should be
no concern, because a rivet possesses enough ductility to
transfer load for any joint configuration. However, this
reason has not been substantiated adequately by test.
When design specifications were being prepared for the
high strength bolt, a question arose as to whether the bolt
was ductile enough to allow similar assumptions..it·.wss
reasoned that increased strengths are often achieved by
sacrificing ductility. To answer this, experimental investi-
gations were initiated at Lehigh University to evaluate the
behavior of long bolted connections. Further tests of
similar riveted connections were to provide comparative data
about the two types of fasteners. In these tests of full size
structural joints the number of fasteners in line was varied
but the pitch (with one exception) was always held constant.
~,
..
-3
1.2 Review of Literature
A search of the literature shows that in both riveted
and bolted connection research~3,4,5) a reduction in average
fastener shear strength has been observed to be associated
with increased joint length. This strength reduction is
called the "unbuttoning" phenomena. However, from these
tests it was impossible to quantitatively evaluate the un-
buttoning effect because of the influence of other variables.
The Lehigh University program has been able to provide quanti~
tative information as well as qualitative results from long
bolted joint tests~6,7,8) Some comparison tests have been
done with long riveted jOints~9)
A number of theoretical explanations of joint behavior
have also been proposed but unfortunately most of these deal
with joints in the elastic range and are not applicable to
ultimate strength studies.
The most extensive work relating to the ultimate strength
of connections was that done for the Aluminium Development(10)
Association of England. Although this work pertained to
aluminum connections with aluminum or steel rivets, it is
of great value in understanding the mechanics of joint behavior
..
-4
beyond the elastic range. The effect of pitch was discussed.
A portion of the Lehigh University program has been the
development of an analytical solution for the post elastic
behavior of steel joints joined with high strength bolts~ll~
This solution has been used to predict successfully the ultimate
strength of joints-tested in the experimental part of the pro-
gram. The method can be used for a theoretical analysis of
the effect of varying pitch without the necessity of an ex-
tensive full scale test program.
1.3 Objective of the Thesis
It has been shown that there is a lack of information
on the effect of pitch and what its contribution to unbutton-
ing phenomena is. Because unbuttoning is vitally important in
long connections, there is a definite need for data on its
effects. Nor are there provisions in design specifications
which account for or control pitch as related to unbuttoning.
The objective of this thesis is to utilize the theoretical
solution(ll) to study the effects of varying pitch, to compare
these results with a limited number of tests of large bolted
joints, and to make general recommendations for the control
of pitch in design practice.
~.
..
-5
2. THEORETICAL SOLUTION
2.1 Origin
The method of theoretical investigation was presented
(11)previously and most of the explanations and developments
offered in this chapter have appeared in the original paper.
Important equations and developments are repeated in con-
densed form for convenience of reference and to support the
validity of results obtained•
2.2 Development of Equilibrium Equation
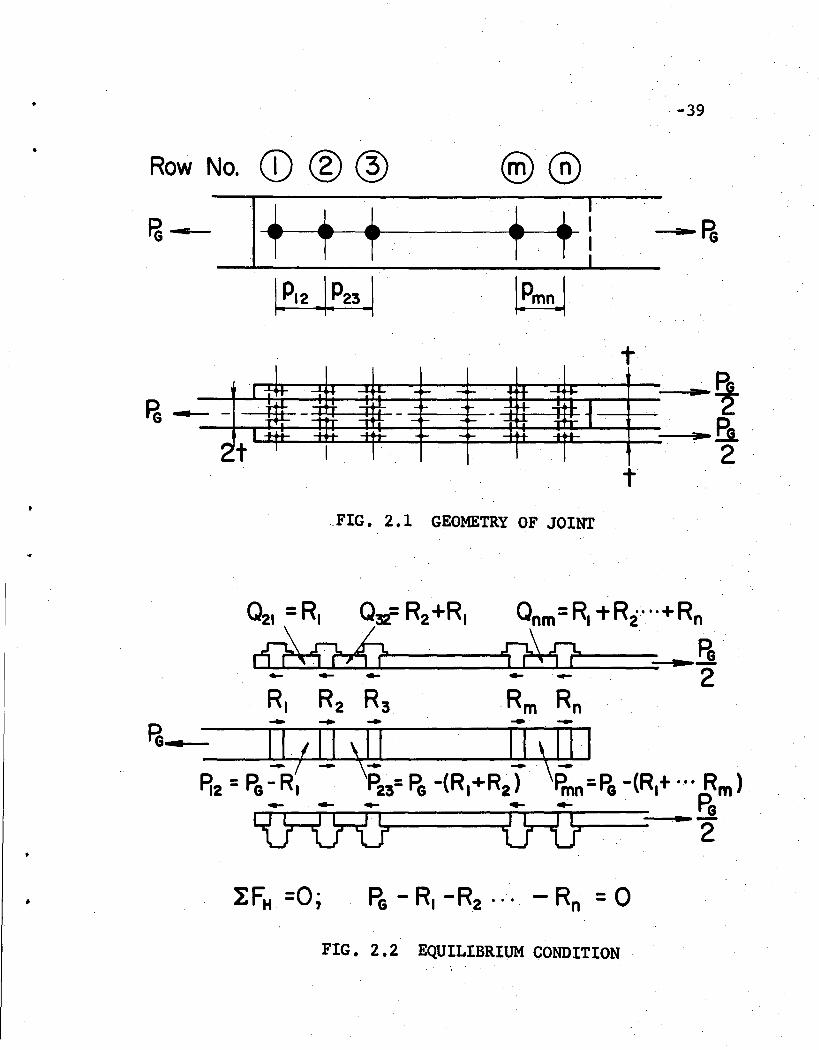
.The connection to be dealt with is an axially loaded,
double shear, butt type tension splice (Fig. 2.1). The
analysis will deal with a single gage strip only since it
has been shown that the capacity of a large joint, PJ , is
equal to the sum of the loads, PG, carried by each gage strip.
The joint has two outer or lap plates, both of thickness t,
and an inner or main plate of thickness 2t.
Each pitch is designated by a subscript of the numbers
of the bolts on either side of that pitch, bolts being numbered
•
-6
1 to n from the free end of the lap plate. Prior to slip
the holes are aligned through the plies of each plate. The
hole diameter, dR' is larger than the fastener diameter,
dB' by an amount c, the hole clearance (usually 1/16" for
structural connections).
The ultimate load of.a bearing type connection is
assumed as independent of the slip behavior of the joint.
Therefore the joint is assumed to be assembled in bearing
(slipped condition). Behavior where load is transferred by
friction is regarded as nonessential to the study of the
effect of variable pitch on behavior near ultimate load •
The bolt is loaded by bearing on each plate and transfers
that load across the plane of shear via the shear resistance
of its shank. The total load carried by any bolt is equal
to the force transferred out of the main plate by that bolt.
Figure 2.2 indicates the bolt forces and the forces acting
in the various regions of the main and lap plates.
Taking either the main plate or the lap plates as a free
body (Fig. 2.2), the equilibrium equation for forces in the
horizontal direction is written as follows:
L FH = PG -Rl - R2 • • • -Rn = 0 (2.1)
-7
To solve for these forces, n-l additional, independent equa
tions are needed. These will come from deformation condi~
tions.
2.3 Development of Compatibility Equations
Certain reference points are set up to help develop the
n-l deformation equations required in solving for the un
known bolt forces. The plate reference points are shown in
Fig. 2.1 as solid dots. These points are on the edges of
the gage strip at the centerline of each aligned hole.
When the inner and outer plate~ move with respect to one
another, the hole reference points are m~saligned by an amount
called the hole offset, b. Connections assembled in bear
ing with no applied load will have all hole offsets equal
to c, the hole clearance. As load is applied, the hole
offsets are no longer equal because each pitch elongates a
different amount.
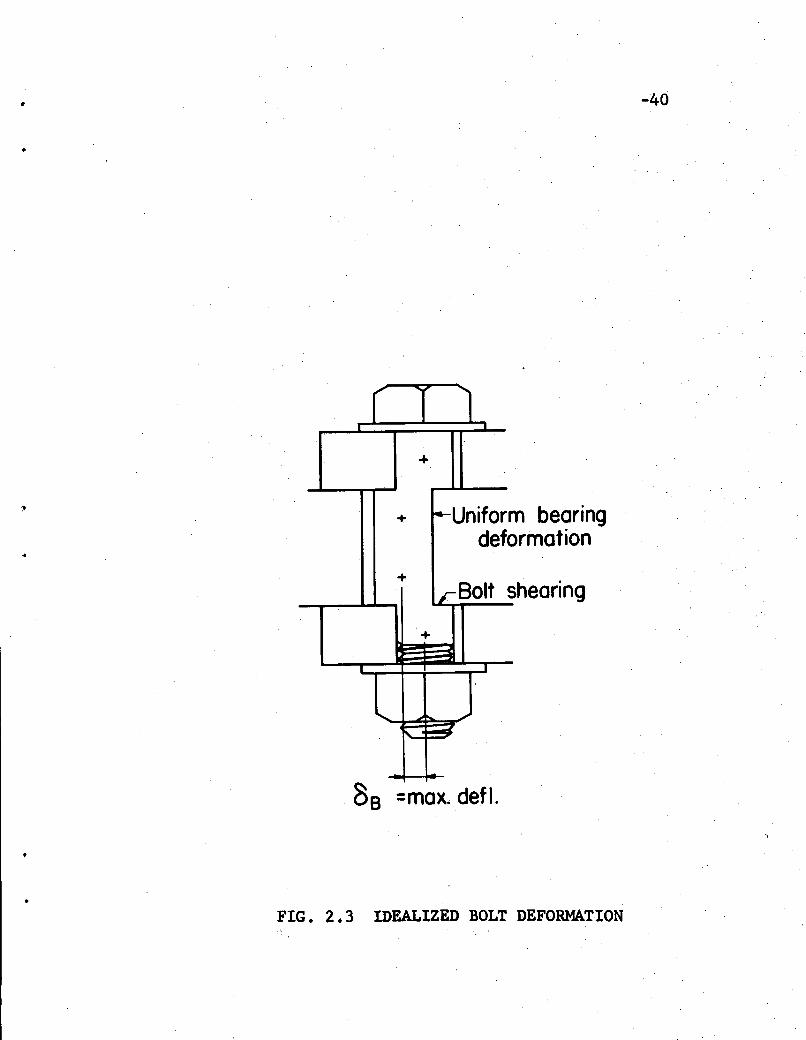
The hole offsets, ~, are not equal to the bolt deforma
tion. It is clear that whe~ slip occurs the hole offsets
equal the hole clearanc.e, c, but the bolts have no deforma
tion. The bolt deformation, actually due to shearing and
bending is idealized as shown in Fig. 2.3.
-8
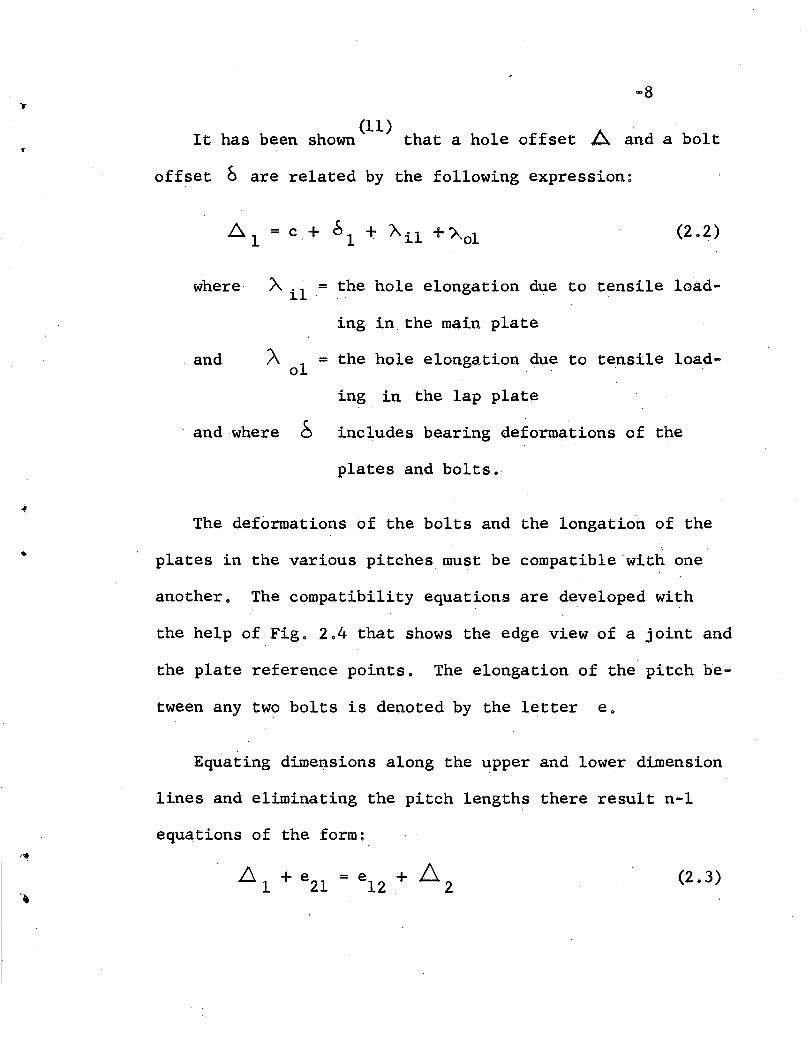
It has been shown (11) that a hole offset A and a bolt
offset 0 are related by the following expression~
(2.2)
where·
and
Ail = the hole elongation due to tensile load-
ing in the main plate
:A = the hole elongation due to tensile load-01
ing in the lap plate
•
and-where b includes bearing deformations of the
plates and bolts.
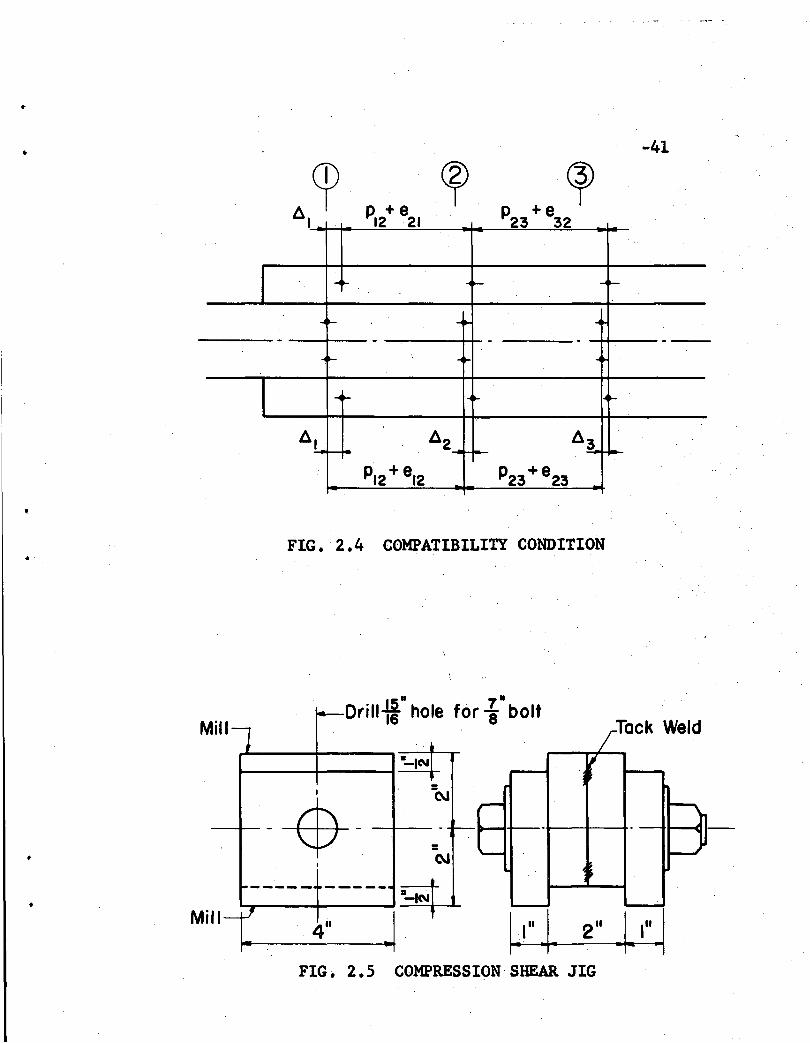
The deformations of the bolts and the longation of the
plates in the various pitches. must be compatible with one
another. The compatibility equations are developed with
the help of Fig. 2.4 that shows the edge view of a joint and
the plate reference points. The elongation of the pitch be-
tween any two bolts is denoted by the letter e.
Equating dimensions along the upper and lower dimension
lines and eliminating the pitch lengths there result n-l
equations of the form~
~ + e 2l = e + ~1 12 . 2(2.3)
•
-9
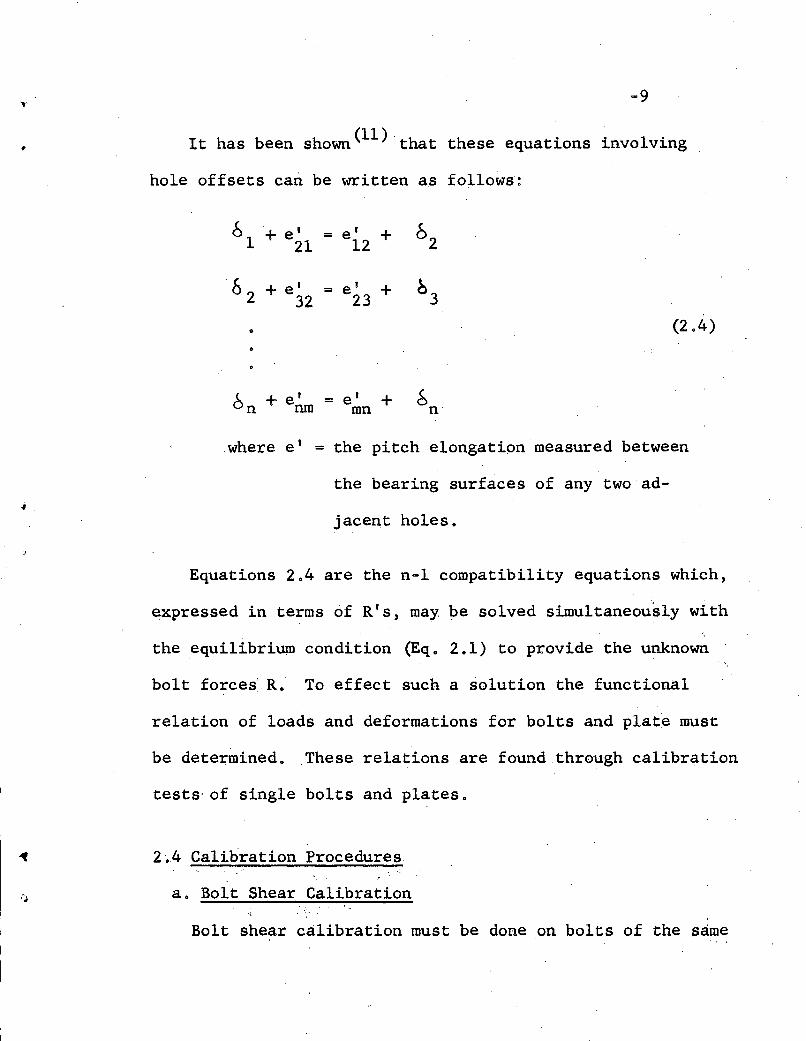
It has been shown (11) that these equations involving
hole offsets can be written as follows:
61 + e' = e' + 6
221 12
6 + e' = e' + 032 32 23
0 (2.4)
<.. + e' = e' + bon run mn n
where e' = the pitch elongation measured between
the bearing surfaces of any two ad-
jace£\t holes.
Equations 2.4 are the n-l compatibility equations which,
expressed in terms 6f R's, may be solved simultaneously with
the equilibrium condition (Eqo 2.1) to provide the unknown
bolt forces' R. To effect such a solution the functional
relation of loads and deformations for bolts and plate must
be determined. These relations are found through calibration
tests· of single bolts and plates~
2.4 Calibration Procedures
a. Bolt Shear Calibration
Bolt shear calibration must be done on bolts of the same

Y'-10
dimensions, basic properties, and heat treatment as those
used in a prototype joint. Because the bolt offset and
bearing deformations alw~ys occur together, they are lumped
together in the quantity called the "calibration bolt off-
set", /).
A. single hole connection called a shear jig is used to"
shear the bolt. The shea~ jig sliown in Fig. 205 was loaded
in a testing machine and corresponding deformations or
"calibration bolt offsets" were determined from the relative
movement of the testing machine heads. Further explanations
of the test procedure may be found in Refs. 11 and 12.
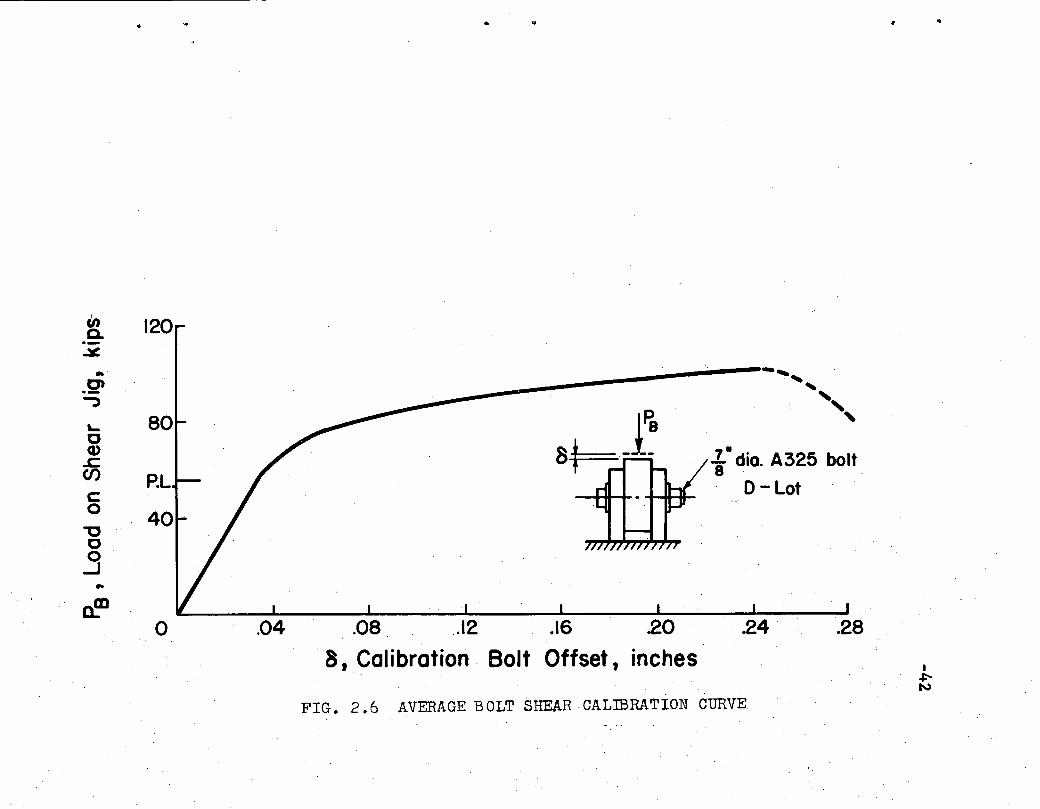
An average of results of bolt shear calibration forD-
(12)Lot bolts' is plotted in Fig. 2.6. This curve provides
the relationship between bolt offset and load.
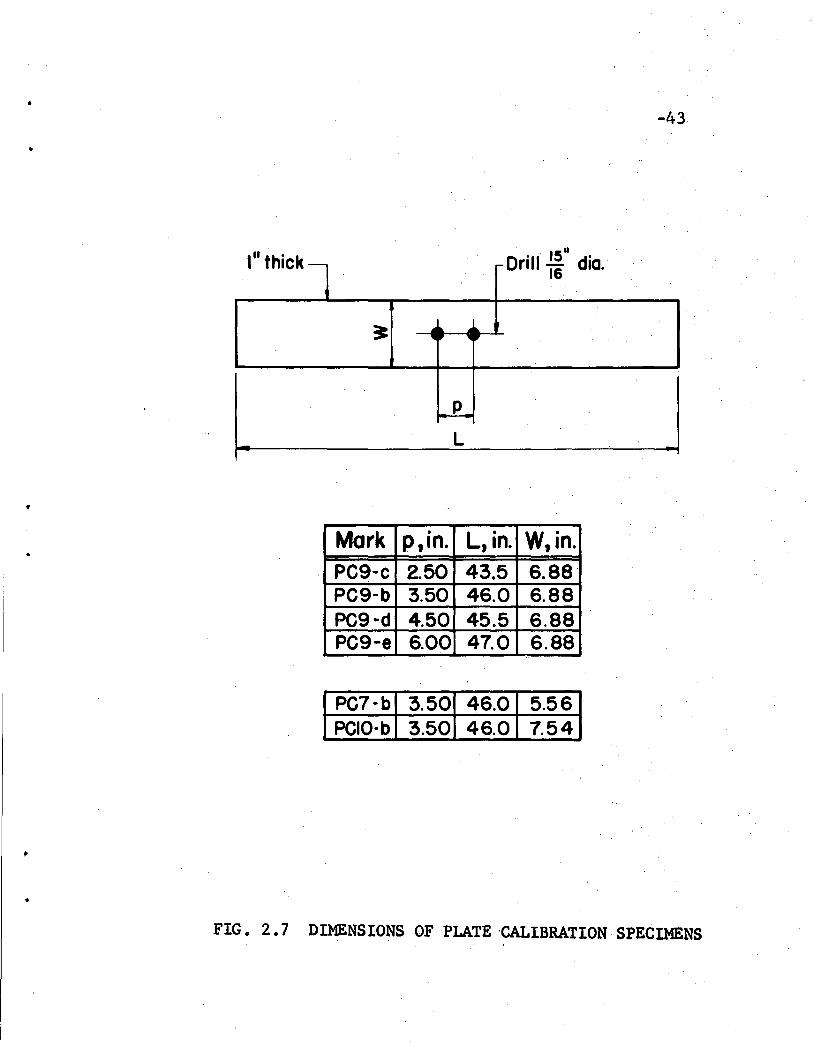
b. Plate Calibr.ation
Plate calibrat;:ion is done by testing a duplicate section
of one gage strip and recording the tension - elongation
behavior of one pitch length. Since the load is uniform
along the length, the quantity e' is equal to the value of
e.

•
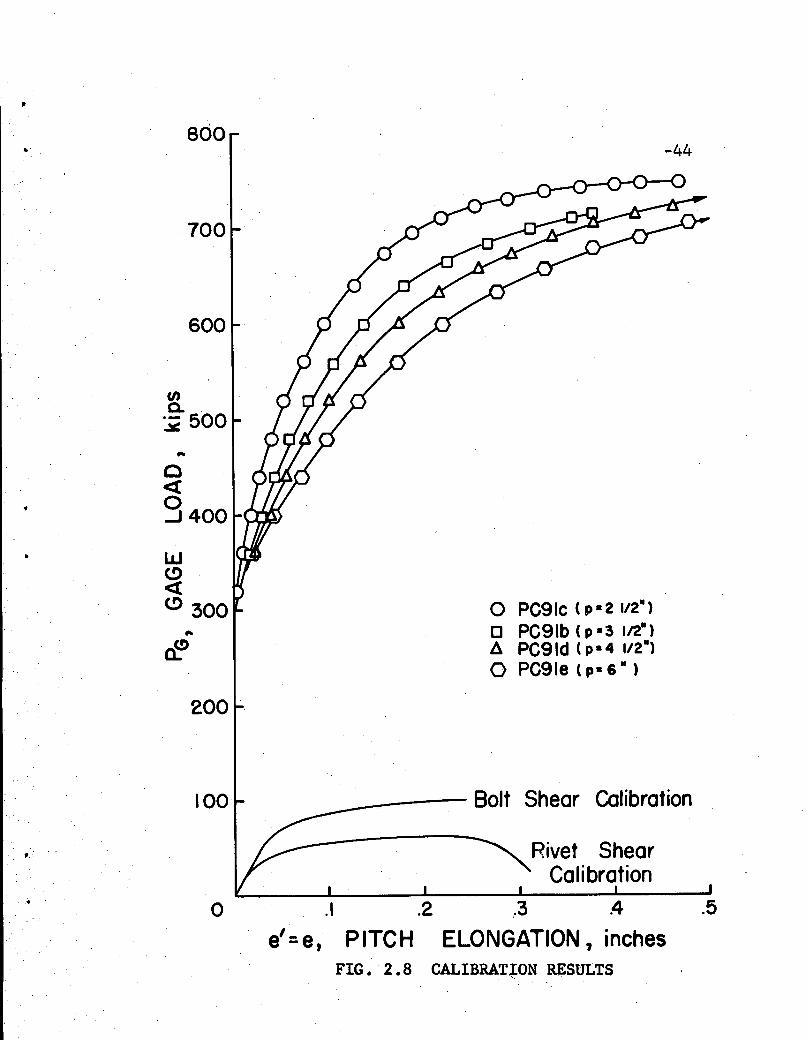
-11
The dimensions of the plate calibration specimens are
tabulated in Fig o 207. The main arid lap plates of the proto-
type joints were always two one-inch plies so the load on
the calibration test specimen was doubled to give the load
PG for the two inch stripso The results are plotted in Figo
205 Solution of Equations
Knowing the load-deformation relations for bolts and
plates, one may procede with a graphical trial and error
solution of forces within the hypothetical joint o Since
the joint is symmetrical, one need only solve for one-half
of the joint though the solution may be continued through
the,entire connection o An illustrabion of the method is
shown in Fig o 2.9 using ass~ed calibration curves o
,The plate and bolt calibration curves are plotted to the
same scale on a large sheet of graph pap~ro The plate curve
is traced on a sheet of transparent paper and~verted as
shown in Fig o 2090 The inverted curve corresponds to the
main plate,M, in the connection and its origin is set at\
the ordinate, PG (the desired gage load) •
1
I
•
-12
For an assumed value of Rl (the first bolt in the con
nection), the corresponding bolt offset, <:S l' is determined
from the bolt calibration curve, B. The elongation of the
first pitch in the lap plate, e2l , is read for the same
ordinate since the load in that pitch is Rlo 'This ordinate
also corresponds to the inverted ordinat~ (PG - Rl), which
is the load carried by the main p~ate in the first pitch,
and the main plate elongation, e l2 , may be read fromM.
Thus, the dimensions above and below the horizontal line
represent the compatibility condition (Eq. 2.4) andb2 may
be determined"algebraically •
. ,With a known 02 ' R2 is read from B and the sum of R2
and Rlis laid off as an ordinate. The pitch elongations
e 23 and e32
are found at this ordinate and R3 is -determined
f~om 63 • This procedure is continued to the center of t~e
joint.
The sum of the bolt forces, R, are compared with one ...half
of the gage loaci, PG
I2, and these should be equal in arder to
satisfy the equ~libriUm condition (Eq.2.l). The difference of
the two represents one half of the total error in equilibrium
and the, original ,assumption for Rl should be modified accordingly.

r
•
-13
With a new value of ~l' the solution is repeated until theL
error is within acceptable limits o

•
•
•
-14
3. BEHAVIOR OF LONG BOLTED JOINTS
3.1 Theoretical and Experimental Work
A theoretical and experimental program was planned ,to
study the effect of pitch on bolted joints. A series of
hypothetical joints were designed with pitch as the only
variable. These hypothetical joints were investigated by
the theoretical method described in Chapter 2 and made use
of the plate calibration specimens described previously •.
The theoretical connections were designed with the object
that available exp~rimental work could be used to validate
results.
3.11 Description of Hypothetical Joints.
Four hypothetical bolted joints were analyzed to obtain
information about the effect of pitch. Each joint had nine
bolts in line but the pitch varied from joint to joint being
2-1/2", 3-1/2", 4-1/2" and 6". Other features of the joints
held constant were width, thickness, fastener size, and hole
diameter.
The four hypothetical joints were designed for .~ tension
shear ratio, T/S, of 1:1.10. Each joint was four inches thick,

-15
33.2%
28.4 ksi
60.0 ksiUltimate Tensile Strength
Elongation in 8 Inches
being made up of four A-7 steel plates one-inch thick and
13.78 inches wide. Plate material (plate calibration stock)
had the following average properties.
Static Yield Level
•
The joints were assumed to be fastened with 7/8 inch
diameter four-inch grip A325 bolts having regular semi
finished hexagon heads. The bolts would be installed in
15/16 inch diameter clearance holes drilled simultaneously
through the four,plies of material. The properties of the
bolt lot assumed for the theoretical analysis were as follows:
Ultimate tensile strength,on stress area l.20.5 ksi
Ultimate shear strength 83.2 ksi
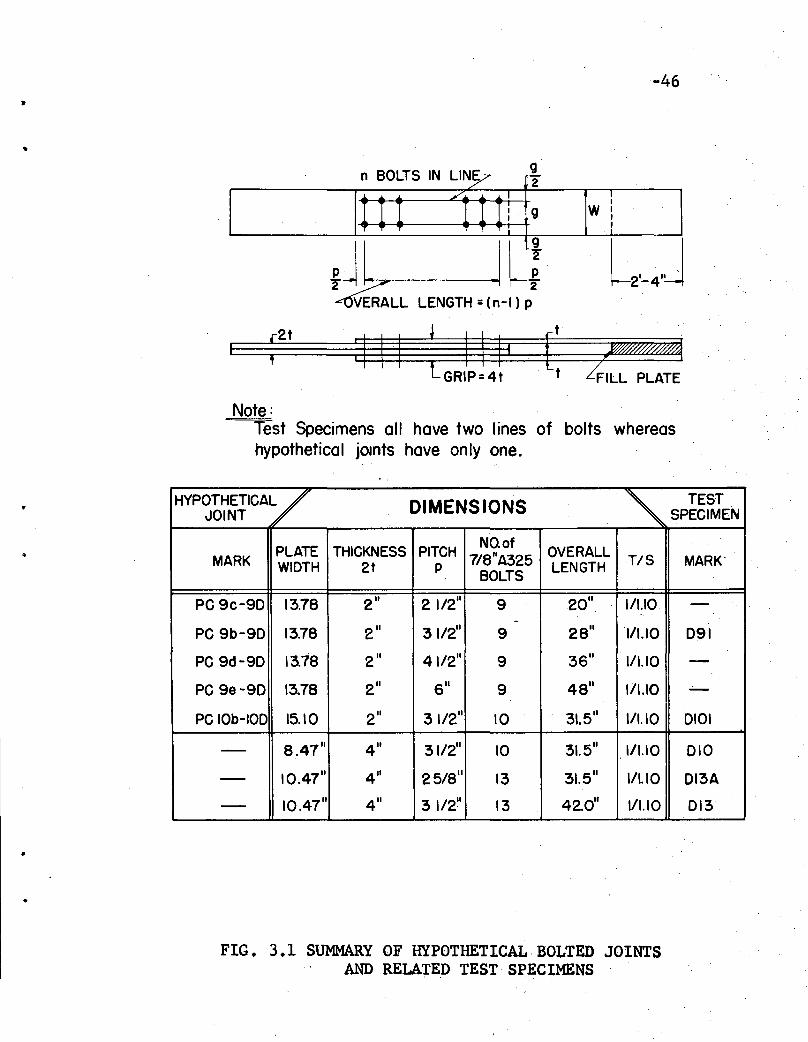
~ systematic notation, illustrated inFig~ 3.1, wa~ used
to distinguish the hypoth~tical joints. Consider'the join'!:
PC9d-9D. ,The' symbol PC signifies tiult this is a hypothetical
joint analyzed through, the use of a plate calibration specimen.
The 9 means that the net section of the plate calibration
is for a joint having nine 7/8 inch bolts in line designed
at a T/S of 1:1.10. The letter ddenotes the pitch while the
•
•
•
-16
9D means that the imaginary joint had nine D-Lotbolts in
line.
3.12 Prototype Testing
One joint, D9l, was actually fabricated and tested.
This specimen was identical to the h~pothetical joint PC9b-9D
except that it had two lines of nine bolts each. Failure of
D9l occurred when a single end bolt unbuttoned at a test
load of l358k (avg. bolt shear stress = 62.8 ksi). It is
assumed that the bolts in this connection possessed the
average strength of single D-Lot bolts tested in double
she.r~ 85.3 ksi. Detailed descriptions of this test will be
found in Ref. 11.
3.2 Other Experimental Work Related to the Variation of Pitch
Ultimate strength data is available from three tests of
long bolted joints whose results(8) are useful in a study
of the effect of pitch. These were double shear splices
with two lines of 7/8 inch diameter, regular head, A325 bolts
(Fig. 3.1). One specimen; D10, had ten rows of bolts while
the others, D13 and D13A,had thirteen. The specimens, D10,
D13A and D13 differed· fr~m D9l in that they were fabricated
of eight one inch plates.

•
•
-17
The bolts, designated the C-Lot, had an average ten-
si1e strength of 53.5 kips. Shear tests of these bolts
showed an average ultimate shear strength of 91 ksi. The
plate material used was from the same heat and ingot as the
plate used in 091.
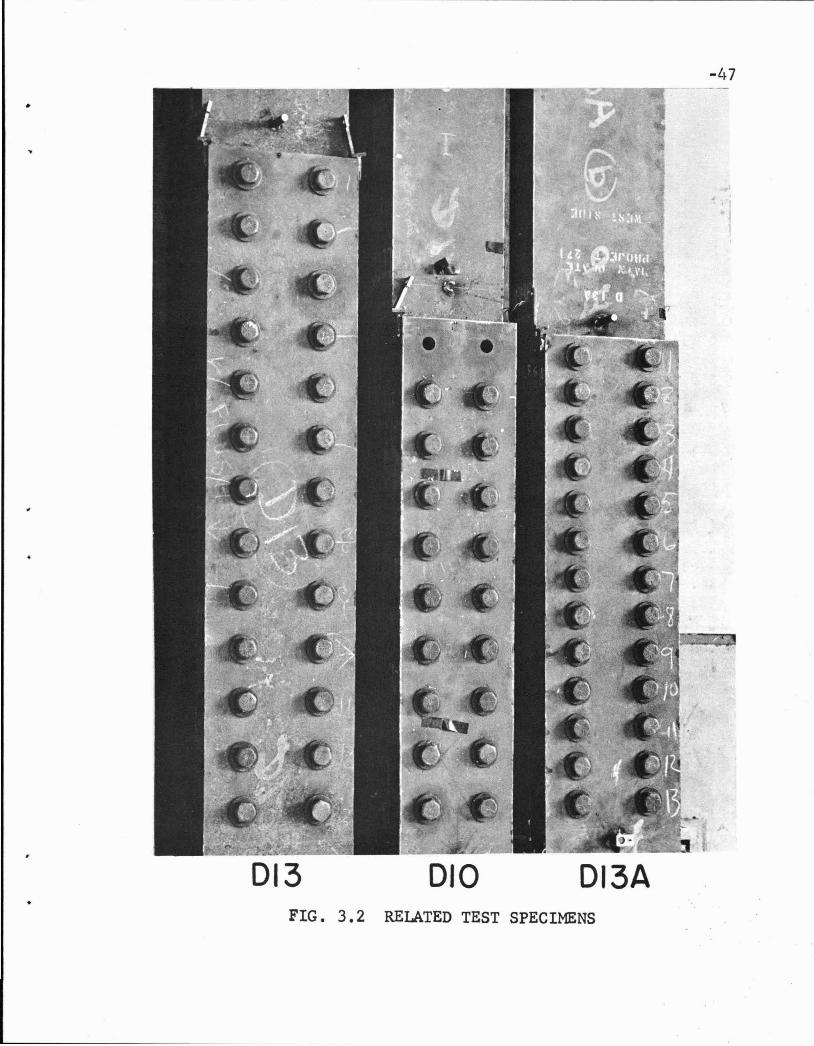
The joints 010 and 013 were fabricated at a pitch of
3-1/2 inches but the joint 013A had a pitch of 2-5/8 inches
(equal to three times the bolt diameter), the minimum a11ow-
able under AISC specifications. With these dimensions D10:
and 013A were equal in overall length, that is, center-to-
center of end fasteners. This resulted in a brief set of
tests which would concisely show the effect of pitch (Fig.
3.2): 010 and 013A were equal in overall length; 013A and
013 had equal numbers of pitches; while 010 and 013 would
define the end points of the unbuttoning phenomena for the
three tests.
The three tests resulted in the following:
JOINT ULTIMATE LOADAVG.BOLT
SHEAR STRESS
010 1544k 64.23 ksi
013A 1988k 63.61 ksi
• 013 1854k 59.33 ksi
~.
,j....,.
•
-18
An additional specimen, D10l, was tested and complete
theoretical analysis was avaiLable from previous work~ll)
This joint had two lines of ten D-Lot bolts each and failed
by unbuttoning a single end bolt at a test load of l506k
(avg. bolt shear = 62.6 ksi).·
•
•
..,19
4. BEHAVIOR OF LONG RIVETED JOINTS
4.1 Application of Theory
With slight modifications, the semi-graphical analysis
described may also be used for riveted joints. A bolt and
rivet behave in a similar manner except that the rivet is
.assumed to entirely fill the hole and no slip is possible.
Thus, the value of c in Eq. 2.2 would be zero. Actually,
the rivet in some cases does not entirely fill the Qole and
$lip may take place.
Because the effects of slip are regarded as nonessential
to ultimate strength behavior, the same equs:tions apply to
riveted joints as did bolted joints a~d analysis proceeds
accordingly.
4.2 Theoretical and Experimental Work
The balanced design tension-shear ratio for. A7 plates
fastened by A141 rivets is 1/0.75. A hypothetical joint can
be devised using the plate calibration specimen PC9b and
thirteen 7/8 inch rivets in line that will have T/S equal
to 1/0.16.
'.
-20
A second theoretical program was i~troduced to" study
the effect of pitch on riveted joints. Using the plate
calibration work, several hypothetical joints 'were analyzed
by theoretical means. Additional test specimens were
fabricated and tested as part of the general research pro
gram. The results of theoretical and experimental work were
arranged to show comparative degrees of validity.
4.21 Description of Hypothetical Joints
Five hypothetical riveted joints were analyzed to obtain
information.about the effect of pitch. Four joints had
thirteen rivets in line and one had ten rivets in line. All
were designed at T/S equal to 1/0.75. Using the platecalibra
tion specimens described these hypothetical riveted joints
were similar to the series of theoretical bolted joints.
The joints were assumed to be fastened with 7/8 inch
diameter four-inch grip ASTM-A14l rivets installed in 15/16
inch diameter holes. The properties of these DR lot rivets
were as follows:
Ultimate tensile str,ength 57.7 ksi
Ultimate shear strength 52.9 ksi
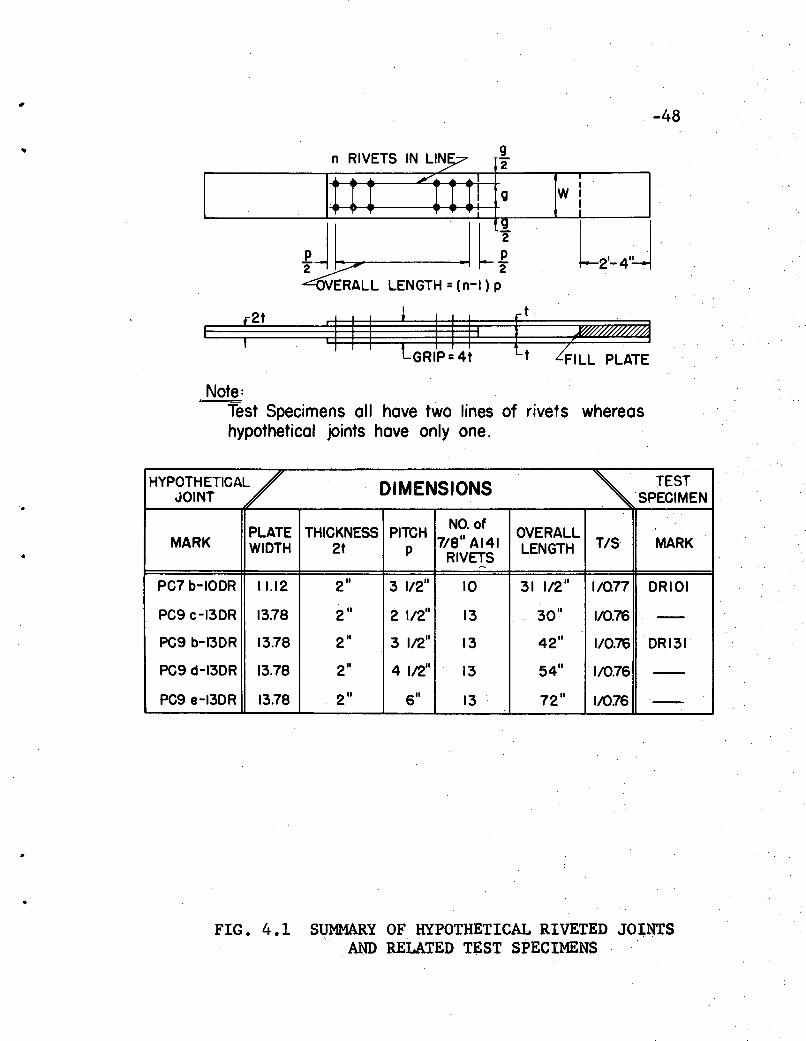
A similar notation system, illustrated in Fig. 4.1, was
•
•
-.
-21
used to distinguish the hypothetical joints. The specimen
PC9c-13DR was analyzed using plate calibration specimen PC9c
and thirteen DR-Lot rivets. P~oporttons of other joints
conform to this notation.
4.22 Prototype Testing
Two joints,DR10land DR13l, were fabricated and tested •
-These specimens had two lines of ten and thirteen 7/8 inch
diameter A14l rivets and were similar to hypothetical joints
PC7b-10DR and PC9b-13DR respectively.
Riveted shear jigs were fabricated at the same time as
the joints to provide calibration specimens whose post-driven
properties were the same as the fasteners in the connection.
An average shearing load vs. deformation curve is shown in
Fig. 4.2. The average ultimate double shear strength of these
- rivets was 52.9 ksi. Coupons cut from undriven rivets gave
an average ultimate tensile strength of 57.7 ksi (further
•
-22
details are available in Ref. 9). Failure of both joints'
took place whe~ single rivets unbuttoned at the following
loads:
JOINT
DR101
DR131
FAILURELOAD
942 kips
1216 kips
AVG .NOM~
SHEAR STRESS
39.2 ksi
38.9 ksi
•
..
-23
5. THEORETICAL AND EXPERIMENTAL RESULTS
5.1 Connector Forces
5.11 Bolted Joints
The effect that pitch has on connector forces in bolted
joints will be shown with the aid of Fig. 5.1 and Fig. 5.2.
The abscissa is the bolt force, R, and the ordinate is the
total load on the joint, PG• Considering PC9c-9D, one can
see that after the plate reaches its net section yield load,
Rl increases more rapidly. The remaining bolts continue to
carry increasing loads at a rate of increase similar to that
in the completely elastic phases of stress. However, as
plates begin yielding farther and farther through the con-
nection, each bolt in turn reaches a point beyond which load
is added at a much faster rate.
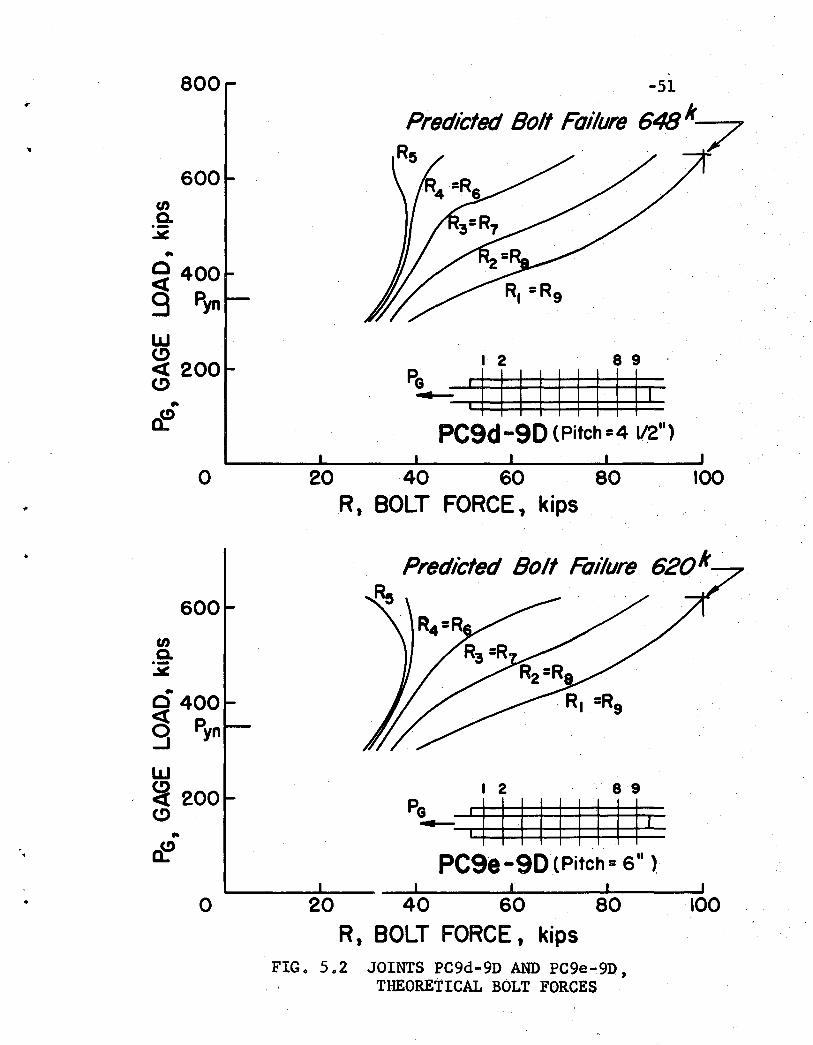
Comparing the remaining three joints in which the pitch
is increased from the 2-1/2" to 6" the same general behavior
is observed although there is some difference in the behavior
of those bolts at the center of the connection. Inthe
connections having larger pitch distances, the difference
in strains in the outer pitches increase very rapidly causing
the end bolts to pick up load faster. Thus, the load carried
-- ..
•
-24
by the inner bolts reaches a maximum and then begins to fall
off as is shown in Figs. 5.1 and 5.2.
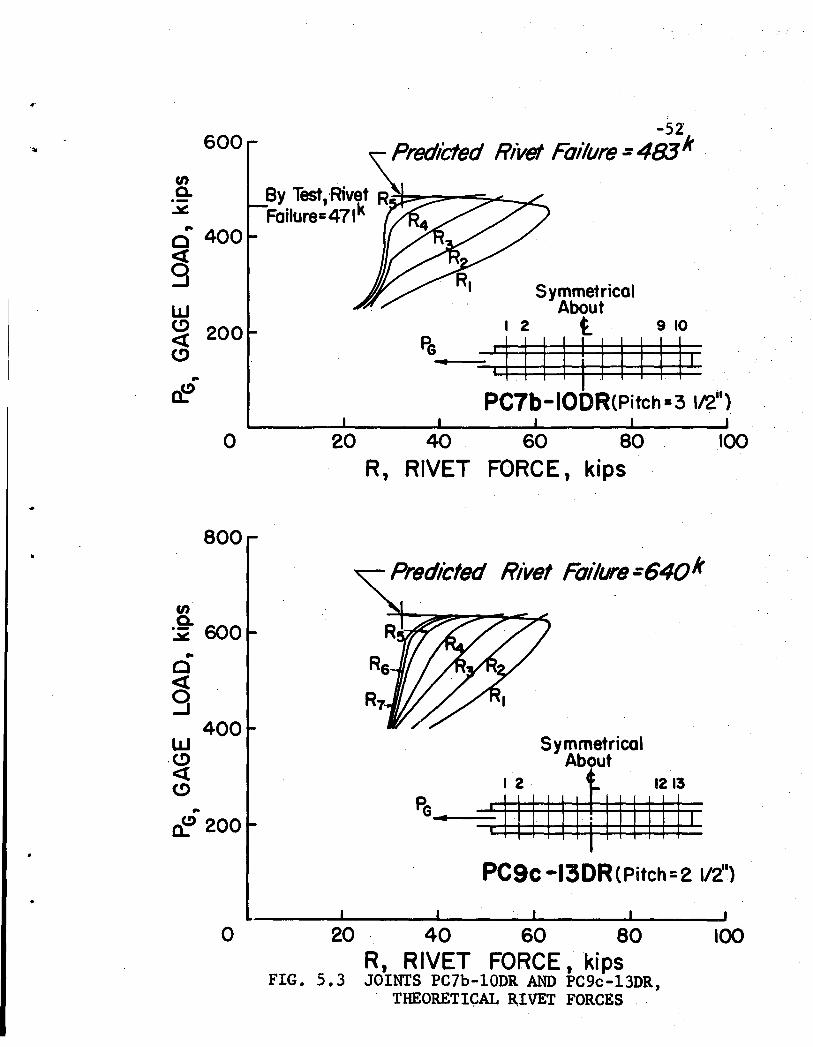
5.12 Riveted Joints
Figure 5.3 is a comparison of two riveted joints that
are similar in overall length.but which have different
numbers of fasteners. The joint PC7b-10DR, with ten rivets
at a 3-1/2" pitch, has an overall length of 31.5" compared
to 30.0" for the joint PC9c-13DR which has 13 rivets at a
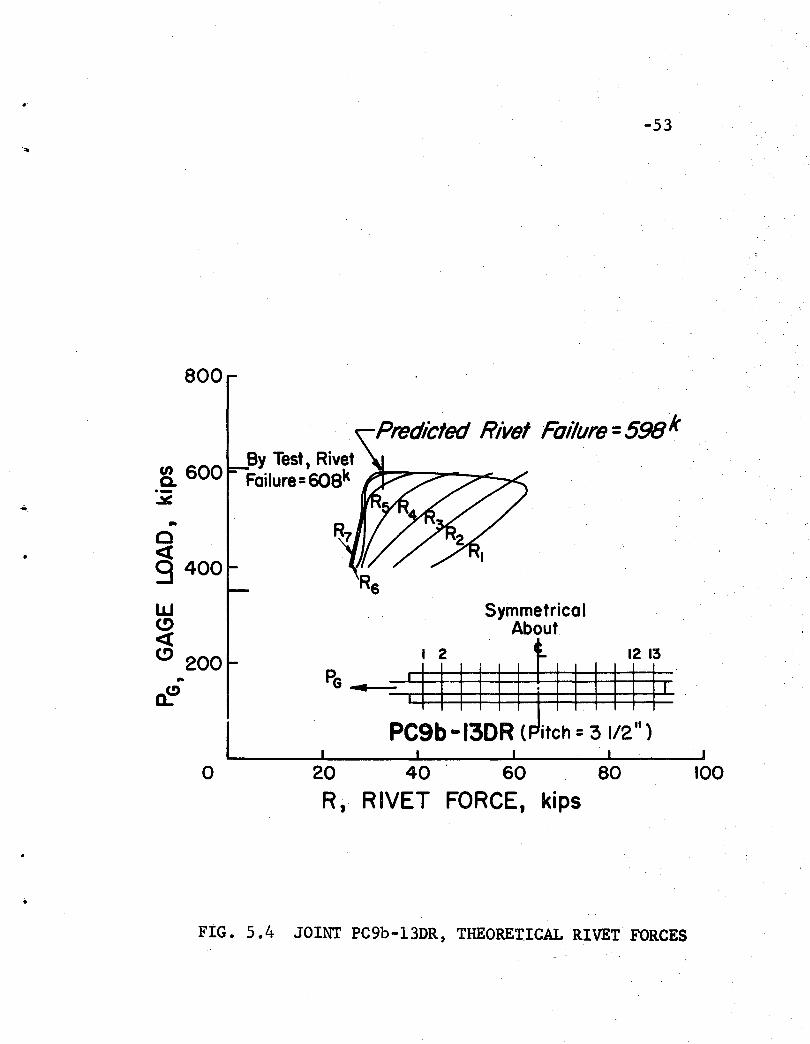
2-1/2" pitch. In contrast, Fig. 5.4 shows the rivet forces
in a third joint, PC9b-13DR, which has 13 rivets at a 3-1/2"
pitch.
Figures 5.3 and 5.4 demonstrate the disparity of rivet
loads within a connection. ,The distribution is similar to
that seen in bolted joints but one outstanding difference
is evident. The end rivet reaches a maximum load and then
falls off; whereas in a bolted joint the end fastener reaches
a maximum load and ruptures almost immediately. Because the
end rivet unloads in this manner, there is a sharp change
in curvature of the load lines near ultimate for the other
rivets in the joint. This results when the remaining fasteners
must assume the additional load thrown off by the end rivet.
•
•
•
-25
The reason for the difference of the bolted and riveted
joints is apparent from the shear calibration curves of the
individual fasteners (Fig. 4.2). These are average curves
and the rivet is shown to fracture at a calibration offset
of about 0.31 II. This deformation is reached after the rivet
passes its ultimate strength and begins to unload. Actually,
the fracture deformation varies somewhat from rivet to rivet
and is significantly affected by the rate of loading. .De-
forming the rivet slowly enough, it is possible to cause
fracture at loads as low as five kips or less. This behavior
makes ultimate strength predictions more difficult for
riveted joints.
The bolt is more sensitive to rate of deformation and
the deformations associated with ultimate and rupture loads
are almost equal.. At the loading rates used in tests of
large prototYl">e specimen"s the end bolt would rupture very
close to its ultimate strength so the theoretical analysis
used the calibration curve shown in Fig. 4.2_•
5.2 Ultimate-Strength and Unbuttoning Factor
It is convenient to non-dimensionalize the ultimate
strength of a connection in terms of the strength of a single

•
-26
fastener. That is, the average nominal shear stress at fail-
ure, 't' , is divided. by the shear strength of a singleavg
fastener, ~l' to produce the unbuttoning factor, U.
u = 'ravg1"1
This unbuttoning factor may also be thought of as a measure
of the connection's efficiency or ability to develop the
potential strength of its fasteners. The ultimate strengths
and unbuttoning factors for all joints are summarized in
Table 5.1 •
In a connection with·a given number of fasteners, the
ultimate strength will decrease as the pitch is increased.
The ultimate strength of PC9c-9D is 720 kips while that of
PCge-9D is 620.0 kips. This is a reduction of 13.9% caused
by increasing the pitch from 2-1/2" to 6"~ The excellent
correlation between predicted ultimate strength and actual
fa~lure load for D9l (PC9b-9D) gives some indication of the. .. (11)
validity of the theoretical analysis. . ..
The thi~teen fastener riveted connections with pitches
of 2-1/2, 3-1/2, 4-1/2, 6" (Table 5.1) show variations of
ultimate loads similar to those in bolted connections. For
..
these joints there is a 13.8% reduction in strength due to
an increase in pitch from 2-1/2" to 6".
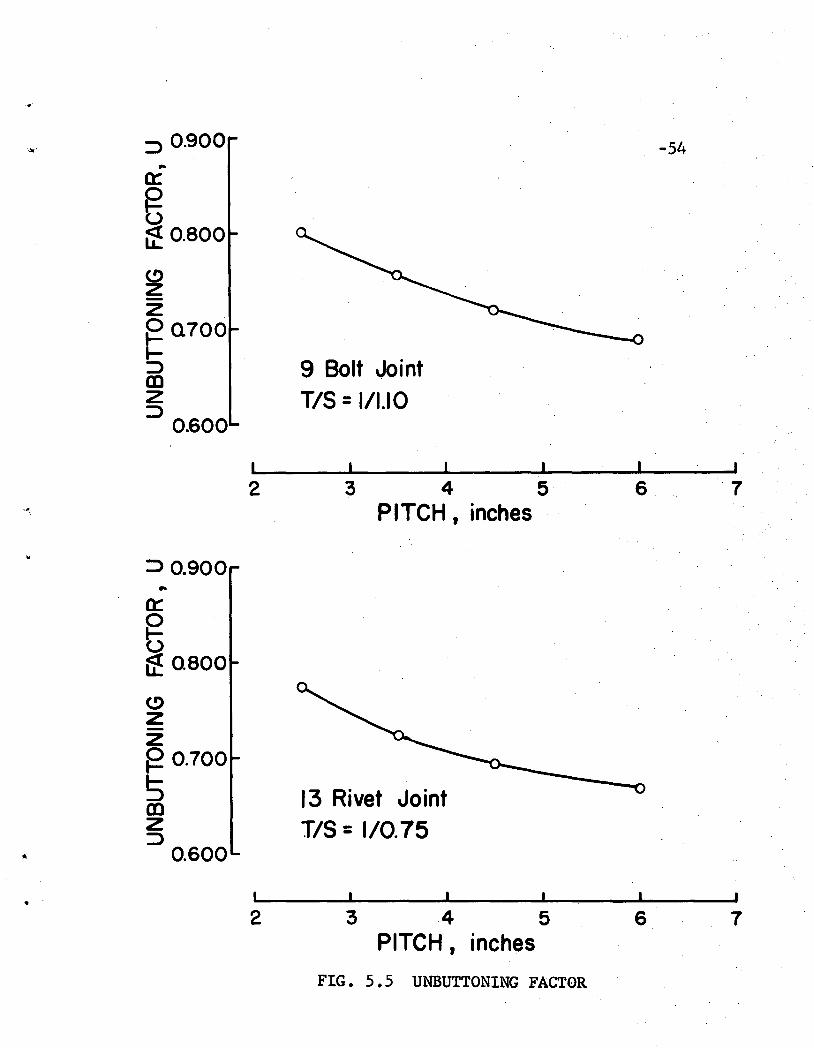
Figure 5.5 compares the g~neral behavior of a nine-
fastener bolted joint 'and a thirteen fastener riveted joint
,where pitch is v~riable. The abscissa is the pitch and the
ordinate the unbuttoning factor. It is apparent from this
figure that the general effect of pitch is similar in nature
in riveted and bolt~d connections.
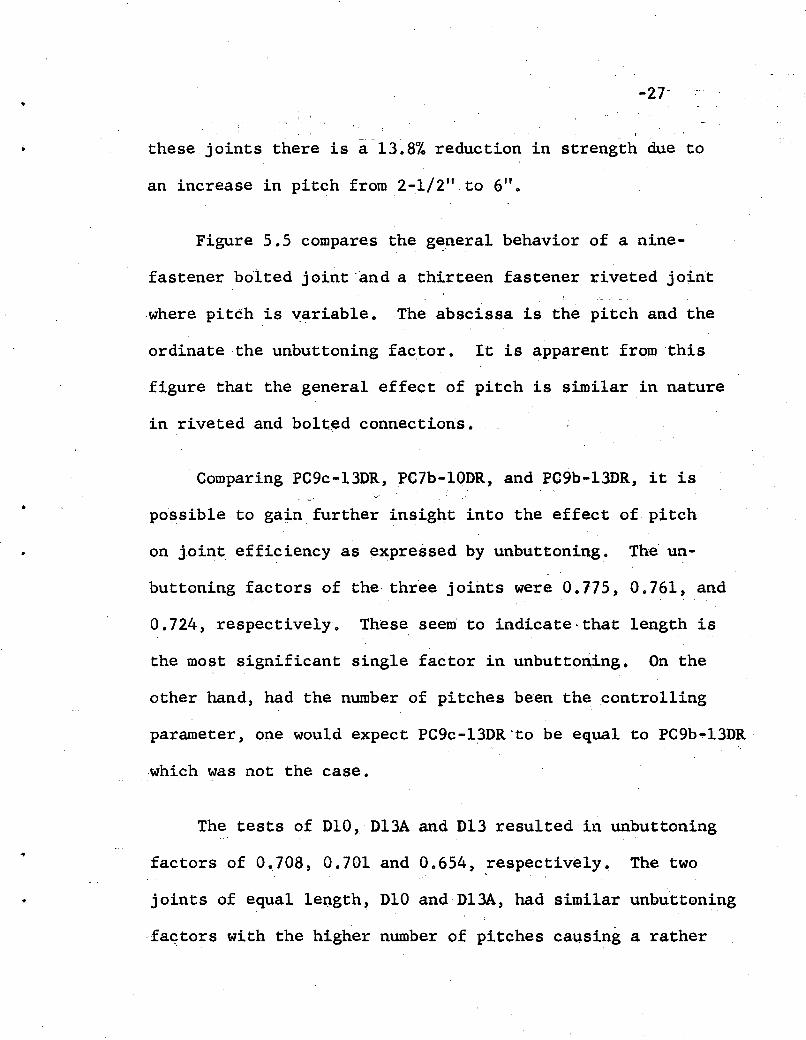
Comparing PC9c-13DR"PC7b-10DR, and PC9b-13DR, it is.~"
possible to ga~n further insight into the effect of pitch
on Joint efficiency as ~xpressed by unbuttoning. The un-
buttoning factors of the three joints were 0.175, 0.761, and
0.724,respectively. These seem to indicate", that length is
the most significant single factor in unbuttoning. On the
other hand, had the number of pitches been the controlling
parameter, one would expect PC9c-l?DR'to be equal to PC9b-13DR
which was not the case.
The tests of D10, Dl3A and D13 resulted in unbuttoning
factors of 0.708, 0.701 and 0.654, ~espectively. The two
joints of equal leQgth, D10 and D1JA, had similar unbuttoning
·fa9tors with the higher number of pitches callsing a rather

-28
slight reduction in efficiency. Where either length or pitch
is significantly differe~t, comparison shows a wide variance
in unbuttoning behavior.
Noting the many possible combinations of results, one
can make the following generalization. The ultimate strength
of a joint is not determined by the number of pitches alone.
It does, however, depend upon the product of the pitch dis-
tance and total number of pitches, which two factors combined
make up the total length of the joint.
-
It is also of interest to compare.the ultimate strengths
of riveted and bolted joints •. With. a given working load,
a riveted joint designed at TIS = 1/0.75 should equal the
ultimate strength of a bolted joint whose 'TIs = 1/1.10. How-
~ver, comparison of the nine~fastener bolted joints with the
thirteen fastener riveted joints demonstrates that the bolted
joints are stronger (Table 5.1). The bolted joints require
33% less fasteners- and consequently the riveted joints are
much longer. "Th~s results in lower efficiencies and ultimate
strengths.
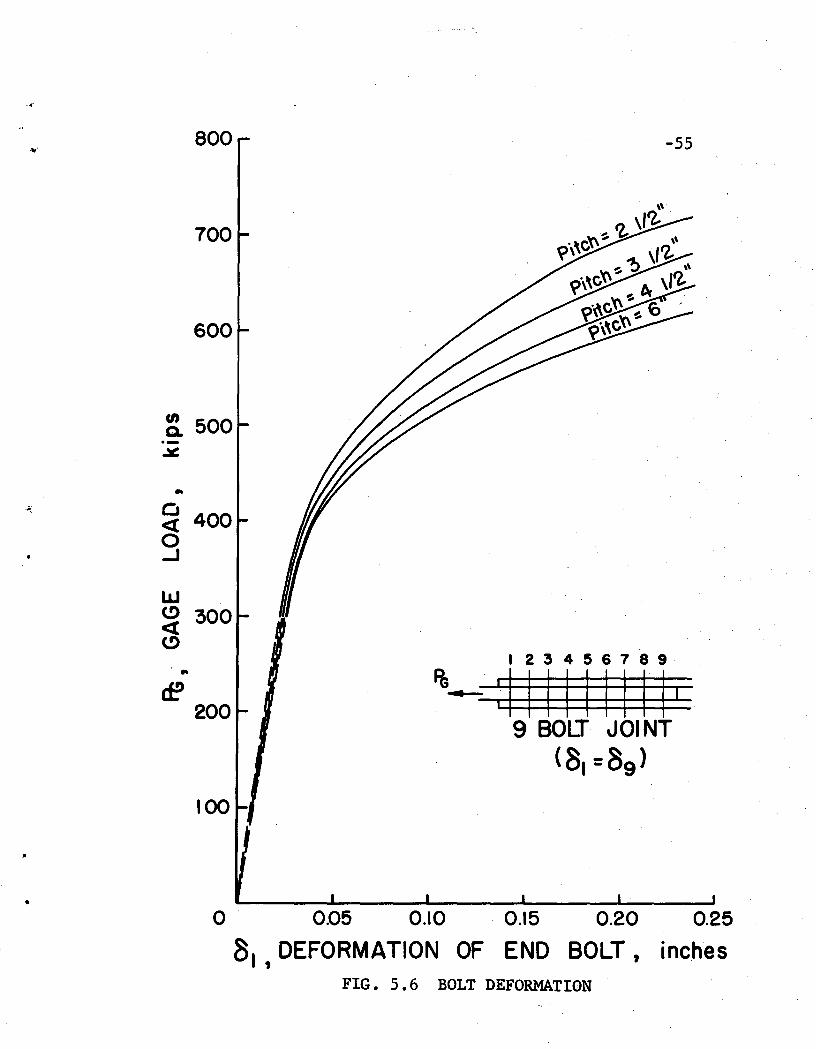
5.3 Bolt Deformation
The effect of pitch on bolt deformation is summ~rized in

..
-29
Fig.' 5.6. This graph compares deformations of the end bolt
in a ninie-fast~ner bolted joint for pitches ,of 2-1/2", 3-1/2",
4-1/2" and 6"~ The relation of deformation to total gage
load shows that for a given load, the amount of deformation
in the end bolts increases directly with an increase in the
pitch of the fasteners. Similar curves could be. drawn for
ot:her bolts in the; connection.
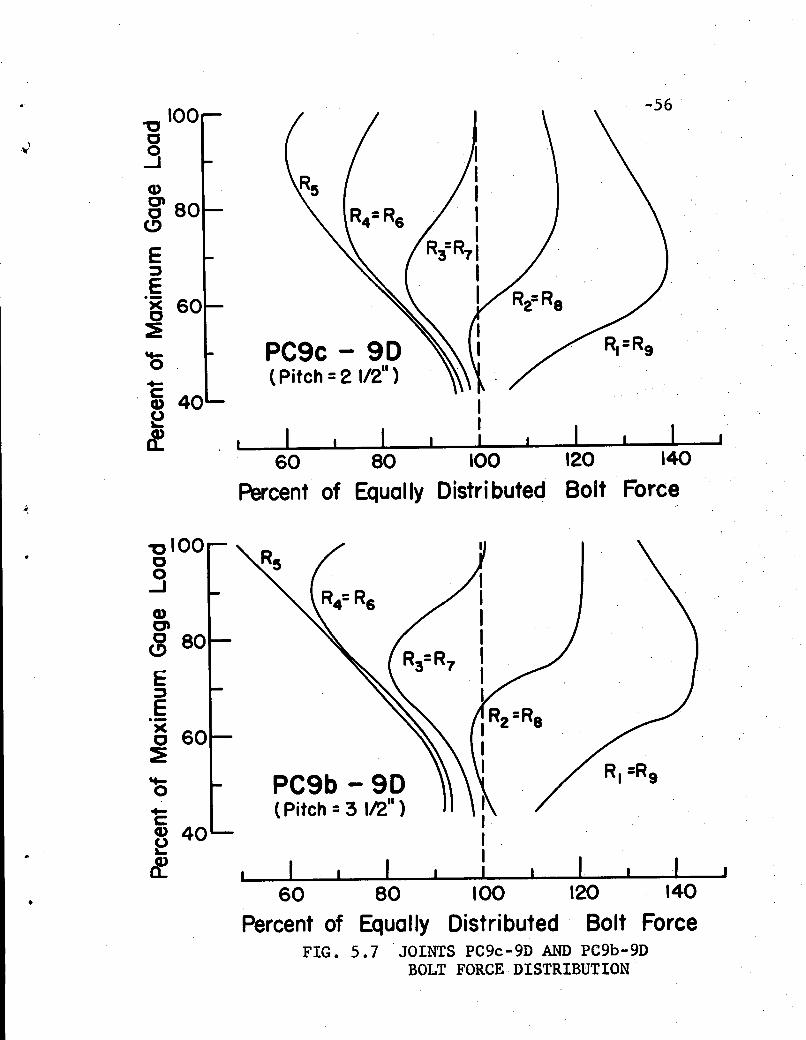
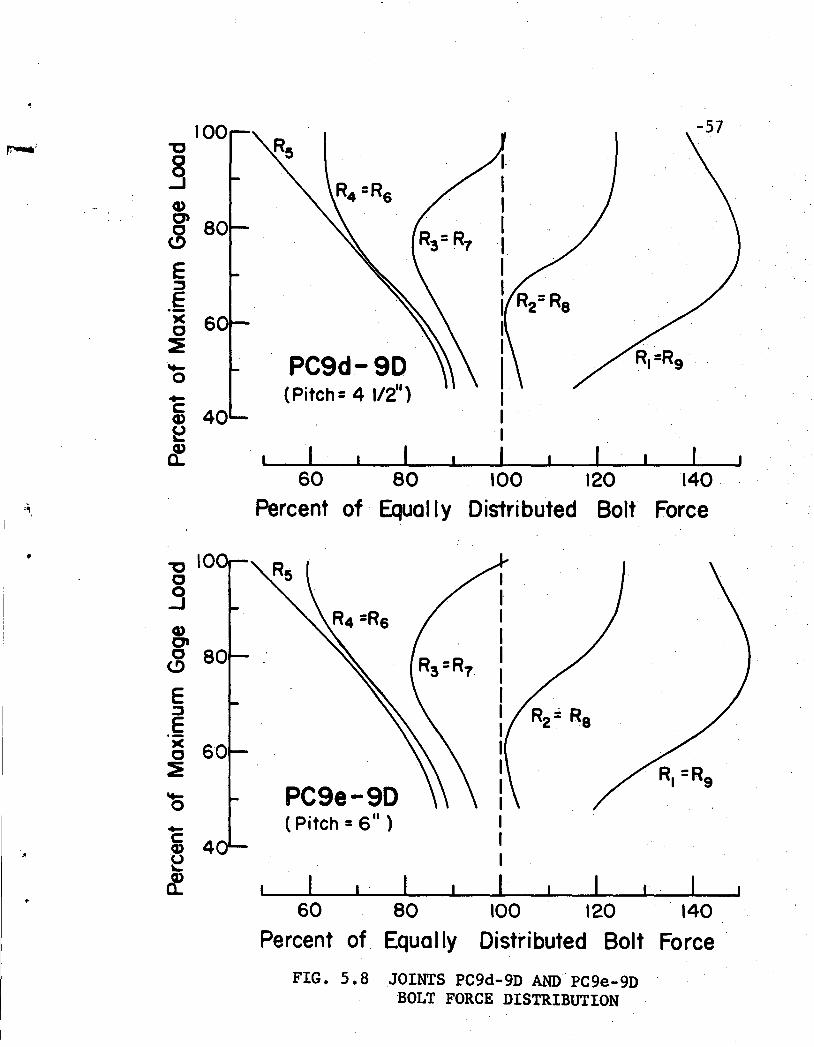
5.4 Distribution of Connector Forces
Figures 5.7 and 5.8 demonstrate the effect of pitch on
.bolt force distribution. Since the plots are non-dimension
alized, they eliminate differences in ultimate loads. In
these graphs the abscissa represents the bolt force as ,a
percentage of the equally distributed bolt force. If all
bolts carried the same load all of the curves would be
vertical lines at the abscissa 100. The ordinate represents
the applied load as a percentage of the maximum gage load.
In the joint PC9c-9D (2-1/2" pitch) there is a,
definite trend above 90% maximum g~ge load whereby the
initial disparity of bolt forces tends to be reduced. How
ever, in the joint PC9b-9D (3-1/2" pitch) the trend is not
..
-30
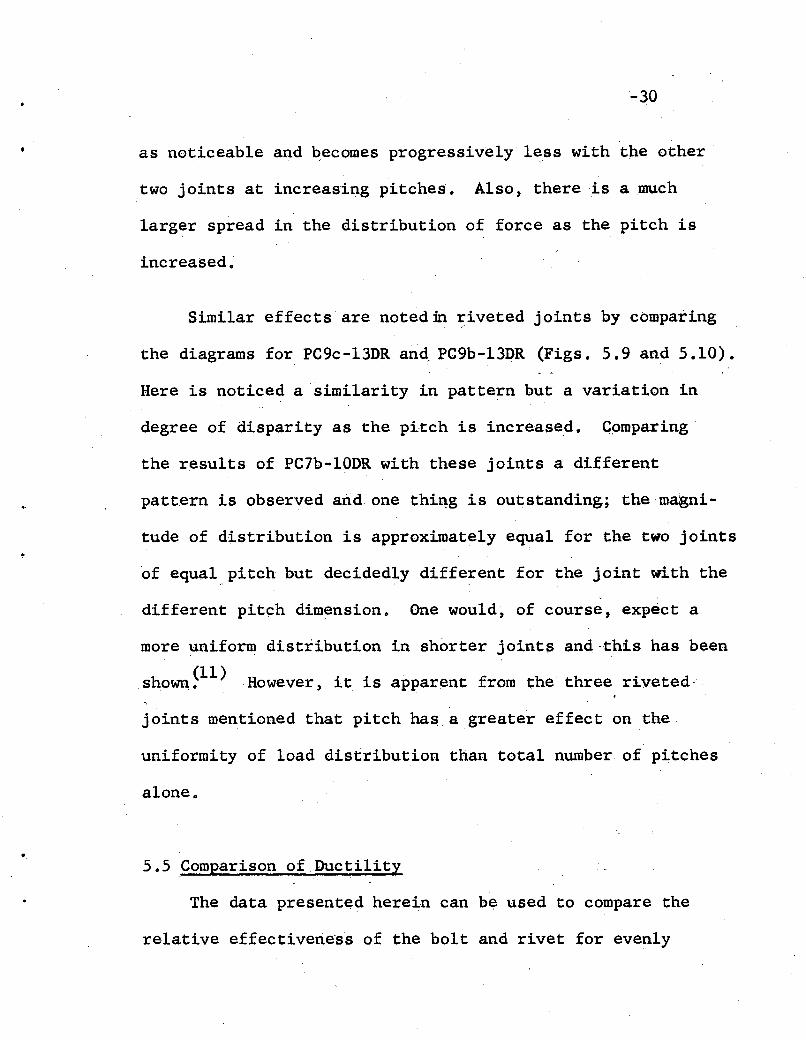
as noticeable and ~ecomes progressively l~ss with the other
two joints at increasing pitches. Also, there is a much
larger spread in the distribution of force as the pitch is
increased.
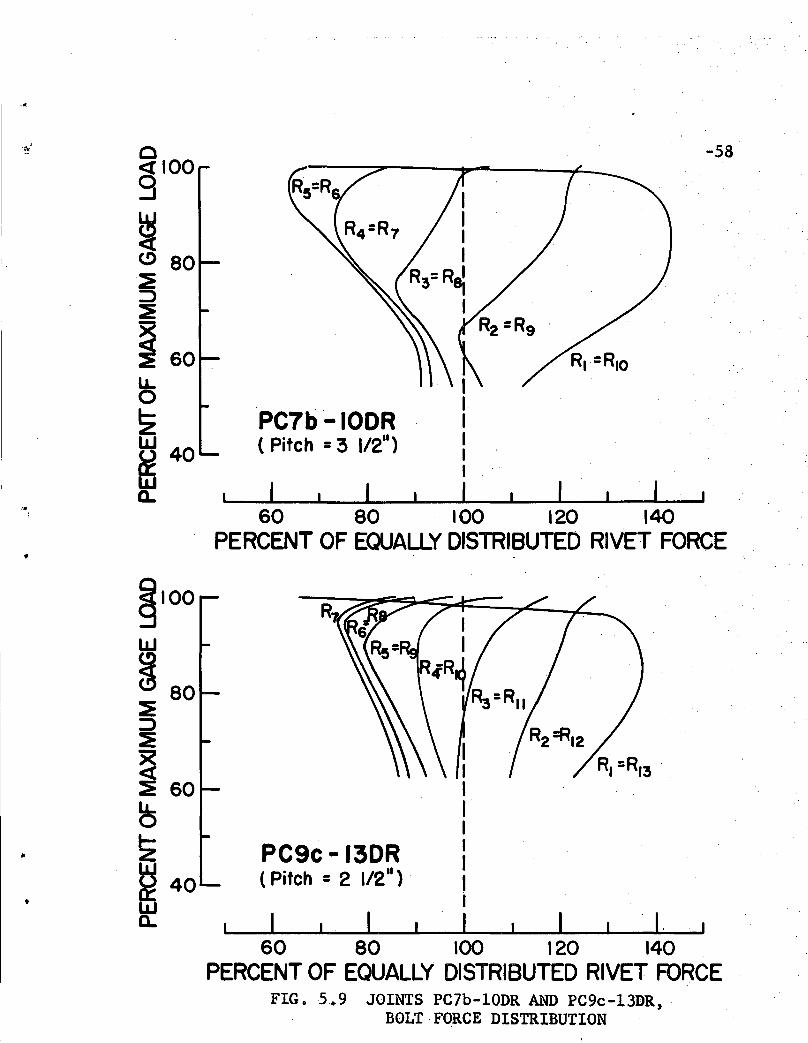
Similar effects are noted in riveted joints by comparing
the diagrams for PC9c-13DR and. PC9b-13DR (Figs. 5.9 and 5.10).
Here is noticed a similarity in pattern but a variation in
degree of disparity as the pitch is increased. Cpmparing
the results of PC7b-10DR with these joints a different
pattern is observed and one thing is outstanding; the magni-
tude of distribution is approximately equal for the two joints
of equal .. pitch but decidedly different for the joint with the
different pitch dimension. One would, of course, expect a
more uniform distribution in shorter joints and-this has been
shown~ll) However, it is apparent from the three riveted·
joints mentioned that pitch ha$ a greater effect on the
uniformity of load distribution than total number of pitches
alone •
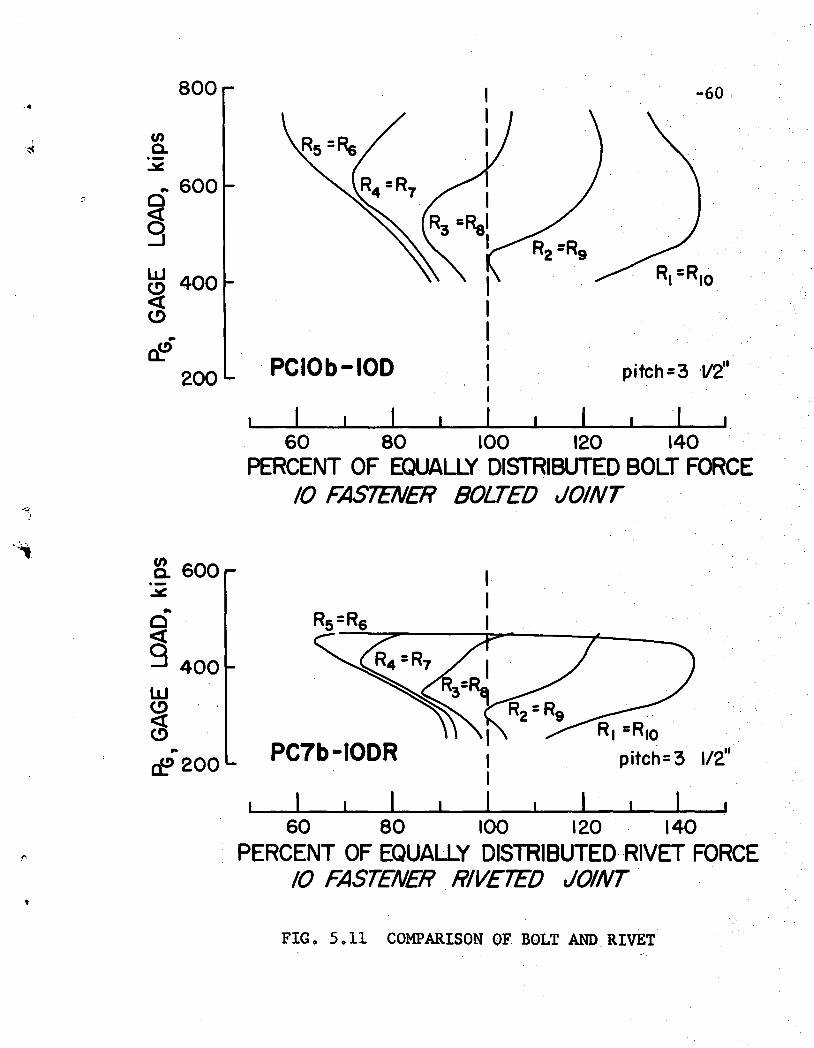
5.5 Comparison of Ductility
The data presented herein can be used to compare the
relative effectiveness of the bolt and rivet for evenly
•
•
-31
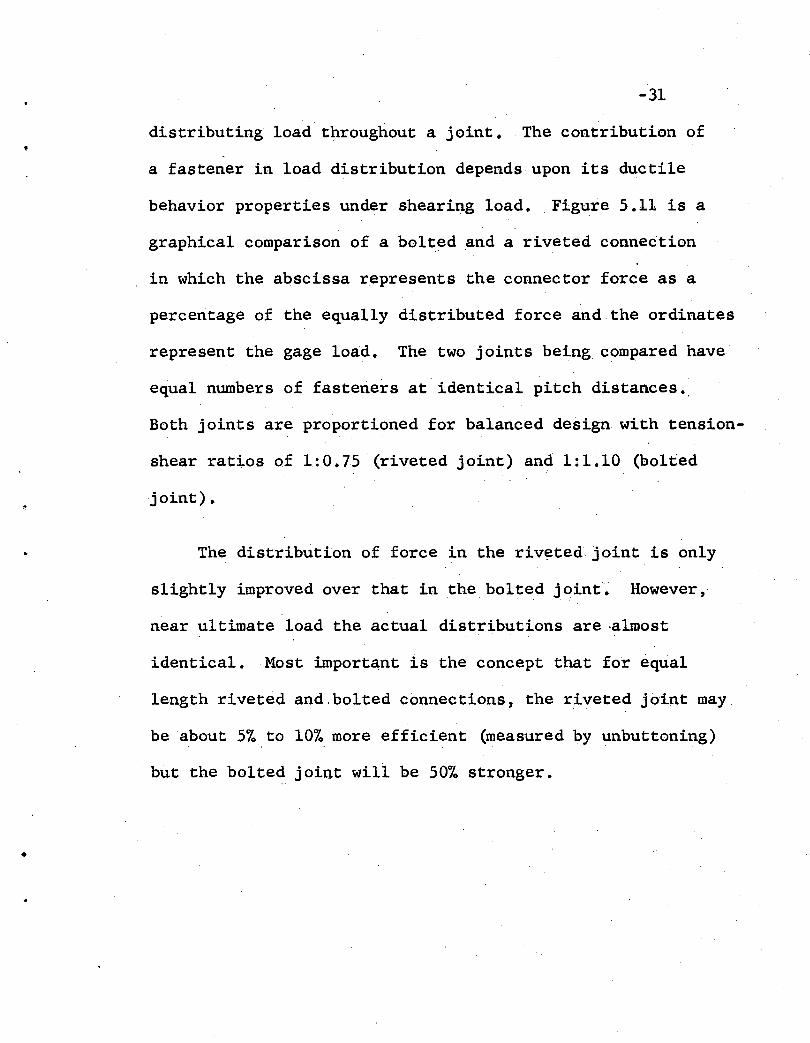
distributing loadthrougJiout a joint. The contribution of
a fastener in load distribution depends upon its ductile
behavior properties under shearing load. Figure 5.11 is a
graphical comparison of a bolted and a riveted connection
in which the abscissa represents the connector force as a
percentage of the equally distributed force and the ordinates
represent the gage load. The two joints being compared have
equal numbers of fasteriers at identical pitch distances.,
Both joints are proportioned for balanced design with tension
shear ratios of 1:0.75 (riveted joint) and 1:1.10 (bolied
joint) •
The distribution of force in the riv~ted,joint is only
slightly improved over that in the bolted joint. However,
near ultimate load the actual distributions are ,almost
identical. Most important is the concept that for equal
length riveted and .bolted connections, the riveted joint may
be 'about 5% to 10% more efficient (measured by unbuttoning)
but the bolted joiqt will be 50% stronger •
•
-32
6. SUMMARY AND CONCLUSIONS
This thesis has made use of certain theoretical methods
in a study of the effect of pitch on the behavior of the
long joint. The theoretical solution was used to investigate
ten hypothetical joints. Duplicates of four of these were
actually fabricated and tested. Comparisons were also pro
vided with three related tests of large joints. The atten
tion was entirely on long joints and the subject,matter
encompasses both riveted and bolted structural connections.
~pecific results were as follows:,
(1) A connection's efficiency, as measured, by i,ts
ability to develop the full strength of.all the'
fasteners, is affected by changes in pitch. For a
given number of fasteners, the ultimate strength of
the connection will decrease as the pitch is increased.
In- a nine bolt joint a change in pitch from 2-1/2" to
6" resulted in a drop in ultimate strength,of·13.9%
(Fig. 5.1 and F~g. 5.2).~hus, the ultimate strength
of the fasteners in a connection depends not ,only on
the number of fasteners but also on their spacing in
the line of the load.
•
-33
(2) It has not been possible to separate pitch dis-
tance and the total number 6f pitches as determinants
of connection efficiency (measured by unbuttoning).
(3) For a given load, the deformation of the end
fasteners in a connection having a fixed number of
fasteners will increase as pitch distance is increased
(Fig. 5.6).
(4) Neither bolted nor riveted joints completely
equalize load among t~e fasteners (Fig. 5.11). This
behavio'r, indicated by reduced shear strengths in long
joints, is a significant pt:'0blemthat should not be
ignored. Though limitations on maximum pitch would
have the best results, a limitation on maximum over-
all length is also necess~ry to prevent an extreme
reduction of safety factor.
(5) The ductility of the high strength bolt is favorable
in comparison to the structural rivet. With riveted
and bolted connections of equal length and number of
fasteners, the riveted joint may be about 5% or 10%
more efficient (measured by unbuttoning) but the bolted
..
"
•
-34
joint will be 50% stronger (Fig. 5.11).
(6) Riveted and bolted connections with similar pitch
dimensions and designed for equal strength under current
codes will not carry equal loads. The riveted joint
requires 50% more fasteners and is necessarily much
longer. This results in lower efficiency and reduced
ultimate strength so the bolted joint is actually
stronger.
(7) The theoretical study and conclusions therefrom
have been verified by ~ concise test series. Three
bolted joints were fabricated to study the effect of
fastener pitch and demonstrated that decreasing pitch
results in an increased joint efficiency.
•
7. NOMENCLATURE
Capital Letters
B Bolt or bplt calibration curve
F Force
L Lap plate calibration curve
M Main plate calibration curve
N Number of pitches
PG Load on gage strip
PJ
Load on joint
Pyn Load that causes yielding of net section
Qkj Force in lap plates between Rows j and k
Rj Force transmitted by Bolt j
S Average shear stress (in TIs ratio)
T Tensile stress on net section (in TIs ratio)
U Unbuttoning factor
Small Letters
c. Hole clearance
dB Bolt diameter
dH Hole diameter
-35
•
Elongation of one pitch length of plate from thecenterline of Hole j to the centerline of Hole k*

• e'.jk
g
m
n
p
t
-36
Elongation of one pitch length of plate from thebearing side of Hole j\to th¢ bearing side of 'Hole k*
Gage
Next to the last boltprhole
N\imber of bolts 'in line or last holt or hole
Pitch
Thickness
•
Greek Letters
o Calibration bolt offset
A Elongation of the radius of a hole due to platetension
Hole offs~7
Summation
Nominal fastener shear stress.'
*Normal order of subscripts indicates main plateeiongations;.. inverted order indicates lap plate elongations •
, ,

-36a
8. ACKNOWLEDGMENTS
This paper covers parts of a research project "Large, .
Bolted Joints" currently being carried out at the Fritz
Engin~ering Laborato~y;,LehighUniversity. The project
is sponsored financially by the Pennsylvania Department
of Highways and the Bureau of Public Roads. Technical
guidance has been provided by a committee of the Research
Council for Riveted and Bolted Structural Joints.I
The author wishes to express his appreciation to
Lynn S. Beedle who serves as director of the project
•
and to S. E. Dlugosz, a research assistant assigned to
the project, who helped conduct a large number of the
tests.
Sincere gratitude is extended to John L. Rumpf,
technical consultant on the project, whose suggestions
have been invaluable .It was on. the basis of previous work
by him that much of this paper proceded and his permission
to use graphs, charts and other results is greatly
appreciat~p.•
•
-36b.
The large ~est specimens were fabricated by the.. ! .
Bethlehem Stee~ Company and appreciation is expressed,
to Messrs. E.F. Ball, K. de Vries, and J.J. Higgins
for their assistance; to Mr.W. R. Penman and A.Schwartz
of the Lebanon Plant of the Bethlehem Steel Company for
furnishing the bolts; to Mr. S. J.Errera and Mr. K. R.
Harpel and their staff of draftsmen and technicians at·
the Fritz Engineering Laboratory; and to Miss Grace Mann
for her patience in typing the manuscript.

•
•
9. TABLES AND FIGURES
-37-

• •
NUMBER OF PITCHOVERALL THEORETICAL
UNBUTTONINGTEST
UNBUTTONINGHYPOTHETICAL LENGTH ULTIMATE TEST ULTIMATEJOINT FASTENERS P L (kf:b )
FACTOR SPECIMEN ( PG) FACTORn .-
in. U Uin. IpS kips
PC9c-90 9 2 V2 20.0 720 0.800PC9b- 90 9 3 1/2 28.0 680 0.756 091 679 0.736PC9d- 90 9 41/2 36.0 648 0.720PCge- 90 9 6 48.0 620 0.689PCIOb-IOO 10 3V2 31.5 750 0.750 0101 . 753 0.734
10 3 1/2 31.5 010 772 0.70813 25/8 31.5 013A 994 0.70113 3 1/2 42.0 013 927 0.654
PC7b-IODR 10 31/2 31.5 483 0.761 ORIOI 471 0.741PC9c-130R 13 21/2 30.0' 640 0.775.PC9b- t30R 13 3 1/2 42.0 598 0.724 ORI31 608 0.737PC9d-130R 13 41/2 54.0 573 0.694PCge-130R 13 6 66.0 . 552 0.669
TAB LE ·5. 1 SUMMARY OF RESULTS
IW00
•
•
Row No. CD ® @ @@
~-J1 + +1----+ t!~12 .~23 ~ ~mn~
-39
I - - ... -~ - ~ - ..-- - !- -,"" - .~.- - -L- - - ....~ -~ -
I I- - I- ~ - ... - t- ..."t I
t
.FIG • 2.1 GEOMETRY OF JOINT
fl_
IF; =0·H ,
FIG. 2.2 EQUILIBRIUM CONDITION
-40
•
shearing
m bearingormation
l+
+ .....Unifordet
+rBolt
+
I
...... J
~
8e =max. defl.
•FIG. 2.3 IDEALIZED BOLT DEFORMATION
..
-41
~P +e
23 32..
.... ~ ...~ -~
........ -- - - . -
.....
-4~ ~ ~
~I~
~2I-
~3I-~l- ...... ~
Pl2 + el2 P23+e23
•
FIG. 2.4 COMPATIBILITY CONDITION
f-- fI 16 oe or- oilll
8 jTaCk Weld• •
--IN -- ~r•I -l\J
--$-- - r-,~- . .
=l\J '-- ~
I~
~-----1------ -f-8_IN L.....-
II-f..!4 i' I" 2" I"
M
Mi•
FIG. 2.5 COMPRESSION· SHEAR JIG
.. • ..
~ 120.-~
I.J:'oN
.28
~-------:---...." "f '8~'- - t- dia. A325 bolt, "
O-Lot
.04 .08 .12 .16 20 ' ' , .24
'8 ,Calibration " Bolt Offset, incheso
P.L
..
'oQ).cenc:o
"'0o.3
...2'"'?
FIG. 2.6 AVERAGE BOLT SHEAR CALIBRATION CURVE
•-43
Drill 1511
diaI" thick
lr-
16.
~ ..
~L
Mark.
L, in. W, in.P,In.PC9-c 2.50 43.5 6.88PC9-b 3.50 46.0 6.88PC9-d 4.50 45.5 6.88PC9-e 6.00 47.0 6.88
PC7-b 3.50 46.0 5.56PCIO-b 3.50 46.0 7.54
•
FIG. 2.7 DIMENSIONS OF PLATE -CALIBRATION SPECIMENS
.... aoo-44
700
600
(J)a.~ 500
..0<t
• g400
• UJ(!)«(!) 300 o PC91c (p·2 1/2·).. 0 PC91b (p·3 112·)
cE Ii. PC91d (p·4 1/2·)
o PC9le (p. 6· )
200 .
_--- Bolt Shear Calibration
.. ~:.
•
100
o .I
e' =e, PITCHFIG. 2.8
Rivet ShearCalibration
.2.3 .4
ELONGATION, inchesCALIBRAT~ON RESULTS
.5

•
.....
t
2t
2= 84 81=85
FIG. SOLUTION OF EQUATIONS
-45
•
•
-46
Note:Test Specimens all have two lines of bolts whereashypotheticaI jOints have onIy one.
HYPOTHETICAY DIMENSIONS " TESTJOINT SPECIMEN
PLATE THICKNESS PITCHNO.of
OVERALLMARK 7/8
11A325 TIS MARK'WIDTH 2t P BOLTS
LENGTH
PC 9c-90 13.78 211
21/211
9 2011
IILlO --
PC 9b-9D 13.78 211
31/211
9 2811
1/1.10 091
PC 9d-90 13.78 211
41/211
9 3611
1/1.10 -PC ge-90 13.78 2
116
119 48
111/1.10 -
PC 10b-100 15.10 211
31/211
10 31.511
1/1.10 0101
- 8.4711
411 31/2
1110 31.5
111/1.10 010
- 10.4711
411 25/8
1113 31.5
111/1.10 013A
- 10.4711
411
31/211
13 42.011
1/1.10 013
FIG. 3.1 SUMMARY OF HYPOTHETICAL. BOLTED JOINTSAND RELATED TEST SPECIMENS
-47
013 010 013AFIG. 3.2 RELATED TEST SPECIMENS
"
..
•
-48
~4~LL PLATE
Note:Test Specimens all have two lines of rivets whereashypothetical joints have only one.
HYPOTHETICAY DIMENSIONS " TESTJOINT SPECIMEN
PLATE THICKNESS PITCHNO. of
OVERALLMARK WIDTH 2t P 7/8" AI41 LENGTH TIS MARK
RIVETS
PC7 b-IODR 11.12 2" 3 1/2" 10 31 1/2" 1/077 DRIOI
PCg c-13DR 13.78 2" 2 1/2" 13 30" 110.76 -PCg b-13DR 13.78 2" 3 112" 13 42" 1/0.76 DRI31
peg d-13DR 13.78 2" 4 112" 13 54" 1/0.76 --Pcg e-13DR 13.78 2" 6" 13 • 72" 11076 -
FIG. 4.1 SUMMARY OF HYPOTHETICAL RIVETED JOINTS; AND RELATED TEST SPECIMENS .

• -- •
120(J)Q.
.::tt: --~,.. ,(!) 80 7/8" dia. A325 bolt
\-J
0- Lota:«wI 40 7/8
11dia. AI41 riveten
'-----
z DR- Lot0 ,0
,9 0 0.04 0.08 0.12 0.16 0.20 0.24 0.28 0.32..a.
8, CALIBRATION OFFSET, -inches
FIG. 4.2 AVERAGE RIVET SHEAR CALIBRATION CURVE

8 9
I
I 2
-soPredicted Boll Failure 720k800
..en 600a..-~
o~ 400.=J PynLLJ
~(!) 200
PC9c - 90 (Pitch =2 1/2")
100
8 9
I
I 2
40 60 80·R, BOLT FORCE, kips
Predicled Bolt Failure 680k
R5
20
By test
Bolt Fai lure679 k600
o
U)a..-~..og« 400
PynLLJ(!)<{(!)200
PC9b - 90 (Pitch =3 1/2")
o 20 40 60 80R, . BOLT FORCE, kips
FIG. 5.1 JOINTS PC9c-9D AND PC9b-9D,THEORETICAL BOLT FORCES
100
I
8 9 .I 2
600
800
--~ 4009 Pyn
LLJ(!)« 200(!)
PC9d -90 (Pitch =4 112")
o 20 40 60 80R, BOLT FORCE, kips
100
I
PCge-90(Pitch= 6" )
8 9I 2
Predicted Bolt Failure 620/r~600
--cE
enC-o-~
--0400«a Pyn..:J
LLJ
~ 200(!)
•
• oI I I
20 40 60 80R, BOLT FORCE, kips
FIG. 5.2 JOINTS PC9d-9D AND PCge-9D,THEORETICAL BOLT FORCES
100
·... 600
f/)~.-~
C 400
9wC) 200«C)
..ce0
-52
"{redicted Rivet Failure =483k
By Test,-Rivet R.::t::=~-o:::::;.,--..L
Foilure=471k
SymmetricalAbout
I 2 l 9 10
I•
PC7b-IODR(Pitch.3 1/211
)
20 40 60 80 100
R, RIVET FORCE, kips
800
PG........I--~gB~~·X~fitT~I
PC9c -13DR (Pitch =2 1/20'1)
1213
SymmetricalAbout
12
~Predicted Rivet Failure =640k
Rf/)~
~ 600
400
..c«9w
.C)«C)..cE 200
•
o 20 40 60 80 100R, RIVET FORCE ,kips
FIG. 5.3 JOINTS PC7b-10DR AND PC9c-13DR,THEORETICAL ~IVET FORCES
....-53
800
By Test, Rivet8. 600 Failure=60ak0-.::tJ:...o«9 400
Predicted Rivet FOllure=598k
SymmetricalAbout
1 2 l;.. 12 13r.. . T
- Fitch =:3 1/2 II )
1l.....__..J..'__P_C,L,9_b_I_3_D-lR,_<__...L.'__--J'o 20 40 60 80 100
R, RIVET FORCE, kips
I.LJ(!)
«(!) 200
•
FIG. 5.4 JOINT PC9b-13DR, THEORETICAL RIVET FORCES
"
.. ':::> 0.900 -54
.-a:§~ 0.800
(!)Z-Z~Q700I-
9 Bolt Joint:::>mz TIS =1/1.10:::> 0.600
I I
2 3 4 5 6 7, PITCH, inches
:::> 0.900..a:guLi! 0.800
(!)Z-Z~ 0.700
~ 13 Rivet Jointmz TIS =1/0.75:::>" 0.600
•2 3 4 5 6 7
PITCH, inches
FIG. 5.5 UNBUTTONING FACTOR
•
800
700
600
~ 500~
..0
400<t0-J
LaJ(!) 300<t(!)
..c£>
200
100
-55
123 4 567 8 9
I
9 BOLT JOINT(81=89 )
•o 0.05 0.10 0.15 0.20 0.25
81,DEFORMATION OF END BOLT, inchesFIG. 5.6 BOLT DEFORMATION
·..;
Q)
g 80(!)
E:"E.-)(o
:iE
o..... c
Q)
~
~
PC9c - 90( Pitch =2 1/2")
1I
'----"1 .....1-_....&.1_.....1-_..&..1--'---1-.....60 80 100 120 140
Percent of Equally Distri buted Bolt Force
PC9b - 90(Pitch =3 I,i')
-0 10000~
Q)C'0
(!)
E:"E.-)(0~....0...cQ)
~
cf•
IIII
--_I II60 80 100 120 140
Percent of Equally Distributed Bolt ForceFIG. 5.7 JOINTS PC9c-9D AND PC9b-9D
BOLT FORCE DISTRIBUTION
CDC'0
(!)
E:::J
.S)(
0:!:~
0..c40CD
~
cf
PC9d-9D(Pitch =4 1/211
)
--_I I ,_.....1-__--'60 80 100 120140 .
Percent of Equally Distributed Bolt Force
PCge-9D( Pitch =6" )
___I I· I I I60 80 100 120 140
Percent of. Equally Distributed Bolt Force·
"0 100
.3CDe-O 80<.!)
E:::JE.;(0:!:~
0..c4CD
~
cf
•
"
FIG. 5.8 JOINTS PC9d-9D ANDPCge-9DBOLT FORCE DISTRIBUTION
o«1009
~(!) 80:!::::>:E
~ 60
~~~ 40l1Ja..
PC7b--IODR( Pitch =:3 1/2")
IIIIIII I
-58
•
~IOO
l1J
~ 80:E:::>:E
~ 60
~
~
~ 40a.
60 80 100 120 140PERCENT OF EQUALLY DISTRIBUTED RIVET FORCE
PC9c -13DR(Pitch = 2 1/2")
,--...r..--._I . I, . ,
60 80 100 120 140PERCENT OF EQUALLY DISTRIBUTED RIVET FORCE
FIG. 5.9 JOINTS PC7b-10DR AND PC9c-13DR,BOLT FORCE DISTRIBUTION

PC9b - 13DR(Pitch =3 1/2")
" I I I
60 80 100 120 140 160
PERCENT OF EQUALLY DISTRIBUTED FORCE
-59
C<l100 R79W(!)
~ 80
~::>::!:-~ 60~
lL.o~ 40WUa::wa..
FIG. 5.10 JOINT PC9b-13DR, BOLT FORCE DISTRIBUTION
800,4
I en'~ a..-
~
.... 600~ Q
~.::J
W 400<.!)«<.!) ..r£>
200
~ 600.-~
-60
III
, PCIOb-IOD : pitch=:3 V2"I
'------'--_..I.....-.~ I _..&..-_ 1_--60 80 100 120 140
PERCENT OF EQUALLY DISTRIBUTED BOLT FORCE10 FAStE.NER BOLTED ,JOINT
....Q«9 400W
~ ..cf' 200
PC7b-IODRR1 =R10
pitch=:3 1/2"
60 80 100 120 140PERCENT OF EQUALLY DISTRIBUTED RIVET FORCE
10 FASTENER RIVETED ,JOINT
FIG. 5.11 COMPARISON OF BOLT AND RIVET

~ . t·
't-
10. LIST OF REFERENCES
-61-
-J
,.#,
0(,
\~'
,
-62
1. Schutz, F. W.EFFECTIVE NET SECTION OF RIVETED JOINTS, SRS #30,University of' Illinois, September 195'2.
2.STEEL CONSTRUCTION, American Institute of SteelConstruction, 1956.
3. Davis, R. W.; Woodruff, G. B.; and Davis, H. E.TENSION TESTS OF 'LARGE RIVETED JOINTS, Transactionsof ASCE, Vol. 105, p. 1193, 1940.
4. Vasarhelyi, D. D.; Beano, S. Y.; Madison, R. B.;'Lu, Zung-An; and Vasishth, V. C•.
EFFECTS OF FABRICATION TECHNIQUES ON BOLTED JOINTS,Proceedings of ASCE, Vol. 85; ST3,March 1959•.
5. Chesson," E., Jr. and Munse, W. H.BEHAVIOR OF, ,LARGE RIVETED AND BOLTED" STRUCTURALCONNECTIONS, SRS. #174, University of Illinois, June,1959.
6. Bendigo, R. A. and Rumpf, J. L.STATIC TENSION TESTS OF LONG BOLTED JOINTS,FritzLaboratory Report No. 271.8, Lehigh University,February 1960. " ,
7. Bendigo, R. Pa;. and Rumpf, J.L.STATIC TENSION TESTS OF BOLTED LAP JOINTS, FritzLaborato~yReportNo. 271.9~ Lehigh University,in preparation. .
8. Hansen, R. M. and Rumpf, J. L.FURTHER STATIC TESTS OF LONG BOLTED JOINTS, FritzLaboratory Report No. 271.15, Lehigh University,in preparation. -
9. Dlugosz, S. E. and Rumpf, J. L.STATIC TENSION TESTS OF LONG RIVETED JOINTS, FritzLabora~ory Report No. 271.16, Lehigh University,in preparaticm. .,
10. Francis, A. J.THE BEHAVIqR OF ALUMINUM ALLOY RIVETED JOINTS, TheA1uminmmDeve1opment Association, Research ReportNo. 15, London, 1953'."
,
-63
11. Rumpf,· J. L.THE ULTIMATE STRENGTH OF BOLTED CONNECTIONS, FritzLaboratory. Report No. 271.14, Lehigh University,
. September 1960.
12. Hansen, R. M. and Rumpf, J. L.SHEAR STRENGTH OF·A325 BOLTS, Fritz LaboratoryReport No. 271.10, Lehigh University, in preparation.