Embed Size (px)
Citation preview

Ann. Bot. Fennici 46: 30–42 ISSN 0003-3847 (print) ISSN 1797-2442 (online)Helsinki 27 February 2009 © Finnish Zoological and Botanical Publishing Board 2009
The effect of fire intensity on vegetation succession on a sub-xeric heath during ten years after wildfire
Lasse Ruokolainen1 & Kauko Salo2
1) Department of Ecology and Evolutionary Biology, P.O. Box 65, FI-00014 University of Helsinki , Finland (e-mail: [email protected])
2) Finnish Forest Research Institute, Joensuu Research Unit, P.O. Box 68, FI-80101 Joensuu, Finland (e-mail: [email protected])
Received 14 Sep. 2007, revised version received 11 Dec. 2007, accepted 15 Jan. 2008
Ruokolainen, L. & Salo, K. 2009: The effect of fire intensity on vegetation succession on a sub-xeric heath during ten years after wildfire. — Ann. Bot. Fennici 46: 30–42.
Many studies indicate that fire intensity has a marked effect on subsequent vegetation recovery. However, evidence from natural fires is still sparse. We studied vegetation succession during ten years after a wildfire on a sub-xeric, pine dominated coniferous forest. The fire affected four adjacent patches differently and thus created a natural fire intensity gradient. Postfire vegetation data was analysed using non-metric multidimen-sional scaling and MANOVA. The clearest indication of fire intensity was provided by herbaceous colonizers. Recovering dwarf shrub cover and residual and invader moss cover provided additional evidence for observed differences between the four areas. Despite of initial dissimilarity, community composition became increasingly similar on the different areas during the study period. In conclusion, variation in fire intensity had a clear impact on postfire recovery in natural conditions. Fire disturbance also clearly enhanced local species richness and diversity. Our results indicate that habitat factors play a considerable role in the nature of vegetation recovery following wildfire.
Key words: fire intensity, forest fire, non-metric multidimensional scaling, species richness, vegetation succession
Introduction
Fire is a natural factor in the boreal forest eco-system. In addition to its importance as a land-scape-shaping agent (Heinselman 1973, Johnson 1992), frequent fires also maintain the diversity and long-term stability of the forests (Heinsel-man 1973, Zackrisson 1977, Turner & Romme 1994, Wardle et al. 1997). Fire promotes the rein-vasion of early successional species in burned areas, and although in many instances the post-
fire community is mainly composed of surviving individuals (Foster 1985, Turner et al. 1997), it has a positive effect on biodiversity (Trabaud & Lepart 1980, Armour et al. 1984, Ruokolainen & Salo 2006b). Furthermore, for example many plant species have evolved to depend upon fire for their regeneration (Shafi & Yarranton 1973), and thus if fires are not maintained in the land-scape such species will eventually be lost from regional floras.
In addition to its influence on vegetation, fire
ANN. BOT. FeNNIcI Vol. 46 • Fire intensity and vegetation succession 31
induces changes in the biological, physical and chemical properties of the soil. The removal of the vegetation and the topsoil initially reduce site nutrients (Feller 1982, 1983, Simard et al. 2001, Arocena & Opio 2003), particularly nitrogen and sulphur. However, soil temperature, cation availability and pH increase as a result of burn-ing (Feller 1982, Simard et al. 2001, Arocena & Opio 2003), which promotes soil microbial activity resulting in increased decomposition rate and nutrient turnover (Pietikäinen & Fritze 1992). These effects promote the initial vegeta-tion succession.
The most important fire related characteristic is its intensity of humus reduction (Schimmel & Granström 1996). Fire intensity affects the pat-tern of vegetation recovery, community dynam-ics and soil processes. Moreover, the intensity of a wildfire determines the proportions of different colonization strategies present in the recovering community (Schimmel & Granström 1996). As fire intensity increases, the abundances of res-prouting species and species germinating from the seed bank are decreased, whereas the abun-dance of invading species (those that colonize through dispersal alone) increase. Fire intensity is also known to directly affect nutrient losses (Raison 1979), and subsequent increase in nutri-ent availability may also be related to fire inten-sity (Pietikäinen & Fritze 1992).
Despite of its relative importance, fire inten-sity has rarely been studied in association with wildfires (Turner et al. 1997), which is prob-ably due to the uncertainty of fire occurrence and the stochastic behaviour of the fire front. Thus, the effects of fire intensity on vegetation processes are mostly studied in experimental conditions (Schimmel 1993). In this paper we present a study conducted on the Kitsi forest fire area, where a wildfire created a mosaic of differ-ently affected patches in a sub-xeric heath forest in 1993. The aim of this study was to deter-mine whether vegetation development differed between sites that had been differently affected by fire, i.e., having different fire intensity. Our hypothesis that fire intensity will affect plant succession was tested with multivariate analysis of vegetation data, collected during ten years after a wildfire.
Materials and methods
Study area
The forest study area (63°16´N, 30°45´E) is located in North Karelia, eastern Finland. The area is located within the mid-boreal climatic zone, which is in the eastern Finland character-ized by relatively continental weather condi-tions. According to the fire chronology, the study area has burned several times during the past 400 years (Lehtonen & Huttunen 1997). The latest fire started 7 June 1992 after broadcast burning, approximately one kilometre away from our study area. This fire affected an area of 137 ha, of which 55 ha belonged to the study area. The oldest living trees in the area were 156 years old at the time of the fire.
The study area is characterized by nutri-ent-poor mineral soil, the dominant tree species being scotch pine (Pinus sylvestris). Other tree species include Norway spruce (Picea abies) and birches (Betula pendula, B. pubescens). In the Finnish forest type classification system the forest was classified as Empetrum-Vaccinium type (EVT).
Field methods
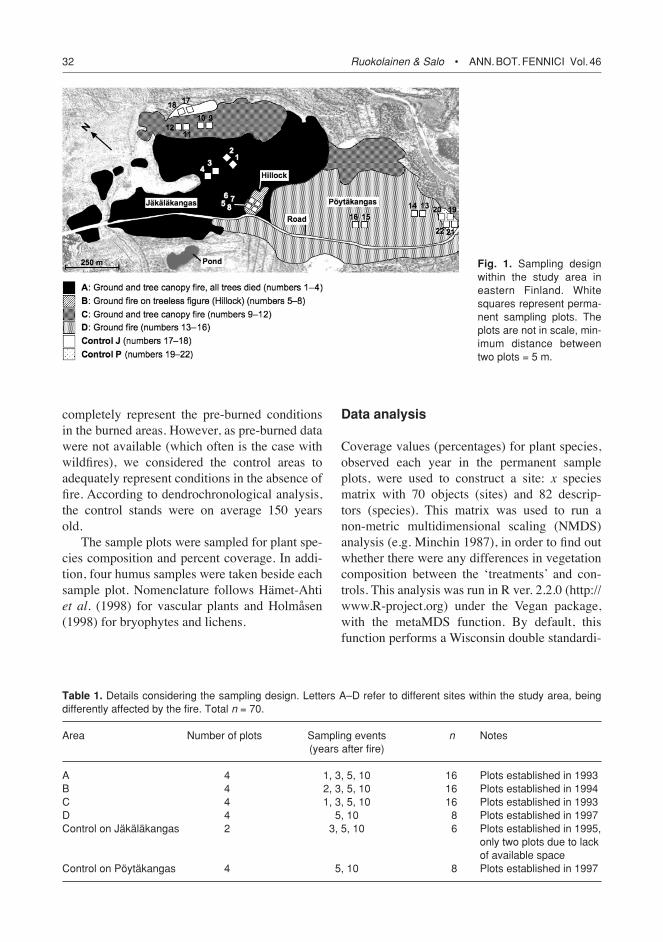
After the fire a total of 22 permanent sample plots (each 10 ¥ 10 m) were established in the area (Fig. 1) at two adjacent sites, Jäkäläkan-gas and Pöytäkangas. At Jäkäläkangas, 14 plots were established on four areas left by ground and severe canopy fire (100% tree mortality) (A), ground fire on a clear-cut patch (B), ground fire and light canopy fire (< 50% tree mortal-ity) (C), and unaffected control stand (Control J). At Pöytäkangas eight plots were established on two areas left by ground fire (D) and an unaffected control stand (Control P). The plots were randomly placed within each area in pairs, and within each pair the plots were at least 5 meters apart. Details considering the sampling design are described in Table 1. According to the behaviour of the fire, areas A–D were assumed to have been differently affected. These areas are hereafter referred to as ‘treatments’. We realize that the selected control areas do not
32 Ruokolainen & Salo • ANN. BOT. FeNNIcI Vol. 46
completely represent the pre-burned conditions in the burned areas. However, as pre-burned data were not available (which often is the case with wildfires), we considered the control areas to adequately represent conditions in the absence of fire. According to dendrochronological analysis, the control stands were on average 150 years old.
The sample plots were sampled for plant spe-cies composition and percent coverage. In addi-tion, four humus samples were taken beside each sample plot. Nomenclature follows Hämet-Ahti et al. (1998) for vascular plants and Holmåsen (1998) for bryophytes and lichens.
Data analysis
Coverage values (percentages) for plant species, observed each year in the permanent sample plots, were used to construct a site: x species matrix with 70 objects (sites) and 82 descrip-tors (species). This matrix was used to run a non-metric multidimensional scaling (NMDS) analysis (e.g. Minchin 1987), in order to find out whether there were any differences in vegetation composition between the ‘treatments’ and con-trols. This analysis was run in R ver. 2.2.0 (http://www.R-project.org) under the Vegan package, with the metaMDS function. By default, this function performs a Wisconsin double standardi-
Fig. 1. Sampling design within the study area in eastern Finland. White squares represent perma-nent sampling plots. The plots are not in scale, min-imum distance between two plots = 5 m.
Table 1. Details considering the sampling design. Letters A–D refer to different sites within the study area, being differently affected by the fire. Total n = 70.
Area Number of plots Sampling events n Notes (years after fire)
A 4 1, 3, 5, 10 16 Plots established in 1993B 4 2, 3, 5, 10 16 Plots established in 1994c 4 1, 3, 5, 10 16 Plots established in 1993D 4 5, 10 8 Plots established in 1997control on Jäkäläkangas 2 3, 5, 10 6 Plots established in 1995, only two plots due to lack of available spacecontrol on Pöytäkangas 4 5, 10 8 Plots established in 1997
ANN. BOT. FeNNIcI Vol. 46 • Fire intensity and vegetation succession 33
zation (standardization of species and site) and a square root transformation (given that there are values > 50, which was the case) to the data. The ordination was based on the widely used Bray-Curtis dissimilarity, which is the complement of the Steinhaus (SS) similarity index:
SS = 2W/(A+B), (1)
where W is the sum of minimum abundances of species shared by two sites and AandB are the total abundances of species present at these two sites (Legendre & Legendre 1998). This associa-tion measure was selected namely because it is familiar to most community ecologists. How-ever, the NMDS solution was relatively insensi-tive to the underlying distance measure.
After a stable solution is reached, the meta-MDS function rotates the final configuration to its principal components in order to ensure that the obtained dimensions corresponded to maxi-mum variation in the data. The final configura-tion is also centered and scaled to half-change. Half-change scaling scales the configuration so that one unit along an ordination axis means halving of community similarity from replicate similarity (Økland 1990). We required the final
configuration to be two-dimensional.Many studies have shown that fire intensity
has a potential influence on post fire vegetation recovery (Schimmel 1993, Schimmel & Gran-ström 1996, Wang & Kendal 2005) and accord-ing to Økland (2000) it is likely to be one of the most important determinants of postfire spe-cies composition. Against this background we tested how well the NMDS ordination reflected the fire intensity gradient in our data. This was done using multivariate analysis of variance (MANOVA), where statistical significances were estimated using 999 permutations (the F values for all model parameters are calculated repeat-edly after randomizing the response variables, the original F values are then compared with the resulting F distributions). The results were used to justify further tests. This analysis was run with a NMDS solution obtained without the control plots, as the differences between the fire intensity ‘treatments’ were of main interest here. In order to account for the non-independence of observation between years, we fit the model with fire intensity, year since fire, and their interac-tion as predictors and the two NMDS-axes as the response. This is a simple way of analysing data with repeated measurements (Crawley 2002).
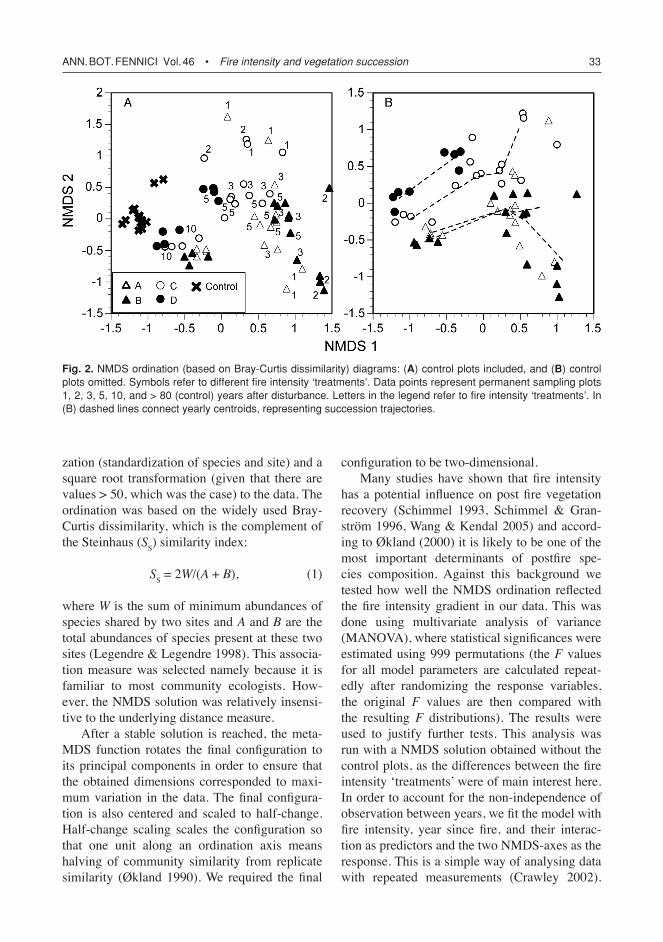
Fig. 2. NMDS ordination (based on Bray-curtis dissimilarity) diagrams: (A) control plots included, and (B) control plots omitted. Symbols refer to different fire intensity ‘treatments’. Data points represent permanent sampling plots 1, 2, 3, 5, 10, and > 80 (control) years after disturbance. Letters in the legend refer to fire intensity ‘treatments’. In (B) dashed lines connect yearly centroids, representing succession trajectories.
34 Ruokolainen & Salo • ANN. BOT. FeNNIcI Vol. 46
The ordination solution (Fig. 2) indicated that time since fire might have a non-linear effect on vegetation composition. Therefore we introduced succession year as a second-degree polynomial, in order to account for potential problems with non-linearity. A second-degree polynomial is also a useful proxy, if plant species are assumed to have some sort of optimum-type development along a temporal gradient (due to responses in gradual changes in, e.g., soil resources and inter-specific competition).
We have previously shown that variation in species abundances is to some extent related to fire intensity in this data set (Ruokolainen & Salo 2006a). Here we took the analysis further by testing whether the total abundances of different plant life-form groups varied between the fire intensity ‘treatments’ and different years along initial succession. This was tested with MANOVA (same predictors as above), and as the dependent variables were not normally distributed statistical significance was estimated with 999 permuta-tions. Again, control plots were omitted from the analysis, as the primary interest was in the differ-ences between ‘treatments’. In addition to plant life-forms, we also tested plant diversity, given by Shannon’s H, against fire intensity and time (and their interaction). Following Pielou (1975) Shannon’s H was calculated as
, (2)
where S is the total number of species in a plot, piis the proportion of the ith species, and ln is the
natural logarithm. In order to fulfil the require-ments of parametric testing, we transformed the plant life-form groups with a square root func-tion. These analyses were also run in R ver. 2.2.0. We realize that the simple method adopted here, for analysing data with repeated measurements, is not very elegant. Here we did not use repeated measures ANOVA, as it requires a fully balanced design. Since we did not have vegetation esti-mates for all ‘treatments’ at each year (Table 1), we chose to use a simpler method. Moreover, as our main aim was to analyze differences in fire intensity and not in succession time, we feel that pseudoreplication was not a major concern in the analyses.
Results
A separation between different fire intensities could be observed in the ordination diagrams (Fig. 2A). Also, control plots were still clearly separated from the burned sites ten years after the fire, which implies that it had a long-last-ing effect on understorey vegetation. With the control plots omitted from the data, fire intensity, succession year, and their interaction explained together 66% of the total variation on the first NMDS-dimension and 52% on the second (Table 2). The first dimension mainly reflected the tem-poral gradient whereas fire intensity was evenly reflected by both dimensions. It was evident from the ordination diagram (Fig. 2B) that suc-cession proceeded differently at the ground fire sites (C and D) as compared with that at the canopy fire site (A) and the burned clear-cut patch (B). Moreover, the ground fire sites where also different from each other with respect to plant succession. In contrast, sites A and B were relatively similar with each other. These observa-tions were corroborated by the significant inter-action between fire intensity and succession year (different slope/curvature in linear regression) in explaining the variation along the NMDS dimen-sions (Table 2).
In order to find out which vegetation com-ponents were behind the observed patterns, the abundance of plant life-form groups and overall species diversity was tested against fire inten-sity, succession year, and their interaction (the
Table 2. MANOVA table representing the ability of the two NMDS-dimensions to reflect the underlying fire-intensity and temporal gradient. Year is here a second-degree polynomial of the actual succession year. Significances tested with 999 permutations. The model explains 66% of variation along the first dimen-sion (NMDS1), and 52% along the second dimension (NMDS2).
Source of variation df Wilks’ F p lambda
Fire intensity 3 0.45 7.30 < 0.001Year 2 0.46 10.37 < 0.001Fire ¥ Year 5 0.52 3.42 0.005Residuals 45
ANN. BOT. FeNNIcI Vol. 46 • Fire intensity and vegetation succession 35
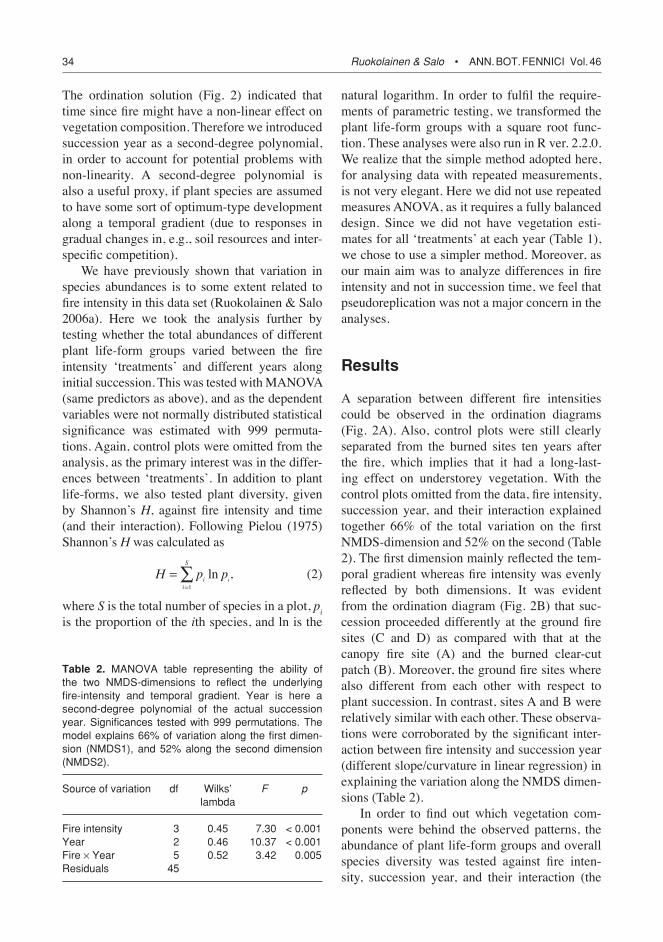
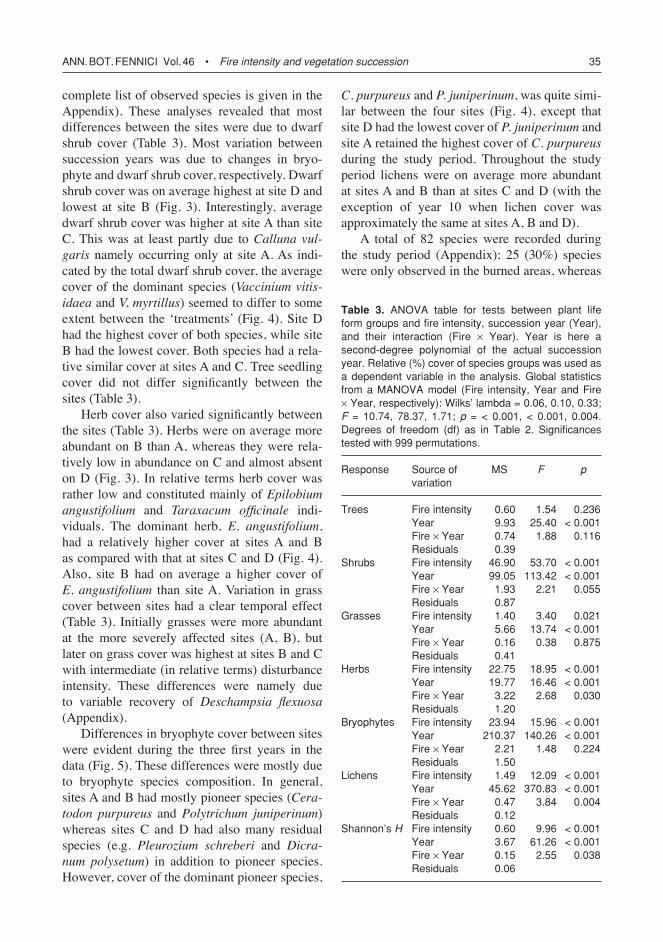
complete list of observed species is given in the Appendix). These analyses revealed that most differences between the sites were due to dwarf shrub cover (Table 3). Most variation between succession years was due to changes in bryo-phyte and dwarf shrub cover, respectively. Dwarf shrub cover was on average highest at site D and lowest at site B (Fig. 3). Interestingly, average dwarf shrub cover was higher at site A than site C. This was at least partly due to Calluna vul-garis namely occurring only at site A. As indi-cated by the total dwarf shrub cover, the average cover of the dominant species (Vaccinium vitis-idaeaandV. myrtillus) seemed to differ to some extent between the ‘treatments’ (Fig. 4). Site D had the highest cover of both species, while site B had the lowest cover. Both species had a rela-tive similar cover at sites A and C. Tree seedling cover did not differ significantly between the sites (Table 3).
Herb cover also varied significantly between the sites (Table 3). Herbs were on average more abundant on B than A, whereas they were rela-tively low in abundance on C and almost absent on D (Fig. 3). In relative terms herb cover was rather low and constituted mainly of Epilobium angustifolium and Taraxacum officinale indi-viduals. The dominant herb, E. angustifolium, had a relatively higher cover at sites A and B as compared with that at sites C and D (Fig. 4). Also, site B had on average a higher cover of E. angustifolium than site A. Variation in grass cover between sites had a clear temporal effect (Table 3). Initially grasses were more abundant at the more severely affected sites (A, B), but later on grass cover was highest at sites B and C with intermediate (in relative terms) disturbance intensity. These differences were namely due to variable recovery of Deschampsia flexuosa(Appendix).
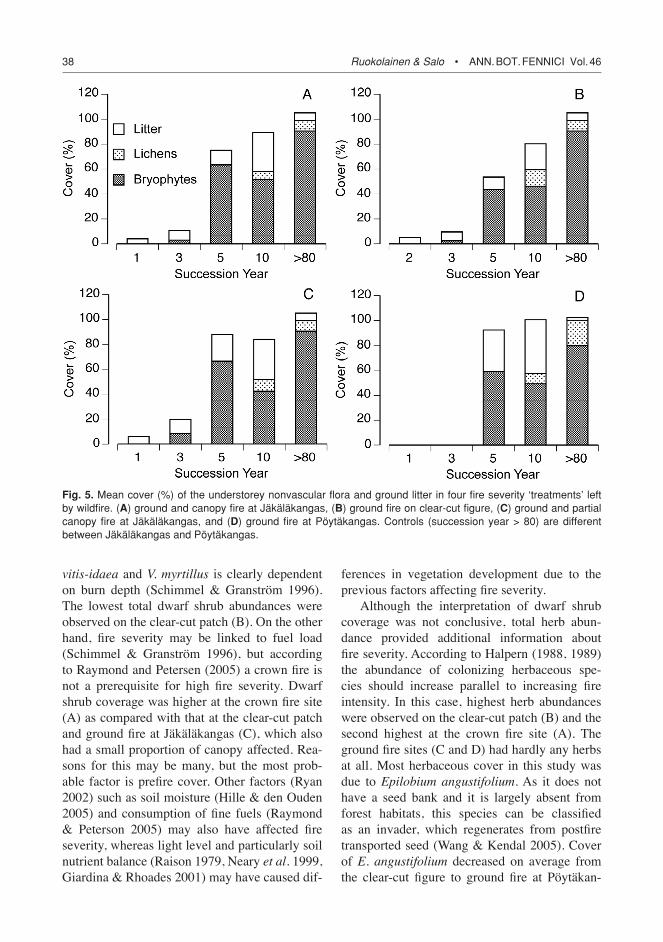
Differences in bryophyte cover between sites were evident during the three first years in the data (Fig. 5). These differences were mostly due to bryophyte species composition. In general, sites A and B had mostly pioneer species (Cera-todon purpureus and Polytrichum juniperinum) whereas sites C and D had also many residual species (e.g. Pleurozium schreberi and Dicra-num polysetum) in addition to pioneer species. However, cover of the dominant pioneer species,
C. purpureus andP. juniperinum, was quite simi-lar between the four sites (Fig. 4), except that site D had the lowest cover of P. juniperinumandsite A retained the highest cover of C. purpureus during the study period. Throughout the study period lichens were on average more abundant at sites A and B than at sites C and D (with the exception of year 10 when lichen cover was approximately the same at sites A, B and D).
A total of 82 species were recorded during the study period (Appendix); 25 (30%) species were only observed in the burned areas, whereas
Table 3. ANOVA table for tests between plant life form groups and fire intensity, succession year (Year), and their interaction (Fire ¥ Year). Year is here a second-degree polynomial of the actual succession year. Relative (%) cover of species groups was used as a dependent variable in the analysis. Global statistics from a MANOVA model (Fire intensity, Year and Fire ¥ Year, respectively): Wilks’ lambda = 0.06, 0.10, 0.33; F = 10.74, 78.37, 1.71; p = < 0.001, < 0.001, 0.004. Degrees of freedom (df) as in Table 2. Significances tested with 999 permutations.
Response Source of MS F p variation
Trees Fire intensity 0.60 1.54 0.236 Year 9.93 25.40 < 0.001 Fire ¥ Year 0.74 1.88 0.116 Residuals 0.39 Shrubs Fire intensity 46.90 53.70 < 0.001 Year 99.05 113.42 < 0.001 Fire ¥ Year 1.93 2.21 0.055 Residuals 0.87 Grasses Fire intensity 1.40 3.40 0.021 Year 5.66 13.74 < 0.001 Fire ¥ Year 0.16 0.38 0.875 Residuals 0.41 Herbs Fire intensity 22.75 18.95 < 0.001 Year 19.77 16.46 < 0.001 Fire ¥ Year 3.22 2.68 0.030 Residuals 1.20 Bryophytes Fire intensity 23.94 15.96 < 0.001 Year 210.37 140.26 < 0.001 Fire ¥ Year 2.21 1.48 0.224 Residuals 1.50 Lichens Fire intensity 1.49 12.09 < 0.001 Year 45.62 370.83 < 0.001 Fire ¥ Year 0.47 3.84 0.004 Residuals 0.12 Shannon’s H Fire intensity 0.60 9.96 < 0.001 Year 3.67 61.26 < 0.001 Fire ¥ Year 0.15 2.55 0.038 Residuals 0.06

36 Ruokolainen & Salo • ANN. BOT. FeNNIcI Vol. 46
6 (10%) species were only observed in the con-trol areas. Thus, species richness of the area increased by approximately 40% [25/(82 – 25)] as a result of the fire. Species richness was rela-tively even between the ‘treatments’ during the study period: A had a total of 54 species, B 47 species, C 52 species, D 54 species, and the con-trols 54 species. These values did not differ from a uniform distribution (χ2 = 0.95; p = 0.92). After ten years species diversity (Shannon’s H) was higher in the clear-cut patch (B) than at the other sites. Diversity tended to be lowest at site D.
Discussion
Ordination of the permanent sample plots indi-cated a convergence of initially relatively dif-ferent ‘treatments’ towards a common target (Halpern 1988, Turner et al. 1997). In addition to
statistical analysis, visual inspection of the aver-age development in different ‘treatments’ (Fig. 2B) supported this observation. The three most severely affected ‘treatments’ approached each other rapidly the first five years, having reached considerable, but not complete resemblance within ten years. Moreover, at all times, the dis-tance to control plots in the ordination increased with increasing disturbance intensity. This indi-cated increasing change in compositional transi-tion (Halpern 1988) and decreasing succession rate. According to Halpern (1988), multiple suc-cessional pathways result from a combination of differences in initial composition and distur-bance intensity. Although we did not have any information about the prefire conditions at each site, there was no reason to suspect that initial understorey vegetation would have been uniform across all sites. Nevertheless, it could be con-cluded that — as overall vegetation composition
Fig. 3. Mean cover (%) of the understorey vascular flora in four fire severity ‘treatments’ left by wildfire. (A) ground and canopy fire at Jäkäläkangas, (B) ground fire on clear-cut figure, (C) ground and partial canopy fire at Jäkäläkan-gas, and (D) ground fire at Pöytäkangas. controls (succession year > 80) are different between Jäkäläkangas and Pöytäkangas.

ANN. BOT. FeNNIcI Vol. 46 • Fire intensity and vegetation succession 37
is considered — fire intensity had a clear effect on initial succession in our study area and it clearly had a long-lasting impact on understorey vegetation composition (Schimmel & Granström 1996, Wang & Kendal 2005). Moreover, as dif-ferences in depth distribution of rhizomes in the soil may be the most important for survival and subsequent resprouting of individuals (Schimmel & Granström 1996), burn depth was the most obvious explanation to the observed patterns. As humus depth was not measured in this study, we
could only speculate on the mechanism behind the observed vegetation patterns.
When the overall surface level succession was inspected in more detail, the different fire intensity ‘treatments’ seemed to be relatively similar. However, as the statistical analyses indi-cated, the ‘treatments’ differed to some extent in total dwarf shrub, herb, and bryophyte cov-erage. Dwarf shrub coverage gives a reason-able indication of fire severity, as the recovery efficiency of the dominant species’ Vaccinium
Fig. 4. Mean cover (%) of dominant understorey spe-cies (two dwarf shrubs, one herb and two bryophytes, respectively). Letters in the legend refer to fire intensity ‘treatments’, for description see Fig. 3.
38 Ruokolainen & Salo • ANN. BOT. FeNNIcI Vol. 46
vitis-idaeaandV. myrtillus is clearly dependent on burn depth (Schimmel & Granström 1996). The lowest total dwarf shrub abundances were observed on the clear-cut patch (B). On the other hand, fire severity may be linked to fuel load (Schimmel & Granström 1996), but according to Raymond and Petersen (2005) a crown fire is not a prerequisite for high fire severity. Dwarf shrub coverage was higher at the crown fire site (A) as compared with that at the clear-cut patch and ground fire at Jäkäläkangas (C), which also had a small proportion of canopy affected. Rea-sons for this may be many, but the most prob-able factor is prefire cover. Other factors (Ryan 2002) such as soil moisture (Hille & den Ouden 2005) and consumption of fine fuels (Raymond & Peterson 2005) may also have affected fire severity, whereas light level and particularly soil nutrient balance (Raison 1979, Neary et al. 1999, Giardina & Rhoades 2001) may have caused dif-
ferences in vegetation development due to the previous factors affecting fire severity.
Although the interpretation of dwarf shrub coverage was not conclusive, total herb abun-dance provided additional information about fire severity. According to Halpern (1988, 1989) the abundance of colonizing herbaceous spe-cies should increase parallel to increasing fire intensity. In this case, highest herb abundances were observed on the clear-cut patch (B) and the second highest at the crown fire site (A). The ground fire sites (C and D) had hardly any herbs at all. Most herbaceous cover in this study was due to Epilobium angustifolium. As it does not have a seed bank and it is largely absent from forest habitats, this species can be classified as an invader, which regenerates from postfire transported seed (Wang & Kendal 2005). Cover of E. angustifolium decreased on average from the clear-cut figure to ground fire at Pöytäkan-
Fig. 5. Mean cover (%) of the understorey nonvascular flora and ground litter in four fire severity ‘treatments’ left by wildfire. (A) ground and canopy fire at Jäkäläkangas, (B) ground fire on clear-cut figure, (C) ground and partial canopy fire at Jäkäläkangas, and (D) ground fire at Pöytäkangas. controls (succession year > 80) are different between Jäkäläkangas and Pöytäkangas.
ANN. BOT. FeNNIcI Vol. 46 • Fire intensity and vegetation succession 39
gas (D), and had thus an increased response to apparently increasing fire intensity (Schimmel & Granström 1996). The differences between ground fires at Jäkäläkangas (C) and Pöytäkan-gas (D) were most probably due to differences in fire intensity (as indicated by the ordination; Fig. 2). In addition to ground fire, ‘treatment’ C was also to some extent affected by crown fire. However, differences in the control areas indi-cated that there were also differences in initial composition.
The nonvascular flora at the burned sites was dominated namely by two pioneer moss species, Ceratodon purpureus and Polytrichum juniperinum (Wang & Kendal 2005). These spe-cies are typical in early postfire succession (e.g., Sarvas 1937, Schimmel & Granström 1996). Their regeneration strategy is invasive (coloniza-tion by dispersed spores) and they establish well on compact layers of charred humus or exposed mineral soil. Although colonization ability of these species is known to be related to fire intensity (e.g., Schimmel 1993, Schimmel & Granström 1996), there were no conclusive dif-ferences between the ‘treatments’ in our study.
While there were no differences in spe-cies richness between sites, species diversity tended to be initially higher at the more severely affected sites. On a temporal gradient however, increasing species richness, at least in the initial succession, was a logical implication of regen-eration after disturbance. In addition, the postfire species composition differed considerably from that in the control areas. Approximately 30% of all recorded species were only observed during initial succession. Most of these species were relatively rare, as considering percent coverage, but nevertheless they increased local richness. Our results support previous perceptions on an increased postfire diversity (Trabaud & Lepart 1980, Lindholm & Vasander 1987, Uotila 2004). Furthermore, 36% (9) of the species observed only in the burned areas were restricted to one ‘treatment’ only. This may partially be accounted to fire intensity (Trabaud & Lepart 1980), but since most of these species were encountered in single sampling plots chance events may have played an important role.
In addition to recognizing the effect of fire intensity, our study also provided some informa-
tion about the recovery of understorey vegeta-tion on sub-xeric coniferous forests. According to our results, residual dwarf shrubs (mainly Vaccinium myrtillus and V. vitis-idaea) gained rapidly dominance in the community in all but the most severely affected ‘treatment’ (Schim-mel & Granström 1996). However, within ten years dwarf shrubs were the dominant life form in all ‘treatments’. This clearly indicated that the post-fire communities were mostly dependent on the pre-disturbed plant community (Dyrness 1973, Foster 1985, Rego et al. 1991, Turner et al. 1997), which is a direct consequence of the adaptations of the dominant species to fire dis-turbance (or to other drastic disturbances).
Our results agree to some extent with ear-lier findings that species regeneration strategy largely determines their response to fire behav-iour (Schimmel & Granström 1996, Wang & Kendal 2005). The overall vegetation composi-tion was clearly different between severely and more lightly burned sites. Within the vascu-lar flora invader strategists (namely Epilobium angustifolium) established themselves best at the more severely burned sites. Also, sprouter strate-gists (namely the dominant dwarf shrub spe-cies), were at least initially more abundant at the more lightly burned sites as compared with the severely burned sites (Schimmel & Granström 1996, Duchesne & Wetzel 2004, Wang & Kendal 2005). The differences between our results and those of earlier studies are most probably due to habitat factors (which again translate to differ-ences in initial conditions and general vegeta-tion composition) and differences in realized fire intensity.
Acknowledgements
We thank two anonymous referees for helpful comments on the manuscript. L. R. received funding from the Nordic Centre of Excellence EcoClim project.
References
Armour, C. D., Buntings, S. C. & Neuenschwander, L. F. 1984: Fire intensity effects on the understory in ponde-rosa pine forest. — J. Range Manage. 37: 44–49.
Arocena, J. M. & Opio, C. 2003: Prescribed fire-induced

40 Ruokolainen & Salo • ANN. BOT. FeNNIcI Vol. 46
changes in properties of sub-boreal forest soils. — Geo-derma 113: 1–16.
Crawley, M. J. 2002: Statistical computing. — John Wiley & Sons Ltd., Chichester.
Duchesne, L. C. & Wetzel, S. 2004: Effects of fire intensity and depth of burn on lowbush blueberry, Vaccinium angustifolium, and velvet leaf blueberry, Vaccinium myrtilloides, production in eastern Ontario. — Can. Field-Nat. 118: 195–200.
Dyrness, C. T. 1973: Early stages of plant succession fol-lowing logging and burning in the western cascades of Oregon. — Ecology 54: 57–69.
Feller, M. C. 1982: The ecological effects of slash burning with particular reference to British Columbia: a litera-ture review. — Land Management Report No. 13, B.C. Ministry of Forests, Canada.
Feller, M. C. 1983: Impacts of prescribed fire (slashburning) on forest productivity, soil erosion and water quality on the coast. — In: Brittish Columbia Minnesota Forestry and Land Management Report: 57–91. B.C. Ministry of Forests, Canada.
Foster, D. R. 1985: Vegetation development following fire in Picea mariana (black spruce) — Pleurozium forest of South-Eastern Labrador, Canada. — J. Ecol. 73: 517–534.
Giardina, C. P. & Rhoades, C. C. 2001: Clear-cutting and burning affect on soil nutrient supply, phosphorus frac-tion and seedling growth in soils from a Wyoming a lodgepole pine forest. — For. Ecol. Manage. 140: 19–28.
Halpern, C. B. 1988: Early successional pathways and the resistence and resilience of forest communities. — Ecol-ogy 69: 1703–1715.
Halpern, C. B. 1989: Early succession patterns of forest spe-cies: interactions of life history traits and disturbance. — Ecology 70: 704–720.
Hämet-Ahti, L., Suominen, J., Ulvinen, T. & Uotila, P. 1998: Retkeilykasvio, 3rd ed. — Luonnontieteellinen keskus-museo, Kasvimuseo, Helsinki.
Heinselman, M. L. 1973: Fire in virgine forests of the Bound-ary Waters Canoe Area, Minnesota. — Quaternary Res.3: 329–382.
Hille, M. & den Ouden, J. 2005: Fuel load, humus consump-tion and humus moisture dynamics in central European Scots pine stands. — Int. J. Wildland Fire 14: 153–159.
Holmåsen, I. 1998: Lavar och mossor, 4. — Stenström Inter-publishing AB.
Johnson, E. A. 1992: Fire and vegetation dynamics: studies from North American boreal forest. — Cambridge Uni-versity Press, Cambridge, UK.
Legendre, P. & Legendre, L. 1998: Numerical ecology, 2nd English ed. — Elsevier, Amsterdam.
Lehtonen, H. & Huttunen, P. 1997: History of forest fires in eastern Finland from the fifteenth century AD — the possible effect of slash-and-burn cultivation. — The Holocene 7: 223–228.
Lindholm, T. & Vasander, H. 1987: Vegetation and stand development of mesic forest after prescribed burning. — Silva Fennica 27: 145–157.
Neary, D. G., Klopatek, C. C., DeBano, L. F. & Ffolliott,
P. F. 1999: Fire effects on belowground sustainability: a review and synthesis. — For. Ecol. Manage. 122: 51–71.
Økland, R. H. 1990: Vegetation ecology: theory, methods and applications with reference to Fennoscandia. — Som-merfeltia Suppl. 1: 1–233.
Økland, R. H. 2000: Understorey vegetation development in North Finnish Picea forests after disturbance: re-analysis of Sirén’s data. — J. Veg. Sci. 11: 533–546.
Pielou, E. C. 1975: Ecological diversity. — John Wiley & Sons, New York.
Pietikäinen, J. & Fritze, H. 1992: Microbial biomass and activity in the humus layer following burning: short term effects of teo fires. — Can. J. For. Res. 23: 1275–1285.
Raison, R. J. 1979: Modification of soil environment by veg-etation fires, with particular reference to nitrogen trans-formations: a review. — Plant & Soil 51: 73–108.
Raymond, C. L. & Peterson, D. L. 2005: Fuel treatments alter the effects of wildfire in a mixed-evergreen forest, Oregon, USA. — Can. J. For. Res. 35: 2981–2995.
Rego, F. C., Buntings, S. C. & DaSilva, J. M. 1991: Changes in understory vegetation following prescribed fire in maritime pine forests. — For. Ecol. Manage. 41: 21–31.
Ruokolainen, L. & Salo, K. 2006a: Differences in perform-ance of four ordination methods on a complex vegeta-tion dataset. — Ann. Bot. Fennici 43: 269–275.
Ruokolainen, L. & Salo, K. 2006b: The succession of boreal forest vegetation during ten years after slash-burning in Koli National Park, eastern Finland. — Ann. Bot. Fen-nici 43: 363–378.
Ryan, K. C. 2002: Dynamic interactions between forest structure and fire behavior in boreal ecosystems. — Silva Fennica 36: 13–39.
Sarvas, R. 1937: Havaintoja kasvillisuuden kehityksestä Poh-jois-Suomen kuloalueilla. — Silva Fennica 44: 32–64.
Schimmel, J. 1993: On fire. Fire behaviour, fuel succession, and vegetation processes to fire in the Swedish boreal forest. — Department of Forest Vegetation Ecology, Swedish University of Agricultural Sciences.
Schimmel, J. & Granström, A. 1996: Fire severity and veg-etation response in the boreal Swedish forest. — Ecol-ogy 77: 1436–1450.
Shafi, M. I. & Yarranton, G. A. 1973: Vegetational heteroge-neity during secondary (postfire) succession. — Can. J. Bot. 51: 73–90.
Simard, D. G., Fyles, J. W., Pare, D. & Nguyen, T. 2001: Impacts of clearcut harvesting and wildfire on soil nutri-ent status in Quebec boreal forest. — Can. J. Soil Sci. 81: 229–237.
Trabaud, L. & Lepart, J. 1980: Diversity and stability in gar-rigue ecosystems after fire. — Vegetatio 43: 49–57.
Turner, M. G. & Romme, W. H. 1994: Landscape dynamics in crown fire ecosystems. — Landsc. Ecol. 9: 59–77.
Turner, M. G., Romme, W. H., Gardner, R. H. & Hargrove, W. W. 1997: Effects of fire size and pattern on early suc-cession in Yellowstone National Park. — Ecol. Monogr.67: 411–433.
Uotila, A. 2004: Vegetation patterns in managed and semi-natural boreal forests in eastern Finland and Russian Karelia. — Faculty of Forestry, University of Joensuu.
ANN. BOT. FeNNIcI Vol. 46 • Fire intensity and vegetation succession 41
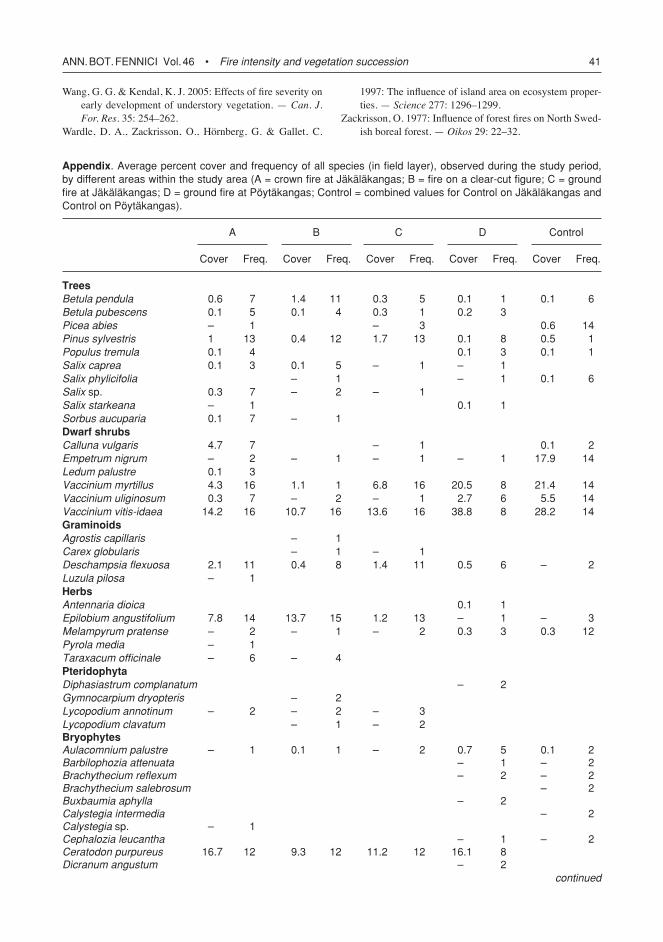
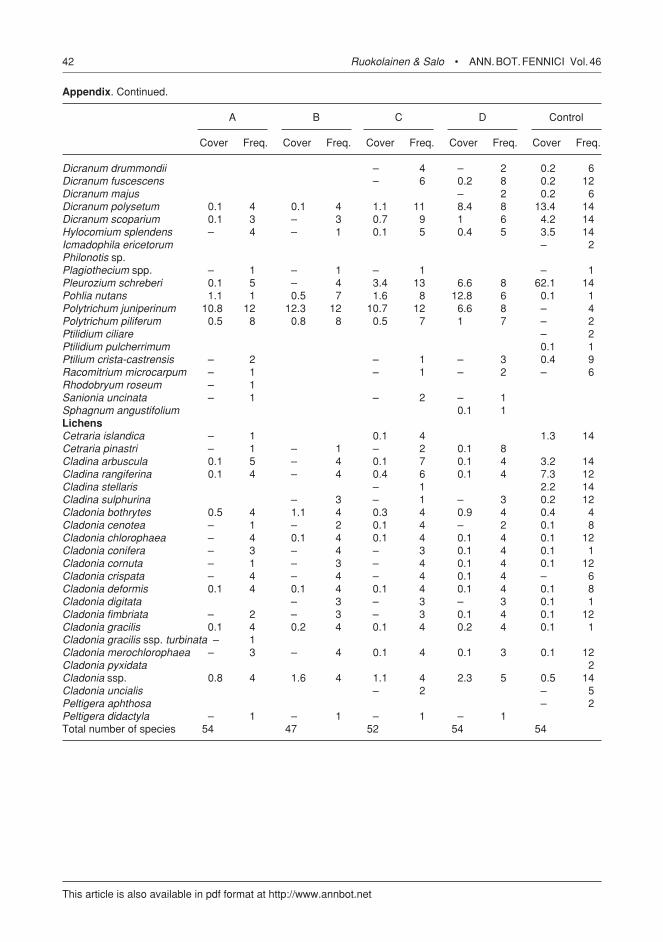
Appendix. Average percent cover and frequency of all species (in field layer), observed during the study period, by different areas within the study area (A = crown fire at Jäkäläkangas; B = fire on a clear-cut figure; c = ground fire at Jäkäläkangas; D = ground fire at Pöytäkangas; control = combined values for control on Jäkäläkangas and control on Pöytäkangas).
A B c D control
cover Freq. cover Freq. cover Freq. cover Freq. cover Freq.
Trees Betula pendula 0.6 7 1.4 11 0.3 5 0.1 1 0.1 6Betula pubescens 0.1 5 0.1 4 0.3 1 0.2 3 Picea abies – 1 – 3 0.6 14Pinus sylvestris 1 13 0.4 12 1.7 13 0.1 8 0.5 1Populus tremula 0.1 4 0.1 3 0.1 1Salix caprea 0.1 3 0.1 5 – 1 – 1 Salix phylicifolia – 1 – 1 0.1 6Salix sp. 0.3 7 – 2 – 1 Salix starkeana – 1 0.1 1 Sorbus aucuparia 0.1 7 – 1 Dwarf shrubs Calluna vulgaris 4.7 7 – 1 0.1 2Empetrum nigrum – 2 – 1 – 1 – 1 17.9 14Ledum palustre 0.1 3 Vaccinium myrtillus 4.3 16 1.1 1 6.8 16 20.5 8 21.4 14Vaccinium uliginosum 0.3 7 – 2 – 1 2.7 6 5.5 14Vaccinium vitis-idaea 14.2 16 10.7 16 13.6 16 38.8 8 28.2 14Graminoids Agrostis capillaris – 1 Carex globularis – 1 – 1 Deschampsia flexuosa 2.1 11 0.4 8 1.4 11 0.5 6 – 2Luzula pilosa – 1 Herbs Antennaria dioica 0.1 1 Epilobium angustifolium 7.8 14 13.7 15 1.2 13 – 1 – 3Melampyrum pratense – 2 – 1 – 2 0.3 3 0.3 12Pyrola media – 1 Taraxacum officinale – 6 – 4 Pteridophyta Diphasiastrum complanatum – 2 Gymnocarpium dryopteris – 2 Lycopodium annotinum – 2 – 2 – 3 Lycopodium clavatum – 1 – 2 Bryophytes Aulacomnium palustre – 1 0.1 1 – 2 0.7 5 0.1 2Barbilophozia attenuata – 1 – 2Brachythecium reflexum – 2 – 2Brachythecium salebrosum – 2Buxbaumia aphylla – 2 Calystegia intermedia – 2Calystegia sp. – 1 Cephalozia leucantha – 1 – 2Ceratodon purpureus 16.7 12 9.3 12 11.2 12 16.1 8 Dicranum angustum – 2
continued
Wang, G. G. & Kendal, K. J. 2005: Effects of fire severity on early development of understory vegetation. — Can. J. For. Res. 35: 254–262.
Wardle, D. A., Zackrisson, O., Hörnberg, G. & Gallet, C.
1997: The influence of island area on ecosystem proper-ties. — Science 277: 1296–1299.
Zackrisson, O. 1977: Influence of forest fires on North Swed-ish boreal forest. — Oikos 29: 22–32.
42 Ruokolainen & Salo • ANN. BOT. FeNNIcI Vol. 46
Appendix. continued.
A B c D control
cover Freq. cover Freq. cover Freq. cover Freq. cover Freq.
Dicranum drummondii – 4 – 2 0.2 6Dicranum fuscescens – 6 0.2 8 0.2 12Dicranum majus – 2 0.2 6Dicranum polysetum 0.1 4 0.1 4 1.1 11 8.4 8 13.4 14Dicranum scoparium 0.1 3 – 3 0.7 9 1 6 4.2 14Hylocomium splendens – 4 – 1 0.1 5 0.4 5 3.5 14Icmadophila ericetorum – 2Philonotis sp. Plagiothecium spp. – 1 – 1 – 1 – 1Pleurozium schreberi 0.1 5 – 4 3.4 13 6.6 8 62.1 14Pohlia nutans 1.1 1 0.5 7 1.6 8 12.8 6 0.1 1Polytrichum juniperinum 10.8 12 12.3 12 10.7 12 6.6 8 – 4Polytrichum piliferum 0.5 8 0.8 8 0.5 7 1 7 – 2Ptilidium ciliare – 2Ptilidium pulcherrimum 0.1 1Ptilium crista-castrensis – 2 – 1 – 3 0.4 9Racomitrium microcarpum – 1 – 1 – 2 – 6Rhodobryum roseum – 1 Sanionia uncinata – 1 – 2 – 1 Sphagnum angustifolium 0.1 1 Lichens Cetraria islandica – 1 0.1 4 1.3 14Cetraria pinastri – 1 – 1 – 2 0.1 8 Cladina arbuscula 0.1 5 – 4 0.1 7 0.1 4 3.2 14Cladina rangiferina 0.1 4 – 4 0.4 6 0.1 4 7.3 12Cladina stellaris – 1 2.2 14Cladina sulphurina – 3 – 1 – 3 0.2 12Cladonia bothrytes 0.5 4 1.1 4 0.3 4 0.9 4 0.4 4Cladonia cenotea – 1 – 2 0.1 4 – 2 0.1 8Cladonia chlorophaea – 4 0.1 4 0.1 4 0.1 4 0.1 12Cladonia conifera – 3 – 4 – 3 0.1 4 0.1 1Cladonia cornuta – 1 – 3 – 4 0.1 4 0.1 12Cladonia crispata – 4 – 4 – 4 0.1 4 – 6Cladonia deformis 0.1 4 0.1 4 0.1 4 0.1 4 0.1 8Cladonia digitata – 3 – 3 – 3 0.1 1Cladonia fimbriata – 2 – 3 – 3 0.1 4 0.1 12Cladonia gracilis 0.1 4 0.2 4 0.1 4 0.2 4 0.1 1Cladonia gracilis ssp. turbinata – 1 Cladonia merochlorophaea – 3 – 4 0.1 4 0.1 3 0.1 12Cladonia pyxidata 2Cladonia ssp. 0.8 4 1.6 4 1.1 4 2.3 5 0.5 14Cladonia uncialis – 2 – 5Peltigera aphthosa – 2Peltigera didactyla – 1 – 1 – 1 – 1 Total number of species 54 47 52 54 54
This article is also available in pdf format at http://www.annbot.net