1
The Effect of GrainSize Distribution on River Delta Morphology Rebecca L. Caldwell 1* , Douglas A. Edmonds 1 1 Department of Earth and Environmental Sciences, Boston College 140 Commonwealth Ave., Chestnut Hill, MA, 02467, * [email protected] Delta morphology is thought to be controlled by river discharge, tidal range, and wave energy. However, recent research has shown that sediment properties may have a stronger control on the physical processes, size, and shape of a delta than previously recognized. Recent numerical studies have begun to quantify this control, but have been limited to the effect of sediment cohesion and subsurface sediment properties in the basin. This study focuses on how properties of the grain-size distribution – the median, standard deviation, and skewness – delivered to the delta head affects delta form. To this end, we conduct numerical experiments using the morphodynamic physics-based model Delft3D. The model setup includes a river carrying constant discharge and sediment load entering a standing body of water devoid of tides, waves, and sea-level change. We conduct 24 runs varying the distribution’s median grain size from 0.01 – 1 mm, standard deviation from 0.1 – 3, and skewness from -0.7 – 0.7. Model results are insensitive to user defined model parameters and initial and boundary conditions. Our results show that of the three parameters tested, median grain size and standard deviation have the most substantial effect on morphology while skewness has little. At low median grain size and standard deviation deltas have 3-6 active distributaries that are relatively deep. The planform is elongate and deviates from a semi-circle, and the topset and delta-front have shallow gradients. Interestingly, as median grain size and standard deviation increase, a morphological transition occurs from deltas with elongate channels to ones with braided channels. Whether or not this transition coincides with the onset of braiding for upland alluvial channels remains to be seen. These braided deltas form at high median grain size and standard deviation, and are characterized by many active, shallow distributaries, a semi-circular planform, and steep topset and delta-front gradients. Our results suggest sediment properties exert control on delta morphology, and future analysis will aim to elucidate the underlying processes. I. ABSTRACT III. METHODOLOGY Median Grain Diameter, D 50 (mm) 1 0.1 2 3 1 km 1 km -10 -8 -6 -4 -2 0 1 2 3 Elevation above sea level (m) 1 0.5 0.25 0.1 0.05 0.01 Standard Deviation (σ) (very well sorted) (poorly sorted) IV. Results Orton, G.J., and Reading, H.G., 1993, Variability of deltaic processes in terms of sediment supply, with particular emphasis on grain size: Sedimentology, v. 40, p. 475-512 Syvitski, J.P.M., and Saito, Y., 2007, Morphodynamics of deltas under the influence of humans: Global Planet Change, v. 57, p. 261-282. V. Analysis VI. CONCLUSIONS / FUTURE WORK EP21A0652 Low D 50 and σ low topset gradient, elongate shape, fewer channels High D 50 and σ steeper topset gradient, fan-like shape, more channels Skewness results (not shown) have little effect on delta morphology Figure 5. Modeled delta morphologies that result from changes to grainsize distribution. Images are taken when the same volume of sediment has entered the system. Figure 4. Example grainsize distributions for (A) different median grain sizes (σ =1, sk=0), and (B) different standard deviations (D 50 = 0.1 mm, sk= 0). A B To meet our goals we numerically model delta growth, changing only the incoming grain-size distribution. We use Delft3D, a morphodynamic physics-based model that calculates: Hydrodynamics depth-integrated Reynolds-averaged Navier-Stokes equations Sediment transport Van Rijn (1993), (suspended and bedload) Bed evolution Exner equation The model setup consists of an initial channel (width = 250 m, depth = 2.5 m) entering a gently sloping basin, devoid of waves, tides, sea-level change, and buoyancy forces (Fig. 3). Upstream boundary conditions include constant water discharge of 1000 m 3 /s, suspended sediment load of 0.1 kg/m 3 , and equilibrium bed load flux. Downstream boundary conditions include uniform water surface elevations. We vary the incoming grain-size distribution in three ways: (1) median (D 50 ) [0.01 – 1 mm]; (2) standard deviation (σ) [0.1-4]; (3) skewness (sk) [-0.7 – 0.7]. For every D 50 (Fig. 4A) we change σ over four increments (Fig. 4B) to produce a total of 23 runs with unique combinations of D 50 and σ. Average Topset Slope 1. Measure equally spaced rays from the delta head to points on the delta shoreline 2. Assume linear slopes 3. Average rays to find a representative slope Figure 6A. Topset slope rays shown for every ~100 shoreline points. Example deltas correspond to grainsize distributions of D 50 = 0.05 mm, σ = 2 (top panel), and D 50 = 0.5 mm, σ = 2 (bottom panel). II. STATEMENT OF THE PROBLEM Figure 1. Deltas with similar ratios of marine to fluvial energy (M p :R p ) have different morphologies from elongate (A) to semicircular (B) to braided (C). Data from Syvitski and Saito (2007) and Edmonds (unpublished). Delta morphology has traditionally been explained by differences in river, wave, or tidal energy, yet deltas influenced by similar ratios of marine to river energy can display strikingly different morphologies (Fig. 1). This suggests that delta morphology may be controlled by additional variables. Previous research has qualitatively noted that grain size can influence delta morphology (Fig. 2), but a clear mechanistic understanding of this is lacking. Here we quantify how changes in grain-size distribution affect delta morphology, with the intention of developing a mechanistic understanding of the morphological changes. Figure 2. Delta morphology is related to grain size in addition to river, wave, and tidal energy. (from Orton and Reading, 1993). As D 50 and σ increase a morphological transition occurs. To quantify this we measure the following morphometric parameters: Results suggest that changing grain-size distribution creates the following trends: Planform Shape 1. Measure distances from equally spaced shoreline points to semi-circular shoreline of same area as delta 2. Take the root mean square of the deviations to measure how much the planform shape deviates from a semi-circle Figure 6B. Deviation lengths shown for every ~45 shoreline points. Example deltas from Fig. 6A are shown. Number of Channels 1. Measure number of channels along a curve that is everywhere half the distance to the shoreline from the delta head Figure 6C. Crosssection locations used for channel count, corresponding to half the distance to the shoreline. Example deltas from Fig. 6A are shown. Average Topset Slope y = 0.611x + 0.0002 R² = 0.6462 0 0.0004 0.0008 0.0012 0.0016 0 0.0004 0.0008 0.0012 0.0016 Modeled Slope Predicted Slope Figure 8. Plot of observed topset slopes from model results against predicted topset slope. Topset slope increases more strongly with respect to D 50 and than with respect to σ (Fig. 7). Interestingly, a deviation from this trend occurs in deltas built by grain- size distributions of intermediate D 50 (0.05 – 0.25 mm) (Fig. 7). We use normal flow equations and a sediment transport relation to predict slope as a function of grain size (Fig. 8). A reasonable correlation (R 2 = 0.6462) between modeled and predicted slopes suggests the change in delta slope with respect to incoming grain-size distribution is largely due to an increase in D 50 . Figure 7. Measured topset slopes (A) contoured in the D 50 vs. σ parameter space, and (B) superimposed on the images of modeled deltas. Our results suggest incoming grain-size distribution exerts a substantial control on delta morphology. This effect is evident in the following morphometric parameters: An increase in topset slope is related to larger median grain size. Elongate planform shapes are related to smaller median grain size while fan-like shapes are related to larger median grain size. More channels are produced in the presence of larger median grain sizes and higher standard deviation of the distribution. Next Steps: Measure the same morphometric parameters on a selection of global deltas using satellite images and available hydrodynamic and sediment data. Do similar morphological variations emerge using a large database of natural deltas? Can sediment properties accurately predict delta morphology? Work towards determining how grain size affects delta-building processes, and develop a mechanistic understanding of the control grain-size distribution exerts on delta morphology. The average shoreline deviation from a semi-circle describes delta planform shape as: 1. High deviation more elongate 2. Low deviation more fan-like An increase in D 50 creates deltas that are more semi-circular and fan-like (Fig. 9). Interestingly the relationship is not monotonic (Fig. 9A). Number of channels increases more strongly with respect to D 50 and than with respect to σ (Fig. 10). The gradient in number of channels is steepest at high/low D 50 (Fig. 10A). It is unclear if the increase in number of channels (Fig. 10) corresponding to increasing D 50 and σ is related to the onset of braiding due to higher slope (Fig. 7). Planform Shape Median Grain Diameter, D 50 (mm) Semicircular Elongate 1 0.1 2 3 1 0.5 0.25 0.1 0.05 0.01 A 1 0.1 2 3 1 0.5 0.25 0.1 0.05 0.01 Standard Deviation (σ) B Figure 9. Distribution of measured deviation from a semicircle (A) contoured in the D 50 vs. σ parameter space, and (B) superimposed on the images of modeled deltas. Number of Channels A Figure 10. Distribution of number of channels on center crosssection (A) contoured in the D 50 vs. σ parameter space, and (B) superimposed on images of modeled deltas. 1 0.1 2 3 1 0.5 0.25 0.1 0.05 0.01 Standard Deviation (σ) Median Grain Diameter, D 50 (mm) Shallow Slope Steep Slope 1 0.1 2 3 1 0.5 0.25 0.1 0.05 0.01 A B 0.0012 0.001 0.0008 0.0006 0.0004 0.0002 2 km 25 km Mississippi Delta D 50 = 0.014 mm M p :R p = 0.1 Lena Delta D 50 = 0.3-0.6 mm M p :R p = 0.2 Mossy Delta D 50 = 0.125 mm M p :R p = minimal 15 km A B C Figure 3. Numerical model setup. Each grid cell size is 25 x 25 m. 5625 m 7500 m -6 -4 -2 0 1 Initial channel Erodible beach Open boundaries on all three sides Upstream boundary Elevation above sea level (m) Slope 575 495 415 335 255 175 Deviation from semi-circle (m) Median Grain Diameter, D 50 (mm) Less Channels More Channels 1 0.1 2 3 1 0.5 0.25 0.1 0.05 0.01 1 0.1 2 3 1 0.5 0.25 0.1 0.05 0.01 Standard Deviation (σ) B 23 19 15 11 7 3 Number of Channels 0 0.1 0.2 0.3 0.4 0.5 -6 -2 2 6 10 14 Frequency Phi σ = 0.1 σ = 1 σ = 2 σ = 3 0 0.1 0.2 0.3 0.4 0.5 -4 -2 0 2 4 6 8 10 Frequency Phi D50 = 0.01 mm D50 = 0.05 mm D50 = 0.1 mm D50 = 0.25 mm D50 = 0.5 mm D50 = 1 mm A

The Effect of Grain Size Distribution on River Delta ... · The Effect of Grain‐Size Distribution on River Delta Morphology Rebecca L. Caldwell1*, Douglas A. Edmonds1 1Department

Embed Size (px)

Citation preview

The Effect of Grain‐Size Distribution on River Delta MorphologyRebecca L. Caldwell1*, Douglas A. Edmonds1

1Department of Earth and Environmental Sciences, Boston College140 Commonwealth Ave., Chestnut Hill, MA, 02467, *[email protected]

Delta morphology is thought to be controlled by river discharge, tidal range, and wave energy. However, recent research has shown that sediment properties may have a stronger control on the physical processes, size, and shape of a delta than previously recognized. Recent numerical studies have begun to quantify this control, but have been limited to the effect of sediment cohesion and subsurface sediment properties in the basin. This study focuses on how properties of the grain-size distribution – the median, standard deviation, and skewness – delivered to the delta head affects delta form. To this end, we conduct numerical experiments using the morphodynamic physics-based model Delft3D. The model setup includes a river carrying constant discharge and sediment load entering a standing body of water devoid of tides, waves, and sea-level change. We conduct 24 runs varying the distribution’s median grain size from 0.01 – 1 mm, standard deviation from 0.1 – 3, and skewness from -0.7 – 0.7. Model results are insensitive to user defined model parameters and initial and boundary conditions. Our results show that of the three parameters tested, median grain size and standard deviation have the most substantial effect on morphology while skewness has little. At low median grain size and standard deviation deltas have 3-6 active distributaries that are relatively deep. The planform is elongate and deviates from a semi-circle, and the topset and delta-front have shallow gradients. Interestingly, as median grain size and standard deviation increase, a morphological transition occurs from deltas with elongate channels to ones with braided channels. Whether or not this transition coincides with the onset of braiding for upland alluvial channels remains to be seen. These braided deltas form at high median grain size and standard deviation, and are characterized by many active, shallow distributaries, a semi-circular planform, and steep topset and delta-front gradients. Our results suggest sediment properties exert control on delta morphology, and future analysis will aim to elucidate the underlying processes.

I. ABSTRACT

III. METHODOLOGY

Med

ian

Gra

in D

iam

eter

, D50

(mm

)

10.1 2 3

1 km 1 km

-10

-8

-6

-4

-2

0

1

2

3

Elev

atio

n ab

ove

sea

leve

l (m

)

1

0.5

0.25

0.1

0.05

0.01

Standard Deviation (σ)(very well sorted) (poorly sorted)

IV. Results

Orton, G.J., and Reading, H.G., 1993, Variability of deltaic processes in terms of sediment supply, with particular emphasis on grain size: Sedimentology, v. 40, p. 475-512

Syvitski, J.P.M., and Saito, Y., 2007, Morphodynamics of deltas under the influence of humans: Global Planet Change, v. 57, p. 261-282.

V. Analysis

VI. CONCLUSIONS / FUTURE WORK

EP21A‐0652

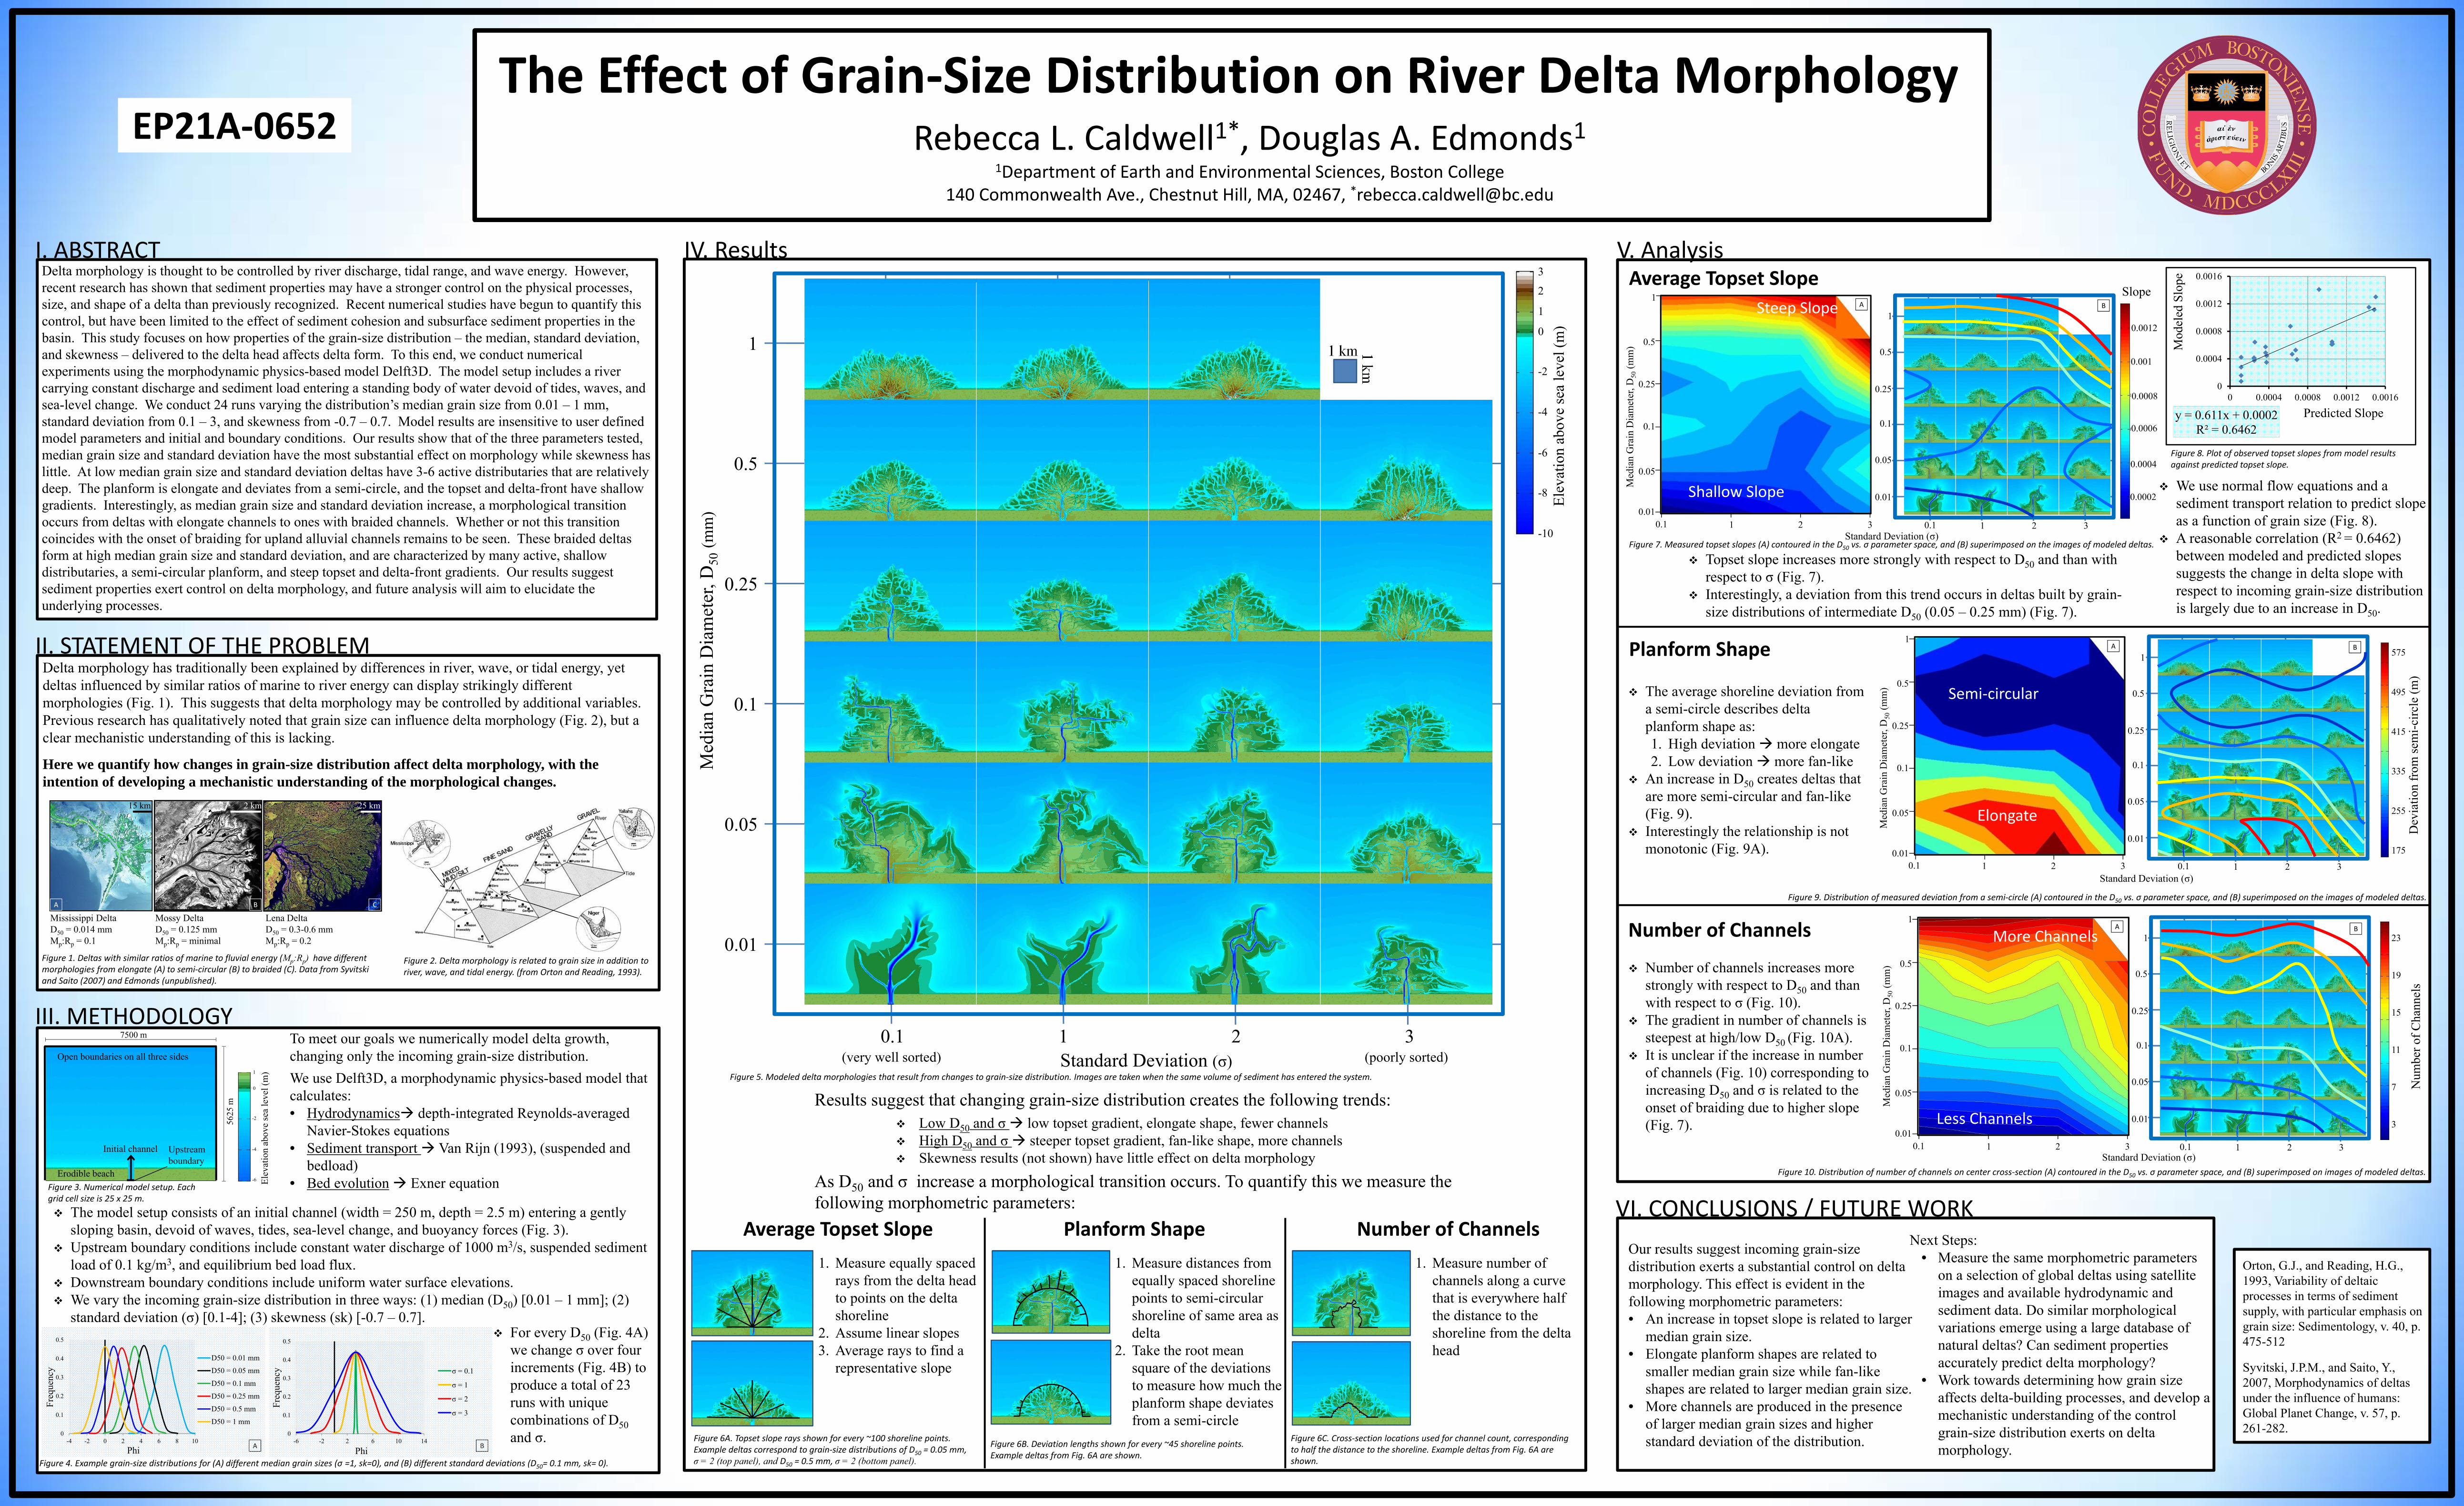
Low D50 and σ low topset gradient, elongate shape, fewer channels High D50 and σ steeper topset gradient, fan-like shape, more channels Skewness results (not shown) have little effect on delta morphology

Figure 5. Modeled delta morphologies that result from changes to grain‐size distribution. Images are taken when the same volume of sediment has entered the system. 

Figure 4. Example grain‐size distributions for (A) different median grain sizes (σ =1, sk=0), and (B) different standard deviations (D50= 0.1 mm, sk= 0).

A B

To meet our goals we numerically model delta growth, changing only the incoming grain-size distribution.We use Delft3D, a morphodynamic physics-based model that calculates:• Hydrodynamics depth-integrated Reynolds-averaged

Navier-Stokes equations• Sediment transport Van Rijn (1993), (suspended and

bedload)• Bed evolution Exner equation

The model setup consists of an initial channel (width = 250 m, depth = 2.5 m) entering a gently sloping basin, devoid of waves, tides, sea-level change, and buoyancy forces (Fig. 3).

Upstream boundary conditions include constant water discharge of 1000 m3/s, suspended sediment load of 0.1 kg/m3, and equilibrium bed load flux.

Downstream boundary conditions include uniform water surface elevations. We vary the incoming grain-size distribution in three ways: (1) median (D50) [0.01 – 1 mm]; (2)

standard deviation (σ) [0.1-4]; (3) skewness (sk) [-0.7 – 0.7]. For every D50 (Fig. 4A)

we change σ over four increments (Fig. 4B) to produce a total of 23 runs with unique combinations of D50and σ.

Average Topset Slope1. Measure equally spaced

rays from the delta head to points on the delta shoreline

2. Assume linear slopes3. Average rays to find a

representative slope

Figure 6A. Topset slope rays shown for every ~100 shoreline points. Example deltas correspond to grain‐size distributions of D50 = 0.05 mm, σ = 2 (top panel), and D50 = 0.5 mm, σ = 2 (bottom panel).

II. STATEMENT OF THE PROBLEM

Figure 1. Deltas with similar ratios of marine to fluvial energy (Mp:Rp) have different morphologies from elongate (A) to semi‐circular (B) to braided (C). Data from Syvitskiand Saito (2007) and Edmonds (unpublished).

Delta morphology has traditionally been explained by differences in river, wave, or tidal energy, yet deltas influenced by similar ratios of marine to river energy can display strikingly different morphologies (Fig. 1). This suggests that delta morphology may be controlled by additional variables. Previous research has qualitatively noted that grain size can influence delta morphology (Fig. 2), but a clear mechanistic understanding of this is lacking.

Here we quantify how changes in grain-size distribution affect delta morphology, with the intention of developing a mechanistic understanding of the morphological changes.

Figure 2. Delta morphology is related to grain size in addition to river, wave, and tidal energy. (from Orton and Reading, 1993).

As D50 and σ increase a morphological transition occurs. To quantify this we measure the following morphometric parameters:

Results suggest that changing grain-size distribution creates the following trends:

Planform Shape1. Measure distances from

equally spaced shoreline points to semi-circular shoreline of same area as delta

2. Take the root mean square of the deviations to measure how much the planform shape deviates from a semi-circle

Figure 6B. Deviation lengths shown for every ~45 shoreline points. Example deltas from Fig. 6A are shown.

Number of Channels1. Measure number of

channels along a curve that is everywhere half the distance to the shoreline from the delta head

Figure 6C. Cross‐section locations used for channel count, corresponding to half the distance to the shoreline. Example deltas from Fig. 6A are shown.

Average Topset Slope

y = 0.611x + 0.0002R² = 0.6462

0

0.0004

0.0008

0.0012

0.0016

0 0.0004 0.0008 0.0012 0.0016

Mod

eled

Slo

pe

Predicted Slope

Figure 8. Plot of observed topset slopes from model results against predicted topset slope.

Topset slope increases more strongly with respect to D50 and than with respect to σ (Fig. 7).

Interestingly, a deviation from this trend occurs in deltas built by grain-size distributions of intermediate D50 (0.05 – 0.25 mm) (Fig. 7).

We use normal flow equations and a sediment transport relation to predict slope as a function of grain size (Fig. 8).

A reasonable correlation (R2 = 0.6462) between modeled and predicted slopes suggests the change in delta slope with respect to incoming grain-size distribution is largely due to an increase in D50.

Figure 7. Measured topset slopes (A) contoured in the D50 vs. σ parameter space, and (B) superimposed on the images of modeled deltas.

Our results suggest incoming grain-size distribution exerts a substantial control on delta morphology. This effect is evident in the following morphometric parameters:• An increase in topset slope is related to larger

median grain size.• Elongate planform shapes are related to

smaller median grain size while fan-like shapes are related to larger median grain size.

• More channels are produced in the presence of larger median grain sizes and higher standard deviation of the distribution.

Next Steps:• Measure the same morphometric parameters

on a selection of global deltas using satellite images and available hydrodynamic and sediment data. Do similar morphological variations emerge using a large database of natural deltas? Can sediment properties accurately predict delta morphology?

• Work towards determining how grain size affects delta-building processes, and develop a mechanistic understanding of the control grain-size distribution exerts on delta morphology.

The average shoreline deviation from a semi-circle describes delta planform shape as:1. High deviation more elongate2. Low deviation more fan-like

An increase in D50 creates deltas that are more semi-circular and fan-like (Fig. 9).

Interestingly the relationship is not monotonic (Fig. 9A).

Number of channels increases more strongly with respect to D50 and than with respect to σ (Fig. 10).

The gradient in number of channels is steepest at high/low D50 (Fig. 10A).

It is unclear if the increase in number of channels (Fig. 10) corresponding to increasing D50 and σ is related to the onset of braiding due to higher slope (Fig. 7).

Planform Shape

Med

ian

Gra

in D

iam

eter

, D50

(mm

) Semi‐circular

Elongate

10.1 2 3

1

0.5

0.25

0.1

0.05

0.01

A

10.1 2 3

1

0.5

0.25

0.1

0.05

0.01

Standard Deviation (σ)

B

Figure 9. Distribution of measured deviation from a semi‐circle (A) contoured in the D50 vs. σ parameter space, and (B) superimposed on the images of modeled deltas.

Number of Channels A

Figure 10. Distribution of number of channels on center cross‐section (A) contoured in the D50 vs. σ parameter space, and (B) superimposed on images of modeled deltas.

10.1 2 3

1

0.5

0.25

0.1

0.05

0.01

Standard Deviation (σ)

Med

ian

Gra

in D

iam

eter

, D50

(mm

)

Shallow Slope

Steep Slope

10.1 2 3

1

0.5

0.25

0.1

0.05

0.01

A B

0.0012

0.001

0.0008

0.0006

0.0004

0.0002

2 km 25 km

Mississippi DeltaD50 = 0.014 mmMp:Rp = 0.1

Lena DeltaD50 = 0.3-0.6 mmMp:Rp = 0.2

Mossy DeltaD50 = 0.125 mmMp:Rp = minimal

15 km

A B C

Figure 3. Numerical model setup. Each grid cell size is 25 x 25 m. 

5625

m

7500 m

-6

-4

-2

0

1

Initial channel

Erodible beach

Open boundaries on all three sides

Upstream boundary

Elev

atio

n ab

ove

sea

leve

l (m

)

Slope

575

495

415

335

255

175

Dev

iatio

n fr

om se

mi-c

ircle

(m)

Med

ian

Gra

in D

iam

eter

, D50

(mm

)

Less Channels

More Channels

10.1 2 3

1

0.5

0.25

0.1

0.05

0.0110.1 2 3

1

0.5

0.25

0.1

0.05

0.01

Standard Deviation (σ)

B23

19

15

11

7

3

Num

ber o

f Cha

nnel

s

0

0.1

0.2

0.3

0.4

0.5

-6 -2 2 6 10 14

Freq

uenc

y

Phi

σ = 0.1

σ = 1

σ = 2

σ = 3

0

0.1

0.2

0.3

0.4

0.5

-4 -2 0 2 4 6 8 10

Freq

uenc

y

Phi

D50 = 0.01 mm

D50 = 0.05 mm

D50 = 0.1 mm

D50 = 0.25 mm

D50 = 0.5 mm

D50 = 1 mm

A