Embed Size (px)
Citation preview

DEPARTMENT OF FOOD TECHNOLOGY, ENGINEERING AND NUTRITION | LUND UNIVERSITY MORVARID KHEZRI & SHRUTI LALWANI | MASTER THESIS IN FOOD TECHNOLOGY 2019
The Effect of High Shear Mixers on Functionality of non-starch-based hydrocolloids


General
The Effect of High Shear Mixers on Functionality of non-starch-based
hydrocolloids
Morvarid Khezri & Shruti Lalwani
Master Thesis in Food Technology
Department of Food Technology and
Nutrition, Lund University
Supervisor
Lars Nilsson (LTH)
Dragana Arlov (Tetra Pak)
Examiner
Björn Bergenståhl


1
General
Popular Abstract
Hydrocolloids are commonly used food additives that help in modification of viscosity, texture and stability of different food products, for example dressings, meat products, juice, dairy beverages, etc. The application for hydrocolloids is wide, but one of the problems associated with hydrocolloids is that it is difficult to disperse them homogeneously which limits its utilisation to the fullest. This problem can be overcome with the help of mixing hydrocolloid in a High Shear Mixer which facilitates efficient dispersion of hydrocolloid.
In this project, the aim was to understand the effect of High Shear Mixer on the properties like viscosity, stability and texture of each hydrocolloids. Various parameters like mixing time, temperature and speed of the mixer were altered and their effect on different concentration of hydrocolloid was observed. Also, behaviour of hydrocolloids was compared both in water and different food product for example apple juice and chocolate milk. The different hydrocolloids used in this project were Xanthan, CMC, Pectin, Gellan and kappa-Carrageenan, which were chosen based on their application in beverage and dairy products.
Hydrocolloid solution were prepared in a 25 litres High Shear Mixer by varying different parameters to understand the impact of mixing on the product. Both apple juice and chocolate milk containing hydrocolloids were also prepared in the High Shear Mixer. The produced samples were analysed with the help of a rheometer (viscosity and yield stress) and texture analyser (Stevens value). Stability tests were performed for chocolate milk with the help of centrifugation.
Altering parameters like mixing speed, temperature and time have an influence on
the viscosity and texture of the hydrocolloid solution. In general, at low concentration
of hydrocolloids in water, no effect of time, temperature and speed of mixing was
observed, as the viscosity of the system was very low. While at higher concentration,
mixing time and temperature were important parameters as it affected the both the
viscosity and texture of the hydrocolloid solution. Further, the observed behaviour of
hydrocolloids in water was different from their behaviour when they were dispersed in
the food matrix. As hydrocolloids can be affected by different factors like pH, ions,
sugar, proteins, etc. in food which influences their properties.

2
General
Preface This master thesis project was performed in collaboration between Tetra Pak, Sweden and the Department of Food Technology and Nutrition, Lund University faculty of Engineering, LTH. The duration of this master thesis was from January 2019 until June 2019. The aim of this thesis was to investigate the effect of High Shear Mixer on different hydrocolloids. We wish to thank our supervisor from Tetra Pak Dragana Arlov and from LTH Lars Nilsson for all their support, encouragement and advice during our work. We also want to thank Dan Johansson and Hans Bolinsson from LTH for the help they provided all through the practical work for this thesis. Finally, we would like to thank CP Kelco, Denmark for their contribution in providing information around hydrocolloids and their application.

3
General
Table of Content
Popular Abstract ...................................................................................................................................... 1
Preface ..................................................................................................................................................... 2
1. Introduction ......................................................................................................................................... 6
1.1 Motivation ..................................................................................................................................... 6
1.2 Objectives ...................................................................................................................................... 6
1.3 Scope and limitation ...................................................................................................................... 6
2. Background .......................................................................................................................................... 7
2.1. High Shear Mixer .......................................................................................................................... 7
2.2. Basics of Hydrocolloids ................................................................................................................. 8
2.2.1. Xanthan ................................................................................................................................. 8
2.2.2. CMC ....................................................................................................................................... 9
2.2.3. Pectin ..................................................................................................................................... 9
2.2.4. Gellan gum ............................................................................................................................. 9
2.2.5. Carrageenan ........................................................................................................................ 10
2.3. Functionality of Hydrocolloid ..................................................................................................... 10
2.3.1. Rheology .............................................................................................................................. 10
2.3.1.1. Viscosity ........................................................................................................................ 11
2.3.1.2. Yield Stress ................................................................................................................... 11
2.3.2. Stability ................................................................................................................................ 12
3. Material and methods ....................................................................................................................... 13
3.1. Hydrocolloids .............................................................................................................................. 13
3.2. High Shear Mixer ........................................................................................................................ 13
3.3. Rheometer .................................................................................................................................. 14
3.4. Texture Analysis.......................................................................................................................... 16
3.5. Homogenizer .............................................................................................................................. 16
3.6. Stability test ................................................................................................................................ 16
3.7. Test Plan - Hydrocolloids in water .............................................................................................. 17
3.7.1. Preparation of the gum solutions ........................................................................................ 17
3.8. Hydrocolloids in Food-matrix ..................................................................................................... 19
3.8.1. Apple juice ........................................................................................................................... 19
3.8.2. Chocolate Milk ..................................................................................................................... 20
3.8.2.1. Chocolate milk with carrageenan ................................................................................. 20
3.8.2.2. Chocolate milk with gellan .......................................................................................... 21
4. Result and Discussion ........................................................................................................................ 22

4
General
Sources of Error: ................................................................................................................................ 22
4.1. Xanthan ...................................................................................................................................... 22
4.1.1. Water matrix ....................................................................................................................... 22
4.1.1.1. Low concentrations ..................................................................................................... 23
4.1.1.1.1. Viscosity ................................................................................................................ 23
4.1.1.2. High concentrations: .................................................................................................... 24
4.1.1.2.1. Viscosity ................................................................................................................. 24
4.1.1.2.2. Texture Analysis .................................................................................................... 26
4.1.1.2.3. Yield Stress ............................................................................................................ 26
4.1.2. Food Matrix ......................................................................................................................... 27
4.2. CMC ............................................................................................................................................ 29
4.2.1. Water Matrix ....................................................................................................................... 29
4.2.1.1. Low Concentration ....................................................................................................... 29
4.2.1.1.1. Viscosity ................................................................................................................. 29
4.2.1.2. High Concentration ...................................................................................................... 31
4.2.1.2.1. Viscosity ................................................................................................................. 31
4.2.1.2.2. Texture Analysis .................................................................................................... 32
4.2.1.2.3. Yield Stress ............................................................................................................ 33
4.2.2. Food Matrix ......................................................................................................................... 33
4.3. Pectin ..................................................................................................................................... 35
4.3.1. Water-matrix ................................................................................................................. 35
4.3.2. Food Matrix ................................................................................................................... 36
4.3.2.1. Low Concentration ................................................................................................ 37
4.3.2.2.1. Viscosity .............................................................................................................. 38
4.3.2.2.2. Texture ............................................................................................................... 39
4.4. Gellan .......................................................................................................................................... 39
4.4.1. Water Matrix ....................................................................................................................... 39
4.4.1.1. Low concentration ................................................................................................. 40
4.4.1.1.1. Viscosity ............................................................................................................. 40
4.4.1.2. High Concentration ................................................................................................ 42
4.4.1.2.1. Viscosity ............................................................................................................. 42
4.4.1.2.2. Texture ............................................................................................................... 42
4.4.1.2.3. Yield Stress ......................................................................................................... 43
4.5. Carrageenan .......................................................................................................................... 48
4.5.1. Water matrix ................................................................................................................. 48
4.5.1.1. Viscosity ................................................................................................................ 49

5
General
4.5.1.2. Yield Stress ............................................................................................................ 50
4.5.1.3. Texture .................................................................................................................. 50
4.5.2. Food-Matrix ................................................................................................................... 51
4.5.3. Cooling Effect ................................................................................................................. 53
5. Conclusion ..................................................................................................................................... 55
6. Reference ...................................................................................................................................... 56
7. Appendix ............................................................................................................................................ 58
7.1. Material and Methods ................................................................................................................ 58
7.1.1. Rheometer, Kinexus Pro+ .................................................................................................... 58
7.1.2. Texture Analyser .................................................................................................................. 58
7.1.3. Homogeniser and Centrifuge .............................................................................................. 59
7.1.4. Stability Test ............................................................................................................................ 59
7.2. Sources of Error .......................................................................................................................... 61
7.2.1. Batch to batch error: ........................................................................................................... 61
7.3. K and n values ........................................................................................................................ 64
7.3.3. Gellan ............................................................................................................................. 67
7.4. Stability Test Result ............................................................................................................... 72
7.4.1. Gellan ............................................................................................................................. 72
7.4.2. Carrageenan .................................................................................................................. 73
7.5. Effect of Calcium on carrageenan ......................................................................................... 73
7.6. Hydrocolloid Table ................................................................................................................. 75
6
General
1. Introduction
1.1 Motivation Hydrocolloids are used in various industries including food, pharmaceutical, cosmetic, etc. To utilise the full potential of the added hydrocolloid, a better understanding of their structure, thickening mechanisms, setting temperature, hydration mechanism, etc. should be known before their use. Each hydrocolloid has different properties and their behaviour with which it interacts with the different matrix like water or food, as they have different molecular interactions and chemical bonds to each other. The application for hydrocolloids is wide, but one of the problems associated with hydrocolloids is that it is very difficult to disperse them homogeneously for example CMC. Also, there is a risk of formation of fisheye, lump formation, etc. which poses a problem and are hard to overcome. With the use of High Shear Mixer, many of the above-mentioned problems with hydrocolloids can be overcome. The High Shear Mixer is a device which helps to efficiently disperse the hydrocolloid in a way that a consistent and lump-free product is produced.
1.2 Objectives The objective of this project is to understand the effect of High Shear mixer (HSM) on the rheological properties like viscosity and texture on different non-starch-based hydrocolloids. Different parameters like speed, temperature and time of mixing are altered in the HSM and their effects are observed. Commonly utilized food hydrocolloids like CMC, Xanthan, Gellan, Pectin and Carrageenan were used both in aqueous environment and in food, and a comparison was done on the behaviour of each gum on different matrices.
1.3 Scope and limitation The scope associated with this project includes understanding the behaviour of various non-starch-hydrocolloids and their interaction with water and food. It was a 20-week long project where the tasks to be done included literature research, design of experiments, running of trials, data analysis and finally writing the report. The limitation with this project was to narrow down the scope of the project to just 5 gums and the application associated were mainly beverages and dairy.

7
General
2. Background 2.1. High Shear Mixer
Figure 1: Interior of 25 litres Tetra Pak High Shear Mixer (Tetra Pak).
Batch Mixing is a process often used in food production where different ingredients in both powder and liquid forms are mixed together to obtain a consistent product. The Tetra Pak High Shear Mixer is a 25 litres vacuum mixing tank equipped with a rotor on the bottom along with a stationary stator unit shown in Figure 1. The dynamic stator in the mixer can be lowered to have high shear and raised to have low shear. A scraper is attached with the machine that improves the bulk flow of the product while mixing which can rotate in both clockwise and counter clockwise direction. The powder or any additive ingredients can be sucked into the tank with the help of vacuum, ensuring optimal dispersion and wetting of the powder in the system. Also, vacuum improves the reduction of air incorporation in the product, reducing foam formation. The product inside the tank can be heated with the help of either direct steam injection or heating from the jacket (Tetra Pak, 2019).
Stationary
stator unit
8
General
2.2. Basics of Hydrocolloids Hydrocolloid is a group of polysaccharides and proteins with a very high molecular
weight that aid in giving an improved texture to food in terms of viscosity, thickening,
gelling, stability, mouthfeel, etc. They have an affinity towards the water and can be
dissolved in water or can be dispersed well in a system with the help of shear forces.
Hydrocolloids can be either linear or branched and, if they have side groups attached
to the main structure it can have an influence on the gelling properties, solubility,
sensitivity to ions, etc. It is widely used in food industries due to their capability to
change the rheology of the food product by modifying texture and viscosity which
changes the organoleptic properties of the food. Hydrocolloids are also used in
stabilising of food product by entrapment of particles that are insoluble in continuous
phase and not letting it separate. Thus, making it very popular to be used as a food
additive. The hydrocolloids can be either naturally produced like from land plants
(Pectin) or marine algae (Carrageenan) or can be obtained with the help microbial
fermentation (Xanthan). To attain the full potential of hydrocolloid they should be
dispersed and hydrated completely in a solution. Each hydrocolloid has different
properties (molecular structure, charge, size, etc.) and thus, the hydration procedure
differs for different hydrocolloids. For example, a few hydrocolloids require the
presence of salt or sugar to be completely hydrated while the other requires a higher
temperature (Phillips and Williams, 2014).
There is a wide variety of gums that are available for example guar gum, gelatine, agar, gum arabic, etc. Though, in this study the gums were narrowed down to only 5, which are most commonly used in Tetra Pak food products. The various hydrocolloids that are used in this study are Xanthan, CMC, Gellan, Pectin and kappa Carrageenan. Properties of each hydrocolloid is mentioned briefly in Table A19. A brief description of each hydrocolloid is given below:
2.2.1. Xanthan
Xanthan gum is an extracellular polysaccharide produced by the microorganism Xanthomonas Campestris.
Hydration of xanthan depends on the several factors. One of the factors is dispersion. Poor dispersion results in lump formation during mixing. Too much lumps in the mixer prevents complete hydration and reduces the functionality of the xanthan gum. It can be improved by using high shear mixers or using dry ingredients such as sugar, starch or salt as dispersants to separate the particles. The ratio of dispersant: Xanthan of 10: 1 can be used for this purpose (Phillips and Williams, 2014). Physical separation of xanthan particles with the help of dispersant improves the dispersion and hydration. Another factor which can affect the quality of hydration is the composition of the solvent (presence of salt and pH). Also, particle size is important for proper hydration. Smaller particles disperse and hydrate faster.
Xanthan is soluble in both cold and hot water. Xanthan molecules can form helix aggregates in the solutions. Xanthan solutions show shear thinning behaviour meaning that when the shear rate is increased, viscosity is reduced because the rod like and stiff aggregates orient in the direction of the applied shear and start to flow.
9
General
Typical used concentration as thickener in food application range from 0.05% to 0.3%. Effect of salts on viscosity of xanthan solutions depends on the concentration of xanthan gum in solution. Below approximately 0.2% gum concentration, monovalent salts such as sodium chloride cause a slight fall in viscosity. At higher gum concentrations, viscosity increases as salts are added (Phillips and Williams, 2014). The viscosity of xanthan solutions is sensitive to changes in pH below pH 4.0. (Phillips and Williams, 2014).
2.2.2. CMC
Sodium carboxymethylcellulose (CMC) is a type of modified cellulose which is soluble in water. This ability is achieved by introducing carboxymethyl groups along the cellulose chain to make the hydration of the molecule possible while dispersing in the water. the association of CMC molecules with water molecules result in the increase in viscosity. CMC exhibits good solubility in both cold and hot water, but higher temperatures can ease the dissolution of gum because of the lower viscosity.
The CMC solutions demonstrate shear thinning behaviour while shearing and will be regained when the shear is removed. The viscosity of the CMC solutions decreases by increasing the temperature but increases again when the temperature is decreased. Longer heating time, especially if the temperature is above 100 °C may result in loss of viscosity. The viscosity of the solutions is stable within a pH range between 4-11. It can be used 0.05% to 0.5% in beverage applications. (Phillips and Williams, 2014).
2.2.3. Pectin
Pectin is a part of the group heteropolysaccharide containing a majority of galacturonic acid units and they are present in the cell wall of all plants. Pectin can be naturally found in various fruits in different quantity and quality. Major sources for pectin are citrus peels, apple pomace, residues left from extraction of apple juice, etc. There are different types of pectin present based on different molecular composition. There are two types of Pectin based on their degree of esterification, i.e. High methyl ester (HM) pectin and Low methyl ester (LM) pectin. In HM Pectin, 50 and more carboxyl groups are methylated while, for LM Pectin the degree of esterification is less than 50. The gelling mechanism for each of the gum is different as LM pectin forms gel in the presence of divalent cations for example calcium, while HM Pectin requires presence of both lower pH and sugar to form gels. In this study, based on the application HM pectin is used for acidic beverages.
Efficient gelation of HM pectin is highly dependent on a balance of different factors like pH, calcium concentration, pectin concentrations and if any sequestrants are present. The gelling mechanism of pectin is highly dependent on the hydrogen bonding between the carboxyl group and the alcohol groups and the hydrophobic interactions between the methyl-ester groups creating junction-zones. Optimum dissolving temperature and pH for pectin is in the range of 50-80 °C and 3-5 respectively. For effective use of pectin, it is important to disperse the solid particles before dissolving which can be accomplished with the help of High shear mixer. (Phillips and Williams, 2014).
2.2.4. Gellan gum
Gellan gum is a naturally produced polysaccharide that is an effective gelling agent which is used in the food and beverage industry. It is secreted by the micro-organism called Sphingomonas elodea. Gellan gum tends to form gels at very low
10
General
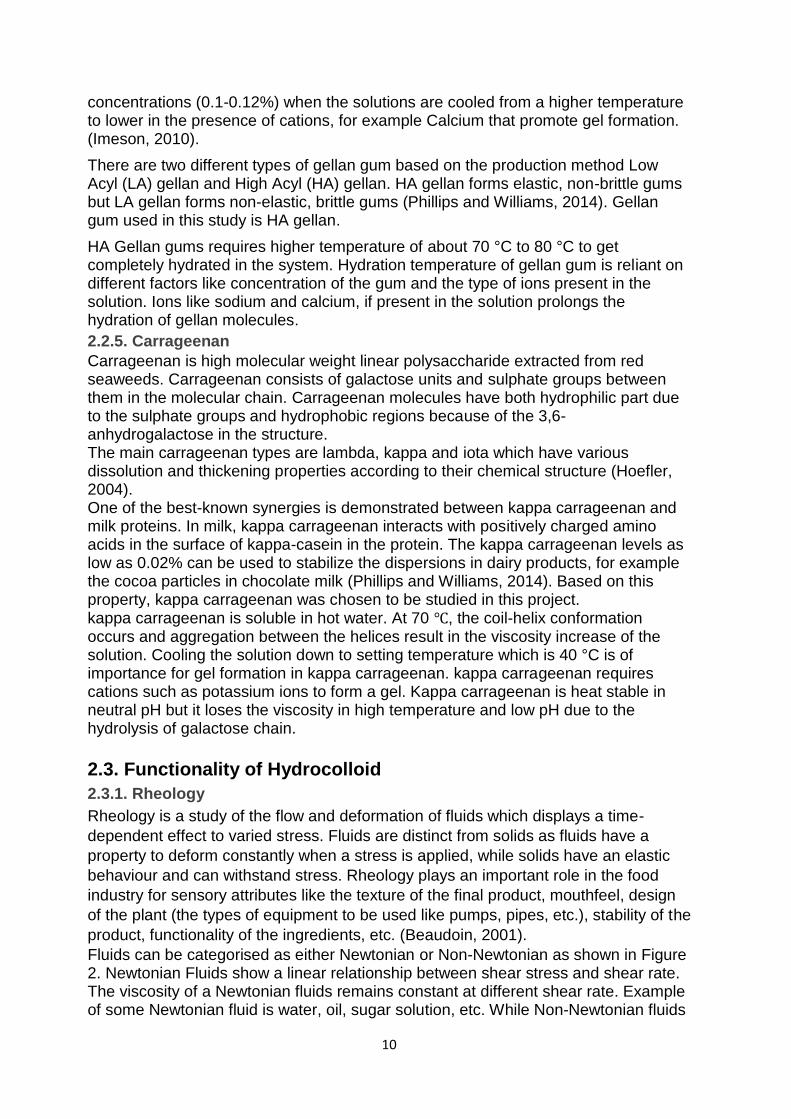
concentrations (0.1-0.12%) when the solutions are cooled from a higher temperature to lower in the presence of cations, for example Calcium that promote gel formation. (Imeson, 2010).
There are two different types of gellan gum based on the production method Low Acyl (LA) gellan and High Acyl (HA) gellan. HA gellan forms elastic, non-brittle gums but LA gellan forms non-elastic, brittle gums (Phillips and Williams, 2014). Gellan gum used in this study is HA gellan.
HA Gellan gums requires higher temperature of about 70 °C to 80 °C to get completely hydrated in the system. Hydration temperature of gellan gum is reliant on different factors like concentration of the gum and the type of ions present in the solution. Ions like sodium and calcium, if present in the solution prolongs the hydration of gellan molecules.
2.2.5. Carrageenan
Carrageenan is high molecular weight linear polysaccharide extracted from red seaweeds. Carrageenan consists of galactose units and sulphate groups between them in the molecular chain. Carrageenan molecules have both hydrophilic part due to the sulphate groups and hydrophobic regions because of the 3,6-anhydrogalactose in the structure. The main carrageenan types are lambda, kappa and iota which have various dissolution and thickening properties according to their chemical structure (Hoefler, 2004). One of the best-known synergies is demonstrated between kappa carrageenan and milk proteins. In milk, kappa carrageenan interacts with positively charged amino acids in the surface of kappa-casein in the protein. The kappa carrageenan levels as low as 0.02% can be used to stabilize the dispersions in dairy products, for example the cocoa particles in chocolate milk (Phillips and Williams, 2014). Based on this property, kappa carrageenan was chosen to be studied in this project. kappa carrageenan is soluble in hot water. At 70 ℃, the coil-helix conformation occurs and aggregation between the helices result in the viscosity increase of the solution. Cooling the solution down to setting temperature which is 40 °C is of importance for gel formation in kappa carrageenan. kappa carrageenan requires cations such as potassium ions to form a gel. Kappa carrageenan is heat stable in neutral pH but it loses the viscosity in high temperature and low pH due to the hydrolysis of galactose chain.
2.3. Functionality of Hydrocolloid
2.3.1. Rheology
Rheology is a study of the flow and deformation of fluids which displays a time-
dependent effect to varied stress. Fluids are distinct from solids as fluids have a
property to deform constantly when a stress is applied, while solids have an elastic
behaviour and can withstand stress. Rheology plays an important role in the food
industry for sensory attributes like the texture of the final product, mouthfeel, design
of the plant (the types of equipment to be used like pumps, pipes, etc.), stability of the
product, functionality of the ingredients, etc. (Beaudoin, 2001).
Fluids can be categorised as either Newtonian or Non-Newtonian as shown in Figure 2. Newtonian Fluids show a linear relationship between shear stress and shear rate. The viscosity of a Newtonian fluids remains constant at different shear rate. Example of some Newtonian fluid is water, oil, sugar solution, etc. While Non-Newtonian fluids

11
General
are the fluids that do not have a linear relationship between shear stress and shear rate. Shear stress can either increase or decrease as a function of shear rate. Non-Newtonian fluids can be further classified as shear thinning (Pseudoplastic) and shear thickening (Dilatant). Example of Non-Newtonian shear thinning fluid is ketchup and shear thickening fluids is corn-starch in water.
Figure 2: Flow behaviour and viscosity behaviour of fluids.
2.3.1.1. Viscosity
Viscosity is the measurement of the resistance to the flow of a fluid. According to Newton’s Law of Viscosity, shear stress is directly proportional to the velocity gradient. Power Law characterizes the linear relationship between the logarithm of shear rate and logarithmic of shear stress. This law is expressed with two parameters (k and n value) as equation below:
𝜁 = 𝐾𝛾𝑛…………………………………. (Equation 1)
In the above equation, 𝜁 is shear stress and 𝛾 is shear rate, K is the consistency
coefficient and n are the power law exponent. n value helps in the determination of
the flow behaviour of the fluid. If the value of n equals to 1 it shows that the fluid has
Newtonian properties, when n is less than one it shows shear-thinning behaviour
while it shows shear thickening properties if n is more than one.
2.3.1.2. Yield Stress
Yield stress is the stress that is required for the fluid to start flowing. Yield stress can be measured using different methods for example Amplitude Oscillatory measurements. The advantage of using this method is that it helps in understanding both the elastic component (G’) and the viscous component of the sample (G’’). In hydrocolloid solutions, when the shear is applied, the stored energy is due to the stretching of chains but when there is frictional movement in the chains there is energy loss. When a lower frequency is applied to the system, the stress is due to the translational motion of the molecules which does not deform the molecules and thus
Shear Thinning
Newtonian
Shear Thickening

12
General
the viscous component (G’’) dominates in the system. At higher frequencies, molecules are distorted and the difference between elastic component (G’) and viscous component (G’’) value reduces as shown in Figure 3 b). For hydrocolloid gel, the molecules have a three-dimensional continuous polymer network which can be stretched and deformed. The network bonding forces would keep the structure from the transitional movement; thus, the elastic component of the system dominates as shown in Figure 3(a), the crossover point where both the viscous component and elastic component meet is the corresponding yield stress of the sample. (Heldman, Lund and Sabliov, 2007)
Figure 3: Illustration of viscous component (G’’) and elastic component (G’) in two cases: a) Elastic component is higher than the viscous component and the yield stress can be determined from the point of crossover. b) Viscous component higher than elastic component depicting no yield stress.
2.3.2. Stability
Most of the dispersions are thermodynamically unstable. The factors affecting the stability is the particle size of the dispersed phase or the density difference in the phases present in the system. The interaction between the phases determines the stability of the system. Interactions could either be attractive or repulsive. There is different type of instability that occurs in a dispersion:
• Creaming or Sedimentation is a separation caused due to the density difference leading to either upward or downward motion of the particle.
• Ostwald Ripening is caused when smaller droplets aggregate together thus forming a larger droplet.
• Coalescence is a process in which the droplets fuse together with other droplets.
• Flocculation is the aggregation of the droplets which is caused due to the collision. (Beckett, 1996)
Chocolate milk is a suspension meaning that cocoa particle (solid particles) is suspended in milk (continuous phase). As cocoa particle is hydrophobic in nature, they do not dissolve in milk and thus, if not mixed they end up as a sediment. To avoid the cocoa particle to sediment, hydrocolloids are added to slow down the process of sedimentation.
Vis
cou
s co
mp
on
ent
(G’’
) P
a
Elas
tic
com
po
nen
t (G
’) P
a
Vis
cou
s co
mp
on
ent
(G’’
) P
a
Elas
tic
com
po
nen
t (G
’) P
a
13
General
3. Material and methods
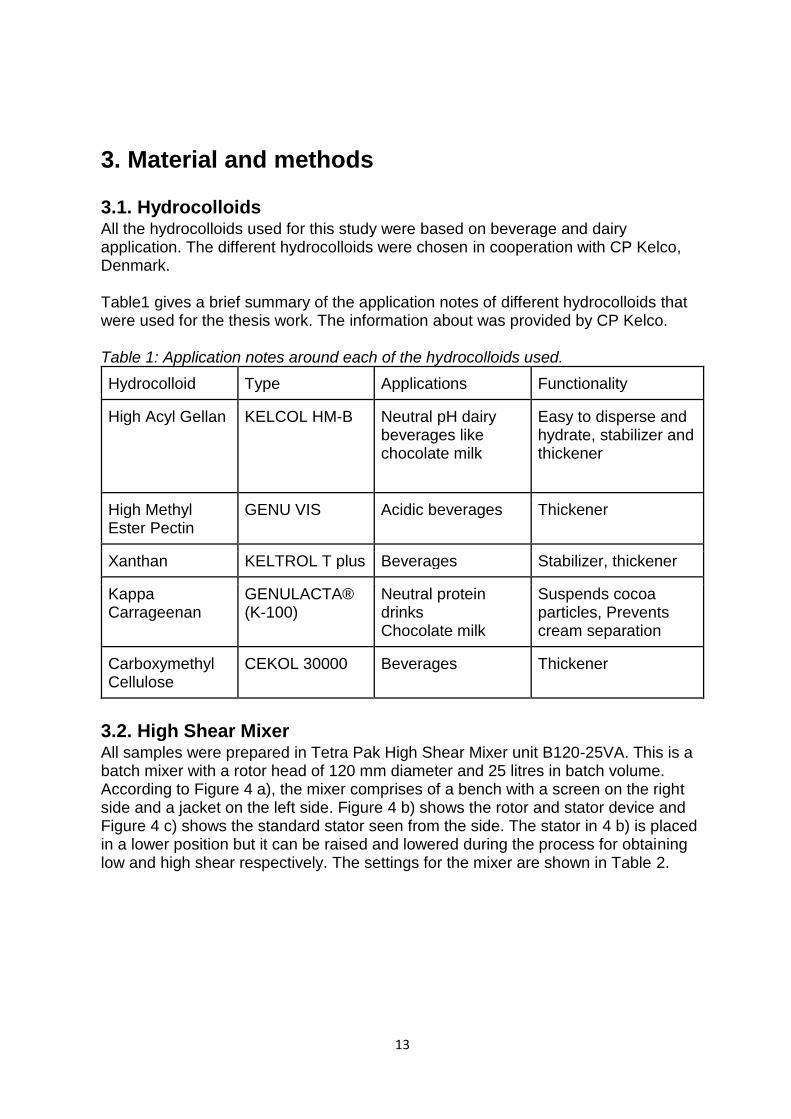
3.1. Hydrocolloids All the hydrocolloids used for this study were based on beverage and dairy application. The different hydrocolloids were chosen in cooperation with CP Kelco, Denmark. Table1 gives a brief summary of the application notes of different hydrocolloids that were used for the thesis work. The information about was provided by CP Kelco. Table 1: Application notes around each of the hydrocolloids used.
Hydrocolloid Type Applications Functionality
High Acyl Gellan KELCOL HM-B Neutral pH dairy beverages like chocolate milk
Easy to disperse and hydrate, stabilizer and thickener
High Methyl Ester Pectin
GENU VIS Acidic beverages Thickener
Xanthan KELTROL T plus Beverages Stabilizer, thickener
Kappa Carrageenan
GENULACTA® (K-100)
Neutral protein drinks Chocolate milk
Suspends cocoa particles, Prevents cream separation
Carboxymethyl Cellulose
CEKOL 30000 Beverages Thickener
3.2. High Shear Mixer All samples were prepared in Tetra Pak High Shear Mixer unit B120-25VA. This is a batch mixer with a rotor head of 120 mm diameter and 25 litres in batch volume. According to Figure 4 a), the mixer comprises of a bench with a screen on the right side and a jacket on the left side. Figure 4 b) shows the rotor and stator device and Figure 4 c) shows the standard stator seen from the side. The stator in 4 b) is placed in a lower position but it can be raised and lowered during the process for obtaining low and high shear respectively. The settings for the mixer are shown in Table 2.
14
General
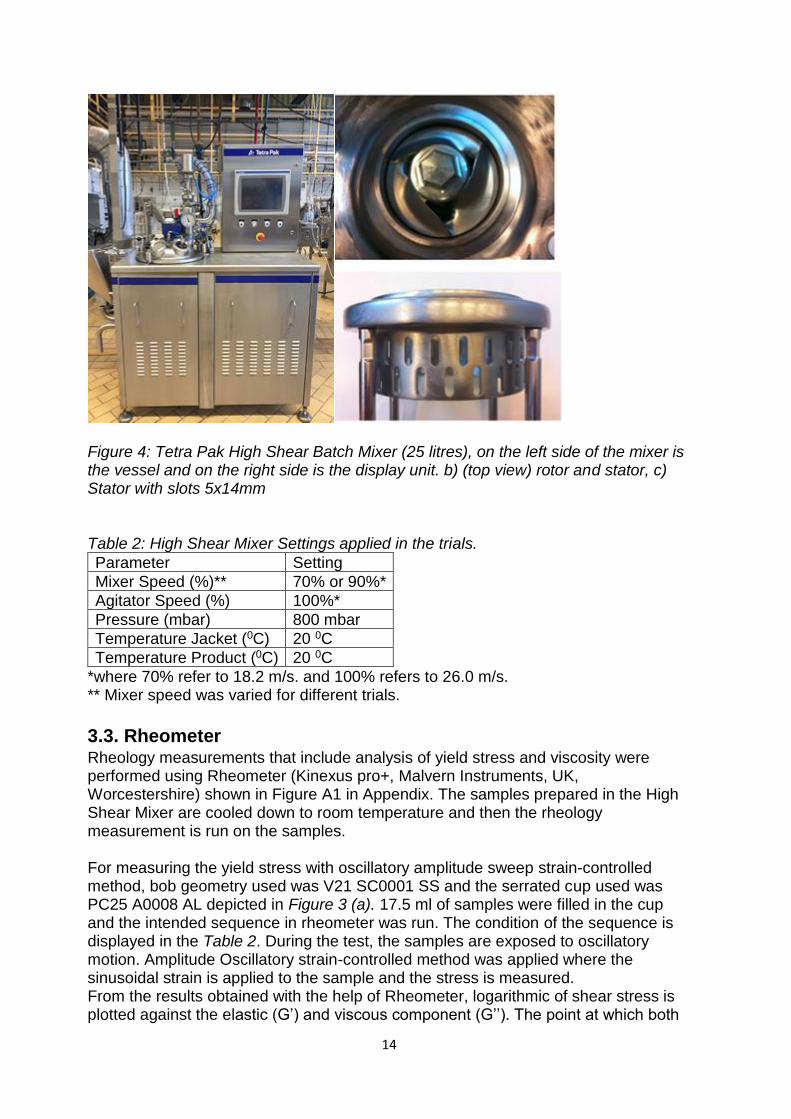
Figure 4: Tetra Pak High Shear Batch Mixer (25 litres), on the left side of the mixer is the vessel and on the right side is the display unit. b) (top view) rotor and stator, c) Stator with slots 5x14mm Table 2: High Shear Mixer Settings applied in the trials.
Parameter Setting
Mixer Speed (%)** 70% or 90%*
Agitator Speed (%) 100%*
Pressure (mbar) 800 mbar
Temperature Jacket (0C) 20 0C
Temperature Product (0C) 20 0C
*where 70% refer to 18.2 m/s. and 100% refers to 26.0 m/s. ** Mixer speed was varied for different trials.
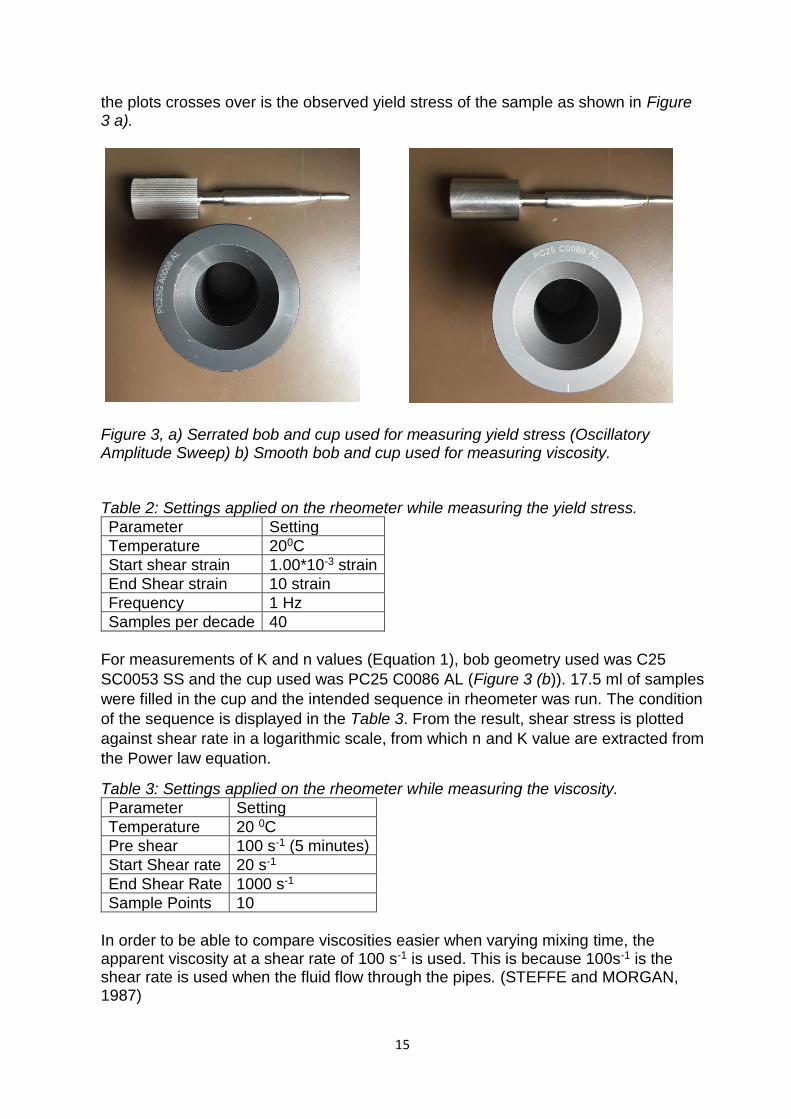
3.3. Rheometer Rheology measurements that include analysis of yield stress and viscosity were performed using Rheometer (Kinexus pro+, Malvern Instruments, UK, Worcestershire) shown in Figure A1 in Appendix. The samples prepared in the High Shear Mixer are cooled down to room temperature and then the rheology measurement is run on the samples. For measuring the yield stress with oscillatory amplitude sweep strain-controlled method, bob geometry used was V21 SC0001 SS and the serrated cup used was PC25 A0008 AL depicted in Figure 3 (a). 17.5 ml of samples were filled in the cup and the intended sequence in rheometer was run. The condition of the sequence is displayed in the Table 2. During the test, the samples are exposed to oscillatory motion. Amplitude Oscillatory strain-controlled method was applied where the sinusoidal strain is applied to the sample and the stress is measured. From the results obtained with the help of Rheometer, logarithmic of shear stress is plotted against the elastic (G’) and viscous component (G’’). The point at which both
15
General
the plots crosses over is the observed yield stress of the sample as shown in Figure 3 a).
Figure 3, a) Serrated bob and cup used for measuring yield stress (Oscillatory Amplitude Sweep) b) Smooth bob and cup used for measuring viscosity. Table 2: Settings applied on the rheometer while measuring the yield stress.
Parameter Setting
Temperature 200C
Start shear strain 1.00*10-3 strain
End Shear strain 10 strain
Frequency 1 Hz
Samples per decade 40
For measurements of K and n values (Equation 1), bob geometry used was C25
SC0053 SS and the cup used was PC25 C0086 AL (Figure 3 (b)). 17.5 ml of samples
were filled in the cup and the intended sequence in rheometer was run. The condition
of the sequence is displayed in the Table 3. From the result, shear stress is plotted
against shear rate in a logarithmic scale, from which n and K value are extracted from
the Power law equation.
Table 3: Settings applied on the rheometer while measuring the viscosity.
Parameter Setting
Temperature 20 0C
Pre shear 100 s-1 (5 minutes)
Start Shear rate 20 s-1
End Shear Rate 1000 s-1
Sample Points 10
In order to be able to compare viscosities easier when varying mixing time, the apparent viscosity at a shear rate of 100 s-1 is used. This is because 100s-1 is the shear rate is used when the fluid flow through the pipes. (STEFFE and MORGAN, 1987)

16
General
3.4. Texture Analysis The gelling properties of the samples were observed by measuring the Stevens values using a Texture Analyser (TA-XT2i, Stable Microsystems, UK, Godalming) shown in Figure 4 (a) with a disc plunger probe with a diameter of 40mm (Figure 4 (b)). The force was applied with the help of probe to the glass beaker containing 100 ml of gum solution. The compression force was recorded as a function of time. The conditions for the texture analyser are given below in the Table A1. The Stevens value was obtained as the average values of the compression force between the 5- 11 s (Cedergårdh, F., 2014)
Figure 4: a) Texture Analyser (TA-XT2i, Stable Microsystems, UK, Godalming). b) Disc Plunger Probe used for the texture analysis.
3.5. Homogenizer Homogenization is used for Chocolate Milk to prevent creaming or sedimentation of the fat and cacao particles, also it helps in the stability of the chocolate milk. High-Pressure Homogenizer consists of a high-pressure piston pump which forces the fluid to pass a narrow gap at a very high speed. This pressure causes the particles in the chocolate milk to become uniform giving stability to the final product. For a homogenized product, high pressure Panda PLUS homogenizer is used (Figure A3(a)). It is a small size table top unit used for liquid products. The product is filled in the hopper continuously, which is then pumped to the two-stage homogeniser with the help of suction valve. Post the homogenisation, the product comes out of the pipe and can be collected in a beaker. The conditions used for the homogenization of chocolate milk are 180 bars at 700C.
3.6. Stability test Stability properties of the chocolate milk was checked by using the Centrifuge Allegra X-15R (Figure A3(b)). The process of sedimentation of cocoa particles can be accelerated with the help of mechanical stress in centrifugation method.

17
General
The chocolate milk samples were filled up to 10 ml in the centrifuge tubes and the tests were run at 1500 rpm for 15 minutes at 200C. After the centrifugation, the tubes were taken out and with the help of a scale, the height of the sediment deposited was noted. Method development for stability test is given in Appendix section 7.1.4.
3.7. Test Plan - Hydrocolloids in water Table 4: Different Parameters used for making samples in High Shear Mixer.
Gum Type Concentration (%)
Temperature (℃)
Speed (%)
Gellan KELCOL HM-B 0.10 0.15
1
60 80
70 90
Xanthan KELTROL T plus 0.05 0.10
1
20 60
70 90
Carrageenan GENULACTA® (K-100)
0.02 0.5 1.0
70 70
CMC CEKOL 30000 0.05 0.10 1.00
20 60
70 90
The test plan included varying four different parameters and testing the functionality of the hydrocolloids. The four parameters that were varied are rotor speed, temperature, hydrocolloid concentration and mixing time as shown above in Table 4. Thus, all the trials were designed in a way that one of the parameters was changing and the rest of the parameter were constant. Initially, all the trials were performed in lower concentration as the anticipated food matrix was beverages and dairy. But later, to understand the functionality of hydrocolloids better, higher concentration was included as well. For each hydrocolloid, different test conditions were followed according to their best practice properties. For example, xanthan and CMC can be dissolved in both cold and hot water and thus the temperature used for these gums were 200C and 600C. While, gellan needs higher temperature for dispersion and thus the tests were performed at 600C and 800C. And for carrageenan, it was dispersed at 200C and then heated to 700C and cooled down while mixing in the High Shear Mixer. The test plan designed for each gum is different and are mentioned separately in the Result and Discussion section.
3.7.1. Preparation of the gum solutions
For the preparation of the solution of CMC, Xanthan and Gellan, the samples were prepared by filling the Tetra Pak High Shear Mixer with 15 litres of water. If the temperature used for the sample preparation is above room temperature, steam is applied onto the jacket of the mixer in order to reach the desired temperature. Further, the hydrocolloid is added according to the required concentration. To

18
General
facilitate the dispersion of gum in the system and to avoid the sticking of gum on the surface or the scraper, for the first thirty seconds only the mixer is turned on with stator down. To have a vacuum in the system, a pressure of 800 mbar is set. After 30 seconds, we turn on the agitator speed to 100%. Samples are taken at different mixing times (as shown in Table 9, 12 and 16 for Xanthan, CMC and Gellan respectively). After the trial, the mixing tank is emptied and cleaned. Figure 5 below depicts the procedure:
Figure 5. Procedure for the solution of CMC, Xanthan and Gellan Gum The preparation method for carrageenan was different due its different dispersion characteristics. For the preparation of solutions with carrageenan, 15 litres of water were added in the High Shear Mixer. The gum was added to the water at 200C and mixed in the mixer. A few samples were collected to check the dispersion of the gum. Further, steam was injected onto the jacket and the system was heated up to 700C. Keeping the temperature 700C the system was mixed for 18 minutes and samples were taken at different mixing times (shown in Table 17). After 18 minutes of mixing, the system was cooled from 700C to 300C and samples were collected. After the trial, the mixing tank is emptied and cleaned. Figure 6 below depicts the procedure:
Figure 6. Procedure for the solution of Carrageenan Gum
Mixing
Tank is
emptied
Fill 15
litres of
water in
HSM
Pre-
Heating
if
required
Addition
of gum
Samples taken
at different time
Heat to
700C
Mixing
continued
until 18
minutes
Cooling
till 300C
is
reached
Fill 15
litres of
water in
HSM
Addition
of gum
Mixing
and
Disperse
the gum
Samples taken
at different time

19
General
3.8. Hydrocolloids in Food-matrix
Table 5: Different hydrocolloids used for the preparation of Apple juice and chocolate milk.
Gum Type Concentration (%) Food Matrix
CMC CEKOL 30000 0.05 Apple Juice
Pectin GENU VIS 0.20 2
Apple Juice
Xanthan KELTROL T plus 0.05 Apple Juice
Carrageenan GENULACTA® (K-100) 0.02 Chocolate Milk
Gellan KELCOL HM-B 0.12 Chocolate Milk
The test plan used for food matrix is mentioned in Table 5. The preparation of samples was done at mixer speed of 70%. Viscosity measurement and stability test were performed on the samples obtained from chocolate milk. For apple juice only viscosity measurement was performed.
3.8.1. Apple juice
Apple juice is made in a 15-litre batch in High Shear Mixer, ingredients used are mentioned in Table 6, the steps followed are as shown in Figure 7:
Figure 7. Procedure for the making apple juice for different hydrocolloids. For making the apple juice, first, all the wet ingredients (water, apple juice concentrate, citric acid) were poured in the High Shear Mixer. After which dry ingredients like sugar and the gum were added. Mixing of all the ingredients was performed in the mixer at 20 0C for 2 minutes with mixing speed of 70% and samples are taken. The mixing was continued while the system is heated up to 80 0C (3 minutes) and mixing is continued until 3 minutes between which the samples at
Mixing
continued
until 3
minutes
Cooling
till 40C is
reached
Add all the
wet
ingredients
in HSM
Addition
of gum
and dry
ingredient
s
Mixing and
Disperse
the gum at
20C for 2
mins
Samples taken
at different time
Heat up
to 80 oC
20
General
different time are collected (as shown in Table 15). After 3 minutes, the system is cooled down until 40 0C is reached and a final sample is collected. Different concentration of gum was used for making apple juice like CMC (0.05%), Xanthan (0.05%) and Pectin (0.2%). Table 6: Ingredients used in making Apple juice.
Component % In 15 litres
Apple juice concentrate 18 2.7 litres
Sucrose 2 300g
Water 80 12 litres
Citric Acid (50% w/v) 0.3 45ml
3.8.2. Chocolate Milk
In the Table 7, ingredient list is mentioned to make the chocolate milk. The two gums used for making chocolate milk were Carrageenan and Gellan. Different methods were used to make the water solution for gellan and carrageenan. Thus, to compare the behaviour of gum in water and food, the methods used by respective gums in water were used in making chocolate milk as well. The methods used in each case are as follows:
3.8.2.1. Chocolate milk with carrageenan
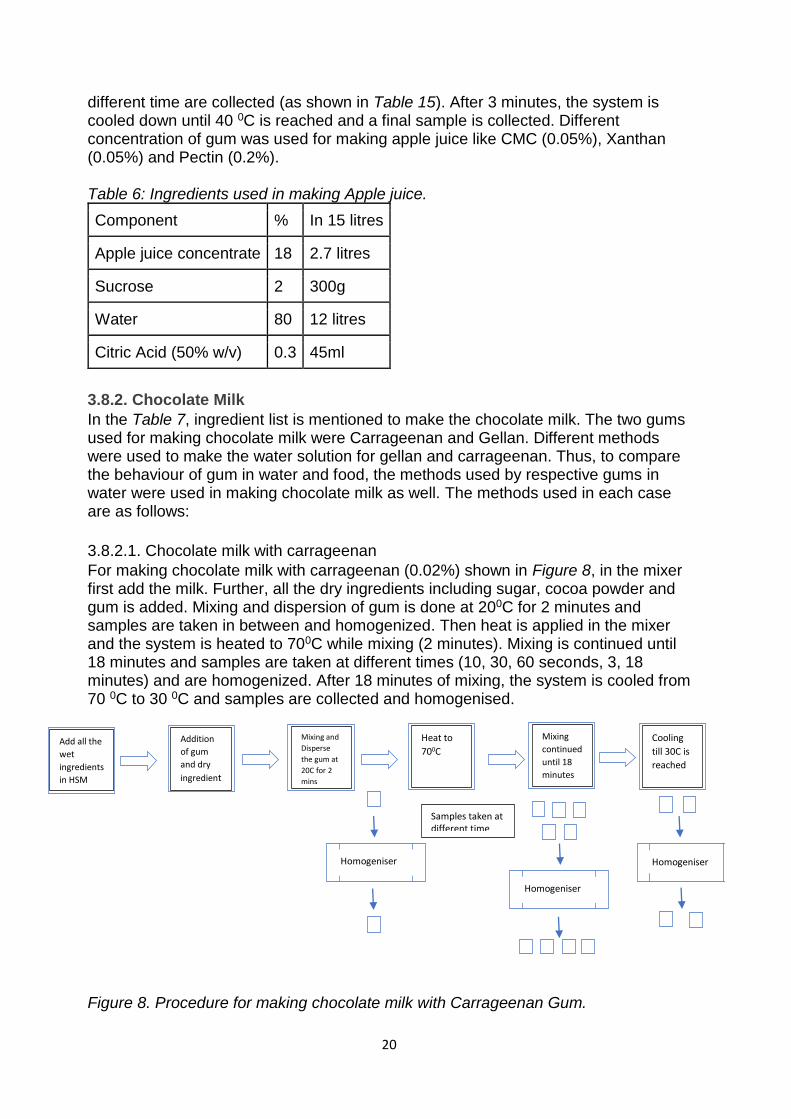
For making chocolate milk with carrageenan (0.02%) shown in Figure 8, in the mixer first add the milk. Further, all the dry ingredients including sugar, cocoa powder and gum is added. Mixing and dispersion of gum is done at 200C for 2 minutes and samples are taken in between and homogenized. Then heat is applied in the mixer and the system is heated to 700C while mixing (2 minutes). Mixing is continued until 18 minutes and samples are taken at different times (10, 30, 60 seconds, 3, 18 minutes) and are homogenized. After 18 minutes of mixing, the system is cooled from 70 0C to 30 0C and samples are collected and homogenised.
Figure 8. Procedure for making chocolate milk with Carrageenan Gum.
Add all the
wet
ingredients
in HSM
Addition
of gum
and dry
ingredient
s
Mixing and
Disperse
the gum at
20C for 2
mins
Heat to
700C
Mixing
continued
until 18
minutes
Cooling
till 30C is
reached
Samples taken at different time
Homogeniser Homogeniser
Homogeniser

21
General
3.8.2.2. Chocolate milk with gellan
For making chocolate milk with gellan (0.12%) shown in Figure 9, in the mixer first add the milk. Further, all the dry ingredients like sugar and cocoa powder are added. Mixing is done and heat is applied in the mixer and the system is heated to 600C (2 minutes). When 600C is reached, gellan is added in the mixer. Mixing is continued until 18 minutes and samples are taken at different times (10, 30, 60 seconds, 3, 18 minutes) and are homogenized. After 18 minutes of mixing, the system is cooled from 600C to 300C and samples are collected and homogenised.
Figure 9. Procedure for making chocolate milk with Gellan Gum. Table 7: Ingredients used in making Chocolate Milk.
Ingredient % In 15 litres
Milk 3% fat 90,48 13.57 litres
Cacao Powder 1.5 225 grams
Sugar 8 1200 grams
Add all
the wet
ingredient
s in HSM
Addition
of dry
ingredie
nts
Mixing
Heat to
60C and
addition
of gum
Mixing
continued
until 18
minutes
Cooling
till 30C is
reached
Samples taken at
different time
Homogeniser Homogeniser
Homogeniser

22
General
4. Result and Discussion
Sources of Error: Plausible source of error must be considered during the measurements and the goal
is to eliminate as many sources of error that can be possible. One of the errors that
was considered is the measurement error. Measurement error is the variation
between a quantity that has been measured and its true value. This may include
random error or the error which is expected in the experiment due to small human
error. Or it includes systematic error which is caused by the machine due to mis-
calibration. Thus, to overcome this error, triplicates of samples were performed, and
two standard deviation was done on the average of the values achieved. If two
standard deviation is performed on the distribution it is in about 95% confidence
interval. Batch to batch error was also calculated while reiterating 5 batches.
(Bevington, 1991) The method used to calculate Batch to batch variation and
measurement error is shown in Appendix section 7.2.
The result from the analysis are given in Table 8. Batch to batch variation was larger
in comparison with the measurement error.
Table 8: Source of error.
Method Standard
Deviation (%)
Confidence
interval
Viscosity Batch to batch variation (5 batches) 6.5 95%
Viscosity Measurement Error (3 samples) 1.8 95%
Texture Analyser Measurement Error (3 samples) 2.97 95%
4.1. Xanthan
4.1.1. Water matrix
For the water-matrix the concentration chosen for xanthan was based on the
beverage application (0.05% and 0.1%) to compare the functionality of gum in water
and food. However, to understand the functionality of Xanthan at higher
concentration, 1% of xanthan solution was prepared as well. Test conditions used in
the case of Xanthan is given below in Table 9.

23
General
Table 9. Test conditions for Xanthan solutions in water-matrix
Concentration (%)
Temperature (oC)
Mixing speed (%)
Time (s)
0.05 20 70 180-600-1200
90 180-600-1200
60 70 180-600-1200
90 180-600-1200
0.1 20 70 180-600-1200
90 180-600-1200
60 70 180-600-1200
90 180-600-1200
1 20 70 10-30-60-180-1080
60 70 10-30-60-180-1080
4.1.1.1. Low concentrations
4.1.1.1.1. Viscosity
Effect of mixing speed and mixing time: To understand the effect of mixing speed
and time, plots were made based on apparent viscosity (at 100s-1) as a function of
time. Figure 10 depicts the effect of speed on the apparent viscosity of 0.05% and
0.1% xanthan solutions at 200C during the mixing time.
Figure 10: Apparent Viscosity of 0.05% xanthan solution at 100 1/s versus mixing
time at 20 0C at two speeds, 70% and 90%. Error bar is showing standard deviation
error with 95% confidence interval.
According to the Figure 10, the curves at different mixing speeds (i.e. 70% and 90%)
lie in the measurement error range. Thus, depicting that there is no effect of shear
speed on Xanthan. It can also be observed that as the mixing time is increased, no
loss in viscosity is seen.
5
7
9
11
13
15
17
19
0 500 1000 1500
Ap
par
ent
visc
osi
ty@
10
0 1
/s s
hea
r ra
te
[mP
as]
Time [s]
0.05%, speed 70%
0.05%, speed 90%
0.1%, speed 70%
0.1%, speed 90%
24
General
Therefore, both mixing time and speed do not have any effect on the viscosity of the
Xanthan solution at low concentrations.
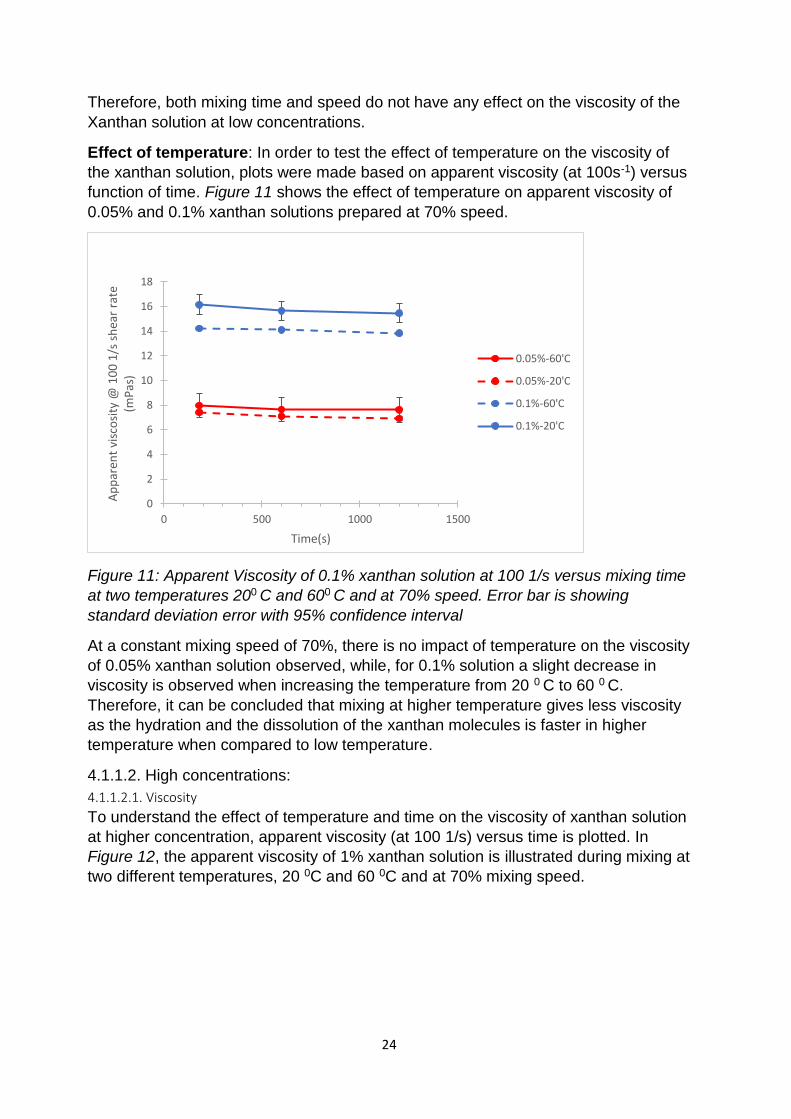
Effect of temperature: In order to test the effect of temperature on the viscosity of
the xanthan solution, plots were made based on apparent viscosity (at 100s-1) versus
function of time. Figure 11 shows the effect of temperature on apparent viscosity of
0.05% and 0.1% xanthan solutions prepared at 70% speed.
Figure 11: Apparent Viscosity of 0.1% xanthan solution at 100 1/s versus mixing time
at two temperatures 200 C and 600 C and at 70% speed. Error bar is showing
standard deviation error with 95% confidence interval
At a constant mixing speed of 70%, there is no impact of temperature on the viscosity
of 0.05% xanthan solution observed, while, for 0.1% solution a slight decrease in
viscosity is observed when increasing the temperature from 20 0 C to 60 0 C.
Therefore, it can be concluded that mixing at higher temperature gives less viscosity
as the hydration and the dissolution of the xanthan molecules is faster in higher
temperature when compared to low temperature.
4.1.1.2. High concentrations:
4.1.1.2.1. Viscosity
To understand the effect of temperature and time on the viscosity of xanthan solution
at higher concentration, apparent viscosity (at 100 1/s) versus time is plotted. In
Figure 12, the apparent viscosity of 1% xanthan solution is illustrated during mixing at
two different temperatures, 20 0C and 60 0C and at 70% mixing speed.
0
2
4
6
8
10
12
14
16
18
0 500 1000 1500
Ap
par
ent
visc
osi
ty @
10
0 1
/s s
hea
r ra
te
(mP
as)
Time(s)
0.05%-60'C
0.05%-20'C
0.1%-60'C
0.1%-20'C
25
General
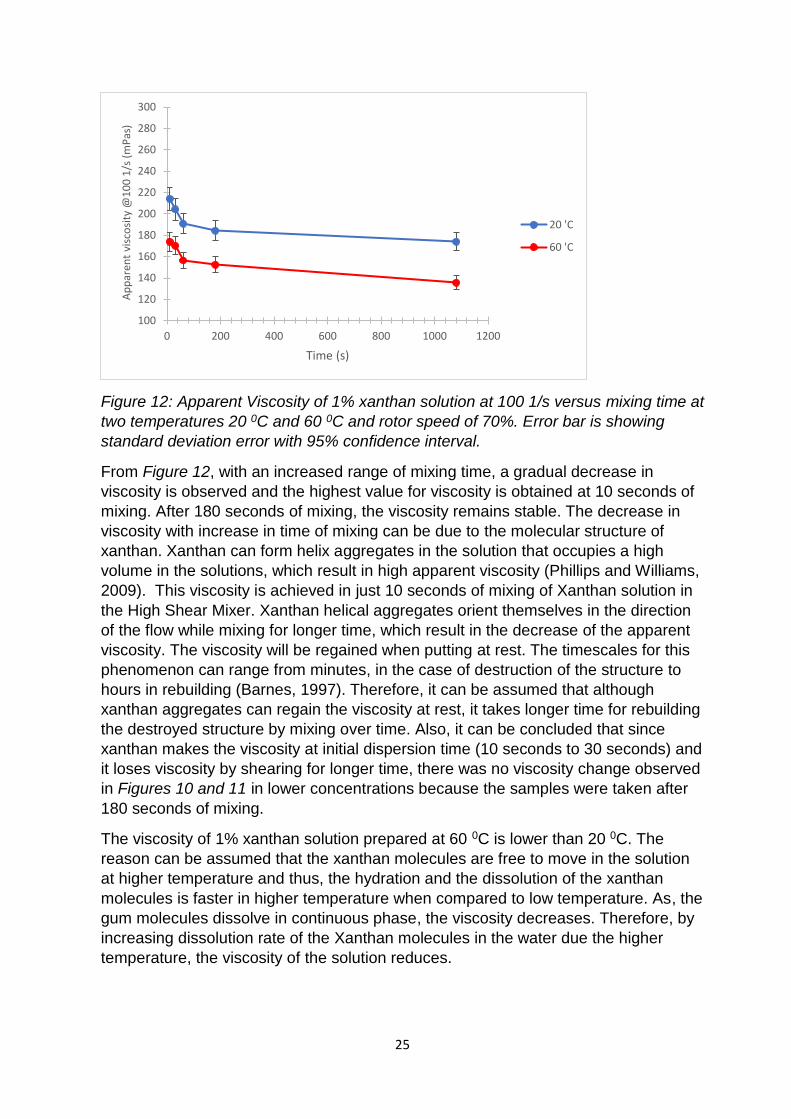
Figure 12: Apparent Viscosity of 1% xanthan solution at 100 1/s versus mixing time at
two temperatures 20 0C and 60 0C and rotor speed of 70%. Error bar is showing
standard deviation error with 95% confidence interval.
From Figure 12, with an increased range of mixing time, a gradual decrease in
viscosity is observed and the highest value for viscosity is obtained at 10 seconds of
mixing. After 180 seconds of mixing, the viscosity remains stable. The decrease in
viscosity with increase in time of mixing can be due to the molecular structure of
xanthan. Xanthan can form helix aggregates in the solution that occupies a high
volume in the solutions, which result in high apparent viscosity (Phillips and Williams,
2009). This viscosity is achieved in just 10 seconds of mixing of Xanthan solution in
the High Shear Mixer. Xanthan helical aggregates orient themselves in the direction
of the flow while mixing for longer time, which result in the decrease of the apparent
viscosity. The viscosity will be regained when putting at rest. The timescales for this
phenomenon can range from minutes, in the case of destruction of the structure to
hours in rebuilding (Barnes, 1997). Therefore, it can be assumed that although
xanthan aggregates can regain the viscosity at rest, it takes longer time for rebuilding
the destroyed structure by mixing over time. Also, it can be concluded that since
xanthan makes the viscosity at initial dispersion time (10 seconds to 30 seconds) and
it loses viscosity by shearing for longer time, there was no viscosity change observed
in Figures 10 and 11 in lower concentrations because the samples were taken after
180 seconds of mixing.
The viscosity of 1% xanthan solution prepared at 60 0C is lower than 20 0C. The
reason can be assumed that the xanthan molecules are free to move in the solution
at higher temperature and thus, the hydration and the dissolution of the xanthan
molecules is faster in higher temperature when compared to low temperature. As, the
gum molecules dissolve in continuous phase, the viscosity decreases. Therefore, by
increasing dissolution rate of the Xanthan molecules in the water due the higher
temperature, the viscosity of the solution reduces.
100
120
140
160
180
200
220
240
260
280
300
0 200 400 600 800 1000 1200
Ap
par
ent
visc
osi
ty @
10
0 1
/s (
mP
as)
Time (s)
20 'C
60 'C

26
General
4.1.1.2.2. Texture Analysis
The Stevens value of 1% xanthan solution were obtained using the texture analyser.
The Stevens value as the function of mixing time was plotted as shown in Figure
13.
Figure 13: Stevens value of 1% xanthan solution versus mixing time at two
temperatures, 20 0C and 60 0C and mixing speed of 70%. Error bar is showing
standard deviation error with 95% confidence interval.
By increasing the mixing time there is a reduction in Stevens value. This behaviour
follows the viscosity result and the explanation is given in Section 4.1.1.2.1.
4.1.1.2.3. Yield Stress
Yield stress of 1% xanthan solution which was mixed for 10 seconds, at 70% speed
and 60 0C, was measured by using Amplitude oscillatory sweep method in
rheometer. The result is depicted in Figure 14.
5
7
9
11
13
15
17
19
21
23
25
0 200 400 600 800 1000 1200
Stev
ens
valu
e (g
)
Time (s)
Concentration 1%
20 'C
60 'C
27
General
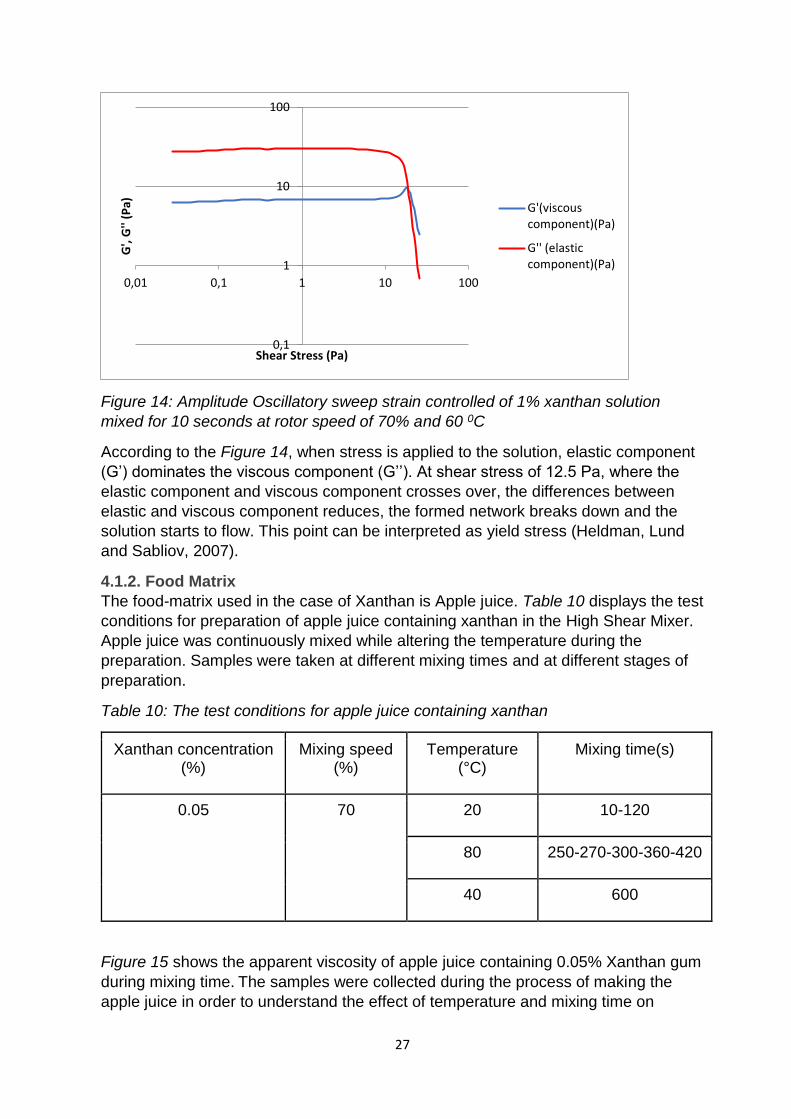
Figure 14: Amplitude Oscillatory sweep strain controlled of 1% xanthan solution
mixed for 10 seconds at rotor speed of 70% and 60 0C
According to the Figure 14, when stress is applied to the solution, elastic component
(G’) dominates the viscous component (G’’). At shear stress of 12.5 Pa, where the
elastic component and viscous component crosses over, the differences between
elastic and viscous component reduces, the formed network breaks down and the
solution starts to flow. This point can be interpreted as yield stress (Heldman, Lund
and Sabliov, 2007).
4.1.2. Food Matrix
The food-matrix used in the case of Xanthan is Apple juice. Table 10 displays the test
conditions for preparation of apple juice containing xanthan in the High Shear Mixer.
Apple juice was continuously mixed while altering the temperature during the
preparation. Samples were taken at different mixing times and at different stages of
preparation.
Table 10: The test conditions for apple juice containing xanthan
Xanthan concentration (%)
Mixing speed (%)
Temperature (°C)
Mixing time(s)
0.05 70 20 10-120
80 250-270-300-360-420
40 600
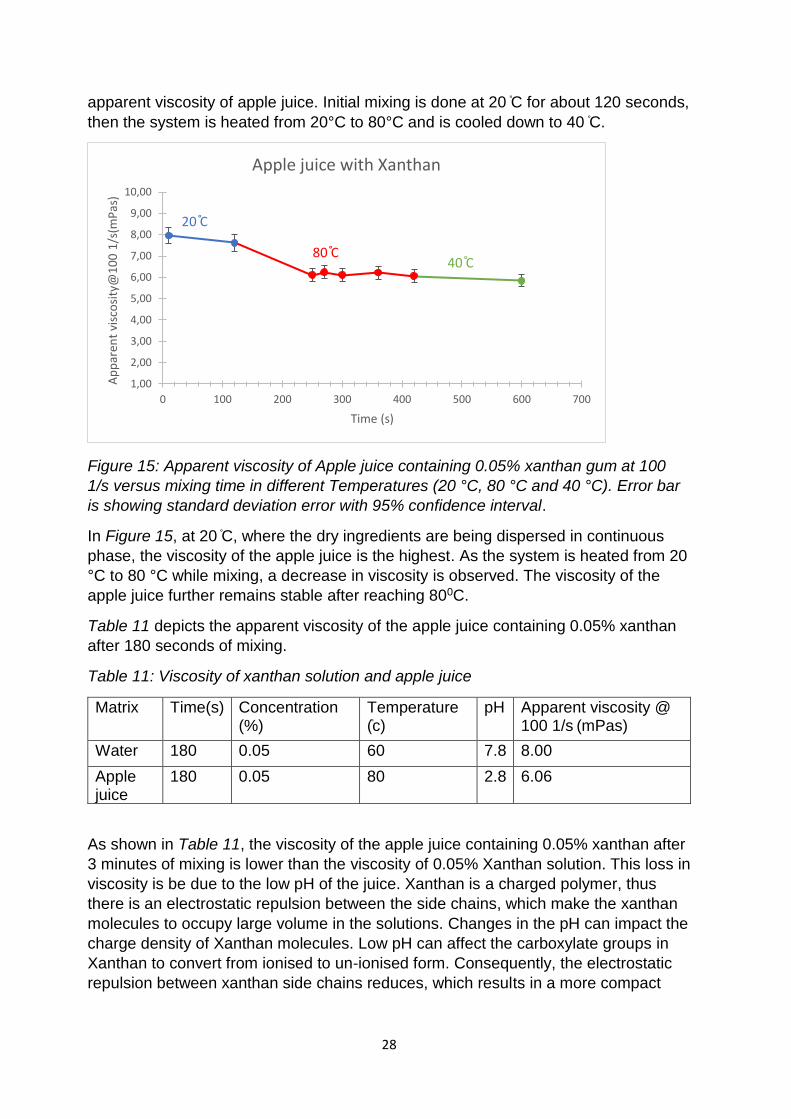
Figure 15 shows the apparent viscosity of apple juice containing 0.05% Xanthan gum
during mixing time. The samples were collected during the process of making the
apple juice in order to understand the effect of temperature and mixing time on
0,1
1
10
100
0,01 0,1 1 10 100
G',
G''
(Pa)
Shear Stress (Pa)
G'(viscouscomponent)(Pa)
G'' (elasticcomponent)(Pa)
28
General
apparent viscosity of apple juice. Initial mixing is done at 20 ֯C for about 120 seconds,
then the system is heated from 20°C to 80°C and is cooled down to 40 ֯C.
Figure 15: Apparent viscosity of Apple juice containing 0.05% xanthan gum at 100
1/s versus mixing time in different Temperatures (20 °C, 80 °C and 40 °C). Error bar
is showing standard deviation error with 95% confidence interval.
In Figure 15, at 20 ֯C, where the dry ingredients are being dispersed in continuous
phase, the viscosity of the apple juice is the highest. As the system is heated from 20
°C to 80 °C while mixing, a decrease in viscosity is observed. The viscosity of the
apple juice further remains stable after reaching 800C.
Table 11 depicts the apparent viscosity of the apple juice containing 0.05% xanthan
after 180 seconds of mixing.
Table 11: Viscosity of xanthan solution and apple juice
Matrix Time(s) Concentration (%)
Temperature (֯c)
pH Apparent viscosity @ 100 1/s (mPas)
Water 180 0.05 60 7.8 8.00
Apple juice
180 0.05 80 2.8 6.06
As shown in Table 11, the viscosity of the apple juice containing 0.05% xanthan after
3 minutes of mixing is lower than the viscosity of 0.05% Xanthan solution. This loss in
viscosity is be due to the low pH of the juice. Xanthan is a charged polymer, thus
there is an electrostatic repulsion between the side chains, which make the xanthan
molecules to occupy large volume in the solutions. Changes in the pH can impact the
charge density of Xanthan molecules. Low pH can affect the carboxylate groups in
Xanthan to convert from ionised to un-ionised form. Consequently, the electrostatic
repulsion between xanthan side chains reduces, which results in a more compact
1,00
2,00
3,00
4,00
5,00
6,00
7,00
8,00
9,00
10,00
0 100 200 300 400 500 600 700
Ap
par
ent
visc
osi
ty@
10
0 1
/s(m
Pas
)
Time (s)
Apple juice with Xanthan
20 ֯C
80 ֯C40 ֯C

29
General
molecular structure and therefore, less volume occupation of the molecules which
causes a loss in the viscosity (Phillips and Williams, 2009).
Apple juice was prepared at 80 0C and it is assumed that the loss of viscosity
because of the low pH can be more in high temperature due to the acceleration of
acid hydrolysis of the polysaccharide (Phillips and Williams, 2009). This can be the
reason of viscosity loss when heating from 20 0C to 80 0C while preparation of apple
juice (Figure 15) because there was no effect of temperature observed on the
viscosity of 0.05% of Xanthan in water matrix.
In conclusion, the viscosity of 1% of xanthan in water decreased by increasing the
time of mixing from 10 seconds to 60 seconds, and after 60 seconds the viscosity of
the system remains stable. However, at low concentrations since the samples were
taken after 180 seconds of mixing, thus, there was no effect of mixing time observed.
Mixing speed had no effect on xanthan solution at low concentration. Temperature of
mixing had no influence on 0.05% xanthan solution while the viscosity decreased for
0.1% and 1% of xanthan solution when increasing the temperature. Also, the elastic
component for 1% Xanthan solution is higher than the viscous component. Finally,
when xanthan is dispersed in apple juice, loss in viscosity was observed when
compared to water matrix due to low pH of the juice.
4.2. CMC
4.2.1. Water Matrix
For water-matrix, the concentration chosen for CMC was based on the beverage
application (0.05% and 0.1%) to be able to compare the functionality of gum in water
and food. However, to understand the functionality of CMC at higher concentration,
1% of CMC solution was prepared as well. Test conditions used in the case of CMC
is given below in Table 12.
Table 12: Test conditions for CMC solutions in water.
Concentration (%) Temperature (0C) Speed (%) Time (s)
0.05 20
70 90
180-360-1080
60 70 90
0.1 20
70 90
180-360-1080
60 70 90
1 20
70 10-30-60 180-1080
60
4.2.1.1. Low Concentration
4.2.1.1.1. Viscosity
The effect of mixing speed and mixing time: For understanding the effect of
mixing speed and mixing time on the viscosity of the CMC solution, plots were made

30
General
based on apparent viscosity (at 100s-1) versus mixing time. Figure 16 depicts the
apparent viscosity of 0.05% and 0.1% CMC solutions during the mixing time at 60 °C.
Figure 16: Apparent Viscosity of 0.05% and 0.1% CMC solution at 100 1/s versus
mixing time at two mixing speeds, 70% and 90% at 60 °C. Error bar is showing
standard deviation error with 95% confidence interval.
According to the Figure 16, at each concentration (0.05 and 0.1%), it is observed that
there is no effect of mixing time on the viscosity. Also, the curves at different mixing
speeds (i.e. 70% and 90%) lie in the error range, showing there is no effect of mixing
speed on the viscosity of 0.0.5% and 0.1% CMC solutions.
Effect of temperature: For testing the effect of temperature on the viscosity of the
CMC solution, plots were made based on apparent viscosity (at 100s-1) versus
function of time. In Figure 17, the effect of temperature on the apparent viscosity of
0.05% and 0.1% CMC solutions is displayed when prepared at 70% of mixing speed.
0
2
4
6
8
10
12
14
16
0 200 400 600 800 1000 1200
Ap
par
ent
visc
osi
ty@
10
0 1
/s [
mP
as]
Time [s]
0.05%, speed 70%
0.05%, speed 90%
0.1%, speed 70%
0.1%, speed 90%
31
General
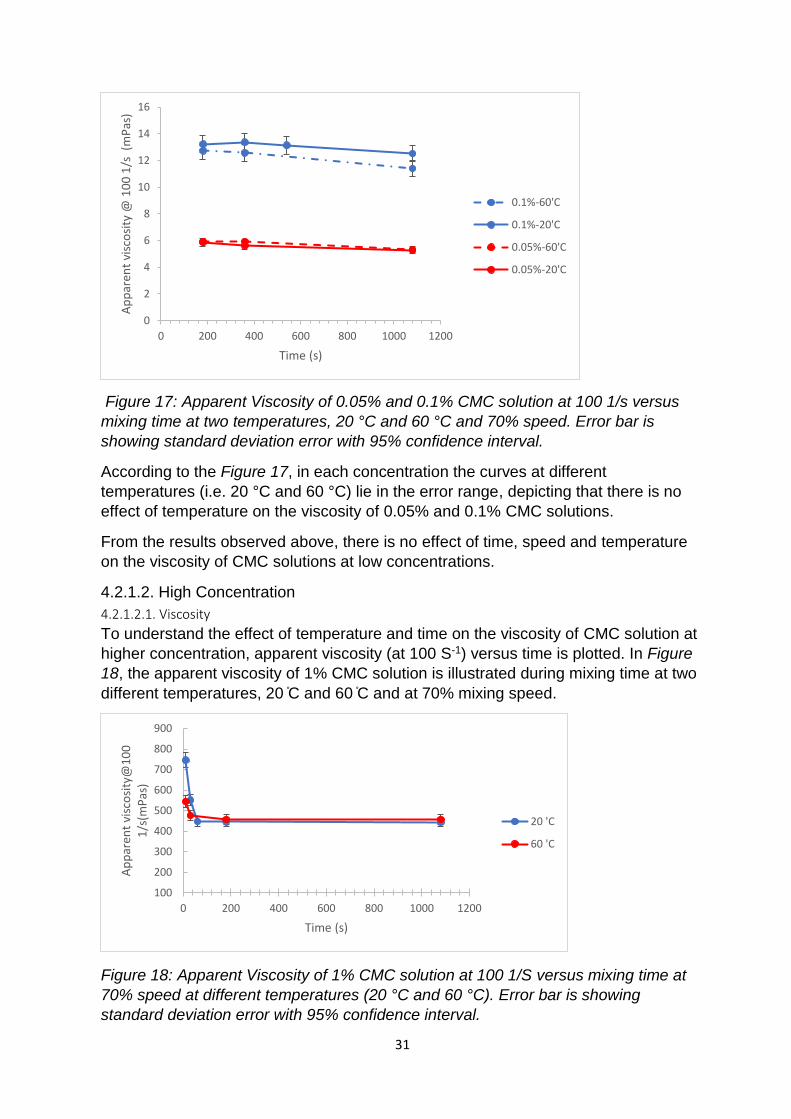
Figure 17: Apparent Viscosity of 0.05% and 0.1% CMC solution at 100 1/s versus
mixing time at two temperatures, 20 °C and 60 °C and 70% speed. Error bar is
showing standard deviation error with 95% confidence interval.
According to the Figure 17, in each concentration the curves at different
temperatures (i.e. 20 °C and 60 °C) lie in the error range, depicting that there is no
effect of temperature on the viscosity of 0.05% and 0.1% CMC solutions.
From the results observed above, there is no effect of time, speed and temperature
on the viscosity of CMC solutions at low concentrations.
4.2.1.2. High Concentration
4.2.1.2.1. Viscosity
To understand the effect of temperature and time on the viscosity of CMC solution at
higher concentration, apparent viscosity (at 100 S-1) versus time is plotted. In Figure
18, the apparent viscosity of 1% CMC solution is illustrated during mixing time at two
different temperatures, 20 ֯C and 60 ֯C and at 70% mixing speed.
Figure 18: Apparent Viscosity of 1% CMC solution at 100 1/S versus mixing time at
70% speed at different temperatures (20 °C and 60 °C). Error bar is showing
standard deviation error with 95% confidence interval.
0
2
4
6
8
10
12
14
16
0 200 400 600 800 1000 1200
Ap
par
ent
visc
osi
ty @
10
0 1
/s (
mP
as)
Time (s)
0.1%-60'C
0.1%-20'C
0.05%-60'C
0.05%-20'C
100
200
300
400
500
600
700
800
900
0 200 400 600 800 1000 1200
Ap
par
ent
visc
osi
ty@
10
0
1/s
(mP
as)
Time (s)
20 'C
60 'C

32
General
As it is shown in Figure 18, in 1% of concentration of CMC solution, at 20 °C there is
an abrupt loss in viscosity, during the initial time of mixing (up to 60 seconds) and
then the viscosity remains stable. However, at 60°C, there is a gradual decrease in
viscosity (up to 30 seconds) observed and after that the viscosity remains stable.
At initial mixing time (up to 60 seconds), the viscosity of the solutions prepared at
60°C is lower than viscosities at 20°C. While, after 60 seconds of mixing there is no
difference in viscosity of the CMC solutions observed at two different temperatures
(20°C and 60°C).
CMC is an anionic gum due to the presence of carboxymethyl groups. When CMC is
dispersed in water, the polar groups will participate with the Hydrogen bonding of
water. As the polymer is highly charged, the electrostatic repulsion between
molecules arises. As a result, the polymer swells occupying a large apparent volume
fraction and hence increase in viscosity is observed (Hoefler, A.,2004). This peak
viscosity is reached in initial mixing time. Further mixing results in the orientation of
CMC molecules in the direction of the flow in the solution and thus, a decrease in the
viscosity is observed from 10 seconds to 60 seconds. This can also be the reason
why there was no viscosity change in low concentration, since no samples were
taken before 180 seconds (depicted in Figure 16 and 17).
In higher temperature, the viscosity of 1% CMC solution is lower. The reason can be
since in high temperature dissolution of CMC occurs more rapidly in the solution.
Thus, the viscosity is lower at higher temperature (60 °C), when compared to the
viscosity at lower temperature (20 °C).
4.2.1.2.2. Texture Analysis
Figure 19 shows the Stevens values of CMC solutions during the mixing time at
temperatures 20 °C and 60 °C.
Figure 19. Stevens value for 1% CMC solutions as the function of time at 20°C and
60 °C, at 70% speed. Error bar is showing standard deviation error with 95%
confidence interval
6
7
8
9
10
11
12
13
14
15
0 200 400 600 800 1000 1200
Stev
ens
valu
e (g
)
Time[s]
60 'C
20 'C
33
General
According to the Figure 19, at a specific temperature, there is a no effect of mixing
time observed on Stevens values of CMC solutions. The reason speculated is due to
the ability of CMC molecules to regain their structure at rest.
Preparation of the gum in higher temperature gives a lower Stevens value to the
CMC solutions. The reason is because of the rapid dissolution of the molecules in
higher temperature.
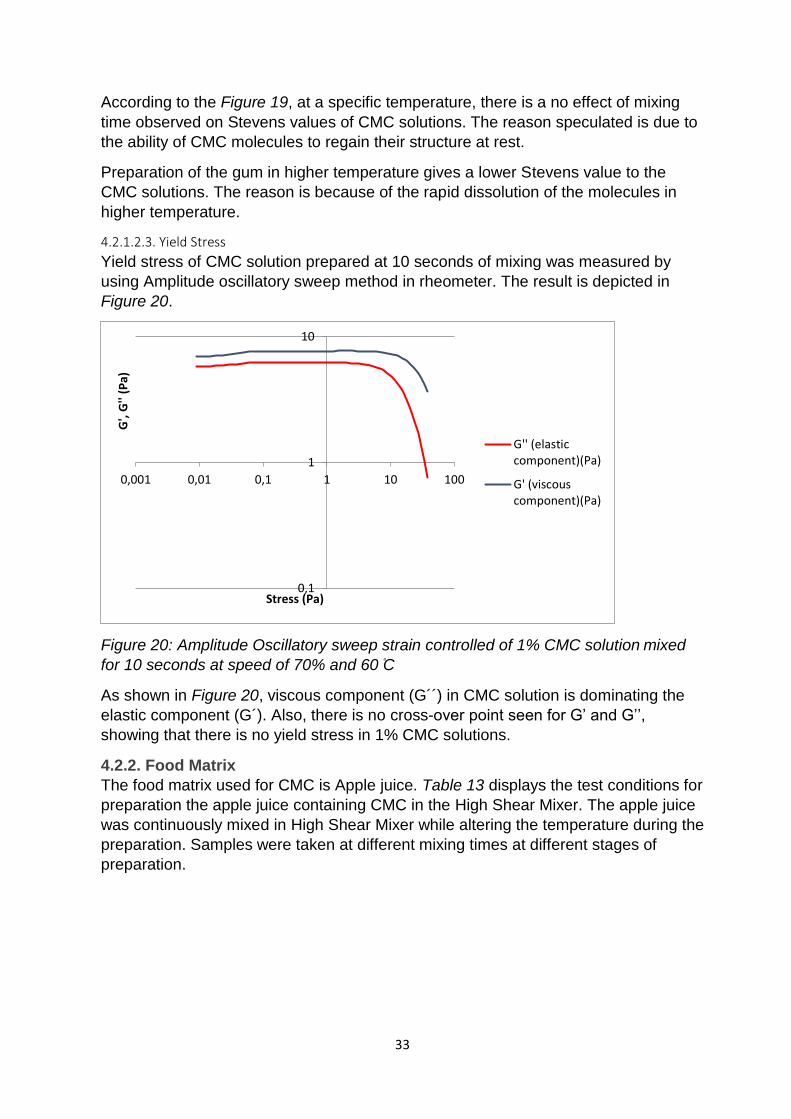
4.2.1.2.3. Yield Stress
Yield stress of CMC solution prepared at 10 seconds of mixing was measured by
using Amplitude oscillatory sweep method in rheometer. The result is depicted in
Figure 20.
Figure 20: Amplitude Oscillatory sweep strain controlled of 1% CMC solution mixed
for 10 seconds at speed of 70% and 60 ֯C
As shown in Figure 20, viscous component (G´´) in CMC solution is dominating the
elastic component (G´). Also, there is no cross-over point seen for G’ and G’’,
showing that there is no yield stress in 1% CMC solutions.
4.2.2. Food Matrix
The food matrix used for CMC is Apple juice. Table 13 displays the test conditions for
preparation the apple juice containing CMC in the High Shear Mixer. The apple juice
was continuously mixed in High Shear Mixer while altering the temperature during the
preparation. Samples were taken at different mixing times at different stages of
preparation.
0,1
1
10
0,001 0,01 0,1 1 10 100
G',
G''
(Pa)
Stress (Pa)
G'' (elasticcomponent)(Pa)
G' (viscouscomponent)(Pa)

34
General
Table 13: The test conditions for apple juice containing CMC
CMC concentration(%)
Mixing speed (%)
Temperature (°C)
Mixing time(s)
0.05 70 20 10-120
80 250-270-300-360-420
40 600
Figure 21 shows the apparent viscosity of apple juice containing 0.05% CMC during
the mixing time. The samples were collected during the process of making the apple
juice in order to understand the effect of temperature and mixing time on apparent
viscosity of apple juice. Initial mixing is done at 20 °C for about 120 seconds, then the
system is heated from 20°C to 80°C and is cooled down to 40°C.
Figure 21: Apparent Viscosity of Apple juice containing 0.05% CMC at 100 1/s versus
mixing time in different Temperatures (20 °C, 80 °C and 40 °C). Error bar is showing
standard deviation error with 95% confidence interval.
According to the Figure 21, at 20 °C, where the dry ingredients were being dispersed
in the aqueous phase, there is no change in viscosity observed as the points lie in
the measurement range. When the system is heated from 20 °C to 80 °C, there is a
drastic drop in viscosity and after that the viscosity remains stable.
Table 14 depicts the apparent viscosity of the apple juice containing 0.05% of CMC
and 0.05% CMC in water after 3 minutes of heating while mixing.
1,00
1,50
2,00
2,50
3,00
3,50
4,00
4,50
5,00
5,50
6,00
0 100 200 300 400 500 600 700
Ap
par
ent
Vis
cosi
ty@
10
01
/s(m
Pas
)
Time (s)
Apple juice with CMC
20 ֯C
80 ֯C40 ֯C

35
General
Table 14: Apparent viscosity of CMC solution and apple juice.
Matrix Time(s) Concentration
(%)
Temperature
(֯c)
pH Viscosity @ 100s-1
(mPas)
Water 180 0.05 60 7.8 5.94
Apple
juice
180 0.05 80 2.8 3.19
The viscosity of the apple juice at 180 second of mixing at 80֯ C is lower than CMC
solution mixed for 3 minutes at 60°C. The reason for the decrease can be due to the
pH differences. The pH of apple juice is 2.8 while the pH of the tap water was about
neutral (7.8). pKa value for CMC is reported as 4.3 (Metodiev Zhivkov, 2013). In
other words, in solutions with pH lower than 4, the CMC molecules start to lose their
charges and thus, CMC is not completely soluble in water. Resulting in a decrease in
volume occupation of CMC and decrease in viscosity of apple juice Moreover, the
apple juice was prepared in higher temperature (80 °C) than water matrix (60 °C), but
as it was observed in the water matrix, there is no effect of temperature on the
viscosity of the 0.05% CMC solutions after 3 minutes (Figure 17), the viscosity loss in
apple juice cannot be considered due to the temperature.
Overall, the viscosity of 1% of CMC in water decreased by increasing the time and
temperature of mixing from 10 seconds to 60 seconds. After 60 seconds the viscosity
of the system remains stable. At low concentrations since the samples were taken
after 180 seconds, thus, there was no effect of mixing time, mixing speed and
temperature on the viscosity. No yield stress was observed for 1% CMC in water as
the viscous component of CMC was higher than the viscous component. Apple juice
containing 0.05% CMC showed lower apparent viscosity comparing to 0.05% CMC in
water, the viscosity loss was due to the low pH in apple juice.
4.3. Pectin
4.3.1. Water-matrix
In order to understand the effect of pectin in water, 0.2% pectin solution was
prepared in water. Shear Stress was plotted as a function of shear rate as shown in
Figure 22.

36
General
Figure 22: Plot of Shear Stress (Pa) versus Shear Rate (1/s) for Pectin Genu Vis
(0.2%) in water. Error bar showing the Standard deviation error with 95% confidence
interval.
Viscosity analysis was done on the samples (Figure 22) obtained after three minutes
of mixing in High Shear Mixer at 60 0C. From the Power Law equation, K value and
viscosity obtained was very low, i.e. 0.0013 and the 2,6 mPas respectively. The
viscosity after the addition of the gum was very close to that of water (1,37 mPas).
High methyl ester pectin forms a network only at lower pH and in the presence of
sugar. (Phillips and Williams, 2014) Due to which, there was no viscosity changes
seen in the pectin-water solution. Thus, further trials with varying temperature, speed
and concentration were not done on water-matrix for Pectin.
4.3.2. Food Matrix
The food matrix trials done with Pectin were on apple juice. The reason why the
chosen food matrix was apple juice is due to the reason that Pectin works best at
lower pH and in product containing sugar, thus making apple juice a suitable food
matrix to work with. Commercially pectin is used in a concentration range of 0.1 to
0.3% (Table 1), but in these experiments 2% concentration of pectin was used for
understanding the behaviour of pectin at higher concentration. Test conditions for
pectin in food matrix is given in Table 15.
y = 0,0013x1,15
0
0,05
0,1
0,15
0,2
0,25
0 10 20 30 40 50 60 70 80 90
Shea
r St
ress
(P
a)
Shear Rate (1/s)
Pectin Genu Vis (0.2%)
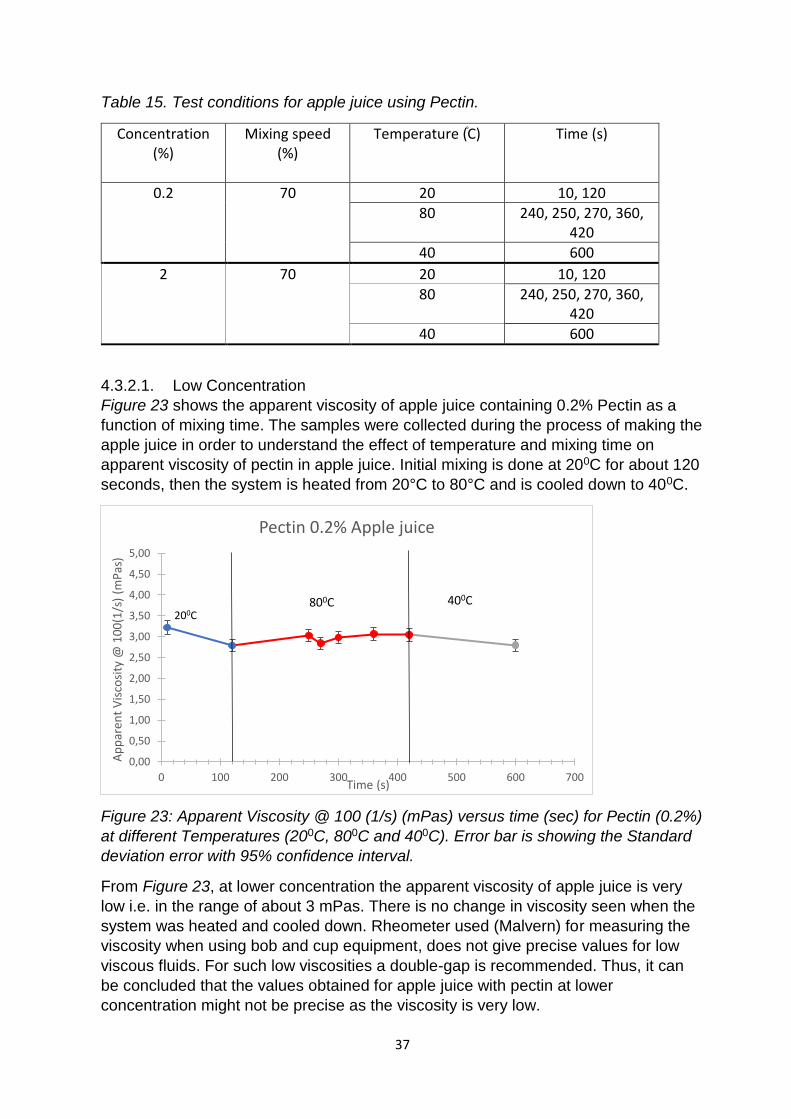
37
General
Table 15. Test conditions for apple juice using Pectin.
Concentration (%)
Mixing speed (%)
Temperature (֯C) Time (s)
0.2 70
20 10, 120
80 240, 250, 270, 360, 420
40 600
2 70 20 10, 120
80 240, 250, 270, 360, 420
40 600
4.3.2.1. Low Concentration
Figure 23 shows the apparent viscosity of apple juice containing 0.2% Pectin as a
function of mixing time. The samples were collected during the process of making the
apple juice in order to understand the effect of temperature and mixing time on
apparent viscosity of pectin in apple juice. Initial mixing is done at 200C for about 120
seconds, then the system is heated from 20°C to 80°C and is cooled down to 400C.
Figure 23: Apparent Viscosity @ 100 (1/s) (mPas) versus time (sec) for Pectin (0.2%)
at different Temperatures (200C, 800C and 400C). Error bar is showing the Standard
deviation error with 95% confidence interval.
From Figure 23, at lower concentration the apparent viscosity of apple juice is very
low i.e. in the range of about 3 mPas. There is no change in viscosity seen when the
system was heated and cooled down. Rheometer used (Malvern) for measuring the
viscosity when using bob and cup equipment, does not give precise values for low
viscous fluids. For such low viscosities a double-gap is recommended. Thus, it can
be concluded that the values obtained for apple juice with pectin at lower
concentration might not be precise as the viscosity is very low.
0,00
0,50
1,00
1,50
2,00
2,50
3,00
3,50
4,00
4,50
5,00
0 100 200 300 400 500 600 700
Ap
par
ent
Vis
cosi
ty @
10
0(1
/s)
(mP
as)
Time (s)
Pectin 0.2% Apple juice
200C800C 400C
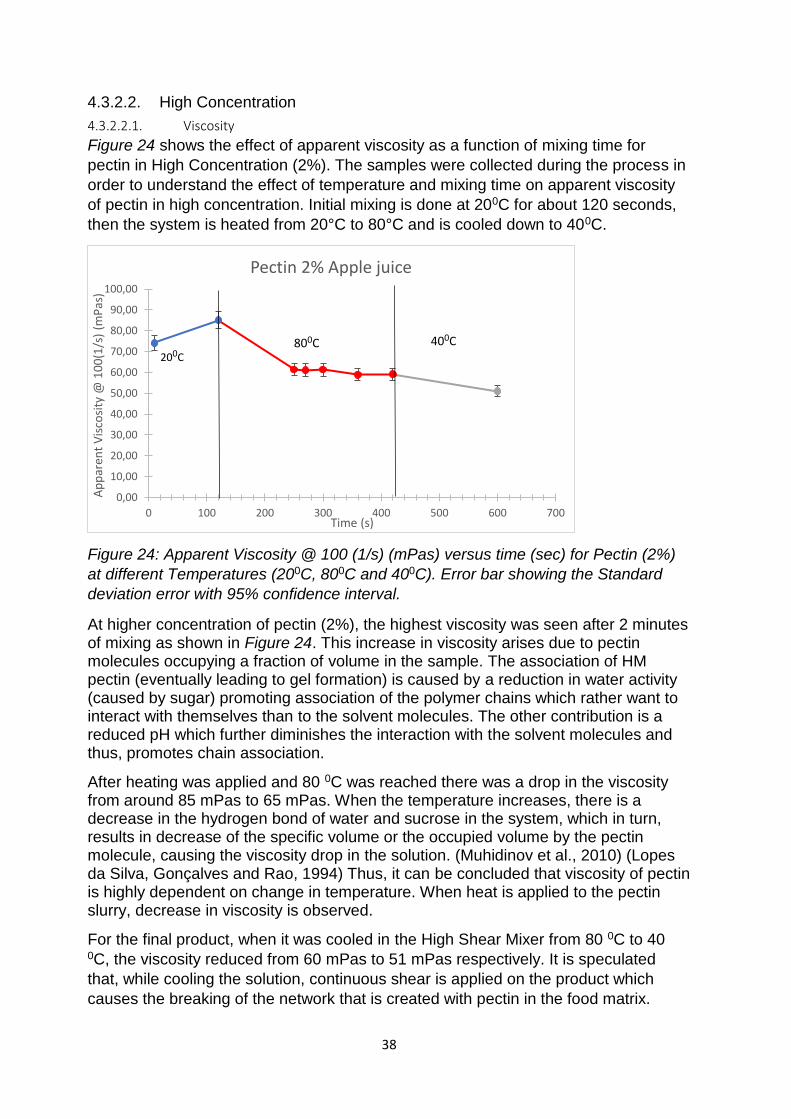
38
General
4.3.2.2. High Concentration
4.3.2.2.1. Viscosity
Figure 24 shows the effect of apparent viscosity as a function of mixing time for
pectin in High Concentration (2%). The samples were collected during the process in
order to understand the effect of temperature and mixing time on apparent viscosity
of pectin in high concentration. Initial mixing is done at 200C for about 120 seconds,
then the system is heated from 20°C to 80°C and is cooled down to 400C.
Figure 24: Apparent Viscosity @ 100 (1/s) (mPas) versus time (sec) for Pectin (2%)
at different Temperatures (200C, 800C and 400C). Error bar showing the Standard
deviation error with 95% confidence interval.
At higher concentration of pectin (2%), the highest viscosity was seen after 2 minutes of mixing as shown in Figure 24. This increase in viscosity arises due to pectin molecules occupying a fraction of volume in the sample. The association of HM pectin (eventually leading to gel formation) is caused by a reduction in water activity (caused by sugar) promoting association of the polymer chains which rather want to interact with themselves than to the solvent molecules. The other contribution is a reduced pH which further diminishes the interaction with the solvent molecules and thus, promotes chain association.
After heating was applied and 80 0C was reached there was a drop in the viscosity from around 85 mPas to 65 mPas. When the temperature increases, there is a decrease in the hydrogen bond of water and sucrose in the system, which in turn, results in decrease of the specific volume or the occupied volume by the pectin molecule, causing the viscosity drop in the solution. (Muhidinov et al., 2010) (Lopes da Silva, Gonçalves and Rao, 1994) Thus, it can be concluded that viscosity of pectin is highly dependent on change in temperature. When heat is applied to the pectin slurry, decrease in viscosity is observed.
For the final product, when it was cooled in the High Shear Mixer from 80 0C to 40 0C, the viscosity reduced from 60 mPas to 51 mPas respectively. It is speculated
that, while cooling the solution, continuous shear is applied on the product which
causes the breaking of the network that is created with pectin in the food matrix.
0,00
10,00
20,00
30,00
40,00
50,00
60,00
70,00
80,00
90,00
100,00
0 100 200 300 400 500 600 700
Ap
par
ent
Vis
cosi
ty @
10
0(1
/s)
(mP
as)
Time (s)
Pectin 2% Apple juice
200C800C 400C
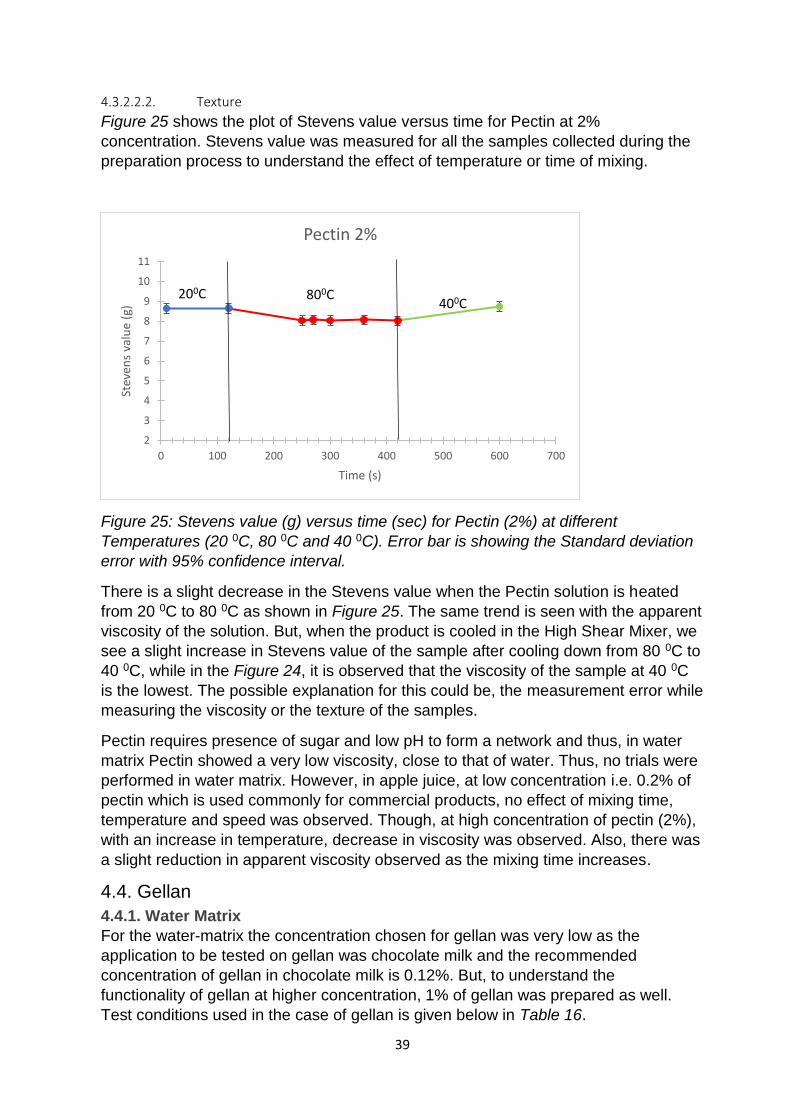
39
General
4.3.2.2.2. Texture
Figure 25 shows the plot of Stevens value versus time for Pectin at 2%
concentration. Stevens value was measured for all the samples collected during the
preparation process to understand the effect of temperature or time of mixing.
Figure 25: Stevens value (g) versus time (sec) for Pectin (2%) at different
Temperatures (20 0C, 80 0C and 40 0C). Error bar is showing the Standard deviation
error with 95% confidence interval.
There is a slight decrease in the Stevens value when the Pectin solution is heated
from 20 0C to 80 0C as shown in Figure 25. The same trend is seen with the apparent
viscosity of the solution. But, when the product is cooled in the High Shear Mixer, we
see a slight increase in Stevens value of the sample after cooling down from 80 0C to
40 0C, while in the Figure 24, it is observed that the viscosity of the sample at 40 0C
is the lowest. The possible explanation for this could be, the measurement error while
measuring the viscosity or the texture of the samples.
Pectin requires presence of sugar and low pH to form a network and thus, in water
matrix Pectin showed a very low viscosity, close to that of water. Thus, no trials were
performed in water matrix. However, in apple juice, at low concentration i.e. 0.2% of
pectin which is used commonly for commercial products, no effect of mixing time,
temperature and speed was observed. Though, at high concentration of pectin (2%),
with an increase in temperature, decrease in viscosity was observed. Also, there was
a slight reduction in apparent viscosity observed as the mixing time increases.
4.4. Gellan
4.4.1. Water Matrix
For the water-matrix the concentration chosen for gellan was very low as the
application to be tested on gellan was chocolate milk and the recommended
concentration of gellan in chocolate milk is 0.12%. But, to understand the
functionality of gellan at higher concentration, 1% of gellan was prepared as well.
Test conditions used in the case of gellan is given below in Table 16.
2
3
4
5
6
7
8
9
10
11
0 100 200 300 400 500 600 700
Stev
ens
valu
e (g
)
Time (s)
Pectin 2%
200C 800C400C

40
General
Table 16: Test conditions for Gellan solutions in water.
Concentration (%) Temperature (0C) Speed (%) Mixing Time (s)
0.1 60 70 10, 30,180, 360, 1080
90 180, 360, 1080
80 70 180, 360, 1080
90 180, 360, 1080
0.15 60 70 10, 30, 180, 360, 1080
90 180, 360, 1080
80 70 180, 360 1080
90 180, 360, 1080
1 60 70 10, 30, 60,180, 1080
80 70 10, 30, 60, 180, 1080
4.4.1.1. Low concentration
4.4.1.1.1. Viscosity
Effect of Mixing speed: In order to test the effect of mixing speed on the viscosity of
the gum solution, plots were made based on apparent viscosity (at 100s-1) versus
function of time. Figure 26 depicts the viscosity of the gum solution at different
concentration and different speed at a constant temperature of 60 0C.
Figure 26. Apparent Viscosity as a function of time at Temperature 600C for various
concentration of gellan gum solution at different mixing speed. Error bars showing
Standard deviation error with 95% confidence interval.
0
2
4
6
8
10
12
14
16
0 200 400 600 800 1000 1200
Ap
par
ent
Vis
cosi
ty@
10
0 (
1/s
) [m
Pas
]
Time [s]
T=60 oC
0.15%, speed 70%
0.15%, speed 90%
0.1%, speed 70%
0.1%, speed 90%

41
General
From Figure 26, it can be observed that at different speed of the mixer there is no
significant difference in viscosity of the gum solution for each of the concentration.
Also, the curves at different shear speed (i.e. 70% and 90%) lie in the measurement
error range. Thus, depicting that there is no effect of mixing speed on gellan.
Because we did not see any difference in speed for lower concentration, we decided
to only run one speed i.e. 70%.
Effect of Temperature: In order to test the effect of temperature on the viscosity of
the gum solution, plots were made based on apparent viscosity (at 100s-1) versus
function of time. Figure 27 depicts the viscosity of the gum solution at different
concentration and different temperature at a constant shear speed of 70%.
Figure 27. Apparent Viscosity as a function of time at Speed 70% for various
concentration of gellan gum solution at different temperature. Error bars showing
Standard deviation error with 95% confidence interval.
From Figure 27, it is observed that at higher temperature, the viscosity of the gum
solution is affected by temperature. The viscosity of the gum solution at higher
temperature is lower because the increase in temperature causes the aggregates
formed by gellan molecule to orient itself in the direction of the flow and thus results
in reduced viscosity of the final product (AlsaidYagoub and Osman M. Nur, 2013).
Also, the curves at different temperature (i.e. 60 0C and 80 0C) do not lie in the
measurement error range.
Effect of mixing time: Figure 26, 27 depict the apparent viscosity at 100 s-1 versus
time for different concentration (lower concentration: 0.1%, 0.15%) for gellan. The
trials are done at two different temperatures 60 0C and 80 0C and two different
speeds 70% and 90%. The basic findings from the above graphs are that between 10
seconds and 360 seconds the viscosity is constant and then there is a decrease in
viscosity after 360 seconds of mixing. When the gum is hydrated in the solution it
starts forming a gel network which gives an increase in the viscosity. But, due to the
0
2
4
6
8
10
12
14
16
0 200 400 600 800 1000 1200
Ap
par
ent
Vis
cosi
ty@
10
0(1
/s)
[m
Pas
]
Time (s)
Speed-70%
0.1%, temp 60C
0.1%, temp 80C
0,15% temp-60
0.15, temp 80C
Time (s)
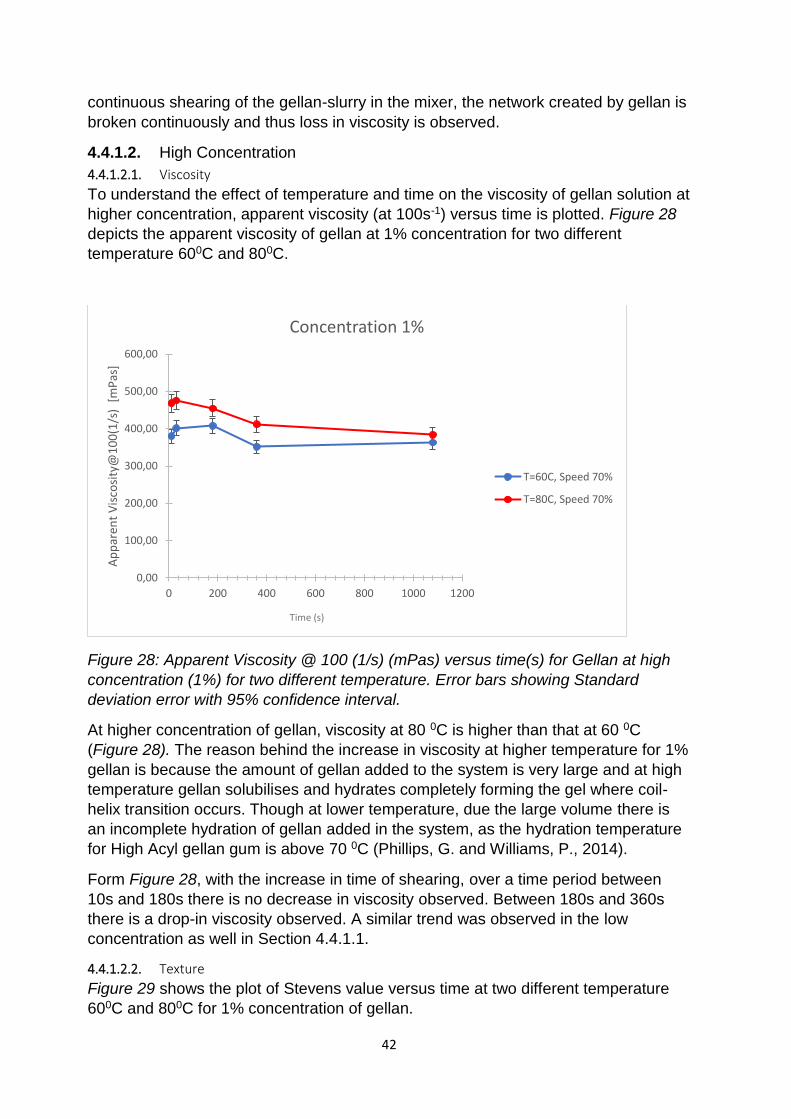
42
General
continuous shearing of the gellan-slurry in the mixer, the network created by gellan is
broken continuously and thus loss in viscosity is observed.
4.4.1.2. High Concentration
4.4.1.2.1. Viscosity
To understand the effect of temperature and time on the viscosity of gellan solution at
higher concentration, apparent viscosity (at 100s-1) versus time is plotted. Figure 28
depicts the apparent viscosity of gellan at 1% concentration for two different
temperature 600C and 800C.
Figure 28: Apparent Viscosity @ 100 (1/s) (mPas) versus time(s) for Gellan at high
concentration (1%) for two different temperature. Error bars showing Standard
deviation error with 95% confidence interval.
At higher concentration of gellan, viscosity at 80 0C is higher than that at 60 0C
(Figure 28). The reason behind the increase in viscosity at higher temperature for 1%
gellan is because the amount of gellan added to the system is very large and at high
temperature gellan solubilises and hydrates completely forming the gel where coil-
helix transition occurs. Though at lower temperature, due the large volume there is
an incomplete hydration of gellan added in the system, as the hydration temperature
for High Acyl gellan gum is above 70 0C (Phillips, G. and Williams, P., 2014).
Form Figure 28, with the increase in time of shearing, over a time period between
10s and 180s there is no decrease in viscosity observed. Between 180s and 360s
there is a drop-in viscosity observed. A similar trend was observed in the low
concentration as well in Section 4.4.1.1.
4.4.1.2.2. Texture
Figure 29 shows the plot of Stevens value versus time at two different temperature
600C and 800C for 1% concentration of gellan.
0,00
100,00
200,00
300,00
400,00
500,00
600,00
0 200 400 600 800 1000 1200
Ap
par
ent
Vis
cosi
ty@
10
0(1
/s)
[m
Pas
]
Time [s]
Concentration 1%
T=60C, Speed 70%
T=80C, Speed 70%
Time (s)
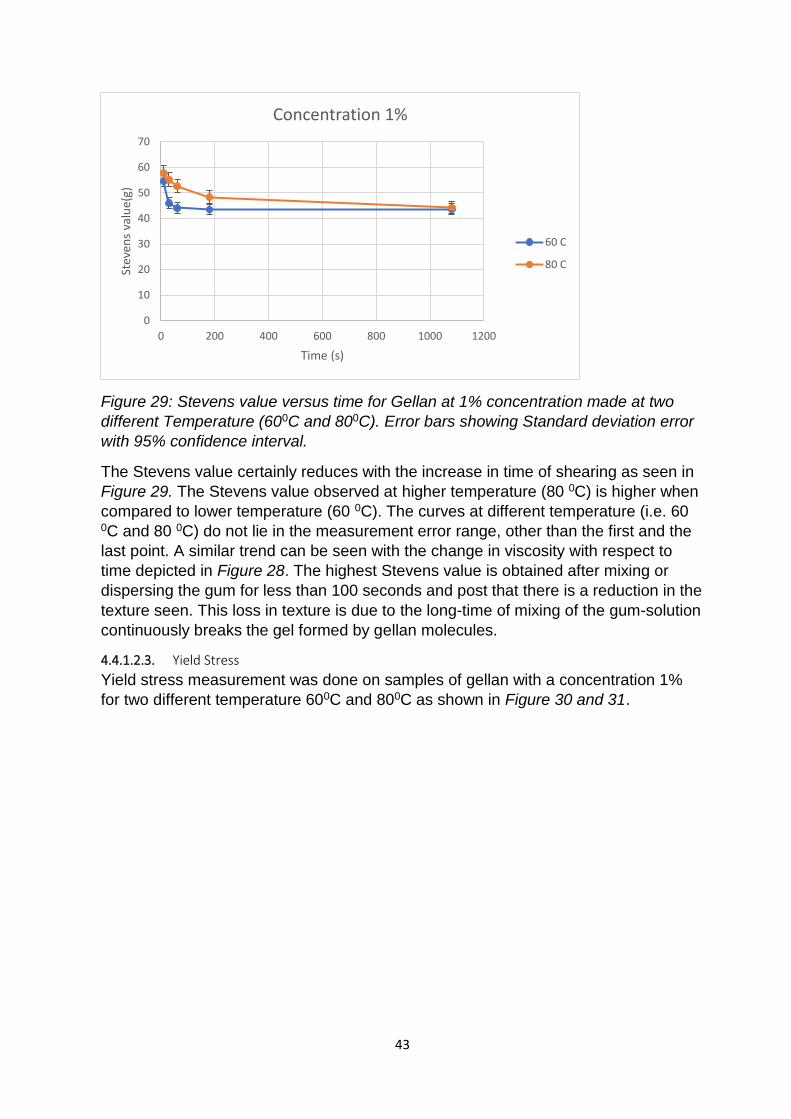
43
General
Figure 29: Stevens value versus time for Gellan at 1% concentration made at two
different Temperature (600C and 800C). Error bars showing Standard deviation error
with 95% confidence interval.
The Stevens value certainly reduces with the increase in time of shearing as seen in
Figure 29. The Stevens value observed at higher temperature (80 0C) is higher when
compared to lower temperature (60 0C). The curves at different temperature (i.e. 60 0C and 80 0C) do not lie in the measurement error range, other than the first and the
last point. A similar trend can be seen with the change in viscosity with respect to
time depicted in Figure 28. The highest Stevens value is obtained after mixing or
dispersing the gum for less than 100 seconds and post that there is a reduction in the
texture seen. This loss in texture is due to the long-time of mixing of the gum-solution
continuously breaks the gel formed by gellan molecules.
4.4.1.2.3. Yield Stress
Yield stress measurement was done on samples of gellan with a concentration 1%
for two different temperature 600C and 800C as shown in Figure 30 and 31.
0
10
20
30
40
50
60
70
0 200 400 600 800 1000 1200
Stev
ens
valu
e(g)
Time (s)
Concentration 1%
60 C
80 C

44
General
Figure 30: Oscillatory Amplitude Sweep Curve for Gellan 1% concentration at 60C.
Figure 31: Oscillatory Amplitude Sweep Curve for Gellan 1% concentration at 80C.
In both Figure 30 and 31, we see that the elastic component is higher than the
viscous component which signifies that the material has a more elastic behaviour or
structure than flowing properties, i.e. it has more solid properties than liquid
properties at rest. The yield stress value for gellan at 60 0C and 80 0C are 53.7 Pa
and 55.6 Pa respectively. The same trend was seen for the apparent viscosity for
gellan at 1% shown in Section 4.4.1.2.
4.4.2. Food-Matrix
Gellan has a wide application is neutral pH beverages and thus it is used in
Chocolate milk for stabilising the cacao particles. The amount of gellan used in
chocolate milk is very low, i.e. 0.12%. To understand the functionality of gellan in
chocolate milk, viscosity and stability tests were performed and a comparison
between food and water matrix was done.
1
10
100
0,01 0,1 1 10 100
G',
G''
(Pa)
Shear Stress (Pa)
Gellan 1% 60 oC
G'' (viscouscomponent) (Pa)
G' (elastic component)(Pa)
1
10
100
0,01 0,1 1 10 100
G',
G''
(Pa)
Shear stress (Pa)
Gellan 1% 80 oC
G'' (viscouscomponent) (Pa)
G' (elastic component)(Pa)
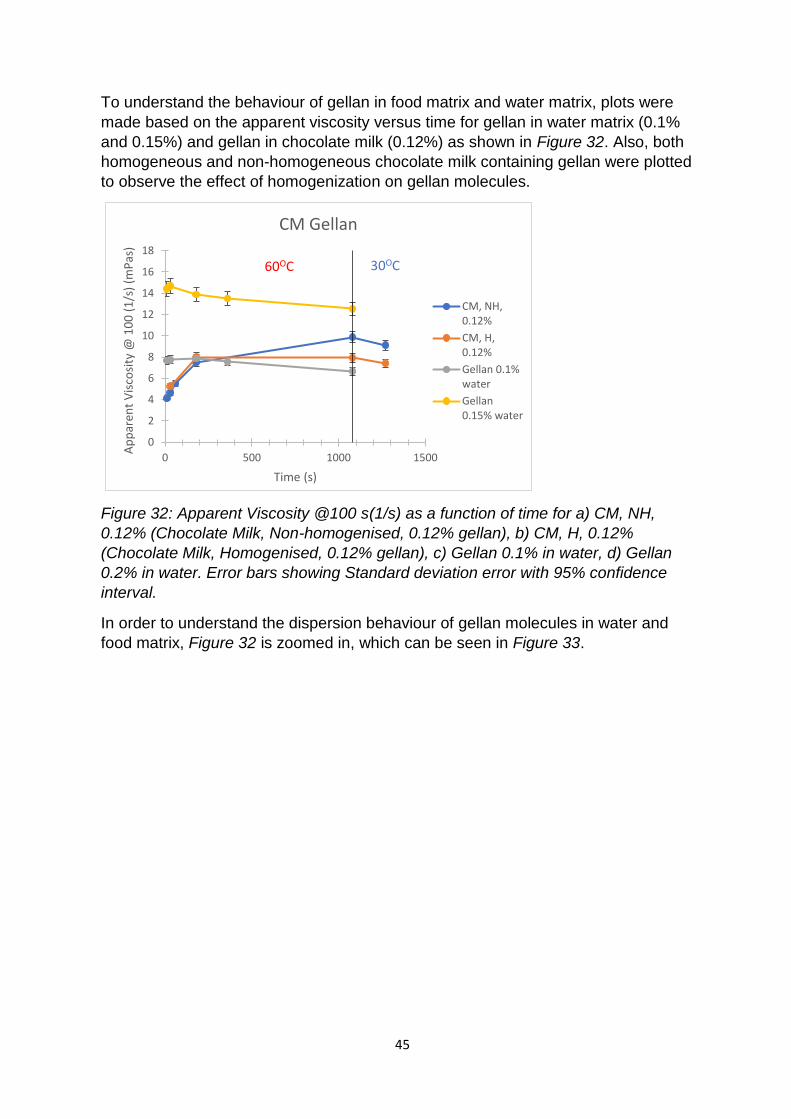
45
General
To understand the behaviour of gellan in food matrix and water matrix, plots were
made based on the apparent viscosity versus time for gellan in water matrix (0.1%
and 0.15%) and gellan in chocolate milk (0.12%) as shown in Figure 32. Also, both
homogeneous and non-homogeneous chocolate milk containing gellan were plotted
to observe the effect of homogenization on gellan molecules.
Figure 32: Apparent Viscosity @100 s(1/s) as a function of time for a) CM, NH,
0.12% (Chocolate Milk, Non-homogenised, 0.12% gellan), b) CM, H, 0.12%
(Chocolate Milk, Homogenised, 0.12% gellan), c) Gellan 0.1% in water, d) Gellan
0.2% in water. Error bars showing Standard deviation error with 95% confidence
interval.
In order to understand the dispersion behaviour of gellan molecules in water and
food matrix, Figure 32 is zoomed in, which can be seen in Figure 33.
0
2
4
6
8
10
12
14
16
18
0 500 1000 1500
Ap
par
ent
Vis
cosi
ty @
10
0 (
1/s
) (m
Pas
)
Time (s)
CM Gellan
CM, NH,0.12%
CM, H,0.12%
Gellan 0.1%water
Gellan0.15% water
60OC 30OC
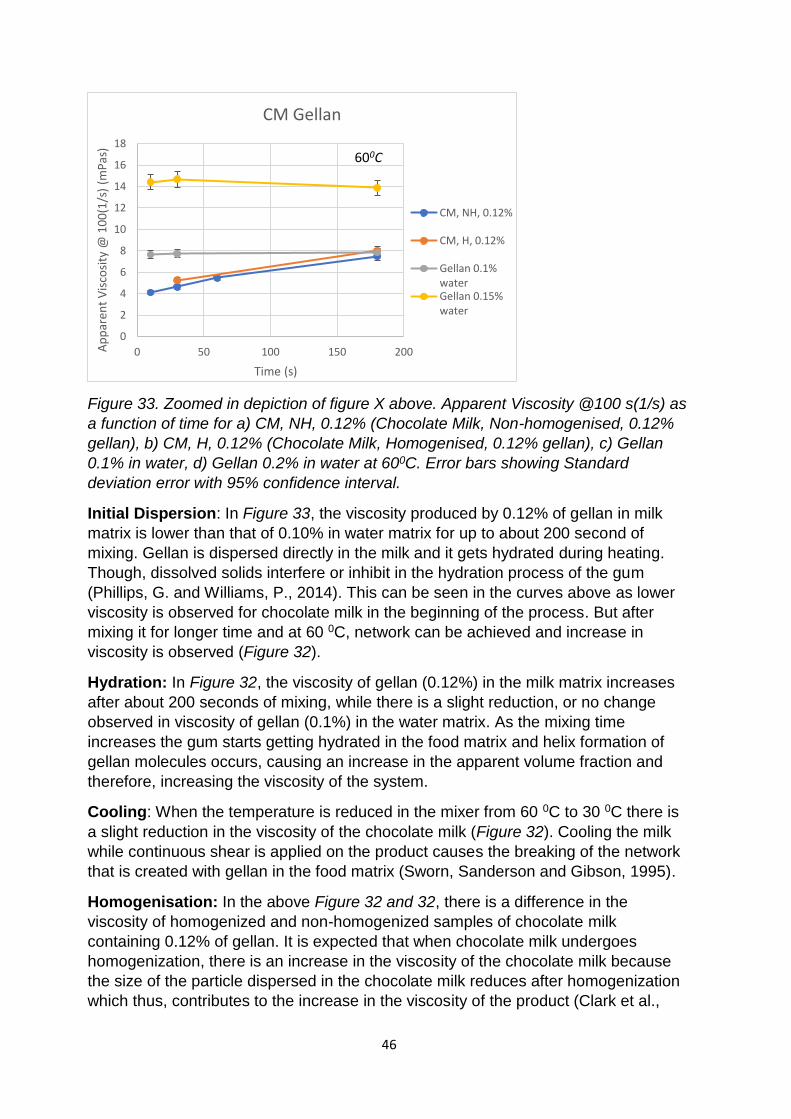
46
General
Figure 33. Zoomed in depiction of figure X above. Apparent Viscosity @100 s(1/s) as
a function of time for a) CM, NH, 0.12% (Chocolate Milk, Non-homogenised, 0.12%
gellan), b) CM, H, 0.12% (Chocolate Milk, Homogenised, 0.12% gellan), c) Gellan
0.1% in water, d) Gellan 0.2% in water at 600C. Error bars showing Standard
deviation error with 95% confidence interval.
Initial Dispersion: In Figure 33, the viscosity produced by 0.12% of gellan in milk
matrix is lower than that of 0.10% in water matrix for up to about 200 second of
mixing. Gellan is dispersed directly in the milk and it gets hydrated during heating.
Though, dissolved solids interfere or inhibit in the hydration process of the gum
(Phillips, G. and Williams, P., 2014). This can be seen in the curves above as lower
viscosity is observed for chocolate milk in the beginning of the process. But after
mixing it for longer time and at 60 0C, network can be achieved and increase in
viscosity is observed (Figure 32).
Hydration: In Figure 32, the viscosity of gellan (0.12%) in the milk matrix increases
after about 200 seconds of mixing, while there is a slight reduction, or no change
observed in viscosity of gellan (0.1%) in the water matrix. As the mixing time
increases the gum starts getting hydrated in the food matrix and helix formation of
gellan molecules occurs, causing an increase in the apparent volume fraction and
therefore, increasing the viscosity of the system.
Cooling: When the temperature is reduced in the mixer from 60 0C to 30 0C there is
a slight reduction in the viscosity of the chocolate milk (Figure 32). Cooling the milk
while continuous shear is applied on the product causes the breaking of the network
that is created with gellan in the food matrix (Sworn, Sanderson and Gibson, 1995).
Homogenisation: In the above Figure 32 and 32, there is a difference in the
viscosity of homogenized and non-homogenized samples of chocolate milk
containing 0.12% of gellan. It is expected that when chocolate milk undergoes
homogenization, there is an increase in the viscosity of the chocolate milk because
the size of the particle dispersed in the chocolate milk reduces after homogenization
which thus, contributes to the increase in the viscosity of the product (Clark et al.,
0
2
4
6
8
10
12
14
16
18
0 50 100 150 200Ap
par
ent
Vis
cosi
ty @
10
0(1
/s)
(mP
as)
Time (s)
CM Gellan
CM, NH, 0.12%
CM, H, 0.12%
Gellan 0.1%waterGellan 0.15%water
600C

47
General
2009). But, in this case, it is seen that the viscosity of chocolate milk is higher when it
is not homogenized and lower when the homogenisation is done. The reason
speculated for the loss of viscosity when chocolate milk is homogenised could be
associated with the gum. When the sample containing gellan gum is forced at a high
pressure through a narrow gap in the homogenizer, gellan polymer breaks down (CP
Kelco U S Inc, 1998). Homogenisation thus destroys the gellan gum leading to
reduction in the viscosity.
Stability Test:
Figure 34 shows the height of sediment of cocoa particles obtained after
centrifugation of chocolate milk containing 0.12% of gellan with and without
homogenisation.
Figure 34: Height of the sediment obtained after centrifugation of chocolate milk as a
function of time for a) CM, NH, 0.12% (Chocolate Milk, Non-homogenised, 0.12%
gellan), b) CM, H, 0.12% (Chocolate Milk, Homogenised, 0.12% gellan). Error bars
showing Standard deviation error with 95% confidence interval.
Stability of cocoa particle was tested with the help of centrifugation of the samples
and measuring the amount of cocoa particle that were sedimented. Figure 34 shows
the height of sediment after centrifugation of the samples at different time of mixing in
the Hight Shear Mixer. For non-homogenised samples, the height of the sediment
particles was comparatively higher for mixing time less than 200 seconds with
respect to homogenised samples. Though, after the mixing was done for about 1000
seconds, both homogenised and non-homogenised samples have the same amount
of sediment. For homogenised samples, the amount of sediment after 3 minutes of
mixing was constant all through the process of heating and cooling.
Table A17 shows the height of sediment after centrifugation of the samples of
chocolate milk with and without gellan. Non-Homogenised chocolate milk containing
no gum had the highest deposition of the cocoa particles in the centrifuge tubes,
while after homogenisation there was a little reduction in the deposition from 9 mm to
8 mm respectively. While, when 0.12% of gellan was added in the chocolate milk the
0
1
2
3
4
5
6
0 500 1000 1500
Sed
imen
t (m
m)
Time (s)
Stability Test
CM, NH, 0.12%
CM, H, 0.12 %
300C
600C
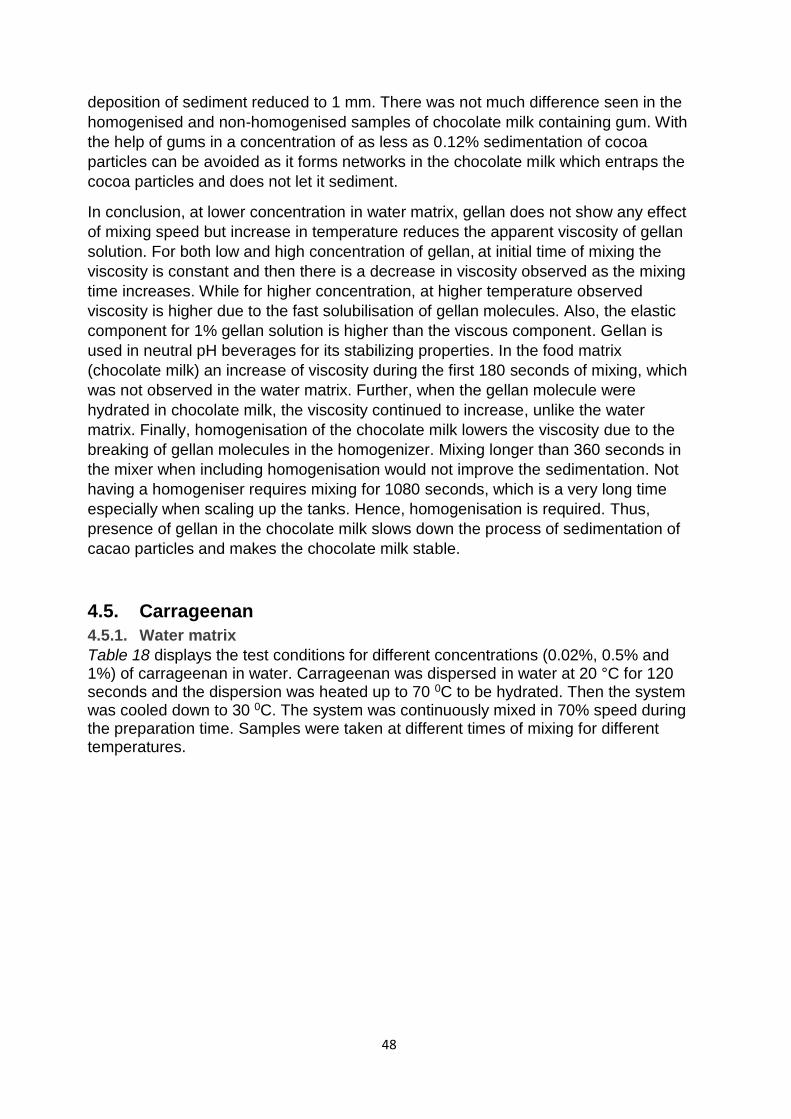
48
General
deposition of sediment reduced to 1 mm. There was not much difference seen in the
homogenised and non-homogenised samples of chocolate milk containing gum. With
the help of gums in a concentration of as less as 0.12% sedimentation of cocoa
particles can be avoided as it forms networks in the chocolate milk which entraps the
cocoa particles and does not let it sediment.
In conclusion, at lower concentration in water matrix, gellan does not show any effect
of mixing speed but increase in temperature reduces the apparent viscosity of gellan
solution. For both low and high concentration of gellan, at initial time of mixing the
viscosity is constant and then there is a decrease in viscosity observed as the mixing
time increases. While for higher concentration, at higher temperature observed
viscosity is higher due to the fast solubilisation of gellan molecules. Also, the elastic
component for 1% gellan solution is higher than the viscous component. Gellan is
used in neutral pH beverages for its stabilizing properties. In the food matrix
(chocolate milk) an increase of viscosity during the first 180 seconds of mixing, which
was not observed in the water matrix. Further, when the gellan molecule were
hydrated in chocolate milk, the viscosity continued to increase, unlike the water
matrix. Finally, homogenisation of the chocolate milk lowers the viscosity due to the
breaking of gellan molecules in the homogenizer. Mixing longer than 360 seconds in
the mixer when including homogenisation would not improve the sedimentation. Not
having a homogeniser requires mixing for 1080 seconds, which is a very long time
especially when scaling up the tanks. Hence, homogenisation is required. Thus,
presence of gellan in the chocolate milk slows down the process of sedimentation of
cacao particles and makes the chocolate milk stable.
4.5. Carrageenan
4.5.1. Water matrix
Table 18 displays the test conditions for different concentrations (0.02%, 0.5% and 1%) of carrageenan in water. Carrageenan was dispersed in water at 20 °C for 120 seconds and the dispersion was heated up to 70 0C to be hydrated. Then the system was cooled down to 30 0C. The system was continuously mixed in 70% speed during the preparation time. Samples were taken at different times of mixing for different temperatures.

49
General
Table 18. Test conditions for Carrageenan solutions
Concentration (%)
Mixing speed (%)
Temperature (֯C) Time (s)
0.02 70
20 120
70 250-310-490-1570
50 1810
30 1930
0.5 70 20 120 70 250-310-490-1570 50 1810 30 1930
1 70 20 120
70 250-310-490-1570
50 1810
30 1930
4.5.1.1. Viscosity
The effect of mixing time and temperature: To understand the effect of temperature on the viscosity of Carrageenan solutions, the plot was made based on apparent viscosity at 100 s-1 versus mixing time during the preparation. Figure 35 illustrates the apparent viscosity of different concentrations of carrageenan solution during the mixing time at different temperatures (20 °C, 70 °C, 50 °C ,30 °C) at 70% mixing speed.
Figure 35. Apparent Viscosity of 1% (dotted line), 0,02% (simple line) and 0.5% (dashed line) carrageenan solutions during the mixing time at 20,70, 50, 30 °C at 70% speed. Error bar is showing standard deviation error with 95% confidence interval
0
10
20
30
40
50
60
70
80
90
100
90 590 1090 1590 2090
Ap
par
ent
visc
osi
ty@
10
01
/s (
mP
as)
Time (s)
0,02%
0,5%
1%
20 0C 70 0C 50 0C 30 ֯C 0

50
General
According to Figure 35, different concentrations of carrageenan solutions (0.02%, 0.5% and 1%), is not affected by mixing time and temperature during the mixing in High Shear Mixer. It is expected that temperature plays an important role in the functionality of kappa carrageenan. Heating the solution up to 70 ֯C and cooling down to 40 ֯C is of importance for the coil-helix confirmation transition in carrageenan molecules (Phillips and Williams, 2014). However, based on the result above, there is no effect of temperature observed on the viscosity of 1% carrageenan solution. The reason can be that when the system is heated, the dissolution and hydration of carrageenan molecules happens rapidly in water and thus, no viscosity change is observed due to heating (70 0C). Also, there was no effect of cooling observed.
4.5.1.2. Yield Stress
Yield Stress of 1% carrageenan solution tested by amplitude oscillatory method in rheometer. For this purpose, the final sample which was cooled down to 30 0C in high shear mixer was chosen. The result is illustrated in Figure 36.
Figure 36. Amplitude Oscillatory sweep strain controlled of 1% Carrageenan solution prepared at mixing speed of 70%
From Figure 36, it is observed that the viscous component is dominating the elastic component in carrageenan depicting that, there is no elastic network formation in the 1% carrageenan solution, thus no yield stress.
4.5.1.3. Texture
Figure 38 illustrates the Stevens value of 1% carrageenan as a function of mixing time at different temperatures (20 °C, 70 °C, 50 °C ,30 °C) at 70% mixing speed.
0,01
0,1
1
1,00E-04 1,00E-03 1,00E-02 1,00E-01 1,00E+00 1,00E+01
G´,
G´´
(Pa)
Shear stress (Pa)
G´ viscous component (Pa)
G´´ (Elastic component (Pa)
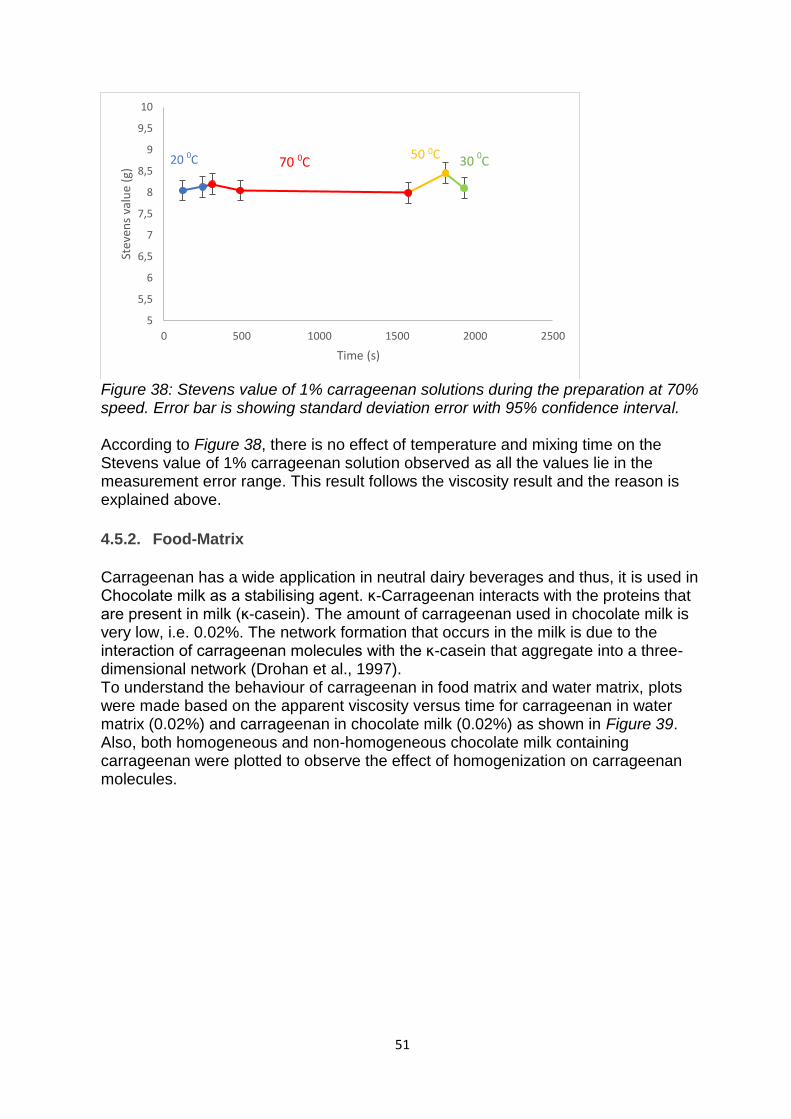
51
General
Figure 38: Stevens value of 1% carrageenan solutions during the preparation at 70% speed. Error bar is showing standard deviation error with 95% confidence interval.
According to Figure 38, there is no effect of temperature and mixing time on the Stevens value of 1% carrageenan solution observed as all the values lie in the measurement error range. This result follows the viscosity result and the reason is explained above.
4.5.2. Food-Matrix
Carrageenan has a wide application in neutral dairy beverages and thus, it is used in Chocolate milk as a stabilising agent. ĸ-Carrageenan interacts with the proteins that are present in milk (ĸ-casein). The amount of carrageenan used in chocolate milk is very low, i.e. 0.02%. The network formation that occurs in the milk is due to the interaction of carrageenan molecules with the ĸ-casein that aggregate into a three-dimensional network (Drohan et al., 1997). To understand the behaviour of carrageenan in food matrix and water matrix, plots were made based on the apparent viscosity versus time for carrageenan in water matrix (0.02%) and carrageenan in chocolate milk (0.02%) as shown in Figure 39. Also, both homogeneous and non-homogeneous chocolate milk containing carrageenan were plotted to observe the effect of homogenization on carrageenan molecules.
5
5,5
6
6,5
7
7,5
8
8,5
9
9,5
10
0 500 1000 1500 2000 2500
Stev
ens
valu
e (g
)
Time (s)
20 0C 70 0C 50 0C 30 ֯C 0
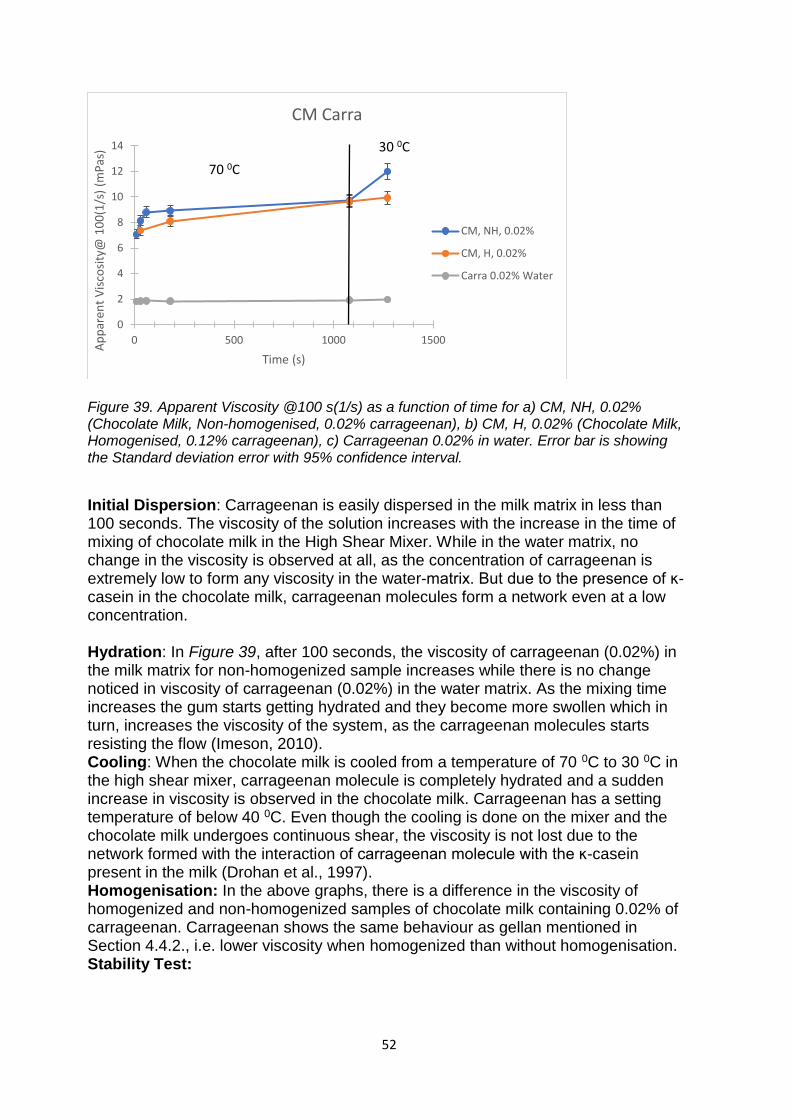
52
General
Figure 39. Apparent Viscosity @100 s(1/s) as a function of time for a) CM, NH, 0.02% (Chocolate Milk, Non-homogenised, 0.02% carrageenan), b) CM, H, 0.02% (Chocolate Milk, Homogenised, 0.12% carrageenan), c) Carrageenan 0.02% in water. Error bar is showing the Standard deviation error with 95% confidence interval.
Initial Dispersion: Carrageenan is easily dispersed in the milk matrix in less than 100 seconds. The viscosity of the solution increases with the increase in the time of mixing of chocolate milk in the High Shear Mixer. While in the water matrix, no change in the viscosity is observed at all, as the concentration of carrageenan is extremely low to form any viscosity in the water-matrix. But due to the presence of ĸ-casein in the chocolate milk, carrageenan molecules form a network even at a low concentration.
Hydration: In Figure 39, after 100 seconds, the viscosity of carrageenan (0.02%) in the milk matrix for non-homogenized sample increases while there is no change noticed in viscosity of carrageenan (0.02%) in the water matrix. As the mixing time increases the gum starts getting hydrated and they become more swollen which in turn, increases the viscosity of the system, as the carrageenan molecules starts resisting the flow (Imeson, 2010). Cooling: When the chocolate milk is cooled from a temperature of 70 0C to 30 0C in the high shear mixer, carrageenan molecule is completely hydrated and a sudden increase in viscosity is observed in the chocolate milk. Carrageenan has a setting temperature of below 40 0C. Even though the cooling is done on the mixer and the chocolate milk undergoes continuous shear, the viscosity is not lost due to the network formed with the interaction of carrageenan molecule with the ĸ-casein present in the milk (Drohan et al., 1997). Homogenisation: In the above graphs, there is a difference in the viscosity of homogenized and non-homogenized samples of chocolate milk containing 0.02% of carrageenan. Carrageenan shows the same behaviour as gellan mentioned in Section 4.4.2., i.e. lower viscosity when homogenized than without homogenisation. Stability Test:
0
2
4
6
8
10
12
14
0 500 1000 1500
Ap
par
ent
Vis
cosi
ty@
10
0(1
/s)
(mP
as)
Time (s)
CM Carra
CM, NH, 0.02%
CM, H, 0.02%
Carra 0.02% Water
70 0C
30 0C
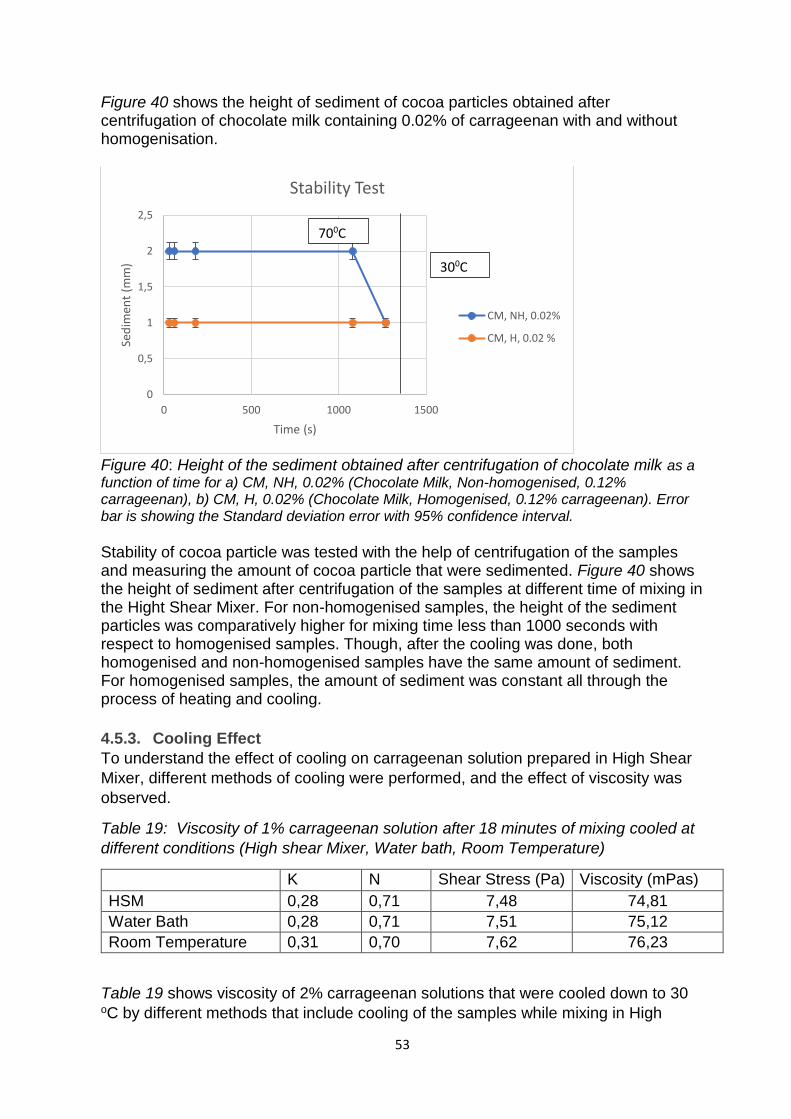
53
General
Figure 40 shows the height of sediment of cocoa particles obtained after centrifugation of chocolate milk containing 0.02% of carrageenan with and without homogenisation.
Figure 40: Height of the sediment obtained after centrifugation of chocolate milk as a function of time for a) CM, NH, 0.02% (Chocolate Milk, Non-homogenised, 0.12% carrageenan), b) CM, H, 0.02% (Chocolate Milk, Homogenised, 0.12% carrageenan). Error bar is showing the Standard deviation error with 95% confidence interval.
Stability of cocoa particle was tested with the help of centrifugation of the samples and measuring the amount of cocoa particle that were sedimented. Figure 40 shows the height of sediment after centrifugation of the samples at different time of mixing in the Hight Shear Mixer. For non-homogenised samples, the height of the sediment particles was comparatively higher for mixing time less than 1000 seconds with respect to homogenised samples. Though, after the cooling was done, both homogenised and non-homogenised samples have the same amount of sediment. For homogenised samples, the amount of sediment was constant all through the process of heating and cooling.
4.5.3. Cooling Effect
To understand the effect of cooling on carrageenan solution prepared in High Shear
Mixer, different methods of cooling were performed, and the effect of viscosity was
observed.
Table 19: Viscosity of 1% carrageenan solution after 18 minutes of mixing cooled at
different conditions (High shear Mixer, Water bath, Room Temperature)
K N Shear Stress (Pa) Viscosity (mPas)
HSM 0,28 0,71 7,48 74,81
Water Bath 0,28 0,71 7,51 75,12
Room Temperature 0,31 0,70 7,62 76,23
Table 19 shows viscosity of 2% carrageenan solutions that were cooled down to 30 oC by different methods that include cooling of the samples while mixing in High
0
0,5
1
1,5
2
2,5
0 500 1000 1500
Sed
imen
t (m
m)
Time (s)
Stability Test
CM, NH, 0.02%
CM, H, 0.02 %
700C
300C

54
General
Shear Mixer, water bath and leaving the samples at room temperature. The viscosity
values obtained while cooling the system in High Shear Mixer were almost the same
and no difference of different cooling method is observed.
Table 20: Viscosity of chocolate milk containing 0.02% carrageenan after different
time of mixing, cooled at different conditions (High shear Mixer, Water bath, Room
Temperature).
Time (minutes) K N Shear Stress (Pa) Viscosity (mPas)
Water Bath 3 0,0047 1,0948 0,73 7,27
Room Temperature 3 0,0080 1,0237 0,89 8,92
HSM 3 0,0137 0,9537 1,11 11,07
Room Temperature 18 0,0101 0,9920 0,97 9,73
HSM 18 0,0160 0,9376 1,20 12,00
Table 20 shows viscosity of chocolate milk containing 0.02% of carrageenan, that
were cooled down to 30 oC by different methods that include cooling of the samples
while mixing in High Shear Mixer, water bath and leaving the samples at room
temperature. The viscosity values obtained while cooling the system in High Shear
Mixer was higher when compared to the viscosity of chocolate milk cooled at either
room temperature or water bath. It this has to do with the setting temperature of
carrageenan. If the cooling is performed while exposed to mixing, then we get a more
viscous product as the mixing is efficient.
From Table 19 and 20, it is observed that carrageenan does not show any changes
in viscosity for different cooling conditions in water. However, when carrageenan is
dispersed in milk system in a concentration of as low as 0.02% a difference in
viscosity is observed when the system is cooled in High Shear Mixer due to presence
of milk protein (casein) in milk and its interaction with kappa-carrageenan.
In conclusion, the viscosity of 0.02%, 0.5% and 1% kappa carrageenan in water was
not affected by time and temperature of mixing. Also, 1% of kappa carrageenan
solution did not form any elastic component and showed no yield stress. Viscosity
increased in chocolate milk when compared to water. In chocolate milk, the viscosity
continued to increase slightly during hydration of carrageenan while no change is
observed in the water matrix. In chocolate milk containing 0.02% kappa carrageenan,
the viscosity was affected by temperature and there was a drastic increase in
viscosity by cooling the chocolate milk from 70 OC to 30 OC in High Shear Mixer.
Kappa carrageenan has a property to bind with the milk proteins (k-casein) present in
the milk which helps in the formation of network, entrapping the cacao particle and
stabilizing the chocolate milk. It was also observed that the viscosity of carrageenan
in chocolate milk was higher without homogenization. For network formation cooling
step while mixing is important and as the stability result showed, the sedimentation of
cocoa particles reduced considerably after cooling to 30 OC. There was no large
difference between the stability of homogenised and non-homogenised samples.

55
General
5. Conclusion
From the above study we can conclude that there is an effect of High Shear Mixer on
rheological behaviour of non-starch-based hydrocolloids. Altering parameters like
mixing temperature and time, influences the functionality of the hydrocolloid solution.
However, there was no effect of mixing speed observed on the viscosity of
hydrocolloid solutions. It was also observed that there is an effect of mixing time
which is dependent on the type of the hydrocolloids used and its structure. The
molecular structure of hydrocolloids plays an important role on the functionality, as it
affects the mechanism with which hydrocolloids disperses and hydrates in the
system.
In general, at low concentration of hydrocolloids, no effect of time, temperature and
speed of mixing was observed, after 180 seconds of mixing. While at higher
concentration, samples were collected after 10 seconds of mixing and it was
observed that there was a significant difference in rheology behaviour in the initial
mixing time (i.e. 10 seconds to 60 seconds) and after about 200 seconds of mixing
the system was stable. Thus, it is concluded that at higher concentration the mixing
time was an important parameter affecting the rheology of the hydrocolloid solution.
Also, temperature of the system influences the functionality of the gum and is highly
dependent on the concentration and type of hydrocolloid used.
Food matrix is a complex system, consisting of multi-components like sugar, fat, etc.
It was observed that the behaviour of hydrocolloids in aqueous system was different
from their behaviour when dispersed in the food matrix. Hydrocolloids can be affected
by different factors like pH, ions, sugar, proteins, etc. which are present in the food
system, influencing their functionality. For apple juice, loss in viscosity of
hydrocolloids was observed when compared to the water matrix due to the low pH in
apple juice which degrades the hydrocolloids. However, for chocolate milk, it was
noticed that with the addition of hydrocolloids, there was an increase in viscosity and
stability of the chocolate milk was improved.

56
General
6. Reference
Alderman, N. (1997). Non-Newtonian Fluids: Guide to Classification and
Characteristics. Project: Slurry, Paste and Polymer Rheology, [online] Report
number: ESDU Data Item 97034.
AlsaidYagoub, N. and Osman M. Nur, A. (2013). The influence of thermal treatment
on physical properties of guar gum. International Journal of Innovations in
Pharmaceutical Sciences.
Barnes, H. (1997). Thixotropy—a review. Journal of Non-Newtonian Fluid Mechanics,
70(1-2), pp.1-33.
Beaudoin, J. (2001). Handbook of Analytical Techniques in Concrete Science and
Technology. William Andrew, pp.333-367.
Beckett, S. (1996). Physico-Chemical Aspects of Food Processing. 2nd ed. Boston:
Springer US, pp.49-64.
Bemiller, J. (1986). ChemInform Abstract: An Introduction to Pectins: Structure and
Properties. Chemischer Informationsdienst, 17(48), pp.3-10.
Bevington, Phillip and Robinson, D. Data Reduction and Error Analysis for the
Physical Sciences, 2nd. ed. McGraw-Hill: New York, 1991.
Cedergårdh, F., (2014) Characterization of commercial mayonnaise products –
texture, viscosity and droplet size. Lund University. Master thesis.
Clark, S., Costello, M., Drake, M. and Bodyfelt, F. (2009). The Sensory Evaluation of
Dairy Products. 2nd ed. New York: Springer, New York, NY, p.120.
CP Kelco U S Inc (1998). Reduced molecular weight native gellan gum.
US6242035B1.
Drohan, D., Tziboula, A., McNulty, D. and Horne, D. (1997). Milk protein-carrageenan
interactions. Food Hydrocolloids, 11(1), pp.101-107.
Heldman, D., Lund, D. and Sabliov, C. (2007). Handbook of food engineering. 2nd
ed. Boca Raton: CRC Press.
Hoefler, A. (2004). Hydrocolloids. 1st ed. St. Paul, Minnesota: Eagan Press.
Imeson, A. (2010). Food stabilisers, thickeners and gelling agents. 1st ed.
Chichester, U.K.: Wiley-Blackwell Pub.
Lai, V., Wong, P. and Lii, C. (2000). Effects of Cation Properties on Sol-gel Transition
and Gel Properties of κ-carrageenan. Journal of Food Science, 65(8), pp.1332-1337.
Lopes da Silva, J., Gonçalves, M. and Rao, M. (1994). Influence of temperature on
the dynamic and steady-shear rheology of pectin dispersions. Carbohydrate
Polymers, 23(2), pp.77-87.

57
General
Metodiev Zhivkov, A. (2013). Cellulose, Fundamental aspects. 1st ed. Montreal:
Intecopen, pp.197-222.
Muhidinov, Z., Fishman, M., Avloev, K., Norova, M., Nasriddinov, A. and Khalikov, D.
(2010). Effect of temperature on the intrinsic viscosity and conformation of different
pectins. Polymer Science Series A, 52(12), pp.1257-1263.
Phillips, G. and Williams, P. (2014). Handbook of hydrocolloids. 2nd ed. Cambridge:
Woodhead Publishing Limited.
Steffe, J. and Morgan, R. (1987). On-line measurement of dynamic rheological
properties during food extrusion. Journal of Food Process Engineering, 10(1), pp.21-
26.
Sworn, G., Sanderson, G. and Gibson, W. (1995). Gellan gum fluid gels. Food
Hydrocolloids, [online] 9(4), pp.265-271.
Tetrapak.com. (2019). Tetra Pak High Shear Mixer, a complete mixing solution.
[online] Available at: https://www.tetrapak.com/processing/mixing/tetra-pak-high-
shear-mixer [Accessed 20 May 2019].

58
General
7. Appendix
7.1. Material and Methods
7.1.1. Rheometer, Kinexus Pro+
Rheometer used for the viscosity and yield stress measurement is shown in Figure
A1.
Figure A1: Kinexus Pro+, Rheometer.
7.1.2. Texture Analyser
Settings applied on the Texture analyser for measuring the Stevens value are given
in table A1.

59
General
Table A1: Settings applied on the Texture Analyser while measuring Stevens value.
Parameter Setting
Test Mode Compression
Pre-Test speed 2 mm/sec
Test Speed 2 mm/sec
Post-Test Speed 2 mm/sec
Target Mode Distance
Distance 25 mm
Trigger Type Auto (Force)
Trigger Force 0.5 g
Probe Type Disc plunger
Sample Shape Cylindrical
Sample volume 100 ml
7.1.3. Homogeniser and Centrifuge
Homogeniser and the centrifuge used for chocolate milk are shown below in Figure
A3 a) and b) respectively.
Figure A3: a) High pressure Panda PLUS homogenizer, b) Centrifuge Allegra X-15R
7.1.4. Stability Test For stability test, the samples to be tested was chocolate milk. Chocolate milk was prepared in the High Shear Mixer without any addition of gums and without homogenising it. To develop this method, the samples were filled up to 10 ml in the centrifuge tubes and were centrifuged at different speeds for different times. Different speeds used were 500, 1000, 1500 and 2000 rpm and times used were 5, 10, 15 and 20 minutes

60
General
in different combinations as shown in Table A2. After the centrifugation, the tubes were taken out and with the help of a scale, the height of the sediment deposited was noted. For 500 rpm no clear border was observed. While in the case of 1000 rpm for lower time the sediment of cacao particles was not clear to be measured, but at higher time the sedimentation was incomplete. Thus, the samples that were centrifuged for speed less than 1500 rpm, showed incomplete sedimentation of cocoa particles. After centrifugation at 2000 rpm for 20 minutes the sediment obtained was 9mm which was the maximum sediment that can be obtained. Thus, at 1500 rpm after 15 minutes of centrifugation the same amount of sediment was seen. Therefore, for all the trials done further for testing the stability of chocolate milk 1500 rpm for 15 minutes was used. Table A2: Test conditions for stability test.
RPM Time (mins) sediment (mm)
500 5 no sediment
10 no sediment
15 no clear border
20 no clear border
1000 5 no clear border
10 no clear border
15 5
20 7
1500 5 no clear border
10 6
15 9
20 9
2000 5 7
10 9
15 9
20 9

61
General
7.2. Sources of Error
7.2.1. Batch to batch error:
To calculate the batch to batch error, five batches were prepared with the same
conditions and concentration of xanthan gum in the High Shear Mixer. The conditions
are mentioned in Table A3.
Table A3: Conditions for samples prepared with Xanthan.
Concentration (%) Temperature (oC) Speed (%) Time (mins)
0.05 60 70 3
For all the 5 samples, rheometer measurement for viscosity was performed and the
results obtained are as below in Table A4:
Table A4: Shear stress value for 5 batches of samples obtained from the Rheometer
measurements.
Shear rate(s-¹)
Shear stress(Pa)
(1)
Shear stress(Pa)
(2)
Shear stress(Pa)
(3)
Shear stress(Pa)
(4)
Shear stress(Pa)
(5)
20,00 0,30 0,25 0,27 0,27 0,29
31,70 0,37 0,32 0,34 0,34 0,36
50,24 0,46 0,40 0,42 0,43 0,45
79,63 0,58 0,52 0,54 0,54 0,57
126,20 0,76 0,68 0,71 0,71 0,74
200,00 1,02 0,93 0,97 0,98 1,01
317,00 1,45 1,40 1,41 1,43 1,45
502,40 3,03 2,94 2,99 2,99 3,01
796,30 5,02 4,85 4,92 4,98 5,06
1000,00 6,79 6,78 6,70 6,80 6,93
From all the shear stress values obtained from Table A4, average and standard
deviation of the values is calculated. Double of standard deviation is divided by the
average and the percentage of the obtained value is calculated as shown in Table
A5.

62
General
Table A5: Average (Avg), standard deviation (SD) and Percentage values.
Avg (Pa)
SD (Pa)
SD*2 (Pa) (SD*2)/avg
% ((SD*2)/avg)
0,27 0,02 0,04 0,07 6,57
0,34 0,02 0,04 0,06 5,99
0,43 0,02 0,05 0,05 5,27
0,55 0,03 0,05 0,05 4,77
0,72 0,03 0,06 0,04 4,17
0,98 0,04 0,07 0,04 3,60
1,43 0,02 0,05 0,02 1,67
2,99 0,04 0,07 0,01 1,19
4,96 0,08 0,16 0,02 1,66
6,80 0,08 0,16 0,01 1,20
The highest value obtained of the error from Table A5 is 6.5. Thus, the error
considered for batch to batch was 6.5%. It is observed from Table A5 that error
decreases with an increase in shear rate.
7.2.1. Measurement Error
To calculate the measurement error, samples of xanthan gum made in the High
Shear Mixer were tested thrice in Rheometer. The conditions are mentioned in Table
A6.
Table A6: Conditions for samples prepared with Xanthan for Measurement Error.
Concentration (%) Temperature (0C) Speed (%) Time (mins)
0.05 60 70 3
For 3 times, rheometer measurement for viscosity was performed and the results
obtained are as below in Table A7:
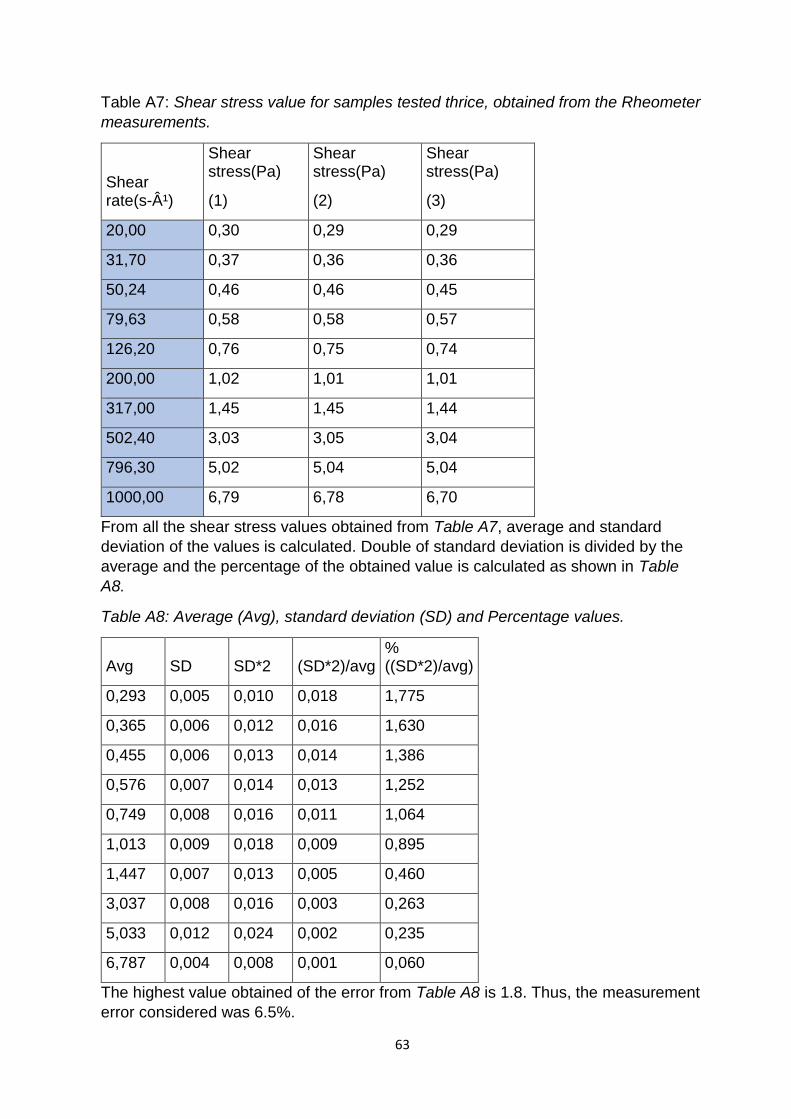
63
General
Table A7: Shear stress value for samples tested thrice, obtained from the Rheometer
measurements.
Shear rate(s-¹)
Shear stress(Pa)
(1)
Shear stress(Pa)
(2)
Shear stress(Pa)
(3)
20,00 0,30 0,29 0,29
31,70 0,37 0,36 0,36
50,24 0,46 0,46 0,45
79,63 0,58 0,58 0,57
126,20 0,76 0,75 0,74
200,00 1,02 1,01 1,01
317,00 1,45 1,45 1,44
502,40 3,03 3,05 3,04
796,30 5,02 5,04 5,04
1000,00 6,79 6,78 6,70
From all the shear stress values obtained from Table A7, average and standard
deviation of the values is calculated. Double of standard deviation is divided by the
average and the percentage of the obtained value is calculated as shown in Table
A8.
Table A8: Average (Avg), standard deviation (SD) and Percentage values.
Avg SD SD*2 (SD*2)/avg % ((SD*2)/avg)
0,293 0,005 0,010 0,018 1,775
0,365 0,006 0,012 0,016 1,630
0,455 0,006 0,013 0,014 1,386
0,576 0,007 0,014 0,013 1,252
0,749 0,008 0,016 0,011 1,064
1,013 0,009 0,018 0,009 0,895
1,447 0,007 0,013 0,005 0,460
3,037 0,008 0,016 0,003 0,263
5,033 0,012 0,024 0,002 0,235
6,787 0,004 0,008 0,001 0,060
The highest value obtained of the error from Table A8 is 1.8. Thus, the measurement
error considered was 6.5%.
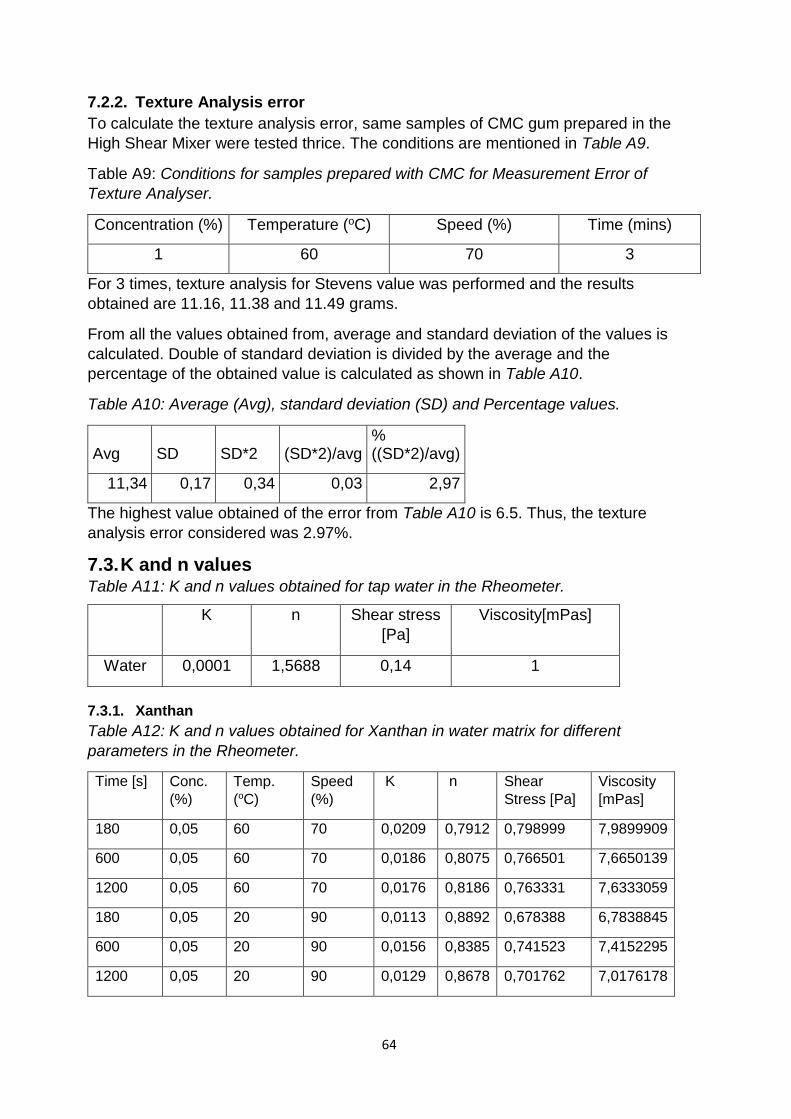
64
General
7.2.2. Texture Analysis error
To calculate the texture analysis error, same samples of CMC gum prepared in the
High Shear Mixer were tested thrice. The conditions are mentioned in Table A9.
Table A9: Conditions for samples prepared with CMC for Measurement Error of
Texture Analyser.
Concentration (%) Temperature (oC) Speed (%) Time (mins)
1 60 70 3
For 3 times, texture analysis for Stevens value was performed and the results
obtained are 11.16, 11.38 and 11.49 grams.
From all the values obtained from, average and standard deviation of the values is
calculated. Double of standard deviation is divided by the average and the
percentage of the obtained value is calculated as shown in Table A10.
Table A10: Average (Avg), standard deviation (SD) and Percentage values.
Avg SD SD*2 (SD*2)/avg % ((SD*2)/avg)
11,34 0,17 0,34 0,03 2,97
The highest value obtained of the error from Table A10 is 6.5. Thus, the texture
analysis error considered was 2.97%.
7.3. K and n values Table A11: K and n values obtained for tap water in the Rheometer.
7.3.1. Xanthan
Table A12: K and n values obtained for Xanthan in water matrix for different
parameters in the Rheometer.
Time [s] Conc.
(%)
Temp.
(oC)
Speed
(%)
K n Shear
Stress [Pa]
Viscosity
[mPas]
180 0,05 60 70 0,0209 0,7912 0,798999 7,9899909
600 0,05 60 70 0,0186 0,8075 0,766501 7,6650139
1200 0,05 60 70 0,0176 0,8186 0,763331 7,6333059
180 0,05 20 90 0,0113 0,8892 0,678388 6,7838845
600 0,05 20 90 0,0156 0,8385 0,741523 7,4152295
1200 0,05 20 90 0,0129 0,8678 0,701762 7,0176178
K n Shear stress
[Pa]
Viscosity[mPas]
Water 0,0001 1,5688 0,14 1
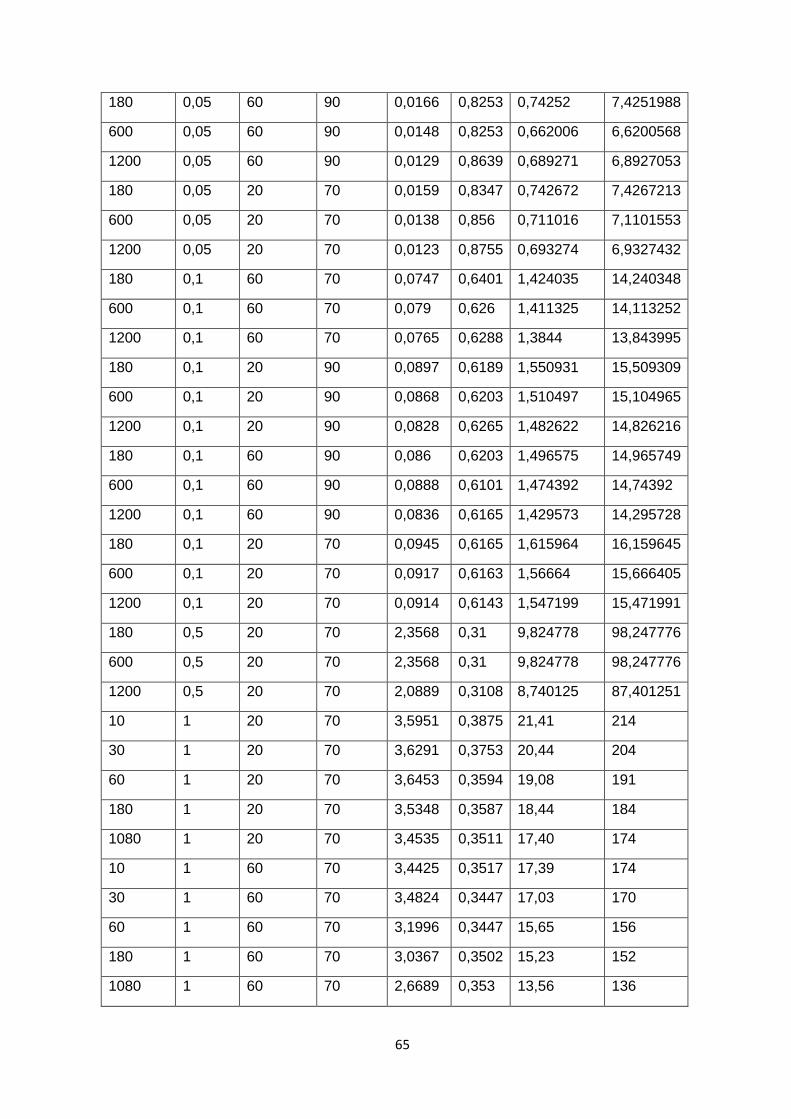
65
General
180 0,05 60 90 0,0166 0,8253 0,74252 7,4251988
600 0,05 60 90 0,0148 0,8253 0,662006 6,6200568
1200 0,05 60 90 0,0129 0,8639 0,689271 6,8927053
180 0,05 20 70 0,0159 0,8347 0,742672 7,4267213
600 0,05 20 70 0,0138 0,856 0,711016 7,1101553
1200 0,05 20 70 0,0123 0,8755 0,693274 6,9327432
180 0,1 60 70 0,0747 0,6401 1,424035 14,240348
600 0,1 60 70 0,079 0,626 1,411325 14,113252
1200 0,1 60 70 0,0765 0,6288 1,3844 13,843995
180 0,1 20 90 0,0897 0,6189 1,550931 15,509309
600 0,1 20 90 0,0868 0,6203 1,510497 15,104965
1200 0,1 20 90 0,0828 0,6265 1,482622 14,826216
180 0,1 60 90 0,086 0,6203 1,496575 14,965749
600 0,1 60 90 0,0888 0,6101 1,474392 14,74392
1200 0,1 60 90 0,0836 0,6165 1,429573 14,295728
180 0,1 20 70 0,0945 0,6165 1,615964 16,159645
600 0,1 20 70 0,0917 0,6163 1,56664 15,666405
1200 0,1 20 70 0,0914 0,6143 1,547199 15,471991
180 0,5 20 70 2,3568 0,31 9,824778 98,247776
600 0,5 20 70 2,3568 0,31 9,824778 98,247776
1200 0,5 20 70 2,0889 0,3108 8,740125 87,401251
10 1 20 70 3,5951 0,3875 21,41 214
30 1 20 70 3,6291 0,3753 20,44 204
60 1 20 70 3,6453 0,3594 19,08 191
180 1 20 70 3,5348 0,3587 18,44 184
1080 1 20 70 3,4535 0,3511 17,40 174
10 1 60 70 3,4425 0,3517 17,39 174
30 1 60 70 3,4824 0,3447 17,03 170
60 1 60 70 3,1996 0,3447 15,65 156
180 1 60 70 3,0367 0,3502 15,23 152
1080 1 60 70 2,6689 0,353 13,56 136
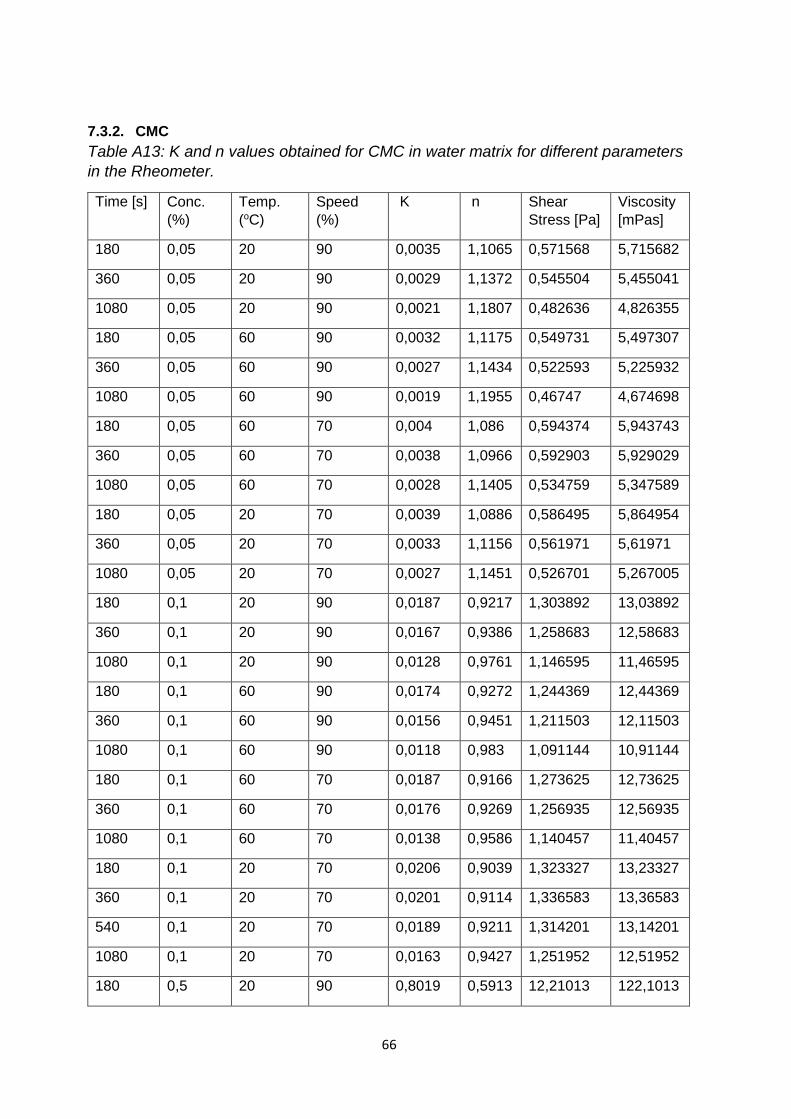
66
General
7.3.2. CMC
Table A13: K and n values obtained for CMC in water matrix for different parameters
in the Rheometer.
Time [s] Conc.
(%)
Temp.
(oC)
Speed
(%)
K n Shear
Stress [Pa]
Viscosity
[mPas]
180 0,05 20 90 0,0035 1,1065 0,571568 5,715682
360 0,05 20 90 0,0029 1,1372 0,545504 5,455041
1080 0,05 20 90 0,0021 1,1807 0,482636 4,826355
180 0,05 60 90 0,0032 1,1175 0,549731 5,497307
360 0,05 60 90 0,0027 1,1434 0,522593 5,225932
1080 0,05 60 90 0,0019 1,1955 0,46747 4,674698
180 0,05 60 70 0,004 1,086 0,594374 5,943743
360 0,05 60 70 0,0038 1,0966 0,592903 5,929029
1080 0,05 60 70 0,0028 1,1405 0,534759 5,347589
180 0,05 20 70 0,0039 1,0886 0,586495 5,864954
360 0,05 20 70 0,0033 1,1156 0,561971 5,61971
1080 0,05 20 70 0,0027 1,1451 0,526701 5,267005
180 0,1 20 90 0,0187 0,9217 1,303892 13,03892
360 0,1 20 90 0,0167 0,9386 1,258683 12,58683
1080 0,1 20 90 0,0128 0,9761 1,146595 11,46595
180 0,1 60 90 0,0174 0,9272 1,244369 12,44369
360 0,1 60 90 0,0156 0,9451 1,211503 12,11503
1080 0,1 60 90 0,0118 0,983 1,091144 10,91144
180 0,1 60 70 0,0187 0,9166 1,273625 12,73625
360 0,1 60 70 0,0176 0,9269 1,256935 12,56935
1080 0,1 60 70 0,0138 0,9586 1,140457 11,40457
180 0,1 20 70 0,0206 0,9039 1,323327 13,23327
360 0,1 20 70 0,0201 0,9114 1,336583 13,36583
540 0,1 20 70 0,0189 0,9211 1,314201 13,14201
1080 0,1 20 70 0,0163 0,9427 1,251952 12,51952
180 0,5 20 90 0,8019 0,5913 12,21013 122,1013

67
General
1080 0,5 20 90 0,7768 0,5982 12,20982 122,0982
180 0,5 60 90 0,6257 0,6107 10,41756 104,1756
1080 0,5 60 90 0,5278 0,6237 9,329737 93,29737
180 0,5 60 70 0,6638 0,6064 10,83521 108,3521
1080 0,5 60 70 0,6342 0,6129 10,66661 106,6661
180 0,5 20 70 1,0222 0,5449 12,57002 125,7002
360 0,5 20 70 1,0324 0,5435 12,61386 126,1386
540 0,5 20 70 1,0136 0,546 12,52756 125,2756
1080 0,5 20 70 1,0115 0,5473 12,57668 125,7668
10 1 20 70 24,07 0,3289 109,47 746
30 1 20 70 14,368 0,3577 74,61 551
60 1 20 70 9,3513 0,3853 55,14 447
180 1 20 70 6,8175 0,4083 44,69 446
1080 1 20 70 6,8149 0,4082 44,65 444
10 1 60 70 8,687 0,3891 52,13 544
30 1 60 70 9,2576 0,3846 54,41 477
180 1 60 70 7,6504 0,3972 47,65 457
1080 1 60 70 7,0861 0,4047 45,69 457
7.3.3. Gellan
Table A14: K and n values obtained for Gellan in water matrix for different parameters
in the Rheometer.
Time [s] Conc.
(%)
Temp.
(oC)
Speed
(%)
K n Shear
Stress [Pa]
Viscosity
[mPas]
10 0,1 60 70 0,0136 0,8756 0,7669 7,669003
30 0,1 60 70 0,0145 0,8637 0,774048 7,740482
180 0,1 60 70 0,0152 0,8568 0,786038 7,860381
360 0,1 60 70 0,0138 0,8694 0,756274 7,562739
1080 0,1 60 70 0,0097 0,9179 0,664617 6,646174
180 0,1 80 70 0,0104 0,9089 0,683649 6,836492
360 0,1 80 70 0,0084 0,94 0,637205 6,372052
1080 0,1 80 70 0,0046 1,0241 0,513994 5,139937
180 0,1 60 90 0,0132 0,8772 0,749849 7,498492

68
General
360 0,1 60 90 0,0118 0,892 0,717599 7,175993
1080 0,1 60 90 0,0069 0,9667 0,591901 5,91901
180 0,1 80 90 0,0126 0,8861 0,745711 7,45711
360 0,1 80 90 0,011 0,9043 0,707934 7,079339
1080 0,1 80 90 0,0058 0,9911 0,556709 5,567087
10 0,2 60 70 0,1394 0,6026 2,235954 22,35954
180 0,2 60 70 0,1404 0,5989 2,213946 22,13946
360 0,2 60 70 0,1563 0,5834 2,294875 22,94875
1080 0,2 60 70 0,1328 0,6012 2,116402 21,16402
180 0,2 80 70 0,1022 0,6394 1,942007 19,42007
360 0,2 80 70 0,0832 0,6644 1,773876 17,73876
1080 0,2 80 70 0,0732 0,6714 1,6118 16,118
180 0,2 60 90 0,1422 0,5946 2,198364 21,98364
360 0,2 60 90 0,1232 0,6116 2,059732 20,59732
1080 0,2 60 90 0,1023 0,6352 1,90667 19,0667
180 0,2 80 90 0,1078 0,6301 1,962541 19,62541
360 0,2 80 90 0,0924 0,6475 1,822519 18,22519
1080 0,2 80 90 0,0613 0,6927 1,488883 14,88883
10 0,15 60 70 0,0539 0,7136 1,441414 14,41414
30 0,15 60 70 0,0549 0,7136 1,468156 14,68156
180 0,15 60 70 0,0515 0,7152 1,387418 13,87418
360 0,15 60 70 0,0499 0,7164 1,351763 13,51763
1080 0,15 60 70 0,0421 0,7368 1,252801 12,52801
180 0,15 80 70 0,0386 0,7507 1,22458 12,2458
360 0,15 80 70 0,03 0,7853 1,116147 11,16147
1080 0,15 80 70 0,0226 0,8126 0,953473 9,534731
180 0,15 60 90 0,0537 0,7076 1,396929 13,96929
360 0,15 60 90 0,0483 0,7207 1,334588 13,34588
1080 0,15 60 90 0,0322 0,7752 1,143552 11,43552
180 0,15 80 90 0,0423 0,7408 1,282155 12,82155
360 0,15 80 90 0,0374 0,7537 1,203017 12,03017

69
General
1080 0,15 80 90 0,0162 0,8576 0,840843 8,408432
10 1 60 70 12,336 0,2442 37,9817 379,817
30 1 60 70 13,493 0,2368 40,15212 401,5212
60 1 60 70 13,868 0,234 40,73933 407,3933
180 1 60 70 11,308 0,246 35,10636 351,0636
1080 1 60 70 13,681 0,2117 36,26752 362,6752
10 1 80 70 18,626 0,2001 46,80795 468,0795
30 1 80 70 19,455 0,1939 47,51505 475,1505
60 1 80 70 19,142 0,1877 45,43466 454,3466
180 1 80 70 17,08 0,191 41,16118 411,6118
1080 1 80 70 18,495 0,1582 38,32254 383,2254
7.3.4. Carrageenan
Table A15: K and n values obtained for Carrageenan in water matrix for different
parameters in the Rheometer.
Time[s] Conc.
[%]
Temp.
[oC]
K n Shear stress
[Pa]
Viscosity
[mPas]
120 0,02 20 0,0003 1,452 0,240503 2,41
250 0,02 70 0,0002 1,481 0,183244 1,83
310 0,02 70 0,0002 1,4848 0,186479 1,86
490 0,02 70 0,0002 1,4827 0,184684 1,85
1570 0,02 70 0,0002 1,4916 0,192411 1,92
1810 0,02 50 0,0002 1,4919 0,192677 1,93
1930 0,02 30 0,0002 1,4971 0,197347 1,97
120 0,5 20 0,0401 0,8751 2,256027 22,56
250 0,5 70 0,0377 0,8864 2,234299 22,34
310 0,5 70 0,0377 0,8864 2,234299 22,34
490 0,5 70 0,038 0,8857 2,244831 22,45
1570 0,5 70 0,0356 0,8931 2,175955 21,76
1810 0,5 50 0,035 0,8956 2,164054 21,64
1930 0,5 30 0,0361 0,8908 2,183269 21,83
120 1 20 0,3844 0,6658 8,248659547 82,49

70
General
250 1 70 0,2917 0,7096 7,658371 76,58
310 1 70 0,3152 0,7012 7,961341 79,61
490 1 70 0,3144 0,7007 7,92287 79,23
1570 1 70 0,3047 0,7056 7,853666 78,54
1810 1 50 0,2772 0,7147 7,450634 74,51
1930 1 30 0,2796 0,7126 7,442814 74,43
Carrageenan with calcium
Time [s] Conc. [%] Temp.
[oC]
K n Shear
stress [Pa]
Viscosity
120 1 20 0,2566 0,6686 5,577719 55,78
250 1 70 0,3418 0,6701 7,481214 74,81
310 1 70 0,3455 0,6719 7,625144 76,25
490 1 70 0,352 0,6696 7,686748 76,87
1570 1 70 0,3389 0,6741 7,555645 75,56
1810 1 50 0,3216 0,6792 7,340338 73,40
1930 1 30 0,3291 0,6744 7,347302 73,47
7.3.5. Apple juice
Table A16: K and n values obtained for Apple juice for CMC, Xanthan and Pectin in
the Rheometer.
Hydrocolloid Conc.
(%)
Time (s) Temp.
(oC)
K n Shear
Stress
(Pa)
Viscosity
(mPas)
CMC 0,05 10 20 0,0011 1,2631 0,36948 3,69
0,05 120 20 0,0015 1,2206 0,41428 4,14
0,05 250 80 0,0006 1,3583 0,31243 3,12
0,05 270 80 0,0006 1,3587 0,31300 3,13
0,05 300 80 0,0006 1,3609 0,31619 3,16
0,05 360 80 0,0006 1,3632 0,31956 3,20
0,05 420 80 0,0006 1,3626 0,31868 3,19
0,05 600 40 0,0005 1,372 0,27731 2,77

71
General
Xanthan 0,05 10 20 0,0133 0,8886 0,79625 7,96
0,05 120 20 0,0121 0,8994 0,76135 7,61
0,05 250 80 0,0063 0,9931 0,61030 6,10
0,05 270 80 0,0066 0,9879 0,62423 6,24
0,05 300 80 0,0063 0,9931 0,61030 6,10
0,05 360 80 0,0065 0,9903 0,62160 6,22
0,05 420 80 0,0061 0,9985 0,60580 6,06
0,05 600 40 0,0054 1,017 0,58397 5,84
Pectin 0,2 10 20 0,0006 1,3649 0,32207 3,22
0,2 120 20 0,0005 1,3732 0,27885 2,79
0,2 250 80 0,0005 1,3911 0,30281 3,03
0,2 270 80 0,0005 1,377 0,28377 2,84
0,2 300 80 0,0005 1,3878 0,29824 2,98
0,2 360 80 0,0005 1,3937 0,30646 3,06
0,2 420 80 0,0005 1,3921 0,30421 3,04
0,2 600 40 0,0005 1,3737 0,27949 2,79
Pectin 2 10 20 0,1192 0,8968 7,41099 74,11
2 120 20 0,1435 0,8866 8,51240 85,12
2 250 80 0,0843 0,9312 6,14084 61,41
2 270 80 0,0844 0,9296 6,10299 61,03
2 300 80 0,0845 0,9305 6,13560 61,36
2 360 80 0,0781 0,9387 5,88913 58,89
2 420 80 0,0787 0,938 5,91527 59,15
2 600 40 0,0635 0,9524 5,10004 51,00
7.3.6. Chocolate milk
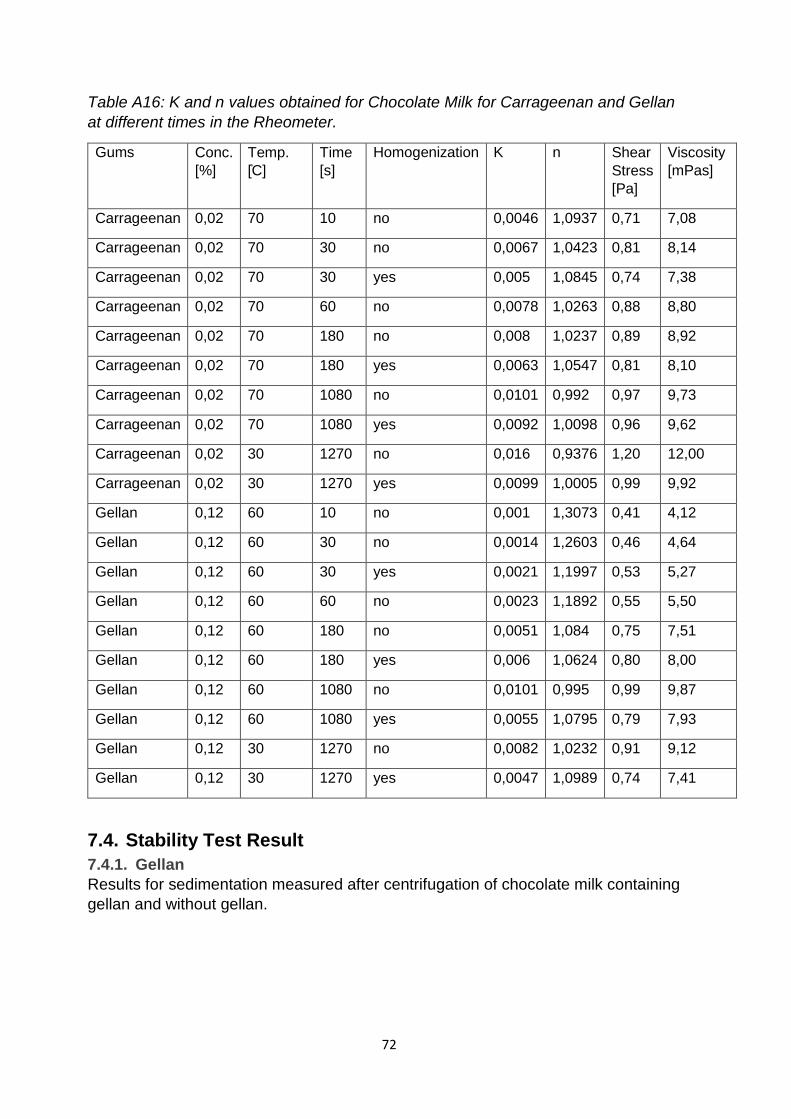
72
General
Table A16: K and n values obtained for Chocolate Milk for Carrageenan and Gellan
at different times in the Rheometer.
Gums Conc.
[%]
Temp.
[֯C]
Time
[s]
Homogenization K n Shear
Stress
[Pa]
Viscosity
[mPas]
Carrageenan 0,02 70 10 no 0,0046 1,0937 0,71 7,08
Carrageenan 0,02 70 30 no 0,0067 1,0423 0,81 8,14
Carrageenan 0,02 70 30 yes 0,005 1,0845 0,74 7,38
Carrageenan 0,02 70 60 no 0,0078 1,0263 0,88 8,80
Carrageenan 0,02 70 180 no 0,008 1,0237 0,89 8,92
Carrageenan 0,02 70 180 yes 0,0063 1,0547 0,81 8,10
Carrageenan 0,02 70 1080 no 0,0101 0,992 0,97 9,73
Carrageenan 0,02 70 1080 yes 0,0092 1,0098 0,96 9,62
Carrageenan 0,02 30 1270 no 0,016 0,9376 1,20 12,00
Carrageenan 0,02 30 1270 yes 0,0099 1,0005 0,99 9,92
Gellan 0,12 60 10 no 0,001 1,3073 0,41 4,12
Gellan 0,12 60 30 no 0,0014 1,2603 0,46 4,64
Gellan 0,12 60 30 yes 0,0021 1,1997 0,53 5,27
Gellan 0,12 60 60 no 0,0023 1,1892 0,55 5,50
Gellan 0,12 60 180 no 0,0051 1,084 0,75 7,51
Gellan 0,12 60 180 yes 0,006 1,0624 0,80 8,00
Gellan 0,12 60 1080 no 0,0101 0,995 0,99 9,87
Gellan 0,12 60 1080 yes 0,0055 1,0795 0,79 7,93
Gellan 0,12 30 1270 no 0,0082 1,0232 0,91 9,12
Gellan 0,12 30 1270 yes 0,0047 1,0989 0,74 7,41
7.4. Stability Test Result
7.4.1. Gellan
Results for sedimentation measured after centrifugation of chocolate milk containing
gellan and without gellan.
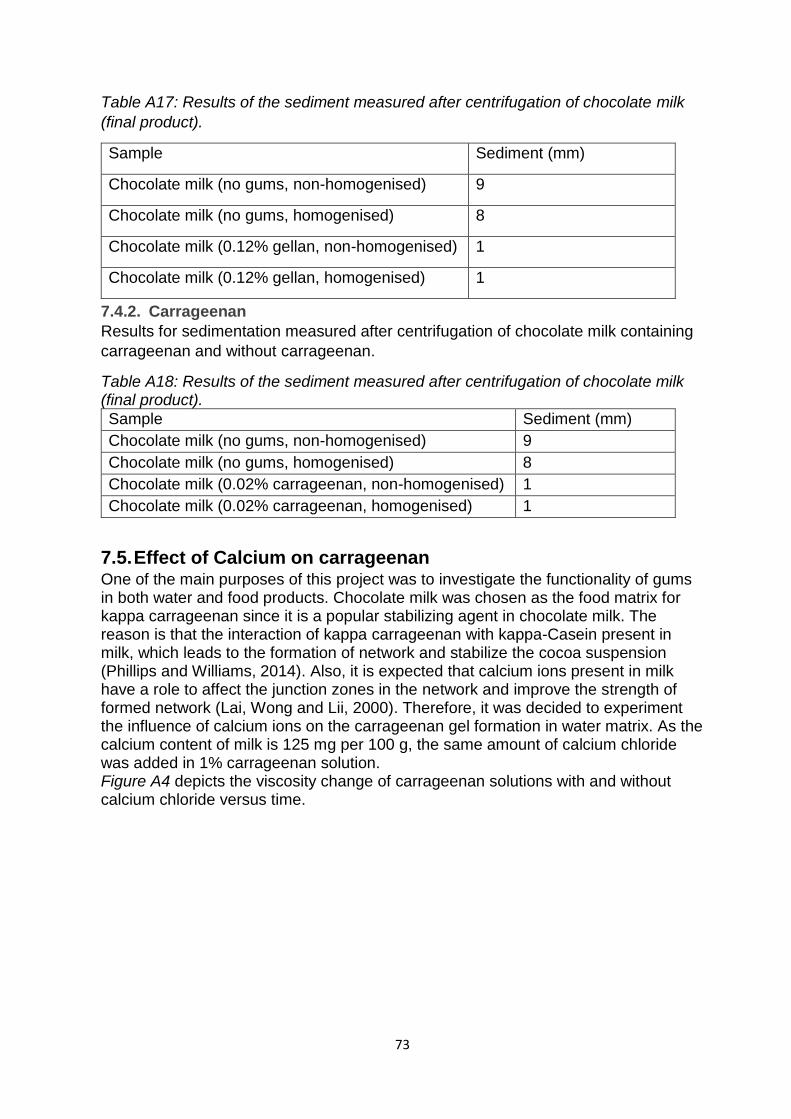
73
General
Table A17: Results of the sediment measured after centrifugation of chocolate milk
(final product).
Sample Sediment (mm)
Chocolate milk (no gums, non-homogenised) 9
Chocolate milk (no gums, homogenised) 8
Chocolate milk (0.12% gellan, non-homogenised) 1
Chocolate milk (0.12% gellan, homogenised) 1
7.4.2. Carrageenan
Results for sedimentation measured after centrifugation of chocolate milk containing
carrageenan and without carrageenan.
Table A18: Results of the sediment measured after centrifugation of chocolate milk (final product). Sample Sediment (mm)
Chocolate milk (no gums, non-homogenised) 9
Chocolate milk (no gums, homogenised) 8
Chocolate milk (0.02% carrageenan, non-homogenised) 1
Chocolate milk (0.02% carrageenan, homogenised) 1
7.5. Effect of Calcium on carrageenan One of the main purposes of this project was to investigate the functionality of gums in both water and food products. Chocolate milk was chosen as the food matrix for kappa carrageenan since it is a popular stabilizing agent in chocolate milk. The reason is that the interaction of kappa carrageenan with kappa-Casein present in milk, which leads to the formation of network and stabilize the cocoa suspension (Phillips and Williams, 2014). Also, it is expected that calcium ions present in milk have a role to affect the junction zones in the network and improve the strength of formed network (Lai, Wong and Lii, 2000). Therefore, it was decided to experiment the influence of calcium ions on the carrageenan gel formation in water matrix. As the calcium content of milk is 125 mg per 100 g, the same amount of calcium chloride was added in 1% carrageenan solution. Figure A4 depicts the viscosity change of carrageenan solutions with and without calcium chloride versus time.

74
Figure A4: Apparent Viscosity of 1% carrageenan solutions and 125 mg of calcium chloride during the preparation at 70% speed. Error bar is showing standard deviation error with 95% confidence interval.
According to the Figure A4, it is observed that in the solution containing calcium chloride at 20 °C, there is a drastic increase in viscosity from 10 to 250 seconds in viscosity and post that the viscosity remains stable over the mixing time. The reason for the increase could be due to the dispersion of powder after 250 seconds of mixing. By increasing the temperature due to the complete dissolution of the dispersed particles in the system, there is no viscosity change observed during the preparation. Furthermore, apart from the dispersion point there is no significant differences between the viscosity of carrageenan solution and carrageenan solution containing calcium in Figure A4. Both the curves lie in the measurement error range depicting that no effect on viscosity is observed.
Texture
Figure A5 illustrates the Stevens value of 1% carrageenan as a function of mixing time at different temperatures (20 °C, 70 °C, 50 °C ,30 °C) at 70% mixing speed.
20,00
30,00
40,00
50,00
60,00
70,00
80,00
90,00
100,00
110,00
120,00
0 500 1000 1500 2000
Ap
par
ent
VIs
cosi
ty @
10
0 (
1/s
) (m
Pas
)
Time(s)
Carageenan with calcium
1% without calcium
1% with calcium
30 oC
50 oC70 oC20 oC

75
Figure A5: Stevens value of 1% carrageenan solution and 1% carrageenan solution
containing 125 mg of calcium chloride during the preparation at 70%speed. Error bar
is showing standard deviation error with 95% confidence interval.
Both the solutions show almost stable Stevens value during the dispersion and
heating stage up to 1570 seconds as shown in Figure A5. In the case of solution
containing calcium chloride, there is a drastic increase in Stevens value at cooling
which is not observed in carrageenan solution without calcium.
The result in texture shows there is an impact of cooling on the Stevens value. This
can depict the role of the salt to improve the gelling strength in carrageenan solution
by improving the junction zones in the formed network (Lai, Wong and Lii, 2000).
The possible reason why there is no difference observed in viscosity result for
calcium solution might be due to the method differences to characterise the gelling
strength. In viscosity measurement in rheometer, the solution is being sheared
continuously and the viscosity is taken at 100 (1/s) while the texture result is done
when the solution was at rest and then the compression force was applied.
Therefore, it can be concluded that 125 mg of calcium chloride can facilitate the
network formation by 1% of kappa carrageenan in water.
7.6. Hydrocolloid Table In Table A19, general information regarding the concentration, temperature, pH, etc.
are mentioned for each of the hydrocolloids used in this project.
0
2
4
6
8
10
12
14
0 500 1000 1500 2000 2500
Stev
ens
valu
e (g
)
Time (s)
Carrageenan
Carrageenan Calcium
30 oC
50 oC
70 oC 20
oC
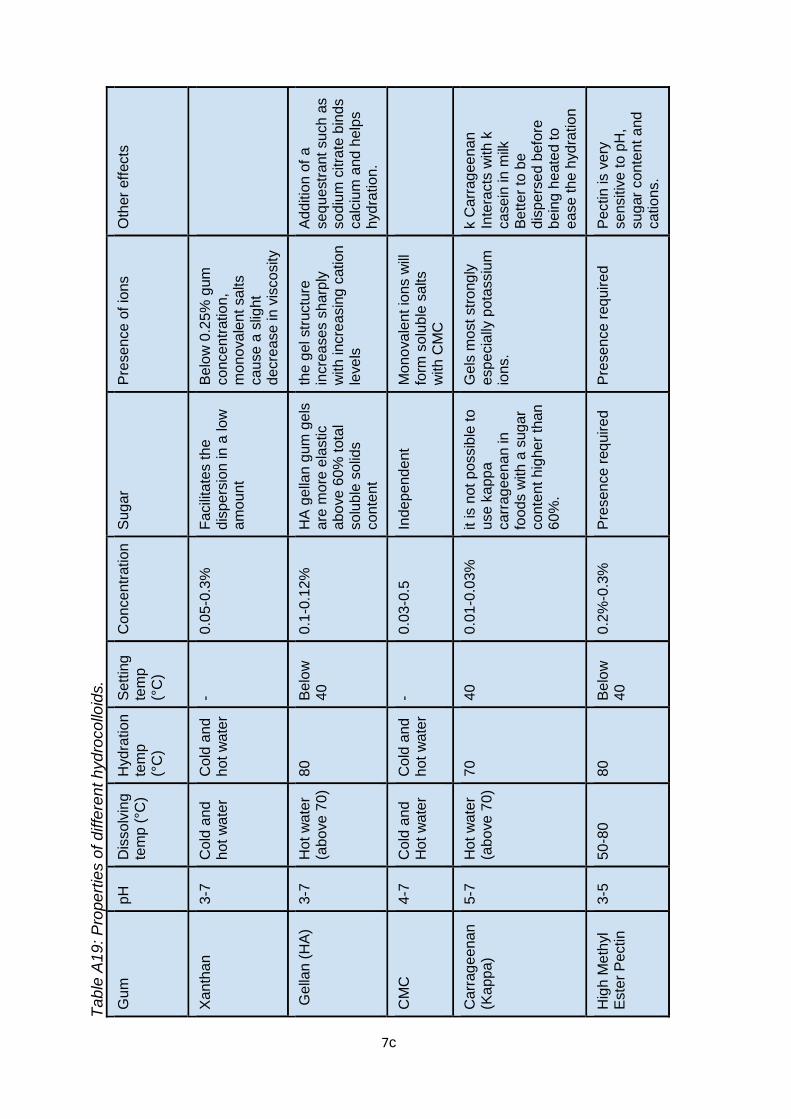
7с
Ta
ble
A1
9: P
rope
rtie
s o
f d
iffe
ren
t h
yd
roco
lloid
s.
Gu
m
pH
D
isso
lvin
g
tem
p (
°C)
Hyd
ratio
n
tem
p
(°C
)
Se
ttin
g
tem
p
(°C
)
Co
nce
ntr
atio
n
Su
ga
r P
resen
ce o
f io
ns
Oth
er
eff
ects
Xa
nth
an
3-7
C
old
an
d
hot
wa
ter
Co
ld a
nd
hot
wa
ter
- 0
.05-0
.3%
F
acili
tate
s t
he
dis
pers
ion in
a lo
w
am
ou
nt
Be
low
0.2
5%
gum
co
nce
ntr
atio
n,
mo
no
va
lent
sa
lts
ca
use
a s
ligh
t d
ecre
ase
in v
isco
sity
Ge
llan (
HA
) 3-7
H
ot
wa
ter
(abo
ve
70
) 80
B
elo
w
40
0
.1-0
.12%
H
A g
ella
n g
um
ge
ls
are
mo
re e
lastic
abo
ve
60%
tota
l so
luble
so
lids
co
nte
nt
the g
el str
uctu
re
incre
ase
s s
harp
ly
with
incre
asin
g c
atio
n
leve
ls
Ad
ditio
n o
f a
se
qu
estr
ant su
ch a
s
so
diu
m c
itra
te b
inds
ca
lciu
m a
nd
he
lps
hyd
ratio
n.
CM
C
4-7
C
old
an
d
Ho
t w
ate
r C
old
an
d
hot
wa
ter
- 0
.03-0
.5
Inde
pe
nd
en
t M
on
ova
lent
ions w
ill
form
so
luble
sa
lts
with
CM
C
Ca
rrag
een
an
(K
app
a)
5-7
H
ot
wa
ter
(abo
ve
70
) 70
40
0
.01-0
.03%
it is n
ot
possib
le to
u
se k
app
a
ca
rrag
een
an in
fo
od
s w
ith
a s
ug
ar
co
nte
nt h
ighe
r th
an
60%
.
Ge
ls m
ost str
ong
ly
espe
cia
lly p
ota
ssiu
m
ions.
k C
arr
ag
ee
na
n
Inte
racts
with
k
ca
sein
in m
ilk
Be
tte
r to
be
dis
pers
ed b
efo
re
bein
g h
eate
d to
e
ase
th
e h
yd
ratio
n
Hig
h M
eth
yl
Este
r P
ectin
3-5
50-8
0
80
B
elo
w
40
0
.2%
-0.3
%
Pre
sen
ce r
eq
uire
d
Pre
sen
ce r
eq
uire
d
Pe
ctin is v
ery
se
nsitiv
e t
o p
H,
su
gar
co
nte
nt a
nd
ca
tion
s.