Embed Size (px)
Citation preview

THE EFFECT OF HIGHER MODES ON EARTHQUAKE FATIGUE DAMAGE
TO STEEL MOMENT FRAMES
by
Navid Nastar
A Dissertation Presented to the FACULTY OF THE GRADUATE SCHOOL
UNIVERSITY OF SOUTHERN CALIFORNIA In Partial Fulfillment of the
Requirements for the Degree DOCTOR OF PHILOSOPHY
(CIVIL ENGINEERING)
May 2008
Copyright 2008 Navid Nastar

ii
DEDICATION
TO MY FATHER AND MOTHER

iii
ACKNOWLEDGEMENTS
The author would like to thank Professor James C. Anderson and Professor Gregg E.
Brandow for their expertise and continuous support at all stages of this research.
Without their guidance, completing this work would not have been possible. Thanks
are also due to Professor Robert L. Nigbor for being a tremendous source of support
and inspiration for the author during his graduate work at USC. The author also
wants to thank Mr. Peter Maranian of Brandow and Johnston, Inc. for his interest in
the project and for providing helpful resources throughout the course of study.
Lastly, the author would like to acknowledge Mr. James Partridge, president of
Smith-Emery Company, for kindly providing the low-cycle fatigue test results and
related reference materials.

iv
TABLE OF CONTENTS
DEDICATION ii ACKNOWLEDGEMENTS iii LIST OF TABLES vi LIST OF FIGURES vii ABSTRACT xii CHAPTER 1: INTRODUCTION 1 CHAPTER 2: BACKGROUND 6 CHAPTER 3: DESCRIPTION OF THE ANALYTICAL CASE STUDIES 12
3.1 Description of the Investigated Buildings 12 3.2 Damage Observed During the Northridge Earthquake 16
3.2.1 Ten-Story Building 16 3.2.2 Two-Story Building
3.3 Analytical Studies 21 CHAPTER 4: TIME-HISTORY ANALYSIS 23
4.1 Ground Motion 23 4.2 Ten-Story Building 30
4.2.1 Linear Modal Time-History Analysis 35 4.2.1.1 Damping 39 4.2.1.2 Mass 39 4.2.1.3 Stress Histories and Contribution of Each Mode to Total Stress 41
4.2.1.3.1 Beam Stress 42 4.2.1.3.2 Column Stress 46
4.2.2 Non-Linear Direct Integration Time-History Analysis 49 4.2.2.1 Effect of Material Properties 49 4.2.2.2 Linear vs. Non-Linear Time-History Results 52
4.3 Two-Story Building 57 4.3.1 Linear Modal Time-History Analysis 59
4.3.1.1 Stress Histories and Contribution of Each Mode to Total Stress 59
4.3.1.1.1 Beam Stress 60 4.3.1.1.2 Column Stress 63

v
CHAPTER 5: FATIGUE ANALYSIS 66
5.1 Fatigue Analysis Procedure 66 5.2 S-N Curve 68
5.2.1 Available Fatigue Test Data 68 5.2.1.1 Tests by Fisher et al. 68 5.2.1.2 Tests by Partridge et al. 71 5.2.1.3 Tests by Kuwamura et al. 73
5.2.2 Stress Concentration Factor 77 5.2.2.1 Available Test Data 78 5.2.2.2 Steel Manuals 78 5.2.2.3 Finite Element Study 81 5.2.2.4 Established Stress Concentration Factor 86
5.2.3 Established S-N Curve for Fatigue Analysis 87 5.3 Cycle Counting Procedure 90
5.3.1 Ten-Story Building 90 5.3.2 Two-Story Building 107
5.4 Cumulative Fatigue Analysis 112 5.4.1 Ten-Story Building 112 5.4.2 Two-Story Building 120
CHAPTER 6: CONCLUSIONS 124 6.1 Conclusions 125 6.2 Future Studies 128
BIBLOGRAPHY 130 APPENDIX A: TEN-STORY BUILDING DRAWINGS 134 APPENDIX B: TWO-STORY BUILDING DRAWINGS 149
vi
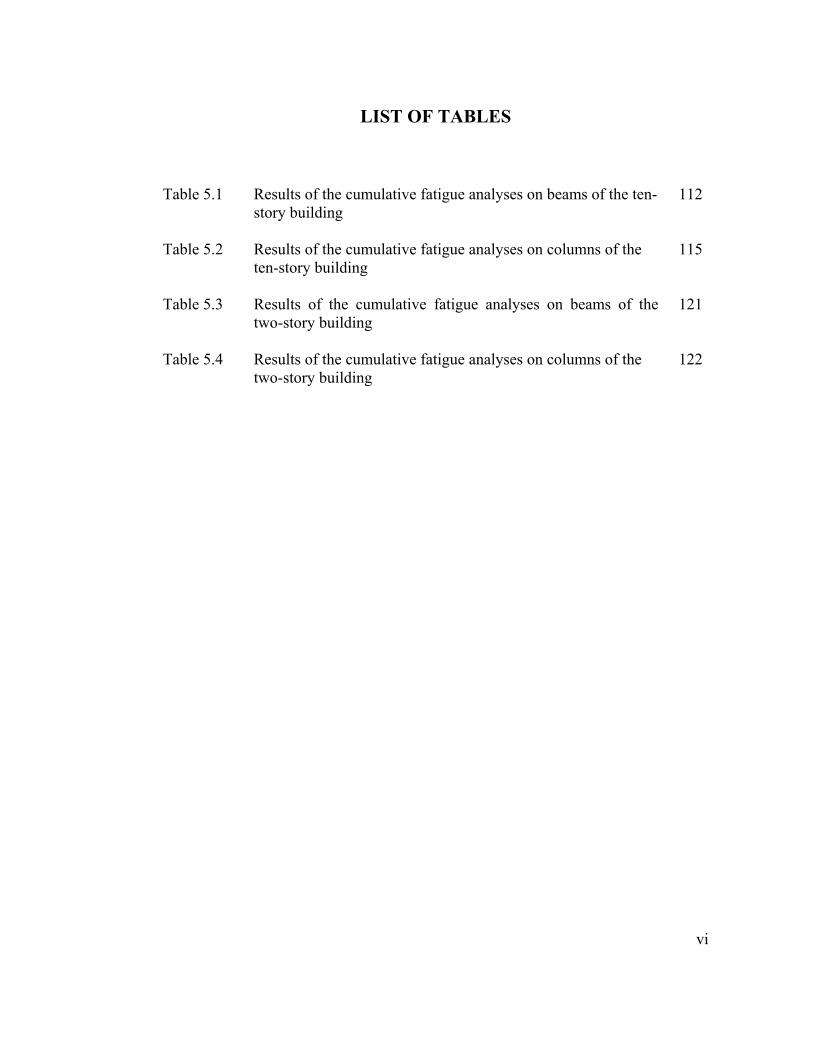
LIST OF TABLES
Table 5.1 Table 5.2 Table 5.3 Table 5.4
Results of the cumulative fatigue analyses on beams of the ten-story building Results of the cumulative fatigue analyses on columns of the ten-story building Results of the cumulative fatigue analyses on beams of the two-story building Results of the cumulative fatigue analyses on columns of the two-story building
112
115
121
122

vii
LIST OF FIGURES
Figure 3.1 Figure 3.2 Figure 3.3 Figure 3.4 Figure 3.5 Figure 3.6 Figure 3.7 Figure 4.1 Figure 4.2 Figure 4.3 Figure 4.4 Figure 4.5 Figure 4.6 Figure 4.7 Figure 4.8 Figure 4.9
Site of the two investigated buildings Ten-story building Two-story building Investigated frames of the ten-story building Investigated frame of the two-story building Typical moment frame connection damage Damage observed in the two-story building after the Northridge Earthquake Location of the investigated buildings Location of the USC 03 station along with all other stations in the region (USGS, CDMG, USC and DWP networks) which recorded the Northridge main event Corrected acceleration, velocity, and displacement records in East direction, Northridge main event recorded at USC 03 station Corrected acceleration, velocity, and displacement records in South direction, Northridge main event recorded at USC 03 station Moment frame on gridline F.5 in East-West direction Moment frame on gridline D in East-West direction 1st mode shape 2nd mode shape 3rd mode shape
13
13
14
15
15
18
19
24
25
26
28
31
32
33
34
34

viii
Figure 4.10 Figure 4.11 Figure 4.12 Figure 4.13 Figure 4.14 Figure 4.15 Figure 4.16 Figure 4.17 Figure 4.18 Figure 4.19 Figure 4.20 Figure 4.21 Figure 4.22 Figure 4.23 Figure 4.24 Figure 4.25 Figure 4.26 Figure 4.27 Figure 4.28
Roof displacement result of linear modal time-history analysis (3% damping for all modes) Contribution of the 1st mode of vibration to the roof displacement (3% damping for all modes) Contribution of the 2nd mode of vibration to the roof displacement (3% damping for all modes) Contribution of the 3rd mode of vibration to the roof displacement (3% damping for all modes) Acceleration (East) recorded at roof by CDMG station Displacement (East) recorded at roof by CDMG station Roof response matching Roof matched response An example of modal stress accumulation Beam stress history (contribution of all modes) Beam stress history (contribution of the 1st mode) Beam stress history (contribution of the 2nd mode) Beam stress history (contribution of the 3rd mode) Column stress history (contribution of all modes) Column stress history (contribution of the 1st mode) Column stress history (contribution of the 2nd mode) Column stress history (contribution of the 3rd mode) The effect of material properties on the result of nonlinear analysis The effect of material properties on the result of nonlinear analysis
35
36
36
37
38
38
40
41
42
43
44
44
45
47
47
48
48
50
51
ix
Figure 4.29 Figure 4.30 Figure 4.31 Figure 4.32 Figure 4.33 Figure 4.34 Figure 4.35 Figure 4.36 Figure 4.37 Figure 4.38 Figure 4.39 Figure 4.40 Figure 4.41 Figure 4.42 Figure 4.43 Figure 4.44 Figure 4.45
The effect of material properties on the column stress history calculated from the non-linear direct integration time-history analysis Comparison between the linear and nonlinear analysis results Column stress (equivalent M/S stress) history calculated from the nonlinear time-history analysis Moving-window Fourier transform of the CDMG roof acceleration record Ratio of maximum beam stress (M/S) from linear analysis to the material yield stress Ratio of maximum beam stress (M/S) from linear analysis to the material yield stress Demand to capacity ratios in the ten-story building result of linear modal time-history analysis using SAP 2000 Moment Frame on gridline 14 in North-South direction 1st mode shape 2nd mode shape 2nd Floor beam stress history (contribution of all modes) 2nd floor beam stress history (contribution of the 1st and 2nd modes) Roof beam stress history (contribution of all modes) Roof beam stress history (contribution of the 1st and 2nd modes) 2nd floor column stress history (contribution of all modes) 2nd floor column stress history (contribution of the 1st and 2nd modes) Roof column stress history (contribution of all modes)
51
52
53
54
55
55
56
57
58
59
60
61
62
62
63
64
65

x
Figure 4.46 Figure 5.1 Figure 5.2 Figure 5.3 Figure 5.4 Figure 5.5 Figure 5.6 Figure 5.7 Figure 5.8 Figure 5.9 Figure 5.10 Figure 5.11 Figure 5.12 Figure 5.13 Figure 5.14 Figure 5.15 Figure 5.16 Figure 5.17 Figure 5.18
Roof column stress history (contribution of the 1st and 2nd modes) S-N curves for different beam details S-N curves for welded and coverplated beams Fatigue crack at the end of cover plate fillet weld toe Low-cycle fatigue test setup Low-cycle fatigue test results Low-cycle fatigue test setup and specimen detail Comparison between the available low-cycle fatigue tests Fatigue test results Stress concentration factors observed in Fisher’s tests Finite element model of the Pre-Northridge connection without continuity plates Result of the finite element study of the model without continuity plates Finite element model of the Pre-Northridge connection with continuity plates Result of the finite element study of the model with continuity plates Established S-N curve for fatigue analysis Rainflow histograms for beams of the ten-story building Rainflow histograms for columns of the ten-story building Rainflow histograms for beams of the two-story building Rainflow histograms for columns of the two-story building
65
69
70
70
72
73
75
76
77
79
82
83
84
85
88
91
99
108
110

xi
Figure 5.19 Figure 5.20 Figure 5.21 Figure 5.22 Figure 5.23 Figure 5.24 Figure 5.25 Figure 5.26 Figure 5.27 Figure 5.28 Figure 6.1 Figure A.1 Figure A.2 Figure B.1 Figure B.2
Cumulative fatigue at beams of the ten-story building (1st mode vs. all modes) Cumulative fatigue at columns of the ten-story building (1st mode vs. all modes) Rainflow histogram blow-up for the 6th floor beam Rainflow histogram blow-up for the 7th floor column Cumulative fatigue at the column above, the column below and the beam at each floor (all modes) Sum of cumulative fatigue values at the column above, the column below and the beam at each floor (all modes) Sum of cumulative fatigue values at the column above, the column below and the beam at each floor (1st mode vs. all modes) Cumulative fatigue at beams of the two-story building (1st mode vs. all modes) Cumulative fatigue at columns of the two-story building (1st mode vs. all modes) Sum of cumulative fatigue values at the column above, the column below and the beam at each floor (1st mode vs. all modes) Comparison between cumulative fatigue distribution and observed damage in the ten-story building Ten-story building framing plans Ten-story building frame elevations Two-story building framing plans Two-story building frame elevations
114
115
116
117
118
119
119
121
122
123
125
134
141
149
151

xii
ABSTRACT
Following the Northridge Earthquake (1994), the SAC steel project was initiated to
investigate the causes of widespread damage observed in the connections of steel
moment frame buildings. The published results of these studies concentrated on local
connection defects that potentially initiated the observed cracks. However, damage
to some buildings could not be reconciled by use of this failure mechanism. This led
to renewed interest in the effects of low-cycle fatigue combined with the higher
modes of vibration increasing the cumulative fatigue at critical connections and
consequently creating the observed connection failures.
The current study is focused on the effect of low-cycle fatigue in the connection
damage observed in steel moment frames and the contribution of the higher modes of
vibration to these failures. A comprehensive fatigue analysis procedure is developed
based on the Palmgren-Miner method. Low-cycle fatigue behavior of Pre-Northridge
connections are studied, and S-N curves established for the high-cycle fatigue range
are extended to the low-cycle region using the limited test results that are available.
A series of linear and non-linear time-history analyses are performed on two
buildings damaged by the Northridge Earthquake. These buildings have two and ten
stories, respectively, and used steel moment frames as the lateral load resisting
system in both directions. Fatigue analyses are performed at critical locations of the

xiii
moment frames using the established procedure, and the contribution of higher
modes in cumulative fatigue is evaluated. Finally, the pattern of cumulative fatigue
at critical connections and the observed damage are compared.
Results of this analytical study indicate that the effect of low-cycle fatigue and
higher modes of vibration can be significant in the connection damage resulting from
the Northridge Earthquake. Although the first mode created a high percentage of
cumulative fatigue in the connections of the two-story building, the cumulative
fatigue and damage pattern in the ten-story building shows that the contribution of
higher modes in the beam and column stress histories significantly increased the
cumulative fatigue relative to the first mode. This results in various types of
connection damage similar to that observed in the steel moment frames during the
Northridge Earthquake.

1
CHAPTER 1: INTRODUCTION
One of the major aftermaths of the Northridge Earthquake of January 17, 1994, was
the widespread connection damage that posed a major question regarding the
behavior of field-welded, field-bolted moment frame connections, also known as
Pre-Northridge connections.
Before the Northridge Earthquake, Steel Moment Resisting Frames (SMRFs) were
believed to have ductile behavior that would achieve high-cycle fatigue. As a result,
fatigue was not considered to be a failure mode for these connections during a
seismic event.
After the Northridge Earthquake and the widespread connection failure in steel
moment frame buildings, it was concluded that many connections failed at what
appears to be relatively few cycles. Observations after the Northridge Earthquake
indicated that these connections failed at both a relatively low stress level and at only
a few cycles of vibration.
Appearance of the cracks which in most cases started from the weld at the bottom
flange of the beam and on some occasions propagated into the column flange or even
column web (as in the case of the two-story building discussed later in this document
in which cracks expanded all the way through the column web), undermined the
2
confidence in the ductile behavior of the steel moment frames [37]. According to a
report by Youssef et al. in 1995, brittle fracture in and around the groove weld
connecting the beam flanges to the column flange was observed in more than 150
steel moment frame buildings after the Northridge Earthquake [37].
As a result of these failures, many researchers tried to gain a better understanding of
the causes of damage observed in the connections of the steel moment frames. Due
to the complexity of the problem, the SAC steel project was initiated by FEMA as a
joint venture between Structural Engineers Association of California (SEAOC),
Applied Technology Council (ATC), and Consortium of Universities for Research in
Earthquake Engineering (CUREE). Since the response of the structures is often
dominated by the first mode, the SAC project was never focused on the potential
effects of higher modes. Consequently, all the performed SAC tests represented the
first mode type of motions.
The majority of published results of this nationwide project ([10], [11], [12], [13],
[14], [15], [16], [17], [18], [19], and [20]) concentrated on local connection defects
that potentially initiated the observed cracks. For instance, the existence of the weld
access hole (web cope hole) and discontinuity of the bottom flange weld were shown
to be the cause of porosity and slag inclusions in the weld at the center of the beam
and potentially one of the main reasons for crack initiation. Also, leaving the backup
bar after the beam flange to column flange full penetration welds were completed

3
(which was the common practice in Pre-Northridge connections) showed to be a
source of porosity and slag inclusions and eventually contributed to the initiation of
cracks at the weld area [4].
Although remarkable research under the SAC project was performed to address the
above issues, damage to some buildings could not be reconciled by use of these
failure mechanisms. This led to renewed interest in studying the effects of low-cycle
fatigue combined with the higher modes of vibration that can increase the cumulative
fatigue at critical connections, and as a result, potentially create the observed
connection failures.
Through an investigation of the role of the higher modes in the fatigue damage, the
current study focuses on the contribution of higher modes of vibration to the damage
observed in steel moment connections during the Northridge Earthquake. In other
words, the contribution of higher mode motions to the stress histories at the
connection beams and columns is investigated, as are cyclic fatigue type damages. In
essence, this study shows that a large number of cycles at higher frequency and at
significant but lower stress levels than the primary mode could be a major cause of
increasing the cumulative fatigue at the connections of steel moment frames,
potentially creating connection failures similar to those observed in the moment
connections during the Northridge Earthquake.

4
As a part of this study, two buildings damaged by the Northridge Earthquake have
been investigated. These buildings were two and ten stories, respectively, and used
steel moment frames as the lateral load resisting system in both directions.
Chapter two of this document describes the definition of fatigue failure and
summarizes the research done in the area of fatigue behavior of steel moment
connections and the concept of low-cycle fatigue.
In chapter three of the current document, the analytical case studies are explained
and the investigated buildings are described. Also, the observed damage in these
buildings is studied.
Chapter four contains a series of linear and non-linear time-history analyses and
includes a very thorough analytical study on the stress histories at the critical
locations of the buildings. Furthermore, the contribution of each mode of vibration to
total stress is investigated.
Chapter five establishes a comprehensive fatigue analysis procedure, which was
developed using the Palmgren-Miner method. In addition, low-cycle fatigue
behavior of Pre-Northridge connections are studied in this chapter, and S-N curves
established for the high-cycle fatigue range are extended to the low-cycle region
using the limited test results that are available. Fatigue analyses are performed at

5
critical locations of the moment frames using the established procedure, and the
contribution of higher modes in cumulative fatigue is evaluated.
Finally, chapter six summarizes the results of the study and compares the pattern of
cumulative fatigue at critical connections to the observed damage. Also, conclusions
of this study are included in this section.

6
CHAPTER 2: BACKGROUND
Although structural steel is an excellent building material that has positive
characteristics which make it behave well in many conditions, there are still concerns
with its fatigue behavior and possible cyclic fatigue failures of steel components in
the scientific community.
The topic of cyclic fatigue has been thoroughly addressed by researchers in the areas
of fracture mechanics and material science, resulting in some good publications in
these areas. In one of the best books in the field [9], Norman E. Dowling explains the
concept and applications of low and high cycle fatigue failures. Most of the
examples in this book deal with material steel, which is specifically the focus of the
current study. Likewise, Rolfe and Barsom cover the concept of fatigue in a thorough
manner in their book [7], which is a classic book on the topic.
Historically, the birth of fracture mechanics goes back to 1920s and studies by
Griffith. He studied the fracture behavior of silica glass and focused on the effect of
defects in lowering the fracture strength of silica glass. He expressed his theories
based on the conservation of energy in a closed system (first law of thermodynamics)
[27]. The next steps were taken by Irwin (1948) [24] and Orowan (1945) [28] who
worked on the fracture of steel and considered the plastic work done during the
fracture.
7
In general, fatigue is a type of fracture failure which occurs when a material is
subjected to cyclic or repeated loading [27], [9]. In other words, structural members
subjected to cyclic loading may fail at stress levels lower than expected as a result of
the fatigue phenomenon. Fatigue failure can be represented in three simplified steps
[27]:
1. Crack initiation: the material transition from the virgin condition to the
formation of macro crack.
2. Crack propagation: stable growth of the crack after the crack initiation phase.
3. Final fracture: unstable, rapid growth of the crack.
If there are pre-existing defects in the material, the crack initiation step could be
eliminated, causing the total fatigue life to decrease. The three steps explained above
could be represented in the form of [27]:
pif NNN +=
In the above equation, fN represents the number of cycles to failure, iN is the
number of cycles for crack initiation, and pN shows the number of cycles for crack
propagation. When the number of cycles to failure is expected to be relatively large
(typically larger than 310 cycles), the concept of high-cycle fatigue is often used to

8
represent the situation. On the other hand, when the number of cycles is not large
(typically less than 310 cycles) the condition will be referred to as low-cycle fatigue
[27].
During earthquakes, steel moment connections could be subject to low-cycle fatigue.
Higher mode effects which create a significant number of stress cycles at the
connection (in some cases with relatively high stress levels) need to be investigated.
Although demand in the beams and columns of connections could be less than the
member strength, cumulative fatigue at the connections could potentially damage
them during a seismic event.
Although the low-cyclic fatigue failure has been well researched and documented in
the last decades, this issue has not been translated properly into the structural
engineering practice and commonly used design manuals [27].
SEAOC Seismology Committee, FEMA 350 task group, strongly recommends that
further research to be done on the issue of low-cycle fatigue [38].
The FEMA 350 commentary cites low-cycle fatigue as the main cause of failure in
some laboratory connection tests but does not give any information or any possible
recommendations on the issue.

9
Some of the SAC task groups addressed the low-cycle fatigue issue in their
individual reports. For instance, the work done by Ricles et al. in 2000 [37] has a
chapter on low-cycle fatigue with a proposed method for predicting crack initiation
and extension over the life cycle of a connection utilizing finite element analysis
[37], [38].
Barsom (2000) [6], concludes that fatigue is the failure mechanism of the
connection. This report was never distributed to the practicing engineers, as only
selected SAC committee members received it.
The report by Krawinkler et al. (1983) [26] cites low-cycle fatigue as the failure
mechanism of the Pre-Northridge connections. The concept of “cumulative damage”
is discussed in this document. The author indicates that each connection remembers
the past events, and these past seismic events consume part of the predictable and
quantifiable life of a connection.
In a follow-up to his 1983 report, Krawinkler introduces the cumulative damage
testing criteria method for establishing cyclic life of a connection in the ATC-24
report [5].
Furthermore, in his confidential report to SAC “Development of Loading Histories
for Testing of Steel Beam-to-Column Assemblies” in August 2000, Krawinkler again

10
suggests the cumulative damage testing per ATC-24 to determine the performance of
the connection.
Bertero and Popov (1965) [8], discusses the low-cycle fatigue as a potential cause of
failure in the steel members through a series of tests on beam specimens with large
deformations. Their tests shows that fatigue, which in the case they studied was
mainly caused by local buckling of flanges, was the failure mode of the specimens.
They emphasize that fatigue life of a structural component can not be solely
estimated by the fatigue characteristics of the material. Other factors need to be
considered for determination of the low-cycle fatigue endurance of a structural
member like type and size of a member, states of stress and strain across and along
the critical region of a member, and most importantly the magnitude and history of
alternating stress and strain.
Popov and Pinkey’s (1969) paper [33], indicates that buckling and the cumulative
fatigue associated with it are the main modes of failure for the rolled beams.
In their interesting paper submitted to the 10th World Conference in Earthquake
Engineering, Kuwamura and Suzuki (1992) [25] conclude that the Pre-Northridge
connection has a finite cyclic life and that low cycle fatigue is the failure mode for
this connection.

11
Partridge et al. (2000) [31] show that fatigue is the principal failure mechanism of
the Pre-Northridge connection. In this paper, constant cyclic tests were performed on
10 beam-column connections. This paper along with other publications by Partridge,
Allen, Richard, and Radau ([30], [32], [34], [35], and [36]) strongly demonstrate that
the Pre-Northridge connection failure during the Northridge Earthquake was the
result of low-cycle fatigue.
As described in this chapter, the low-cycle fatigue issue has been widely addressed in
the literature before and after the Northridge Earthquake; however, the methodology
of implementing the fatigue considerations in the state-of-the-art design practices has
not been properly developed.

12
CHAPTER 3: DESCRIPTION OF THE ANALYTICAL CASE
STUDIES
3.1 Description of the Investigated Buildings
Two buildings which experienced significant damage in their steel moment frames
during the Northridge Earthquake were chosen for this study. Both buildings used
steel moment frames with Pre-Northridge connections in both major directions
(North-South and East-West) as the main lateral resisting system. These buildings
were ten and two stories, respectively, and located in Chatsworth, CA, 91311. Figure
3.1 shows the site of the buildings. Also, figures 3.2 and 3.3 illustrate photos of the
ten and two-story buildings, respectively.
The original design of both buildings was performed by Brandow and Johnston, Inc.
After the Northridge Earthquake, Brandow and Johnston, Inc. performed the
structural inspection for possible damages and the subsequent repair project. As a
result, the original design documents including structural calculations and drawings,
mill test results, shop drawings, inspection results, and damage data were available
for use in this study, in addition to the proposed repair methods and procedures.
Appendices A and B contain a complete set of drawings for the ten-story and two-
story buildings, respectively.

13
Figure 3.1: Site of the two investigated buildings. [http://www.ngdc.noaa.gov/seg/hazard/slideset/18/18_380_slide.shtml]
Figure 3.2: Ten-story building (photo courtesy of James C. Anderson).

14
Figure 3.3: Two-story building (photo courtesy of James C. Anderson).
Fortunately, the ten-story building was instrumented by California Department of
Mines and Geology (CDMG) at the roof level. As described in chapter four of this
document, this record has been used to calibrate and validate the analytical model
used for the current study. The roof record taken during the Northridge Earthquake
was provided for this research by Dr. Tony Shakal of California Geological Survey.
Figures 3.4 and 3.5 show the investigated frames in the ten-story and two-story
buildings, respectively. The selection of these frames was based on a careful study of
the damage observed in these buildings after the Northridge Earthquake. Red lines
show the beam and columns of the connections under investigation.

15
Figure 3.4: Investigated frames of the ten-story building. [Brandow and Johnston, Inc. drawings]
Figure 3.5: Investigated frame of the two-story building. [Brandow and Johnston, Inc. drawings]
16
3.2 Damage Observed During the Northridge Earthquake
3.2.1 Ten-Story Building
Observations after the Northridge Earthquake showed that no major damage
occurred in the moment frame on gridline F.5. Also, they demonstrated that gridline
10 of moment frame D could be a good representation of the typical damages that
occurred in this building. As shown in Figure 3.4, connections from 2nd floor through
the 9th floor on gridline 10 were studied carefully for the level of stress they
experienced. Furthermore, the contribution of each mode to the total stress was
carefully investigated. Finally, fatigue analysis was performed to calculate the
cumulative fatigue and the effect of higher modes on it. Figure 3.4 also depicts in red
the beams and columns on which this analytical study has been performed.
Figure 3.6 shows the typical damage observed in Pre-Northridge steel moment frame
connections after the Northridge Earthquake. Post-Northridge inspection results
show that most of the damage in Frame D gridline 10 happened at 5th, 6th, and 7th
floors. The 6th floor experienced the most severe damage represented by types 2 and
3 in the bottom of the connection. This means the connection had cracks that went
through the weld and column flange (Types 2b and 3b). The 5th floor experienced
only type 2 damage in the bottom of the connection, and cracks were just observed in
17
the bottom flange weld (Type 2b). The damage at the 7th floor was minor, and only
small cracks in the weld root zone of the bottom flange were observed (Type 1b).
3.2.2 Two-Story Building
Inspection after the Northridge Earthquake indicated that severe damage occurred at
gridline L at the 2nd floor. This connection and the investigated beams and columns
have been shown in Figure 3.5. Damage observed at the connections of this frame
was similar in nature to the damage previously observed in the ten-story building.
However, the damage at the 2nd floor connection on gridline L was significantly
more severe. The damage was reported to be of type 3 and type 6 at the bottom, in
the form of cracks through the column flange and their propagation into the column
web. For this specific connection, the crack went horizontally all the way through the
web of the column.
Photos shown in Figure 3.7 clearly illustrate the initiation of the crack from the weld
area and its propagation into the column flange and eventually the column web.

18
Figure 3.6: Typical moment frame connection damage. [Brandow and Johnston, Inc. drawings]

19
Figure 3.7: Damage observed in the two-story building after the Northridge Earthquake (Photos courtesy of Peter J. Maranian).

20
Figure 3.7, continued: Damage observed in the two-story building after the Northridge Earthquake (Photos courtesy of Peter J. Maranian).
21
3.3 Analytical Studies
The purpose of these analytical studies was to break down the response of the
structure into responses caused by each mode of vibration. In other words, the
contribution of each mode in the overall response was investigated. As described
earlier in this chapter, the critical moment frames of each building were carefully
selected, and the type of damage was identified at all critical connections. Next, a
series of linear and non-linear time history analyses was performed on the selected
frames. The goal was to look at the stress levels under the response of each mode and
try to get a better understanding of what the frame (specifically the connections)
went through during the Northridge Earthquake. Basically, finding the number of
cycles created by each mode of vibration separately and the stress level associated
with each of them was the starting point for this study.
The ultimate intention of this research was to establish a comprehensive fatigue
analysis procedure for the steel moment frames with Pre-Northridge connections.
This procedure would then be used to investigate the cumulative fatigue created at
each connection component and to study the effect of higher modes of vibration on
calculated values. Finally, finding a pattern between the observed damage and
cumulative fatigue that could reasonably justify the damage observed in the
investigated frames, as well as studying the higher mode effects on the cumulative
fatigue values, was of essence to this study.
22
The next chapter includes the time-history analyses performed on these buildings.
Chapter five goes through the fatigue analyses procedures. Finally chapter six
summarizes the results of the performed studies.

23
CHAPTER 4: TIME-HISTORY ANALYSIS
This chapter contains the result of a series of linear and non-linear time-history
analyses on the investigated ten-story and two-story buildings. Modeling and
analysis details are explained, and stress histories at the beam and columns of the
critical connections are studied. Finally, the contribution of each mode of vibration
in the total stress is investigated.
4.1. Ground Motion
Since the earthquake record could potentially play a major role in the final results of
a time-history analysis, a thorough study was performed to select the best available
earthquake record for the purposes of the current research. Figure 4.1 shows the
location of the investigated buildings on the map of the Los Angeles area. According
to Maporama (www.maporama.com), the latitude and longitude of the site are
34.238 and -118.567 degrees, respectively.
After investigating the available earthquake records in the area using United States
Geological Survey (USGS), California Department of Mines and Geology (CDMG),
University of Southern California (USC), and Department of Water and Power
(DWP) networks, it was concluded that the closest record to the site was recorded at

24
the USC 03 station. This earthquake record was selected to be used for time-history
analyses explained later in this chapter.
Figure 4.1: Location of the investigated buildings. [www.mapquest.com]
Figure 4.2 depicts the location of the USC 03 station along with all other stations
belonging to USGS, CDMG, USC, and DWP, which recorded the Northridge main
event. USC 03 is located at 17645 Saticoy Street, Northridge, California, with a
latitude and longitude of 34.209 and -118.517 degrees, respectively.
Figure 4.3 shows the corrected acceleration, velocity, and displacement data for the
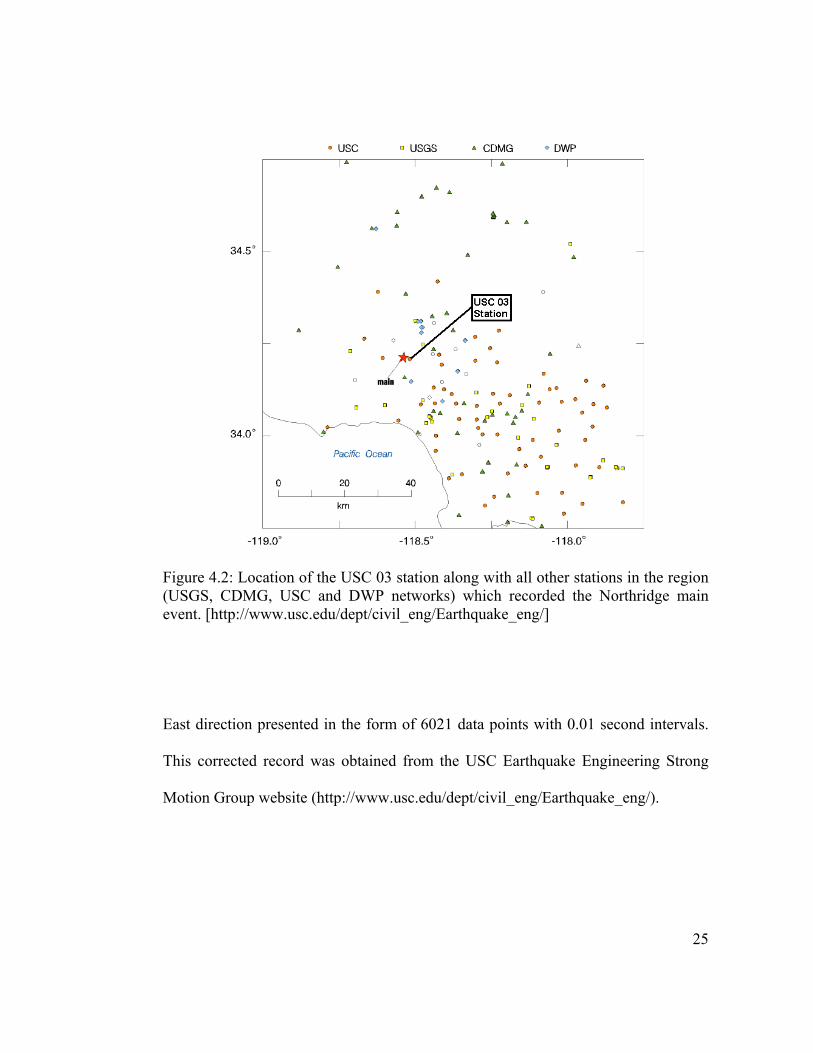
25
Figure 4.2: Location of the USC 03 station along with all other stations in the region (USGS, CDMG, USC and DWP networks) which recorded the Northridge main event. [http://www.usc.edu/dept/civil_eng/Earthquake_eng/]
East direction presented in the form of 6021 data points with 0.01 second intervals.
This corrected record was obtained from the USC Earthquake Engineering Strong
Motion Group website (http://www.usc.edu/dept/civil_eng/Earthquake_eng/).

26
Base Acceleration (East)
-400
-300
-200
-100
0
100
200
300
0 10 20 30 40 50 60
Time (sec)
Acc
. (cm
/sec
2)
Base Acceleration (East)
-4
-3
-2
-1
0
1
2
3
0 10 20 30 40 50 60
Time (sec)
Acc
. (0.
1g)
Figure 4.3: Corrected acceleration, velocity, and displacement records in East direction, Northridge main event recorded at USC 03 station.

27
Base Velocity (East)
-40
-30
-20
-10
0
10
20
30
0 10 20 30 40 50 60
Time (sec)
Velo
city
(cm
/sec
)
Base Displacement (East)
-10
-8
-6
-4
-2
0
2
4
6
8
0 10 20 30 40 50 60
Time (sec)
Dis
plac
emen
t (cm
)
Figure 4.3, continued: Corrected acceleration, velocity, and displacement records in East direction, Northridge main event recorded at USC 03 station.
28
Base Acceleration (South)
-500
-400
-300
-200
-100
0
100
200
300
400
500
0 10 20 30 40 50 60
Time (sec)
Acc
. (cm
/sec
2)
Base Acceleration (South)
-5
-4
-3
-2
-1
0
1
2
3
4
5
0 10 20 30 40 50 60
Time (sec)
Acc
. (0.
1g)
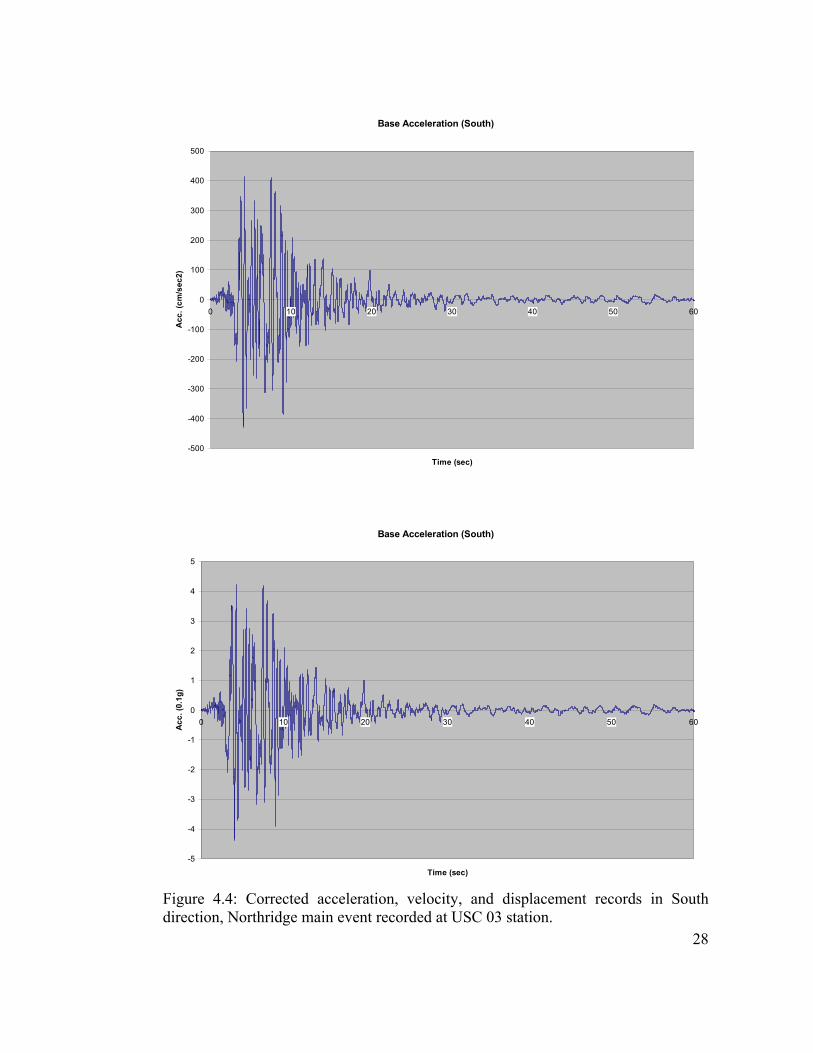
Figure 4.4: Corrected acceleration, velocity, and displacement records in South direction, Northridge main event recorded at USC 03 station.

29
Base Velocity (South)
-80
-60
-40
-20
0
20
40
60
80
0 10 20 30 40 50 60
Time (sec)
Velo
city
(cm
/sec
)
Base Displacement (South)
-20
-15
-10
-5
0
5
10
15
20
0 10 20 30 40 50 60
Time (sec)
Dis
plac
emen
t (cm
)
Figure 4.4, continued: Corrected acceleration, velocity, and displacement records in South direction, Northridge main event recorded at USC 03 station.

30
4.2 Ten-Story Building
In order to study the behavior of the ten-story building during the Northridge
Earthquake a series of modal, linear modal time-history, and nonlinear direct
integration time-history analyses was performed using SAP 2000. The 10-story
building is almost symmetrical in both North-South and East-West directions.
Lateral load-resisting system in each direction consists of four steel moment frames.
The two selected moment frames for this study, are part of the lateral system in East-
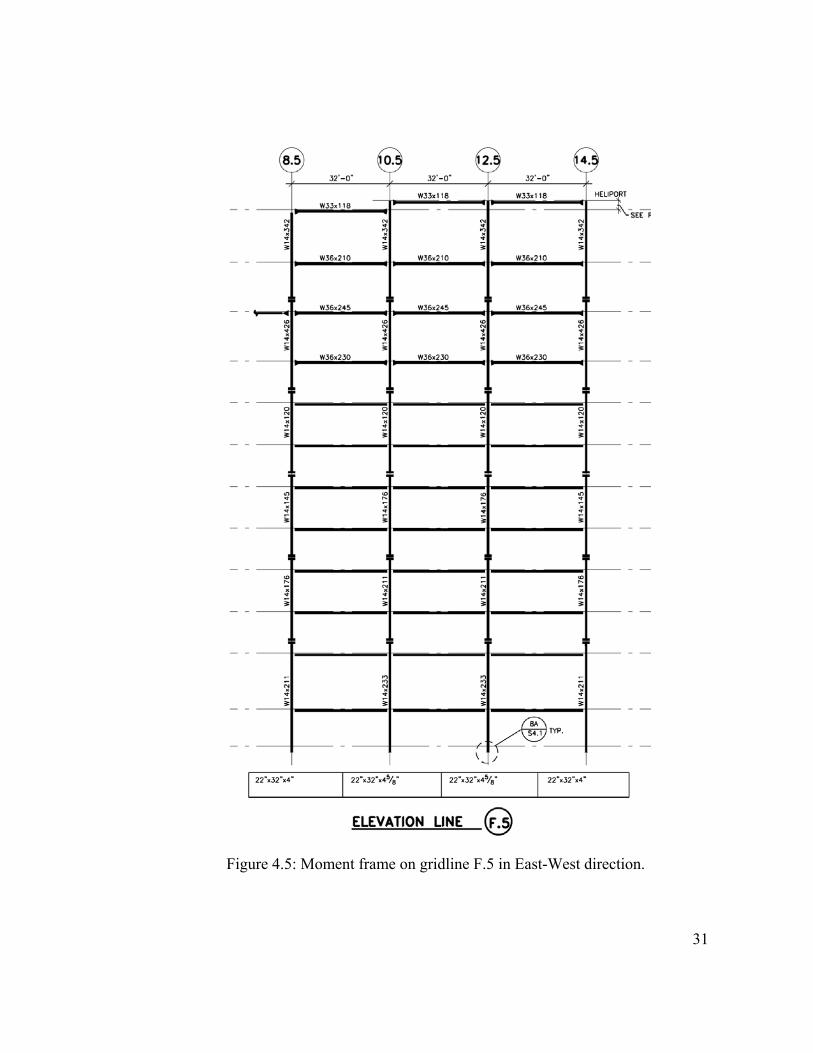
West direction which is the longitudinal direction of the building. Figures 4.5 and 4.6
show the elevation views of these two frames on gridlines F.5 and D. See Appendix
A, which contains the drawings of the ten-story building, for the location of the
frames. Since the building is symmetrical, these two frames together are assumed to
be supporting half of the total seismic forces in East-West direction. As a result, half
of the building seismic mass was assigned to the model at each level. Also, in order
to make the two frames work together, weightless link elements with high axial
stiffness were used to connect the frames together and to represent axial stiffness of
floor slabs. These members had pinned connections at the ends.
As discussed in chapter three, gridline 10 of moment frame D is a good
representative for the typical connection damages that occurred in this building. As a
result, this study was focused on the beams and columns on gridline 10 as shown in
red in figure 4.6.
31
Figure 4.5: Moment frame on gridline F.5 in East-West direction.

32
Figure 4.6: Moment frame on gridline D in East-West direction.

33
Modal analysis was performed and the periods of the first three modes were
calculated to be:
1T =2.70 sec
2T =1.07 sec
3T =0.63 sec
Figures 4.7, 4.8, and 4.9 show the first three mode shapes of the model.
Figure 4.7: 1st mode shape.

34
Figure 4.8: 2nd mode shape.
Figure 4.9: 3rd mode shape.

35
4.2.1 Linear Modal Time-History Analysis
A linear modal time-history analysis was performed on the model. The USC 03
record was used as the ground motion as explained earlier in this chapter. Figure
4.10 shows the displacement response history of frame F.5 at the roof level
calculated as a result of this analysis. Also, Figures 4.11, 4.12 and 4.13 show the
contribution of each of the first three modes of vibration to the total displacement.
Initial damping assumed to be 3% to calculate these displacement histories.
Roof (node 118) Displ. from SAP model (All Modes)
-20
-15
-10
-5
0
5
10
15
20
0 10 20 30 40 50 60
Time (sec)
Dis
pl. (
inch
es)
Figure 4.10: Roof displacement result of linear modal time-history analysis (3% damping for all modes).

36
Roof (node 118) Displ. from SAP model (Mode 1)
-20
-15
-10
-5
0
5
10
15
20
0 10 20 30 40 50 60
Time (sec)
Dis
pl. (
inch
es)
Figure 4.11: Contribution of the 1st mode of vibration to the roof displacement (3% damping for all modes).
Roof (node 118) Displ. from SAP model (Mode 2)
-4
-3
-2
-1
0
1
2
3
4
0 10 20 30 40 50 60
Time (sec)
Dis
pl. (
inch
es)
Figure 4.12: Contribution of the 2nd mode of vibration to the roof displacement (3% damping for all modes).

37
Roof (node 118) Displ. from SAP model (Mode 3)
-1
-0.8-0.6-0.4-0.2
00.2
0.40.60.8
1
0 10 20 30 40 50 60
Time (sec)
Dis
pl. (
inch
es)
Figure 4.13: Contribution of the 3rd mode of vibration to the roof displacement (3% damping for all modes).
The main goal of this linear modal time-history analysis was to plot the stress
histories at the critical locations of the frames and break them down to the
contribution of each mode separately. In order to do that, it was necessary to have a
reasonable degree of confidence in the model and calibrate it by adjusting the values
of damping and mass assigned to it according to the behavior of the actual building.
Fortunately, there was a CDMG instrument at the roof level which recorded the
Northridge Earthquake main event. This record which is shown in Figures 4.14 and
4.15 was used to adjust the damping and mass used for the analysis.

38
Roof Accel. (CDMG Record)
-0.5-0.4-0.3-0.2
-0.10
0.10.20.30.4
0 10 20 30 40 50 60
Time (sec)
Acc
el. (
g)
Figure 4.14: Acceleration (East) recorded at roof by CDMG station.
Roof Displ. (CDMG Record)
-15
-10
-5
0
5
10
15
0 10 20 30 40 50 60
Time (sec)
Dis
pl. (
in)
Figure 4.15: Displacement (East) recorded at roof by CDMG station.

39
4.2.1.1 Damping
Analysis was repeated for different damping values ranging from 1% to 5%.
Comparing the results with the CDMG roof record showed that damping value of 1%
seems to be the closest to reality. As a result, damping value of 1% for all modes was
used in the next stages of this study. Figures 4.16 and 4.17 show the result of
different analysis runs with 1% damping for all modes.
4.2.1.2 Mass
In order to be able to match the response of the model with the CDMG roof record, a
series of linear modal time-history analyses was performed with damping set to 1%.
Mass associated with each level was proportionally changed in order to make
changes to the modal periods of the frame and consequently result in a better match
between the calculated response at the roof and the recorded response by the CDMG
instrument. Finally, it was concluded that the original masses (masses based on the
original design documents of the buildings), which result in the first mode period of
2.7 seconds, seem to create the best match. Figures 4.16 and 4.17 show the result of
this study and depict the response of the models with different assigned masses and
consequently different first mode periods. As a result, in the next stages of this study,

40
the model with first mode period of 2.7 seconds (original building masses) was used
for stress investigations.
It will be shown later on in this chapter that a moving-window Fourier transform of
the CDMG roof record (figure 4.32) indicates that the first mode period of the
building is 2.5 seconds. This result shows good compatibility with the first mode
period of the analytical model.
Roof Response Matching
-30
-20
-10
0
10
20
30
0 10 20 30 40 50 60
Time (Sec)
Dis
plac
emen
t (in
)
T=2.7 Sec (D=1%) CDMG record T=2 Sec (D=1%) T=2.1 Sec (D=1%)
Figure 4.16: Roof response matching.

41
Roof Response (Original Masses)
-30
-20
-10
0
10
20
30
0 10 20 30 40 50 60
Time (Sec)
Dis
plac
emen
t (in
)
T=2.7 Sec (D=1%) CDMG record
Figure 4.17: Roof matched response.
4.2.1.3 Stress Histories and Contribution of Each Mode to Total Stress
The stresses at beams and columns were calculated using the calibrated model
described in the previous sections of this chapter. The purpose was to indicate the
total stress level and show the contribution of each mode of vibration in the stress
value at each time step and finally, plotting the stress history for each mode
separately. In reality each member is experiencing stress cycles created by the first
mode as well as many more cycles created by higher modes of vibration. The
purpose of this study was to investigate the higher mode stress cycles and their
distribution along the height of the building and finally, to look for a pattern between
these higher mode effects and the damage occurred at the frame connections.

42
Chapter five shows how these stress histories will be used to perform a series of
cumulative fatigue analyses. Figure 4.18 shows a clear example of the modal stress
accumulation happening at the 7th floor column located on gridline 10.
Modal Stress Accumulation
-80
-60
-40
-20
0
20
40
60
80
5 10 15 20 25 30
Time (sec)
Stre
ss (k
si)
7th Floor Column Mode 1+3 7th Floor Column Mode 1
Figure 4.18: An example of modal stress accumulation.
4.2.1.3.1 Beam Stress
Figure 4.19 shows the stress histories that the beams experienced as a result of the
time-history analysis of the frame. The stress values plotted are calculated by
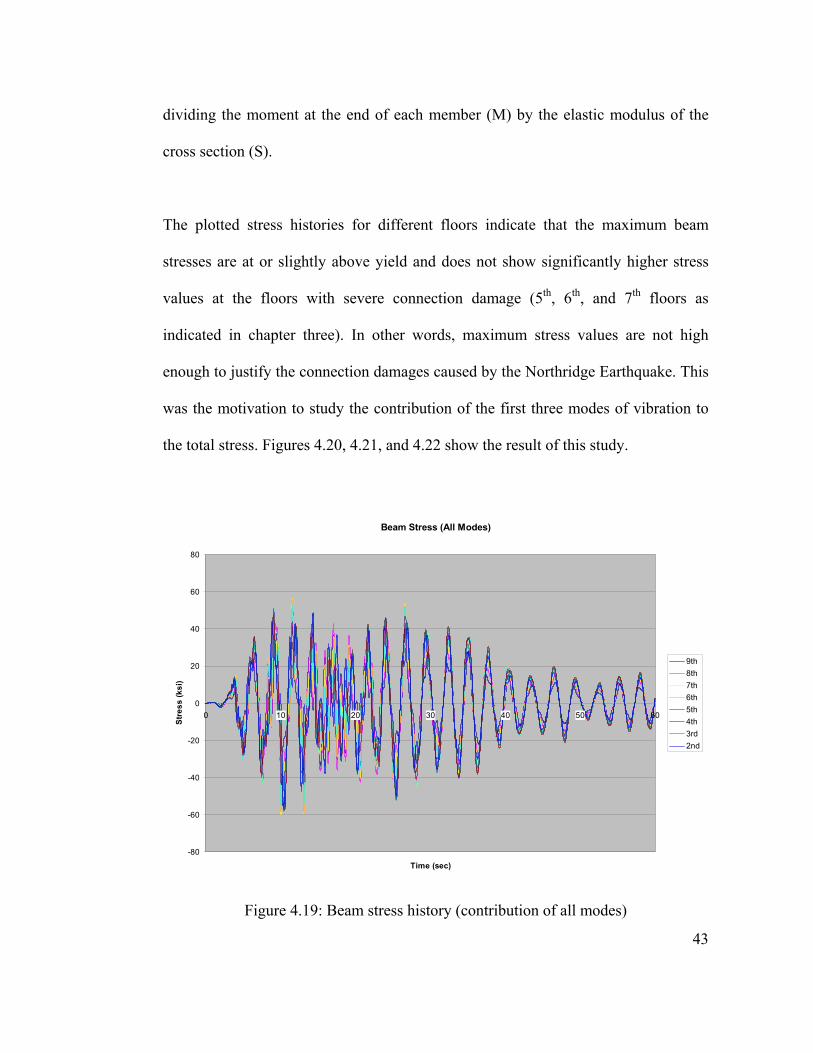
43
dividing the moment at the end of each member (M) by the elastic modulus of the
cross section (S).
The plotted stress histories for different floors indicate that the maximum beam
stresses are at or slightly above yield and does not show significantly higher stress
values at the floors with severe connection damage (5th, 6th, and 7th floors as
indicated in chapter three). In other words, maximum stress values are not high
enough to justify the connection damages caused by the Northridge Earthquake. This
was the motivation to study the contribution of the first three modes of vibration to
the total stress. Figures 4.20, 4.21, and 4.22 show the result of this study.
Beam Stress (All Modes)
-80
-60
-40
-20
0
20
40
60
80
0 10 20 30 40 50 60
Time (sec)
Stre
ss (k
si)
9th8th7th6th5th4th3rd2nd
Figure 4.19: Beam stress history (contribution of all modes)

44
Beam Stress (Mode 1)
-60
-40
-20
0
20
40
60
0 10 20 30 40 50 60
Time (sec)
Stre
ss (k
si)
9th8th7th6th5th4th3rd2nd
Figure 4.20: Beam stress history (contribution of the 1st mode).
Beam Stress (Mode 2)
-40
-30
-20
-10
0
10
20
30
40
0 10 20 30 40 50 60
Time (sec)
Stre
ss (k
si)
9th8th7th6th5th4th3rd2nd
Figure 4.21: Beam stress history (contribution of the 2nd mode).

45
Beam Stress (Mode 3)
-25
-20
-15
-10
-5
0
5
10
15
20
25
0 10 20 30 40 50 60
Time (sec)
Stre
ss (k
si)
9th8th7th6th5th4th3rd2nd
Figure 4.22: Beam stress history (contribution of the 3rd mode).
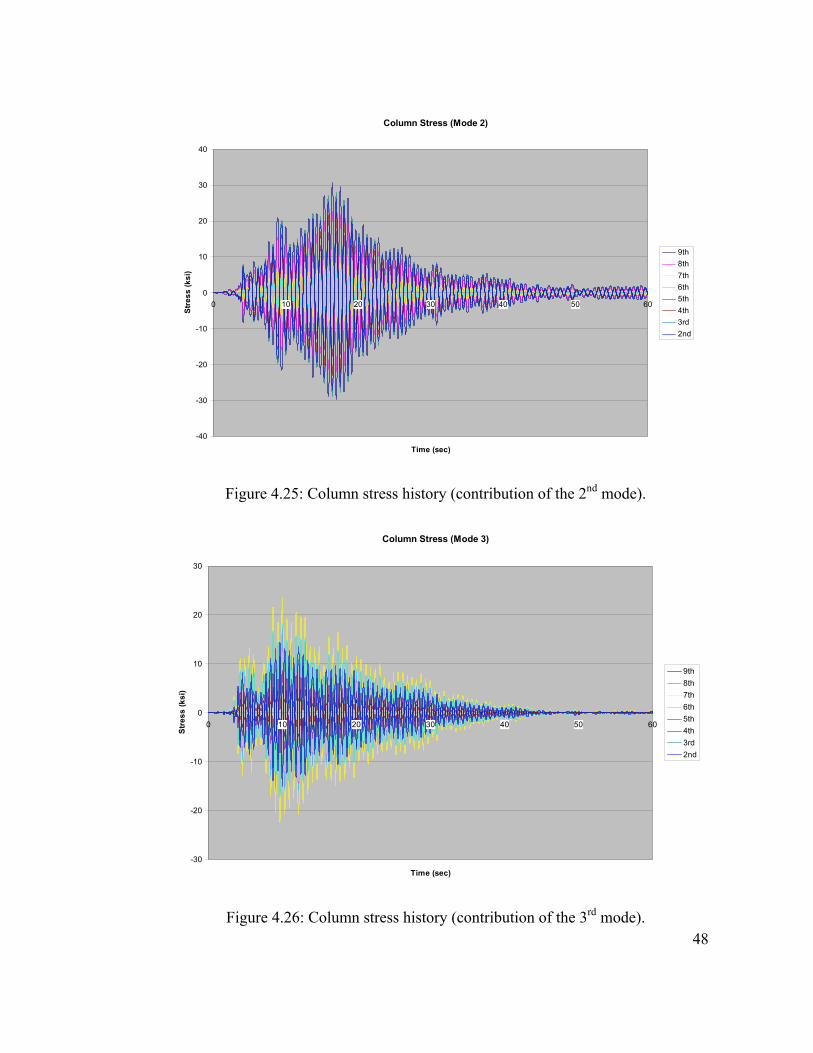
It can be clearly seen on Figure 4.22 that 5th, 6th and 7th floor beams are going
through a lot of cycles with noticeable stress levels created by the 3rd mode of
vibration. Knowing that these connections are the ones that experienced significant
damage during the Northridge Earthquake, it can be concluded that the higher modes
of vibration are potentially a major player in the connection damages occurred in the
10-story building. The 6th floor beam as shown in Figure 3.23 has the highest level of
stress created by the 3rd mode and this is the floor with the most significant damage
during the Northridge Earthquake. The result of cumulative fatigue studies described
later on in chapters five and six of this document confirm this observation.

46
4.2.1.3.2 Column Stress
The next step is looking at the column stress histories. Figure 4.23 shows the total
column stresses. Similar to what was observed previously for beams, the total stress
does not appear to justify the severe column damage observed at the 6th floor. Also
the maximum column stress values are not high enough to justify the connection
damages caused by the Northridge Earthquake. Figures 4.24, 4.25, and 4.26 show the
stress histories created by the first three modes of vibration separately. By looking at
Figure 4.26, it is obvious that the 6th and 7th floor columns (columns above and
below the 6th floor moment connection that experienced severe damage in the form
of crack through the weld and column flange) have gone through many cycles with
significant stress levels. It can be concluded that the higher modes of vibration are
potentially a major player in the connection damages that occurred in the 10-story
building. The result of cumulative fatigue studies described later on in chapters five
and six of this document confirm this observation.

47
Column Stress (All Modes)
-80
-60
-40
-20
0
20
40
60
80
0 10 20 30 40 50 60
Time (sec)
Stre
ss (k
si)
9th8th7th6th5th4th3rd2nd
Figure 4.23: Column stress history (contribution of all modes).
Column Stress (Mode 1)
-60
-40
-20
0
20
40
60
0 10 20 30 40 50 60
Time (sec)
Stre
ss (k
si)
9th8th7th6th5th4th3rd2nd
Figure 4.24: Column stress history (contribution of the 1st mode).
48
Column Stress (Mode 2)
-40
-30
-20
-10
0
10
20
30
40
0 10 20 30 40 50 60
Time (sec)
Stre
ss (k
si)
9th8th7th6th5th4th3rd2nd
Figure 4.25: Column stress history (contribution of the 2nd mode).
Column Stress (Mode 3)
-30
-20
-10
0
10
20
30
0 10 20 30 40 50 60
Time (sec)
Stre
ss (k
si)
9th8th7th6th5th4th3rd2nd
Figure 4.26: Column stress history (contribution of the 3rd mode).

49
4.2.2 Non-Linear Direct Integration Time-History Analysis
A series of non-linear direct integration time-history analyses was performed on the
same model used for the linear modal time-history analysis. The purpose was to
study the effect of nonlinearities in the behavior of the frames and to investigate the
adequacy of the linear model for the purpose of this research project.
4.2.2.1 Effect of Material Properties
According to the design documents, the material used for the beams and columns
had yield stresses of 36 and 50 ksi, respectively (A36 beams and A572 GR.50
columns). In this document, these material properties are referred to as theoretical
material properties. The mill test results on the other hand, indicate that the average
values of yF and uF for the beams and columns are as follows:
Beams: yF = 50 ksi ; uF = 70 ksi
Columns: yF = 52 ksi ; uF = 75 ksi
These values are referred to as mill test material properties in this document. A
series of non-linear direct integration time-history analyses was performed
considering different material properties for beams and columns and the analysis
50
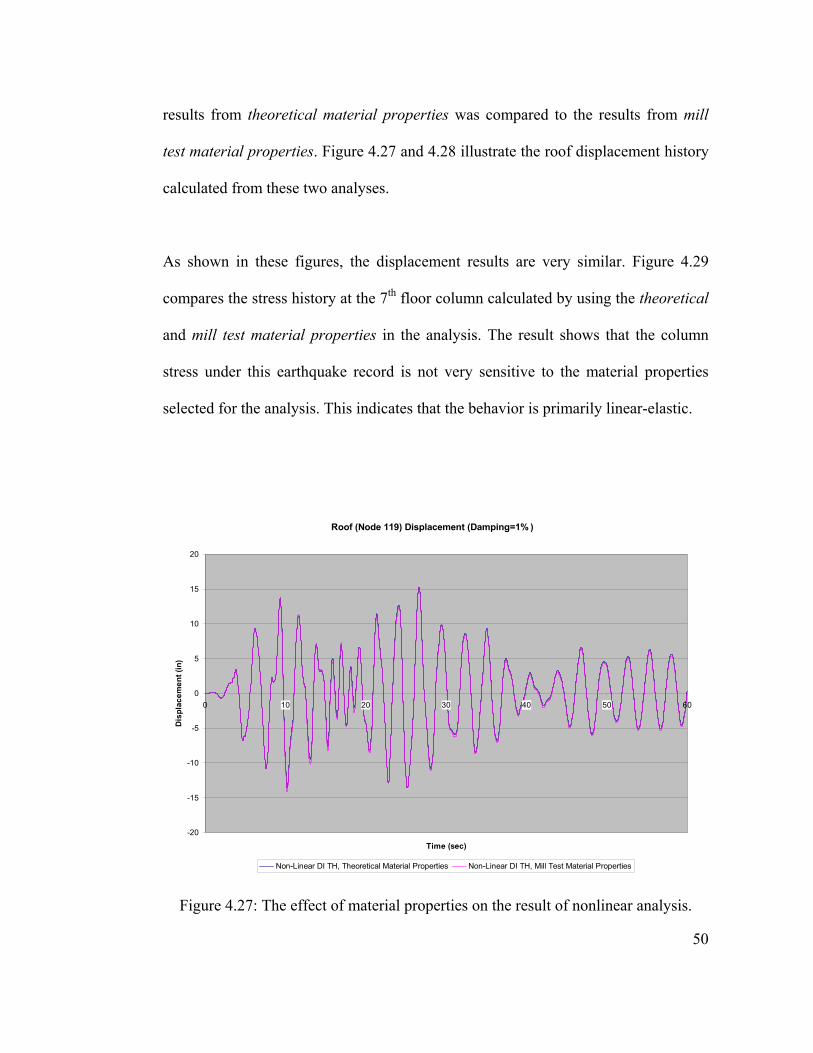
results from theoretical material properties was compared to the results from mill
test material properties. Figure 4.27 and 4.28 illustrate the roof displacement history
calculated from these two analyses.
As shown in these figures, the displacement results are very similar. Figure 4.29
compares the stress history at the 7th floor column calculated by using the theoretical
and mill test material properties in the analysis. The result shows that the column
stress under this earthquake record is not very sensitive to the material properties
selected for the analysis. This indicates that the behavior is primarily linear-elastic.
Roof (Node 119) Displacement (Damping=1% )
-20
-15
-10
-5
0
5
10
15
20
0 10 20 30 40 50 60
Time (sec)
Dis
plac
emen
t (in
)
Non-Linear DI TH, Theoretical Material Properties Non-Linear DI TH, Mill Test Material Properties
Figure 4.27: The effect of material properties on the result of nonlinear analysis.

51
Roof (Node 119) Displacement (Damping=1% )
-15
-10
-5
0
5
10
15
10 15 20 25 30 35 40
Time (sec)
Dis
plac
emen
t (in
)
Non-Linear DI TH, Theoretical Material Properties Non-Linear DI TH, Mill Test Material Properties
Figure 4.28: The effect of material properties on the result of nonlinear analysis.
Column Stress Nonlinear TH at 7th Floor
-80
-60
-40
-20
0
20
40
60
80
0 10 20 30 40 50 60
Time (sec)
Stre
ss (k
si)
Theoretical Materila Properties Mill Test Material Properties
Figure 4.29: The effect of material properties on the column stress history calculated from the non-linear direct integration time-history analysis.

52
4.2.2.2 Linear vs. Non-Linear Time-History Results
In this section, the result of the linear modal time-history analysis is compared to the
non-linear direct integration time-history results. Figure 4.30 depicts the
displacement histories at the roof calculated by the linear and non-linear analyses.
Also, figure 4.31 illustrates the column stress histories resulted from the nonlinear
direct integration time-history analysis. It should be noticed that the stress shown in
this graph is calculated by dividing the moment at the end of each member (M) by
the elastic section modulus (S). The reason for using the elastic section modulus (and
not the plastic section modulus) is to keep the stress levels comparable to those of
linear analysis. Comparing this figure with the result of the linear modal time history
analysis shown on figure 4.23, indicates that the stresses are in the same range.
Roof (Node 119) Displacement (Damping=1% )
-20
-15
-10
-5
0
5
10
15
20
0 10 20 30 40 50 60
Time (sec)
Dis
plac
emen
t (in
)
Non-Linear DI TH, Theoretical Material Properties Non-Linear DI TH, Mill Test Material Properties Linear Modal TH (all modes)
Figure 4.30: Comparison between the linear and nonlinear analysis results.

53
Column Stress Nonlinear TH (Theoretical Material Properties)
-80
-60
-40
-20
0
20
40
60
80
0 10 20 30 40 50 60
Time (sec)
Stre
ss (k
si)
9th8th7th6th5th4th3rd2nd
Figure 4.31: Column stress (equivalent M/S stress) history calculated from the nonlinear time-history analysis.
As indicated earlier in this chapter, the CDMG record at the roof of the building was
available for this study. Result of a moving-window Fourier transform of the CDMG
roof acceleration record has been shown on figure 4.32. The moving window
analysis has been performed in MATLAB [www.mathworks.com]. For this analysis,
ten-second blocks with 5-second overlaps have been used. The results indicate that
the first mode period of the building is 2.5 seconds. This result shows good
compatibility with the first mode period of the analytical model. Figure 4.32 also
shows that the first mode period of the building did not change during the Northridge
event. This means that there have not been significant nonlinearities in the building.

54
This observation is well justified by studying the maximum stresses (M/S) at the
investigated beams and columns. This study has been performed on maximum
stresses resulting from the linear modal time-history analysis. As shown in figures
4.33 and 4.34, the maximum stresses are not significantly larger than the yield value.
This combined with the fact that higher than yield stresses happened in very few
cycles (figures 4.19 and 4.23), give more validity to the linear modal time history
analysis. As a result, building nonlinearities have not been significant during the
Northridge Earthquake and use of the linear modal time-history analysis is adequate
for the purposes of this study. Low demand to capacity ratios as shown in figure 4.35
indicate that response is mainly linear-elastic and confirms the previous
observations.
Ten-Story Building First Mode Period (from the Roof Record)Moving-Window Fourier Transform (10-sec Blocks with 5-sec Overlap)
0
0.5
1
1.5
2
2.5
3
5 10 15 20 25 30 35 40 45 50
Time (sec)
Firs
t Mod
e Pe
riod
(sec
)
Figure 4.32: Moving-window Fourier transform of the CDMG roof acceleration record.

55
Beam Maximum Stress/Yield Stress
0
0.5
1
1.5
9th 8th 7th 6th 5th 4th 3rd 2nd
Floor
Max
. Stre
ss/Y
ield
Str
ess
Figure 4.33: Ratio of maximum beam stress (M/S) from linear analysis to the material yield stress.
Column Maximum Stress/Yield Stress
0
0.5
1
1.5
9th 8th 7th 6th 5th 4th 3rd 2nd
Floor
Max
. Str
ess/
Yiel
d St
ress
Figure 4.34: Ratio of maximum beam stress (M/S) from linear analysis to the material yield stress.

56
Figure 4.35: Demand to capacity ratios in the ten-story building result of linear modal time-history analysis using SAP 2000.

57
4.3 Two-story building
As described in chapter three, the selected 2-story building is almost symmetrical in
North-South and East-West directions. The lateral load resisting system consists of
steel moment frames in both directions. The moment frame on gridline 14 is selected
for this study. This frame is one of the two moment frames in North-South direction
that experienced very severe connection damage during the Northridge Earthquake.
Figure 4.36 shows the elevation view of this frame. As discussed in chapter three of
this document, gridline L of moment frame 14 is a good representative for the typical
connection damages occurred in this building. As a result, this study is focused on
the beams and columns on gridline L as shown in red in figure 4.36.
Figure 4.36: Moment Frame on gridline 14 in North-South direction.

58
Modal analysis was performed and the periods of the first two modes were calculated
to be:
1T =0.60 sec
2T =0.18 sec
Figures 4.37 and 4.38 show the first two mode shapes of the model.
Figure 4.37: 1st mode shape.

59
Figure 4.38: 2nd mode shape.
4.3.1 Linear Modal Time-History Analysis
A linear modal time-history analysis was performed on the frame. The USC 03
record in South direction (as shown in section 4.1) was used as the ground motion.
4.3.1.1 Stress Histories and Contribution of Each Mode to Total Stress
As described earlier for the ten-story building, a similar study was performed on
beam and column stresses of the two-story building. The goal was to investigate the

60
contribution of higher modes (in this case 2nd mode) to the total stress created at the
investigated beams and columns.
4.3.1.1.1 Beam Stress
Figure 4.39 shows the total stress history at the 2nd floor beam and figure 4.40
illustrates the contribution of each of the first two modes in the beam stress.
Figure 4.39: 2nd Floor beam stress history (contribution of all modes).
2nd Floor Beam Stress (All Modes)
-60
-40
-20
0
20
40
60
0 10 20 30 40 50 60
Time (sec)
Stre
ss (k
si)

61
As seen on Figure 4.40, there is not much contribution from 2nd mode in the total
beam stress and the 1st mode is somehow dominating the response.
Figure 4.40: 2nd floor beam stress history (contribution of the 1st and 2nd modes).
Same observation can be made at the roof beam. Figures 4.41 and 4.42 show the roof
beam stress histories.
2nd Floor Beam Stress
-60
-40
-20
0
20
40
60
0 10 20 30 40 50 60
Time (sec)
Stre
ss (k
si)
Mode 1Mode 2

62
Figure 4.41: Roof beam stress history (contribution of all modes).
Figure 4.42: Roof beam stress history (contribution of the 1st and 2nd modes).
Roof Beam Stress
-50
-40
-30
-20
-10
0
10
20
30
40
50
0 10 20 30 40 50 60
Time (sec)
Stre
ss (k
si)
Mode 1Mode 2
Roof Beam Stress (All Modes)
-50
-40
-30
-20
-10
0
10
20
30
40
50
0 10 20 30 40 50 60
Time (sec)
Stre
ss (k
si)

63
4.3.1.1.2 Column Stress
The 2nd floor column stress histories, shown on Figures 4.43 and 4.44, indicate that
there is not a significant contribution from the 2nd mode of vibration to the total
stress. In other words, the first mode creates a significant share of the total stress.
Figure 4.43: 2nd floor column stress history (contribution of all modes).
2nd Floor Column Stress (All Modes)
-100
-80
-60
-40
-20
0
20
40
60
80
100
0 10 20 30 40 50 60
Time (sec)
Stre
ss (k
si)

64
Figure 4.44: 2nd floor column stress history (contribution of the 1st and 2nd modes).
Same conclusion can be made from the stress histories shown on figures 4.45 and
4.46. The observations of the beam and column stress histories indicate that the
higher mode effects do not appear to be significant for the investigated two-story
building. It can be concluded that the first mode of vibration is potentially the major
contributor in the connection damages occurred in this building. The result of
cumulative fatigue studies described later on in chapters five and six of this
document confirm this theory.
2nd Floor Column Stress
-100
-80
-60
-40
-20
0
20
40
60
80
100
0 10 20 30 40 50 60
Time (sec)
Stre
ss (k
si)
Mode 1Mode 2

65
Figure 4.45: Roof column stress history (contribution of all modes).
Figure 4.46: Roof column stress history (contribution of the 1st and 2nd modes).
Roof Column Stress
-50
-40
-30
-20
-10
0
10
20
30
40
50
0 10 20 30 40 50 60
Time (sec)
Stre
ss (k
si)
Mode 1Mode 2
Roof Column Stress (All Modes)
-80
-60
-40
-20
0
20
40
60
80
0 10 20 30 40 50 60
Time (sec)
Stre
ss (k
si)

66
CHAPTER 5: FATIGUE ANALYSIS
This chapter contains the procedure and the results of a series of fatigue analyses
performed on the investigated ten-story and two-story buildings. Cumulative fatigue
is calculated and the effect of higher modes on cumulative fatigue is investigated.
5.1 Fatigue Analysis Procedure
Since stresses at the investigated beams and columns do not have a constant
harmonic amplitude, the selected fatigue assessment procedure needs to be
applicable to variable stress ranges. The study of different fatigue assessment
methods resulted in using the linear damage rule that is widely used in civil
engineering practice. This method, which is known as Palmgren-Miner rule was first
proposed by Palmgren in 1924. Two decades later, Miner further developed the
procedure in 1945. [9], [23], [39]
This method assumes that the damage fraction resulting from each particular stress
range is a linear function of the number of cycles at that stress range. As a result, the
total fatigue damage in the detail is the sum of the damage from all different stress
levels that are applied to it. This can be written as the following equation. [9], [23],
[39]
67
∑i
i
Nn = 1
Where in and iN are defined as follows:
in : Number of cycles at stress level i (from time-history analysis).
iN : Number of cycles to failure at stress level i (from S-N curve).
Based on the results of the time-history analyses explained in chapter four, the
number of cycles at each stress level ( in ) can be computed through a cycle counting
process. As described later in this chapter, the rainflow method [9], [23], [39] is
selected as the cycle counting procedure for the beam and column stress histories.
The number of cycles to failure at each stress level ( iN ) is another parameter in the
fatigue equation. Fatigue life of the investigated detail at each stress level is needed
to determine this parameter. As a result, establishing a fatigue life curve for the
investigated Pre-Northridge moment connection appears to be essential for this
study. This curve is technically know as S-N curve and illustrates the stress versus
the number of cycles to failure. The following section of this document includes the
steps taken to establish an S-N curve suitable for this study.

68
5.2 S-N Curve
The current research tried to use all applicable technical resources and fatigue test
results available at the time of this work. Since the available fatigue tests for the
investigated beam-column connection detail are limited, a probabilistic approach is
not possible. Therefore, the S-N curve developed later in this chapter, and
consequently the fatigue analysis results, are based on the available test data at the
time of this study.
5.2.1 Available Fatigue Test Data
A thorough study has been performed on the fatigue tests available at the time of this
research. Independent tests have been done on low-cycle and high-cycle regions that
are investigated in this section.
5.2.1.1 Tests by Fisher et al.
Investigations conducted by Fisher et al. (1977) [22] are mainly used for the high-
cycle region of the S-N curve. Figure 5.1 illustrates the results of these tests for
rolled beams, welded beams, and beams with end welded cover plate.

69
Figure 5.1: S-N curves for different beam details. [22]
These tests results have been widely used in establishing most of the fatigue design
criteria currently used in United States. Since the high-cycle fatigue is significant in
bridge structures, the criteria developed from these tests are widely used in fatigue
design and assessment of bridges [1]. “Fatigue and Fracture in Steel Bridges” [21]
includes a series of case studies by Fisher on the fatigue in steel bridges. Also, in a
document published by Fisher et al. (1998) [23], the authors present more fatigue test
results in the high-cycle region. Figure 5.2 depicts the S-N curves presented in that
document for welded and coveplated beams.

70
Figure 5.2: S-N curves for welded and coverplated beams. [23]
Figure 5.3: Fatigue crack at the end of cover plate fillet weld toe. [23]

71
The results shown in this figure, completely match the S-N curves in figure 5.1. The
fatigue crack, which is the main mode of failure for coverplated beam specimens,
has been illustrated in figure 5.3.
The current study uses the appropriate stress concentration factors in these test
results in order to apply them to the investigated Pre-Northridge connection detail.
This will be further explained in the following pages.
5.2.1.2 Tests by Partridge et al.
Ten full scale fatigue tests have been performed in the low-cycle region. Figure 5.4
shows the setup for these tests. Identical W14x155 columns and W18x40 beams
have been used for this experimental study. Backup bars were left in place in the first
two tests and were removed for the rest of the experiments. Figure 5.5 shows the
results of the study by Partridge et al. [31] based on the test data.
The current study mainly uses these test results for the low-cycle region. Relevant
stress concentration factor has been used to account for the back-up bar which is
further clarified later in this chapter.

72
Figure 5.4: Low-cycle fatigue test setup (courtesy of James Partridge).

73
Figure 5.5: Low-cycle fatigue test results. [31]
5.2.1.3 Tests by Kuwamura et al.
A series of low-cycle fatigue tests on welded joints with high-strength steel members
has been performed in Japan by Kuwamura et al. The result of their studies was
published in a paper in the proceedings of the Tenth World Conference on
Earthquake Engineering [25].
A new type of high-strength steel was used for these tests. The properties of this new
material were as follows:

74
yF = 62.5 ksi
uF = 85.3 ksi
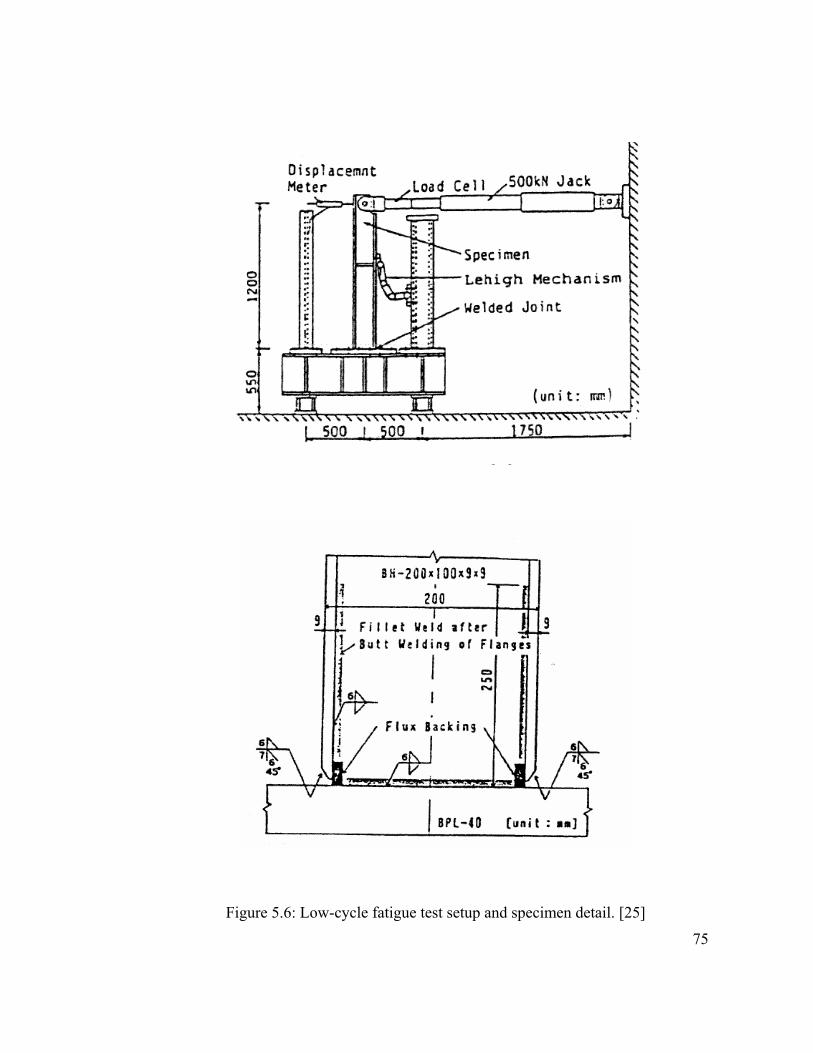
Test specimen comprised an H-shape member with 200mm x 100mm x 9mm x 9mm
dimensions. Backup bars were removed for all tests. Tests were displacement
controlled and it was concluded that fatigue failure happened at all the specimens.
Figure 5.6 illustrates the test setup and specimen details of these tests. The results of
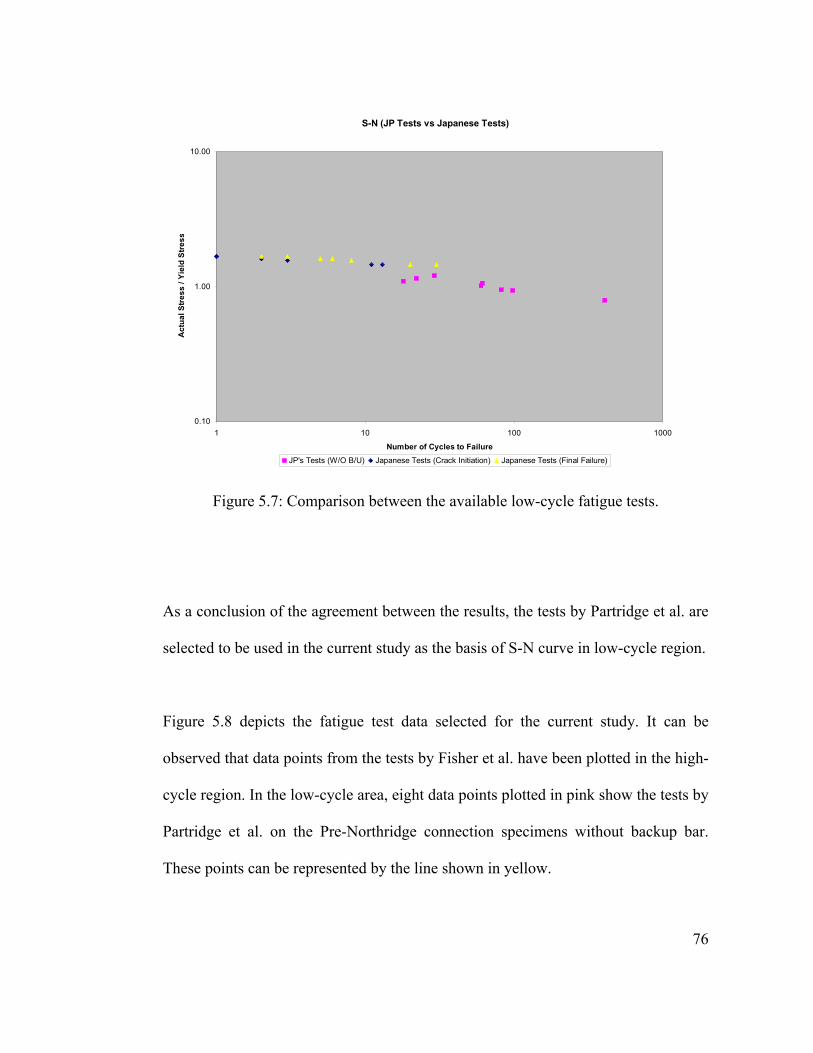
this study are used to verify the tests done by Partridge et al. [31]. The material used
in the Japanese tests is significantly different from the regular steel used in the
studies by Partridge et al. As a result, for comparison and verification purposes, the
test stress values are normalized relative to the yield stress of the material. In other
words, the maximum equivalent elastic stress is calculated for all tests by dividing
the maximum moment (M) by the elastic section modulus (S). This value is then
normalized by dividing it by the yield stress of material. The result of this
comparison can be observed in figure 5.7.
It is concluded that the investigated tests appear to be significantly consistent. This
validates the results of the tests by Partridge et al.
75
Figure 5.6: Low-cycle fatigue test setup and specimen detail. [25]
76
Figure 5.7: Comparison between the available low-cycle fatigue tests.
As a conclusion of the agreement between the results, the tests by Partridge et al. are
selected to be used in the current study as the basis of S-N curve in low-cycle region.
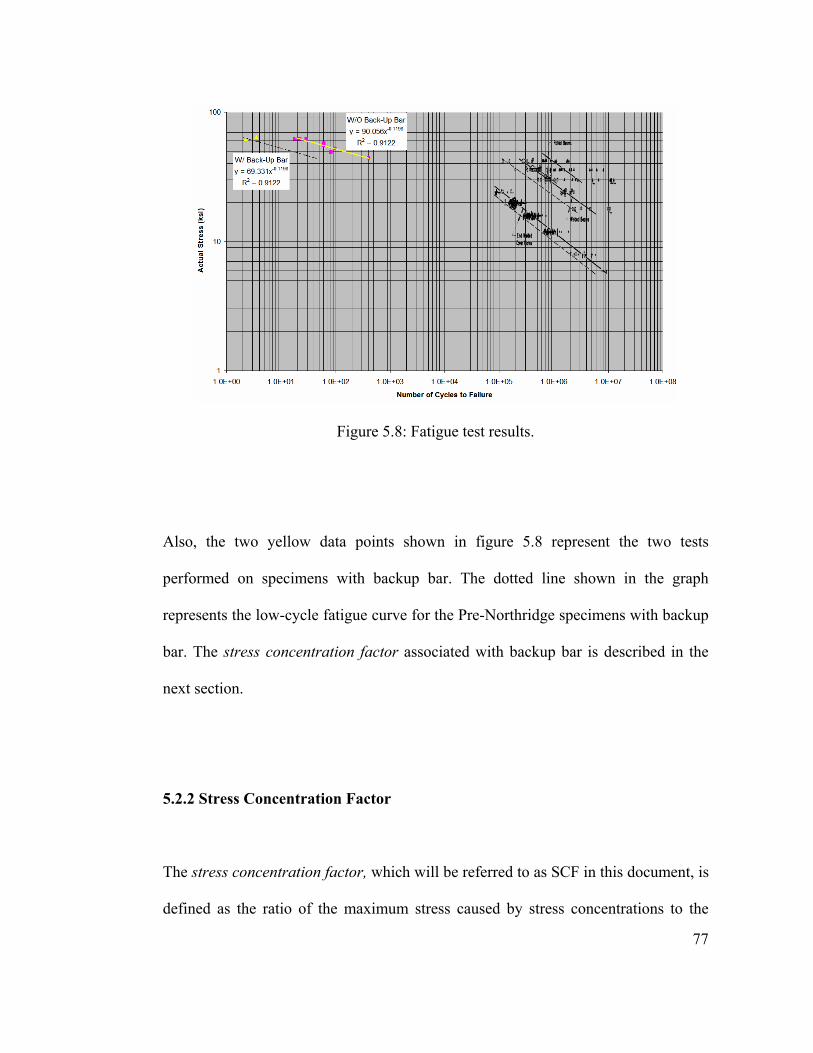
Figure 5.8 depicts the fatigue test data selected for the current study. It can be
observed that data points from the tests by Fisher et al. have been plotted in the high-
cycle region. In the low-cycle area, eight data points plotted in pink show the tests by
Partridge et al. on the Pre-Northridge connection specimens without backup bar.
These points can be represented by the line shown in yellow.
S-N (JP Tests vs Japanese Tests)
0.10
1.00
10.00
1 10 100 1000
Number of Cycles to Failure
Act
ual S
tres
s / Y
ield
Str
ess
JP's Tests (W/O B/U) Japanese Tests (Crack Initiation) Japanese Tests (Final Failure)
77
Figure 5.8: Fatigue test results.
Also, the two yellow data points shown in figure 5.8 represent the two tests
performed on specimens with backup bar. The dotted line shown in the graph
represents the low-cycle fatigue curve for the Pre-Northridge specimens with backup
bar. The stress concentration factor associated with backup bar is described in the
next section.
5.2.2 Stress Concentration Factor
The stress concentration factor, which will be referred to as SCF in this document, is
defined as the ratio of the maximum stress caused by stress concentrations to the
78
analytical stress (M/S). SCF is a critical element in establishing the S-N curve and as
a result careful study is performed to estimate the relative SCF for the investigated
Pre-Northridge moment connection.
5.2.2.1 Available Test Data
Comparing the overlapping area of solid and dotted lines in the low-cycle region of
figure 5.8 indicates that based on tests by Partridge et al. the value of SCF is
estimated to be 1.3 (for backup bars).
In the high-cycle region, tests by Fisher et al. indicate that SCF associated with
welded beams and beams with end welded cover plates are respectively 1.5 and 3.5
relative to rolled beams. Figure 5.9 shows how these values are estimated.
5.2.2.2 Steel Manuals
In this section, the SCFs estimated from the available test results are verified using
the well established fatigue criteria in widely accepted steel manuals. “AISC Steel
Construction Manual” [2] and British “Steel Designers’ Manual” [29] (which is the

79
Figure 5.9: Stress concentration factors observed in Fisher’s tests.
main reference for steel construction and design in Great Britain) have been selected
for this verification study.
Observations from “AISC Steel Construction Manual” [2] are as follows:
• SCF of base metal is assumed to be 1 and all other SCFs are calculated
relative to base metal.
28 ksi
19 ksi
8 ksi
45 ksi
31 ksi
13 ksi
SCF=1
SCF=3.5
SCF=1.5
80
• SCF of rolled beams is calculated to be 1.5.
• SCF of beams with welded end cover plates is calculated to be 5.3.
• SCF of welded joints (caused by weld) is calculated to be 2.4.
• SCF of beams with welded end cover plates relative to rolled beams is
calculated to be 5.3/1.5 = 3.53. This confirms the SCF estimated from tests
by Fisher et al. which suggests a SCF of 3.5 (see figure 5.9) [22], [23].
• SCF of welded joints relative to rolled beams is calculated to be 2.4/1.5 =
1.6. This confirms the SCF estimated from tests by Fisher et al. which
suggests a SCF of 1.5 (see figure 5.9) [22], [23].
Observations from the British “Steel Designers’ Manual” [29] are as follows:
• SCF of welded joints relative to rolled beams is calculated to be 1.67. This
confirms the SCFs presented in “AISC Steel Construction Manual” (SCF of
welded joints relative to rolled beams = 2.4/1.5 = 1.6).

81
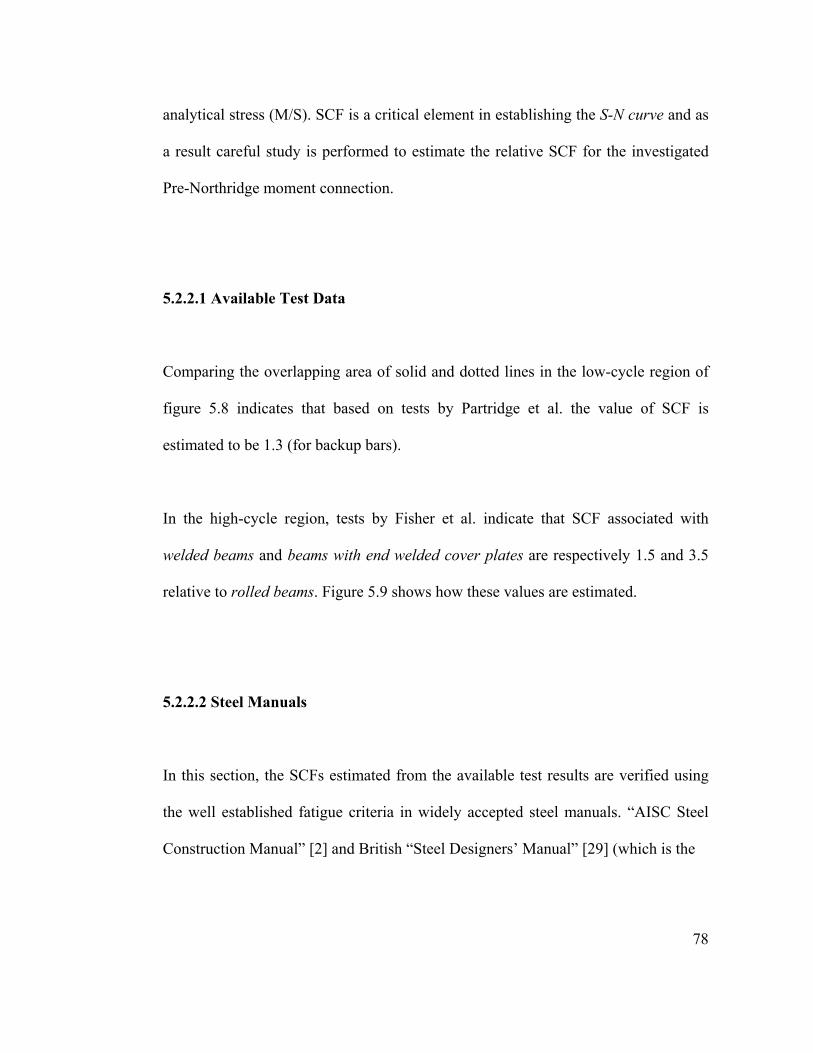
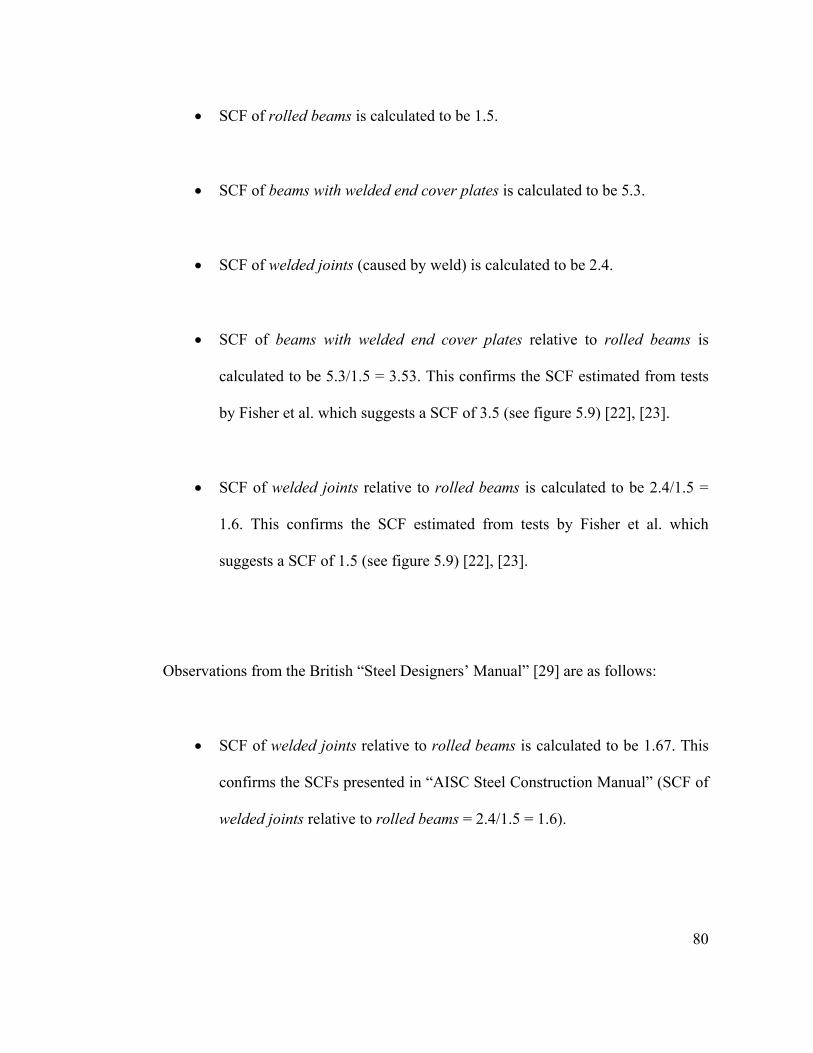
• SCF of welded joints with backup bar relative to welded joints (caused by
backup bar) is calculated to be 1.3. This perfectly confirms the backup bar
SCF estimated from the tests by Partridge et al. (1.3).
5.2.2.3 Finite Element Study
A series of linear static finite element analyses was performed on the Pre-Northridge
moment connection. ANSYS was used as the finite element software for this study.
The purpose was to investigate the SCF caused by geometry of the detail. Two
typical details of the Pre-Northridge moment connection, with and without continuity
plates, were investigated.
Figure 5.10 shows the finite element model of the connection without continuity
plates and figure 5.11 shows the result of the analysis. This study indicates that the
SCF is 1.92 for the Pre-Northridge connection without continuity plates. This SCF is
calculated as the ratio of maximum stress observed as the result of the finite element
analysis to the maximum bending stress in the beam (M/S).

82
Figure 5.10: Finite element model of the Pre-Northridge connection without continuity plates.
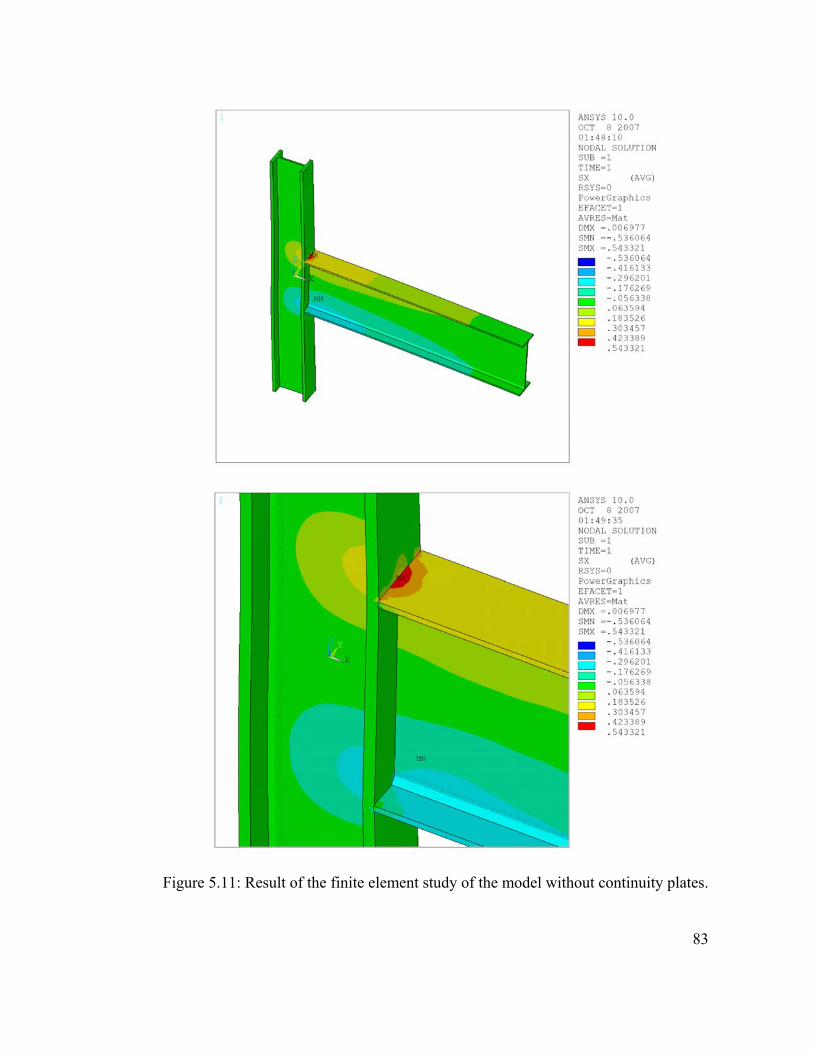
83
Figure 5.11: Result of the finite element study of the model without continuity plates.

84
Figure 5.12: Finite element model of the Pre-Northridge connection with continuity plates.

85
Figure 5.13: Result of the finite element study of the model with continuity plates.

86
Figure 5.12 shows the finite element model of the connection with continuity plates
and figure 5.13 shows the result of the analysis. This study indicates that the SCF is
1.75 for the Pre-Northridge connection with continuity plates. This SCF is calculated
as the ratio of maximum stress observed as the result of the finite element analysis to
the maximum bending stress in the beam (M/S).
Since the connections of the investigated buildings have continuity plates, the value
of 1.75 is chosen for the purposes of this study.
5.2.2.4 Established Stress Concentration Factor
The results of the study of SCFs can be summarized as follows:
• SCF caused by geometry of the connection (relative to M/S stress) has been
shown to be 1.75 (finite element analysis).
• SCF caused by weld has been calculated to be 2.4.
• SCF caused by backup bar has been calculated to be 1.3.
• SCF caused by rolling effects has been calculated to be 1.5.
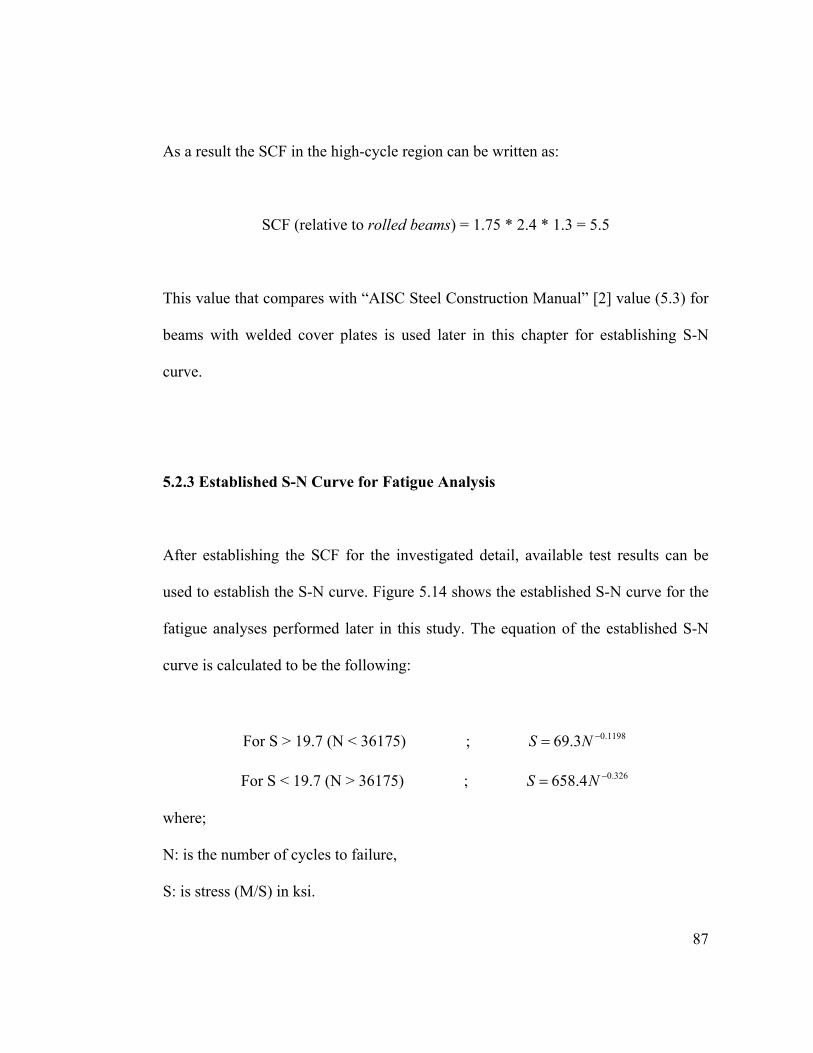
87
As a result the SCF in the high-cycle region can be written as:
SCF (relative to rolled beams) = 1.75 * 2.4 * 1.3 = 5.5
This value that compares with “AISC Steel Construction Manual” [2] value (5.3) for
beams with welded cover plates is used later in this chapter for establishing S-N
curve.
5.2.3 Established S-N Curve for Fatigue Analysis
After establishing the SCF for the investigated detail, available test results can be
used to establish the S-N curve. Figure 5.14 shows the established S-N curve for the
fatigue analyses performed later in this study. The equation of the established S-N
curve is calculated to be the following:
For S > 19.7 (N < 36175) ; 1198.03.69 −= NS
For S < 19.7 (N > 36175) ; 326.04.658 −= NS
where;
N: is the number of cycles to failure,
S: is stress (M/S) in ksi.

88
Figure 5.14: Established S-N curve for fatigue analysis.
The following need to be considered in regards to the established S-N curve:
• Mode shape and its effects will be captured by the global model (time-history
analysis).
• Higher mode distributions will change the global behavior and will be
automatically captured in M/S stress output at the end of critical members.
Rolled Beams (SCF=1)
Welded Beams (SCF=1.5)
Cover Plated Beams (SCF=3.5)
SCF=5.5

89
• In low-cycle fatigue range, getting from M/S to actual concentrated stresses
does not appear to be critical since the test results are plotted against M/S
stress (and not the maximum concentrated stress). However, understanding of
the magnitude of SCF created by Backup bar is a must. This study shows that
this value is 1.3.
• In low-cycle fatigue range, since the stress field in tests by Partridge et al. is
identical to actual conditions of Pre-Northridge connection, using the SCF of
1.3 (relative to specimen without backup bar) to account for backup bar
effects appears to be appropriate. This has been cross checked with the
British Steel Designers’ Manual.
• In high-cycle fatigue range, SCF relative to rolled beams test data (tests by
Fisher et al.) has been calculated to be approximately 5.5. S-N curves
developed by Fisher et al. can be used after implementing this factor.
• Available tests for the investigated detail are limited and as a result a
probabilistic approach is not possible. Developed S-N curve is based on the
available test data at the time of this study.
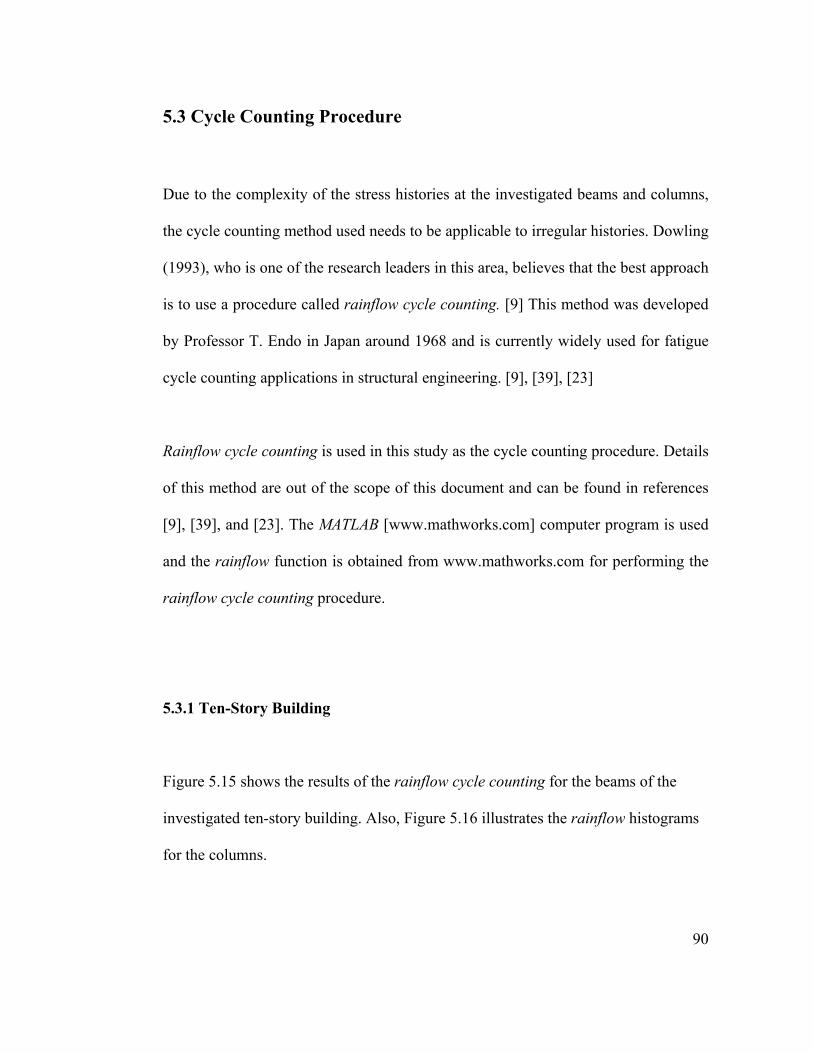
90
5.3 Cycle Counting Procedure
Due to the complexity of the stress histories at the investigated beams and columns,
the cycle counting method used needs to be applicable to irregular histories. Dowling
(1993), who is one of the research leaders in this area, believes that the best approach
is to use a procedure called rainflow cycle counting. [9] This method was developed
by Professor T. Endo in Japan around 1968 and is currently widely used for fatigue
cycle counting applications in structural engineering. [9], [39], [23]
Rainflow cycle counting is used in this study as the cycle counting procedure. Details
of this method are out of the scope of this document and can be found in references
[9], [39], and [23]. The MATLAB [www.mathworks.com] computer program is used
and the rainflow function is obtained from www.mathworks.com for performing the
rainflow cycle counting procedure.
5.3.1 Ten-Story Building
Figure 5.15 shows the results of the rainflow cycle counting for the beams of the
investigated ten-story building. Also, Figure 5.16 illustrates the rainflow histograms
for the columns.

91
2nd Floor Beam
1st Mode 2nd Mode
3rd Mode All Modes
Figure 5.15: Rainflow histograms for beams of the ten-story building.

92
3rd Floor Beam
1st Mode 2nd Mode
3rd Mode All Modes
Figure 5.15, continued: Rainflow histograms for beams of the ten-story building.

93
4th Floor Beam
1st Mode 2nd Mode
3rd Mode All Modes
Figure 5.15, continued: Rainflow histograms for beams of the ten-story building.

94
5th Floor Beam
1st Mode 2nd Mode
3rd Mode All Modes
Figure 5.15, continued: Rainflow histograms for beams of the ten-story building.

95
6th Floor Beam
1st Mode 2nd Mode
3rd Mode All Modes
Figure 5.15, continued: Rainflow histograms for beams of the ten-story building.

96
7th Floor Beam
1st Mode 2nd Mode
3rd Mode All Modes
Figure 5.15, continued: Rainflow histograms for beams of the ten-story building.
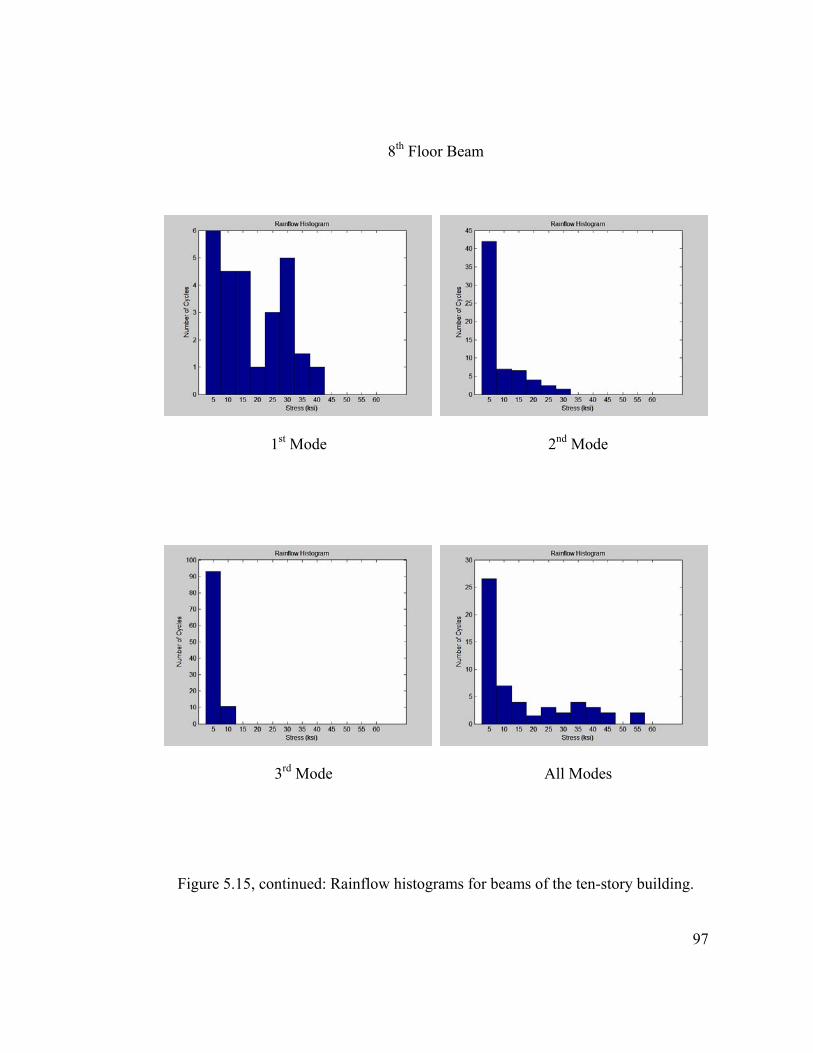
97
8th Floor Beam
1st Mode 2nd Mode
3rd Mode All Modes
Figure 5.15, continued: Rainflow histograms for beams of the ten-story building.

98
9th Floor Beam
1st Mode 2nd Mode
3rd Mode All Modes
Figure 5.15, continued: Rainflow histograms for beams of the ten-story building.

99
2nd Floor Column
1st Mode 2nd Mode
3rd Mode All Modes
Figure 5.16: Rainflow histograms for columns of the ten-story building.

100
3rd Floor Column
1st Mode 2nd Mode
3rd Mode All Modes
Figure 5.16, continued: Rainflow histograms for columns of the ten-story building.

101
4th Floor Column
1st Mode 2nd Mode
3rd Mode All Modes
Figure 5.16, continued: Rainflow histograms for columns of the ten-story building.

102
5th Floor Column
1st Mode 2nd Mode
3rd Mode All Modes
Figure 5.16, continued: Rainflow histograms for columns of the ten-story building.
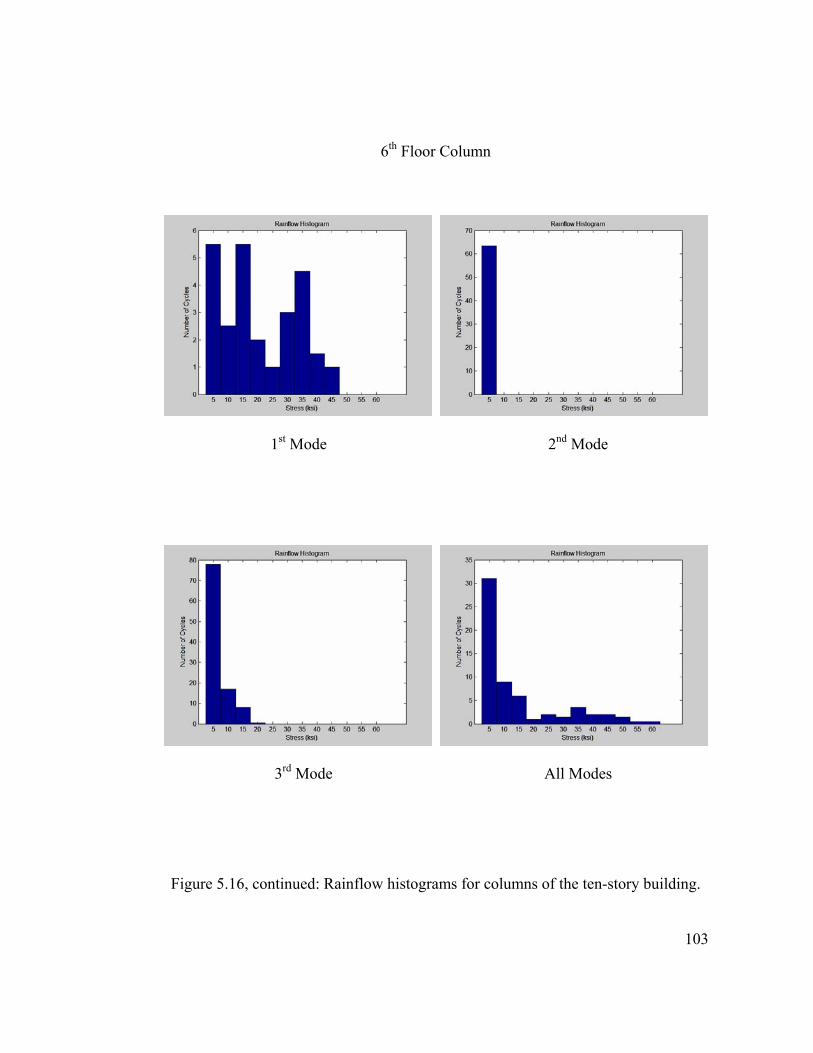
103
6th Floor Column
1st Mode 2nd Mode
3rd Mode All Modes
Figure 5.16, continued: Rainflow histograms for columns of the ten-story building.
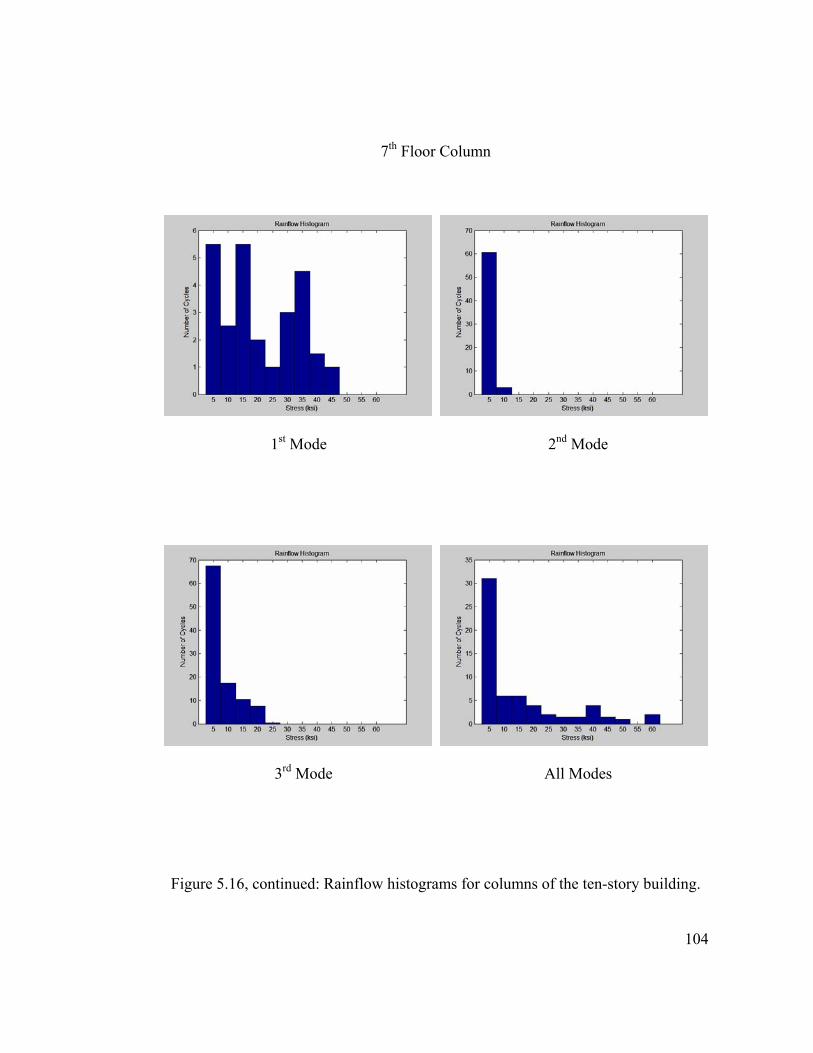
104
7th Floor Column
1st Mode 2nd Mode
3rd Mode All Modes
Figure 5.16, continued: Rainflow histograms for columns of the ten-story building.

105
8th Floor Column
1st Mode 2nd Mode
3rd Mode All Modes
Figure 5.16, continued: Rainflow histograms for columns of the ten-story building.

106
9th Floor Column
1st Mode 2nd Mode
3rd Mode All Modes
Figure 5.16, continued: Rainflow histograms for columns of the ten-story building.

107
It can be seen that the higher modes of vibration enormously effect the cycle
counting results and the histograms corresponding to the 1st mode are significantly
different from the ones corresponding to all modes. This shows that the higher mode
effects make a significant difference in the results of the fatigue analysis in this
building. Figures 5.21 and 5.22 show a blowup of the histograms for the 6th floor
beam and the 7th floor column and clearly illustrates the difference between the 1st
mode and all mode histograms.
5.3.2 Two-Story Building
The results of the rainflow cycle counting for the beams and columns of the two-
story building have been shown in figures 5.17 and 5.18, respectively.
It can be observed from the histograms that the effect of 2nd mode of vibration is not
significant. In other words, the histograms corresponding to the first mode and all
modes are very similar. This observation is different from that of the ten-story
building.

108
2nd Floor Beam
1st Mode 2nd Mode
All Modes
Figure 5.17: Rainflow histograms for beams of the two-story building.

109
Roof Beam
1st Mode 2nd Mode
All Modes
Figure 5.17, continued: Rainflow histograms for beams of the two-story building.

110
2nd Floor Column
1st Mode 2nd Mode
All Modes
Figure 5.18: Rainflow histograms for columns of the two-story building.
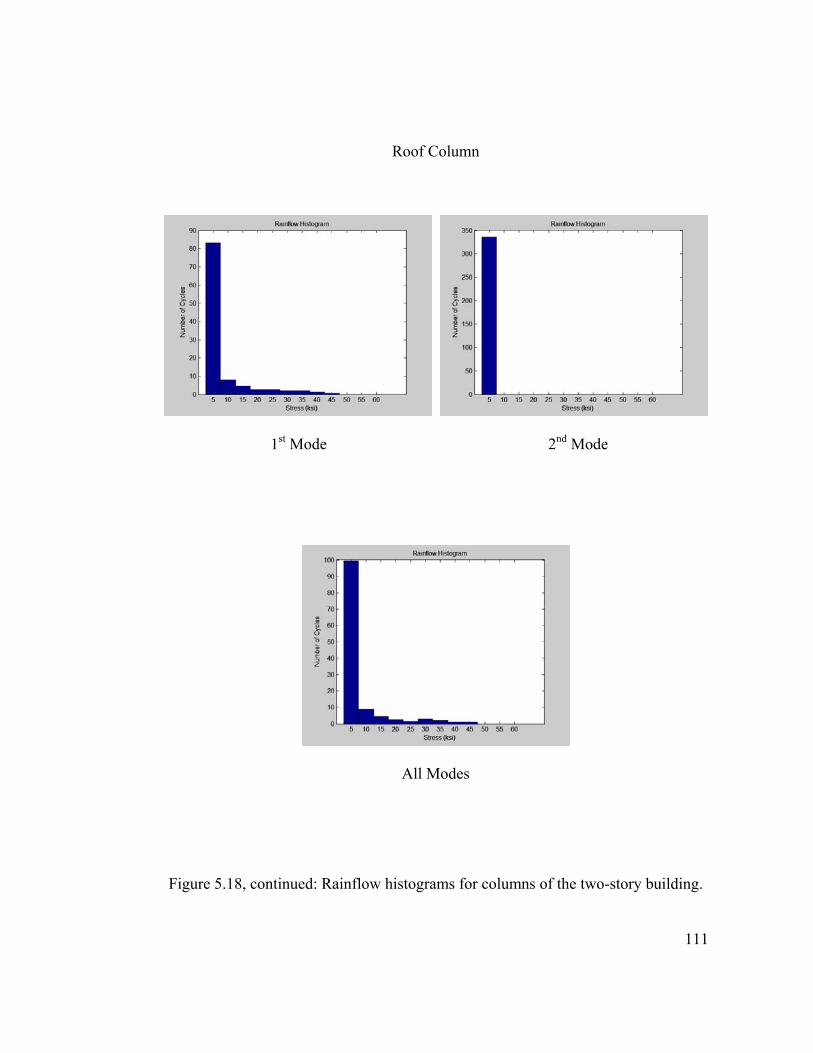
111
Roof Column
1st Mode 2nd Mode
All Modes
Figure 5.18, continued: Rainflow histograms for columns of the two-story building.

112
5.4 Cumulative Fatigue Analysis
As explained earlier, the cumulative fatigue analysis is performed using Palmgren-
Miner rule. This section summarizes the results of the cumulative fatigue analysis on
the investigated beams and columns of the ten-story and two-story buildings.
5.4.1 Ten-Story Building
Table 5.1: Results of the cumulative fatigue analyses on beams of the ten-story building.
Table 5.1 shows the results of the analysis on the beams of the ten-story building. It
can be observed that the cumulative fatigue created by all modes is significantly
5 ksi 10 ksi 15 ksi 20 ksi 25 ksi 30 ksi 35 ksi 40 ksi 45 ksi 50 ksi 55 ksi 60 ksi3173900 378607.9 109152.2 31991.6 4967.1 1084.3 299.46 98.23 36.75 15.25 6.88 3.33
5 ksi 10 ksi 15 ksi 20 ksi 25 ksi 30 ksi 35 ksi 40 ksi 45 ksi 50 ksi 55 ksi 60 ksi1st Mode 7 4.5 4 1 4 3.5 2 0.5 0 0 0 0 0.015882nd Mode 44 7 5.5 4 3 0 0 0 0 0 0 0 0.000813rd Mode 93 10.5 0 0 0 0 0 0 0 0 0 0 0.00006All Modes 29.5 5 4 3.5 2 2.5 3.5 1.5 1.5 1.5 0 0 0.169011st Mode 5.5 2.5 5.5 2.5 1.5 3 3.5 2 0.5 0 0 0 0.048862nd Mode 44 7 6 3.5 3 0 0 0 0 0 0 0 0.000803rd Mode 103.5 0 0 0 0 0 0 0 0 0 0 0 0.00003All Modes 22.5 3.5 5.5 1.5 1 2.5 3 4 1.5 1.5 0 0 0.192541st Mode 5.5 1.5 4.5 4 0.5 2 2.5 3.5 2 0.5 0 0 0.133302nd Mode 45.5 11 4 3 0 0 0 0 0 0 0 0 0.000173rd Mode 103.5 0 0 0 0 0 0 0 0 0 0 0 0.00003All Modes 27.5 4 5.5 1.5 2 1 3.5 4.5 0.5 1 0.5 0.5 0.360941st Mode 5.5 1.5 5 3.5 1 2.5 3.5 3 0.5 0.5 0 0 0.091292nd Mode 60 3.5 0 0 0 0 0 0 0 0 0 0 0.000033rd Mode 85 15.5 3 0 0 0 0 0 0 0 0 0 0.00010All Modes 30.5 7 4.5 1.5 3 0 4 2 3 0.5 0.5 0.5 0.371681st Mode 5.5 2.5 5.5 2 1 3 4.5 1.5 1 0 0 0 0.060602nd Mode 63.5 0 0 0 0 0 0 0 0 0 0 0 0.000023rd Mode 74.5 18.5 7.5 3 0 0 0 0 0 0 0 0 0.00023All Modes 26 6 6 3 2 0.5 4 2 1 1 2 0 0.418241st Mode 6 2 5.5 2.5 1.5 3 3.5 2 0.5 0 0 0 0.048862nd Mode 49 9 5.5 0 0 0 0 0 0 0 0 0 0.000093rd Mode 75.5 19 7.5 1.5 0 0 0 0 0 0 0 0 0.00019All Modes 28 6 6 2.5 2 3 2.5 3.5 0.5 0.5 2 0 0.384401st Mode 6 4.5 4.5 1 3 5 1.5 1 0 0 0 0 0.020492nd Mode 42 7 6.5 4 2.5 1.5 0 0 0 0 0 0 0.002103rd Mode 93 10.5 0 0 0 0 0 0 0 0 0 0 0.00006All Modes 26.5 7 4 1.5 3 2 4 3 2 0 2 0 0.391581st Mode 7 7 2.5 4 5 1 0 0 0 0 0 0 0.002102nd Mode 42.5 6.5 7.5 3.5 3.5 0 0 0 0 0 0 0 0.000913rd Mode 103.5 0 0 0 0 0 0 0 0 0 0 0 0.00003All Modes 40.5 5 2.5 3 3.5 4 3 2 0.5 0 0 0 0.04852
Ni (Cycles)
ni (Cycles) SUM(ni/Ni)
2nd
3rd
4th
5th
6th
BEAM CUMULATIVE FATIGUE ANALYSES RESULTS
Floor Mode
7th
8th
9th

113
larger than the corresponding value for the 1st mode only. This comparison can be
clearly seen in figure 5.19. Also table 5.2 and figure 5.20 confirm the same
observations for the columns of the ten-story building.
Figures 5.21 and 5.22 show the blowup of the rainflow histograms for the most
critical beam and column. It can be seen that effect of higher modes significantly
increases the cumulative fatigue value at these members. Due to effect of potential
defects and principal stresses that are not included this study, cumulative fatigue
values of 0.41 and 0.75 are high enough to be considered the cause of observed
damages. The observations from the fatigue analysis of the 7th floor column (most
critical member) as shown in figure 5.22 can be summarized as follows:
• Comparison between cumulative fatigue analyses of 1st mode and all modes
clearly indicate that higher mode effects are significant.
• Cumulative fatigue analysis of 1st mode only, indicates that the column has
gone through only 6% of its fatigue life.
• Cumulative Fatigue Analysis of all modes, shows a significantly larger
cumulative fatigue value in the column (75%). This is the result of higher
modes.

114
• The contribution of higher modes of vibration significantly increases the
cumulative fatigue in this column. This is because of the contribution of
higher mode stresses than can increase the total stress significantly (relative
to 1st mode stress only) at each point in time.
• Low-cycle fatigue is significant at this column and as expected high-cycle
fatigue does not play a major role.
Figure 5.19: Cumulative fatigue at beams of the ten-story building (1st mode vs. all modes).
Cumulative Fatigue at Beams
0.00
0.05
0.10
0.15
0.20
0.25
0.30
0.35
0.40
0.45
9th Floor 8th Floor 7th Floor 6th Floor 5th Floor 4th Floor 3rd Floor 2nd Floor
Cum
ulat
ive
Fatig
ue
1st ModeAll Modes

115
Table 5.2: Results of the cumulative fatigue analyses on columns of the ten-story building.
Figure 5.20: Cumulative fatigue at columns of the ten-story building (1st mode vs. all modes).
Cumulative Fatigue at Columns
0.00
0.10
0.20
0.30
0.40
0.50
0.60
0.70
0.80
9th Floor 8th Floor 7th Floor 6th Floor 5th Floor 4th Floor 3rd Floor 2nd Floor
Cum
ulat
ive
Fatig
ue
1st ModeAll Modes
5 ksi 10 ksi 15 ksi 20 ksi 25 ksi 30 ksi 35 ksi 40 ksi 45 ksi 50 ksi 55 ksi 60 ksi3173900 378607.9 109152.2 31991.6 4967.1 1084.3 299.46 98.23 36.75 15.25 6.88 3.33
5 ksi 10 ksi 15 ksi 20 ksi 25 ksi 30 ksi 35 ksi 40 ksi 45 ksi 50 ksi 55 ksi 60 ksi1st Mode 7 6.5 2.5 2 6 2 0.5 0 0 0 0 0 0.004832nd Mode 42.5 6.5 7.5 4 3 0 0 0 0 0 0 0 0.000833rd Mode 83.5 15.5 4.5 0 0 0 0 0 0 0 0 0 0.00011All Modes 42.5 9 4.5 2 3.5 3 3.5 1 1.5 0.5 0.5 0 0.171761st Mode 6 4.5 5 0.5 3 5 1.5 1 0 0 0 0 0.020482nd Mode 42 7 7.5 3 2.5 1.5 0 0 0 0 0 0 0.002083rd Mode 93 10.5 0 0 0 0 0 0 0 0 0 0 0.00006All Modes 28.5 2.5 6.5 2 2.5 3.5 3 2 1.5 1 0.5 0 0.213311st Mode 6 4.5 5 0.5 3 5 1.5 1 0 0 0 0 0.020482nd Mode 45 7.5 7 3.5 0.5 0 0 0 0 0 0 0 0.000313rd Mode 103.5 0 0 0 0 0 0 0 0 0 0 0 0.00003All Modes 31 4.5 5.5 0.5 2 3.5 4.5 2 0.5 1 0 0 0.118281st Mode 5.5 1.5 5 3.5 1 1.5 3.5 3.5 1 0.5 0 0 0.109062nd Mode 49 9 5 0.5 0 0 0 0 0 0 0 0 0.000103rd Mode 101 2.5 0 0 0 0 0 0 0 0 0 0 0.00004All Modes 30.5 8 5.5 1.5 1 2 2.5 4 2 0.5 1 0.5 0.433951st Mode 5.5 2.5 5.5 2 1 3 4.5 1.5 1 0 0 0 0.060602nd Mode 63.5 0 0 0 0 0 0 0 0 0 0 0 0.000023rd Mode 78 17 8 0.5 0 0 0 0 0 0 0 0 0.00016All Modes 31 9 6 1 2 1.5 3.5 2 2 1.5 0.5 0.5 0.409561st Mode 5.5 2.5 5.5 2 1 3 4.5 1.5 1 0 0 0 0.060602nd Mode 49 9 5.5 0 0 0 0 0 0 0 0 0 0.000093rd Mode 75.5 19 7.5 1.5 0 0 0 0 0 0 0 0 0.00019All Modes 31 6 6 4 2 1.5 1.5 4 1.5 1 0 2 0.754711st Mode 6 4.5 4.5 1 3 5 1.5 1 0 0 0 0 0.020492nd Mode 42 7 6.5 4 2.5 1.5 0 0 0 0 0 0 0.002103rd Mode 93 10.5 0 0 0 0 0 0 0 0 0 0 0.00006All Modes 25.5 9.5 4 2.5 2 3 4 3 1 0 2 0 0.365121st Mode 7 7 2.5 4 5 1 0 0 0 0 0 0 0.002102nd Mode 42.5 6.5 7.5 3.5 3.5 0 0 0 0 0 0 0 0.000913rd Mode 103.5 0 0 0 0 0 0 0 0 0 0 0 0.00003All Modes 35 8 2 3 2.5 4 2.5 2.5 2 0.5 0 0 0.12534
ni (Cycles) SUM(ni/Ni)
5th
2nd
3rd
4th
6th
7th
8th
9th
COLUMNS CUMULATIVE FATIGUE ANALYSES RESULTS
Floor Mode
Ni (Cycles)

116
1st Mode (∑i
i
Nn = 0.06).
All Modes (∑i
i
Nn = 0.41)
Figure 5.21: Rainflow histogram blow-up for the 6th floor beam.

117
1st Mode (∑i
i
Nn = 0.06)
All Modes (∑i
i
Nn = 0.75)
Figure 5.22: Rainflow histogram blow-up for the 7th floor column.

118
It is obvious that the cumulative fatigue at the column above, the column below, and
the beam at each joint can contribute directly to the connection damage. Figure 5.23
and 5.24 illustrate the cumulative fatigue values at the column above, the column
below, and the beam at each connection. It can be observed that the 5th, 6th, and 7th
floors have the highest values in figure 5.24. As explained in chapter three, these
floors are the floors the experienced significant connection damage during the
Northridge Earthquake. Figure 5.25 shows the contribution of higher modes to the
cumulative fatigue values and clearly indicate the role of higher modes of vibration
in the observed connection damages.
Figure 5.23: Cumulative fatigue at the column above, the column below and the beam at each floor (all modes).
Cumulative Fatigue at Columns Above, Below, and Beam at Each Floor (All Modes)
0.00
0.10
0.20
0.30
0.40
0.50
0.60
0.70
0.80
9th 8th 7th 6th 5th 4th 3rd 2nd
Cum
ulat
ive
Fatig
ue
Beam (All Modes)Column Below (All Modes)Column Above (All Modes)

119
Figure 5.24: Sum of cumulative fatigue values at the column above, the column below and the beam at each floor (all modes).
Figure 5.25: Sum of cumulative fatigue values at the column above, the column below and the beam at each floor (1st mode vs. all modes).
SUM of Cumulative Fatigue at Columns Above, Below, and Beam at Each Floor
0.00
0.20
0.40
0.60
0.80
1.00
1.20
1.40
1.60
1.80
9th 8th 7th 6th 5th 4th 3rd 2nd
SUM
of C
umul
ativ
e Fa
tigue
Val
ues
1st ModeAll Modes
SUM of Cumulative Fatigue at Columns Above, Below, and Beam at Each Floor (All Modes)
0.00
0.20
0.40
0.60
0.80
1.00
1.20
1.40
1.60
1.80
9th 8th 7th 6th 5th 4th 3rd 2nd
SUM
of C
umul
ativ
e Fa
tigue
Val
ues
Column Above (All Modes)Column Below (All Modes)Beam (All Modes)

120
5.4.2 Two-Story Building
Table 5.3 shows the results of the analysis on the beams of the two-story building. It
can be observed that the cumulative fatigue created by all modes and the cumulative
fatigue created by only the first mode are not significantly different. This comparison
can be clearly seen in figure 5.26. It can be observed that the cumulative fatigue
created at the 2nd floor beam and column of the two story building are high enough to
be considered the cause of the observed damages during the Northridge Earthquake.
Table 5.4 and figure 5.27 confirm the same observations for the columns of the two-
story building. It can be observed in table 5.4 that the cumulative fatigue in the 2nd
floor column is over 1.4 (significantly larger than 1). This observation indicates that
theoretically the fatigue life of the column is over and it justifies the observed crack
in the flange and through the web of this column.
The above observation is different from what was previously seen in the case of the
ten-story building. It is obvious that the cumulative fatigue at the column above, the
column below, and the beam at each joint can contribute directly to the connection
damage. Figure 5.28 illustrates the cumulative fatigue values at the column above,
the column below, and the beam at each connection. It can be observed that the 2nd
floor has a significantly high value in figure 5.28. As explained in chapter three, this
floor is the floor that experienced significant connection damage during the
Northridge Earthquake.

121
Table 5.3: Results of the cumulative fatigue analyses on beams of the two-story building.
Figure 5.26: Cumulative fatigue at beams of the two-story building (1st mode vs. all modes).
Cumulative Fatigue at Beams
0.00
0.02
0.04
0.06
0.08
0.10
0.12
0.14
0.16
0.18
0.20
Roof 2nd Floor
Cum
ulat
ive
Fatig
ue
1st ModeAll Modes
5 ksi 10 ksi 15 ksi 20 ksi 25 ksi 30 ksi 35 ksi 40 ksi 45 ksi 50 ksi 55 ksi 60 ksi3173900 378607.9 109152.2 31991.6 4967.1 1084.3 299.46 98.23 36.75 15.25 6.88 3.33
5 ksi 10 ksi 15 ksi 20 ksi 25 ksi 30 ksi 35 ksi 40 ksi 45 ksi 50 ksi 55 ksi 60 ksi1st Mode 79 9.5 4.5 2.5 3 2 2 1.5 1 1 0.5 0 0.190032nd Mode 336 0 0 0 0 0 0 0 0 0 0 0 0.00011All Modes 78 10.5 4.5 2.5 3 2 2 1.5 1 1 0.5 0 0.190031st Mode 83.5 9.5 2.5 3 4 2 1.5 0.5 0 0 0 0 0.012922nd Mode 336 0 0 0 0 0 0 0 0 0 0 0 0.00011All Modes 101 8.5 4 2.5 4 2 1 1 0 0 0 0 0.01634
SUM(ni/Ni)
2nd
Roof
Ni (Cycles)
Floor Mode ni (Cycles)
BEAM CUMULATIVE FATIGUE ANALYSES RESULTS

122
Table 5.4: Results of the cumulative fatigue analyses on columns of the two-story building.
Figure 5.27: Cumulative fatigue at columns of the two-story building (1st mode vs. all modes).
Cumulative Fatigue at Columns
0.00
0.20
0.40
0.60
0.80
1.00
1.20
1.40
1.60
Roof 2nd Floor
Cum
ulat
ive
Fatig
ue
1st ModeAll Modes
5 ksi 10 ksi 15 ksi 20 ksi 25 ksi 30 ksi 35 ksi 40 ksi 45 ksi 50 ksi 55 ksi 60 ksi3173900 378607.9 109152.2 31991.6 4967.1 1084.3 299.46 98.23 36.75 15.25 6.88 3.33
5 ksi 10 ksi 15 ksi 20 ksi 25 ksi 30 ksi 35 ksi 40 ksi 45 ksi 50 ksi 55 ksi 60 ksi1st Mode 70.5 11.5 5 4 3.5 1 2.5 0.5 1 3 0 4 1.440422nd Mode 336 0 0 0 0 0 0 0 0 0 0 0 0.00011All Modes 75.5 11.5 5 5 2.5 1 2.5 0.5 2 2 0 4 1.401891st Mode 83 8 4.5 2.5 2.5 2 2 1.5 0.5 0 0 0 0.038072nd Mode 336 0 0 0 0 0 0 0 0 0 0 0 0.00011All Modes 99.5 9 4.5 2.5 1.5 3 2 1 1 0 0 0 0.04731
Roof
Mode ni (Cycles) SUM(ni/Ni)
Ni (Cycles)
Floor
2nd
COLUMNS CUMULATIVE FATIGUE ANALYSES RESULTS
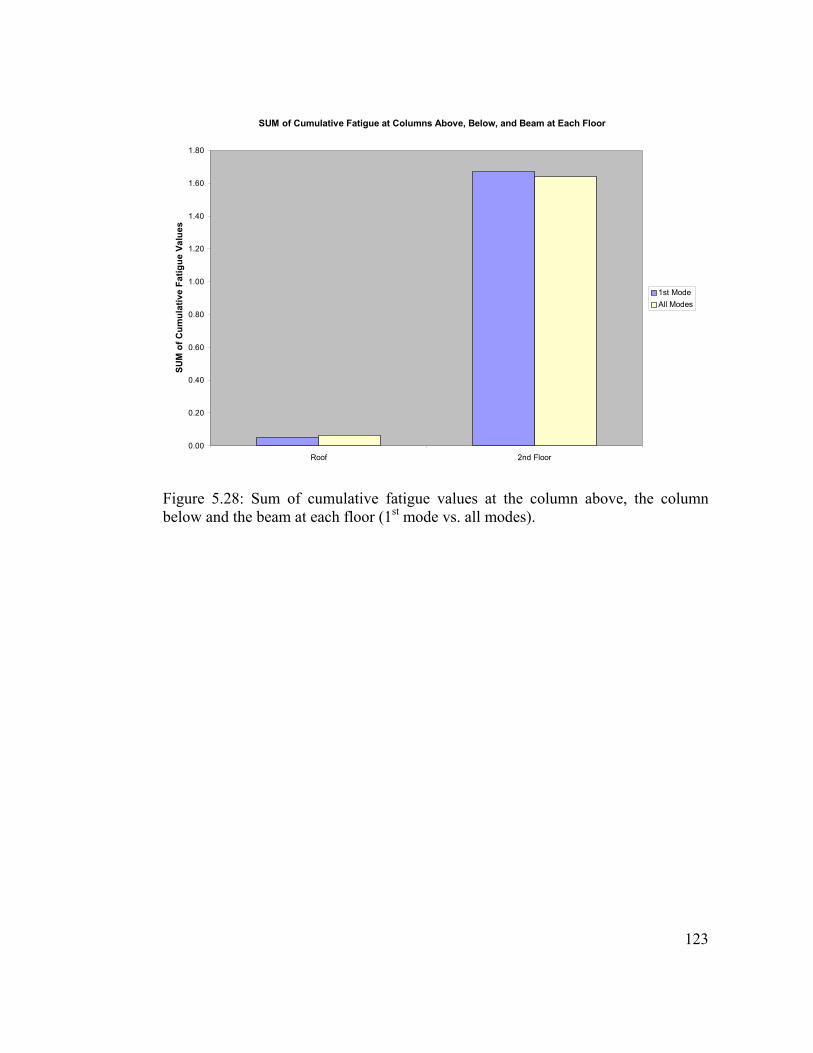
123
Figure 5.28: Sum of cumulative fatigue values at the column above, the column below and the beam at each floor (1st mode vs. all modes).
SUM of Cumulative Fatigue at Columns Above, Below, and Beam at Each Floor
0.00
0.20
0.40
0.60
0.80
1.00
1.20
1.40
1.60
1.80
Roof 2nd Floor
SUM
of C
umul
ativ
e Fa
tigue
Val
ues
1st ModeAll Modes
124
CHAPTER 6: CONCLUSIONS
As described in the previous chapter, the result of the analytical study on the two-
story building indicates that the first mode created a high percentage of cumulative
fatigue in the connections of the investigated frame. However, the study of the ten-
story building clearly shows that the contribution of higher modes of vibration in the
beam and column stress histories significantly increased the cumulative fatigue
relative to that created by the first mode alone. Investigations of the damage pattern
in the investigated ten-story building indicate that the effect of higher modes of
vibration was significant in the connection damage observed after the Northridge
Earthquake.
Figure 6.1 illustrates the damage in the ten-story building. It can be observed that the
cumulative fatigue distribution at the investigated connections match the observed
damage during the Northridge Earthquake. However, the cumulative fatigue created
by the 1st mode only (as shown in figure 6.1) does not appear to match the observed
damage distribution. This observation indicates that the higher mode effects are
significant in this building. The damage indicator used in this comparison for
quantifying the connection damage in the ten-story building shows the number of
damaged locations in the beams on both sides of the joints and columns above and
below the joints at each level in all the moment frames in the investigated direction
(East-West).

125
Figure 6.1: Comparison between cumulative fatigue distribution and observed damage in the ten-story building.
6.1 Conclusions
The general conclusions of this study can be summarized as follows:
1. Comparison between cumulative fatigue analyses of first mode and all modes
clearly indicates that higher mode effects are significant in the ten-story
building.
SUM of Cumulative Fatigue at Column Above, Column Below, and Beam at Each Floor
0.0
0.5
1.0
1.5
2.0
2.5
9th 8th 7th 6th 5th 4th 3rd 2nd
SUM
of C
umul
ativ
e Fa
tigue
Val
ues
-80
-60
-40
-20
0
20
40
Dam
age
Indi
cato
r
1st ModeAll ModesConnection Damage Indicator

126
2. Comparison between the cumulative fatigue caused by the first mode only
and cumulative fatigue caused by all modes of vibration indicates that the
latter is significantly larger at each beam and column in the ten-story
building. This is the result of higher mode effects.
3. In the investigated ten-story building, the contribution of the higher modes of
vibration significantly increases the cumulative fatigue at the end of each
member. This is because of the contribution of higher mode stresses that can
increase the total stress significantly (relative to 1st mode stress only) at each
point in time.
4. In both buildings, low-cycle fatigue is significant at all the investigated
members. As expected, high-cycle fatigue was not important during the
Northridge Earthquake.
5. In both buildings, cumulative fatigue distribution at the investigated beams
and columns matches observed damage during the Northridge Earthquake.
6. Distribution of the sum of cumulative fatigue values at the column above, the
column below, and the beam at each connection matches the distribution of
connection damage indicator introduced earlier in this chapter.

127
7. This study shows that the following wording from the “AISC Steel
Construction Manual” [2], appears to be incorrect:
“Fatigue shall be considered in accordance with Appendix 3, Design for Fatigue, for members and their connections subject to repeated loading. Fatigue need not be considered for seismic effects or for the effects of wind loading on normal building lateral load resisting systems and building enclosure components.”
Fatigue can play a major role in the behavior of structures during seismic
events and needs to be further investigated and carefully considered in the
seismic design of certain structures. The result of the current research
emphasizes that low-cycle fatigue appears to be the cause of connection
fatigue failures in both of the investigated buildings similar to that observed
during the Northridge Earthquake.
8. As described earlier, low damping and vertical irregularity (set-back) are the
characteristics of the investigated ten-story building which contributed to the
results. It appears that other steel buildings having these characteristics might
need some additional analyses.
9. The low damping may be important in the results of this study. One way to
improve this is to include supplemental damping [3].

128
10. Response data does not support the existence of plastic hinges at failure
locations. Recorded data and calculations indicate pre-dominate elastic
response. Hence, fatigue (low-cycle) must be significant in explaining the
overall behavior (damage).
11. The buildings used in this study have experienced only one earthquake. Since
the cumulative fatigue created by past events is remembered by the
connection, it appears that low-cycle fatigue damage will be more significant
for the buildings that have experienced two or more earthquakes in their life.
In other words, the behavior of the building during an earthquake depends on
the fatigue accumulated in the connections from all the past major seismic
events.
6.2 Future Studies
As discussed earlier in this document, the current study tried to establish the link
between existing research on fatigue and fracture mechanics in the area of material
science and apply it to the structural engineering field in general and to beam-column
moment connection applications in particular.

129
The current research tried to use all applicable technical resources and fatigue test
results available at the time of this work. Since the available fatigue tests for the
investigated beam-column connection detail are limited, a probabilistic approach is
not possible. Therefore, the developed S-N curve, and consequently the fatigue
analyses results, are based on the available test data at the time of this study.
Obviously, performing more fatigue tests especially in the low-cycle region and
creating more data points on the S-N curve could be an interesting topic for future
research. Also, further empirical study on the area of the S-N curve that falls
between the low-cycle and high-cycle regions (mid-cycle) could be a major focus of
future studies. In addition, analyzing more instrumented buildings will be useful in
better understanding of the problem.
Furthermore, studying the effect of defects on fatigue life of the connection will be
an interesting topic for future research. The current study was primarily focused on
stresses at the beams and columns. As a result, the effect of principal stresses at the
connection was never investigated. This appears to be an interesting topic for further
research.

130
BIBLIOGRAPHY
1. American Association of State Highway and Transportation Officials (1990).
Guide Specifications for Fatigue Evaluation of Existing Steel Bridges. Washington, D.C.: AASHTO.
2. American Institute of Steel Construction (2006). Steel Construction Manual.
Thirteenth Edition. Chicago, Illinois: AISC.
3. Anderson, J.C., & Bertero, V.V. (1998). Seismic response of a 42-story steel building. The Loma Prieta, California, Earthquake of October 17, 1989, Building Structures. U.S. Geological Survey Professional Paper 1552-C, C113-C139.
4. Anderson, J.C., & Duan, X. (1998, May). Repair/Update procedures for
welded beam to column connections. Pacific Earthquake Engineering Research Center, PEER 98/03.
5. ATC 24 (1992). Guidelines for cyclic seismic testing of components of steel
structures. Applied Technology Council. 6. Barsom, J.M. (2000, May 1). Development of fracture toughness
requirements for weld metals in seismic applications. SAC steel project task 7.1.3.
7. Barsom, J.M., & Rolfe, S.T. (1977). Fracture and fatigue control in
structures: Applications of fracture mechanics. New Jersey: Prentice Hall. 8. Bertero, V.V., & Popov, E. (1965, February). Effect of large alternating
strains of steel beams. Proceedings of the American Society of Civil Engineers, Journal of structural division. 1-12.
9. Dowling, Norman E. (1993). Mechanical behavior of materials: Engineering
methods for deformation, fracture, and fatigue. New Jersey: Prentice Hall. 10. FEMA 267 (1995, August). Interim Guidelines: Evaluation, Repair,
Modification and Design of Welded Steel Moment Frame Structures. 11. FEMA 267A (1997, January). Interim Guidelines Advisory No. 1, Supplement
to FEMA 267. 12. FEMA 274 (1997, October). NEHRP Commentary on the Guidelines for the
Seismic Rehabilitation of Buildings.
131
13. FEMA 350 (2000, July) and Errata (2001, March). Recommended Seismic
Design Criteria for New Steel Moment-Frame Buildings. 14. FEMA 351 (2000, July). Recommended Seismic Evaluation and Upgrade
Criteria for Existing Welded Steel Moment-Frame Buildings. 15. FEMA 352 (2000, July). Recommended Post-Earthquake Evaluation and
Repair Criteria for Welded Steel Moment-Frame Buildings. 16. FEMA 353 (2000, July). Recommended Specifications and Quality
Assurance Guidelines for Steel Moment Frame Construction for Seismic Applications.
17. FEMA 355A (2000). State of the Art Report on Base Metals and Fracture. 18. FEMA 355B (2000). State of the Art Report on Welding and Inspection. 19. FEMA 355D (2000). State of the Art Report on Connection Performance. 20. FEMA 355F (2000). State of the Art Report on Performance Prediction and
Evaluation of Steel Moment-Frame Buildings. 21. Fisher, J.W. (1984). Fatigue and Fracture in Steel Bridges, Case Studies.
John Wiley & Sons, Inc. 22. Fisher, J.W., & Yen, B.T. (1977). Fatigue Strength of Steel Members with
Welded Details. Engineering Journal, American Institute of Steel Construction. Fourth Quarter, 1977.
23. Fisher, J.W., Kulak, G.L., & Smith, I.F.C. (1998, May). A Fatigue Primer for
Structural Engineers. National Steel Bridge Alliance. 24. Irwin, G.R., 1948. Fracture dynamics. In: Jonassen, F., Roop, W.P., Bayless,
R.T. (Eds.), Fracturing of Metals. American Society for Metals, Cleveland, pp. 147–166.
25. Krawinkler, H., Zohrei, M., Lashkari-Irvani, B., Cofie, N.G., & Hadidi-
Tamjed, H. (1983, September). Recommendations for experimental studies on the seismic behavior of steel components and materials. Report No. 61, The John A. Blume Earthquake Engineering Center, Department of Civil Engineering, Stanford University.

132
26. Kuwamura, H., & Suzuki, T. (1992). Low-Cycle fatigue resistance of welded joints of high-strength steel under earthquake loading. Proceedings of the Tenth World Conference on Earthquake Engineering. 19-24 July 1992, Madrid, Spain, 2851-2856.
27. Maranian, P., Metzger, A., & Stovner, E. (have not yet been published at the
time this dissertation was written). Considerations on reducing brittle and fatigue failures in steel structures (Draft Version). Technical Council on Forensic Engineering of the American Society of Civil Engineers.
28. Orowan, E., 1945. Notch brittleness and the strength of metals. Proceedings
of the Society of Engineers and Shipbuilders, Paper No. 1063, Scotland. 29. Owens, G.W., & Knowles, P.R. (Editors). Steel Designers’ Manual. Fifth
Edition. The Steel Construction Institute. Blackwell Science. 30. Partridge, J.E., Allen, J., & Richard, R.M. (2002). Failure analysis of
structural steel connections in the Northridge and Loma Preita, California earthquakes.
31. Partridge, J.E., Paterson, S.R., & Richard, R.M. (2000). Low cycle fatigue
tests and fracture analyses of bolted-welded seismic moment frame connections. STESSA 2000, Third International Conference. August 21-24, 2000, Montreal, Canada.
32. Partridge, J.E., Paterson, S.R., & Richard, R.M. (2003). ATC-24 cumulative
damage tests and fracture analyses of bolted-welded seismic moment frame connections. Proceedings of the Third Congress, Oct. 19-21, 2003, San Diego, CA. Technical Council on Forensic Engineering of the American Society of Civil Engineers. 142-157.
33. Popov, E.P., & Pinkney, R.B. (1969, March). Cyclic yield reversal in steel
building connections. Proceedings of the American Society of Civil Engineers, Journal of structural division. 327-353.
34. Richard, R.M., Allen, J., & Partridge, J.E. (2001). Accumulated seismic
connection damage based upon low cycle fatigue connection tests. Proceedings of SEAOC 2001 70th Annual Convention.
35. Richard, R.M., Partridge, J.E., & Allen, J. Low cycle fatigue and seismic
performance of steel connections.

133
36. Richard, R.M., Partridge, J.E., Allen, J., & Radau, S. (1995, October). Finite element analysis and tests of beam-to-column connections. Modern Steel Construction. 44-47.
37. Ricles, J.M., Mao, C., Lu, L.W., & Fisher, J.W. (2000, August). Development
and evaluation of improved details for ductile welded unreinforced flange connections. Final report, SAC Task 7.05. ATLSS Report No. 00-04.
38. SEAOC Seismology Committee, FEMA 350 Task Group (2002, January).
Commentary and recommendations on FEMA 350. 39. Ts’ao, H.S., & Werner, S.D. (1975, May). Determination of Equivalent
Response Cycles for Use in Earthquake-Induced Fatigue Analyses. Technical Information Center, Energy Research and Development Administration. El Segundo, California: Agbabian Associates.

134
APPENDIX A: TEN-STORY BUILDING DRAWINGS
a. 2nd floor framing plan.
Figure A.1: Ten-story building framing plans. [Brandow and Johnston, Inc. drawings]

135
b. 3rd floor framing plan.
Figure A.1, Continued: Ten-story building framing plans.
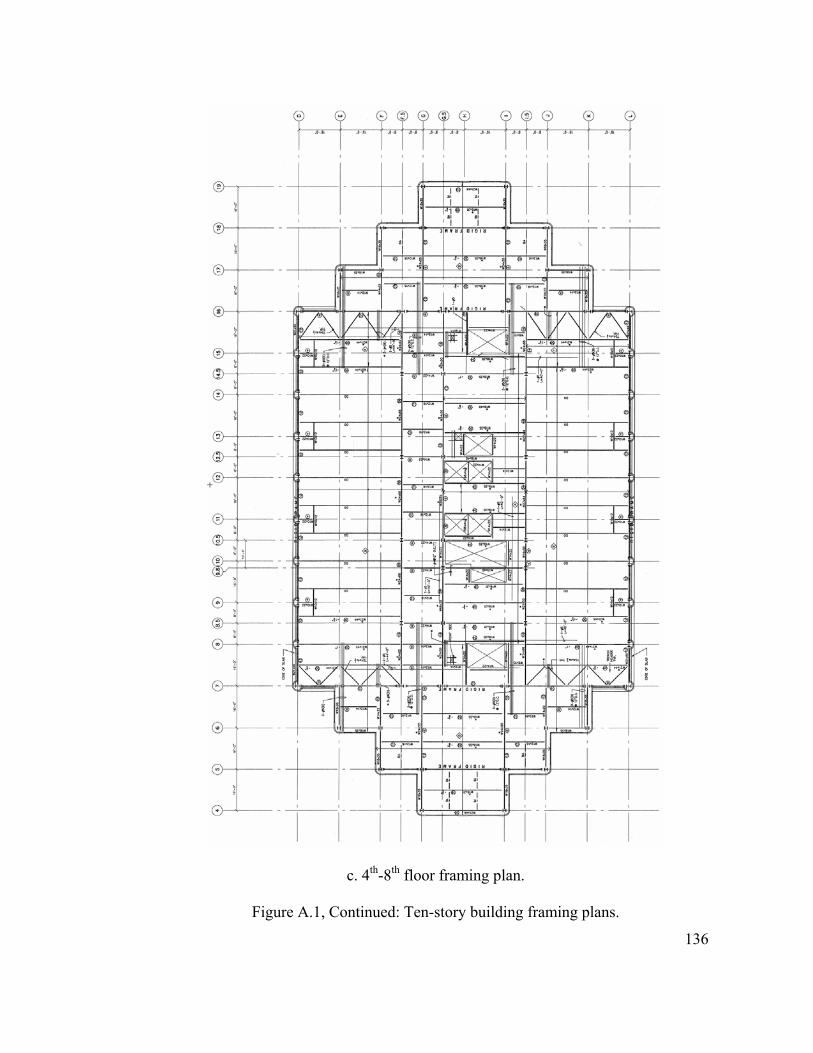
136
c. 4th-8th floor framing plan.
Figure A.1, Continued: Ten-story building framing plans.

137
d. 9th floor framing plan.
Figure A.1, Continued: Ten-story building framing plans.
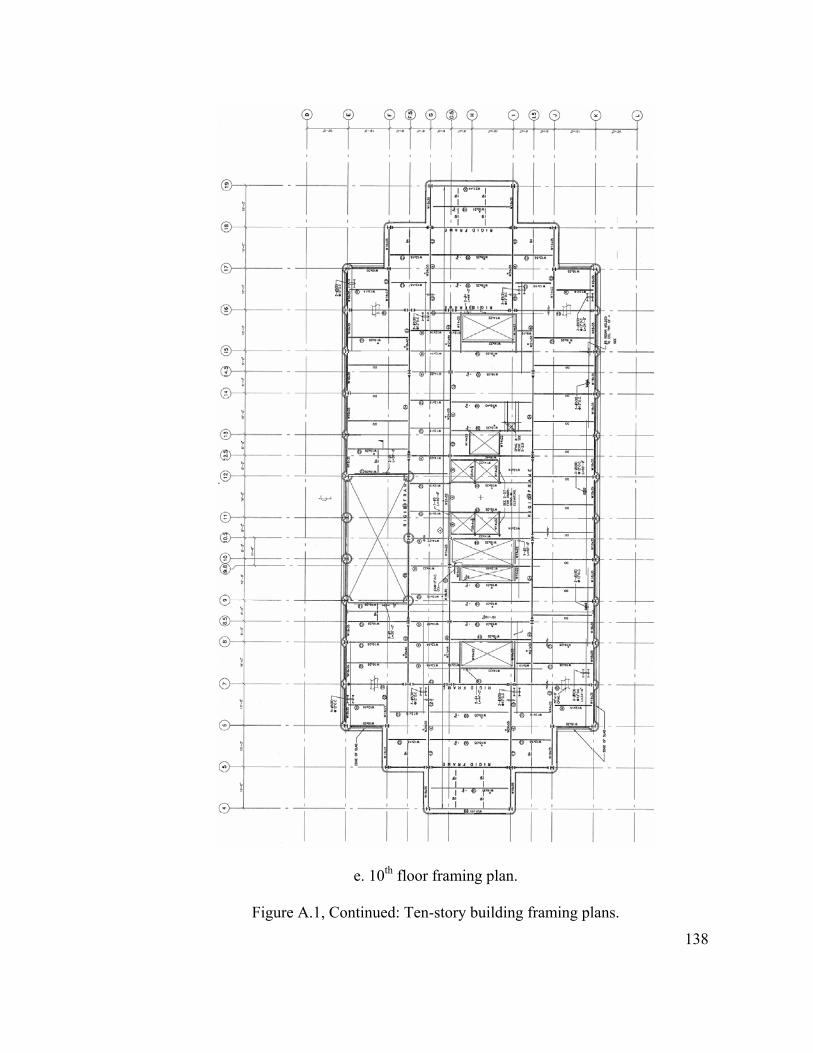
138
e. 10th floor framing plan.
Figure A.1, Continued: Ten-story building framing plans.

139
f. Penthouse framing plan.
Figure A.1, Continued: Ten-story building framing plans.
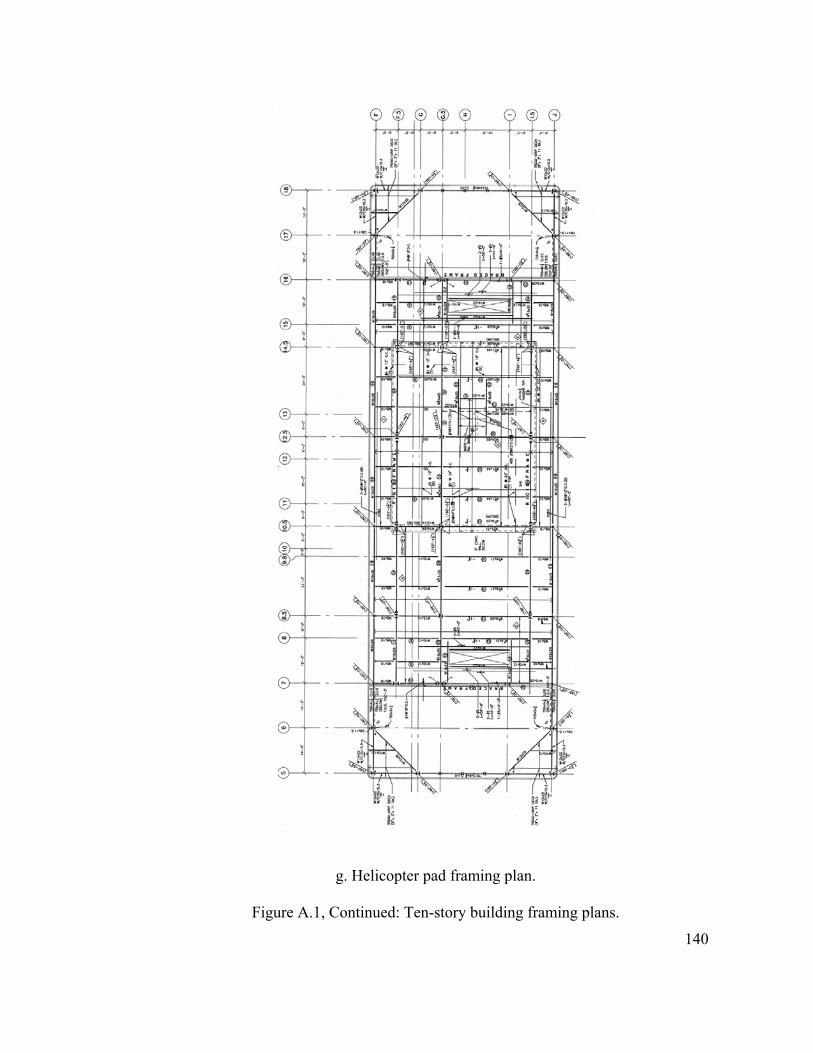
140
g. Helicopter pad framing plan.
Figure A.1, Continued: Ten-story building framing plans.

141
Figure A.2: Ten-story building frame elevations. [Brandow and Johnston, Inc. drawings]

142
Figure A.2, Continued: Ten-story building frame elevations.

143
Figure A.2, Continued: Ten-story building frame elevations.

144
Figure A.2, Continued: Ten-story building frame elevations.
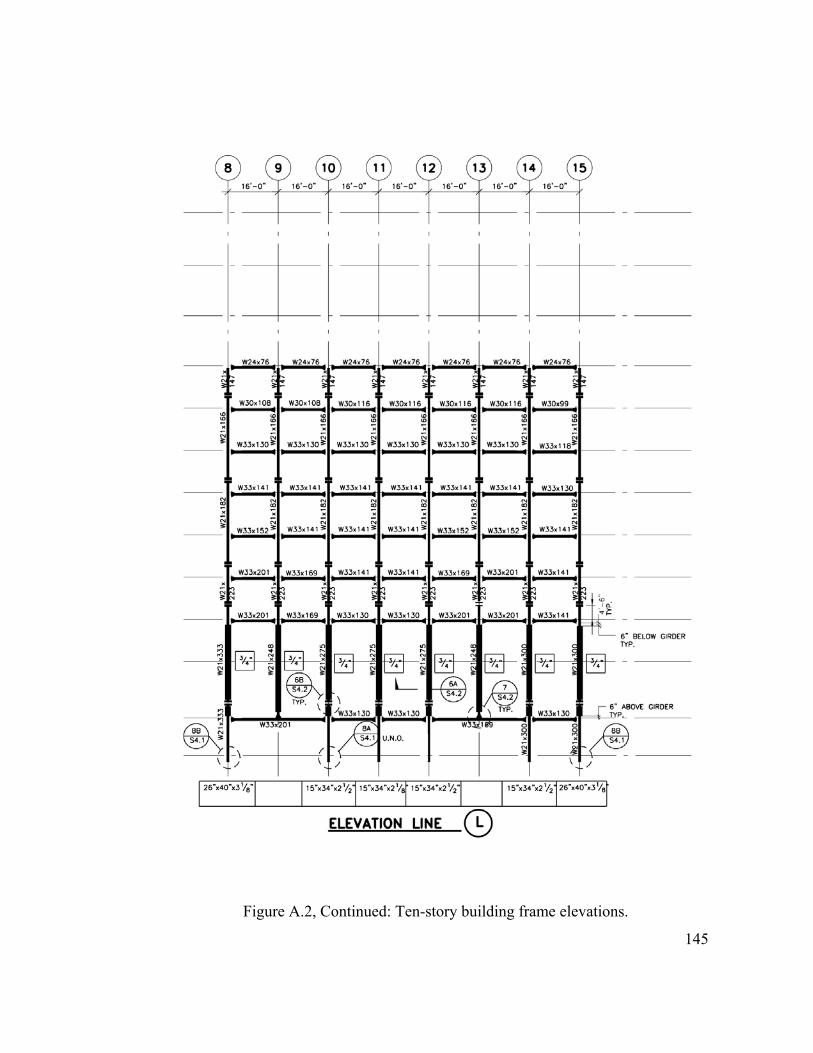
145
Figure A.2, Continued: Ten-story building frame elevations.

146
Figure A.2, Continued: Ten-story building frame elevations.

147
Figure A.2, Continued: Ten-story building frame elevations.

148
Figure A.2, Continued: Ten-story building frame elevations.

149
APPENDIX B: TWO-STORY BUILDING DRAWINGS
a. 2nd floor framing plan.
Figure B.1: Two-story building framing plans. [Brandow and Johnston, Inc. drawings]

150
b. Roof framing plan
Figure B.1, Continued: Two-story building framing plans.

151
Figure B.2: Two-story building frame elevations. [Brandow and Johnston, Inc. drawings]

152
Figure B.2, Continued: Two-story building frame elevations.

153
Figure B.2, Continued: Two-story building frame elevations.