Embed Size (px)
Citation preview

THE EFFECT OF HYPERSTIMULATION ON VASCULAR
ENDOTHELIAL GROWTH FACTOR (VEGF) AND
CYCLOOXYGENASE 2 (COX2) IN THE RAT UTERUS IN EARLY
PREGNANCY
�
�
Mirjana Štrkalj
A dissertation submitted to the Faculty of Health Sciences, University of the
Witwatersrand, in fulfillment of the requirements for the Degree
of
Master of Science (Medicine)

I
DECLARATION I, Mirjana Strkalj declare that this dissertation is my own work. It is being submitted for
the Degree of Masters of Science in Medicine in the University of the Witwatersrand,
Johannesburg. It has not been submitted before for any degree or examination in this or
any other University.
…………………………………………….. ……… day of ………………………… 2007.

II
Dedicated to:
My sons, Petar and Aleksandar
for giving me the strength and courage in everything I do

III
PUBLICATIONS AND PRESENTATIONS ARISING FROM THIS STUDY
Strkalj M. & Kramer B. 2006. Immunolocalization of cyclooxygenase 2 (COX2) in the
hyperstimulated rat uterus. Clinical Anatomy 19:738. (abstract)
Strkalj M. & Kramer B. 2006. Immunolocalization of cyclooxygenase 2 (COX2) in the
hyperstimulated rat uterus. Presented at the annual congress of the Anatomical Society of
Southern Africa (ASSA) in April 2006 and Health Science Research Day in August 2006.

IV
ABSTRACT
Vascular permeability and angiogenesis are crucial events in the rodent and human uterus
in early pregnancy and are regulated by vascular endothelial growth factor (VEGF) and
prostaglandins liberated from arachidonic acid by cyclooxygenase 2 (COX2). These
events coincide with the typical morphological features of the receptive uterus and are
regulated by synchronized release of ovarian hormones (oestrogen and progesterone).
However, administration of follicle stimulating hormone (FSH) and human chorionic
gonadotropin (hCG), commonly used in assisted reproduction, affect the synchrony of the
hormonal milieu, particularly by increasing oestrogen levels. This causes detrimental
changes to the uterine morphology and affects vascular permeability at the site of
implantation. In the present study, the expression of COX2 and VEGF was compared
between control and hyperstimulated rat uteri during the peri-implantation period using
immunohistochemistry and Western blot analysis.
While in control pregnant rats COX2 and VEGF immunolocalization occurred in the
luminal epithelial cells and stroma on consecutive days, strong immunolocalization of
COX2 and VEGF occurred in the luminal epithelial cells but was inhibited in the stroma
of the hyperstimulated rats. This appears to have resulted in the suppression of stromal
decidualization and vascular permeability. Western blot analysis did not show any
results. This may be due to low concentrations of the protein in the sample. Since
vascular permeability and angiogenesis are critical to the process of implantation and are
influenced by VEGF and COX2, disturbance of the pattern of these two proteins by
hyperstimulation may contribute to the low implantation rate in IVF programes.

V
A NOTE ON THE BLOOD COLLECTION AND
ANALYSIS OF BLOOD
The blood from the 36 animals used in this study was jointly collected by Mrs. A.
Jovanovic, Embryonic Differentiation and Development Research Programme, School of
Anatomical Sciences, and myself. Mrs. A. Jovanovic performed the Elisa test on half of
the animals (n=18) and I performed the test on the other half of the animals (n=18).
Analysis of the data obtained from the Elisa was carried out independently by Mrs. A.
Jovanovic and myself.

VI
AKNOWLEDGEMENTS
The completion of this thesis would not have been possible without the help of certain
people to whom I am indebted.
Prof. Beverley Kramer, my supervisor, provided guidance, invaluable advice and
constant support.
Prof. J. C. Allan and Mr J. Hemingway advised me on statistical procedures.
Mrs H. Ali assisted with the ICC.
Mrs S. Rogers gave me invaluable technical assistance and helped with photography.
Miss T. Dix Peek provided valuable suggestions on Western blotting.
Mrs A. Jovanovic was supportive through the good and the bad days.
Finally, I thank my family for their support and understanding during difficult times.

VII
CONTENTS PAGE
DECLARATION . . . . . . . . . . . . . . . . . . . . . . . . . . . . . . . . . . . . . i
DEDICATION . . . . . . . . . . . . . . . . . . . . . . . . . . . . . . . . . . . . . . ii
PUBLICATIONS AND PRESENTATIONS ARISING
FROM THIS STUDY . . . . . . . . . . . . . . . . . . . . . . . . . . . . . . . . . . . iii
ABSTRACT ………………………………………………………. iv
A NOTE ON THE BLOOD COLLECTION AND
ANALYSIS OF BLOOD…………………………………………… v
ACKNOWLEDGEMENTS . . . . . . . . . . . . . . . . . . . . . . . . . . . . . . . vi
LIST OF CONTENTS ……………………………………………. vii
LIST OF FIGURES . . . . . . . . . . . . . . . . . . . . . . . . . . . . . . . . . . . . . xi
LIST OF TABLES . . . . . . . . . . . . . . . . . . . . . . . . . . . . . . . . . . . . . xvii 1.0 INTRODUCTION . . . . . . . . . . . . . . . . . . . . . . . . . . . . . . . . . . . 1 1.1 Controlled ovarian stimulation………………………………. 1
1.2 Effect of hyperstimulation on the uterus ……………………. 3
1.3 Effect of exogenous hormones on embryo quality ………….. 7
1.4 The expression of implantation related genes………………… 8
1.5 Vascular permeability and angiogenesis……………………… 10
1.5.1 Vascular endothelial growth factor (VEGF) ……………. 12
1.5.2 Cyclooxygenase2 (COX2)………………………………….. 17

VIII
1.6 Aim of the study ……………………………………………. 19 2.0 MATERIALS AND METHODS . . . . . . . . . . . . . . . . . . . . . . . 20 2.1 Animals ……………………………………………………….. 20
2.2 Progesterone and oestradiol ELISA ………………………... 23
2.3 Histology ………………………………………………………… 24
2.4 Immunohistochemistry ………………………………………… 24
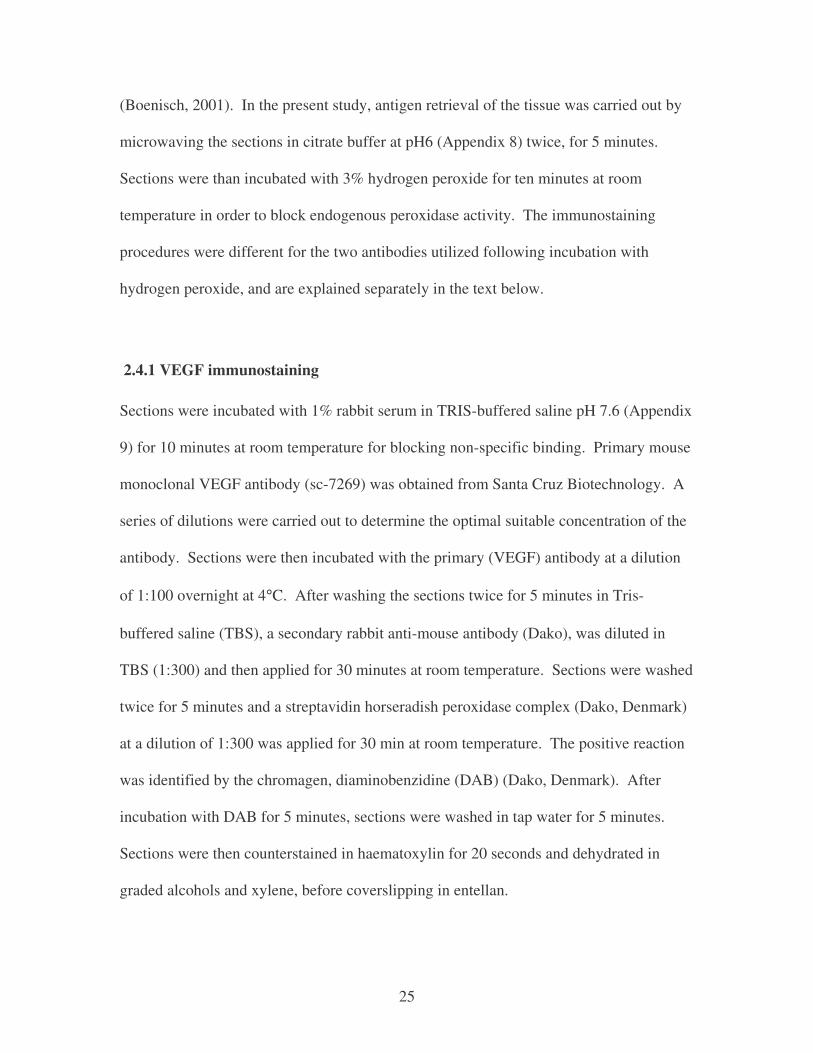
2.4.1 VEGF immunostaining ………………………………………… 25
2.4.2 COX2 immunostaining ………………………………………… 26
2.4.3 Controls for immunohistochemistry …………………………. 27
2.5 Protein extraction ………………………………………………….. 27
2.6 Lowry protein assay ………………………………………….. 28
2.7 Electrophoresis ………………………………………………….. 30
2.8 Western blot ………………………………………………….. 31
3.0. RESULTS . . . . . . . . . . . . . . . . . . . . . . . . . . . . . . . . . . . . . . . . . . . 33
3.1 Oestradiol ELISA…………………………………………………. 33
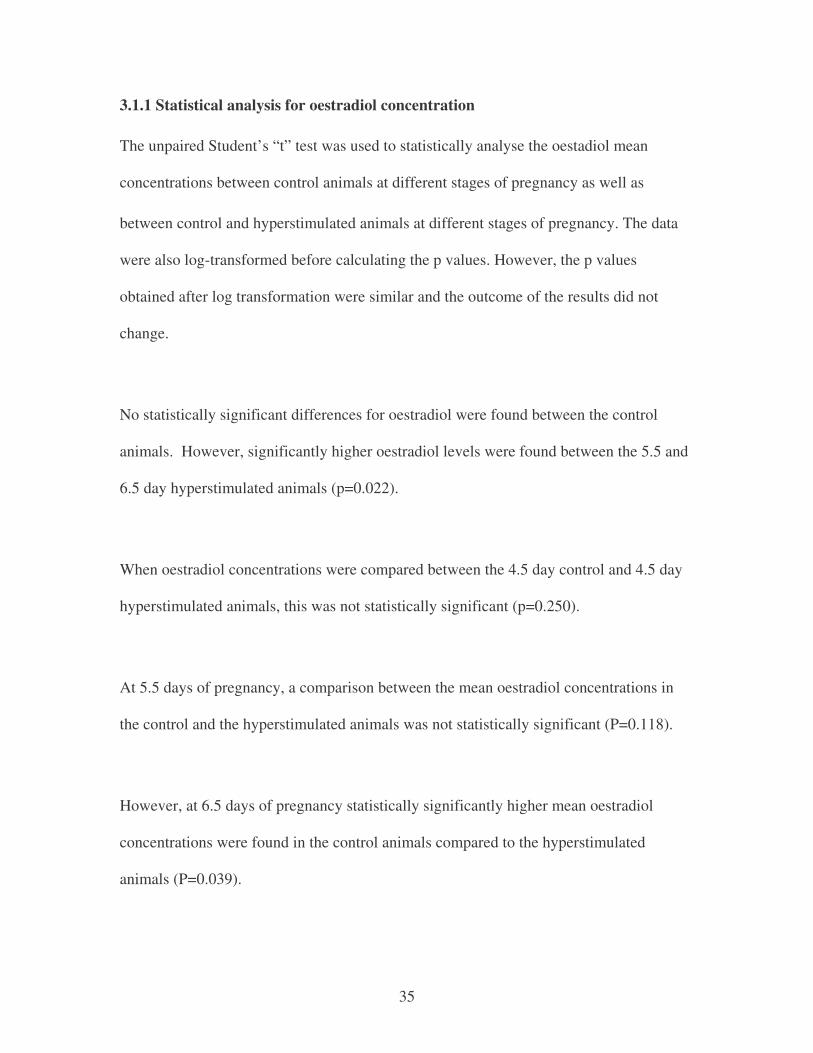
3.1.1 Statistical analysis for Oestradiol concentration………………… 35
3.2 Progesterone ELISA………………………………………………. 37
3.2.1 Statistical analysis for Progesterone concentration …………….. 39
3.3 Non-parametric Mann-Whitney test………………………………. 41
3.4 Progesterone:Oestradiol (P:E2) ratio………………………………. 42
3.5 General observation………………………………………………… 45
3.6 Histology …………………………………………………….. 46

IX
3.7 Immunohistochemistry…………………………………………. 50
3.7.1 Controls for COX2 immunohistochemistry…………………… 50
3.7.2 Immunolocalisation of COX2 in the control and hyperstimulated
animals at 4.5, 5.5 and 6.5 days of pregnancy………………… 51
3.8.1 Controls for VEGF imunohistochemistry……………………… 54
3.8.2 Immunolocalization of VEGF in the control and hyperstimulated
animals at 4.5, 5.5 and 6.5 days of pregnancy……………. 55
3.9 Summary of COX2 and VEGF immunolocalization in the control
and hyperstimulated animals at 4.5; 5.5 and 6.5 days
of pregnancy………………………………………… 58
3.10 Western blot analysis for VEGF and COX2…………………….. 61
4.0 DISCUSSION . . . . . . . . . . . . . . . . . . . . . . . . . . . . . . . . . . . . . . 98
4.1 Gross morphological changes in the uterus caused by
exogenous hormones…………………………………… 98
4.2 Oestradiol and progesterone concentrations and P:E2 ratio
in the control and hyperstimulated animals during the
peri-implantation period 100
4.3 Uterine receptivity and embryo implantation
in the control and hyperstimulated animals 103
4.5 COX2 and VEGF expression in the control and
X
hyperstimulated rat uterus………………………… 111
4.5.1 COX2 Immunolocalization in the control and
hyperstimulated rat uterus………………………. 112
4.5.2 VEGF Immunolocalization in the control and
hyperstimulated rat uterus………………………. 118
5.0 CONCLUSION ………………………………………………… 124 REFFERENCES ………………………………………………….. 125 APPENDIX ………………………………………………….. 141

XI
LIST OF FIGURES
Figure 1 Schematic illustration of five different VEGF isoforms
(Krussel et al. 2003)………………………………………..... 13
Figure 2 Schematic illustrations of VEGF receptors and their interaction
with different growth factors. (Krussel et al. 2003)…………. 14
Figure 3 Standard curve for Bovine Serum Albumin (BSA) at known
concentrations in �g/ml at an absorbance of 690 nm ……….. 29
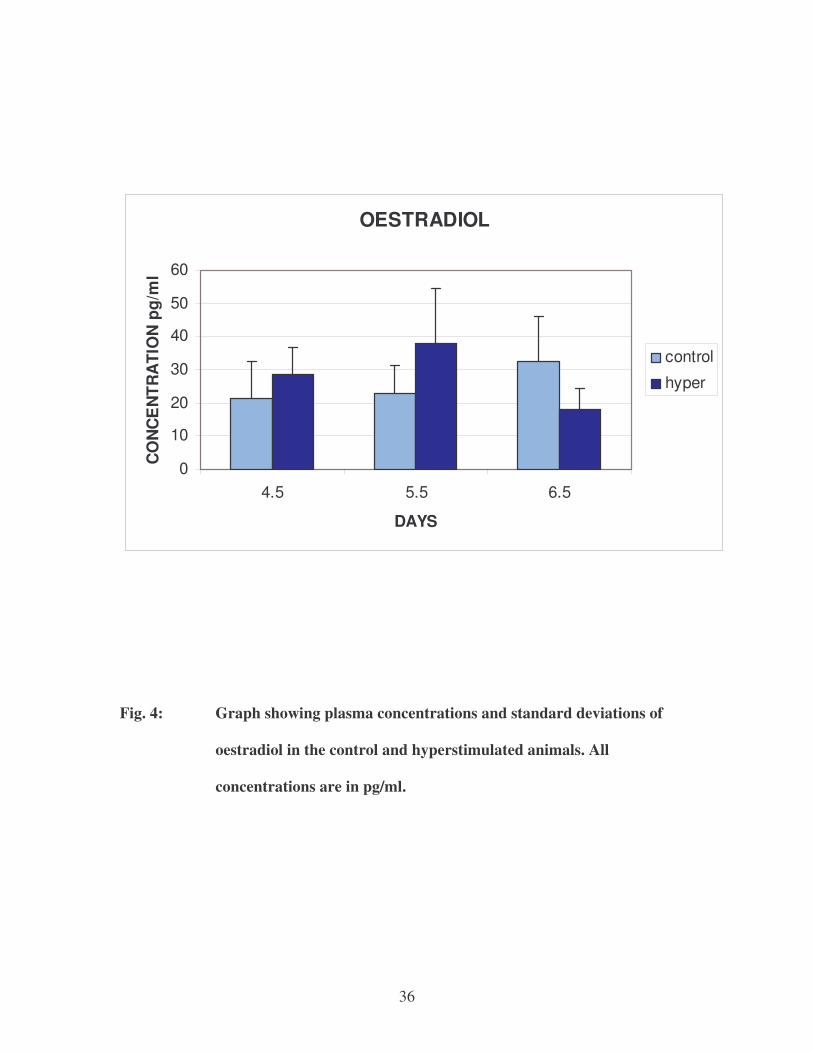
Figure 4 Graph showing plasma concentrations and standard deviations of
oestradiol in the control and hyperstimulated animals………. 36
Figure 5 Graph showing plasma concentrations and standard deviations
of progesterone in the control and hyperstimulated animals….. 40
Figure 6 Progesterone – Oestradiol ratio (P:E2) in the control and
hyperstimulated rats at 4.5, 5.5 and 6.5 days of pregnancy……. 44
Figure 7 Representative photomicrograph of dissected uterine horns
of 5.5 control animal showing blue bands (implantation sites)
Pontamine blue………………………………………………. 63
Figure 8 Representative photomicrograph of dissected uterine horns
of 5.5 hyperstimulated animal showing dilated uterine horns and
large polycystic ovaries. Pontamine blue……………………. 63
Figure 9 Representative histological section of 4.5 day control ovarian
tissue with numerous well developed corpora lutea.

XII
Haematoxylin and eosin x10………………………………. 65
Figure 10 Representative histological section of 5.5 day hyperstimulated
ovarian tissue showing numerous large follicles and numerous
small corpora lutea. Haematoxylin and eosin x10……………. 65
Figure 11 Representative histological section of 4.5 day control uterine
tissue. Haematoxylin and eosin x10………………………… 67
Figure 12 Higher magnification of uterine tissue seen in Fig. 8 with
the implanting embryo. Haematoxylin and eosin x40……… 67
Figure 13 Representative histological section of 4.5 control uterine
tissue. Haematoxylin and eosin x40……………………... 67
Figure 14 Representative histological section of 4.5 day hyperstimulated
uterine tissue. Haematoxylin and eosin x10…………………… 69
Figure 15 Representative histological section of 4.5 day hyperstimulated
uterine tissue. Haematoxylin and eosin x40………………….. 69
Figure 16 Representative histological section of 4.5 day hyperstimulated
uterine tissue. Haematoxylin and eosin x40………………….. 69
Figure 17 Representative histological section of 5.5 day control uterine
Tissue. Haematoxylin and eosin x10…………………………. 71
Figure 18 Representative histological section of 5.5 day pregnant uterine
tissue Haematoxylin and eosin x40………………………….. 71
Figure 19 Representative histological section of 5.5 day hyperstimulated

XIII
uterine tissue. Haematoxylin and eosin x10…………………… 73
Figure 20 Representative histological section of 5.5 day hyperstimulated
uterine tissue Haematoxylin and eosin x40……………………. 73
Figure 21 Representative histological section of 6.5 day control uterine
tissue. Haematoxylin and eosin x10……………………………. 75
Figure 22 Representative histological section of 6.5 day pregnant uterine
tissue. Haematoxylin and eosin x40………………………….. 75
Figure 23 Representative histological section of 6.5 days hyperstimulated
uterine tissue Haematoxylin and eosin x10……………………. 77
Figure 24 Representative histological section of 6.5 day hyperstimulated
uterine tissue. Haematoxylin and eosin x40………………….. 77
Figure 25 Representative histological section of lung carcinoma tissue
incubated with COX2 antibody showing immunolocalization
in the cytoplasm of the tumorous cells. Counterstained with
haematoxylin x40………………………………………………. 79
Figure 26 Representative histological section of 6.5 day hyperstimulated
uterine tissue incubated with COX2 antibody. Counterstained with
haematoxylin x40……………………………………………… 79
Figure 27a Representative histological section adjacent to the section
showing immunolocalization of 6.5 day hyperstimulated
uterine tissue where the primary COX2 antibody was

XIV
replaced with TRIS Counterstained with haematoxylin x40….. 79
Figure 27b Representative histological section adjacent to the section
showing immunolocalization of 6.5 day hyperstimulated
uterine tissue where the secondary antibody was replaced
with TRIS. Counterstained with haematoxylin x40…………… 79
Figure 28 Representative histological section of the uterus of 4.5 day
control animal showing immunolocalisation of COX2.
Counterstained with haematoxylin x40………………………. 81
Figure 29 Representative histological section of the uterus in 4.5 day
hyperstimulated animal showing COX2 immunolocalization
Counterstained with haematoxylin x40……………………….. 81
Figure 30 Representative histological section of the uterus in a 5.5 day
control animal showing immunolocalisation of COX2
Counterstained with haematoxylin x40……………………….. 81
Figure 31 Representative histological section of the uterus of 5.5 day
hyperstimulated animal Counterstained with haematoxylin x40.. 81
Figure 32 Representative histological section of the uterus in 6.5 day
control animal Counterstained with haematoxylin x40………… 85
Figure 33 Representative histological section of the uterus in 6.5 day
hyperstimulated animal showing COX2 immunolocalization.
Counterstained with haematoxylin x40……………………. 85

XV
Figure 34 Representative histological section of breast carcinoma tissue
showing immunolocalization of VEGF in the cytoplasm
of the tumour cells. Counterstained with haematoxylin x40…… 87
Figure 35 Representative histological section of 6.5 day pregnant
uterine tissue showing VEGF immunolocalization in the
cytoplasm of the luminal epithelial cells and stromal cells.
Counterstained with haematoxylin x40…………………………. 87
Figure 36a Representative histological section of 6.5 day pregnant
uterine tissue adjacent to section in Fig. 32, where the primary
VEGF antibody was replaced with TRIS. Counterstained with
haematoxylin x40……………………………………………….. 87
Figure 36b Representative histological section of 6.5 day pregnant
uterine tissue adjacent to the section in Fig. 32, where the
secondary antibody was replaced with TRIS. Counterstained
with haematoxylin x40………………………………………… 87
Figure 37 Representative histological section of the uterus of 4.5 day
control animal showing immunolocalisation of VEGF.
Counterstained with haematoxylin x40……………………….. 89
Figure 38 Representative histological section of the uterus of 4.5 day
hyperstimulated animal showing immunolocalization of VEGF.
Counterstained with haematoxylin x40……………………… 89

XVI
Figure 39 Representative histological section of the uterus of 5.5 day
control animal showing immunolocalisation of VEGF.
Counterstained with haematoxylin x40……………………… 91
Figure 40 Representative histological section of the uterus of 5.5 day
hyperstimulated animal showing immunolocalization of VEGF.
Counterstained with haematoxylin x40………………………. 91
Figure 41 Representative histological section of the uterus of 6.5 day
pregnant animal showing VEGF immunolocalization
Counterstained with haematoxylin x10……………………… 93
Figure 42 Representative histological section of uterus of 6.5 day
control animal showing VEGF localization.
Counterstained with haematoxylin x40…………………….. 93
Figure 43 Representative histological section of the uterus of 6.5 day
hyperstimulated animal showing VEGF immunolocalization
Counterstained with haematoxylin x40……………………… 95
Figure 44 Representative gel after the protein separation stained with
Commasie stain in the different groups of animals…………. 96
Figure 45 Nitrocellulose membrane after Western blotting, representing
expression of VEGF protein in the rat uterus………………… 97

XVII
LIST OF TABLES
Table 3.1 Summary statistical oestradiol concentrations in the
control animals………………………………………………. 34
Table 3.2 Summary statistical oestradiol concentrations in the
hyperstimulated animals……………………………………… 34
Table 3.3 Summary statistical progesterone concentrations in the
control animals………………………………………………. 38
Table 3.4 Summary statistical progesterone concentrations in the
hyperstimulated animals…………………………………….. 38
Table 3.5 Summary of P:E2 ratio of the control and hyperstimulated
animals………………………………………………………. 42
Table 3.6 Summary of statistical analysis for P:E2 ratio……………….. 43 APPENDIX
Appendix 1 The Schorr Staining…………………………………. 141
Appendix 2 Oestrous cycle diagram……………………………… 142
Appendix 3 Phosphate buffered saline pH 7.6…………………… 143
Appendix 4 10% Neutral buffered formalin……………………… 143
Appendix 5 Raw data for oestrogen and progesterone…………… 144
Appendix 6 Silane dipped slides…………………………………. 145
Appendix 7 Haematoxylin and eosin stain
(Mayer’s Staining Technique)……………………. 146

XVIII
Appendix 8 Citrate buffer pH 6 ……………………………….. 147
Appendix 9 TRIS buffered saline pH 7, 6…………………….. 147
Appendix 10 Homogenizing buffer stock ……………………… 147
Appendix 11 Reagent A for Lowry protein assay ……………… 148
Appendix 12 Reagent B for Lowry protein assay ……………… 149
Appendix 13 Raw data for the protein extracts ………………… 150
Appendix 14 12% SDS- polyacrylamide separating gel ……….. 151
Appendix 15 Electrophoresis Tank Buffer ……………………… 151
Appendix 16 Sample transferring buffer pH 6.8 ………………… 151
Appendix 17 Towbin buffer ……………………………………... 152
Appendix 18 Commassie Blue Staining Solution ……………….. 152
Appendix 19 Distaining Solution 1 and 2 ……………………….. 152

1
1.0 INTRODUCTION
Approximately 35 to 70 million couples worldwide face the problem of infertility
(Schultz and Williams, 2002). Infertility is defined as an inability to conceive an
intrauterine pregnancy after a year of sexual intercourse without contraception. A
number of causes in both partners can lead to infertility. Some of these are ovulatory
problems, fallopian tube blockage, endometriosis, decreased sperm count or motility, or
abnormal sperm morphology. The majority of these causes can be successfully treated,
but some remain unexplained (Tabibzadeh, 1998).
In 1978 the first “test tube baby” was born as a result of the in vitro fertilisation (IVF)
and embryo transfer (ET) technique (Edwards et al., 1980). It thus seemed that it was
possible to resolve the infertility problem. While ongoing research helped to understand
the complex process of fertilization, blastocyst stages, differentiation of the uterus to the
receptive stage and attachment and implantation of the blastocyst, the use of the IVF and
ET techniques did not increase implantation rates markedly, despite the improvement in
selection and transfer of healthy embryos (Psychoyos & Martel, 1985; Sterzik et al.,
1988; Duc-Goiran et al., 1999; Ma et al., 2003).
1.1 Controlled ovarian stimulation
Discovery of the endocrine hypophyseal-gonadal axis early in the 20th century and
purification of two separate gonadotropic hormones, FSH and LH, opened an era of
ovarian stimulation (Macklon et al., 2006). Over the last 25 years of controlled ovarian

2
stimulation (COS)/hyperstimulation used in IVF and ET techniques, various protocols
were introduced in order to induce growth of multiple antral follicles (superovulation)
and thus obtain many oocytes for IVF and ET (Macklon et al., 2006). Increased numbers
of oocytes are required in order to ensure transfer of sufficient numbers of blastocysts to
the mother in order to ensure implantation of at least one blastocyst.
One of the commonly used superovulatory drugs is clomiphene citrate (CC). CC has few
long term side effects and is simple to use (Edwards et al., 1996; Macklon et al., 2006).
Despite successful superovulation in CC-treated patients, implantation rates are very low
(Macklon et al., 2006). It has been shown that CC affects normal uterine histology and
ultrastructure, which in turn affects uterine receptivity (Hosie and Murphy, 1992; Hosie
and Murphy, 1995).
Pregnancy rates in patients treated with CC alone are lower, compared with pregnancy
rates in patients treated with gonadotropins (Macklon et al., 2006). Gonadotropins are
thus still widely and most commonly used in IVF and ET techniques (Edwards et al.,
1996; Macklon et al., 2006). Successful implantation rates depend on the type of ovarian
stimulation used (Sterzik et al., 1988) where doses of gonadotropins used are adjusted
according to individual ovarian response (Macklon et al., 2006). Even so, use of
exogenous hormones in these techniques is implicated in the low implantation rates. In
addition, the low percentage of successful pregnancies after IVF and ET, commonly
result in multiple pregnancies. This creates another set of problems, often causing

3
maternal and neonatal complications, as well as increased cost in delivery and neonatal
care (Edwards et al., 1996; Krussel et al., 2003).
1.2 Effect of hyperstimulation on the uterus
As medico-legal and ethical problems restrict researchers from carrying out research on
the human uterus, a rodent model is most often used for experimental studies. The
previous studies in rodents showed that the use of exogenous hormones, superimposed on
the normal hormonal milieu, induces a rise in oestrogen and progesterone levels and
affects the progesterone:oestradiol ratio (Gidley-Baird et. al., 1986; Kramer et al., 1990)
during the peri-implantation period. Since an increase in oestrogen levels alters gross
morphological and histological appearance of the uterus (Gidley-Baird et al., 1986;
Kramer et al., 1990; Stein et al., 1993; Simon et al., 1995.), as well as the expression of
implantation related genes (Ma et al., 2003), events in normal pregnancy need to be
understood in order to explain changes that may occur during application of IVF
techniques.
In mammals, implantation is a dynamic process where the blastocyst comes into close
physical and physiological contact with the receptive uterus (Enders and Schlafke, 1967;
Tranguch et al., 2005). Successful attachment and implantation of the blastocyst is
governed by synchrony between the receptive uterus and the blastocyst and is related to
exquisite hormonal control. During the oestrous cycle in mammals, the uterus is in the
refractory stage for most of the time (Psychoyos, 1973). Under the influence of the
steroid hormones, oestrogen and progesterone, the uterus undergoes a series of changes
that lead to its receptivity. The receptive stage, also known as the ”window” of

4
implantation, is a limited period of time during which the uterus supports blastocyst
attachment and implantation (Psychoyos, 1973; Paria et al., 1993; Ma et al., 2003). It has
also been shown that the duration of the “window” of uterine receptivity is dependent on
oestrogen levels in mice (Ma et al., 2003). Lower oestrogen levels maintain the
“window” of implantation open for a longer period of time, while it closes rapidly at
higher levels (Ma et al., 2003). In mice, the uterus becomes receptive on day 4 of
pregnancy and proceeds to a refractory state on day 5, which lasts for about 18h
(Psychoyos, 1973), while in the rat, the uterus becomes receptive on day 5 and becomes
non-receptive to blastocyst implantation by day 6 (Paria et al., 1993). In humans the
uterus is receptive between days 19-24 of the menstrual cycle. While oestrogen appears
to influence the duration of uterine receptivity, the ratio between progesterone and
oestrogen plays an important role in providing the normal morphology for implantation
during this period.
At the onset of the receptive stage, the blastocysts are in close contact (apposition) with
the luminal epithelium (Chen et al., 2000). In rodents, the blastocyst is positioned at the
antimesometrial side of the uterus with the embryonic pole of the blastocyst facing the
mesometrial side (Enders and Schlafke, 1967). On day 5 of pregnancy in the rat, it is still
possible to flush the blastocysts from the uterus. The pontamine blue reaction, which is
predicated on vascular permeability, is usually not demonstrable at this stage (Enders and
Schlafke, 1967).

5
In order for the blastocyst to implant, the endometrium must be in a receptive state to
receive it. The receptive state is characterised by particular morphological features.
However, the superphysiological oestrogen and progesterone levels recorded in
hyperstimulated animals and humans, cause detrimental changes to the uterine
morphology and affect uterine receptivity (Gidley-Baird et. al., 1986; Testart 1987;
Kramer et al., 1990; Stein et. al., 1993; Simon et. al., 1995).
The attachment reaction occurs between the plasma membrane of the uterine epithelial
cells and the trophoblast of the blastocyst (Murphy, 1992) under synchronized interaction
of oestrogen and progesterone (Ljungkvist, 1972). In the normal pregnant rat uterus on
day 5 of pregnancy, luminal epithelial cells are simple columnar and their apical borders
are covered with numerous short microvilli (Enders and Schlafke, 1967). These cells
contain large and numerous lipid droplets which are basally situated. The presence of
lipid droplets in the luminal epithelial cells displaces the nucleus from the base of the cell
to a central position (Enders and Schlafke, 1967). These features of the receptive
epithelium are altered with raised oestrogen levels in hyperstimulated animals. In rats
hyperstimulated with FSH and hCG, the luminal epithelial cells are tall columnar and
covered with long microvilli (Kramer et al., 1990). Lipid droplets are absent in these
cells and the nucleus is basally situated. Treatment with oestradiol only causes
hypertrophy and hyperplasia of the luminal epithelium, appearance of long apical
microvilli and the reduction of lipid droplets within these cells in the rat uterus
(Ljunkvist, 1972; Williams and Rogers, 1980).

6
Observations in the pseudopregnant rat showed replacement of microvilli with irregular
projections of the cytoplasm eighteen hours after oestrogen treatment (Ljunkvist, 1972).
These large apical cytoplasmic protrusions, physically overlying the rest of the uterine
surface are also known as pinopodes (Psychoyos, 1973; Psychoyos and Martel, 1985;
Klentzeris 1997; Carson et al., 2000) or uterodomes in the human uterus (Adams et al.,
2004), and are progesterone dependent, while, oestrogen inhibits their expression (Martel
et al., 1991). The function of pinopodes is not fully understood. However, it appears that
pinopodes are involved in the reduction of the intraluminal fluid, allowing the blastocyst
to come into close contact with the uterine epithelium (Psychoyos and Martel 1985).
Bagot et al. (2001) stated that the pinopodes are probably a more sensitive marker of the
window of implantation than any other histological feature of the luminal epithelial cells
or detection of any molecular marker currently available. Pinopodes are observed on the
surface epithelium of the human endometrium on days 19-21 of the menstrual cycle
(Nikas et al., 1995) and in mice at day 5 of pregnancy (Psychoyos, 1973). However, in
controlled ovarian hyperstimulation cycles, uterodomes are present on days 19-20,
suggesting premature uterine receptivity (Adams et al., 2004).
Apposition of the blastocyst to the luminal epithelium of the uterus is followed by the
attachment reaction. Carbohydrates, integrins and other cell-surface molecules contribute
to the adhesion of the blastocyst at the implantation site (Murphy, 1995; Paria et al.,
2002). During the peri-implantation period in normal pregnant rats, uterine luminal
epithelial cells demonstrate an increase in at least four different carbohydrate molecules
(Murphy and Turner, 1991). One of these carbohydrates, the trisaccharides of

7
glucosamine are absent on day one of pregnancy, but increase significantly at the time of
implantation (Murphy and Turner, 1991). Production of glucosamine trisaccharides in
the glycocalyx of surface epithelial endometrial cells is inhibited in hyperstimulated
pregnant rats affecting receptivity of the endometrium for blastocyst implantation
(Kramer et al., 1994; Peverini and Kramer, 1995). In addition, studies in hyperstimulated
rodents showed that the number of implanted embryos was highly affected. Although
embryos were present in the dilated lumina of the uterine horns at 5.5 and 6.5 days of
hyperstimulated rats, it appeared that aberrant distribution of the adhesion molecules
suppressed their attachment to the luminal epithelium and embryos were found lying
freely in the lumen of the uterus (Kramer, 1997).
After the attachment reaction, the luminal epithelial cells of the uterus undergo apoptosis
(programmed cell death), which facilitates the invasion of the maternal endometrium by
the blastocyst (Parr et al., 1987; Tsujii and Du Bois, 1995; Carson et al., 2000; Tassell et
al., 2000; Zhang and Paria, 2006). At the same time, extensive proliferation and
differentiation of the stromal cells form decidua (Enders and Schlafke, 1967; Kramer et
al., 1990; Kramer, 1997; Carson et al., 2000). Under the influence of exogenous
hormones, decidualisation is affected in rats and results in the stromal cells remaining flat
and fibroblastic (Kramer et al., 1990; Kramer, 1997).
1.3 Effect of exogenous hormones on embryo quality
In addition to endometrial receptivity, embryo quality is also important for successful
implantation. It has been suggested that hyperstimulation causes a decreased

8
developmental ability of the embryos as a result of an increased proportion of
chromosomal abnormalities in these embryos (Ertzeid and Storeng, 2001). Embryo
donation studies in mice showed significantly lower implantation rates when the embryos
from superovulated donors were transferred into control recipients, compared to that of
control donors (Ertzeid and Storeng, 2001). It has also been reported that
hyperstimulation of mice causes a delay in the development of embryos in vitro (Ertzeid
and Storeng, 2001). Similarly in the human uterus, use of exogenous hormones causes a
rise in oestradiol levels and affects embryo quality (Valbuena et al., 2001). Existing data
concerning research on human embryos, suggest that high oestrogen levels have a toxic
effect on the cleavage stage of embryos, as well as affecting their adhesion in vitro
(Valbuena et al., 2001).
1.4 The expression of implantation-related genes
Many molecules and genes are important for implantation. However, the sequence of
gene expression of these molecules during the period of implantation and their interaction
and relationship is still not well understood (Paria et al., 2002). To date, the best
understood signalling sequence in implantation of mice embryos has been established
with the target deletion of Hoxa-10, leukaemia inhibitory factor (LIF) and
cyclooxygenase2 (COX2) (Paria et al., 2002).
Due to epithelial-mesenchymal interactions between the uterus and the embryo during
implantation, many classes of developmental genes are involved in the molecular cross-
talk at the time of implantation (Paria et al., 2002). Some of these genes are those
9
encoding for fibroblast growth factor, bone morphogenetic proteins, Indian hedgehog as
well as the Homeobox of transcription factors. Homeobox (Hox) genes are vital during
embryogenesis of the genitourinary tract, and particularly Hox10 gene expression is
required for endometrial receptivity and embryo implantation (Taylor et al., 1997; Bagot
et al., 2001). It has been previously reported that mice with a Hox10 gene disruption
produce viable embryos, but these embryos fail to implant into the Hox 10-deficient
mouse uterus (Satokata et al., 1995). However, if the embryos of Hox10-deficient mice
are transferred into the uterus of wild-type mice, implantation occurs (Satokata et al.,
1995). Studies of the mouse and human uterus confirmed that maternal Hox10
expression is required for uterine receptivity (Satokata et al., 1995; Taylor et al., 1997).
In the cytokine family, one of the essential cytokines for preparation of the uterus for
implantation is leukaemia inhibitory factor (LIF). In mice, LIF is expressed in the uterine
glands on day 4 of pregnancy in response to nidatory oestrogen, indicating its
involvement in the preparation of the uterus for implantation (Song et al., 2000). LIF is
also expressed in the stromal cells at the site of blastocyst implantation during the
attachment reaction on day 5 of pregnancy (Song et al., 2000). Mutation of the LIF gene
in mice results in failure of implantation (Sharkey, 1998; Song et al., 2000; Dey et al.,
2004). Mice with the target disruption of the LIF gene show aberrant expression of some
of the EGF family of growth factors at the time of implantation, suggesting the
importance of synergistic expression of these factors (Song et al., 2000). While LIF is
particularly important for the attachment reaction, another member of the cytokine
family, interleukin-11 (IL-11) is primarily involved in decidualization (Paria et al., 2002).

10
Numerous growth factors are also important signalling molecules at the site of
implantation. The epidermal growth factor (EGF) family of growth factors includes EGF
itself, transforming growth factor-� (TGF- �), heparin binding-EGF (HB-EGF),
amphiregulin (Ar), �-cellulin (BTC) epiregulin (Er), heregulins/neu-differentiating
factors (NDFs)and cripto (Carson et al., 2000). These factors are expressed in a
spaciotemporal manner suggesting their involvement as local mediators at the time of
implantation. TGF- � is expressed in the mouse uterus at the time of implantation.
However, TGF- � mutant mice are fertile, suggesting that the deficiency might be
compensated for by other growth factors (Carson et al., 2000). Heparin binding EGF-like
growth factor is the earliest known marker of implantation in mice (Paria et al., 2002).
The expression of HB-EGF is evident in the luminal epithelial cells surrounding the
blastocyst, suggesting that the signals from the blastocyst initiate expression of HB-EGF.
In addition, experiments in vitro showed that HB-EGF stimulates blastocyst proliferation,
zona hatching, trophoblast outgrowth and phosphorylation of the receptor in the mouse
blastocyst (Carson et al., 2000). Soluble HB-EGF is used to improve the development of
in vitro-fertilized human embryos (Martin et al., 1998)
1.5 Vascular permeability and angiogenesis
Two major events which occur at the site of implantation are vascular permeability and
angiogenesis. Vascular permeability and stromal oedema in the uterus of rodents are
apparent during the attachment reaction and can be demonstrated by an intravenous
injection of a macromolecular blue dye, pontamine blue, resulting in the formation of
blue segmental bands along the length of the uterine horns (Psychoyos, 1973). Vascular
11
permeability at the site of implantation occurs as a result of the fenestrations of
endometrial thin-walled vessels (Kramer et al., 1993).
Vascular permeability occurs as a response to the angiogenic stimuli (Hyder and Stancel,
1999) in order to allow fibrinogen and other plasma proteins to infiltrate the surrounding
tissue (Dvorak et al., 1995). This results in the formation of extracellular fibrin gel which
is a suitable substrate for endothelial and tumour cell growth (Dvorak et al., 1995).
Cyclical changes in the ovaries and uterus during the menstrual cycle and the process of
placentation during pregnancy require increased blood flow, which is maintained by the
formation of new blood vessels. Angiogenesis is a complex process where new blood
vessels arise from the pre-existing vasculature (Perrot-Applanat et al., 2000; Robinson
and Stringer, 2001). Angiogenesis is achieved by proliferation, migration and tissue
infiltration of capillary endothelial cells and localised breakdown of the extracellular
matrix (Hyder and Stancel, 1999). As a result of these events, new capillaries are formed
(Dvorak et al., 1995; Hyder and Stancel, 1999; Robinson and Stringer, 2001). During
angiogenesis new capillaries originate from the smaller blood vessels, capillaries and
venules (Hyder and Stancel, 1999). New blood vessels also develop by the process of
vasculogenesis, from hemangioblasts (Coffin and Poole, 1988).
Angiogenesis is important in embryogenesis and tissue development. In adults,
angiogenesis occurs primarily in the female reproductive tract, at the site of wound
healing and bone remodelling (Robinson and Stringer, 2001). Apart from the normal
physiological conditions in adults, angiogenesis is implicated in several pathological

12
conditions, such as diabetic retinopathy, rheumatoid arthritis and development of tumours
(Folkman, 1990; Ferrara, 1996; Kim et al., 1996).
Vascular permeability and angiogenesis in the female reproductive tract are regulated in
different ways by oestrogen and progesterone in vivo (Matsumoto et al., 2002).
Oestrogen induces uterine vascular permeability and inhibits angiogenesis, while
progesterone stimulates angiogenesis and does not affect vascular permeability
(Matsumoto et al., 2002). Numerous vasoactive agents such as histamine, platelet-
activating factor, prostaglandins, fibroblast growth factor (FGF) and vascular endothelial
growth factor (VEGF) are important for vascular permeability at the site of implantation
(Hyder & Stancel, 1999; Paria et al., 2002).
1.5.1 Vascular endothelial growth factor (VEGF)
The first discovery of a permeability factor secreted by hepatocarcinoma cell lines that
induced dye leakage into the skin of the guinea pig was described by Senger et al. (1983).
This permeability factor was later cloned and named vascular endothelial growth factor
(VEGF) for its mitogenic effect on endothelium in culture (Leung et al., 1989). VEGF is
a glycoprotein, which exists in multiple isoforms that work primarily via two
transmembrane tyrosine kinase receptors: VEGFR-1 encoded by Flt-1, and VEGFR-2
encoded by KDR Flk-1 (Matsumoto et al., 2002). Both receptors are exclusively
expressed on endothelial cells. It appears that VEGF does not increase mitogenesis in any
other cell type (Leung et al., 1983; Roberts and Palade, 1995; Ferrara, 1996). The role of
VEGF as a potent permeability factor has been studied by Roberts and Palade (1995). It
has been shown that application of VEGF induces fenestrations of small venules and

13
capillaries in the cremaster muscle, which does not normally have a fenestrated
endothelium in its vascular bed (Roberts and Palade, 1995).
VEGF-A is a member of a larger VEGF family that includes VEGF-B, VEGF-C, VEGF-
D, VEGF-E and placental growth factor (PlGF) (Bates and Harper, 2003). VEGF-B is
mainly distributed in heart and skeletal muscle, PlGF in the placenta, while VEGF-C and
VEGF-D are related to lymphogenesis and maintenance of lymphatic vessels (Robinson
and Stringer, 2001).
VEGF-A exists in several isoforms (Fig. 1), derived from the single gene through
alternative gene mRNA spicing (Robinson and Stringer, 2001; Krussel et al., 2003).
VEGF protein in humans consists of 121, 145, 165, 189 and 206 amino acids (VEGF 121,
VEGF 145, VEGF 165, VEGF 189, and VEGF 206).
Fig. 1: Five different VEGF isoforms (Krussel et al., 2003)

14
In rodents, different isoforms of VEGF protein contain one amino acid less than in
humans. VEGF 121 and VEGF 165 are predominant isoforms in humans, while VEGF 120
and VEGF 164 are more predominant in mice (Ma et al., 2001). All VEGF isoforms
contain 8 exons of which 1-5 and exon 8 are constituents for all isoforms (Fig. 1)
(Krussel et al., 2003). Different isoforms are dependant on various combinations in
additions of exons 6 and 7 (Bates and Harper, 2003). VEGF isoforms exist in secreted
forms (VEGF 121, 145, 165) or they are bound to the cell surface (VEGF 189, 206) (Houck et
al., 1991; Bates and Harper, 2003). All secreted VEGF isoforms bind to
transmembranous tyrosine kinase receptors Flt-1 and KDR (Fig. 2).
Fig. 2: Schematic illustration of VEGF receptors and their interaction with
different growth factors (Krussel et al., 2003)

15
Although VEGF has a greater affinity for binding to Flt-1 than KDR, it appears that its
biological response is facilitated through the binding of VEGF to KDR rather than Flt-1
(Waltenberger et al., 1994). However, both receptors and their interactions are required
in order to induce VEGF biological responses (Ferrara, 1996; Ferrara and Davis-Smith,
1997). VEGF binding to these receptors causes phosphorylation and signal transduction
that causes vascular permeability and angiogenesis (Krussel et al., 2003; Bates and
Harper, 2003). Waltenberger et al. (1994) reported that KDR mediates chemotaxis,
mitogenesis and cytoskeletal reorganization of endothelial cells.
Experiments with knockout mice, have shown that targeted disruption of genes in the
VEGF system, cause intrauterine death of embryos resulting in an inability of these
animals to produce live offsprings (Fong et al., 1995; Carmeliet et al., 1996). Carmeliet
et al. (1996) reported abnormal blood vessel formation in heterozygous and homozygous
VEGF-deficient embryos resulted in death of the embryos at mid-gestation. Mice
embryos with a VEGFR-1 (Flk-1) gene disruption die on embryonic day 8.5 as a result of
aberrant blood vessels formation (Fong et al., 1995). Although endothelial cells develop
in these animals, their rearrangement into small vessels does not occur. KDR expression
on the surface of hemangioblasts contributes to differentiation of these cells into
haematopoietic and endothelial cells. Embryos with KDR gene disruption are not able to
produce mature haematopoietic cells and endothelial cells (Krussel et al., 2003).
Other receptors are also expressed on the endothelial cells and specifically bind to VEGF.
VEGFR-3 is found predominantly on the lymphatic endothelial cells (Bates and Harper,

16
2003). Recently, neuropilin-1 (NRP1) has been identified as a neuronal receptor in
developing nervous tissue. However, it has been shown that the VEGF 165 isoform, (one
of the most predominant isoforms in the human uterus) binds to the NRP1 receptor (Day
et al., 2004). Studies on NRP1 knockout mouse showed cardiovascular abnormalities
which caused death of the embryos on days 10.5-12.5 in utero (Kitsukawa et al., 1997).
It has also been reported that another angiogenic factor, angiopoietin (angiopoietin-1 and
angiopoietin-2) coordinates the expression of VEGF. Angiopoietin-1 upregulates and
coordinates VEGF effects on vascular permeability and angiogenesis, while angiopoietin-
2 acts as an antagonist by suppressing angiogenesis (Matsumoto et al., 2002). However,
before and during the attachment reaction in mice, vascular permeability and
angiogenesis are predominantly regulated by VEGF expression (Matsumoto et al., 2002).
Studies in the human endometrium suggested that amongst several endometrial growth
factors, only VEGF stimulates growth of the capillaries in the decidual endometrium
(Zhang et al., 1998; Demir et al., 2004). Angiopoietins together with VEGF are
important in these processes during decidualization following implantation (Matsumoto
et al., 2002).
Oestrogen and progesterone induce VEGF expression in the rodent uterus (Hyder and
Stancel, 1999). Oestrogen and oestrogen agonists such tamoxifen, induce expression of
VEGF in the rat uterus, and it appears that VEGF is oestrogen-receptor mediated (Hyder
et al., 1996). Similarly, other studies suggest that progesterone also induces VEGF
expression in the rodent uterus (Cullinan-Bove and Koos, 1993).

17
1.5.2 Cyclooxygenase2 (COX2)
Cyclooxygenase1 (COX1) and COX2 are the rate-limiting enzymes that convert
arachidonic acid into prostaglandins (PGs). Arachidonic acid is converted into
prostaglandin H2 (PGH2), which is the precursor for a variety of prostaglandins (PGs)
important in normal physiological and pathological conditions (Markenson, 1999). The
principal bioactive PG metabolites are: prostaglandin E2 (PG E2), PGF2�, PGD2, PGI2 and
TXA2 (Breyer et al., 2000). In rodents, prostaglandins are implicated in the events in
early pregnancy (Kennedy, 1977; Kennedy and Lukash, 1982; Ni et al., 2002; Ni et al.,
2003). Amongst biologically active PGs, PGE2 and PGI2 are the most predominant
metabolites involved in the events in the rodent uterus in early pregnancy (Lim et al.,
1999). PGs mediate diverse events in various tissues by binding to a set of cell surface
receptors (Lim and Day, 1997). The surface receptors for PGE2, one of the predominant
PGs in the uterus, are Ep1, Ep2, Ep3 and EP4 (Yang et al., 1997). Genes of these receptors
are expressed in a spatio-temporal manner, suggesting PGE2’s role in preparation of the
uterus for implantation as well as decidualization (Lim and Day, 1997).
It has been previously suggested that an increase in PGs and expression of COX1 prior to
implantation, mediates uterine oedema and luminal closure which are important for the
attachment reaction in rodents (Kennedy, 1977; Chakraborty et al., 1996). Chakraborty
et al. (1996) stated that PGs produced at the site of implantation by COX2 are important
for localized increased vascular permeability and the attachment reaction, and are
involved in angiogenesis for the establishment of the placenta. In addition, it has been
shown that PG levels are higher in the endometrium at implantation sites compared to the

18
inter-implantation sites in many species (Bany and Kennedy, 1997) supporting the
importance of their involvement in implantation.
The two isoforms, COX1 and COX2 are encoded by two separate genes, Ptgs1 and Ptgs2
(Smith et al., 2000). The expression of COX1 is more constant as it is important in
regulating cell function, while COX2 expression is up-regulated in response to various
stimuli (Das et al., 1999). In mice, COX1 is expressed in the luminal epithelial cells and
glandular cells on the morning of day 4 of pregnancy but is not detectable in these cells at
the time of the attachment reaction (Dey et al., 2004). COX2 is expressed in the luminal
epithelial cells and subepithelial stromal cells at the site of implantation on day 5 of
pregnancy in mice (Dey et al., 2004).
Experiments with COX1-deficient mice show that the females are fertile with a specific
parturition defect, while COX2-deficient females are infertile and show abnormalities in
ovulation, fertilization, implantation and decidualization (Matsumoto et al., 2001).
Cheng and Stewart (2003) recently reported that wild-type blastocysts, following transfer
into COX2 deficient mice, implant and develop successfully to term. These animals
however, show a reduction in decidual growth when compared to the wild-type mice, but
are restored to their normal growth rate after 24-36h. These results suggest that COX2 is
required for the induction of other factors mediating angiogenesis (Cheng and Stewart,
2003). Specifically, VEGF is important for the process of vascular permeability and
angiogenesis in the uterus, both in rodents and humans. Thus, it is possible that during

19
the initial stages of decidualization, COX2 is required for induction of VEGF expression
(Cheng and Stewart, 2003).
Since exogenous hormones cause an increase in oestrogen levels and alter the
progesterone:oestradiol ratio, which subsequently cause unsatisfactory changes in the
uterine morphology and aberrant expression of implantation related genes, it would be of
interest to see whether hyperstimulation affects COX2 and VEGF during the peri-
implantation and thus the receptivity of the uterus for blastocyst implantation.
1.6 AIM OF THE STUDY
The aim of this study was:
1. To investigate the expression of VEGF and COX2 in the normal rat uterus during
the peri-implantation period
2. To determine the effect of hyperstimulation on the expression of VEGF and
COX2
3. To provide a better understanding of the use of hyperstimulation on these two
important mediators of implantation during early pregnancy.
20
2.0�MATERIALS AND METHODS
2.1 Animals
Animal ethics clearance for this experiment was granted by the Animal Ethics
Committee, University of the Witwatersrand (AESC NO: 2004/100/4). Adult, virgin
female Sprague-Dawley rats (n=36) and two male rats of proven fertility were used for
the experiment. Animals were obtained and housed in the Animal Unit of the University
of the Witwatersrand. The animals were housed in an environment with a controlled
temperature of 22°C and a 12h light and 12h darkness cycles. The animals were fed with
rat cubes and water ad libitum.
Vaginal smears of the female rats were taken daily until a regular 4-day oestrous cycle
had been established. The smears were fixed in alcohol and stained using Shorr’s stain
(Appendix 1). Stages of the oestrous cycle were assessed according to Kent and Smith
(1945) (Appendix 2). The phases of the oestrous cycle are: oestrus, metoestrus, dioestrus
and pro-oestrus. Animals showing at least three consecutive regular 4-day cycles were
used for the experiment.
The animals were divided into two groups:
Group 1 – Experimental (hyperstimulated):
Female rats (n=18) received an intra-peritoneal injection of 20i.u. of follicle stimulating
hormone (FSH) (Folligon, Intervet, Johannesburg) at mid-day of dioestrus followed by an

21
intraperitoneal injection of 20i.u. of human chorionic gonadotropin (hCG) (Chorulon,
Intervet, Johannesburg) 24h later, at late dioestrus (Stein et al., 1993)
Group 2 – Control (normal pregnant):
Female rats (n=18) received an intraperitoneal injection of sterile saline at the same stage
of the oestrous cycle as the hyperstimulated animals received exogenous hormones.
Control and experimental females were placed with a fertile male on the afternoon of pro-
oestrous to mate.
On the morning following mating, female rats were examined to assess the presence of a
mucous plug. Vaginal smears were examined for the presence of spermatozoa for
confirmation of successful copulation. The day following mating was taken as day 0.5 of
pregnancy following the work of Kramer et al. (1993). The timing of pregnancy in the
present study differs to other studies where the morning after mating was taken as a day 1
of pregnancy (Enders and Schlafke, 1967; Psychoyos, 1973; Lim et al., 1997). The
reason for this is that the rats mate in the early evening and the females were killed for
the experiment in the early morning of the following day of pregnancy. This corresponds
to approximately 12 hours after mating or 0.5 days of pregnancy. Thus, in the other
relevant published studies day 1 will correspond to day 0.5 in the present study. Vaginal
smears were taken daily until the day of sacrifice to confirm the maintenance of
pregnancy.
Animals were anaesthetized with 0.6 ml of Chanazen (Centaur Labs, Johannesburg, SA)
and 0.24 ml of Ketamine (Centaur Labs, Johannesburg, SA) on days 4.5, 5.5 and 6.5 of

22
pregnancy (n=6 control and n=6 hyperstimulated per group, per day of sacrifice). Blood
samples from heart punctures of these animals were collected and placed in sterile
heparin tubes. The blood was immediately centrifuged and the plasma was stored at -
70°C until assayed for oestradiol and progesterone levels by ELISA (enzyme-linked-
immunosorbent assay).
An incision through the anterior abdominal wall was carried out in order to view the
inferior vena cava, ovaries and uterine horns. A 1% pontamine blue solution (a high
molecular weight dye) was injected into the inferior vena cava and was allowed to
circulate in the anesthetized animal for 10-15 minutes (Psychoyos, 1973). Due to
vascular permeability and leakage of the pontamine blue into the surrounding tissue, blue
bands were noted at the site of the implanting blastocysts (Psychoyos, 1973). The uterine
horns of the animals were then removed, dissected from the surrounding tissue and
washed with phosphate buffered saline pH 7.6 (PBS) (Appendix 3) to remove blood.
Regions of the uterine horns showing blue bands (implantation sites) were separated from
the non-implantation sites by sharp dissection for total protein extraction and Western
blot analysis. Uterine horns of animals not showing blue bands after pontamine blue
injections were sectioned in pieces of approximately 5-10 mm in length from different
regions of the uterine horns.
Dissected pieces of tissue were fixed in 10% neutral buffered formalin (Appendix 4). An
automatic tissue processor (Shandon Citadel 1000) was used to dehydrate tissue through
graded alcohols and chloroform followed by embedding the tissue in paraffin wax.

23
Tissue blocks were utilized for routine histology and immunohistochemical localisation
of specific antigens. Following removal of the uterine horns the animals were killed by
exsanguination.
2.2 Progesterone and oestradiol ELISA
Progesterone and oestradiol were quantitatively determined in the plasma of these
animals by using an Estradiol (E2) Enzyme immunoassay test kit (Linear Chemicals,
Spain) and a Progesterone enzyme immunoassay test kit (Linear Chemicals, Spain) for
raw data see Appendix 5). ELISA (enzyme-linked-immunosorbent assay) is based on the
competition principle in the microtitre plate. An unknown amount of antigen
(progesterone or oestradiol) present in the sample and a fixed amount of enzyme-labelled
antigen compete for the constant amount of rabbit anti-progesterone or anti-oestradiol.
Each blood sample obtained from the control and experimental animals was assayed in
duplicate. According to the manufacturer’s recommendation 25 µl of standards,
specimens and controls were dispensed into appropriate wells on the microtitre plate.
Progesterone or oestradiol-HRP conjugate reagent (100 µl) and 50 µl of rabbit anti-
progesterone or rabbit anti-oestadiol reagent were added to each well and mixed
thoroughly. Incubation was carried out for 90 minutes at room temperature. After
incubation, the wells were washed with distilled water to stop the competition reaction.
After the substrate solution was added and incubated at room temperature for 20 minutes
the reaction was stopped by adding 100 µl of stop solution to each well. The plate was
gently mixed to allow a change from a blue colour to yellow. The concentration of
antigen was inversely proportional to the optical density measured (read at 450 nm). The

24
standard curve was obtained by plotting the concentration of the standard versus the
absorbance and was used to calculate the unknown sample concentration.
2.3 Histology
Sections 4µm thick, prepared from the paraffin wax blocks were placed on silane (3
Aminopropyl triethoxy-silane, obtained from Sigma-Aldrich Co, USA) dipped glass
slides (Appendix 6). Every sixth section of each block was deparaffinised in xylene and
rehydrated in a series of graded alcohols. Sections were than stained with haematoxylin
and eosin (Appendix 7) in order to investigate the morphology of the uteri at different
stages of pregnancy. The haematoxylin and eosin stain is a widely used histological
stain. This staining method, demonstrates a large number of different tissue structures
(Bancroft and Gamble, 2002). The haematoxylin component stains cell nuclei blue-black
(basophilic), whilst the eosin stains cell cytoplasm and connective tissue fibres in shades
of pink, orange and red (eosinophilic) (Bancroft and Gamble, 2002).
2.4 Immunohistochemistry
Formalin-fixed, paraffin embedded tissues were sectioned at 4µm. Fixation in formalin,
as well as paraffin embedding of tissue is known to allow substantial changes in the
antigen epitopes (the structural part of an antigen which reacts with an antibody). These
changes in the antigen epitopes can lead to complete loss of immunoreactivity by the
antigen or the “masking” of the antigen (Boenisch, 2001). Restoration of
immunoreactivity or antigen unmasking (antigen retrieval) can be achieved by
application of heat for varying lengths of time to the sections in an aqueous medium
25
(Boenisch, 2001). In the present study, antigen retrieval of the tissue was carried out by
microwaving the sections in citrate buffer at pH6 (Appendix 8) twice, for 5 minutes.
Sections were than incubated with 3% hydrogen peroxide for ten minutes at room
temperature in order to block endogenous peroxidase activity. The immunostaining
procedures were different for the two antibodies utilized following incubation with
hydrogen peroxide, and are explained separately in the text below.
2.4.1 VEGF immunostaining
Sections were incubated with 1% rabbit serum in TRIS-buffered saline pH 7.6 (Appendix
9) for 10 minutes at room temperature for blocking non-specific binding. Primary mouse
monoclonal VEGF antibody (sc-7269) was obtained from Santa Cruz Biotechnology. A
series of dilutions were carried out to determine the optimal suitable concentration of the
antibody. Sections were then incubated with the primary (VEGF) antibody at a dilution
of 1:100 overnight at 4°C. After washing the sections twice for 5 minutes in Tris-
buffered saline (TBS), a secondary rabbit anti-mouse antibody (Dako), was diluted in
TBS (1:300) and then applied for 30 minutes at room temperature. Sections were washed
twice for 5 minutes and a streptavidin horseradish peroxidase complex (Dako, Denmark)
at a dilution of 1:300 was applied for 30 min at room temperature. The positive reaction
was identified by the chromagen, diaminobenzidine (DAB) (Dako, Denmark). After
incubation with DAB for 5 minutes, sections were washed in tap water for 5 minutes.
Sections were then counterstained in haematoxylin for 20 seconds and dehydrated in
graded alcohols and xylene, before coverslipping in entellan.

26
2.4.2 COX2 immunostaining
A primary goat polyclonal COX2 antibody (sc-1747; Santa Cruz Biotechnology USA)
and Immunostaining kit (sc-2053 Immuno Cruz Staining System) was used for COX2
immunoassaying.
Sections (4µm in thickness) were incubated for 20 minutes at room temperature in 1-2
drops of serum block provided in the Immunostaining kit, followed by removal of the
excess serum block. Primary goat polyclonal COX2 antibody at a dilution of 1:100 was
applied to the sections for two hours at room temperature. After washing in TBS with
0.05% Tween 20 three times for 5 minutes, secondary biotinulated antibody (provided in
the Immunosraining kit) was applied for 30 minutes at room temperature. Sections were
washed three times for 5 minutes in TRIS-buffered saline with 0.05% Tween 20 and
incubated with streptavidin HRP complex for 30 minutes at room temperature. Sections
were washed 3 times in TBS with 0.05% Tween 20, and than incubated with DAB for 5
minutes. Sections were than washed in tap water for 5 minutes, counterstained in
haematoxylin for 20 seconds and dehydrated in graded alcohols and xylane, before
coverslipping in entellan. The sections were than analyzed for VEGF and COX2
immunolocalization by light microscopy using the Zeiss Axioscope microscope
(Axioscope 2, MOT, Carl Zeiss, Germany). The images were captured by digital camera
(Sony 3 CCD).

27
2.4.3 Controls for immunohistochemistry
Negative controls were prepared using tissue sections adjacent to the sections showing
immunolocalization of antibodies. In the first instance the primary antibodies were
replaced with TBS and in the second negative control, the secondary antibodies were
replaced with TBS.
An absorption control (pre-absorbtion of the respective antibody with its antigen, and
substituted for the primary antibody) was not carried out as the VEGF and COX2
antigens were not available commercially.
Formalin-fixed paraffin embedded breast carcinoma tissue was prepared by the same
procedure as mentioned above and used as a positive control for VEGF immunostaining.
Human lung carcinoma tissue was used as a positive control for COX2
immunolocalization. Human Ethics Committee approval for the use of these tissues was
granted by the Human Ethics Research Committee of the University of the Witwatersrand
(M050521).
2.5 Protein extraction
Dissected pieces of uterine tissue approximately 5-10 mm in length were further sliced
with sterile scissors and placed in a clean homogenizer with 5 ml of homogenising buffer
(Appendix 10) with DTT stock and protease inhibitor cocktail stock (Sigma-Aldrich Co,
USA). Homogenizing was carried out slowly, letting in as little air as possible, to prevent
foaming. The homogenized tissue was centrifuged at 12 000 rpm for 20 minutes at 4˚C,

28
followed by the removal of supernatant. Supernatant was aliquoted in 200µl aliquots and
stored at -70˚C until used.
2.6 Protein Concentration (Lowry protein assay)
Total protein determination from the homogenized tissue was carried out by the Lowry
protein assay. The assay is based on complex formation of the protein with copper.
Adding folin phenol reagent results in binding to the protein and changes the colour from
yellow to blue.
Bovine serum albumin (BSA) was used as the standard. A working solution was made
up of 2000 µg BSA in 1000µl of PBS pH 7.4. Serial dilutions of two folds were carried
out in triplicate up to a dilution of 1:31.25. Extracted protein samples of control and
hyperstimulated animals were diluted in PBS (1:20) prior to testing. ELISA microtiter
plates were used for the test. In respective wells of the microtiter plate, 50 µl of the
diluted protein extract sample and 200 µl of reagent A (Appendix 11) were added and
incubated on a shaker for 10 minutes at room temperature. Reagent B (50 µl) (Appendix
12) was added followed by incubation for 30 minutes on a shaker. Labsystems Multiskan
Ascent (Amersham Pharmacia Biotech, Buckinghamshire, UK) a microtiter well reader
was used to read absorbance at 690 nm. A standard curve was created by plotting the
absorbance values of the BSA standards against their concentrations (Fig. 3). The protein
concentration in the sample was than calculated automatically of the graph multiplied by
the dilution factor (for raw data see Appendix 13).

29
0
0.1
0.2
0.3
0.4
0.5
0.6
0.7
0 200 400 600 800 1000 1200
CONCENTRATION OF BSA (µg/ml)
AB
SO
RB
AN
CE
AT
690n
m
Fig. 3: Standard curve for Bovine Serum Albumin (BSA) at known
concentrations in �g/ml at an absorbance of 690 nm

30
2.7 Electrophoresis
Protein separation was carried out on a 10% SDS-polyacrylamide gel (sodium dodecyl
sulphate) (Appendix 14) in a Hoeffer Mighty Small Electrophoresis Unit (Amersham
Pharmacia Biotech, Buckinghamshire, UK). The separating gel was allowed to set for
approximately 30 minutes before the loading of samples.
The lower and upper buffer chambers of the electrophoresis unit were filled with
electrophoresis tank buffer (Appendix 15). The wells of the separating gel were rinsed
three times with the tank buffer to remove any unpolymerized gel solution. A Hamilton
Syringe (Hamilton Company Incorporated, Whittier, California, USA) was used to load
the molecular weight marker, positive control or protein samples to the wells of the
separating gel. Two types of molecular weight markers were used. Some of the gels
were loaded with wide range molecular weight marker (Sigma-Aldrich Co., USA; range
6.5-205kDa) and for a few gels, The PageRuler Prestained Ladder Plus (Fermentas, Life
Sciences; range 10-250kDa) a highly purified coloured molecular weight marker, was
available. The first well of the separating gel was loaded with 4µl of a molecular weight
marker. The second well was loaded with a positive control consisting of 10µl of the
whole cell lysate (sc-2210 for VEGF or sc-2211 for COX2, Santa Cruz Biotechnology,
CA, USA). The other consecutive wells were loaded with concentrated sample and
sample diluted 1:10 and 1:20 in order to produce band representing VEGF or COX2 in
relation to the molecular weight marker. The example of sample dilution 1:10 is as
follows: 10µl of neat protein extraction, 40µl of TBS pH 7.6 and 50µl of transfer buffer
containing SDS, ß mercaptoethanol and bromophenol blue (Appendix 16). The positive

31
control samples and respective protein samples were boiled for 90 seconds, prior to
loading in the wells of the gel.
The system was connected to an electric power pack (Consort E452; Separation
Scientific, Honeydew, South Africa). The separation of the proteins was carried out at a
constant current of 25mA for approximately one hour. The movement of the protein was
closely monitored. After the separation of the protein, the gels were dipped in the
Towbin buffer (Appendix 17) for 10 minutes at room temperature to stabilize. One gel
was incubated with Commasie stain (Appendix 18) overnight. Destaining of the gels
with destain 1 and 2 (Appendix 19) was carried out in order to visualize the bands of
separated proteins and to determine the band of interest in correlation with the molecular
weight marker.
2.8 Western blot
A second gel was used for Western blotting. Separated protein was transferred to a
nitrocellulose membrane (Hybond – ECL, Amersham Pharmacia Biotechnology, UK).
The nitrocellulose membrane was cut to the size of the gel and soaked in transfer Towbin
buffer (Appendix 17). The gel was laid out in a “sandwich” consisting of a sponge and
double filter paper, the gel with the separated proteins, a nitrocellulose membrane,
another double filter paper and sponge. The gel was placed facing the side of the cathode
(negative) tray as the transfer occurs from the negative to the positive side with electric
current. The transfer of proteins was carried out in Hoeffer Western blotting transfer
equipment (Hoeffer Scientific Instruments, San Francisco, USA) filled with cold Towbin

32
buffer. The electric current was set on 20V and left overnight at 4˚C. After successful
transfer, the membrane was washed twice for 5 min each in TBS with Tween 20 (Merck,
Germany).
The membrane was blocked in TBS with 5% non-fat milk for one hour at room
temperature. Incubation with primary VEGF antibody (various dilution were probed:
1:500; 1:750; 1:1000) was carried out overnight at 4˚C. For COX2, the primary antibody
incubation was carried out for 2 hours at room temperature (dilution 1:750 or 1:1000).
Incubation with the primary antibody was followed by a washing step. The membranes
were washed twice for 5 minutes with TBS with Tween 20 at room temperature.
Incubation with secondary rabbit anti-mouse HRP (Dako) diluted 1:1000 in 5% non-fat
milk with Tween 20 was applied for 45 minutes at room temperature. Secondary COX2
antibody rabbit anti-goat HRP (Santa Cruz Biotechnology) diluted 1:1000 in 5% non-fat
milk with Tween 20 was applied for 45 minutes at room temperature. After washing the
membranes in TBS with Tween 20 three times for 5 minutes each, and once for 5 minutes
in TBS alone, the bands were detected by adding POD (BM Blue POD substrate,
precipitating, Roche Diagnostics, Indianapolis, US) for 5 minutes at room temperature.
The reaction was stopped with distilled water and the membrane allowed to dry.

33
3.0 RESULTS
3.1 Oestradiol ELISA
The summary statistical values for the ELISA oestradiol concentrations are shown in
Table 3.1 for the control rats and Table 3.2 for the hyperstimulated animals at 4.5, 5.5
and 6.5 days of pregnancy. The oestradiol concentrations with standard deviations for
both control and hyperstimulated animals are shown in Figure 4. Values of oestradiol
concentrations are given in pg/ml.
In the control animals, the oestradiol concentrations increased from 4.5 days of
pregnancy through 5.5 days and 6.5 days of pregnancy. In the hyperstimulated rats,
oestradiol concentrations were higher at 5.5 days when compared to the 4.5 days
hyperstimulated rats and then markedly decreased on day 6.5 of pregnancy compared to
the concentrations of oestradiol at 5.5 days in the hyperstimulated rats. On day 5.5 in the
hyperstimulated rats, an extremely high oestradiol concentration was recorded (66.60
pg/ml) in one of the animals. However, the outcome of the results did not change in the
case when statistical analysis was carried out without the result of that particular animal.
Statistically significantly higher oestradiol levels were found only between the control
and hyperstimulated animals at 6.5 days of pregnancy.
�
�
�
�

34
�
Table 3.1
Summary of the statistical values of oestradiol concentrations in the control animals
Factor Hormone Days of pregnancy
Number of animals
Mean pg/ml
SD Min Max
Control Oestradiol 4.5 5 21.28 11.23 12.40 40.80
Control Oestradiol 5.5 6 22.68 8.39 12.10 32.90
Control Oestradiol 6.5 6 32.52 13.65 19.50 51.90
Table 3.2
Summary of the statistical values of oestradiol concentrations in the hyperstimulated animals
Factor Hormone Days of
pregnancy
Number of animals
Mean pg/ml
SD Min Max
Hyper-stimulated
Oestradiol 4.5 6 28.46 8.14 19.50 41.10
Hyper-stimulated
Oestradiol 5.5 5 37.86 16.42 26.20 66.60
Hyper-stimulated
Oestradiol 6.5 6 17.87 6.46 12.90 29.90
All values are oestradiol concentrations in pg/ml.
35
3.1.1 Statistical analysis for oestradiol concentration
The unpaired Student’s “t” test was used to statistically analyse the oestadiol mean
concentrations between control animals at different stages of pregnancy as well as
between control and hyperstimulated animals at different stages of pregnancy. The data
were also log-transformed before calculating the p values. However, the p values
obtained after log transformation were similar and the outcome of the results did not
change.
No statistically significant differences for oestradiol were found between the control
animals. However, significantly higher oestradiol levels were found between the 5.5 and
6.5 day hyperstimulated animals (p=0.022).
When oestradiol concentrations were compared between the 4.5 day control and 4.5 day
hyperstimulated animals, this was not statistically significant (p=0.250).
At 5.5 days of pregnancy, a comparison between the mean oestradiol concentrations in
the control and the hyperstimulated animals was not statistically significant (P=0.118).
However, at 6.5 days of pregnancy statistically significantly higher mean oestradiol
concentrations were found in the control animals compared to the hyperstimulated
animals (P=0.039).
36
�
OESTRADIOL
0
10
20
30
40
50
60
4.5 5.5 6.5
DAYS
CO
NC
EN
TRA
TIO
N p
g/m
l
control
hyper
Fig. 4: Graph showing plasma concentrations and standard deviations of
oestradiol in the control and hyperstimulated animals. All
concentrations are in pg/ml.
�
�
�

37
3.2. Progesterone ELISA
The summary of the statistical values for progesterone concentrations obtained from
control animals is shown in Table 3.3 and for hyperstimulated animals in Table 3.4, at
4.5, 5.5 and 6.5 days of pregnancy. The progesterone concentrations with standard
deviations for both control and hyperstimulated animals are shown in Figure 5. Values of
progesterone concentrations at 4.5, 5.5 and 6.5 days of pregnancy are given in ng/ml.
The mean progesterone concentrations increased in the 5.5 day control animals compared
to the control animals at 4.5 days, while a slight decrease of progesterone was noticed at
6.5 days of pregnancy. In the hyperstimulated animals, the progesterone levels increased
from 4.5 days through 5.5 days and 6.5 days of pregnancy.
Progesterone levels were higher in the hyperstimulated animals compared to the control
animals at all stages of pregnancy examined. However, a statistically significantly higher
progesterone concentration was found only between the control and the hyperstimulated
animal groups on day 6.5 of pregnancy.

38
Table 3.3
Summary of the statistical values for the progesterone concentrations in the control animals
Factor Hormone Days of pregnancy
Number Mean SD Min Max
Control Progesterone 4.5 6 22.51 6.04 11.90 28.90
Control Progesterone 5.5 6 25.36 5.06 18.30 30.78
Control Progesterone 6.5 6 23.46 5.00 16.10 31.30
Table 3.4
Summary of the statistical values for the progesterone concentrations in the hyperstimulated animals
Factor Hormone Days of
pregnancy Number Mean SD Min Max
Hyper-stimulated
Progesterone 4.5 6 25.45 4.50 19.10 31.33
Hyper-stimulated
Progesterone 5.5 5 32.06 7.70 24.30 44.30
Hyper-stimulated
Progesterone 6.5 7 33.07 4.97 26.20 39.20
All values are progesterone concentrations in ng/ml.

39
3.3.1 Statistical analysis for progesterone concentration
The unpaired Student’s “t” test was used to compare progesterone concentrations
between control animals at consecutive days of pregnancy, the same for the
hyperstimulated animals at consecutive stages of pregnancy and between the pregnant
and hyperstimulated animals at different stages of pregnancy. Data were also log-
transformed before calculating the p values, as had been done with oestradiol data.
However, the p values were similar and the outcome of the results did not change.
No statistically significant differences for the progesterone concentrations were recorded
in either the control or hyperstimulated animals.
When progesterone concentrations were compared between 4.5 day control and 4.5 day
hyperstimulated animals, these were not statistically significant (p=0.362).
No statistically significant differences were recorded between control and
hyperstimulated animals at 5.5 days of pregnancy (p=0.213).
However, the progesterone concentrations were statistically significantly higher in the
hyperstimulated animals compared to the control animals at 6.5 days of pregnancy (p=
0.006).
�

40
PROGESTERONE
05
1015202530354045
4.5 5.5 6.5
DAYS
CO
NC
EN
TRA
TIO
N n
g/m
l
control
hyper
Fig. 5: Graph showing plasma concentrations and standard deviations of
progesterone in the control and hyperstimulated animals. All values
are progesterone concentrations in ng/ml.

41
3.3. Non-parametric Mann-Whitney test
In addition to statistical analysis using the Student’s “t” test, a non-parametric Mann-
Whitney test was used in order to determine possible statistically significant differences
with regards to the progesterone and oestradiol concentrations between control and
hyperstimulated animals at different stages of pregnancy. These statistical results were
then compared with the outcome of the Student’s “t” test. The outcome was the same in
both statistical analyses. In other words, no significant statistical differences were found
between control and hyperstimulated groups of animals for both progesterone and
oestradiol concentrations at 4.5 and 5.5 days of pregnancy. However, significant
statistical differences were evident between control and hyperstimulated animals at 6.5
days of pregnancy for both progesterone and oestradiol.
�
�
�
�
�
�
�
�
�
�
�

42
3.4. Progesterone:Oestradiol (P:E2) ratio
The progesterone:oestradiol ratio (P:E2 ) was calculated first for every individual animal
in each group, followed by the calculation of the group P:E2 ratio. The group P:E2 ratio
was calculated by dividing the mean progesterone concentration by the mean oestradiol
concentration of the control animals at 4.5 or 5.5 or 6.5 days of pregnancy. The ratio was
also calculated in the hyperstimulated animals at the same stages of pregnancy. The
summary of the progesterone-oestradiol ratio is given in Table 3.5.
Table 3.5 Summary of the P:E2 ratio of the control and hyperstimulated animals. Day and Factor Progesterone Oestrogen P:E2
4.5 control 22.51 21.28 1.2352 5.5 control 25.36 22.68 1.2177 6.5 control 23.46 32.52 0.7977 4.5 hyperstimulated 25.45 28.46 0.9490
5.5 hyperstimulated 32.06 37.86 0.9454 6.5 hyperstimulated 33.07 17.87 2.0693

43
Statistical analysis for P:E2 was carried out using the F-test of variance, Student’s “t” test
and the Welch test (non-parametric test of uniqual variance).
At 4.5 days and 5.5 days of pregnancy the P:E2 ratio was higher in the control animals
than in the hyperstimulated animals at the same day of pregnancy. However, it was not
statistically significant.
At 6.5 days in the control animals, the P:E2 was lower than in the hyperstimulated
animals and this was statistically significant ( P < 0.01).
Table 3.6 Summary of statistical analysis for P:E2 ratio
Control Hyperstimulated Days mean (SD) mean (SD) F (P) t (P) Welch t (P)
4.5 1.2352 (0.7117) 0.9490 (0.2765)
6.6245 (0.062)
0.91367 (0.385) 0.84747 (0.435)
5.5 1.2177 (0.4168) 0.9454 (0.3556)
1.7159 (0.568) 1.2542 (0.238) 1.2542 (0.240)
6.5 0.7977 (0.2776) 2.0693 (0.6083)
4.8029 (0.110)
-4.6582 (0.000) *
-4.6582 (0.002) *
* Significant difference P < 0.01

44
Fig. 6: Progesterone:Oestradiol ratio (P:E2) in the control and hyperstimulated
rats at 4.5, 5.5 and 6.5 days of pregnancy (NS = no significant difference
between control and hyperstimulated groups; * = significant difference
between groups: P < 0.01).
P:E 2 RATIO
0
0.5
1
1.5
2
2.5
3
4.5 5.5 6.5
DAYS
P:E 2 Control
Hyperstimulated
NS NS *

45
3.5. General Observation
The uterine horns and ovaries showed distinct gross morphological differences between
the control and hyperstimulated animals. Ovaries appeared larger and contained
numerous follicles in the hyperstimulated animals (Fig. 8) compared to the control rats
(Fig. 7). Implantation sites, stained blue with the pontamine blue technique, were present
in the uterine horns of one control animal (three implantation sites) at 4.5 days of
pregnancy. All other animals in both the control and hyperstimulated groups at 4.5 days
of pregnancy did not show blue bands. In all control animals on days 5.5 (Fig. 7) and 6.5
of pregnancy, numerous implantation sites staining blue were evident (average 8-15
implantation sites per animal). However, only in two animals in the hyperstimulated
group at 5.5 days of pregnancy, one possible implantation site in each animal was
evident. None of the hyperstimulated animals at 6.5 days showed blue bands.
The uterine horns of the hyperstimulated animals at all stages of pregnancy were
markedly dilated (Fig. 8), when compared to control animals at the same stage.

46
3.6. Histology
The histology of the ovaries and the uterine tissue of control and hyperstimulated animals
were examined in order to analyse tissue morphology.
The ovaries of the control animals at all stages examined (4.5, 5.5 and 6.5 days of
pregnancy) contained numerous corpora lutea which were well developed (Fig. 9). The
ovaries of the hyperstimulated animals at all stages examined, contained numerous large
secondary follicles. Corpora lutea were also present in the ovaries of the hyperstimulated
animals, however, smaller compared to those of normal pregnant animals (Fig. 10).
The surface of the uterine lumen in control animals at 4.5 days of pregnancy appeared
smooth. The luminal walls were in apposition at the antimesometrial end of the uterine
lumen (region of the implanting blastocyst) (Fig. 11). The luminal epithelial cells were
simple cuboidal with oval nucleus, displaced from the base of the cell by the presence of
vacuoles (Fig. 12). Numerous microvilli covered the apex of the cells (Fig. 13). Some of
the cells in the subepithelial stroma adjacent to the luminal epithelial cells predominantly
at the antimesometrial pole were round (indicating decidualization) and contained
prominent round basophilic nuclei (Fig. 13). Potential spaces were apparent between the
stromal cells indicated oedema of the tissue as a result of vascular leakage. However, the
majority of the cells in the stroma were flat and fibroblastic and the tissue appeared
compact.

47
Numerous glands were observed in the stroma. Glandular cells were simple cuboidal
with prominent large nuclei which were basally placed in the cell. The presence of
vacuoles was noted in the cytoplasm around the nucleus of the glandular cells (Fig. 13).
The uterine tissue of hyperstimulated animals at 4.5 days of pregnancy showed distinct
differences in the luminal epithelium and tissue morphology compared to the 4.5 day
control animals. The uterine lumen was markedly dilated and the mucosa was very
folded (Fig. 14). The luminal epithelial cells were simple columnar with large, oval,
basally placed nuclei (Fig. 15). Vacuoles were not present in these cells. The
subepithelial stromal cells were flat and fibroblastic (Fig. 15). Numerous uterine glands
were observed in the stroma. The glandular lumen was dilated. The glandular cells were
simple cuboidal and contained large, basally placed nuclei (Fig. 16). Vacuoles were
absent from the cytoplasm of the glandular cells at 4.5 days of pregnancy in the
hyperstimulated animals.
The gross morphology of the uterine tissue at 5.5 and 6.5 days of pregnancy in control
animals was similar to that of the tissue at 4.5 days of pregnancy in control animals. The
uterine lumen was smooth and the uterine walls were in apposition (Fig. 17). However,
histological changes of the uterine tissue were evident at 5.5 days of pregnancy. The
luminal epithelial cells were simple cuboidal in shape (Fig. 18). The apical portions of
these cells were covered with numerous microvilli. Oval nuclei were placed towards the
base of the luminal epithelial cells on the antimesometrial side, as vacuoles were not
present in these cells (Fig. 18). However, at the mesometrial side of the lumen, vacuoles

48
were present basally in the luminal epithelial cells, but were decreased in size. Decidual
cells were arranged in a distinct thick layer in the subepithelial stroma (primary decidual
zone). Numerous blood vessels were evident in the stroma. Spaces between the decidual
cells were evident and indicated the collection of extracellular fluid in the tissue (Fig. 18).
Uterine glands were numerous in the stroma and were arranged in clusters. The
glandular cells remained simple cuboidal in shape. Vacuoles were not present in the
glandular cells in 5.5 day control animals.
Uterine tissue of the hyperstimulated animals at 5.5 days showed similarities in
morphology and histology to that of 4.5 day hyperstimulated animals. The uterine lumen
of these animals was markedly dilated and contained numerous mucosal folds (Fig. 19).
The luminal epithelial cells were simple columnar with numerous microvilli on their
apical border. Large nuclei were basally placed in the luminal epithelial cells (Fig. 20).
Subepithelial stromal cells remained flat and fibroblastic. Numerous glands arranged in
clusters were present in the stroma (Fig. 20).
On day 6.5 of pregnancy in the control animals, more extensive decidualisation was
evident compared to that at 5.5 days. Numerous stromal cells adjacent to the primary
decidual zone were rounded and the stroma appeared oedematous. This histological
change was indicative of formation of a secondary decidual zone (Fig. 21). The stromal
blood vessels were numerous and were surrounded by decidual cells (Fig. 22). At the
antimesometrial side, the luminal epithelial cells showed distinct differences to those at
the mesometrial side of the lumen. At the mesometrial side of the uterine lumen, the

49
luminal epithelial cells were simple low cuboidal. At the antimesometrial side, luminal
epithelial cells were simple squamous (Fig. 22) and at the margin with the implanting
blastocyst, the epithelium had disappeared allowing for contact of the blastocyst and
decidua.
Sections of uterine tissue of hyperstimulated animals on 6.5 days of pregnancy followed a
similar pattern in morphology and histological appearance to that of 4.5 and 5.5 day
hyperstimulated animals. The uterine lumen contained numerous folds of the luminal
epithelial cells and subepithelial stromal tissue (Fig. 23). The luminal epithelial cells
were simple columnar with large nuclei, basally placed in the cell. The subepithelial
stromal cells were fibroblastic (Fig. 24). Numerous uterine glands were observed in the
stoma. Glandular cells remain simple cuboidal and contained large basally placed nuclei
(Fig. 24) without vacuoles in the cytoplasm.
�
�
�
�
�
�
�
�
50
3.3 Immunohistochemistry
3.3.1 Controls for COX2 immunohistochemistry
Human lung carcinoma was used as a positive control. Sections of the lung carcinoma
tissue expressed COX2 immunoreactivity in the cytoplasm of the lung carcinoma cells
(Fig. 25).
For the negative control, sections of the uterine tissue, in both control and
hyperstimulated animals were used. Sections adjacent to the sections of the uterine tissue
which showed COX2 immunolocalization were incubated with TRIS buffered saline in
place of either the primary or secondary antibody. While the control tissue expressed
immunolocalization of the respective protein (Fig. 26), the sections incubated with TRIS
in the place of the primary antibody (Fig. 27a) or the secondary antibody (Fig. 27b)
showed no evidence of COX2 protein expression.

51
3.3.2 Immunolocalisation of COX2 in control and hyperstimulated animals at 4.5,
5.5 and 6.5 days of pregnancy
Immunolocalization of COX2 was evident in the tissue of both control and
hyperstimulated animals at different stages of pregnancy. However, differences in the
distribution of COX2 immunolocalization were evident between the two groups of
animals.
At 4.5 days of pregnancy in the control animals, COX2 immunolocalization was evident
in the cytoplasm of the luminal epithelial cells, the subepithelial stromal cells and the
glandular cells (Fig.28). While the expression of COX2 was clearly evident in the
luminal epithelial cells, only scanty cytoplasmic COX2 immunolocalization was noted in
the glandular cells and the rounded stromal cells immediately adjacent to the luminal
epithelial cells, predominantly at the antimesometrial side at 4.5 days of pregnancy.
In the hyperstimulated animals at 4.5 days of pregnancy, intense immunolocalization of
COX2 was evident in the cytoplasm of the luminal epithelial cells and less so, in the
glandular cells. However, COX2 immunolocalization was absent in the stromal cells
(Fig. 29). The luminal epithelial cells showed variable protein expression as some
epithelial cells expressed highly intense COX2 immunolocalization compared with the
other epithelial cells (Fig. 29). The majority of the luminal epithelial cells expressed more
intense immunolocalization around the nucleus. Glandular cells expressed a lower

52
intensity of COX2 immunolocalization compared to the luminal epithelial cells, and this
was evenly distributed in the cytoplasm (Fig. 29).
At 5.5 days of pregnancy in the control animals, COX2 immunolocalisation was weakly
present in the luminal epithelial cells (Fig.30). It was less intense compared to that in the
luminal epithelial cells of the animals at 4.5 days of pregnancy. COX2
immunolocalization was weakly present and evenly distributed in the glandular cells.
Stromal decidual cells immediately adjacent to the luminal epithelial cells (primary
decidual zone) expressed a stronger cytoplasmic COX2 localisation when compared to
the 4.5 day control stromal tissue.
In the hyperstimulated animals at 5.5 days of pregnancy, an uneven and often intense
localization of COX2 was evident in the luminal epithelial cells (Fig. 31). There was
however an even, but very weak, distribution in the glandular cells (Fig. 31). Stromal
cells at 5.5 days in hyperstimulated animals did not show COX2 immunolocalization.
At 6.5 days of pregnancy in the control animals, COX2 immunolocalization was not
evident in the luminal epithelial cells which showed varying morphological appearances
in the different regions of the lumen (Fig. 32). The glandular cells expressed scanty
cytoplasmatic COX2 immunolocalization. However, the decidual stromal cells at 6.5
days of pregnancy in the control animals showed strong immunolocalization of COX2
which was particularly strongly localized around the nucleus of the decidual cells. Also,
the cells in the primary decidual zone showed stronger localization compared to the

53
decidual cells in the secondary decidual zone. In the tissue sections containing an
embryo, weak COX2 immunolocalization was evident in the embryonic cell mass (Fig.
32).
In the hyperstimulated animals at 6.5 days of pregnancy, strong expression of COX2 was
evident in the simple high columnar luminal epithelial cells. Stromal cells did not
express COX2 localization at this stage of pregnancy (Fig. 33).
�
�
�
�
�
�
�
�
�
�
�
�
�

54
3.4.1 Controls for VEGF immunohistochemistry
Sections of human breast carcinoma tissue were used as a positive control. VEGF
immunoreactivity was observed in the cytoplasm of the tumour cells (Fig. 34).
For the negative control, sections of uterine tissue, in both the control and
hyperstimulated animals, adjacent to the sections showing VEGF immunolocalization
were incubated with TRIS buffered saline in place of either the primary or secondary
VEGF antibody. While the experimental tissue expressed immunolocalization of the
protein (Fig. 35), in the sections incubated with TRIS in place of the primary antibody
(Fig. 36a) and the secondary antibody (Fig. 36b) no VEGF immunolocalization was
present in any tissue compartment.
�
�
�
�
�
�
�
�����������������������������
55
3.4.2 Immunolocalization of VEGF in control and hyperstimulated animals at 4.5,
5.5 and 6.5 days of pregnancy
Uterine tissue sections of control and hyperstimulated animals incubated with VEGF
antibody showed differences in the distribution of VEGF immunolocalization in these
two groups of animals at different stages of pregnancy.
At 4.5 days of pregnancy in the control animals, VEGF immunolocalization was evident
in the cytoplasm of the luminal epithelial cells, the glandular epithelial cells and the
subepithelial stromal cells (Fig. 37). Expression of VEGF was evident in the cytoplasm
of the luminal epithelial cells, particularly in the basal part of the epithelial cells and
surrounded the vacuoles which were present (Fig. 37). The cytoplasm of the glandular
cells showed evenly distributed VEGF immunolocalization. In the subepithelial stroma,
only the rounded cells indicating decidualization showed distinct cytoplasmic VEGF
immunolocalization, while the fibroblasts did not show immunolocalization (Fig.37).
VEGF immunolocalization was present in the stromal blood vessels as well.
A difference in distribution of VEGF immunolocalization was evident in the
hyperstimulated uterine tissue compared to the control tissue at 4.5 days of pregnancy.
While VEGF was evident in the cytoplasm of the luminal epithelial cells and glandular
cells (Fig. 38) at 4.5 days in the hyperstimulated animals, the stromal cells did not show
localization of the protein (Fig.38). VEGF was highly intense and evenly distributed in

56
the apical portions of the tall simple columnar luminal epithelial cells. In addition, the
uterine glandular cells showed intense cytoplasmic VEGF immunolocalization (Fig. 38).
Distribution of VEGF immunolocalisation in control animals at 5.5 days of pregnancy
followed a similar pattern of expression to the control animals at 4.5 days of pregnancy.
However, the luminal epithelial cells, the glandular and decidual stromal cells of the 5.5
day control animals expressed a much higher intensity of VEGF localization compared to
those of 4.5 day pregnancy (Fig. 39).
Hyperstimulated animals at 5.5 days of pregnancy expressed VEGF localization in the
luminal epithelial cells and glandular cells. The intensity of VEGF imunolacalization
was similar to that at 4.5 day hyperstimulated animals. The stromal cells at this stage, as
at 4.5 days, did not show immunolocalization (Fig. 40).
At 6.5 days in the control animals, VEGF was differently localized when compared to the
control animals at 5.5 days of pregnancy. These differences were particularly evident in
the distribution of VEGF in the luminal epithelial cells and stromal cells. The luminal
epithelial cells at the antimezometrial side, immediately adjacent to the embryo did not
show VEGF localization, while localization was evident in the luminal epithelial cells at
the mesometrial side of the lumen (Fig. 41). In addition, at the antimesometrial side
some of the cells of the embryo, which appeared to be trophoblastic cells, showed intense
immunolocalization of VEGF (Fig. 42). VEGF was also localized to the embryonic cells
(Fig. 42). Decidual stromal cells showed immunolocalization in both, the primary and
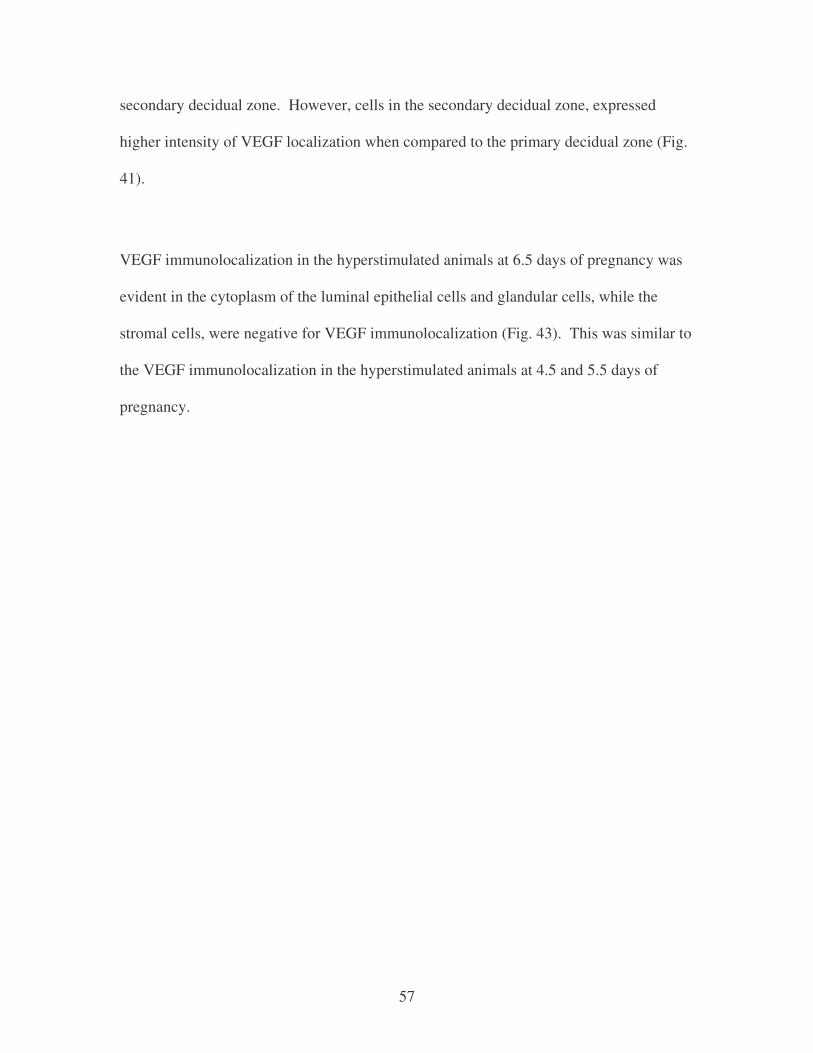
57
secondary decidual zone. However, cells in the secondary decidual zone, expressed
higher intensity of VEGF localization when compared to the primary decidual zone (Fig.
41).
VEGF immunolocalization in the hyperstimulated animals at 6.5 days of pregnancy was
evident in the cytoplasm of the luminal epithelial cells and glandular cells, while the
stromal cells, were negative for VEGF immunolocalization (Fig. 43). This was similar to
the VEGF immunolocalization in the hyperstimulated animals at 4.5 and 5.5 days of
pregnancy.
�
�
�
�
�
�
�
�
�
�
�
58
3.5 Summary of COX2 and VEGF immunolocalization in the control and
hyperstimulated animals at 4.5; 5.5 and 6.5 days of pregnancy
Both COX2 and VEGF were immunolocalized to the uterine tissue at the different stages
of pregnancy examined and in both control and hyperstimulated animals. However,
differences, as well as similarities, in the distribution of COX2 and VEGF
immunolocalization were evident between the two groups of animals at the various stages
of pregnancy.
COX2 was expressed in the control groups of animals at 4.5, 5.5 and 6.5 days of
pregnancy in the luminal epithelial cells, glandular cells and in the stromal cells that
showed decidualization. While COX2 immunolocalization in the luminal and glandular
epithelial cells was prominent in the control animals at 4.5 days, the intensity of
immunolocalization decreased in these cells with the progression of pregnancy. A high
intensity of cytoplasmic COX2 immunolocalization was evident in the decidual stromal
cells of the control animals at 6.5 days of pregnancy particularly in the region
immediately adjacent to the luminal epithelial cells (primary decidual zone).
In the hyperstimulated animals at 4.5 days, COX2 was present in the luminal epithelial
cells and glandular epithelial cells and the intensity of immunolocalization increased
slightly in these cells at 5.5 and 6.5 days of pregnancy. The major difference in COX2
immunolocalization between control and hyperstimulated animals was noted in the
stromal cells. While the stroma of the control animals became decidualized and showed
59
COX2 localization in these cells at 4.5, 5.5 and 6.5 days of pregnancy, the stromal cells
of hyperstimulated animals did not show decidua formation or localization of COX2 at
any of the stages of pregnancy examined.
VEGF, like COX2 was immunolocalized to the luminal epithelial cells, glandular cells
and decidual stromal cells of the uterine tissue in the control animals at 4.5, 5.5 and 6.5
days of pregnancy. Differences in the intensity of VEGF compared to COX2 expression
were noticed in these cells in the control animals. The luminal epithelial and glandular
cells showed intense VEGF immuniolocalization at all stages of pregnancy examined
which was opposite to the COX2 immunolocalization. Expression of COX2 decreased in
these cells with the progression of pregnancy. In addition, luminal epithelial cells did not
show VEGF immunolocalization at the antimesometrial side around the implanting
blastocyst at 6.5 days of pregnancy, while the simple cuboidal luminal epithelial cells at
the mesometrial side expressed strong VEGF immunolocalization. Stromal cells
exhibited differences in immunolocalization of VEGF compared to COX2
immunolocalization at 6.5 days of pregnancy. While COX2 was intensely localized in
the decidual cells immediately adjacent to the luminal epithelial cells and decreased in
the cells distant to this area, the opposite was true for VEGF immunolocalization. Intense
VEGF immunolocalization was evident in the decidual stromal cells of the secondary
decidual zone.
In the hyperstimulated animals, VEGF was present in the luminal epithelial cells and
glandular cells, but was absent in the stromal cells which remained flat at all stages of

60
pregnancy examined. This was the same for COX2 immunolocalization. While
cytoplasmatic COX2 immunolocalization was unevenly distributed in the cytoplasm of
the luminal epithelial cells, VEGF was evenly expressed in these cells at all stages of
pregnancy examined.
�
�
��
61
3.10 Western blot analysis for VEGF and COX2 Western blot analysis was carried out on samples of extracted protein from the uterine
tissue of the control and hyperstimulated animals at all the stages of pregnancy examined.
Following electrophoresis of the samples, the gel incubated with destain 1 and destain 2
was observed to determine the band of interest (Fig. 44). However, it appeared that no
band corresponding to the range of 21/42kDa (molecular weight of VEGF) or band in the
range of 72-74kDa (molecular weight of COX2) was present.
The second gel obtained after electrophoresis was used for protein transfer on to the
nitrocellulose membrane as per materials and methods. After incubation with the primary
and secondary antibodies the membranes were incubated with POD in order to visualize
the bands. However, no bands indicating VEGF or COX2 were visible on the membrane.
Although different concentrations of the primary and secondary antibody were incubated
with the membranes, and an increased volume of the samples was loaded for
electrophoresis, no results could be produced. The reason for unsuccessful Western blot
analysis may be that the concentration of VEGF and COX2 in the sample was too low, as
very small pieces of the uterine tissue were used for the protein extraction. The coloured
protein molecular weight marker used indicated that the transfer during the blotting was
successful (Fig. 45).

62
Fig. 7: Representative photomicrograph of dissected uterine horns of a 5.5 day
control animal. Note the presence of numerous blue bands (implantation
sites; 13 in total). Ovaries appear normal. Pontamine blue reaction.
Fig. 8: Representative photomicrograph of dissected uterine horns of a 5.5 day
hyperstimulated animal. Note the dilated uterine horns and no evidence of
blue stained implantation sites. Ovaries appear large with numerous
follicles. Pontamine blue reaction.

63
�������� ��
�
�
�
�

64
Fig. 9: Representative histological section of 4.5 day control ovarian tissue.
Note numerous well developed corpora lutea (CL). Haematoxylin and
eosin. x10.
Fig. 10: Representative histological section of 5.5 day hyperstimulated ovarian
tissue. Note numerous large follicles (FL) and numerous small corpora
lutea (CL). Haematoxylin and eosin. x10.
�������
�

65
�
�
�
�
�
�

66
Fig. 11: Representative histological section of 4.5 day control uterine tissue.
Note the apposed uterine walls at the antimesometrial site (AMM), and the
smooth appearance of the uterine lumen. Decidualisation (DEC) is
evident around the implanting embryo (EMB). Numerous uterine glands
(GL) are present. Haematoxylin and eosin. x10.
Fig. 12: Higher magnification of 4.5 day control uterine tissue seen in Fig. 8. Note
the simple cuboidal luminal epithelial cells with rounded centrally placed
nuclei (N). The luminal epithelial cells contained vacuoles (V) basally
placed in the cell. Immediately adjacent to the luminal epithelial cells
around the implanting embryo (EMB), the stromal cells are rounded,
indicating decidua formation (DEC). Haematoxylin and eosin. x40.
Fig. 13. Representative histological section of 4.5 control uterine tissue. Note the
simple cuboidal luminal epithelial cells (LE) and glandular cells (GL) with
vacuoles basally placed. The nucleus is centrally placed in the luminal
epithelial cells. The apex of the luminal epithelial cells is covered with
microvilli (MV). Subepithelial stromal cells (DEC) are rounded with
scanty cytoplasm. Haematoxylin and eosin. x40.

67
�
�
�

68
Fig. 14: Representative histological section of 4.5 day hyperstimulated uterine
tissue. Note the dilated uterine lumen (L) with numerous luminal mucosal
folds. Numerous glands (GL) are present in the stroma (ST).
Haematoxylin and eosin. x10.
Fig. 15: Representative histological section of 4.5 day hyperstimulated uterine
tissue. Note the simple columnar luminal epithelial cells (LE) with basally
placed nuclei. The subepithelial stromal cells (ST) are flat and fibroblastic
(open lines). Haematoxylin and eosin. x40.
Fig. 16: Representative histological section of 4.5 day hyperstimulated uterine
tissue showing stroma (ST) with flat, fibroblastic cells surrounding the
uterine glands (GL). The lumen of the glands is dilated. Glandular cells
are simple cuboidal with nuclei basally placed in each cell. Haematoxylin
and eosin. x40.
�
�

69
�
�
�

70
�
�
�
Fig. 17: Representative histological section of a 5.5 day control uterine tissue.
Note the smooth appearance of the uterine lumen (L). Numerous glands
(GL) are present in the endometrium. Note that uterine stroma at the
mesometrial uterine side (MM) appears compact, while at the
antimesometrial side (AMM) spaces between the cells are evident
indicating stromal oedema and formation of primary decidual zone (PDZ).
Haematoxylin and eosin. x10.
Fig. 18: Representative histological section of a 5.5 day pregnant uterine tissue
showing simple cuboidal luminal epithelial cells (LE) with numerous
microvilli (MV) on the apical border of the cells. Nuclei (N) are rounded
and situated towards base of the cells. Note scanty cytoplasm in the
decidual stromal cells (STR) and potential spaces between these cells as a
result of tissue oedema. Haematoxylin and eosin. x40.

71
�
�
�
�
�

72
�
�
�
Fig. 19: Representative histological section of a 5.5 day hyperstimulated uterine
tissue. Note dilated lumen (L) and numerous luminal mucosal folds (LF).
Haematoxylin and eosin. x10.
Fig. 20: Representative histological section of a 5.5 day hyperstimulated uterine
tissue. Stromal cells (STR) are fibroblastic in shape. Uterine
glandular cells (GL) are simple columnar with rounded basally placed
nuclei. Haematoxylin and eosin. x40.
�
�
�

73
�
�
�
�
�
�
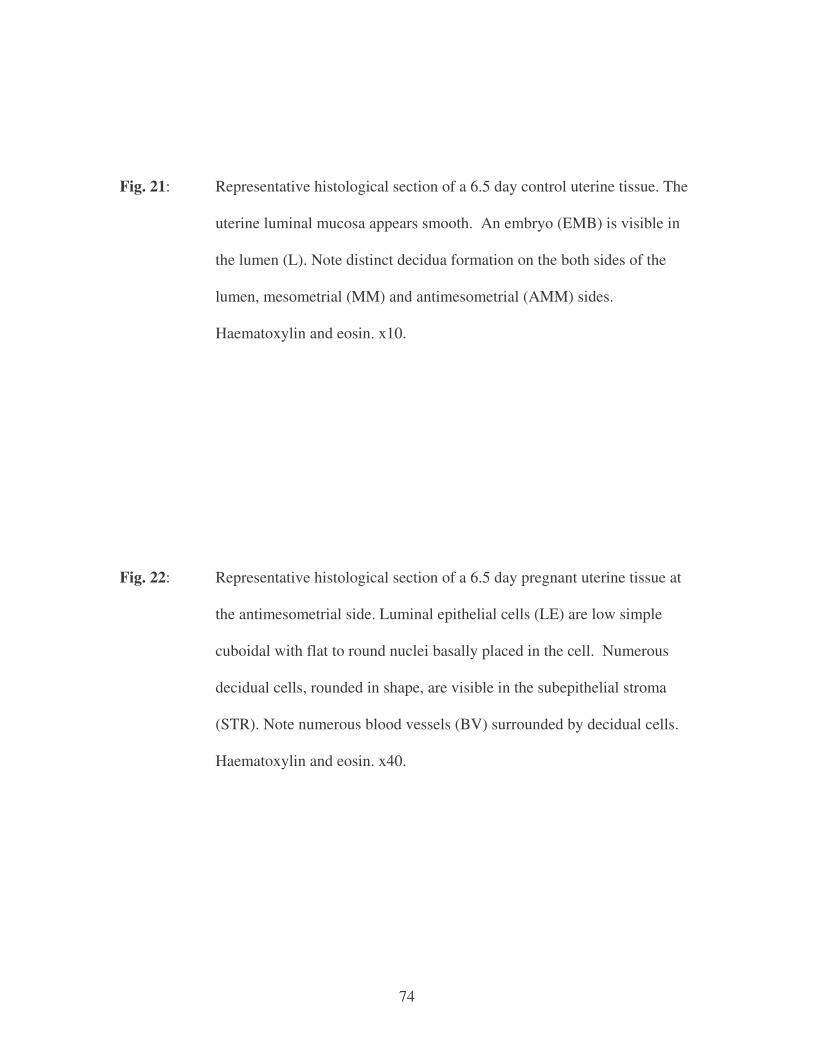
74
Fig. 21: Representative histological section of a 6.5 day control uterine tissue. The
uterine luminal mucosa appears smooth. An embryo (EMB) is visible in
the lumen (L). Note distinct decidua formation on the both sides of the
lumen, mesometrial (MM) and antimesometrial (AMM) sides.
Haematoxylin and eosin. x10.
Fig. 22: Representative histological section of a 6.5 day pregnant uterine tissue at
the antimesometrial side. Luminal epithelial cells (LE) are low simple
cuboidal with flat to round nuclei basally placed in the cell. Numerous
decidual cells, rounded in shape, are visible in the subepithelial stroma
(STR). Note numerous blood vessels (BV) surrounded by decidual cells.
Haematoxylin and eosin. x40.
�
�

75
�
�
�
�
�

76
�
�
Fig. 23: Representative histological section of a 6.5 day hyperstimulated uterine
tissue. Numerous mucosal folds (LF) are present in the dilated lumen (L).
Note the numerous uterine glands (GL) in the stroma (STR).
Haematoxylin and eosin. x10.
Fig. 24: Representative histological section of a 6.5 day hyperstimulated uterine
tissue. Note simple tall columnar luminal epithelial cells (LE). Vacuoles
are not present in the cytoplasm of these cells. The stromal cells (STR)
are flat and fibroblastic. The glandular cells (GL) are simple columnar
with basally placed nuclei. Haematoxylin and eosin. x40.
�
�
�
�

77
�������������� �
�
��������������������� �
�

78
Fig. 25: Representative histological section of lung carcinoma tissue incubated
with COX2 antibody. Note COX2 immunolocalization in the cytoplasm
of the tumorous cells. Counterstained with haematoxylin. x40.
Fig. 26: Representative histological section of 6.5 day hyperstimulated uterine
tissue incubated with COX2 antibody, showing immunolocalization to the
luminal epithelium (LE) Counterstained with haematoxylin. x40.
Fig. 27a: Representative histological section adjacent to the section showing
immunolocalization of 6.5 day hyperstimulated uterine tissue where the
primary COX2 antibody was replaced with TRIS. Note the absence of
immunolocalization in any compartment of the tissue. Counterstained with
Haematoxylin. x40.
Fig. 27b: Representative histological section adjacent to the section showing
immunolocalization of 6.5 day hyperstimulated uterine tissue where the
secondary antibody was replaced with TRIS. Note the absence of
immunolocalization in any compartment of the tissue. Counterstained with
Haematoxylin. x40.

79

80
Fig. 28: Representative histological section of a 4.5 day control uterine tissue.
Note immunolocalisation of COX2 in the luminal epithelial cells (LE).
Note scanty localization of COX2 in the cytoplasm of the subepithelial
stromal cells (straight lines). Counterstained with haematoxylin. x40.
Fig. 29: Representative histological section of a 4.5 day hyperstimulated uterine
tissue. Note the strong but variable immunolocalization of COX2 in the
luminal epithelial cells (LE). In the glandular cells (GL) scanty
immunolocalization is evenly distributed. No localization of the antibody
was observed in the subepithelial stromal cells. Counterstained with
haematoxylin. x40.
�
�
�
�
�

81
�
�
�

82
Fig. 30: Representative histological section of a 5.5 day control uterine tissue.
Immunolocalisation of COX2 in the luminal epithelial cells (LE) and
glandular cells (GL) is present, but weak. Note irregular COX2
immunolocalization in the subepithelial stromal cells (STR).Cells
immediately adjacent to the luminal epithelial cells show intense
immunolocalization (straight lines), compared to the cells distant to the
luminal epithelial cells. Counterstained with haematoxylin. x40.
Fig. 31: Representative histological section of a 5.5 day hyperstimulated uterine
tissue. Note intense but irregular immunolocalization of COX2,
predominantly distributed around the nucleus of the luminal epithelial
cells (LE). Immunolocalization is evident in the glandular cells, while no
localization of the antibody is observed in the subepithelial stromal cells
(STR). Counterstained with haematoxylin. x40.
�
�
�

83
�
�
�
�
�
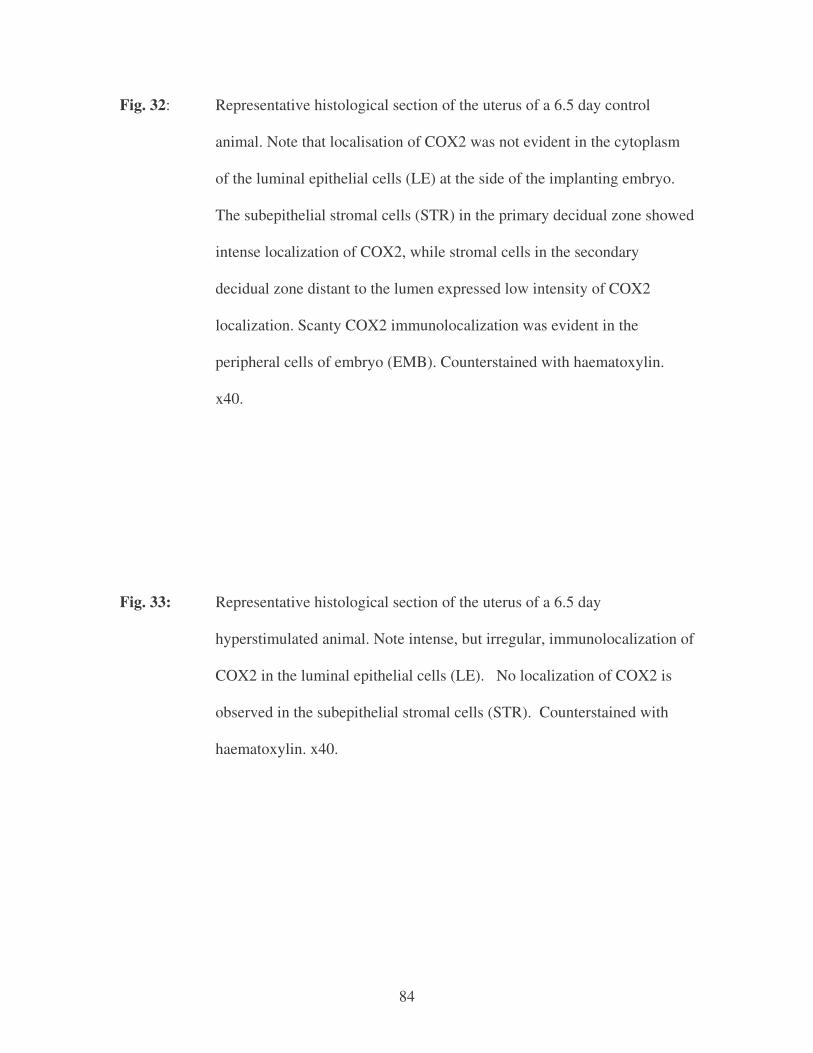
84
Fig. 32: Representative histological section of the uterus of a 6.5 day control
animal. Note that localisation of COX2 was not evident in the cytoplasm
of the luminal epithelial cells (LE) at the side of the implanting embryo.
The subepithelial stromal cells (STR) in the primary decidual zone showed
intense localization of COX2, while stromal cells in the secondary
decidual zone distant to the lumen expressed low intensity of COX2
localization. Scanty COX2 immunolocalization was evident in the
peripheral cells of embryo (EMB). Counterstained with haematoxylin.
x40.
Fig. 33: Representative histological section of the uterus of a 6.5 day
hyperstimulated animal. Note intense, but irregular, immunolocalization of
COX2 in the luminal epithelial cells (LE). No localization of COX2 is
observed in the subepithelial stromal cells (STR). Counterstained with
haematoxylin. x40.
�

85
�
�
�
�
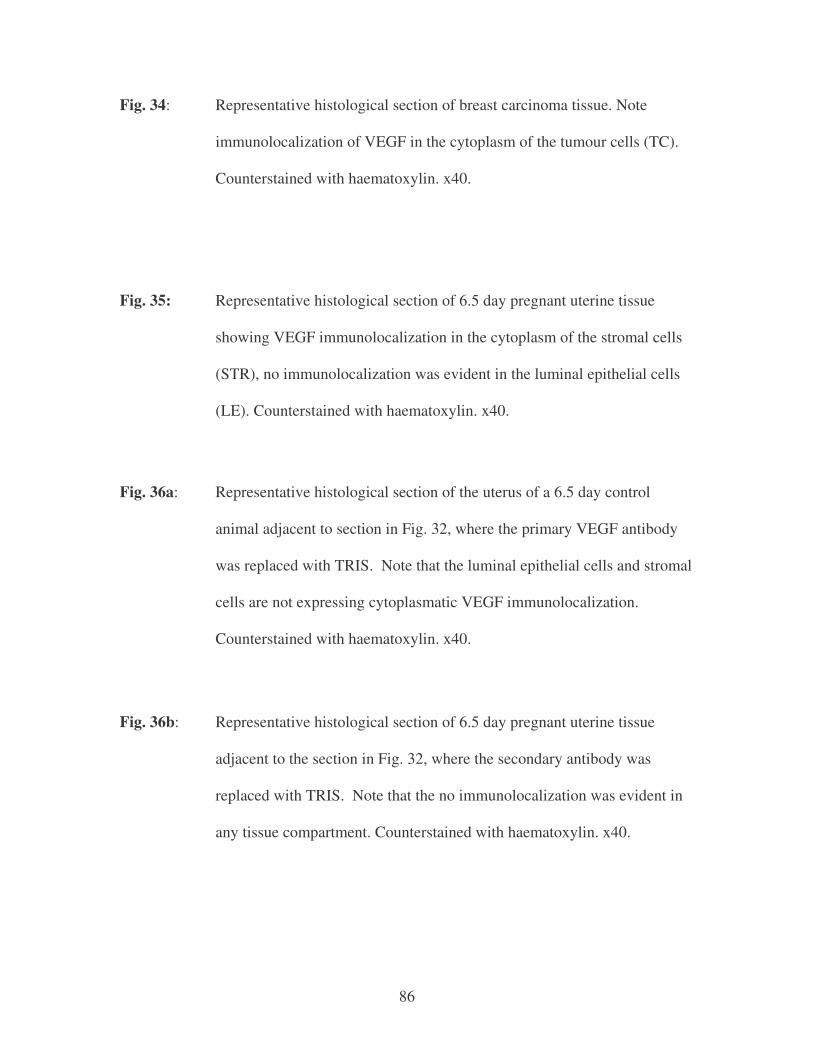
86
Fig. 34: Representative histological section of breast carcinoma tissue. Note
immunolocalization of VEGF in the cytoplasm of the tumour cells (TC).
Counterstained with haematoxylin. x40.
Fig. 35: Representative histological section of 6.5 day pregnant uterine tissue
showing VEGF immunolocalization in the cytoplasm of the stromal cells
(STR), no immunolocalization was evident in the luminal epithelial cells
(LE). Counterstained with haematoxylin. x40.
Fig. 36a: Representative histological section of the uterus of a 6.5 day control
animal adjacent to section in Fig. 32, where the primary VEGF antibody
was replaced with TRIS. Note that the luminal epithelial cells and stromal
cells are not expressing cytoplasmatic VEGF immunolocalization.
Counterstained with haematoxylin. x40.
�
Fig. 36b: Representative histological section of 6.5 day pregnant uterine tissue
adjacent to the section in Fig. 32, where the secondary antibody was
replaced with TRIS. Note that the no immunolocalization was evident in
any tissue compartment. Counterstained with haematoxylin. x40.

87
�
�
�
����������� �
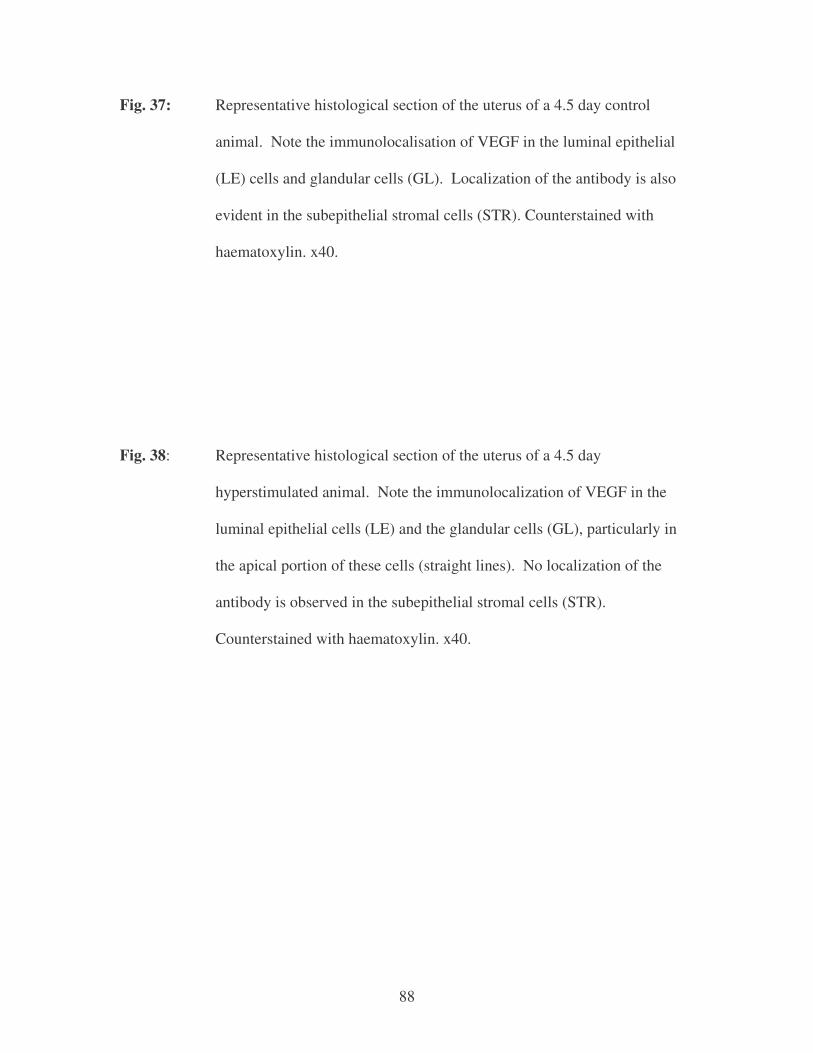
88
Fig. 37: Representative histological section of the uterus of a 4.5 day control
animal. Note the immunolocalisation of VEGF in the luminal epithelial
(LE) cells and glandular cells (GL). Localization of the antibody is also
evident in the subepithelial stromal cells (STR). Counterstained with
haematoxylin. x40.
Fig. 38: Representative histological section of the uterus of a 4.5 day
hyperstimulated animal. Note the immunolocalization of VEGF in the
luminal epithelial cells (LE) and the glandular cells (GL), particularly in
the apical portion of these cells (straight lines). No localization of the
antibody is observed in the subepithelial stromal cells (STR).
Counterstained with haematoxylin. x40.
�
�
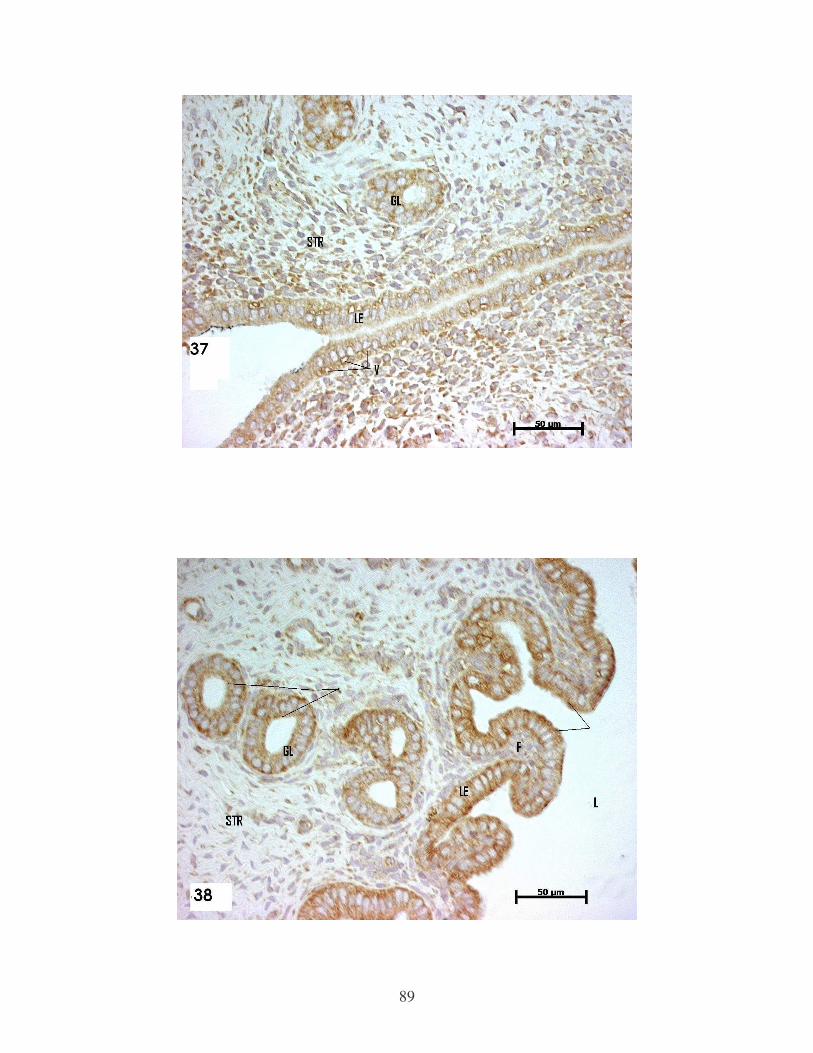
89
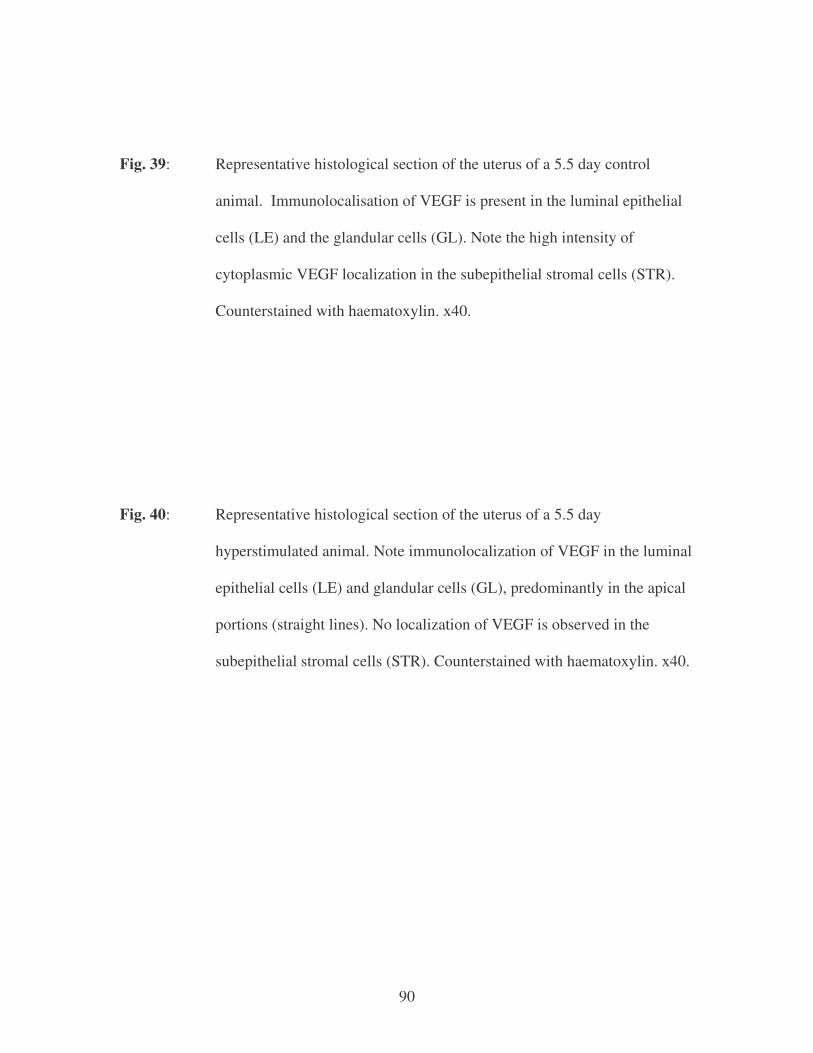
90
Fig. 39: Representative histological section of the uterus of a 5.5 day control
animal. Immunolocalisation of VEGF is present in the luminal epithelial
cells (LE) and the glandular cells (GL). Note the high intensity of
cytoplasmic VEGF localization in the subepithelial stromal cells (STR).
Counterstained with haematoxylin. x40.
Fig. 40: Representative histological section of the uterus of a 5.5 day
hyperstimulated animal. Note immunolocalization of VEGF in the luminal
epithelial cells (LE) and glandular cells (GL), predominantly in the apical
portions (straight lines). No localization of VEGF is observed in the
subepithelial stromal cells (STR). Counterstained with haematoxylin. x40.

91

92
Fig. 41: Representative histological section of the uterus of a 6.5 day pregnant
animal. An embryo (EMB) is visible in the lumen at the antimesometrial
side (AMM). Stromal cells immediately adjacent to the luminal epithelial
cells (primary decidual zone PDZ) show less VEGF immunolocalization
compared to the stromal cells in the secondary decidual zone (SDZ).
Counterstained with haematoxylin. x10.
Fig. 42: Representative histological section of the uterus of a 6.5 day control
animal. Luminal epithelial cells (LE) do not show VEGF localization.
Note scanty cytoplasmatic localization in the decidual cells (DEC)
immediately adjacent to the implanting embryo (E). Embryonic cells
show high intensity of VEGF immunolocalization. Counterstained with
haematoxylin. x40.
�
�
�

93
�
�

94
Fig. 43: Representative histological section of the uterus of a 6.5 day
hyperstimulated animal. Note numerous folds, lined with the simple
columnar epithelium, showing apical VEGF cytoplasmic
immunolocalization (straight lines). The immunolocalization is also
evident in the glandular cells. Stromal cells are flat and fibroblastic and
do not show VEGF immunolocalization. Counterstained with
haematoxylin. x40.
�

95

96
Fig. 44: Representative gel after protein separation stained with Commasie
stain in the different groups of animals. Lane A was loaded with
molecular weight marker (Sigma-Aldrich Co., USA), B= protein extract
sample of 6.5 day control rat, C = 6.5 day hyperstimulated rat, D = 5.5
control rat, in E =5.5 day hyperstimulated rat, F = 4.5 day control rat and
G = 4.5 day hyperstimulated rat.

97
Fig. 45: Nitrocellulose membrane after Western blotting, representing
expression of VEGF protein in the rat uterus. The molecular weight
marker confirmed successful transfer from the gel to the membrane.
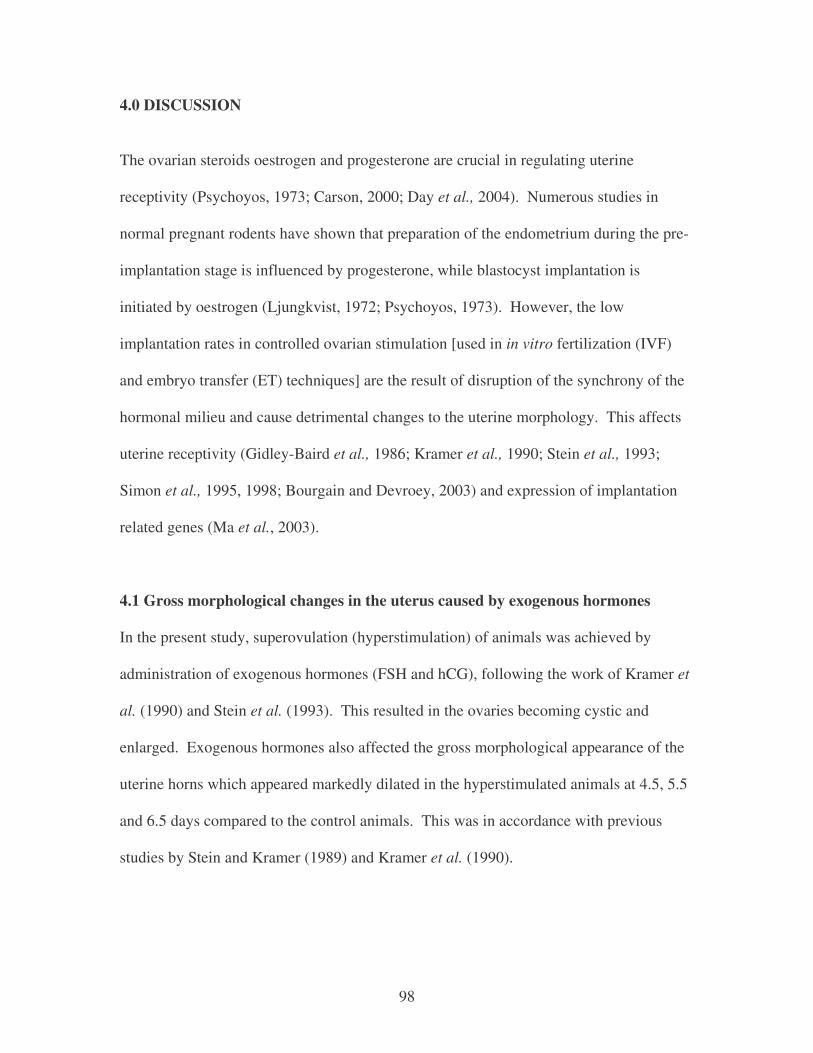
98
4.0 DISCUSSION
The ovarian steroids oestrogen and progesterone are crucial in regulating uterine
receptivity (Psychoyos, 1973; Carson, 2000; Day et al., 2004). Numerous studies in
normal pregnant rodents have shown that preparation of the endometrium during the pre-
implantation stage is influenced by progesterone, while blastocyst implantation is
initiated by oestrogen (Ljungkvist, 1972; Psychoyos, 1973). However, the low
implantation rates in controlled ovarian stimulation [used in in vitro fertilization (IVF)
and embryo transfer (ET) techniques] are the result of disruption of the synchrony of the
hormonal milieu and cause detrimental changes to the uterine morphology. This affects
uterine receptivity (Gidley-Baird et al., 1986; Kramer et al., 1990; Stein et al., 1993;
Simon et al., 1995, 1998; Bourgain and Devroey, 2003) and expression of implantation
related genes (Ma et al., 2003).
4.1 Gross morphological changes in the uterus caused by exogenous hormones
In the present study, superovulation (hyperstimulation) of animals was achieved by
administration of exogenous hormones (FSH and hCG), following the work of Kramer et
al. (1990) and Stein et al. (1993). This resulted in the ovaries becoming cystic and
enlarged. Exogenous hormones also affected the gross morphological appearance of the
uterine horns which appeared markedly dilated in the hyperstimulated animals at 4.5, 5.5
and 6.5 days compared to the control animals. This was in accordance with previous
studies by Stein and Kramer (1989) and Kramer et al. (1990).

99
Intravenous injection of a macromolecular blue dye, pontamine blue, results in the
appearance of blue bands at the site of the implanting embryos (Psychoyos, 1973).
Control animals showed numerous blue bands along the uterine horns at 5.5 and 6.5 days
of pregnancy, while in the hyperstimulated animals, blue bands were not observed,
indicating failure of vascular permeability and embryo implantation in these animals.
4.2. Oestradiol and progesterone concentrations and the P:E2 ratio in the control
and hyperstimulated animals during the peri-implantation period
In the present study, the oestradiol concentrations increased with the progression of
pregnancy in the control animals while, in the hyperstimulated animals an initial rise of
oestradiol concentrations from 4.5 days to 5.5 days was followed by a marked decrease at
6.5 days.
Although the oestradiol concentration was higher in the hyperstimulated compared to the
control animals at 4.5 days of pregnancy, this was not statistically significant. This was
not in agreement with the findings of Kramer et al. (1990), where a statistically higher
oestradiol concentration was found in the hyperstimulated animals compared to control
animals at 4.5 days of pregnancy. While the type of animals and protocols were identical
in the study by Kramer et al. (1990) and the present study, the differences in these two
observations may be due to the different kits used to assess oestradiol concentration. In
the present study, an oestradiol ELISA kit was used, while in the study by Kramer et al.
(1990) a RIA kit was used to measure oestradiol concentrations. In addition, although in
both studies the blood samples were obtained from the animals in the morning, slight
100
difference in timing of obtaining the samples may cause different outcomes. This is due
to the variations in timing of implantation that can differ between animals by half a day
(Enders, 1975), as well as rapid fluctuations in the hormonal levels during the short peri-
implantation period.
The oestradiol concentrations were higher in both the control and hyperstimulated
animals at 5.5 days of pregnancy when compared to that at 4.5 days. In addition, the
hyperstimulated animals had higher oestradiol concentrations at 5.5 days compared to the
animals in the control group on the same day of pregnancy. However, once again, this
was not statistically significant. A similar finding was previously reported by Kramer et
al. (1990), where no statistically significant differences were found in the
hyperstimulated compared to the control animals on day 5.5 of pregnancy, although
higher oestradiol levels were evident in the hyperstimulated animals. The similarity in
the results between the present and the previous study by Kramer et al. (1990) may be
due to a better correlation in the timing of sample collections from these animals.
Statistically significantly lower oestradiol concentrations in the hyperstimulated animals
compared to the control animals at 6.5 days were the result of a marked decrease in the
oestradiol concentration in the hyperstimulated animals. In the study by Kramer et al.
(1990) no statistically significant differences were noted in the hyperstimulated animals
at 6.5 days. This does not correspond with the present study. However, again it is
possible that some of the animals, due to a difference in timing of sample collection were

101
in a more advanced phase of pregnancy compared to the animals in the previous study,
causing discrepancies in the results between the two studies.
In the control animals, the rise of progesterone concentrations from 4.5 days to 5.5 days
of pregnancy, and a slight decrease at 6.5 days of pregnancy was noted. However, in the
hyperstimulated animals, the progesterone concentrations increased with the progression
of pregnancy. Statistically significantly higher progesterone concentrations were found
in the hyperstimulated animals when compared with the control animals at 6.5 days of
pregnancy. In a previous study by Kramer et al. (1990), progesterone concentrations
were measured in the control and hyperstimulated animals from 1.5 to 6.5 days of
pregnancy. However, no statistically significant differences in progesterone levels were
found at any stage of pregnancy between the control and hyperstimulated animals.
Differences in the outcome of the progesterone concentrations in the present study and
the previous study by Kramer et al. (1990) may be due to the different kits used in these
two studies.
It is well established that steroidal hormones, oestrogen and progesterone do not act
independently in mediating events in the preparation of the uterus for the blastocyst
implantation and establishment of pregnancy (Psychoyos, 1973; Gidley-Beard et al.,
1986; Tan et al., 1999). Gidley-Beard et al. (1986) proposed that assessing the
progesterone:oestradiol ratio (P:E2) could be considered as a better predictor for the
success of implantation than assessment of the levels of either hormone. Studies in
women attending infertility clinics showed that a higher P:E2 ratio and lower oestradiol
102
levels were a common appearance in women that became pregnant to those that failed to
became pregnant after treatment with the exogenous hormones (Gidley-Beard et al.,
1986). Kramer et al. (1990) reported a similar finding in the study on the rats treated
with exogenous hormones. The lower P:E2 ratio and higher oestradiol concentrations
during the peri-implantation stages of these animals coincided with the suppression of
implantation. The control animals however, had higher P:E2 ratio and lower oestradiol
concentrations which was accompanied by implantation of numerous blastocysts. The
present study is in support of observations by Gidley-Beard et al. (1986) and Kramer et
al. (1990). The control animals had higher P:E2 ratio and lower oestradiol levels at the
time of blastocyst apposition, attachment and initiation of implantation at days 4.5 and
5.5 of pregnancy when compared to the hyperstimulated animals at the same stages of
pregnancy. Numerous implantation sites were evident in the control animals at 5.5 and
6.5 days of pregnancy, while no implantation sites were evident in the hyperstimulated
animals. At 6.5 days of pregnancy, the hyperstimulated animals had a higher P:E2 ratio
and lower oestradiol concentrations when compared to the control animals at 6.5 days of
pregnancy. However, implantation sites were observed only in the control animals.
4.3. Uterine receptivity and embryo implantation in the control and hyperstimulated
animals
The specific, transient, but unique period of uterine receptivity known as the “window”
of implantation is a limited period of time which determines the uterine readiness to
accept the blastocyst (Psychoyos, 1973; Day, 1996; Ma et al., 2003). Ma et al. (2003)
reported that oestrogen at different physiological concentrations can initiate implantation

103
while, the higher oestrogen concentrations affect the duration of the window of
implantation, causing its rapid closure. The window of implantation is also characterized
by the morphological features of the receptive uterus, necessary for successful
implantation (Enders and Schlafke, 1967; Psychoyos, 1973; Enders, 1975; Kramer et al.,
1990).
In the present study at 4.5 days of pregnancy in the control rats, blastocysts were found at
the antimesometrial side of the smooth uterine lumen. The luminal fluid was reduced
indicated by the luminal walls appearing to be in apposition, closing down around the
blastocyst. Reduction of the uterine luminal fluid is associated with uterine receptivity in
the rat and dependant on the presence of a blastocyst and appropriate hormonal
environment (Lindsay and Murphy, 2006.). Also in the human uterus, embryo
attachment is accompanied by the extraction of uterine luminal fluid (Edwards, 1995).
These morphological changes in the uterine tissue of the control animals allow
trophoblastic cells of the implanting blastocyst to be in close contact with the luminal
epithelial cells (Enders and Schlafke, 1967). In the hyperstimulated animals at 4.5 days,
the uterine lumen was highly folded and dilated. Luminal dilation in these animals
indicated the presence of excessive fluid. High oestradiol and progesterone levels in
these animals appear to be the cause of aberrant redistribution of aquaporins (specialized
transporters for the fluid in the transcellular fluid transport across cells) causing fluid
retention in the uterine lumina of the hyperstimulated animals (Lindsay and Murphy,
2006).

104
Since the luminal epithelial cells are the site of the attachment of the blastocyst with the
uterus, transition of the surface epithelium from the non-receptive to receptive state
occurs as remodeling of these cells under the influence of the ovarian hormones
(Psychoyos, 1973). The hormonal regulation is mediated through nuclear receptors, the
oestrogen receptors � and ß (ER- � and ER- ß) and the progesterone receptor (PR) which
exists in two isoforms (Tan et al., 1999). Tan et al. (1999) reported proliferation of the
luminal epithelial cells under the influence of pre-ovulatory oestrogen which coincides
with the expression of the oestrogen receptor � (ER-�) in these cells on day 1 and 2 of
pregnancy. A decrease in proliferation and occurrence of differentiation of the luminal
epithelial cells, correlated with the expression of ER-� and PR (Tan et al., 1999).
Differentiation of these cells is essential for implantation and occurs on day 4 of
pregnancy in mice under the influence of progesterone and a nidatory surge of oestrogen
(Tan et al., 1999).
In the present study, the simple cuboidal luminal epithelial cells of the control animals at
4.5 days of pregnancy showed morphological features of the receptive epithelium. The
luminal epithelial cells contained large, basally placed lipid vacuoles, and their apical
portions were covered with short microvilli. These findings were consistent with findings
by Enders and Schlafke (1967). Also, Psychoyos and Martel (1985) reported flattening
of the microvilli of the luminal epithelial cells around the receptive phase in the normal
rat uterus. In contrast, in the hyperstimulated animals the luminal epithelial cells were
high columnar and did not contain vacuoles, while microvilli were numerous and
appeared longer compared to that of the control animals. With the progression of
105
pregnancy in the rat uterus, other specializations of the apical portions of the luminal
epithelial cells emerge. Ljungkvist (1972) reported flattening of the microvilli and
appearance of cytoplasmic projections or “pinopodes” in the rodent uterus. Similar
structures are evident in the human uterus by day 18-19 of the menstrual cycle and are
present for 24-48 hours (Psychoyos and Martel, 1985). The pinopodes or uterodomes in
the human uterus are believed to be involved in the reduction of the luminal fluid
(Psychoyos and Martel, 1985). The pinopodes are also considered as specific markers of
uterine receptivity (Bagot et al., 2001).
The morphological features of the luminal epithelium of the hyperstimulated animals
coincided with the increased oestradiol levels in these animals when compared to the
control animals at the same stage of pregnancy. A previous study by Ljunkvist (1972)
showed that the microvilli of the luminal epithelial cells increased in length after
oestrogen treatment of ovariectomized mice. Williams and Rogers (1980) demonstrated
marked reduction in the cytoplasmic lipid droplets in the ovariectomized rat after
treatment with oestrogen. Kramer et al. (1990) and Stein et al. (1993) reported
significantly higher epithelium in the hyperstimulated animals at 4.5 days, when higher
oestrogen and progesterone levels were recorded. The findings in the present study are
consistent with these studies, were, in the hyperstimulated animals, higher oestradiol
levels where associated with tall columnar luminal epithelial cells. Cytoplasmic lipid
vacuoles were absent from these cells. Therefore the nuclei were not displaced and were
basally placed.

106
The stroma of the 4.5 day control animals was compact, except at the antimesometrial
side where a number of cells were rounded and widely separated, indicating tissue
oedema. Enders and Schlafke (1967) previously reported similar results, indicating that
the subepithelial stroma remains compact in the rat uterus on a day 5 (4.5).
In contrast, the subepithelial stroma of the hyperstimulated animals at day 4.5 remained
compact, with flat, fibroblastic cells. Thus, the stroma did not show signs of
decidualization. It has been suggested that failure of the stromal cells to decidualise
following hyperstimulation is due to the increased levels of oestradiol caused by
administration of the exogenous hormones, FSH and hCG (Stein and Kramer, 1987;
Fossum et al., 1989; Kramer et al., 1990; Kramer, 1997). Numerous studies of the human
endometrium suggest unfavorable, detrimental endometrial changes resulting in low
implantation rates under the influence of the exogenous hormones used in assisted
reproductive procedures (Testart, 1987; Sterzik et al., 1988; Fossum et al., 1989; Paulson
et al., 1990).
At the electron microscopic level in the control rats, well defined fenestrations in, and
gaps between, endothelial cells in the uterine thin-walled blood vessels are present in the
control animals at 4.5 and 6.5 days of pregnancy, allowing vascular leakage at the site of
implantation (Kramer et al., 1993; Kramer, 1997). These are not present in the blood
vessels of hyperstimulated animals at the same stages of pregnancy (Kramer et al., 1993;
Kramer, 1997). The vascular permeability at the site of implantation can be
demonstrated by the injection of the pontamine blue dye, resulting in the formation of the

107
blue bands along the uterine horns at the site of the implanting blastocyst (Psychoyos,
1973). However, blue bands were not observed in the hyperstimulated and control
animals at 4.5 days, except in one control animal where three blue bands were found.
The animals were killed on the morning of day 4.5 of pregnancy which is prior to the
time given for normal implantation (Enders and Schlafke, 1967; Psychoyos, 1973), and
the pontamine blue reaction is not usually found at that time (Enders and Schlafke, 1967).
However, the presence of blue bands in an animal at 4.5 days is a possible occurrence, as
variation may occur in the time of implantation in different animals (Enders, 1975).
Changes in the uterine morphology under the synchronized release of steroid hormones in
the control animals were favorable for blastocyst implantation which resulted in
numerous implantation sites in the 5.5 day control animals. This was confirmed by
numerous blue stained bands along the uterine horns of the control animals. Routine
histology of the uterine tissue of the 5.5 day control animals showed flattening of the
luminal epithelial cells at the antimesometrial side of the lumen, together with
disappearance of vacuoles in these cells. The nuclei of these cells were irregular in shape.
These findings are consistent with the previous findings of Psychoyos (1973) and Parr et
al. (1987). The microvilli of the luminal epithelial cells at the site of blastocyst
implantation were flattened, compared to the microvilli of these cells at the mesometrial
side (Enders, 1975; Parr et al., 1987). On the contrary, the histological appearance of the
luminal epithelial cells of the hyperstimulated animals at 5.5 day appeared unchanged
when compared to that at 4.5 days.

108
The subepithelial stromal cells around the implanting blastocyst in the control animals at
day 5.5 of pregnancy were rounded with large nuclei indicating formation of a distinct
decidual zone. The proliferation of the subepithelial stromal cells was previously defined
as the primary decidual zone by Day (1996). The stroma of these animals was also
highly vascularized and oedematous. However, in the hyperstimulated animals
decidualization did not occur and the cells appeared compact as has been previously
reported (Stein and Kramer, 1987; Kramer et al., 1990; Kramer, 1997). Observations of
the uterine horns did not show blue stained bands after the pontamine blue injection. This
indicated the failure of implantation. However, one blue band in each of two
hyperstimulated animals at 5.5 days demonstrated possible sites of blastocyst
implantation in these animals.
At this stage of pregnancy in the hyperstimulated animals, higher oestradiol and
progesterone concentrations were measured compared to that at 4.5 days of
hyperstimulation. It has been previously reported that high progesterone levels alone are
not inhibitory to implantation. Progesterone can act against the inhibitory effect of high
oestradiol levels (Gidley-Baird, 1986). A recent study on the uterus of pseudopregnant
mice showed that progesterone supplementation can extend the uterine receptivity
through day 6 (Song et al., 2007). However, in the present study, the rise of oestradiol
levels together with the rise of progesterone, coincided with the lower P:E2 ratio when
compared to the control animals at 5.5 days. This concurs with the study by Gidley-
Baird (1986) who stated that the P:E2 ratio is a better predictor of the success of the
implantation. It has also been shown by Fossum et al. (1989), that after embryo transfer
109
in mice treated with an intraperitoneal injection of pregnant mare’s serum gonadotropin
and hCG, the implantation rate decreased. The implantation rate was statistically
significantly lower in the hyperstimulated mice (8%) compared with 50% in the control
mice.
In addition, it appears that the high oestradiol levels at 4.5 days hyperstimulated animals
may have caused the premature closing of the “window” of implantation. This may have
caused the premature transition of the uterus to a refractory state. Indeed, in the present
study the persistent morphology of the uterus in the hyperstimulated animals at 4.5 and
5.5 days of pregnancy showed the features of an unsatisfactory uterine morphology for
blastocyst implantation.
In the control animals at 6.5 days of pregnancy, the luminal epithelial cells showed signs
of detachment and disappearance at the site of the implanting blastocyst, allowing the
trophoblast to invade the stroma. An ultrastructural study of the luminal epithelial cells
of mouse and rat embryo implantation sites shows features of apoptosis, rather than of
necrosis, of these cells (Parr et al., 1987). The embryos were commonly observed in the
elongated implantation region at the antimesometrial side of 6.5 days control rats with the
embryonic cell mass facing the mesometrial side of the lumen. Implantation of embryos
was followed by extensive stromal decidualization and formation of a secondary decidual
zone. Day (1996) defined the secondary decidual zone as a zone of stromal cells
proliferation outside the primary decidual zone.
110
In the hyperstimulated animals at 6.5 days, the histology of the uterus did not show any
changes compared to the hyperstimulated animals at the previous stages of pregnancy.
However, the hormonal milieu at 6.5 days hyperstimulated animals appeared to be
favorable for blastocyst implantation. The oestradiol concentrations dropped significantly
while progesterone levels increased when compared to the control animals at the same
stage of pregnancy. Even so, the P:E2 ratio was higher when compared to the previous
stages in the hyperstimulated animals and statistically significantly higher when
compared to the control animals at 6.5 days. The pontamine blue reaction was not evident
in these animals, and the histology of the uterus showed no signs of stromal oedema or
decidua formation, indicating failure of fenestration of blood vessels and lack of tissue
oedema.
In addition, it has been previously shown that although hyperstimulated animals have
typical pregnancy vaginal smears, these animals do not have successful pregnancies and
revert to the oestrous cycle after 10 days (Kramer et al., 1990). It is also known that the
closing of the window of implantation is followed by the refractory stage, when the
uterus is unable to accept the blastocyst. The refractory phase is under the influence of
the same hormones (oestrogen and progesterone) which are also responsible for the
preparation and initiation of pregnancy (Psychoyos, 1973).
The other reason for implantation failure in the hyperstimulated animals might be the
negative effect of raised steroid hormones on the development of the embryos. Previous
findings by Stein and Kramer (1989), Kramer et al. (1990) and Kramer (1997) also
111
showed that although hyperstimulated animals did not have blue bands following
pontamine blue injection, embryos were present in the lumina of the uterine horns.
However, embryos seen in tissue sections of these animals were undeveloped and
unattached to the luminal epithelium. Thus, it was possible to flush these unattached
embryos out of the uterine horns at 5.5 and 6.5 days of pregnancy (Kramer, 1997). In a
study by Ertzeid and Storeng (2001), a significantly lower implantation rate was noted
when blastocysts from the hyperstimulated donors were transferred into the control
recipient, compared to the transfer of the blastocyst from the control donors.
4.4. COX2 and VEGF expression in the control and hyperstimulated rat uterus
Studies in rodents using either pseudopregnant or knockout animal models have revealed
the importance of VEGF and prostaglandins, produced by the COX pathway, in early
pregnancy and their effect on vascular permeability and angiogenesis (Kennedy, 1977;
Kennedy and Lukash, 1982; Lim et al., 1997; Matsumoto et al., 2002; Chakraborty et al.,
1995; Bates and Harper, 2003). However, inhibition of decidualization and vascular
permeability under the influence of exogenous hormones, previously reported by Kramer
et al. (1993) and Kramer (1997) were suggested to be the result of increased levels of
oestradiol and progesterone during the peri-implantation in rats. In the present study, it
appears that expression and distribution of VEGF and COX2 during the peri-implantation
period were also affected in the hyperstimulated animals after the administration of
exogenous hormones.

112
4.4.1. COX2 Immunolocalization in the control and hyperstimulated rat uterus
In the present study, marked differences were evident in COX2 expression in the rat
uterus between the control animals at consecutive stages of pregnancy, indicating
involvement of COX2 in the regulation of numerous events during the peri-implantation
period. However, COX2 immunolocalization did not change substantially in the
hyperstimulated animals at consecutive stages of pregnancy and appeared to be severely
affected by the administration of the exogenous hormones (FSH and hCG) when
compared to the control animals. Western blot analysis did not show any results. After
electrophoresis of the protein the band corresponding to the molecular weight marker at
80kD which is the molecular weight of COX2 could not be determined. A reason for this
could be that the COX2 protein concentration in the sample was too low to be detected.
Studies in the rodent uterus have shown that prostaglandins produced from arachidonic
acid through the COX pathway are implicated in the process of vascular permeability,
angiogenesis, as well as adhesion and blastocyst invasion of the stroma during the peri-
implantation period (Chakraborty et al., 1996; Lim et al., 1997; Matsumoto et. al., 2002).
Two COX isoforms are differently expressed during the peri-implantation period in
rodents. At the site of implantation, COX1 expression is more constant and occurs in the
rodent uterus prior to implantation. COX2, on the contrary, is up-regulated during
inflammation and cellular transformation by various stimuli (Hla and Neilson, 1992,
Smith et al., 1994). The expression of COX2 is suggested to be one of the crucial factors
during the peri-implantation period in the rodent uterus (Lim et al., 1997; Matsumoto et
al., 2002).

113
In the present study, it appears that the presence of numerous implantation sites during
the peri-implantation period of the control rats was the result of the synchronized steroid
hormonal release. The routine histology of the normal pregnant uterus showed features
of the receptive uterus, while immunohistochemistry showed distribution of COX2, both
in the luminal epithelial cells and stroma. In contrast, hyperstimulated rats had higher
progesterone and oestradiol concentrations compared to the control animals during peri-
implantation period, morphological features of a non-receptive surface epithelium and
intense COX2 immunolocalization in the luminal epithelial cells, but not in the stroma.
It is well established that during early pregnancy the attachment reaction is followed by
apoptosis of the luminal epithelial cells (Parr et al., 1987; Tsujii and Du Bois, 1995;
Carson et al., 2000; Tassell et al., 2000; Zhang and Paria, 2006). At the same time,
extensive proliferation and differentiation of the stromal cells occurs to form the decidua
(Enders and Schlafke, 1967; Kramer et al., 1990; Kramer, 1997; Carson et al., 2000). In
the present study, only light microscopy was used to study the morphology of the uterus.
Thus, apoptotic luminal epithelial cells could not be identified. However, the flattening
and detachment of luminal epithelial cells noticed in the control animals at 6.5 days of
pregnancy, was not evident in the hyperstimulated rats. A previous study by Tsujii and
Du Bois (1995) on intestinal epithelial cells, suggests that COX2 over-expression
suppresses apoptosis and causes changes in cellular adhesion. The intense COX2
expression in the luminal epithelial cells of the hyperstimulated animals may be
considered as over-expression. Over-expression of COX2 may thus have contributed to
the unsuccessful implantation of embryos in the hyperstimulated animals. The presence

114
of unattached embryos in the uterine lumen of hyperstimulated animals, as has been
observed in the present study and previous studies by Stein and Kramer (1989), Kramer
et al. (1990) and Kramer (1997), may be influenced by the over-expression of COX2.
Different uterine cells are organized in tissue compartments which are involved in
signaling from one compartment to another and are regulated by the steroid hormones,
oestrogen and progesterone. It has been previously reported that signaling from the
luminal epithelial cells is required to induce the decidual reaction in the stroma (Lejeune,
1981). Lim et al. (1997) reported that expression of COX2 mRNA in the luminal
epithelial cells of the mouse uterus is important in initiating decidualization. Thus, in the
present study, COX2 expression in the luminal epithelial cells of the control animals was
indeed followed by initiation of stromal decidualization, seen as rounding of the
subepithelial stromal cells. Decidualization however, was not observed in the stroma of
the hyperstimulated animals, although intense COX2 immunolocalization in the luminal
epithelial cells was evident during the peri-implantation. It appears that over-expression
of COX2 may also be inhibitory to stromal decidualization.
Early studies on the rodent uterus suggested an important role for prostaglandins in the
initiation of decidualization at the site of implantation (Kennedy, 1977; Kennedy and
Lukash, 1982). It has been previously reported that treatment with indomethacin (an
inhibitor of prostaglandin biosynthesis) at the time of implantation, can cause a delay in
implantation (Kennedy, 1977). In the same study, it was noted that the concentrations of
prostaglandins were significantly higher in the implantation sites of control, compared to
implantation sites of the indomethacin-treated animals at day 5 of pregnancy (Kennedy,
115
1977). Later, Kennedy and Lukash (1982) showed that after the initial decidualization,
prostaglandin levels decreased, indicating that decidual growth did not require high
prostaglandin levels. Studies on COX2 knock-out mice showed that artificial
decidualization does not occur after intraluminal oil infusion on day 4 of
pseudopregnancy, even if the physiological steroidal regime is provided (Lim et. al.,
1997). This suggests that COX2 may be one of the crucial mediators for blastocyst
implantation.
Decidualization failure in the hyperstimulated animals coincided with the rise of
oestradiol and progesterone at 5.5 days of pregnancy, the lower P:E2 ratio compared with
the control animals and the absence of COX2 immunolocalization in the stromal cells.
Previously, Hewitt et al. (2002) showed that initial COX2 induction is hormone
independent, while its later induction is dependant on both progesterone and oestrogen
priming. Chakraborty at al. (1996) stated that COX1 gene expression is influenced by
ovarian hormones, while the COX2 gene expression is hormone independent and
regulated by the implanting blastocyst. However, in the present study it appears that
higher concentrations of oestradiol and progesterone inhibited stromal COX2 expression
thus the stroma did not show signs of decidualization in the hyperstimulated animals. Ma
et al. (2003) indeed showed aberrant expression of the COX2 gene at higher oestrogen
levels in pseudo-pregnant mice. Injection of a high dose of oestrogen on day 7
immediately after blastocyst transfer did not change the normal expression of the COX2
gene within a 24 h period. However, the COX2 gene could not be detected after 24 hours

116
of injection of the high oestrogen dose, and aberrant expression of other implantation-
related genes were also noted (Ma et al., 2003).
The regulation of COX2 expression is also regulated by the presence of the blastocyst in
the uterine lumen (Chakraborty at al., 1996). However, although embryos were
observed in hyperstimulated animals in the present and previous studies, the embryos
were not attached to the surface epithelium and the stroma did not show decidualization
and COX2 immunolocalization. Thus, it can be concluded that not only the presence of
the blastocysts in the uterine lumen, but attachment to the surface epithelium is required
for the regulation of COX2 expression and initiation of decidualization of the stroma.
Intense COX2 immunolocalization was also observed in the luminal epithelial cells of the
hyperstimulated animals at 6.5 days. However, the higher P:E2 ratio of these animals and
statistically significantly lower oestradiol concentration when compared to the control
animals at the same stage of pregnancy, did not allow for the induction of
decidualization and COX2 immunolocalization in the stromal cells. Thus, it appears that
not only expression, but rather optimal expression of COX2 in the luminal epithelial cells
is required to induce decidualization of the stroma. It is also possible that the refractory
state of the uterus induced at the earlier stages of pregnancy at 4.5 and 5.5 days at higher
oestradiol and progesterone concentrations, was not converted to the receptive state with
the improved hormonal environment in the hyperstimulated animals at day 6.5.
Kennedy and Lukash (1982) reported an increase in vascular permeability in the rat
uterus in response to prostaglandin infusion. In the present study, blue stained bands as a

117
result of vascular permeability were present along the uterine horns of the control animals
at 5.5 and 6.5 days of pregnancy. In addition, routine histology of the uterine sections of
the control animals at the same days of pregnancy showed spaces between decidual cells
indicating stromal oedema. COX2 was immunolocalized in the cytoplasm of these
decidual cells, at the antimesometrial side, indicating an influence of COX2 on vascular
permeability and tissue oedema at the site of implantation. Chakraborty et al. (1996)
reported COX2 gene expression in the luminal epithelium and subepithelial stroma at the
antimesometrial side of the mouse uterus on day 4 and day 5 of pregnancy. Chakraborty
et al. (1996) suggested that the mesometrial COX2 gene expression on day 6 of
pregnancy facilitated the establishement of the placenta. Intense cytoplasmic COX2
immunolocalization in the subepithelial stromal cells adjacent to the implanting embryo
at day 6.5 in the present study differs from the study by Chakraborty et al. (1996). In the
present study the rat uterus was used while Chakraborty et al. (1996) used mouse uterus
for their experiment, which could be the reason for the discrepancies in the observations
between the two studies.
Evidence that prostaglandins are important inducers of vascular permeability has been
confirmed in studies on mutant mice. Matsumoto et al. (2002) reported poor vascular
permeability at the site of blastocyst apposition in COX2 deficient mice, proposing that
fenestration of the uterine vessels had not occurred. In the present study in control rats
numerous blood vessels were observed in the stroma, surrounded by the decidual cells,
particularly at 5.5 and 6.5 days of pregnancy. In contrast, the non-decidualized and
compact stroma of the hyperstimulated animals did not show a rich blood supply.

118
Numerous studies on mutant mice have shown a crucial role for COX2 during the peri-
implantation period. COX2 deficient mice show multiple reproductive failures, causing
infertility of these animals (Lim et al., 1997). However, recent study by Cheng and
Stewart (2003) argued these statements by showing a delay but not inhibition of
implantation after the blastocyst transfer in COX2-deficient mice. These results are in
support of the theory that COX2 mediates the initial decidual response, but negates the
importance of COX2 in further decidual growth and embryo development. Cheng and
Stewart (2003) suggested the importance of COX2 as an inducer of the expression of
other mediators of decidualization and vascular permeability, such as VEGF.
4.4.2. VEGF Immunolocalization in the control and hyperstimulated rat uterus
In the present study, closure of the uterine lumen around the blastocysts and supepithelial
stromal oedema in the control animals at 4.5 days, coincided with VEGF expression in
the luminal and glandular epithelial cells and rounded subepithelial stromal cells at the
antimesometrial side of the lumen. In contrast, the subepithelial stroma of the
hyperstimulated animals was compact and the uterine lumen highly folded and dilated.
VEGF was immunolocalized to the luminal epithelial and glandular cells, but not
localized to the stroma. Western blot did not show any results.
Studies on the normal mouse uterus have shown VEGF localization in the luminal
epithelial cells and stroma on day 4 of pregnancy (Chakraborty et al., 1995). VEGF was
thus suggested to be the signal for generalized vascular permeability in the stroma prior
to implantation (Chakraborty et al., 1995).

119
VEGF is a crucial mediator for vascular permeability during the peri-implantation in
rodents and humans (Cullinan-Bove and Koos, 1993; Chakraborty et al., 1995; Hyder et
al., 1996) and a promoter of angiogenesis (Ferrara, 1996; Matsumoto et al., 2002;
Krussel et al., 2003). In addition, it is also well established that vascular permeability
and angiogenesis are hormonally regulated in the reproductive system of rodents and
humans (Shweiki et al., 1993; Hyder and Stancel, 1999; Perrot-Applanat et al., 2000; Ma
et al., 2001). Ma et al. (2001) have shown that oestrogen induces vascular permeability
which coincides with the expression of VEGF, while oestrogen is also responsible for
inhibiting angiogenesis. In addition it has been shown that VEGF receptors Flk-1/KDR
are up-regulated by VEGF in the absence of a direct oestrogen effect (Harve et al., 2006).
Progesterone has little effect on vascular permeability but stimulates uterine angiogenesis
(Ma et al., 2001; Walter et al., 2005).
Hyder et al. (1996) stated that the stroma with the highest blood vessel density in the
uterus responds with massive oedema after hormone treatment. Also, isolated stromal
cells express increased VEGF mRNA after treatment with a physiological concentration
of oestrogen or both oestrogen and progesterone (Perrot-Applanat et al., 2000). Hyder
(2002) stated that the VEGF is up-regulated at the low oestrogen concentrations in the rat
uterus. In the human uterus oestradiol up-regulates all VEGF isoforms (Bausero et al.,
1998). Srivastava et al. (1998) stated that progesterone does not alter expression of
VEGF, while Ancelin et al. (2002) have shown up-regulation of the VEGF189 isoform in
the human uterus under the influence of progesterone.

120
In the present study, the nidatory oestradiol surge in the control animals at 4.5 days
indeed induced stromal vascular permeability which coincided with epithelial and stromal
VEGF immunolocalization. However, it appears that increased oestradiol levels inhibited
VEGF expression and vascular permeability in the stroma of the hyperstimulated
animals. It is more likely that the high oestradiol levels in these animals altered
morphology of the uterus which was unsatisfactory for the blastocyst implantation, while
suppression of VEGF in the stroma of these animals may be a result of aberrant COX2
expression at the site of implantation. This finding is in agreement with Cheng and
Stewart (2003) who suggested that COX2 may be essential for VEGF expression. Thus,
the aberrant COX2 expression on 4.5 days in the hyperstimulated animals, may have
failed to induce VEGF stromal expression and resulted in the suppression of the
fenestration of the thin blood vessels as reported by Kramer (1997).
The other possibility for the failure of the stromal VEGF expression and decidualization
might be that the predominant VEGF isoforms in the rodent uterus (VEGF120 and
VEGF164) exist as secreted forms (Houck et al., 1991). Since VEGF immunolocalization
was most predominantly found in the apical portions of the luminal and glandular
epithelial cells of the hyperstimulated animals at all consecutive stages of pregnancy, it is
possible that VEGF produced in these cells was secreted into the lumen and did not act
on the stroma to induce vascular permeability.
It has also been shown that human blastocyst expresses mRNA encoding for the free
VEGF proteins which induces vascular permeability at the implantation site (Krussel et

121
al., 2001). It was suggested that only the free VEGF isoforms are able to induce
angiogenesis at the implantation site and be involved in the process of embryo
implantation (Krussel et al., 2001). VEGF was also detected in the giant trophoblast cells
and early yolk sac (Jakeman et al., 1993).
In the present study, implanting embryos of control animals at 6.5 days showed VEGF
immunolocalization. This coincided with VEGF immunolocalization in the decidual cells
of the subepithelial stroma. The VEGF was also strongly expressed in the cells adjacent
to the stroma and implanting blastocyst which appeared to be the trophoblastic cells. This
was consistent with the study by Jakeman et al. (1993). However, in the hyperstimulated
animals at 6.5 days, blastocysts present in the lumen were not attached to the luminal
epithelium. Decidualization of the stromal cells was not evident and these cells did not
show VEGF immunolocalization. It appears that the initiation of the stromal VEGF
expression may require the presence of the implanting embryos.
The observations in the present study are also in support to the previous observations that
non-decidual stromal cells do not express VEGF (Srivastava et al., 1998).
It has been previously reported that the subepithelial stroma is the most potent region for
the micro-vessel growth in the rodent uterus (Shweiki et al., 1993). The primary decidual
zone immediately surrounding the implanting blastocyst expressed scanty VEGF
immunolocalization, while intense VEGF localization was evident on the mesometrial
side and in the secondary decidual zone in the control animals on day 6.5. The present
study is in support to the observation by Shweiki et al., (1993), as numerous blood

122
vessels were observed in the primary decidual zone in the control animals at 6.5 days of
pregnancy. It appeared that the intense VEGF immunolocalization in the primary
decidual zone at the previous stages of pregnancy, particularly at 5.5 days at the
antimesometrial side facilitated angiogenesis and development of new blood vessels.
Cessation of VEGF expression in the primary, but more intense expression in the
secondary decidual zone and at the mesometrial side observed in the present study, may
have been induced by extensive decidualization at these sites. Vascular permeability and
angiogenesis failed to occur in the hyperstimulated animals at 6.5 days which was
confirmed by the compact appearance of the stroma and fewer blood vessels, when
compared to the control animals at the same stage of pregnancy.
The biological response of VEGF is achieved by it binding to transmembranous tyrosine
kinase receptors (Ferrara, 1996). Also, VEGF binds to the heparin-sulfate proteoglycans
on the cell surfaces or extracellular matrix, necessary to induce release of other
angiogenic factors, such as basic fibroblast growth factor (bFGF) (Krussel et al., 2001).
It is thought that VEGF and bFGF have synergistic effects in induction of endothelial cell
proliferation and angiogenesis (Srivastava et al., 1998). In the human uterus, VEGF 121
splice variant is unable to bind to the extracellular matrix, due to absence of the exons 6
or 7 which contain heparin-binding domains (Krussel et al., 2001). Thus, failure of the
stromal oedema and vascular permeability in the hyperstimulated rats may be explained
by an inability of VEGF 120, one of the most predominant splice variants in the rodent
uterus, to bind to the extracellular matrix and induce secretion of bFGF.

123
Decidualization requires an increased oxygen supply for the survival of the newly formed
cells (Diakoku et al., 2003). A strong correlation exists between hypoxia and VEGF
expression in physiological angiogenesis (Bates and Harper, 2003; Daikoku et al., 2003;
Ryzhov et al., 2007). It is also known, that a reduction in oxygen concentration below
2% induces VEGF mRNA in many cell types (Zhang et al., 1998). Thus, it is possible
that hypoxia occurred causing strong VEGF immunolocalization at the mesometrial side
and in the secondary decidual zone in the uterus of the control animals at 6.5 days which
may have induced vascular permeability and angiogenesis. Chakraborty et al. (1995)
suggested that VEGF expression at the mesometrial side in uteri of mice on day 5 of
pregnancy contributes to angiogenesis for the establishment of the placenta.
In addition to the detrimental change in the uterine morphology as a result of raised
oestradiol concentrations, the ovarian hyperstimulation syndrome (OHSS) is a severe
complication following treatment with gonadotrophins. VEGF is implicated in the
pathogenesis of OHSS due to its effect on vascular permeability (Garcia-Velasco et al.,
2004) and through the mediation of hCH on the up-regulation of VEGF (Wang et al.,
2002). The ovary is the main source of VEGF (Garcia-Velasco et al., 2004). The fact
that VEGF is produced by stimulation of both FSH and hCG, which are used in IVF and
ET techniques, emphasizes the importance of balanced, or even decreased doses of these
hormones in order to prevent the risk of OHSS. This may allow for successful
superovulation and a favorable uterine environment for blastocyst implantation.
124
5.0 CONCLUSION
Superovulation was achieved by the administration of the exogenous hormones, FSH and
hCG. Administration of the exogenous hormones altered the physiological levels of
oestrogen and progesterone at the time of preparation of the uterus for blastocyst
implantation. The increased oestrogen levels in the hyperstimulated animals at the time of
implantation had deleterious effects on the morphology of the uterus which resulted in
failure of blastocyst implantation. In addition, the exogenous hormones had a negative
effect on the expression and distribution of VEGF and COX2 in the uterine tissue during
the peri-implantation period. Thus it appears that numerous factors are important and
need to be synchronized for implantation to occur.
In order to further understand the complexities of assisted reproduction, it is necessary to
investigate other molecules and factors that are involved in this process. In addition,
although experiments on the ovariectomized rodents provide invaluable information
regarding the effects of assisted reproductive techniques on the the peri-implantation
period, validation of these results should be carried out superimposed on the normal
hormonal milieu of intact animals. The findings of these studies may thus provide safe
and successful implantation in assisted reproductive procedures in the future.

125
REFERENCES
1. Adams, S.A., Terry, V., Hosie, M.J., Gayer, N., Murphy, C. 2004. Endometrial
response to IVF hormonal manipulation: Comparative analysis of menopausal,
down regulated and natural cycles. Reproductive Biology and Endocrinology, 2, 21-
37.
2. Ancelin, M., Buteau-Lozano, H., Meduri, g., Osborne-Pellegrin, M., Sordello, S.,
Plouet, J., Perrot-Aplanat, M. 2002. A dynamic shift of VEGF isoforms with a
transient and selective progesterone-induced expression of VEGF 189 regulates
anfiogenesis and vascular permeability in human uterus. Proceedings of the
National Academy of Sciences USA, 99, 6023-6028.
3. Bagot, C. N., Kliman, H. J., Taylor H. S. 2001. Maternal Hoxa10 is required for
pinopod formation in the development of mouse uterine receptivity to embryo
implantation. Developmental Dynamics, 222, 538-544.
4. Bancroft, J.D., Gamble M. (eds.) 2002. Theory and Practice of Histological
Techniques. 5th edition. London: Churchill Livingstone.
5. Bany, B.M., Kennedy, T. G. 1997. Regulation of cyclooxygenase gene expression
in rat endometrial stromal cells: the role of epidermal growth factor. Developmental
Genetics, 21, 109-115.
6. Bates, D.O., Harper, S.J. 2003. Regulation of vascular permeability by vascular
endothelial growth factor. Vascular Pharmacology, 39, 225-237.
7. Bausero, P., Freitas, S., Meduri, G., Perrot-Applanat, M. 1998. Paracrine action of
VEGF in the human endometrium: regulation by ovarian steroids. Angiogenesis, 2,
167-182.

126
8. Boenisch, T. (ed.) 2001. Imunochemical Staining Methods. 3rd edition. Carpinteria:
DAKO Corporation.
9. Bourgain, C., Devroey, P. 2003. The endometrium in stimulated cycle for IVF.
Human Reproduction Update, 9, 515-522.
10. Breyer, R.M., Kennedy, C.R.J., Zhang Y., Breyer M.D. 2000. Structure-function
analyses of eicosanoid receptors: physiological and therapeutic implications. Annals
of New York Academy of Science, 905, 221-231.
11. Carmeliet, P., Ferreira, V., Breier, G., Pollefeyt, S., Kieckens, L., Gertsenstein, M.,
Fahrig, M., Vendenhoeck, A., Harpal K., Eberhardt, C., Declercq, C., Pawling, J.,
Moons, L., Collen, D., Risau, W., Nagy, A. 1996. Abnormal blood vessel
development and lethality in embryos lacking a single VEGF allele. Nature, 380,
453-439.
12. Carson, D.D., Bagchi, I., Dey, S.K., Enders, A.C., Fazleabas, A.T., Lessey, B.A.,
Yoshinaga, K. 2000. Embryo implantation. Developmental Biology, 223, 217-237.
13. Chakraborty, I., Das, S.K., Dey, S.K. 1995. Differential expression of vascular
endothelial growth factor and its receptor mRNAs in the mouse uterus around the
time of implantation. Journal of Endocrinology, 147, 339-352.
14. Chakraborty, I., Das, S.K., Wang, J., Dey, S.K. 1996. Developmental expression of
the cyclo-oxygenase-1 and cyclo-oxygenase-2 gene in the peri-implantation mouse
uterus and their differential regulation by the blastocyst and ovarian steroids.
Journal of Molecular Endocrinology, 16, 107-22.
15. Chen, J.R, Cheng, G., Shatzer T., Sewell, L., Hernandez, L., Stewart, C.L. 2000.
Leukemia inhibitory factor can substitute for nidatory oestrogen and is essential to

127
inducing a receptive uterus for implantation but is not essential for subsequent
embryogenesis. Endocrinology, 141, 4365-4372.
16. Cheng, J., Stewart, C.L. 2003. Loss of cyclooxygenase-2 retards decidual growth
but does not inhibit embryo implantation or development to term. Biology of
Reproduction, 68, 401-404.
17. Coffin, D., Poole, T.J. 1988. Embryonic vascular development:
immunohistochemical identification of the origin and subsequent morphogenesis of
the major vessel primordial in quail embryos. Development, 102, 735-748.
18. Cullinan-Bove, K., Koos, R. 1993. Vascular endothelial growth factor/vascular
permeability factor expression in the rat uterus: rapid stimulation by estrogen
correlates with estrogen-induced increases in uterine capillary permeability and
growth. Endocrinology, 133, 829-837.
19. Daikoku, T., Matsumoto, H., Gupta, R.A., Das, S.K., Gassmann, M., DuBois, R.N.,
Dey, S.K. 2003. Expression of hypoxia-inducible factors in the peri-implantation
mouse uterus is required in a cell-specific and ovarian steroid hormone-dependent
manner. The Journal of Biological Chemistry, 278, 7683-7691.
20. Das, S.K., Wang, J., Dey, S.K., Mead, R.A. 1999. Spatiotemporal expression of
cyclooxygenase1 and cyclooxygenase 2 during delayed implantation and the
periimplantation period in the western spotted skunk. Biology of Reproduction, 60,
893-899.
21. Demir, R., Kayisli, U.A., Seval, Y., Celik-Ozenci, C., Korgun, E.T., Demir-
Weusten, A.Y., Huppertz, B. 2004. Sequential expression of VEGF and its

128
receptors in human placental villi during very early pregnancy: differences between
placental vasculogenesis and angiogenesis. Placenta, 25, 560-572.
22. Day, S.K. 1996. Implantation. In Adasshi EY, Rock, JA, Rosenwaks Z (eds)
reproductive Endocrinology, surgery, and technology. Lippincott-Raven, New
York, 421-434.
23. Dey, S.K., Lim, H., Das, S.K., Reese, J., Paria, B.C., Daikoku, T., Wang, H., 2004.
Molecular cues to implantation. Endocrine Reviews, 25, 314-373.
24. Duc-Goiran, P., Mignot, T.M., Bourggeois, C., Ferre, F. 1999. Embryo-maternal
interactions at the implantation site: a delicate equilibrium. European Journal of
Obstetric and Gynecology and Reproductive Biology, 83, 85-100.
25. Dvorak, H. F., Brown, L.F., Detmar, M., Dvorak, A.M. 1995. Vascular
permeability factor/vascular endothelial factor, microvascular hyperpermeability,
and angiogenesis. American Journal of Pathology, 146, 1029-1039.
26. Edwards, R.G., Steptoe, P. C., Purdy, J.M. 1980. Establishing full-term human
pregnancies using cleaving embryos grown in vitro. British Journal of Obstetrics
and Gynaecology, 87, 737-756.
27. Edwards, R.G. 1995. Physiological and molecular aspects of human implantation.
Human Reproduction, 10, 1-13.
28. Edwards, R. G., Lobo, R., Bouchard, P., 1996. Time to revolutionize ovarian
stimulation. Human Reproduction, 11, 917-919.
29. Enders, A.C. 1975. The implantation chamber, blastocyst and blastocyst imprint of
the rat: a scanning electron microscopy study. Anatomical Record, 182, 137-150.
129
30. Enders, A.C., Schlafke, S., 1967. A morphological analysis of the early
implantation stages in the rat. American Journal of Anatomy, 120, 185-226.
31. Ertzeid, G., Storeng R. 2001. The impact of ovarian stimulation on implantation
and fetal development in mice. Human Reproduction, 16, 221-225.
32. Ferrara, N. 1996. Vascular endothelial growth factor. European Journal of Cancer,
32A, 2413-2422.
33. Ferrara, N., Davis-Smith T. 1997. The biology of vascular endothelial growth
factor. Endocrine Reviews, 18, 4-25.
34. Folkman, J. 1990. What is the evidence that tumors are angiogenesis dependent?
Journal of Nat. Cancer Inst. 82, 4-6.
35. Fong, G. H., Rossant J., Gertsenstein, M., Breitman, M.L. 1995. Role of the Flt-1
receptor tyrosine kinasein regulating the assembly of vascular endothelium. Nature,
376, 66-70.
36. Fossum, G.T., Davidson, A., Paulson, R.J. 1989. Ovarian hyperstimulation inhibits
embryo implantation in the mouse. Journal of in vitro Fertilization and Embryo
Transfer, 6, 7-10.
37. Garcia-Valasco, J.A., Zuniga, A., Pacheco, A., Gomez, R, Simon, C., Remohi, J.,
Pellicer, A. 2004. Coasting acts through downregulation of VEGF gene expression
and protein secration. Human Reproduction, 19, 1530-1538.
38. Gidley-Baird, A.A., O’Neill, C., Sinocisich, M.J., Porter, N.R., Pike, I.L., Saunders,
D.M. 1986. Failure of implantation in human in vitro fertilization and embryo
transfer patients: the effect of altered progesterone/estrogen ratios in humans and
mice. Fertility and Sterility, 45, 69-74.

130
39. Herve, M.A.J., Meduri, G., Petit, F.G., Domet, T.S., Lazennec, G., Mourah, S.,
Perrot-Applanat, M. 2006. Regulation of the vascular endothelial growth factor
(VEGF) receptor Flk-1/KDR by estradiol through VEGF in uterus. Journal of
Endocrinology, 188, 91-99.
40. Hewitt, C. S., Goulding, E. H., Eddy, E.M., Korach, K.S. 2002. Studies using the
estrogen receptor � knockout uterus demonstrate that implantation but not
decidualization-associated signaling is estrogen dependent. Biology of
Reproduction, 67, 1268-1277.
41. Hla, T., Neilson, K. 1992. Human cyclooxygenase-2 cDNA. Proceedings of the
National Academy of Sciences USA, 89, 7384-7388.
42. Hosie, M.J., Murphy, C.R. 1992. Clomiphene citrate alters surface ultrastructure of
luminal epithelial cells. Acta Anatomica 145, 2, 175-178.
43. Hosie, M.J., Murphy, C.R. 1995. A scanning and light microscope study
comparing the effects of clomiphene citrate, estradiol 17-beta and progesterone on
the structure of uterine luminal epithelial cells. European Journal of Morphology,
33, 39-50.
44. Houck, K.A., Ferrara, N., Winer, J., Cachianes, G., Li, B., Leung, D.W. 1991. The
vascular endothelial growth factor family: identification of a fourth molecular
species and caracterization of alternative splicing of RNA. Molecular
Endocrinology, 5, 1806-1814.
45. Hyder, S. M., Stancel, G.M. 1999. Regulation of angiogenic growth factors in the
female reproductive tract by estrogens and progestins. Molecular Endocrinology,
13, 806-811.

131
46. Hyder, S.M. 2002. The role of steroid hormones on the regulation of vascular
endothelial growth factor. American Journal of Pathology, 161, 345-346.
47. Hyder, S.M., Stancel, G.M., Chiappetta, C., Murthy L., Boettger-Tong, H.L.,
Makela, S. 1996. Uterine expression of vascular endothelial growth factor is
increased by estradiol and tamoxifen. Cancer Research, 56, 3954-3960.
48. Jakeman, L.B., Armanini, M., Phillips, H.S., Ferrara, N. 1993. Developmental
expression of binding sites and messenger ribonucleic acid for vascular endothelial
growth factor suggests a role for this protein in vasculogenesis and angiogenesis.
Endocrinology, 133, 848-859.
49. Kennedy, T.G. 1977. Evidence for a role for prostaglandins in the initiation of
blastocyst implantation in rat. Biology of Reproduction, 16, 289-291.
50. Kennedy, T.G., Lukash, L.A. 1982. Induction of decidualization in rats by the
intrauterine infusion of prostaglandins. Biology of Reproduction, 27, 253-260
51. Kent, G.C., Smith, R.A. 1945. A study of the oestrus cycle of the golden hamster,
cricetus auratus waterhouse. Anatomical Record, 92, 263-271.
52. Kim, K.J., Li, B., Winer, J 1996. Inhibition of vascular endothelial growth factor-
induced angiogenesis suppresses tumor growth in vivo. Nature, 362, 841-844.
53. Kitsukawa, T., Shimizu, M., Sanbo, M., Hirata, T., Taniguchi, M., Bekku, Y.,
Yagi, T., Fujisawa, H. 1997. Neuropilin-semaphorin III/D-mediated chemopulsive
signals play a crucial role in peripheral nerve projection in mice. Neuron, 19, 995-
1005.
54. Klentzeris, L.D. 1997. The role of endometrium in implantation. Human
Reproduction, 2, 170-175.

132
55. Kramer, B. 1997. Changes in vascular permeability and deciduoma formation
during the peri-implantation period of the rat in response to exogenous
gonadotropins. Anatomical Record, 247, 20-24.
56. Kramer, B., de Wet, G. 1994. Exogenous gonadotropin administration affects the
glicocalyx of rat endometrial epithelial cells during the period of implantation.
Journal of Assisted Reproduction and Genetics, 11, 504-509.
57. Kramer, B., Magan, A., de Wet, G. 1993. Hyperstimulation affects vascular
permeability at implantation sites in the rat endometrium. Journal of Assisted
Reproduction and Genetics, 10, 163-168.
58. Kramer, B., Stein, B.A., van der Walt, L.A. 1990. Exogenous gonadotropins-serum
oestrogen and progesterone and the effect on endometrial morphology in the rat.
Journal of Anatomy, 173, 177-186.
59. Krussel, J.S., Behr, B., Milki, A.A., Hirchenhain, J., Wen, Y., Bielfeld, P., Lake,
Polan, M. 2001. Vascular endothelial growth factor (VEGF) mRNA splice variants
are differentially expressed in human blastocysts. Molecular Human Reproduction,
7, 57-63.
60. Krussel, J.S., Bielfeld, P., Polan, M.L., Simon, C. 2003. Regulation of embryonic
implantation. European Journal of Obstetrics & Gynecology and Reproductive
Biology, 110, S2-S9.
61. Lejeune, B., Van Hoeck, J., Leroy, F. 1981. Transmitter role of the luminal uterine
epithelium in the induction of decidualization in rats. Journal of Reproduction and
Fertility, 61, 235-240.

133
62. Leung, D.W., Cachienes G., Kuang W.-J., Goeddel D.V., Ferrara N. 1989.
Vascular endothelial growth factor is a secreted angiogenic mitogen. Science, 246,
1306-1309.
63. Lim, H., Dey, S.K. 1997. Prostaglandin E2 receptor subtype EP2 gene expression in
the mouse uterus coincides with differentiation of the luminal epithelium for
implantation. Endocrinology, 138, 4599-4607.
64. Lim, H., Gupta, R.A., Ma, W-G, Paria, B.C., Moller, D.E., Morrow, J.D., Du Bois,
R.N., Trazaskos, J.M., Dey, S.K. 1999. Cyclo-oxygenase-2-derived prostacyclin
mediates embryo implantation in the mouse via PPAR�. Genes and Development,
13, 1561-1574.
65. Lim, H., Paria, B.C., Das, S.K., Dinchuk, J.E., Langenbach, R., Trzaskos, J.M. and
Dey, S.K. 1997. Multiple female reproductive failures in cyclooxygenase 2
deficient mice. Cell, 91, 197-208.
66. Lindsay, L.A., Murphy, C.R., 2006. Redistribution of aquaporins 1 and 5 in the rat
uterus is dependent on progesterone: a study with light and electron microscopy.
Reproduction, 131, 369-378.
67. Ljungkvist, I. 1972. Attachment reaction of rat uterine luminal epithelium. IV The
cellular changes in the attachment reaction and its hormonal regulation. Fertility
and Sterility, 23, 847-865.
68. Ma, W., Tan, J., Matsumoto, H., Robert, B., Abrahamson, D.R., Das, S.K., Dey,
S.K. 2001. Adult tissue angiogenesis: evidence for negative regulation by estrogen
in the uterus. Molecular Endocrinology, 15, 1983-1992.

134
69. Ma, W., Song, H., Das, S.K., Das, S.K., Paria, B.C., Dey, S.K. 2003. Estrogen is a
critical determinant that specifies the duration of the window of uterine receptivity
for implantation. Proceedings of the National Academy of Sciences USA, 100,
2963-2968.
70. Macklon, N.S., Stouffer, R.L., Giudice, L.C., Fauser, B.C.J.M. 2006. The science
behind 25 years of ovarian stimulation for in vitro fertilization. Endocrine Reviews,
27, 170-207.
71. Markenson, J., 1999. Clinical implications of Cyclooxygenase enzymes:
COX1/COX2 role of the new NSAIDs. Cancer Control, 6, 22-25.
72. Martin, K.L., Barlow, D.H., Sargent, I.L. 1998. Heparin-binding epidermal growth
factor significantly improves human blastocyst development and hatching in serum-
free medium. Human Reproduction, 13, 1645-1652.
73. Martel, D., Monier, M.N., Roche, D., Psychoyos, A. 1991. Hormonal control of
pinopode formation at the uterine luminal surface. Human Reproduction, 6, 597-
603.
74. Matsumoto, H., Ma, W., Daikoku, T., Zhao, Z., Paria, B.C., Das, S.K., Trzaskos,
J.M., Dey, S.K. 2002. Cyclooxygenase-2 differentially directs uterine angiogenesis
during implantation in mice. The Journal of Biological Chemistry, 277, 29260-
29267.
75. Matsumoto, H., Ma, W., Smalley, W., Trzaskos, J.M., Breyer, R. M., Dey, S.K.
2001. Diversification of cyclooxygenase2 derived prostaglandins in ovulation and
implantation. Biology of Reproduction, 64, 1557-1565.

135
76. Murphy, C.R., Turner, V.F. 1991. Glycocalyx carbohydrates of uterine epithelial
cells increase during early pregnancy in rat. Journal of Anatomy, 177, 109-115.
77. Murphy, C.R. 1995. The cytoskeleton of uterine epithelial cells: a new player in
uterine receptivity and plasma membrane transformation. Human Reproduction
Update, 1, 567-880.
78. Murphy, C.R. 1992. Structure of the plasma membrane of uterine epithelial cells in
blastocyst attachment: a review. Reprod. Fertil. Dev, 4, 633-643.
79. Ni, H., Sun, T., Ding, N., Ma, X., Yang, Z. 2002. Differential expression of
microsomal prostaglandin E synthase at implantation sites in decidual cells of
mouse uterus. Biology of Reproduction, 67, 351-358.
80. Ni, H., Sun, T., Ma, X., Yang, Z., 2003. Expression and regulation of cytosolic
prostaglandin E synthase in the mouse uterus during the peri-implantation period.
Biology of Reproduction, 68, 744-750.
81. Paria, B.C., Huet-Hudson, Y.M., Dey S.K. 1993. Blastocyst’s state of activity
determines the “window” of implantation in the receptive mouse uterus.
Proceedings of the National Academy of Sciences USA, 90, 10159-10162.
82. Paria, B.C., Reese, J., Das, S.K., Dey, S.K. 2002. Deciphering the cross talk of
implantation: advances and challenges. Science, 296, 2185-2188.
83. Parr, E.L., Tung, H.N., Parr, M.B. 1987. Apoptosis as the mode of uterine
epithelial cell death during embryo implantation in mice and rats. Biology of
Reproduction, 36, 211-225.
136
84. Paulson, R.J., Sauer, M.V., Lobo, R.A. 1990. Embryo implantation after human in
vitro fertilization: importance of endometrial receptivity. Fertility and Sterility, 53,
870-873.
85. Perrot-Applanat, M., Ancelin, M., Buteau-Lozano, H., Meduri, G., Bausero, P.
2000. Ovarian steroids in endometrial angiogenesis. Steroids, 65, 599-603.
86. Peverini, S., Kramer, B. 1995. Superovulation affects glucosamine trisaccharides in
the glycocalyx of the rat endometrium at the time of implantation. Journal of
Anatomy, 187, 487-490.
87. Psychoyos, A. 1973. Endocrine control of egg implantation. In: Greep R.O.,
Astwood E.G., Geiger S.R. (eds.) Handbook of Physiology. Washington DC:
American Physiology Society; 187-215.
88. Psychoyos, A., Martel, D. 1985. Problems related to the implantation of the human
egg after in vitro fertilization. Acta Europaea Fertilitatis, 16,107-109.
89. Robinson, C.J., Stringer, S.E. 2001. The splice variant of vascular endothelial
growth factor (VEGF) and their receptors. Journal of Cell Science, 114, 853-865.
90. Roberts, W.G., Palade, G.E. 1995. Increased microvascular permeability and
endothelial fenestration induced by vascular endothelial growth factor. Journal of
Cell Science, 108, 2369-2379.
91. Ryzhov, S., McCaleb, J.L., Goldstein, A.E., Biaggioni, I., Feoktistov, I. 2007. Role
of adenosine receptors in the regulation of angiogenic factors and
neovascularisation in hypoxia. Journal of Pharmacology and Experimental
Therapeutics, 320, 565-572.

137
92. Satokata, I., Benson, G., Mass, R. 1995. Sexually dimorphic sterility phenotypes in
Hox-10 deficient mice. Nature 374, 460-463.
93. Schultz, R. M., Williams C. J. 2002. The science of ART, Science, 269, 2188-2190.
94. Senger, D. R., Galli, S.J., Dvorak, A. M., Perruzzi, C.A., Harvey, S. Dvorak, H.F.
1983. Tumor cells secrete a vascular permeability factor that promotes
accumulation of ascites fluid. Science, 219, 983-985.
95. Sharkey, A. 1998. Cytokines and implantation. Reviews of Reproduction, 3, 52-61.
96. Shweiki, D., Itin, A., Neufeld, G., Gitay-Goren, H., Keshet, E. 1993. Patterns of
expression of vascular endothelial growth factor (VEGF) and VEGF receptors in
mice suggest a role in hormonally regulated angiogenesis. Journal of Clinical
Investigations, 91, 2235-2243.
97. Simon, C., Cano, F., Valbuena, D., Peinado, J.A., Remohi, J., Pellicer, A. 1995.
Implantation: clinical evidence for a detrimental effect on uterine receptivity of high
oestradiol concentrations in high and normal responder patients. Human
Reproduction, 10, 2432-2437.
98. Simon, C., Valasco, G.V., Valbuena, D., Peinado, J.A., Moreno, C., Remohi, J.,
Pellicer, A. 1998. Increasing uterine receptivity by decreasing estradiol levels
during the periimplantation period in high responders with the use of follicle-
stimulating hormone step-down regimen. Fertility and Sterility, 70, 234-239.
99. Smith, W.L., Meade, E.A., DeWitt, D.L. 1994. Interactions of PGH synthase
isozymes-1 and-2 with NSAIDs. Annals of the New York Academy of Science, 744,
50-57.

138
100. Smith, W. L., DeWitt, D.L., Garavito, R.M. 2000. Cyclooxygenases: structural,
cellular, and molecular biology. Annual Review of Biochemistry, 69, 149-182.
101. Song, H., Lim, H., D, S.K., Paria, B.C., Dey, S.K. 2000. Dysregulation of EGF
family of growth factors and COX-2 in the uterus during the preattachment and
attachment reactions of the blastocyst with the luminal epithelium correlates with
implantation failure in LIF-deficient mice. Molecular Endocrinology, 14, 1147-
1161.
102. Song, H., Han, K., lim, H. 2007. Progesterone supplementation extends uterine
receptivity for blastocyst implantation in mice. Reproduction, 133, 487-493.
103. Stein, B. A., Kramer, B., 1989. The effect of exogenous gonadotropic hormones
on the endometrium of the rat. Journal of Anatomy, 164, 123-130.
104. Stein, B.A., Kramer, B., de Wet, G., van der Walt, L.A. 1993. Dose-dependent
effects of exogenous gonadotrophins on the endometrium of the rat. South African
Medical Journal, 83, 122-125.
105. Sterzik, K., Sasse, V., Dallenbach, C., Dallenbach-Hellweg, G., Schneider, V.
1988. In vitro fertilization: the degree of endometrial insufficiency varies with the
type of ovarian stimulation. Fertility and Sterility, 50, 457-462.
106. Srivastava, R.K., Gu, Y., Ayloo, M., Gibori, G. 1998. Developmental expression
and regulation of basic fibroblast growth factor and vascular endothelial growth
factor in rat decidua in a decidual cell line. Journal of Molecular Endocrinology,
21, 355-362.
107. Tabibzadeh, S. 1998. Molecular control of the implantation window. Human
Reproduction Update, 4, 465-471.

139
108. Tan, J., Paria, B.C., Dey, S.K., Das, S.K. 1999. Differential uterine expression of
estrogen and progesterone receptors correlates with uterine preparation for
implantation and decidualization in the mouse. Endocrinology, 140, 5310-5321.
109. Tassell, W., Slater, M., Barden, J.A., Murphy, C.R. 2000. Endometrial cell death
during early pregnancy in the rat. The Histochemical Journal, 32, 373-379.
110. Taylor, H.S., Venden Heuvel, G.B., Igarashi, P. 1997. A conserved Hox axis in
the mouse and human female reproductive system: late establishment and persistent
adult expression of the Hoxa cluster genes. Biology of Reproduction, 57, 1338-
1345.
111. Testart, J. 1987. Evidence of uterine inadequacy to egg implantation in stimulated
in vitro fertilization cycles. Fertility and Sterility, 47, 855-857.
112. Tranguch, S., Daikoku, T., Guo, Y., Wang, H., Dey, S.K. 2005. Molecular
complexity in establishing uterine receptivity and implantation. Cellular and
Molecular Life Sciences, 62, 1964-1973.
113. Tsujii, M., Du Bois, R.N., 1995. Alteration of cellular adhesion and apoptosis in
epithelial cells overexpressing endoperoxide synthase 2. Cell, 83, 493-501.
114. Valbuena, D., Martin, J., de Pablo, J.L., Remohi, J., Pellicer, A., Simon, C. 2001.
Increasing levels of estradiol are deleterious to embryonic implantation because
they directly affect the embryo. Fertility and Sterility, 76, 962-968.
115. Waltenberger, J., Claesson-Welsh, L., Siegbahn, A., Shibuya, M., Heldin, C.
1994. Different signal transduction properties of KDR and Flt-1, two receptors for
vascular endothelial growth factor. The Journal of Biological Chemistry, 269,
26988-26995.

140
116. Walter, L.M., Rogers, P.A.W., Girling, J.E. 2005. The role of progesterone in
endometrial angiogenesis in pregnant and ovariectomised mice. Reproduction, 129,
765-777.
117. Wang, T., Horno, S., Chang, C., Wu, H., Tsai, Y., Wang, H., Song, Y. 2002.
Human chorionic gonadotropin-induced ovarian hyperstimulation syndrome is
associated with up regulation of vascular endothelial growth factor. Journal of
Clinical Endocrinology and Metabolism, 87, 3300-3308.
118. Williams, T., Rogers, A. W. 1980. Morphometric studies of the response of the
luminal epithelium in the rat uterus to exogenous hormones. Journal of Anatomy,
140, 867-881.
119. Yang, Z. M., Das, S. K., Wang, J., Sugimoto, Y., Ichikawa, A., Dey, S.K. 1997.
Potential sites of prostaglandin actions in the periimplantation mouse uterus:
differential expression and regulation of prostaglandin receptor genes. Biology of
Reproduction, 56, 368-379.
120. Zhang, L., Scott, P.A.E., Turley, H., Leek, R., Lewis, C.E., Gatter, K.C., Harris,
A.L., Mackenzie, I.Z., Rees, M.C., Bicknell, R. 1998. Validation of anti-vascular
endothelial growth factor (anti-VEGF) atibodies for immunohistochemical
localization of VEGF in tissue sections: expression of VEGF in the human
endometrium. Journal of Pathology, 185, 402-408.
121. Zhang, Q., Paria, B.C. 2006. Importance of cell death, renewal, and their
hormonal regulation in hamsters that show progesterone-dependent implantation.
Endocrinology, 175, 2215-2227.

141
Appendix 1
The Schorr Staining
Preparation (1 litter of stain)
ethyl alcohol (50%)
Biebrich scarlet (water soluble) 5.0 g
orange G 2.5 g
fast green FCF 0.75 g
phosphotungstic acid 5.0 g
phosphmolybdic acid 5.0 g
glacial acetic acid 10 ml
METHOD:
1. Stain for 1-2 minutes in Schorr’s stain.
2. Rinse in 70% alcohol
3. Rinse in 90% alcohol.
4. Rinse in 100% alcohol twice.
5. Clear in xylene twice.
6. Count in synthetic resin mountain.
�
�
�

142
Appendix 2
Oestrous cycle diagram.
�������� ����������
������������� � �������������� ��������������������� � �����������
������������ �������������� ���
���������
��� ���������� �������������
������������������� ���������
������ � ���������������
�������������������
������������������� ���������
����� ��������������������� � ��������
������������
�������������� ���������
������������������� � �������
�� �����������������������
��� �������������� ������������
���������� � ������������������
������������ ���������������������
��� �������������������������
�
143
Appendix 3
Phosphate buffered saline pH 7.6
NaCl 16.0 g
Na2HPO4.2H2O 3.5 g
KCL 0.4 g
KH2PO4 0.4 g
2 litter distilled H2O
Appendix 4
10% Neutral buffered formalin
formalin 100 ml
sodium dihydrogen phosphate 3.5 g
di-sodium hydrogen phosphate 6.5 g
distilled H20 900 ml
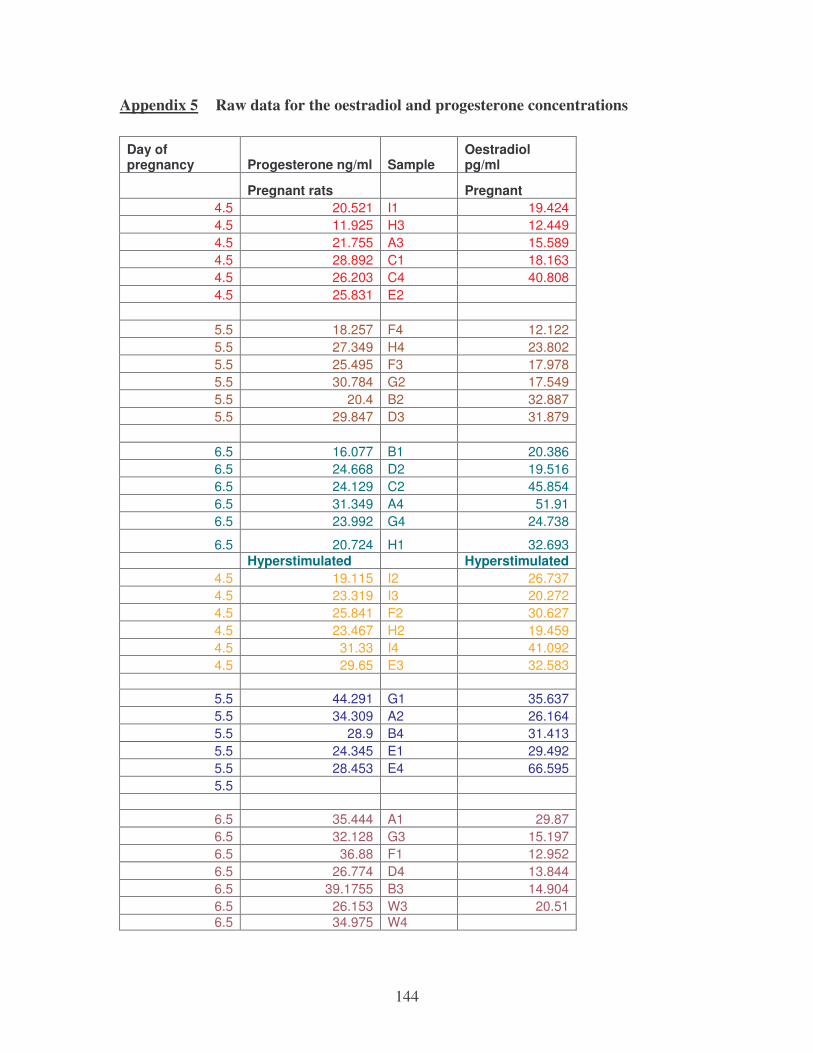
144
Appendix 5 Raw data for the oestradiol and progesterone concentrations
Day of pregnancy Progesterone ng/ml Sample
Oestradiol pg/ml
Pregnant rats Pregnant 4.5 20.521 I1 19.424 4.5 11.925 H3 12.449 4.5 21.755 A3 15.589 4.5 28.892 C1 18.163 4.5 26.203 C4 40.808 4.5 25.831 E2
5.5 18.257 F4 12.122 5.5 27.349 H4 23.802 5.5 25.495 F3 17.978 5.5 30.784 G2 17.549 5.5 20.4 B2 32.887 5.5 29.847 D3 31.879
6.5 16.077 B1 20.386 6.5 24.668 D2 19.516 6.5 24.129 C2 45.854 6.5 31.349 A4 51.91 6.5 23.992 G4 24.738
6.5 20.724 H1 32.693 Hyperstimulated Hyperstimulated
4.5 19.115 I2 26.737 4.5 23.319 I3 20.272 4.5 25.841 F2 30.627 4.5 23.467 H2 19.459 4.5 31.33 I4 41.092 4.5 29.65 E3 32.583
5.5 44.291 G1 35.637 5.5 34.309 A2 26.164 5.5 28.9 B4 31.413 5.5 24.345 E1 29.492 5.5 28.453 E4 66.595 5.5
6.5 35.444 A1 29.87 6.5 32.128 G3 15.197 6.5 36.88 F1 12.952 6.5 26.774 D4 13.844 6.5 39.1755 B3 14.904 6.5 26.153 W3 20.51 6.5 34.975 W4

145
Appendix 6
Silane dipped slides
2% Silane in acetone
3 Aminopropyl triethoxy silane 6 ml
acetone 294 ml
Method:
1. Soak slides in 10% Contrad or Super 10 overnight
2. Rinse in running water minimum 2 hours
3. Dry in oven at 60°C
4. Dip in acetone
5. Dip in 2% silane in acetone for 30 minutes
6. Wash in two changes of acetone 1-2 dips
7. Wash briefly in distilled water
8. Dry at 42°C in the incubator overnight.

146
Appendix 7
Haematoxylin and eosin stain (Mayer’s Staining Technique)
Haematoxylin: haematoxylin 4 g
distilled water 1000 ml
potassium alum 50 g
citric acid 1.5 g
chloral hydrate 75 g
Eosin: 1% Eosin 500 ml
1% phloxine 250 ml
distilled water 750 ml
Method:
1. Dewax in two changes of xylene (2 x 5 min)
2. Pass through graded alcohols followed by rinsing the slides into running water.
3. Stain in haematoxylin for 5 minutes. Wash in tap water to “blue”. Check staining
under the microscope.
4. If necessary differentiate by dipping slides 2-3 times in 1% acid alcohol.
5. Wash in running water for 5 min, until nuclei are bright blue.
6. Counter-stain in eosin for 30 sec to 1 minute.
7. Wash briefly in running water.
8. Slides are passed up through alcohol series and than into Xylene, mounted with
Entellan and cover-slipped and left to dry.
147
Appendix 8
Citrate buffer pH 6
Solution A: 0.1M citric acid
10.5 g citric acid and 500 ml distilled water
Solution B: 0.1M sodium citrate
29.4 g sodium citrate and 1000 ml distilled water
Method:
Solution A 9 ml
Solution B 41 ml
Distilled H2O 500 ml
Appendix 9
TRIS buffered saline pH 7, 6
TRIS base 6.06 g
NaCl 8.77 g
Distilled H20 1000 ml
Appendix 10
Homogenizing buffer stock
50mM TRIS HCl pH 7.5
10% glycerol
5mM Mg acetate
148
0.2mM EDTA
1% Triton-X-100
Add 500 µl of 0.5 M DTT and 50 µl of protease inhibitor stock to 10 ml of
homogenizing buffer just before the protein extraction.
Appendix 11 Reagent A for Lowry protein assay
Reagents
1) 2% sodium carbonate (Na2CO3) made up in 0.1M NaOH
2) 1% copper sulphate (CuSO4.5H2O)
3) 2% sodium potassium tartrate (NaKC4H4O6.4H20)
Reagent A
20 ml of (1)
200 µl of (2)
200 µl of (3)

149
Appendix 12
Reagent B for Lowry protein assay
Folin reagent diluted 1:4 in distilled water
Method for Lowry protein assay:
Use ELISA plate and disperse the following in order:
1. 50 µl of sample
2. 200 µl of reagent A (leave for 10 min on shaker)
3. 50 µl of reagent B (leave for 30 min on shaker)
4. Read absorbance at 690nm

150
Appendix 13 Raw data for the protein in the sample
Day of pregnancy
Volume of protein in the sample (µg/µl) Sample
Pregnant rats 4.5 3.396 I1 4.5 5.666 H3 4.5 3.504 A3 4.5 2.613 C1 4.5 2.330 C4 4.5 2.850 E2
5.5 5.031 F4 5.5 7.435 H4 5.5 3.214 F3 5.5 3.543 G2 5.5 2.313 B2 5.5 3.140 D3
6.5 2.829 B1 6.5 3.278 D2 6.5 3.101 C2 6.5 3.653 A4 6.5 3.354 G4 6.5 3.411 H1
Hyperstimulated rats 4.5 4.690 I2 4.5 3.933 I3 4.5 5.934 F2 4.5 3.562 H2 4.5 2.622 I4 4.5 3.238 E3
5.5 4.068 G1 5.5 3.014 A2 5.5 2.639 B4 5.5 2.828 E1 5.5 2.584 E4 5.5
6.5 2.187 A1 6.5 4.242 G3 6.5 5.978 F1 6.5 3.518 D4 6.5 2.777 B3 6.5 6.099 W3

151
Appendix 14
10% SDS- polyacrylamide separating gel
dH2O 5.9ml
30% acrilamide monomer stock solution 5ml
1.5M TRIS-HCl pH8.8 3.75ml
10% sodium dodecyl sulphate (SDS) 150µl
10% ammonium persulphate 150µl
N,N,N’,N’-tetramethylethylenediamine (TEMED) 6µl
Appendix 15
Electrophoresis Tank Buffer
0.025M TRIS pH 8.3
0.192M glycine
0.15 SDS
Appendix 16
Sample transferring buffer pH 6.8
0.125M Tris-HCl pH 6.8
4% SDS
20% glycerol
10% ß mercaptoethanol
10µg/ml bromophenol blue

152
Appendix 17
Towbin buffer
TRIS 15.15g
glycine 72.05g
SDS 5g
dH20 4000ml
methanol 1000ml
Appendix 18
Commassie Blue Staining Solution
0.25 g Commasie blue
100 ml ethanol
100 ml distilled water
Stir for an hour until dye is completely dissolved.
Add 25 ml acetic acid
Add distilled water to make 250 ml of stain.
Appendix 19
Distaining Solution 1 Distaining Solution 2
50% methanol 5% methanol
10% acetic acid 7% acetic acid

153