Embed Size (px)
Citation preview

University of Kentucky University of Kentucky
UKnowledge UKnowledge
Theses and Dissertations--Education Sciences College of Education
2019
THE EFFECT OF INCREASED PHYSICAL ACTIVITY ON ACADEMIC THE EFFECT OF INCREASED PHYSICAL ACTIVITY ON ACADEMIC
PERFORMANCE PERFORMANCE
Lauren Michelle Willis University of Kentucky, [email protected] Digital Object Identifier: https://doi.org/10.13023/etd.2019.072
Right click to open a feedback form in a new tab to let us know how this document benefits you. Right click to open a feedback form in a new tab to let us know how this document benefits you.
Recommended Citation Recommended Citation Willis, Lauren Michelle, "THE EFFECT OF INCREASED PHYSICAL ACTIVITY ON ACADEMIC PERFORMANCE" (2019). Theses and Dissertations--Education Sciences. 48. https://uknowledge.uky.edu/edsc_etds/48
This Doctoral Dissertation is brought to you for free and open access by the College of Education at UKnowledge. It has been accepted for inclusion in Theses and Dissertations--Education Sciences by an authorized administrator of UKnowledge. For more information, please contact [email protected].

STUDENT AGREEMENT: STUDENT AGREEMENT:
I represent that my thesis or dissertation and abstract are my original work. Proper attribution
has been given to all outside sources. I understand that I am solely responsible for obtaining
any needed copyright permissions. I have obtained needed written permission statement(s)
from the owner(s) of each third-party copyrighted matter to be included in my work, allowing
electronic distribution (if such use is not permitted by the fair use doctrine) which will be
submitted to UKnowledge as Additional File.
I hereby grant to The University of Kentucky and its agents the irrevocable, non-exclusive, and
royalty-free license to archive and make accessible my work in whole or in part in all forms of
media, now or hereafter known. I agree that the document mentioned above may be made
available immediately for worldwide access unless an embargo applies.
I retain all other ownership rights to the copyright of my work. I also retain the right to use in
future works (such as articles or books) all or part of my work. I understand that I am free to
register the copyright to my work.
REVIEW, APPROVAL AND ACCEPTANCE REVIEW, APPROVAL AND ACCEPTANCE
The document mentioned above has been reviewed and accepted by the student’s advisor, on
behalf of the advisory committee, and by the Director of Graduate Studies (DGS), on behalf of
the program; we verify that this is the final, approved version of the student’s thesis including all
changes required by the advisory committee. The undersigned agree to abide by the statements
above.
Lauren Michelle Willis, Student
Dr. Heather Erwin, Major Professor
Dr. Margaret Bausch, Director of Graduate Studies

THE EFFECT OF INCREASED PHYSICAL ACTIVITY ON ACADEMIC PERFORMANCE
____________________________________
DISSERTATION ____________________________________
A dissertation submitted in partial fulfillment of the requirements for the degree of Doctor of Philosophy in the College of Education at the University of Kentucky
By
Lauren Michelle Willis
Lexington, Kentucky
Director: Dr. Heather Erwin, Professor of Kinesiology and Health Promotion
Lexington, Kentucky
2019
Copyright © Lauren Michelle Willis 2019
ABSTRACT OF DISSERTATION
THE EFFECT OF INCREASED PHYSICAL ACTIVITY ON ACADEMIC PERFORMANCE
Increased levels of obesity, particularly among American youth, have consistently been cause for concern over the last few decades. Additionally, the amount of time youth spend being active throughout the day has consistently decreased. Physical activity levels among school-aged children in America are effected by any number of reasons, but this study points to the possibility of time spent being physically active during the school day having the greatest effect on a student’s overall level of physical activity. Increased pressures from different entities on local schools to improve student performance on standardized test scores have contributed to a decline in students’ time spent being active during the school day. The inverse relationship that exists between levels of obesity and amount of time spent being active is a call to action and cause for more research in this area if a solution is to be reached with the obesity epidemic in America.
The purpose of this study was to investigate the effects of increased physical activity on the academic performance of elementary students in a rural, Central Kentucky community. Academic performance is an overarching term that encompasses academic achievement through standardized testing, academic behavior, and cognitive skills and abilities. Ninety students in 4th and 5th grade with an average age of 10 from one elementary school participated in the study.
After obtaining parental consent and students’ verbal consent, students were divided into two intervention groups and one control group. Each intervention group received extra physical activity for three days a week for four weeks. Activity for students was measured with an EKHO MVPA accelerometer for the duration of each activity session during their respective intervention weeks. Standardized test scores were obtained through the school’s measure of academic progress (MAP) assessment. Student behavior was assessed through direct systematic observation and teacher-based questionnaires. Finally, the STROOP color word test was used to measure student’s cognitive processes and executive functioning skills.

The results from the STROOP color word test provided evidence of a significant relationship between physical activity and cognitive skills (ttest1=2.63, p < .01, ttest2=7.14, p < .001). Additionally, the teacher-based questionnaire demonstrated a significantly positive relationship between physical activity and student behavior (t = -2.65, p < .01). Boys were significantly more active than girls (tfemale = -2.71, p <.01). There were also significant correlations between females and the teacher-based questionnaires, the white race and the STROOP color word test, and the white race and on-task behavior. No significant relationships were found between physical activity and overall academic performance or academic achievement.
KEYWORDS: Physical activity, academic performance, academic achievement, cognitive skills, academic behavior
Lauren Willis___________
4/17/2019_____________

THE EFFECT OF INCREASED PHYSICAL ACTIVITY ON ACADEMIC PERFORMANCE
BY
Lauren Michelle Willis
Dr. Heather Erwin__________ Director of Dissertation
Margaret Bausch__________ Director of Graduate Studies
4/17/19 Date
iii
ACKNOWLEDGEMENTS
The following dissertation, while an individual work, benefitted from the insights
and directions of several people. First, my Dissertation Chair, Dr. Heather Erwin,
exemplifies the high quality scholarship to which I aspire. Her assistance in this research
has been beyond valuable and her support throughout my time at the University of
Kentucky has been unmatched. I am forever grateful to her and humbled to be able to
work with her so closely during my time as a student. In addition, Dr. Aaron Beighle
provided instructive comments and suggestions as I prepared my physical activity
intervention. It was through his advice and guidance that I was able to create a successful
physical activity intervention for students in the study. Dr. Jody Clasey provided
backpacks as an incentive for students to complete the study and supported me through
the dissertation process. I have no doubt that her contributions provided the motivation
the students needed to participate in the study. The final member of the dissertation
committee, Dr. Kiluba Nkulu, provided encouragement at every step and I am truly
thankful for his backing throughout the process. Lastly, I am thankful to my outside
reader, Dr. Justin Bathon, for agreeing to serve in this capacity.
In addition to the instrumental assistance above, I received unparalleled support
from family and friends. My husband provided on-going support throughout my
coursework and dissertation while also taking on extra responsibilities at home with our
twin daughters. My mother, grandparents, and other members of my family went above
and beyond to ensure my children were well taken care of while I had to be away for
various responsibilities with this degree. Their unconditional love and care for me
throughout this process has been overwhelming and I am truly thankful to them for all

iv
they have done as I have worked to complete this degree. A number of friends and
colleagues supported me through this process but none more than Dr. Jill Day. Her
encouragement and commitment to me during my time as a student in undergraduate
work has persisted through this degree. She has been available to answer questions,
review drafts of my dissertation, and provide guidance without hesitation. Donna Wise,
my division chairman at Campbellsville University, has been consistently supportive of
me as a student and now as a colleague. She made it possible for me to be able to pursue
this degree while teaching full-time under her leadership. A number of other colleagues
and leaders on CU’s campus checked in and provided encouragement at pivotal points
along the way to which I am truly grateful.
I am thankful to the school district that allowed me access to their facilities,
equipment, and students to be able to conduct this study. Without their permission, this
study would not have happened. Their administration is second to none when it comes to
valuing their students and people within the community. I feel blessed to have been able
to work with them and will continue this partnership in the future through other projects
and research. The teachers, staff, and students treated me as one of their own and the
respect they demonstrated was nothing short of excellent. I also had three students from
Campbellsville University assist me during the intervention and data collection that
proved to be extremely valuable throughout the study.
Lastly, as a believer in Christ, I am eternally thankful to Him for blessing me with
the ability to complete this degree, providing the family that He knew I would need to be
successful, and blessing me with tremendous support from family, friends, and
colleagues.

v
TABLE OF CONTENTS
Acknowledgements............................................................................................................iii
List of Tables................................................................................................................….vii
Chapter One: Introduction...................................................................................................1 Purpose of the Study................................................................................................3 Research Questions..................................................................................................3 Hypotheses...............................................................................................................3 Significance of the Study.........................................................................................4 Definitions................................................................................................................6
Chapter Two: Review of Literature.....................................................................................8 Physical Activity Recommendations.......................................................................8 Physical Activity as an Intervention......................................................................11 Physical Activity and Cognition............................................................................15 Physical Activity and Rural Communities.............................................................17 Academic Performance..........................................................................................19 Academic Achievement.........................................................................................20 Academic Behavior................................................................................................22 Cognitive Skills and Attitudes...............................................................................24 Variables Impacting Student Behavior..................................................................26
Chapter Three: Methodology.............................................................................................32 Participants.............................................................................................................32 Instruments.............................................................................................................34
Accelerometer............................................................................................34 Measures of Academic Progress Assessment............................................35 STROOP Test............................................................................................35 Student Behavior Questionnaire................................................................36 Systematic Behavior Observations............................................................36
Procedures..............................................................................................................37 Physical Activity Intervention...................................................................39
Data Analysis.........................................................................................................41
Chapter Four: Results........................................................................................................43 Physical Activity and Overall Academic Performance.........................................43 Physical Activity and Academic Achievement......................................................47 Physical Activity and Cognitive Skills..................................................................51 Physical Activity and Classroom Behavior............................................................53 Significant Relationships.......................................................................................57
Chapter Five: Discussion...................................................................................................59 Academic Performance..........................................................................................59 Academic Achievement.........................................................................................62

vi
Cognitive Skills......................................................................................................65 Classroom Behavior...............................................................................................68 Limitations and Future Research...........................................................................75 Conclusion.............................................................................................................76
Appendices........................................................................................................................78 Appendix A: Physical Activity Intervention.........................................................78 Appendix B: Intervention Protocol Schedule........................................................88 Appendix C: Teacher Questionnaire Form............................................................90 Appendix D: Systematic Classroom Observations Form......................................92 Appendix E: Systematic Classroom Observations Definitions.............................93
References.........................................................................................................................95
Vita...................................................................................................................................103

vii
LIST OF TABLES Table 4.1, Index Scores ..................................................................................................... 45
Table 4.2, Two Sample T-Test ......................................................................................... 46
Table 4.3, Difference in Reading Scores .......................................................................... 47
Table 4.4, Difference in Math Scores ............................................................................... 48
Table 4.5, Difference in Reading Scores Intervention to Control .................................... 49
Table 4.6, Difference in Math Intervention to Control ..................................................... 50
Table 4.7, Stroop Test Results: Phase 1 ............................................................................ 51
Table 4.8, Stroop Test Results: Phase 2 ............................................................................ 52
Table 4.9, On-Task Observations Regression Statistics ................................................... 53
Table 4.10, T-Test Results.................................................................................................53
Table 4.11, Regression of Teacher-Based Questionnaires................................................55
Table 4.12, Correlations of Variables................................................................................57
Table 4.13, Regression of Steps by Gender and Race.......................................................58

1
CHAPTER ONE
INTRODUCTION
Over the course of the last few decades, the prevalence of obesity in America has
consistently increased, even in pediatric populations. National reports indicate that
obesity levels have tripled among elementary children since 1976 (Barros, Silver & Stein,
2009; Fedewa & Ahn, 2011; Fedewa, Ahn, Erwin & Davis, 2015; Ling, King, Speck,
Kim & Wu, 2014). The National Health and Nutrition Examination Survey (NHNES)
conducted in 2013 and 2014 revealed that 16.2% of United States children and
adolescents are overweight, and 17.2% are obese (Fryar, Carroll & Ogden, 2016).
Research also shows that percentages of overweight and obese children and adolescents
from Kentucky are higher than the national average (2016). In fact, 33.5% of children
and adolescents in Kentucky are considered overweight or obese (State of Obesity, 2016).
Kentucky’s child and adolescent population ranks at 14th overall in the nation as the most
overweight or obese group (State of Obesity, 2016). These numbers are alarming and
cause for concern when considering the present and future for the youth of Kentucky and
America as a whole.
Obesity has been associated with several health risks, including premature death,
stroke, cardiovascular disease, diabetes, and mental health issues (Ahamed, Macdonald,
Reed, Naylor, Liu-Ambrose & McKay, 2006; Fedewa et al., 2015; Haapala, 2012; Martin
& Murtagh, 2015; Ogden, Carroll, Fryar & Flegal, 2015; Stone, McKenzie, Welk &
Booth, 1998; Office of Disease Prevention and Health Promotion (ODPHP), 2014). High
levels of obesity among children could have several negative implications for them now
and in the future, as problems associated can become more extensive in adulthood. If

2
children are obese, they are likely to stay obese in adolescence and continue the habit as
an adult. This notion is confirmed by looking at obesity levels in Kentucky with the total
adult population at 34.2%, increasing slightly from the adolescent percentage of obesity
mentioned previously (State of Obesity, 2016). Further, in Taylor County, Kentucky, as
much as 40% of the adult population is considered obese, which is the location of this
study (County Health Rankings, 2018). Therefore, intervening during childhood will
likely help reduce the odds of obesity in adulthood.
Health disparities such as hypertension and diabetes have previously been found
to be connected to obesity in adults (ODPHP, 2014). These two diseases are more
widespread in Taylor County than the average for the rest of Kentucky (Foundation for a
Healthy Kentucky, 2008). Considering these diseases are directly related to obesity,
which is directly related to inactivity, this fact is not surprising when one considers that
close to 39% of the Taylor County population is completely sedentary (County Health
Rankings, 2018). Preventable diseases and causes of death are exactly that - preventable.
The question then becomes, what could be done to slow down and potentially eliminate
the continuing obesity epidemic in America?
The United States Department of Health and Human Services and the Centers for
Disease Control (CDC) and Prevention suggest that daily physical activity could be the
solution. In 2008, a detailed document was released to serve as a guide for physical
activity, and it included recommendations for both adults and children. Research showed
that regular physical activity reduces the risk of many negative health implications and
the benefits of engaging in physical activity outweighs the potential negative outcomes
(ODPHP, 2014; U.S. Department for Health and Human Services, 2008). Obesity-related

3
diseases can be prevented by targeting the fundamental issue of obesity. To combat
obesity, physical activity and a nutritious diet must occur consistently. The importance of
being active and pursuing a healthy lifestyle must be instilled in children at a young age if
there is any hope of reversing the ever-increasing rise of obesity percentages in America.
Purpose of the Study
The purpose of this study was to investigate the effects of increased physical
activity on the academic performance of elementary students in a rural, Central Kentucky
community. In the context of this study, academic performance is a general term that will
be assessed by academic achievement, cognitive skills and attitudes, and academic
behavior in elementary-aged students.
Research Questions
1. How does physical activity affect academic performance as a whole?
2. How does physical activity affect academic achievement?
3. How does physical activity affect cognitive skills?
4. How does physical activity affect classroom behavior?
5. What variables affect student behavior?
Hypotheses
1. Overall, as physical activity levels increase in children, their academic performance
will improve.
2. Over the next 8 weeks, as physical activity levels increase, academic achievement
will improve and reflect through increased standardized assessment scores.
3. Immediately following the physical activity intervention, students’ concentration,
memory, and speed (executive functioning skills) will improve.

4
4. Immediately following physical activity, classroom behavior will improve.
5. Over the next 8 weeks, as physical activity levels increase, on-task behavior will
also increase.
Significance of the Study
There have been several studies conducted over the last 30 plus years attempting
to establish a relationship between physical activity and academic performance in school-
aged children and adolescents. The method of intervention used within each study varied.
Some studies investigated the effects of classroom-based physical activity on student
performance (Fedewa et al., 2015; Ma, Mare & Gurd, 2014; Mahar, Murphy, Rowe,
Golden, Shields & Raedeke, 2006). Others examined the effects of increased time spent
in physical education class on performance (Carlson, Fulton, Lee, Maynard, Brown, Kohl
& Dietz, 2008; Coe, Pivarnik, Womack, Reeves & Malina, 2006; Sacchetti, Ceciliani,
Garulli, Dallolio, Beltrami & Leoni, 2013). One study further examined the effects of
increased physical education and an increase in the level of intensity of activity during
that time (Ardoy, Fernandez-Rodriguez, Pavon, Castillo, Ruiz & Ortega, 2014). More
looked at the impact of recess (Barros et al., 2009) and other “activity breaks” spread
throughout the school day on school performance and brain development (Bunketorp,
Malmgren, Olsson, Linden & Nilsson, 2015). Others explored the effects of an
afterschool intervention on students’ target heart zone and cognitive performance
(Castelli, Hillman, Hirsch, Hirsch & Drollette, 2011). This is by no means an exhaustive
list of the existing studies available on this topic, but it does provide a brief summary of
previous research related to physical activity and academic performance.

5
This study is similar to some mentioned previously because the efforts are still the
same: investigate the effects of physical activity as an intervention on academic
performance. However, there were no previous studies found that used physical activity
as a specific method of intervention for classroom behavior. The participants in the
intervention group within this study have a previously documented behavior issue and
used this intervention as an RTI (Response to Intervention) for their school behavior plan.
The physical activity intervention was in addition to physical education, recess, and any
extracurricular activities, and will have a focus of promoting respectful and responsible
behaviors. Furthermore, many studies simply looked at the effects of physical activity on
classroom behavior (Mahar et al., 2006), academic achievement (Carlson et al., 2008),
cognitive skills (Castelli et al., 2011), or more than one of these areas (Fedewa & Ahn,
2011; Wright, Duquesnay, Anzman-Frasca, Chomitz, Chui, Economos, Langevin, Nelson
& Sacheck, 2016). However, according to the Centers for Disease Control, academic
performance includes all three components: academic achievement, cognitive skills, and
academic behavior (CDC, 2010). Without exploring the effects of physical activity on all
three facets of academic performance, the visual is incomplete. Therefore, this study
sought to establish a clearer image of what academic performance is and how it can be
affected by physical activity.
Additionally, this study took place in a small, rural farming community in Central
Kentucky (Ratcliffe, Burd, Holder & Fields, 2016). While the obesity epidemic seems to
be global, the issue is more prevalent in rural communities and in Kentucky. According
to one study, 15.6% of Kentucky children aged 2-5 and 37.1% of children aged 10-17
were overweight or obese compared to the national averages of 12.4% and 31.6%

6
respectively (Ling et al., 2014). The county where this study took place ranked at 68 of
120 counties in Kentucky on overall health outcomes when considering healthy days,
premature death, obesity, inactivity, and other risk factors (County Health Rankings,
2018). While not the worst ranking health county in Kentucky, it is far from the best in a
state where obesity is more predominant than the rest of the nation. Moreover, 30.1% of
the county is categorized as persons living in poverty where the average for Kentucky is
18.5% (U.S. Census Bureau, 2016). More investigations on the effects of physical
activity are needed to further establish an association between physical activity and
academic performance, and it is needed in rural Central Kentucky.
Definitions
Academic Performance: This is a general term used to describe three different factors
(academic behavior, academic achievement, and cognitive skills and attitudes) that
impact success in school (CDC, 2010).
Academic Achievement: Academic achievement includes formal assessments or
standardized test scores in Mathematics, Reading, and Language Arts (CDC, 2010). For
the purposes of this study, academic achievement will be assessed using MAP (Measures
of Academic Progress), a formal standardized assessment in the areas of Mathematics,
Reading, Language Arts, and Science.
Body Mass Index (BMI): This is a calculation of weight in kilograms divided by height
in meters squared and is used to express weight adjusted for height (Ogden & Flegal,
2010).
Cognitive Attitudes: Cognitive beliefs that impact student performance such as
motivation, self-concept, and school connectedness (CDC, 2010).

7
Cognitive Skills: This includes basic cognitive abilities of executive function, which is
memory, selective attention, and information processing (CDC, 2010).
METs: This refers to metabolic equivalent where one MET is the rate of energy
expenditure while at rest. The intensity of physical activity is often measured by noting
the METs of an activity (USDHHS, 2008).
Moderate-to-Vigorous Intensity: The level of physical activity intensity at or above 3
METS (Donnelly & Lambourne, 2011).
Obese: BMI for age >= 95th percentile (Ogden & Flegal, 2010).
Off-Task Behavior: Any type of motor, noise, passive, or other off-task behaviors that
breaks the class rules or disrupts the learning environment (Mahar et al., 2006).
On-Task Behavior: Any type of verbal or motor behavior that follows the class rules and
is appropriate to the learning situation (Mahar, Murphy, Rowe, Golden, Shields &
Raedeke, 2006).
Overweight: BMI for age 85th – 95th percentile (Ogden & Flegal, 2010).
Physical Activity: Any bodily movement produced by the contraction of a skeletal
muscle that increases energy expenditure to above a resting level (CDC, 2010).
Rural Region: A less dense, sparse population that is not built up and at a reasonable
distance from urban areas (Ratcliffe et al., 2016).
8
CHAPTER TWO
REVIEW OF LITERATURE
The following information provides a brief review of literature related to the
current studies of academic performance, physical activity, and student behavior. More
specifically, this review will investigate all aspects of academic performance including
academic achievement, cognitive skills and attitudes, and academic behavior and how it
relates to physical activity as well as the variables that impact student behavior.
Physical Activity Recommendations
Daily physical activity could be the simple solution to the growing issue of
overweight and obese Americans as it improves one’s overall well-being. Daily
guidelines for children and adolescents were released in a document from the CDC in
detail (ODPHP, 2014). According to the 2008 guidelines, children are to receive at least
60 minutes of daily physical activity (U.S. Department for Health and Human Services,
2008). Specifically, it was determined that most of the 60 minutes should include at least
a moderate-intensity level of activity and at least three days of vigorous-intensity level of
activity, including muscle and bone strengthening activities (Sallis, Prochaska & Taylor,
2000; U.S. Department for Health and Human Services, 2008). While the importance of
physical activity is recognized, the reality is these recommendations are not being met by
the majority of youth in America and around the globe (Fedewa et al., 2015; Ling et al.,
2014; Stone et al., 1998; Trost, 2009; Watson, Timperio, Brown, Best & Hesketh, 2017;
Wright et al., 2016). Further, the physical activity levels of children in Kentucky reflect
the national average, but once those children reach adolescence, they are significantly

9
less active than the rest of America (2016). Something must be done, especially in
Kentucky, to combat the increasing decline in physical activity levels.
Some activity is indeed better than no activity at all, so at least a moderate-
intensity level of physical activity is positive, but it is still not meeting the
recommendations set forth by the United States government (ODPHP, 2014). With a rise
in technology and more sedentary behaviors among American youth, physical activity
has fallen even further down the “to-do” list of most children (Davis & Cooper, 2011;
Hillman, Erikson & Kramer, 2008). Therefore, action is needed at the individual and
community levels to promote the benefits of physical activity (Stone et al., 1998; U.S.
Department for Health and Human Services, 2008). Most children will not simply make
the most beneficial decision; they must be encouraged and given the opportunity to
engage in activity by those that surround them. To meet the set recommendations,
children typically will need to engage in both free play and structured activities (Carlson,
Engelberg, Cain, Conway, Mignano, Bonilla, Geremia & Sallis, 2015; U.S. Department
for Health and Human Services, 2008). When children spend most of their time in a
classroom at school, 60 minutes of daily physical activity can be daunting and unrealistic
unless measures are taken at the school and community level to help students achieve the
goal.
Based on this information, the CDC released a national action guide to help direct
states and communities to support children in achieving the 60-minute recommendation
(ODPHP, 2014). Potential action items from this document included enhancing
community parks and other facilities, forging community partnerships with schools to
permit activity in and on their facilities beyond regular school hours, increasing time in

10
physical education, adopting guidelines for physical education times in each grade level,
implementing timed recess, improving quality of physical education, supporting bicycle
and pedestrian transportation initiatives, and supporting physical activity and health unit
in state public health departments (CDC, 2010). Clearly, there are many areas for
improvement to help children and adolescents achieve their daily physical activity goal.
This is the case in other parts of the world such as Canada and Australia as well as the
U.S., reflecting similar recommendations with an addition of limiting non-active time by
reducing time with technology (Janssen & LeBlanc, 2010; Sacchetti et al., 2013). This
further supports the need for adults, parents, and teachers to reduce students’ screen time
in favor of genuine activity.
The daily recommendation cannot be achieved, especially in children and
adolescents, by simply changing one factor or another. Many things need to be done to
help pave the way for children to increase their activity levels. American children have
access to a compulsory education system and are required to attend elementary school so
this seems like the best place to start (Wilson, Olds, Lushington, Petkov & Dollman,
2015). Children who live a healthier, active lifestyle are less likely to be unhealthy as
adults (Stone et al., 1998; U.S. Department for Health and Human Services, 2008).
Schools are an ideal location to begin to provide more opportunities for physical activity
and encourage overall healthy behaviors (Ardoy et al., 2014; Bunketorp et al., 2015;
Fedewa et al., 2015; Kibbe, Hackett, Hurley, McFarland, Schubert, Schultz & Harris,
2011; Mahar, Murphy, Rowe, Golden, Shields & Raedeke, 2006; Martin & Murtagh,
2015; Rasberry, Lee, Robin, Laris, Russell, Coyle & Nihiser, 2011; Resaland, Moe,
Aadland, Steene-Johannessen, Glosvik, Andersen, Kvalheim, McKay & Anderssen,

11
2015; Sallis, McKenzie, Alcaraz, Kolody, Faucette & Hovell, 1997; Wright et al., 2016).
While there are many variables that can be impacted on the school level, starting
anywhere could go a long way and make a tremendous difference in students’ health both
now and for many years to come.
Physical Activity as an Intervention
Studies have shown that physical activity levels decline consistently through
childhood, adolescence and into adulthood (Bartholomew & Jowers, 2011; Bunketorp et
al., 2015; Carlson et al., 2008; Fedewa & Ahn, 2011; Lee, Burgeson, Fulton & Spain,
2007; Sibley & Etnier, 2003; Stone et al., 1998). For the first time in United States
history, younger generations might live a less healthy lifestyle than their parents (Hillman
et al., 2008; Lees & Hopkins, 2013) and have a shorter lifespan (Olshansky, Passaro,
Hershow, Layden, Carnes, Brody & Ludwig, 2005). While it is common knowledge and
has already been validated through research that physical activity benefits children in a
number of ways, children are simply not as active as they once were. A 2002 study
revealed that more than 60% of elementary-aged children did not participate in any type
of organized physical activity outside the school day (Ling et al., 2014). In 2011, it was
found that a mere 28.7% of adolescents participated in 60 minutes of physical activity
each day (Ling et al., 2014). This means that most students will not meet the daily
recommendation for physical activity unless it is accomplished during the school day.
Some of these numbers could be attributed to a student’s lack of ability or access to
activity resources, especially in rural communities (Ling et al., 2014; Trost, Pate,
Saunders, Ward, Dowda & Felton, 1997). Creating opportunities for students to meet the
national guideline within the school day could be the best option for reducing childhood

12
obesity (Donnelly & Lambourne, 2011; Strong, Malina, Blimkie, Daniels, Dishman,
Gutin, Hergenroeder, Must, Nixon, Pivarnik, Rowland, Trost, & Trudeau, 2005).
However, it is obvious that the regulations and guidelines currently in place at schools
across the nation are simply not getting the job done because another recent population
survey indicated that guidelines are not being met among the adolescent population
(Castelli et al., 2011; Ma et al., 2014; Mahar et al., 2006; Sallis et al., 2000). More
physical activity interventions are needed if children and adolescents have any sort of
hope in achieving the guidelines set forth by the CDC.
In public schools, physical activity opportunities have steadily declined since the
1970s, promoting a sedentary lifestyle among students (Donnelly & Lambourne, 2011;
Sacchetti et al., 2013). One study noted that this decline has continued because time
given for physical activity during the school day is less than it was even in the early
2000s as a result of increased focus on students’ standardized test results in the spring
(Fedewa & Ahn, 2011). These findings are sobering considering the need for more time
dedicated to physical activity rather than less. Public school systems are going in the
wrong direction in this area despite the knowledge that physical activity is valuable and
necessary in the school setting. One must begin to ask why this trend began, and further,
why it is continuing down this path of reduction.
Many believe that this reduction in time dedicated to physical activity during the
school day is due to growing pressures from government entities for increased instruction
time (Fedewa & Ahn, 2011; Ma et al., 2014). Increased stress to improve standardized
test scores has school districts across the nation making the decision to eliminate or
reduce the amount of time spent in enrichment programs, such as physical education, in

13
favor of more instruction time in tested areas, regardless of the known benefits of
physical activity on students’ overall health and wellbeing (Bunketorp et al., 2015;
Fedewa & Ahn, 2011; Martin & Murtagh, 2015; Taras, 2005). The increased emphasis on
improving academic achievement through standardized test scores has caused
administrators to review their processes and create new ways to improve their schools’
performance on the end-of-year exams. Logically, administrators assume that test scores
will increase in tested subject areas if the time dedicated to those subjects are increased
(Wilkins, Graham, Parker, Westfall, Fraser & Tembo, 2003). Therefore, time spent in
non-tested subject areas must be reduced or eliminated to create more time in the school
day for tested subject areas, such as English and Math (Ardoy et al., 2014; Marttinen,
McLoughlin, Fredrick & Novak, 2017; Rasberry, Lee, Robin, Laris, Russell, Coyle &
Nihiser, 2011; Seymour & Garrison, 2015). However, simply increasing students’ time
spent in tested subject areas does not ensure improvement on standardized test scores
(Ahamed et al., 2006; Trost, 2009; Wilkins et al., 2003).
The recent shift toward a decrease in physical education time in favor of
increasing time spent in the classroom is counterproductive, considering the benefits of
increased physical activity on one’s physical and mental health (Bunketorp et al., 2015;
Ma et al., 2014; Mahar, 2011; Singh, Uijtdewilligen, Twisk, Mechelen & Chinapaw,
2012; Taras, 2005). Unfortunately, administrators know increased physical activity levels
can be linked to improved academic performance yet choose to eliminate or reduce
physical education requirements for their students (Donnelly, Hillman, Castelli, Etnier,
Lee, Tomporowski, & Szabo-Reed, 2016). If it has been previously established that most
students are not meeting the daily physical activity recommendation outside of school,

14
one can assume if school-based opportunities are not available, students will not achieve
a healthy fitness level. Eliminating a student’s opportunity to engage in physical activity
on a regular basis may have negative repercussions for years to come.
The potential solution for improving students’ overall academic performance is to
increase the amount of time spent in daily physical activity (Trudeau & Shephard, 2008).
This can be done in an elementary setting by combining recess, structured activity time,
and activity breaks within the classroom (Carlson et al., 2015; Kibbe et al., 2011; Mahar,
2011; Naylor, Nettleford, Race, Hoy, Ashe, Higgins & McKay, 2015; Strong et al., 2005;
Wright et al., 2016). Most elementary schools already have a rotation of some sort for
structured activity time in physical education and a short recess time, assuming nothing
prevents the students from participating. However, a recent study concluded that no more
than 16% of school districts require regular physical activity breaks outside of recess and
physical education (Kibbe et al., 2011). Recess and physical education are wonderful
tools for aiding students in reaching the recommended goal and in teaching lifelong
cooperative learning skills, but additional opportunities are needed within the school day
to support these programs that are already in place (Singh et al., 2012). Further
intervention is needed to supplement physical education and allow for more ways to
apply physical activity knowledge and skills (Lee et al., 2007). Sending students to
physical education once a week is not a stand-alone solution. Increased time and variety
of methods of intervention are necessary to achieve the daily physical activity
recommendations.

15
Physical Activity & Cognition
Various studies have been conducted with the aim of investigating the effects of
physical activity on children’s cognitive function. Twelve out of the most recent 15
studies conducted in this area found significant effects on motor skills and cognitive
development while none of the 15 reported negative effects (Gao, Chen, Sun, Wen, &
Xiang, 2018; Zeng, Ayyub, Sun, Wen, Xiang & Gao, 2017). The authors concluded that
there was a positive association between physical activity and certain cognitive skills
such as working memory, attention, academic achievement, and language learning (Gao
et al., 2018; Haapala, 2012; Hillman et al., 2008; Roig, Skriver, Lundbye-Jensen, Kiens
& Nielsen, 2012). While a positive relationship has been established, more research is
necessary to further investigate this connection and provide evidence as to why this
relationship exists.
Physical activity causes a change in the human brain when one begins moving
actively through an increase in oxygen, blood flow, hormones, and oxygen levels
(McPherson, Mackay, Kunkel, & Duncan, 2018; Roig et al., 2012). Progress has been
made in connecting physical activity to brain structure and development, and research
shows that an increase in physical activity can cause an increase in brain-deprived
neurotrophic factor (BDNF) which facilitates learning (Roig et al., 2012; Zeng et al.,
2017). BDNF facilitates learning by improving synaptic plasticity and increasing brain
circulation (Singh & Staines, 2015; Zeng et al., 2017). When a person is sedentary, much
needed increases in blood flow and oxygen to the brain and the rest of the body does not
occur. The body must be in motion, causing the heart rate to increase, in order to pump
more blood to the brain.

16
A single bout of exercise can increase cortical excitability which improves
performance on specific tasks with executive functioning (Haapala, 2012; Singh &
Staines, 2015). Additionally, one study found acute aerobic exercise has a positive effect
on the primary motor cortex (Singh & Staines, 2015). Other studies confirmed these
findings, but also provided evidence that exercise promotes an increase in brain
activation and brain volume in the hippocampus, frontal, and parietal cortices (Haapala,
2012; Hillman et al., 2008; Roig et al., 2012). Movement is particularly important in
children as their brain and cognitive function is still developing (McPherson et al., 2018;
Zeng et al., 2017). Higher levels of physical activity in school-aged children have been
previously associated with physical and cognitive health across the entire lifespan (Zeng
et al., 2017). However, recent trends show a decline in physical health among children
(Hillman et al., 2008). The importance of a child moving throughout the school day is far
beyond that of student achievement on standardized tests. Providing opportunities for
them to move throughout the day while they are still in crucial cognitive and physical
development stages can make an impact on their health for the rest of their life.
Students moving throughout the day is beneficial, but structured activity with a
physical education specialist is also valuable to ensure correct motor skill development.
Some believe a positive relationship between motor skills and cognition exists because
they have several consistent underlying processes such as planning and sequencing
involved (Zeng et al., 2017). General movement is important, but the most effective
physical activity interventions should include instruction for motor skills to ensure the
students are developing these skills while also receiving positive health benefits during
movement. Children today are showing limited motor skill abilities and need guidance in

17
this area (Zeng et al., 2017). Schools are failing their students if they do not promote
opportunities to develop these abilities correctly because they have the means and
opportunity to provide physical education services to all children.
Physical Activity & Rural Communities
The benefits of physical activity are plentiful, yet, as mentioned previously, many
choose to remain sedentary despite the known benefits of staying active. Individuals
might choose a sedentary life for various reasons, some controllable and some
uncontrollable. Where a child lives would be considered an uncontrollable variable for
them and one study notes that living in a rural environment creates more barriers and
obstacles for being active than other communities (Seguin, Connor, Nelson, LaCroix &
Eldridge, 2014). Noted barriers include limited access to recreation centers, weather, and
resources to be active in the community (Seguin et al., 2014). These barriers could be
attributing to the fact that physical inactivity is even more prevalent in rural areas than
other regions (Park, Eyler, Tabak, Valko & Brownson, 2017). The current study was set
in a small, rural community so this variable must be taken into consideration moving
forward.
Living in a rural community has been connected with an overall poorer quality of
life as a result of increased poverty levels, inferior health, and a lack of opportunities
(Kristjansson, Elliot, Bulger, Jones, Taliaferro & Neal, 2015). A child with a lower
socioeconomic status, fewer opportunities, limited access, and insufficient health is going
to be less likely to be active than a child with none of these barriers to face. Regardless of
a child’s background or opportunities at home, all children are given similar opportunities
in a public school system. What a child experiences outside the walls of the school cannot

18
be easily controlled or anticipated in many cases. One study found that individuals in
rural communities are aware of the dangers of being sedentary, have an interest in
physical activity, and pointed to the schools’ facilities as the solution to increasing
physical activity for children (Kristjansson et al., 2015). School facilities create a means
for activity that might otherwise be nonexistent in a rural area. Providing students with
opportunities to be active and teaching them how to make healthy choices is a
responsibility that lies with the school system in all demographics but is even more
valuable in a rural community.
Another substantial barrier for those living in rural communities is that more and
more children are watching TV and playing video games. One study found that 40% of
children watch at least 3 hours of TV per day and 43% of children play video games for
at least 3 hours per day among 5th graders (Kristjansson et al., 2015). Perhaps the increase
in technology use is taking the place of physical activity because watching TV is so much
more accessible than being active. The same study found that a third of the boys and an
even smaller number of girls in the same age group meet the minimum required daily
physical activity recommendations (Kristjansson et al., 2015). As technology has
improved and increased in society, children’s activity levels have decreased, especially in
rural areas.
Fun and innovative physical activity opportunities are needed in schools to get
children excited about being active again. If students can become engaged in activity at
school, it might pour over at home to where they seek out opportunities to be active
rather than choosing to watch another hour of TV or play another round on their video
game. On the other hand, if children do not choose to remain active outside the school,

19
providing physical activity opportunities within the confines of the school day is even
more vital to ensure they have a fighting chance to meet the daily recommendations.
Academic Performance
There are many known health-related benefits to daily physical activity, but
studies are also showing that there is a positive association between physical activity and
academic achievement in children and adolescents (Ardoy et al., 2014; Hillman et al.,
2008; Lees & Hopkins, 2013; Rasberry et al., 2011; Sibley & Etnier, 2003). While a
positive association is a step in the right direction, this is a rather vague statement about
the association that exists between the two variables because causation has yet to be
established due to study limitations, effect size, or measurement error (Bunketorp et al.,
2015; Resaland et al., 2015; Sallis et al., 2000; Sibley & Etnier, 2003). Therefore, further
investigation is needed in this area to provide validity for the importance of physical
activity and its connection to academic performance (Castelli, Hillman, Buck & Erwin,
2007; Taras, 2005). To really understand the association, one must first define both
physical activity and academic achievement. Moving forward, physical activity will be
recognized as any type of bodily movement that increases energy expenditure beyond
what is required at rest (CDC, 2010; Lees & Hopkins, 2013; Rasberry et al., 2011;
Trudeau & Shephard, 2010). Although sometimes used interchangeably with academic
performance, academic achievement is strictly based on results from formal and
standardized assessments, including grade point average (GPA) (CDC, 2010; Rasberry et
al., 2011). It seems that many studies have only looked at a portion of the overall picture
of the relationship between physical activity and academics because academic
achievement is only a piece of the puzzle that is academic performance.

20
Academic performance is a general term referring to a student’s overall
performance in school and includes three separate components: academic achievement
(defined earlier), academic behavior, and cognitive skills (CDC, 2010). Academic
achievement is of course a critical factor, but one must not overlook two other key areas:
academic behavior and cognitive skills and attitudes. Academic behaviors include on-task
behaviors, being punctual, and organized, all of which are critical to student success
(CDC, 2010; Rasberry et al., 2011). Cognitive skills and attitudes include traits such as
attention, memory, and motivation (CDC, 2010; Rasberry et al., 2011). The picture of the
existing association is incomplete without looking at all three components of academic
performance in greater detail.
Academic Achievement
Many studies have been conducted over the last couple decades striving to get a
better representation of the relationship that exists between increased physical activity
and academic achievement (Ardoy et al., 2014; Bunketorp et al., 2015; Castelli et al.,
2011; Haapala, 2012; Tomporowski, Davis, Miller & Naglieri, 2008; Trudeau &
Shephard, 2008). While school performance has always been a priority for many, the last
few decades have pushed for a greater emphasis on academic achievement as it pertains
to high-stakes standardized tests (Wilkins et al., 2003). Perhaps this push has caused
many to equate academic achievement on tests to academic success. There is no doubt
that standardized assessment scores signify where an entire school or grade might fall in
relation to others, but it is not the only indicator of academic success. In fact, academic
achievement and standardized tests have so many other variables that are involved in the

21
equation, it has been difficult to find a strong correlation between physical activity and
academic achievement.
A few studies demonstrated that increasing physical activity has no negative
implications on academic performance (Ahamed et al., 2006; Carlson et al., 2008;
Donnelly & Lambourne, 2011; Hillman et al., 2008; Sallis, McKenzie, Kolody, Lewis,
Marshall & Rosengard, 1999; Sibley & Etnier, 2003; Trost, 2009; Trudeau & Shephard,
2010; Watson et al., 2017; Wilkins et al., 2003). If there are no negative implications,
even when reducing classroom time to increase time dedicated to physical activity, one
must wonder why the notion to reduce physical activity and increase classroom time
continues. Many administrators and educators consider physical education to be a “lower
status” subject and opt to dedicate more time to important “academic” subjects such as
science and mathematics (Fedewa & Ahn, 2011; Sallis et al., 1999; Sibley & Etnier,
2003). Rather, the subject areas that are assessed at the end of the academic school year.
Several studies have established a positive relationship exists between increased
physical activity and academic achievement (Ardoy et al., 2014; Hillman et al., 2008;
Lees & Hopkins, 2013; Rasberry et al., 2011; Sibley & Etnier, 2003; Trost, 2009;
Trudeau & Shephard, 2008). Therefore, increasing students’ activity time will support the
efforts of educators to increase performance on standardized assessments over time.
Reducing activity time in favor of more class time promotes more sedentary behaviors
which has been found to be associated with increased obesity levels and a decrease in
academic performance (Haapala, 2012). School systems that are consciously choosing to
compromise activity time are working against their own goals. Evidence is mounting that
supports students with high levels of physical fitness are associated with higher levels of

22
academic performance (Trost, 2009). This evidence further supports the notion that
increasing activity time will aid in improving one’s overall physical fitness and thereby
improving academic achievement.
Academic Behavior
Behavior is a complex topic that helps represent an individual’s unique
personality. Academic behaviors are specific traits that may have an impact on academic
performance (CDC, 2010; Ma et al., 2014). These behaviors, or indicators, have been
tracked by several different academic studies across all school-aged children. It was
found that the following indicators may have a direct impact on academic performance:
on-task behavior, organization, planning, attendance, scheduling, and impulse control
(CDC, 2010). These are valuable qualities for any individual in school or even in a
workplace environment. If a student is on-task often, they will likely have more success
both in the classroom and on state assessments than their peers who spend more time off-
task than on-task (Davis & Cooper, 2011; Goh, Hannon, Webster, Podlog & Newton,
2016; Mahar et al., 2006; Trudeau & Shephard, 2010). The same predictive statements
could be made for the other indicators as well; take organization for an additional
example. A student who attends class with their folders and assignments organized by
assignments’ due dates will likely have their assignments submitted on time. However, a
student who has a few papers crumbled into a backpack in a disheveled fashion might not
remember or even realize when their assignments are due.
While all these indicators are important to describe academic behavior, on-task
behavior and attention are the most objective to consistently observe (Wilson et al.,
2015). Therefore, most of the available research on academic behavior specifically

23
examines on-task behaviors (Ma et al., 2015; Mahar et al., 2006). There are likely many
definitions or descriptions from educators on what on-task behaviors look like in their
classrooms. However, one study went so far as to define both on-task and off-task
behaviors so there would be more objectivity to their study. In this investigation, on-task
behaviors were defined as “verbal and motor behaviors that followed class rules and were
appropriate to the learning environment or activity” (Mahar et al., 2006). Examples of on-
task behaviors would be working on assignments at their desk, involved in group
discussion, answering teacher prompts, and overall engagement in the classroom
environment (Mahar et al., 2006). In general, on-task behaviors are any type of behavior
that represents attentiveness to the teacher, learning environment, and their peers.
Off-task behaviors were broken down into several different categories. Motor off-
task behaviors are any type of gross response that disrupts the learning environment such
as, leaving one’s seat without permission or even aggressive behaviors such as slapping,
throwing, or taking someone’s property (Mahar et al., 2006). Noise off-task behaviors
included both object and voice noise that interrupts the learning situation such as, yelling,
laughing, rapping a desk, or slamming books (Mahar et al., 2006). The final category is
passive, or other off-task behaviors, when the students are not involved when they are
expected to be such as daydreaming or playing with their hair (Mahar et al., 2006).
Students that display these types of behaviors make it more difficult to learn because of
the environment they create for themselves (Wilson et al., 2015). These behaviors would
be disruptive or at the very least, unacceptable, in any learning environment.
Most educators would likely agree that students that spend more time on-task are
easier to teach and more likely to learn (Trudeau & Shephard, 2010). Further, they would

24
likely agree that off-task behaviors displayed by students are frustrating and difficult to
overcome both from a teaching and learning standpoint (Sullivan, Johnson, Owens &
Conway, 2014). If students that display on-task behaviors more consistently are more
successful academically, one can assume that efforts to increase on-task behaviors would
be appreciated. Studies have shown that increases in physical activity have a positive
association with on-task classroom behaviors (; Barros et al., 2009; Carlson et al., 2015;
Goh et al., 2016; Ma et al., 2014; Mahar et al., 2006; Trudeau & Shephard, 2010; Wilson
et al., 2015). In contrast, students that spend long periods of time in classrooms for
academic instruction are more fidgety and struggle to concentrate (Goh et al., 2016; Ma
et al., 2014; Mahar et al., 2006; Trudeau & Shephard, 2010). Therefore, a student that is
more active during the school day is more likely to be on-task and thereby have a higher
probability for academic success.
Cognitive Skills and Attitudes
Several traits separate a successful student from an unsuccessful one. Too often, a
student’s success has been decided or understood by simply reviewing GPAs and test
scores because they are considered “formal” assessment tools (CDC, 2010; Rasberry et
al., 2011). However, the qualities that truly set one student apart from another are unique
to them and can be categorized as cognitive skills and attitudes. Cognition is a broad term
that represents several mental processes including executive function, control processing,
visuospatial processing, and speed processing (Rasberry et al., 2011; Tomporowski et al.,
2008; Watson et al., 2017). Executive function includes skills such as memory and
planning and the other three processing systems include reaction time, perceptual
learning, and automatization of response (Rasberry et al., 2011; Tomporowski et al.,

25
2008). Most would agree that a student that lacks any number of these qualities would be
at a disadvantage in school-based learning activities.
Recent studies in cognition and mental processing have found that healthier
children, as well as those receiving acute bouts of exercise as an intervention, perform
better on cognitive assessments than their peers, supporting the findings from adult
assessments (Castelli et al., 2007; Castelli et al., 2011; Davis & Cooper, 2011; Donnelly
& Lambourne, 2011; Fedewa & Ahn, 2011; Fedewa et al., 2015; Lees & Hopkins, 2013;
Tomporowski et al., 2008;). This finding means that students, who are more sedentary,
will tend to perform slower and not as well on cognitive assessments (Davis & Cooper,
2011). Since cognitive skills and abilities are integral to academic performance, one can
assume that students that are more sedentary will tend to have a poorer performance on
standardized assessments. However, more information is needed on this topic because
there is clearly a connection between exercise and cognition, but much is still unknown (;
Fedewa & Ahn, 2011; Rasbery et al., 2011; Sibley, Etnier & Masurier, 2006;
Tomporowski et al., 2008; Wilson et al., 2015). Further investigation is needed to
determine a proper time and type of exercise needed to experience a positive outcome for
cognitive skills (Castelli et al., 2011; Fedewa et al., 2015; Hillman et al., 2008; Rasberry
et al., 2011; Watson et al., 2017). The connection has been found, but the specifics of the
dose-response relationship as it relates to exercise and cognition is still unknown.
Several investigations have provided evidence that children experience an
improvement in executive function when involved in an exercise program (Ardoy et al.,
2014; Davis, Tomporowski, McDowell, Austin, Miller, Yanasak, Allison & Naglieri,
2011; Ma et al., 2014; Sibley & Etnier, 2003). One study sought to investigate this

26
relationship more specifically by examining the effects of intensity of physical activity on
executive functions. Their results suggest that simply adding time spent in physical
activity is not enough to make a difference on a student’s executive function; the intensity
must be increased as well (Ardoy et al., 2014; Davis et al., 2011; Ma et al., 2015). This
theory might be further supported through a meta-analysis that indicated short bouts of
classroom activity did not have a clear effect on cognitive functioning (Davis et al., 2011;
Watson et al., 2017;). However, other studies found that increasing activity was enough
to improve executive function, but not overall academic achievement (Castelli et al.,
2011; Haapala, 2012; Hill, Williams, Aucott, Thomson & Mon-Williams, 2011). While
classroom-based activity is a great way to help students achieve the daily
recommendation for physical activity, more intense bouts are necessary to have a positive
and significant impact on cognitive skills and abilities.
Variables Impacting Student Behavior
Academic behavior is a strong component of the total picture of academic
performance. Often, student and academic behavior are used interchangeably. However,
there are several variables acting with student behavior that create the outcome of one’s
overall academic behavior. A student’s demographics, family background, peer
influence, and fitness are only the tip of the iceberg of factors that play a role in how a
student carries themselves during the school day, or student disposition. One study
identified a “learning ecosystem” claiming that productive learning and teaching is
synonymous with productive behaviors (Sullivan et al., 2014). Productive behaviors are
integral to student learning and overall academic performance.
27
A student’s demographics are most certainly out of their control; nevertheless,
they play a role in behavior and academic success. For example, “male dominant”
behaviors are more common in school-aged boys while avoidance and withdrawal
behaviors are more common in girls (McDermott & Schaefer, 1996). Preadolescent
children are also more prone to Attention-Deficit/Hyperactivity Disorder (ADHD) than
adolescent children who are more prone to Avoidant Syndrome where students display
aloof behaviors (McDermott & Schaefer, 1996). This finding affirms that age is a factor
in the method and type of misbehaviors displayed by school-aged children. Delinquent
and avoidant-type behaviors are also more common in less educated parents (McDermott
& Schaefer, 1996). This suggests that socioeconomic status or social class through level
of education completed is an additional reason for poor behavior, including anger
outbursts associated with externalizing problems (Pitzer et al., 2009). A student’s
ethnicity might also influence behavior, but there is not a great deal of research that
investigates this aspect of a student’s demographic (McDermott & Schaefer, 1996). Some
studies note that both low socioeconomic status and ethnic minorities are unreasonably
inactive by age 11 (Bartholomew & Jowers, 2011; Davis et al., 2011). Many
uncontrollable variables do play a role in student behavior that educators and
investigators alike need to keep in mind moving forward.
Another large factor in student behavior is the development of one’s personality.
Studies have demonstrated that there are several variables that impact personality
development including the mother-child relationship, temperament, and stress (Bates,
Maslin & Frankel, 1985). Within the constructs of the mother-child relationship,
warmness, involvement, control, and educative behaviors the mother displays to her

28
children early in their life could impact their behavior in the future (Bates et al., 1985;
Caspi, Henry, McGee, Moffitt & Silva, 1995). A child’s temperament is mostly
biological and unique to them including traits such as sociability or extraversion but is
also impacted by their activity levels (Bates et al., 1985; Pekdogan & Kanak, 2016). The
stress that a child experiences is typically attributed to their family environment,
including divorce or marital discord (Bates et al., 1985). A child’s personality could be
one of the single most valid predictors for behavior that is somewhat uncontrollable.
Impulse control is an additional factor that impacts student behavior through
internalizing and externalizing problems (Eisenberg, Sadovsky, Spinrad, Fabes, Losoya,
Valiente, Reiser, Cumberland & Shepard, 2005). When a student externalizes their
problems, one might act out through anger or hostility, but when problems are
internalized depression and anxiety might be observed (Eisenberg et al., 2005; Pitzer,
Esser, Schmidt & Laucht, 2009). Children that internalize their problems are likely to
experience social issues because they tend to be more withdrawn, creating more anxiety
for the child (Eisenberg et al., 2005). However, children that externalize their problems
through anger, also identified as the difficult child concept, are more likely to have issues
with academic work and struggle with friendships that can result in physical outbursts
such as hitting (Eisenberg et al., 2005; Pitzer et al., 2009). If teachers are unable to
discover the root of the child’s off-task or negative behaviors, their reaction might have
an even greater negative impact on the child, resulting in more negative behaviors in
school.
Each student’s situation is unique and often it is unknown what they experience
outside the walls of the school building. An increasing number of children are growing

29
up in single-parent families due to divorce and unwed mothers, especially in
economically disadvantaged families (Ackerman, D’Eramo, Umylny, Schultz & Izard,
2001). Typically, students from single-parent households experience a variety of problem
behaviors and difficulty in school (Ackerman et al., 2001). There is conjecture on why
this association exists, but many researchers claim that the added stress of a single
income, economic job demands, and the lack of an adult male role model plays a major
role in their child’s behavior issues (Ackerman et al., 2001). Interestingly, the lack of an
adult male role model is more likely to have a negative impact on boys than girls
(Ackerman et al., 2001). This seems like a logical conclusion to be found because with
the absence of an adult male, the boy has no one to admire or aspire to be as they mature.
Additionally, poor parenting practices or overall family disfunction have a different effect
on girls than boys (Pitzer et al., 2009). The same issues are found in families that
cohabitate because it brings a level of uncertainty to the children in the home, another
trait that is more prevalent in economically disadvantaged families (Ackerman et al.,
2001). The untraditional structure of a child’s home plays a major role in problematic
behavior patterns.
There are several factors influencing student behavior that are both within and
outside a student’s control. Social relationships or social competence impact student
behavior (Pekdogan & Kanak, 2016). Being accepted or rejected by a friend group is
important to children and congruently studies show that being accepted aids in child
development while being rejected is considered a risk factor (Hartup, 1996). However,
more research is needed on this topic to strengthen this finding (Hartup, 1996). Making
and keeping friends can be equated to being socially skilled, but it depends on the child

30
and the relationship that is developed as to whether this bodes well for the child’s future
(Hartup, 1996). Some children are respectful, outgoing, and all-around good children and
will most likely have a positive impact on their friendships. However, children that are
disposed to getting into trouble may tend to have a negative impact on friendships.
Therefore, simply making and keeping friends is not always an indicator for a promising
future (Hartup, 1996). Children must be able to choose their friends wisely because they
will be impacted by the behaviors of their peers. One can assume if their friends are
prone to get into trouble, it will only be a matter of time before the child will also find
themselves in trouble.
In addition to the relationships developed among peers, a recent study points to
the significance of the parent-child relationship and its impact on several behavior
patterns in children (Tarver, Daley, Sayal, 2015). A child’s relationship with their parent
is the first they come to know and logically this relationship could be the foundation to all
others the child will establish. Parents are the gatekeepers for their children and what they
allow, encourage, or establish will have a lasting impact on their child. One study noted
that parenting interventions and attempts to establish a positive parent-child relationship
may have influences on a child’s disruptive behavior and academic functioning (Tarver et
al., 2015). Establishing a positive relationship between parent and child is vital to the
child’s development. Everything that a parent does or does not do has an inevitable
influence on their child, including helping their child make decisions about their health
and wellness by setting the example and promoting healthy eating choices and providing
opportunities for their child to be active.
31
One of the most controllable factors is the level of a child’s health or frequency of
engaging in physical activity. Studies show that students that are more fit, are more likely
to display good behavior, including attentiveness in the classroom (Davis & Cooper,
2011) At the same time, students with lower levels of fitness demonstrated more off-task
behaviors in classroom settings (Davis & Cooper, 2011). Another study found that even a
15-minute activity break can result in better group behavior (Barros et al., 2009). Even
more studies have supported that increasing physical activity also increased students’ on-
task classroom behavior and decreases off-task behavior (Watson et al., 2017). Obesity is
more common in students with documented Attention Deficit Hyperactivity Disorder
(ADHD), which has also been associated with more off-task behaviors than their peers
(Davis & Cooper, 2011; Ma, Mare & Gurd, 2015). ADHD has become more common
with 3-7% of school-aged children diagnosed and increases in physical activity could
help students manage this disorder (Gapin, Labban & Etnier, 2011). Additionally, one
study points to a positive parent-relationship intervention plan aiding in negative
behaviors for students with ADHD (Tarver et al., 2015). An aspect of this relationship
could be encouraging healthy behavior patterns and possibly establishing opportunities
for families to be healthy and active together (Sallis et al., 2000). Establishing an
emphasis on health and wellness at home could be a difference-maker for students’
attitudes and perceptions about being active both at home and at school. Perhaps this
disease related to attention issues becoming more common over the same time that
physical activity levels have decreased is a coincidence, but the two could be related.

32
CHAPTER THREE
METHODOLOGY
The following section provides information about the participants that were
involved in the study. Additionally, there is information regarding the instruments used to
assess student activity levels, academic achievement, cognitive skills and attitudes, and
academic behavior. The procedures that were used for the study were included as well as
the data analysis of the findings.
Participants
The participants for this study were recruited from seven 4th and 5th grade classes
from one elementary school in a rural county in Central Kentucky. The primary
investigator participated in the school’s open house day the first week in August to
promote the study, distribute consent to parents and assent forms to students. Additional
forms were left for classroom teachers to place in their “Wednesday Folders”, a folder the
teachers use each week to send valuable information home information to students’
parents. The students who returned both permission forms and agreed to participate in the
study received a cloth drawstring backpack from the University of Kentucky Pediatric
Exercise Physiology Laboratory Endowment fund.
Ninety students (Mage = 9.84 +/- 0.60) returned the parent consent form, and they
were randomly assigned into intervention and control groups. More students from 4th
grade returned forms than those in 5th grade causing the average age to be lower than
anticipated. Due to having a limited number of accelerometers, the intervention group
was divided into two different groups. The respective numbers were 30 control students,
28 I1 (intervention one) students, and 32 I2 (Intervention 2) students with each

33
intervention group receiving four weeks of the intervention. The students in the control
group received their regular physical education time and any other activity breaks that
their teachers allowed. The intervention group received a total of 60 minutes per week of
additional activity through the intervention. Of the 90 students who agreed to participate
in the study, only two were withdrawn. One of the students chose not to participate after a
couple weeks of the intervention, and the other moved to another school district and was
removed.
Student demographics, including sex, ethnicity, and age were comparable
between the intervention and control groups. Overall, there were 51 boys and 37 girls in
the study. Thirty-seven of the total number of students were in 5th grades while 51 were
in 4th grade. According to the Kentucky Department of Education (KDE), the school is
55.4% female and 44.6% male with a total enrollment of around 400 students (KDE,
2017). Other demographics of the school include 69.7% White Non-Hispanic, 7.7%
Black Non-Hispanic, 4.9% Hispanic, 1% Asian, and 16.2% are students with more than
one race. In the study, 72% were White Non-Hispanic, 15% were Black Non-Hispanic,
2% were Hispanic, and 11% identified with more than one race. 83.3% qualify for the
free lunch program in Kentucky (KDE, 2017). Diversity is not prevalent in this rural
farming community of Central Kentucky with the entire community reflecting similar
statistics among races at 88% White Non-Hispanic, but equal representation of all races
was sought in both groups of participants (Ratcliffe et al., 2016; U.S. Census Bureau,
2016). Overall, the county is considered below average in household income with a
median yearly income of $26,733 compared to the state median yearly income of $44,811

34
(U.S. Census Bureau, 2016). As many as 37% of the children from this county are living
in poverty (County Health Rankings, 2018).
Instruments
Considering the number of variables involved in this study, there were several
different measures taken throughout the 8-week intervention. These include physical
activity, academic achievement, academic performance, classroom behavior , and
cognitive skills.
Accelerometer. First, an objective actigraphy device EKHO MVPA H206G
accelerometer was used to count students’ steps during the physical activity intervention
time for those in the intervention groups. Each intervention group received extra physical
activity for 20 minutes, 3 days a week, for 4 weeks in addition to their regular activity
breaks and physical education class. The control group did not wear the device during
their regular physical education time. Steps were only recorded for those who received
the intervention to see how much extra physical activity they received during the 20
minutes they were in the gym. Since the control group did not wear the accelerometers, it
was understood that the level and type of activity during physical education, recess, and
other activity breaks would be comparable to that of the intervention group. Although this
was a limitation of the study, the lack of resources for the accelerometers only allowed
the intervention group to be measured with this device to determine the amount of
activity beyond the average amount during the normal activity times throughout the day.
This device has been identified as a reliable method for objectively counting steps
compared to competing devices such as the pedometer (Bailey & DiPerna, 2015; Carlson
et al., 2015; Hart, Brusseau, Kulinna, McClain & Tudor-Locke, 2011; Lees & Hopkins,

35
2013; Martin & Murtagh, 2014; Resaland et al., 2015; Sibley et al., 2006; Troiano,
Berrigan, Dodd, Masse, Tilert & McDowell, 2007). Some studies are citing the need to
use accelerometers in future studies due to their higher levels of accuracy (Hart et al.,
2011; Mahar et al., 2006). The accelerometers were distributed prior to the activity times
and students were instructed each time to clip the device onto the right side of their
waistband or belt directly in line with their right knee cap. The devices also have a
security clip that the students were instructed to clip to their shirt for further stability
during activity. After the activity time was completed, the students returned their devices
to a storage container that was labeled according to the number listed on each device.
Measures of Academic Progress Assessment. The first component of academic
performance that must be assessed is academic achievement. The MAP (Measures of
Academic Progress) is a national standardized test used to prepare students for future
tests and provide indicators for educators by making projections as to how their students
will score on future standardized tests in Reading, Language Arts, Science, and
Mathematics (Fedewa et al., 2015; NWEA, 2017). The school had a pre-determined
scheduled “practice” MAP tests given at three different points in the year with the
purpose of preparing their students for the end-of-year state assessments (E. Rhodes,
personal communication, March 9, 2018). The students took the first of three tests in
August and the second test in December (E. Rhodes, personal communication, March 9,
2018). The September test served as the baseline score for academic achievement and
signified the starting point of the study. The school released the raw scores for each
student involved in the study. The second assessment was the post-test and slated to be
the conclusion of the study. However, outside circumstances forced this assessment to be

36
administered six weeks after the final week of the intervention. The students’ results were
compared from the first to the second assessment to determine whether the physical
activity intervention effected their performance on the standardized test compared to the
control group.
Stroop Test. Next, the students’ cognitive skills were assessed through a digital
Stroop Test that was administered two times to each student immediately prior to and
following their intervention time (Memarmoghaddam, Torbati, Sohrabi, Mashhadi &
Kashi, 2016). The Stroop Test measures specific components of high levels of executive
function such as selective attention, response inhibition, self-control, and mental speed
(Castelli et al., 2011; Kvalø, Bru, Brønnick, & Dyrstad, 2017; Resaland et al., 2015;
Sibley et al., 2006; Wright et al., 2016). The students were given a list of words that
represent the color they are (the word red will be colored red) and be asked to read the
words aloud while being timed. Then, the students were given a second set of words that
had conflicting words and colors (the word black might be colored green) and were asked
to read the color of the word aloud while being timed. If the student missed a word or
responded incorrectly, the investigators paused and pointed to the missed word for the
student to correct their response before moving on to the next word in the series. This
was a short, simple test that has been used in previous studies as a representation of level
of executive function as it relates to cognitive skills.
Student Behavior Questionnaire. Classroom behavior was assessed in two
different ways to increase the accuracy and validity of this measure. First, the students
were assessed using one component of a teacher-based questionnaire adopted from a
previous study (Carlson et al., 2015). The teachers were asked to complete an 11-question
37
survey that assessed the general behavior and performance of all the students in each of
their classes involved in the study (Carlson et al., 2015). The questionnaire was a
subjective measure completed during the first and last weeks of each intervention of the
study to investigate the effects of the physical activity intervention on general
performance or behavior in the classroom. The classroom teachers completed these
surveys for the control and I1 students in the first and fourth weeks and then the I2
students in the fifth and eighth weeks of the study.
Systematic Behavior Observations. The students were also assessed objectively
using direct, systematic observations immediately following their activity times during
the first and last weeks of each intervention. Again, the control and I1 students were
observed in weeks one and four and the I2 students were observed in weeks five and
eight. The observations were made using partial interval recording at five seconds of
observations and five seconds to record (Ma et al., 2015; Mahar, 2011). Partial recording
means that if a behavior is present at any point during the 5-second observation, the
behavior is recorded on the data sheet (Mahar, 2011). The behaviors being observed were
on-task behaviors, motor off-task behaviors, noise off-task behaviors, and other/passive
off-task behaviors as used in a previous study (Mahar et al., 2006). For the purposes of
inter-rater reliability, a secondary observer observed about 40% of the sessions split
between the first and last week of each intervention in the study (Goh et al., 2016). The
secondary observer was trained prior to the study and had two opportunities to practice
with the primary observer before the study began.

38
Procedures
Before the study could begin, approval from the University of Kentucky Non-
Medical Office of Research Integrity, administrators, and educators was sought. Once
approval was received, recruitment of participants began by attending the school’s open
house in August to discuss the study with students and parents alike. The consent and
assent forms were distributed on this night as well through the student welcome packets
that were handed out during registration for the event. The students were given
instruction to return the forms within two weeks to their homeroom teacher to be
considered for participation in the study. Once the forms were returned, they were
organized and randomly chosen for the three different groups and then given an ID
number for privacy and showed reference to their chosen group. The ID numbers were
created to help identify the student and provide confidentiality. Each student was
assigned a letter based on their homeroom teacher’s last name, their group number (C –
Control, I1 – Intervention 1, or I2 – Intervention 2), a number based on their grade (4 or
5), and a number based on their student number from the class rosters. For example,
WC4-4 would mean student 4 in 4th grade from homeroom “W” in the control group.
Once the groups were chosen, they were brought together in the gymnasium to
further discuss the study. The students were given an accelerometer number (based on
their ID number), instructed on the distribution and collection process for the devices,
and taught how to attach the device to their clothing. The students were told of the
scheduled intervention times and also were reminded of the classroom observations in the
hopes of avoiding issues of distraction on the days they were observed. There was also a
short time to answer any questions the students had about the study. The meeting took

39
place during school hours, so parents were encouraged to contact the investigator or one
of the teachers to ask questions, if they had any, about their child’s involvement in the
study.
In August, the students were administered the MAP test for the first time. Results
from that assessment were collected, entered into Microsoft Excel, and stored on a
password protected flash drive for the remainder of the study. Teacher-based
questionnaires were distributed during the first day of MAP testing and asked to be
completed by the end of the week. On the last day of MAP testing, the questionnaires
were gathered, and the results were entered into a Microsoft Excel file and stored on a
flash drive. Once all the students finished each component of the assessment, the physical
activity intervention began.
All students gathered in the gym as they arrived to school for the day. The
intervention group was asked to remain the gymnasium every Monday, Wednesday, and
Thursday morning when the rest of the students were dismissed to go to their regular
classes. The first group participated in the physical activity intervention from 8:00-
8:20am for four weeks and then the second group participated for four weeks while the
first group went on to class as usual. Upon arrival, students were given accelerometers
according to student number and reminded of placement of the device. At the end of each
activity time, the accelerometers were returned, and the step counts were documented in a
Microsoft Excel file. After all the accelerometers were securely placed on each student,
and instructions were given for the activity, the students were asked to participate as fully
as possible for the entire 20 minutes.

40
Physical Activity Intervention. The students participated in a variety of pre-
planned activities with the goal of increasing steps, heart rate, and teaching social and
responsible cooperative learning skills (Martinek & Hellison, 2016; Parker & Hellison,
2001). This physical activity model has been used previously to target low-income youth,
who might be more prone to certain struggles due to their economic status, to teach
respectful behavior and general cooperation (Martinek & Hellison, 2016). The activities
were two-fold because the level of intensity increased their overall time spent being
active, but the underlying purpose of the activities also taught the students valuable skills
aimed at improving their overall behavior. Considering some of these students were
previously identified by administrators as displaying issues with classroom behavior, this
model of intervention seemed to be the most appropriate and beneficial.
Each day of the first week of each intervention, direct observations took place
until each student had been observed. The students were observed based on classroom
teachers each day in an effort to reduce disruptions throughout the observation period.
Two classrooms were observed each day on Monday, Wednesday, and three on Thursday
with any makeup observations on Thursday or the following Monday. The secondary
observer performed direct observations in three of the seven homeroom classes to ensure
interrater reliability. The study included the final round of direct observations mirroring
the first weeks of each intervention during the last week of each intervention. The
students were observed those three days in each of the weeks immediately following the
intervention time until all the students had been observed. Both the intervention and
control groups were observed during these weeks at 5-second partial interval observation
and recording.
41
Throughout the 8-week study, the Stroop Test was administered on the
intervention groups to detect the effect of the physical activity intervention on students’
executive functioning. Three students were tested before and immediately after the
intervention session until each student in the group had been assessed. The students were
asked to complete two phases of the Stroop Test. First, students read the word while the
color reflected the word and then the students said the color of the word while the color
contradicted the written word. The students were timed on both phases of the assessment
before and after the intervention session. Four total times for each student will be
recorded on location and entered into a Microsoft Excel file to be stored on a flash drive
throughout the study.
At the conclusion of the 8-week intervention time, students were administered the
MAP test once again. The raw score for each student were collected and recorded in a
Microsoft Excel file and compared to the baseline scores from the first test. Additionally,
teachers were again given the questionnaire and asked to return it by the end of the week.
The results from the teacher-based questionnaire was collected and entered into
Microsoft Excel to compare to the results from the first week of each intervention. The
questionnaires were administered a total of four times throughout the eight weeks with
the control and I1 groups being completed in weeks 1 and 4 and the I2 group in weeks 5
and 8, signifying the beginning and end of their respective interventions. Once all the
data was collected from the direct observations, teacher-based questionnaires, MAP tests,
Stroop Test, and accelerometers data analysis began.

42
Data Analysis
The current study sought to determine the effects of extra physical activity on
student academic performance by breaking down the components of academic
performance into three sections: academic achievement, academic behavior, and
cognitive skills. The students were evaluated through MAP scores, classroom
observations and teacher-based questionnaires, and a two-phase Stroop test. Each group
was randomized, and each variable was tested before and after the intervention period.
The only variables tested exclusively within the intervention groups was students’
cognitive skills through the Stroop test and step counts with the MVPA accelerometers.
This was because Stroop was intended to measure how the activity intervention effected
the students’ cognitive skills and abilities so without the intervention, this measure was
impossible to assess (i.e. control group). Additionally, the accelerometers were used to
determine how many steps were actually gained through the extra time spent in the
intervention activity, making this measure unnecessary for collection in the control
group.
Data were collected and entered into Microsoft Excel throughout the study. Once
all the data had been collected, it was analyzed using the data analysis function in
Microsoft Excel and transferred into SPSS (version 24.0) for additional analysis. The
amount of physical activity served as the independent variable and MAP scores, Stroop
Test times, Teacher-Based Questionnaire, and direct systematic observations served as
the dependent variables. Linear regression was run to determine descriptive statistics, test
for significance of the variables, and determine variance. To test for significance of the
dependent variables, a two-tailed T-Test at the 95% confidence interval and .05

43
significance level (p < .05) was conducted on each individual variable as it was
associated with physical activity. The Coefficient of Determination (R2) was used as well
to determine the amount of variance explained by each dependent variable involved in
the study.

44
CHAPTER FOUR
RESULTS
A total of 90 students with parental consent in seven 4th and 5th grade classes (four
5th grade, three 4th grade) participated in this study. The total number of students dropped
to 88 due to two being withdrawn from the study for varying reasons. Of the 88 students
remaining, 32 were female and 56 were male. Additionally, 64 considered themselves
Caucasian while the remaining 24 students identified with a different race. The average
age of the participants was 10 years old. The total numbers in each group were Control
(C) = 30, Intervention 1 (I1) = 28, and Intervention 2 (I2) = 32. The participants in the
intervention groups averaged slightly over 1,000 steps each day of the intervention during
the 20-minute activity period (MI1 = 1,141.65 +/- 684.48 steps, MI2 = 1,061.83 =/- 675.98
steps).
Physical Activity and Overall Academic Performance
Hypothesis 1 predicted that as students’ physical activity levels increased, their
overall academic performance would improve. In order to determine whether an
individual’s academic performance improved, each score was normalized into an index
score based on where a student’s score fell within a predetermined range of scores. Each
aspect of academic performance (academic achievement, cognitive skills, and classroom
behavior) was quantified into one holistic unit. The MAP scores represented students’
academic achievement and ranged from 165-265. The index scores ranged from 1-10 and
were assigned systematically based on each student’s earned score on the MAP test. See
Table 1 below for the exact scale explanation of the index scores.

45
The STROOP test scores were given an index score as well but could not be used
in the final calculation of students’ overall academic performance index because this
assessment was not given to the control students. Without an index number on the
STROOP assessment for the control group, including this number in the total count
would cause the numbers to be skewed in favor of the intervention group. Therefore, this
index value was left out of the total index calculation. However, this means that the data
analyzed for academic performance is missing the cognitive skills and executive function
skills of students which will be taken into consideration during the discussion of results.
Classroom behavior as measured by teacher questionnaires was given an index
from 1-10 based on the range of possible scores from 24-44. The range and indexes
assigned based on the scores from the teacher questionnaire measure can be further
explained by referring to Table 1 below. Classroom behavior was also assessed through
direct systematic observations. Students’ on-task behavior marks ranged from 0-18 and
were also assigned an index number ranging from 1-10. See Table 1 below for further
explanation of the systematic on-task behavior index.

46
Table 4.1 – Index Scores
Index Scores
Index
Score
MAP Score
Range
Teacher Questionnaire
Range
On-Task Behavior
Range
0 165 and below 24 and below 8 and Below
1 166-175 25-26 9
2 176-185 27-28 10
3 186-195 29-30 11
4 196-205 31-32 12
5 206-215 33-34 13
6 216-225 35-36 14
7 226-235 37-38 15
8 236-245 39-40 16
9 246-255 41-42 17
10 256-265 43-44 18
Once the scores for each student were given an index number based on where
each student’s scores fell in the pre-determined range, they were combined into one
overall index score. The index from MAP Reading, MAP Math, Teacher Questionnaires,
and On-Task Classroom Behavior were summed for each student. The results of a two-
tailed two sample t-test assuming equal variances did not support the hypothesis that as
physical activity increased, overall academic performance would improve, (t=1.99,
p>.05). The results of this analysis are presented in Table 2 below.
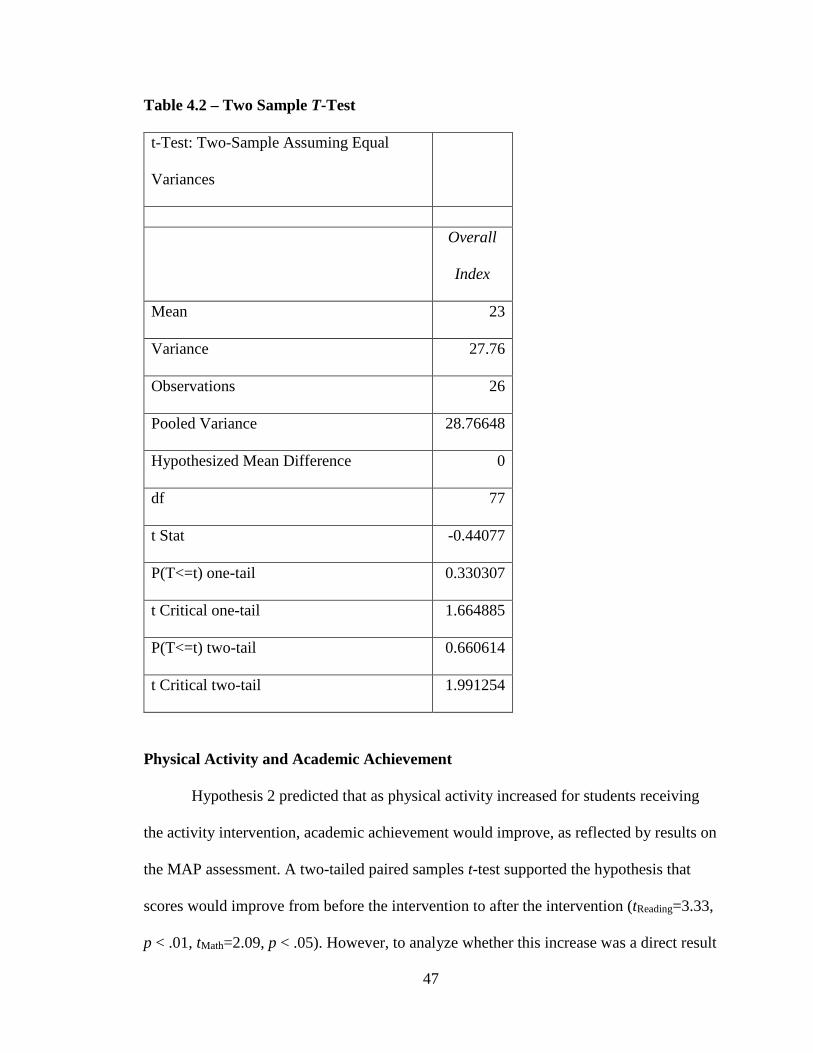
47
Table 4.2 – Two Sample T-Test
t-Test: Two-Sample Assuming Equal
Variances
Overall
Index
Mean 23
Variance 27.76
Observations 26
Pooled Variance 28.76648
Hypothesized Mean Difference 0
df 77
t Stat -0.44077
P(T<=t) one-tail 0.330307
t Critical one-tail 1.664885
P(T<=t) two-tail 0.660614
t Critical two-tail 1.991254
Physical Activity and Academic Achievement
Hypothesis 2 predicted that as physical activity increased for students receiving
the activity intervention, academic achievement would improve, as reflected by results on
the MAP assessment. A two-tailed paired samples t-test supported the hypothesis that
scores would improve from before the intervention to after the intervention (tReading=3.33,
p < .01, tMath=2.09, p < .05). However, to analyze whether this increase was a direct result

48
of the intervention a two-tailed t-test assuming equal variances was conducted on the
December scores as compared to the control and intervention groups. This test did not
support the hypothesis that academic achievement would improve as a result of increased
physical activity for those in the intervention group (tReading=0.40, p > .05, tMath=-0.10, p >
.05). See tables 3-6 below for further explanation of these analyses.
Table 4.3 – Difference in Reading Scores
Regression Statistics
Multiple R 0.354545
R Square 0.125702
Adjusted R
Square 0.114348
Standard Error 14.55194
Observations 79
ANOVA
df SS MS F
Regression 1 2344.318 2344.318 11.0707
Residual 77 16305.43 211.7588
Total 78 18649.75
Coefficients
Standard
Error t Stat P-value
Intercept 202.908 1.706241 118.9211 5.04E-89
Diff Reading 0.701501 0.210834 3.327266 0.001347

49
Table 4.4 – Difference in Math Scores
Regression Statistics
Multiple R 0.232047
R Square 0.053846
Adjusted R
Square 0.041558
Standard Error 13.76365
Observations 79
ANOVA
df SS MS F
Regression 1 830.1329 830.1329 4.382082
Residual 77 14586.73 189.438
Total 78 15416.86
Coefficients
Standard
Error t Stat P-value
Intercept 207.5899 1.721575 120.5814 1.74E-89
Diff Math 0.63148 0.301661 2.093342 0.039611

50
Table 4.5 – Difference in Reading Scores Intervention to Control
t-Test: Two-Sample Assuming Equal
Variances
Reading -
Dec 206
Mean 205.52 204
Variance 245.5933 244.5
Observations 25 53
Pooled Variance 244.8453
Hypothesized Mean Difference 0
df 76
t Stat 0.400367
P(T<=t) one-tail 0.345005
t Critical one-tail 1.665151
P(T<=t) two-tail 0.690009
t Critical two-tail 1.991673

51
Table 4.6 – Difference in Math Intervention to Control
t-Test: Two-Sample Assuming Equal
Variances
Math - Dec 210
Mean 208.92 209.2642
Variance 206.2433333 201.2366
Observations 25 53
Pooled Variance 202.8176564
Hypothesized Mean Difference 0
df 76
t Stat -0.0995994
P(T<=t) one-tail 0.460462313
t Critical one-tail 1.665151353
P(T<=t) two-tail 0.920924626
t Critical two-tail 1.99167261
Physical Activity and Cognitive Skills
Hypothesis 3 predicted that the students receiving the intervention will improve
their times on both phases of the Stroop Test after the additional activity. The results of a
two-tailed paired samples t-test supported this hypothesis, (ttest1=2.63, p < .01, ttest2=7.14,
p < .001). Participants were faster on the Stroop Test after activity than they were before
activity. Additionally, the participants’ results demonstrated a greater level of

52
significance on the more difficult (phase two) test than the easier (phase one) test of the
Stroop. The results of these analyses are presented in Tables 7 and 8.
Table 4.7 – Stroop Test Results: Phase 1
STROOP Test 1:
Test 1-before
PA
Test 1- after
PA
Mean 24.88672414 23.15672414
Variance 55.91349961 27.5325382
Observations 58 58
Pearson Correlation 0.743196664
Hypothesized Mean Difference 0
df 57
t Stat 2.628423976
P(T<=t) one-tail 0.005502344
t Critical one-tail 1.672028888
P(T<=t) two-tail 0.011004688
t Critical two-tail 2.002465459
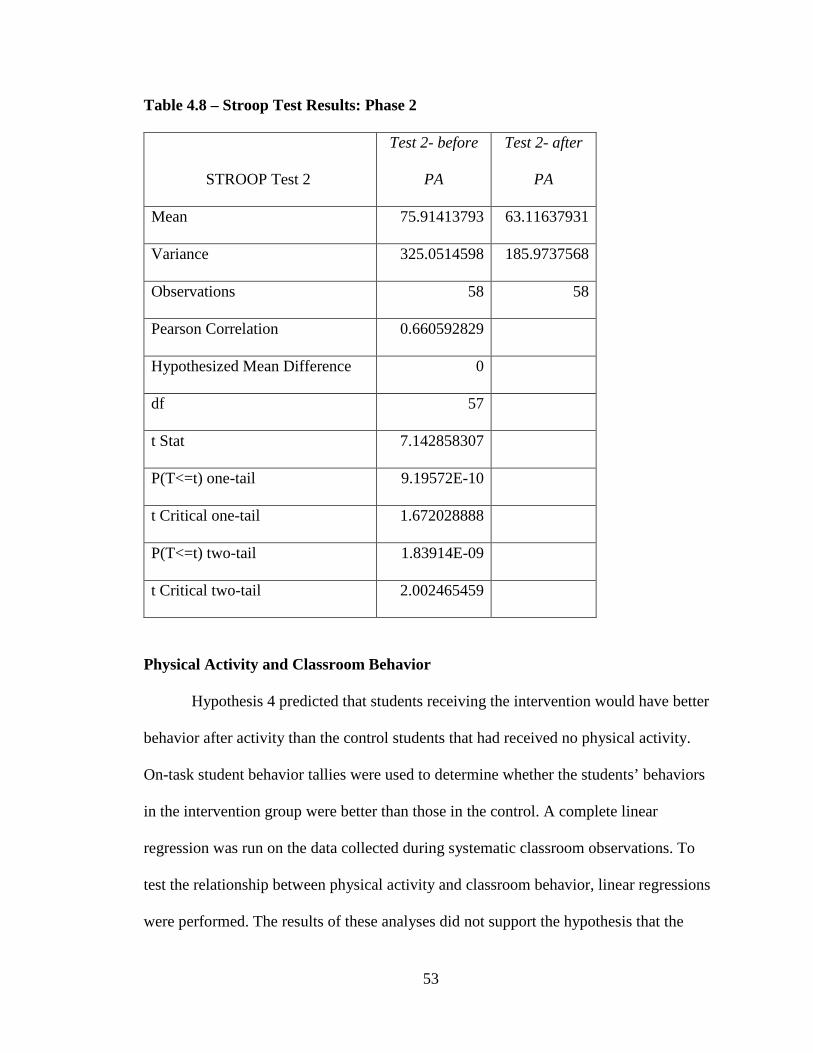
53
Table 4.8 – Stroop Test Results: Phase 2
STROOP Test 2
Test 2- before
PA
Test 2- after
PA
Mean 75.91413793 63.11637931
Variance 325.0514598 185.9737568
Observations 58 58
Pearson Correlation 0.660592829
Hypothesized Mean Difference 0
df 57
t Stat 7.142858307
P(T<=t) one-tail 9.19572E-10
t Critical one-tail 1.672028888
P(T<=t) two-tail 1.83914E-09
t Critical two-tail 2.002465459
Physical Activity and Classroom Behavior
Hypothesis 4 predicted that students receiving the intervention would have better
behavior after activity than the control students that had received no physical activity.
On-task student behavior tallies were used to determine whether the students’ behaviors
in the intervention group were better than those in the control. A complete linear
regression was run on the data collected during systematic classroom observations. To
test the relationship between physical activity and classroom behavior, linear regressions
were performed. The results of these analyses did not support the hypothesis that the

54
physical activity intervention would increase students’ on-task classroom behavior
(tIntervention = 0.22, p > .05). However, the results did show that the participants’ classroom
teacher is a significant variable for on-task classroom behavior (tT = 2.79, p <.01). The
results of these analyses are presented in Tables 9 and 10.
Table 4.9 – On-Task Observations Regression Statistics
Regression Statistics
Multiple R 0.320278
R Square 0.102578
Adjusted R Square 0.025969
Standard Error 3.779028
Observations 90
Table 4.10 – T-Test Results
On-Task Observations Coefficients Standard Error
t Stat P-value
Intercept -1.32059 1.296282 -1.01875 0.311316
Intervention 0.190813 0.849911 0.22451 0.822919
Class 1 1.443643 1.467073 0.984029 0.327996
Class 2 1.687022 1.418756 1.189086 0.237838
Class 3 1.876907 1.480536 1.267722 0.208485
Class 4 1.287022 1.651339 0.779381 0.437999
Class 5 5.360049 1.918621 2.793699 0.006485
Class 6 3.106104 1.654715 1.877122 0.064058

55
Additionally, student classroom behavior was assessed using a teacher-based
questionnaire. This second assessment of the same variable was conducted because the
systematic observations only take place two times during each intervention. The
systematic nature of the questionnaires could cause a misrepresentation of students’
actual classroom behavior. Therefore, the classroom teachers were asked to reflect on the
participants’ classroom behavior prior to the intervention for the first round of
questionnaires and then the second questionnaire should be answered based on teachers’
observations of student behavior after the intervention. To continue to test the
relationship between physical activity and classroom behavior, a complete linear
regression was run on the data collected from all teacher-based questionnaires. The
results of this analysis supported the hypothesis that the physical activity intervention
would improve participants’ classroom behavior (t = -2.65, p < .01). The results of these
analyses are presented in Table 11.

56
Table 4.11 – Regression of Teacher-Based Questionnaires
Teacher Questionnaires
Post New
Score New Score
Mean 35.61363636 36.69318182
Variance 48.30877743 46.16914838
Observations 88 88
Pearson Correlation 0.845897234
Hypothesized Mean Difference 0
df 87
t Stat -2.652200706
P(T<=t) one-tail 0.004751545
t Critical one-tail 1.662557349
P(T<=t) two-tail 0.009503091
t Critical two-tail 1.987608282
Hypothesis 5 stated that over the course of the intervention, classroom behavior
would improve. This hypothesis addressed the question of what variables impacted
student behavior. The hypothesis stated that the intervention would be the only
significant variable of student classroom behavior. However, based on the data already
discussed, this is decidedly untrue. The regression analysis conducted on systematic
classroom observations provided evidence that the intervention was not a statistically
significant variable on classroom behavior. However, the regression results from the
teacher-based questionnaires did demonstrate a significant correlation between the

57
intervention and classroom behavior. The teacher-based questionnaire and systematic
observations were both measures of classroom behavior, yet the regression results were
contradicting. Additionally, as shown in Table 10, the classroom teacher is a significant
variable for classroom behavior. There are several other extraneous variables that could
influence students’ classroom behavior but were not measured within this study.
Significant Relationships
In addition to running a regression analysis on the data, correlations were
conducted on each variable in the study using SPSS to determine what relationships
existed within the data. The results can be seen in Table 12. There was a strong positive
correlation between reading and math scores r = 0.801, p < .01, teacher questionnaire
results and reading scores r = 0.253, p < .05, reading scores and STROOP results r =
0.274, p < .05 and math scores and STROOP results r = 0.295, p < .05. A regression
analysis also revealed a significantly positive relationship between the male gender and
level of activity (tfemale = -2.71, p <.01). The results of this analysis are presented in Table
13.

58
Table 4.12 - Correlations of Variables
Dec - Reading Dec - Math
Dec - Math Pearson Correlation – 0.801**
Sig. (2-tailed) – p < .01
1
Teacher
Questionnaires
Pearson Correlation – 0.253*
Sig. (2-tailed) – p < .05
Pearson Correlation – 0.211
Sig. (2-tailed) – p > .05
STROOP 2
Index
Pearson Correlation – 0.274*
Sig. (2-tailed) – p < .05
Pearson Correlation – 0.295*
Sig. (2-tailed) – p < .05
Systematic
Observations
Index
Pearson Correlation – -0.164
Sig. (2-tailed) – p > .05
Pearson Correlation – -0.031
Sig. (2-tailed) – p > .05
Table 4.13 – Regression of Steps by Gender
Regression Statistics
Multiple R 0.352654391
R Square 0.12436512
Adjusted R Square 0.092523851
Standard Error 338.0751837
Observations 58
Coefficients Standard Error t Stat P-value
Intercept 1212.000798 83.83809654 14.4564446 2.21E-20
Female
-
254.4150445 93.81531377
-
2.711871168 0.008911

59
CHAPTER FIVE
DISCUSSION
Since the inception of the physical activity intervention implemented in this study,
the CDC released new physical activity guidelines for Americans (United States
Department of Health and Human Services [USDHHS], 2018). These guidelines will be
taken into consideration as new findings, but this study was designed and conducted
based on the 1st edition of the guidelines released in 2008. However, even in the new
guidelines, the recommendations for children to receive a minimum of 60 minutes each
day of moderate to vigorous physical activity remains the same (USDHHS, 2018). More
valuable evidence was released in the new addition on the positive relationship between
physical activity and overall brain health (USDHHS, 2018). This additional finding
supports the hypotheses made at the beginning of this study and provides further
explanation for the connection that exists between these two variables. Based on the
hypotheses stated, there are several anticipated findings that were confirmed and others
that were not. The results, limitations of the study, and suggestions for future research
will be discussed in greater detail now.
Academic Performance
Academic performance is a broad term used to take into consideration all factors
that have an influence on a child’s academics (Rasberry, et al., 2011). This study sought
to investigate each aspect of academic performance as it relates to physical activity. The
students in the intervention group received their normal physical education time and all
physical activity breaks that the control students received throughout the school day. In
addition, the intervention groups received 60 minutes of additional physical activity each

60
week for 4 weeks. To determine whether the physical activity intervention had a positive
effect on academic performance, data were collected on students’ MAP scores (academic
achievement), Teacher Questionnaires (classroom behavior), Direct Systematic
Observations (classroom behavior), and STROOP test (cognitive skills and attitudes).
These results were combined into one overall score and the analysis showed that there
was no significant relationship between physical activity and one’s overall academic
performance. This finding is conflicting with a recent study that investigated the same
relationship and found the association between academic performance and physical
activity to be significantly positive (McPherson et al., 2018).
The lack of significance could be due to several factors that existed within the
study. First, the total index score calculated for academic performance did not include the
results from the STROOP test as originally intended. The STROOP test was used to
investigate the effects of the physical activity intervention on students’ cognitive skills
through executive function. As such, this assessment was only given to the students
involved in the intervention. Therefore, this index could not be included in the overall
index for academic performance due to the control students not having a score range for
this category. The analysis run on the STROOP test results for the intervention students
demonstrated that STROOP (i.e., cognitive skill) was the most significant variable in the
entire study. Not having this score for the control students was a limitation of the study
because without this score it is impossible to get a true picture of the relationship between
overall academic performance and physical activity. Cognitive skills are a vital piece of
the puzzle for academic performance. While the results calculated did not show a
significant relationship between the two variables, this is truly an inconclusive result due

61
to the lack of one of the most crucial aspects of academic performance. In future studies,
cognitive skills should be assessed in both groups in order to make a true connection
between academic performance and physical activity.
The length of the intervention could have possibly been too short to find any
lasting effects on one’s overall academic performance. However, a recent systematic
review found that as many as 10 studies implemented a physical activity intervention that
ranged in time from immediately to no more than 3 months (Rasberry et al., 2011; Sibley
& Etnier, 2003). One study noted a specific 8-week intervention to investigate on-task
classroom behavior (Goh et al., 2016). Therefore, a two-month intervention was set for
this study to remain consistent with the design used in similar investigations. Originally,
the intervention was set to be 8 weeks for 30 students. However, due to the high level of
student interest, the sample size grew dramatically, and the overall expected participation
tripled in size. In order to accommodate the large numbers, a trade-off had to be made to
make two intervention groups over 8 weeks. The larger number of participants was a
positive for the study design because lower participation numbers can sometimes be
considered a limitation to a study. However, there were only 32 accelerometers available
for student use and the host school only permitted 20 minutes a day, 3 days a week, for 8
weeks for students to participate in the physical activity intervention. Comparable studies
implemented an intervention for 20 minutes or less per day and found no negative effects
on academic performance so 20-minute intervention times were established in this study
(Ahamed et al., 2011; Bailey & DiPerna, 2015; Haapala, 2012; Hill et al., 2011).
Therefore, the change had to be made to two intervention groups with 28 and 32
participants, respectively for two consecutive 4-week periods.

62
As a result, participants were randomly placed in a control and one of two
intervention groups. Intervention Group 1 participated in the activity for the first 4 weeks
and Intervention Group 2 participated in the activity for the second 4 weeks. While more
students were able to experience the intervention, their time with the intervention was cut
in half. A total of 240 minutes of extra physical activity might not be enough time to
make an impact on students’ overall academic performance. The length of the
intervention was a limitation of the study because the brief nature of the time spent in
activity was possibly not significant enough to make a true difference. Other studies
conducted over a much longer timeline found significant results on students’ academic
achievement after a physical activity intervention (Kibbe et al., 2011; Lees & Hopkins,
2013; Singh et al., 2012; Trudeau & Shephard, 2008). Future investigators should take
this into consideration and create a longer intervention either by longer times in activity
or over the course of more weeks.
Academic Achievement
Student academic achievement as investigated through MAP scores did improve,
as expected, from the pre-test which was administered in August to the post-test taken in
December. This improvement from August to December was a significant improvement
for all students in the study. A previous study demonstrated similar results with all
students demonstrating an improvement from the pre to the post assessment when
investigating academic achievement (Ardoy et al., 2013; Taras, 2005). When comparing
students in the control group to those that received one of the two interventions, the
improvement was not significant. This finding was consistent with another study that
found some aspects of the academic achievement scores to not be a significant

63
improvement in the intervention group (Bunketorp et al., 2015). However, a more recent
study found the improvement in the intervention group to be significant (McPherson et
al., 2018). The intervention groups did not have a significant improvement from August
to December as compared to the control groups; the improvements were equally
significant. This means that the improvement cannot be attributed to the physical activity
intervention because the control group made the same advance on the assessment.
However, this finding also supports the notion that reducing students’ time in the
classroom to opt for more time being physically active did not have a negative
implication on their achievement scores (Ahamed et al., 2011; Carlson et al., 2008;
Donnelly & Lambourne, 2011).
The lack of significance with physical activity and academic achievement could
be attributed to a few different variables that were unexpected in the study. First, as
already stated, the intervention time was shorter than planned. Previous findings have
pointed to an increase in activity alone might not be enough to have a significant impact
on academic achievement but could also need an increase in volume and intensity of
activity (Ardoy et al., 2011). The intervention group that received the activity first was
finished by the end of September and they did not take the post-test until the first week of
December. It is possible that any effects they experienced in the intervention were gone
by the time they were administered the assessment. It is also equally plausible that the
length of the intervention was not long enough to see any significant impact on the
academic achievement test. The length of the study has been previously identified as a
limitation, but the timing of the intervention as compared to when the academic
achievement assessment was administered is also a limitation of the study. Due to the

64
larger sample sizes, the first intervention group had a longer break between the end of the
intervention and the assessment given than the second intervention group. Even so, the
second intervention group had a longer wait time than expected when receiving the
academic achievement assessment as well.
The restrictions that exist when conducting a study in a school setting is part of
this limitation. When using academic achievement assessments conducted by the school,
the research is at the mercy of the school’s timeline. In future studies, considerations
should be made to create or implement an existing academic achievement assessment as
the researcher. When using the school’s assessments, this will continue to be a limitation
in future studies as a result of the nature of the school’s schedule. Much of the timing of
testing administration cannot be tampered with and the school is at the mercy of the
testing agencies and board offices. The timing of the pre-test was moved up from when
previously expected which hurried the beginning of the intervention and left a longer gap
of time at the conclusion of the intervention before the assessment was administered
again in December. As in previous studies, the pre-test and post-test varied based on
when this was issued by the school system and is typically over the course of an entire
academic year (Tomporowski et al., 2007). However, in the case with this study, the
timeline was shorter because the approved intervention was for 8 weeks. Therefore, the
intervention was administered between the first and second assessment of MAP testing
given by the school system in August and December. This was a limitation that was not
expected and could not be helped in this study but can be avoided in the future by
implementing an assessment as the researcher rather than using the school’s resources.

65
One expected limitation of using MAP scores to detect student academic
achievement improvement is the nature of standardized testing. This is a limitation that
has previously been accepted because there does not seem to be a better way to get a true
picture of where a student is academically when they return from summer break.
Logically, a student will lose some of the information they gained in the previous school
year during the long summer break. When they return to school, scores are expected to be
lower. After several weeks of reviewing and seeking a deeper understanding in their new
grade’s content, it is expected that students’ assessment scores would improve. However,
it is difficult to pinpoint the factors that make an impact on this improvement. It could be
simple exposure to the content, a specific teacher, practice through more homework, or
any number of interventions the school might be implementing on any given student,
subject, or grade. The lack of significance of the improvement in scores from control to
intervention groups could be due to any or all of these limitations. However, the MAP
test was chosen, as in previous studies, because of the strength that exists within
standardized assessments by eliminating rater bias had a different instrument been used
(Carlson et al., 2008). While certain restrictions do exist within the realm of standardized
testing, utilizing the exact instrument used by students to measure academic success
provides the most accurate picture of validity for academic achievement in this study.
Cognitive Skills
Executive function skills including concentration, memory, and speed were
investigated using the STROOP Color Word Test (Rasberry et al., 2011; Tomporowski et
al., 2008). The STROOP Effect is a test to assess selective attention, self-control, and
mental speed (Kvalø et al., 2017). The hypothesis that immediately following the

66
physical activity intervention, students’ executive functioning skills would improve was
supported by the evidence found in this study. In fact, this result was the most significant
in the entire study. Students were administered a digital STROOP test where they were
asked to take two tests which the first being easier than the second. The students were
given the same instructions for both tests, “say aloud the color you see and not the word
you read”. The students could ask questions of clarification and were asked to begin
when the start button had been clicked. Each student in the intervention group took this
assessment before and immediately after the activity one time throughout the duration of
the intervention. Almost every student made an improvement on the assessment from
pre- to post-intervention.
The first phase of the STROOP test was easier for the students because the
instructions might have been the same when given both tests, but on the first test, the
colors shown reflected the word that was written. However, the second phase of the
STROOP test had written words that were contradictory to the font color used. As stated
previously, the students improved from before the intervention to after. The result was
anticipated because earlier studies supported the hypothesis that STROOP test results
would improve immediately following activity (Castelli et al., 2011; Trudeau &
Shephard, 2009). However, the more difficult test had more significant improvements in
student times than the easier assessment. This was not expected but begs the question of
whether physical activity has a more significant impact on more difficult cognitive skill
assessments. This result could support the previous notion that early intervention of
physical activity in life could be vital for maintenance and improvement for cognitive
67
health (Hillman et al., 2008). In theory, this finding could also imply that the more
difficult the cognitive test, the more impactful physical activity is on the outcome.
The design of this assessment was sufficient to determine the relationship
between physical activity and cognitive skills. However, since the control group was not
administered this assessment simultaneously with the intervention groups, the findings
were limited in how they could be used to calculate the effects of physical activity on
students’ overall academic performance. Previous research that administered the
STROOP test to both the control and intervention group found the intervention results to
be more significant than the control (Memarmoghaddam et al., 2016). Other studies that
used a different assessment tool to determine students’ cognitive skills found the same
result with the intervention students improving more significantly than the control (Gao
et al., 2018). As a result, future researchers should consider administering this assessment
to both the control and intervention groups at the same time in the day to see if the
improvements were a direct result of the physical activity intervention or if some of the
improvement was the result of practicing the test. It is possible that some of the
improvement in students’ cognitive skills were a result of taking the same test two times
over a short (25 minute) time period. However, in a previous study where the STROOP
test was administered at different points over a longer time period, the results were still
significant (Wright et al., 2016). This conjecture is supported by a previous study that
administered the STROOP Color Word Test to both the intervention and control groups
finding that a significant improvement was found on this test for both groups (Kvalø et
al., 2017). While plausible, this assumption cannot be supported due to the lack of
assessment of the control students. If the assessment was given to the control group and

68
improvements were made as well, it could be attributed to more exposure of the same
test. However, this remains to be unseen at this time.
Classroom Behavior
Student classroom behavior was thought to be a more significant variable in
students’ academic performance due to its impact on overall classroom group behavior
(Barros et al., 2009; Davis & Cooper, 2011). Therefore, this variable was measured using
two different instruments. First, classroom teachers were asked to complete a
questionnaire the week before and the week after the intervention time for each group of
students (Carlson et al., 2015). Teachers were asked to consider each student’s behavior
in the homeroom classes before the intervention and complete the questionnaire. At the
end of the intervention period, the teachers were given the same questionnaire and asked
to respond with students’ behavior in mind since the intervention had begun. After
analyzing their responses, it was determined that a high number on some questions were
considered positive while a lower number on certain questions would be positive
feedback. As a result, these scores were normalized and rescaled so the higher the
number, the more positive the observed behavior. The results from this assessment were
significant which supported previous findings and the hypothesis that student classroom
behavior would improve (Barros et al., 2009). However, a study that used a similar
teacher-based questionnaire found that behaviors were trending to be better for those that
received a classroom-based activity intervention, but the improvement was not significant
(Carlson et al., 2015). This finding could mean that a more active physical education-
oriented intervention would be more impactful on student classroom behavior.

69
Students were also observed directly through systematic observations.
Observations were considered systematic partial interval recording where students were
observed for 5 seconds and any behavior displayed during that time was noted (Mahar,
2011). The observer(s) had 5 seconds to make marks and notes on that interval and would
observe the same student for their remaining intervals. Each student was observed 6 times
before moving on to the next student. Observations occurred for each student’s full 6
intervals before moving back to the original student to continue observations. A
secondary observer was utilized 35% of the time to ensure inter-rater reliability. Both
observers underwent detailed training on what constituted as on-task and off-task
behavior prior to observing students in the classroom setting (Ma et al., 2014; Wilson et
al., 2015). After comparing the primary to secondary observer observations, results
showed an inter-rater reliability of 71%.
When analyses were run on this measure, they were not found to be significant
and did not support the hypothesis that classroom behavior would improve immediately
following the intervention. Interestingly, this finding was consistent with one study that
found off-task behaviors to show no significant improvement after receiving a short
activity break outside the classroom (Wilson et al., 2015). This was contradictory to the
results found using teacher questionnaires which was a different instrument measuring
the same variable. This finding was conflicting with a previous study that found on-task
behaviors to be significantly better after receiving a classroom-based physical activity
intervention (Goh et al., 2016). Another study found that off-task behaviors significantly
decreased after receiving an activity intervention (Ma et al., 2014). More studies revealed
that immediate effects of activity on classroom behavior were significant, but over time

70
the results typically became consistent with those not receiving activity (Watson et al.,
2017. However, more long-term research is needed to determine the lasting effects of
physical activity on classroom behavior.
There are a few reasons this discrepancy could have occurred as noted in a
previous study that used both systematic observation and teacher questionnaires to assess
classroom behavior (DiPerna, Lei, Bellinger & Cheng, 2016). First, the classroom
teachers have much more exposure to the students and would have a better grasp on the
effectiveness of the intervention on their regular classroom behavior. According to the
teacher questionnaire results, behavior change after the intervention was significantly
better. It is feasible to consider that partial interval recording does not give a complete
picture of student behavior. The classroom teachers know the students and their behavior
better than anyone else, so their opinion should carry more weight on the effectiveness of
the study than systematic recording. The questionnaire also took more into consideration
than on-task behaviors in the classroom. Questions referred to demeanor, tentativeness in
class, being punctual, responsible, and many other qualities that are valuable for a good
student to possess. It is also possible that the physical activity intervention made a lasting
impact on students’ overall on-task behavior which would support the finding that
questionnaire results were significant while systematic observations were not.
Additionally, based on previous findings, one might reason that classroom-based physical
activity breaks might be more impactful for immediate on-task behavior (Goh et al.,
2016). Perhaps, the intervention was effective for overall behavior, but more frequent and
continuous activity breaks are necessary for students to maintain on-task behavior
throughout the school day.

71
The systematic observations were limited to investigating students’ on-task
behavior. The final hypothesis stated that as physical activity levels increase, on-task
behavior would also increase. Based on the results from the analysis of students’ on-task
behaviors through direct systematic observation, this hypothesis was not supported, and
the results were not found to be significant. As stated previously, the nature of partial
recording is flawed when gaining a true picture of good behavior and bad behavior.
Additionally, the observer’s nature and opinion can skew the results. This can be seen by
looking at the inter-rater reliability numbers because the reliability percentage should be
at least 80% compatible (Mahar et al., 2006). There were times that the observers would
differ on the type of off-task or even whether the student was on-task during
observations. Often, the differences would be when determining if a student was on-task
or passively off-task.
Additionally, partial recording forces the observer to note off-task behavior even
if it occurs for one of the five seconds of the observation time period. This can be
difficult to observe consistently when the off-task behavior is of a passive nature. One
study took this into consideration and the observer indicated the type, nature, and
duration of the student’s off-task behaviors to investigate this issue further (Ma et al.,
2014). However, another researcher noted the importance of shorter partial recording
techniques when using systematic observations in elementary school children (Mahar,
2011). Therefore, partial recording was decidedly used within this study. Human error
can occur here because one observer might notice an off-task behavior, but due to the
position or line of site of the other observer this behavior was not noticed and therefore
not recorded.

72
The direct observation instrument used in this study cited blatant off-task
behaviors such as noisy outbursts that would clearly be disruptive in a classroom setting.
However, certain passive off-task behaviors such as day dreaming or losing focus on the
teacher might not be considered disruptive. Teachers have a large responsibility in
teaching students, monitoring behavior and progress, and handling disruptions in their
classrooms. Certain passive off-task behaviors that the systematic observations noted
might not be seen by classroom teachers as negative behavior or could be overlooked
entirely because they experience these every day and have learned to accept these types
of behaviors as the norm (Sullivan et al., 2014). The interval recoding instrument did
exactly what it was designed to do in observing students’ on-task behavior immediately
following activity. However, there were instances that appeared to be passive off-task
behavior as it related to the recording device that might not have been off-task at all.
Some students could be looking away or lightly tapping their pencil on the desk while
listening to everything the teacher is saying, and others could be ignoring the lesson
entirely. There is no perfect, full-proof way, to know whether a student is truly on-task
when they are not focused completely on the teacher. However, it is also unrealistic to
expect a student of any age to stare at their teacher for an entire class period.
There was not a significant relationship found between the physical activity
intervention and the other variables measured in the study. This lack of significance could
be due to any number of reasons, but the short length of the intervention is clear. The
intervention time was not over a long enough period to assess any real impact on
academic performance and therefore had an insignificant relationship with the other
variables. In future studies, the intervention should be over the course of at least a

73
semester to get a truer picture of the effect of physical activity on all aspects of academic
performance.
However, there were several significant relationships among the other variables
that should be noted. Students’ results on the MAP reading and math scores from
December had a significant positive relationship indicating that students tend to score
comparably on the two assessments. The conclusion can also be drawn that students that
were successful in reading were also successful in math. This finding is supported by a
previous study that claimed reading skills can be a predictor for both reading and math
achievement (Rabiner, Godwin, & Dodge, 2016). Students that scored well on the MAP
Reading test from December also tended to have positive results on the teacher-based
questionnaires. This relationship suggests that students demonstrating positive behaviors
in the classroom performed better on the reading assessment. This finding is supported by
previous studies that cited a positive relationship between classroom behavior and
academic achievement (Davis & Cooper, 2011) and another that cited on-task behaviors
are predicative of good academic performance (Stapp & Karr, 2018; Walker &
Berthelsen, 2017).
The STROOP cognitive assessment had a strong positive relationship with MAP
reading and math results from December. This relationship suggests that the tool used to
assess executive function and cognitive processes is closely related to standardized
assessment outcomes. This finding also supports previous studies that point to a
connection between executive functioning skills and academic achievement (Lawson &
Farah, 2017). Lastly, male students were found to be significantly more active than their
female peers. This finding was not surprising because the male students were visibly

74
more active during each intervention session than the female students. Through a quick
observation of each intervention period, a clear difference could be seen between the two
groups in the intensity of their activity as well as their continuous level of activity. In a
previous study, boys were also found to engage in a more intense amount of physical
activity than girls (Patnode, Lytle, Erickson, Sirard, Barr-Anderson, & Story, 2010). This
finding was expected because it has been a persistent behavior in previous studies and
one study also cited that the gap between girls and boys could be closed in the future if
underlying causes for girls being inactive were investigated further (Telford, Telford,
Olive, Cochrane, & Davey, 2016).
Limitations and Future Research
While there were several limitations within the study, valuable information was
gained in this area of research. Many of the issues that were considered to be limitations
of the study can easily be rectified by future research. Academic achievement did
improve, but to determine whether this was a result of the physical activity intervention,
more research needs to be conducted with a longer intervention time period.
On-task classroom behaviors did improve for both groups, but to determine
whether the improvement was correlated with physical activity, further research is
necessary. This limitation can be helped by lengthening the study, providing more
observer training prior to the study, or using a different measure for this variable
altogether. The inter-rater reliability was not as accurate as anticipated. More thorough
training and practice is needed to ensure precise observations.
Additionally, classroom behavior was already measured quantitatively with
teacher questionnaires that did show a significant improvement of on-task classroom

75
behavior due to the intervention. In order to get a more complete picture of the
effectiveness of the intervention, future researchers should consider implementing a
qualitative interview with students involved in the study. This would provide the
opportunity to investigate their thoughts on the impact of the intervention on their own
behavior and performance in the classroom.
The STROOP test did prove to be an effective measure of executive function with
students’ cognitive skills and abilities. However, to truly investigate the relationship
between physical activity and overall academic performance, the cognitive assessment
should be measured with both the intervention and control groups in future studies.
Conclusion
In many cases in this study, physical activity had a significantly positive
relationship with academic performance. Due to limitations in the current study, more
investigation and research is needed to clarify the significance of this positive
relationship. In general, reducing students’ time in a classroom to increase their time
engaging in physical activity did not have a negative implication on their overall
academic performance. The assumption by many that reducing time in the classroom will
hinder performance has shown to be false when the reduction equates to an increase in
activity. Students need physical activity as an important part of their daily life. While,
academic performance as a whole might not show significant improvement, this study
has demonstrated the significantly positive effects of a physical activity intervention on
cognition, executive functioning, and certain aspects of academic behavior.
Children and adolescents that are physically active experience clear health
benefits, including improved brain health, an extremely important aspect of academic

76
performance (USDHHS, 2018). There is a mountain of research that supports the benefits
of physical activity and this study furthers that cause. The whole child approach to
learning that has now been adopted across the United States places value on students’
health (ASCD, 2015). The purpose of each school in each community should be to
challenge and encourage their students (ASCD, 2015). It is time that schools use their
time and influence to make a lasting impact on their students’ lives by providing
opportunities for all students to better themselves through prioritizing daily physical
activity and health in each school, in each community.

77
Appendix A
Physical Activity Intervention Standards:
2.31 Students demonstrate the knowledge and skills they need to remain physically healthy and to accept responsibility for their own physical well-being.
2.34 Students perform physical movement’s skills effectively in a variety of settings.
2.35 Students demonstrate knowledge and skills that promote physical activity and involvement in physical activity throughout lives.
3.1 Students demonstrate positive growth in self-concept through appropriate tasks or projects
4.1 Students effectively use interpersonal skills.
4.2 Students use productive team membership skills.
4.3 Students individually demonstrate consistent, responsive and caring behavior
4.4 Students demonstrate the ability to accept the rights and responsibilities for self and others.
Objectives:
SWBAT respect themselves and others during team and individual games.
SWBAT perform different movement patterns during a variety of game situations.
SWBAT perform manipulative, locomotor, and non-locomotor movements proficiently in a variety of settings.
SWBAT work together with others to accomplish various tasks.
SWBAT choose appropriate defensive and offensive strategies in a variety of game situations.
SWBAT demonstrate personal and social responsibility in various situations.
Protocol:
Arrival – When students arrive in the gymnasium they will line up along the baseline as they enter the door. The students will be assigned color groups by poly spots, so I will call out colors at random and when their color group is called they will walk to their assigned color poly spot that will be scattered throughout the gym. Departure – When it is time for students to leave the gym, I will ask them to line up on the same baseline that they came in on, request a “0” noise level, and lead them back to their respective classrooms. Discipline - Any arguments or disputes are initially settled using rock, paper, and scissors. If this does not solve the issue, I will pull the student aside during the game to explain their options (display good sportsmanship & participate or sit out of the activity).

78
If there are continuing issues, the student will sit out of the activity for 5 minutes. If issues persist, the student will be removed from the activity for the remainder of the day. If the same student continues to have issues for more than 6 sessions in row, they will be dismissed from the activity time and will remain in their regular class. Grouping – Students will be grouped using the toe to toe method. If I need two groups, one will raise their hand and split, if I need pairs they will remain with their partner, etc. If several groups are needed for a game, they will be grouped based on their color groups.
Activity: Handshake Game Resource: PE Central
Supplies: Activity cards, gymnasium Procedures: Students will be asked to walk around the gymnasium and when I say “go” they will perform a specific greeting that I give them with as many people as they can until I ask them to continue walking. The following “greetings” will be used: regular handshake, high five, fist bump, foot shake, and shoulder taps. After we make it through all of those greetings, the students will draw 3 activity cards from a box that will have random actions or body parts on them. They will be grouped together into 2 or 3 students and will create their own secret handshake or greeting using the 3 activity cards they drew within their handshake. After several minutes of working on their handshake, each group will present their secret handshake to the rest of the class. Topic Addressed: Teamwork, cooperation, listening skills, creativity
Activity: Respect Tag Resource: Human Kinetics -
http://www.humankinetics.com/excerpts/excerpts/sample-game-respect-tag
Supplies: Dice, Tag Cards, 6 balls, goals, 3 bean bags, gymnasium Procedures: Students are scattered with one or two taggers. Remind them to show respect for the rules by being honest. If they fall down, crash, or go out of bounds, they must send themselves to the “show respect, get back in” area or if they are tagged, they will automatically go to the show respect area. When in the “show respect, get back in” area, students roll the dice and follow the directions to re-enter the game: Rules: Be honest. Throw three balls into the target without stepping over the line. Equipment: Put it away and do not play. Pick up three beanbags and put them away. Self: Be active and be safe. Do 10 jumping jacks without hitting anyone. People: Be a friend. Give two people a high five. Every Child: Include every child and don’t go wild. Safely find a person you do not play with often and tell him something nice. Teacher: Listen to her and follow directions. Tell the teacher what each letter in the word respect stands for (the chant from the dance): rules, equipment, self, people, every child, and the teacher. Topics Addressed: Following directions, respect, honesty, sportsmanship, cardio
Activity: Peaks & Valleys Resource: Campbellsville University HP Department

79
Supplies: 20 Cones, gymnasium Procedures: The students will be divided into 2 equal groups and cones will be spread out across the entire activity area with 10 cones standing upright and 10 cones laying on their side. The cones that are upright are considered “peaks” and those on their side are “valleys”. Each group of students will also be titled peaks and the other valleys. The students that are “peaks” have the objective of standing all of the cones in an upright position while the students that are “valleys” have the objective of laying the cones on the side. The students must squat and turn the cones each time and may not kick, hit, or throw the cones. Play will go for a specified time and the team with the most peaks or valleys wins then the students switch roles. Topics Addressed: cardio, fitness, teamwork
Activity: Parachute Activities Resource: Dynamic Physical Education book
Supplies: Parachute, bean bags, gymnasium Procedures: The students will engage in a variety of parachute activities. First, the students will get used to operating the parachute and attempt to make a dome. Once they can successfully work together to do this they will perform various fitness activities with the chute: toe touches, abdominal curl-ups, and backward pull. Next, students will perform a dome activity called number exchange where each student will be assigned a number and I will call out various numbers. When their number is called, they must perform a locomotor movement under the parachute before it returns to the ground. Lastly, student will perform a parachute activity using equipment with bean bags on the top of the chute attempting to make it like popcorn popping. Topics Addressed: Teamwork, cooperation
Activity: Pig Ball Resource: Dynamic Physical Education book
Supplies: Rubber Pig, gymnasium Procedures: Students will be divided into two equal teams and will stand heel to two in a straight line with their teammates facing the opposing team. The student in the front of the line for Team A will throw the pig into the playing area and then begin running around his team. Each time he makes a successful lap around his team, they receive a point. Team B will hustle to the pig, remaining in their line, and must pass the pig from the front of the line to the back of the line going “over then under”. When the pig reaches the back person in the line, they will run to the front of the line, yell “PIG”, and then throw the pig for the opposing team to hustle to the pig. The student running laps in the first group must stop once “PIG” has been yelled out. The team that threw the pig will be required to perform a variety of locomotor movements throughout the activity. Topics Addressed: Cooperation & teamwork, cardio, coordination
Activity: Attached at the… Resource: Dynamic Physical Education book
80
Supplies: 15 balls, gymnasium Procedures: Students will be partnered up and will work together to navigate from one point in the gym to the other while attached at the hip, back, elbow, and ankle while walking, sliding, skipping, and galloping. After they have made it through all of these attachments, the students will attempt to navigate while attached at all of these positions with a ball between their attached body parts. If the students seem to be having success with this, I will make the task more difficult with different locomotor movements and obstacles in the gym, forcing them to change direction with their partner. Topics Addressed: Teamwork, cooperation, cardio
Activity: Noodle Games Resource: Pinterest
Supplies: Pool Noodles, balls, bins, gymnasium Procedures: Students will perform a few different skills with the pool noodles. First, they must move around the gym performing different locomotor movements while “attached” to a partner with the noodle. Next, students will partner up and attempt to lift a ball off the ground on one end of the gym and carry it to the other end of the gym without dropping the ball. The group that gets to the other end first wins. Last, students will get into groups of 4 and work together to pick up balls off the ground and place them into a bin. The group with the most balls in their bin at the end of the time limit wins. Topics Addressed: Responsible personal & social behavior, teamwork, cooperation, cardio
Activity: Castaways Resource: Focus on FUNdamentals
Supplies: 4 bowling pins per group, 1 mat per group, 2 scooters per group, 3 fleece balls per group Procedures: Participants will be divided into equal groups of 4 – 6 and placed on an “island” or mat to protect their 4 bowling pins with 2 “rafts” or scooters on the outside of the island. The castaways will throw “cannonballs” or fleece balls at their opponents’ islands to try to knock down their pins. Those assigned to guard the pins must remain on the mat and if they fall into the ocean, they must run to the sideline to perform a specified fitness activity before returning to guard their pins. If a pin gets knocked down, it must stay down and once all 4 pins have been knocked down, the whole team must run a lap around the gym before returning to setup their 4 pins. The students on the “rafts” must use them throughout the game to collect “cannonballs” for their team. The team with the most original pins standing at the end wins the game! Topics Addressed: throwing skills, strategy, core skills, fitness, cooperation, teamwork
Activity: Leap, Stop, & Throw Resource: Focus on FUNdamentals
Supplies: Hurdles, cones, poly-spots, rubber animals, bins, baskets, targets, balls, and any other equipment available to the students in the supply closet.

81
Procedures: Students will be divided into equal groups and given 5 different types of equipment. They will be given a designated area in the gymnasium and instructed to build their own obstacle course. Be as creative as you can be! Students can choose which locomotor movement students must use when getting through their course. After 5 minutes, the students will move through their course in a relay format against the other groups. Once everyone in their group has completed their obstacle course, they will move in a clockwise motion to another group’s course until each group has made it through every group’s course. Topics Addressed: PA is FUN, cardio, creativity, locomotor movements, teamwork
Activity: Tic Tac Toe Resource: KAHPERD
Supplies: 18 Hula-hoops, 12 bean bags, gymnasium Procedures: Hula-hoops will be placed together in a 3x3 format between half court and the 3-point line on a gym floor. Students will line up on the blocks and will perform different locomotor movements from the block to the free throw line. Once they reach the free throw line they will toss their bean bag into a hoop with the goal of playing tic tac toe. The will perform the same locomotor movement back to the block and before the next person can go they will perform a fitness movement. Once all 3 bags have been tossed, the student will perform their movement all the way to the hoops, choose a bag, and re-toss the bag in an effort to win tic tac toe by getting 3 in a row or blocking their opponent. The following locomotor movements will be used (walk, jog, gallop, skip, & lateral slides). The following fitness activities will be used (3 squats, 3 push-ups, 3 sit-ups, 3 jumping jacks, & 3 arm circles). Topic Addressed: Tactical strategies & foundational fitness skills
Activity: Bombs Away Resource: Campbellsville University HP Dept.
Supplies: 2 bins, 20 foam/yarn balls, gymnasium Procedures: Students will be divided into two even groups with half on each side of the gymnasium. Each side will begin with 10 balls and the object is to collect the most balls by the end of the specified time period. Students are attempting to throw their balls into an open area of the court in hopes of keeping their ball in play. Students without a ball are attempting to catch any ball that comes to their side and place it in the bin that is on their side of the court. Once a ball has been caught, it is no longer in play and counts as a point for the team that retrieved it. At the end of play, the team with the most balls in their bin (points) wins the game. Topics Addressed: All Physical Activity is good Physical Activity, overarm throw, catching
Activity: Ball Toss
Supplies: At least 10 foam balls, gymnasium

82
Procedures: Students will be divided into two even groups and separated by the half court line. The students will form a circle and begin with one foam ball tossing it around the circle. The only rule is that students cannot throw the ball to the same person they just received it from; they have to find someone new. After they get comfortable controlling the ball, they will have the rule added that the ball cannot touch the ground. The team with the most consecutive catches in 2 minutes wins. Next they will begin the same way as the previous game, but after 1 minute passes, I will throw in an additional ball that they must keep off the ground. The team with the most balls going at the end of the 5 minute time frame, wins. Topics Addressed: Teamwork, throwing, catching, coordination
Activity: Frisbee Bowling Resource: Campbellsville University HP Department
Supplies: Frisbee bowling set, gymnasium Procedures: Students will be divided into 4 equal groups (or the number of Frisbee bowling sets available) and be designated a color. Each group will receive Frisbee bowling pins which look a lot like regular bowling pins but are much thinner and lighter and Frisbee. The teams will start out 10 feet from pins and will be spaced out further if a greater difficulty level is needed after the first round of play. Each person on the team will receive one throw each time with the objective of knocking down as many pins as they can. If the team knocks down all the pins on the first throw they receive 5 points, on the second throw 3 points, and after three or more throws 1 point. After all of the pins have been knocked down the team must work together to setup their pins again and start over. The team with the most points at the end of the time limit wins. Topics addressed: Backhand throw, targeting & aiming, teamwork, cardio
Activity: Ultimate Frisbee or Modified Handball (depending on skill level)
Supplies: Frisbee or play yard ball, cones, gymnasium Procedures: Students will be divided into 2 equal teams and have the goal of scoring the most points by the end of the time limit. Students may use a Frisbee, or if their skill level throwing a Frisbee is not proficient, a play yard ball. Students must make 5 throws before attempting to score. Once a Frisbee or ball has been caught, the student only has 2 steps before they must make a throw. Students may score after 5 successful throws and crossing the cones on their opponent’s side of the floor. If the ball or Frisbee is dropped, it is considered a turnover and the opposing team will take possession from that same spot. If a ball is used, no dribbling will be allowed. The team with the most points at the end wins. Topics Addressed: overarm or backhand throw, offensive & defensive strategy, moving without the ball, teamwork, integrity
Activity: Bokwale Resource: Campbellsville University HP Dept.

83
Supplies: 30 Hula-hoops, at least 60 small items (balls, rubber critters, bean bags, etc.), gymnasium Procedures: Students will each stand at their own “home” hoop with at least 2 items in their hoop. The purpose is to “visit” each hoop and take one item to bring back to their home hoop. Each student must visit each hoop before returning to the same hoop and must always go from one hoop back to their home to return the item. The person at the end with the most items in their home hoop wins the game. Topics Addressed: Cardiovascular Fitness, taking care of their “home”, best effort
Activity: Hoarders Resource: Dynamic Physical Education textbook
Supplies: 20 Rubber Critters, 10 hula-hoops, gymnasium Procedures: Students will be divided into groups of 3 with each set of students assigned to a hula-hoop. Each hula-hoop will contain two rubber critters that two of the three students must defend. One student in each group will be designated as an attacker and will attempt to steal other critters to bring back to their home hoop. If one of the defenders tags the attacker, they must return to their home hoop before attempting to steal another critter. If an attacker makes it into the hula-hoop safe zone, they can no longer be tagged and can bring the critter back to their home hoop before making additional steal attempts. Topics Addressed: Offensive strategy, defensive strategy, responsibility
Activity: Guard the Pins Resource: Focus on FUNdamentals
Supplies: Hula hoop & bowling pin for each participant, 10 play yard balls, gymnasium Procedures: Each participant will be assigned a hula-hoop with a bowling pin in the center of it. Their responsibility is to guard their pin from outside the hoop and keep others from knocking down their pin. The balls will be scattered throughout the play area and students can choose to leave their pin to get a ball and attempt to knock down someone’s pin. Once a student has a pin, they must stay stationary in that spot, but will be allowed to pivot or use other non-locomotor movements to better position themselves to knock down someone’s pin. If someone’s pin gets knocked down they must pick up their pin and move it inside the hoop of the person that knocked down their pin and they will work together to defend both pins. If any of the pins in a group get knocked down, the entire group must move their pins to the person’s hoop that knocked a pin down. The game continues until all the pins are united into one group. Topics Addressed: Teamwork, strategy, rolling, throwing, defense, integrity, locomotor & non-locomotor movements
Activity: Targets Away Resource: www.playsport.net
Supplies: 8 Hula-hoops, 8 bowling pins, 4 small kick balls, gymnasium
84
Procedures: Hula-hoops will be placed horizontally on the gym floor with a bowing pin in the center of each hoop and 2 hoops directly across from one another in the form of goals. Teams will be divided into 2 v 2 or 3 v 3 teams, depending on numbers, with two teams playing each other on each “court”. The goal is for the teams to defend their bowling pin by staying outside the hoop and attack the other team’s pin by throwing the kick ball in an attempt to knock down the pin. The teams will play “full court” and will determine who goes first by playing rock, paper, scissors. The losing team will throw off and begin play. In the first modification, each team must make at least 3 passes before attempting to knock down the opponent’s pin (Ultimate Frisbee rules). They must move without the ball and will not be permitted to dribble the ball. If they drop the ball, it’s a turnover where it’s at going to the other team. The second modification will allow them to dribble, but they still must make at least 3 passes before attempting to score (Basketball rules apply). The third and final modification is in the case of a dropped ball, it becomes a ground rule and must be played on the ground through the possession (Soccer rules apply). Topics Addressed: Offensive strategy, defensive strategy, kicking, passing (by hand & foot), dribbling (by hand & foot), overarm throw, sportsmanship
Activity: Can’t Touch This Resource: www.playsport.net
Supplies: 2 play yard balls, 8 cones, gymnasium Procedures: Students will be divided into 4 even groups and play horizontally on both ends of the court so there will be two games going on at one time. The playing court will be outlined used 4 cones on each end. The purpose of the game is for the students to focus on invasion/territory strategies, moving with and without the ball, and making good passes/catches. Teams that make 5 successful passes without dropping the ball or turning it over receive 1 point. After points or turnovers, the ball changes possession to the opposite team. The team with the most points at the end of the game wins. Topics Addressed: Teamwork, Cooperation, Cardio, passing, catching, defensive/offensive strategies
Activity: Healthy Habits Resource: Focus on FUNdamentals
Supplies: 8 cones, 8 poly-spots, 10 bean bags, 10 foam balls, 2 hula hoops, gymnasium Procedures: Students will be divided into 2 equal groups, 1 group on each side of the court. The cones will be spread across half court to help visualize the dividing line and the poly-spots will be spread around the perimeter of the court. A hula hoop will be in the middle of each team’s area and contains that teams bean bags. The foam balls will be spread out evenly on both sides of the floor. The objective is for the opposing teams to collect each other’s “healthy food” or bean bags by crossing the line into their territory. At the same time, each team is trying to get rid of their “junk food” or the balls by rolling them over to the other team’s area. If someone is tagged while in the opposing team’s zone they must hustle to a poly-spot on the sideline and perform a specific fitness activity
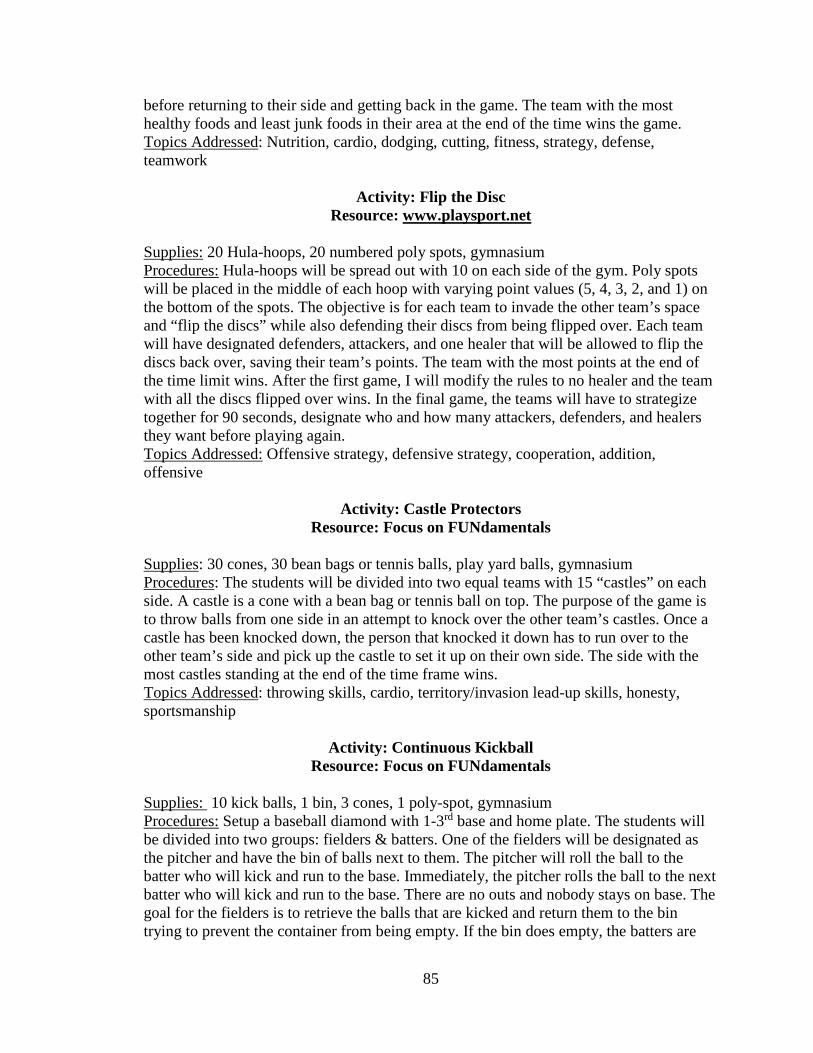
85
before returning to their side and getting back in the game. The team with the most healthy foods and least junk foods in their area at the end of the time wins the game. Topics Addressed: Nutrition, cardio, dodging, cutting, fitness, strategy, defense, teamwork
Activity: Flip the Disc Resource: www.playsport.net
Supplies: 20 Hula-hoops, 20 numbered poly spots, gymnasium Procedures: Hula-hoops will be spread out with 10 on each side of the gym. Poly spots will be placed in the middle of each hoop with varying point values (5, 4, 3, 2, and 1) on the bottom of the spots. The objective is for each team to invade the other team’s space and “flip the discs” while also defending their discs from being flipped over. Each team will have designated defenders, attackers, and one healer that will be allowed to flip the discs back over, saving their team’s points. The team with the most points at the end of the time limit wins. After the first game, I will modify the rules to no healer and the team with all the discs flipped over wins. In the final game, the teams will have to strategize together for 90 seconds, designate who and how many attackers, defenders, and healers they want before playing again. Topics Addressed: Offensive strategy, defensive strategy, cooperation, addition, offensive
Activity: Castle Protectors Resource: Focus on FUNdamentals
Supplies: 30 cones, 30 bean bags or tennis balls, play yard balls, gymnasium Procedures: The students will be divided into two equal teams with 15 “castles” on each side. A castle is a cone with a bean bag or tennis ball on top. The purpose of the game is to throw balls from one side in an attempt to knock over the other team’s castles. Once a castle has been knocked down, the person that knocked it down has to run over to the other team’s side and pick up the castle to set it up on their own side. The side with the most castles standing at the end of the time frame wins. Topics Addressed: throwing skills, cardio, territory/invasion lead-up skills, honesty, sportsmanship
Activity: Continuous Kickball Resource: Focus on FUNdamentals
Supplies: 10 kick balls, 1 bin, 3 cones, 1 poly-spot, gymnasium Procedures: Setup a baseball diamond with 1-3rd base and home plate. The students will be divided into two groups: fielders & batters. One of the fielders will be designated as the pitcher and have the bin of balls next to them. The pitcher will roll the ball to the batter who will kick and run to the base. Immediately, the pitcher rolls the ball to the next batter who will kick and run to the base. There are no outs and nobody stays on base. The goal for the fielders is to retrieve the balls that are kicked and return them to the bin trying to prevent the container from being empty. If the bin does empty, the batters are
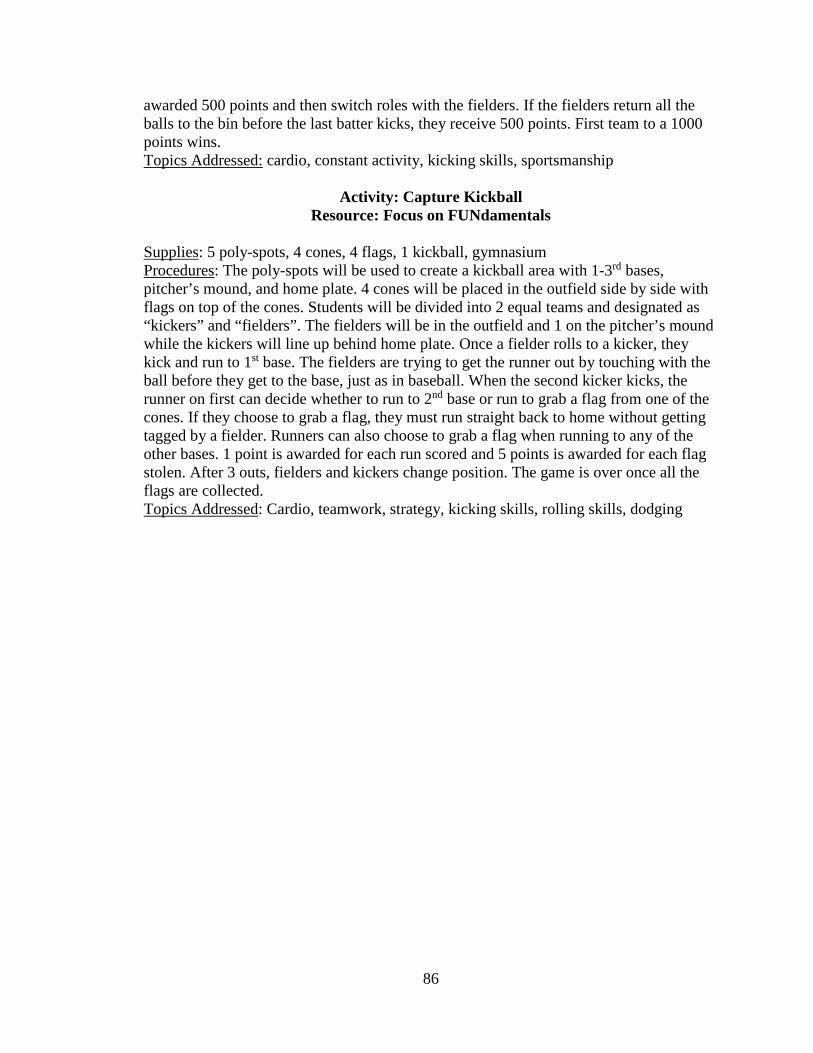
86
awarded 500 points and then switch roles with the fielders. If the fielders return all the balls to the bin before the last batter kicks, they receive 500 points. First team to a 1000 points wins. Topics Addressed: cardio, constant activity, kicking skills, sportsmanship
Activity: Capture Kickball Resource: Focus on FUNdamentals
Supplies: 5 poly-spots, 4 cones, 4 flags, 1 kickball, gymnasium Procedures: The poly-spots will be used to create a kickball area with 1-3rd bases, pitcher’s mound, and home plate. 4 cones will be placed in the outfield side by side with flags on top of the cones. Students will be divided into 2 equal teams and designated as “kickers” and “fielders”. The fielders will be in the outfield and 1 on the pitcher’s mound while the kickers will line up behind home plate. Once a fielder rolls to a kicker, they kick and run to 1st base. The fielders are trying to get the runner out by touching with the ball before they get to the base, just as in baseball. When the second kicker kicks, the runner on first can decide whether to run to 2nd base or run to grab a flag from one of the cones. If they choose to grab a flag, they must run straight back to home without getting tagged by a fielder. Runners can also choose to grab a flag when running to any of the other bases. 1 point is awarded for each run scored and 5 points is awarded for each flag stolen. After 3 outs, fielders and kickers change position. The game is over once all the flags are collected. Topics Addressed: Cardio, teamwork, strategy, kicking skills, rolling skills, dodging
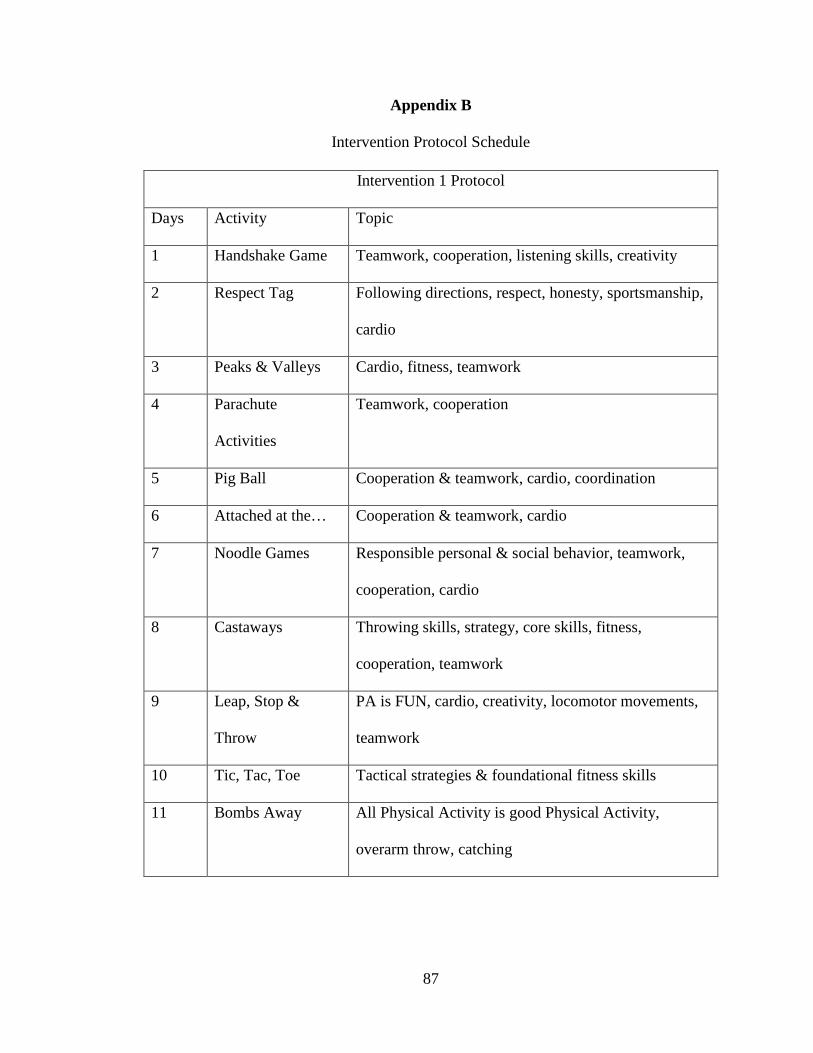
87
Appendix B
Intervention Protocol Schedule
Intervention 1 Protocol
Days Activity Topic
1 Handshake Game Teamwork, cooperation, listening skills, creativity
2 Respect Tag Following directions, respect, honesty, sportsmanship,
cardio
3 Peaks & Valleys Cardio, fitness, teamwork
4 Parachute
Activities
Teamwork, cooperation
5 Pig Ball Cooperation & teamwork, cardio, coordination
6 Attached at the… Cooperation & teamwork, cardio
7 Noodle Games Responsible personal & social behavior, teamwork,
cooperation, cardio
8 Castaways Throwing skills, strategy, core skills, fitness,
cooperation, teamwork
9 Leap, Stop &
Throw
PA is FUN, cardio, creativity, locomotor movements,
teamwork
10 Tic, Tac, Toe Tactical strategies & foundational fitness skills
11 Bombs Away All Physical Activity is good Physical Activity,
overarm throw, catching

88
Intervention 2 Protocol
Days Activity Topic
1 Handshake Game Teamwork, cooperation, listening skills, creativity
2 Tic, Tac, Toe Tactical strategies & foundational fitness skills
3 Peaks & Valleys Cardio, fitness, teamwork
4 Bombs Away All Physical Activity is good Physical Activity,
overarm throw, catching
5 Guard the Pins Teamwork, strategy, rolling, throwing, defense,
integrity, locomotor & non-locomotor movements
6 Targets Away Offensive strategy, defensive strategy, kicking, passing
(by hand & foot), dribbling (by hand & foot), overarm
throw, sportsmanship
7 Flip the Disc Offensive strategy, defensive strategy, cooperation,
addition
8 Castaways Throwing skills, strategy, core skills, fitness,
cooperation, teamwork
9 Castle Protectors throwing skills, cardio, territory/invasion lead-up skills,
honesty, sportsmanship
10 Can’t Touch This Teamwork, Cooperation, Cardio, passing, catching,
defensive/offensive strategies
11 Leap, Stop &
Throw
PA is FUN, cardio, creativity, locomotor movements,
teamwork
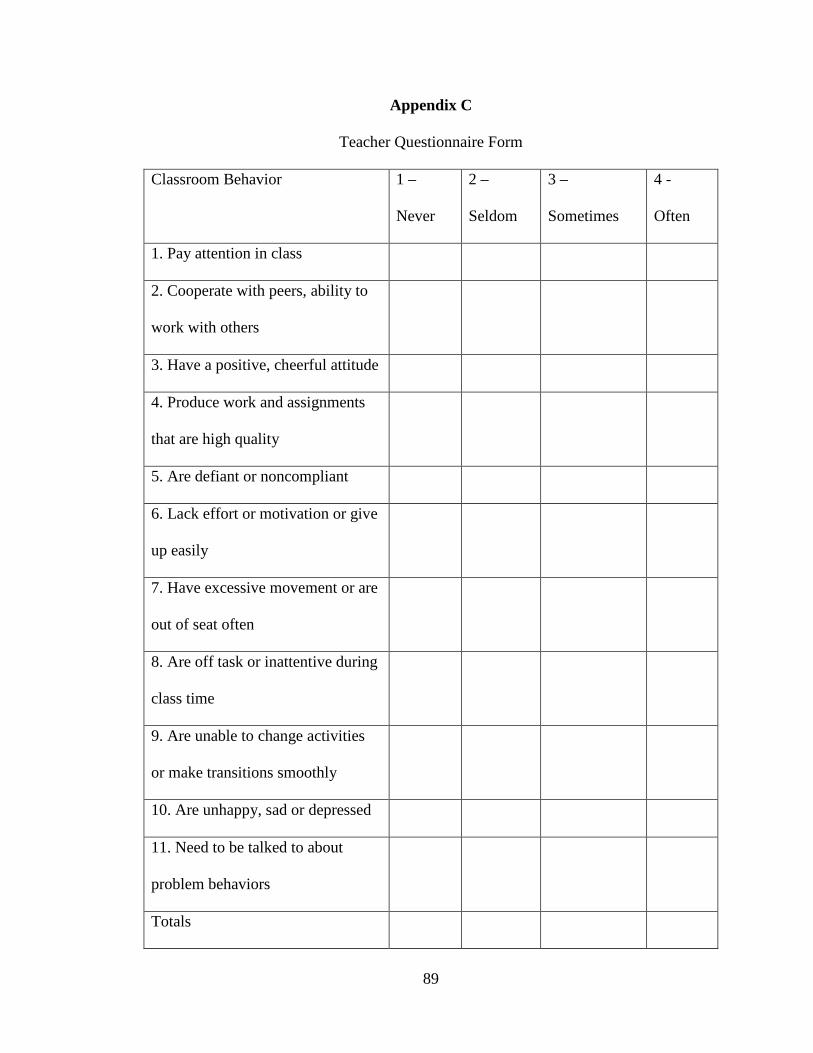
89
Appendix C
Teacher Questionnaire Form
Classroom Behavior 1 –
Never
2 –
Seldom
3 –
Sometimes
4 -
Often
1. Pay attention in class
2. Cooperate with peers, ability to
work with others
3. Have a positive, cheerful attitude
4. Produce work and assignments
that are high quality
5. Are defiant or noncompliant
6. Lack effort or motivation or give
up easily
7. Have excessive movement or are
out of seat often
8. Are off task or inattentive during
class time
9. Are unable to change activities
or make transitions smoothly
10. Are unhappy, sad or depressed
11. Need to be talked to about
problem behaviors
Totals

90
Classroom Behavior Following Activity
Classroom Behavior 1 –
Terrible
2 – Same
as Before
3 – Some
improvement
4 –
Total
behavior
change
12. Classroom behavior
immediately following bouts of
physical activity
13. Classroom behavior
immediately following intervention
14. Classroom behavior
immediately following PE time
15. Classroom behavior
immediately following recess or
some other form of physical
activity break
Totals

91
Appendix D
Systematic Classroom Observations Form
End ________________
ACTIVITYCODE 1 2 3 4 5 6
ID: 1 + N M O + N M O + N M O + N M O + N M O + N M O
2 + N M O + N M O + N M O + N M O + N M O + N M O
3 + N M O + N M O + N M O + N M O + N M O + N M O
ACTIVITYCODE 1 2 3 4 5 6
ID: 1 + N M O + N M O + N M O + N M O + N M O + N M O
2 + N M O + N M O + N M O + N M O + N M O + N M O
3 + N M O + N M O + N M O + N M O + N M O + N M O
ACTIVITYCODE 1 2 3 4 5 6
ID: 1 + N M O + N M O + N M O + N M O + N M O + N M O
2 + N M O + N M O + N M O + N M O + N M O + N M O
3 + N M O + N M O + N M O + N M O + N M O + N M O
ACTIVITYCODE 1 2 3 4 5 6
ID: 1 + N M O + N M O + N M O + N M O + N M O + N M O
2 + N M O + N M O + N M O + N M O + N M O + N M O
3 + N M O + N M O + N M O + N M O + N M O + N M O
ACTIVITYCODE 1 2 3 4 5 6
ID: 1 + N M O + N M O + N M O + N M O + N M O + N M O
2 + N M O + N M O + N M O + N M O + N M O + N M O
3 + N M O + N M O + N M O + N M O + N M O + N M O
ACTIVITYCODE 1 2 3 4 5 6
ID: 1 + N M O + N M O + N M O + N M O + N M O + N M O
2 + N M O + N M O + N M O + N M O + N M O + N M O
3 + N M O + N M O + N M O + N M O + N M O + N M O
ACTIVITYCODE 1 2 3 4 5 6
ID: 1 + N M O + N M O + N M O + N M O + N M O + N M O
2 + N M O + N M O + N M O + N M O + N M O + N M O
3 + N M O + N M O + N M O + N M O + N M O + N M O
ACTIVITYCODE 1 2 3 4 5 6
ID: 1 + N M O + N M O + N M O + N M O + N M O + N M O
2 + N M O + N M O + N M O + N M O + N M O + N M O
3 + N M O + N M O + N M O + N M O + N M O + N M O
ACTIVITYCODE 1 2 3 4 5 6
ID: 1 + N M O + N M O + N M O + N M O + N M O + N M O
2 + N M O + N M O + N M O + N M O + N M O + N M O
3 + N M O + N M O + N M O + N M O + N M O + N M O
INTERVALS
Teacher _________________________________
Grade or Subject ______ Date _______________
Time: Start _________
Page ___________of ___________
Record Interval 5 sec
COMMENTS
TIME
INTERVALS
INTERVALS
Observer ________________________________
Reliability Observer _________________________
No. in Class or Group _______________________
General Activity ____________________________
Observation Interval 5 sec
STUDENT
INTERVALS
STUDENT TIME
STUDENT
STUDENT
STUDENT
STUDENT
INTERVALS
INTERVALS
INTERVALS
COMMENTS
COMMENTS
TIME COMMENTS
COMMENTSTIME
TIME COMMENTS
COMMENTS
TIME
STUDENT TIMEINTERVALS
COMMENTS
STUDENT TIMEINTERVALS
COMMENTS
STUDENT TIME

92
Appendix E
Systematic Classroom Observations Definitions
On-Task Behavior – On-task behavior includes verbal and motor behavior that
follows the class rules and is appropriate to the learning situation. On-task behavior is
defined with reference to both the rules of the classroom and the teacher designated
academic activity. If a student is working on the appropriate academic activity and is
obeying the rules of the classroom, then the student’s behavior is recorded as being
on-task. Examples of on-task behavior might include sitting at one’s desk while
working, engaging in group games when appropriate, responding to teacher questions
(whether the answer is correct or incorrect), walking to the chalkboard when asked,
demonstrating activity to others when expected to do so, or talking during class
discussion.
Motor Off-Task Behavior – Motor off-task behavior is any gross motor response that
breaks the rules and/or interrupts the learning situation. Gross motor behaviors may
include getting or being out of one’s seat, turning around at least 90°, running, turning
cartwheels, walking around the room, and/or waving arms. Another area of
inappropriate gross motor behavior includes behaviors generally labeled as
aggressive, such as hitting, kicking, pushing, pinching, slapping, striking another
person with objects, grabbing another’s property, and throwing objects. Some motor
behaviors are inappropriate during certain classroom periods, but not always at other
times.
Noise Off-Task Behavior – Noise off-task behavior includes both verbal noise and
object noise. Verbal noise is any oral response that breaks the class rules and/or

93
interrupts the learning situation. This category may include inappropriate talking,
yelling, blurting out, whistling, humming, screaming, singing, and laughing. Simply
seeing the student’s lips move is not enough. If a child responds to a teacher’s
questions or instruction, then the student is on-task. Further examples of verbal off-
task behavior include blurting out an answer instead of raising one’s hand (if this
breaks the class rules; based on the teacher’s reaction), talking to a neighbor instead
of working on materials, and singing during discussion. Object noise is any audible
noise resulting from any behavior on the part of the child that may cause other
children to be off-task, such as slamming books, kicking furniture, or rapping a desk.
Other or Passive Off-Task Behavior – Other or passive off-task behavior refers to
times when the student is involved in no interaction or is doing nothing when
expected to be involved. Behaviors in this category include daydreaming and staring
into space. The student must be engaged in no gross motor or verbal activity for this
category to be recorded. It is important to remember that there are times when doing
nothing is appropriate, for example when an assignment is completed and nothing has
been assigned. This is very rare, however, as most teachers have activities for all
students when one assignment is completed. This category also includes minor motor
behaviors, such as thumb sucking, fingernail biting, fiddling with hair, finger
twiddling, chewing on a pencil or other object, or playing with one’s pencil when not
appropriate. Minor motor behaviors are only recorded when attention is not directed
toward the student’s learning work. If, however, the student is engaged in appropriate
activities while he exhibits these small motor behaviors, then his or her behavior is
recorded as being on-task.

94
References
(2016). The Child & Adolescent Health Measurement Initiative. Retrieved from http://www.childhealthdata.org/browse/data-snapshots/state-snapshot?geo=19.
Ackerman, B.P., D’Eramo, K.S., Umylny, L., Schultz, D. & Izard, C.E. (2001). Family structure and the externalizing behavior of children from economically disadvantaged families. Journal of Family Psychology. 15(2):288-300.
Ahamed Y., MacDonald H., Reed K., Naylor P.J., Liu-Ambrose T. & McKay H. (2007). School-based physical activity does not compromise Children's academic performance. Medicine & Science in Sports &Exercise. 39(2):371–376. doi:10.1249/01.niss.000024 I 654.45500.8e
Ardoy, D. N., Fernández-Rodríguez, J. M., Jiménez-Pavón, D., Castillo, R., Ruiz, J. R., & Ortega, F. B. (2014). A Physical Education trial improves adolescents' cognitive performance and academic achievement: the EDUFIT study. Scandinavian Journal of Medicine & Science in Sports, 24(1), e52-e61.
Association for Supervision and Curriculum Development. (2015). The whole child. Retrieved on December 8th from http://www.wholechildeducation.org/.
Bailey C.G. & DiPerna J.C. (2015). Effects of classroom-based energizers on primary grade Students' physical activity levels. Physical Educator. 72(3):480–95.
Barros, R.M., Silver, E.J. & Stein, R.E. (2009). School recess and group classroom behavior. Pediatrics 123, 431–436.
Bartholomew, J.B., Jowers, E.M., 2011. Physically active academic lessons in elementary children. Preventive Medicine. 52, S51–S54.
Bates, J.E., Maslin, C.A & Frankel, K.A. (1985). Attachment security, mother-child interactions, & temperament as predictors of behavior-problem ratings at age three years. Monographs of the Society for Research in Child Development. 50(1/2):167-193.
Bunketorp Käll, L., Malmgren, H., Olsson, E., Lindén, T., & Nilsson, M. (2015). Effects of a Curricular Physical Activity Intervention on Children's School Performance, Wellness, and Brain Development. Journal of School Health, 85(10), 704-713.
Carlson J.A., Engelberg, J.K., Cain K.L., Conway T.L., Mignano A.M., Bonilla, E.A., Geremia, C. & Sallis, J.F. (2015). Implementing classroom physical activity breaks: Associations with student physical activity and classroom behavior. Preventative Medicine. 81:67–72.
Carlson, S.A., Fulton, J.E., Lee, S.M., Maynard, L.M., Brown, D.R., Kohl III, H.W. & Dietz, W.H. (2008). Physical education and academic achievement in elementary school: data from the Early Childhood Longitudinal Study. American Journal of Public Health 98(4), 721–727.
Caspi, A., Henry, B., McGee, R.O., Moffitt, T.E. & Silva, P.A. (1995). Temperamental origins of child and adolescent behavior problems: From age three to age fifteen. Child Development. 66, 55-68.
Castelli D.M., Hillman C.H., Buck S.M. & Erwin, H.E. (2007). Physical fitness and academic achievement in third- and fifth-grade students. Journal of Sport & Exercise Psychology. 29(2):239-252.
Castelli, D.M., Hillman, C.H., Hirsch, J., Hirsch, A. & Drollette, E. (2011). FIT Kids: Time in target heart zone and cognitive performance. Preventative Medicine. 52, S55–S59.

95
Center for Disease Control & Prevention (2010). State indicator report on physical activity, 2010 national action guide. Retrieved March 2nd, 2018 from https://www.cdc.gov/physicalactivity/downloads/PA_State_Indicator_Report_2010_Action_Guide.pdf
County Health Rankings. (2018). Kentucky: Taylor(TA). Retrieved from http://www.countyhealthrankings.org/app/kentucky/2018/rankings/taylor/county/factors/overall/snapshot
Davis, C.L. & Cooper, S. (2011). Fitness, fatness, cognition, behavior, and academic achievement among overweight children: do cross-sectional associations correspond to exercise trial outcomes? Preventative Medicine. 52, S65–S69.
Davis C.L., Tomporowski P.D., McDowell J.E. (2011). Exercise improves executive function and achievement and alters brain activation in overweight children: a randomized, controlled trial. Health Psychology 30(1):91-98.
Diperna, J. C., Lei, P., Bellinger, J., & Cheng, W. (2016). Effects of a Universal Positive Classroom Behavior Program on Student Learning. Psychology in the Schools, 53(2), 189–203. Retrieved from http://ezproxy.uky.edu/login?url=http://search.ebscohost.com/login.aspx?direct=true&db=eric&AN=EJ1086853&site=ehost-live&scope=site
Donnelly, J. E., Hillman, C. H., Castelli, D., Etnier, J. L., Lee, S., Tomporowski, P., Lambourne, K. & Szabo-Reed, A. N. (2016). Physical Activity, Fitness, Cognitive Function, and Academic Achievement in Children: A Systematic Review. Medicine & Science In Sports & Exercise, 48(6), 1197-1222.
Donnelly, J.E. & Lambourne, K. (2011). Classroom-based physical activity, cognition, and academic achievement. Preventive Medicine, 52(SUPPL.): p. S36-S42.
Eisenberg, N., Sadovsky, A., Spinrad, T.L., Fabes, R.A., Losoya, S.H., Valiente, C., Reiser, M., Cumberland, A. & Shepard, S.A. (2005). The relations of problem behavior status to children’s negative emotionality, effortful control, and impulsivity: Concurrent relations and prediction of change. Developmental Psychology. 41(1):193-211.
Fedewa, A.L. & Ahn, S. (2011). The effects of physical activity and physical fitness on children's achievement and cognitive outcomes: a meta-analysis. Research Quarterly for Exercise & Sport.82(3):521–35.
Fedewa, A.L., Ahn, S., Erwin, H. & Davis, M.C. (2015). A randomized controlled design investigating the effects of classroom-based physical activity on children’s fluid intelligence and achievement. School Psychology International. 36(2):135–53.
Foundation for a Healthy Kentucky. (2008). Health Outcomes: Location: Taylor County. Retrieved from http://kentuckyhealthfacts.org/data/location/show.aspx?loc=109.
Fryar, C.D., Carroll, M.D., & Ogden, C.L. (2016) Prevalence of Overweight and Obesity Among Children and Adolescents Aged 2–19 Years: United States, 1963–1965 Through 2013–2014. National Center for Health Statistics. Retrieved from https://www.cdc.gov/nchs/data/hestat/obesity_child_13_14/obesity_child_13_14.pdf.
Gao, Z., Chen, S., Sun, H., Wen, X., & Xiang, P. (2018). Physical Activity in Children’s Health and Cognition. BioMed Research International, 2018, 1–4. https://doi.org/10.1155/2018/8542403

96
Gapin, J.I., Labban, J.D., Etnier, J.L., (2011). The effects of physical activity on attention deficit hyperactivity disorder symptoms: The evidence. Preventative Medicine. 52, S70–S74.
Goh, T.L., Hannon, J., Webster, C., Podlog, L. & Newton, M. (2016). Effects of a TAKE 10! Classroom-based physical activity intervention on third- to fifth-grade Children's on-task behavior. Journal of Physical Activity & Health. 13(7):712–718.
Haapala, E. (2012). Physical activity, academic performance and cognition in children and adolescents. A systematic review. Baltic Journal of Health & Physical Activity. 4(1):53–61.
Hart, T. L., Brusseau, T., Kulinna, P. H., McClain, J. J., & Tudor-Locke, C. (2011). Evaluation of low-cost, objective instruments for assessing physical activity in 10-11-year-old children. Research Quarterly for Exercise and Sport, 82(4), 600-609.
Hartup, W.W. (1996). The company they keep: Friendships and their developmental significance. Child Development. 67:1-13
Hill, L.J.B., Williams, J.H.G., Aucott, L., Thomson, J. & Mon-Williams, M. (2011). How does exercise benefit performance on cognitive tests in primary-school pupils? Developmental Medicine & Child Neurology. 53(7):630–635.
Hillman, C.H., Erickson, K.I. & Kramer, A.F. (2008). Be smart, exercise your heart: Exercise effects on brain and cognition. Nature Reviews Neuroscience, 9(1):58-65.
Janssen, I. & LeBlanc, A.G. (2010). Systematic review of the health benefits of physical activity and fitness in school-aged children and youth. International Journal of Behavioral Nutrition & Physical Activity. 7:40-55.
Kentucky Department of Education. (2017). School Report Card. Retrieved on February 1, 2018. Retrieved from http://applications.education.ky.gov/SRC/LearningEnvironment.aspx.
Kibbe, D.L., Hackett, J., Hurley, M., McFarland, A., Schubert, K.G., Schultz, A. & Harris, S. (2011). Ten Years of TAKE 10!: Integrating physical activity with academic concepts in elementary school classrooms. Preventive Medicine. 52, S43–S50.
Kristjansson, A. L., Elliott, E., Bulger, S., Jones, E., Taliaferro, A. R., & Neal, W. (2015). Needs assessment of school and community physical activity opportunities in rural West Virginia: the McDowell CHOICES planning effort. BMC Public Health, 15(1), 1–10. https://doi.org/10.1186/s12889-015-1702-9
Kvalø, S. E., Bru, E., Brønnick, K., & Dyrstad, S. M. (2017). Does increased physical activity in school affect children's executive function and aerobic fitness? Scandinavian Journal of Medicine & Science In Sports, 27(12), 1833-1841. doi:10.1111/sms.12856
Lawson, G. M., & Farah, M. J. (2017). Executive Function as a Mediator between SES and Academic Achievement throughout Childhood. International Journal of Behavioral Development, 41(1), 94–104. Retrieved from http://ezproxy.uky.edu/login?url=http://search.ebscohost.com/login.aspx?direct=true&db=eric&AN=EJ1124381&site=ehost-live&scope=site

97
Lee, S.M., Burgeson, C.R., Fulton, J.E. & Spain, C.G. (2007). Physical education and physical activity: results from the School Health Policies and Programs Study 2006. Journal of School Health 77(8):435-463.
Lees, C. & J. Hopkins. (2013). Effect of aerobic exercise on cognition, academic achievement, and psychosocial function in children: A systematic review of randomized control trials. Preventing Chronic Disease, 10(10): 1-8.
Ling, J., King, K. M., Speck, B. J., Kim, S., & Wu, D. (2014). Preliminary Assessment of a School-Based Healthy Lifestyle Intervention Among Rural Elementary School Children. Journal of School Health, 84(4), 247-255. doi:10.1111/josh.12143
Ma, J.K., Mare, L.L. & Gurd, B.J. (2014). Classroom-based high-intensity interval activity improves off-task behaviour in primary school students. Applied Physiology, Nutrition & Metabolism. 39(12):1332–1337.
Ma, J.K., Mare, L.L. & Gurd, B.J. (2015). Four minutes of in-class high-intensity interval activity improves selective attention in 9- to 11-year olds. Applied Physiology, Nutrition & Metabolism. 40(3):238–44.
Mahar, M.T. (2011). Impact of short bouts of physical activity on attention-to-task in elementary school children. Preventative Medicine. 52(Suppl 1):S60–4.
Mahar, M.T., Murphy, S.K., Rowe, D.A., Golden, J., Shields, A.T. & Raedeke, T.D. (2006). Effects of a classroom-based program on physical activity and on-task behavior. Medicine & Science in Sports & Exercise. 38(12):2086–2094.
Martin, R., & Murtagh, E. M. (2015). An intervention to improve the physical activity levels of children: Design and rationale of the ‘Active Classrooms’ cluster randomised controlled trial. Contemporary Clinical Trials, 41180-191. doi:10.1016/j.cct.2015.01.019
Martinek, T. & Hellison, D. (2016). Teaching personal and social responsibility: Past, present, and future. Journal of Physical Education, Recreation, and Dance, 87(5):9-13.
Marttinen, R. J., McLoughlin, G., Fredrick, R., & Novak, D. (2017). Integration and Physical Education: A Review of Research. Quest (00336297), 69(1), 37-49.
McDermott, P.A. & Schaefer, B.A. (1996). A demographic survey of rare and common problem behaviors among American students. Journal of Clinical Child Psychology, 25(3):352-362.
McPherson, A., Mackay, L., Kunkel, J., & Duncan, S. (2018). Physical activity, cognition and academic performance: an analysis of mediating and confounding relationships in primary school children. BMC Public Health, 18(1), N.PAG. https://doi.org/10.1186/s12889-018-5863-1
Memarmoghaddam, M., Torbati, H. T., Sohrabi, M., Mashhadi, A., & Kashi, A. (2016). Effects of a selected exercise programon executive function of children with attention deficit hyperactivity disorder. Journal of Medicine & Life, 9(4), 373-379. doi:10.22336/jml.2016.0410
Naylor, P.J., Nettlefold, L., Race, D., Hoy, C., Ashe, M.C., Wharf, H.J. & McKay, H.A. (2015). Implementation of school based physical activity interventions: a systematic review. Preventive Medicine. 72:95–115.
Norman, M. A., Moore, D. J., Taylor, M., Franklin, D., Cysique, L., Ake, C., … Heaton, R. K. (2011). Demographically corrected norms for African Americans and Caucasians on the Hopkins Verbal Learning Test-Revised, Brief Visuospatial

98
Memory Test-Revised, Stroop Color and Word Test, and Wisconsin Card Sorting Test 64-Card Version. Journal of Clinical & Experimental Neuropsychology, 33(7), 793–804. https://doi-org.ezproxy.uky.edu/10.1080/13803395.2011.559157
NWEA. (2017). MAP Growth. Retrieved from https://www.nwea.org/map-growth/. ODPHP. (2014). Physical Activity. Retrieved from
https://www.healthypeople.gov/2020/topics-objectives/topic/physical-activity. Ogden, C. L., Carroll, M.D., Fryar, C. D., & Flegal, K.M. (2015). Prevalence of Obesity
Among Adults and Youth: United States, 2011–2014. NCHS Data Brief, 219. Ogden, C.L. & Flegal, K.M. (2010). Changes in terminology for childhood overweight
and obesity. National Health Statistics Reports, 25:1-6 Olshansky, S. J., Passaro, D. J., Hershow, R. C., Layden, J., Carnes, B. A., Brody, J., &
Ludwig, D. S. (2005). A potential decline in life expectancy in the United States in the 21st century. New England Journal of Medicine, 352(11), 1138-1145.
Park, T., Eyler, A. A., Tabak, R. G., Valko, C., & Brownson, R. C. (2017). Opportunities for Promoting Physical Activity in Rural Communities by Understanding the Interests and Values of Community Members. Journal of Environmental & Public Health, 1–5. https://doi.org/10.1155/2017/8608432
Parker, M. & Hellison, D. (2001). Teaching responsibility in physical education: Standards, outcomes, and beyond. Journal of Physical Education, Recreation, & Dance, 72(9):25-36.
Patnode, C., Lytle, L., Erickson, D., Sirard, J., Barr-Anderson, D. & Story, M. (2010). The relative influence of demographic, individual, social, and environmental factors on physical activity among boys and girls. International Journal of Behavioral Nutrition and Physical Activity, 7(79). https://doi.org/10.1186/1479-5868-7-79.
Pekdogan, S. & Kanak, M. (2016). A study on social competence and temperament of pre-school children’s. Journal of Education and Learning, 5(4):133-140.
Pitzer, M., Esser, G., Schmidt, M.H. & Laucht, M. (2009). Temperamental predictors of externalizing problems among boys and girls: A longitudinal study in high-risk sample from ages 3 months to 15 years. European Archives of Psychiatry & Clinical Neuroscience, 259:445-458,
Rabiner, D. L., Godwin, J., & Dodge, K. A. (2016). Predicting Academic Achievement and Attainment: The Contribution of Early Academic Skills, Attention Difficulties, and Social Competence. School Psychology Review, 45(2), 250–267. Retrieved from http://ezproxy.uky.edu/login?url=http://search.ebscohost.com/login.aspx?direct=true&db=trh&AN=118145207&site=ehost-live&scope=site
Rasberry, C.N., S.M. Lee, L. Robin, B.A. Laris, L.A. Russell, K.K. Coyle, and A.J. Nihiser. (2011). The association between school-based physical activity, including physical education, and academic performance: A systematic review of the literature. Preventive Medicine. 52(SUPPL.): p. S10-S20.
Ratcliffe, M., Burd, C., Holder, K. & Fields, A. (2016). Defining rural at the U.S. census bureau: American community survey and geography brief. United States Census Bureau. Retrieved from https://www.census.gov/library/publications/2016/acs/acsgeo-1.html.
99
Resaland, G. K., Moe, V. F., Aadland, E., Steene-Johannessen, J., Glosvik, Ø., Andersen, J. R., & Kvalheim, O.M., McKay, H.A., Anderssen, S. A. (2015). Active SmarterKids (ASK): Rationale and design of a cluster-randomized controlled trialinvestigating the effects of daily physical activity on children's academicperformance and risk factors for non-communicable diseases. BMC PublicHealth, 15(1), 1-10. doi:10.1186/s12889-015-2049-y
Roig, M., Skriver, K., Lundbye-Jensen, J., Kiens, B., & Nielsen, J. B. (2012). A Single Bout of Exercise Improves Motor Memory. PLoS ONE, 7(9), 1–8. https://doi.org/10.1371/journal.pone.0044594
Sacchetti, R., Ceciliani, A., Garulli, A., Dallolio, L., Beltrami, P. & Leoni, E. (2013). Effects of a 2-year school-based intervention of enhanced physical education in the primary school. Journal of School Health. 83: 639-646.
Sallis, J.F., McKenzie, T.L., Alcaraz, J.E., Kolody, B., Faucette, N. & Hovell, M.F. (1997). The effects of a 2-year physical education program (SPARK) on physical activity and fitness in elementary school students. Sports, play and active recreation for kids. American Journal of Public Health. 87(8):1328–34.
Sallis J.F., Prochaska, J.J. & Taylor, W.C. (2000). A review of correlates of physical activity of children and adolescents. Medicine & Science in Sports & Exercise, 32(5):963-975.
Sallis, J., McKenzie, T., Kolody, B., Lewis, M., Marshall, S. & Rosengard, P. (1999). Effects of health-related physical education on academic achievement: Project SPARK. Research Quarterly for Exercise in Sport. 70(2):127–134.
Seguin, R., Connor, L., Nelson, M., LaCroix, A., & Eldridge, G. (2014). Understanding Barriers and Facilitators to Healthy Eating and Active Living in Rural Communities. Journal of Nutrition & Metabolism, 1–8. https://doi.org/10.1155/2014/146502
Seymour, C., & Garrison, M. (2015). Is the Physical Being Taken out of Physical Education? On the Possible Effects of High-Stakes Testing on an Embattled Profession’s Curriculum Goals. Quest (00336297), 67(4), 400-408.
Sibley, B.A. & Etnier, J.L. (2003). The relationship between physical activity and cognition in children: a meta-analysis. Pediatric Exercise Science. 15:243–256.
Sibley, B. A., Etnier, J. L., & Le Masurier, G.C. (2006). Effects of an Acute Bout of Exercise on Cognitive Aspects of Stroop Performance. Journal of Sport & Exercise Psychology, 28(3), 285-299.
Singh, A., Uijtdewilligen, L., Twisk, J.W.R., Van Mechelen, W., Chinapaw, M.J.M. (2012). Physical activity and performance at school: a systematic review of the literature including a methodological quality assessment. Arch Pediatric Adolescent Medicine. 166(1):49–55.
Singh, A. M., & Staines, W. R. (2015). The Effects of Acute Aerobic Exercise on the Primary Motor Cortex. Journal of Motor Behavior, 47(4), 328–339. https://doi.org/10.1080/00222895.2014.983450
Smolkowski, K., Girvan, E. J., McIntosh, K., Nese, R. N. T., & Horner, R. H. (2016). Vulnerable Decision Points for Disproportionate Office Discipline Referrals: Comparisons of Discipline for African American and White Elementary School Students. Behavioral Disorders, 41(4), 178–195. https://doi-org.ezproxy.uky.edu/10.17988/bedi-41-04-178-195.1

100
Stapp, A. C., & Karr, J. K. (2018). Effect of Recess on Fifth Grade Students’ Time On-Task in an Elementary Classroom. International Electronic Journal of Elementary Education, 10(4), 449–456. Retrieved from http://ezproxy.uky.edu/login?url=http://search.ebscohost.com/login.aspx?direct=true&db=eric&AN=EJ1176549&site=ehost-live&scope=site
State of Obesity (2016). State Briefs. Retrieved from http://www.stateofobesity.org/states/.
Stone, E.J, McKenzie, T.L., Welk, G.J. & Booth, M.L. (1998). Effects of physical activity interventions in youth. American Journal of Preventative Medicine. 15(4), 298-315.
Strong, W., Malina, R., Blimkie, C., Daniels, S., Dishman, R., Gutin, B., Hergenroeder, A., Must, A., Nixon, P., Pivarnik, J., Rowland, T., Trost, S., Truedeau, F. (2005). Evidence based physical activity for school-age youth. The Journal of Pediatrics. 146(6), 732-737. DOI: https://doi.org/10.1016/j.jpeds.2005.01.055
Sullivan, A.M., Johnson, B., Owens, L. & Conway, R. (2014). Punish them or engage them? Teachers’ views of unproductive student behaviours in the classroom. Australian Journal of Teacher Education, 39(6):43-56.
Taras, H. (2005). Physical activity and student performance at school. Journal of School Health. 75(6):214–8.
Tarver, J., Daley, D., & Sayal, K. (2015). Beyond symptom control for attention-deficit hyperactivity disorder (ADHD): what can parents do to improve outcomes? Child: Care, Health & Development, 41(1), 1–14. https://doi-org.ezproxy.uky.edu/10.1111/cch.12159
Telford, R.M., Telford, R.D., Olive, L., Cochrane, T. & Davey, R. (2016). Why are girls less physically active than boys? Findings from the LOOK longitudinal study. PLOS One, 11(3). doi:10.1371/journal.pone.0150041.
Tomporowski, P.D., Davis, C.L., Miller, P.H. & Naglieri, J.A. (2008). Exercise and children’s intelligence, cognition, and academic achievement. Educational Psychology Review. 20(2):111-131.
Troiano, R.P., Berrigan, D., Dodd, K.W., Masse, L.C., Tilert, T. & McDowell, M. (2008). Physical activity in the United States measured by accelerometer. Medicine & Science in Sports & Exercise. 40(1):181–188.
Trost S. (2009). Active Education: Physical Education, Physical Activity and Academic Performance. A Research Brief. Princeton, NJ: Active Living Research, a National Program of the Robert Wood Johnson Foundation. Retrieved from www.activelivingresearch.org.
Trost, S.G., Pate, R.R., Saunders, R., Ward, D.S., Dowda, M. & Felton, G. (1997). A prospective study of the determinants of physical activity in rural fifth-grade children. Preventative Medicine, 26:257-263.
Trudeau, F., & Shephard, R. J. (2008). Physical education, school physical activity, school sports and academic performance. International Journal of Behavioral Nutrition & Physical Activity, 51-12. doi:10.1186/1479-5868-5-10
Trudeau F. & Shephard R.J. (2010). Relationships of physical activity to brain health and the academic performance of schoolchildren. American Journal of Lifestyle Medicine. 4(2): 138-150.

101
United States Census Bureau. (2016). Quick facts Campbellsville city, Kentucky; Kentucky. Retrieved March 1, 2018, Retrieved from https://www.census.gov/quickfacts/fact/table/campbellsvillecitykentucky,KY/PST045217
United States Department of Health and Human Services. (2008). 2008 Physical activity guidelines for Americans. Retrieved February 20, 2018, Retrieved from https://health.gov/paguidelines/pdf/paguide.pdf.
United States Department of Health and Human Services, (2018). Physical activity guidelines for Americans, 2nd edition. Retrieved December 5, 2018, Retrieved from https://health.gov/paguidelines/second-edition/pdf/Physical_Activity_Guidelines_2nd_edition.pdf.
United States Department of Health and Human Services, Centers for Disease Control and Prevention, (2010). The Association Between School-Based Physical Activity, Including Physical Education, and Academic Performance. http://www.cdc.gov/healthyyouth/health_and_academics/pdf/pa-pe_paper.pdf Accessed 15 February 2018.
Walker, S., & Berthelsen, D. (2017). Gender differences in early literacy and mathematics achievement and self-regulatory behaviours in the first year of school: An Australian study. Australasian Journal of Early Childhood, 42(1), 70–78. https://doi-org.ezproxy.uky.edu/10.23965/AJEC.42.1.08
Watson, A., Timperio, A., Brown, H., Best, K., & Hesketh, K. D. (2017). Effect of classroom-based physical activity interventions on academic and physical activity outcomes: a systematic review and meta-analysis. International Journal of Behavioral Nutrition & Physical Activity, 141-24. doi:10.1186/s12966-017-0569-9
Wilkins, J.L.M., Graham, G., Parker, S., Westfall, S., Fraser, R.G. & Tembo, M. (2003). Time in the arts and physical education and school achievement. Journal of Curriculum Studies. 35(6):721-734
Wilson, A.N., Olds, T., Lushington, K., Petkov, J. & Dollman, J. (2016). The impact of 10-min activity breaks outside the classroom on male students' on-task behaviourand sustained attention: a randomised crossover design. Acta Paediatrica. 105(4):e181-e188
Wright, C. M., Duquesnay, P. J., Anzman-Frasca, S., Chomitz, V. R., Chui, K., Economos, C. D., & Sacheck, J. M. (2016). Study protocol: the Fueling Learning through Exercise (FLEX) study - a randomized controlled trial of the impact of school-based physical activity programs on children's physical activity, cognitive function, and academic achievement. BMC Public Health, 16(1), 1-12. doi:10.1186/s12889-016-3719-0
Zeng, N., Ayyub, M., Sun, H., Wen, X., Xiang, P., & Gao, Z. (2017). Effects of Physical Activity on Motor Skills and Cognitive Development in Early Childhood: A Systematic Review. BioMed Research International, 2017, 1–13. https://doi.org/10.1155/2017/2760716

102
Vita
LAUREN M. WILLIS CAMPBELLSVILLE UNIVERSITY DIVISION OF HUMAN PERFORMANCE
EDUCATION PhD University of Kentucky, Educational Sciences – Physical Education Expected May 2019
Dissertation: “The Effects of Increased Physical Education on Student Academic Achievement and Classroom Behavior”
Committee: Dr. Heather Erwin (chair), Dr. Aaron Beighle, Dr. Jody Clasey, Dr. Kiluba Nkulu
MS Campbellsville University, Sport Management May 2016
Advisor: Dr. Kun Soo Shim
MS Campbellsville University, Theology May 2015
Advisor: Dr. John Hurtgen
BS Campbellsville University, Health & Physical Education December 2012 Graduated Summa Cum Laude, Valedictorian
HONORS AND AWARDS Graduate Block Funding 2018
John E. Partington Scholarship 2017 & 2018
Valedictorian 2012
Health and Physical Education Award 2012
Who’s Who Among Students 2009-2012
President’s List 2009-2012
RESEARCH EXPERIENCE Dissertation, University of Kentucky, Campbellsville Elementary School 2018
Advisor: Dr. Heather Erwin
• The Effects of Physical Activity on Academic Performance

103
Pilot Study, University of Kentucky, Campbellsville Elementary School 2017-2018
Advisor: Dr. Heather Erwin
• The Effects of Physical Education on Academic Achievement
TEACHING EXPERIENCE Campbellsville University, Campbellsville Kentucky August 2016-Current
Assistant Professor, Division of Human Performance (2018)
Instructor (2016-2017)
Lead Professor of Health and Physical Education (2016-current)
![SPECIMEN - OCR€¦ · Physical Education : Specimen Paper. ... Increased breathing rate [1] SPECIMEN: 5 ... Developing Knowledge in Physical Education](https://img.pdfslide.net/doc/110x75/5b0c87b07f8b9a8b038c4f58/specimen-education-specimen-paper-increased-breathing-rate-1-specimen.jpg)