Embed Size (px)
Citation preview
JOURNAL OF FINANCIAL AND QUANTITATIVE ANALYSIS Vol. 52, No. 2, Apr. 2017, pp. 553–582COPYRIGHT 2017, MICHAEL G. FOSTER SCHOOL OF BUSINESS, UNIVERSITY OF WASHINGTON, SEATTLE, WA 98195doi:10.1017/S0022109017000072
The Effect of Labor Unions onCEO Compensation
Qianqian Huang, Feng Jiang, Erik Lie, and Tingting Que*
AbstractWe find evidence that labor unions affect chief executive officer (CEO) compensation.First, we find that firms with strong unions pay their CEOs less. The negative effect is ro-bust to various tests for endogeneity, including cross-sectional variations and a regressiondiscontinuity design. Second, we find that CEO compensation is curbed before union con-tract negotiations, especially when the compensation is discretionary and the unions have astrong bargaining position. Third, we report that curbing CEO compensation mitigates thechance of a labor strike, thus providing a rationale for firms to pay CEOs less when facingstrong unions.
The United Auto Workers says it knows it needs to help Detroit’s au-tomakers cut labor costs to reduce the gap in production expenses withAsian rivals. But as talks continue on new contracts, the union also isquestioning why top executives at the automakers are paid what theyare. (USA Today, Oct. 10, 2007)
I. IntroductionExecutive compensation is an essential mechanism to attract, retain, and in-
centivize top executives. However, executive compensation is often criticized forbeing excessive or for creating perverse incentives, especially against the back-drop of significant compensation increases (Murphy (1999)), revelations of com-pensation scandals (Lie (2005)), and the alleged role of executive pay in therecent financial crisis (Bhagat and Romano (2009)). This criticism has fueled ex-ternal pressure on executive compensation. In particular, Murphy ((2012), p. 47)
*Huang, [email protected], College of Business, City University of Hong Kong; Jiang,[email protected], School of Management, State University of New York–Buffalo; Lie (corre-sponding author), [email protected], Tippie College of Business, University of Iowa; and Que,[email protected], College of Business Administration, University of Alabama in Huntsville. Wethank David Barker, Matt Billett, Ye Cai, Peter DeMarzo, Jon Garfinkel, Jarrad Harford (the editor),Randy Heron, Marcin Kacperczyk (associate editor and referee), Bill Maxwell, Yiming Qian, TomRietz, Tong Yao, and seminar participants at the University of Iowa for helpful suggestions andcomments.
553
https://doi.org/10.1017/S0022109017000072D
ownloaded from
https://ww
w.cam
bridge.org/core . The University of Iow
a , on 08 Sep 2017 at 18:24:27 , subject to the Cambridge Core term
s of use, available at https://ww
w.cam
bridge.org/core/terms .
554 Journal of Financial and Quantitative Analysis
argues that “executive contracts in publicly held corporations are . . . influencedby the media, labor unions, and by political forces operating inside and outsidecompanies.” Thus, it seems important to understand whether and why firms yieldto external pressure because of its potential to redistribute value.
This study focuses on the pressure from labor unions. Unions target exec-utive compensation because they are concerned that executives receive an un-fair share of cash flow and because wage inequality erodes employee morale.Anecdotal evidence supports this view. For example, the American Federation ofLabor and Congress of Industrial Organizations (AFL–CIO), an umbrella federa-tion for U.S. unions, hosts an “Executive Paywatch” feature on its Web site thatclaims to be “the leading watchdog critic of runaway CEO pay and its effect ongrowing inequality.” Unions also have other powerful tools at their disposal toexert pressure on companies, most notably the right to strike, as protected underthe National Labor Relations Act.
To explore the impact of unions on a firm’s executive compensation policy,we first examine the relation between unionization and the level of total chiefexecutive officer (CEO) compensation. We collect industry unionization ratesfrom the Union Membership and Coverage Database, which annually reports thefraction of total workers in a 3-digit Census Industry Classification (CIC) indus-try who are represented by unions in collective bargaining agreements. Basedon more than 18,000 firm-years from 1993 to 2011, we find that a 1-standard-deviation increase in the industry unionization rate is associated with roughly9.2% lower total CEO compensation ($0.26 million) for the median CEO in oursample. The negative relation between unionization and executive compensationis robust to the use of firm-level unionization data from U.S. Securities and Ex-change Commission (SEC) filings, which are available for about half of our sam-ple firms. These preliminary results weigh in on the findings in past studies: Ban-ning and Chiles (2007) document a negative relation between unionization andexecutive compensation for a sample of 170 randomly selected Fortune 500 firmsin 1996, whereas Singh and Agarwal (2002) find a positive relation for a sampleof 86 Canadian metal-mining firms in 1996. But further analysis is required to es-tablish causality and identify the underlying economic mechanisms. For example,it is possible that some unidentified industry or firm characteristics contribute tothe lower total CEO compensation in unionized firms, or that unionization makesit difficult for firms to attract the best executive talent.
We address the identification issue in two ways. First, we explore cross-sectional variations in the effects of unionization on CEO compensation. Weexpect that the negative impact is more pronounced when unions are relativelystrong. Indeed, we find a stronger negative relation for firms located in states withno right-to-work laws and/or lower unemployment rates and for firms with moreconcentrated business operations. Second, we analyze CEO compensation arounda set of union elections using a regression discontinuity design (RDD), and wefind that passing a union election leads to a reduction in CEO compensation.
Our evidence thus far suggests that unionization induces lower CEO pay. Onepossibility is that the firms’ decision makers are caving in to continuous unionpressure for moderation in CEO pay. An alternative but not mutually exclusivepossibility is that firms curtail CEO pay strategically to obtain concessions from
https://doi.org/10.1017/S0022109017000072D
ownloaded from
https://ww
w.cam
bridge.org/core . The University of Iow
a , on 08 Sep 2017 at 18:24:27 , subject to the Cambridge Core term
s of use, available at https://ww
w.cam
bridge.org/core/terms .
Huang, Jiang, Lie, and Que 555
unions. That is, CEO pay curtailment might be used to elicit support and coop-eration from unions or to signal the need to restrain costs, and lower CEO payamong unionized firms represents a strategic choice designed to enhance share-holders’ wealth.
We explore the underlying mechanism by examining CEO compensationpatterns around union negotiations. In particular, we investigate whether boardsattempt to strengthen firms’ bargaining power by curtailing CEO pay beforescheduled labor negotiations. Using collective bargaining agreement informationfrom the Bureau of National Affairs (BNA), we document a significantly negativerelation between total CEO pay in a given year and the negotiation ratio, definedas the percentage of employees involved in contract negotiations, in the follow-ing year. A 1-standard-deviation increase in negotiation ratio is associated witha 7.5% decline in total CEO compensation in the fiscal year prior to negotiation.This suggests that boards are more likely to curtail CEO pay when they face unioncontract negotiations. The empirical pattern is stronger when unions have a strongbargaining position (i.e., the firms have concentrated business operations and op-erate in states with no right-to-work laws and/or low unemployment rates). Thepattern is also stronger for option grants, especially unscheduled grants, than forother components of CEO pay, presumably because of the ease with which firmscan determine both how many options to grant and when to grant them.
In the setting of our study, we recognize that boards of directors (which for-mally set CEO pay) and executives (who provide input on their pay and negotiatewith unions) have divergent goals. Although both parties presumably aim to keeplabor costs low and union relations healthy, executives are more likely to resist apay cut to reach these goals. We therefore examine whether the strength and inde-pendence of boards affect our results. Consistent with our conjecture, we find thatfirms with strong and independent boards are indeed more likely to curtail totalCEO compensation to deal with powerful unions.
Finally, to investigate a possible rationale for curtailing CEO pay as a strate-gic tool to deal with labor unions, we examine how CEO compensation affects thedecision of labor unions to initiate a strike. We find that both high CEO pay andrecent increases in CEO pay raise the likelihood of a strike.
A remaining question is why union leaders do not seem to mobilize overtemporary curtailment in CEO pay as they enter contract negotiations with firmmanagers. That is, after repeated negotiations, union leaders should have learnedthat CEO pay bounces back after the negotiations have concluded.1 There are sev-eral possible reasons for this apparent complacency. First, unions might be contentthat executive pay is curbed at least every few years, especially if they also recog-nize that executive pay is generally lower for unionized firms. Conversely, unionsmight be insulted by the failure of executives to show moderation prior to nego-tiations. Second, the agency problem between union leaders and workers couldobscure what is rational from a union perspective.2 For example, union leaders
1In this regard, our study is particularly related to others that examine the use of accounting ma-nipulation to temporarily deceive unions (Liberty and Zimmerman (1986), DeAngelo and DeAngelo(1991), D’Souza, Jacob, and Ramesh (2000), Bova (2013), and Comprix and Muller (2011)).
2The agency problem between union leaders and workers is widely recognized (e.g., in the earlystudies of Ross (1948) and Martin (1984)). The media periodically discuss the pay gap between union
https://doi.org/10.1017/S0022109017000072D
ownloaded from
https://ww
w.cam
bridge.org/core . The University of Iow
a , on 08 Sep 2017 at 18:24:27 , subject to the Cambridge Core term
s of use, available at https://ww
w.cam
bridge.org/core/terms .
556 Journal of Financial and Quantitative Analysis
might recognize the strategic actions undertaken by the firm but view them asnecessary to save face with workers during negotiations. Third, perhaps unionsare ignorant of the trend. After all, it is hard to detect compensation patterns,especially the slow recovery after negotiations, in a single firm across a small setof negotiations. To tease out underlying patterns, our study makes use of thou-sands of firm-years.
As noted previously, our paper is not the first to study the relation betweenunionization and executive pay. Compared with earlier studies, including those bySingh and Agarwal (2002) and Banning and Chiles (2007), our study contributesto the literature by better establishing causality using triangulation tests and a re-gression discontinuity design. More importantly, we identify and empirically testa specific mechanism through which unions influence executive pay. In particular,we find that firms facing strong unions strategically alter executive pay to enhancebargaining power and that the failure to curtail executive compensation increasesthe likelihood of a labor strike.
The only study we are aware of that mentions the strategic role of CEO com-pensation in collective bargaining is that by DeAngelo and DeAngelo (1991).Based on a sample of 7 distressed steel firms in the 1980s, DeAngelo and DeAn-gelo also document a significant CEO salary cut prior to union negotiations. Ourstudy differs in several respects. First, a large fraction of the negotiations thatDeAngelo and DeAngelo study were opened early as a result of looming prob-lems in the steel industry. The financial difficulties of the firms presumably alsocontributed to the CEO salary cuts, so it is unclear what role union negotiations perse played. In contrast, the union negotiations in our sample are primarily sched-uled, thus allowing us to study the strategic games leading up to negotiations thatare not contaminated by financial difficulties. Second, whereas DeAngelo andDeAngelo focus on base salary and bonuses, we also examine equity grants. Thisis critical because, in terms of both magnitude and timing, these grants are ar-guably the most discretionary component of CEO compensation in recent years.Third, our larger and broader sample across numerous industries allows us to con-duct a more systematic and generalized study of the strategic role of CEO com-pensation in collective bargaining.
Our paper is related to the larger literature on the impact of labor unionson firm policies. Prior studies find that unionization affects firms’ innovationactivities (Hirsch (1992), Bradley, Kim, and Tian (2013)), risk-taking behavior(Chen, Kacperczyk, and Ortiz-Molina (2011), (2012)), and tax aggressiveness(Chyz, Leung, Li, and Rui (2013)). Other studies find evidence that firmstake strategic actions to lower their real or apparent ability to meet union de-mands. These actions include leverage increases (Bronars and Deere (1991),
leaders and workers and corruption among union leaders. The Detroit News writes that “The paydisparity is taking a financial toll on many union halls” and “raises questions about whether laborleaders are sharing the economic struggles of their members” (Aug. 14, 2007). The Washington Timeswrites that “The average union member has no idea how much the leaders make, said Stanley Oubre, aretired Boilermaker in Louisiana—and can hardly relate” (Jan. 10, 2013). The New York Times writesthat union leaders “helped corrupt contractors steal millions of dollars more from the union and itsbenefit funds” (Aug. 5, 2009). The National Legal and Policy Center even creates an annual “Top TenUnion Corruption Stories of the Year.”
https://doi.org/10.1017/S0022109017000072D
ownloaded from
https://ww
w.cam
bridge.org/core . The University of Iow
a , on 08 Sep 2017 at 18:24:27 , subject to the Cambridge Core term
s of use, available at https://ww
w.cam
bridge.org/core/terms .
Huang, Jiang, Lie, and Que 557
Hanka (1998), and Matsa (2010)), curbing of cash balances (Klasa, Maxwell, andOrtiz-Molina (2009)), and the choice of accounting policies (Cullinan and Kno-blett (1994), Bowen, DuCharme, and Shores (1995), D’Souza et al. (2000), andBova (2013)).
Our paper also contributes to the literature on how external pressure affectsexecutive compensation. Joskow, Rose, and Wolfram (1996) find that politicalpressures constrain CEO pay levels in the electric utility industry. Dial and Mur-phy (1995) describe how pressures on pay at General Dynamics led to the replace-ment of a controversial bonus plan with conventional stock options. Eldenburgand Krishnan (2003) show that public scrutiny leads to lower CEO pay in publichospitals. Finally, Core, Guay, and Larcker (2008) document that negative presscoverage is related to excess CEO pay and option exercises, but they find littleevidence that firms respond to negative press coverage by decreasing excess CEOcompensation or increasing CEO turnover.
II. Hypothesis Development and Testable PredictionsStudies in both economics and sociology suggest that firms with unionized
employees have incentives to curtail executive compensation. First, curtailing ex-ecutive compensation could help manage overall labor costs. As suggested byJensen and Murphy (1990), unions might interpret high executive compensa-tion as a positive indicator of the firm’s expected future financial performanceand therefore demand wage increases. Second, curtailing executive compensa-tion could improve union relations and limit labor disruptions. Studies show thatemployees generally prefer similar pay within a firm (Akerlof and Yellen (1990),Sheppard, Lewicki, and Minton (1992)). A great pay disparity between executivesand other employees can make the latter feel disadvantaged and unfairly treated,which in turn can reduce productivity, increase turnover, and disrupt operations(Adams (1965), Pfeffer and Langton (1993)). This leads to our first set of testablehypotheses on the effect of unionization on executive pay:
Hypothesis 1. Unionized firms maintain lower total CEO pay.
Hypothesis 1a. The lower CEO pay for unionized firms is more pronounced whenunions are relatively strong.
Hypothesis 1b. The lower CEO pay for unionized firms is more pronounced forthe part of pay that is readily altered.
Hypothesis 1c. Passing a union election leads to a reduction in CEO pay.
There are several ways in which unions can affect CEO compensation inpractice. Ertimur, Ferri, and Muslu (2011) show that union pension funds useshareholder activism, including shareholder proposals, to curb CEO pay. In thisstudy, we focus instead on the possibility that imminent labor negotiations compelfirms to curb CEO pay.
Labor negotiation outcomes can substantially affect the labor costs of thefirm, the motivation and well-being of workers, and, indirectly, the financialwealth of managers, owners, and perhaps even union leaders. Thus, firms have
https://doi.org/10.1017/S0022109017000072D
ownloaded from
https://ww
w.cam
bridge.org/core . The University of Iow
a , on 08 Sep 2017 at 18:24:27 , subject to the Cambridge Core term
s of use, available at https://ww
w.cam
bridge.org/core/terms .
558 Journal of Financial and Quantitative Analysis
an incentive to act strategically to increase the chance of moderate wage in-creases and meanwhile not endanger workers’ motivation and sense of well-being.Such strategic actions could include temporarily raising financial leverage, min-imizing cash balances, reporting lower-than-fair earnings, and curbing executivecompensation. Regarding the latter, curbing executive compensation might serveas i) a symbolic concession that engenders a willingness among workers to alsosacrifice for the financial health of the company or ii) a signal that executivesview future prospects to be dismal, thus instigating everyone to show moderation.However, because curbing executive compensation could adversely affect firms’ability to attract and retain talented executives, the curtailment could be limited toa critical period leading up the contract negotiations. These arguments lead us toa second set of hypotheses:
Hypothesis 2. Firms curtail total CEO compensation prior to union contractnegotiations.
Hypothesis 2a. The curtailment in CEO pay is more pronounced when unionshave a strong bargaining position.
Hypothesis 2b. The curtailment in CEO pay is more pronounced for the part ofpay that is readily altered.
We further recognize that the major players within firms differ in their rolesand objectives. On the one hand, the board of directors, in its fiduciary duty toensure that the firm is run in shareholders’ long-term interest, makes overall pol-icy decisions, provides oversight, and sets executive compensation. On the otherhand, executives are in charge of the daily operations, negotiate with unions, andprovide input to the board of directors on their own compensation. As such, theexecutives’ role is more conflicted than that of the board members. Specifically,although curtailing executive compensation might improve union relations andease union negotiations, it also hurts executives’ financial wealth directly. Thissuggests that, compared with boards of directors, executives have less incentiveto suppress their own pay even when faced with strong unions. Whether a boardfulfills its fiduciary duty and curtails executive pay could very well depend on itsstrength and independence from executives. We therefore predict that any curtail-ment of executive compensation to handle powerful unions is more pronouncedamong firms with strong and independent boards.
Hypothesis 2c. The curtailment in CEO pay is more pronounced among firmswith strong and independent boards.
To arrive at our final hypothesis, we consider the bargaining process moreexplicitly from the perspective of unionized workers, who desire what they per-ceive to be secure employment and fair wages and working conditions. As notedpreviously, executive compensation affects these perceptions in at least 2 ways.First, executive compensation might signal firm prospects and thus the ability ofunions to extract higher wages and better working conditions without endanger-ing future employment. Second, the pay disparity between executives and unionemployees affects union members’ sense of fairness of their contractual terms.If union workers are displeased with the actual or proposed terms, they have a
https://doi.org/10.1017/S0022109017000072D
ownloaded from
https://ww
w.cam
bridge.org/core . The University of Iow
a , on 08 Sep 2017 at 18:24:27 , subject to the Cambridge Core term
s of use, available at https://ww
w.cam
bridge.org/core/terms .
Huang, Jiang, Lie, and Que 559
couple of alternative actions to take. They could seek employment elsewhere,especially if nearby employment opportunities make the switching costs reason-able. Hypotheses 1a and 2a on the power of unions capture this. Alternatively,union workers could initiate a strike, which places a financial burden on both theunion (including its members) and the firm (including its ability to provide secureemployment and attractive labor terms). We expect that if executive compensa-tion affects union members’ view of firm prospects and/or fairness of contractualterms, the curtailment of executive compensation reduces the likelihood of laborstrikes.
Hypothesis 3. Firms that have higher CEO pay or that experience increases inCEO pay prior to union negotiations have a higher probability of unionstrikes.
III. DataWe study the population of firms covered by ExecuComp (excluding finan-
cial and utility firms) during the period 1993–2011. We require the sample firms tohave available information on key variables used in our analysis, including CEOcompensation, industry unionization rates, and financial information. Our data re-quirements yield an initial sample of 18,366 firm-year observations from 1993 to2011.
A. Unionization DataA union’s bargaining power is highly correlated with the fraction of union-
ized employees in that firm. Thus, labor economists often use unionization ratesas a proxy for union bargaining power. Because there is no publicly availabledatabase that provides systematic firm-level unionization information, most stud-ies of labor unions assume industry unionization rates to be a reasonable proxy forthe unionization rates of individual firms within an industry (Bronars and Deere(1991), Matsa (2010), Klasa et al. (2009), and Chen et al. (2011)). We there-fore follow the literature and collect industry unionization rates from the UnionMembership and Coverage Database, which reports the fraction of total workersin a 3-digit CIC industry who are represented by unions in collective bargainingagreements.
To account for intra-industry variation in union coverage, we also manu-ally collect firm-level unionization data from firms’ SEC filings, when avail-able. Specifically, we identify firms’ 10-K filings that contain one or more ofthe following key words: collective bargaining, collective-bargaining, union(s),labo(u)r agreement(s), labo(u)r contract(s), labo(u)r organization(s). We thenread through each of these filings to obtain union membership information.3
Because firms are not required to provide union coverage information in theirpublic filings, we are only able to collect firm-level rates for about half of oursample firms. Among these, some firms report their unionization rates directly,whereas others only disclose the number of employees represented by various
3Union membership information is normally reported in the “Employees” section of Item 1.
https://doi.org/10.1017/S0022109017000072D
ownloaded from
https://ww
w.cam
bridge.org/core . The University of Iow
a , on 08 Sep 2017 at 18:24:27 , subject to the Cambridge Core term
s of use, available at https://ww
w.cam
bridge.org/core/terms .
560 Journal of Financial and Quantitative Analysis
unions. In the latter cases, we calculate the unionization rate by scaling by thetotal number of employees. Of the sample of 9,013 firm-years with firm-levelunionization rates, 4,862 firm-years are not covered by any collective bargain-ing agreements, and 4,151 firm-years have nonzero union coverage ranging from0.003% to 96.4%.
B. Union Election DataWe collect union election data from the National Labor Relations Board
(NLRB). The database contains establishment-level information on union elec-tions, including firm name, location, Standard Industrial Classification (SIC) code,petition type, election date, number of participants, and outcomes of the voting.Following Lee and Mas (2012) and Bradley et al. (2013), we merge the NLRBdatabase with our main sample using company names. Because different abbre-viations are used by these data sets, this comparison could result in matching anestablishment to more than one company name. Therefore, we manually confirmeach match using information on industry classification, firm location, and on-line resources, including LexisNexis, Factiva, and Bloomberg Businessweek. Ifthe election outcome is unavailable or if the number of employees participatingin the election is fewer than 100, we exclude the election from our sample. Whenmultiple elections occur within a 3-year period for a firm, we keep only the firstelection. This procedure yields a sample of 398 unique union elections, amongwhich 134 elections favor unions. The unionization passage rate is 34%, compa-rable to the rate reported by Bradley et al. (2013).
C. Labor Contract ExpirationsWe obtain data on labor contract expirations from the BNA Labor Plus
database. Under the National Labor Relations Act, firms with labor union con-tracts are required to file notices of contract expiration with the Federal Mediationand Conciliation Service (FMCS) to help it prepare for potential strike mediation.4
These filings contain such information as employer names, contract expirationdates, bargaining unit size, and establishment size. The BNA has collected dataon these contract expirations since 1990. In this study, we include collective bar-gaining agreements involving 500 workers or more. In comparison, Klasa et al.(2009) include contract negotiations that cover at least 1,000 workers. We choosea lower break point because firms could have multiple contract negotiations ina given year that individually involve fewer than 1,000 workers but aggregate tomore than 1,000 employees. For example, in 2007, BAE Systems negotiated 2labor contracts involving 747 and 700 employees, respectively. We then mergethe BNA database with our main sample, following the matching procedure pre-viously described. We ultimately match 518 contract expirations from the BNAdatabase to companies covered by ExecuComp during the 1993–2011 period.
4The database includes both contentious and noncontentious negotiations. According to industryinsiders with whom we have communicated, only a small minority (less than 5%) of negotiations arenot filed because a new contract is agreed upon more than 30 days before the previous contract expires.
https://doi.org/10.1017/S0022109017000072D
ownloaded from
https://ww
w.cam
bridge.org/core . The University of Iow
a , on 08 Sep 2017 at 18:24:27 , subject to the Cambridge Core term
s of use, available at https://ww
w.cam
bridge.org/core/terms .
Huang, Jiang, Lie, and Que 561
D. Strike DataWe collect strike data from the BNA Labor Plus database and the U.S.
Bureau of Labor Statistics (BLS). These databases, constructed with data frompublished sources, including BNA publications, newspapers, union publications,and government reports, contain information on employer names, strike begin-ning and ending dates, and number of workers involved in strikes since 1990. Wefollow the extant literature and focus on major strikes that involve at least 1,000workers. After merging work stoppages with our main sample based on companynames, we obtain 56 strikes during our sample period.
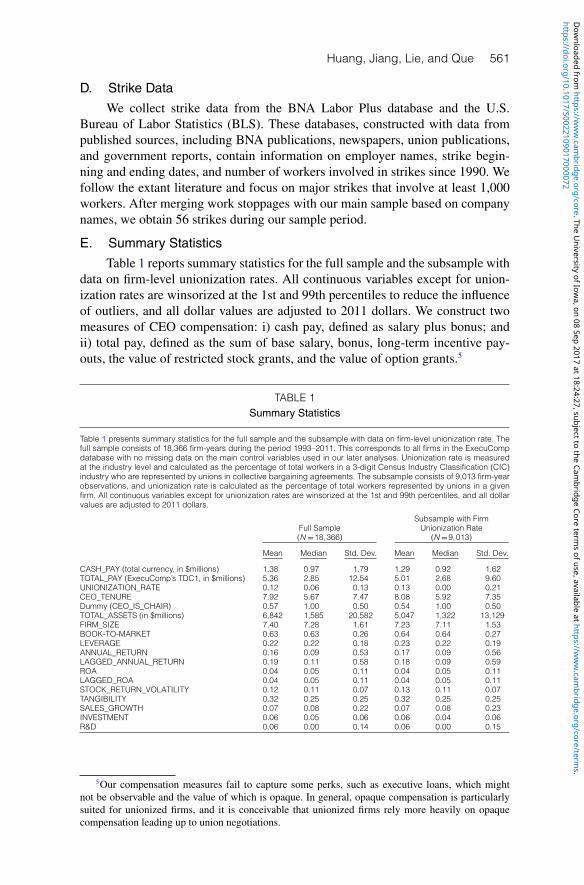
E. Summary StatisticsTable 1 reports summary statistics for the full sample and the subsample with
data on firm-level unionization rates. All continuous variables except for union-ization rates are winsorized at the 1st and 99th percentiles to reduce the influenceof outliers, and all dollar values are adjusted to 2011 dollars. We construct twomeasures of CEO compensation: i) cash pay, defined as salary plus bonus; andii) total pay, defined as the sum of base salary, bonus, long-term incentive pay-outs, the value of restricted stock grants, and the value of option grants.5
TABLE 1Summary Statistics
Table 1 presents summary statistics for the full sample and the subsample with data on firm-level unionization rate. Thefull sample consists of 18,366 firm-years during the period 1993–2011. This corresponds to all firms in the ExecuCompdatabase with no missing data on the main control variables used in our later analyses. Unionization rate is measuredat the industry level and calculated as the percentage of total workers in a 3-digit Census Industry Classification (CIC)industry who are represented by unions in collective bargaining agreements. The subsample consists of 9,013 firm-yearobservations, and unionization rate is calculated as the percentage of total workers represented by unions in a givenfirm. All continuous variables except for unionization rates are winsorized at the 1st and 99th percentiles, and all dollarvalues are adjusted to 2011 dollars.
Subsample with FirmFull Sample Unionization Rate(N =18,366) (N =9,013)
Mean Median Std. Dev. Mean Median Std. Dev.
CASH_PAY (total currency, in $millions) 1.38 0.97 1.79 1.29 0.92 1.62TOTAL_PAY (ExecuComp’s TDC1, in $millions) 5.36 2.85 12.54 5.01 2.68 9.60UNIONIZATION_RATE 0.12 0.06 0.13 0.13 0.00 0.21CEO_TENURE 7.92 5.67 7.47 8.08 5.92 7.35Dummy (CEO_IS_CHAIR) 0.57 1.00 0.50 0.54 1.00 0.50TOTAL_ASSETS (in $millions) 6,842 1,585 20,582 5,047 1,322 13,129FIRM_SIZE 7.40 7.28 1.61 7.23 7.11 1.53BOOK-TO-MARKET 0.63 0.63 0.26 0.64 0.64 0.27LEVERAGE 0.22 0.22 0.18 0.23 0.22 0.19ANNUAL_RETURN 0.16 0.09 0.53 0.17 0.09 0.56LAGGED_ANNUAL_RETURN 0.19 0.11 0.58 0.18 0.09 0.59ROA 0.04 0.05 0.11 0.04 0.05 0.11LAGGED_ROA 0.04 0.05 0.11 0.04 0.05 0.11STOCK_RETURN_VOLATILITY 0.12 0.11 0.07 0.13 0.11 0.07TANGIBILITY 0.32 0.25 0.25 0.32 0.25 0.25SALES_GROWTH 0.07 0.08 0.22 0.07 0.08 0.23INVESTMENT 0.06 0.05 0.06 0.06 0.04 0.06R&D 0.06 0.00 0.14 0.06 0.00 0.15
5Our compensation measures fail to capture some perks, such as executive loans, which mightnot be observable and the value of which is opaque. In general, opaque compensation is particularlysuited for unionized firms, and it is conceivable that unionized firms rely more heavily on opaquecompensation leading up to union negotiations.
https://doi.org/10.1017/S0022109017000072D
ownloaded from
https://ww
w.cam
bridge.org/core . The University of Iow
a , on 08 Sep 2017 at 18:24:27 , subject to the Cambridge Core term
s of use, available at https://ww
w.cam
bridge.org/core/terms .
562 Journal of Financial and Quantitative Analysis
For the full sample, the average cash pay and average total pay are $1.38 mil-lion and $5.36 million, respectively, suggesting that equity-related compensationaccounts for the majority of total CEO pay. The mean (median) industry union-ization rate is 0.12 (0.06), lower than the rate reported by Klasa et al. (2009).This is because we cover firms in all industries, whereas Klasa et al. focus onmanufacturing firms only, whose unionization rates are generally higher. We alsoreport firm-level unionization rates for the subsample for which this informationis available. We find a very comparable mean of 0.13 but a smaller median of0.00. Because the distribution of the unionization rate at the firm level is skewedto the right, the median for the distribution is expected to be lower than the me-dian for a distribution of averages for subsamples based on, for example, industryclassifications.
IV. The Relation between Unionization and CEOCompensation
A. Evidence from OLSTo test Hypothesis 1, which is that firms facing labor unions maintain lower
total CEO pay, we examine whether CEOs of firms in more-unionized industriesreceive relatively lower observable total pay than CEOs of firms in less-unionizedindustries. We first conduct pooled ordinary least squares (OLS) regressions ofthe natural logarithm of total CEO pay on industry unionization rates and a groupof control variables. The main independent variable of interest is the unioniza-tion rate in a firm’s 3-digit CIC industry. We control for other economic determi-nants of CEO pay based on prior research in this area (e.g., Core, Holthausen, andLarcker (1999), Murphy (1999)), including firm size, growth opportunities, stockperformance, accounting performance, asset tangibility, and investment rates. Toaddress the concern that industry unionization acts as a proxy for general industrycharacteristics that are also correlated with total CEO compensation, we includeseveral industry-level variables that proxy for the stage of the industry’s life cycle,such as the industry’s capital-to-labor ratio, industry research and development(R&D), and industry age. We also include fixed effects for years and 2-digit SICcodes in the regressions.
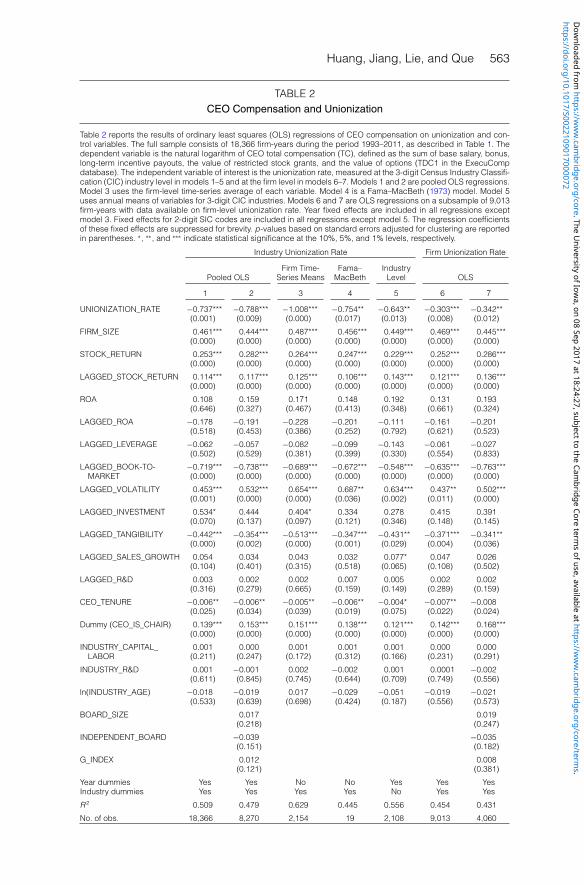
Model 1 of Table 2 presents the results of our baseline model, with p-valuesbased on standard errors adjusted for CIC industry clustering. The estimated co-efficients of the control variables are generally in line with extant research andhave the expected signs. For example, the level of total pay is positively relatedto firm size, growth opportunities, stock returns, cash flow volatility, and the dualCEO-chairman dummy. Turning to our variable of interest, we find that the co-efficient of the industry unionization rate is negative and statistically differentfrom 0 at the 1% level, suggesting that CEOs of firms in more-unionized in-dustries receive lower total pay than those of firms in less-unionized industries.The impact of unionization on total CEO pay is also economically meaningful.Ceteris paribus, a 1-standard-deviation increase in industry unionization is asso-ciated with a 9.2% reduction in total compensation (TC). For comparison, weestimate that a 1-standard-deviation increase in contemporaneous annual stock
https://doi.org/10.1017/S0022109017000072D
ownloaded from
https://ww
w.cam
bridge.org/core . The University of Iow
a , on 08 Sep 2017 at 18:24:27 , subject to the Cambridge Core term
s of use, available at https://ww
w.cam
bridge.org/core/terms .
Huang, Jiang, Lie, and Que 563
TABLE 2CEO Compensation and Unionization
Table 2 reports the results of ordinary least squares (OLS) regressions of CEO compensation on unionization and con-trol variables. The full sample consists of 18,366 firm-years during the period 1993–2011, as described in Table 1. Thedependent variable is the natural logarithm of CEO total compensation (TC), defined as the sum of base salary, bonus,long-term incentive payouts, the value of restricted stock grants, and the value of options (TDC1 in the ExecuCompdatabase). The independent variable of interest is the unionization rate, measured at the 3-digit Census Industry Classifi-cation (CIC) industry level in models 1–5 and at the firm level in models 6–7. Models 1 and 2 are pooled OLS regressions.Model 3 uses the firm-level time-series average of each variable. Model 4 is a Fama–MacBeth (1973) model. Model 5uses annual means of variables for 3-digit CIC industries. Models 6 and 7 are OLS regressions on a subsample of 9,013firm-years with data available on firm-level unionization rate. Year fixed effects are included in all regressions exceptmodel 3. Fixed effects for 2-digit SIC codes are included in all regressions except model 5. The regression coefficientsof these fixed effects are suppressed for brevity. p-values based on standard errors adjusted for clustering are reportedin parentheses. ∗, ∗∗, and ∗∗∗ indicate statistical significance at the 10%, 5%, and 1% levels, respectively.
Industry Unionization Rate Firm Unionization Rate
Firm Time- Fama– IndustryPooled OLS Series Means MacBeth Level OLS
1 2 3 4 5 6 7
UNIONIZATION_RATE −0.737*** −0.788*** −1.008*** −0.754** −0.643** −0.303*** −0.342**(0.001) (0.009) (0.000) (0.017) (0.013) (0.008) (0.012)
FIRM_SIZE 0.461*** 0.444*** 0.487*** 0.456*** 0.449*** 0.469*** 0.445***(0.000) (0.000) (0.000) (0.000) (0.000) (0.000) (0.000)
STOCK_RETURN 0.253*** 0.282*** 0.264*** 0.247*** 0.229*** 0.252*** 0.286***(0.000) (0.000) (0.000) (0.000) (0.000) (0.000) (0.000)
LAGGED_STOCK_RETURN 0.114*** 0.117*** 0.125*** 0.106*** 0.143*** 0.121*** 0.136***(0.000) (0.000) (0.000) (0.000) (0.000) (0.000) (0.000)
ROA 0.108 0.159 0.171 0.148 0.192 0.131 0.193(0.646) (0.327) (0.467) (0.413) (0.348) (0.661) (0.324)
LAGGED_ROA −0.178 −0.191 −0.228 −0.201 −0.111 −0.161 −0.201(0.518) (0.453) (0.386) (0.252) (0.792) (0.621) (0.523)
LAGGED_LEVERAGE −0.062 −0.057 −0.082 −0.099 −0.143 −0.061 −0.027(0.502) (0.529) (0.381) (0.399) (0.330) (0.554) (0.833)
LAGGED_BOOK-TO- −0.719*** −0.738*** −0.689*** −0.672*** −0.548*** −0.635*** −0.763***MARKET (0.000) (0.000) (0.000) (0.000) (0.000) (0.000) (0.000)
LAGGED_VOLATILITY 0.453*** 0.532*** 0.654*** 0.687** 0.634*** 0.437** 0.502***(0.001) (0.000) (0.000) (0.036) (0.002) (0.011) (0.000)
LAGGED_INVESTMENT 0.534* 0.444 0.404* 0.334 0.278 0.415 0.391(0.070) (0.137) (0.097) (0.121) (0.346) (0.148) (0.145)
LAGGED_TANGIBILITY −0.442*** −0.354*** −0.513*** −0.347*** −0.431** −0.371*** −0.341**(0.000) (0.002) (0.000) (0.001) (0.029) (0.004) (0.036)
LAGGED_SALES_GROWTH 0.054 0.034 0.043 0.032 0.077* 0.047 0.026(0.104) (0.401) (0.315) (0.518) (0.065) (0.108) (0.502)
LAGGED_R&D 0.003 0.002 0.002 0.007 0.005 0.002 0.002(0.316) (0.279) (0.665) (0.159) (0.149) (0.289) (0.159)
CEO_TENURE −0.006** −0.006** −0.005** −0.006** −0.004* −0.007** −0.008(0.025) (0.034) (0.039) (0.019) (0.075) (0.022) (0.024)
Dummy (CEO_IS_CHAIR) 0.139*** 0.153*** 0.151*** 0.138*** 0.121*** 0.142*** 0.168***(0.000) (0.000) (0.000) (0.000) (0.000) (0.000) (0.000)
INDUSTRY_CAPITAL_ 0.001 0.000 0.001 0.001 0.001 0.000 0.000LABOR (0.211) (0.247) (0.172) (0.312) (0.166) (0.231) (0.291)
INDUSTRY_R&D 0.001 −0.001 0.002 −0.002 0.001 0.0001 −0.002(0.611) (0.845) (0.745) (0.644) (0.709) (0.749) (0.556)
ln(INDUSTRY_AGE) −0.018 −0.019 0.017 −0.029 −0.051 −0.019 −0.021(0.533) (0.639) (0.698) (0.424) (0.187) (0.556) (0.573)
BOARD_SIZE 0.017 0.019(0.218) (0.247)
INDEPENDENT_BOARD −0.039 −0.035(0.151) (0.182)
G_INDEX 0.012 0.008(0.121) (0.381)
Year dummies Yes Yes No No Yes Yes YesIndustry dummies Yes Yes Yes Yes No Yes Yes
R 2 0.509 0.479 0.629 0.445 0.556 0.454 0.431
No. of obs. 18,366 8,270 2,154 19 2,108 9,013 4,060
https://doi.org/10.1017/S0022109017000072D
ownloaded from
https://ww
w.cam
bridge.org/core . The University of Iow
a , on 08 Sep 2017 at 18:24:27 , subject to the Cambridge Core term
s of use, available at https://ww
w.cam
bridge.org/core/terms .
564 Journal of Financial and Quantitative Analysis
returns increases total compensation by 13.4%, and a 1-standard-deviationincrease in firm size (log(assets)) increases total pay by 71.5%. Thus, the eco-nomic impact of unionization on CEO pay seems comparable to that of severalwell-known determinants of CEO pay. In model 2, we expand the baseline modelby adding more governance variables and conduct the analysis on a subsample forwhich we have data available from RiskMetrics. The results are the same.
To further address the omitted-variable concern, we estimate a change-on-change regression to remove unobserved time-invariant factors correlated withboth unionization and total CEO pay. In particular, given the limited time-seriesvariation of industry unionization rates, we convert all variables into 2-yearchanges. Unreported results show that changes in total CEO pay are negativelyrelated to changes in unionization rates, further suggesting that firms facing morepowerful unions set lower levels of total CEO compensation.
Another concern is that time trends drive our findings. In fact, private-sectorunionization has declined over time, whereas executive compensation has in-creased dramatically in the past few decades. This concern is mitigated by theyear fixed effects in the regressions. However, because different industries couldexhibit different time trends during our sample period, we adopt 3 approachesto strengthen our analysis. First, we conduct a time-series average regressionwhere we convert all variables into time-series averages and estimate a pure cross-sectional regression. The results are presented in model 3 of Table 2. We findthat the coefficient of unionization remains negative, with even greater magnitudeand statistical significance. Second, we estimate a Fama–MacBeth (1973) model,where we correct for serial correlation with a lag of 1. The results in model 4confirm a significantly negative relation between unionization and total CEO pay.Finally, we repeat our OLS analysis for each year in the period 1993–2011. Unt-abulated results show that the coefficients of unionization rates are negative for allyears and are statistically significant in 14 out of 19 years. These findings suggestthat the documented negative relation is not a result of time trends.
Like other studies using industry unionization data, our analysis has a limi-tation in that it disregards intra-industry variation in union coverage. As a result,our findings might suffer from nontrivial measurement errors. To ensure that theestimated coefficients are not significantly biased, we convert all firm-level vari-ables into CIC industry averages and conduct an industry-level regression. Thisapproach can also address the issue that industries with a greater number of firmsreceive larger weight in earlier tests. The results are reported in model 5, withp-values based on standard errors adjusted for CIC industry clustering. We findthat the coefficient of unionization is again negative and statistically significant,and the effect of unionization on total CEO pay is still economically large.
In model 6 of Table 2, we reestimate our baseline model using hand-collectedfirm-level unionization data and report p-values based on firm-clustered standarderrors. We still find a significantly negative association between unionization andtotal CEO pay. All else being equal, a 1-standard-deviation increase in firm-levelunionization is associated with a decrease in total CEO pay of approximately 6.4percentage points per year. This magnitude is comparable to the 9.2 percentagepoints obtained using industry unionization rates. In model 7, we add more gov-ernance controls, and our results remain the same.
https://doi.org/10.1017/S0022109017000072D
ownloaded from
https://ww
w.cam
bridge.org/core . The University of Iow
a , on 08 Sep 2017 at 18:24:27 , subject to the Cambridge Core term
s of use, available at https://ww
w.cam
bridge.org/core/terms .
Huang, Jiang, Lie, and Que 565
Another concern is that the lower total CEO compensation in unionizedfirms contributes to or is attributable to worse performance among executives inunionized firms or lower-quality executives in unionized firms. This concern ismitigated by both the inclusion of performance variables in the regression modelsand our later tests designed to address the identification problem. Nevertheless,we also examine the issue of CEO quality more directly. In particular, for a sub-sample of CEOs with biographical information from BoardEx (9,467 firm-years),we examine three measures of CEO quality: i) whether the CEO had prior CEOexperience in publicly traded firms, ii) whether the CEO had an MBA degree, andiii) the number of industries (4-digit SIC) in which the CEO had worked for pub-licly traded firms (Custodio, Ferreira, and Matos (2013)). Among CEOs in firmswith unionization below (above) the median, 31% (27%) had prior CEO experi-ence, 33% (30%) had an MBA degree, and the average number of industries theyhad worked in was 1.5 (1.3). On this basis, CEOs in firms with greater union-ization are of lower quality. Next, we introduce these quality measures into ourcompensation regressions as additional independent variables. Untabulated resultsshow that all three quality measures have positive coefficients, and those of priorCEO experience and number of prior industries are both statistically significantat the 5% level. More importantly, the introduction of the CEO quality variablescontributes only 0.5% to the explanatory power and has a trivial effect on theunionization variable, suggesting that the relation between unionization and totalCEO compensation is unlikely to be attributable to CEO quality.
B. Cross-Sectional Variation in the Union EffectTo further address the identification issue, we explore cross-sectional vari-
ations in the impact of unionization on executive compensation. If the negativerelation arises because boards of directors consider union pressure when settingCEO compensation, it should be more pronounced when unions have a relativelystrong bargaining position relative to the firm (Hypothesis 1a).
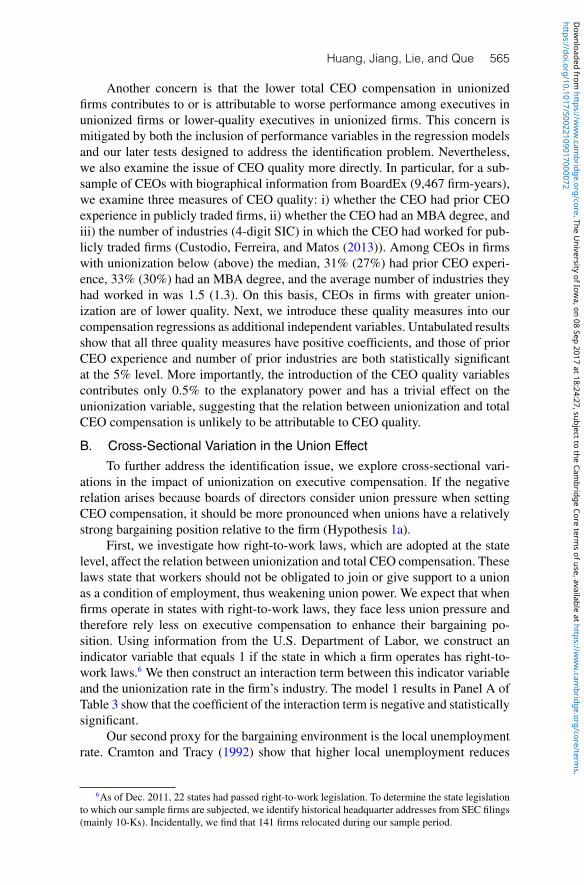
First, we investigate how right-to-work laws, which are adopted at the statelevel, affect the relation between unionization and total CEO compensation. Theselaws state that workers should not be obligated to join or give support to a unionas a condition of employment, thus weakening union power. We expect that whenfirms operate in states with right-to-work laws, they face less union pressure andtherefore rely less on executive compensation to enhance their bargaining po-sition. Using information from the U.S. Department of Labor, we construct anindicator variable that equals 1 if the state in which a firm operates has right-to-work laws.6 We then construct an interaction term between this indicator variableand the unionization rate in the firm’s industry. The model 1 results in Panel A ofTable 3 show that the coefficient of the interaction term is negative and statisticallysignificant.
Our second proxy for the bargaining environment is the local unemploymentrate. Cramton and Tracy (1992) show that higher local unemployment reduces
6As of Dec. 2011, 22 states had passed right-to-work legislation. To determine the state legislationto which our sample firms are subjected, we identify historical headquarter addresses from SEC filings(mainly 10-Ks). Incidentally, we find that 141 firms relocated during our sample period.
https://doi.org/10.1017/S0022109017000072D
ownloaded from
https://ww
w.cam
bridge.org/core . The University of Iow
a , on 08 Sep 2017 at 18:24:27 , subject to the Cambridge Core term
s of use, available at https://ww
w.cam
bridge.org/core/terms .
566 Journal of Financial and Quantitative Analysis
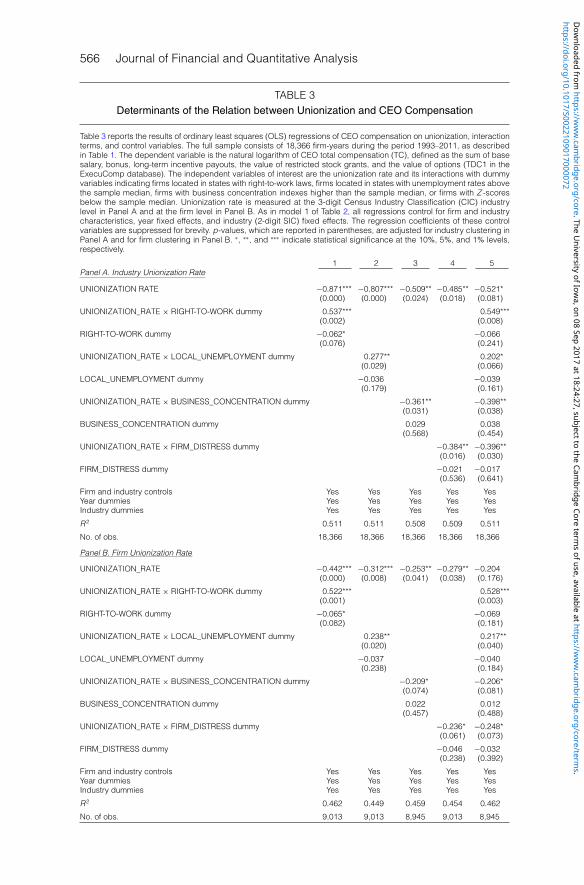
TABLE 3Determinants of the Relation between Unionization and CEO Compensation
Table 3 reports the results of ordinary least squares (OLS) regressions of CEO compensation on unionization, interactionterms, and control variables. The full sample consists of 18,366 firm-years during the period 1993–2011, as describedin Table 1. The dependent variable is the natural logarithm of CEO total compensation (TC), defined as the sum of basesalary, bonus, long-term incentive payouts, the value of restricted stock grants, and the value of options (TDC1 in theExecuComp database). The independent variables of interest are the unionization rate and its interactions with dummyvariables indicating firms located in states with right-to-work laws, firms located in states with unemployment rates abovethe sample median, firms with business concentration indexes higher than the sample median, or firms with Z -scoresbelow the sample median. Unionization rate is measured at the 3-digit Census Industry Classification (CIC) industrylevel in Panel A and at the firm level in Panel B. As in model 1 of Table 2, all regressions control for firm and industrycharacteristics, year fixed effects, and industry (2-digit SIC) fixed effects. The regression coefficients of these controlvariables are suppressed for brevity. p-values, which are reported in parentheses, are adjusted for industry clustering inPanel A and for firm clustering in Panel B. ∗, ∗∗, and ∗∗∗ indicate statistical significance at the 10%, 5%, and 1% levels,respectively.
1 2 3 4 5Panel A. Industry Unionization Rate
UNIONIZATION RATE −0.871*** −0.807*** −0.509** −0.485** −0.521*(0.000) (0.000) (0.024) (0.018) (0.081)
UNIONIZATION_RATE × RIGHT-TO-WORK dummy 0.537*** 0.549***(0.002) (0.008)
RIGHT-TO-WORK dummy −0.062* −0.066(0.076) (0.241)
UNIONIZATION_RATE × LOCAL_UNEMPLOYMENT dummy 0.277** 0.202*(0.029) (0.066)
LOCAL_UNEMPLOYMENT dummy −0.036 −0.039(0.179) (0.161)
UNIONIZATION_RATE × BUSINESS_CONCENTRATION dummy −0.361** −0.398**(0.031) (0.038)
BUSINESS_CONCENTRATION dummy 0.029 0.038(0.568) (0.454)
UNIONIZATION_RATE × FIRM_DISTRESS dummy −0.384** −0.396**(0.016) (0.030)
FIRM_DISTRESS dummy −0.021 −0.017(0.536) (0.641)
Firm and industry controls Yes Yes Yes Yes YesYear dummies Yes Yes Yes Yes YesIndustry dummies Yes Yes Yes Yes Yes
R 2 0.511 0.511 0.508 0.509 0.511
No. of obs. 18,366 18,366 18,366 18,366 18,366
Panel B. Firm Unionization Rate
UNIONIZATION_RATE −0.442*** −0.312*** −0.253** −0.279** −0.204(0.000) (0.008) (0.041) (0.038) (0.176)
UNIONIZATION_RATE × RIGHT-TO-WORK dummy 0.522*** 0.528***(0.001) (0.003)
RIGHT-TO-WORK dummy −0.065* −0.069(0.082) (0.181)
UNIONIZATION_RATE × LOCAL_UNEMPLOYMENT dummy 0.238** 0.217**(0.020) (0.040)
LOCAL_UNEMPLOYMENT dummy −0.037 −0.040(0.238) (0.184)
UNIONIZATION_RATE × BUSINESS_CONCENTRATION dummy −0.209* −0.206*(0.074) (0.081)
BUSINESS_CONCENTRATION dummy 0.022 0.012(0.457) (0.488)
UNIONIZATION_RATE × FIRM_DISTRESS dummy −0.236* −0.248*(0.061) (0.073)
FIRM_DISTRESS dummy −0.046 −0.032(0.238) (0.392)
Firm and industry controls Yes Yes Yes Yes YesYear dummies Yes Yes Yes Yes YesIndustry dummies Yes Yes Yes Yes Yes
R 2 0.462 0.449 0.459 0.454 0.462
No. of obs. 9,013 9,013 8,945 9,013 8,945
https://doi.org/10.1017/S0022109017000072D
ownloaded from
https://ww
w.cam
bridge.org/core . The University of Iow
a , on 08 Sep 2017 at 18:24:27 , subject to the Cambridge Core term
s of use, available at https://ww
w.cam
bridge.org/core/terms .
Huang, Jiang, Lie, and Que 567
unions’ bargaining power. This also fits with our earlier discussion that local em-ployment opportunities affect the extent to which unionized workers seek differentemployment when they are discontented with their labor contracts. Thus, we ex-pect firms located in states with higher unemployment rates to be less likely to useexecutive compensation to strengthen their bargaining power. We collect state-level unemployment rates from the BLS and construct a dummy variable thattakes a value of 1 if the unemployment rate in the firm’s state is above the samplemedian. Model 2 in Panel A of Table 3 shows that the coefficient of the interactionterm between the industry unionization and the unemployment dummy is negativeand statistically significant.
Rose (1991) argues that diversified firms have a better bargaining positionrelative to unions because they can cross-subsidize costs associated with unionactivities, such as strikes. Therefore, following Chen et al. (2011), we construct aHerfindahl index measuring the concentration of a firm’s sales across its businesssegments. A firm is classified as having concentrated business operations if itsHerfindahl index is higher than the sample median. In model 3 in Panel A ofTable 3, we report that the negative relation between unionization and total CEOcompensation is more pronounced for concentrated firms, providing even moreevidence consistent with our conjecture.
Last, we examine whether the negative effect is stronger when lower totalCEO compensation serves as credible evidence that the firm cannot comply withunion demands. In particular, we investigate whether firms closer to financial dis-tress are more likely to use lower CEO compensation to bargain with labor unions.A firm is defined as financially distressed if its Altman Z -score is below the sam-ple median. The results in model 4 in Panel A of Table 3 show a significantlynegative coefficient of the interaction between unionization and a distress dummy.This suggests that lower total CEO compensation provides more of a bargainingadvantage for firms that face higher bankruptcy risk.
For completeness, model 5 in Panel A of Table 3 presents a regression that in-cludes all of the aforementioned interaction terms. The results confirm our earlierfindings. In Panel B of Table 3, we repeat all of these tests using unionization ratesmeasured at the firm level and obtain the same results. Overall, the evidence in Ta-ble 3 suggests that strong unions compel firms to curtail executive compensation.
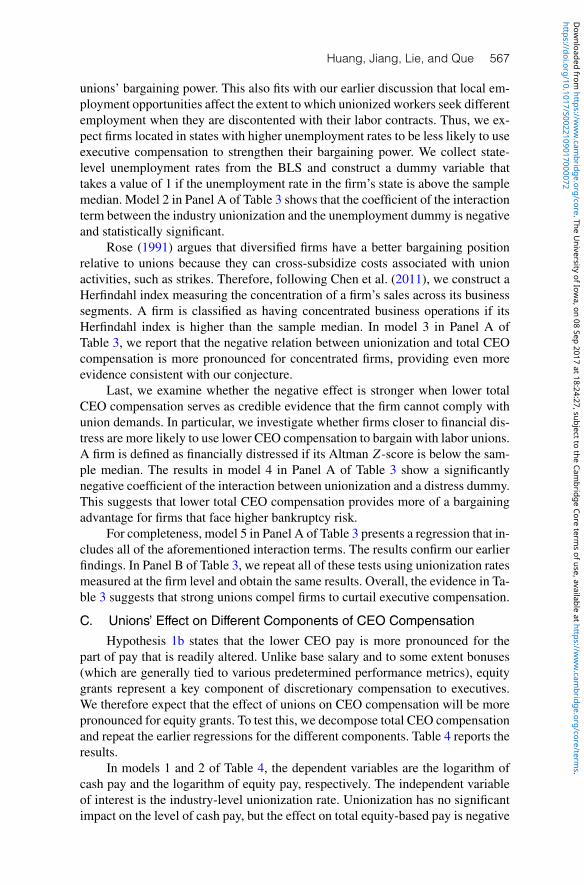
C. Unions’ Effect on Different Components of CEO CompensationHypothesis 1b states that the lower CEO pay is more pronounced for the
part of pay that is readily altered. Unlike base salary and to some extent bonuses(which are generally tied to various predetermined performance metrics), equitygrants represent a key component of discretionary compensation to executives.We therefore expect that the effect of unions on CEO compensation will be morepronounced for equity grants. To test this, we decompose total CEO compensationand repeat the earlier regressions for the different components. Table 4 reports theresults.
In models 1 and 2 of Table 4, the dependent variables are the logarithm ofcash pay and the logarithm of equity pay, respectively. The independent variableof interest is the industry-level unionization rate. Unionization has no significantimpact on the level of cash pay, but the effect on total equity-based pay is negative
https://doi.org/10.1017/S0022109017000072D
ownloaded from
https://ww
w.cam
bridge.org/core . The University of Iow
a , on 08 Sep 2017 at 18:24:27 , subject to the Cambridge Core term
s of use, available at https://ww
w.cam
bridge.org/core/terms .
568 Journal of Financial and Quantitative Analysis
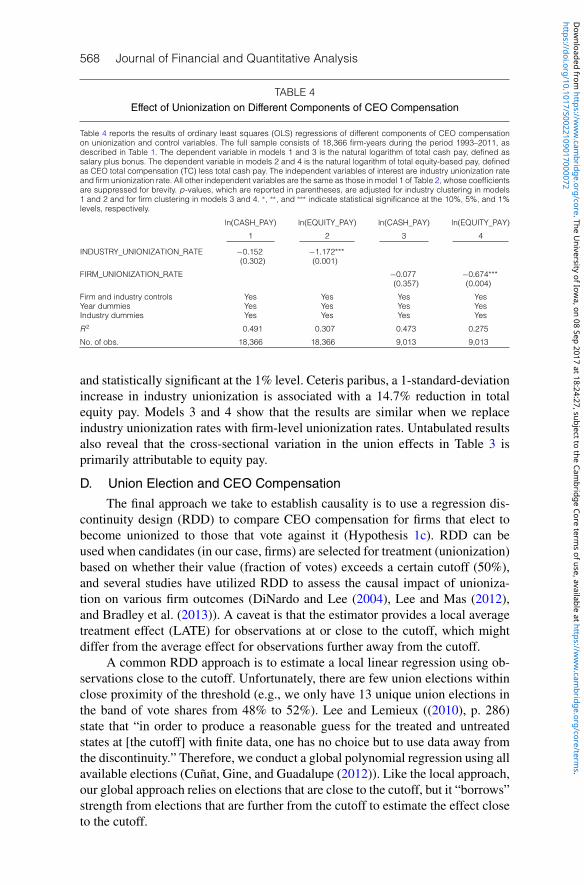
TABLE 4Effect of Unionization on Different Components of CEO Compensation
Table 4 reports the results of ordinary least squares (OLS) regressions of different components of CEO compensationon unionization and control variables. The full sample consists of 18,366 firm-years during the period 1993–2011, asdescribed in Table 1. The dependent variable in models 1 and 3 is the natural logarithm of total cash pay, defined assalary plus bonus. The dependent variable in models 2 and 4 is the natural logarithm of total equity-based pay, definedas CEO total compensation (TC) less total cash pay. The independent variables of interest are industry unionization rateand firm unionization rate. All other independent variables are the same as those in model 1 of Table 2, whose coefficientsare suppressed for brevity. p-values, which are reported in parentheses, are adjusted for industry clustering in models1 and 2 and for firm clustering in models 3 and 4. ∗, ∗∗, and ∗∗∗ indicate statistical significance at the 10%, 5%, and 1%levels, respectively.
ln(CASH_PAY) ln(EQUITY_PAY) ln(CASH_PAY) ln(EQUITY_PAY)
1 2 3 4
INDUSTRY_UNIONIZATION_RATE −0.152 −1.172***(0.302) (0.001)
FIRM_UNIONIZATION_RATE −0.077 −0.674***(0.357) (0.004)
Firm and industry controls Yes Yes Yes YesYear dummies Yes Yes Yes YesIndustry dummies Yes Yes Yes Yes
R 2 0.491 0.307 0.473 0.275
No. of obs. 18,366 18,366 9,013 9,013
and statistically significant at the 1% level. Ceteris paribus, a 1-standard-deviationincrease in industry unionization is associated with a 14.7% reduction in totalequity pay. Models 3 and 4 show that the results are similar when we replaceindustry unionization rates with firm-level unionization rates. Untabulated resultsalso reveal that the cross-sectional variation in the union effects in Table 3 isprimarily attributable to equity pay.
D. Union Election and CEO CompensationThe final approach we take to establish causality is to use a regression dis-
continuity design (RDD) to compare CEO compensation for firms that elect tobecome unionized to those that vote against it (Hypothesis 1c). RDD can beused when candidates (in our case, firms) are selected for treatment (unionization)based on whether their value (fraction of votes) exceeds a certain cutoff (50%),and several studies have utilized RDD to assess the causal impact of unioniza-tion on various firm outcomes (DiNardo and Lee (2004), Lee and Mas (2012),and Bradley et al. (2013)). A caveat is that the estimator provides a local averagetreatment effect (LATE) for observations at or close to the cutoff, which mightdiffer from the average effect for observations further away from the cutoff.
A common RDD approach is to estimate a local linear regression using ob-servations close to the cutoff. Unfortunately, there are few union elections withinclose proximity of the threshold (e.g., we only have 13 unique union elections inthe band of vote shares from 48% to 52%). Lee and Lemieux ((2010), p. 286)state that “in order to produce a reasonable guess for the treated and untreatedstates at [the cutoff] with finite data, one has no choice but to use data away fromthe discontinuity.” Therefore, we conduct a global polynomial regression using allavailable elections (Cunat, Gine, and Guadalupe (2012)). Like the local approach,our global approach relies on elections that are close to the cutoff, but it “borrows”strength from elections that are further from the cutoff to estimate the effect closeto the cutoff.
https://doi.org/10.1017/S0022109017000072D
ownloaded from
https://ww
w.cam
bridge.org/core . The University of Iow
a , on 08 Sep 2017 at 18:24:27 , subject to the Cambridge Core term
s of use, available at https://ww
w.cam
bridge.org/core/terms .
Huang, Jiang, Lie, and Que 569
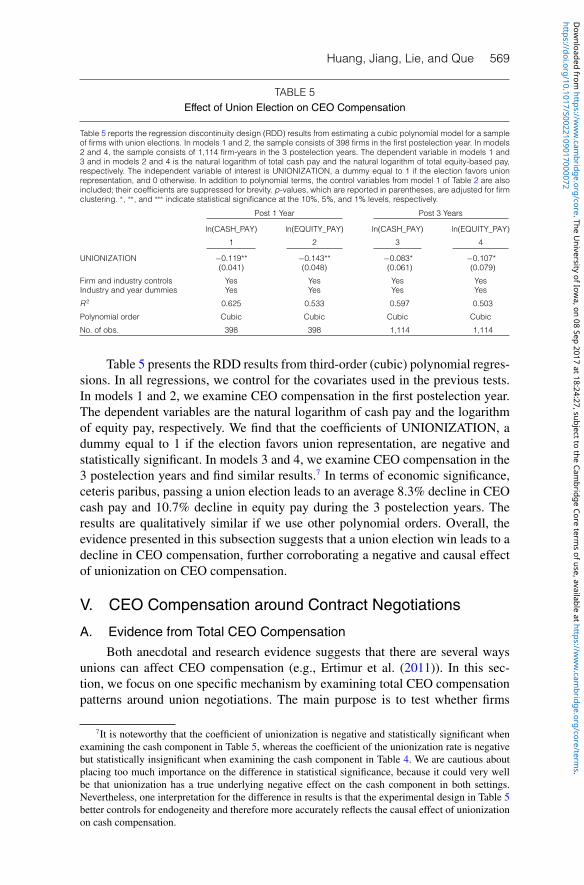
TABLE 5Effect of Union Election on CEO Compensation
Table 5 reports the regression discontinuity design (RDD) results from estimating a cubic polynomial model for a sampleof firms with union elections. In models 1 and 2, the sample consists of 398 firms in the first postelection year. In models2 and 4, the sample consists of 1,114 firm-years in the 3 postelection years. The dependent variable in models 1 and3 and in models 2 and 4 is the natural logarithm of total cash pay and the natural logarithm of total equity-based pay,respectively. The independent variable of interest is UNIONIZATION, a dummy equal to 1 if the election favors unionrepresentation, and 0 otherwise. In addition to polynomial terms, the control variables from model 1 of Table 2 are alsoincluded; their coefficients are suppressed for brevity. p-values, which are reported in parentheses, are adjusted for firmclustering. ∗, ∗∗, and ∗∗∗ indicate statistical significance at the 10%, 5%, and 1% levels, respectively.
Post 1 Year Post 3 Years
ln(CASH_PAY) ln(EQUITY_PAY) ln(CASH_PAY) ln(EQUITY_PAY)
1 2 3 4
UNIONIZATION −0.119** −0.143** −0.083* −0.107*(0.041) (0.048) (0.061) (0.079)
Firm and industry controls Yes Yes Yes YesIndustry and year dummies Yes Yes Yes Yes
R 2 0.625 0.533 0.597 0.503
Polynomial order Cubic Cubic Cubic Cubic
No. of obs. 398 398 1,114 1,114
Table 5 presents the RDD results from third-order (cubic) polynomial regres-sions. In all regressions, we control for the covariates used in the previous tests.In models 1 and 2, we examine CEO compensation in the first postelection year.The dependent variables are the natural logarithm of cash pay and the logarithmof equity pay, respectively. We find that the coefficients of UNIONIZATION, adummy equal to 1 if the election favors union representation, are negative andstatistically significant. In models 3 and 4, we examine CEO compensation in the3 postelection years and find similar results.7 In terms of economic significance,ceteris paribus, passing a union election leads to an average 8.3% decline in CEOcash pay and 10.7% decline in equity pay during the 3 postelection years. Theresults are qualitatively similar if we use other polynomial orders. Overall, theevidence presented in this subsection suggests that a union election win leads to adecline in CEO compensation, further corroborating a negative and causal effectof unionization on CEO compensation.
V. CEO Compensation around Contract Negotiations
A. Evidence from Total CEO CompensationBoth anecdotal and research evidence suggests that there are several ways
unions can affect CEO compensation (e.g., Ertimur et al. (2011)). In this sec-tion, we focus on one specific mechanism by examining total CEO compensationpatterns around union negotiations. The main purpose is to test whether firms
7It is noteworthy that the coefficient of unionization is negative and statistically significant whenexamining the cash component in Table 5, whereas the coefficient of the unionization rate is negativebut statistically insignificant when examining the cash component in Table 4. We are cautious aboutplacing too much importance on the difference in statistical significance, because it could very wellbe that unionization has a true underlying negative effect on the cash component in both settings.Nevertheless, one interpretation for the difference in results is that the experimental design in Table 5better controls for endogeneity and therefore more accurately reflects the causal effect of unionizationon cash compensation.
https://doi.org/10.1017/S0022109017000072D
ownloaded from
https://ww
w.cam
bridge.org/core . The University of Iow
a , on 08 Sep 2017 at 18:24:27 , subject to the Cambridge Core term
s of use, available at https://ww
w.cam
bridge.org/core/terms .
570 Journal of Financial and Quantitative Analysis
strategically curtail total CEO compensation prior to union contract negotiations(Hypothesis 2).
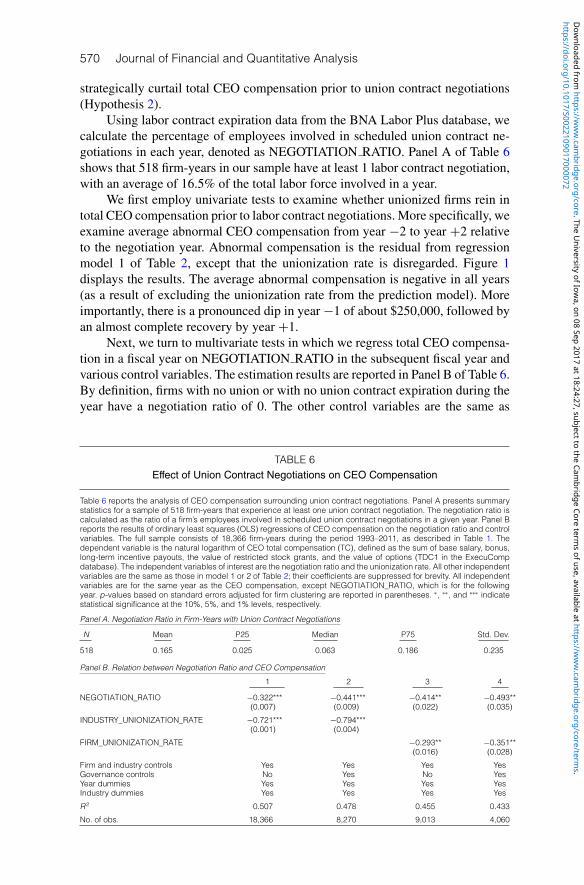
Using labor contract expiration data from the BNA Labor Plus database, wecalculate the percentage of employees involved in scheduled union contract ne-gotiations in each year, denoted as NEGOTIATION RATIO. Panel A of Table 6shows that 518 firm-years in our sample have at least 1 labor contract negotiation,with an average of 16.5% of the total labor force involved in a year.
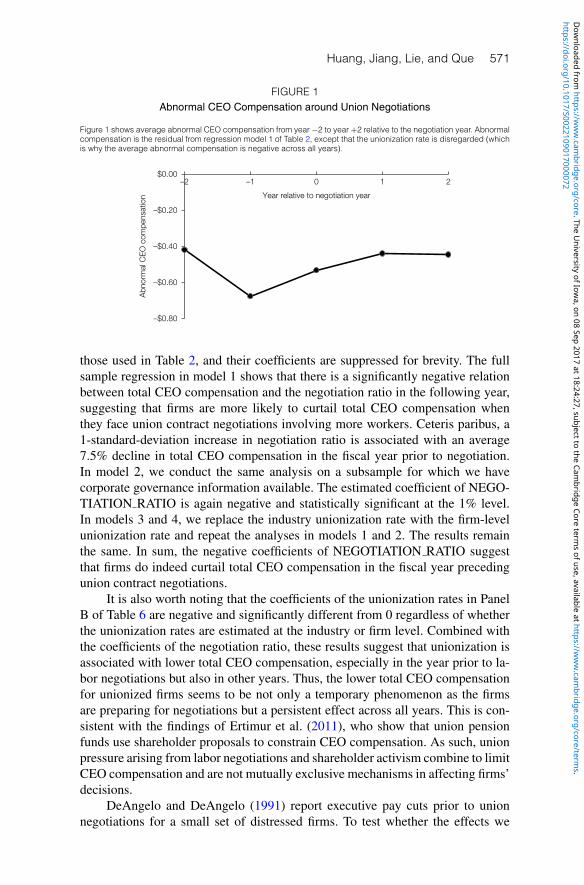
We first employ univariate tests to examine whether unionized firms rein intotal CEO compensation prior to labor contract negotiations. More specifically, weexamine average abnormal CEO compensation from year −2 to year +2 relativeto the negotiation year. Abnormal compensation is the residual from regressionmodel 1 of Table 2, except that the unionization rate is disregarded. Figure 1displays the results. The average abnormal compensation is negative in all years(as a result of excluding the unionization rate from the prediction model). Moreimportantly, there is a pronounced dip in year −1 of about $250,000, followed byan almost complete recovery by year +1.
Next, we turn to multivariate tests in which we regress total CEO compensa-tion in a fiscal year on NEGOTIATION RATIO in the subsequent fiscal year andvarious control variables. The estimation results are reported in Panel B of Table 6.By definition, firms with no union or with no union contract expiration during theyear have a negotiation ratio of 0. The other control variables are the same as
TABLE 6Effect of Union Contract Negotiations on CEO Compensation
Table 6 reports the analysis of CEO compensation surrounding union contract negotiations. Panel A presents summarystatistics for a sample of 518 firm-years that experience at least one union contract negotiation. The negotiation ratio iscalculated as the ratio of a firm’s employees involved in scheduled union contract negotiations in a given year. Panel Breports the results of ordinary least squares (OLS) regressions of CEO compensation on the negotiation ratio and controlvariables. The full sample consists of 18,366 firm-years during the period 1993–2011, as described in Table 1. Thedependent variable is the natural logarithm of CEO total compensation (TC), defined as the sum of base salary, bonus,long-term incentive payouts, the value of restricted stock grants, and the value of options (TDC1 in the ExecuCompdatabase). The independent variables of interest are the negotiation ratio and the unionization rate. All other independentvariables are the same as those in model 1 or 2 of Table 2; their coefficients are suppressed for brevity. All independentvariables are for the same year as the CEO compensation, except NEGOTIATION_RATIO, which is for the followingyear. p-values based on standard errors adjusted for firm clustering are reported in parentheses. ∗, ∗∗, and ∗∗∗ indicatestatistical significance at the 10%, 5%, and 1% levels, respectively.
Panel A. Negotiation Ratio in Firm-Years with Union Contract Negotiations
N Mean P25 Median P75 Std. Dev.
518 0.165 0.025 0.063 0.186 0.235
Panel B. Relation between Negotiation Ratio and CEO Compensation
1 2 3 4
NEGOTIATION_RATIO −0.322*** −0.441*** −0.414** −0.493**(0.007) (0.009) (0.022) (0.035)
INDUSTRY_UNIONIZATION_RATE −0.721*** −0.794***(0.001) (0.004)
FIRM_UNIONIZATION_RATE −0.293** −0.351**(0.016) (0.028)
Firm and industry controls Yes Yes Yes YesGovernance controls No Yes No YesYear dummies Yes Yes Yes YesIndustry dummies Yes Yes Yes Yes
R 2 0.507 0.478 0.455 0.433
No. of obs. 18,366 8,270 9,013 4,060
https://doi.org/10.1017/S0022109017000072D
ownloaded from
https://ww
w.cam
bridge.org/core . The University of Iow
a , on 08 Sep 2017 at 18:24:27 , subject to the Cambridge Core term
s of use, available at https://ww
w.cam
bridge.org/core/terms .
Huang, Jiang, Lie, and Que 571
FIGURE 1Abnormal CEO Compensation around Union Negotiations
Figure 1 shows average abnormal CEO compensation from year −2 to year +2 relative to the negotiation year. Abnormalcompensation is the residual from regression model 1 of Table 2, except that the unionization rate is disregarded (whichis why the average abnormal compensation is negative across all years).
–$0.80
–$0.60
–$0.40
–$0.20
$0.00–2 –1 0 1 2
Abn
orm
al C
EO
com
pens
atio
n Year relative to negotiation year
those used in Table 2, and their coefficients are suppressed for brevity. The fullsample regression in model 1 shows that there is a significantly negative relationbetween total CEO compensation and the negotiation ratio in the following year,suggesting that firms are more likely to curtail total CEO compensation whenthey face union contract negotiations involving more workers. Ceteris paribus, a1-standard-deviation increase in negotiation ratio is associated with an average7.5% decline in total CEO compensation in the fiscal year prior to negotiation.In model 2, we conduct the same analysis on a subsample for which we havecorporate governance information available. The estimated coefficient of NEGO-TIATION RATIO is again negative and statistically significant at the 1% level.In models 3 and 4, we replace the industry unionization rate with the firm-levelunionization rate and repeat the analyses in models 1 and 2. The results remainthe same. In sum, the negative coefficients of NEGOTIATION RATIO suggestthat firms do indeed curtail total CEO compensation in the fiscal year precedingunion contract negotiations.
It is also worth noting that the coefficients of the unionization rates in PanelB of Table 6 are negative and significantly different from 0 regardless of whetherthe unionization rates are estimated at the industry or firm level. Combined withthe coefficients of the negotiation ratio, these results suggest that unionization isassociated with lower total CEO compensation, especially in the year prior to la-bor negotiations but also in other years. Thus, the lower total CEO compensationfor unionized firms seems to be not only a temporary phenomenon as the firmsare preparing for negotiations but a persistent effect across all years. This is con-sistent with the findings of Ertimur et al. (2011), who show that union pensionfunds use shareholder proposals to constrain CEO compensation. As such, unionpressure arising from labor negotiations and shareholder activism combine to limitCEO compensation and are not mutually exclusive mechanisms in affecting firms’decisions.
DeAngelo and DeAngelo (1991) report executive pay cuts prior to unionnegotiations for a small set of distressed firms. To test whether the effects we
https://doi.org/10.1017/S0022109017000072D
ownloaded from
https://ww
w.cam
bridge.org/core . The University of Iow
a , on 08 Sep 2017 at 18:24:27 , subject to the Cambridge Core term
s of use, available at https://ww
w.cam
bridge.org/core/terms .
572 Journal of Financial and Quantitative Analysis
document are attributable to labor negotiations of financially distressed firms, weredo our analysis while excluding such firms. We define firms to be financiallydistressed if their Altman Z -scores are below 1.8 prior to labor contract negoti-ations. The results (not tabulated) are similar to those reported here for the fullsample, suggesting that we are not merely documenting an effect that is specificto negotiations during times of distress.
We also examine compensation for executives other than the CEO. We con-jecture that firms curtail not only CEO compensation but also that of other topexecutives prior to negotiations. Thus, we examine the annual compensation ofthe 5 highest-paid executives during the period surrounding union contract nego-tiations. Untabulated results indicate that top executives as a group experience atemporary curtailment in compensation prior to union contract negotiations.
B. The Cross-Sectional Variation in the Effect of Labor NegotiationsAnalogous to our analysis of the relation between unionization and total CEO
compensation, we explore the cross-sectional variation in the effects of union ne-gotiation on CEO compensation. In particular, we test whether the effect of ne-gotiation is more pronounced when the union has a strong bargaining position(Hypothesis 2a).
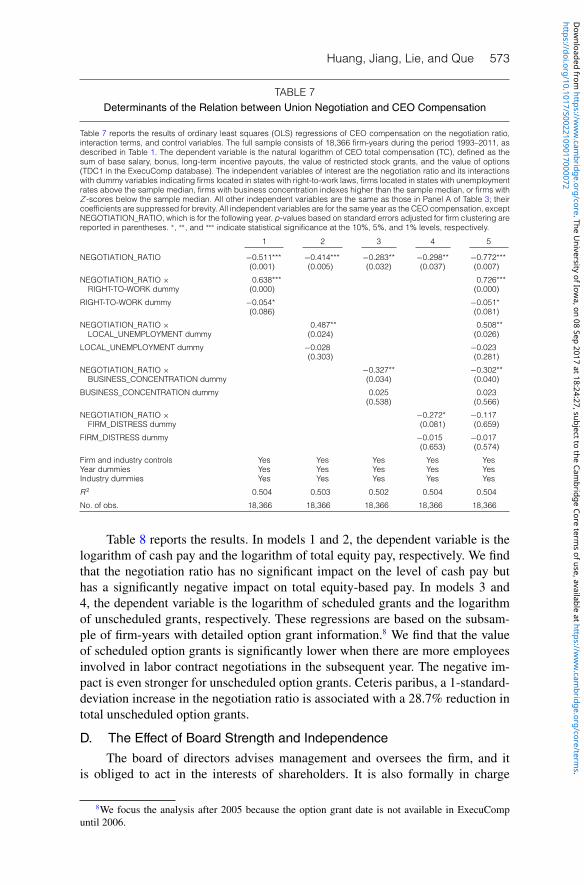
Table 7 presents our regression results. The choice of interaction variablesand the underlying logic are the same as in Table 3. We find that the negative rela-tion between labor negotiation and total CEO compensation is more pronouncedfor firms located in states with no right-to-work laws, for firms located in stateswith lower unemployment rates, and for firms with more concentrated businessoperations. The relation is likewise more pronounced for firms that are closer tofinancial distress. These results corroborate the claim that executive pay trendsaround union negotiations are designed to improve the firms’ bargaining situationvis-a-vis labor unions.
C. CEO Option Grants around Union Contract NegotiationsWe next study the pattern of different compensation components around
union negotiations. Based on Hypothesis 2b, we expect the empirical pattern tobe stronger for equity-based compensation. Moreover, because option grants rep-resent a key part of equity pay and the board often has significant leeway in bothhow many options to grant and when to grant these options, we examine individ-ual option grants most closely.
In practice, firms can issue stock options to CEOs on a scheduled or an un-scheduled basis. Lie (2005) and Heron and Lie (2007) find evidence that firmsopportunistically “time” unscheduled grants. This suggests that it is easier forfirms to manipulate CEO compensation prior to negotiations using unscheduledoption grants. Following the literature, we define option grants to be scheduled ifthey occur within 2 days of the 1-year anniversary of the prior year’s award date;if the grants do not occur within 2 days of this anniversary or if no options wereawarded during the prior year, they are defined as unscheduled. We then aggre-gate the value of scheduled or unscheduled options in each year using the valuereported by the company.
https://doi.org/10.1017/S0022109017000072D
ownloaded from
https://ww
w.cam
bridge.org/core . The University of Iow
a , on 08 Sep 2017 at 18:24:27 , subject to the Cambridge Core term
s of use, available at https://ww
w.cam
bridge.org/core/terms .
Huang, Jiang, Lie, and Que 573
TABLE 7Determinants of the Relation between Union Negotiation and CEO Compensation
Table 7 reports the results of ordinary least squares (OLS) regressions of CEO compensation on the negotiation ratio,interaction terms, and control variables. The full sample consists of 18,366 firm-years during the period 1993–2011, asdescribed in Table 1. The dependent variable is the natural logarithm of CEO total compensation (TC), defined as thesum of base salary, bonus, long-term incentive payouts, the value of restricted stock grants, and the value of options(TDC1 in the ExecuComp database). The independent variables of interest are the negotiation ratio and its interactionswith dummy variables indicating firms located in states with right-to-work laws, firms located in states with unemploymentrates above the sample median, firms with business concentration indexes higher than the sample median, or firms withZ -scores below the sample median. All other independent variables are the same as those in Panel A of Table 3; theircoefficients are suppressed for brevity. All independent variables are for the same year as the CEO compensation, exceptNEGOTIATION_RATIO, which is for the following year. p-values based on standard errors adjusted for firm clustering arereported in parentheses. ∗, ∗∗, and ∗∗∗ indicate statistical significance at the 10%, 5%, and 1% levels, respectively.
1 2 3 4 5
NEGOTIATION_RATIO −0.511*** −0.414*** −0.283** −0.298** −0.772***(0.001) (0.005) (0.032) (0.037) (0.007)
NEGOTIATION_RATIO × 0.638*** 0.726***RIGHT-TO-WORK dummy (0.000) (0.000)
RIGHT-TO-WORK dummy −0.054* −0.051*(0.086) (0.081)
NEGOTIATION_RATIO × 0.487** 0.508**LOCAL_UNEMPLOYMENT dummy (0.024) (0.026)
LOCAL_UNEMPLOYMENT dummy −0.028 −0.023(0.303) (0.281)
NEGOTIATION_RATIO × −0.327** −0.302**BUSINESS_CONCENTRATION dummy (0.034) (0.040)
BUSINESS_CONCENTRATION dummy 0.025 0.023(0.538) (0.566)
NEGOTIATION_RATIO × −0.272* −0.117FIRM_DISTRESS dummy (0.081) (0.659)
FIRM_DISTRESS dummy −0.015 −0.017(0.653) (0.574)
Firm and industry controls Yes Yes Yes Yes YesYear dummies Yes Yes Yes Yes YesIndustry dummies Yes Yes Yes Yes Yes
R 2 0.504 0.503 0.502 0.504 0.504
No. of obs. 18,366 18,366 18,366 18,366 18,366
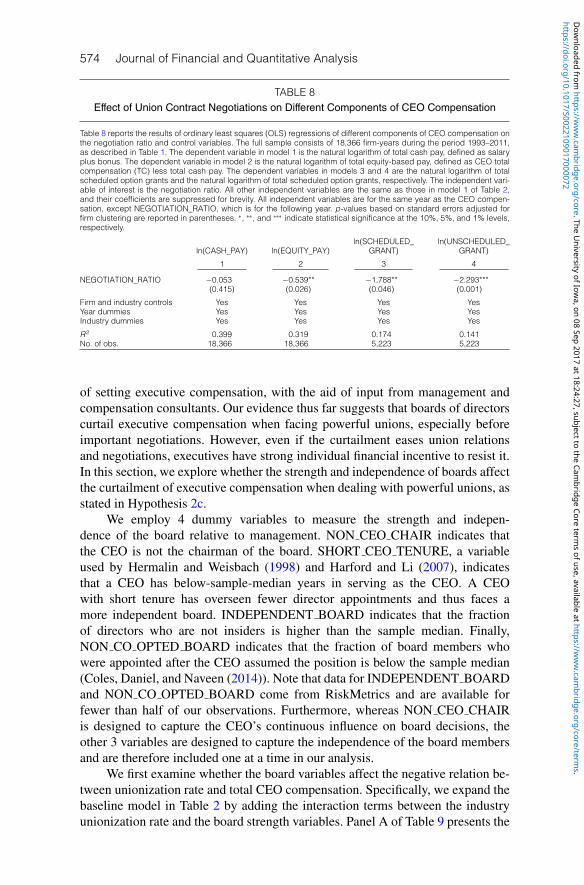
Table 8 reports the results. In models 1 and 2, the dependent variable is thelogarithm of cash pay and the logarithm of total equity pay, respectively. We findthat the negotiation ratio has no significant impact on the level of cash pay buthas a significantly negative impact on total equity-based pay. In models 3 and4, the dependent variable is the logarithm of scheduled grants and the logarithmof unscheduled grants, respectively. These regressions are based on the subsam-ple of firm-years with detailed option grant information.8 We find that the valueof scheduled option grants is significantly lower when there are more employeesinvolved in labor contract negotiations in the subsequent year. The negative im-pact is even stronger for unscheduled option grants. Ceteris paribus, a 1-standard-deviation increase in the negotiation ratio is associated with a 28.7% reduction intotal unscheduled option grants.
D. The Effect of Board Strength and IndependenceThe board of directors advises management and oversees the firm, and it
is obliged to act in the interests of shareholders. It is also formally in charge
8We focus the analysis after 2005 because the option grant date is not available in ExecuCompuntil 2006.
https://doi.org/10.1017/S0022109017000072D
ownloaded from
https://ww
w.cam
bridge.org/core . The University of Iow
a , on 08 Sep 2017 at 18:24:27 , subject to the Cambridge Core term
s of use, available at https://ww
w.cam
bridge.org/core/terms .
574 Journal of Financial and Quantitative Analysis
TABLE 8Effect of Union Contract Negotiations on Different Components of CEO Compensation
Table 8 reports the results of ordinary least squares (OLS) regressions of different components of CEO compensation onthe negotiation ratio and control variables. The full sample consists of 18,366 firm-years during the period 1993–2011,as described in Table 1. The dependent variable in model 1 is the natural logarithm of total cash pay, defined as salaryplus bonus. The dependent variable in model 2 is the natural logarithm of total equity-based pay, defined as CEO totalcompensation (TC) less total cash pay. The dependent variables in models 3 and 4 are the natural logarithm of totalscheduled option grants and the natural logarithm of total scheduled option grants, respectively. The independent vari-able of interest is the negotiation ratio. All other independent variables are the same as those in model 1 of Table 2,and their coefficients are suppressed for brevity. All independent variables are for the same year as the CEO compen-sation, except NEGOTIATION_RATIO, which is for the following year. p-values based on standard errors adjusted forfirm clustering are reported in parentheses. ∗, ∗∗, and ∗∗∗ indicate statistical significance at the 10%, 5%, and 1% levels,respectively.
ln(SCHEDULED_ ln(UNSCHEDULED_ln(CASH_PAY) ln(EQUITY_PAY) GRANT) GRANT)
1 2 3 4
NEGOTIATION_RATIO −0.053 −0.539** −1.788** −2.293***(0.415) (0.026) (0.046) (0.001)
Firm and industry controls Yes Yes Yes YesYear dummies Yes Yes Yes YesIndustry dummies Yes Yes Yes Yes
R 2 0.399 0.319 0.174 0.141No. of obs. 18,366 18,366 5,223 5,223
of setting executive compensation, with the aid of input from management andcompensation consultants. Our evidence thus far suggests that boards of directorscurtail executive compensation when facing powerful unions, especially beforeimportant negotiations. However, even if the curtailment eases union relationsand negotiations, executives have strong individual financial incentive to resist it.In this section, we explore whether the strength and independence of boards affectthe curtailment of executive compensation when dealing with powerful unions, asstated in Hypothesis 2c.
We employ 4 dummy variables to measure the strength and indepen-dence of the board relative to management. NON CEO CHAIR indicates thatthe CEO is not the chairman of the board. SHORT CEO TENURE, a variableused by Hermalin and Weisbach (1998) and Harford and Li (2007), indicatesthat a CEO has below-sample-median years in serving as the CEO. A CEOwith short tenure has overseen fewer director appointments and thus faces amore independent board. INDEPENDENT BOARD indicates that the fractionof directors who are not insiders is higher than the sample median. Finally,NON CO OPTED BOARD indicates that the fraction of board members whowere appointed after the CEO assumed the position is below the sample median(Coles, Daniel, and Naveen (2014)). Note that data for INDEPENDENT BOARDand NON CO OPTED BOARD come from RiskMetrics and are available forfewer than half of our observations. Furthermore, whereas NON CEO CHAIRis designed to capture the CEO’s continuous influence on board decisions, theother 3 variables are designed to capture the independence of the board membersand are therefore included one at a time in our analysis.
We first examine whether the board variables affect the negative relation be-tween unionization rate and total CEO compensation. Specifically, we expand thebaseline model in Table 2 by adding the interaction terms between the industryunionization rate and the board strength variables. Panel A of Table 9 presents the
https://doi.org/10.1017/S0022109017000072D
ownloaded from
https://ww
w.cam
bridge.org/core . The University of Iow
a , on 08 Sep 2017 at 18:24:27 , subject to the Cambridge Core term
s of use, available at https://ww
w.cam
bridge.org/core/terms .
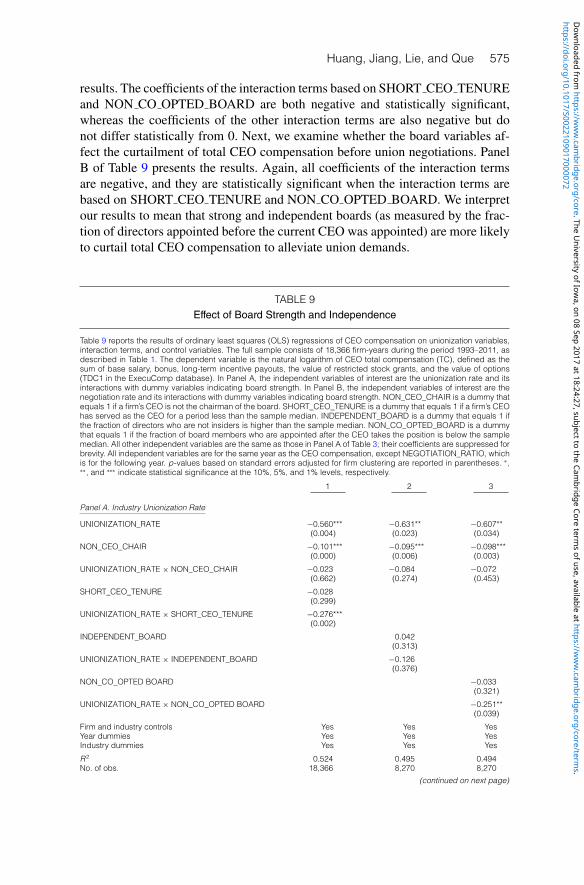
Huang, Jiang, Lie, and Que 575
results. The coefficients of the interaction terms based on SHORT CEO TENUREand NON CO OPTED BOARD are both negative and statistically significant,whereas the coefficients of the other interaction terms are also negative but donot differ statistically from 0. Next, we examine whether the board variables af-fect the curtailment of total CEO compensation before union negotiations. PanelB of Table 9 presents the results. Again, all coefficients of the interaction termsare negative, and they are statistically significant when the interaction terms arebased on SHORT CEO TENURE and NON CO OPTED BOARD. We interpretour results to mean that strong and independent boards (as measured by the frac-tion of directors appointed before the current CEO was appointed) are more likelyto curtail total CEO compensation to alleviate union demands.
TABLE 9Effect of Board Strength and Independence
Table 9 reports the results of ordinary least squares (OLS) regressions of CEO compensation on unionization variables,interaction terms, and control variables. The full sample consists of 18,366 firm-years during the period 1993–2011, asdescribed in Table 1. The dependent variable is the natural logarithm of CEO total compensation (TC), defined as thesum of base salary, bonus, long-term incentive payouts, the value of restricted stock grants, and the value of options(TDC1 in the ExecuComp database). In Panel A, the independent variables of interest are the unionization rate and itsinteractions with dummy variables indicating board strength. In Panel B, the independent variables of interest are thenegotiation rate and its interactions with dummy variables indicating board strength. NON_CEO_CHAIR is a dummy thatequals 1 if a firm’s CEO is not the chairman of the board. SHORT_CEO_TENURE is a dummy that equals 1 if a firm’s CEOhas served as the CEO for a period less than the sample median. INDEPENDENT_BOARD is a dummy that equals 1 ifthe fraction of directors who are not insiders is higher than the sample median. NON_CO_OPTED_BOARD is a dummythat equals 1 if the fraction of board members who are appointed after the CEO takes the position is below the samplemedian. All other independent variables are the same as those in Panel A of Table 3; their coefficients are suppressed forbrevity. All independent variables are for the same year as the CEO compensation, except NEGOTIATION_RATIO, whichis for the following year. p-values based on standard errors adjusted for firm clustering are reported in parentheses. ∗,∗∗, and ∗∗∗ indicate statistical significance at the 10%, 5%, and 1% levels, respectively.
1 2 3
Panel A. Industry Unionization Rate
UNIONIZATION_RATE −0.560*** −0.631** −0.607**(0.004) (0.023) (0.034)
NON_CEO_CHAIR −0.101*** −0.095*** −0.098***(0.000) (0.006) (0.003)
UNIONIZATION_RATE × NON_CEO_CHAIR −0.023 −0.084 −0.072(0.662) (0.274) (0.453)
SHORT_CEO_TENURE −0.028(0.299)
UNIONIZATION_RATE × SHORT_CEO_TENURE −0.276***(0.002)
INDEPENDENT_BOARD 0.042(0.313)
UNIONIZATION_RATE × INDEPENDENT_BOARD −0.126(0.376)
NON_CO_OPTED BOARD −0.033(0.321)
UNIONIZATION_RATE × NON_CO_OPTED BOARD −0.251**(0.039)
Firm and industry controls Yes Yes YesYear dummies Yes Yes YesIndustry dummies Yes Yes Yes
R 2 0.524 0.495 0.494No. of obs. 18,366 8,270 8,270
(continued on next page)
https://doi.org/10.1017/S0022109017000072D
ownloaded from
https://ww
w.cam
bridge.org/core . The University of Iow
a , on 08 Sep 2017 at 18:24:27 , subject to the Cambridge Core term
s of use, available at https://ww
w.cam
bridge.org/core/terms .
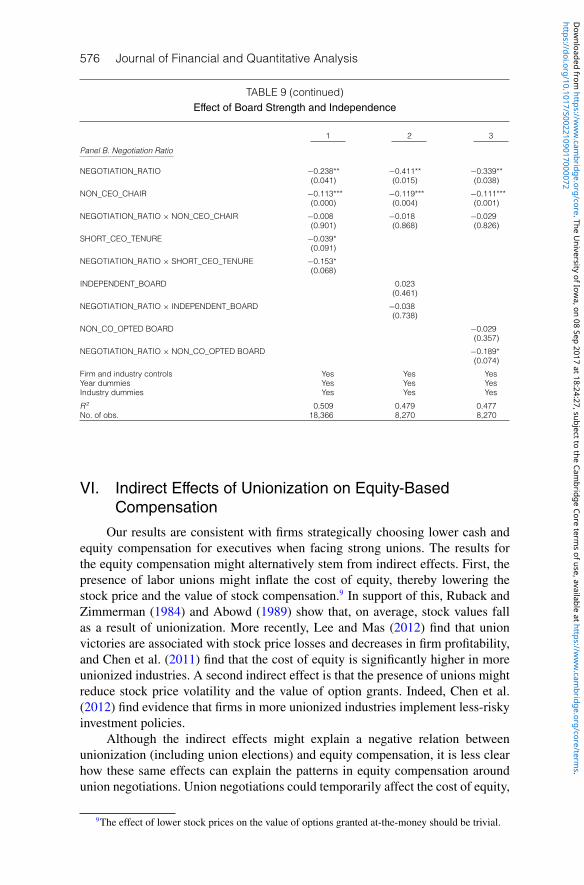
576 Journal of Financial and Quantitative Analysis
TABLE 9 (continued)Effect of Board Strength and Independence
1 2 3
Panel B. Negotiation Ratio
NEGOTIATION_RATIO −0.238** −0.411** −0.339**(0.041) (0.015) (0.038)
NON_CEO_CHAIR −0.113*** −0.119*** −0.111***(0.000) (0.004) (0.001)
NEGOTIATION_RATIO × NON_CEO_CHAIR −0.008 −0.018 −0.029(0.901) (0.868) (0.826)
SHORT_CEO_TENURE −0.039*(0.091)
NEGOTIATION_RATIO × SHORT_CEO_TENURE −0.153*(0.068)
INDEPENDENT_BOARD 0.023(0.461)
NEGOTIATION_RATIO × INDEPENDENT_BOARD −0.038(0.738)
NON_CO_OPTED BOARD −0.029(0.357)
NEGOTIATION_RATIO × NON_CO_OPTED BOARD −0.189*(0.074)
Firm and industry controls Yes Yes YesYear dummies Yes Yes YesIndustry dummies Yes Yes Yes
R 2 0.509 0.479 0.477No. of obs. 18,366 8,270 8,270
VI. Indirect Effects of Unionization on Equity-BasedCompensation
Our results are consistent with firms strategically choosing lower cash andequity compensation for executives when facing strong unions. The results forthe equity compensation might alternatively stem from indirect effects. First, thepresence of labor unions might inflate the cost of equity, thereby lowering thestock price and the value of stock compensation.9 In support of this, Ruback andZimmerman (1984) and Abowd (1989) show that, on average, stock values fallas a result of unionization. More recently, Lee and Mas (2012) find that unionvictories are associated with stock price losses and decreases in firm profitability,and Chen et al. (2011) find that the cost of equity is significantly higher in moreunionized industries. A second indirect effect is that the presence of unions mightreduce stock price volatility and the value of option grants. Indeed, Chen et al.(2012) find evidence that firms in more unionized industries implement less-riskyinvestment policies.
Although the indirect effects might explain a negative relation betweenunionization (including union elections) and equity compensation, it is less clearhow these same effects can explain the patterns in equity compensation aroundunion negotiations. Union negotiations could temporarily affect the cost of equity,
9The effect of lower stock prices on the value of options granted at-the-money should be trivial.
https://doi.org/10.1017/S0022109017000072D
ownloaded from
https://ww
w.cam
bridge.org/core . The University of Iow
a , on 08 Sep 2017 at 18:24:27 , subject to the Cambridge Core term
s of use, available at https://ww
w.cam
bridge.org/core/terms .
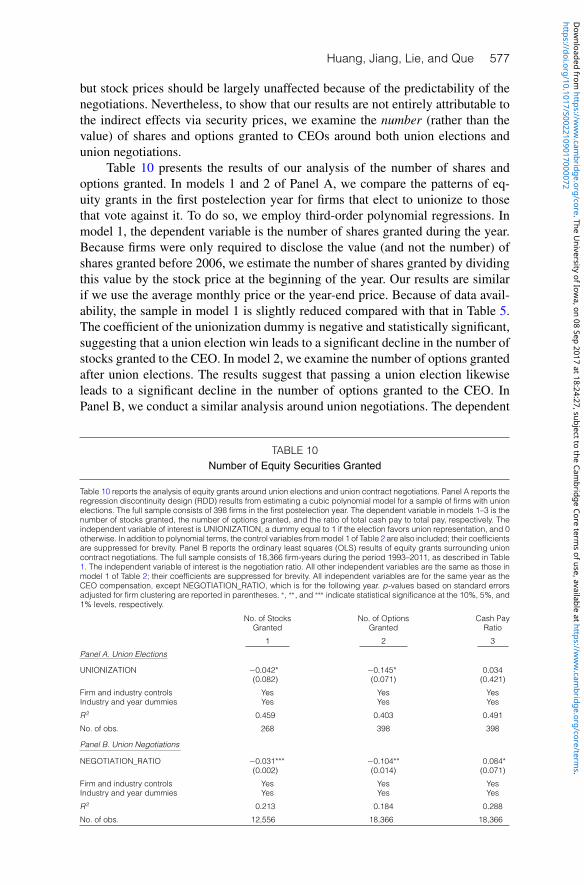
Huang, Jiang, Lie, and Que 577
but stock prices should be largely unaffected because of the predictability of thenegotiations. Nevertheless, to show that our results are not entirely attributable tothe indirect effects via security prices, we examine the number (rather than thevalue) of shares and options granted to CEOs around both union elections andunion negotiations.
Table 10 presents the results of our analysis of the number of shares andoptions granted. In models 1 and 2 of Panel A, we compare the patterns of eq-uity grants in the first postelection year for firms that elect to unionize to thosethat vote against it. To do so, we employ third-order polynomial regressions. Inmodel 1, the dependent variable is the number of shares granted during the year.Because firms were only required to disclose the value (and not the number) ofshares granted before 2006, we estimate the number of shares granted by dividingthis value by the stock price at the beginning of the year. Our results are similarif we use the average monthly price or the year-end price. Because of data avail-ability, the sample in model 1 is slightly reduced compared with that in Table 5.The coefficient of the unionization dummy is negative and statistically significant,suggesting that a union election win leads to a significant decline in the number ofstocks granted to the CEO. In model 2, we examine the number of options grantedafter union elections. The results suggest that passing a union election likewiseleads to a significant decline in the number of options granted to the CEO. InPanel B, we conduct a similar analysis around union negotiations. The dependent
TABLE 10Number of Equity Securities Granted
Table 10 reports the analysis of equity grants around union elections and union contract negotiations. Panel A reports theregression discontinuity design (RDD) results from estimating a cubic polynomial model for a sample of firms with unionelections. The full sample consists of 398 firms in the first postelection year. The dependent variable in models 1–3 is thenumber of stocks granted, the number of options granted, and the ratio of total cash pay to total pay, respectively. Theindependent variable of interest is UNIONIZATION, a dummy equal to 1 if the election favors union representation, and 0otherwise. In addition to polynomial terms, the control variables frommodel 1 of Table 2 are also included; their coefficientsare suppressed for brevity. Panel B reports the ordinary least squares (OLS) results of equity grants surrounding unioncontract negotiations. The full sample consists of 18,366 firm-years during the period 1993–2011, as described in Table1. The independent variable of interest is the negotiation ratio. All other independent variables are the same as those inmodel 1 of Table 2; their coefficients are suppressed for brevity. All independent variables are for the same year as theCEO compensation, except NEGOTIATION_RATIO, which is for the following year. p-values based on standard errorsadjusted for firm clustering are reported in parentheses. ∗, ∗∗, and ∗∗∗ indicate statistical significance at the 10%, 5%, and1% levels, respectively.
No. of Stocks No. of Options Cash PayGranted Granted Ratio
1 2 3
Panel A. Union Elections
UNIONIZATION −0.042* −0.145* 0.034(0.082) (0.071) (0.421)
Firm and industry controls Yes Yes YesIndustry and year dummies Yes Yes Yes
R 2 0.459 0.403 0.491
No. of obs. 268 398 398
Panel B. Union Negotiations
NEGOTIATION_RATIO −0.031*** −0.104** 0.084*(0.002) (0.014) (0.071)
Firm and industry controls Yes Yes YesIndustry and year dummies Yes Yes Yes
R 2 0.213 0.184 0.288
No. of obs. 12,556 18,366 18,366
https://doi.org/10.1017/S0022109017000072D
ownloaded from
https://ww
w.cam
bridge.org/core . The University of Iow
a , on 08 Sep 2017 at 18:24:27 , subject to the Cambridge Core term
s of use, available at https://ww
w.cam
bridge.org/core/terms .
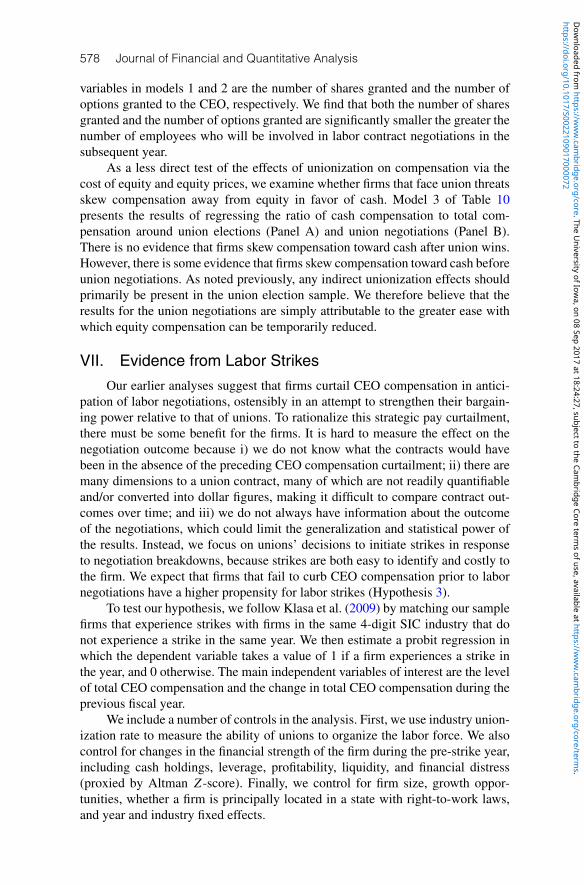
578 Journal of Financial and Quantitative Analysis
variables in models 1 and 2 are the number of shares granted and the number ofoptions granted to the CEO, respectively. We find that both the number of sharesgranted and the number of options granted are significantly smaller the greater thenumber of employees who will be involved in labor contract negotiations in thesubsequent year.
As a less direct test of the effects of unionization on compensation via thecost of equity and equity prices, we examine whether firms that face union threatsskew compensation away from equity in favor of cash. Model 3 of Table 10presents the results of regressing the ratio of cash compensation to total com-pensation around union elections (Panel A) and union negotiations (Panel B).There is no evidence that firms skew compensation toward cash after union wins.However, there is some evidence that firms skew compensation toward cash beforeunion negotiations. As noted previously, any indirect unionization effects shouldprimarily be present in the union election sample. We therefore believe that theresults for the union negotiations are simply attributable to the greater ease withwhich equity compensation can be temporarily reduced.
VII. Evidence from Labor StrikesOur earlier analyses suggest that firms curtail CEO compensation in antici-
pation of labor negotiations, ostensibly in an attempt to strengthen their bargain-ing power relative to that of unions. To rationalize this strategic pay curtailment,there must be some benefit for the firms. It is hard to measure the effect on thenegotiation outcome because i) we do not know what the contracts would havebeen in the absence of the preceding CEO compensation curtailment; ii) there aremany dimensions to a union contract, many of which are not readily quantifiableand/or converted into dollar figures, making it difficult to compare contract out-comes over time; and iii) we do not always have information about the outcomeof the negotiations, which could limit the generalization and statistical power ofthe results. Instead, we focus on unions’ decisions to initiate strikes in responseto negotiation breakdowns, because strikes are both easy to identify and costly tothe firm. We expect that firms that fail to curb CEO compensation prior to labornegotiations have a higher propensity for labor strikes (Hypothesis 3).
To test our hypothesis, we follow Klasa et al. (2009) by matching our samplefirms that experience strikes with firms in the same 4-digit SIC industry that donot experience a strike in the same year. We then estimate a probit regression inwhich the dependent variable takes a value of 1 if a firm experiences a strike inthe year, and 0 otherwise. The main independent variables of interest are the levelof total CEO compensation and the change in total CEO compensation during theprevious fiscal year.
We include a number of controls in the analysis. First, we use industry union-ization rate to measure the ability of unions to organize the labor force. We alsocontrol for changes in the financial strength of the firm during the pre-strike year,including cash holdings, leverage, profitability, liquidity, and financial distress(proxied by Altman Z -score). Finally, we control for firm size, growth oppor-tunities, whether a firm is principally located in a state with right-to-work laws,and year and industry fixed effects.
https://doi.org/10.1017/S0022109017000072D
ownloaded from
https://ww
w.cam
bridge.org/core . The University of Iow
a , on 08 Sep 2017 at 18:24:27 , subject to the Cambridge Core term
s of use, available at https://ww
w.cam
bridge.org/core/terms .
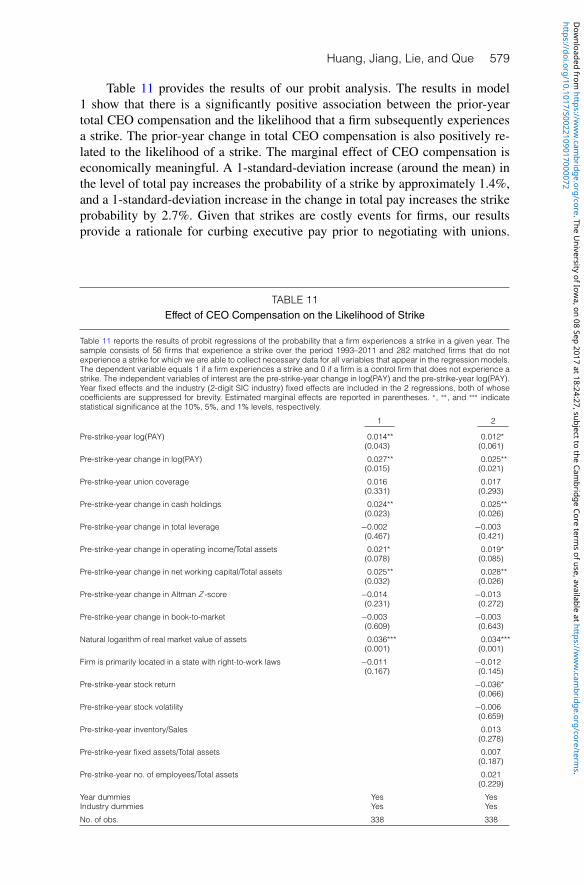
Huang, Jiang, Lie, and Que 579
Table 11 provides the results of our probit analysis. The results in model1 show that there is a significantly positive association between the prior-yeartotal CEO compensation and the likelihood that a firm subsequently experiencesa strike. The prior-year change in total CEO compensation is also positively re-lated to the likelihood of a strike. The marginal effect of CEO compensation iseconomically meaningful. A 1-standard-deviation increase (around the mean) inthe level of total pay increases the probability of a strike by approximately 1.4%,and a 1-standard-deviation increase in the change in total pay increases the strikeprobability by 2.7%. Given that strikes are costly events for firms, our resultsprovide a rationale for curbing executive pay prior to negotiating with unions.
TABLE 11Effect of CEO Compensation on the Likelihood of Strike
Table 11 reports the results of probit regressions of the probability that a firm experiences a strike in a given year. Thesample consists of 56 firms that experience a strike over the period 1993–2011 and 282 matched firms that do notexperience a strike for which we are able to collect necessary data for all variables that appear in the regression models.The dependent variable equals 1 if a firm experiences a strike and 0 if a firm is a control firm that does not experience astrike. The independent variables of interest are the pre-strike-year change in log(PAY) and the pre-strike-year log(PAY).Year fixed effects and the industry (2-digit SIC industry) fixed effects are included in the 2 regressions, both of whosecoefficients are suppressed for brevity. Estimated marginal effects are reported in parentheses. ∗, ∗∗, and ∗∗∗ indicatestatistical significance at the 10%, 5%, and 1% levels, respectively.
1 2
Pre-strike-year log(PAY) 0.014** 0.012*(0.043) (0.061)
Pre-strike-year change in log(PAY) 0.027** 0.025**(0.015) (0.021)
Pre-strike-year union coverage 0.016 0.017(0.331) (0.293)
Pre-strike-year change in cash holdings 0.024** 0.025**(0.023) (0.026)
Pre-strike-year change in total leverage −0.002 −0.003(0.467) (0.421)
Pre-strike-year change in operating income/Total assets 0.021* 0.019*(0.078) (0.085)
Pre-strike-year change in net working capital/Total assets 0.025** 0.028**(0.032) (0.026)
Pre-strike-year change in Altman Z -score −0.014 −0.013(0.231) (0.272)
Pre-strike-year change in book-to-market −0.003 −0.003(0.609) (0.643)
Natural logarithm of real market value of assets 0.036*** 0.034***(0.001) (0.001)
Firm is primarily located in a state with right-to-work laws −0.011 −0.012(0.167) (0.145)
Pre-strike-year stock return −0.036*(0.066)
Pre-strike-year stock volatility −0.006(0.659)
Pre-strike-year inventory/Sales 0.013(0.278)
Pre-strike-year fixed assets/Total assets 0.007(0.187)
Pre-strike-year no. of employees/Total assets 0.021(0.229)
Year dummies Yes YesIndustry dummies Yes Yes
No. of obs. 338 338
https://doi.org/10.1017/S0022109017000072D
ownloaded from
https://ww
w.cam
bridge.org/core . The University of Iow
a , on 08 Sep 2017 at 18:24:27 , subject to the Cambridge Core term
s of use, available at https://ww
w.cam
bridge.org/core/terms .
580 Journal of Financial and Quantitative Analysis
That is, the failure to curb CEO compensation increases the probability of a break-down in labor negotiations and a labor strike.
Turning to our control variables, we find that the estimated coefficients aregenerally consistent with previous studies. Notably, firms experiencing increasesin cash holdings, profitability, and liquidity are subsequently more likely to havestrikes (DeAngelo and DeAngelo (1991), Cramton and Tracy (1992), and Klasaet al. (2009)). Finally, in the second model, we control for more variables, in-cluding stock performance, stock return volatility, inventory ratio, and capitaland labor intensity (Tracy (1986)). The results shown in the first model remainunaffected.
VIII. ConclusionWe find a significantly negative relation between executive compensation
and unionization. The negative association is more pronounced for firms locatedin states with no right-to-work laws, for firms located in states with lower un-employment rates, for firms with more concentrated business, and for firms thatare closer to financial distress. Furthermore, we find that passing a union electionleads to a reduction in total CEO compensation. These findings suggest that thenegative relation between CEO compensation and unionization rates is, at leastpartially, attributable to union pressure to constrain CEO compensation.
We next examine total CEO compensation around union contract expira-tions. We find that unionized firms curtail CEO compensation in the fiscal yearpreceding union contract negotiations. Moreover, the curtailment is greater whenthe unions are strong and when lower CEO compensation represents credible evi-dence that the firm cannot concede to union demands. We also find that the declineof executive compensation in the fiscal year preceding union contract negotiationsis most evident for option grants, particularly for grants that are unscheduled.
Finally, we find that firms with higher total CEO compensation or with recentincreases in total CEO compensation prior to labor negotiations are more likelyto experience union strikes. This shows that labor unions respond to the levelof executive compensation, thereby providing a rationale for firms to use CEOcompensation as a strategic tool in their interactions with labor unions.
Our study adds to the understanding of how strategic considerations aris-ing from collective bargaining between a firm and its labor unions affect corpo-rate policy. In addition to manipulating actual financial flexibility, which mightthreaten a firm’s viability, firms also use CEO compensation to improve their bar-gaining position with unions. In this sense, executive compensation is used notonly to incentivize executives but also to create goodwill among constituenciesand/or signal firm prospects to less-informed parties.
ReferencesAbowd, J. M. “The Effect of Wage Bargains on the Stock Market Value of the Firm.” American
Economic Review, 79 (1989), 774–800.Adams, J. “Inequity in Social Exchange.” In Advances in Experimental Social Psychology, Vol. 2, L.
Berkowitz, ed. New York, NY: Academic Press (1965), 267–299.Akerlof, G., and J. Yellen. “The Fair Wage-Effort Hypothesis and Unemployment.” Quarterly Journal
of Economics, 105 (1990), 255–283.
https://doi.org/10.1017/S0022109017000072D
ownloaded from
https://ww
w.cam
bridge.org/core . The University of Iow
a , on 08 Sep 2017 at 18:24:27 , subject to the Cambridge Core term
s of use, available at https://ww
w.cam
bridge.org/core/terms .
Huang, Jiang, Lie, and Que 581
Banning, K., and T. Chiles. “Trade-Offs in the Labor Union-CEO Compensation Relationship.” Jour-nal of Labor Research, 28 (2007), 347–357.
Bhagat, S., and R. Romano. “Reforming Executive Compensation: Focusing and Committing to theLong-Term.” Yale Journal on Regulation, 26 (2009), 359–372.
Bova, F. “Labor Unions and Management’s Incentive to Signal a Negative Outlook.” ContemporaryAccounting Research, 30 (2013), 14–41.
Bowen, R.; L. DuCharme; and D. Shores. “Shareholders’ Implicit Claims and Accounting MethodChoice.” Journal of Accounting and Economics, 20 (1995), 255–295.
Bradley, D.; I. Kim; and X. Tian. “The Causal Effect of Labor Unions on Innovation.” Working Paper,Indiana University (2013).
Bronars, S., and D. Deere. “The Threat of Unionization, the Use of Debt, and the Preservation ofShareholder Wealth.” Quarterly Journal of Economics, 106 (1991), 231–254.
Chen, J.; M. Kacperczyk; and H. Ortiz-Molina. “Labor Unions, Operating Flexibility, and the Cost ofEquity.” Journal of Financial and Quantitative Analysis, 46 (2011), 25–58.
Chen, J.; M. Kacperczyk; and H. Ortiz-Molina. “Do Non-Financial Stakeholders Affect the Pricing ofRisky Debt? Evidence from Unionized Workers.” Review of Finance, 16 (2012), 347–383.
Chyz, J.; W. Leung; O. Li; and O. Rui. “Labor Unions and Tax Aggressiveness.” Journal of FinancialEconomics, 108 (2013), 675–698.
Coles, J.; N. Daniel; and L. Naveen. “Co-Opted Boards.” Review of Financial Studies, 27 (2014),1751–1796.
Comprix, J., and K. Muller III. “Pension Plan Accounting Estimates and the Freezing of DefinedBenefit Pension Plans.” Journal of Accounting and Economics, 51 (2011), 115–133.
Core, J.; W. Guay; and D. Larcker. “The Power of the Pen and Executive Compensation.” Journal ofFinancial Economics, 88 (2008), 1–25.
Core, J.; R. Holthausen; and D. Larcker. “Corporate Governance, Chief Executive Officer Compensa-tion, and Firm Performance.” Journal of Financial Economics, 51 (1999), 371–406.
Cramton, P., and J. Tracy. “Strikes and Holdouts in Wage Bargaining: Theory and Data.” AmericanEconomic Review, 82 (1992), 100–121.
Cullinan, C., and J. Knoblett. “Unionization and Accounting Policy Choice: An Empirical Examina-tion.” Journal of Accounting and Public Policy, 13 (1994), 49–78.
Cunat, V.; M. Gine; and M. Guadalupe. “The Vote Is Cast: The Effect of Corporate Governance onShareholder Value.” Journal of Finance, 67 (2012), 1943–1977.
Custodio, C.; M. Ferreira; and P. Matos. “Generalists vs. Specialists: Lifetime Work Experience andCEO Pay.” Journal of Financial Economics, 108 (2013), 471–492.
DeAngelo, H., and L. DeAngelo. “Union Negotiations and Corporate Policy: A Study of Labor Con-cessions in the Domestic Steel Industry during the 1980s.” Journal of Financial Economics, 30(1991), 3–43.
Dial, J., and K. Murphy. “Incentives, Downsizing, and Value Creation at General Dynamics.” Journalof Financial Economics, 37 (1995), 261–314.
DiNardo, J. K., and D. S. Lee. “Economic Impacts of New Unionization on Private Sector Employers:1984–2001.” Quarterly Journal of Economics, 119 (2004), 1383–1441.
D’Souza, J.; J. Jacob; and K. Ramesh. “The Use of Accounting Flexibility to Reduce Labor Renego-tiation Costs and Manage Earnings.” Journal of Accounting and Economics, 30 (2000), 187–208.
Eldenburg, L., and R. Krishnan. “Public versus Private Governance: A Study of Incentives and Oper-ational Performance.” Journal of Accounting and Economics, 35 (2003), 377–404.
Ertimur, Y.; F. Ferri; and V. Muslu. “Shareholder Activism and CEO Pay.” Review of Financial Studies,24 (2011), 535–592.
Fama, E. F., and J. D. MacBeth. “Risk, Return, and Equilibrium: Empirical Tests.” Journal of PoliticalEconomy, 81 (1973), 607–636.
Hanka, G. “Debt and the Terms of Employment.” Journal of Financial Economics, 48 (1998),245–282.
Harford, J., and K. Li. “Decoupling CEO Wealth and Firm Performance: The Case of AcquiringCEOs.” Journal of Finance, 62 (2007), 917–949.
Hermalin, B. E., and M. Weisbach. “Endogenously Chosen Boards of Directors and Their Monitoringof the CEO.” American Economic Review, 88 (1998), 96–118.
Heron, R., and E. Lie. “Does Backdating Explain the Stock Price Pattern around Executive StockOption Grants?” Journal of Financial Economics, 83 (2007), 271–295.
Hirsch, B. T. “Firm Investment Behavior and Collective Bargaining Strategy.” Industrial Relations, 31(1992), 95–121.
Jensen, M., and K. Murphy. “Performance Pay and Top-Management Incentives.” Journal of PoliticalEconomy, 98 (1990), 225–264.
https://doi.org/10.1017/S0022109017000072D
ownloaded from
https://ww
w.cam
bridge.org/core . The University of Iow
a , on 08 Sep 2017 at 18:24:27 , subject to the Cambridge Core term
s of use, available at https://ww
w.cam
bridge.org/core/terms .
582 Journal of Financial and Quantitative Analysis
Joskow, P.; N. Rose; and C. Wolfram. “Political Constraints on Executive Compensation: Evidencefrom the Electric Utility Industry.” Rand Journal of Economic, 27 (1996), 165–182.
Klasa, S.; W. Maxwell; and H. Ortiz-Molina. “The Strategic Use of Corporate Cash Holdings inCollective Bargaining with Labor Unions.” Journal of Financial Economics, 92 (2009), 421–442.
Lee, D., and T. Lemieux. “Regression Discontinuity Designs in Economics.” Journal of EconomicLiterature, 48 (2010), 281–355.
Lee, D., and A. Mas. “Long-Run Impacts of Unions on Firms: New Evidence from Financial Markets,1961–1999.” Quarterly Journal of Economics, 127 (2012), 333–378.
Liberty, S., and J. Zimmerman. “Labor Union Contract Negotiations and Accounting Choices.”Accounting Review, 61 (1986), 692–712.
Lie, E. “On the Timing of CEO Stock Option Awards.” Management Science, 51 (2005), 802–812.Martin, D. L. “The Agency Problem in a Nonproprietary Theory of Union Behavior.” In The Eco-
nomics of Trade Unions: New Directions, J.-J. Rosa, ed. Boston, MA: Kluwer-Nijhoff (1984),191–220.
Matsa, D. “Capital Structure as a Strategic Variable: Evidence from Collective Bargaining.” Journalof Finance, 65 (2010), 1197–1232.
Murphy, K. J. “Executive Compensation.” In Handbook of Labor Economics, Vol. 3, O. Ashenfelterand D. Card, eds. Amsterdam, Netherlands: Elsevier (1999), 2485–2563.
Murphy, K. J. “Executive Compensation: Where We Are, and How We Got There.” In Handbook of theEconomics of Finance, G. Constantinides, M. Harris, and R. Stulz, eds. Amsterdam, Netherlands:North Holland (2012), 211–356.
Pfeffer, J., and N. Langton. “The Effect of Wage Dispersion on Satisfaction, Productivity, and WorkingCollaboratively: Evidence from College and University Faculty.” Administrative Science Quar-terly, 38 (1993), 382–407.
Rose, D. “Are Strikes Less Effective in Conglomerate Firms?” Industrial and Labor Relations Review,45 (1991), 131–144.
Ross, A. Trade Union Wage Policy. Berkeley, CA: University of California Press (1948).Ruback, R., and M. Zimmerman. “Unionization and Profitability: Evidence from the Capital Market.”
Journal of Political Economy, 92 (1984), 1134–1157.Sheppard, B.; R. Lewicki; and J. Minton. Organizational Justice: The Search for Fairness in the Work-
place. New York, NY: Lexington Books (1992).Singh, P., and N. Agarwal. “Union Presence and Executive Compensation: An Exploratory Study.”
Journal of Labor Research, 23 (2002), 631–646.Tracy, J. S. “An Investigation into the Determinants of U.S. Strike Activity.” American Economic
Review, 76 (1986), 423–436.
https://doi.org/10.1017/S0022109017000072D
ownloaded from
https://ww
w.cam
bridge.org/core . The University of Iow
a , on 08 Sep 2017 at 18:24:27 , subject to the Cambridge Core term
s of use, available at https://ww
w.cam
bridge.org/core/terms .