Embed Size (px)
Citation preview
Loughborough UniversityInstitutional Repository
The effect of lateral pressureon anchorage bond inlightweight aggregate
concrete
This item was submitted to Loughborough University's Institutional Repositoryby the/an author.
Additional Information:
• A Doctoral Thesis. Submitted in partial fulfilment of the requirementsfor the award of Doctor of Philosophy of Loughborough University.
Metadata Record: https://dspace.lboro.ac.uk/2134/25596
Publisher: c© Ian Guy Standish
Rights: This work is made available according to the conditions of the Cre-ative Commons Attribution-NonCommercial-NoDerivatives 4.0 International(CC BY-NC-ND 4.0) licence. Full details of this licence are available at:https://creativecommons.org/licenses/by-nc-nd/4.0/
Please cite the published version.
,:.l,
,';
. ~- .. < •
/3 l-l-ZDI'/6.'--»{;l;6&L!8:-3
LOUGHBOROUGH UNIVERSITY OF TECHNOLOGY
LIBRARY
AUTHOR/FILING TITLE
,
I . 5-r A,.a!;l)\ S H I G-:--------------------------~------------------
1------~--- ---------------------- --- ------------- -~ 1 ACCESSION/COPY NO.
______________ , ___ J_2:_~ ?-:"7.-'J.j':_~ ________ ----- --VOL. NO. CLASS MARK
I ( L- c.i?'-( 2~\( ~6 • •
! - 1 jUL 1988 lit Afil< Ul98
11 3 /) J i:J " 1989---. ij 1\
1 ItOEC 1995 l! , 2 JAM \996 r - 1 JIII 1~RR I'
O~199 1I
r - 3 i~ \995 I. .--- - - -- .. _- ---- --~ -----~
) - .'
,
- . ;
.-

THE EFFECT OF LATERAL PRESSURE ON ANCHORAGE
BOND IN LIGHTWEIGHT AGGREGATE CONCRETE.
by
IAN GUY STANDISH, B. Sc.
A Doctoral Thesis submitted in partial fulfilment of the
requirements for the Award of the Doctor of Philosophy of
the Loughborough University of Technology.
September 1982
@ 'by Ian Guy Standish 1982.
\
l,o.o.Jghborougr. : !rd"'~;"ltlt ..
• f T -:;chr.;.' 'i ..• '; .' y ---, .. , ----•.• Nw '5-1-______ .H' •• ____ ~
Class
4cc. :t.!o.
f
ACKNOWLEDGEMENTS
The author would like to thank Dr. p.J. Robins
for his friendly guidance and encouragement throughout the
course of this research.
My sincere thanks to Professors L.L. Jones, my
Director of Research, and G.C. Brock, Head of Department, for
their criticisms and helpful comments during the practical
work. Thanks are also due to the technical staff of the
Department of Ci viI Engineering, especially Mr. P. Bonser,
for their cheerful and enthusiastic assistance in the laboratory.
Finally my gratitude extends to those who assisted
in the completion of this thesis; Mrs. E. Tivey for her
typing and Miss C.S. Blench for proof reading the manuscript.
The financial support of the S.E.R.C. is gratefully
acknowledged.
i
ii
SYNOPSIS
This research examines the effect of lateral pressures
on the bond characteristics of both plain and deformed reinforcing
bars in lightweight aggregate (Lytag) concrete, Two common bond
tests, the cube pull-out and the semi-beam test, were modified in
order that lateral pressures could be applied to the bond specimens,
The major variables studied were the magnitude of the lateral pressure,
the bar diameter, the length of embedment and the concrete strength,
The results of over 200 bond tests show that for round
bars the application of a lateral pressure close to the cube-strength
of the concrete can result in an increase in pull-out load of as
much as 260% and that for similar sized deformed bars the
corresponding increase is about 75%, The different bond mechanisms
for round and deformed bars were highlighted by the failure modes
of the bond specimens and this difference in behaviour is reflected
in the theoretical work by a frictional bond strength criterion for
round bars and a splitting. or shearing criterion for deformed bars,
As part of the experimental work a reinforcing bar was
fully strain-gauged, enabling the strain distribution along the bar
to be monitored for various combinations of lateral pressure and pull
out loads, The bond stress was found to be uniformly distributed
along the bar for pull-out loads greater than about half the ultimate
and the strain distribution relatively unaffected by increasing
lateral pressure,
iii
Finally, to test the conclusions from the bond pull-out
tests in a practical situation, a total of sixty-four lightweight
concrete deep beams, with varying anchorage lengths, bearing block
sizes and web reinforcement were tested. The results of these
tests confirm that the high bearing stresses that occur at the
supports of deep beams do have significant positive effects on the
anchorage bond that can be developed. A method is proposed to take
into account the enhanced bond strengths that occur over the
supports of deep beams with span/depth ratios of less than 2.
TABLE OF CONTENTS
Acknowledgements
Synopsis
List of Tables and Figures
List of Plates
Notation.
CHAPTER ,1 I NTRODUCTI ON
SECTION 1 EFFECT OF LATERAL PRESSURE ON ANCHORAGE BOND
CHAPTER 2 BOND AND ANCHORAGE REVIEW OF LITERATURE
2.1 Introduction
2.2 History of Research on Bond
2.3 The Mode of Bond Resistance
2.3.1 Adhesion
2.3.2 Friction
2.3.3 Mechanical Interlock
2.4 Important Factors Affecting Bond Strength
2.5 Confining Pressures and Bond
CHAPTER 3 THE EXPERIMENTAL PROGRAMME FOR ANCHORAGE BOND TESTS
3.1 Preliminary Remarks
3.2 Choice of Experimental Anchorage Tests
3.2.1 Simple Pull-out Test
3.2.2 Semi-beam Test
3.2.3 Lateral Load
3.3 Anchorage Tests
3.3.1 Series 1 Round Bars
3.3.2 Series 2 Deformed Bars
Series 3 Effect of Concrete Strength
i
ii
xiv
xv __
1
5
5
5
5
10
11
13
15
18
18
24
24
25
25
25
26
27
27
27
28
iv
3.3.4 Series 4 Effect of Platten Restraint
3.3.5 Series 5 Effect of Embedment Length
3.4 Material Properties of Reinforcing Steel
3.5 Concrete Materials
3.5.1 Cement
3.5.2 Aggregate
3.5.3 Mix Details
3.6 Concrete Strength
3.7 Shrinkage
3.7.1 Results of Shrinkage Experiments
3.7.2 Discussion of Shrinkage Experiments
3.8 Fabrication of Specimens
3.9 Testing Methods
3.9.1 Pull-out Tests
3.9.2 Semi-beam Tests
3.9.3 General
CHAPTER 4 PRESENTATION AND DISCUSSION OF ANCHORAGE BOND TESTS
4.1 Series 1 Round Bars
4.1.1 Ultimate Bond Strength
4.1.2 Load/Slip Behaviour
4.1.3 Mode of Failure
4.1.4 Effect of Bar Size
4.2 Series 2 Deformed Bars
4.2.1 Ultimate Bond Strength
4.2.2 Load/Slip Behaviour
4.2.3 Mode of Failure
4.2.4 Effect of Bar Size
4.2.5 Effect of Bar Type
v
~ 28
28
29
29
29
29
29
30
32
32
34
34
35
35
35
36
48
48
48
48
49
50
51
51
52
53
54
55
4.3 Comparison of Test Methods
4.4 Series 3 Effect of Cube Strength on Bond of Deformed Bars
4.5 Series 4 Variable Embedment Length
4.6 Series 5 Effect of Platten Restraint on Deformed Bar Cube Tests
4.7 Double Shear Test
CHAPTER 5 TIiE EFFECT OF lATERAL PRESSURE ON TIlE BOND OF ROUND REINFORCING BARS
5.1
5.2
5.3
5.4
5.5
Introduction
Glanvi11e (11)
(58) Takaku and Arridge
Pinchin (46)
Prediction of Pull-out Loads of Bond Tests
CHAPTER 6 PREDICTION OF TIlE BOND STRENGTIi OF DEFORMED BARS"
6.1
6.2
6.3
6.4
6.5
Introduction
Empirical Formulae
6.2.1
6.2.2
6.2.3
6.2.4
Mathey and Watstein (40)
(65) Orangun, Jirsa and Breen
Kemp and Wilh~lm (32)
(31) Jimenez, White and Gergely
Fundamental Bond Theories
6.3.1
6.3.2
6.3.3
(61) Lutz and Gergely
Cairns (49)
(62) Tepfers
Summary of Bond Strength Formulae
The Bond Stress Distribution for Deformed Bars
6.5.1 Average Bond Stress Distribution
6.5.2 Methods for Determining the Bond Stress Distribution
v4
~ 57
59
61
"63
65
83
83
84
85
86
87
94
94
94
94
95
95
97
97
97
99
100
102
104
104
104
6.6 Experimental Investigation of Effect of Lateral Pressure on the 107 Bond Stress Distribution
6.6.1 Test Specimen
6.6.2 Cali bra tion
6.6.3 Test Method
6.7 Results from Gauged Semi-beam Specimen
6.7.1 General
6.7.2 Effect of Lateral Load on Strain Distribution
6.7.3 Strain Distribution at Bond Failure
6.8 Prediction of Pull-out Loads for Deformed Bars
SECTION 2 mE DEEP BEAM STUDY
CHAPTER 7 REVIEW OF DEEP BEAM BEHAVIOUR AND DESIGN
7.1
7.2
7.3
7.4
Introduction
Deep Beam Analysis
7.2.1 Elastic Analysis
7.2.2 Ul timate Load
Flexural Failure
7.3.1 Design of Flexural Reinforcement
7.3.1.1 The CEB-FIP Recommendations
7.3.1.2 ACI Building Code (3)
(92\ 7.3.1.3 CIRIA Design Guide '
7.3.1.4 Kong's (5) Method
Shear Fai lure
( 6)
7.4.1 Design of Shear Reinforcement
7.4.1.1 The CEB-FIP Recommendations (6)
7.4.1.2 ACI Building Code (3)
. . - (92) 7.4.1.3 CIRIA DesIgn GUIde
7.5 _ Bearing Failure
.vi i
~
107
108
109
110
110
111
112
112
-126
126
126
127
127
128
129
130
131
131
132
132
133
133
133
134
136
137
vi i i
page
7.6 Anchorage Failure 137
7.6.1 Experimental Studies 138
7.7 Design of Anchorage Reinforcement 139
7.7.1 The CEB-FIP Recommendations ( 6) 139
7.7.2 ACI Building ·Code (3) 139
7.7.3 CIRIA Design Guide (92) 140
7.7.4 CPllO (2)
140
CHAPTER. 8 THE DEEP BEAM EXPERIMENTAL PROGRAMME 147
8.1 Preliminary Remarks 147
8.2 Description of Test Specimens 148
8.2.1 Series A 148
8.2.2 Series B 149
8.2.3 Series C 149
8.3 Beam Notation 150
8.4 Materials 150
8.5 Fabrication and Curing of the Test Specimens 151
8.6 Test Equipment and Testing Procedure 152
CHAPTER 9 PRESENTATION AND DISCUSSION OF RESULTS FROM THE DEEp BEAM EXPERIMENTS
161
9.1 Crack patterns and Mode of Failure 161
9.2 Diagonal Cracking Loads 164
9.2.1 Robins (98) Diagonal Cracking Formula 165
9.2.2 ACI (3) Factored Shear Formula 166
9.2.3 De Cossio and Siess (119) Diagonal Cracking Formula 167
9.3 Strain Distribution Over the Support 168
9.4 Failure Loads 169
9.4.1 Effect of Anchorage Length and Bearing Size ·169
ix
9.4.2 Effect of Web Reinforcement 170
9.4.3 Effect of Type of Anchorage 171
9.5 Deflection Control 172
CHAPTER 10 PREDICTION OF DEEP BEAM FAILURE LOADS 208
10.1 Modes of Failure 208
10.1.1 Flexural Failure 208
10.1.2 Limiting Bond Failure 208
10.1.3 Diagonal Cracking 210
10.2 Predicted Failure Loads for Beams with Straight Anchorage 210
10.2.1 Series A 210
10.2.2 Series B 211
10.3 Anchorage Design to Codes of Practice 212
10.3.1 Comparison of Design Anchorage to Experimental 212
10.3.2 The Case for Specified Bond Strengths in CPllO (2) 212
10.4 Proposed Method of Design 213
10.4.1 Preliminary Remarks 213
10.4.2 Design Approach 214
10.5 Design Example 216
CHAPTER 11 CONCLUSIONS 235
11.1 Pull-out Stress Pull-out
Tests and Semi-beam Tests with no Applied Lateral 235
11.2 Tests and Semi-beam Tests with Applied Lateral Stress 236
11.2.1 Round Bars 236
11.2.2 Deformed Bars 236
11.3 Comparison of Anchorage Bond Test Methods 237
11.4 Deep Beam Experiments 237
11.5 Design Recommendations for Deep Beams .239
11.6 Further Work 240
REFERENCES ·241/253
APPENDIX A 254/256
x
LIST OF TABLES AND FIGURES
CHAPTER 1
Figure 1.1
CHAPTER 2
Figure 2.1 Figure 2.2
Figure 2.3
CHAPTER 3
Table 3.1 Table 3.2 Table 3.3 Table 3.4 Table 3.5
Figure 3.1 Figure 3.2
Figure 3.3 . Figure 3.4 Figure 3.5 Figure 3.6 Figure 3.7
CHAPTER 4
Figure 4.1
Figure 4.2
Figure 4.3 Figure 4.4
Figure 4.5
Figure 4.6
Figure 4.7
Figure 4.8
Figure. 4.9
Figure 4.10
Figure 4.11
Lateral Pressures in Reinforced Concrete Members;
4
Bond Testing Specimens. 22 Tensile Stress Rings Resulting from Deformed 23 Reinforcing Bars (62). Deformation of the Concrete around a Ribbed 23 Reinforcing Bar (28).
Summary of Pull-out Experiments. 37 Reinforcement Properties. 38 Sieve Analysis. 39 Material Properties of Cubes. 40 Values of Static Young's Moduli for Lytag. 40
Bond Test Specimens. Straining Rig for the Application of Laterial Stress. Stress/Strain Curves for Cubes from Mix 2. Poisson's Ratio Mix 2. Shrinkage for Air Cured Specimens. Shrinkage for Water Cured Specimens. Semi-beam Pull-out Rig.
Effect of Lateral Stress on Pull-out 8 mm Round Bars. Effect of Lateral Stress on Pull-out 12 mm Round Bars.
Load
Load
for
for
41 42
43 43 44 44 45
66
66
Best Fit Lines for 8 and 12 mm Round Bar Results .67 Load/Slip Curves for Cube Tests on 8 mm Round Bars. Load/Slip Curves for Semi-beam Tests on 8 mm Round Bars. Load/Slip Curves for Cube Tests on 12 nim Round Bars. Load/Slip Curves for Semi-beam Tests on 12 mm Round Bars.· Effect of Lateral Stress on Force Developed in 12 mm Round Bars at Free-end Slip of 0.03 mm. Effect of Lateral Stress on Force Developed in 12 mm Round Bars at Free-end Slip of 0.05 mm. Effect of Lateral Stress on Pull-out Load for 8 mm Torbar. Effect of Lateral Stress on Pull-out Load for 8 mm Unisteel Bars.
68
68
69
69
70
70
71
71
xi
LIST OF TABLES AND FIGURES (contd)
Figure 4.12
Figure 4.13
Figure 4.14
'Figure 4.15
Figure 4.16
Figure 4.17
Figure 4.18
Figure 4.19
Figure 4.20
Figure 4.21
Figure 4.22
Figure 4.23
Figure 4.24
Figure 4.25
Figure 4.26
Figure 4.27
CHAPTER 5
Table 5.1
Figure 5.1
Figure 5.2
Figure 5.3
CHAPTER 6
Table 6.1
Figure 6.1 Figure 6.2 Figure 6.3 Figure 6.4 Figure 6.5 Figure 6.6 Figure 6.7
Effect of Lateral Stress on Pull-out Load for 12 mm Torbar. Effect of Lateral Stress on Pull-out Load for 12 mm Unisteel Bars. Effect of Lateral Stress on Cube Pull-out Load for 16 mm Bars. Load/Slip Curves for Cube Tests on 12 mm Torbar. Load/Slip Curves for Semi-be,am Tests on 12 mm Torbar. Sketches of Cube Failure Crack Patterns wi th 12 mm Torbar Specimens. Sketches of Cube Failure Crack Patterns with 16 mm Torbar Specimens. Effect of Bar Size on Average Bond Strength of Torbar. Effect of Bar Size on Average Bond Strength of Unisteel Bars. Effect of Cube Strength on Average Bond Strength (8 mm Torbar). Variation of Average Bond Strength with Square Root of Cube Strength (8 mm Torbar). Effect of Concrete Strength on Average Bond Stress at Transition. Variable Anchorage Semi-beam Tests with 8 mm Torbar. Effect of Embedment Length on Average Bond Strength. Effect of Cube Restraint on Pull-out Loads of 12 mm Torbar. Double Shear Test Rig.
Material Properties.
Stress Normal to Bar/Concrete Interface Resulting from Lateral Pressure ox. Effect of Lateral Stress on Pull-out Load for 8 mm Round Bars. Effect of Lateral Stress on Pull-out Load for 12 mm Round Bars.
Calculated Bond Stresses at Failure.
Progression of the Bond Stress Distribution Bar Preparation and Gauge Locations. Calibration Curves of Strain Gauged Bar.
Page 72
72
73
74
74
75
75
76
77
78
78
79
80
80
81
82
90
91
92
93
115/116
(87). 11 7
118 119 119 Data Logging Equipment.
Strain Distribution with Strain Distribution with Strain Distribution with
Zero Lateral Stress. 120 4 N/mm2 Lateral Stress.120 8 N/mm2 Lateral Stress.121
xii
LIST OF TABLES AND FIGURES (contd) ~
121 Figure 6.8
Figure 6.9
Figure 6.10
Figure 6.11
Figure 6.12 Figure 6.13 Figure 6.14 Figure 6.15 Figure 6.16
CHAPTER 7
Figure 7.1 Figure 7.2 Figure 7 .. 3 Figure 7.4 Figure 7.5 Figure 7,6 Figure 7,7
CHAPTER 8
Table 8.1
Figure 8,1 Figure 8,2 Figure 8,3
CHAPTER 9
Table 9.1
Figure 9.1 Figure 9,2 Figure 9.3 Figure 9.4
Figure 9,5
Figure 9,6 Figure 9,7 Figure 9.8 Figure 9,9
Figure 9,10
Figure 9,11
Strain Distribution with 12 N/mm2 Lateral Stress. Strain Distribution with 16 N/mm2 Lateral Stress.
122
. Strain Distribution to Failure, Lateral Stress 122 8 N/mm2. Strain Distributions for various Lateral Stress 123 and Pull-out Load of 10 KN. Predicted Pull-out Loads for 8 mm Torbars, Predicted Pull-out Loads for 8 mm Unisteel Bars. Predicted Pull-out Loads for 12 mm Torbars, Predicted Pull-out Loads for 12 mm Unisteel Predicted Pull-out Loads for 16 mm Bars.
Deep Beam General Arrangement, Typical Deep Beam Flexural Failure, Calculation of Ultimate Flexural Strength, Shear Failure Crack patterns, Bearing Stresses above a long Support, Deep Beams as part of other Structures, Alternative Anchorage Lengths at a Simple Support to CPll02
Details of Deep Beam Tests
Deep Beam Experimental Programme, Deep Beam Test Rig, Position of Demec Gauges over Support,
Bars.
Comparison of Diagonal Cracking Loads for Beams of Series A and B.
Crack patterns' for Crack patterns for Crack Patterns for Effect of Anchorage Series A. Effect of Anchorage Series B,
Beams of Series A, Beams of Series B .. Beams of Series C, Length on Failure
Length on Failure
Ultimate Shear Cracking Loads, Diagonal Cracking Loads,
Loads,
Loads,
Bearing Strain Distributions over Supports, Effect of Anchorage Length and Bearing Size on Failure Loads for L/D = I, Series A. Effect of Anchorage Length and Bearing Size on Failure Loads for L/D = 4/3, Series A. Effect of Anchorage Length and Bearing Size on Failure Loads for L/D = 2, Series A,
123 124 124 125 125
142
143 143 144 145 145 146
155/157
158 159 160
175
176/181 182/184 185 186
186
187 188 189/191 192
193
194
LIST OF TABLES AND FIGURES (contd)
Figure 9.12
Figure 9.13 Figure 9.14 Figure 9.15
CHAPTER 10
Table 10.1
Table 10.2
Figure 10.1 Figure 10.2
Figure 10.3
Figure 10.4
Figure 10.5 Figure 10.6
Figure 10.7
NOTE:
Effect of Anchorage Length and Bearing Size on Failure Loads for L/D = 4, Series A. Load/Deflection Curves Series B. Load/Deflection Curves Series B. Load/Deflection Curves Series C.
Ultimate and Diagonal Cracking Loads for Beams in Series A, Band C. Anchorage Lengths for 8 mm Torbar Specified by ACI 318-77(3), CIRIA(92) and CPIIO(2) for Lightweight Concrete.
Calculation of Ultimate Flexural Strength. Comparison of Actual and Predicted Failure Loads for Beams in Series A. Comparison of Actual and Predicted Failure Loads for Beams in Series B. Comparison of Anchorage Bond Stresses from Semi-beam and Deep Beam Tests. Effect of Bar Diameter on Bond Strength Proposed Method to allow for Enhanced Bond Strength at Deep Beam Supports. Deep Beam Design Example.
All Tables and Diagrams appear at the end of the Chapter to which they refer.
xi i i
~ 195
196/198 199/201 202
222/224
225
226 227/228
229/230
231
232 233
234
LIST OF PlATES
CHAPTER 3
Plate 3.1 Plate 3.2
CHAPTER 9
Rig Used to Measure Lateral Strain. Semi-beam Test Layout.
46 47
xiv
Flexural Failure. Beam 0.75B-loo-150-52. 203 Plate 9.1 Plate 9.2 Plate 9 • .3 Plate 9.4 Plate 9.5
Anchorage Failure. Beam lB-loo-150-48. 204 Diagonal Cracking Failure. Beam 0.5A-50-75-45. 205 Shear Failure. Beam 0.25A-loo-75-4l. 206 Flexural Failure. Beam 0.25B-100-l50-53. 207
NOTE:
All Plates appear at the end of the Chapter to which they refer.
NOTATION
a
A
c
c g
d
d'
D
Em' Es
f
fb
fb£.
fbs
fbt
f' c
fct
fcu
fs
f' s
fy
fu
b a
I
Ib
xv
area of section in complementary shear stress formula, (66)
experimental constant from Untrauer and Henrys
pull-out tests,
area of horizontal'web bar,
area of one rib above bar surface,
area of tensile reinforcement,
area of transverse reinforcement.
area of vertical web bar,
breadth of section, , (66)
experimental constant from Untrauer and Henrys
pull-out tests,
minimum cover to reinforcement,
elastic constant in Glanvill~s (11)
bar diameter,
effective depth of beam,
overall depth of beam,
theory,
Young's Moduli of concrete and steel,
bond stress before any longitudinal stress is applied
in Glanvilles (11) equation,
bond stress,
limiting value of bond stress,
bond stress resulting from bearing pressure,
bond stress at transition from splitting to shearing
type fai lure,
cylinder compressive strength of concrete,
tensile strength of concrete,
cube crushing strength of concrete,
steel stress at pull-out.
enhanced steel stress at pull-out resulting from lateral
pressure,
yield strength of reinforcement,
ultimate strength of reinforcement,
CIRIA'S (92) effective height of a deep beam,
second moment of area of a section about the XX axis.
geometrical property of a deformed bar depending on
ri b height,
xvi
NOTATION (contd)
n
N
s
s· v
u
Vu
x
x y
experimental
experimental
formula,
. (32) constants in Kemp and Wllhelms formula,
constant in Robins (98) diagonal cracking
length of bearing block,
embedment length of anchored bar,
clear span length,
design bending moment,
ultimate bending moment,
number of web reinforcing bars,
number of main tensile reinforcing bars,
actual load in the bar at any section,
ultimate failure load,
radius of effective concrete cylinder,
radius of reinforcement,
spacing of web reinforcement.
spacing of horizontal web bars.
longitudinal spacing of bar ribs.
spacing of vertical web bars.
total radial movement at steel surface in
Glanvilles (11) equation.
nominal shear stress carried by concrete.
nominal shear stress at a section.
design shear force,
beam failure load.
diagonal cracking load for beams in Series A,
diagonal cracking load for beams in Series B.
diagonal cracking loads for.beams in Series A, Band C,
deep beam service load.
CEB-FIP (6) ultimate design shear load.
ACI (3) ultimate design shear load, (92) .
CIRIA ultimate deSIgn shear load.
Robins (98) diagonal cracking load.
ACI (3) shear cracking load,
D C • d Si (U9). 1 . 1 d e 05510 an ess d~agona cracking oa.
depth of concrete compressive zone.
shear span length,
lever arm of element considered.
xvii
NOTATION "(contd)
z a
Ym
Yt
6
E' o
e
P
Pw
T
lever arm of main" tensile reinforcement,
intercept on y axis of best fit line,
gradient of best fit line,
partial safety factor for materials,
safety factor for loads,
unit cohesion of concrete,
original strain in concrete due to shrinkage,
average increase in radial strain due to lateral pressure,
inclincation to horizontal of line joining support point
to nearest load point,
constants in CIRIA (92) ultimate shear load formula,
coefficient of friction at failure interface,
Poisson's ratio of concrete and steel,
web reinforcement ratio,
tensile steel reinforcement ratio,
average interfacial pressure at failure interface,
applied normal stress,
lateral stress applied to pull-out specimen.
shear strength of concrete,
capacity reduction factor in ACI (3)
1
CHAPTER 1
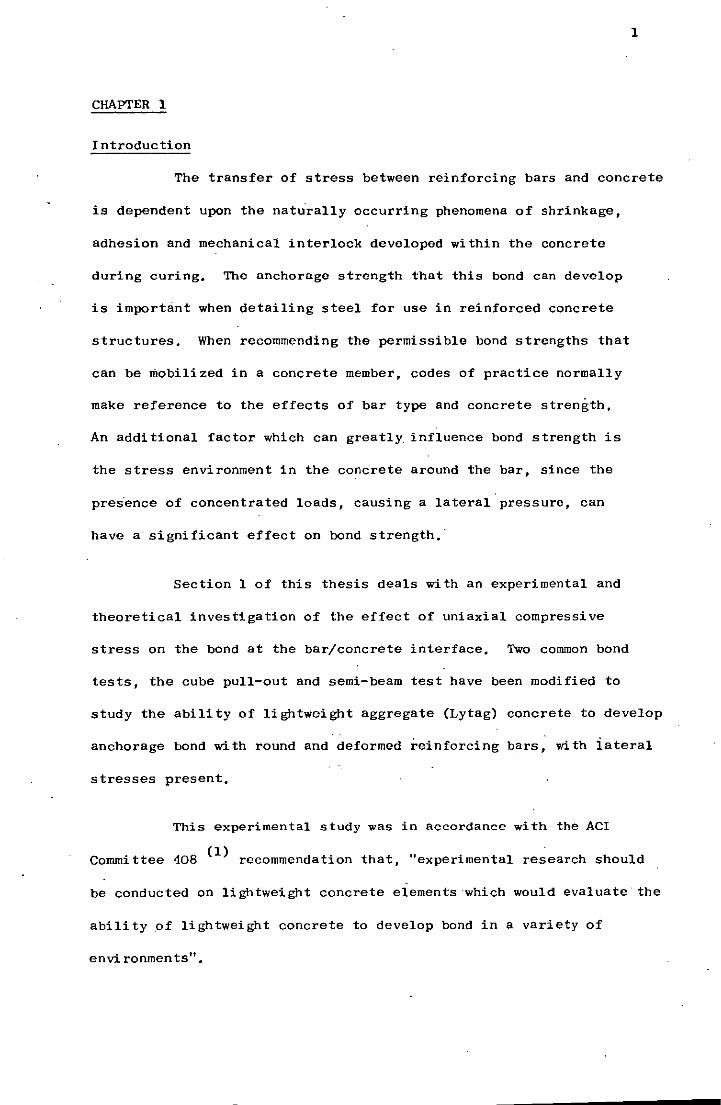
Introduction
The transfer of stress between reinforcing bars and concrete
is dependent upon the naturally occurring phenomena of shrinkage,
adhesion and mechanical interlock developed within the concrete
during curing. The anchorage strength that this bond can develop
is important when detailing steel for use in reinforced concrete
structures, When recommending the permissible bond strengths that
can be mobilized in a concrete member, codes of practice normally
make reference to the effects of bar type and concrete strength,
An additional factor which can greatly. influence bond strength is
the stress environment in the concrete around the bar, since the
pres"ence of concentrated loads, causing a lateral pressure, can
have a significant effect on bond strength,·
Section 1 of this thesis deals with an experimental and
theoretical investigation of the effect of uniaxial compressive
stress on the bond at the bar/concrete interface, Two common bond
tests, the cube pull-out and semi-beam test have been modified to
study the ability of lightweight aggregate (Lytag) concrete to develop
anchorage bond with round and deformed reinforcing bars, with lateral
stresses present.
This experimental study was in accordance with the ACI
Commi ttee 408 (1) recommendation that, "experimental re~earch should
be conducted on lightweight concrete elements ·which would evaluate the
abili tyof lightweight concrete to develop bond in a variety of
envi ronments" .
2
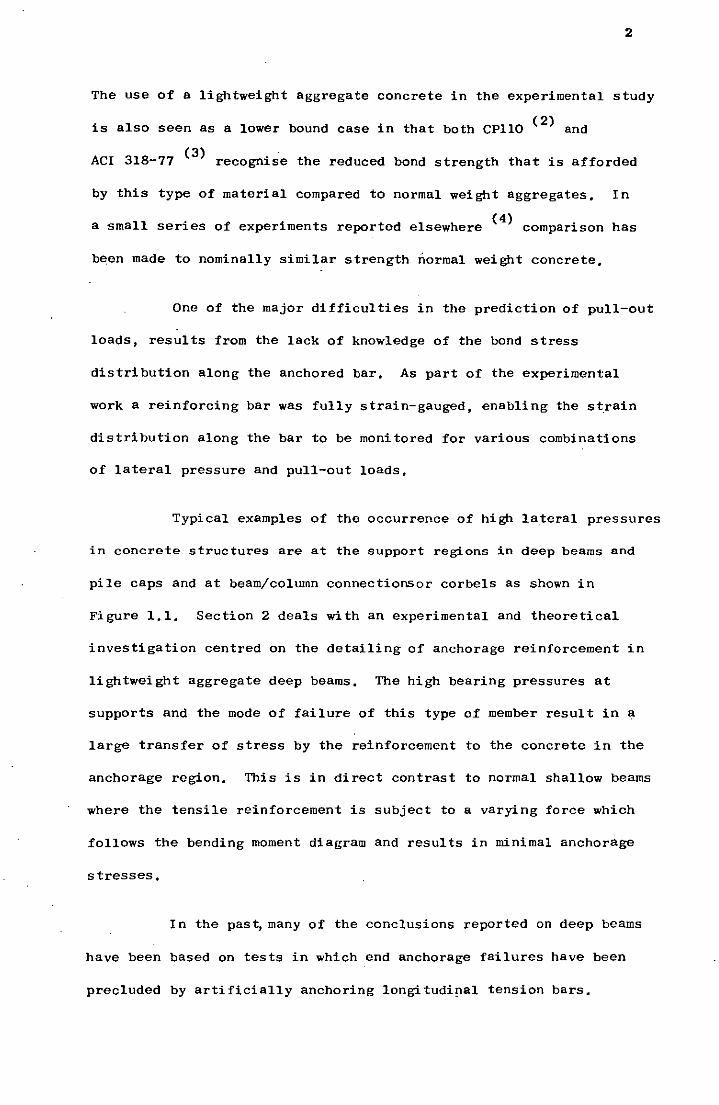
The use of a lightweight aggregate concrete in the experimental study
is also seen as a lower bound case in that both CPllO (2) and
(3) . ACI 318-77 recognise the reduced bond strength that is afforded
by this type of material compared to normal weight aggregates, In
a small series of experiments reported elsewhere (4) comparison has
been made to nominally similar strength normal weight concrete,
One of the major difficulties in the prediction of pull-out
loads, results from the lack of knowledge of the bond stress
distribution along the anchored bar, As part of the experimental
work a reinforcing bar was fully strain-gauged, enabling the strain
distribution along the bar to be monitored for various combinations
of lateral pressure and pull-out loads,
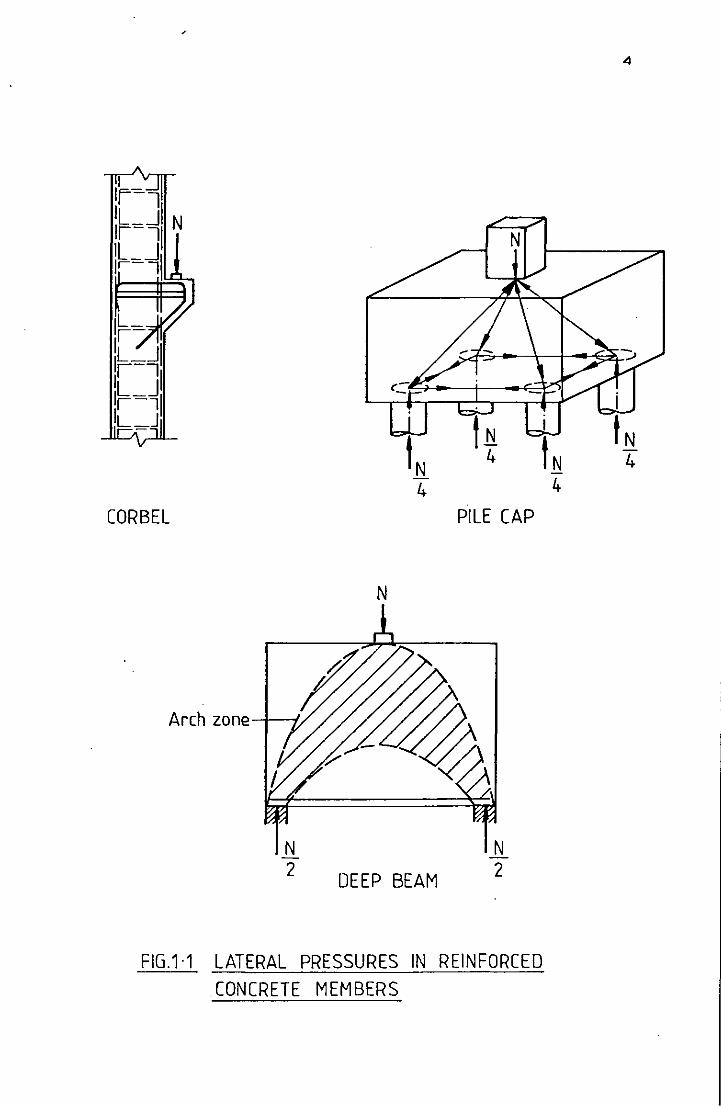
Typical examples of the occurrence of high lateral pressures
in concrete structures are at the support regions in deep beams and
pile caps and at beam/column connections or corbels as shown in
Figure 1,1, Section 2 deals with an experimental and theoretical
investigation centred on the detailing of anchorage reinforcement in
lightweight aggregate deep beams, The high bearing pressures at
supports and the mode of failure of this type of member result in a
large transfer of stress by the reinforcement to the concrete in the
anchorage region, This is in direct contrast to normal shallow beams
where the tensile reinforcement is subject to a varying force which
follOWS the bending moment diagram and results in minimal anchorage
stresses.
In the pas~ many of the conclusions reported on deep beams
have been based on tests in which end anchorage failures have been
precluded by artificially anchoring longitudi~al tension bars,
To the Author's knowledge there has only been one pilot
study (5) into the actual anchorage requirements for deep beams,
al though the necessity of special provisions are acknowledged by
3
(3) . . (6) codes of practice such as ACI 318-77 and the C,E,B, - F,I,P
This study then has involved a systematic investigation of the effects
of various amounts of end anchorage and bearing sizes on the strength
and mode of failure of 64 lightweight. concrete deep beams; ~he
results of which are compared to the bond tests so as to draw
conclusions about the relevance of the data obtained from the types
of bond test methods in common use, In light of the observations
made from the deep beams study, suggestions are made to make optimum
use of the special conditions which exist at the supports of such
members.
I Ir=l IL_.Ji Ir-'I N
1~=~1
~ C=J\ 1,-, lL_JI ,-1 L=J
CORBEL
Arch zone-l----1/
4
N
DEEP BEAM
N
PILE CAP
N 2
FIG.1·1 LATERAL PRESSURES IN REINFORCED CONCRETE MEMBERS
4
4 4
SECTION 1
EFFECT OF IATERAL PRESSURE ON ANCHORAGE BOND
5
SECTION 1 EFFECT OF LATERAL PRESSURE ON ANCHORAGE BOND
CHAPTER 2 OOND AND ANCHORAGE:REVIEW OF LITERATURE
2,1 Introduction
In reinforced concrete elements bond defines the complex
system by which stress is transferred between the concrete and steel,
The bond stress is measured by the rate of change of steel stress in
the reinforcing bar, Conventionally bond is divided into two types:
(i) local, flexural or transfer bond which is required at each
(ii)
section along the length of a bar in order that the
concrete and the steel act together, and
anchorage bond, required to ensure that the ends of bars
are firmly embedded in the concrete,
Although the cause of these two types of bond are different,
ie.flexural bond is related to the shear at a section and anchorage bond
solely to the transfer of axial load over the length of reinforcement,
the manner in which the steel and concrete interact are the same •
Therefore although the objective of this thesis is to investigate the
specific case of anchorage bond and the effect on it of confining
pressures it was considered useful to outline in the following section
previous investigations carried out to determine the bond mechanism,
factors that will affect it and the various test methods employed in
bond research.
2,2 History of Research on Bond
Since the end of the last century engineers (7) have
realised the importance of the interaction between reinforcing steel
and concrete in ensuring proper composite action,
6
It had been observed that primary failure frequently resulted from
slip of the bar rather than from excessive tension in the bar Or
compression of the concrete.
The first major review of tests on bond resistance of round
and deformed bars was completed in 1913 by Abrams (8) in the USA.
The explanation of the bond mechanism and the influence of various
factors on it remain to a large extent valid to the present time.
.. (9) (10) In Europe Morsch and Graf followed Abrams' work in 1923 and
1930 with studies that provided a major separation of the emphasis
of investigation on bond between Europe and the USA. Abrams had
found that deformed bars were more effective in mobilising bond
,,(9) (10) resistance than round bars and although Morsch and Graf con-
firmed these results they concluded that for the bond resistance
required at the time there was no particular advantage in using de-
formed bars especially since there was a possibility of bursting.
These conclusions however need to be seen in the perspective of the
2 strength of concrete (10 N/mm in compression) and the working
stress in the reinforcement (120 N/mm2) of that era. The importance
of round bars, especially for use in pre-stressed concrete
construction, resulted in Glanville's (11) publication (1930) of a
theory and results of experiments to show the distribution of bond
stresses for this type of bar.
By 1940 the typical strength of concrete was twice that
Abrams used and a further comprehensive study of bond was published
(12) in the USA by Gilkey, Chamberlin and Seal
7
The advantage of the improved bond capacity of deformed bars was now
more apparent and Clarke's (13,14) publications of 1946 and 1949
led to the production of the geometrical specifications of ribs in
ASTMA 305 (15) so that in tOday's ACI 318-77 (3) only deformed bars
are to be used for tensile reinforcement while round bars are limited
to use in spirals and tendons.
The main interest during the 50's on both sides of the
Atlantic was in the actual stress distribution occurring in bars
embedded in concrete and the fundamental nature of bond. The problem
was tackled in various ways: Plowman (16) measured the movement of
W'lk'ns (17) , Ma'ns (18) , studs welded to the reinforcing bar; ~ ~ ~
. (19) (20) (21) Peatt~e and Pope , Bernander and later, Perry and Thompson
and Nilson (22) attached strain gauges to bars embedded in concrete,
while Evans and Williams (23) photographed the movement of small
platinum markers cast half in the steel reinforcing bar and half in
concrete, using an X-ray technique. ParI and (24) determined the
steel stresses by a magneto-strictive method. This was based on the
principle that the impedance of a reinforcing bar to an alternating
current is altered by the state of stress, thus enabling the
variation in average stress over a distance to be determined by
measuring the voltage changes.
Although various experimental methods had been used to
represent bond situations, until this time the simple pull-out test
was the most widely used and accepted. Abrams (8) had justified the
pull-out test by a comprehensive series of tests on beams but clearly
it could not be realistically expected to model f1exura1 bond.
8
Moreover, Leonhardt (25) and Plowman (26) cast doubts as to whether
it was even a reliable method of obtaining absolute values of
anchorage bond stress. The main criticisms of the test were that
the concrete was in compression at the loaded face of the bar and
that the free-end slips measured were not representative of what
would occur in an actual beam. These doubts resulted in the various
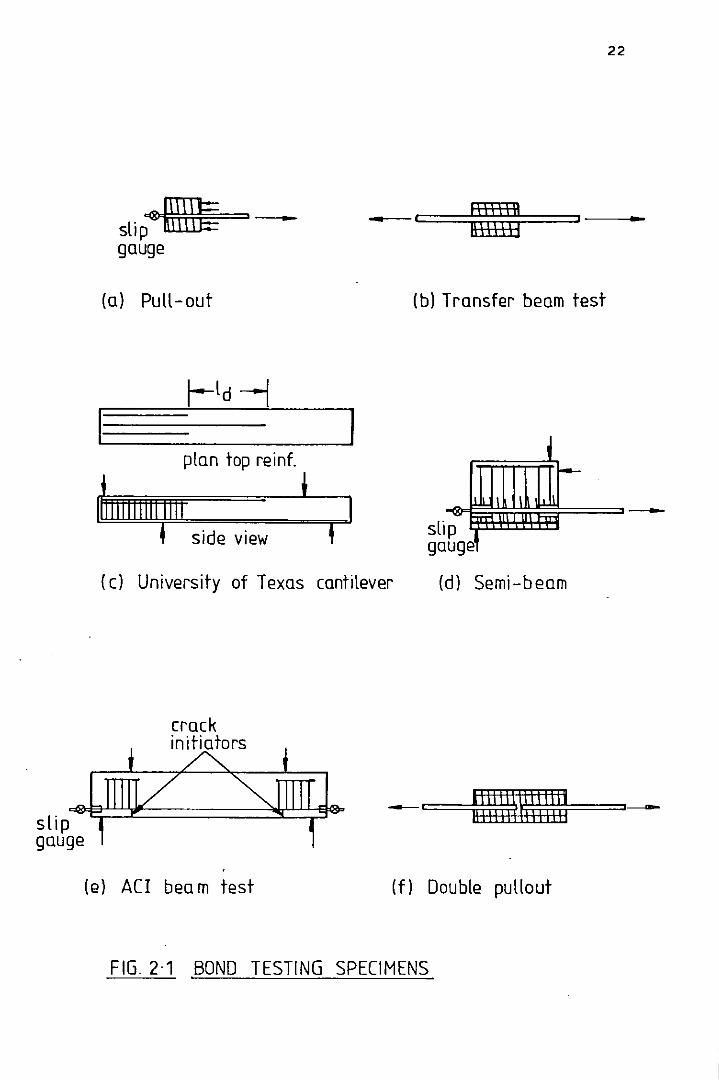
bond testing methods illustrated in Figure 2.1.
Flexural or transfer bond and cracking have been studied
by Broms (27) and Goto (28) by casting reinforced bars in prisms of
concrete and applying load to both ends of the embedded bar.
The majority of investigations have been concerned with
anchorage bond. (29)
Ferguson and Thompson developed a cantilever
bond specimen to test the anchorage requirements in the top
reinforcement of continuous beams. The semi-beam test method is
the most recently favoured testing technique and was developed from
the eccentric pull-out test first used by Abrams (8)
and then
Lutz (30) . . (31 32 33 34) Several 1nvest1gators ", have used the
technique to investigate the various parameters affecting bond.
. (35) The test procedure specif1ed by the ACI 208-58 for
measuring bond values is a beam test, which although being the only
true test has the disadvantage of being costly and difficult
to handle.
various modifications have been made to the pull-out test
so that the concrete is in a state of tension. Abrams (8) investigated
double pull-out specimens and more recent investigations on specimens
using the same principle have been carried out by Edwards and
(36) . (37) Yannopoulous and Edwards and Picard •
9
The introduction of these various bond tests resulted in
a stream of reports (29,38,39,40) from the USA on the various
parameters affecting bond. These investigations have been largely
responsible for the empirical design rules referring to bond of high
strength, large diameter deformed reinforcement incorporated in ACI
318-77 (3) •
The need for an analytical solution of the bond problem and
(41) ° a more fundamental insight prompted Rehm's comprehens1ve
investigation into pull-out specimens with short embed·M~nt lengths.
From his experiments the bond/slip characteristics of most types of
plain and deformed reinforcing bars were presented. The validity of
results on deformed bars however is questionable since failure by
bursting was not the primary cause in most cases. Bond/slip relation-
Ships were more rigorousl~~' developed with the advent of high speed
digital computers. Experimental curves have been used by Ngo and ~
S d 1 ° (42) L t (43) N°l (44) d All (45) t 1 cor e 1S ,u Z ,1 son an wood 0 mode
bond at the steel/concrete interface in finite-element analyses of re-
inforced concrete members.
Various theoretical models have been proposed to account for
bond failure. Pinchin (46) studied the pull-out of steel wires from
concrete samples and concluded that the stress transfer is a frictional
process. Bartos (47) , in an investigation of bond characteristics of
fibrous composites in brittle matrices, considered bond resistance to
be due to two phases. Elastic shear bond permits transfer of stresses
across the interface while the displacements of the reinforcement and
matrix are compatible. Frictional shear bond is responsible for the
stress transfer when a relative displacement between the matrix and
reinforcement OCCUrs at the interface.
10
This approach, and that of Pinchin (46) , will only apply to round
bars since splitting is normally of primary importance with deformed
bars. Tepfers (48) and Cairns (49) in their analysis of bond in
lapped bars acknowledge that bursting is critical for deformed bars
and propose models that relate the ultimate bond to the cracking
resistance of the concrete cover and to the confining reinforcement.
In addition to the mechanical tests of bond strength there
have been various investigations of the concrete/steel interface.
The Germans, Wurzner (50), Nacken and Von Rodt (51) , Pogany (52) and
Martin (53) studied the chemical adhesion and crystalline ingrowth
of the cement gel into the steel against which it was cast.
(54) Schnittgrund and Scott observed a chemical bonding and, like
Alexander (55) , noted that failure for plain bars often occurred at
an interface within the matrix rather than at the steel/concrete
boundary. This relative weakness of a layer close to the steel/con-
crete interface has been confirmed in scanning electron microscope
examinations by Pinchin (46) •
Information on the morphology of the matrix in contact with
the steel interface has become of increasing interest with the recent
developments in fibre reinforced concrete technology.
2.3 The Mode of Bond Resistance
Ever since the early work by Abrams (8) in 1913 the bond
resistance of reinforcing bars has been described by three mechanisms:
1. Adhesion;
2. Friction; and
3. Mechanical interlock.
11
For round bars the first two factors are of primary importance, while
mechanical interlock becomes increasingly more dominant with larger
surface deformations and rough finishes. The overlap and relative
importance of the factors are disputed.
2.3.1 Adhesion
Adhesive resistance is the term used to designate the bond
resistance developed before the movement of the bar with respect to
the adjacent concrete. Wurzner (50) attributed adhesion to cohesion
arising from the suction occurring as a result of extraction or
evaporation of water from the capillaries in the concrete matrix.
(52) Pogany observed that there was some ingrowth of the
gel and crystalline mass into the steel which supports Plowman's (16)
and Brown's (56) conclusions that the micro-mechanical locking are
the most reasonable explanation of adhesion resistance. The initial
resistance to slip is given by the shear strength of the fine particles
of concrete that have been introduced into the micro-indentations in
the surface of the reinforcement.
Chemical investigations of the bar/concrete interface have
been undertaken. Martin (53) showed by means of micrographs that
dissolved calcium hydroxide from the cement paste was able to
penetrate the porous oxide layer of the steel resulting in adhesion,
and similarly silicon,calcium and aluminium ions could build into
the surface of the metallic iron.
12
(54 56) Observations ' of the failure surfaces of cement, and
concrete cast against metal plates have indicated that the strength
of this chemical bonding is such that failure occurs in a zone between
10 - 40 micron from the bar surface as well as occurring at an
interface with·the bar. Measurements of the hardness of the concrete
by Pinchin (46) in the interfacial region with steel, have shown a
region of lower hardness within 1 mm of the surface. Pinchin (46)
attributes this reduced hardness to increased porosity introduced by
vibration (30% within 150 pm of the wire surface compared to
approximately 16% in the bulk of the cement paste). The vibration
leads to less efficient packing of the cement clinker particles near
the bar surface and a local increase in the water/cement ratio.
As is to be expected adhesion is dependant on the age of
the matrix and the chemical reactions that have occurred. Pinchin
and Tabor (57) in their studies of the structural properties of the
hydrated cement matrix near the interfacial region tested specimens
after curing for 3 days, 1 week and 4 weeks and then examined the
surfaces using a scanning electron microscope (S.E.M.). After 3"
days the water-cured cement paste specimens cast against steel
plates showed large voids covering almost half of the cement
fracture surface. Tensile failure occurred both at the actual inter-
face and in the bulk of the cement, leaving cement paste adhering to
the steel. After 7 days the voids had largely disappeared and covered
only a small area of the interface (<: 5%). After 4 weeks no
noticeable changes either in void content at the interface, in the mode
of fracture or in the chemical content were noted. Bond resulting
from adhesion can be expected to attain its full strength after 1
week's curing.
13
The absolute strength of adhesion bond is obviously
difficult to quantify and will depend on how it is defined and on
factors such as the concrete mix, bar surface and age of testing,
Abrams (8) on studies of concrete of his day, defined the adhesion
resistance as that developed before movement of a polished round bar
with respect to the adjacent concrete, It was found that round bars
with normal mill scale developed an average bond resistance of
1,79 N/mm2 (260 Ib/in2) at first slip while the corresponding value
for polished b~rs was 1,1 N/mm2 (160 Ib/in2),
2,3,2 Friction
A contribution to total bond resistance by friction has been
accepted from the time of the earliest work by Abrams (8)
The normal
force required for a frictional mechanism is provided by shrinkage of
the concrete matrix about the bar, For an embedded length of plain
round bar where the adhesion is not completely destroyed, static
friction developed by the pressure of the concrete accounts for the
difference between the adhesion and the resistance developed before
slipping begins, On complete de-bonding and slip of the bar the
whole of the bond resistance must be due to frictional resistance
which includes some dilatation resulting from wedging action of the
small particles of concrete loosened after an initial slip has
occurred, Abrams (8) in contrast to the conclusions of Glanville (11)
and then Gilkey, Chamberlin and Beal (12) stated that "while frictional
resistance is of importance, reliance should not be placed on this
element of bond resistance",> and attributed the majority of resistance
before slip to adhesion, Gilkey, Chamberlin and Beal (12) considered
bond to be mainly a manifestation of frictional resistance which is
borne out by the increase in bond resistance of round bars after
ini tial de-bonding.
14
Glanville (11) in his theory assumed that the bond stress at any point
along an embedded reinforcing bar is dependent on the strains in the
concrete due to radial shrinkage and to the stress in the steel.
The Poisson ratio effect of stress in the steel would tend to reduce
the bond stress. The same principles have been applied by Takaku
and Arridge (58) and Pinchin (46) to steel fibres embedded in resin
and concrete matrices respectively.
(55) . (56) . Investigations by Alexander • Brown • Sch1ttgrund
and Scott (54) on the weak calcium hydroxide rich layer close to
the bar surface have shown that the failure interface for frictional
sliding can oscillate between the steel surface and concrete matrix.
The stick-slip characteristics which are observed in pUll-out tests
reflect the varying coefficients of friction. Alexander (55) measured
the shear bond and frictional bond between ~ inch cubes of steel
clamped between two ! inch cubes of cement. The clamping pressure
could be varied and the load applied to the steel to initiate sliding
was measured. The coefficient of friction remained constant until on
continued sliding Alexander (55) found that the surface of the cement
became polished and the frictional bond decreased. The value of
coefficient of friction for cement paste of water/cement ratio 0.35
on stainless/steel decreased from approximately 0.9 to 0.45 at a normal
2 pressure of 24.8 N/mm (3600 psi). At higher water/cement ratios
"welding" of steel and cement asperities was so extensi ve that
continued slip occurred entirely within the bulk of the cement. The
coefficient for cement sliding on cement was found to be 1.02 and was
independent of age or water/cement ratio.
15
Plowman (16) quoted the value of the coefficient of friction
for steel sliding on paste or mortar as 0.66 - 0.73 but gives few
details of the test method used.
Pinchin (46) obtained values of friction for steel, cement
paste and mortar hemispheres sliding on flat paste and mortar surfaces
and in other experiments, between steel and cement surfaces, using a
method similar to that of Alexander (55). Comparison of values for
coefficient of friction obtained from these tests show that there
is in general no significant difference. It is also clear that the
coefficients for steel/concrete and concrete/concrete interfaces are
very similar. This is in agreement with Plowman (16) but differs
markedly from Alexander (55) who reported these coefficients to be
0.74 and 1.02 respectively. The values of initial coefficient of
friction given by Pinchin (46) are in the range 0.47 to 0.72 for the
various types of interfaces investigated in the hemispherical slider
experiments. The average coefficient of friction for paste and mortar
sliderson roughened stainless steel was 0.52.
This trend towards lower coefficients of friction than
. (55) (16) predicted by Alexander. and Plowman is substantiated by
(59) results from the Cement and Concrete Association Research Laboratory
who suggest a value of 0.5 for prestressing steel on concrete.
2.3.3. Mechanical Interlock
Abrams (8) comparison of the bond resistance of polished
bars and plain bars with a surface of ordinary mill scale demonstrated
that mechanical interlock resulting from irregularities of the bar
surface could account for as much as 55% of the bond resistance of
ordinary mill scale bars at a small amount of slip.
16
Both round and deformed bars with rusted surfaces have been
shown by Abrams (8) , Rehm (41) (60) Kemp, Brezney and Unterspan
to improve bond resistance by as much as 16% compared to normal mill-
rolled steel.
For round bars failure often occurs by shearing through the
concrete matrix across the top of the mechanical enlargement rather
than at the bar surface. In deformed bars where the enlargements are
of a much greater magnitude, bursting forces produced by the mechanical
interlock of the deformations are more usually the cause of bond
failure. Abrams (8) experiments on standard threaded bars however,
did show that shearing of the concrete surrounding the threads
~occurred when the rib spacing was small.
According to Rehm (41)
and Lutz and Gergeley (61) failure of
the bond can result in two ways: (1) the ribs can split the concrete
by this wedging action, and (2) the ribs can crush the concrete at the
root of the lugs. The angle of the rib face is not considered to be
an important variable since as slip develops the compacted powder
resulting from crushing of the concrete in front of the ribs modifies
o 0 the face angle to between 30 and 40 •
After a small amount of slip and destruction of the adhesive
bond the ribs of deformed reinforcing bars bear against the concrete
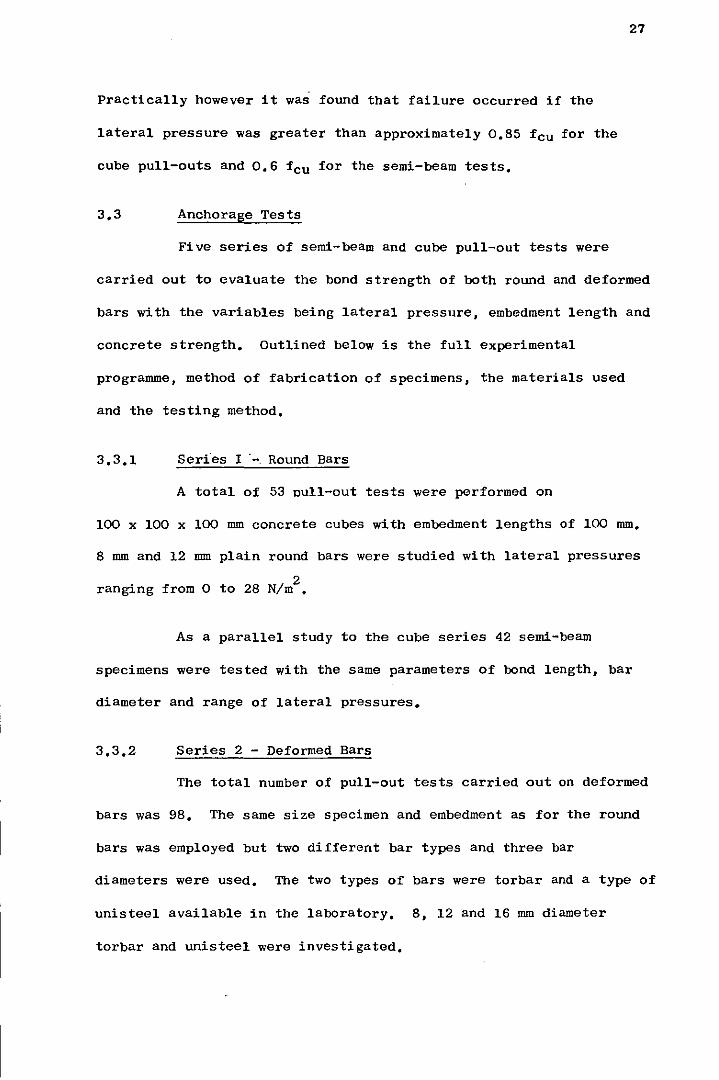
matrix. Tepfers (62) explained how the radial components of the bond
forces are balanced against rings of tensile stress in the concrete as
shown in Figure 2.2. When a ring is stressed to rupture longitudinal
cracks appear. These may start as internal cracks, not visible from
the concrete surface. At some point the ultimate load capacity of the
concrete cover is reached and failure occurs.
17
Abrams (8) and Rehm (41) also identified a third bond failure
mechanism resulting from either very small rib spacing or heavy con-
finement of the reinforcement. Shearing of the concrete across the
(41) surface between the tops of the ribs was observed by Rehm when
the value of shear stress over the fracture surface was of the order
of 0.4 - 0.6 times the cube crushing strength. For the threaded bars
he tested, Abrams (8) concluded that the bearing area was so large
that the reduction in average bearing stress resulted in shearing
becoming the critical factor for failure.
A reduction of the height of the lugs has been shown by
Soretz and Ho1zenbein (63) to reduce the bond characteristics of the
bars if the lug distance is not decreased in proportion to the height.
Cairns (49) in his analysis of reinforcement in compression laps
includes the influence of the specific rib area of a bar, defined
as Ar/Sr, in improving the ultimate bond strength.
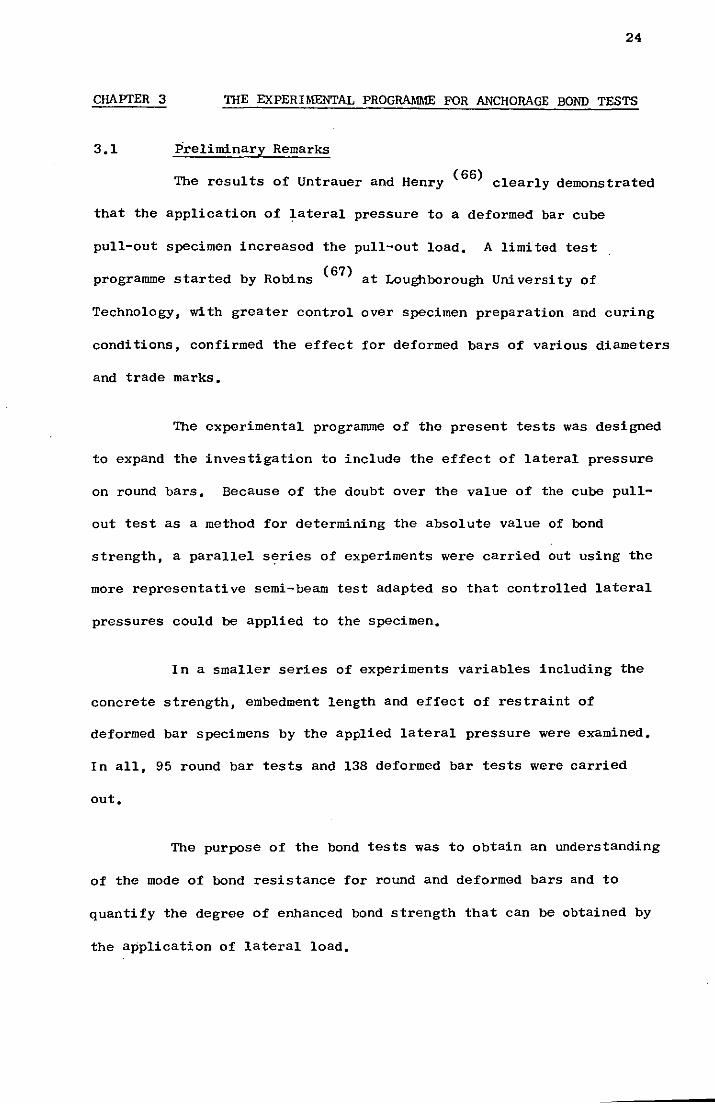
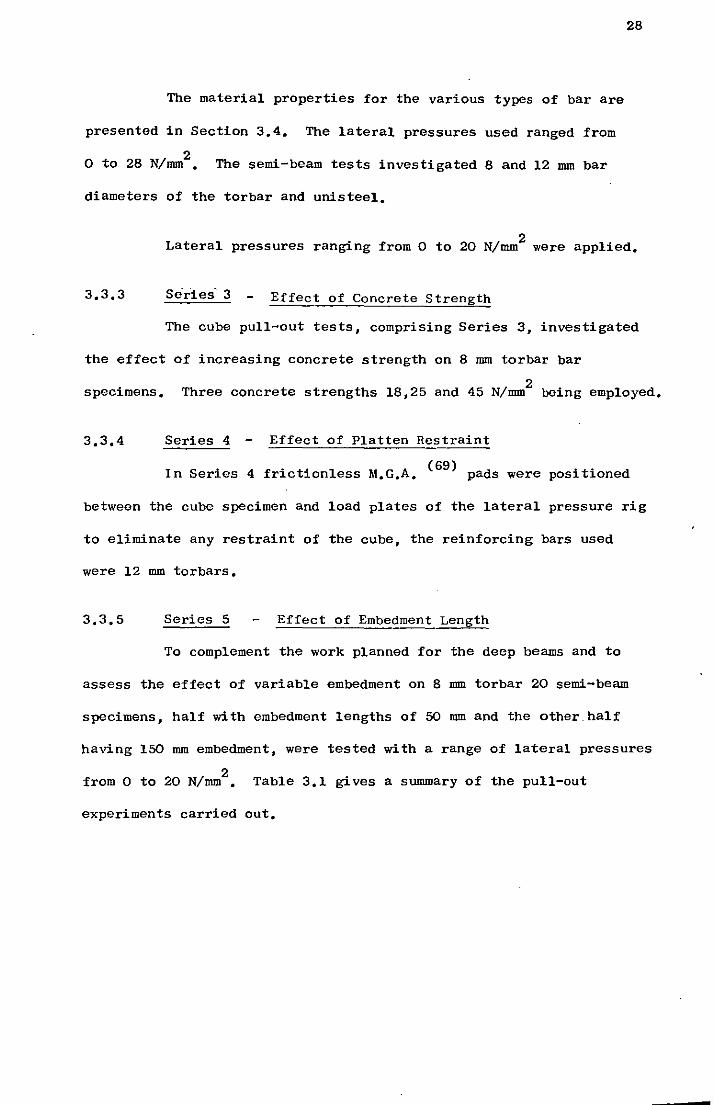
Experimental methods employed by Broms (27) and Goto (28)
of injecting resin and dyes into the interface of specimens where an
embedded bar in concrete cylinder is pulled at both ends, has shown
that as ultimate bond strength is approached, transverse cracking
occurs and there is no contact between bar and concrete at points
away from the bearing side of the ribs (Figure 2.3). The slopes of
the internal cracks, from 450
to SOo, indicate the trajectories along
which the compressive forces spread out into the concrete.
18
2.4 Important Factors Affecting Bond Strength
Various parameters are known to affect the bond strength
that can be mobilised at a bar/concrete interface. In the previous
section the importance of adhesion, friction and interlock in
developing bond resistance have been discussed. When recommending
the permissible bond strength, codes of practice normally make
reference to the effects of bar type and concrete strength. An
additional factor which can greatly influence bond strength is the
stress environment in the concrete around the bar. To a certain
extent this is acknowledged in CP 110 (2) by allowing higher
permissible bond strengths for bars in compression than in tension.
However, no mention is made of the effect on bond of the application
of confining stresses.
Taylor and Clark (64) remarked on the lack of quantitative
investigations on the effectiveness of lateral pressures in
increasing bond. They surmised that bond strengths, well in
excess of those normally assumed in design, could be expected at a
beam-column connection where the column load provides a normal stress
over the beam top steel. . (5)
Kong et al have also suggested that the
large bearing stresses which can occur in the vicinity of the
anchorage reinforcement in deep beams could have an advantageous
effect on the bond.
2.5 Confining Pressures and Bond
The increase of bond resulting from confining stresses is
not always due to directly applied external stress. Internal restraint
can have a similar effect.
19
Shrinkage has long been accepted as an important factor influencing
the strength of bond between concrete and round reinforcing bars.
Abrams (8) considered that the bond that developed after slip of the
bar was entirely due to sliding resistance and that the normal pressure
at the interface was partly due to initial stresses generated by
shrinkage. (26)
Later, Plowman stressed the importance of considering
the effect of shrinkage in the final analysis of results on bond tests.
Takaku and Arridge (58) developed a theoretical model to predict the
pull-out force required for steel wires embedded in an epoxy matrix;
the stress transfer was concluded to be a frictional process caused
by the normal compressive stress resulting from resin shrinkage.
The case for frictional forces being the main cause of bond
development in round bars was supported by the results of tests by
Abrams (8) in which an external pressure was applied to the specimens
during curing. The bond strengths of the samples which had set under
2 pressures of 0.04 and 0.7 N/mm were found to have increased by 9%
and 91% respectively when compared to the corresponding values of
concrete setting under normal conditions. Abrams (8) also observed
that it made little or no difference whether the concrete remained
under pressure for 1, 7 or 77 days.
The interfacial pressure, and hence the bond strength, is
also increased in the anchorage zone of pretensioned concrete members.
Glanville (11) explained how the expansion, or Poisson's ratio effect,
of the relaxed pretensioned wire in the anchorage region results in a
wedging action of the steel, thereby increasing confining pressure
and so giving greater bond resistance.
•
20
The greater average bond strength of bars in compression, rather than
tension, can be partly explained in a similar manner.
Cover will impart a contribution to the ultimate bond
strength of deformed bars embedded in concrete. For this type of
bar, where bursting forces are produced, the cover can have a
significant influence. Morita and Kaku (33) found that the bond
strength increased at a rate ranging from 0.05 to 0.17 N/mm2 per cm
of added cover. (29) " .
Ferguson and Thompson reported 1ncreases of
2 0.42 to 0.7 N/mm for increments of increased cover of 25 mm from
a clear cover of 37.5 mm up to 75 mm and Tepfers (62) observed a
200% increase in bond stress by increasing the clear cover from one
diameter to 4.5 bar diameters.
None of the present codes of practice however allow any
increase in bond strength for an increase in concrete cover above
the minimum, which is one bar diameter in all cases, except where
conditions of exposure demand more.
Transverse reinforcement will also resist the splitting
forces produced by deformed bars. The confining effect of stirrups
h b h t " th b d t th Kemp and W1"lhelm (32) ave een s own 0 1ncrease e on S reng •
make allowance for stirrups in an empirical pUll-out equation as does
Lutz (30) with the results of his eccentric pull-out tests. Orangun,
Jirsa and Breen (65) note the increase in bond strength resulting
from transverse restraint but emphasise that beyond a certain point
additional transverse reinforcement will no longer be effective and an
upper limit of ultimate bond will be reached.
21
Investigations into the effect of external confining
pressures on bond have been very few. Pinchin (46) applied a radial
compressive stress to specimens of wire embedded in concrete and found
that significant increases in the load necessary to cause pull-out
were required as the compressive stress was increased.
Untrauer and Henry (66) investigated the effect of a compressive
stress applied to two opposite faces of a pUll-out specimen in which
a deformed bar was embedded. They tested 37 6 inch normal weight
cube specimens with concrete strengths varying from 25 N/mm2 (3600 psi)
to 44 N/mm2 (7000 psi), two bar diameters were used (~ 9 and ~ 6).
The bond strength was found to increase with the square root of the
compressive stress applied to the specimen. Failure occurred in all
cases by splitting of the specimen. Specimens tested with normal
pressure developed a single longi tudinal crack which extended
perpendicular from one pressure face to the other, intersecting the
embedded bar. Without normal pressure the specimen could split into
three or four pieces.
The bond strength at failure was expressed in the form of
an empirical equation:
where 0 is the applied normal stress; n
f ' is the cylinder compressive strength; c
A and B are constants obtained from the test results.
slip gauge
slipc0& gauge
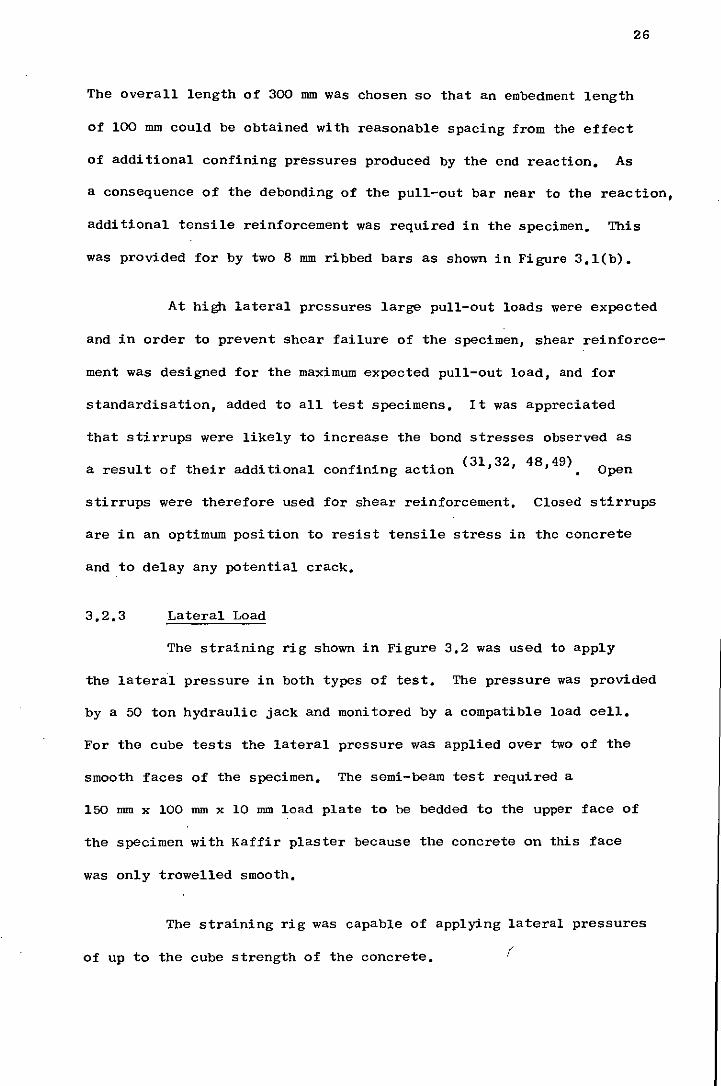
(a) Pull-out
..
plan top reinf.
It 111111111 i III ' ~ side view ,
-
(c) University of Texas cantilever
(b) Transfer beam test
slip~ gauge'
1\
(d) Semi-beam
22
..
__ ===il~lj~lll~ll~lI~ll~lI'~==i __ 1\ H 111111111111
(el ACI bea m test (fl Double PUllout
FIG. 2·1 BOND TESTING SPECIMENS
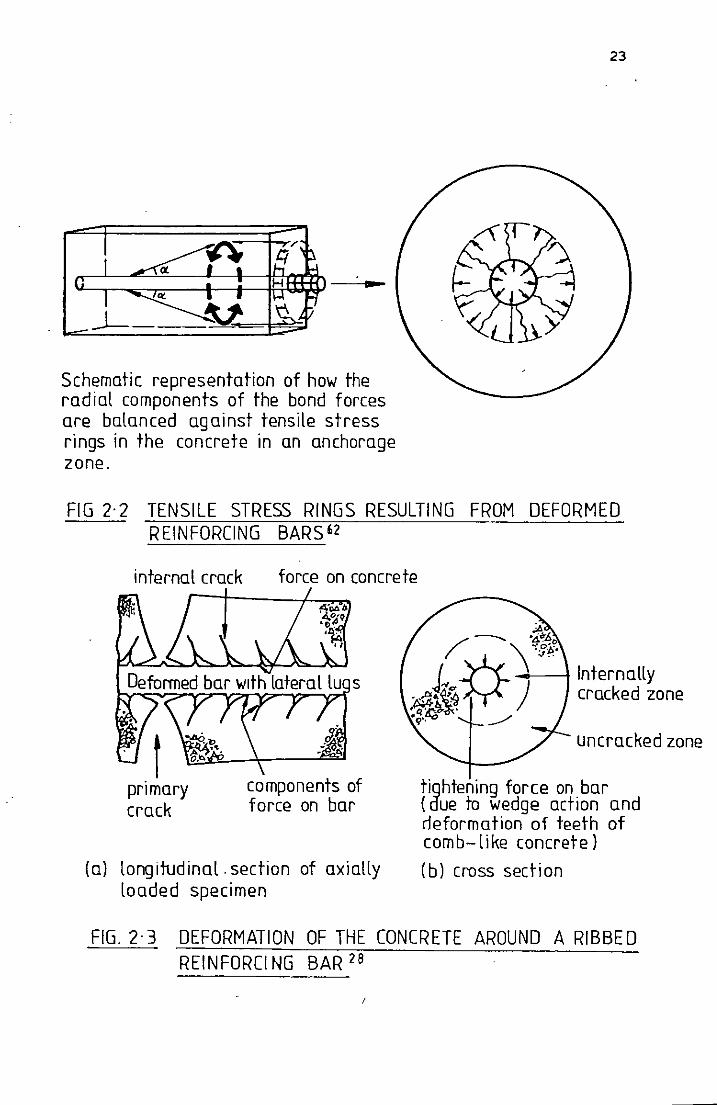
-Schematic representation of how the radial components of the bond forces are balanced against tensile stress rings in the concrete in an anchorage zone.
23
FIG 2·2 TENSILE STRESS RINGS RESULTING FROM DEFORMED REINFORCING BARS~2
internal crack
primary crack
force on concrete
components of force on bar
(a) longitudinal. section of axially loaded specimen
uncracked zone
tightening force on bar (due to wedge action and deformation of teeth of com b- like concrete)
(b) cross section
FIG.2·3 DEFORMATION OF THE CONCRETE AROUND A RIBBED REINFORCI NG BAR 28
24
CHAPTER 3 'mE EXPERIMENTAL PROGRAMME FOR ANCHORAGE BOND TESTS
3.1 Preliminary Remarks
(66) The results of Untrauer and Henry clearly demonstrated
that the application of lateral pressure to a deformed bar cube
pull-out specimen increased the pull-out load. A limited test
programme started by Robins (67) at Loughborough University of
Technology, with greater control over specimen preparation and curing
conditions, confirmed the effect for deformed bars of various diameters
and trade marks.
The experimental programme of the present tests was designed
to expand the investigation to include the effect of lateral pressure
on round bars. Because of the doubt over the value of the cube pull-
out test as a method for determining the absolute value of bond
strength, a parallel series of experiments were carried out using the
more representative semi-beam test adapted so that controlled lateral
pressures could be applied to the specimen.
In a smaller series of experiments variables including the
concrete strength, embedment length and effect of restraint of
deformed bar specimens by the applied lateral pressure were examined.
In all, 95 round bar tests and 138 deformed bar tests were carried
out.
The purpose of the bond tests was to obtain an understanding
of the mode of bond resistance for round and deformed bars and to
quantify the degree of enhanced bond strength that can be obtained by
the application of lateral load.
25
The results from these specific tests have then been used
to predict the anchorage requirements for the deep beam investigations
in Section 2.
3.2 Choice of Experimental Anchorage Tes·fs
The obvious choice for a simple and easily reproducable
bond test is the simple pull-out specimen.
Many of the investigations on bond have been carried out
with this test and reasonable confidence placed in the results.
However as a result of the recent unpopularity of the test, due to
the state of stress in the specimen, it was decided to compare the
results of pull-out tests to those from the semi-beam test. This
was thought to represent more adequately the strain gradient to be
expected in an anchorage situation.
3.2.1 Simple Pull-out
The pull-out test used was similar to the original standard
. (68) test specified by the British Standard Code of Pract1ce 114 : 1957 •
Figure 3.1(a) shows how the test bar is pulled from an unreinforced
cube of concrete. The specimen size chosen was a 100 x 100 x 100 mm
cube. This determined a length of embedment, which it was found,
permitted the various modes of failure for the range of bars that
were to be used for the further deep beam investigations. Lateral
pressures were applied to· two of the smooth faces not containing the
pull-out bar.
Semi-beam Test
The semi-beam specimen shown in Figure 3.I(b) is similar in
(32) the ratio of its dimensions to that employed by Kemp and Wilhelm
26
The overall length of 300 mm was chosen so that an embedment length
of 100 mm could be obtained with reasonable spacing from the effect
of additional confining pressures produced by the end reaction. As
a consequence of the debonding of the pull-out bar near to the reaction,
additional tensile reinforcement was required in the specimen. This
was provided for by two 8 mm ribbed bars as shown in Figure 3.1(b).
At high lateral pressures large pull-out loads were expected
and in order to prevent shear failure of the specimen, shear reinforce
ment was designed for the maximum expected pull-out load, and for
standardisation, added to all test specimens. It was appreciated
that stirrups were likely to increase the bond stresses observed as
a result of their additional confining action (31,32, 48,49) Open
stirrups were therefore used for shear reinforcement. Closed stirrups
are in an optimum position to resist tensile stress in the concrete
and to delay any potential crack.
Lateral Load
The straining rig shown in Figure 3.2 was used to apply
the lateral pressure in both types of test. The pressure was provided
by a 50 ton hydraulic jack and monitored by a compatible load cell.
For the cube tests the lateral pressure was applied over two of the
smooth faces of the specimen. The semi-beam test required a
150 mm x 100 mm x 10 mm load plate to be bedded to the upper face of
the specimen with Kaffir plaster because the concrete on this face
was only trowelled smooth.
The straining rig was capable of applying lateral pressures
of up to the cube strength of the concrete. (
27
Practically however it was found that failure occurred if the
lateral pressure was greater than approximately 0.85 feu for the
cube pull-outs and 0.6 feu for the semi-beam tests.
3.3 Anchorage Tests
Five series of semi-beam and cube pull-out tests were
carried out to evaluate the bond strength of both round and deformed
bars with the variables being lateral pressure, embedment length and
concrete strength. Outlined below is the full experimental
programme, method of fabrication of specimens, the materials used
and the testing method.
Serfes I 0-0 Round Bars
A total of 53 Dull-out tests were performed on
100 x 100 x 100 mm concrete cubes with embedment lengths of 100 mm.
8 mm and 12 mm plain round bars were studied with lateral pressures
2 ranging from 0 to 28 N/m •
As a parallel study to the cube series 42 semi-beam
specimens were tested with the same parameters of bond length, bar
diameter and range of lateral pressures.
Series 2 - Deformed Bars
The total number of pull-out tests carried out on deformed
bars was 98. The same size specimen and embedment as for the round
bars was employed but two different bar types and three bar
diameters were used. The two types of bars were torbar and a type of
unisteel available in the laboratory. 8, 12 and 16 mm diameter
torbar and unisteel were investigated.
The material properties for the various types of bar are
presented in Section 3.4. The lateral pressures used ranged from
2 o to 28 N/mm. The semi-beam tests investigated 8 and 12 mm bar
diameters of the torbar and unisteel.
28
Lateral pressures ranging from 0 to 20 N/mm2 were applied.
3.3.3 Effect of Concrete Strength
The cube pull-out tests, comprising Series 3, investigated
the effect of increasing concrete strength on 8 mm torbar bar
specimens. 2 Three concrete strengths 18,25 and 45 N/mm being employed.
Series 4 Effect of Platten Restraint
(69) d In Series 4 frictionless M.G.A. pa s were positioned
between the cube specimen and load plates of the lateral pressure rig
to eliminate any restraint of the cube, the reinforcing bars used
were 12 mm torbars.
3.3.5 Series 5 Effect of Embedment Length
To complement the work planned for the deep beams and to
assess the effect of variable embedment on 8 mm tor bar 20 semi-beam
specimens, half with embedment lengths of 50 mm and the other. half
having 150 mm embedment, were tested with a range of lateral pressures
2 from 0 to 20 N/mm. Table 3.1 gives a summary of the pull-out
experiments carried out.
29
3.4 Material Properties of Reinforcing Steel
The material properties for all reinforcing bars used
during the experimental work were obtained in accordance with
(70) SS 18 : 1962 and appear in Table 3.2.
The plain round bars were of mild steel and the deformed
bars used were two types of commercially available bars conforming
to SS 4449 (71) and SS 4461 (72) The 6, 8, 12 and 16 mm unisteel
bars were hot rolled high yield deformed bars as defined by SS 4449 (71)
with a distinct yield platform similar to that of the plain bars.
The 8, 12 and 16 mm torbar however were cold worked, high yield re-
(72) . inforcing bars as described by SS 4461 w1thout a well defined
yield and so the value of the 0.2% proof stress was determined.
3.5 Concrete Materials
3.5.1 Cement
Ordinary Portland cement provided by the Ketton Cement
Company was used throughout.
3.5.2 Aggregate
Fine aggregate was Lytag fine (5 mm down);
Coarse aggregate was Lytag medium grade (12 mm - 5mm).
Sieve analyses are given in Table 3.2.
3.5.3 Mix Details
The dry weight mix proportions used throughout the project
were constant and corresponded to the specifications recommended by
the manufacturers (73) 2 to give an average cube strength of 35 N/mm •
The mix proportions by dry weight 1 1.25 1.52
Total water/cement ratio 0.8.
30
It was necessary to adjust the wet weight mix proportions
significantly between supplies of the aggregates, The as - delivered
moisture content by dry weight varied from 0,1% to 7,6% for the
coarse aggregate and 4,1% to 16,5% for the fine aggregate,
3,6 Concrete strength
With the exception of Series 3 specime~ the same
concrete mix was used throughout the experimental programme, For
each batch of specimens the control specimens cast consisted of
three standard 100 mm cubes and one 150 mm x 300 mm cylinder, The
cubes and cylinder provide the crushing and splitting strength at
time of testing, The mean crushing and tensile strengths being
222 32,5 N/mm and 2,3 N/mm with standard deviations of 4,5 N/mm and
0,4 N/mm2
respectively,
Generally the control specimens were tested in a 120 Ton
Denison crushing machine. However a series of 10 cubes from five
mixes were crushed in a stiffer 250 Ton capacity Avery-Denison testing
machine, This machine was capable of providing a full stress/strain
history of the material, Lateral strain of the cube specimens was
measured using the rig shown in Plate 3,1, Graphs of load/longitudinal
deflection and lateral deflection/longitudinal deflection are shown
in Figures 3,3 and 3,4,
To ensure that platten restraint did not affect the values
of Poisson's ratio obtained in some tests, low friction M,G,A, (69)
pads were placed between the loaded faces of the cubes and platten,
31
Table 3.4 shows a summary of the values of Youngs Moduli
and Poisson's ratios. The low valuesof Young's Modulus are consistent
with results obtained by Grimer (74) who obtained a value of Young's
2 Modulus for Lytag of approximately 14.25 kijlmm • Mihul (75) also
2 obtained values of Young's ModulUS in the range 13 - 17.5 k'wmm •
Table 3.5 gives a summary of static Young's Moduli for Lytag.
The stress/strain curves for lightweight concretes, up to
the point of maximum stress, have been observed to be straighter than
those for gravel concretes of the same strength. This reflects the
much lower degree of internal cracking in lightweight concretes prior
to failure, resulting from the more uniform elastic properties of the
aggregate and matrix and the consequent low intensity of self induced
stresses.
The more homogenous properties of Lytag lightweight concrete
are most clearly demonstrated in the cylinder splitting test.
Gerritise (76) explains how the failure plane is able to pass directly
through the aggregate and cement matrix rather than around the
perimeter as occurs with stronger gravel aggregate.
Rather surprisingly the experimental values for Poisson's
ratio obtained with and without end restraint of the loading faces
of the cube specimens were very similar. The average value of 0.13 is
however slightly lower than the range of 0.15 to 0.20 suggested for
(77) lightweight concrete by Neville
32
3.7 Shrinkage
In Section 2.3.2 it was stated that one of the main parameters
influencing the bond strength mobilized by round bars was the shrinkage
of the concrete matrix. For this reason shrinkage experiments were
carried out on samples described in B.S. 1881 : part 5 : 1970 (78)
Although the apparatus in the British Standard (78) was used, the
method was varied in that the samples were cured under conditions
similar to those of the pull-out specimens.
Two series of tests were performed. Seven specimens were
cured under water at 200Cand 4 were painted with rite-cure after
stripping and cured in the laboratory environment. Rite-cure is a
commercially available curing paint which is applied to prevent
excessive moisture loss from concrete at an early age. The change in
length of the specimens was measured at regular intervals using a
dial gauge graduated to 0.002 mm. More frequent measurements were
taken at early ages when the changes in length were expected to be
most rapid.
3.7.1 Results of Shrinkage Experiments
Figures 3.5 and 3.6 show the values of shrinkage of the
specimens and the rate at which they were attained. Although the trend
is clear the results are variable.
For air cured specimens (Figure 3.5) the 28 day shrinkage
values ranged from 850 to 1300 microstrain ( pE). However curing
under water (Figure 3.6) resulted in specimens both shrinking and
swelling, the variation being from 250 ~E shrinkage to 100 ~E
swelling at 28 days.
33
Shrinkage results from two separate mechanisms.
1. The loss of water from around the cement paste, ie. drying
shrinkage.
2. The removal of zeolitic water. Calcium silicate hydrate and
C4A,results of the hydration process, have been shown to undergo
o a change in lattice spacing from 14 to 19 A on drying resulting
in a reduction of volume.
The actual value of shrinkage will be affected by the size,
amount and nature of aggregate and the presence of materials such as
(79) gypsum
The dry shrinkage value is affected by the method of
curing and this is apparent from the test results. Although
Neville (77) suggests that approximately 30% of the drying shrinkage
is irreversible, concrete cured continuously in water from thetime of
casting exhibits a nett increase in volume and an increase in weight.
This swelling is due to the absorption of water by the cement gel;
the water molecules act against the cohesive forces in the gel tending
to force particles further apart.
The observation from this series of shrinkage tests is
that variation is to be expected in the initial value of shrinkage
of the concrete. It is dependent on the curing conditions and age of
the mix. The upper value of shrinkage for the Lytag mix used can be
taken as approximately equal to 1000 ~e after 28 days and a lower bound
value of 300 pe which reflects the degree of irreversible shrinkage
suggested by Neville (77) for specimens cured under water.
34
The air cured specimens achieved 95% of the maximum
shrinkage by 30 days, while the water cured specimens attained this
value of shrinkage or swelling by 12 days.
3.7.2 Discussion of Shrinkage EXperiments
The values of dry shrinkage compare well with values given
by Neville (77) for lightweight aggregate concrete. Surprisingly
however the experimental values are of the order of 5 times greater
than the shrinkage value suggested by the Lytag General Information
Brochure (73) which gives a value of not more than 200 ~e for
shrinkage in normal conditions of temperature and humidity.
3.8 Fabrication of Specimens
Both the cube and semi-beam specimens were cast in
timber moulds. The pull-out cubes were fabricated in batches of 8
in one partitioned mould with the bars supported horizontally at the
axis of the cube. The bars were carefully degreased and cleaned
using acetone and the free end of the bar wired to the base of the
mould to ensure no disturbance of the interface as a result of
vibration.
The semi-beam specimens were cast in pairs. The bars were
supported horizontally with the axis of the bars 40 mm above the
bottom of the mould. The bonded area of the bar was thoroughly
cleaned and degreased with acetone, but the portion to be left un-
bonded was greased and covered with a casing of polystyrene to ensure
no additional restraint. The reinforcement was placed in the mould
and wired down securely.
The shear ~age, provided to prevent premature shear failure of the
specimen, was then placed in the mould and the concrete poured in.
35
The control specimens consisted of three 100 mm cubes and
one 150 mm cylinder. Vibration of the specimens was carried out on a
vibrating table in the laboratory. After curing under laboratory
conditions for 24 hours the specimens were demoulded and cured under
water at a constant 200
C until testing at 28 days.
3.9
3.9.1
Testing Methods
Pull-out Tests
The pull-out experiments were carried out in an Amsler
400 kN hydraulic testing machine. The cube was set up on a loading
table on the moving beam of the machine and adjusted so that an axial
load was transmitted through the bar to the cube. A rubber pad was
placed between the loaded face of the cube and loading table to reduce
restraint of the specimen.
The lateral pressures were applied by means of the straining
rig, see Section 3.2.3. This was set up on the beam of the Amsler machine
at the beginning of each test series and carefully aligned and squared
so that uniform load was applied to the loaded faces of the cube.
3.9.2 Semi-beam Tests
The semi-beam specimen was prepared by placing
100 x 25 x 10 mm steel loading blocks bedded in Kaffir plaster to the
reaction positions (1) and (2) in Figure 3.7. The specimen after
hardening of the plaster (approximately 3 hours) was positioned
and supported on rollers in the semi-beam rig. The pull-out load
was applied by means of a 100 kN hydraulic jack.
The load was measured by means of a suitable load cell positioned
between the end of the jack and the CCL wedge anchor used to jack
against.
Lateral pressures were applied by the straining rig.
36
However for this test it was found necessary to suspend the rig by
a wire strop from the cross member, Plate 3.2, so that any rotation
of the specimen during testing could be accommodated without restraint.
The end of the straining rig furthest from the point of balance was
supported on rollers so that the rig remained level throughout test
ing. Again the straining rig was set up to the required level and
position before each series of tests. To ensure uniform loading of
the lateral pressure a 150 x 100 x 10 mm loading plate was bedded to
the semi-beam at the required position on the upper face where there
was a rough concrete finish.
3.9.3 General
The required lateral load was first applied to the
specimen under test and then the pUll-out load was applied at a rate
of approximately 5 kN per minute. Free-end slip measurements were
taken at regular intervals using a dial gauge graduated to 0.01 mm.
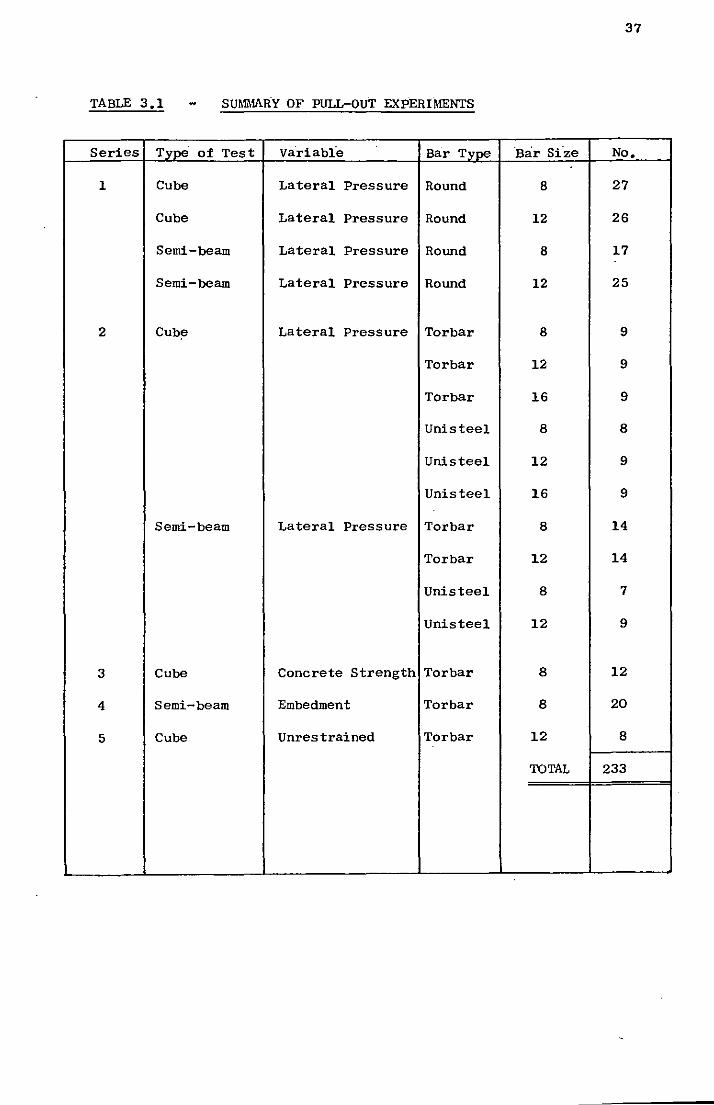
37
TABLE 3.1 SUMMARY OF PULL-OUT EXPERIMENTS
Series Type' of Test Variable Bar Type 'Bar si'ze No.
1 Cube Lateral Pressure Round 8 27
Cube Lateral Pressure Round 12 26
Semi-beam Lateral Pressure Round 8 17
Semi-beam Lateral Pressure Round 12 25
2 Cub~ Lateral Pressure Torbar 8 9
Torbar 12 9
Torbar 16 9
Unisteel 8 8
Unisteel 12 9
Unisteel 16 9
Semi-beam Lateral Pressure Torbar 8 14
Torbar 12 14
Unisteel 8 7
Unisteel 12 9
3 Cube Concrete Strength Torbar 8 12
4 Semi-beam Embedment Torbar 8 20
5 Cube Unrestrained Torbar 12 8
TOTAL 233
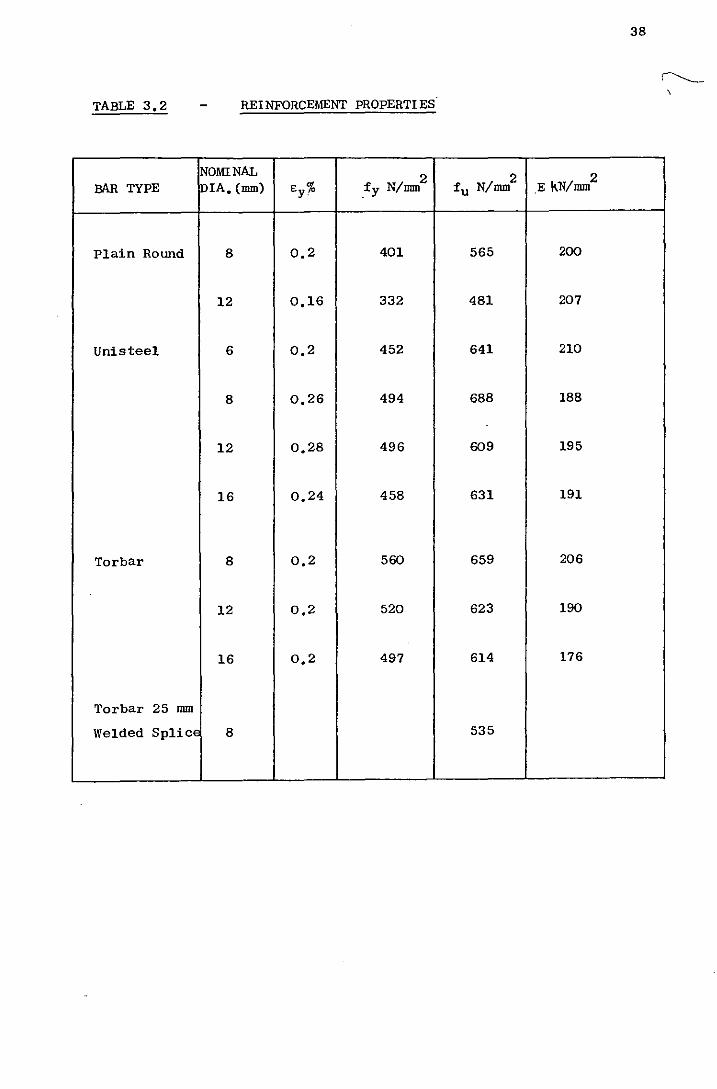
38
, TABLE 3,2 REINFORCEMENT PROPERTIES·
NOMINAL 2 2 .E kN/mm2 BAR TYPE PIA, (mm> Ey% fy N/mm fu N/mm
Plain Round 8 0,2 401 565 200
12 0,16 332 481 207
Unisteel 6 0,2 452 641 210
8 0,26 494 688 188
12 0,28 496 609 195
16 0,24 458 631 191
Torbar 8 0,2 560 659 206
12 0,2 520 623 190
16 0,2 497 614 176
Torbar 25 mm
Welded SpliCE 8 535
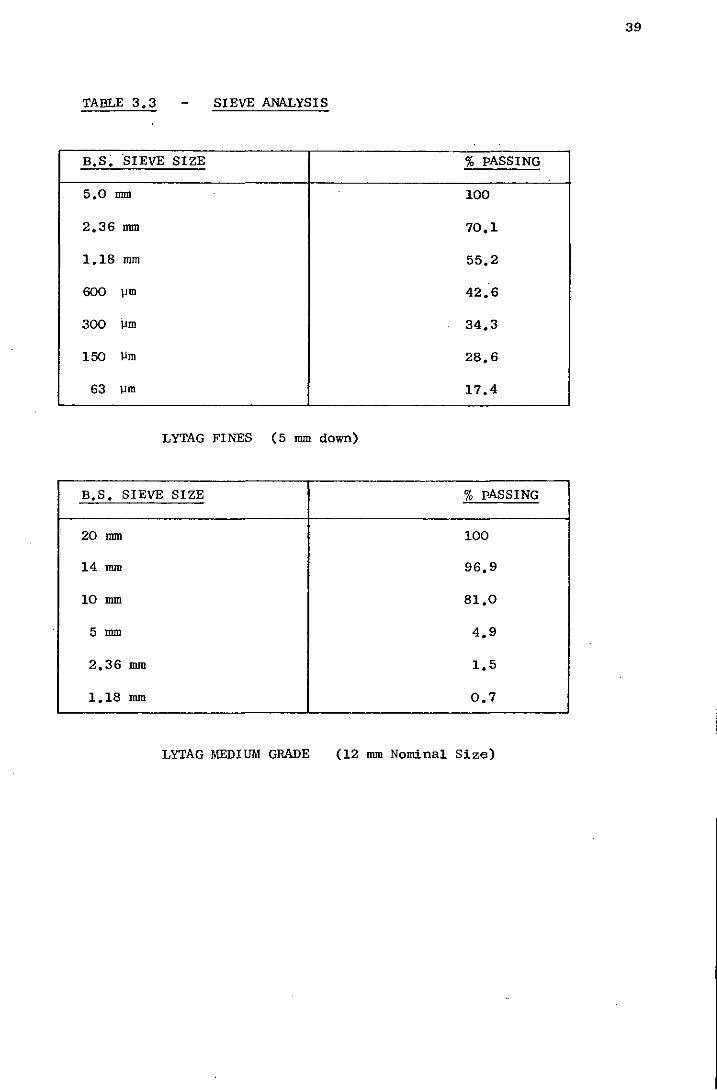
39
TABLE 3.3 SIEVE ANALYSIS
B.S;SIEVE SIZE % pASSING
5.0 mm 100
2.36 mm 70.1
1.18 mm 55.2
600 \lID 42.6
300 \lm 34.3
150 \lm 28.6
63 \lm 17.4
LYTAG FINES (5 mm down)
B.S. SIEVE SIZE % pASSING
20 mm 100
14 mm 96.9
10 mm 81.0
5mm 4.9
2.36 mm 1.5
1.18 mm 0.7
LYTAG MEDIUM GRADE (12 mm Nominal Size)
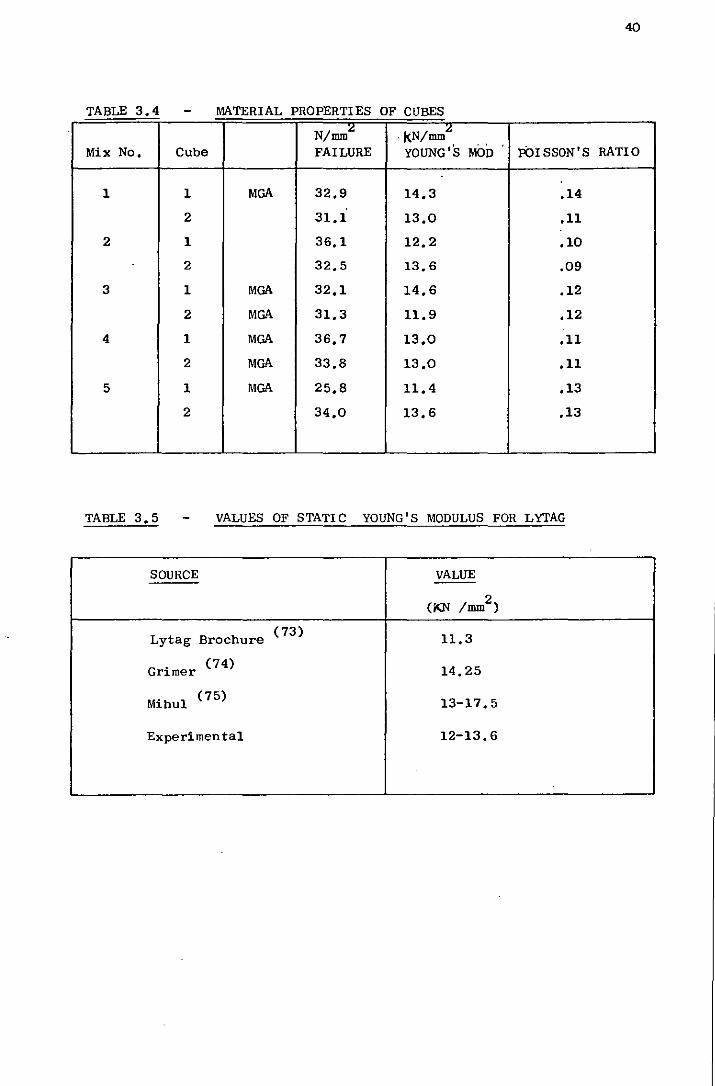
40
TABLE 3 4 , MATERIAL PROPERTIES OF CUBES
N/mm" -kN/mm" Mix No, Cube FAILURE YOUNG'S MOD PiJISSON'S RATIO
1 1 MGA 32,9 14,3 ,14
2 31.1 13,0 ,11
2 1 36,1 12,2 ,10
2 32,5 13,6 ,09
3 1 MGA 32,1 14,6 ,12
2 MGA 31,3 11,9 ,12
4 1 MGA 36,7 13,0 ,11
2 MGA 33,8 13,0 ,11
5 1 MGA 25,8 11,4 ,13
2 34,0 13,6 ,13
TABLE 3,5 VALUES OF STATIC YOUNG'S MODULUS FOR LYTAG
SOURCE VALUE
(KN /mm2)
Lytag Brochure (73) 11,3
Grimer (74) 14,25
Mihul (75) 13-17,5
Experimental 12-13,6
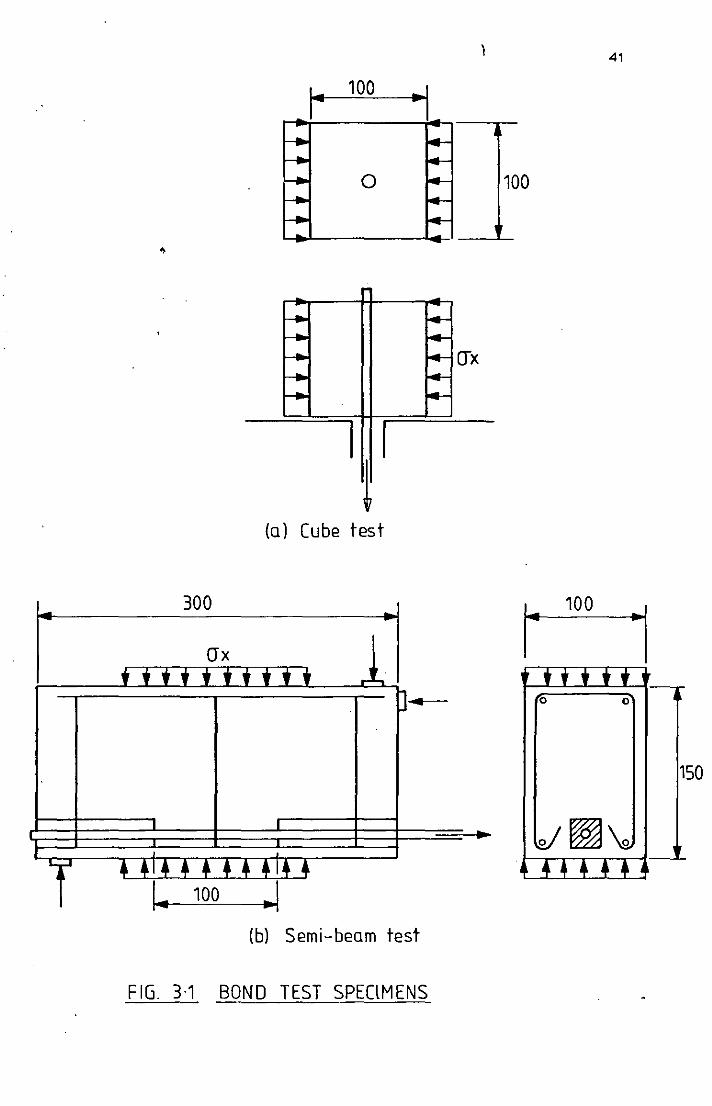
....
... ,...
,
o 100
I I ~
(a) Cube test
300
(J"x ....... , .. r-'-,
~L
•• 1 ••• + + +1+ + I .. 100
~
]---
(b) Semi-beam test
FIG. 3·1 BOND TEST SPEClMENS
~
41
100
~I
o 0
150
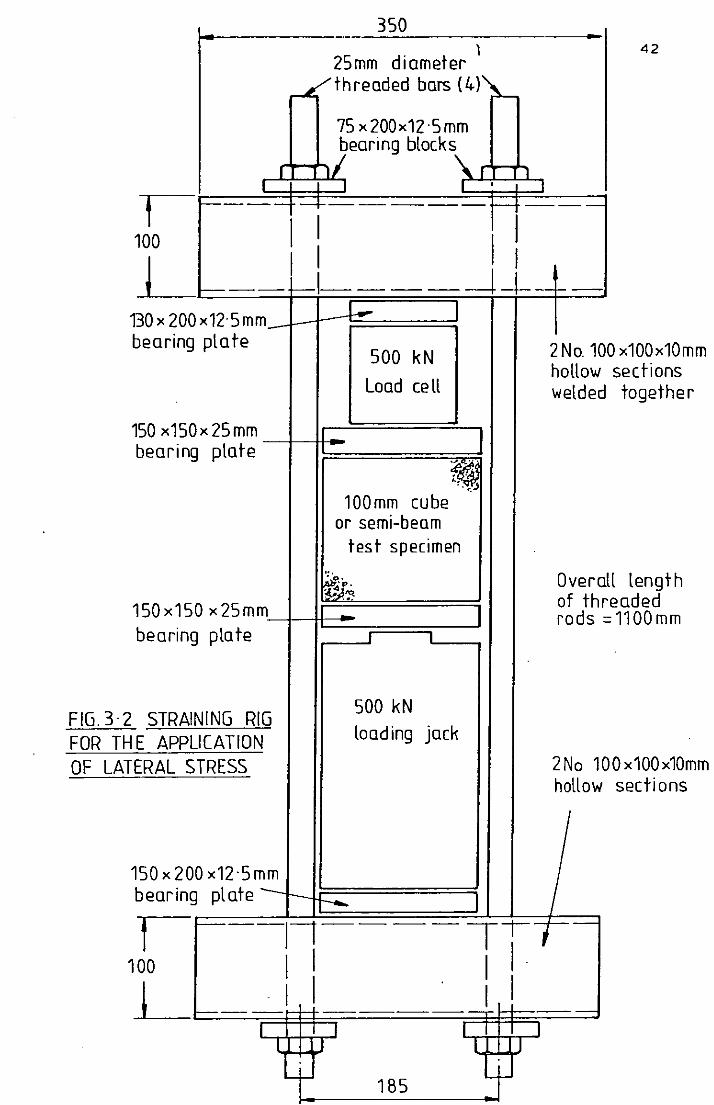
350
25mm diameter \ 42
threaded bars (4) ;L
75 x200x1Z·5mm
I
l)earing blOCkS\ I
I I L , I I f--. _.-+ ---t---
I I I I t 100
L I I I f---- f-I- - -- -- -J -t--f-
130 x 20 bearin
Ox12·5mm 9 plate
Ox25mm 150 x15 bearing plate
50 x25mm 150x1 bearin g plate
INING RIG LlCATION
FIG.3·2 STRA FOR THE APP OF LATERAL STRESS
00 x12·5mm 150x2 bearin g plate-
1 f.-C-.
100
L l-
1 I
1-
500 kN
Load cell
t~ .. _.J
100mm cube or semi-beam
tes t specimen , .. ~ .. ~~'i<
I1 1 I
500 kN loading jack
I--Ir-
2No.10 hollow welded
o x100x10mm sections together
Overall length eaded 1100 mm
of thr rods =
2No 10 hollow
I
Ox100x10mm sections
11 I I
1 1 ,-
I I I 1 I I t-I-+ -- 1-+-. --
1 I 1 J I I
~ 185 4-
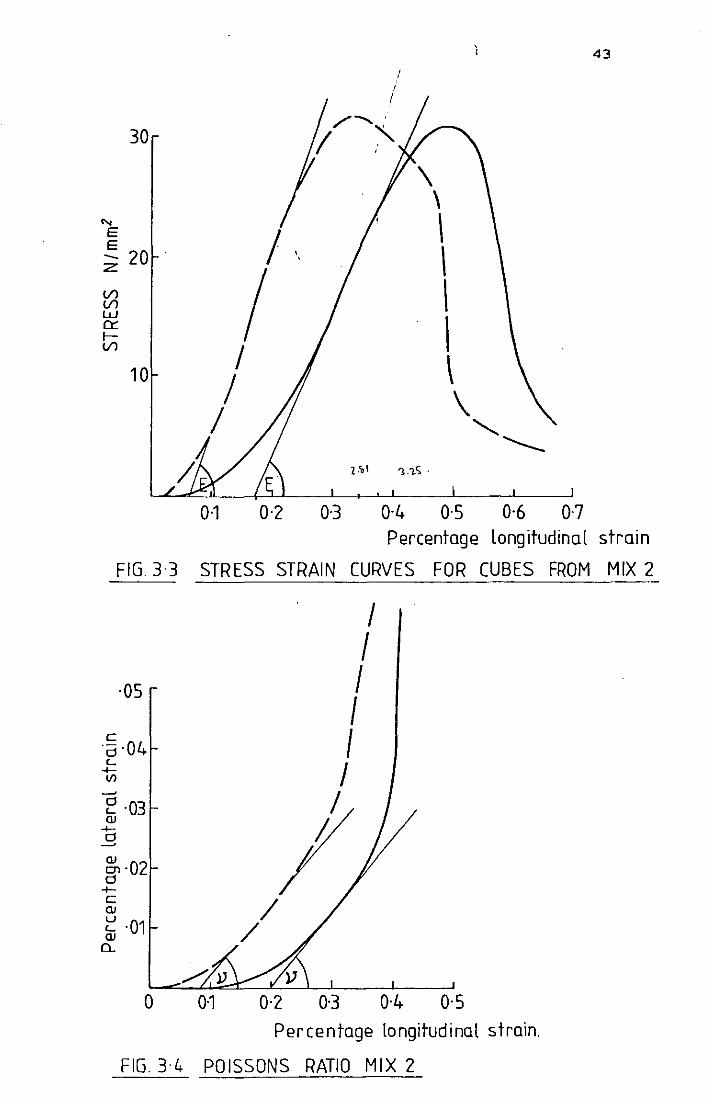
43
30
\ \
'" E / E -- 20
, , :z:
/ (/) (/) w 0::: l-(/)
/ 10 /
/
\ \ I I \ \
""------1·~1 ".1.~ .
0·1 0·2 OJ 0·4 0·5 0·6 0·7 Percentage longitudinal strain
FIG.3·3 STRESS STRAIN CURVES FOR CUBES FROM MIX 2
·05
c ·Cj·04 L.. ...... III ~
~ ·03 QJ ...... E
~'02 d ...... C QJ
~ ·01 QJ
0..
o
I I I I I /
/ ~
003 0·4 0·5 Percentage longitudinal strain.
FIG.3·4 POISSONS RATIO MIX 2
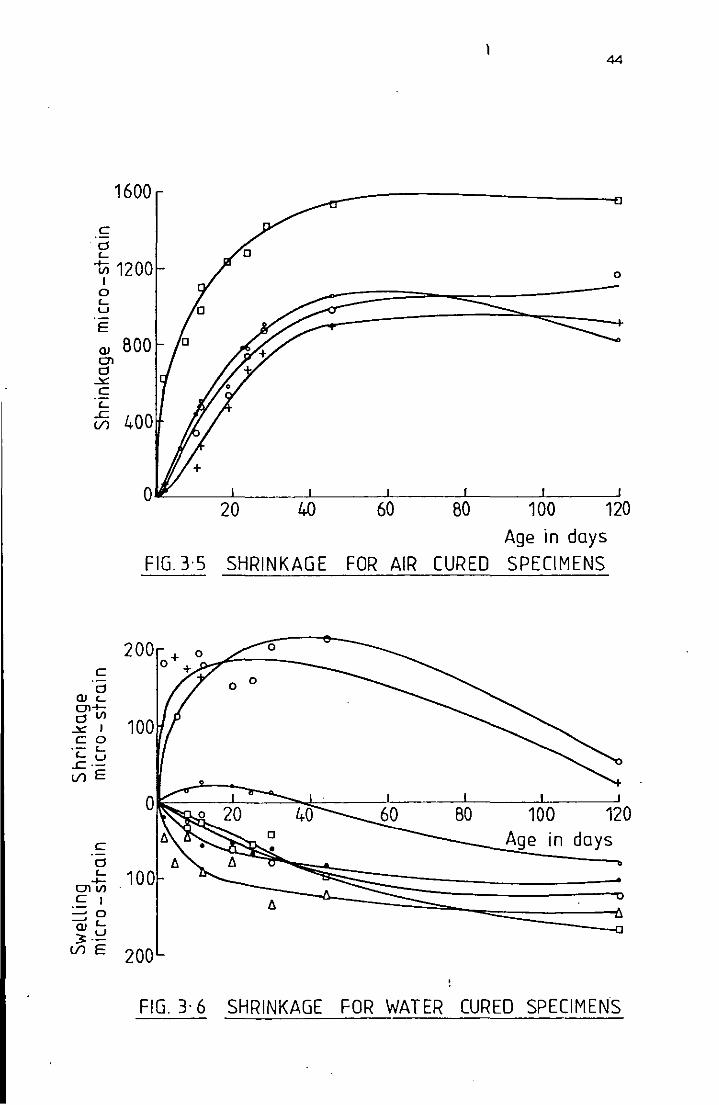
l 44
1600
c d L
lii 1200 0 I
0 L U
E
Q) 0'1 d ~ c
·L .r:. !/l
800
400
o~----~----~----~------~----~----~ 20 4f) 60 80 100 120
Age in days
FIG.3·5 SHRINKAGE FOR AIR CURED SPECIMENS
o
c d
Q)L O'l+-
] '7 100 co
0C: tJ .r:. .-!/lE
C
d
0~--~~~~40~--~~--~----1~070--~120
Cl Age in days • J: 100
0'1 VI .~ I ~o ~L Q)u 3·
!/lE 200
FIG. 3· 6 SHRINKAGE FOR WATER CURED SPECIMENS
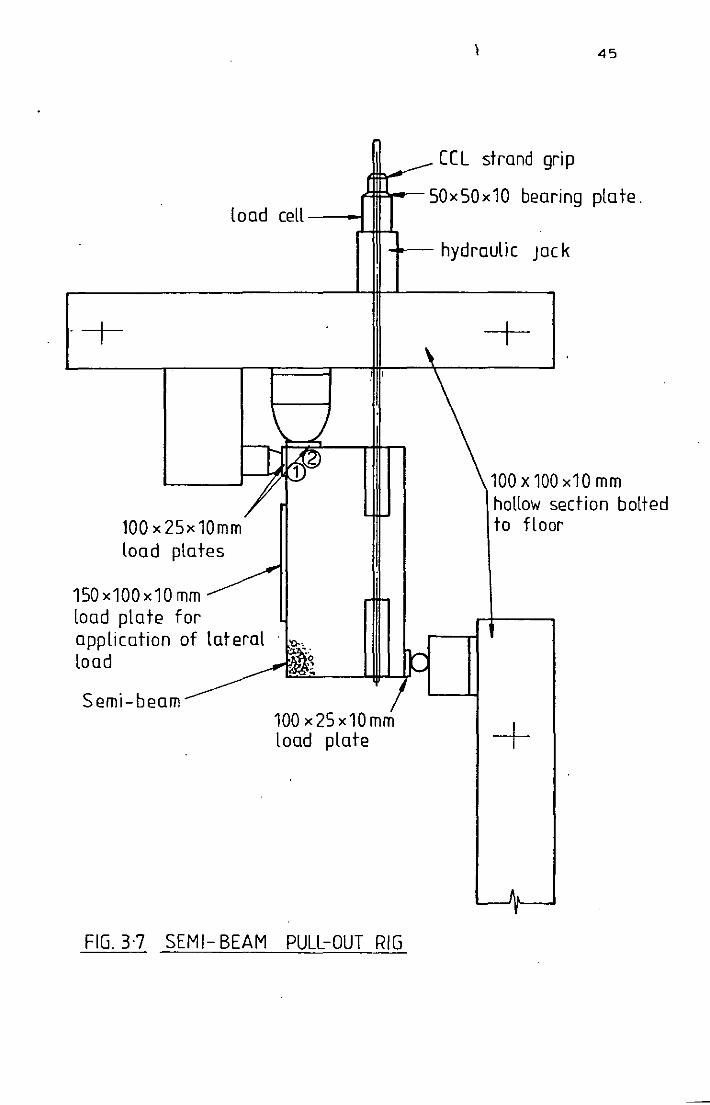
\ 45
CCl strand grip
"'*I=!r--50x50x10 bearing plate. load cell----I
+
100 x 25x 10mm load plates
\ J
150x100x10 mm ~ load plate for application of lateral load
Semi-beam
-+--- hydraulic JOc k
'\ -+
100 x 100 x10 mm hollow section bolted to floor
100x25x10mm + load plate
, FIG.3·7 SEMI- BEAM PUll-OUT RIG
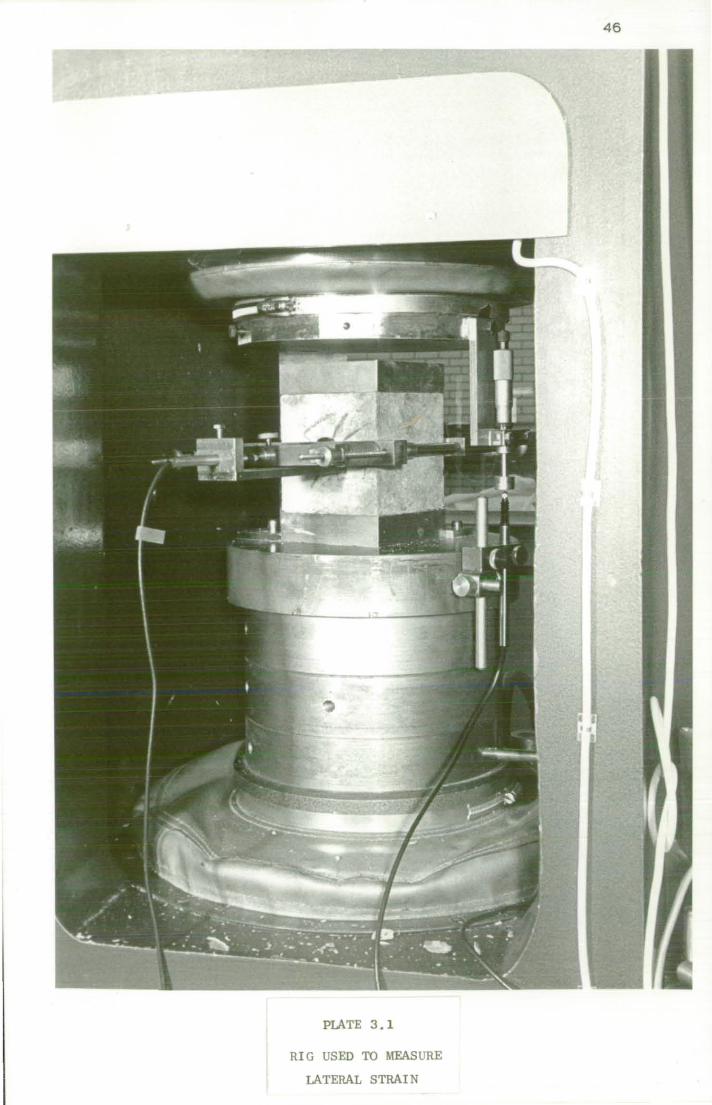
PLATE 3.1
RIG USED TO MEASURE
LATERAL STRAIN
4 6
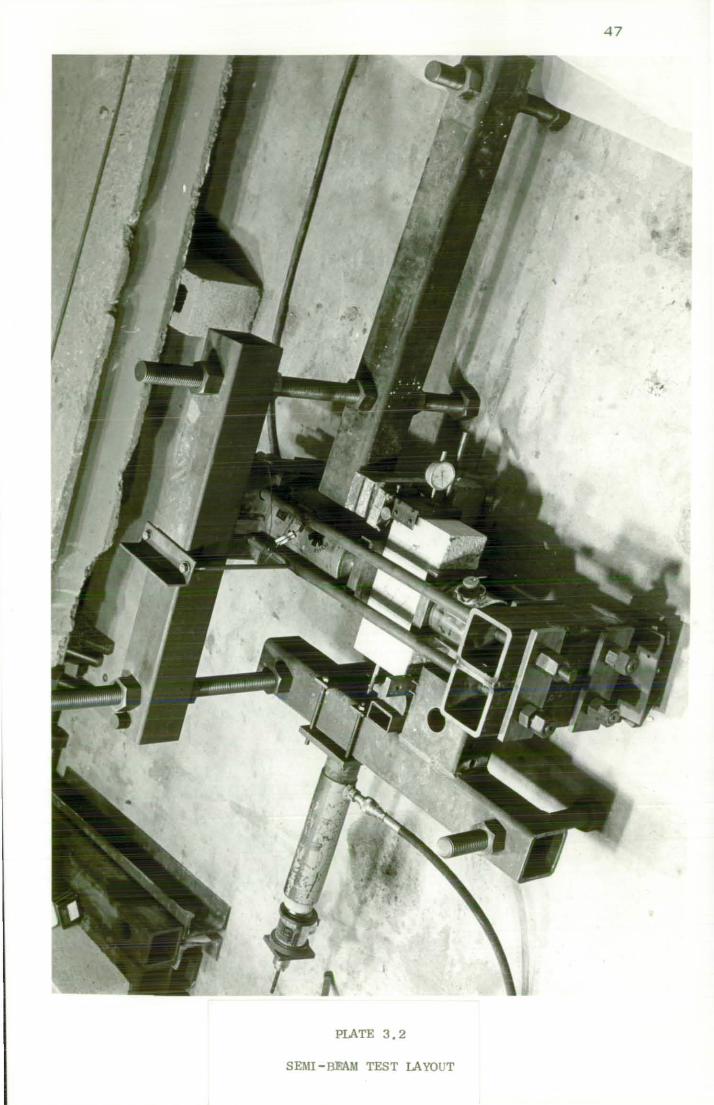
PLATE 3.2
SEMI-BEAM TEST LAYOUT
47
48
CHAPTER 4 PRESENTATION AND DISCUSSION OF ANCHORAGE BOND TESTS
4.1
4.1.1
Series 1 Round Bars
Ultimate Bond Strength
Figures 4.1 and 4.2 show the effect of lateral pressure on
pull-out loads for the 8 mm and 12 mm round bars for both the cube
and semi-beam tests. There is a clear trend of increasing bond
resistance with increasing lateral pressure. Although there is
obvious scatter between results the best fit straight lines
(Appendix A) presented in Figure 4.3 show that there is a significant
correlation to support the conclusion that there is a direct
relationship between the ultimate pull-out load and the lateral stress
applied.
For a lateral stress of 28 N/mm2 an increase.of pUll-out
load of 260% on the value for no lateral stress was obtained for
12 mm pull-out tests. For the 8 mm bars the corresponding increase
was approximately 200%.
4.1.2 Load/Slip Behaviour
The typical bond/free-end slip curves of Figures 4.4 -
4.7 show how the lateral stress affects bond behaviour not just at
the ultimate but at all stages of the loading. An increase in
lateral stress has the effect of displacing the load/slip curves
upwards; that is, the load needed to· cause a particular value of
end slip increases with increasing lateral stress. This is more
clearly demonstrated by Figures 4.8 and 4.9 which show the relation
between the lateral stress and the bar force needed to produce
arbi trary free-"end slips of .03 mm and .05 mm for 12 mm round bars.
49
The exact significance of the values of the load/slip
relation is difficult to estimate since it is obviously dependent
on the type of specimen, the length of embedment and stress in the
steel. Figures" 4.4 - 4.7 are therefore presente~ only to show the
trend occurring as lateral pressure is increased.
4.1.3 Mode of Failure
The type of failure for all the round bar specimens was
similar whatever lateral stress was applied. On initial application
of the pull-out load little slip was observed until at a slip of
0.02 mm - 0.03 mm the load/slip gradient reduced significantly.
The load carried by the bar continued to increase with increasing
slip until sudden failure occurred at a value of free-end slip of
" approximately 0.06 mm. The bar left a smooth polished surface in
the concrete with some evidence of concrete paste adhering to the
bar. No splitting of the specimens occurred.
The first recorded slip obviously corresponds to the
complete debonding of the specimen since for all the author's
experiments only free-end slips have been recorded. The bond
"resistance before the point at which free-end slip is observed
results from two of the effects discussed in Section 2.3. Firstly,
"there is adhesion between the bar and the concrete and where this
has broken down a frictional effect. Plowman (26) stated that the
adhesional effect would break down once the elastic limit of the
gel had been exceeded and that this point corresponded to a steel
strain of 0.001. Bartos (47) provides graphs explaining these phases
of bond transfer; the cases of no debonding and partial debonding and
their relation to embedment length.
50
At some value of load the adhesion is broken all along the
bar and the resistance is now due solely to the frictional effect;
this situation corresponds to the flatter portion of the load/slip
curve. Mortar left adhering to the surface of the bar supports the
conclusions of Brown (56) and Alexander (55) who showed that the
plane of shear failure in the matrix is likely to occur within the
concrete rather than at the cement/steel interface. This shear
failure zone creates an interface separating the matrix adhering to
the surface of the steel reinforcement from the rest of the matrix.
Hence once the shear strength of the matrix has been exceeded, and
the new interface created, the magnitude of the force needed to
start and to maintain the slipping of the reinforcement is governed
by the laws of friction. A theoretical approach based on this
reasoning is pursued in Chapter 5.
4.1.4 Effect of Bar Size
The results from either the semi-beam or cube tests show
that the average ultimate bond stress at corresponding lateral loads
is similar for both bar sizes. The larger bar, ·however, mobilises
slightly greater average bond strengths as the lateral stress is
increased.
The effect of bar size has given contradictory results,
but the general conclusion is that it is a relatively unimportant
parameter for round bars. Abrams (8) noticed that smaller bars gave
higher resistance for equal values of end slip but that the maximum
bond strength was nearly constant. His tests on 12.5 mm, 24 mm and
2 32 mm bars gave a value of maximum bond resistance of 2.7 N/mm •
51
Glanville (11) assumed th t bo d t i i 1 a n s ress s nverse y
proportional to the total radial movement at the interface between
the steel and concrete:
where u
u v s
is the radial displacement;
E Youngs Modulus for steel; s
v Poisson's ratio for steel; s
4.1
Pa
the actual load in the bar at any section;
d the bar diameter.
This theory implies that the average bond resistance
developed by bars of different sizes depends only on the lengths.of
embedment and is independent of the. bar size.
(12) Gilkey, Chamberlin and Beal reported that comparison
between 6.5 mm and 9.6 mm bars showed no consistent difference
between bar sizes. Rehm (41) like Abrams (8) found that small bars
were superior to large bars for small displacements, although when
the surface profiles, i.e. height and spacing of peaks, were
proportional to bar. diameter the larger bars gave a higher maximum
bond resistance. Helmy (80) concluded that bond strength decreased
as the diameter increased, but explained this as being due to the
smaller bars having a more irregular cross section.
4.2 Series 2 Deformed Bars
4.2.1 Ultimate Bond Strength
The contrasting effect of lateral pressures on deformed bars
as compared to round bars is shown in Figures 4.10 to 4.14.
52
As expected the pull-out load for zero lateral pressure is
significantly higher for a deformed bar than a similar sized round
bar, as is the initial rate of increase of bond strength with lateral
pressure. The experimental results for the deformed bars exhibit
a similar trend of increasing bond strength with lateral pressure
as shown by Untrauer and Henry's (66) tests over the range of
lateral stress within which most of their results fell. However,
above a lateral pressure of about 10 N/mm2 (0.3 x cube strength)
there is a clear levelling off of ultimate load. For the 8 mm bars
this might perhaps be expected as the pUll-out load is close to the
compliance of the bar, and for some specimens the bars failed in
tension rather than as a result of bond failure. The 12 mm bars
however show this platform at approximately the same value of
average bond for values of bar stress well below the 0.2% proof
stress; the indication being then that this levelling off in bond
strength is notdue to a limiting strength property of the bar but
rather of the concrete matrix.
Although an increase in lateral pressure was only
effective in increasing the pUll-out load for values of pressure up
2 to about 10 N/mm the additional bond mobilized was significant.
For the 8 mm bars the minimum increase in bond strength was 37% of
the unconfined value and for the 12 mm bars the corresponding increase
was 75%.
4.2.2 Load/Slip Behaviour
The load/free-end slip curves for deformed bars shown in
Figures 4.15 and 4.16 are similar to those of the round bars in that
the load/slip curves are displaced upwards by increasing lateral
pressure, although the shift is not so marked as with round bars.
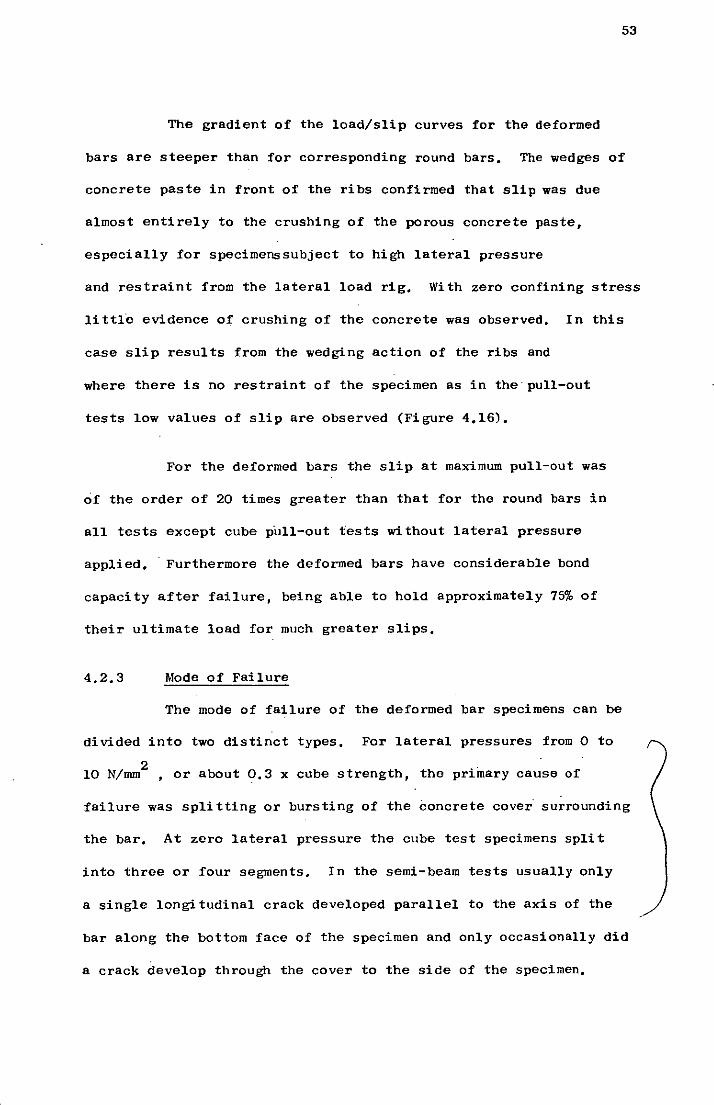
53
The gradient of the load/slip curves for the deformed
bars are steeper than for corresponding round bars. The wedges of
concrete paste in front of the ribs confirmed that slip was due
almost entirely to the crushing of the porous concrete paste,
especially for specimens subject to high lateral pressure
and restraint from the lateral load rig. With zero confining stress
li ttl" evidence of crushing of the concrete was observed. In this
case slip results from the wedging action of the ribs and
where there is no restraint of the specimen as in the· pUll-out
tests low values of slip are observed (Figure 4.16).
For the deformed bars the slip at maximum pull-out was
of the order of 20 times greater than that for the round bars in
all tests except cube p·ull-out tests wi thout lateral pressure
applied. Furthermore the deformed bars have considerable bond
capacity after failure, being able to hold approximately 75% of
their ultimate load for much greater slips.
4.2.3 Mode of Failure
The mode of failure of the deformed bar specimens can be
divided into two distinct types. For lateral pressures from 0 to
2 10 N/mm ,or about 0.3 x cube strength, the primary cause of
failure was spli tting or bursting of the concrete cover· surrounding
the bar. At zero lateral pressure the cube test specimens spli t
into three or four segments. In the semi-beam tests usually only
a single longitudinal crack developed parallel to the axis of the
bar along the bottom face of the specimen and only occasionally did
a crack develop through the cover to the side of the specimen.
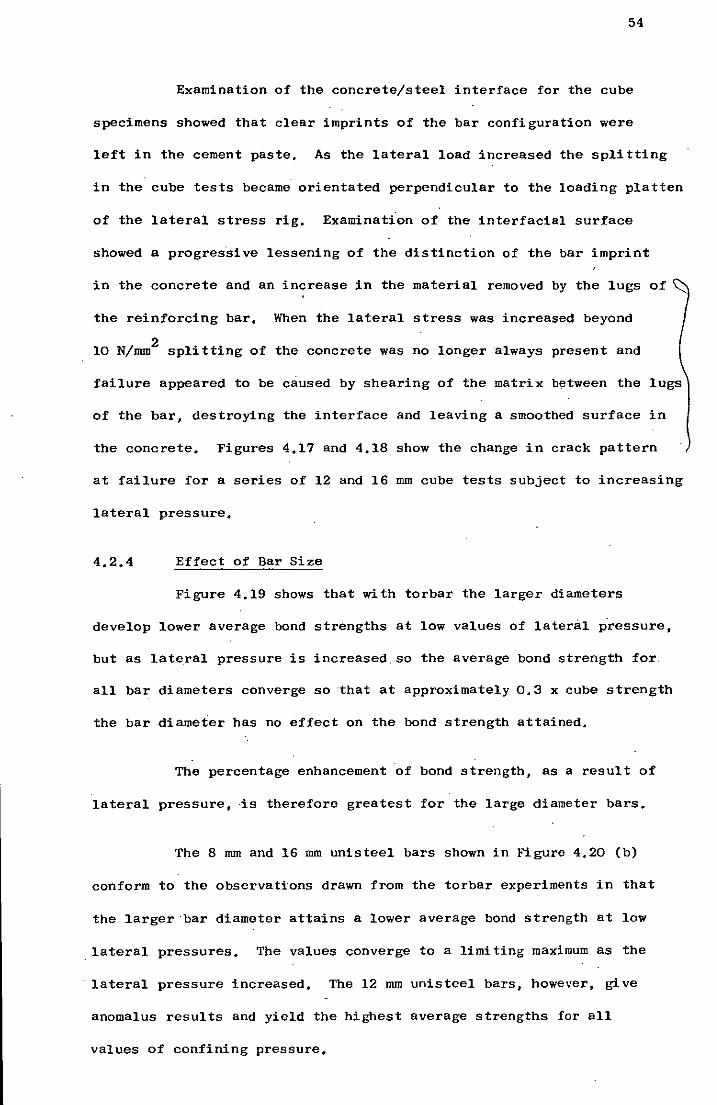
54
Examination of the concrete/steel interface for the cube
specimens showed that clear imprints of the bar configuration were
left in the cement paste. As the lateral load increased the splitting
in the cube tests became orientated perpendicular to the loading platten
of the lateral stress rig. Examination of the interfacial surface
showed a progres·sive lessening of the distinction of the bar imprint
in the concrete and an increase in the material removed by the lugs of
the reinforcing bar. When the lateral stress was increased beyond
10 N/mm2 splitting of the concrete was no longer always present and
failure appeared to be caused by shearing of the matrix between the lugs
of the bar, destroying the interface and leaving a smoothed surface in
the concrete. Figures 4.17 and 4.18 show the change in crack pattern
at failure for a series of 12 and 16 mm cube tests subject to increasing
lateral pressure.
4.2.4 Effect of Bar Size
Figure 4.19 shows that with torbar the larger diameters
develop lower average bond strengths at low values of lateral p·ressure,
but as lateral pressure is increased. so the average bond strength for.
all bar diameters converge so ·that at approximately 0.3 x cube strength
the bar diameter has no effect on the bond strength attained.
The percentage enhancement of bond strength, as a result of
lateral pressure, ·is therefore greatest for the large diameter bars.
The 8 mm and 16 mm unisteel bars shown in Figure 4.20 (b)
conform to the observations drawn from the torbar experiments in that
the larger bar diameter attains a lower average bond strength at low
lateral pressures. The values converge to a limiting maximum as the
. lateral pressure increased. The 12 mm unisteel bars, however, give
anomalus results and yield the highest average strengths for all
values of confining pressure.
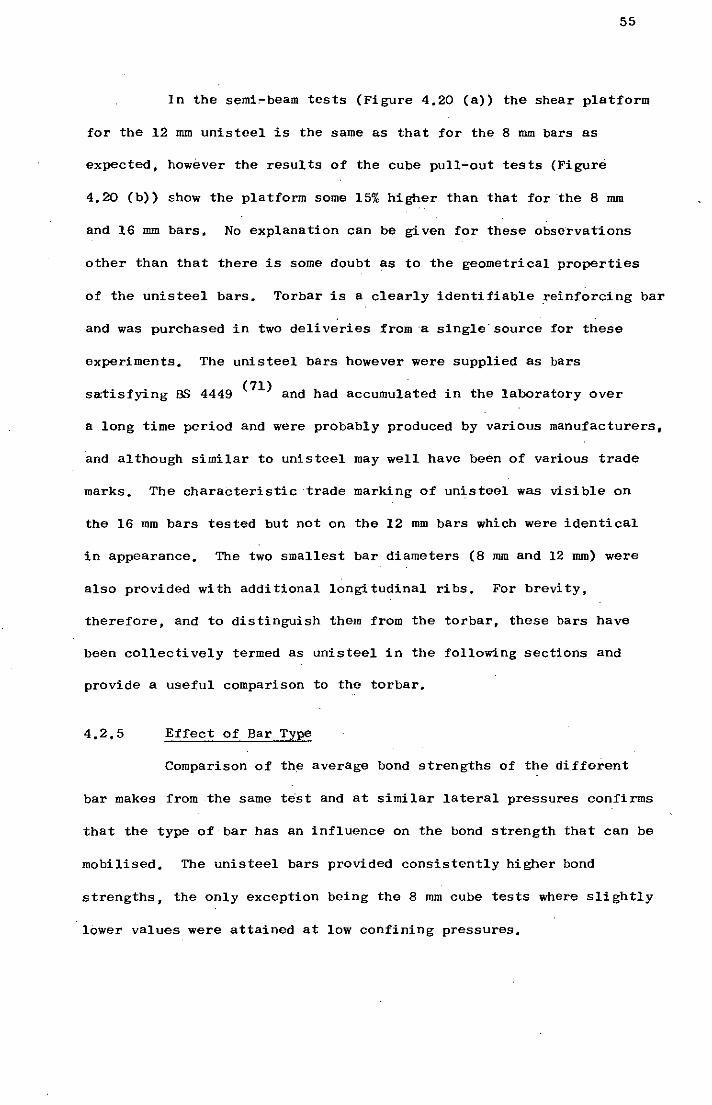
55
In the semi~beam tests (Figure 4.20 (a» the shear platform
for the 12 mm unisteel is the same as that for the 8 mm bars as
expected, however the results of the cube pull-out tests (Figure
4.20 (b» show the platform some 15% higher than that for the 8 mm
and 16 mm bars. No explanation can be gi ven for these observations
other than that there is some doubt as to the geometrical properties
of the unisteel bars. Torbar is a clearly identifiable reinforcing bar
and was purchased in two deliveries from -a single· source for these
experiments. The unisteel bars however were supplied as bars
satisfying BS 4449 (71) and had accumulated in the laboratory over
a long time period and were probably produced by various manufacturers,
and although similar to unisteel may well have been of various trade
marks. The characteristic trade marking of unisteel was visible on
the 16 mm bars tested but not on the 12 mm bars which were identical
in appearance. The two smallest bar diameters (8 mm and 12 mm) were
also provided with additional longitudinal ribs. For brevity,
therefore, and to distinguish them from the torbar, these bars have
been collectively termed as unisteel in the following sections and
provide a useful comparison to the torbar.
4.2.5 Effect of Bar Type
Comparison of the average bond strengths of the different
bar makes from .the same test and at similar lateral pressures confirms
that the type of bar has an influence on the bond strength that can be
mobilised. The unisteel bars provided consistently higher bond
strengths, the only exception being the 8 mm cube tests where slightly
lower values were attained at low confining pressures.
56
These observations contradict the conclusions of Cairns (49) who
suggests that twisted bars such as torbar with crescent-shaped ribs will
have superior bond characteristics to·those like unisteel which are
. . (411 untwisted bars with crescent-shaped annular ribs, Rehm . in his
extensive investigations found that the shape of the ribs had little
effect while Lutz (30) observed 15 to 20';{, improvement of bond strength
for deformed bars with smaller rib spacing and higher ribs than
regular deformed reinforcing bars,
Cairns and Jones (81) in a recent publication concluded
that the influence of rib geometry on bond strength may be as
great as that of the. concrete strength, They compared the ultimate
bond stresses to the relative rib areas of most commercially available
20 mm and 25 mm diameter reinforcing bars, Doubling the relative
rib area from 0,05 to 0,10 was observed to increase ultimate bond
strength by 25 - 30%, For deformed bars with crescent shaped ribs align-
ment of the bar relative to the splitting plane was also shown to
affect the bond strength, Cold worked bars, such as torbar, where
the maximum rib height is not aligned along the axis of the bar, do not
exhibi t such behaviour., since uniform bursting forces ·are produced
around the bar perimeter,
57
4,3 Comparison of Test Methods
The objection most commonly voiced about the cube pull-out
test is that it does not realistically reflect the conditions of a
bar in an anchorage'situation, The face of the cube from which the
bar is pulled is in compression rather than tension and restraint
due to the loading platten is expected to result in increased bond
(25 26 32) . (32). strength •• ,It has been argued that the sem1-beam
test method better'represents the strain gradient expected in a
flexural member, The conclusions that can be drawn about the
nature of the bond mechanism and modes of failure for the round
and deformed bars are consistent from both semi-beam and pull-out
tests, However for both the 'round and the deformed bars the semi-
beam tests yield lower values of ultimate bond strength,
Although Figures 4,i and 4,2 show a considerable degree of
overlap between the results of ultimate pull-out for the round bars
obtained from both semi-beam and cube tests it can be statistically
proven that the semi-beam tests yield slIghtly lower values; the
difference in results between the two methods being significant at the
5% level of the student - t test, The statistical analysis is ex-
plained further in Appendix A,
The effect of the lateral stress on the results of the
deformed bar specimens is similar in both types of tests, The
gradients of the 'splitting lines' are approximately equal, The
value of lateral stress corresponding to transition to the shear
type failure is slightly increased for the cube tests and hence the
'shear platform' corresponds to higher values of average bond stress,
An explanation of this is clear from the mechanics of the tests.
The semi-beam test in comparison to the cube ·test is subject to
bending and the resulting complementary bending shear stresses
58
(Equation 4.2) induced correlate reasonably well with the short fall.
where
= ~ay
Ib
Vuis the shear force;
4.2
a the area of section above line where the shear
stress is required;
y the lever arm of area a;
I the second moment of area;
b the. breadth of the section.
The level of bond stress on the splitting line is not
affected by the shear stresses produced by bending since the
criterion for failure in this situation is the tensile strength
of the concrete rather than its shearing capacity.
Leonhardt (25) has suggested that the restraint between
the face of the cube and the loading plate could explain the
apparent increase in bond strength observed in the cube test.
Voellmy and Bernardi (82) have demonstrated the arching effect which
occurs in the cube test,which may also increase the pull-out loads
by a photoelastic method.
The presence of stirrups, provided in the semi-beam to
prevent shear failure can result in an increase in bond strength
(31,32,48,49) but as split stirrups (Figures 3.1 (b» were used these
probably had a minimal confining action.
59
The lower bond stresses observed in the semi-beam tests
could also be partly attributed to the dowel effect resulting from
the test method. As in a real beam at a cracked section, rotation
of the specimen results in the pull-out load no longer being applied
perpendicular to the face of the specimen. The· application of a
component of load at right angles to the normal .pull-out load has
been shown by Kemp and Wilhelm (32) to reduce bond strength
si gni ficantly.
From the foregoing comments and the comparison of results
from the semi-beam tests to anchorage bond stresses in the deep
beam study discussed in Chapter 10, it is concluded that the semi-
beam method-represents a considerable improvement over the conven-
tional cube pull-out specimen. It is a more realistic anchorage bond
test which also allows a variable embedment length to be accomodated
more easily. However, the practical difficulties in fabrication, the
secondary effects introduced by additional reinforcement and the
increased care required to carry out the test are reflected in a
slightly greater scatter of results.
4.4 Series 3 Effect of Cube Strength on Bond of Deformed Bars
The anchorage bond tests and the deep beam study were
carried out using concrete of one nominal concrete strength. In order
that the conclusions obtained from these results could be more
generally applied the effect of concrete strength on the bond
developed by deformed bars was investigated.
2 Three further concrete mixes with design strengths of 20 N/mm ,
25 N/mm2 and 45 N/mm2 were prepared and for each strength four 8 mm
torbar cube specimens were cast, together with the usual control test
specimens.
60
All the specimens were cured under water until testing at 28 days.
The test method and apparatus used are the same as explained in
Chapter 3.
The results of ultimate pull-out load for lateral pressures
2 of 0, 4, 8 and 12 N/mm are shown in Figures 4.21 and 4.22.
The conclusions to be drawn from the results confirm those of
previous investigations; an increase in concrete strength results in
higher bond stress for similar lateral pressures. The increase in
bond strength is not directly proportional to the compressive
strength of the concrete. Over the range of concrete strengths used
the ul timat·e average bond stress varies approximately with the square
root of concrete strength, as shown in Figure 4.22.
The variation of bond strength with the square root of
the cube compressive strength is referred to in both the ACI 318-77 (3)
and the CP 110 (2) design Codes. Over the full range of concrete strengths
Neville (77) states that the bond strength is approximately proportional
2 . to the compressive strength up to about 20 N/mm • and that for higher
strengths of concrete the increase in bond strength becomes
progressively smaller and for very high strength concretes is negligible.
Increasing lateral pressure further increases the bond strength for the
range of concrete strengths considered here. The range of lateral
pressures and number of specimens tested in this series of experiments
were only sufficient to draw conclusions about the splitting type of
failures. Farndon (83) carried out a more comprehensive series of
tests to investigate the effect of concrete strength on average bond
stress. Farndon (83) tested 64 pull-out cube specimens with 12 mm
torbar using the same experimental technique as the author.
61
Lateral pressures ranging from 0 to O,B fcu were applied to cube
specimens with nominal ·strengths of 25, 45, 55 and 65 N/mm2, It was
apparent from the results that the transition from splitting to
shearing failure does occur for concrete of all strengths and
Figure 4,23 shows the variation of average bond stress corresponding
to the shear platform with concrete strength, Included in the figure
are the relevant data from the author's experiments on 12 mm torbar
. 2 with concrete strength of 33 N/mm and the Bmm torbar experiments
with variable concrete strengths described above,
The results are plotted in the form:
Kft J ~cu where K ; l,B 4,3
This relationship has been chosen since the shear platform must be
dependent on the shear strength of the matrix, which like the tensile
strength of concrete is related to· the cube crushing strength by a
square root ratio.
4,5 Series 4 Variable Embedment Length
The deep beam experiments discussed in Section 2
investigate, among other factors, the effect of anchorage length on
the ultimate load, Two further series of semi-beam tests with
Bmm torbar were carried out with embedment lengths of 50 nun and 150 mm
to study the effect of varying the embedment length,
The test specimen used was the same as in previous tests only
the length of the polystyrene sleeve nearest to the loaded face was
adjusted to vary the embedment,
The results of the ultimate pull-out loads for the 50 and
150 mm embedment lengths together with those for the 100 mm embedment
are shown in Figure.4,24,
62
As expected the pull-out load increases with embedment. The
specimens with 150 mm embedment rapidly reach the yield stress of
. the bar. 2 Failure for latera15tr~~greater, than 5 N/mm occurs by
yielding of the bar rather than as a result of bond failure. The
mode of failure of the 100 mm embedment specimens is discussed in
Section 4.2, The 50 mm specimens appear to show inconsistent ~
results. The effect of lateral pressure has no conclusive effect
on the bond mobilised. However a graph of average bond stress
against lateral pressure (Figure 4,25) shows that the 50 mm
specimens reach the limiting matrix bond stress with no lateral load
applied and hence the increase in confining pressure has no affect.
Figure 4.25 also shows how ,ultimate bond stresses decrease only slightly with
zero confining pressures as the embedment length is increased.
Provided that the embedment length is not sufficient to
result in yielding of the anchorage, as in the case of the 150 mm
embedment bars, lateral pressure has the effect of increasing the
bond that can be mObilised up to the limiting shear value of the
matrix and thus more efficient use is made of the anchorage
provided and the embedment length is no longer an important variable
which will affect average bond strength. Figures 4,24 and 4,25
also demonstrate the large factors of safety incorporated into the
present anchorage bond stresses given in Table 22 of ,CP 110 (2) ,
Even with no lateral pressure the safety factor for deformed bars
in lightweight aggregate concrete is as much as 3,6, This factor
of safety increases to 5,0 with lateral pressures equal to or
greater than that necessary to ensure a shearing type bond' failure.
4.6 Series 5 - Effect of Platten Restraint on Deformed Bar Cube Tests
The results of the experiments in Series 2 showed
conclusively that the bond strengths mobilized by deformed bars
could be significantly improved by applying a lateral pressure in
the manner shown. The mode of failure of the specimens, i.e.
splitting of the concrete cover, suggested that restraint of the
63
specimen s by the loading plattens of the straining rig would affect
the pull-out loads obtained. In Series 5 a batch of 8 cube
specimens with 12 mm torbars were tested by the method explained
in Section 3.9, the only difference being that low friction
MGA (69) pads were placed between the load plattens of the straining
rig and the faces of the cube specimen. The concrete strength
. used was the same as in Series 2 (33 N/mm2).
Figure 4.26 shows the markedly different results obtained
for 12 mm torbar with no restraint provided to the cube specimen.
As expected the specimen with zero lateral pressure failed at the
same value of pull-out as the results from Series 2 shown in
Figure 4.12 With increased lateral load there is almost no overall
increase in pull-out load. For all specimens the cracking pattern
of the specimen was similar. Failure occurred immediately after
splitting of .the specimen had occurred on a plane through the axis
of the bar and perpendicular to the loading plattens. This mode
of failure was observed even for specimens with applied lateral
pressures greater than fbt, the lateral stress corresponding to the
transition from splitting to shearing failure. No evidence of the
shear type failure was observed.
It is apparent that the increased pull-out loads observed
in Series 2 result from restraint of the specimen.
64
Splitting and thus failure are delayed so that higher bond strengths
are mobilised, The rate of increase of pull-out with lateral
pressure must therefore be dependent on the type of restraint
provided, and in particular,. to the testing method, The upper
boundary, the shear failure line, is however·a property of the
concrete matrix and will be achieved provided that sufficient
restraint is provided either by the loading method or by lateral
reinforcement in the form of stirrups or spira.Ls
Orangun, . .1i rsB (65)
and Breen for example have observed
how greater transverse restraint, in the form of stirrups, results
in increased bond strength compared to that provided by concrete
cover alone, A limit is reached however beyond which the addition
of further reinforcement is ineffective. The maximum increase
in bond strength afforded in this manner was given by:
fb = 1 ( At fy )~ 3 4,4
Jf[ 500 s d
where fb is the increased bond strength (psi) ;
, fc the concrete cylinder compressive strength (psi);
At the area of transverse reinforcement (in2
) ;
s the spacing of the web reinforcement (in) ;
d the diameter of the bars (in) ,
It is suspected that the pull-out loads for round bars
will not be similarly affected by restraint of the specimen,
The mode of failure is for all cases dependent on the friction at the
bar/concrete interface and only the magnitude of the lateral pressure
will al ter this,
65
4.7 Double Shear Test
The distinctive platform in Figures 4.ID - 4.14 and the
observed ·failure mechanism at failure for deformed bars prompted a
limited series of shear tests to compare the values for the 'shear
platform' in the pull-out tests to a common shear strength test.
The apparatus shown in Figure 4 •. 27 is based on Johnson' s
double shear test (84). The specimens measuring 275 x 50 x 10 mm
were cast at the same time and from the same mix as the pull-out
specimens, cured under the same conditions, and tested on the same
day. The specimens with their rough finished surface bedded to the
jig in Kaffir plaster were clamped down rigidly and the centre
portion sheared out by applying a compressive force using an
Amsler 400 kN testing machine. The load was applied at the same
rate as in the pUll-out test (5kN/min). The shear strength of the
material was then calculated from the formula:
= Failure Load 4.5 2 x sample cross sectional area
From the limited range of tests carried out the suggested
values of pull-out loads at shearing failure for the 8 mm and 12 mm
bars were 29 itN and 43 kN.
Surprisingly these values compare best with the semi-beam
tests rather than the cube tests, even though it would appear that the
latter test more closely resembles the conditions existing in the
double shear test.
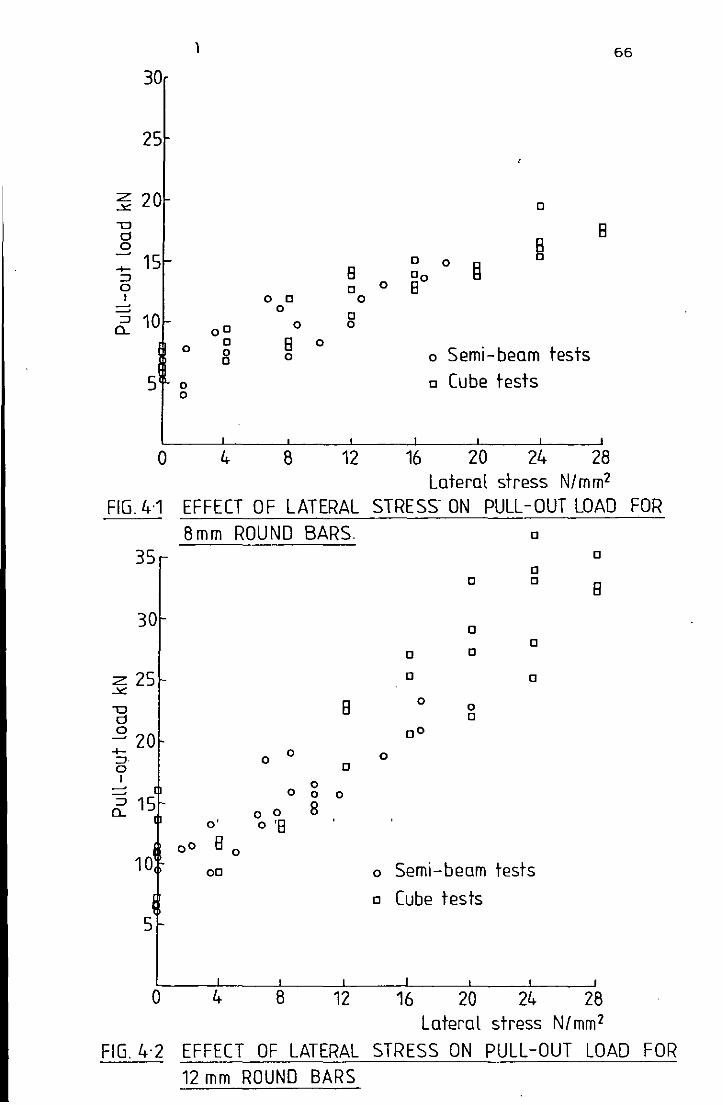
30
25
~ 20 -0 d o +- 15 :J o I
:J 10 Cl..
5
0
FIG. 4·1
35
30
:z: 25 -X:
-0 d 0 ~ 20 +-:J. 0 I ~
~
:J 15 Cl..
10
5
o
o
o o
1
0 0 o 8
4
o 0 o
o
B o
8
o
8 o
o o o
12
EFFECT OF LATERAL 8mm ROUND BARS.
B
0 0
0
0 o 0 0
o 0 8 0' o '8
00 8 0
00
4 8 12
o
o 00 8
16
66
o
B
o §
o Semi-beam tests o Cube tests
20 24 28 Lateral stress N/mm2
STRESS' ON PULL -OUT LOAD FOR 0
0
0 0 0 B
0 0
0 0
0 0
0 0 0
0 0
0
o Semi-beam tests
0 Cube tests
16 20 24 28 Lateral stress NI mm 2
FIG. 4'2 EFFECT OF LATERAL STRESS ON PULL-OUT LOAD FOR 12 mm ROUND BARS
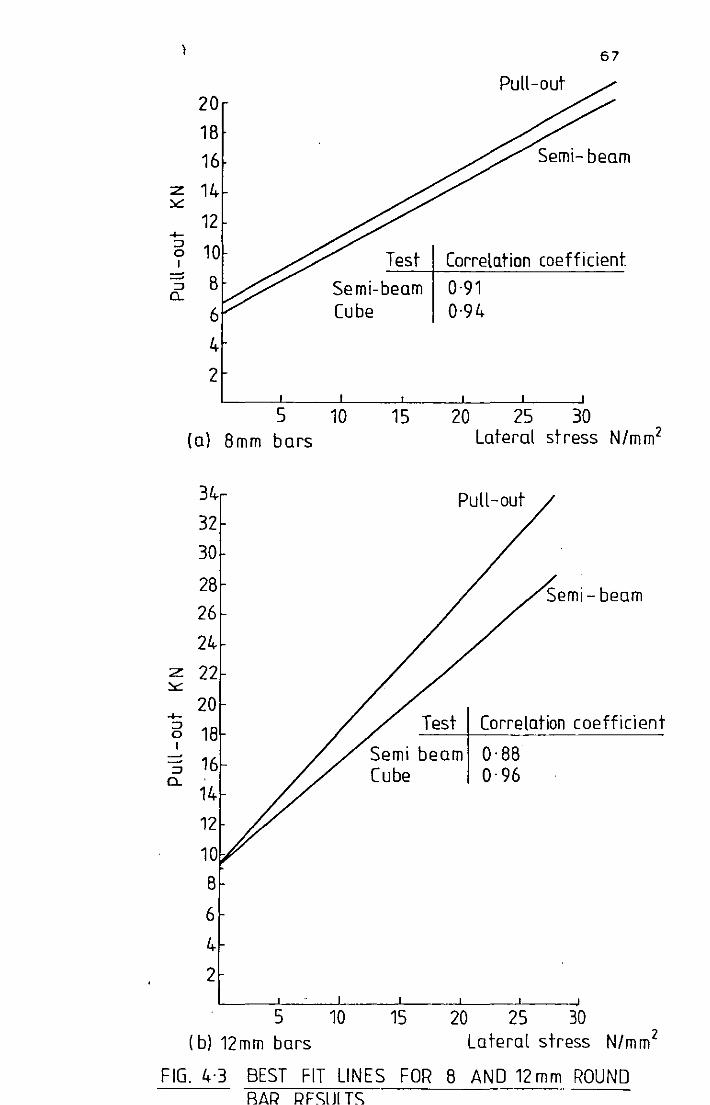
1
20 1B 16
z 14 :.:::
12 +-
~ 10 I
B
6
4
2
Test
Semi-beam Cube
67
Pull-out
Semi-beam
Correlation coefficient
0·91 0·94
5 10 15 20 25 30 la) 8mm bars
34-
32 30
2B
26
24-
z22 y
20 ..... ~ 18 I
=:; 16 0..
14
12
10
B
6
4
2
5 I b) 12 mm bars
10
Lateral stress N/mm2
Pull-out
Semi- beam
Test Correlation coefficient
Semi beam o· 8B Cube 0·96
15 20 25 30 Lateral stress N/mm2
FIG. 4·3 BEST FIT LINES FOR 8 AND 12 mm ROUND
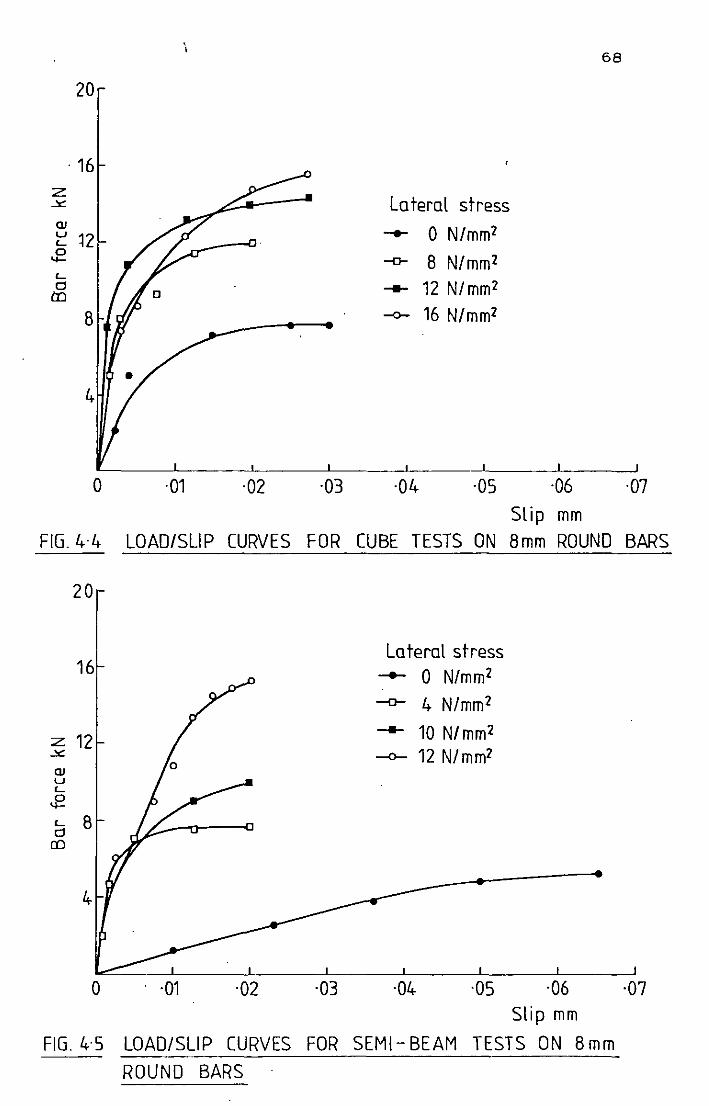
\ 68
20
. 16 z
Lateral stress .Y
QJ o N/mm2 ~n ........ 0
8 N/mm2 ....... -0-
'-a -- 12 N/mm2 lI:l
8 -0- 16 N/mm2
o ·01 ·02 ·03 ·04 ·05 ·06 ·07 Slip mm
FIG. 4·4 LOAD/SLIP CURVES FOR CUBE TESTS ON 8mm ROUND BARS
20
16
z 12 .Y
QJ u '-.e '- 8 a co
0
FIG. 4·5
I
·01 ·02
LOAD/SLIP CURVES
ROUND BARS
·03
FOR
Lateral stress
-- 0 N/mm2
-0- 4 N/mm2
-- 10 N/mm2
-0- 12 N/mm2
I I
·04- ·05 I
·06 Slip mm
SEM1- BEAM TESTS ON 8mm
I
·07
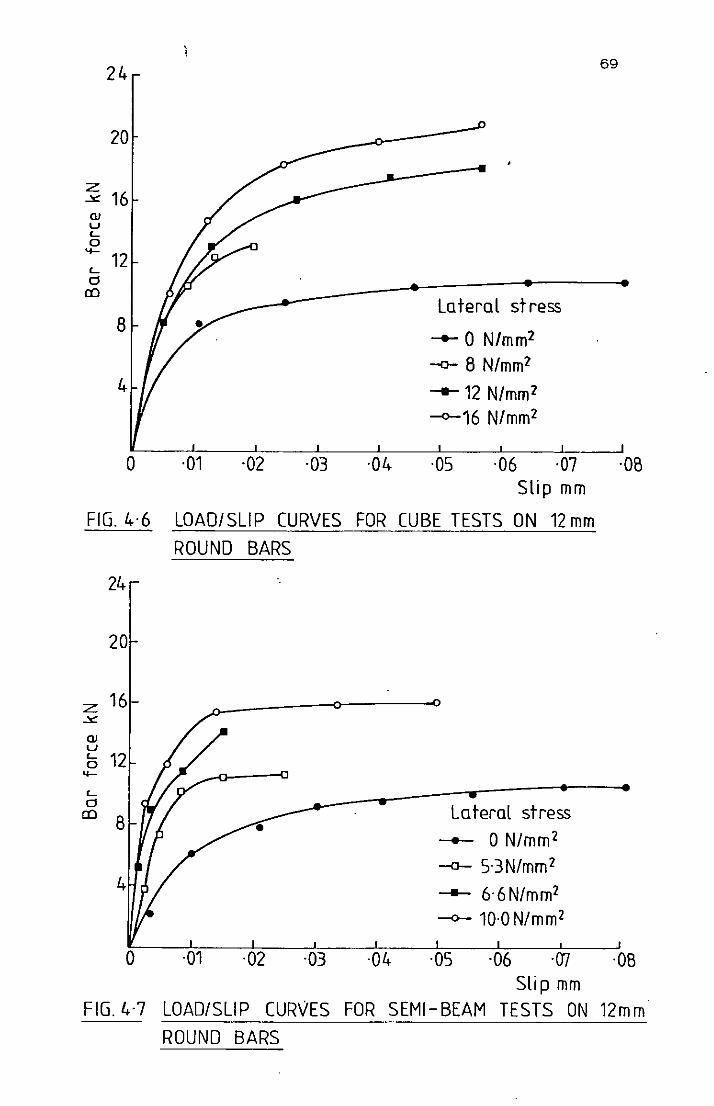
24
20
z ~ 16 QJ u <a 'f- 12 <d
CO
8
4
o ·01 ·02 ·03 ·04
Lateral stress
-- 0 N/mm2
-0- 8 N/mm2
--12 N/mm2 -0-16 N/mm2
·05 ·06 ·07 Slip mm
FIG. 4·6 LOAD/SLIP CURVES FOR CUBE TESTS ON 12 mm
ROUND BARS
24
20
z 16 ~
QJ u '- 12 a "-
'-d
a:l 8
o ·01 ·02 ·03 ·04
La teral stress
-- 0 N/mm 2
~ 5·3N/mm2
-- 6'6N/mm2
-0- 10·0 N/mm2
·05 ·06 .(J7
Slip mm
69
'OB
·08
FIG.4·7 LOAD/SLIP CURVES FOR SEMI-BEAM TESTS ON 12mm
ROUND BARS
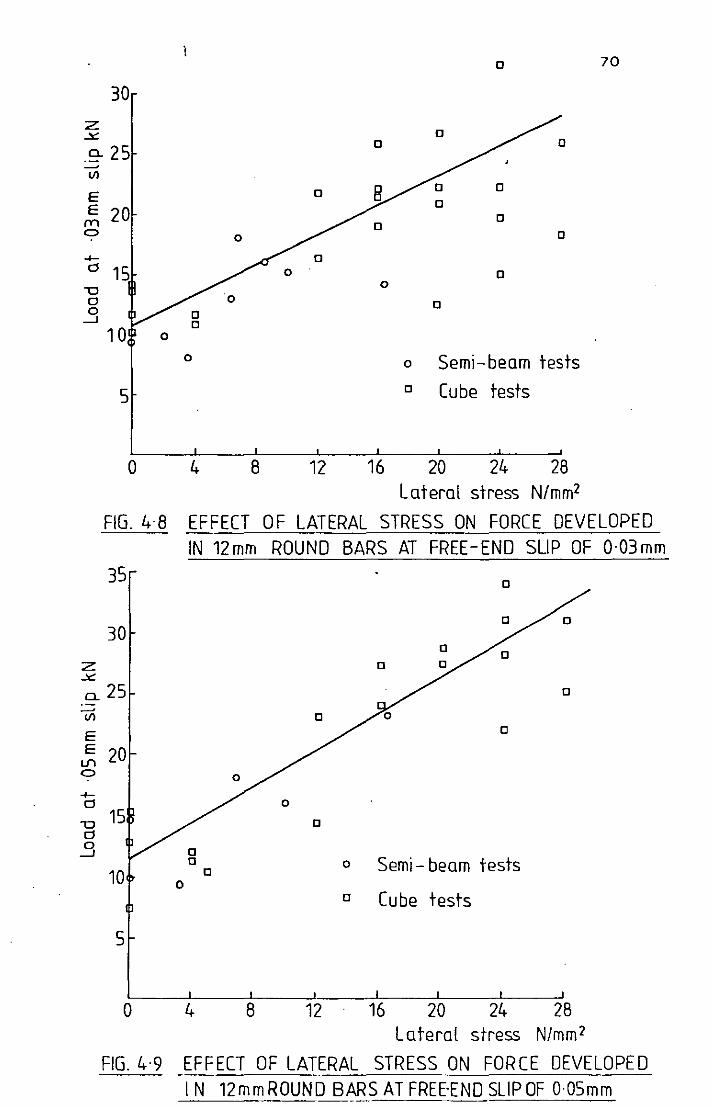
D 70
30
z ~
.~ 25 ~
VI
E D
E 20 (Y'l D D
C> D
4-d 15 D
'0 0
d D 0
-1
10 0
0 0 Semi-beam tests
5 D Cube tests
o 4 8 12 16 20 24 28 Lateral stress N/mm2
FIG. 4·8 EFFECT OF LATERAL STRESS ON FORCE DEVELOPED IN 12mm ROUND BARS AT FREE-END SLIP OF 0·03mm
Z .x
35
30
0. 25 ~
VI
E E 20 If)
C>
'0 15 d
.3 10
5
o
o
D o
4
o D
8 12
D
o Semi - beam tests
D Cube tests
16 20 24
D
D
28 Lateral stress N/mm2
FIG. 4·9 EFFECT OF LATERAL STRESS ON FORCE DEVELOPED IN 12mmROUND BARS AT FREE-END SLIP OF O·OSmm
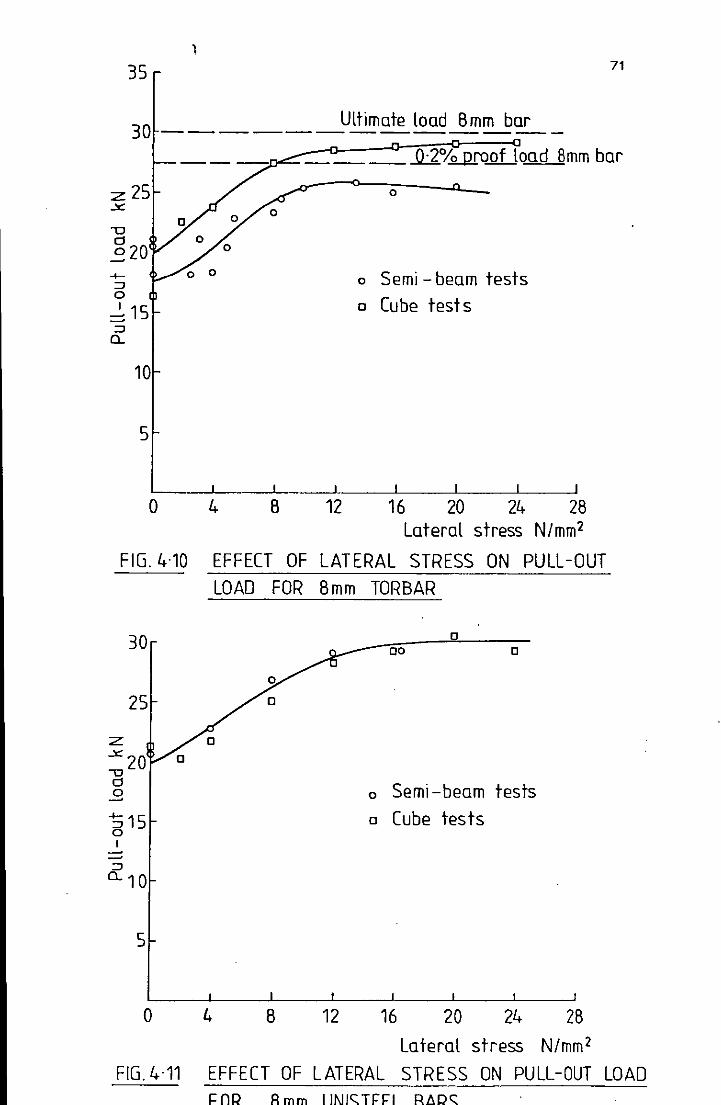
1
35 71
30 ___________ U~~~~~~ _
____ ..02.% proof load 8mm bar
225 ..le:
u d ~20 -+
::::J o ~ 15 ::::J
Cl
10
5
o 4 8
o
o Semi - beam tests
o Cube tests
12 16 20 24 28 Lateral stress N/mm2
FIG. 4·10 EFFECT OF LATERAL STRESS ON PULL-OUT LOAD FOR 8mm TORBAR
-S 15 o I
5
o 4 8 12
o 00 o
o Semi -beam tests
o Cube tests
16 20 24 28 Lateral stress N/mm2
FIG.4·11 EFFECT OF LATERAL STRESS ON PULL-OUT LOAD
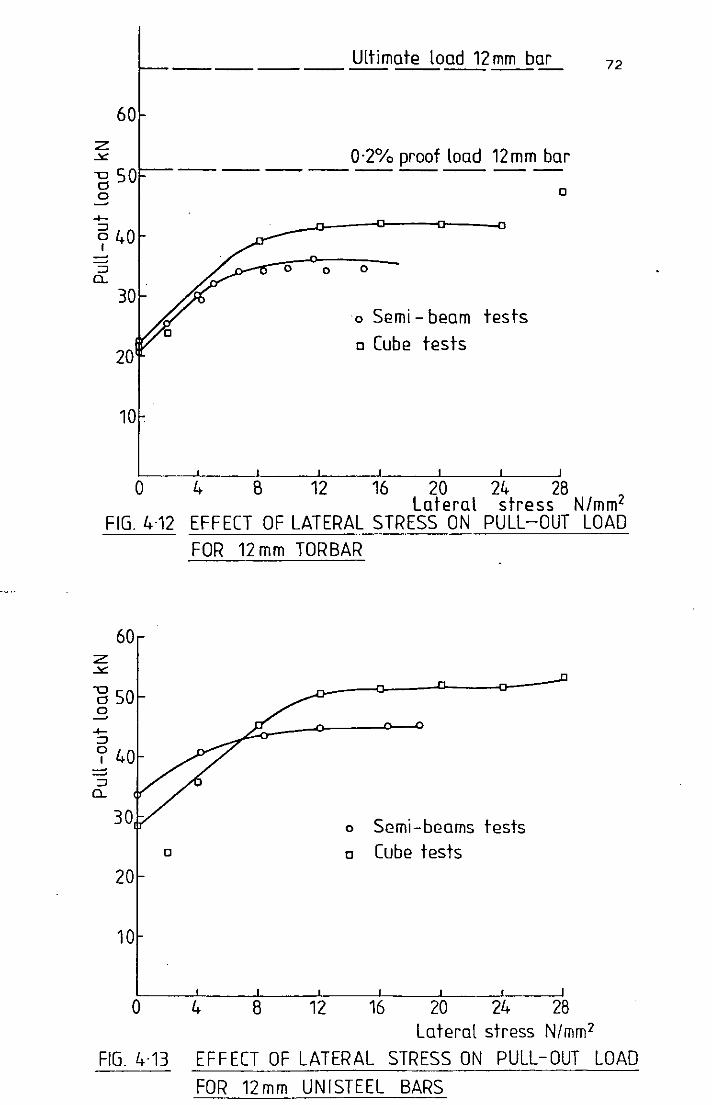
z ~
60
"0 50 d o ~
20
10
Ultimate load 12 mm bar ----------
0·2% proof load 12mm bar ----------- ----
o 0 0
o Semi - beam tests c Cube tests
c
72
o 4 s 12 16 20 24 28 Lateral stress N/mm2
FIG. 4·12 EFFECT OF LATERAL STRESS ON PULL-OUT LOAD
60 z ~
-g 50 0 ~
..... ~
? 40 ~ ~
~ Q.
30
c
20
10
o
FOR 12 mm TORBAR
4 s 12
o Semi-beams tests c Cube tests
16 20 24 28 Lateral stress N/mm2
FIG.4·13 EFFECT OF LATERAL STRESS ON PULL-OUT LOAD
FOR 12mm UNISTEEL BARS
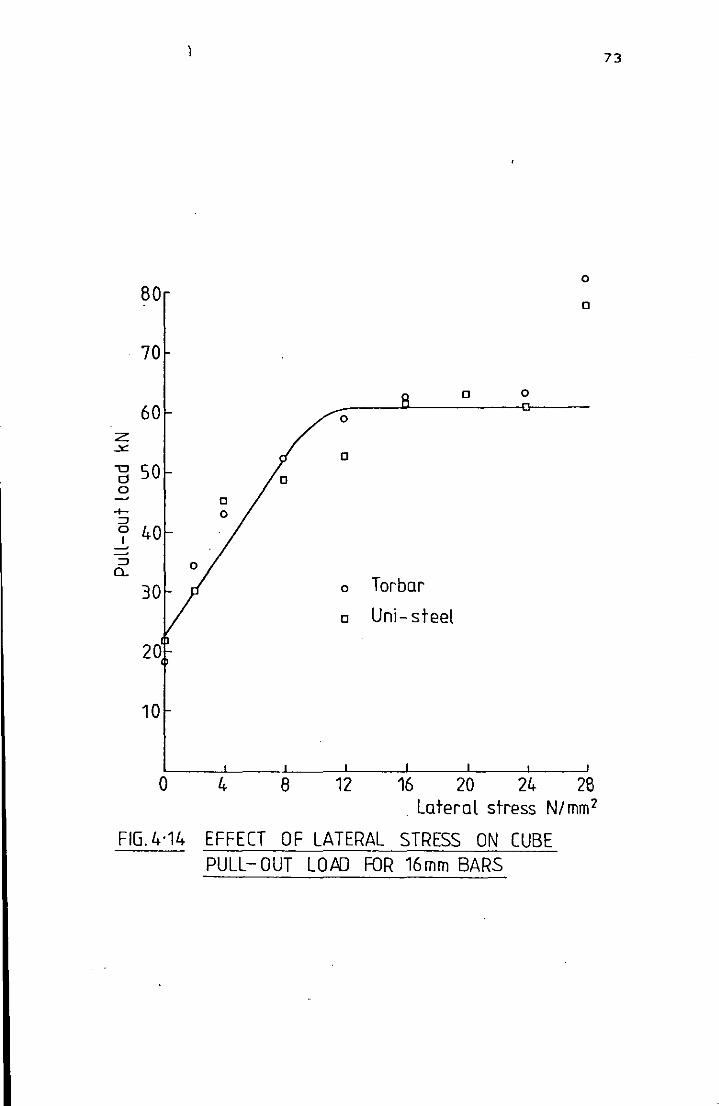
0
80 0
70
0 0
60 0
z .x
0 u 50 d 0
....... :::J 0 I ~
:::J Q..
0 Torbar
0 Uni-steel
20
10
o 4 8 12 16 20 24 26 . Lateral stress NI mm 2
FIG.4·14 EFFECT OF LATERAL STRESS ON CUBE PULL-OUT Lam FOR 16 mm BARS
73
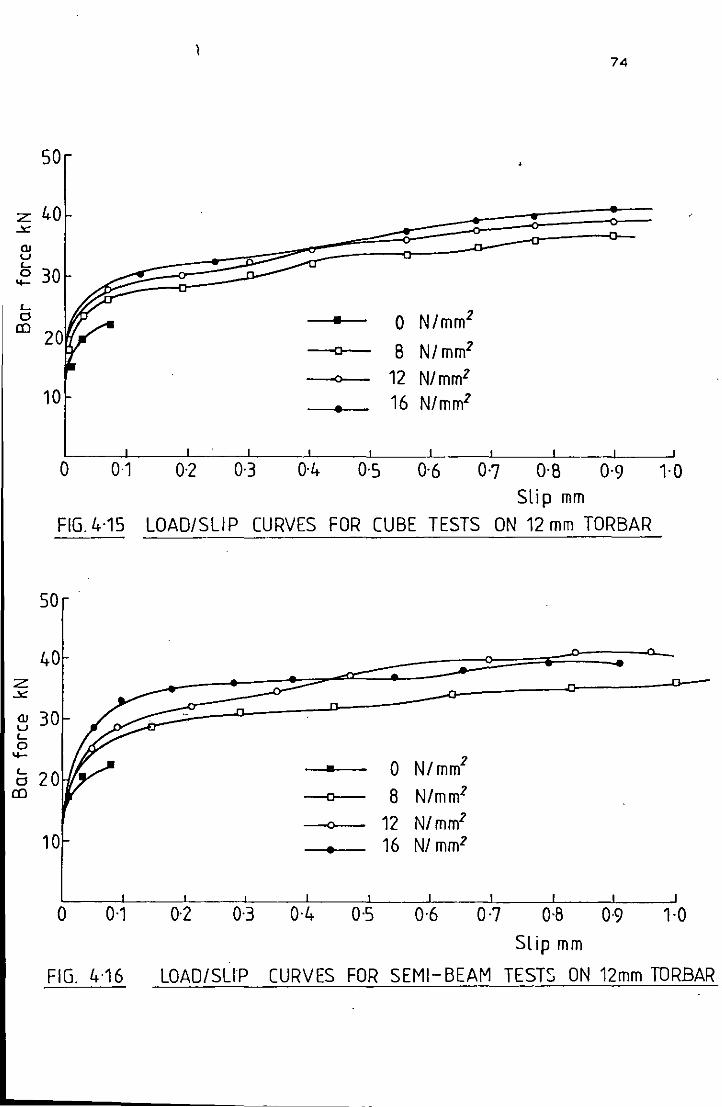
1 74
50
z 40 x QJ u '--.e 30
'--0 • 0 N/mm2 ro
20 B N/mm2 ~
0 12 N/mm2
10 16 N/mm2 •
o 0-1 0-2 0-3 ~4 0-5 ~6 01 O'B 0'9 lO Sli P mm
FIG.4·15 LOAD/SLIP CURVES FOR CUBE TESTS ON 12 mm TORBAR
50
40 z X
QJ 30 u '--0
'<-
N/mm2
a 20 • 0 ro --0-- B N/mm2
-----0-- 12 N/mm2
10 • 16 N/ mm2
o 0'1 0-2 0·3 0·4 0-5 0·6 0·7 O'B 09 Slip mm
1·0
FIG. 4-16 LOAD/SUP CURVES FOR SEMI-BEAM TESTS ON 12mm TORBAR
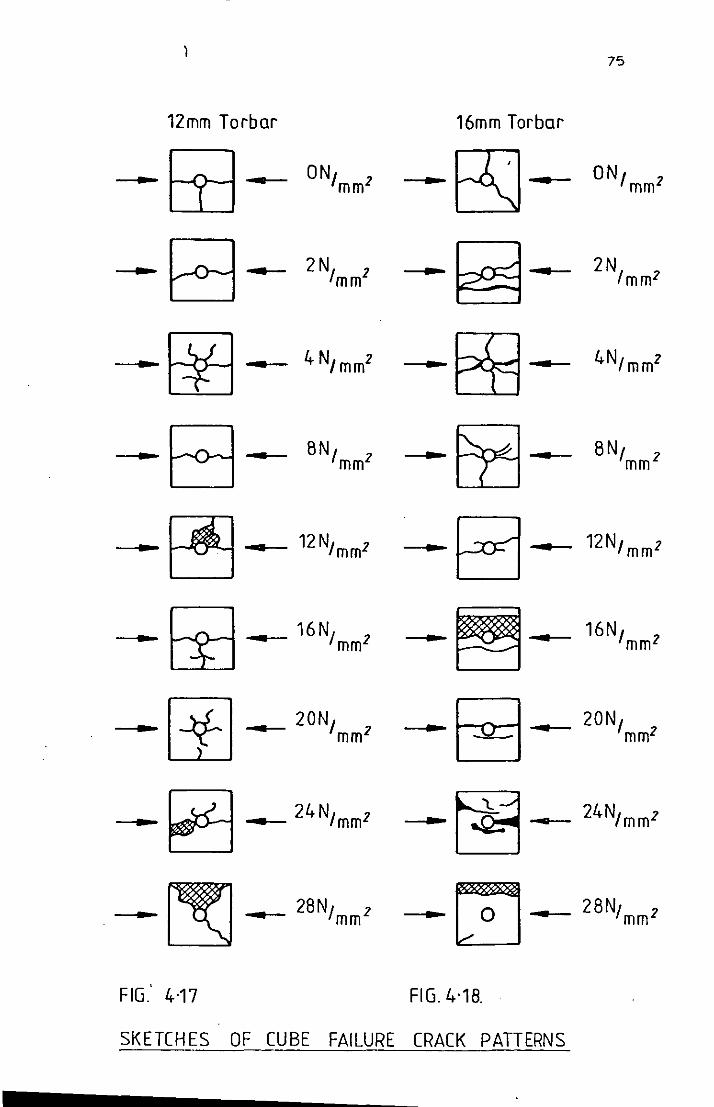
)
12mm Torbar
--.@---.. ON, ] mm
-B~ 2N, ] mm
--- 00 4
---B~ 8N, ] mm
---. ~----11 .. _ 0 ___ 16N, ] rn mm
----~ ___ a ~
---- [!] FIG.' 4·17
20N, --- mm]
___ 28N, ] mm
16mm Torbar
_.6] · _~4
----~~
--. fS3 · ---B · _~4
75
ON, ] mm
2N, ] mm
8N, ] mm
16N, ] mm
--1 __ ~ _ 24N'mm2
_~_2BNlmm2
FIG.4·18.
SKETCHES OF CUBE FAILURE CRACK PATTERNS
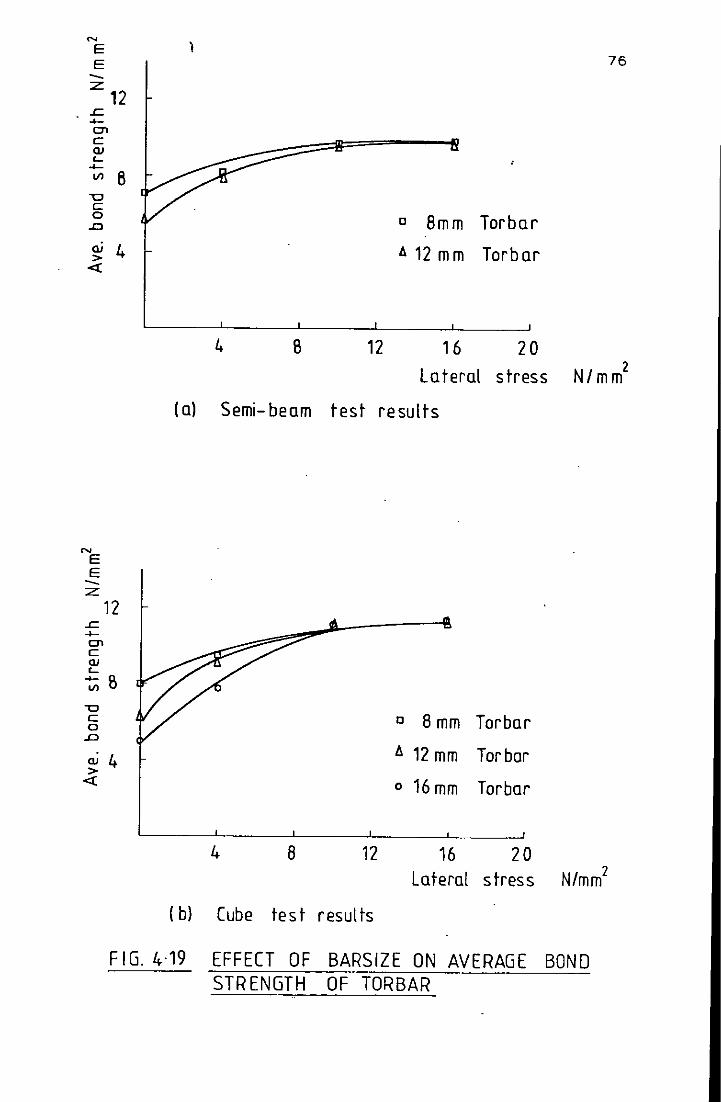
'" E E --:z
12 .c. .... O'l C Q)
'-.... VI 8
"0 C 0 .0
QJ 4 > «
'" E E --:z
12 .c. +-O'l C Q) '-~B "0 c 0 .0
ai 4 > «
)
4 B 12
c 8mm Torbar
A 12 mm Torbar
16 20 La teral stress
76
2 N/mm
(a) Semi-beam test results
c 8 mm Torbar
A 12 mm Tor bar
o 16 mm Torbar
4 8 12 16 20 Lateral stress N/mm2
(b) Cube test results
FIG. 4.·19 EFFECT OF BARSIZE ON AVERAGE BOND STRENGTH OF TOR BAR
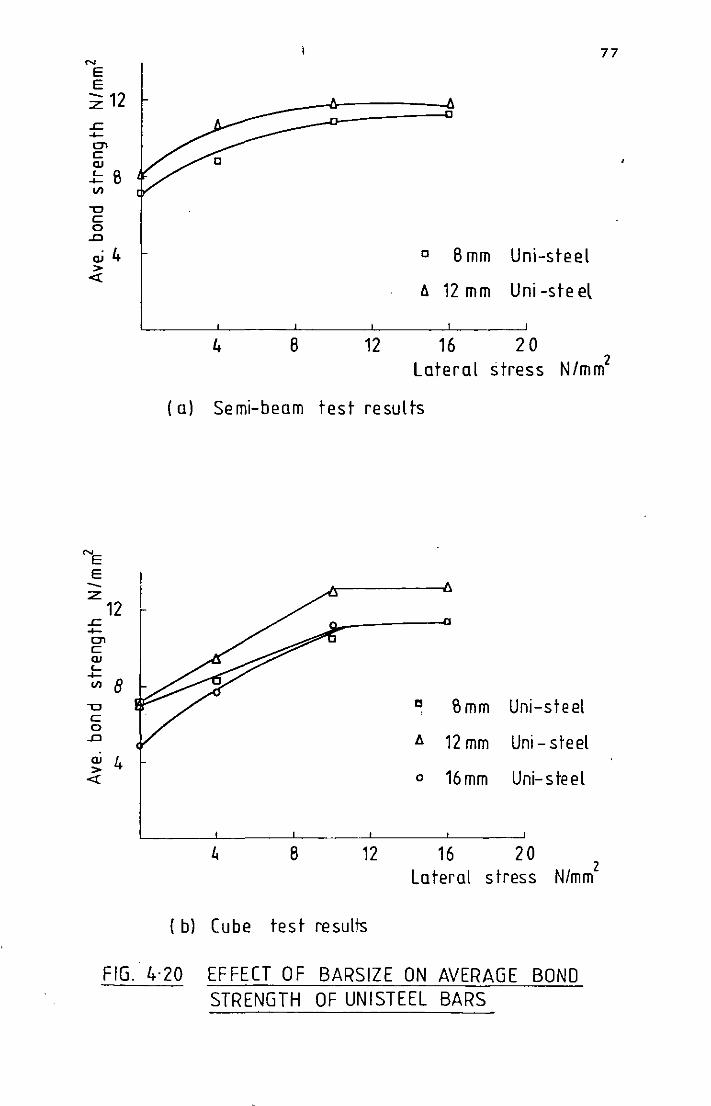
N
E E Z 12 .c +Cl C Q)
l: 8 Vl
"0 C o
.D
o.i 4 >
<{
4 B 12
77
0 Bmm Uni-steel
6 12 mm Uni -ste el
16 20 Lateral stress N/mm2
( a) Semi-beam test results
NE E --:z
12 .c +-Cl C Q) c... +-Vl
"0 c 0
.D
Q)
> <{
8
4
4 8 12
(b) Cube test results
Cl Smm Uni-s te el
l:. 12 mm Uni - steel
0 16mm Uni-steel
16 20 2
La teral stress N/mm
FIG. 4·20 EFFECT OF BARSIZE ON AVERAGE BOND STRENGTH OF UNISTEEL BARS
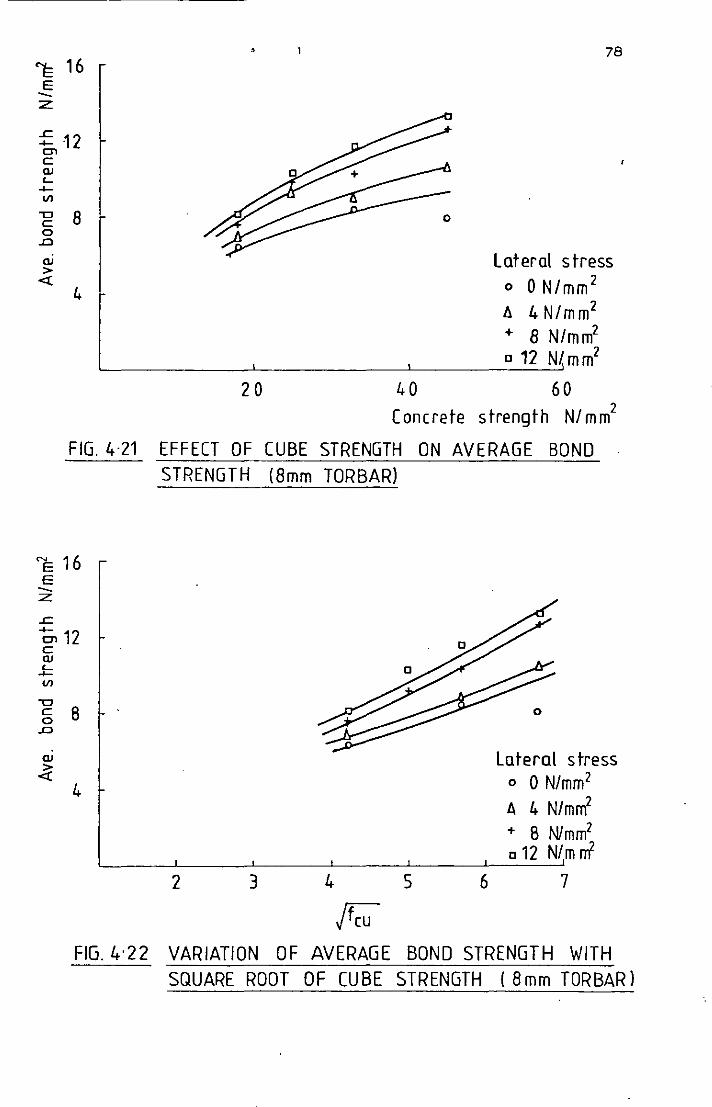
1= 16 E --:z
f ·12 = c QJ
'..... VI
-g 8 o .0
QJ >
<t: 4
20 40
78
lateral stress o 0 N/mm2 6. 4 N/mm2 + 8 N/mm2 o 12 Nlmm2
60 2 Concrete strength N/mm
FIG. 4·21 EFFECT OF CUBE STRENGTH ON AVERAGE BOND STRENGTH (Bmm TOR BAR)
"'E 16 E --:z
Le
~ 12 c QJ
..!:: VI
"Cl C 8 o .D
4
2 3 4 5
Au
lateral stress o 0 N/mm2 A 4 N/mm2 + 8 Nlmm2
012 N/m rrf 6 7
FIG.4-22 VARIATION OF AVERAGE BOND STRENGTH WITH SQUARE ROOT OF CUBE STRENGTH (Bmm TORBARl
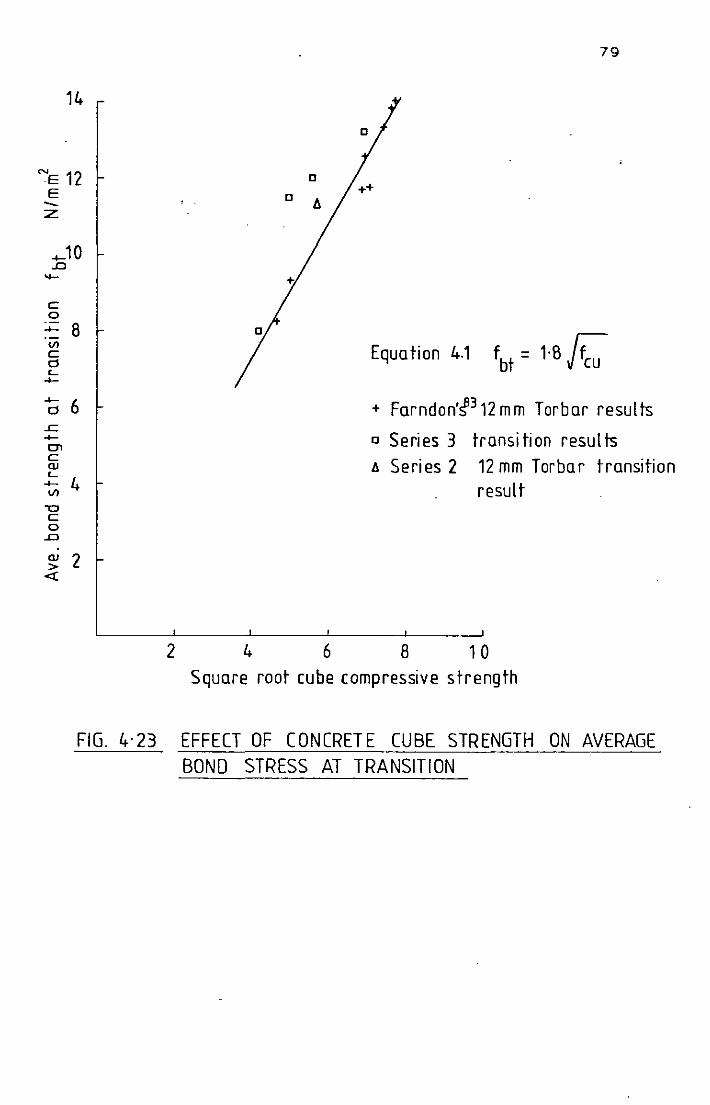
14
~E 12 E --z:
.< . ..10
.D --C 0
+- 8 III C cl t..
+-
+- 6 cl .£:; +-0"1 C QJ t..
4 +-III
"0 C 0
.D
QJ 2 > <x:
2
[]
4 6
79
Equa tion 4.1 fbt = 1·8 If:: + Farndon,~312mm Torbar results
[] Series 3 transition results
Il Series 2 12 mm Torbar transition resul t
8 1 0 Square root cube compressive strength
FIG. 4·23 EFFECT OF CONCRETE CUBE STRENGTH ON AVERAGE BOND STRESS AT TRANSITION
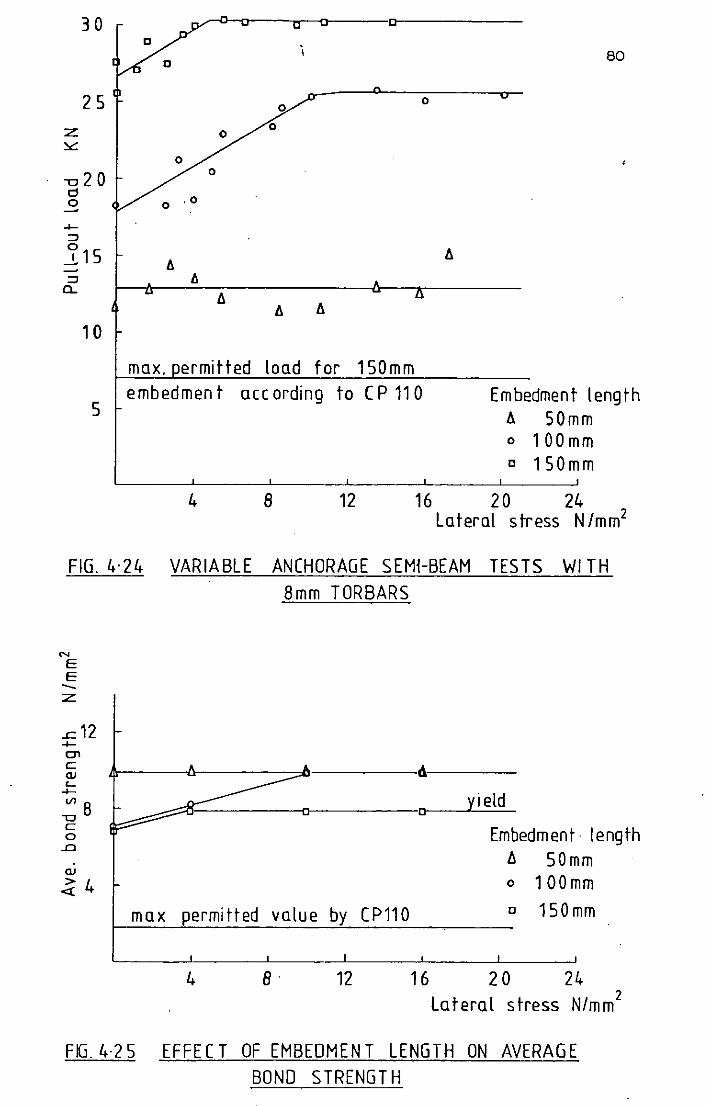
30
25
10
5
c c
c 80
o o
o o
o o
o ,0
max. ermitted load for 150mm embedmen t ace ording to (P 110 Embedment length
b. 50mm o 100mm c 150mm
4 B 12 16 20 24 Lateral stress N/mm2
FIG. 4·24 VARIABLE ANCHORAGE SEMi-BEAM TESTS WI TH
"" E E --:z
.c 12 ..... en c Q)
'-..... "'8
'"D C 0 .0
Q)
~4
Bmm TORBARS
c yi eld
r--------ICr--L-~~
max permitted value by CP110
4 B 12
Embedment, length l!. 50mm o 100mm
c 150 mm
16 20 24 2
Lateral stress N/mm
FIG. 4·25 EFFECT OF EMBEDMENT LENGTH ON AVERAGE BONO STRENGTH
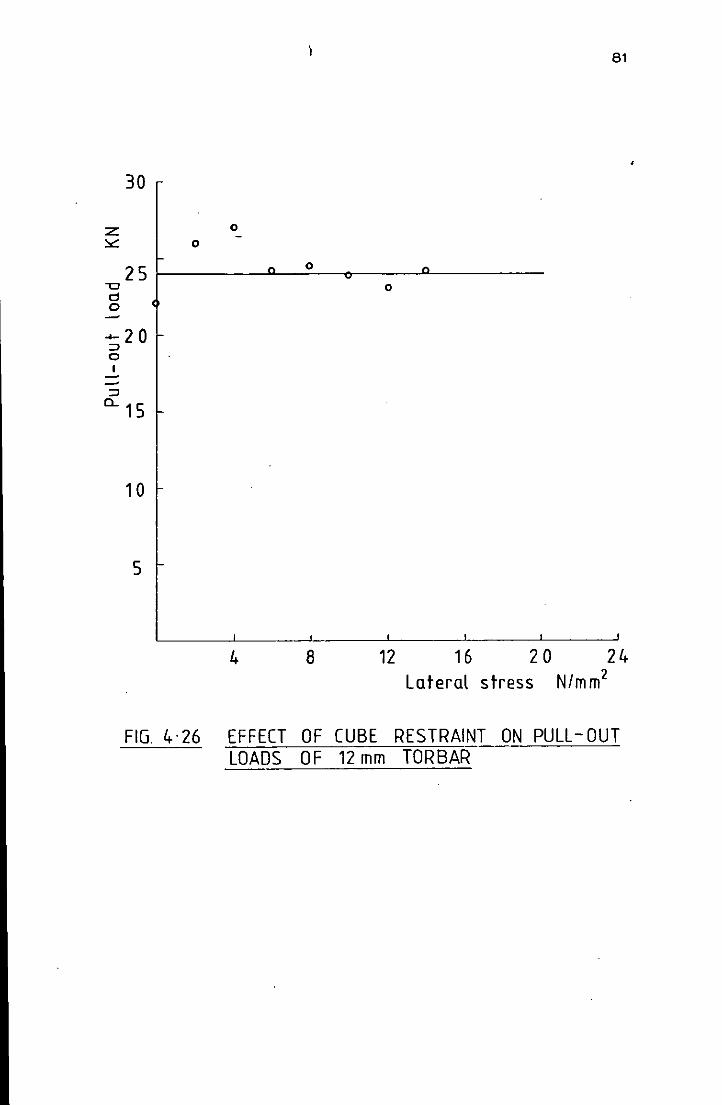
81
30
:z 0 -:.:::: 0
2S 0
LJ 0 d 0
.... 20 => 0 I
=> 0... 1 S
10
S
4 8 12 16 20 24 Lateral stress N/mm2
FIG. 4·26 EFFECT OF CUBE RESTRAINT ON PULL-OUT LOADS OF 12 mm TORBAR
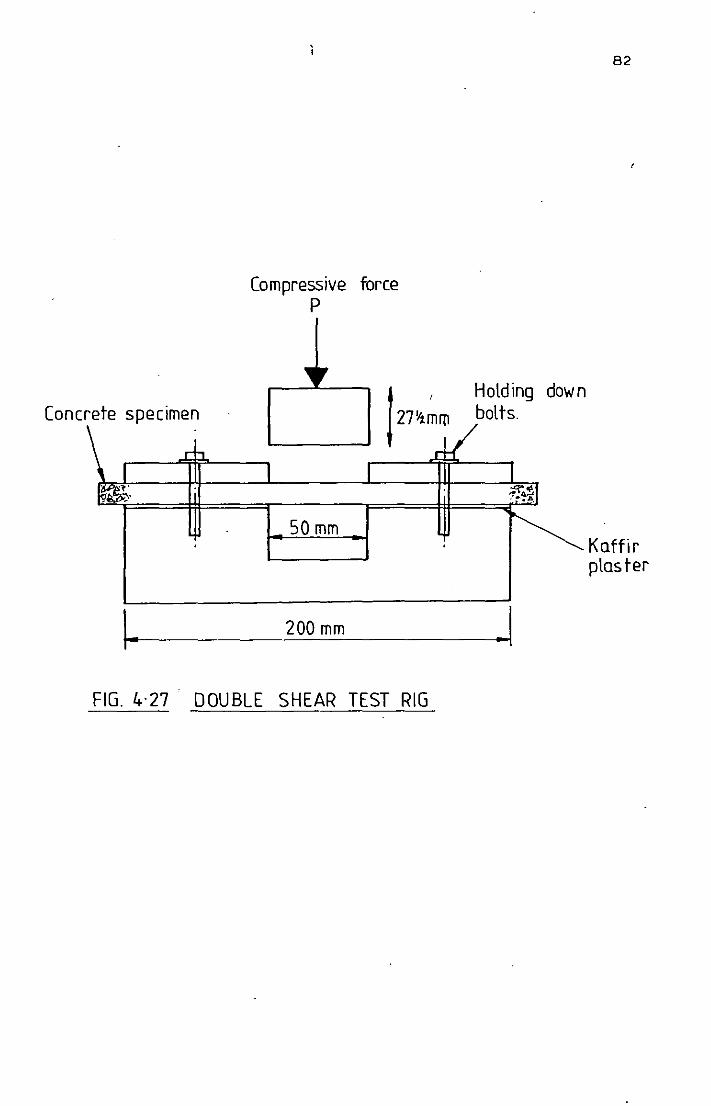
Concrete specimen
\ ~;.
\ ..
Compressive force p
50 mm
200 mm
FIG. 4·27 DOUBLE SHEAR TEST RIG
Holding down bolts.
! ~':~]
~
~I
82
Koffir plos ter
CHAPTER 5
5.1
THE EFFECT OF LATERAL PRESSURE ON THE BOND OF ROUND REINFORCING BARS
Introduction
There are two phases of bond resistance of round, plain
reinforcing bars. Before complete debonding of the embedded bar,
i.e. whilst there is still no slip of the free-end, the pull-out
load is resisted by the adhesion between the bar and matrix where
83
debonding has not occurred, and by friction when debonding has occurred.
At complete debonding the bond stress is due solely to the frictional
resistance between the interfaces at/or near the bar surface.
The permissible bond stresses used in design are obtained
from standard bond tests like the cube pUll-out. The frictional
bond resistance will be affected by various factors however, such as
initial stresses (8,25) about the bar, the tension in the bar (11)
and the bar surface (8,12,60) which are not variables in the
standard test. (11)
Glanville was the first to provide a model to
predict the bond stresses obtained by plain round bars, A similar
(58) approach was used both by Takaku and Arridge to study the
extraction of stainless steel wires embedded in epoxy resin, and then
by Pinchin (46) to predict the pull-out of steel wire embedded in
mortar matrixes, Pinchin (46) also showed experimentally that a
hydrostatic pressure could increase the pUll-out load and explained
this in terms of the increased friction resulting at the bar/matrix
interface,
This chapter outlines Glanville's (11) theory and explains
the modifications made to take into account the increased frictional
effect produced by the uniaxial stress conditions applied in the
author's test method,
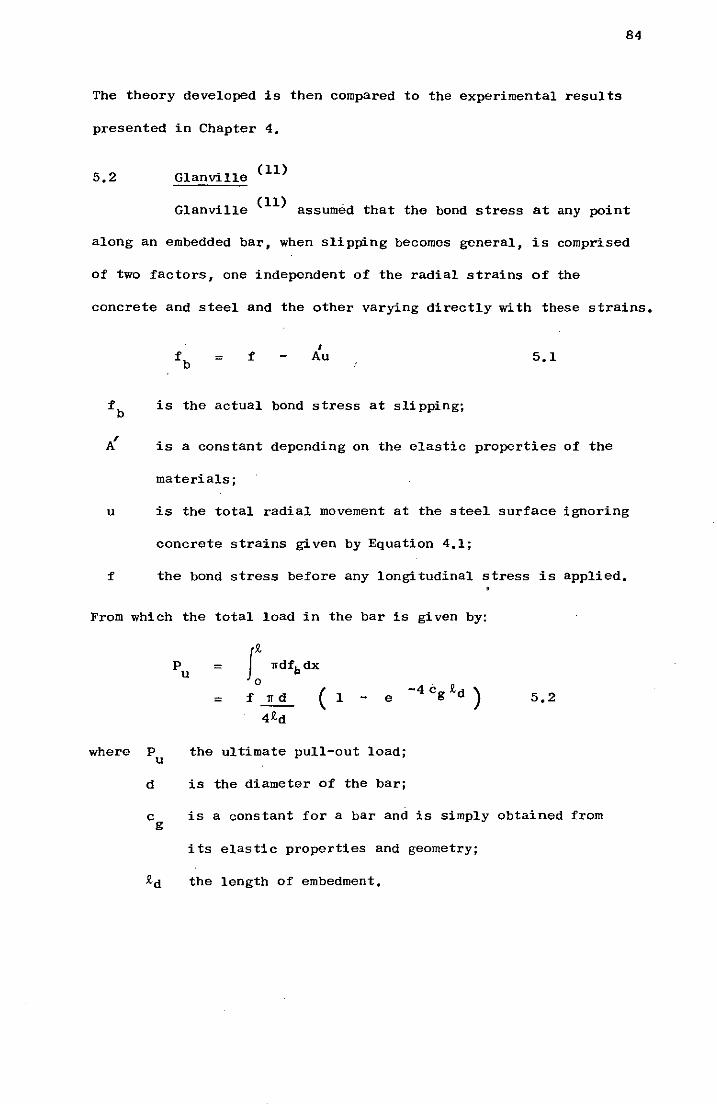
84
The theory developed is then compared to the experimental results
presented in Chapter 4.
5.2 Glanville (11)
Glanville (11) assumed that the bond stress at any point
along an embedded bar, when slipping becomes general, is comprised
of two factors, one independent of the radial strains of the
concrete and steel and the other varying directly with tbese strains.
f I
Au
fb is the actual bond stress at slipping;
5.1
A' . is a constant depending on the elastic propert~es of the
materials;
u is the total radial movement at the steel surface ignoring
concrete strains given by Equation 4.1;
f the bond stress before any longitudinal stress is applied.
From which the total load in the bar is given by:
where P u
p u = f~ rrdfbdx
0
= f rrd ( 1 e
4~d
the ultimate pull-out load;
d is the diameter of the bar;
-4 cg ~d ) 5.2
c is a constant for a bar and is simply obtained from g
its elastic properties and geometry;
~d the length of embedment.
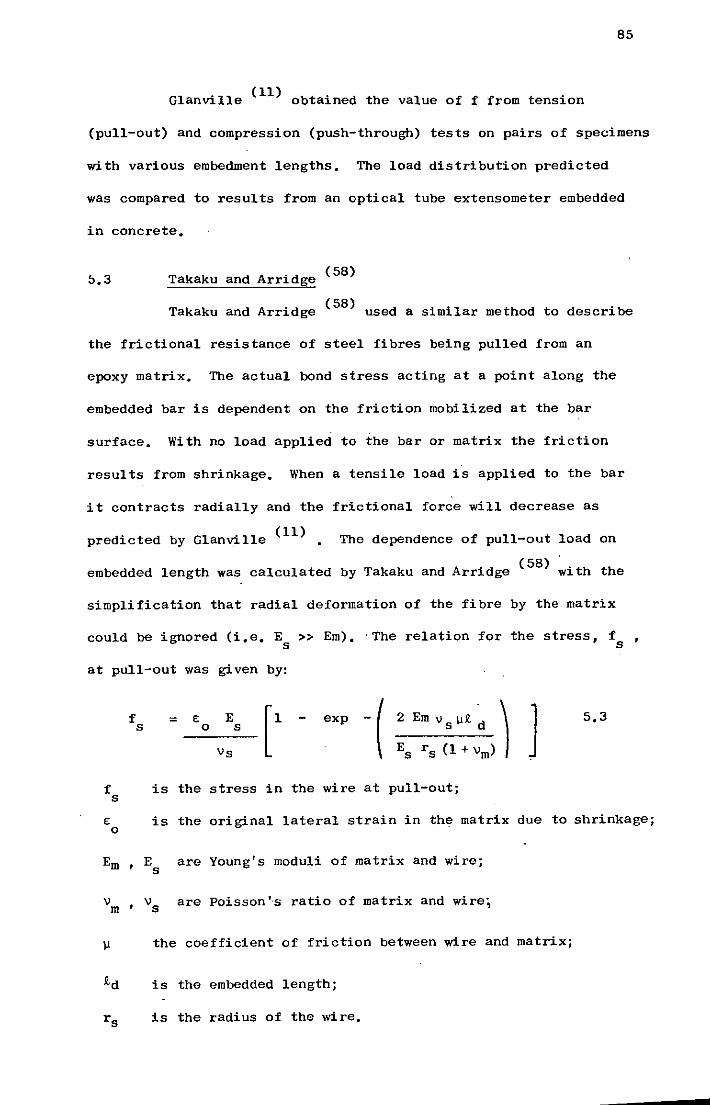
85
Glanville (11) obtained the value of f from tension
(pull-out) and compression (push-through) tests on pairs of specimens
with various embedment lengths. The load distribution predicted
was compared to results from an optical tube extensometer embedded
in concrete.
(58) Takaku and Arridge
Takaku and Arridge (58) used a similar method to describe
the frictional resistance of steel fibres being pulled from an
epoxy matrix. The actual bond stress acting at a point along the
embedded bar is dependent on the friction mobilized at the bar
surface. With no load applied to the bar or matrix the friction
results from shrinkage. When a tensile load is applied to the bar
it contracts radially and the frictional force will decrease as
predicted by Glanville (11) • The dependence of pull-out load on
embedded length was calculated by Takaku and Arridge (58) with the
simplification that radial deformation of the fibre by the matrix
could be ignored (i.e. E »Em). 'The relation for the stress, f s s
at pull-out was given by:
f s = _E:_o_E_s _ [l
Vs
exp
f is the stress in the wire at pull-out; s
] 5.3
E: is the original lateral strain in the matrix due to shrinkage; o
Em , E are Young's moduli of matrix and wire; s
"m ' "s are Poisson '"5 ratio of matrix and wire;
~ the coefficient of friction between wire and matrix;
£d is the embedded length;
rs is the radius of the wire.
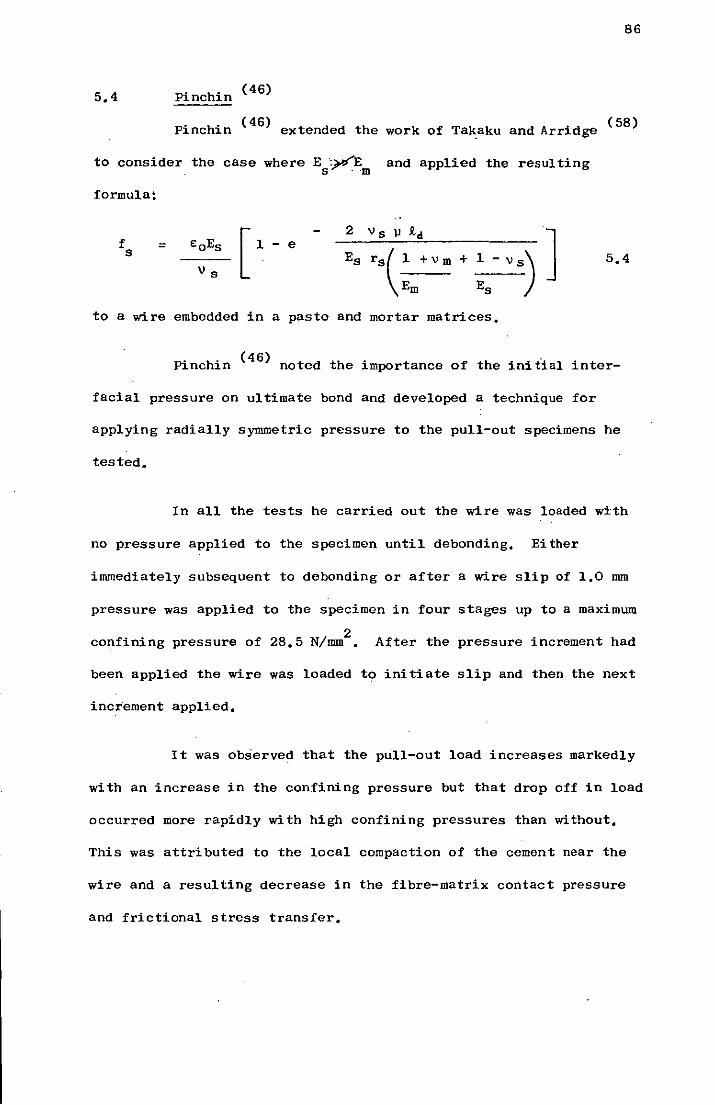
86
5,4 Pinchin (46)
(46) (58) Pinchin extended the work of Takaku and Arridge
to consider the case where E:y.<E and applied the resulting s ·-m
formula!
f s = +_l-VS)]
Es Vs
to a wire embedded in a paste and mortar matrices,
5,4
Pinchin (46) noted the importance of the ini fial inter-
facial pressure on ultimate bond and developed a technique for
applying radially symmetric pressure to the pull-out specimens he
tested,
In all the tests he carried out the wire was loaded with
no pressure applied to the specimen until debonding, Either
immediately subsequent to debonding or after a wire slip of I,D mm
pressure was applied to the specimen in four stages up to a maximum
2 confining pressure of 28,5 N/mm, After the pressure increment had
been applied the wire was loaded to initiate slip and then the next
increment applied,
It was observed that the pull-out load increases markedly
with an increase in the confining pressure but that drop off in load
occurred more rapidly with high confining pressures than without,
This was attributed to the local compaction of the cement near the
wire and a resulting decrease in the fibre-matrix contact pressure
and frictional stress transfer.
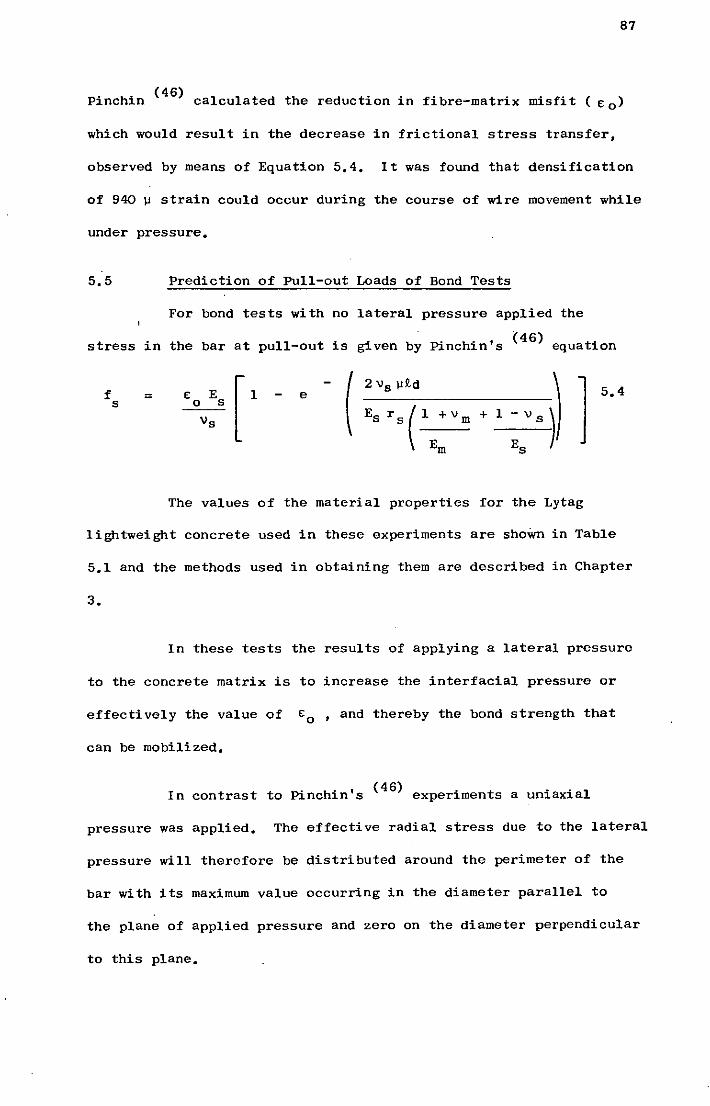
87
Pinchin (46) calculated the reduction in fibre-matrix misfit ( Eo)
which would result in the decrease in frictional stress transfer,
observed by means of Equation 5.4. It was found that densification
of 940 ~ strain could occur during the course of wire movement while
under pressure.
5.5 Prediction of Pull-out Loads of Bond Tests
For bond tests wi th no lateral pressure applied the
stress in the bar at pull-out is given by Pinchin t S (46) equation
f E E [, ( 2 Vs j1£d
:," ")1 1 5.4 = e
s 0 s
Vs Es rsC
+Vm + 1
Em
The values of the material properties for the Lytag
lightweight concrete used in these experiments are shoWn in Table
5.1 and the methods used in obtaining them are described in Chapter
3.
In these tests the results of applying a lateral pressure
to the concrete matrix is to increase the interfacial pressure or
effectively the value of EO ' and thereby the bond strength that
can be mobilized.
In contrast to Pinchin's (46) experiments a uniaxial
pressure was applied. The effective radial stress due to the lateral
pressure will therefore be distributed around the perimeter of the
bar with its maximum value occurring in the diameter parallel to
the plane of applied pressure and zero on the diameter perpendicular
to this plane.
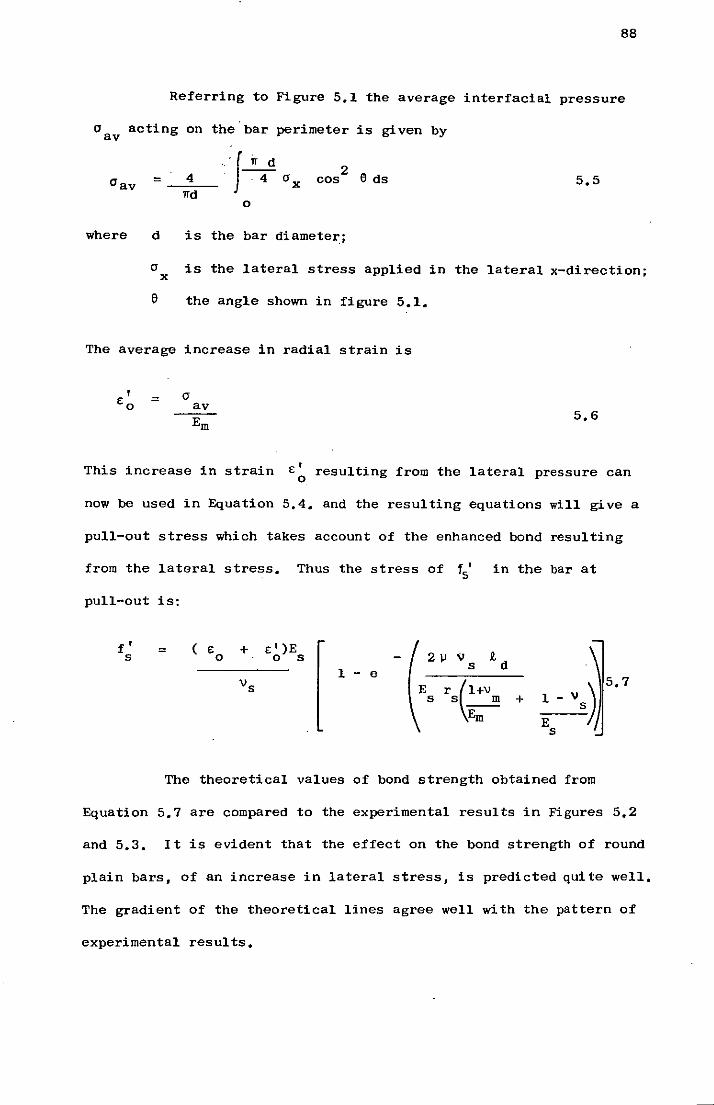
88
Referring to Figure 5.1 the average interfacial pressure
o acting on the bar perimeter is given by av
"'f~ 2 ~ _...:4,--_ . . 4 Cl x cos a ds 1Td
o
where d is the bar diameter.;
5.5
Cl x
is the lateral stress applied in the lateral x-direction;
e the angle shown in figure 5.1.
The average increase in radial strain is
~ o av
This increase in strain E~ resulting from the lateral pressure can
now be used in Equation 5.4. and the resulting equations will give a
pull-out stress which takes account of the enhanced bond resulting
from the lateral stress. Thus the stress of f ' 5 in the bar at
pull-out is:
f' s
+ E')E o s
"s 1 - e
2jJ Vs R.d
E r (1+" s s m Em
+ 1 -
E s
The theoretical values of bond strength obtained from
Equation 5.7 are compared to the experimental results in Figures 5.2
and 5.3. It is evident that the effect on the bond strength of round
plain bars, of an increase in lateral stress, is predicted quite well.
The gradient of the theoretical lines agree well with the pattern of
experimental results.
89
The upper and lower bound lines of Figures 5.2 and 5.3 reflect
the variation to be expected in initial shrinkage value e of the . 0
concrete. The initial shrinkage is a variable parameter and is
dependent on the method of curing and the composition of the mix.
The upper value of shrinkage in Table 5.1 is that obtained from
curing the specimen under laboratory conditions; the lower value is
the irreversible part of shrinkage (0.3 x dry shrinkage value) that
Neville (77) suggests is the value expected for specimens cured
under water.
The value of coefficient of friction ~ used in Equation
5.7 was that obtained by Pinchin (46) from tests on water cured
specimens and supported by data from the Cement and Concrete
Association Research Laboratory (59) (see Section 2.3.2).
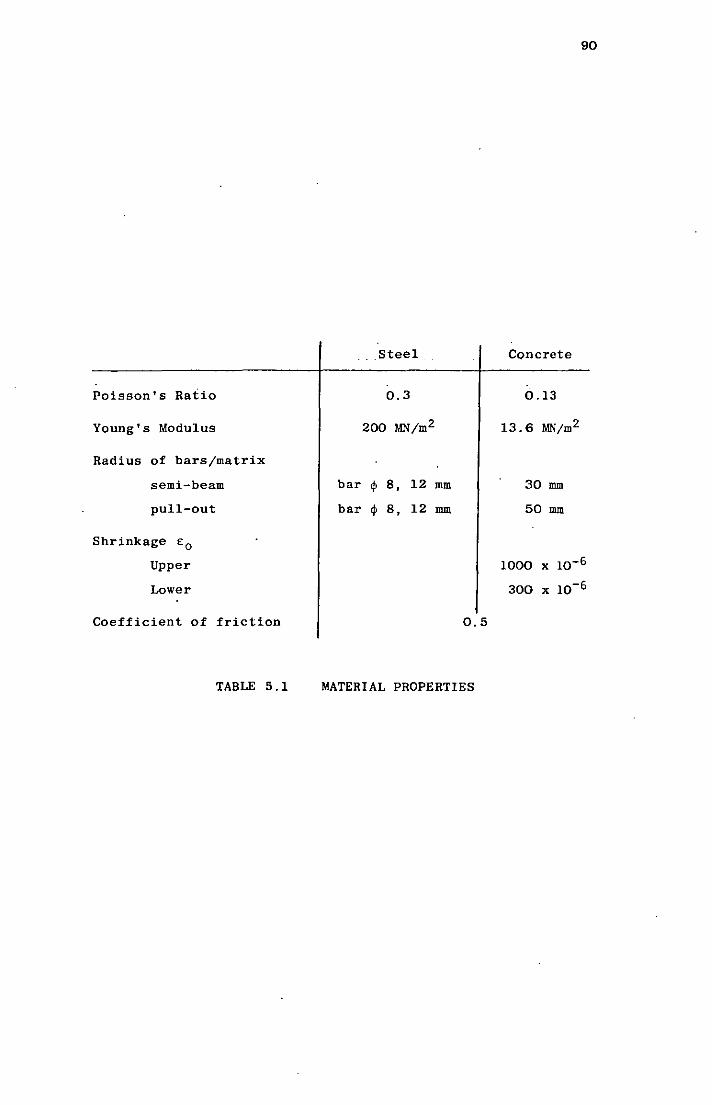
Poisson's Ratio
Young's Modulus
Radius of bars/matrix
semi-beam
pUll-out
Shrinkage EO
Upper
Lower
Coefficient of friction
TABLE 5.1
· .. Steel
bar
bar
0.3
200 MN/m2
q, 8, 12
q, 8, 12
mm
mm
0.5
MATERIAL PROPERTIES
Concrete
0.13
13.6 MN/m2
30 mm
50 mm
90
1000 x 10-6
300 x 10-6
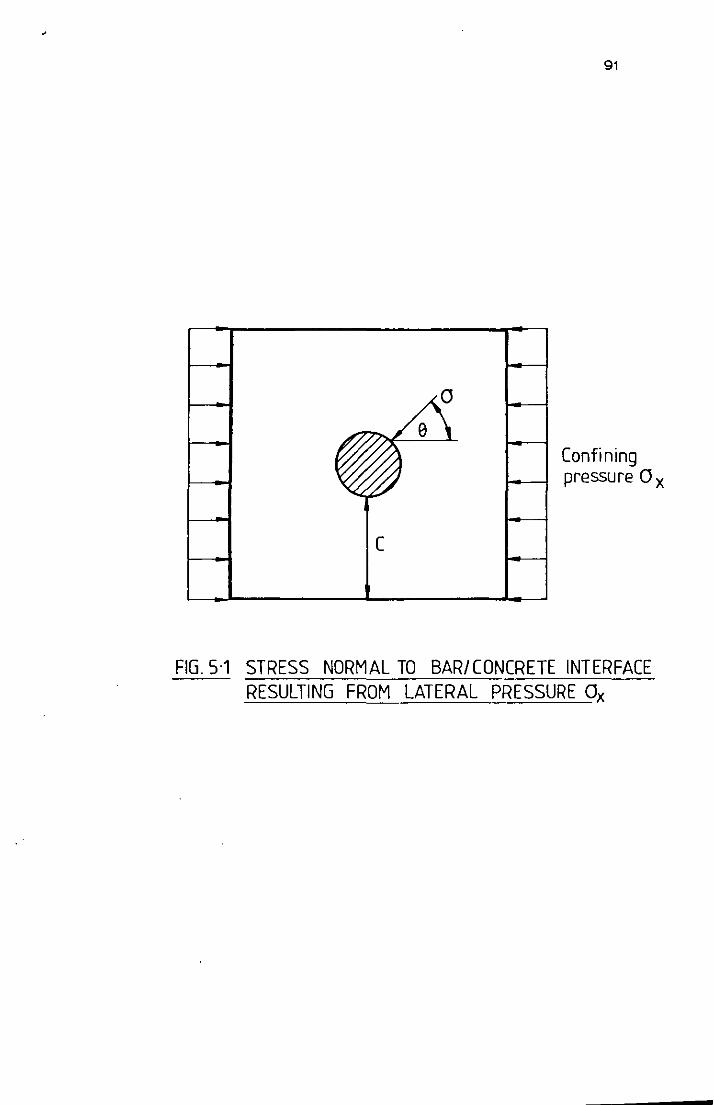
C
91
Confining pressure Ox
FIG.5·1 STRESS NORMAL TO BAR/CONCRETE INTERFACE RESULTING FROM LATERAL PRESSURE Ox
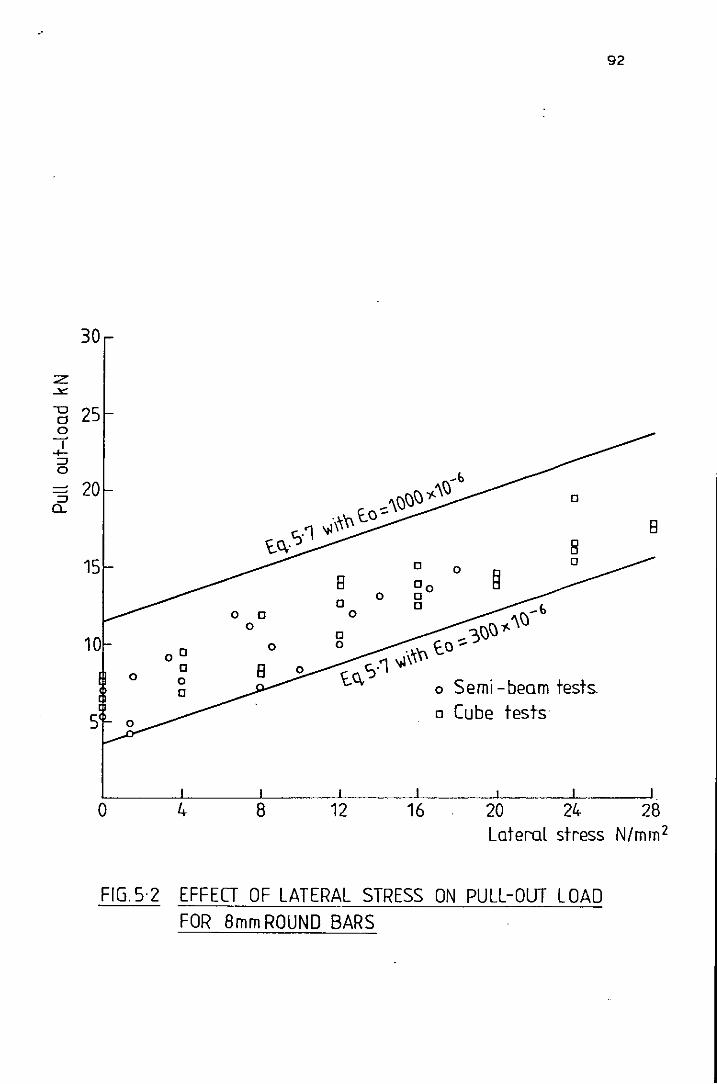
;z: -"" u d 0 I' ..... :::J 0
-:::J CL
92
30
25
-b 20 _ '\ r::F§:) j. '\ r:J 0
'~'n lo-S.1 'Il\ B
0 £.c,. 0
15 0 0 0 § B 00
0 0 0
0 _b 0 0 0
r:J j. '\ r:J 0
10 _ 3r:J
00 0 ','n ~o -
0 S.1 'Il\ 0 0 £.c, 0 Semi -beam tests. 0
5 o Cube tests
o 4 8 12 16 20 24 28 Lateral stress N/mm2
FIG.5·2 EFFECT OF LATERAL STRESS ON PULL-OUT LOAD FOR 8mm ROUND BARS
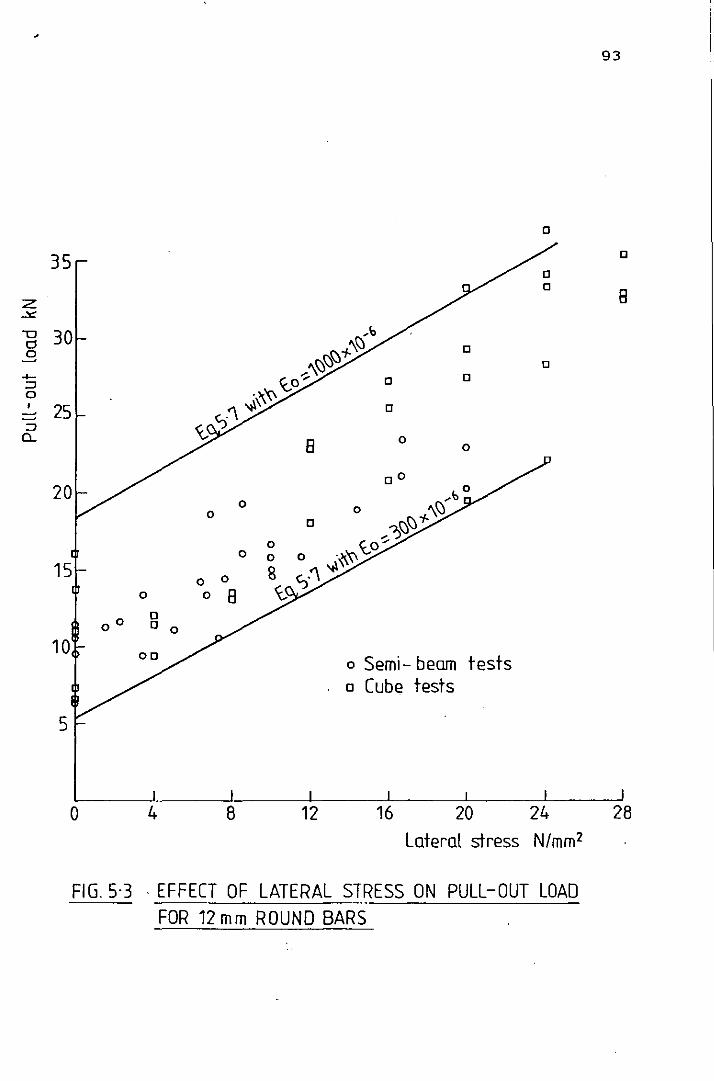
z .:r: "t:J d .3 4-~ 0 , ~
~ 0..
0
35
30 0
0 0
25
8 0 0
DO 20
0 0 0
0
0 0 0 0
15 0 0 0 0 8
10 o Semi- beam tests o Cube tests
5
o 4 8 12 16 20 24
Lateral stress N/mm 2
FIG.5·3 . EFFECT OF LATERAL STRESS ON PULL-OUT LOAD FOR 12 mm ROUND BARS
93
0
8
28
94
CHAPI'ER 6 PREDICTION OF THE BOND STRENGTH OF DEFORMED BARS
6,1 Introduction
This Chapter presents and compares the various empirical
and fundamental bond equations available for predicting bond
strength of deformed bars in concrete, An investigation is
described in which the strain distribution along the embedment
length of a strain gauged semi-beam specimen is monitored with
various combinations of lateral stress and pull-out load, The
conclusions drawn from the strain distribution diagrams together with
f (62) t· f d d t h Tep ers es lmate 0 a lower boun bon s rengt are used to
predict the pull-out loads observed in the pUll-out experiments
described in Ohapter 3,
6,2
6.2.1
Empirical Formulae
(40) Mathey and Watstein
(40) Mathey and Watstein obtained values of bond strength
from 18 beam and 18 pull-out tests using deformed bars with nominal
yield.strengths of 690 N/mm2 (100,000 psi), The lengths of
embedment ranged from 178 mm to 432 mm (7 to 17 in) for 12,7 mm
(#4) bars and 178 mm to 864 mm (7 to 34 in) for 25 mm (#8) bars.
Cri tical bond stress was defined as that occurring at loaded-end slip
of 0.25 mm (0.01 in) or a free-end slip of 0.05 mm (0,002 in). The
bond stress for these values of slip were considered sufficiently low
to ensure that beam failure at this value of slip would be by
yielding of the reinforcement. The formulae obtained from these
results gave the following values for bond strength:
fh!, (psi) = 62 600 x d
4 ~d + 85 for # 4 bars
f~ (psi) = 1300 + 380 for # 8 bars
d
6.2.2
is the bar diameter (in)
is the embedment length (in).
(65) Orangun, Jirsa and Breen
and
The authors analysed the results of 62 beam tests and
95
developed an equation to predict ultimate bond stresses for use in
design.
fb
,If'; c =
d =
9-'d =
fb = ,
f = c
6.2.3
= 1.2 4- 3 c + 50 d/9-d
d 6.1
cover (in)
diameter of bar (in)
development length (in)
average bond stress (psi)
concrete cylinder strength (psi) •
Kemp and Wilhelm (32)
(32) Kemp and Wilhelm provided empirical design formula to
account for both ultimate and cracking load bond stresses. The
results were obtained from 36 stub cantilever type bond specimens
in which the variables investigated were cover, bar spacing,
influence of stirrups, and the bond/shear ratio.
96
The ultimate load and cracking load equations are of the
same form and given by
fb = g[ K • ." 1~ll K3 [ V, J 6.2
S d
Kl = 6.57
K2 = 2.9
K3 = 0.191
fb = average bond stress at ultimate load (psi);
I. f = concrete strength (psi);
c
c = concrete cover (in);
d = diameter test bar (in);
At = area of stirrups (in2);
f = yield strength of stirrups (psi); y
S = centre to centre spacing between stirrups.
fb£ = xl' + K2 I ~ I] · K{ ::'" J 6.3
fb£ = average bond strength at first visible bond crack;
Kl = 1.66
K2 = 2.37
K3 = 0.13
6.2.4 Jimenez, \'/hi te and Gergely (31)
These authors proposed a model in which co~ete cover
and transverse reinforcement are the important parameters. The
model is based on the radial pressure exerted by the bursting
forces being resisted by thin cylinder circumferential stresses.
The axial stress (ksi) at splitting for 140 development and splice
length experiments from various sources is given by
£ 'd
c I
f c
d
e
f y
6.3
6.3.1
fs (ksi) = £d
[c K + 0.573efy ]
=
=
=
=
=
=
d (27.8 d + 0.45£d)
length of development (in) ;
concrete cover (in);
concrete compressive strength (psi) ;
diameter of bar (in) ;
percentage web reinforcement;
yield strength of stirrups (psi) •
Fundamental Bond Theories
( 61) Lutz and Gergely
6.4
97
Lutz and Gergely (61) based their model for bond stress on
the bond stress required to resist shear at a section. The apparent
bond stress is therefore increased by transverse or stirrup reinforce-
ment and the shear resistance of the concrete. If the shear strength
of the concrete is taken as the ACt minimum of 2~ then it can
be shown that the bond stress (psi) is given by
= +
N 7T d
f y
S N 7T d
6.5
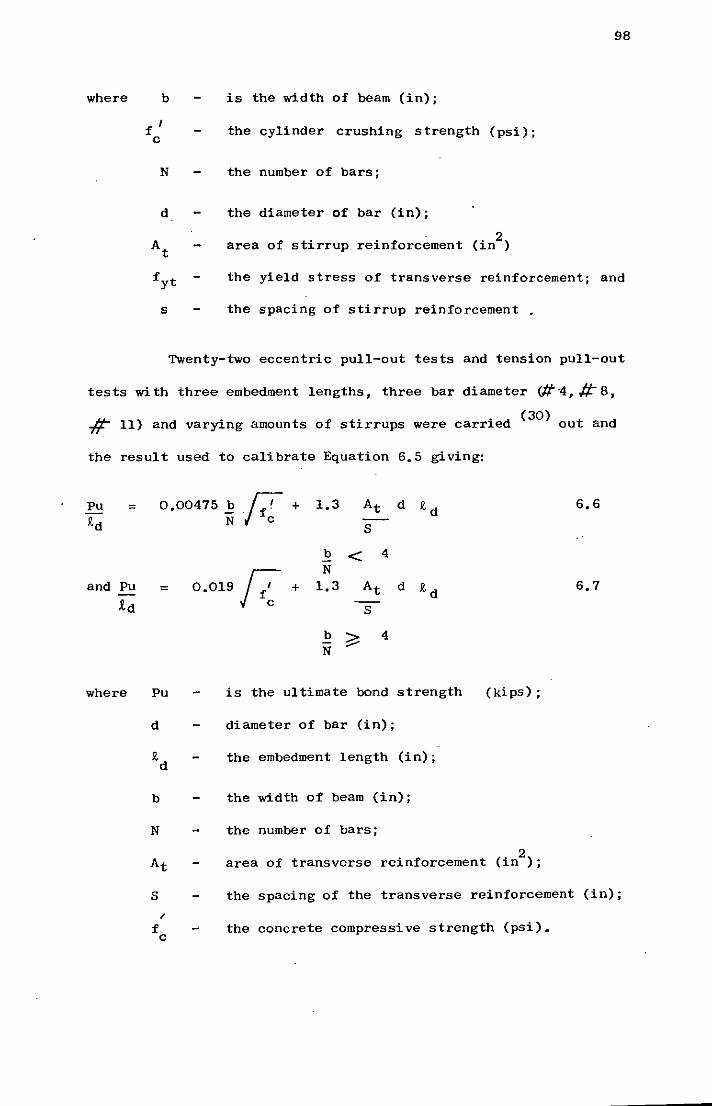
98
where b is the width of beam (in);
f I C
the cylinder crushing strength (psi);
N the number of bars;
d the diameter of bar (in);
At area of stirrup reinforcement (in2
)
fyt the yield stress of transverse reinforcement; and
s the spacing of stirrup reinforcement .
Twenty-two eccentric pull-out tests and tension pUll-out
tests with three embedment lengths, three bar diameter (#"4, #8,
~ 11) and varying amounts of stirrups were carried (30) out and
the result used to calibrate Equation 6.5 giving:
Po = 0.00475 !> rr:+ 1.3 At d ~d ~d N --
S
6.6
b < 4
0.019 !Z N and Pu = + 1.3 At d ~d
.td S
6.7
b ~ 4 N
where Pu is the ultimate bond strength (kips) ;
d diameter of bar (in) ;
~ the embedment length (in) ; d
b the width of beam (in) ;
N the number of bars;
At area of transverse reinforcement (in2
) ;
S the spacing of the transverse reinforcement (in) ;
I
f the c
concrete compressive strength (psi) •
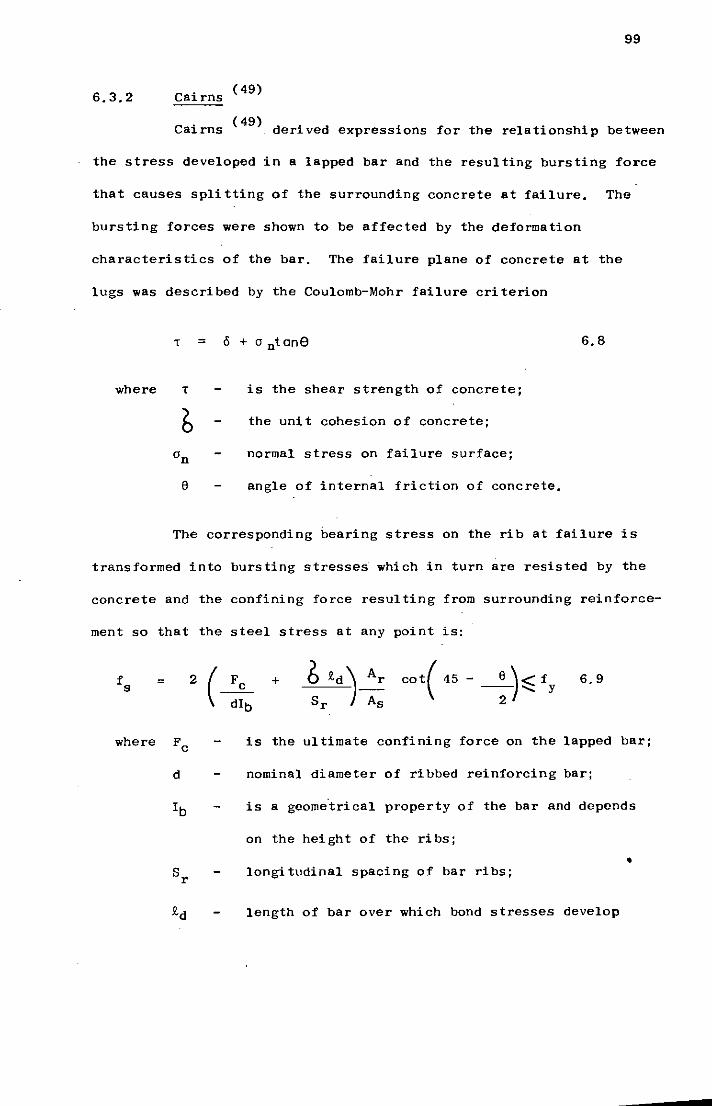
99
6.3.2 Cai rns (49)
Cairns (49) derived expressions for the relationship between
the stress developed in a lapped bar and the resulting bursting force
that causes splitting of the surrounding concrete at failure. The
bursting forces were shown to be affected by the deformation
characteristics of the bar. The failure plane of concrete at the
lugs was described by the Coulomb-Mohr failure criterion
T = o + 0ntan9 6.8
where T is the shear strength of concrete;
& the unit cohesion of concrete;
an normal stress on failure surface:
e angle of internal friction of concrete.
The corresponding bearing stress on the rib at failure is
transformed into bursting stresses' which in tUrn are resisted by the
concrete and the confining force resulting from surrounding reinforce-
ment so that the steel stress at any point is:
=
where Fe
d
+ cot(45- ej<f ---..,;: y 2
6.9
is the ultimate confining force on the lapped bar;
nominal diameter of ribbed reinforcing bar;
is a geome'trical property of the bar and depends
on the height of the ribs;
• longitudinal spacing of bar ribs;
length of bar over which bond stresses develop
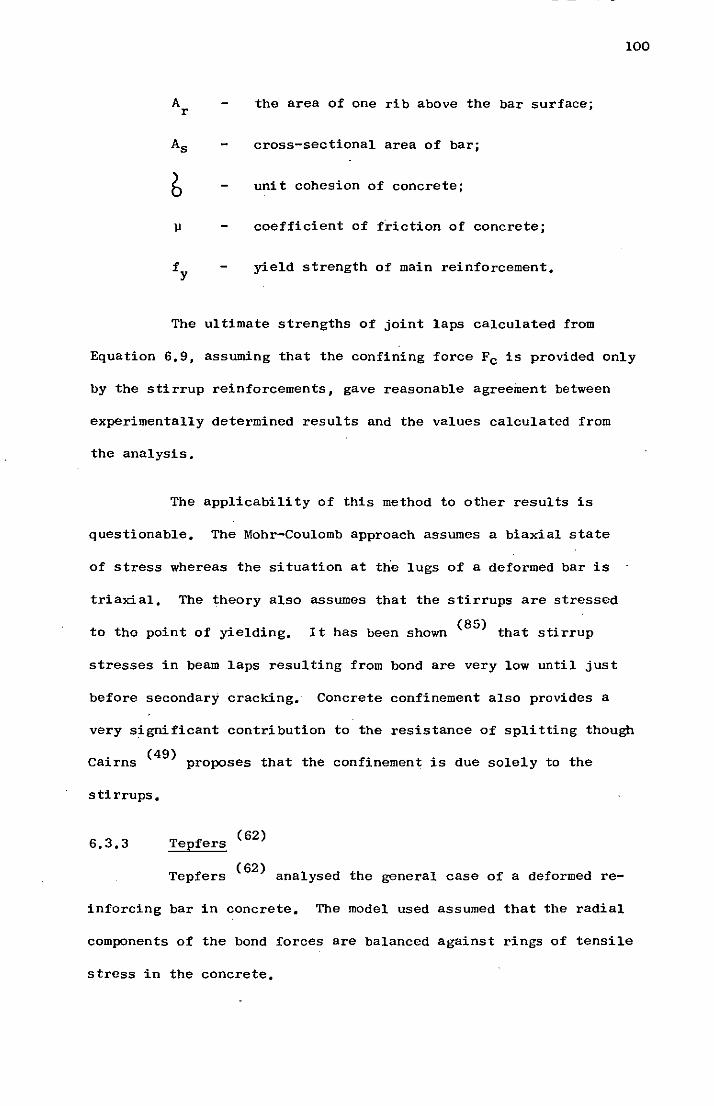
A r
)J
the area of one rib above the bar surface;
cross-sectional area of bar;
unit cohesion of concrete;
coefficient of t:riction of concrete;
yield strength of main reinforcement.
The ultimate strengths of joint laps calculated from
100
Equation 6.9, assuming that the confining force Fc is provided only
by the stirrup reinforcements, gave reasonable agreement between
experimentally determined results and the values calculated from
the analysis.
The applicability of this method to other results is
questionable. The Mohr-Coulomb approach assumes a biaxial state
of stress whereas the situation at the lugs of a deformed bar is
triaxial. The theory also assumes that the stirrups are stressed
to the point of yielding. (85)
It has been shown that stirrup
stresses in beam laps resulting from bond are very low until just
before secondary cracking. Concrete confinement also provides a
very significant contribution to the resistance of splitting though
Cairns (49) proposes that the confinement is due solely to the
stirrups.
6.3.3 (62)
Tepfers
(62) Tepfers analysed the general case of a deformed re-
inforcing bar in concrete. The model used assumed that the radial
components of the bond forces are balanced against rings of tensile
stress in the concrete.
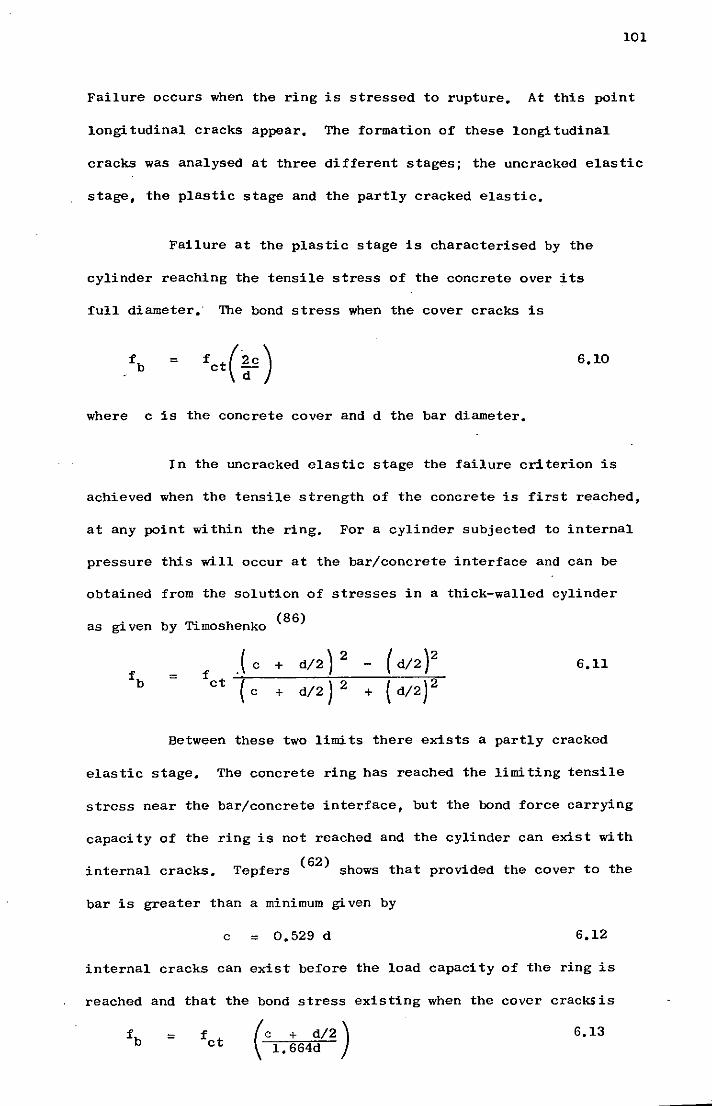
lOl
Failure occurs when the ring is stressed to rupture. At this point
longitudinal cracks appear. The formation of these longitudinal
cracks was analysed at three different stages; the uncracked elastic
stage, the plastic stage and the partly cracked elastic.
Failure at the plastic stage is characterised by the
cylinder reaching the tensile stress of the concrete over its
full diameter.- The bond stress when the cover cracks is
= 6.10
where c is the concrete cover and d the bar diameter.
In the uncracked elastic stage the failure criterion is
achieved when the tensile strength of the concrete is first reached,
at any point within the ring. For a cylinder subjected to internal
pressure this will occur at the bar/concrete interface and can be
obtained from the solution of stresses in a thick-walled cylinder
as given by Timoshenko (86)
= _ (c + d/2) 2 ( d/2)2
fct ~----------~~--~--~~ ( c + d/2) 2 + (d/2) 2
6.11
Between these two limits there exists a partly cracked
elastic stage. The concrete ring has reached the limiting tensile
stress near the bar/concrete interface, but the bond force carrying
capacity of the ring is not reached and the cylinder can exist with
internal cracks. (62)
Tepfers shows that provided the cover to the
bar is greater than a minimum given by
c = 0.529 d 6.12
internal cracks can exist before the load capacity of the ring is
reached and that the bond stress existing when the cover crackS is
fb = fct (c + d/2) 6.13
1.664d
102
(62) Tepfers assumes that the bond stress is constant
along the embedded length. This assumption, even for the short
(62) embedments used in Tepfers tests, is questionable. The work
(28) of Goto has shown that as ultimate bond strength is approached
there is no contact between bar and concrete at points away from the
bearing side of the ribs. Therefore all load is transferndbetween
bar and concrete by the bearing of the bar ribs on the concrete. Also
for longer embedments the assumption of a constant maximum value
for bond stress leads to an over-estimation of the ultimate bond
capacity.
Tepfers (62) approach is an over-simplication and ignores
various parameters such as the effect of rib specific area (80)
and transverse reinforcement.(3l,32,65) both of which are known to
increase the bond capacity. However, the bond strength, as calculated
at the partly cracked elastic stage, (Equation 6.13) provides a
reasonable lower bound to experimental results, while the plastic
analysis predictions are approached as confinement provided by the
cover is increased.
6.4 Summary of Bond Strength Formulae
A comparison of the measured bond strengths given by the
semi-beam test and the calculated values obtained from the various
empirical and fundamental bond equations are given in Table 6.1.
Generally the approaches overestimate the observed bond strength.
This may be due to the fact that most of the formulae were calibrated
with results from normal weight concrete specimens which are known to
have higher bond strengths than lightweight.
103
The equation proposed by Mathey and Watstein (40) , contrary to
existing evidence, predicts that bond strength increases with
increasing bar size. Only this equation and that of OranGun,Jirsa
(65) and Breen suggest reduced bond strengths occur as the embedment
is increased. . (61) Lutz and Gergely's formula relating the shear at
a section to the bond greatly underestimates the bond strengths
obtained in an anchorage situation. (62)
Tepfers prediction based
on the partly cracked elastic stage criterion for failure, only
I slightly underestimates the observed values. This method does also
have the advantage of relating only the actual material properties
to the bond strengths rather than being based on the results of
various independent investigations. It will be used later to
predict the bond values from the experimental investigation.

104
6.5 The Bond Stress Distribution for Deformed Bars
6.5.1 Average Bond Stress Distribution
The bond stress distribution along an embedded bar has
traditionally been taken to be uniform. The assumption has been
useful where relative rather than absolute bond resista~ce is
acceptable, as for example when comparing the slip resistance of
various lug sizes and patterns. Certainly for low bond stresses
this assumption is not true and a bond stress distribution resembling
. (87) that proposed by Ferguson (Figure 6.1) is more likely.
(48) . Tepfers suggests that at h1gh loads the bond properties change
in such a way as to approach an evenly distributed bond stress.
The deformability of the concrete and longitudinal cracking, which
lower the resistance of the surrounding concrete, tends to smooth
out any peaks in bond stress. At the last stage of loading to
failure for lapped splices Tepfers (48) has noted, from readings
of strain gauged specimens, that as the bars start to slip the bond
is almost evenly distributed.
6.5.2 Methods for Determining the Bond Stress Distribution
(12) Gilkey, Chamberlin and Beal recognised that the bond
stress distribution was probably not constant from the loaded end of
a pull-out bar to the free end. In order to obtain load distribution
curves they took measurements on the external surface of the concrete
and assumed that these values could be applied to the contact surface.
(16) Plowman's method of measuring the movement of studs
welded to the bar surface had the disadvantage of disturbing the bond
at the interface and also it was not practical to provide a small
gauge length.
105
Wilkins (17) was the first to use electrical resistance
strain gauges. These he inserted in tubes made from 25 mm (1 inch)
diameter plain and 25 mm (1 inch) and 38 mm (I! inch) diameter
knurled bars. The embedment length of the bars was 405 mm (16 inch)
and the gauges positioned at 50 mm (2 inch) centres. The pull-out
loads applied were low in order to remain within the elastic range
of the tube.
The results of this investigation were typical of the
qualitative nature of conclusions that have been obtained by later
investigations of this sort:
1. Bond resistance is first developed at the loaded end of the bar,
leaving parts of the tubes free of load at the early stages of
a test;
2. Maximum bond stress moves' towards the free end of the embedded
bar under increasing load; and
3. The character and type of surface of bar are important parameters
on the bond resistance.
Mains (18) inserted gauges in reinforcing bars by cutting
an off-centre longitudinal slice down the bar and providing a channel
so as to allow the gauges to be mounted at the centroid of the finished
bar. After insulating and waterproofing the gauges the bar was tack
welded together. Using this method tensile force distributions were
obtained for beam and pUll-out specimens. The effect of standard
hooks on the behaviour of plain and deformed bars were compared.
106
'I' (18) i . From "a1ns results t 1S clear that provided no transverse
cracking occurs within the anchorage zone for straight deformed bars,
the maximum average bond stress is only a little lower than the
measured maximum bond stress at any particular value of pull-out
load.
For round bars the bond stress towards the loaded end of
the bar tends to reduce and therefore the calculated average bond
stress is considerably lower than the maximum measured value. All
the deformed bar tests carried out by Mains (18) resulted in failure
by yielding of the bars rather than by bond failure and therefore no
conclusion could be drawn about the bond stress distribution at
pull-out.
(21) The experimental technique employed by Perry and Thompson.
and later by Nilson (22) were similar to that of Mains (18) except that
only deformed reinforcing bars were used and these were sawn
longitudinally across the diameter of the bar. Slots were milled
along the centre-line of each cut surface and then the electric
resistance strain gauges were attached at close intervals along the
bottom of each slot. The two halves of the bar were then rejoined
by welding or wi th epoxy cement.
Perry and Thompson (21) like Wilkins (17) , investigated
low pull-out forces (average bond stress equal to 2.8 N/mm2 (400 psi»
and their conclusions were similar. As the pull-out load was in-
creased the movement of the position of maximum bond stress from the
loaded end towards the free-end of the bar was clear.
107
They also compared the bond stress distribution observed in a
pull-out test to that in a beam bar cut off, and to the bond stress
distribution adjacent to a crack in a beam. Little similarity was
observed although the magnitudes of the maximum bond stress for
each were approximately the same.
(22) Nilson tested only one type of specimen with a very
limited range of concrete strengths. The results of his experiments
were not conclusive and only supported the observations of others.
An alternative approach to internal strain gauging is to
attach strain gauges to the outside of bars. This results in a
significant disturbance of the concrete/steel interface, and the
method can only be expected to indicate the relative steel stresses
within a member rather than the bond stress distribution.
6.6 Experimental Investigation of Effect of Lateral Pressure on the Bond Stress Distribution
From the review presented in the previous section it is
apparent that the information on bond stress distribution at pull-
out of the bar is limited. No doubt this is partly a result of the
time consuming and expensive nature of preparing and gauging specimens.
However, any method of predicting ultimate pull-out loads must
reflect the conditions at failure. Neither has the effect that
lateral stress has on modifying the bond distribution been investigated.
The following sections describe an experimental investigation on·a gauged
semi-beam specimen subjected to varying lateral pressures and pull-out
loads up to bond failure.
6.6.1· Test Specimen
The method adopted was similar to that employed by Perry and
Thompson (2l)(Figure 6.2).
108
Two 12 mm torbars were milled down to half diameter in the laboratory,
A 2 mm x 4 mm slot was then milled out down the axis of each half
bar, The slot that was to accommodate the strain gauges was then
prepared by rubbing down with successive grades of 600, BOO and 1000
wet-and-dry sand-paper until a mirror surface was obtained, The
surface was then thoroughly cleaned with acetone and seven gauges
posi tioned over the 100 mm length which was to be bonded in the
semi-beam specimen, A further gauge was positioned outside the
bonded length to monitor the strain from the pull-out load, The
gauges used were Tinsley (88) linear foll gauges wi t'h a nominal active
gauge length of 1,6 mm, The gauges were supplied with enamelled
copper jump leads attached, The cement used to attach the gauges
was MY 753 Araldite with HY 951 hardener, These were mixed in
proportions of 10 to 1 and spread out over the surface to which the
gauge was to be bonded. The gauges were aligned parallel to the axis of
the bar and covered' with a strip of PTFE tape, Any surplus adhesive
was then carefully rolled out and pressure applied to the gauge
through a neoprene rubber strip,'by means of clamps, The gauges were
then left for 48 hours in a warm atmosphere to cure,
The gauges were waterproofed by coating with M-Coat A, an
air drying polyurethane, The jump leads were soldered to tags glued
to the surface of the bar to prevent snagging of the gauges,
6,6,2 Calibration
The gauged specimen was calibrated in a 400 flN Amsler
hydraulic testing machine, The calibration curves, using a gauge
factor of 2,07 supplied by the manufacturer, are shown in Figure 6,3,
lO9
The bridge voltage was 0.9 V at all times and the current switched
on at least 2 hours before testing to allow the gauges to stabilise.
(89) Data logging was provi'ded by a Commadore Pet 32K computer
connected to a Solartron 7060 digital voltmeter (90) and a Solartron
Minate Analog Scanner (91). The wheatstone bridge circuits incorpor
ating the strain gauges attached to the semi-beam specimen were
connected via a' solder box to the equipment described above (Figure
6.4). The Minate Scanner and voltmeter are commanded by the Pet
Computer to scan voltage readings from the gauges at the rate of
approximately 2 channels per second. The voltage changes were then
converted to strain measurements which were output to an on-line
printer and also displayed on the computer's V.~U.
6.6.3 Test Method
The calibrated specimen was cast into a semi-beam specimen
as described in Section 3.8, A control semi-beam was also
fabricated, together with 6 cubes and 2 cylinders. The cubes and
cylinders were cured under water at 200
C for 28 days until testing
and the semi-beams left to cure under laboratory conditions,
The apparatus used for testing the strain-gauged semi-beam
test specimen was the same as described earlier in Section 3.9.2.
The test procedure was carried out in two parts. Firstly, the specimen
was loaded in increments up to a pull-out load of'15 kN without
lateral pressure applied. From previous experiments it was observed that
little slip had occurred over this range of pull-out load and
hopefully the minimum bond deterioration possible resulted,
llO
The load was then removed and the process repeated for 4 increasing
2 increments of lateral pressure up to 16 N/mm. Figures 6.5 to 6.9
show the distribution of strain along the bonded length of bar for
2 lateral pressures of 0, 4, 8, 12 and 16 N/mm • Finally the specimen
was· tested to failure wi th a lateral pressure of 8 N/mm2 applied,
(Figure 6.10).
The control semi-beam specimen was tested in a similar
manner as that described above so "that comparison could be made
with monotonically loaded tests.
6.7 Results from Gauged Semi-beam Specimen
6.7.1 General
Gauge 5 (Figure 6.2) failed to function properly very soon
after the start of testing and results from this gauge. are therefore
ignored. Strain gauge 8 which monitored the strain in the unbonded
.bar consistently under read increments in strain. These results
were also ignored and hence Figures 6.5 to 6.9 represent the output
from 6 strain gauges within the bonded length of the specimen.
Figure 6.10 presents the strain distributions observed when the
specimen was loaded to failure with an applied lateral stress of
2 8 N/mm. At this stage only four of the original eight gauges were
operating successfully. The unreliability of the gauges was
disappointing considering the care and patience that was required
to prepare the surfaces, attach and then to connect the gauges.
Although the gauge length employed was small compared to
that used in previous investigations the relatively large spacing of
the gauges made it apparent that little quantitative information
about the strain distribution could be obtained from these experiments.
(
The qualitative conclusions on the effect of lateral load on the
distribution and the ultimate strain distribution are discussed
below.
6.7.2 Effect of Lateral Load on Strain Distribution
III
Figure 6.5 shows the strain distribution on initial loading
of the specimen with no lateral load. As the pUll-out load increases
the change of strain becomes more evenly distributed along the
embedment length. At a pull-out load of 15 kN, which corresponds
to approximately half of the anticipated ultimate pull-out, the
gradient of the line is almost constant. This would indicate that the
bond stress is also uniform, even at half the ultimate load. Similar
observations can be made from Figures 6.8 to 6.9 which show the
strain distributions for various increments of lateral pressure.
It is interesting to note that the application of increasing lateral
pressure has no effect on the strain distribution. It might have
been suspected that the bond strength would be increased by increasing
lateral stress and this would be reflected in an initial steeper
gradient. This is not the case and Figure 6.11 shows how the strain
distribution is virtually constant whatever the value of confinement.
Figure 6.11 also demonstrates the effect of repeated loading of the
specimen. Residual strains remain in the bar after_unloading and these
have the effect of displacing the strain distribution upwards especially
at the unloaded end of the bar where the interface has been disrupted
least.
112
6.7.3 Strain Distribution at Bond Failure
The strain distribution along the bar at failure is
similar to that at any other increment of loading. In Figure 6.10
the strain gradients remain reasonably constant over the embedment
and the bond stress can be assumed to be nearly uniform. Failure
of the semi-beam specimen occurred by splitting at a pull-out load
of 31.25 kN compared to 34.5 kN for the control specimen.· These
values are comparable to ultimate pull-out loads obtained from the
semi-beam tests shown in Figure 4.10. The reduced area of the
gauged bar and the resultant increased strain in the bar, obviously
had little effect on the ultimate pull-out.
6.8 Prediction of Pull-out Loads for Deformed Bars
It has been concluded in the previous sections of this
(62) . . chapter that Tepfers theory of the partly cracked elast1c bond
failure criterion. is the most attractive of the various bond formulae
available. Results from the strain gauge experiment have also
supported the argument that the bond stress can be taken as practically
constant along the embedment length. The bond stress will be evenly
distributed for loads considerably less than the ultimate pUll-out
load, and varying the lateral pressure has little effect on strain
distribution for any particular value of pull-out load applied to the
bar.
This information, together with limiting shear bond stress
value observed for Lytag concrete, can be used to predict the bond
failure loads for the semi-beam and cube pUll-out tests. Firstly some
general comments must be made about the manner by which lateral pressure
modifies the ultimate bond strength of deformed bars.
113
The enhanced bond strengths of the round bars discussed
in Chapter 5 result from the lateral pressure increasing the
frictional effect at the bar/matrix interface. For deformed bars
failure occurs because the ring tension, resulting from bursting
forces, exceeds the tensile strength of the concrete. The deformed
bar specimens of Series '4, (Section 3.3,4) in which low friction
(69) M.G.A. pads were placed between the loading plattens and the cube
specimen, demonstrated that the increased pull-out results from
restraint rather than being due solely to the confining action of
the lateral pressure. Untrauer and Henry (66) ignored this possible
cause of increased pull-out. Also over the range of lateral pressures
they applied, the shear type platform which was apparent in these
experiments was not observed.
Results from the strain-gauged specimen support the conclusion
that increased lateral pressure improves the splitting capacity of the
specimen by restraint rather than affecting the bond strength
(Figure 6.1-1). The strain distributions observed at a particular
pull-out load are similar for various levels of applied lateral
pressure, if improved bond resulted then the gradient of the strain
distribution along the bar would increase.
Restraint resulting between the specimen and the metal
loading platten is seen as the least effective that would occur in
practi,e; Only a frictionless bearing would provide less and stirrups, ,
helices or other transverse reinforcement will provide substantially
greater restraint to splitting in the presence of lateral pressure.
114
(62) 0
Tepfers method of predict1ng the splitting load at the
partly cracked stage for specimens that are unconfined, provides a
satisfactory estimate ofoa lower bond value. The shear platform
observed with lightweight aggregate (Lytag) concrete is a property
of the concrete matrix and for concrete strengths in the normal
structural range is given by
This value, unlike the unconfined bond strength, is independent of
the embedment length.
The line marking the transition from unconfined splitting
(i.e. zero lateral stress) to shear type failures will depend on the
restraint provided between the loading plat~n. and the specimen.
For specimens that are restrained by metal load plates the
transition is reached with a lateral pressure of 0.3 fcu
• Figures
6.12 to 6.16 compare the pull-out loads observed in Chapter 4 with
the values predicted by this estimate of lower bound values.
(4 66) It has been shown ' that the shear platform for normal
weight concrete greatly exceeds that of Lytag lightweight concrete.
Increases·of bond strength in the order of 110% for lateral pressures
of 0.3 fcu have been observed as compared ·to 75% in these experiments
OhiO 0 (41) i h O t d t d W1t Lytag 19htwe1ght concrete. Rehm n 18 s u y commen e
that the failure by shearing rather than splitting for normal weight
concrete is to be expected at values of bond stress of the order of
0.4 - 0.6 times the cube crushing strengtl\ .
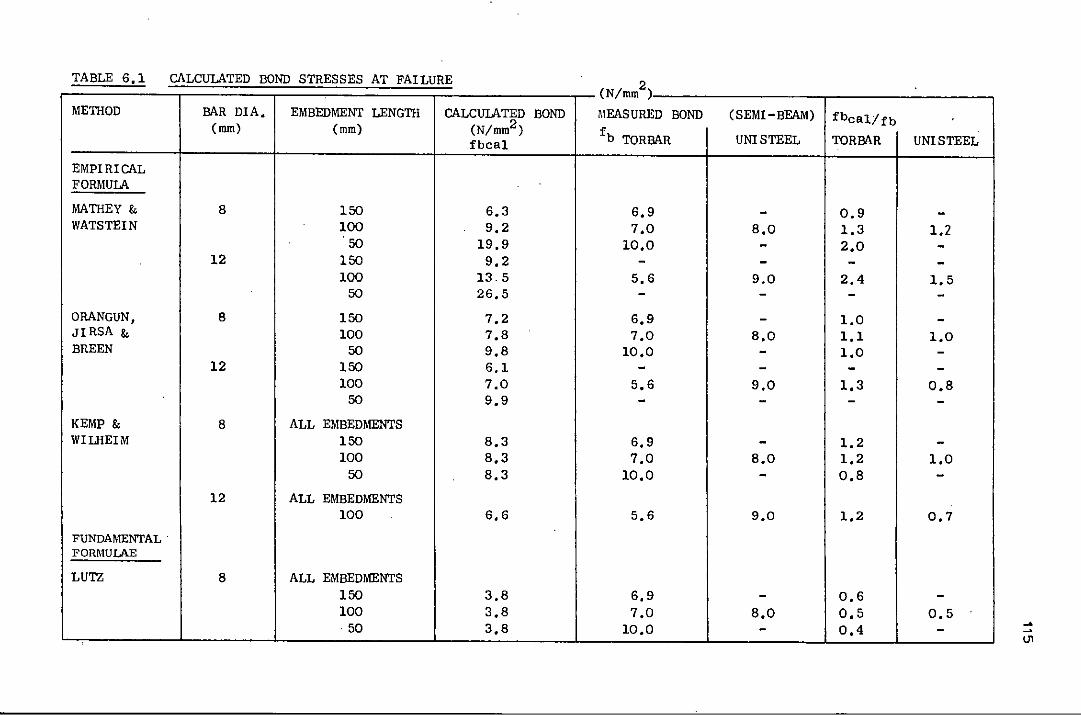
TABLE 6.1 CALCULATED BOND STRESSES AT FAILURE ~ --
" (N/mm ) METHOD BAR DIA, EMBEDMENT LENGTH CALCULATED BOND MEASURED BOND (SEMI-BEAM) fbcal/fb
(mm) (mm) (N/mm2 ) fb TORBAR UNlSTEEL TORBAR UNlSTEEL fbca1
EMPIRICAL FORMULA
MATHEY & 8 150 6.3 6.9 - 0.9 -WATSTEIN 100 9.2 7.0 8.0 1.3 1.2
50 19.9 10.0 - 2.0 -12 150 9.2 - - - -
100 13.5 5.6 9.0 2.4 1.5 50 26.5 - - - -
ORANGUN, 8 150 7.2 6.9 - 1.0 -JIRSA & 100 7.8 7.0 8.0 1.1 1.0 BREEN 50 9.8 10.0 - 1.0 -
12 150 6,1 - - - -100 7.0 5.6 9,0 1.3 0.8
50 9.9 - - - -KEMP & 8 ALL EMBEDMENTS WILHEIM 150 8.3 6.9 - 1,2 -
100 8.3 7.0 8,0 1.2 1,0 50 8,3 10.0 - 0.8 -
12 ALL EMBEDMENTS 100 6.6 5.6 9.0 1.2 0,7
FUNDAMENTAL· FORMULAE
LUTZ 8 ALL EMBEDMENTS 150 3,8 6.9 - 0,6 -100 3.8 7,0 8.0 0.5 0.5 ·50 3.8 10,0 - 0,4 - ~
lJ1
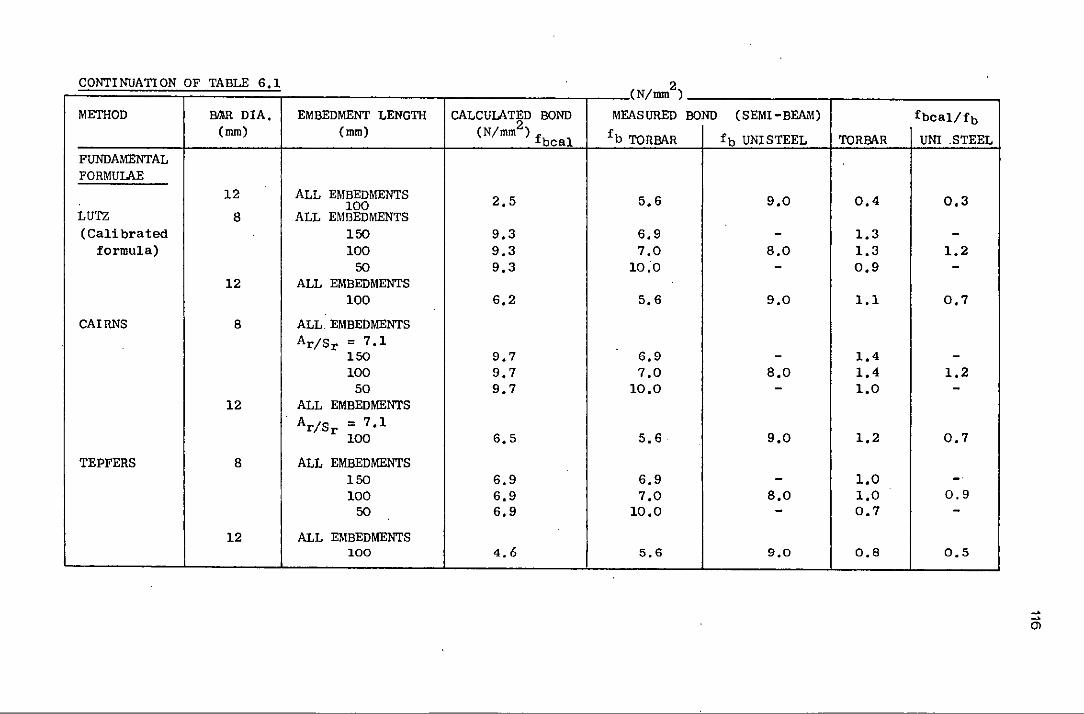
CONTINUATION OF TABLE 6.1 2 (N/mm )
METHOD aAA DIA. EMBEDMENT LENGTH CALCUIATED BOND MEASURED BOND (SEMI-BEAM) fbeal/fb (mm) (mm) (N/mm2) f fb TORBAR fb UNISTEEL TORBAR UN! .STEEL beal
FUNDAMENTAL FORMULAE
12 ALL EMBEDMENTS 2.5 5.6 9.0 0.4 0,3 100 LUTZ 8 ALL EM13EDMENTS (Calibrated 150 9,3 6,9 - 1.3 -
formula) 100 9.3 7,0 8,0 1,3 1.2 50 9,3 10.0 - 0,9 -
12 ALL EMBEDMENTS 100 6.2 5,6 9.0 1.1 0,7
CAIRNS 8 ALL. EMBEDMENTS Ar/S r = 7,1
150 9,7 6,9 - 1,4 -100 9,7 7.0 8,0 1.4 1.2
50 9,7 10.0 - 1,0 -12 ALL EMBEDMENTS
Ar/S ,,7,1 r 100 6,5 5.6 9,0 1,2 0.7
TEPFERS 8 ALL EMBEDMENTS 150 6.9 6,9 - 1.0 -100 6,9 7,0 8,0 1,0 0.9
50 6.9 10.0 - 0.7 -12 ALL EMBEDMENTS
100 4.6 5.6 9.0 0.8 0.5 -- ------_. -
~
en
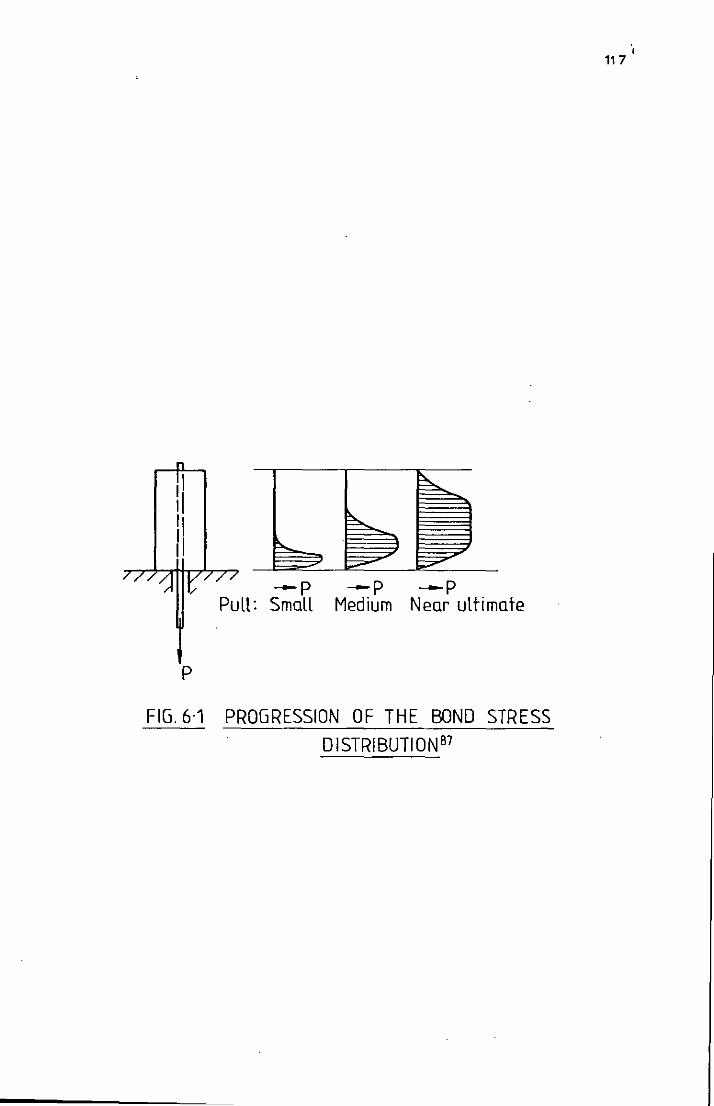
~
~ ~
;?'" ~
--P --P --P Pull: Small Medium Near ultimate
P
FIG.6·1 PROGRESSION OF THE BOND STRESS DISTRIBUTIONB7
., 117
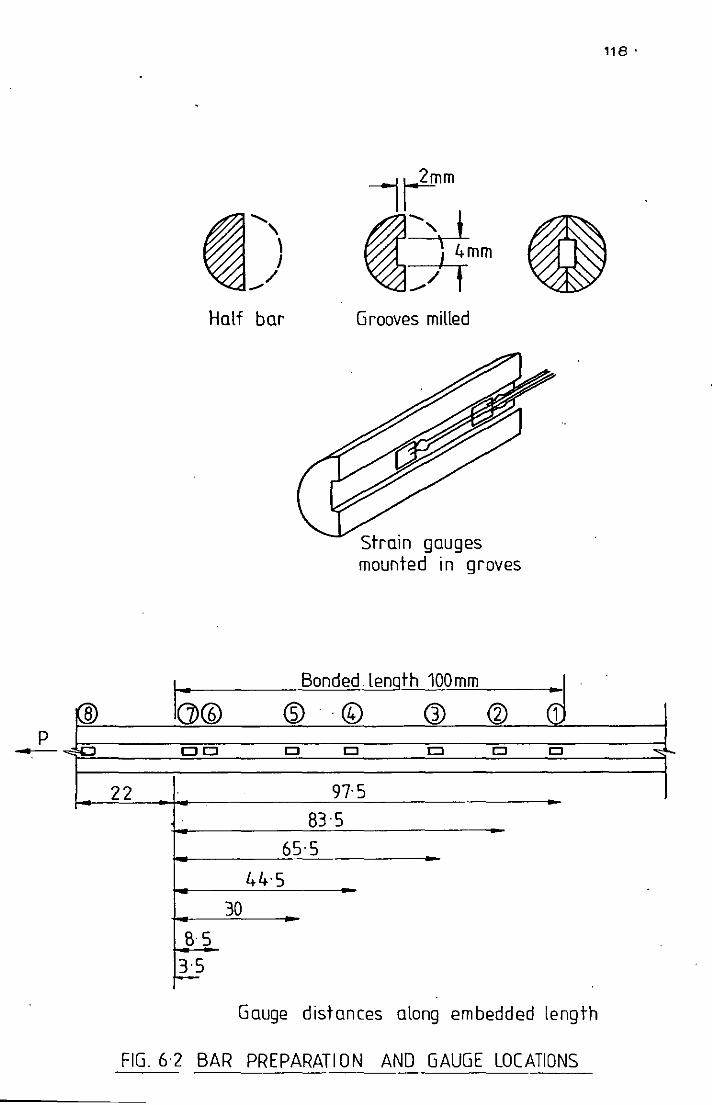
@
... P ~ ""
22
~) Half bar Grooves milled
strain gauges mounted in groves
16>@ Bonded. length 100mm
@ .(0 Q) <V Cl Cl Cl Cl Cl Cl
97-5
83·5
65·5
44'5
30
8·5 3·5 ~
-et Cl
Gauge distances along embedded length
FIG. 6·2 BAR PREPARATION AND GAUGE LOCATIONS
118 .
'"
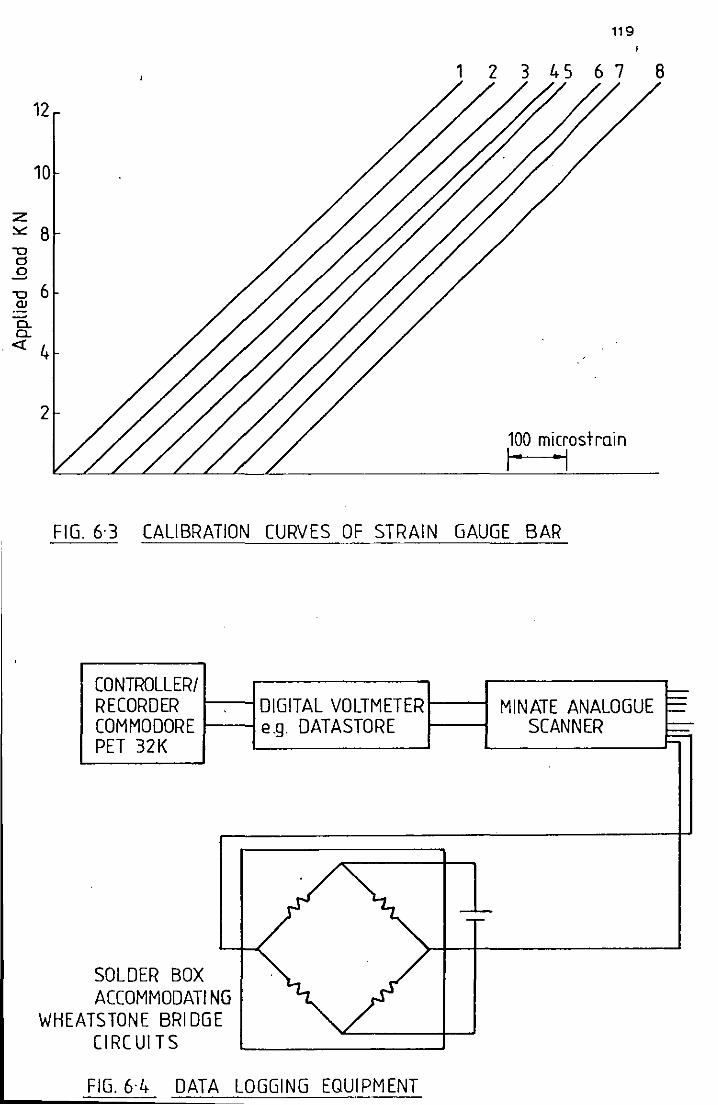
12
10
:z :-c 8 -0 Cl
.El -0 6 QJ ~
Cl.. Cl..
« 4
2
119
1 2 3 45 6 7 8
100 microstrain
I" "I
FIG. 6·3 CALIBRATION CURVES OF STRAIN GAUGE BAR
CONTROLLER! RECORDER I---lDIGITAL VOLTMETERt-----I MINATE ANALOGUE COMMODORE e.g. DATASTORE SCANNER PET 32K
SOLDER BOX ACCOMMODATI NG
WHEATSTONE BRI DGE CIRC UI TS
FIG. 6·4 DATA LOGGING EQUIPMENT
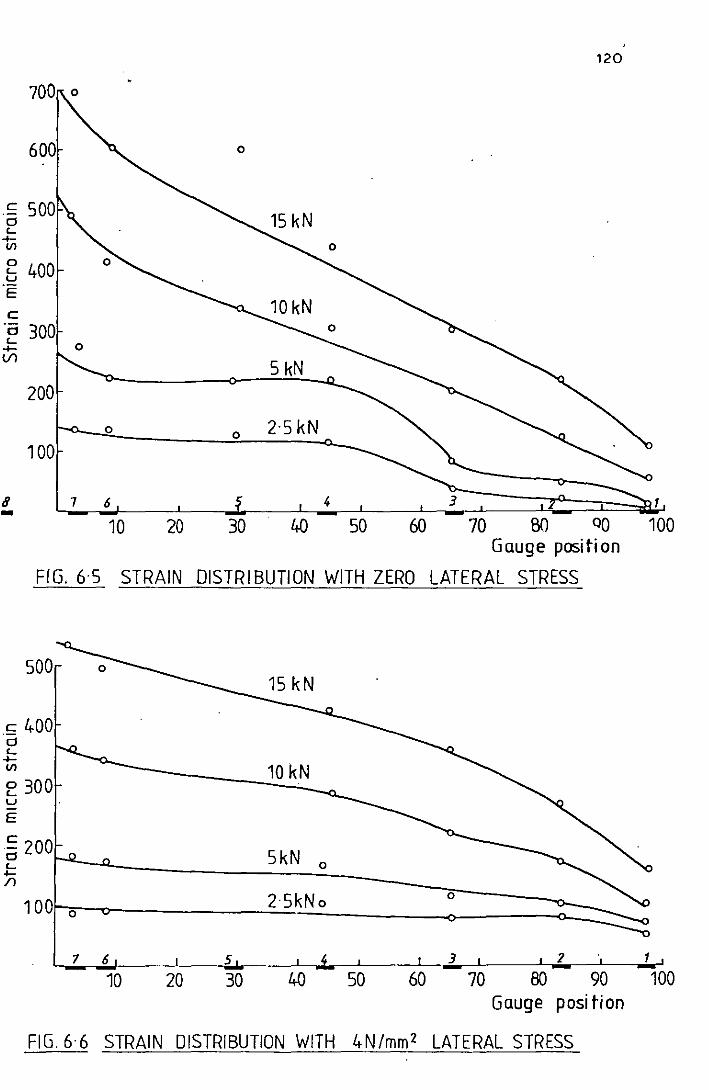
120
600 o
e 400 u E
c ·0 300 J:: 0 Vl
5 kN 200
o o 2·5 kN 100
B 1 6 - 10 20 ~ ~ ~ w m 00 ~ Gauge position
FIG. 6·5 STRAIN DISTRI BUTION WITH ZERO LATERAL STRESS ~~~~~~~~~~~~-=~~=-~~~
500
.!; 400 o '..... VI
e 300 u
E
10 kN
~ 200
~ [~~------------~5~k~N~O--______ -cor-______ ~:: 100 2·5kNo
1
100
IoO~~----------~~~~--------~or------~~~_ ~
7 6 5 3 2 1
10 20 30 ~ 50 60 70 80 90 100 Gauge position
FIG.6·6 STRAIN DISTRIBUTION WITH 4N/mm2 LATERAL STRESS
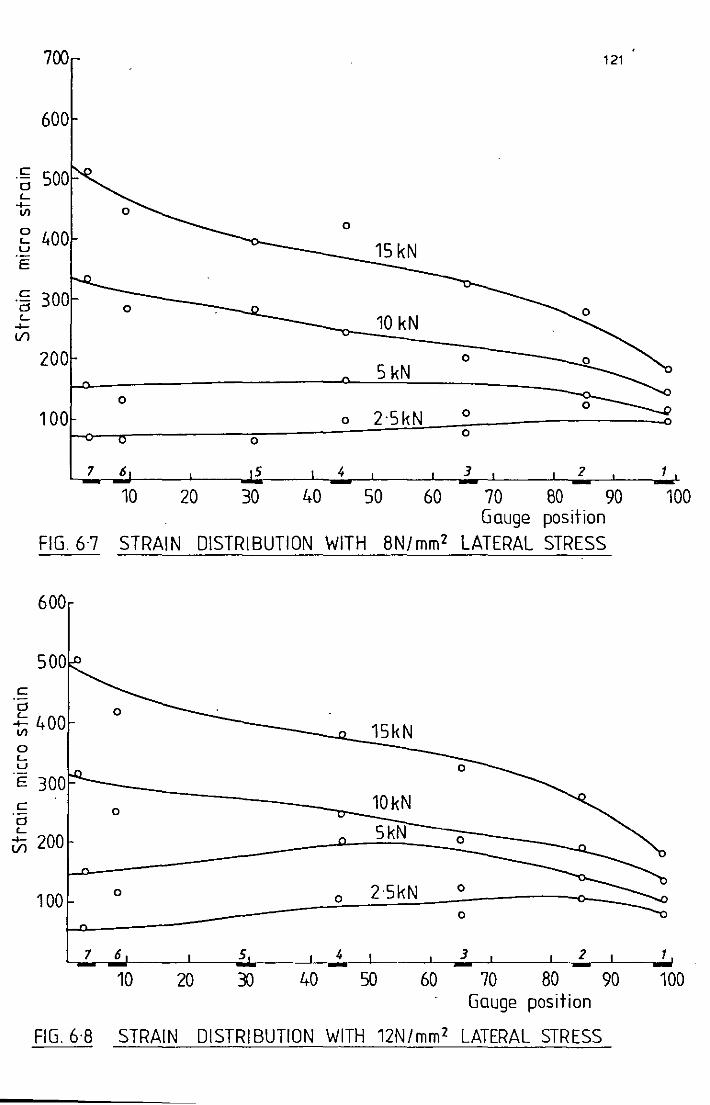
700
600
.~ 500 d L 4-III
2 400 u
E
.!:: 300 d L
4-V1
200
100
7
FIG. 6·7
c d
600
~ 400 III
o L U
E 300
0
0
6
10
STRAIN
o
0
15 kN
10 kN
5 kN
0 2·5kN 0
5 4
20 30 40 50 60
DISTRIBUTION WITH 8N/mm 2
15kN
c 0 10kN
121
0
0 0
0
3 Z
70 80 90 Gouge position
LATERAL STRESS
d
~ 200~ ____ --------------~--S~k~N~--~
100~~O~ ____ --------~o--~2.~Sk~N~-:o--------~--=
1
100
7 6 .L 1 ____ ~~ __ 3~----~_~~~1--~ ___ ',
10 20 40 50 60 70 80 90 100 Gouge position
FIG. 6·8 STRAIN DISTRIBUTION WITH 12N/mm2 LATERAL STRESS
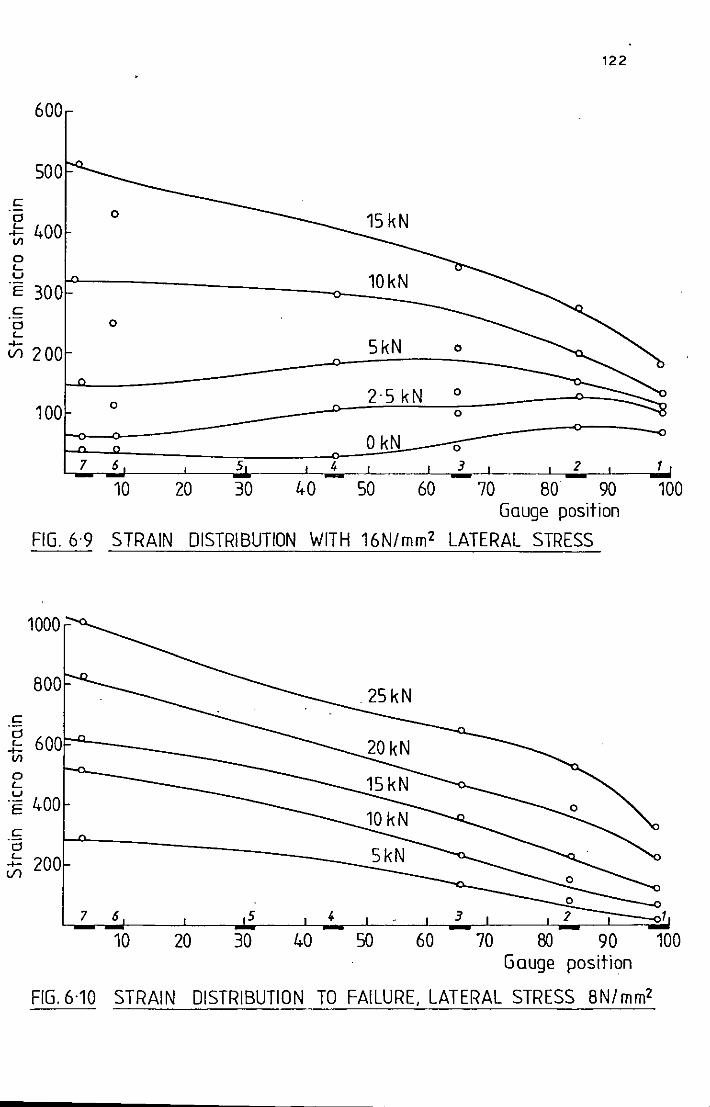
122
600
500
c:: 0 0
J= 400 III
0 L u 10kN ·E 300 c:: 0 0 L
->-V1 200 5kN
0 2·5 kN
100
o kN o 7 6 5 4 3 z 1
10 20 30 40 50 60 70 80 90 100 Gauge position
FIG. 6·9 STRAIN DISTRIBUTION WITH 16N/mm2 LATERAL STRESS
1000
800
c::
~ 600r--___ ~ o L u ·E 400 c::
~ 200~------------------~~
7 6 5
10 20 30 40 50
--3 z 1
60 70 80 90 100 Gauge position
FIG.6·10 STRAIN DISTRIBUTION TO FAILURE, LATERAL STRESS 8N/mm2
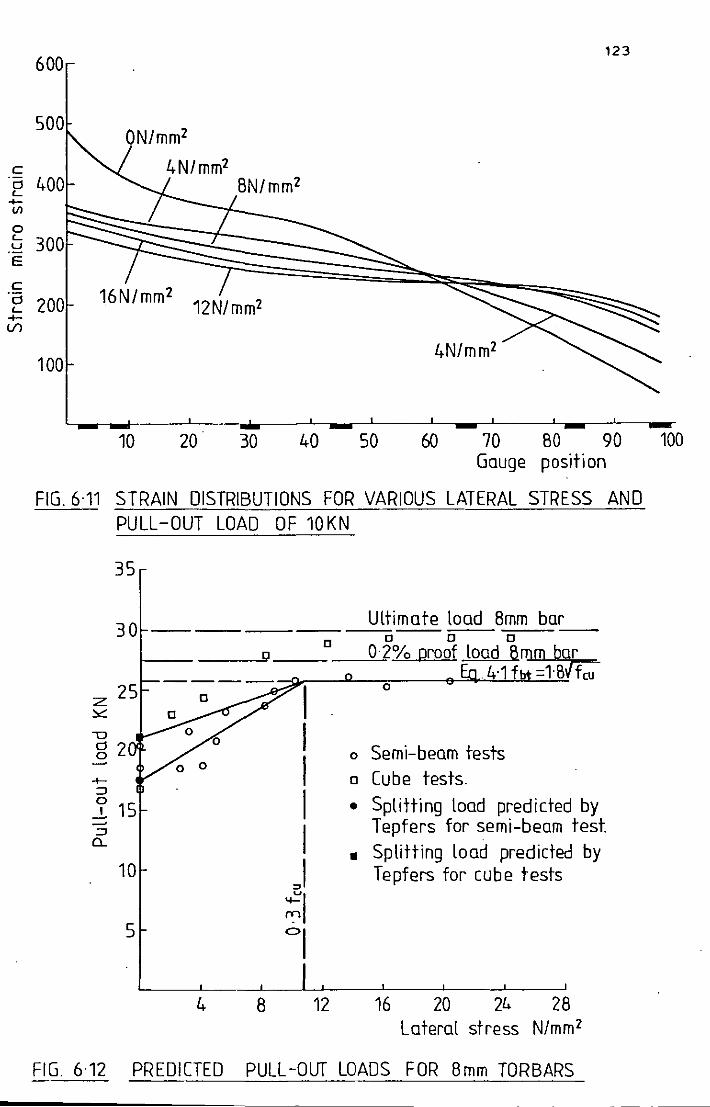
c d L ..... III
0 L u E
c ·0 L .....
If)
600
500
4N/mm2 8N/mm2
300
200 16N/mm2 12N/mm2
100
10 20· 30 40 so
123
4N/mm2
70 80 90 Gauge position
FIG. 6·11 STRAIN DISTRIBUTIONS FOR VARIOUS LATERAL STRESS AND PULL-OUT LOAD OF 10KN
35
30 Ultimate load 8mm bar
c c 0 c 0·2% proof load 8mm bar !;I
.4·1 f ="B~fcu z 25 I
0
~
u 0 I g 2
I o Semi-beam tests
..... o Cube tests . ::J
I l' 15 • Splitting load predicted by ~
I Tepfers for semi-beam test. ::J 0..
• Splitting load predicted by 10 J Tepfers for cube tests
5 ;1 °1
4 8 12 16 20 24 28 Lateral stress N/mm 2
FIG. 6·12 PREDICTED PULL -OUT LOADS FOR 8mm TORBARS
100
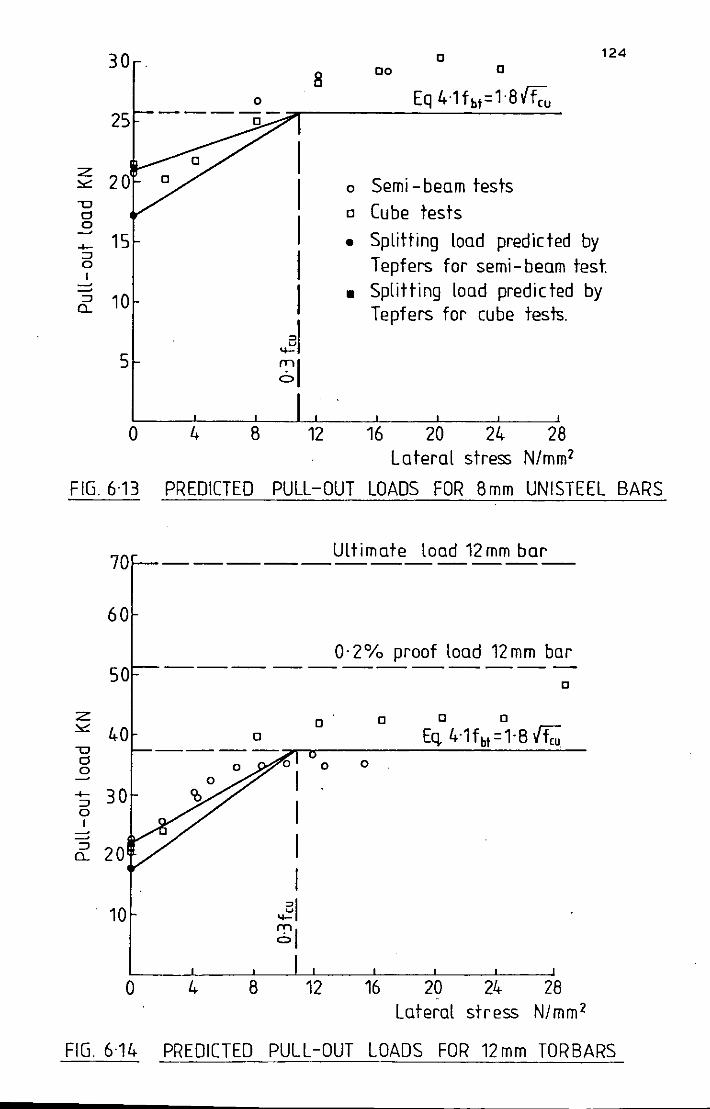
30
25
z ~
'0 CJ 0 ~
15 -I-:::J 0 I ~
~
:::J 10 a..
5
0
FIG. 6·13
70
60
50
z ~ 40 '0 o o
'!:J 30 o I
er 20
10
o
0
4 B
PREDICTED
o
4 8
0 124
8 DO 0
Eq 4'1fbt=l8Ucu
I I 0 Semi - beam tests
Cube tests I
0
Splitting load predicted by • I T epfers for semi - beam test.
I Splitting load predicted by • Tepfers for cube tests.
~I 61
12 16 20 24 28 Lateral stress N/mm2
PULL-OUT LOADS FOR 8mm UNISTEEL BARS
Ultimate load 12mm bar
o· 2% proof load 12 mm bar
o
o 0 o 0
Eq, 4'1fbt =lB Vtcu o 0
12 16 20 24 28 Lateral stress N/mm2
FIG. 6·14 PREDICTED PULL-OUT LOADS FOR 12 mm TORBARS
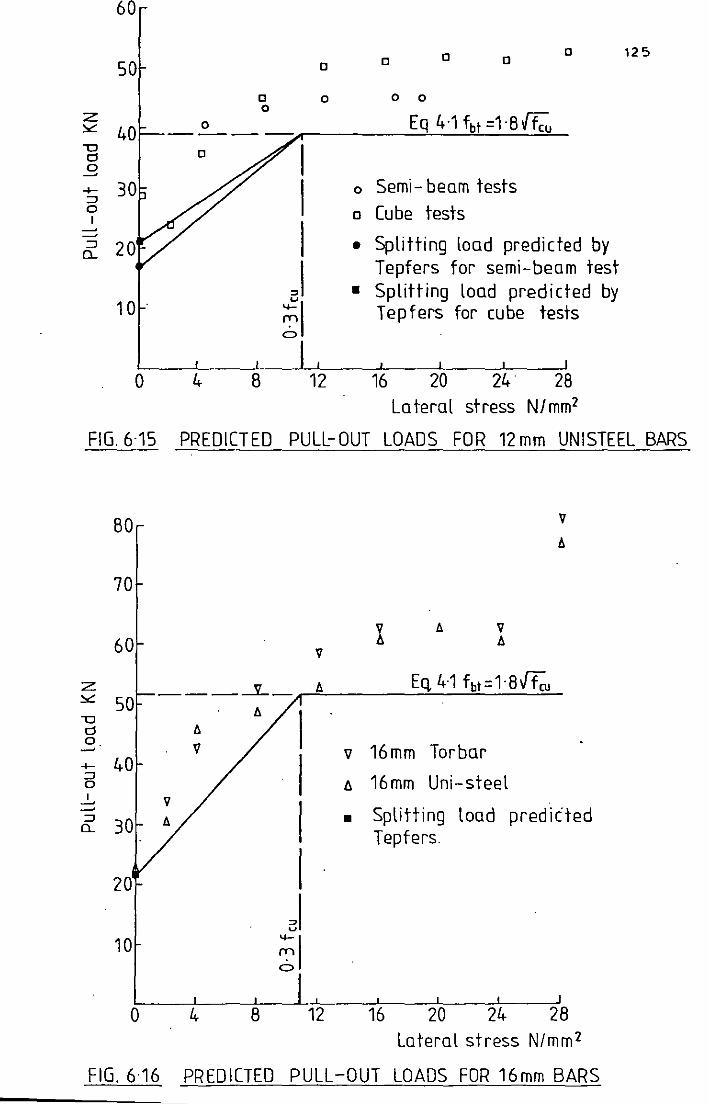
60
c c 125
50 c c c
c 0 0 0 0
:z: 0 Eq 4·1 fbt =1·8 Hcu ~ 40 ----
"0 C I Cl E .... I o Semi- beam tests :::J 0 c Cube tests I
I :::J • Splitting load predicted by Cl..
J Tepfers for semi-beam test • Splitting load predicted by
10 . ~I Tepfers for cube tests
0 4 8 12 16 20 24 28 La teral stress N/mm2
FIG. 6·15 PREDICTED PULL-OUT LOADS FOR 12 mm UNISTEEL BARS

SECTION 2
TIlE DEEP BEAM STUDY
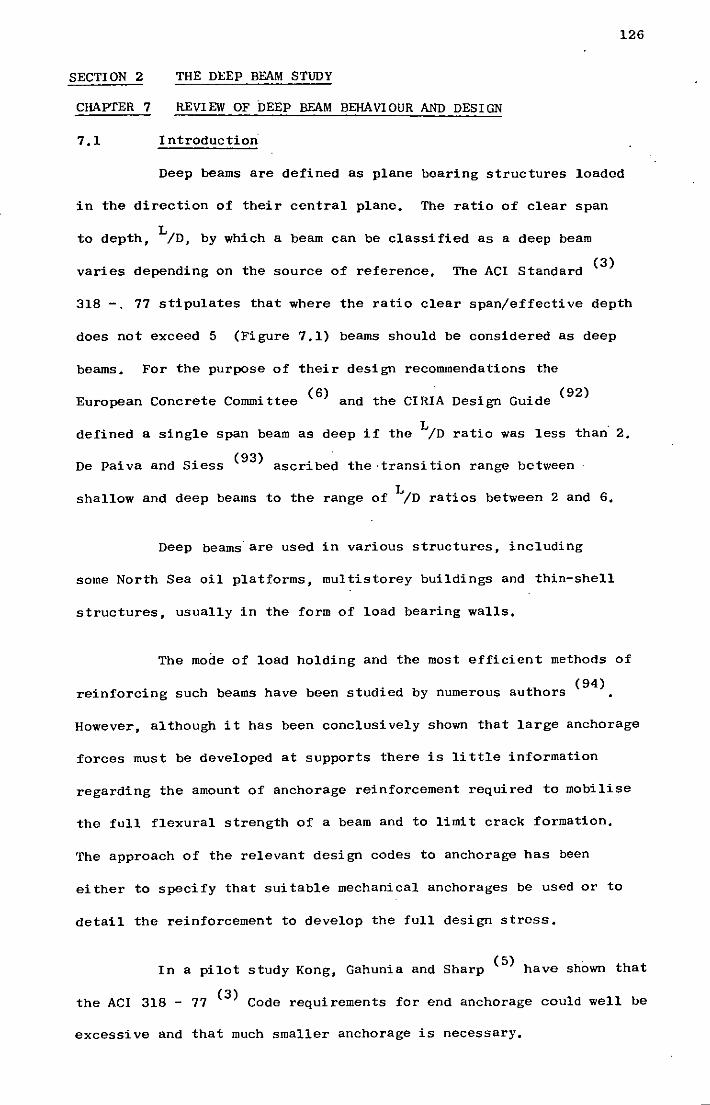
126
SECTION 2 THE DEEP BEAM STUDY
CHAPTER 7 REVIEW OF DEEP BEAM BEHAVIOUR AND DESIGN
7.1 Introduction
Deep beams are defined as plane bearing structures loaded
in the direction of their central plane. The ratio of clear span
to depth, L/D, by which a beam can be classified as a deep beam
varies depending on the source of reference. The ACI Standard (3)
318 -. 77 stipulates that where the ratio clear span/effective depth
does not exceed 5 (Figure 7.1) beams should be considered as deep
beams. For the purpose of their design recommendations the
(6) . (92) European Concrete Committee and the CIRIA Design GU1de
defined a single span beam as deep if the L/D ratio was less than' 2.
De Paiva and Siess (93) ascribed the ,transition range between
shallow and deep beams to the range of L/D ratios between 2 and 6.
Deep beams· are used in various structures, including
some North Sea oil platforms, multistorey buildings and thin-shell
structures, usually in the form of load bearing walls.
The mode of load holding and the most efficient methods of
reinforcing such beams have been studied by numerous authors (94).
However, although it has been conclusively shown that large anchorage
forces must be developed at supports there is little information
regarding the amount of anchorage reinforcement required to mobilise
the full flexural strength of a beam and to limit crack formation.
The approach of the relevant design codes to anchorage has been
either to specify that suitable mechanical anchorages be used or to
detail the reinforcement to develop the full design stress.
(5) , In a pilot study Kong, Gahunia and Sharp have shown that
the ACI 318 - 77 (3) Code requirements for end anchorage could well be
excessive and that much smaller anchorage is necessary_
127
(95) Swamy, Andriopoulos and Adepegba however stress the
need for adequate bond length of tension steel from tests on beams
of short shear span, They concluded that the secondary failures at
the anchorage would suggest that anchorage lengths in excess of that
recommended in building codes are desirable,
This experimental. study was designed to investigate more
fully the amount of anchorage required and in the light of the bond
tests described previously the effects upon the anchorage of varying
bearing pressures at the supports,
7,2 Deep Beam Analysis
For the design of shallow or normal reinforced concrete
beams of the proportions more commonly used in construction, it is
assumed that plane sections remain plane after loading, This
assumption is not strictly true but the errors resulting from it do
not become significant until the depth of the beam becomes equal to,
or more than, about half the span, The analysis of forces in deep
beams is more complicated and can be examined at two levels,
elastic and ultimate load,
7,2,1 Elastic Analysis
The original predictions of the internal forces in deep
beams were based on service state criteria, Elastic theory and
experimental techniques were used to design uncracked reinforced
concrete deep beams in which the assumption of elastic behaviour could
be reasonably applied, The methods include numerical approximations of
Fourier series solutions to elastic plate equations (96), finite
~lements, (97,98) , finite differences, (99,100,101) and experimental
photoelastici ty (102),
128
These methods based on the assumption of an elastic
homogeneous material have been used by several authors for
. (99 101 103) . recommendat10ns " for the design and analys1s of reinforced
concrete members, The results are useful in that they highlight the
differences between shallow and deep beams and are adequate for the
design of service load conditions, at which level reinforced concrete
can be considered sensibly elastic.
Elastic analysis has shown that the Navier-Bernoulli hy-
pothesis on the planeness of cross sections is invalid for beams
with LID ~ 1.5 - 2.0. The bending stress at mid-section of a deep
beam haS a lower or multiple neutral aX'is, wi th increased areas of
beam subject to compressive stresses compared to normal shallow
beams.
Vertical and shear strains in deep beams are large compared
with the bending strains and high biaxial stress conditions exist
in .the areas over supports. Geer (104) in a finite difference
approach to deep beams found for beams with LID = 2 that the greatest
tensile stress occurred not at the midspan but near the face of the
support, and that the maximum stresses were a function of the load
and not its location,
7.2.2 Ultimate Load
Theoretical and experimental investigations have shown
that before cracking the stresses in deep beams conform to the
predictions of elastic analysis. At the onset of cracking the
neutral axis changes position rapidly and the extending flexural
cracks decrease the area of the compressive zone such that the
ultimate failure load can no longer be predicted by the elastic
approach.
Experimental studies of deep beams loaded to failure have
demonstrated the different load carrying mechanism that occurs.
129
Despite differences in web reinforcement and in LID ratios,
the crack patterns for deep beams are generally similar, variance
only occurring at ultimate load. On loading, the first cracks are
flexural and form at the soffit within the central third of the
beam. These spread upwards and incline towards the centre of the
top surface of the beam. At higher loads, further cracks form near
the supports and propagate towards the loading points. These cracks
which initiate at or near the beam soffit are quite harmless except
in beams wi th hi gh LID ratios.
The most important type of crack usually occurs at about
60 - 80% of the ultimate load. Diagonal cracks are formed running
from load point to the inside face of the reaction block. This is
usually accompanied by a loud crack due to their high speed of
propagation. On further increase in load, failure of the beam is
dependent on the amount and disposition of the reinforcement. Four
main categories of failure have been identified:
1. flexural.
2. shear.
3. bearing.
4. ancho rage.
7.3 Flexural Failure
De paiva and Seiss (93) describe flexural failure as the
crushing of the compressive concrete or rupture of the tensile tie.
The crack pattern of a typical flexural failure is shown in Figure 7.2.
130
The progression of the crack pattern is the same as outlined
previously. The flexural cracks in this case however become very
large in width and closely spaced, These cracks can cause general
spalling of the concrete at the level of the main tension reinforce-
ment, gi ving rise to a si tuation of uni form tension, The tensile
reinforcement then acts as a "tie rod" in a tied arch wi th the
compression being taken by the concrete, Even where flexural crack-
. (93) ing is not so widespread de Paiva and Seiss concluded that after
the formation of an inclined crack, the principle tensile stress
necessary for beam action is eliminated and the redistribution of
internal stresses results in the formation of a tied arch, The
reinforcement acts as a tension tie and the part of the concrete
beam outside the inclined crack acts as an arch rib in compression.
(95) Swamy et al compared the results of failure ·loadsfor un bonded
beams which acted like true tied arches with those for normally
bonded beams, The ratio of W, ultimate failur·e load unbonded, to
the bonded failure load was related to the shear span/depth ratio,
X/D, and reached a maximum for X/D ~ 2,5 and dropped off rapidly on
either side. The nearest to arch behaviour, they argued, occurs "for
X/D ~ 2,5, although this value varied with percentage ;einforcement,
cross-section and type of loading. (95) .
Swamy et al . suggested that th1s
ratio represents the transition stage between strut-like failures in
beams of very short shear spans and the diagonal tension failure in
longer shear spans. The results were obtained however from beams
with larger L/D ratios (7 - 12) than would normally be considered as
deep beams,
7,3,1 Design of Flexural Reinforcement
The design of reinforced concrete deep beams has not yet
(2) been covered by the CP 110 : 1972 ,
At present provision is made for the ultimate load design of this
type of beam by the Comite European du Beton International
recommendations (6) , ACI 318 - 77 Building Code (3) and the· CIRIA
(92) Design Guide
7.3.1.1 The :OlB-FIP Reeommendations (6)
131
The main consideration of the CEB - FIP Recommendations (6)
is the flexural design of deep beams. The area of the main
longitudinal reinforcement is calculated from the largest bending
moment in the span, using the following values for the lever arm Z:
Z
Z
=
=
0.2 (L + 2D)
0.6 L
for
for LID < 1
The main ·longitudinal reinforcement should extend without
curtailment from one support to another and be securely anchored
at the ends, The required area of reinforcement is to be distributed
over the bottom part of the beam to a depth of 0.25D - O,058L,
7,3,1,2 ACI Building Code (3)
In contrast to the CEB - FIP Recommendations (6) the ACI
318 - 77 (3) recommendations, which were based mainly on tests
carried out by Crist(l05) and de Pai va and Seiss (93) are con-
cerned with shear design and do not give specific guidance on how
to calculate flexural steel areas to resist the specified bending
moments.
132
7.3.1.3 CIRIA Design Guide (92)
The area of reinforcement provided to resist positive
and negative moments should satisfy the. following condition:
As> My 7.1 0.87 fy Z
The lever arm Z may be assumed to be:
Z 0.2L + 0.4 ha for LID < 2
where ha is the effective height of the beam,.
and ha c D when L> D, and ha c L when D > L.
The reinforcement is not to be curtailed in the span and may be
distributed over a depth of 0.2 ha.
7.3.1.4 Kongs (5) Method
For this experimental investigation the design method for
. (5) . ultimate flexural loads used by Kong has been employed. In
calculating the ultimate load the contribution of the web reinforce-
ment is taken into account. Referring to Figure 7.3 the ultimate
moment of resistance is calculated by taking moments of the tension
forces Asfu and
pression block.
M u
c As f (d' ·u
f about the centroid of the concrete corny
7.2
and the depth of the concrete compressive zone is obtained from
equating forces within the section •
.. 0.85 f bx
c + f c Y
f Y
7.3
133
7.4 Shear Failure
(lOG) Varghese and Krishnamoorthy in a review of results
from previous investigators, concluded that deep beams with 'normal
reinforcement' tend to fail by shear and this mode of failure was
characterised by inclined cracks from the support to loading point.
Intop-loaded beams the formation of these inclined cracks is
initiated at about O.G to 0.9 of the ultimate load. Leonhardt and
(107) Walther have suggested that the shear capacity of deep beams
cannot be improved by the addition of web reinforcement although
up to 30% increase in shear strength has been demonstrated by Kong
. (108) and Rob1ns and Figure 7.4 identifies three modes of shear
failure shown in order of increasing web effectiveness.
7.4.1). The CEB - FIP Recommendations (G)
The CEB - FIP guide (G) which is based mainly on the work
of Leonhardt and Walther (107) states that the design shear force
be limi ted to
b
D
L
f c
=
-.
, O.lb D f / Y c m or O.lb L fc / Y m (whichever
is less)
is the beam width (mm);
is the beam depth (mm);
the span (mm);
7.4
·"the characteristic cylinder strength of the concrete
2 (N/mm );
the partial safety factor for the materials.
The Recommendations state that it is generally sufficient
to provide a light mesh of orthogonal reinforcement.
134
The web steel ratio, expressed as the area of bars divided by the
cross-sectional area of concrete should be about 0.25 percent in
each direction for mild steel bars and 0.2 percent for high bond-
bars.
7.4.12 ACI Building Code (3)
The ACI Building Code (3) considers the critical section
located midway between the load and face of_ the support for a
concentrated load and the section 0.15L from the support for a
uniformly distributed load. L is the clear span distance face to
face-of supports.
The nominal shear stress v u is calculated from the gi ven
design shear force V u
v u = 7.5
• j1l bd
where j1l is the capacity reduction factor and is taken at 0.85,
b is the width of the beam, d is the effective depth measured to
the centroid of the main longitudinal steel.
The dimensions band D of the beam must be large enough
for v not to exceed the following limits: u
;£ 8 r;-;-Irc -when LID < 2
v- "7- 2 ( 10 + LID) A when 2 -u
3
•
-:::: LID -::::
f is the concrete cylinder compressive strength. ;c
7.6
5 7.7
(psi) •
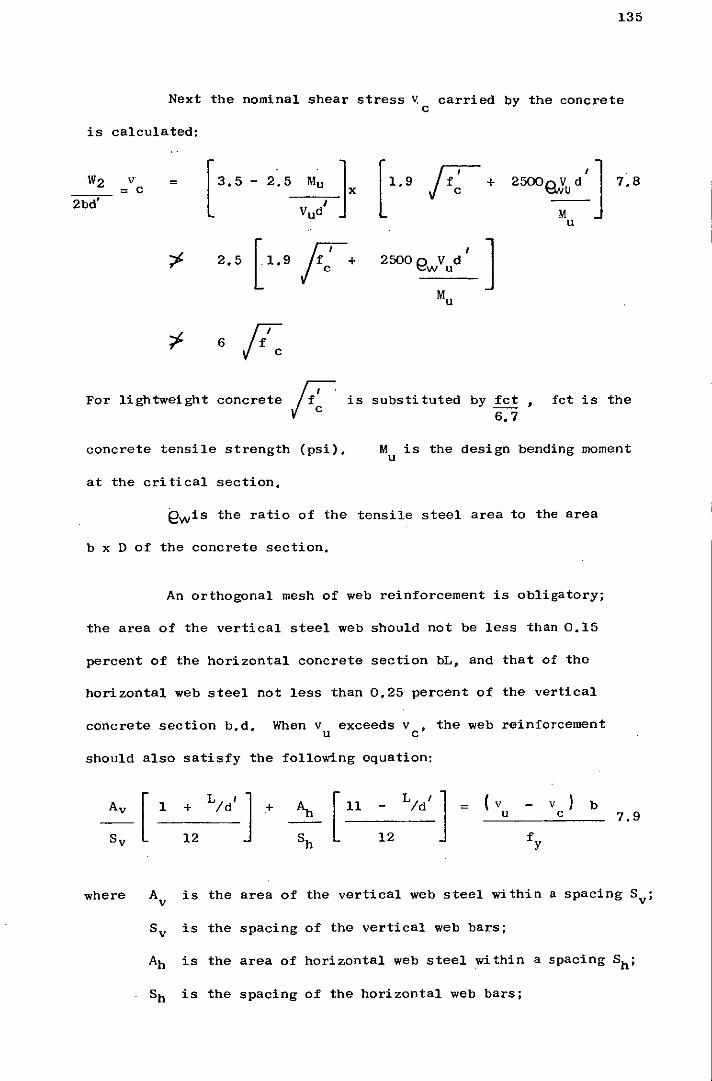
135
Next the nominal shear stress" carried by the concrete c
is calculated:
W2 v = [ 3,5 - 2",5 Mu ]x
[1.9 ;-;:-+ 2500~u/ ] 7,8 = c
2bd' I Vud
u
[1,9 F+ I ] 2,5 2500 9 Vd wu
Mu
u-For lightweight concrete I fc is substi tuted by fct , 6.7
fct is the
concrete tensile strength (psi). M is the design bending moment u
at the critical section,
ewis the ratio of the tensile steel area to the area
b x D of the concrete section.
An orthogonal mesh of web reinforcement is obligatory;
the area of the vertical steel web should not be less than 0.15
percent of the horizontal concrete section bL, and that of the
horizontal web steel not less than 0.25 percent of the vertical
concrete section b.d. When v exceeds v , the web reinforcement u c
should also satisfy the following equation:
+ =
12 12
( v u
v c
b 7.9
where A v is the area of the vertical web steel within a spacing Sv;
Sv is the spacing of the vertical web bars;
Ah is the area of horizontal web steel wi thin a spacing Sh;
Sh is the spacing of the horizontal web bars;
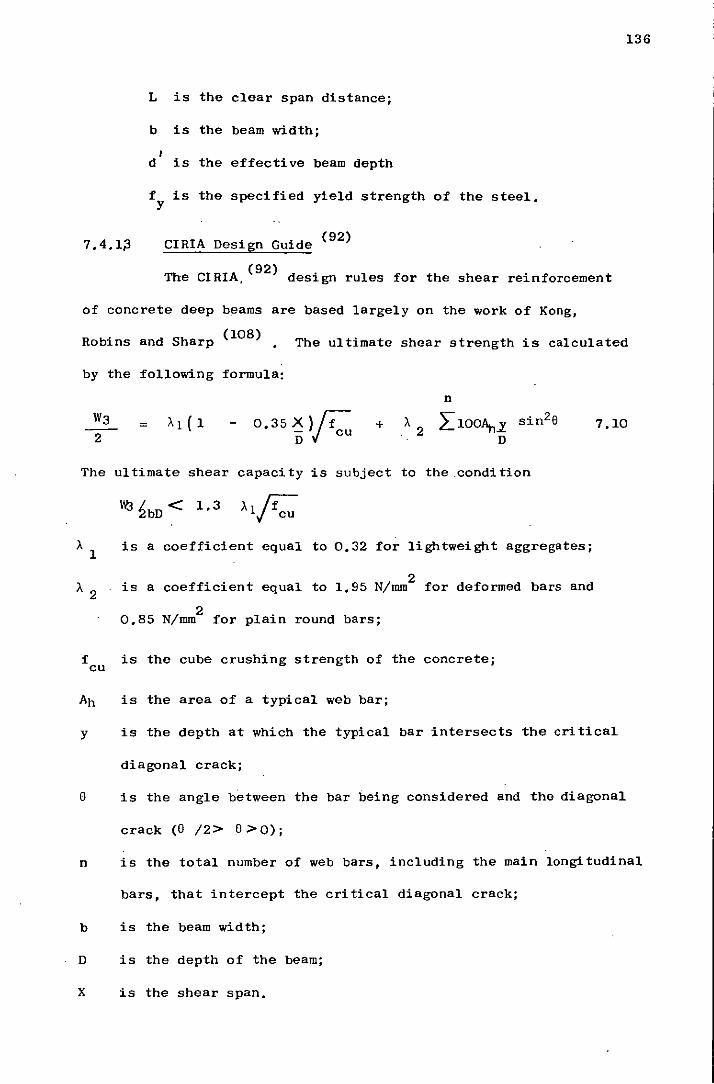
136
L is the clear span distance;
b is the beam width; ,
d is the effective beam depth
f is the specified yield strength of the steel. y
7.4.1p CIRIA Design Guide (92)
(92) , The CIRIA, des1gn rules for the shear reinforcement
of concrete deep beams are based largely on the work of Kong,
Robins and Sharp (108) The ultimate shear strength is calculated
by the following formula:
n
= 0.35 X ljf: - cu D
+ A 2 7.10
The ultimate shear capacity is subject to the .condition
113 ~bD < 1.3
Al is a coefficient equal to 0.32 for lightweight aggregates;
A 2 2
is a coefficient equal to 1.95 N/mm for deformed bars and
0.85 N/mm2 for plain round bars;
f is the cube crushing strength of the concrete; cu
Ah is the area of a typical web bar;
Y is the depth at which the typical bar intersects the critical
diagonal crack;
8 is the angle between the bar being considered and the diagonal
crack (8 /2> 8> 0);
n is the total number of web bars, including the main longitudinal
bars, that intercept the critical diagonal crack;
b is the beam width;
D is the depth of the beam;
X is the shear span.
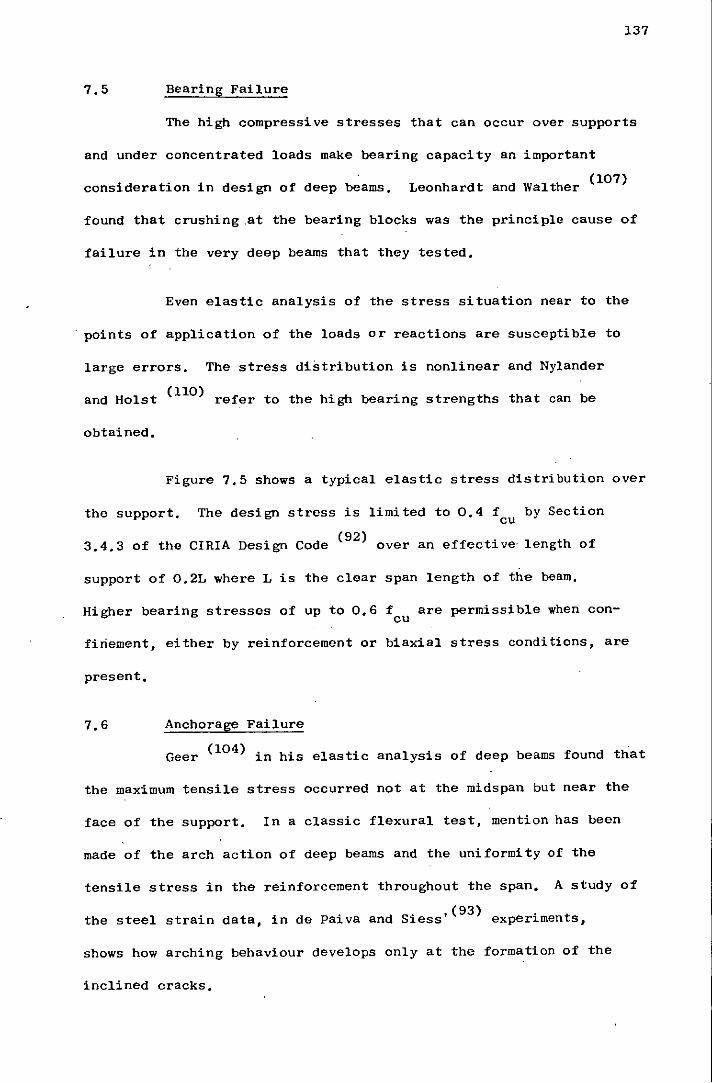
137
7.5 Bearing Failure
The high compressive stresses that can occur over supports
and under concentrated loads make bearing capacity an important
consideration in design of deep beams. Leonhardt and Walther (107)
found that crushing .at the bearing blocks was the principle cause of
failure in the very deep beams that they tested.
Even elastic analysis of the stress situation near to the
points of application of the loads or reactions are susceptible to
large errors. The stress distribution is nonlinear and Nylander
(110) . and HoIst refer to the h~gh bearing strengths that can be
obtained.
Figure 7.5 shows a typical elastic stress distribution over
the support. The design stress is limited to 0.4 f by Section cu (92) .
3.4.3 of the CIRIA Design Code over an effect~ve· length of
support of 0.2L where L is the clear span length of the beam.
Higher bearing stresses of up to 0.6 f are permissible when concu
firiement, either by reinforcement or biaxial stress conditions, are
present.
7.6 Anchorage Failure
Geer (104) in his elastic analysis of deep beams found that
the maximum tensile stress occurred not at the midspan but near the
face of the support. In a classic flexural test, mention has been
made of the arch action of deep beams and the uniformity of the
tensile stress in the reinforcement throughout the span. A study of
the steel strain data, in de Paiva and Siess,(93) experiments,
shows how arching behaviour develops only at the formation of the
inclined cracks.
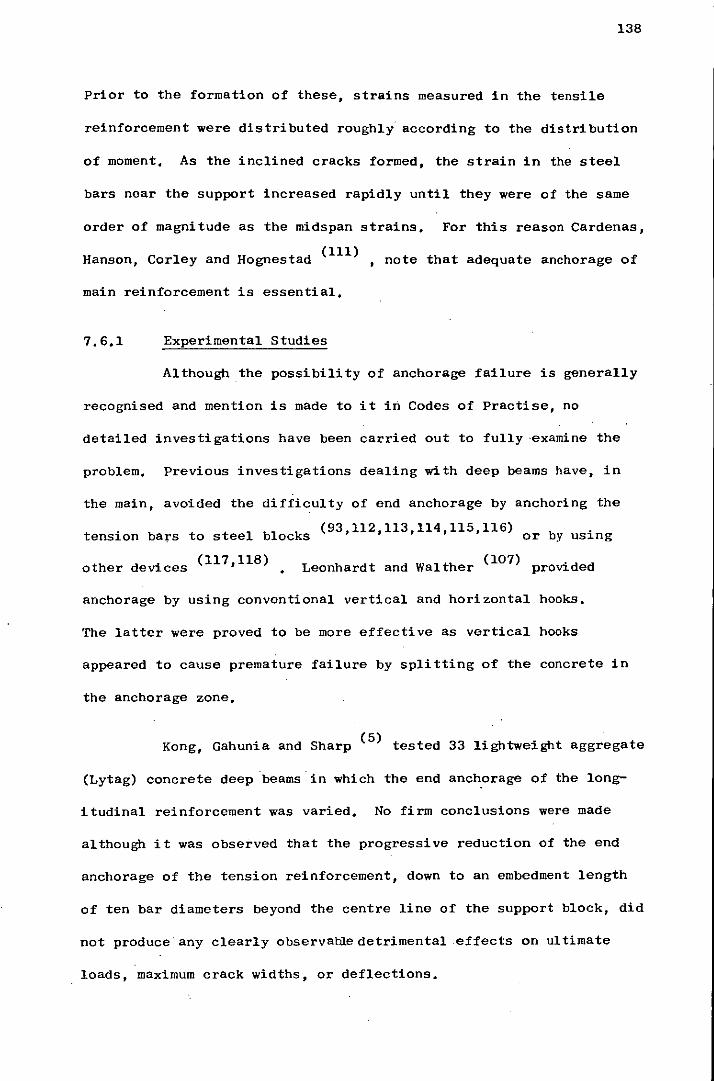
138
Prior to the formation of these, strains measured in the tensile
reinforcement were distributed roughly according to the distribution
of moment. As the inclined cracks formed, the strain in the steel
bars near the support increased rapidly until they were of the same
order of magnitude as the midspan strains. For this reason Cardenas,
(111) Hanson, Corley and Hognestad , note that adequate anchorage of
main reinforcement is essential.
7.6.1 Experimental Studies
Although the possibility of anchorage failure is generally
recognised and mention is made to it in Codes of Practise, no
detailed investigations have been carried out to fully -examine the
problem. Previous investigations dealing with deep beams have, in
the main, avoided the difficulty of end anchorage by anchoring the
. t bl k (93,112,113,114,115,116) b . tens10n bars to s eel OC 5 or y US1ng
. (117 118) other dev1ces t • Leonhardt and Walther (107) provided
anchorage by using conventional vertical and horizontal hooks.
The latter were proved to be more effective as vertical hooks
appeared to cause premature failure by splitting of the concrete in
the anchorage zone.
Kong, Gahunia and Sharp (5) tested 33 lightweight aggregate
(Lytag) concrete deep beams in which the end anchorage of the long-
itudinal reinforcement was varied. No firm conclusions were made
although it was observed that the progressive reduction of the end
anchorage of the tension reinforcement, down to an embedment length
of ten bar diameters beyond the centre line of the support block, did
not produce any clearly observa~edetrimental effects on ultimate
loads, maximum crack widths, or deflections.
139
7.7 Design of Anchorage Reinforcement
The following sections refer to the present design methods
for detailing of anchorages for reinforced concrete deep beams.
They deal with direct methods of anchorage such as blocks, bends and
welding. Indirect anchorage is also possible, for example in con-
tinuous structures where the reinforcement is carried over the
supports.
Deep beams can also form part of other structures and the
anchorage reinforcement then becomes an integral part of the whole
(Figure 7.6).
7.7.1 The CEB-FIP Recommendations (6)
The C.E.B. recommendation (6) for anchorage of principle
reinforcement required to resist the ultimate bending ~mentJ is
that at supports it should be anchored so as to develop O.B times the
maximum force,for which it has been calculated,at the face of the
support. The computed reinforcement should be uniformly distributed
over a depth equal to 0.25D - 0.05BL measured from the lower face
of the beam.
Attention is drawn' to the importance of providing small
diameter·bars to limit crack width and to improve anchorage. The
report discourages the use of vertical hooks for anchorage since in
(107) the experiments of Leonhardt and Walther , vertical hooks tended
to promote cracking in the anchorage zone.
7.7.2 ACI Building Code (3)
The ACI Standard 31B-77 (3) is explicit in its definition
that where the ratio-clearspan/effective depth does not exceed 5 the
beam should be considered as a deep beam.
140
Section 12.11.6 states that adequate end anchorage shall be provided
for tension reinforcement where reinforcement stress is not directly
proportional to moment as is the case in deep beams. Anchorage can
be provided for by any mechanical device capable of developing the
strength of reinforcement without damage to the concrete or
where development lengths are provided this must not be less than
300 mm (12 in). The development length is computed from a basic
development length depending on the size of bar given in Section
12.2.2. Modification factors are given by Sections 12.2.3 and
12.2.4 which make allowances for the type of concrete, position of
casting and the strength of the reinforcement.
7.7.3 CIRIA Design Guide (92)
Anchorage bond stresses and the effective dimensions of
hooks, (92) . bends and U-bars suggested by CIRIA for anchorlng re-
inforcement should comply with Clauses 3. 11. 6. 2 and 3. 11. 6. 7
and 8 of CP 110 (2) subject to the additional requirements for light-
weight concrete in Clause 3.12.11. The bars must be anchored to
develop' 80% of the maximum force beyond the face of the support and
20% of the maximum ultimate force at a point 0.2 x clear span
length from the face of the support, or at the far face of the
support whichever is less. U-bar anchorage,S are favoured at the
supports although their use is not mandatory.
7.7.4 CP 110 (2)
CP no part 1 : 1972 (2) makes no specific reference to
the design of deep beams as such, other than indirectly in Clause
3.3.6.2.
This clause dealing with curtailment of bars stipulates that
when the distance X from the face of the support to the nearest
I edge of the principal load is less than 2d, all the main
reinforcement should continue to the support and be provided with
an anchorage equivalent to 20 times the bar size or the effective
depth of the be~m whichever is the greater.
Various alternative anchorage lengths are proposed by
CPIlO (2) at a simple support. These are shown in Figure 7.7 and
are covered by Clause 3.11.7,1,
141
Stressed bars are dealt with by Clause 3.11.6.2 and must
be provided with an anchorage length given by
where f is the direct tensile stress in the bar; s
7.11
id the embedment length beyond the section considered;
d the bar diameter;
fb the ultimate anchorage bond stress;
Table 22 CPIIO (2) •
For deep beams the face of the support can be taken as the
critical section and sufficient anchorage is required to transmit
the full tensile strength of the reinforcement, The anchorage
length is calculated as
l'- d = 0.87 fy d . 7.12
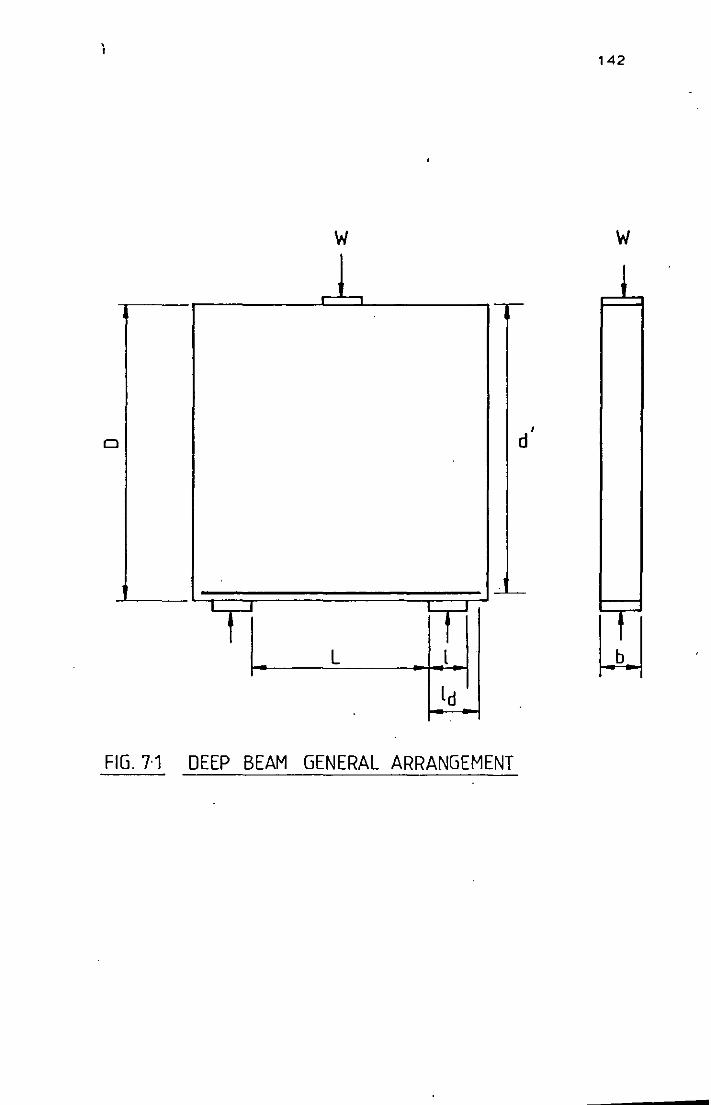
i 142
w w
I,C-
o d
-'-'-, t L l
ld
FIG. 7-1 DEEP BEAM GENERAL ARRANGEMENT
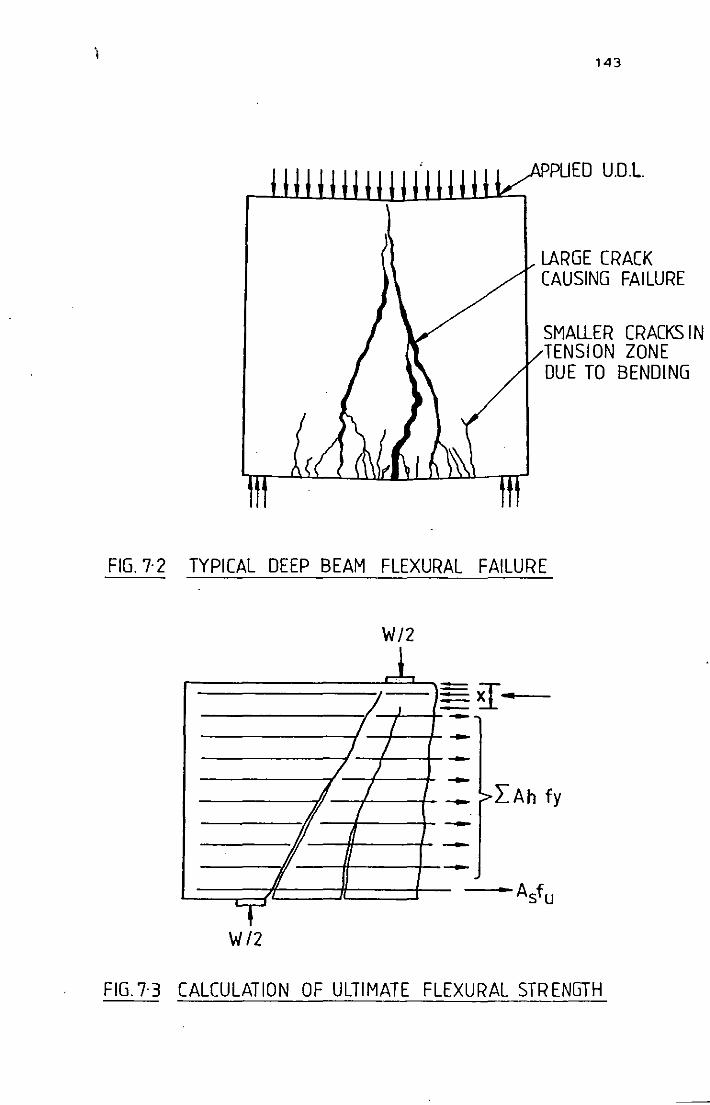
i 143
PPUED U.D.L.
LARGE CRACK CAUSING FAILURE
SMALLER CRACKS IN TENSION ZONE DUE TO BENDlNG
FIG. 7-2 TYPICAL DEEP BEAM FLEXURAL FAILURE
W/2
.1 I)
I / / /
/ ) ! I
/I / /. 11
I
~-.. --------__ LAh fy
------T
W/2
FIG.7·3 CALCULATION OF ULTIMATE FLEXURAL STRENGTH
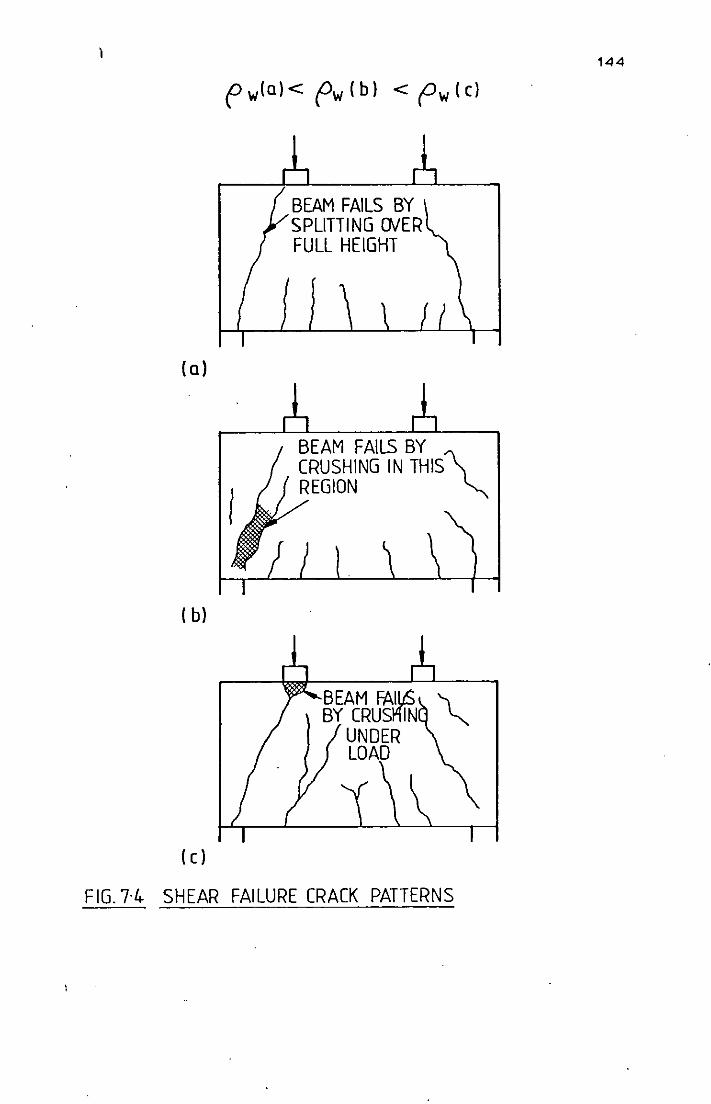
( a)
( b)
( C )
pw(a)< pw(b) < pw(c)
BEAM FAILS BY SPLITTING CNER FULL HEIGHT
BEAM FAILS BY CRUSHING IN THIS\ REGION ~
BEAM FAIL6 BY CRUSI4IN
UNDER LOAD
FIG.7·4 SHEAR FAILURE CRACK PATTERNS
144
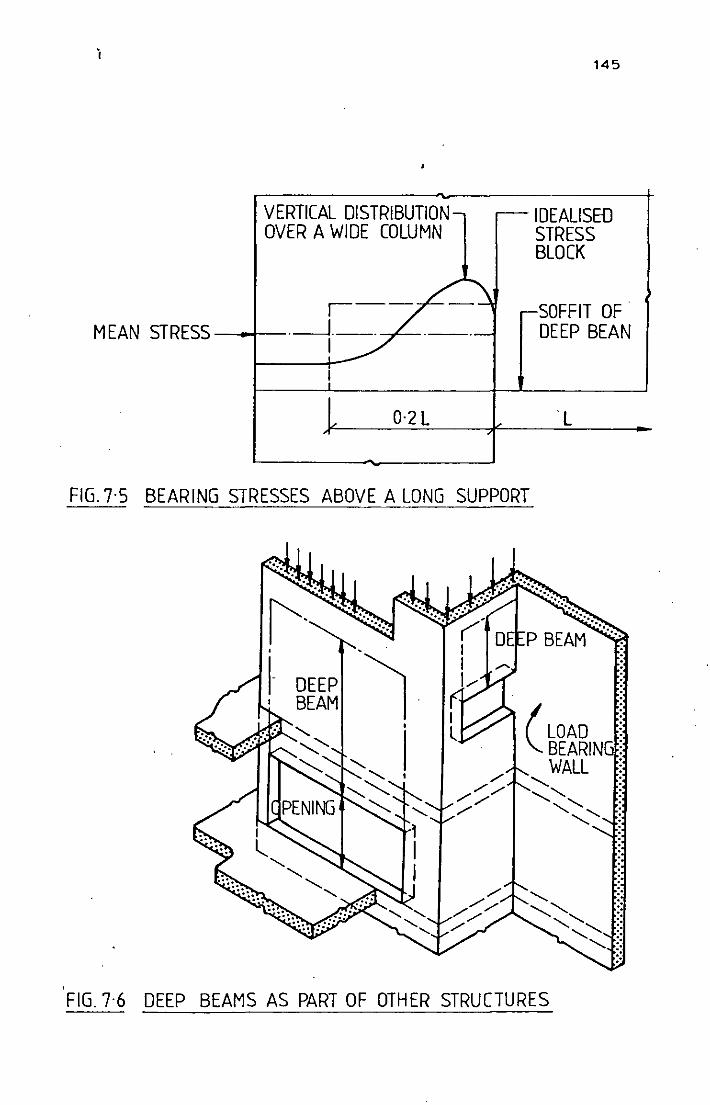
i 145
VERTICAL DISTRIBUTION- r--IDEALlSED OVER A WIDE COLUMN STRESS
BLOCK
1-- -~ r-SOFFIT OF MEAN STRESS .--J_. ._-.- DEEP BEAN
! I
L O·2L L n
FIG.7·5 BEARING STRESSES ABOVE A LONG SUPPORT
1'-•
1- DEEP BEAM 'I ,
I /"
/"/" /"/" /"
.
( LOAD : BEARING: WALL .
.........
......... ' , ...... ......... '
......... .'
.................... ;: ................ ;. ................ .:
...... :; .' .'
FIG.7·6 DEEP BEAMS AS PART OF OTHER STRUCTURES
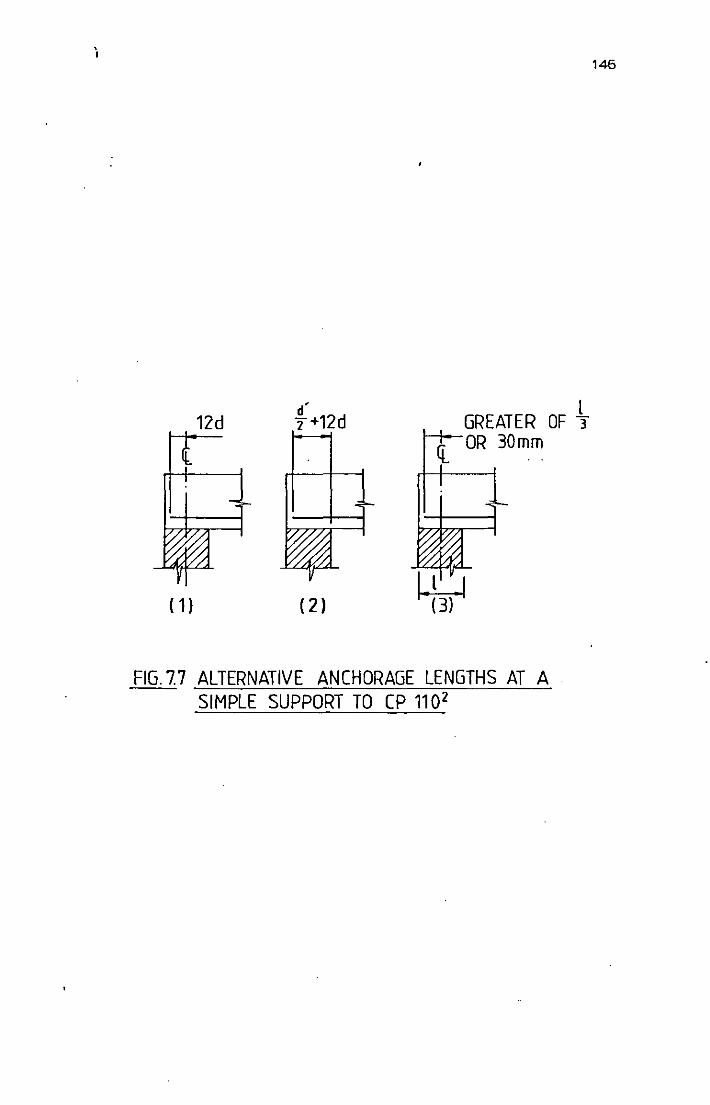
i
12d
( 1 )
d' Y+12d
(2)
GREATER OF ~ J--+ofl~OR 30mm
FIG.7.7 ALTERNATIVE ANCHORAGE LENGTHS AT A . SIMPLE SUPPORT TO CP 1102
146
147
CHAPTER 8 THE DEEP BEAM EXPERIMENTAL PROGRAMME
8.1 Preliminary Remarks
The analysis of stresses and the most efficient methods of
reinforcing concrete deep beams have been the subject of many
investigations. The CIRIA Design Guide (92) has drawn from the
conclusions of these researchers and is at present the most
comprehensive document for detailing reinforced concrete deep beams.
While it states that the system for a single span deep beam may
be thought of as a simple tied arch and that the full tensile
strength of the reinforcement must be anchored at the supports, its
recommendations on anchorage are not based on the findings of any
systematic programme of research that has investigated the effects
of the high biaxial stress conditions resulting from this mode of
load holding.
The results of applying a uniaxial confining pressure to
cube pull-out and semi-beam specimens confirmed that lateral pressure
can significantly increase the bond strength mobilised at the bar/
concrete interface. Although in the case of deep beam anchorages
the stress path causing the high bearing stresses at the supports
is inclined to the bar axis it was considered very likely that the
stress environment would have a beneficial effect especially for
beams with low L/D ratios.
The main purpose of these deep beam experiments was to
investigate the amount of anchorage required for deep beams of
L various /D ratios and to obtain a fuller understanding of the effect
on the anchorage of.the tensile reinforcement of the high lateral
stress conditions present over the supports.
148
The experimental work was planned to include the influence of various
anchorage lengths and bearing sizes on lightweight aggregate (Lytag)
deep beams having span/depth ratios between 1 and 4.
8.2 Description of Test ·Specimens
Sixty-four deep beams made from Lytag lightweight concrete
t with i 1 · / 2 aggrega es a nom na concrete strength of 35 N mm were tested.
All specimens had a clear span length of 1 metre and an overall
length of 1.4 metres. The overhang of the support allowed for the
provision of sufficient anchorage to obtain flexural rather than
anchorage failure. The width of the beams was in all cases 100 mm
and the clear span/depth ratio ranged from 1 to 4.
Tensile reinforcement was made from two 8 mm torbars and
web reinforcement where required was an orthogonal mesh of a readily
available commercial 6 mm deformed bar. The material properties of
all steel used in the investigations are shown in Table 3.2.
The experimental programme can be conveniently divided into
~hree sections.
8.2.1 Series A
In Series A 45 lightweight concrete deep beams with no web
reinforcement were tested. The anchorage length varied from 0
to 150 mm beyond the front edge of the bearing support. The bearing
size also varied from 75 mm to 150 mm. This ·corresponds to the
CIRIA (92) recommendations that the effective bearing area of supports
is limited to 0.2L, where L is the clear length span. For all beams the
clear span was equal to 1 m.
149
8.2.2 Series B
Series B consisted of 16 lightweight deep beams containing
the minimum web steel ratio required by Section 11.9.6 of ACI 318-77(3).
Section 11.9.6 of ACI 318-77(3) states that the minimum web
reinforcement is to be made up in the following manner:
e ;::: 0.004 Ah +
where Ah ~ 0.0025 bSh ' the horizontal web reinforcement and Av ~
0.0015 bsv , the vertical web reinforcement.
The necessary web reinforcement was provided by 6 mm
deformed bars at 110 mm vertical spacing, Sh ' and 185 mm spacing
horizontally, S v
e = n x 62
+ n x 62
4 x 100 x HO 4 x 100 x 185
= 0.00257 + 0.00153
e = 0.0041
The vertical end' web bars were stopped off slightly so
as not to affect the anchorage zone (Figure 8.1).
The bearing size and anchorage lengths were systematically
varied as in Series A.
8.2.3 Series C
Three beams were tested in Series C with the U bend anchor
ages suggested in Section 2.1.1 of the CIRIA Design Guide (92). These
anchorages were of the same overall length as the beams in Series A which
had been provided with a just sufficient or nearly sufficient anchorage
length to ensure that flexural failure occurred.
150
The three beams tested had a web steel ratio, g L , of 0.004 and ID
ratios of 1, 4/3 and 2.
Full details of the reinforcement, anchorage lengths and
block sizes are given in Table 8.1.
8.3 Beam Notation
All beams can be identified by a four figure code, an
example of which appears below:
150 100 65
The number and figure before the first hyphen represents the depth
in meters of the lightweight beam tested ~nd the test series. The
second figure is the overall anchorage length beyond the face of the
support. The figure before the final hyphen is the length of the
bearing block, and the .last number corresponds to the sequence in
which .the beams were fabricated. The example shown above therefore
is a 1 metre deep beam in Series C with a 150 mm u-type anchorage
and the ACI (3) minimum web reinforcement on a 100 x 100 mm bearing
block. For convenience beams are referred to in the text by the
first and last sets of digits (i.e. lC - 65).
8.4 Materials
The 8mm torbar reinforcing steel used for tensile reinforce-
ment was from the same batch as that used in the pull-out experiments.
The material properties of this bar and the 6 mm deformed bar can be
found in Section 3.4.
The concrete mix used was the same as that described for the
pull-out tests in Section 3.5.3. The same cement, Lytag coarse and fine
aggregates were used.
2 The mean concrete strength for the deep beam mixes was 33.1 N/mm
222 6.5 N/mm s.d. as compared to 32.5 N/mm ,4.5 N/mm s.d. for the
151
pull-out tests. The slightly larger standard deviation of the deep
beam control specimens is largely due to the far larger mix sizes and
3 the less efficient mixing in the 0.17 m cumflow mixer used.
8.5 Fabrication and Curing of the Test Specimens
Each mix consisted of sufficient materials to make one or
two deep beams and the necessary_control specimens. The 1 m, 0.75 m
and 0.5 m deep beams were all cast using the same mould. The
mould was constructed of plastic backed-shutterboard and supported by
a metal frame designed to prevent distortion from the weight of the
freshly placed concrete. A false base was incorporated in the mould
so that the various beam depths could be accommodated. The 0.25 m
deep beams were cast in steel moulds that were already-available in
the laboratory.
Tensile reinforcement was supported on plastic spacers and
wired into position in the mould to ensure that the reinforcement was
positioned accurately and the required anchorage length maintained
during casting. Web reinforcement when required was welded together
before placing.
All beams were cast in an upright position with concrete
3 mixed in a 0.17 m capacity cumflow mixer. The beams were vibrated
using a hand held 2 inch vibrating poker. Three 100 mm cubes and two
12 inch cylinders were also cast at the same time as the beams to act
-as control specimens. These were compacted on a vibrating table,
I - ,
152
The moulds were stripped approximately 24 hours after
casting, The deep beams were immediately painted with Ritecure and
covered with plastic sheeting and left in the laboratory until
testing at 28 days, The control specimens were cured under water at
o 20 C until testing at the same age as the beams,
8,6 Test Equipment and Testing Procedure
The testing rig shown in Figure 8,2 was specially designed
and constructed for the series of deep beam experiments, The rig
is capable Of. loading beams with a clear span of 1 m and various
span/depth ratios, The rig was provided with a 500 kN hydraulic jack
and the beams tested with centre point loading, However, with some
modifications to the reaction points the rig is capable of 500k·N
third point loading for similar beam configurations,
Before positioning the deep beams in the testing rig the
height of the load cell and jack were adjusted to suit the depth of
beam to be tested and a thin coat of whitewash was applied to the
beam,· A 100 mm pencil grid was also drawn on the specimen so that
cracking could be easily observed and accurate sketches of the crack
pattern obtained,
Reaction blocks were made from 27! mID (1 inch) steel,
Three reaction bearing lengths were used, 75, 100 and 150 mm
with a constant breadth of 100 mm. The 150 mm bearing block being
slightly less than the maximum effective bearing length of .0.2 x clear
(92) span suggested in Section 2,4,3 of the CIRIA Design Guide Both
bearings were supported on 30 mm diameter rollers to allow free spread-
ing of the supports,
153
The load was applied to the beam by a 500 ~N hydraulic jack through
a 2 inch ball joint attached to a 75 x 100 x 25 mm metal block
bedded to the rough top surface of the beam with Kaffir plaster.
This was positioned on the beam at least two hours before testing to
ensure that the full strength of the plaster was realised. In
general the load was applied in increments of 0.5 tons up to failure
although for the 0.25 m deep beams intervals of 0.25 ton were used.
Unloading and then reloading of the beams was avoided whenever
possible since it is known that repeated loading can affect the
maximum ultimate bond resistance (8,56). Unfortunately deep beams
numbers IB-48 , IB-49 and 0.75B-51 were subject to reloading as a
result of water mixing with the hydraulic oil and preventing the
maximum pressure being obtained from the pump. At each load
increment deflection readings were taken at points close to the
reaction blocks and at the centre of the span. Dial gauges, mounted
independently to the rig, and graduated to 0.01 mm were used. At
regular intervals of load the position and extent of each crack was
marked on the beam surface with a thin pencil line, and the value of
the load was written at the two extremities of the crack.
After failure of the specimen the load was removed and the mode of
failure and a sketch of the ultimate cracking pattern were recorded
before the beam was moved from the rig to be photographed. Usually
when two beams pad been made from a mix it was possible to test
both beams on the same day together with the control specimens.
It was appreciated that the pressure distribution acting on
the anchored bars could be somewhat different to that applied to the
semi-beam and pull-out specimens •
154
So demec gauges were attached to beams lA-G, O.75A-2O, lA-4, O.75A-22,
IB-ll and O.75A-12 in order that the bearing distribution for the
various sizes of blocks could be investigated. The demec -studs
had a 50 mm (2inch) gauge length and were positioned generally at
20 mm centres over the support region as shown in Figure B.3.
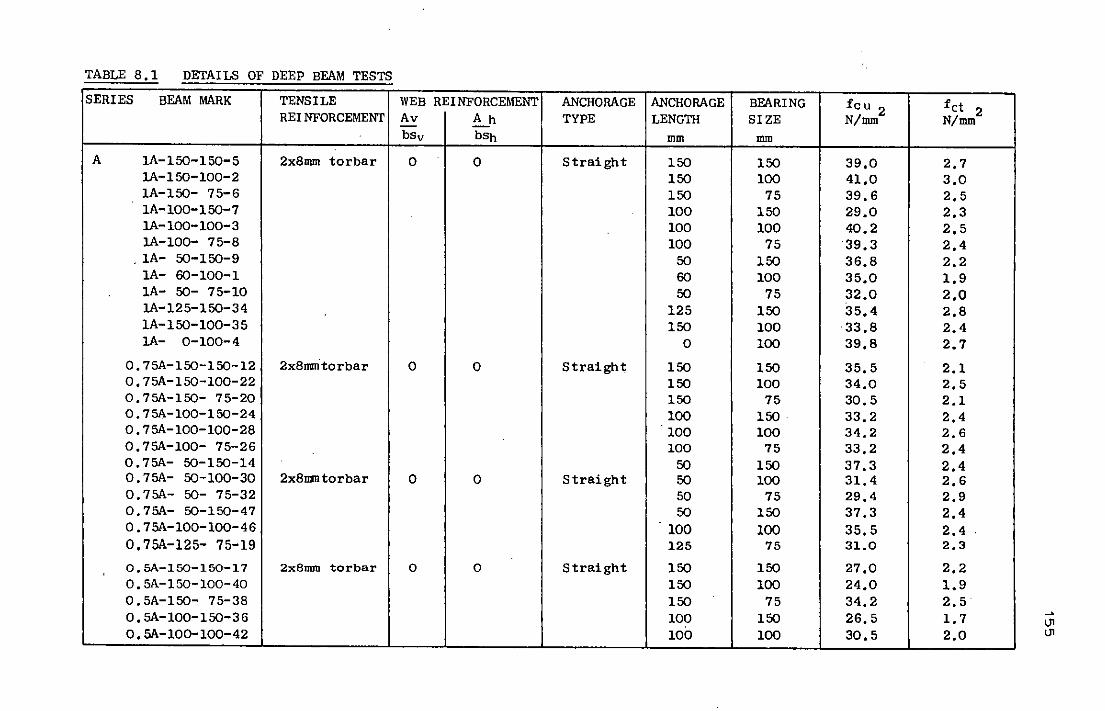
TABLE 8.1 DETAILS OF DEEP BEAM TESTS
SERIES BEAM MARK TENSILE REINFORCEMENT
A 1A-I50-150- 5 lA-150-100-2 1A-150- 75-6 1A-100-150-7 lA-100-100-3 lA-lOO- 75-8
. 1A- 50-150-9 lA- 60-100-1 1A- 50- 75-10 lA-125-150-34 lA-I50-100-35 lA- 0-100-4
2x8mm torbar
0.75A-150-150-12! 2x8mm'torbar 0.75A-150-100-22 0.75A-150- 75-20 0.75A-100-150-24 0.75A-100-100-28 0.75A-I00- 75-26 0.75A- 50-150-14 0.75A- 50-100-301 2x8mmtorbar 0.75A- 50- 75-32 0.75A- 50-150-47 0.75A-100-100-46 0.75A-125- 75-19
0.5A-150-150-17 0.5A-150-100-40 0.5A-150- 75-38 0.5A-100-150-36 0.5A-10o-100-42
2x8mm torbar
WEB REINFORCEMENT Av I A h bsv bSh
o o
o o
o o
o o
ANCHOMGE I ANCHOMGE TYPE LENGTH
Straight
Straight
Straight
Straight
mm
150 150 150 100 100 100
50 60 50
125 150
o 150 150 150 100 100 100
50 50 50 50
100 125
150 150 150 100 100
BEARING SIZE
mm
150 100
75 150 100
75 150 100
75 150 100 100
150 100
75 150 ' 100
75 150 100
75 150 100
75
150 100
75 150 100
feu 2 N/mm
39.0 41.0 39.6 29.0 40.2 39.3 36.8 35.0 32.0 35.4 33.8 39.8
35.5 34.0 30.5 33.2 34.2 33.2 37.3 31.4 29.4 37.3 35.5 31.0
27.0 24.0 34.2 26.5 30.5
fct 2 N/mm
2.7 3.0 2.5 2.3 2.5 2.4 2.2 1.9 2.0 2.8 2.4 2.7
2.1 2.5 2.1 2.4 2.6 2.4 2.4 2.6 2.9 2.4 2.4 2.3
2.2 1.9 2.5 1.7 2.0
~
U1 U1
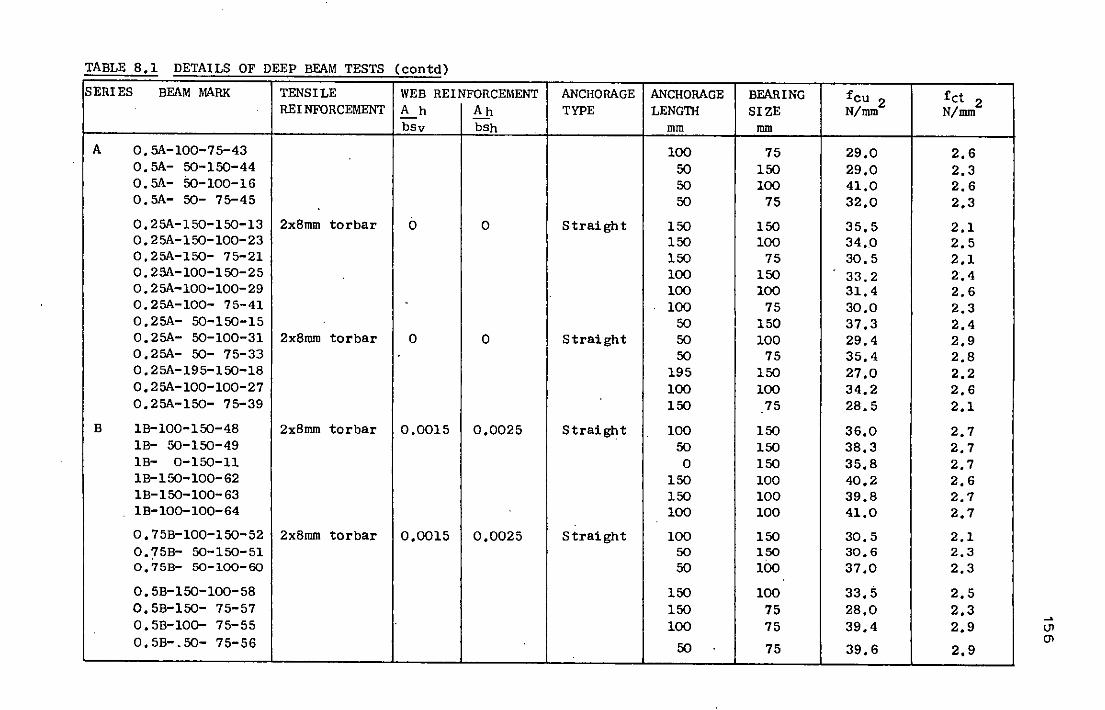
TABLE 8.1 DETAILS OF DEEP BEAM TESTS (eontd)
SERIES
A
B
BEAM MARK TENSILE I WEB REINFORCEMENT REI NFORCEMENT A h I A h
0.5A-100-75-43 0.5A- 50-150-44 0.5A- 50-100-16 0.5A- 50- 75-45
0.25A-150-150-13 I 2x8mm torbar 0.25A-150-100-23 0.25A-150- 75-21 0.25A-I00-150-25 0.25A-100-100-29 0.25A-100- 75-41 0.25A- 50-150-15 0.25A- 50-100-31 I 2x8mm torbar 0.25A- 50- 75-33 0.25A-195-150-18 0.25A-100-100-27 0.25A-150- 75-39
bsv bSh
o o
o o
IB-100-150-48 IB- 50-150-49 IB- 0-150-11
2x8mm torbar I 0.0015 I 0.0025
IB-150-100-62 IB-150-100-63 IB-100-100-64
0.75B-I00-150-52 I 2x8mm torbar 10.0015 I 0.0025 0.75B- 50-150-51 0.75B- 50-100-60
0.5B-150-100-58 0.5B-150- 75-57 0.5B-100- 75-55 0.5B-.50- 75-56
ANCHORAGE I ANCHORAGE TYPE LENGTH
Straight
Straight
Straight
Straight
mm
100 50 50 50
150 150 150 100 100 100
50 50 50
195 100 150
100 50 o
150 150 100
100 50 50
150 150 100
50
BEARING SIZE
mm
75 150 100
75
150 100
75 150 100
75 150 100
75 150 100
75
150 150 150 100 100 100
150 150 100
100 75 75
75
feu 2 N/mm
29.0 29,0 41,0 32,0
35,5 34,0 30,5 33.2 31,4 30.0 37,3 29.4 35,4 27,0 34,2 28,5
36,0 38,3 35,8 40.2 39,8 41.0
30.5 30,6 37,0
33,5 28,0 39,4
39,6
fct 2 N/mm
2,6 2,3 2.6 2,3
2,1 2,5 2,1 2.4 2,6 2,3 2,4 2,9 2.8 2,2 2,6 2,1
2,7 2,7 2.7 2,6 2.7 2,7
2.1 2.3 2,3
2,5 2,3 2,9
2,9
~
U1 ()\
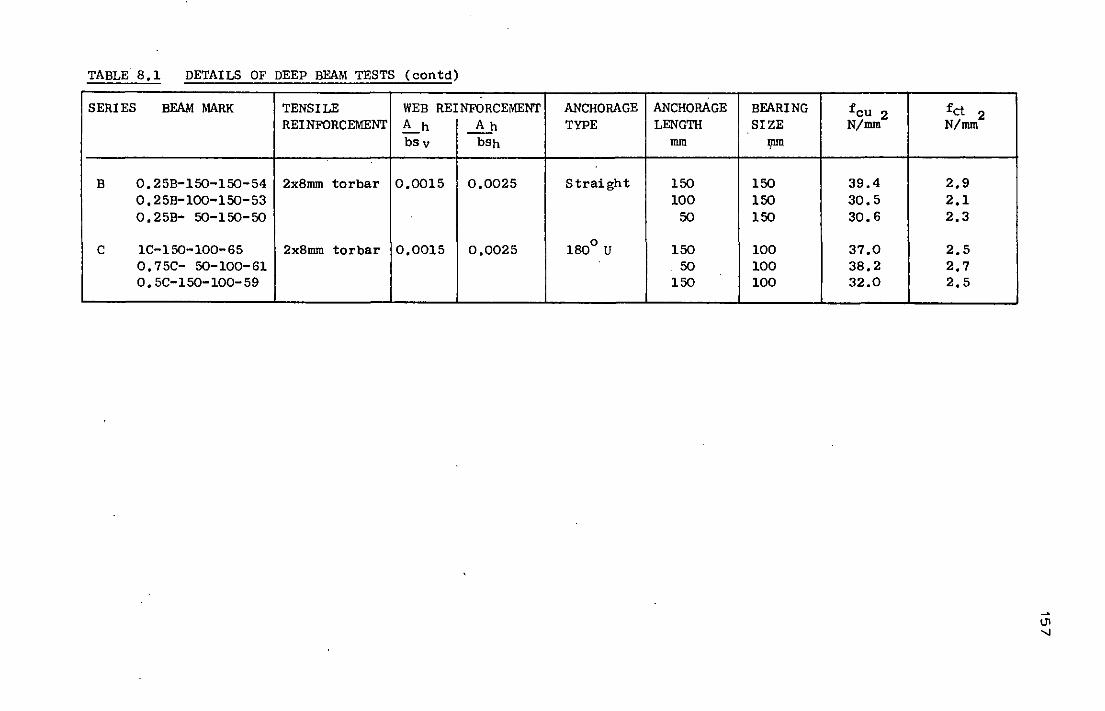
TABLE 8.1 DETAILS OF DEEP BEAM TESTS (eontd)
SERIES BEAM MARK TENSILE WEB REINFORCEMENT REINFORCEMENT ~h ~h
bsv bSh
B 0.25B-150-150-54 2x8mm torbar 0.0015 0.0025 0.25B-loo-150-53 0.25B- 50-150-50
C lC-150-100-65 2x8mm torbar 0.0015 0.0025 0.75C- 50-100-61 0.5C-150-100-59
-- -----
ANCHORAGE ANCHORAGE TYPE LENGTH
mm
Straight 150 100
50
1800 U 150 50
150
BEARING feu 2 SIZE N/mm
I)UD
150 39.4 150 30.5 150 30.6
100 37.0 100 38.2 100 32.0
fct N/mm
2.9 2.1 2.3
2.5 2.7 2.5
2
\J1 -..J
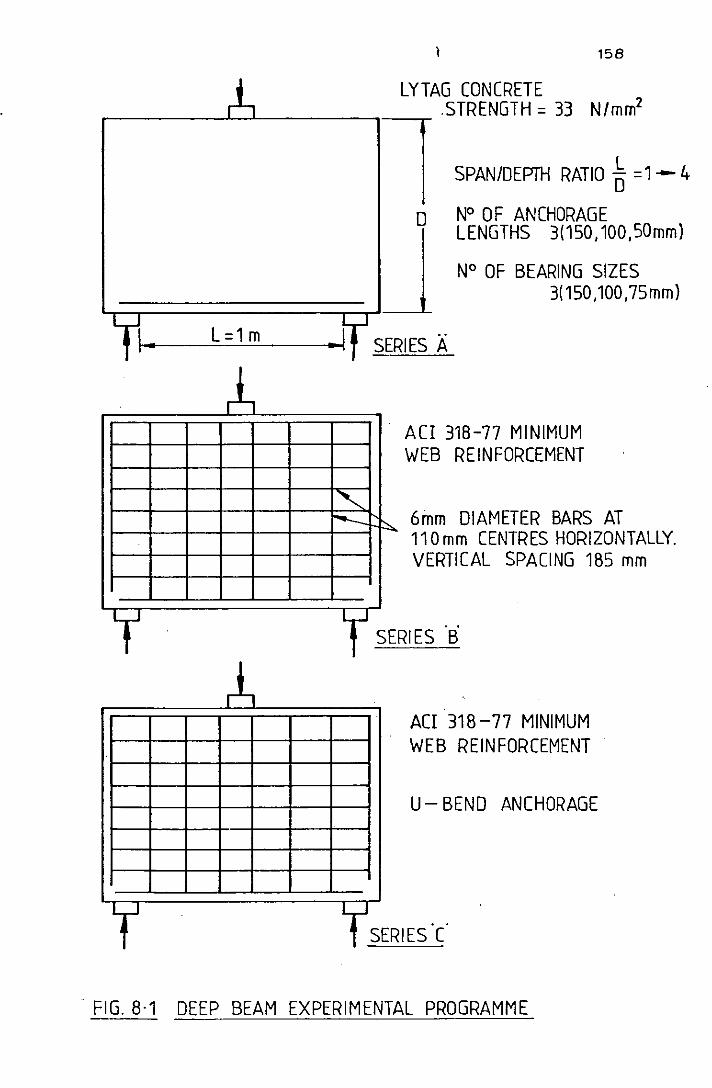
158
LYTAG CONCRETE
r-------~~------~---~ .sTRENGTH = 33 N/mm2
L=1m
b
t ),
t
o
SPAN/DEPTH RATIO ~ = 1 - 4
N° OF ANCHORAGE LENGTHS 3(150,100,50mm)
N° OF BEARING SIZES 3(150,100,75mm)
SERIES A
"-t--l"""'-
, SE
ACI 318-77 MINIMUM WEB REINFORCEMENT
6inm DIAMETER BARS AT 110mm CENTRES HORIZONTALLY. VERTICAL SPACING 185 mm
ACI WEB
318-77 MINIMUM REINFORCEMENT
U- BEND ANCHORAGE
1_SERIES'C
.. FIG. 8·1 DEEP BEAM EXPERIMENTAL PROGRAMME
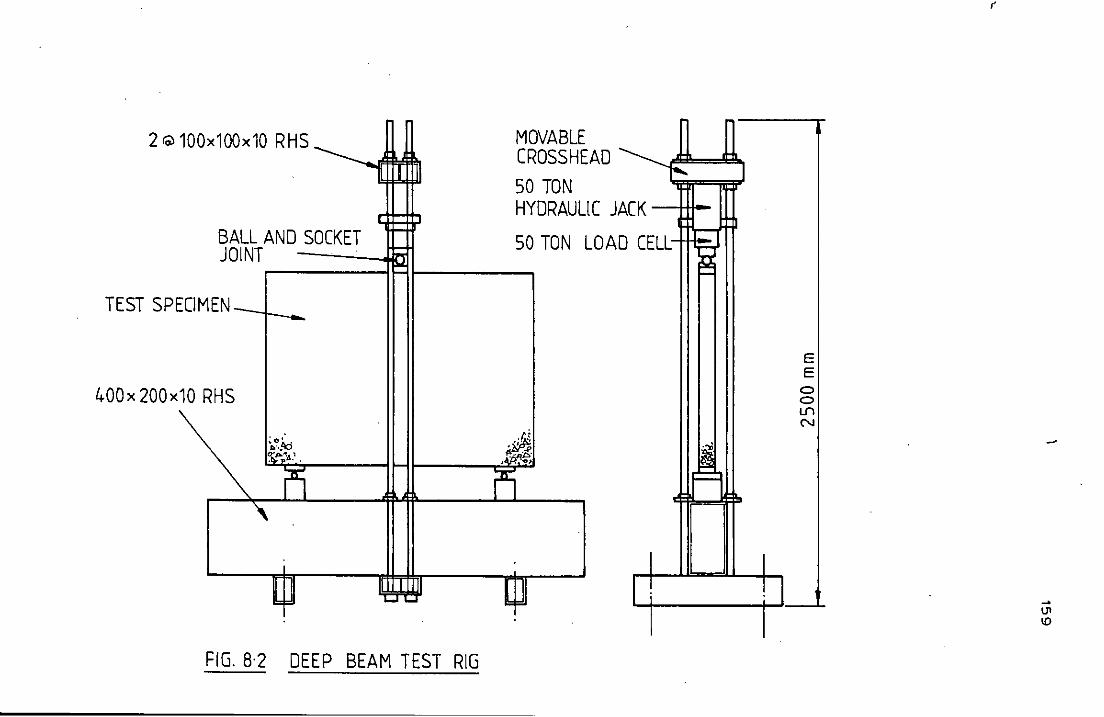
2G )x100x10 RHS
11 I1 III
BALL AND SOCKET I-
JOINT ... P"
TEST SPE -1EN --400x 200x RHS
~ ,., r~;~ I-
'\
~ ~ n 11 III
....
FIG. 8·2 DEEP BEAM TEST RIG
MOVABLE CROSS HE
50 TON HYDRAUL
50 TON
~ . "" .tm'f-~ ,<0,
Fl
l U
AD ~ J
C JACK 111-
OAD CELl"~
~ I .
J II
E E o o U"l N
(
~
lJl !O
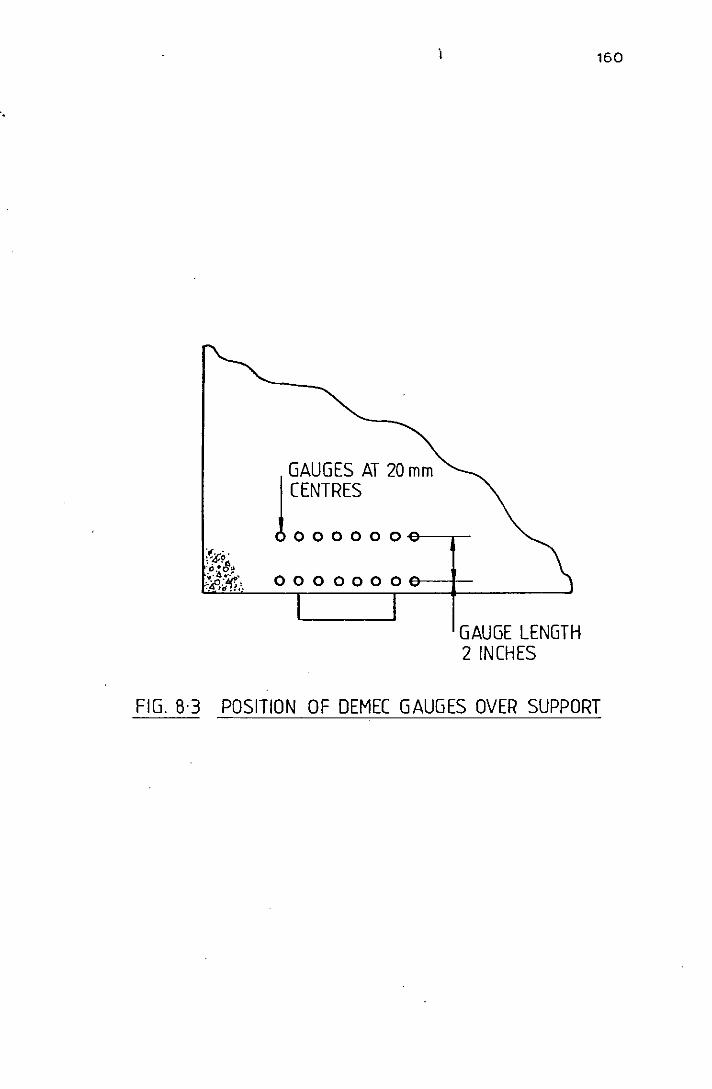
'.
lGAUGES AT 20 mm CENTRES
o 0 0 0 0 0 -e-----.--
0000000&--+-
GAUGE LENGTH 2 INCHES
160
FIG, 8,3 POSITION OF DEMEC GAUGES OVER SUPPORT
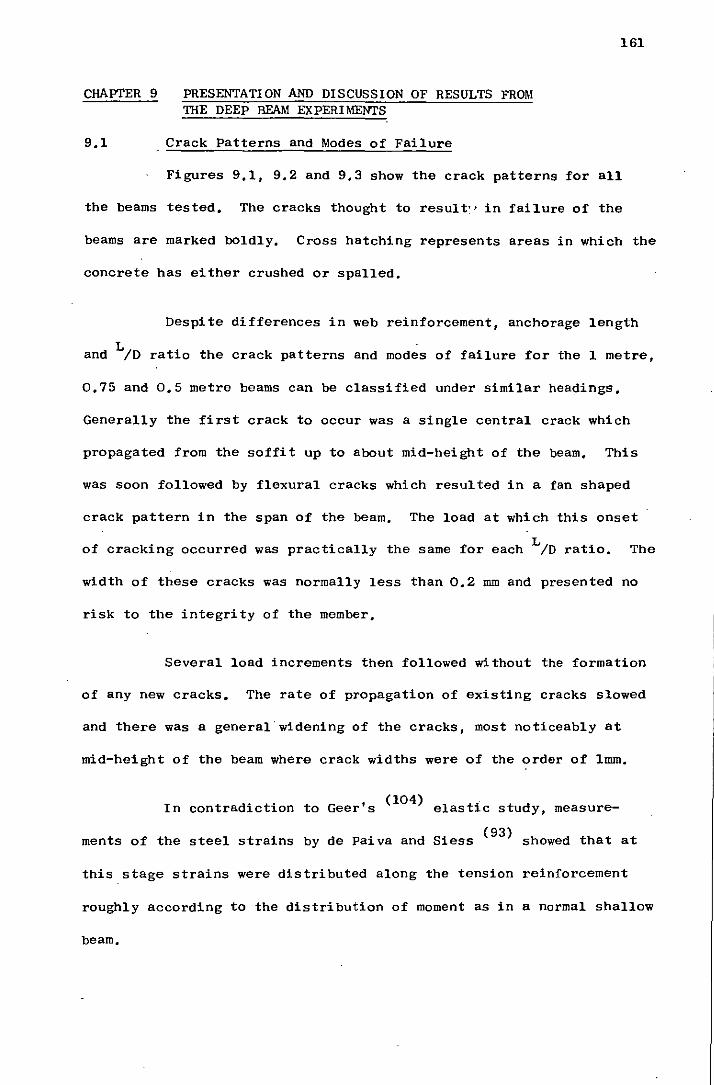
161
CHAPTER 9 PRESENTATION AND DISCUSSION OF RESULTS FROM THE DEEP BEAM EXPERIMENTS
9,1 Crack Patterns and Modes of Failure
Figures 9,1, 9,2 and 9,3 show the crack patterns for all
the beams tested, The cracks thought to result-' in failure of the
beams are marked boldly, Cross hatching represents areas in which the
concrete has either crushed or spalled,
Despite differences in web reinforcement, anchorage length
L and /D ratio the crack patterns and modes of failure for the 1 metre,
0,75 and 0,5 metre beams can be classified under similar headings,
Generally the first crack to occur was a single central crack which
propagated from the soffit up to about mid-height of the beam, This
was soon followed by flexural cracks which resulted in a fan shaped
crack pattern in the span of the beam, The load at which this onset
of cracking occurred was practically the same for each L/D ratio, The
width of these cracks was normally less than 0,2 mm and presented no
risk to the integrity of the member,
Several load increments then followed without the formation
of any new cracks, The rate of propagation of existing cracks slowed
and there was a general widening of the cracks, most noticeably at
mid-height of the beam where crack widths were of the order of Imm,
In contradiction to Geer's (104) elastic study, measure
ments of the steel strains by de paiva and Siess (93) showed that at
this stage strains were distributed along the tension reinforcement
roughly according to the distribution of moment as in a normal shallow
beam,
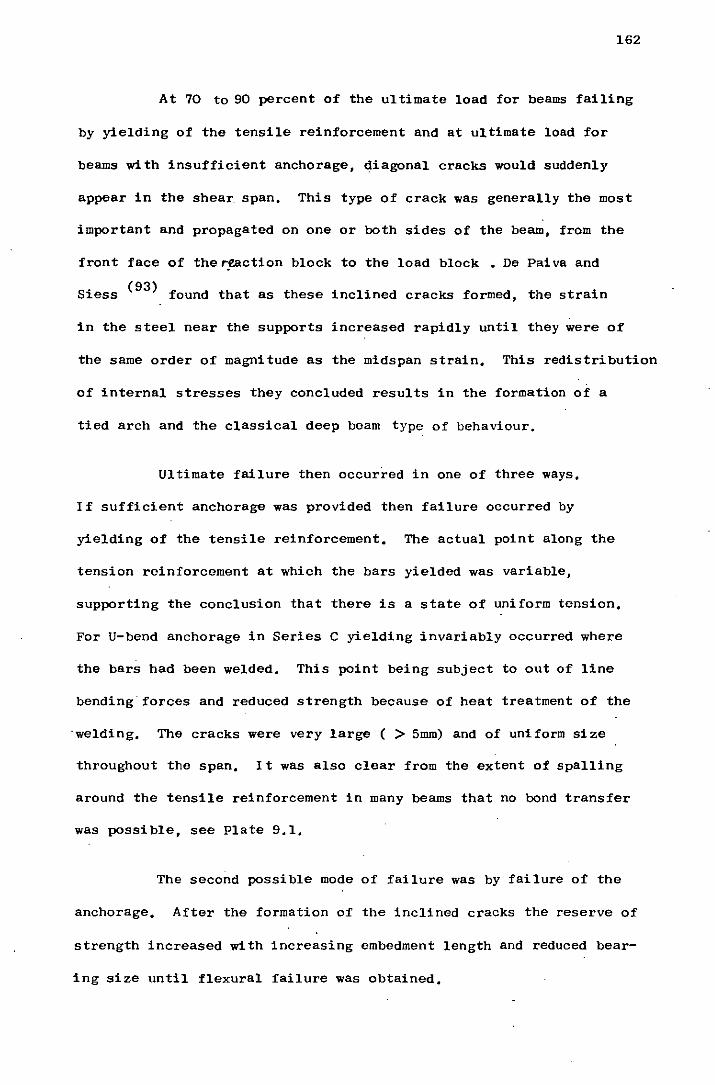
162
At 70 to 90 percent of the ultimate load for beams failing
by yielding of the tensile reinforcement and at ultimate load for
beams with insufficient anchorage, diagonal cracks would suddenly
appear in the shear. span. This type of crack was generally the most
important and propagated on one or both sides of the beam, from the
front face of the~ction block to the load block. De Paiva and
Siess (93) found that as these inclined cracks formed, the strain
in the steel near the supports increased rapidly until they were of
the same order of magnitude as the midspan strain. This redistribution
of internal stresses they concluded results in the formation of a
tied arch and the classical deep beam type of behaviour.
Ultimate failure then occurred in one of three ways.
If sufficient anchorage was provided then failure occurred by
yielding of the tensile reinforcement. The actual point along the
tension reinforcement at which the bars yielded was variable,
supporting the conclusion that there is a state of uniform tension.
For U-bend anchorage in Series C yielding invariably occurred where
the bars had been welded. This point being subject to out of line
bending· forces and reduced strength because of heat treatment of the
·welding. The cracks were very large ( > 5mm) and of uniform size
throughout the span. It was also clear from the extent of spalling
around the tensile reinforcement in many beams that no bond transfer
was possible, see Plate 9.1.
The second possible mode of failure was by failure of the
anchorage. After the formation of the inclined cracks the reserve of
strength increased with increasing embedment length and reduced bear
ing size until flexural failure was obtained.
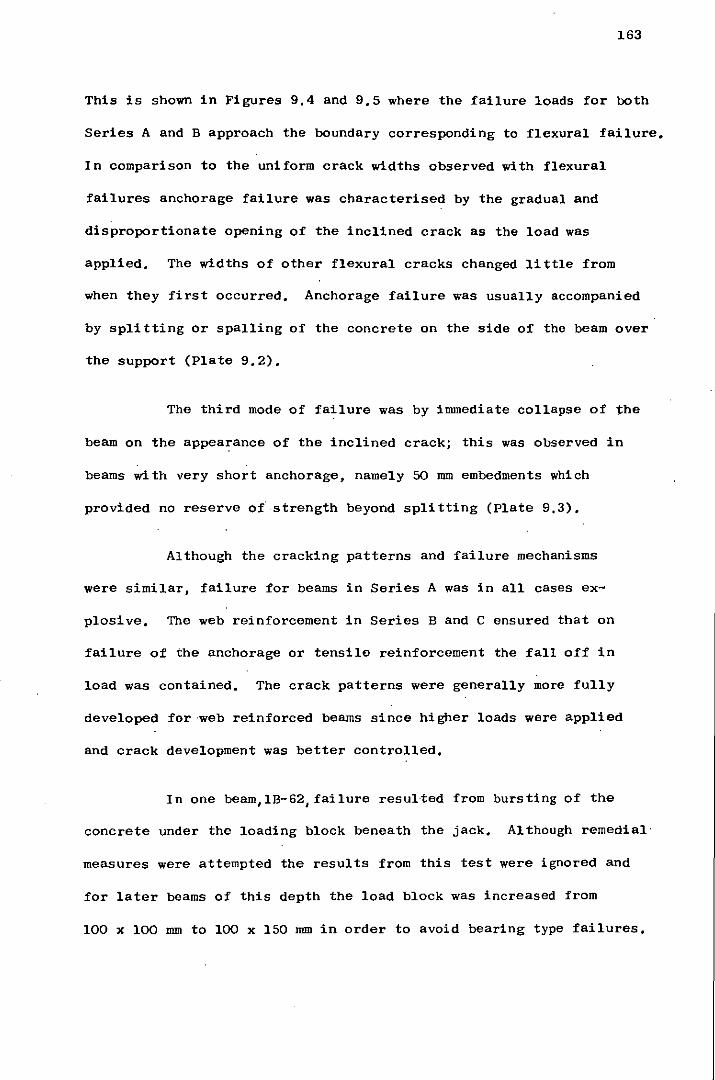
163
This is shown in Figures 9,4 and 9,5 where the failure loads for both
Series A and B approach the boundary corresponding to flexural failure,
In comparison to the uniform crack widths observed with flexural
failures anchorage failure was characterised by the gradual and
disproportionate opening of the inclined crack as the load was
applied, The widths of other flexural cracks changed little from
when they first occurred, Anchorage failure was usually accompanied
by splitting or spalling of the concrete on the side of the beam over
the support (Plate 9,2),
The third mode of failure was by immediate collapse of the
beam on the appearance of the inclined crack; this was observed in
beams with very short anchorage, namely 50 mm embedments which
provided no reserve of strength beyond splitting (Plate 9,3),
Although the cracking patterns and failure mechanisms
were similar J failure for beams in Series A was in all cases ex
plosive, The web reinforcement in Series Band C ensured that on
failure of the anchorage or tensile reinforcement the fall off in
load was contained, The crack patterns were generally more fully
developed for ·web reinforced beams since higher loads were applied
and crack development was better controlled,
In one beam,lB-62, failure resul·ted from bursting of the
concrete under the loading block beneath the jack, Although remedial·
measures were attempted the results from this test were ignored and
for later beams of this depth the load block was increased from
100 x 100 mm to 100 x 150 mm in order to avoid bearing type failures,
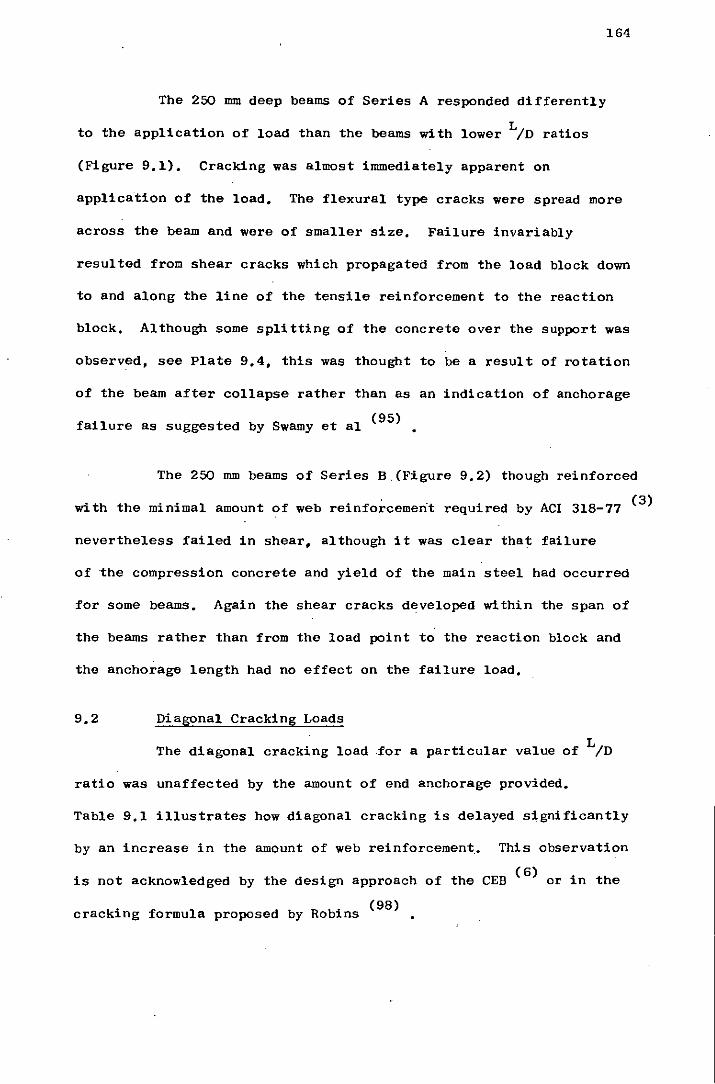
164
The 250 mm deep beams of Series A responded differently
L to the application of load than the beams with lower /0 ratios
(Figure 9.1). Cracking was almost immediately apparent on
application of the load. The flexural type cracks were spread more
across the beam and were of smaller size. Failure invariably
resulted from shear cracks which propagated from the load block down
to and along the line of the tensile reinforcement to the reaction
block. Although some splitting of the concrete over the support was
observed, see Plate 9.4, this was thought to be a result of rotation
of the beam after collapse rather than as an indication of anchorage
. (95) fa~lure as suggested by Swamy et al •
The 250 mm beams of Series B.(Figure 9.2) though reinforced
wi th the minimal amount of web reinforcement required by ACI 318-77 (3)
nevertheless failed in shear, although it was clear that failure
of the compression concrete and yield of the main steel had occurred
for some beams. Again the shear cracks developed within the span of
the beams rather than from the load point to the reaction block and
the anchorage length had no effect on the failure load.
9.2 Diagonal Cracking Loads
The diagonal cracking load .for a particular value of L /0
ratio was unaffected by the amount of end anchorage provided.
Table 9.1 illustrates how diagonal cracking is delayed significantly
by an increase in the amount of web reinforcement. This observation
is not acknowledged by the design approach of the CEB (6) or in the
. (98) cracking formula proposed by Rob~ns •
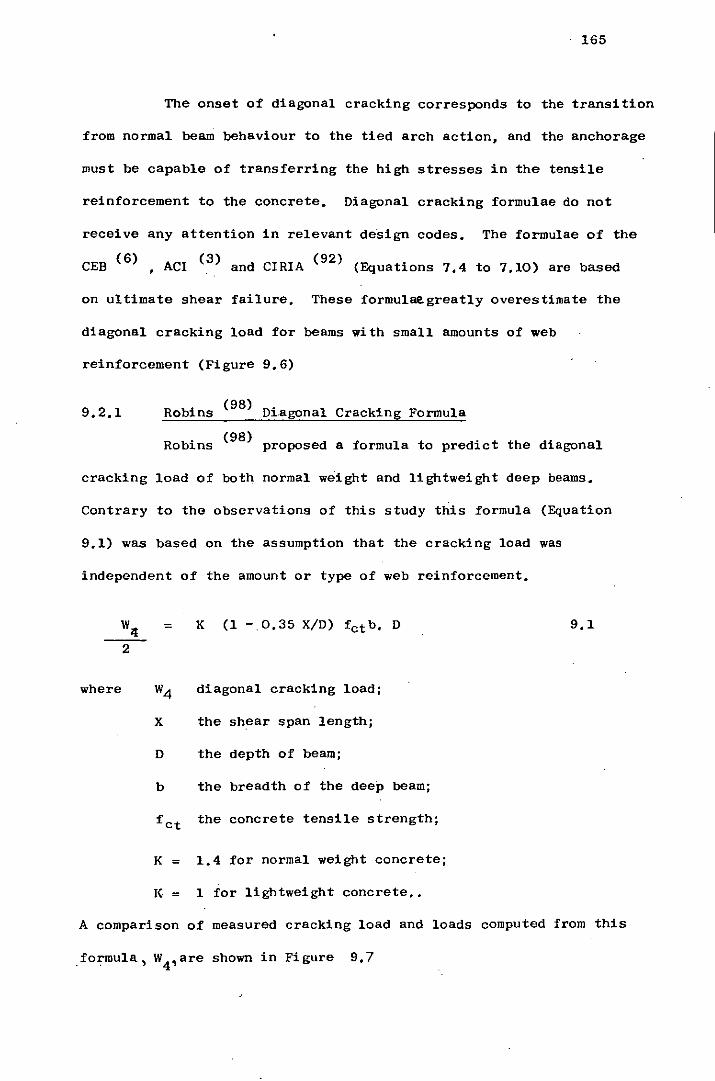
165
The onset of diagonal cracking corresponds to the transition
from normal beam behaviour to the tied arch action, and the anchorage
must be capable of transferring the high stresses in the tensile
reinforcement to the concrete. Diagonal cracking formulae do not
receive any attention in relevant design codes. The formulae of the
CEB (6) , ACI (3) and CIRIA (92) (Equations 7.4 to 7.10) are based
on ultimate shear failure. These formul&egreat1y overestimate the
diagonal cracking load for beams with small amounts of web
reinforcement (Figure 9.6)
9.2.1 (98)
Robins Di.agona1 Cracking Formula
Robins (98)
proposed a formula to predict the diagonal
cracking load of both normal weight and lightweight deep beams.
Contrary to the observations of this study this formula (Equation
9.1) was based on the assumption that the cracking load was
independent of the amount or type of web reinforcement.
WII:
2
where
= K (1 -0.35 X/D) fctb. D
diagonal cracking load;
X the shear span length;
D the depth of beam;
b the breadth of the deep beam;
f ct the concrete tensile strength;
K = 1.4 for normal weight concrete;
K = 1 for lightweight concrete ••
9.1
A comparison of measured cracking load and loads computed from this
formula, w4,are shown in Figure 9.7
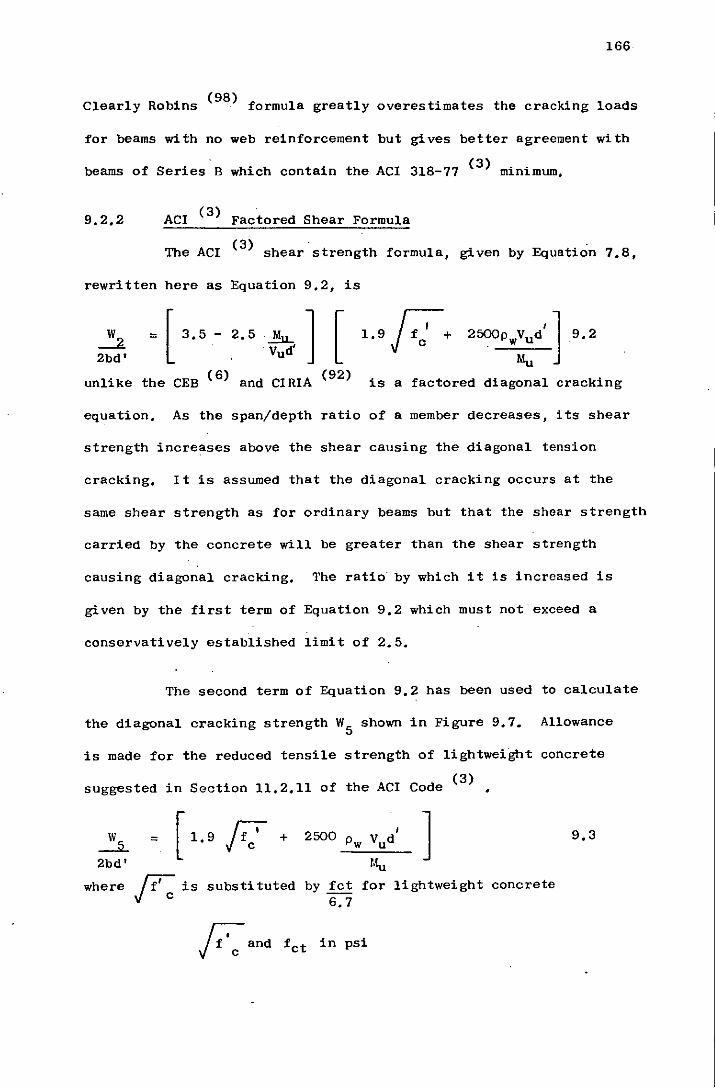
166
(98) Clearly Robins formula greatly overestimates the cracking loads
for beams with no web reinforcement but gives better agreement with
beams of Series B which contain the ACI 318-77 (3) minimum.
9.2.2 ACI (3) Factored Shear Formula
(3) . The ACI shear strength formula, given by Equation 7.8,
rewri tten here as Equation 9.2, is
~ = [ 3.5 - 2.5 .~ J [ 1.9 r::+ 2500Pw~dl ] .9.2
2bd' ·Vud'
unlike the CEB (6) and CIRIA (92)
is a factored diagonal cracking
equation. As the span/depth ratio of a member decreases, its shear
strength increases above the shear causing the diagonal tension
cracking. It is assumed that the diagonal cracking occurs at the
same shear strength as for ordinary beams but that the shear strength
carried by the concrete will be greater than the shear strength
causing diagonal cracking. The ratio by which it is increased is
given by the first term of Equation 9.2 which must not exceed a
conservatively established limit of 2.5.
The second term of Equation 9.2 has been used to calculate
the diagonal cracking strength W5 shown in Figure 9.7. Allowance
is made for the reduced tensile strength of lightweight concrete
suggested in Section 11.2.11 of the ACI Code (3)
~ 2bd'
= ] where jf': is substi tuted by fct for lightweight concrete
6.7
Rand fct in psi
9.3
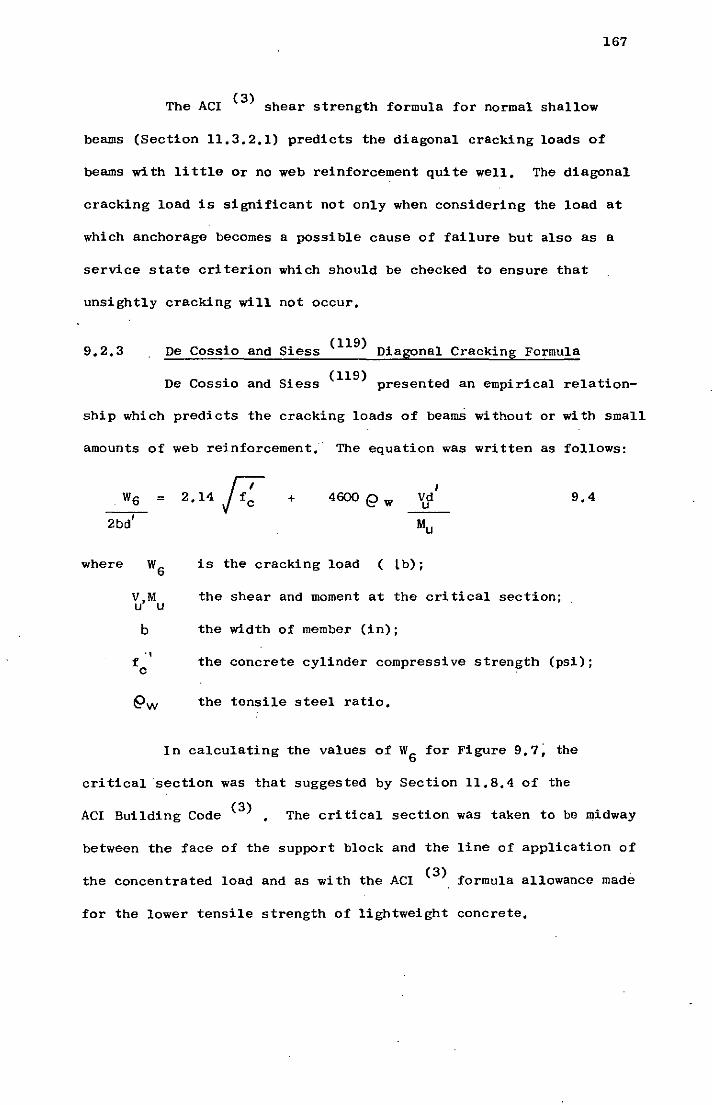
167
( 3) The ACI shear strength formula for normal shallow
beams (Section 11.3.2.1) predicts the diagonal cracking loads of
beams with little Or no web reinforcement quite well. The diagonal
cracking load is significant not only when considering the load at
which anchorage becomes a possible cause of failure but also as a
service state criterion which should be checked to ensure that
unsightly cracking will not occur.
9.2.3 De Cossio and Siess (119) Diagonal Cracking Formula
(119) De Cossio and Siess presented an empirical relation-
ship which predicts the cracking loads of beams without or with small
amounts of web reinforcement;· The equation was written as follows:
where
=
V,M u u
b
~w
2.14 r;:- + 4600 f2 w 9.4
is the cracking load ( Lb);
the shear and moment at the critical section;
the width of member (in);
the concrete cylinder compressive strength (psi);
the tensile steel ratio.
In calculating the values of W6 for Figure 9.7; the
critical 'section was that suggested by Section 11.8.4 of the
ACI Building Code (3). The critical section was taken to be midway
between the face of the support block and the line of application of
the concentrated load and as with the ACI (3) formula allowance made
for the lower tensile strength of lightweight concrete.
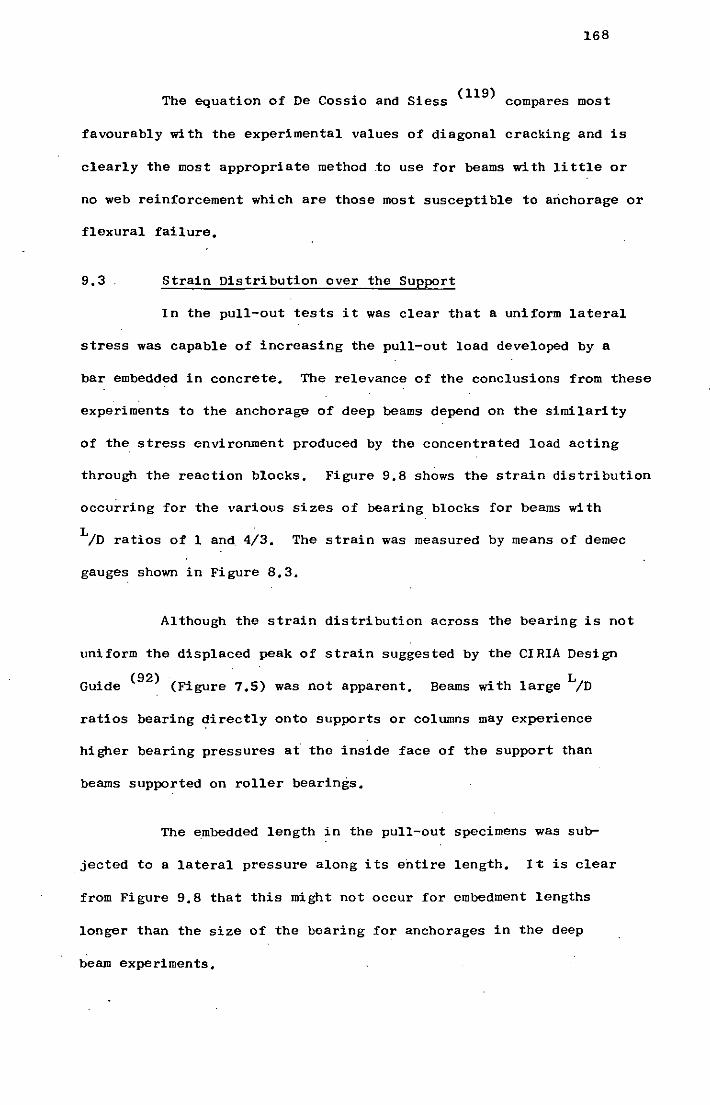
168
The equation of De Cassia and Siess (119) compares most
favourably with the experimental values of diagonal cracking and is
clearly the most appropriate method to use for beams with little or
no web reinforcement which are those most susceptible to arichorage or
flexural failure.
9.3 Strain Distribution over the Support
In the pull-out tests it was clear that a uniform lateral
stress was capable of increasing the pull-out load developed by a
bar embedded in concrete. The relevance of the conclusions from these
experiments to the anchorage of deep beams depend on the similarity
of the. stress environment produced by the concentrated load acting
through the reaction blocks. Figure 9.8 shows the strain distribution
occurring for the various sizes of bearing blocks for beams with
LID ratios of 1 and. 4/3. The strain was measured by means of demec
gauges shown in Figure 8.3.
Although the strain distribution across the bearing is not
uniform the displaced peak of strain suggested by the CIRIA Design
(92) Guide . (Figure 7.5) was not apparent. Beams with large LID
ratios bearing directly onto supports or columns may experience
higher bearing pressures at the inside face of the support than
beams supported on roller bearings.
The embedded length in the pull-out specimens was sub-
jected to a lateral pressure along its entire length. I t is clear
from Figure 9.8 that this might not occur for embedment lengths
longer than the size of the bearing for anchorages in the deep
beam experiments.
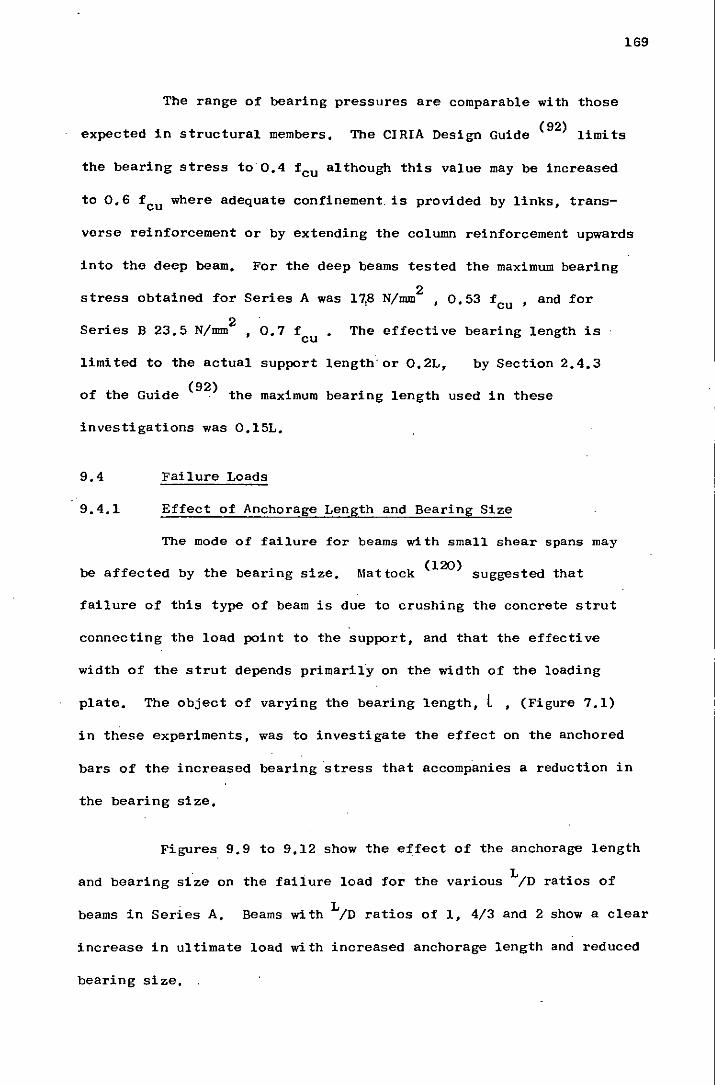
169
The range of bearing pressures are comparable with those
expected in structural members. The CIRIA Design Guide (92) limits
the bearing stress to·0.4 fcu although this value may be increased
to 0.6 fcu where adequate confinement. is provided by links, trans-
verse reinforcement or by extending the column reinforcement upwards
into the deep beam, For the deep beams tested the maximum bearing
2 stress obtained for Series A was 17,8 N/mm ,0.53 fcu ' and for
2 Series B 23.5 N/mm ,0,7 fcu The effective bearing length is
limited to the actual support length· or O,2L, by Section 2.4,3
of the Guide (92) the maximum bearing length used in these
investigations was O,15L,
9.4 Failure Loads
9.4.1 Effect of Anchorage Length and Bearing Size
The mode of failure for beams with small shear spans may
be affected by the bearing size, Mat tock (120) suggested that
failure of this type of beam is due to crushing the concrete strut
connecting the load point to the support, and that the effective
width of the strut depends primarity on the width of the loading
plate, The object of varying the bearing length, L , (Figure 7.1)
in these experiments, was to investigate the effect on the anchored
bars of the increased bearing ·stress that accompanies a reduction in
the bearing size.
Figures 9.9 to 9.12 show the effect of the anchorage length
and bearing size on the failure load for the various L/D ratios of
beams in Series A. Beams with L/D ratios of 1, 4/3 and 2 show a clear
increase in ultimate load with increased anchorage length and reduced
bearing size.
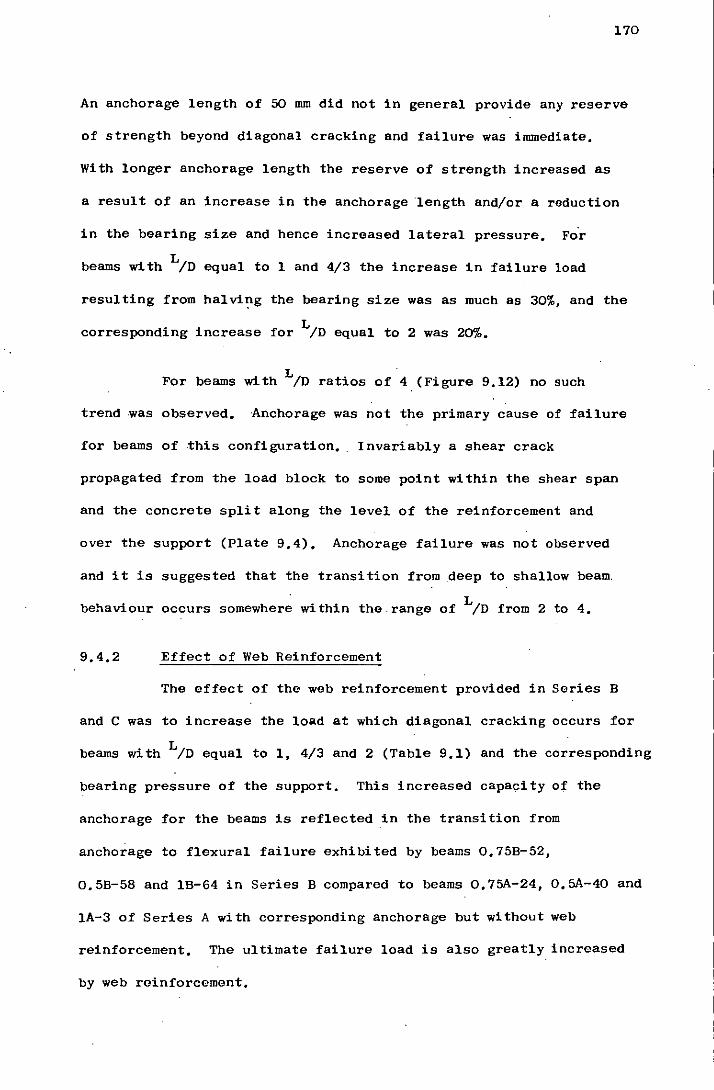
170
An anchorage length of 50 mm did not in general provide any reserve
of strength beyond diagonal cracking and failure was immediate.
With longer anchorage length the reserve of strength increased as
a result of an increase in the anchorage ·length and/or a reduction
in the bearing size and hence increased lateral pressure. For
L beams with /D equal to 1 and 4/3 the increase in failure load
resulting from halving the bearing size was as much as 30%, and the
L corresponding increase for /D equal to 2 was 20%.
For beams with L/D ratios of 4. (Figure 9.12) no such
trend was observed. Anchorage was not the primary cause of failure
for beams of ·this configuration. Invariably a shear crack
propagated from the load block to some point within the shear span
and the concrete split along the level of the reinforcement and
over the support (Plate 9.4). Anchorage failure was not observed
and it is suggested that the transition from deep to shallow beam.
behaviour occurs somewher~ within the.range of L/D from 2 to 4.
9.4.2 Effect of Web Reinforcement
The effect of the web reinforcement provided in Series B
and C was to increase the load at which diagonal cracking occurs for
beams with L/D equal to 1, 4/3 and 2 (Table 9.1) and the corresponding
bearing pressure of the support. This increased capacity of the
anchorage for the beams is reflected in the transition from
anchorage to flexural failure exhibited by beams 0.75B-52,
0.5B-58 and lB-64 in Series B compared to beams 0.75A-24, 0.5A-40 and
lA-3 of Series A with corresponding anchorage but without web
reinforcement. The ultimate failure load is also greatly increased
by web reinforcement.
171
Beams lA-2 and O,75A-22 failed in .flexure at 0,6 times the ultimate
loads of beam lB-63 and O,75B-52 of Series B which were provided with
web reinforcement and also failed by yielding of the main tensile
reinforcement, These results confirm that web reinforcement plays·
an important role as tensile reinforcement, This contradicts the
recommendations of the CEB-FIP (6) and the work of Leonhardt and
(107) . Walther which draw a clear d1stinction between the functions
of web and tensile reinforcement,
For L/D = 4 the effect of web reinforcement was to extend
the load/deflection diagram, The initial .stiffness of the beam was
not significantly changed, Although a flexural failure is inferred
by. the large amounts of plastic strain, only in the case of
O,25B-53 shown in Plate 9,5 was it clear that failure occurred by
crushing of the concrete compressive·zone rather than by shear
cracking,
9,4,3 Effect of Type of Anchorage
The results of Series C demonstrated that the CIRIA (92)
U-bend anchorage had little or no advantage over a similar length
of straight anchorage, Only beam O,75C-6l gave an increase in
failure load compared to the equivalent straight anchorage of beam
O,75B-GO, Beams O,5C-59 and lC-65 failed at lower loads than
O,5B-58 and lB-64 of Series B because of the reduction in ultimate
strength of the primary tension reinforcement, Welding of the cold
worked torbar and the out of line bending stresses in the lap reduced
the ultimate failure stress of the bars from 659 N/mm2 to 535 N/mm2
(Table 3,2),
172
(107) . Leonhardt and Walther observed that hor1zontal
hooks and anchorages are more effective than vertical hooks and bent
up bars. This is not surprising since the latter are removed from
the localised advantageous effect of the confining stress at the
support.
As has been mentioned in the previous section web reinforce-
ment plays an important role as tensile reinforcement. ~or this
reason it is equally important to ensure adequate anchorage of web
reinforcement. Three of the beams (N8-3D, N8-25 and N8-20) tested
by Robins (98) failed by" vertical spli tting directly above a
support. The position of the vertical splitting corresponded
approximately to the section at which the web rein"forcement was
"terminated. If the reinforcement had been continued further over
the supports it is suggested that a higher failure load or
possibly a different mode of failure might have been observed.
9.5 Deflection Control
The central span deflection and deflection at points on the
span close to the support reactions were recorded. The central
deflection was corrected by allowing for settlement at the supports
recorded by the relevant dial gauges. Figures 9,13 to 9.15 show
the load/deflection curves for the" deep beams tested in Series A,
Band C.
(121) As pointed out by Ramakrishnan and Ananathanarayana
the geometry of deep beams ensures that little deflection occurs for
relatively high proportions of the ultimate load. Even so deflections
are observed almost from the onset of loading for beams of allL/D
ratios.
The percentage of ultimate load at which a significant reduction
in the stiffness of the beam is observed reduces with increasing
L/D and invariably corresponded to the point at which initial
/ . cracking occurred; only for the 250 mm deep beams (L/D .= 4) did
.cracking commence almost at the start of the loading,
The load/deflection curves of beams LA-4 and IB-l1,
which were provided with zero anchorage length, ~d, show how the
anchorage has no effect on the stiffness of the beam up to the
point at which diagonal cracking occurs, The load at which the
first flexural cracks were observed is apparent from Figure 9,13,
173
For beams of Series A it was marked by a rapid reduction in stiffness
and associated deflection, where permitted by adequate end anchorage,
In Series Band C (Figures 9,14, 9,15) where web reinforcement was
provided,the. beams were far more ductile and the reduction in
i . L/ st ffness not so ob~ous, For beams with D equal to 1 and 4/3 of
Series B,deflections were markedly less than those for comparable
loads with beams in Series A, In the case of beams with L/D equal
to 2 and 4 the presence of web reinforcement had little effect on
the. load/deflection curves,
L For each /D ratio the shape of the load/deflection graph
is similar, however it is curtailed where the anchorage provided is
not sufficient to ensure flexural failure, No evidence of this
effect is observable for beams with L/D equal to 4, For these, the
load/deflection curves show no distinct elastic range and the very
large deflections obtained are more typical of flexural failure than
the shear failures which were prevalent,
174
(121) Ramakrishnan and Ananathanarayana noted this flexure-shear
type of failure but in beams with lower L/D ratios (1,8 to 0,9),
In four of their beams even after the tensile steel had shown signs
of considerable yielding the secondary compression failure of the
compression zone was delayed and before the beams could fail in
~lexure suddenly diagonal cracks developed and caused the collapse
of the beam,
Series C (Figure 9,15) gave load/deflection curves of the
same form as the 'corresponding web reinforced beams in Series B,
although greater deflection was observed at corresponding loads than
with straight anchorages,
Although it was decided not to apply loads in cycles to
the beams because of the possible reduction this might have on the
ultimate bond strength of the anchorage, for beams lB-48, lB-49 and
O,75B-5l it was unavoidable because of the difficulties with the
hydraulic pump explained in Section 8,6, 'Figure 9,14 shows that
the residual deflection resulting from unloading was taken up and
the load/deflection curve extended with apparently no effect on the
ultimate failure load,'
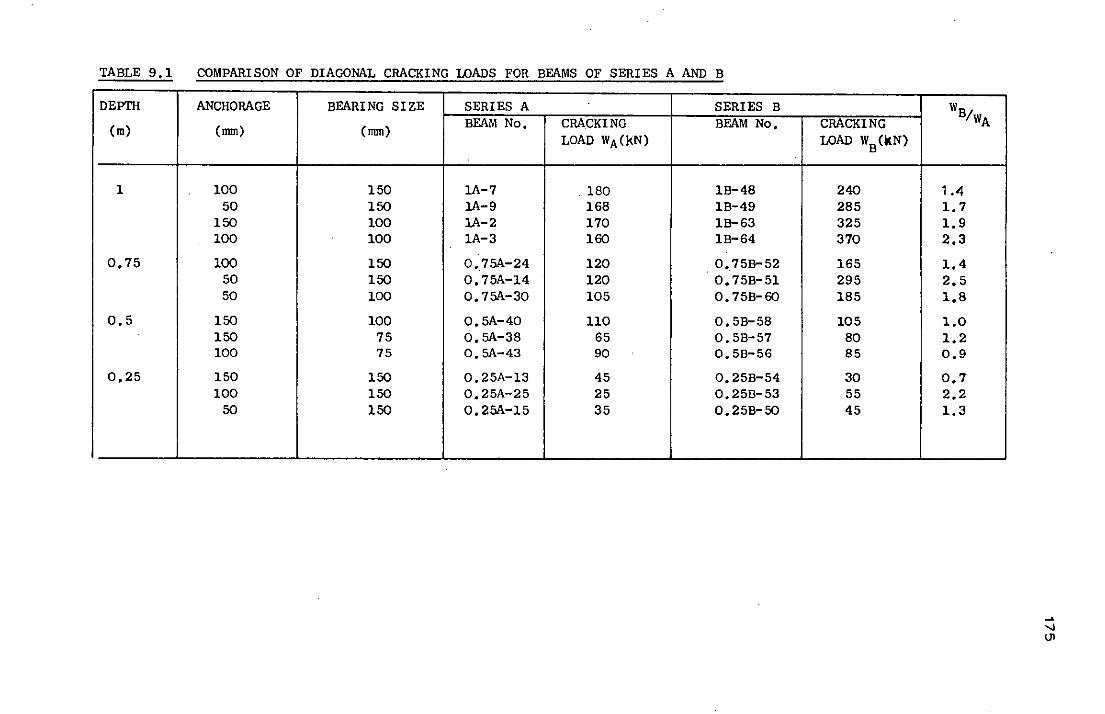
TABLE 9.1 COMPARISON OF DIAGONAL CRACKING LOADS FOR BEAMS OF SERIES A AND B
DEPTH ANCHORAGE BEARING SIZE SERIES A SERIES B BEAM No. CRACKING BEAM No. (m) (mm) (mm)
LOAD WA(kN)
1 100 150 lA-7 .180 1B-48 50 150 lA-9 168 1B-49
150 100 lA-2 170 1B-63 100 100 1A-3 160 1B-64
0.75 100 150 0.75A-24 120 0.75B-52 50 150 0.75A-14 120 0.75B-51 50 100 0.75A-30 105 0.75B-60
0.5 150 100 0.5A-40 110 0.5B-58 150 75 0.5A-38 65 0.5B-57 100 75 0.5A-43 90 0.5B-56
0.25 150 150 0.25A-13 45 0.25B-54 100 150 0 •. 25A-25 25 0.25B-53
50 150 0.25A-15 35 0.25B-50
CRACKING LOAD WB(kN)
240 285 325 370
165 295 185
105 80 85
30 55 45
W B/WA
1.4 1.7 1.9 2.3
1.4 2.5 1.8
1.0 1.2 0.9
0.7 2.2 1.3
I
,
~
'-I \J1
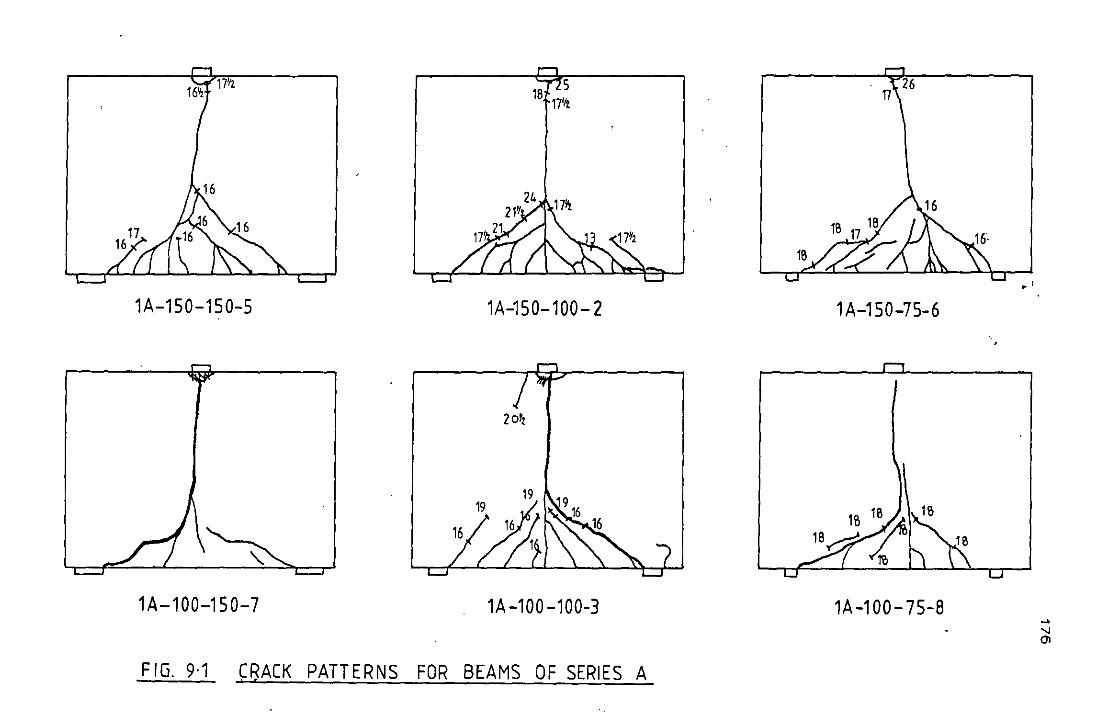
1A-1S0-1S0-S
1A-100-1S0-7
18t- L 5 17'ft
1A-1S0-100-2
20'1
1A-100-100-3
FIG. 9·1 CRACK PATTERNS FOR BEAMS OF SERIES A ! r
17- 26
18
1 A-1S0-7S-6
1A-100-7S-8
.'
~
'-J 01
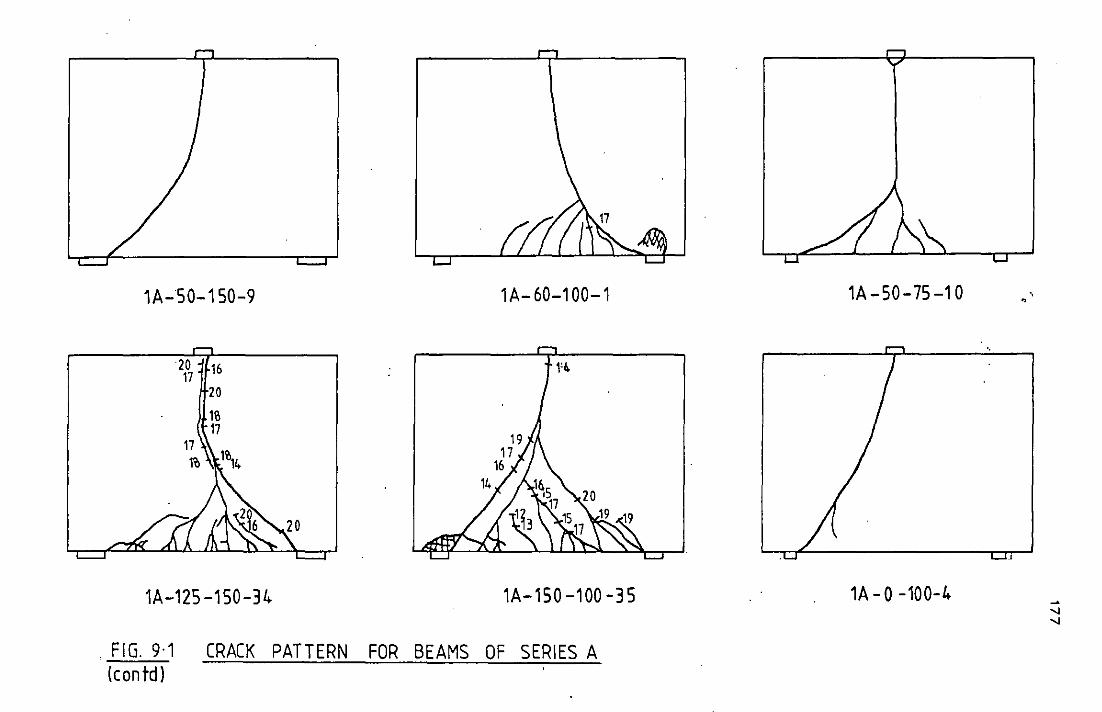
1A-SO-150-9
20 :I~16 17
20
1\\ 17
1A-12S-150-34
1A-60-100-1
1!~
1A-150 -100 -35
. FIG. 9·1 CRACK PATTERN FOR BEAMS OF SERIES A (contdl
1A-50-75-10
~
1A-0 -100-4
, •
-..J -..J
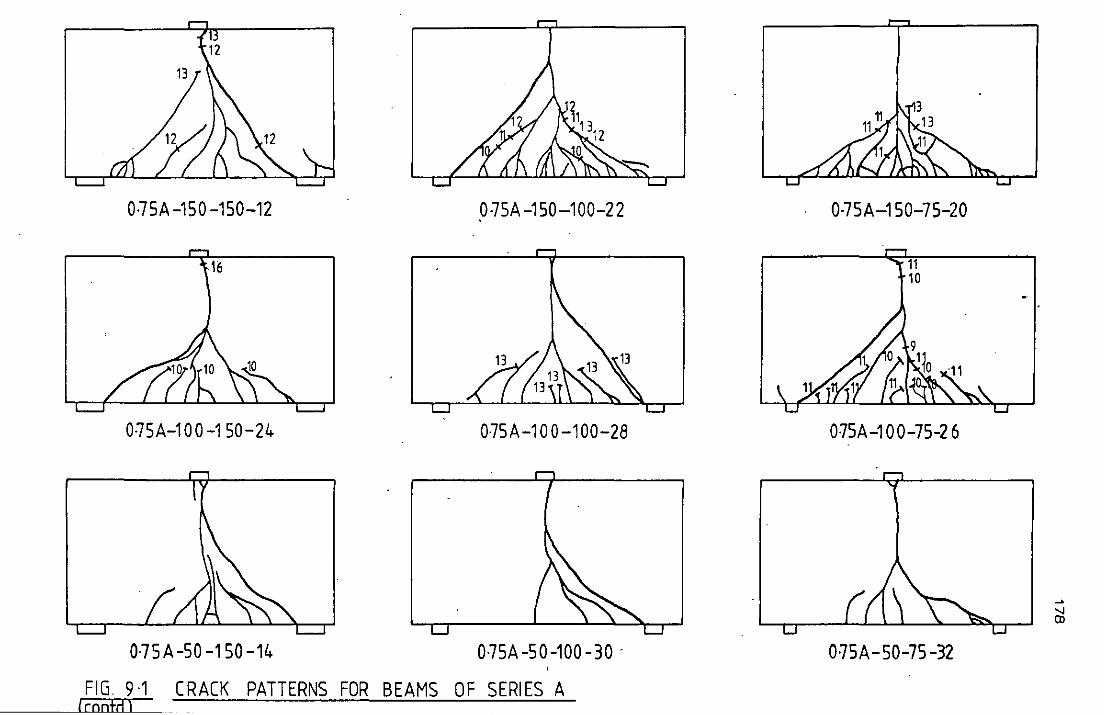
0·7SA -1S0 -150-12 0·7SA -1S0-100-22
0·7SA-100-1S0-24 07SA-100-100-2B
07SA-SO-1S0-14 0·75A-50-100-30·
FIG. 9·1 CRACK PATTERNS FOR BEAMS OF SERIES A I rnnfrll
0·75A-1S0-7S-20
11 10
075A-1 00-7S-2 6
07SA-SO-7S-32
~
Ol
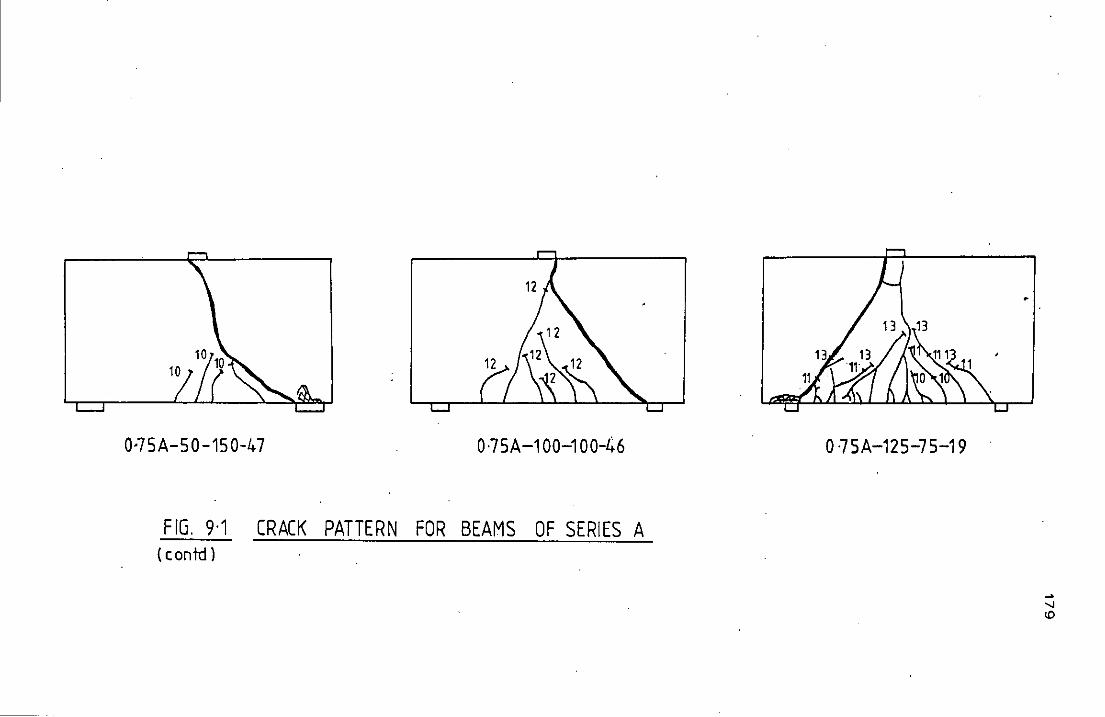
0-7SA-SO-1S0-47 0·7SA-1 00-1 00-46
FIG. 9·1 CRACK PATTERN FOR BEAMS OF SERIES A (contd )
•
o 75A-12S-7S-19
~
-.J ID
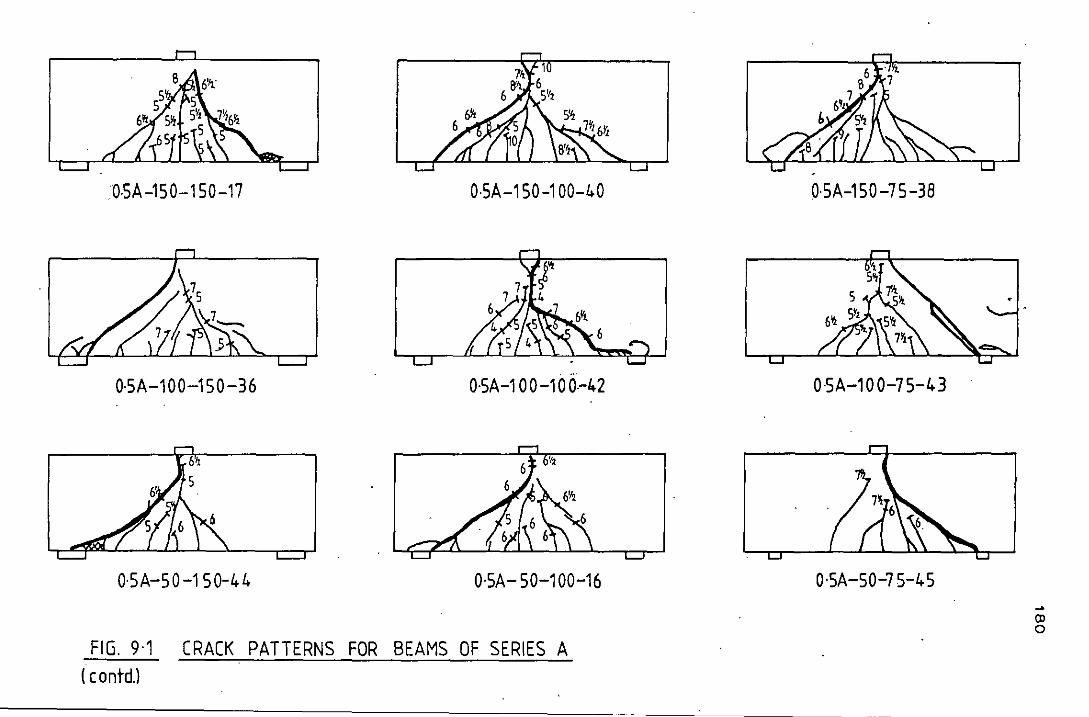
0·SA-1S0-1S0-17 0-SA-1S0-100-40 0-SA-1S0-7S-38
0·5A-100-150-36 0·SA-1 00-100·-42 0-5A-100-7S-43
0·SA-SO-1S0-44 0·5A- SO-1 00-16 0·SA-SO-75-45
-Ol o
FIG. 9·1 CRACK PATTERNS FOR BEAMS OF SERIES A ( C ontd.l
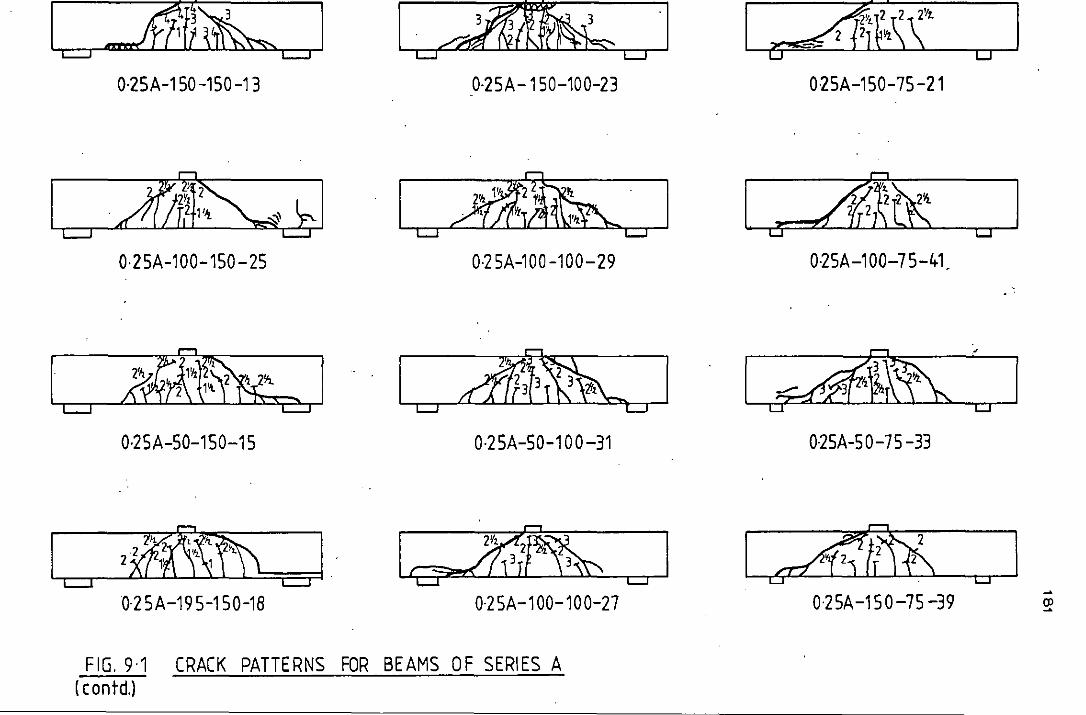
I c::J-:J11n~ I c::::J
·~···I LJ LJ
r: %S!11}~2~\\Vt I D
0·2SA-1S0-1S0-13 0·2SA-1S0-100-23 02SA-1S0-7S-21
" " "
12t2t4~c:b1 LJ
LJ~~· LJ
16 2&E~ I D
0·2SA-100-1S0- 2S 0·2 SA-100 -100-29 0·2SA-100-7S-41
,-, co ,-,
~ /flri\~~~Q LJ
I ;rm3~1 LJ I~RK I o
0·2SA-SO-1S0-1S 0·2 SA-SO-1 00-31 0-2SA-SO-7S -33
,-, ,......, 1"""0
I 2kr~- I LJ c::::J
lea J1;l~--LJ I [~tr1f\ u I 0·2 SA-19 5-1S0-18 0·2 SA-1 00-100-27 0·2SA-1S0-7S-39 -OJ -
FIG. 9·1 CRACK PATTERNS FOR BEAMS OF SERIES A (c ontd.)
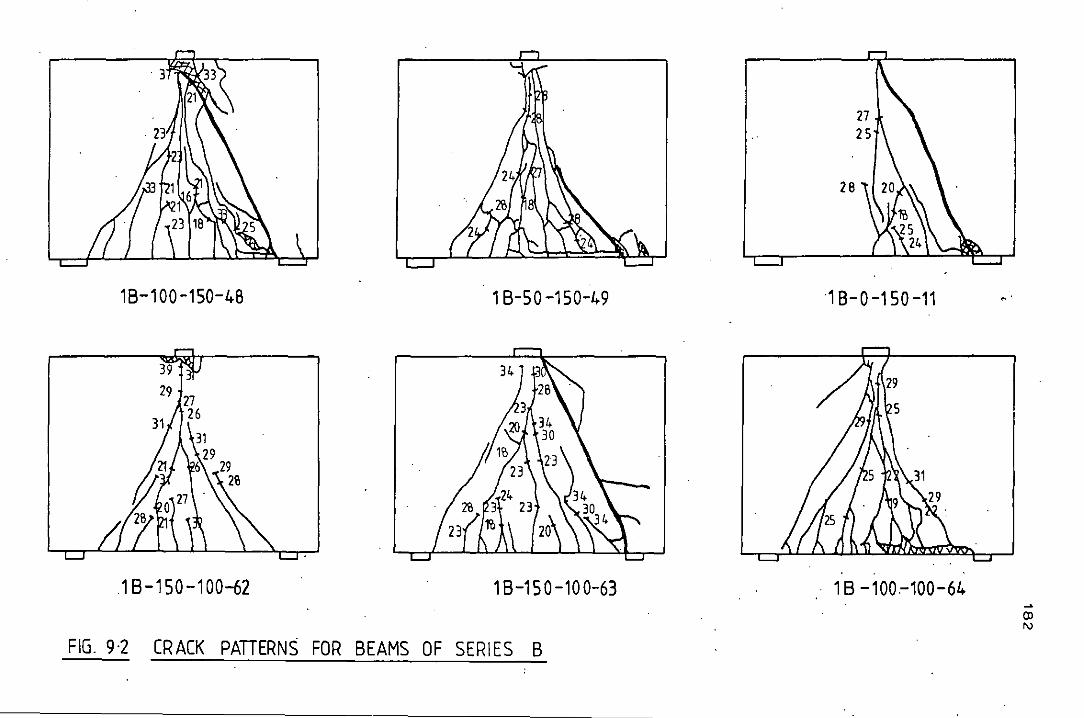
18-100-150-48 18-50-150-49
18-150-100-62 18-150-100-63
FIG. 9·2 CRACK PATIERNS FOR BEAMS OF SERIES B
26
18-0-150-11
1 B -100-100-64
"
~
(l) I\)
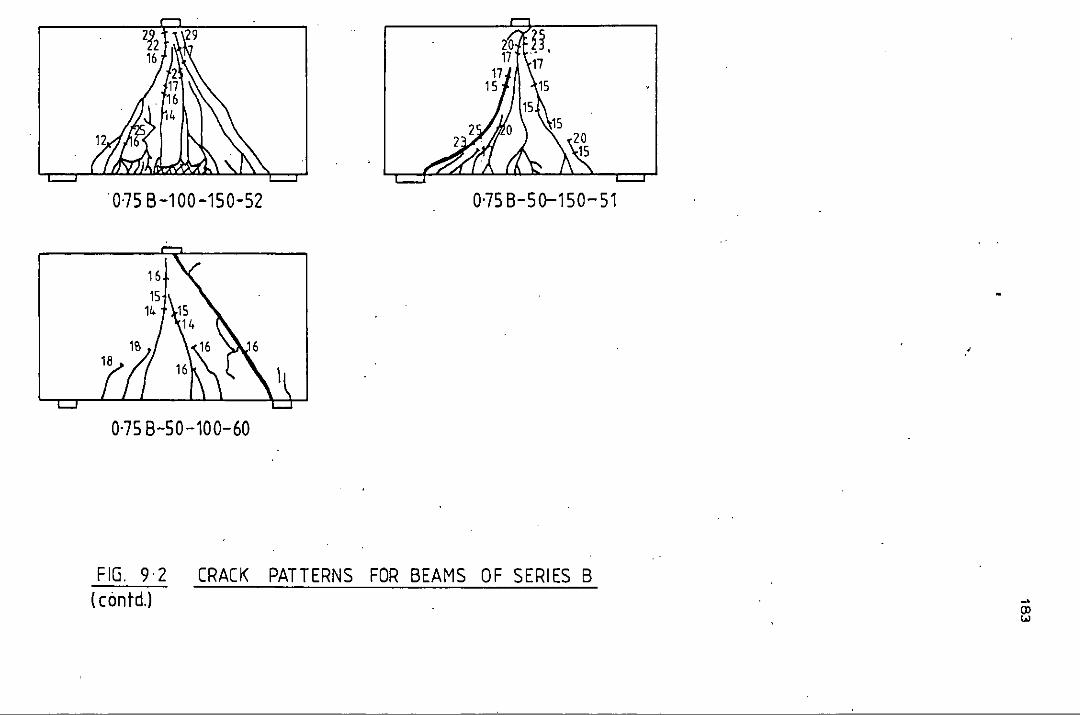
0-75 B-100-150-52 0'75B-50-150-51
0-758-50-100-60
FIG. 9·2 ( contd.l
CRACK PATTERNS FOR BEAMS OF SERIES B ~
(J) lA>
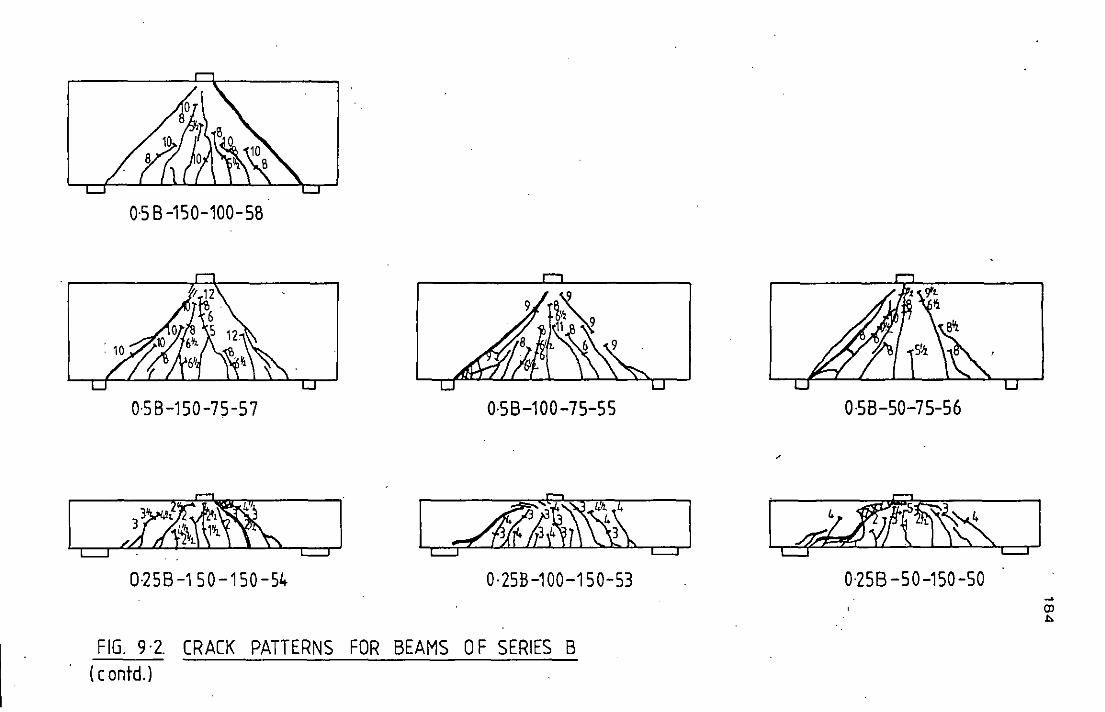
0'58-150-100-58
0'5B-150-75-57 0-58-100-75-55
.--. r-o
[/~~J l-~~mr l ~ c::::J
0·258-150-150-54 O· 25B-1 00-1 SO-53
FIG. 9·2. CRACK PATTERNS FOR BEAMS 0 F SERIES B (( ontd.)
0·5B-50-75-56
,
~
I ~f!l\~-l L...J t=J
0·258 -50-150-50 ~
Ol t.
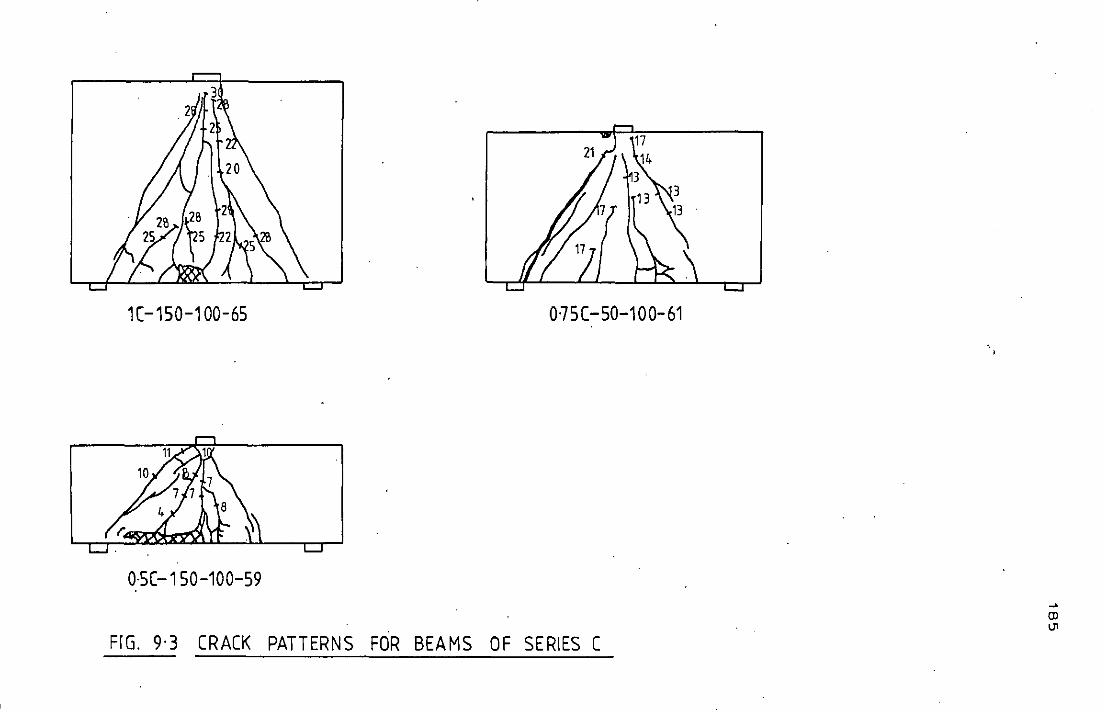
1C -150-100-65 075C -50-100-61
0·5C -150-100-59
FrG. 9·3 CRACK PATTERNS FOR BEAMS OF SERIES C
~
Cl IJ1
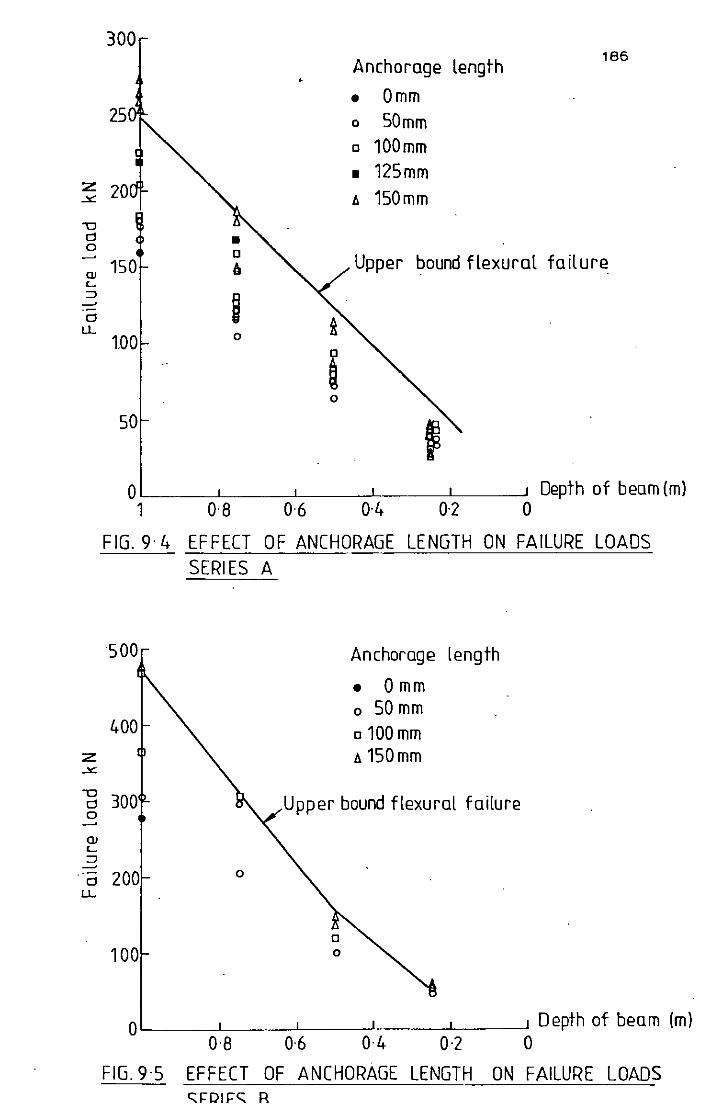
z x
\:J d 0
QJ '-::::J ~
d LL
z -'C
\:J d 0 ~
QJ '-::::J ~
d LL
300
• Anchorage length
166
• Omm 25 0 50mm
o 100mm
• 125mm 20 A 150mm
150 Upper bound flexural failure
~ 100 0
0
& 0
50
0'-------,-'------,--'----:-'-:----=-':-----:' Depth of beam (m) 1 0-8 0-6 0-4 0-2 0
FIG.9-4 EFFECT OF ANCHORAGE LENGTH ON FAILURE LOADS SERIES A
500 Anchorage length
• o mm o 50 mm
400 o 100mm A 150mm
300 Upper bound flexural failure
200 0
100 o
o L--__ .l-__ -'---__ -'-__ -'-__ --' Depth of beam (m) 0-8 0-6 0-4 0·2 0
FIG_ 9-5 EFFECT OF ANCHORAGE LENGTH ON FAILURE LOADS
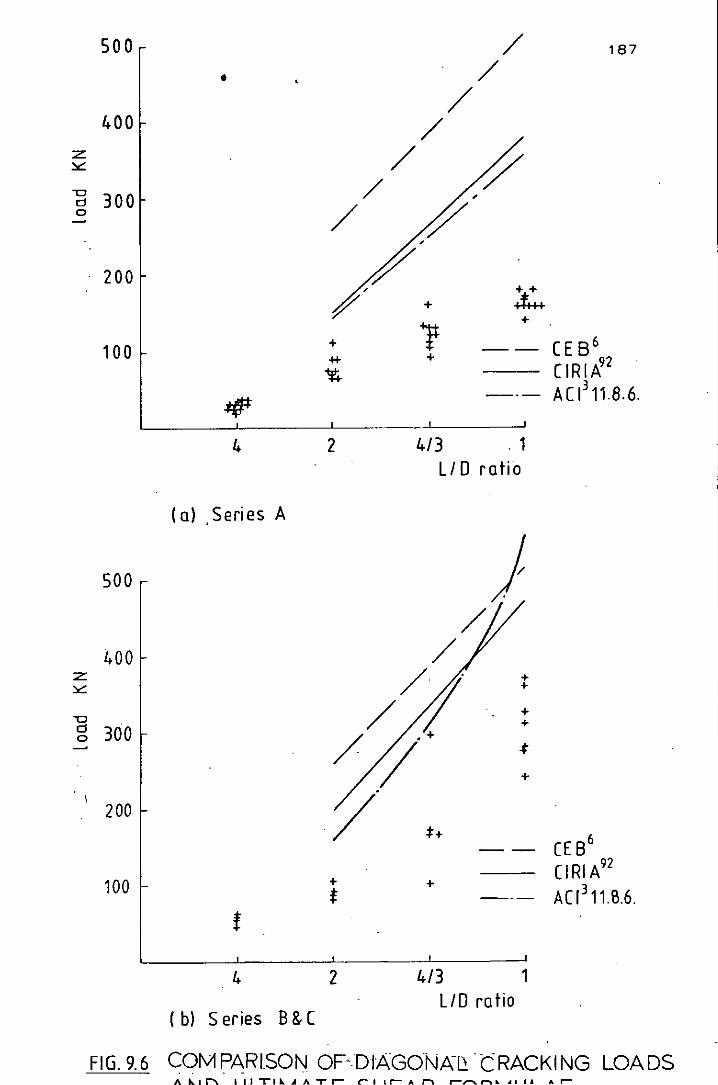
500 / 187
• / /
400 / :z / ~ ~
/ "0 300
, d
/ ~ 0
,
200 ~ , :k ~ +
1 +
100 + -- CES 6 +I- +
C IR 1,At2 l!i. 3
~ --- ACI 11.8.6.
4 2 4/3 . 1 LI D ratio
(0) .Series A
500 ) /
400 / :z /</ + :x:: +
+ "0 + d 300 0
/ ~.+ -t
+
200 ~ :t+ (E 86 --CIRIA92
100 + + AC 1311.8.6. f ---
4 2 4/3 1 LID ratio
(b) Series B & C
FIG.9.6 COMPARISON OFDIAGONA1! -CRACKING LOADS ITI ... ..tATr- rllr--At""\ r--,......I"""\ ..... III. Ar--
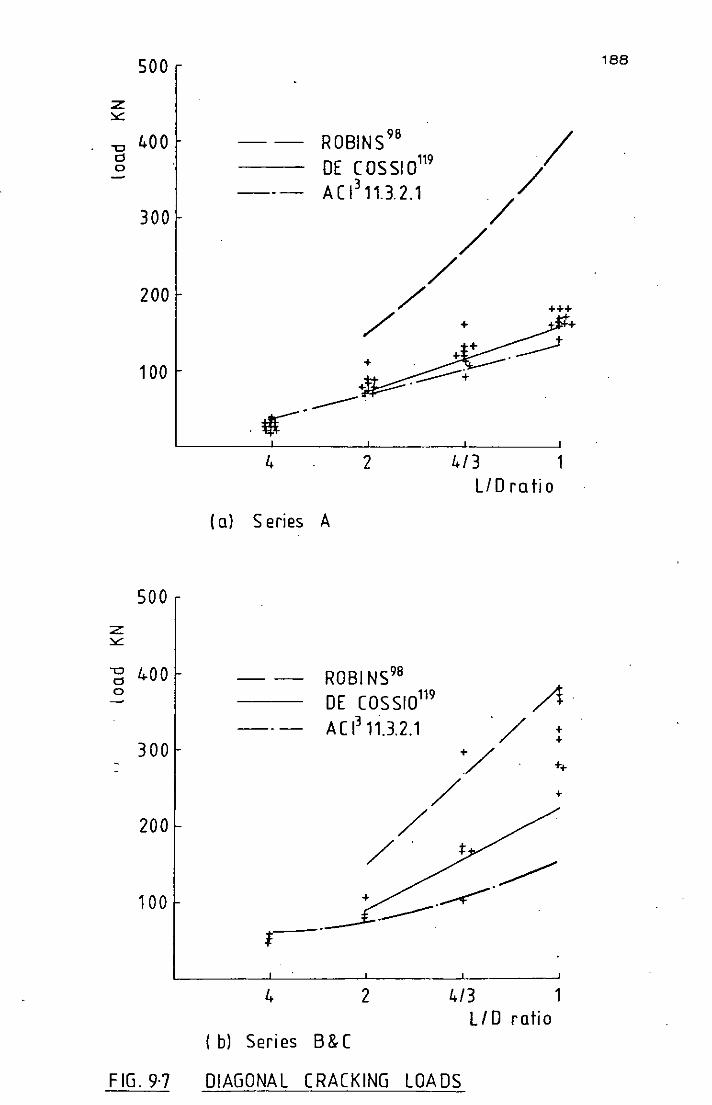
500
"'[J 400 d o
300
200
100
ROBINS 9B
DE (OSS10119
3 ACI 11.3.2.1
/
/ /
/
/ /
/ + -- .
. .---4 2
(a) Series A
4 2
(b) Seri es B & (
+
4/3 1 LlDratio
4/3 1 LID ratio
FIG. 9·7 DIAGONAL CRACKING LOADS
188
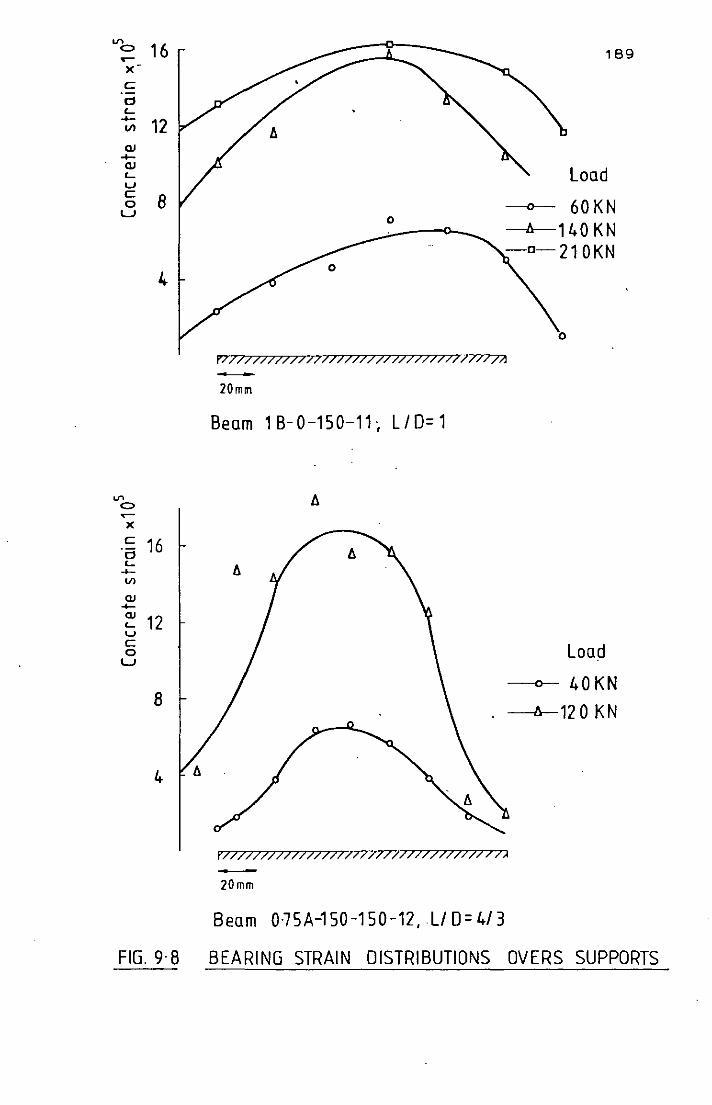
V'>
16 0 189 ..-x c 0 '-.....
12 VI
QJ ..... QJ
Load '-u c 8 0 ~ 60KN LJ
0 ---A----1 40 K N -0-210KN
4
P77777777777777777777)77/777777177l7~ -20mlll
Beam 1B-0-150-11; LlD=1
V'> I:J. 0 ..-x c 16 -0 '-..... VI
QJ ..... QJ
12 '-u c
Load 0 LJ
-0- 40KN 8
--b-120 KN
4
P771117177717777177777777777777777777A -20mm
Beam 0-75A-150-150-12,LlD=4/3
FIG_ 9-8 BEARING STRAIN DISTRIBUTIONS OVERS SUPPORTS
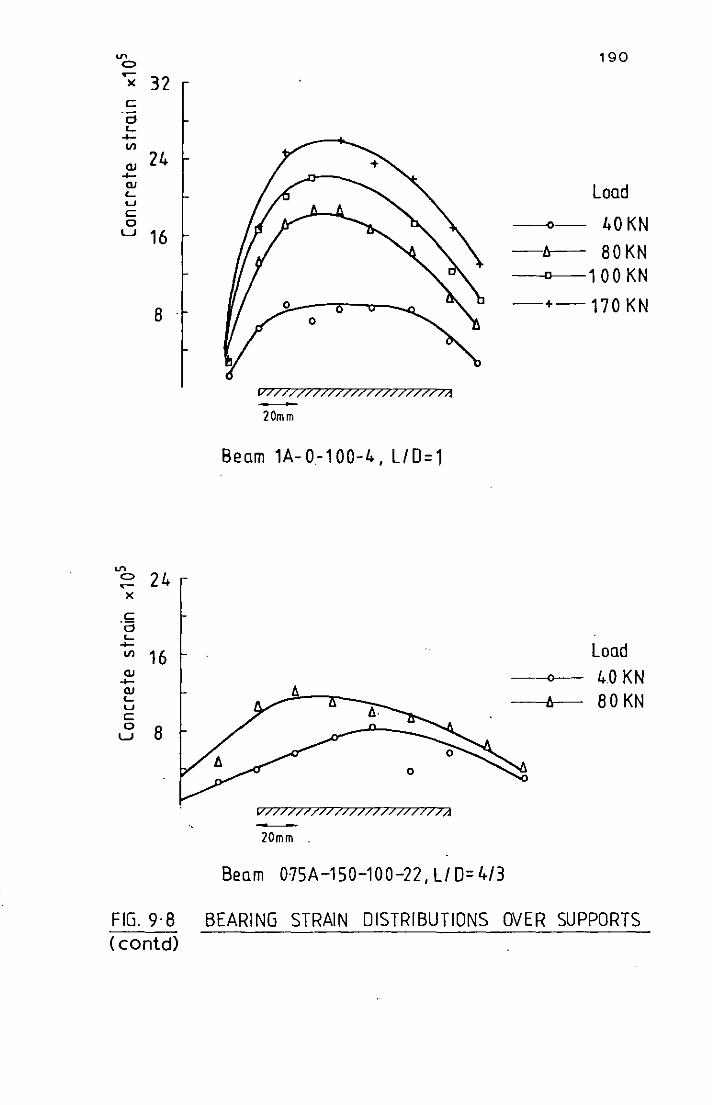
'" 190 C> ..-
32 )(
c -a '-+-VI
QJ 24 +-QJ
Load '-w C 0 --0-- 40 KN
LJ 16 -tr-- 80 KN ---n--100KN
8 -+-170KN
v777777J7777777777777?7~ -20mm
Beam 1A- 0-1 00-4, LfD=1
'" C> 24 ..-)(
c -a '-+- Load VI 16 QJ
~ 40 KN +-QJ
80 KN '- -----b--w c 0 8 LJ
v77777777777777777777777A -20mm
Beam 0-75A-150-100-22, LfD=4/3
FIG_ 9-8 BEARING STRAIN DISTRIBUTIONS OVER SUPPORTS (contd)
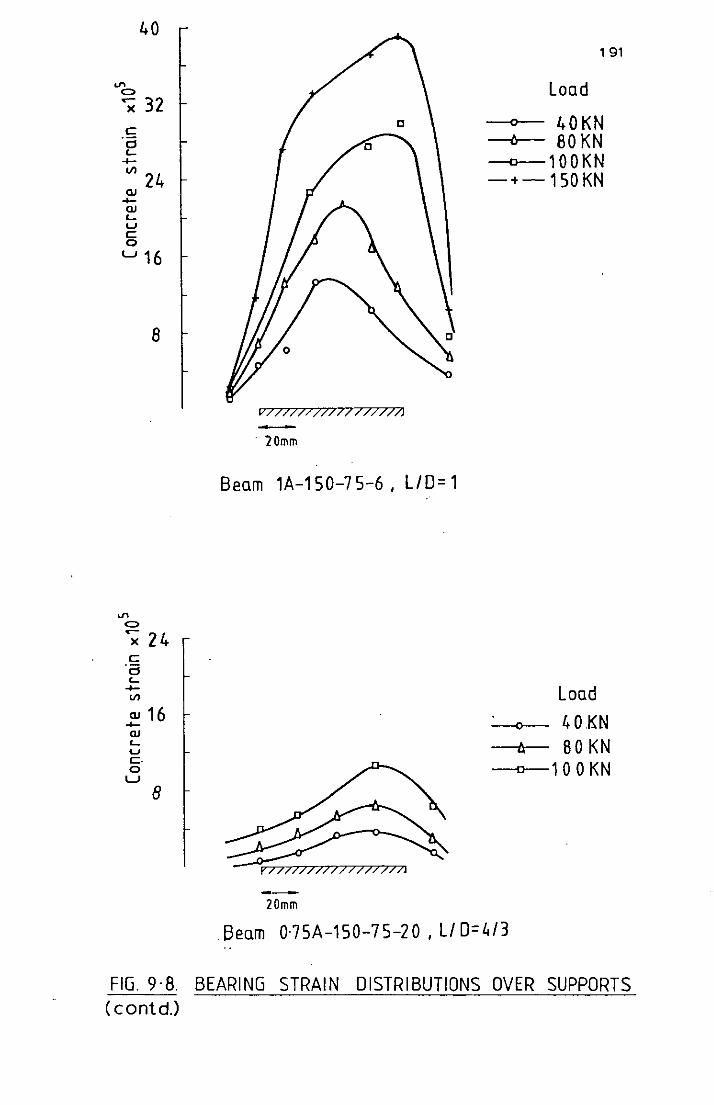
'" =
40
X 32 c ·a (...
4-
Vl 24 QJ 4-QJ (...
w C o
L.J 16
'" =
8
or; 2 4 c ·a (...
4-Vl
QJ 16 4-QJ (...
w c· o
L.J
8
v77777777717777~ -. 20mm
Beam 1A-1S0-7S-6. L1D=1
20mm
191
Load
o 40KN ---/r-- 80 K N ---o-100KN -+-1S0KN
Load
~ 40.KN A 80 KN
--0-100 KN
Beam 0·7SA-1S0-7S-20. LI D=~/3
FIG. 9·8. BEARING STRAIN DISTRIBUTIONS OVER SUPPORTS (contd.)
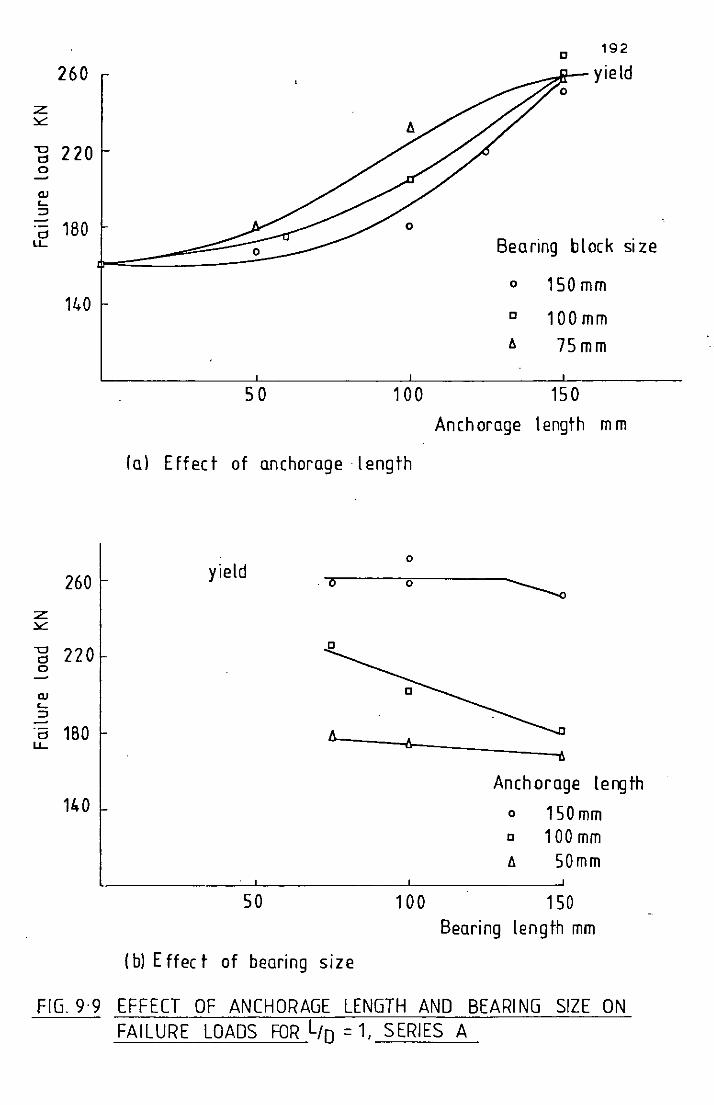
260
-g 220 o
Cl)
'::J
cl 180
D 192
-'""'~- Y i e Id o
LL J-=::::~5- Bearing block si ze
140
260
:z ~
-a 220 cl 0
Cl)
'-::J
·a 180 LL
140
FIG.9·9
50 100
(a) Effect of anchorage -length
0
yield - 0 0
/:;
SO 100
(b) Effect of bearing size
o 1 SO mm
D 100 mm
6 75 mm
150
Anchorage length m m
~
-fl
Anchorage length
0 150 mm D 100 mm tJ. SOmm
150 Bearing length mm
EFFECT OF ANCHORAGE LENGTH AND BEARING SIZE ON FAILURE LOADS FOR LID = 1, SERIES A
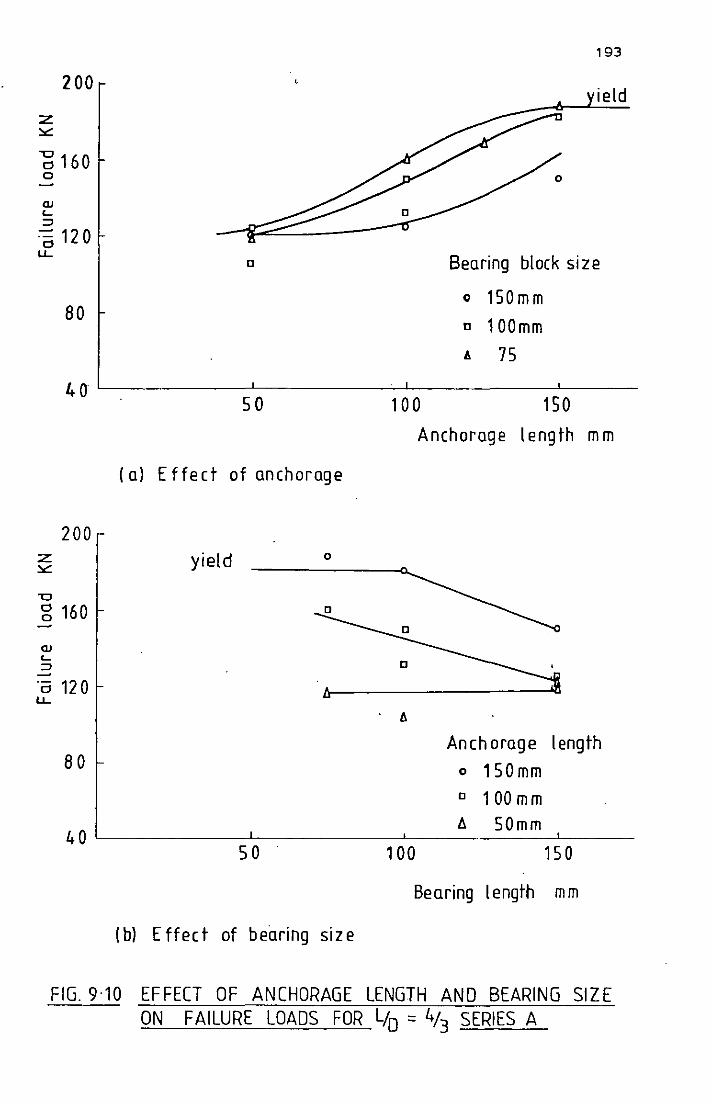
193
200 ield
z ~
~ 160 0
QJ '-::::>
== 120 '=' LL 0 Bearing block si z e
o 150mm 80
o 100mm
A 75 40 L-________ ~ ________ ~_L __________ ~ __ __
50 100 150
200
"0
g 160
QJ '::::>
·0 120 LL
80
(a) Effect of anchorage
yield o
Anchorage length mm
A
Anchorage length 0 150mm 0 100 mm f1 50mm
40L---------~----------~----------~----50 100 150
Bearing length mm
(b) Effect of bearing size
FIG. 9·10 EFFECT OF ANCHORAGE LENGTH AND BEARING SIZE ON FAILURE LOADS FOR LID = 4/3 SERIES A
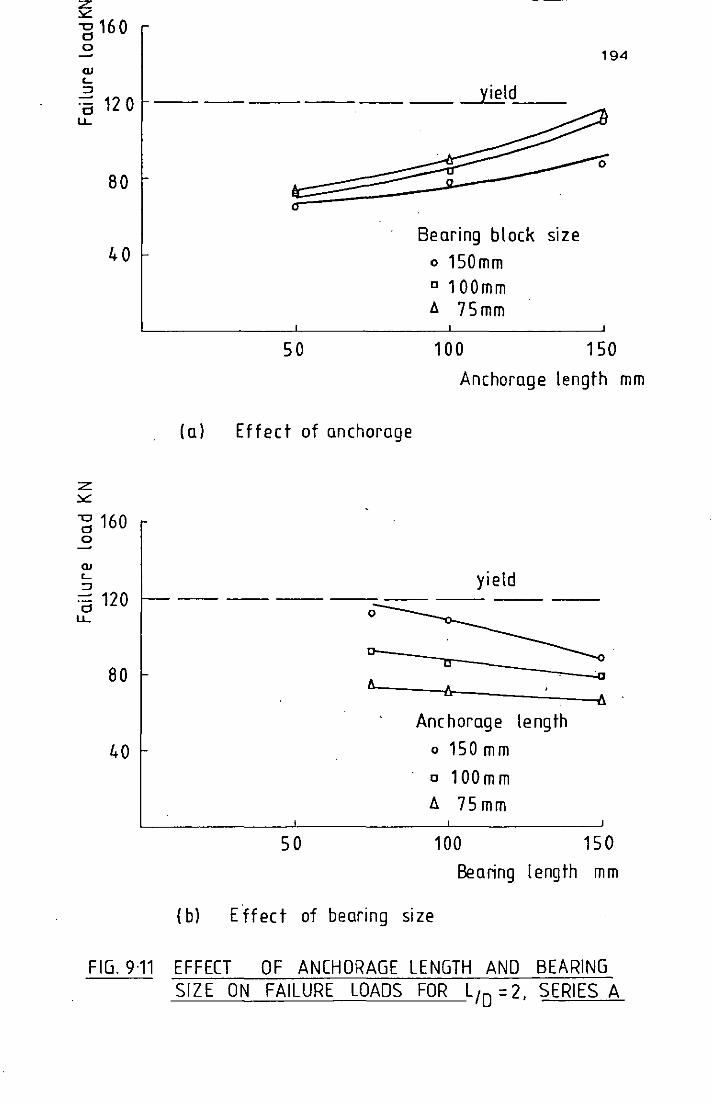
Z :I<: "0160 d o -QI <~
-a 120 1.L
80
40
z :I<:
"0 160 d 0
QI <-~
:::: 120 d
1.L
80
40
FIG. 9·11
194
y i e Id:.....-_
~ ,----0
~ Bearing block size
o 150mm c 100mm II 75mm
50 100 150
Anchorage length mm
(a) Effect of anchorage
yield --
0
0-
t-ea
6 tJ.
Anchorage length
o 150 mm
c 100 m m /::,. 75mm
50 100 150
Bearing length mm
( b) Effect of bearing size
EFFECT OF ANCHORAGE LENGTH AND BEARING SIZE ON FAILURE LOADS FOR LID =2. SERIES A
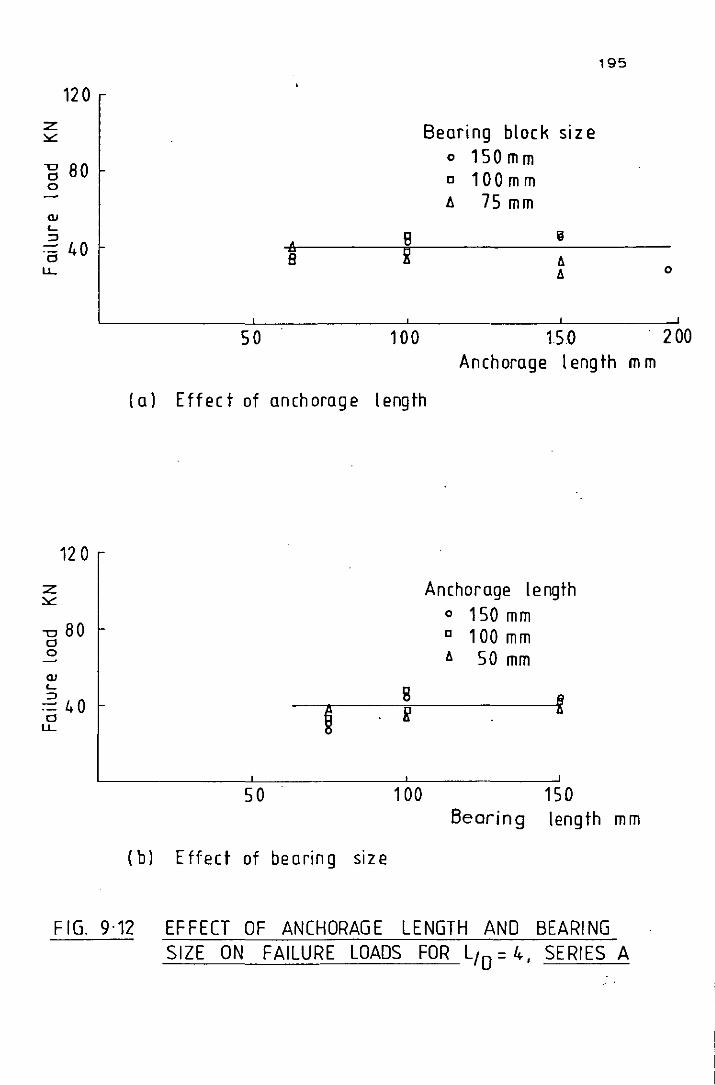
120
is 80 o
QJ L.. :::> :a 40
u..
120
"'Cl 80 d o
QJ L.. :::>
:= 40 d
u..
8
so 100
Bearing block size o 150 m m o 100mm /:, 75 mm
t. t.
150
195
Anchorage length mm
(a) Effect of anchorage length
B
50 100
(b) Effect of bearing SIZe
Anchorage length o 150 mm D 100 mm t. SO mm
150 Bearing length mm
FIG. 9·12 EFFECT OF ANCHORAGE LENGTH AND BEARING SIZE ON FAILURE LOADS FOR LID = 4, SERIES A
o
200
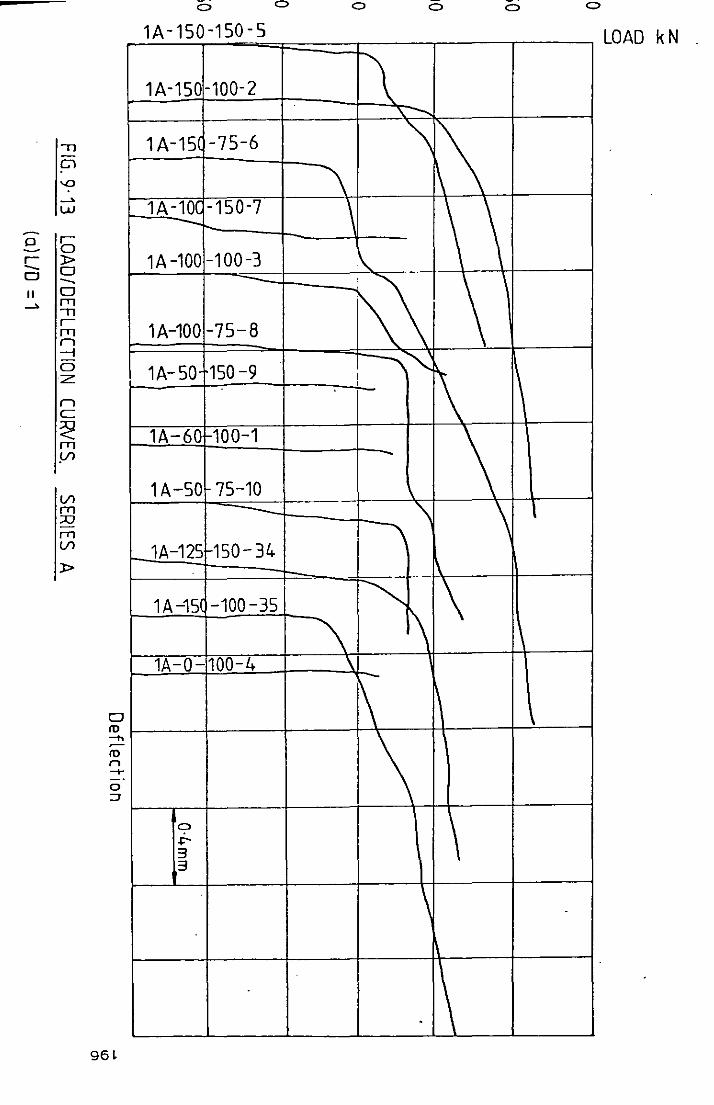
-n Cl
-a ~
W
p r 0
r -- ~ Cl 0 --11 0 ~ I"Tl
-n r I"Tl n -i 0 Z
n c ~ I"Tl Yl
VI I"Tl ;;0
I"Tl VI
~
o It) -h
It) n ..... o J
g6~
o C>
1A-150-150-S
1A-1S0 -100- 2
1A-1S -75-6
1 A -10( -150-7 --1A-100 -100-3
1A-100 -75-8
1A-SO- 150 -9
1A-60 !--100-1
1A-SO 75-10
1A-125 150- 34
1 A -15( -100-35
1A-0-100-4
0
.... 3 3
C> C> C> C>
LOAD kN
\ ~
'\ ~ '\ \ \\ I, r\\ \'
0
\ \
\ \ \
~ \ \ 1\
" -1\ \
\
. \
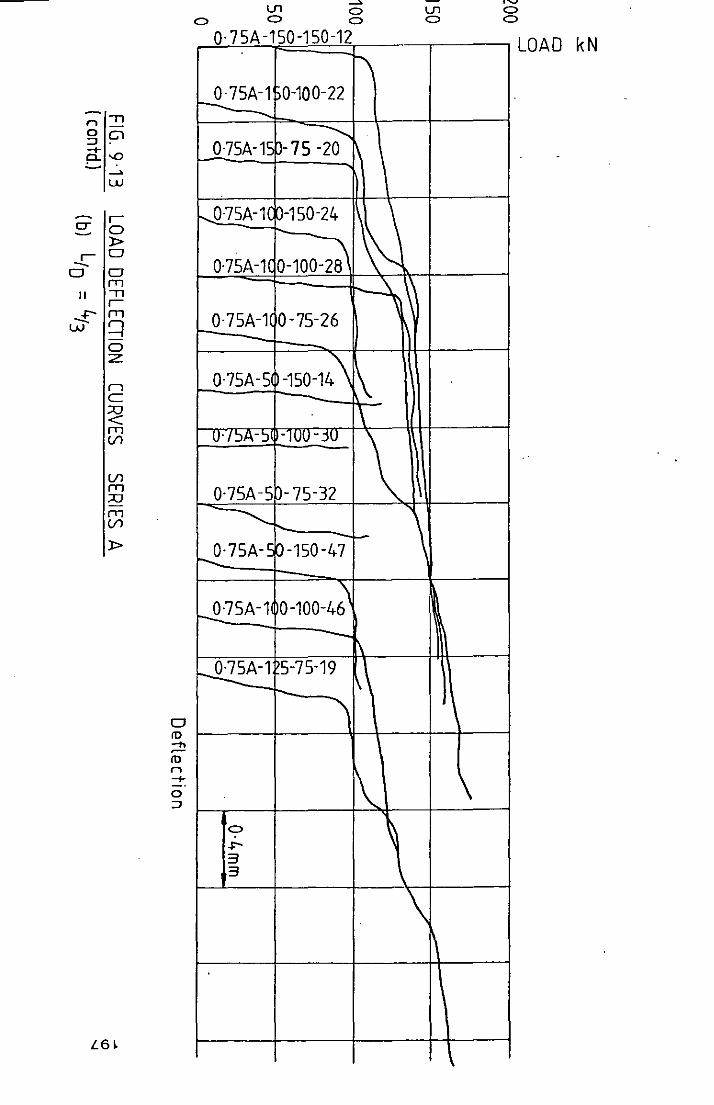
n" eel ::J. e..o
-" w
er IS l>
,0 --o 0 rn
11 " , +-- rn
.;;- Cl C)
z
n C
~ rn (/l
(/l rn ;;0
rn (/l
l>
L6L
o ID -h ~
ID n -+-e ::J
-" LTl 0
o 0 0
O· 7 5A -150 -150-12
"\ O· 75A-1 r--:.. 0-100-22
...... --..., 0-75A-1: D-75 -20
,.......0-75A-1C 0-150-24
~ 0·75A-1C \
0-100-28
0·75A-1 0-75-26 ~
O·75A-5 -150-14\ ,\ U·/~A-jI -lU\! . ."JU
\ 0·75A-5 )-75-32
---------~·75A-: 0-150-47
\ 0·75A-1 r--: 0-100-46
- \ ~A-1 5-75-19 \
"\
\ C> ~ ...... 3 3
\
-"
LTl C>
\
\
\
"-J o C>
LOAD kN
I
!
i
,
I I
I
i
I
,
,
I
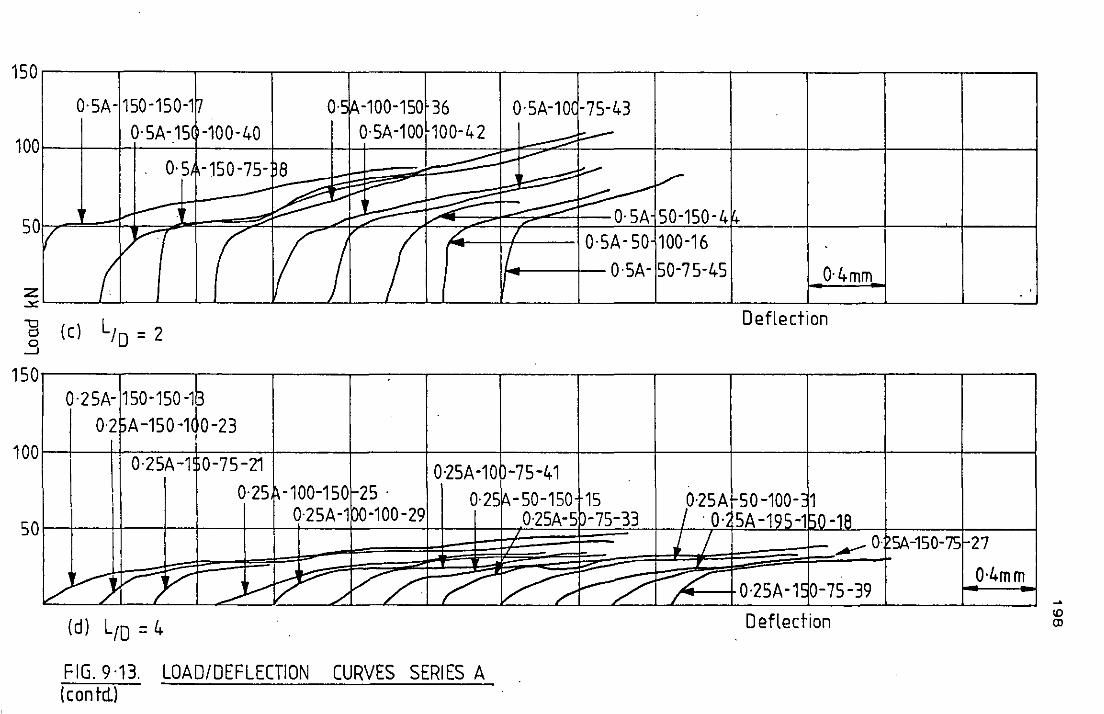
150
100
50
z ~
0'5A-
I1
(
150-150-1 0'5A-15
. O· 5,
v ~ V-
15 {cl LID = 2 3
~ 0·5 ~-100-150 -100-40 0'5A-100
-150-75- 8 -~r-~
--= ----
::.--
I 1(1 (
36 0'5A-10( -75-43 100-42 -
I -::: f- -- .... V-..- k::::.--" ---=:::-- ,
0·5A 50-150-4 ~ L / 0'5A- 50 100-16
I 0'5A- 50-75-45 0'4mm
,
Deflection
150rl-----.-----,-----,----_.--~_,r_--_.------._----,_----._----._----._----_.----,
O' 2 5A-1150-150 -1~ 0'2~A -150 -1do-23
1001 I I! 0'25A-1~0-75-21 1 l 0'25A-100-75-41 0·25 -100-150 25 . 0-25 -50-150 15
0'25A-1 0-100-29 0'25A-5 -75-33 50 0 SA-150-7S 27 ..--
0·4mm
(d) LID = 4 Deflection
FIG. 9·13. LOAD/DEFLECTION CURVES SERIES A (con tel.)
~
ID CD
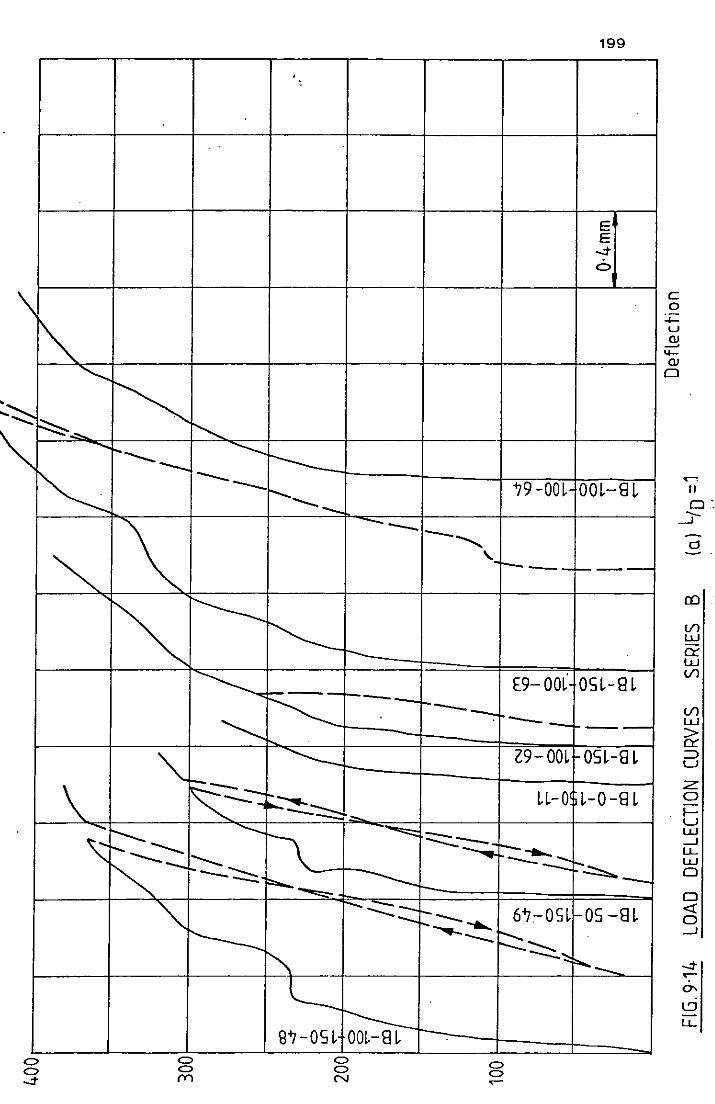
. ,
\
'" ~ ~ :..~ =:::::::::. -- '-....
~ '" f.. ___ --I---'--"
~ ----1"--__ '-\ --~
~ I----
i'---- r--
---- ~-1"---
'-......
'" ------\ ~-: ~~~ -~-- --1\ """'" \: ~- ---
o o ...:t
1-_""-.. -.....;;
"" I----
o o (Y)
r=---= -------..::::-0--
~ ~ ~ \3'7-0SL
C> C> N
199
E E
...:t 0
'79 -OOL OOL-8L
--....... '. r- __
f-_.-
E9-00L' OSL-8L 1--- --1---
Z9-00L I-OSL-8L
LL-O L-O -8 L
:::::::...-.~ ~~ t-~ f- '-~- 6'7:-0SL f-OS -8L ~ ...... t--. --.. r-:-:::::::::.-:: r=---_
c o
:;:: u ~ 4-QJ o
(/) w er: w (/)
(/) w
~ :=> Ll
:z: o lLl W ..J LL W o o <t o ..J
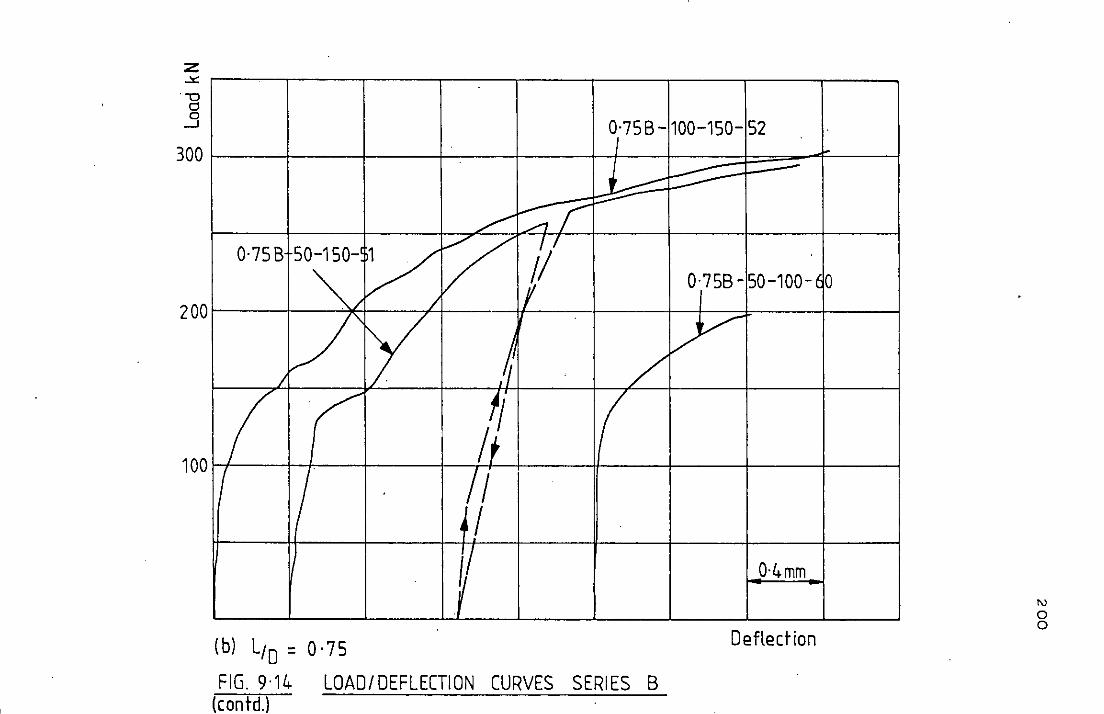
Z -'<:
. "'0 o o
....J
300
200
100
0'75B-1 00-150- 52 ... -
~ :...--1 ....-::
L ~L 0·75 B 5 0-150-
~ / l' 0'75B - 50-100- (0 1 ~ L
vV /' V / ~ /
'/ I L .~ /1 /1 1
I I
0'4mm
_J
(b) L/D = 0·75 Deflection
FIG. 9·14 LOAD/DEFLECTION CURVES SERIES B (contd.)
N o o
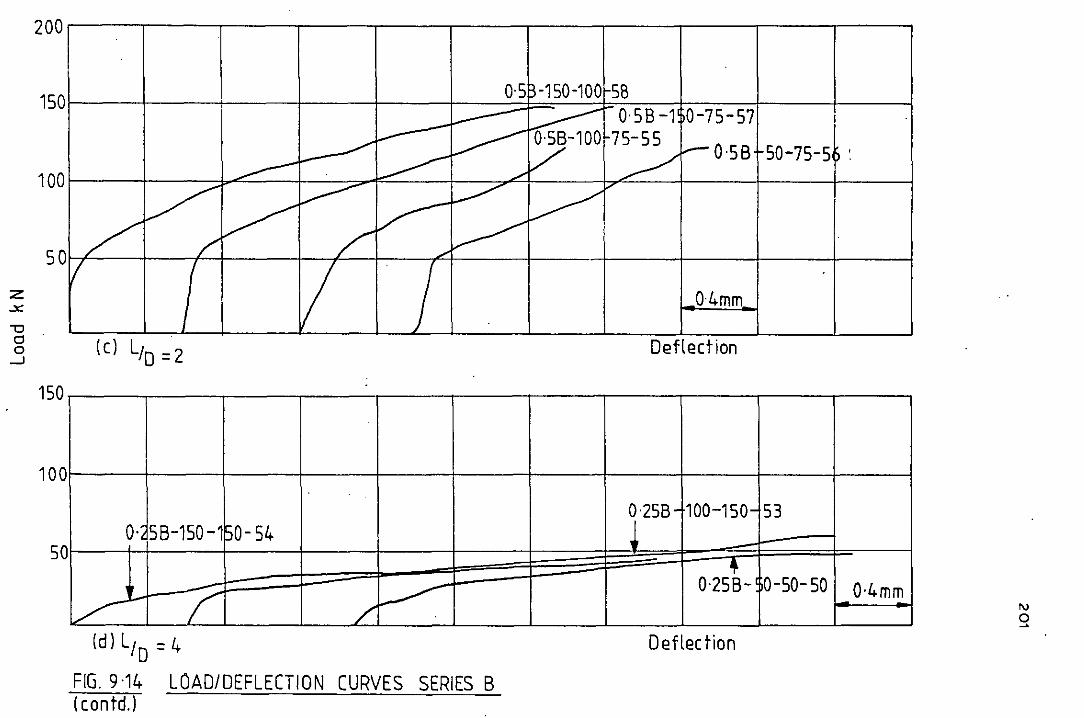
z oX
"'0 d o -l
200
150
100
0·5~-150-100 58 ~ 0'5B 1 0-75-57 ---V 0-5B-100 75-55 I- 0'5B r50-75-5t> :
~~ ~ -" r~ /1 ./'------ ~~/
.,,/ /~ L ..-.~ V j 04mm
50
(cl LID =2 Deflection
150
100
r5B 100 150 53 -- '--0·' 5B-150 -1 )0- 54
'l" 50
0-50- 50 0'25B-. ~""" / V ~I-
(dlL/D =4 Deflection
FIG.9·14 LOAD/DEFLECTION CURVES SERIES B ( contd.l
0'4mm I\)
o ~
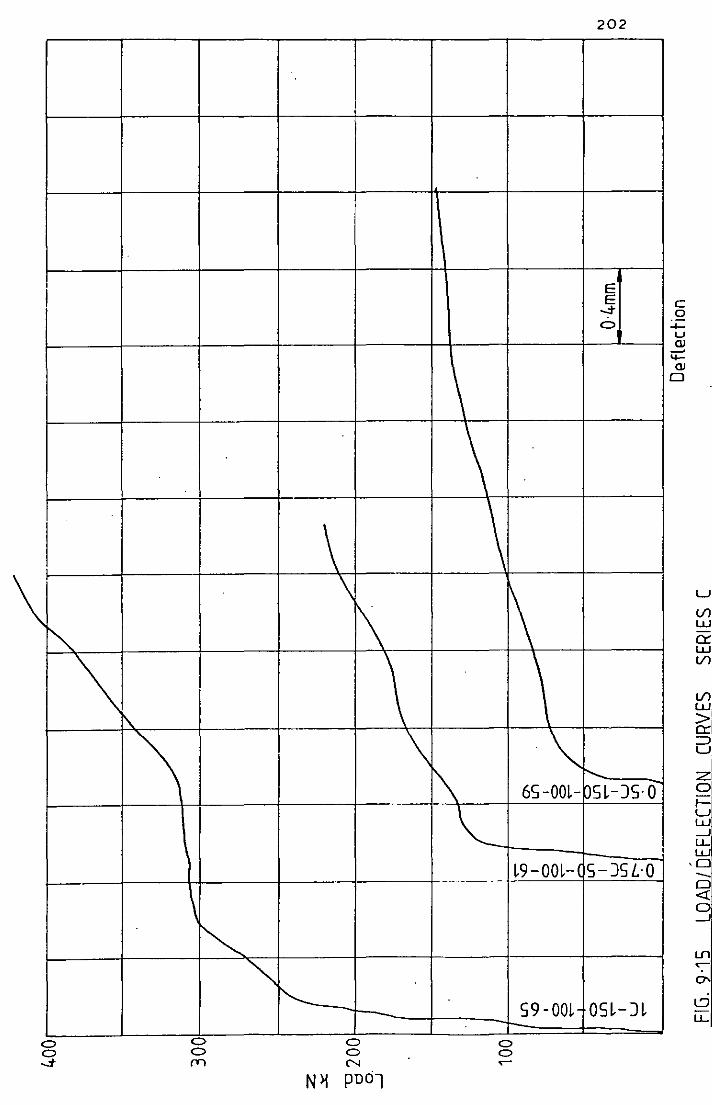
I
\ ~
C> C> -t
'\ I\.
'\
~
C> C> rn
\ \
1\ \
\ \
'" ~
\ \ \
1\ \
\
~ 1\ 6S -OOL-
\. L9-00H
S9 -OOL-
202
E E
..j-
C>
r--.. PSL-)S·O
S- )SL·O
OSL )L
c o +u Q)
~ Q)
o
u V1 w a:: w V1
V1 w > a:: :=J U
z o Iu W -1 LL W ,0 --o <l: o
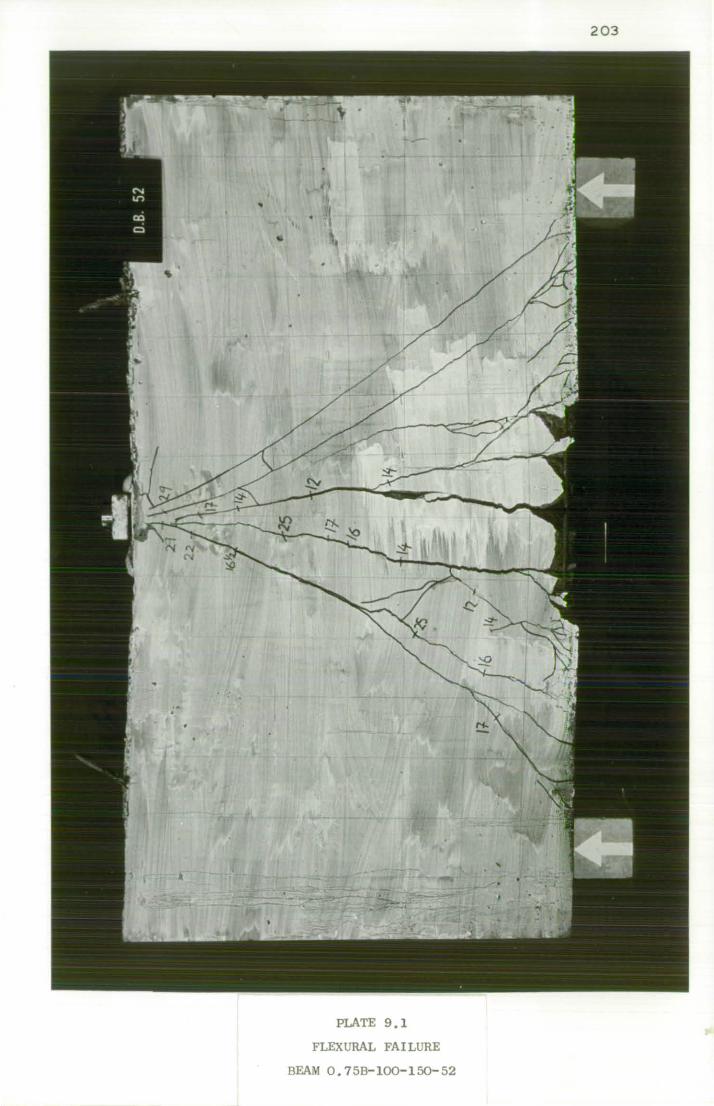
PLATE 9.1
FLEXURAL FAILURE
BEAM 0.75B-100-150-52
203
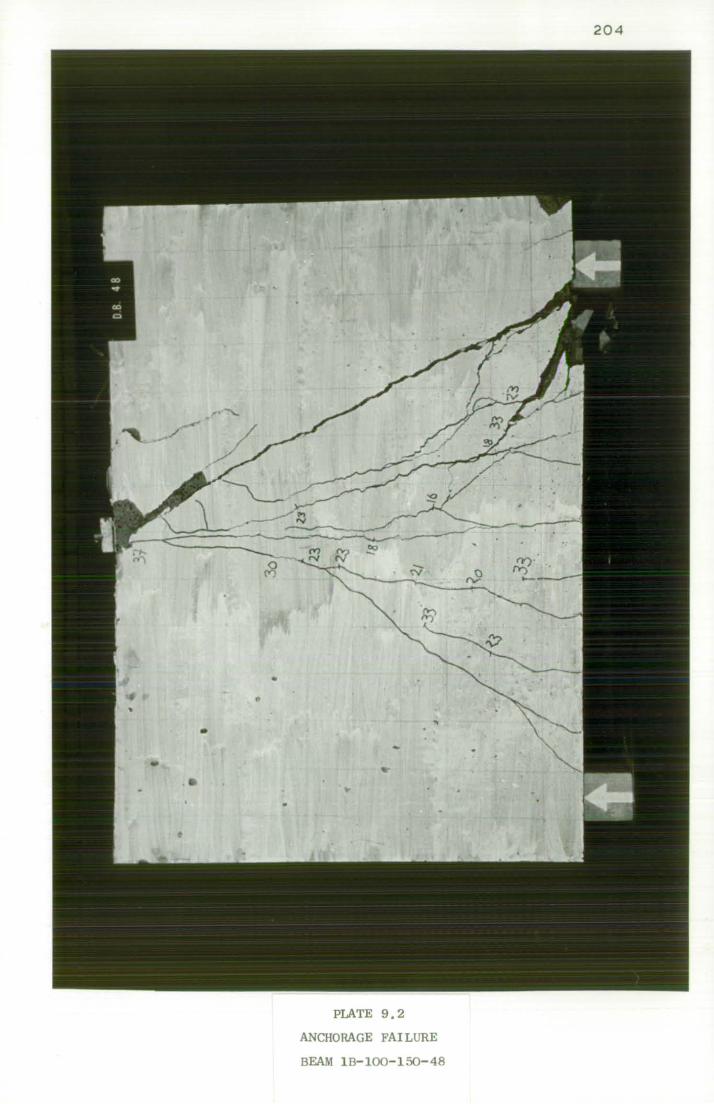
PLATE 9.2
ANCHORAGE FAILURE
BEAM IB-l00-I50-48
204
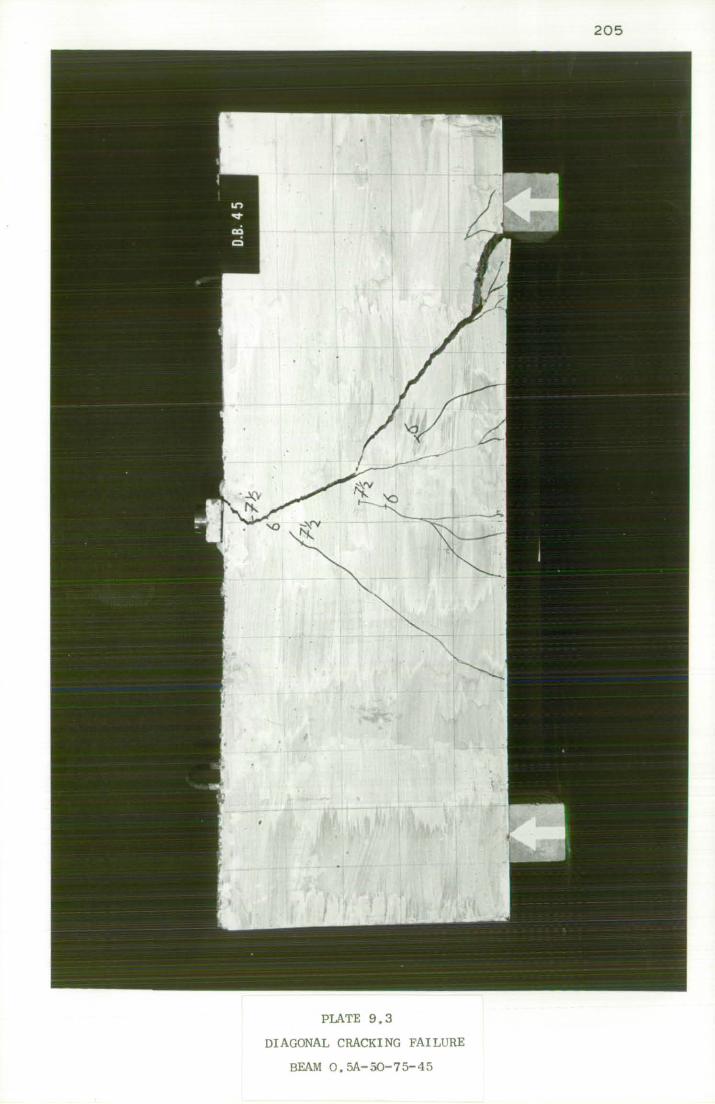
PlATE 9.3
DIAGONAL CRACKING FAILURE
BEAM O.5A-50-75-45
205

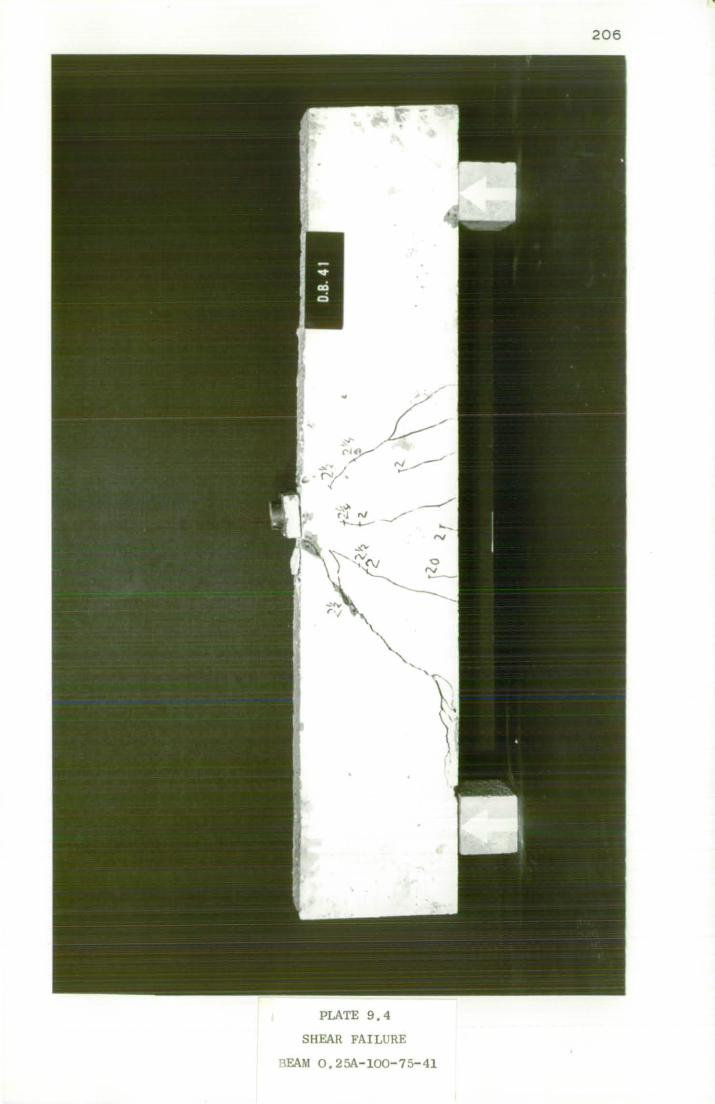
PLATE 9.4
SHEAR FAILURE
BEAM O.25A-lOO-75-41
206
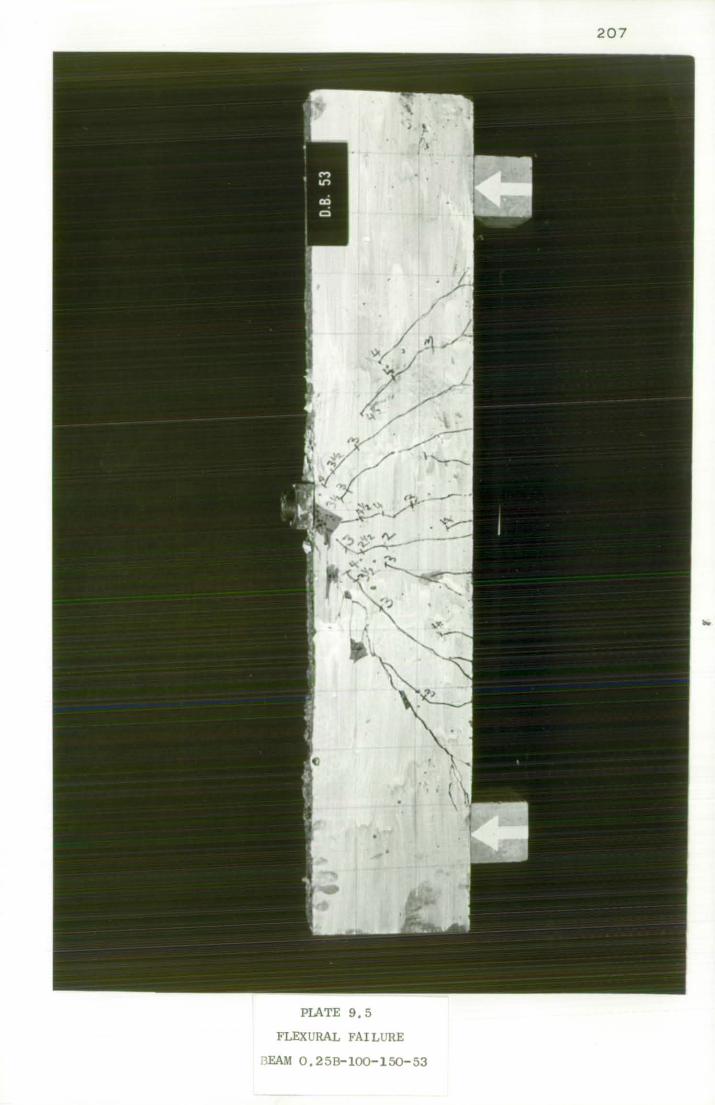
PIATE 9,5
FLEXURAL FAILURE
BEAM O,25B-1oo-150-53
207
..
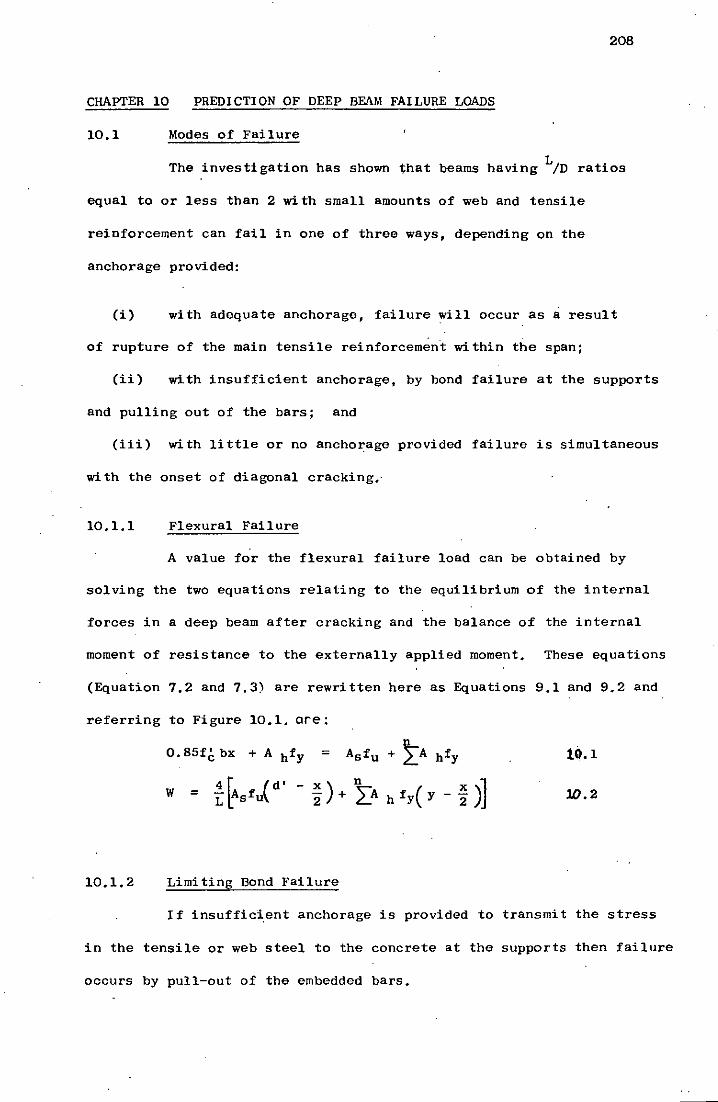
208
CHAPTER 10 PREDICTION OF DEEP BEAM FAILURE LOADS
10.1 Modes of Failure
The investigation has shown that beams having LID ratios
equal to or less than 2 with small amounts of web and tensile
reinforcement can fail in one of three ways, depending on the
anchorage provided:
(i) with adequate anchorage, failure will occur as a result
of rupture of the main tensile reinforcem~n't within the span;
(ii) with insufficient anchorage, by bond failure at the supports
and pulling out of the bars; and
(iii) with little or no anchorage provided failure is simultaneous
wi th the onset of diagonal cracking.'
10.1.1 Flexural Failure
A value for the flexural failure load can be obtained by
solving the two equations relating to the equilibrium of the internal
forces in a deep beam after cracking and the balance of the internal
moment of resistance to the externally applied moment. These equations
(Equation 7.2 and 7.3) are rewritten here as Equations 9.1 and 9.2 and
referring to Figure 10.1. are:
O. 85f~ bx + A hfy = Asfu + ~A hfy
w = 10.2
10.1. 2 Limiting Bond Failure
I f insufficient anchorage is provided to transmi t the stress
in the tensile or web steel to the concrete at the supports then failure
occurs by pull-out of the embedded bars.
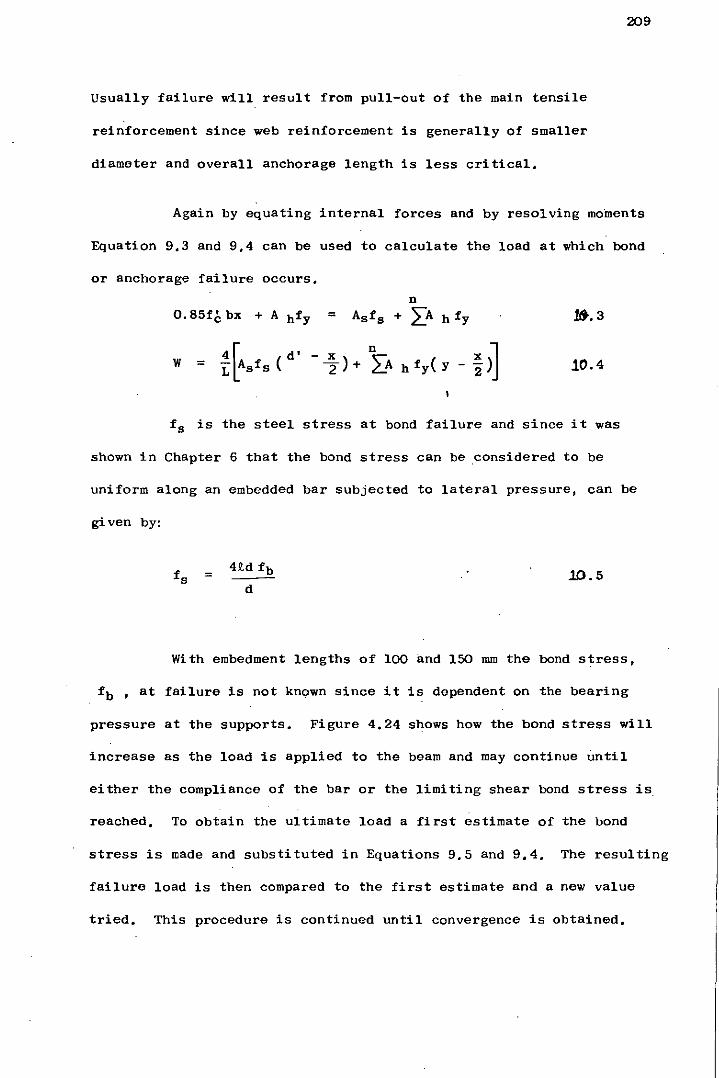
209
Usually failure will result from pull-out of the main tensile
reinforcement since web reinforcement is generally of smaller
diameter and overall anchorage length is less critical.
Again by equating internal forces and by resolving moments
Equation 9.3 and 9.4 can be used to calculate the load at which bond
or anchorage failure occurs.
O. S5f" bx + A hfy = 1It.3
W = 10.4
fs is the steel stress at bond failure and since it was
shown in Chapter 6 that the bond stress can be considered to be
uniform along an embedded bar subjected to lateral pressure, can be
given by:
= 10.5
With embedment lengths of 100 and 150 mm the bond stress,
fb , at failure is not known since it is dependent on the bearing
pressure at the supports. Figure 4.24 shows how the bond stress will
increase as the load is applied to the beam and may continue until
either the compliance of the bar or the limiting shear bond stress is.
reached. To obtain the ultimate load a first estimate of the bond
stress is made and substituted in Equations 9.5 and 9.4. The resulting
failure load is then compared to the first estimate and a new value
tried. This procedure is continued until convergence is obtained.
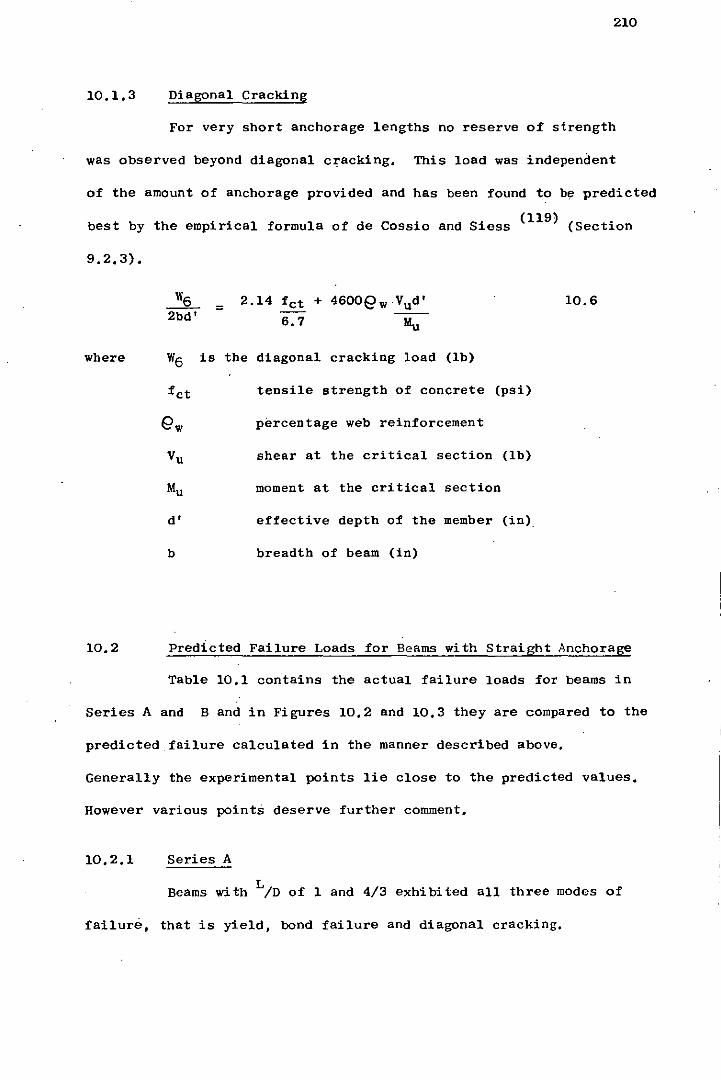
210
10.1. 3 Diagonal Cracking
For very short anchorage lengths no reserve of strength
was observed beyond diagonal cracking. This load was independent
of the amount of anchorage provided and has been found to be predicted
(119) . best by the empirical formula of de Cossio and Siess (Sect10n
9.2.3).
where
10.2
~ 2bd'
= 2.14 fct
6.7
W6 is the diagonal cracking load (lb)
tensile strength of concrete (psi)
percentage web reinforcement
shear at the critical section (lb)
moment at the critical section
d' effective depth of the member (in).
b breadth of beam (in)
10.6
Predicted Failure Loads for Beams with Straight Anchorage
Table 10.1 contains the actual failure loads for beams in
Series A and B and in Figures 10.2 and 10.3 they are compared to the
predicted failure calculated in the manner described above.
Generally the experimental points lie close to the predicted values.
However various points deserve further comment.
10.2.1 Series A
Beams with LID of 1 and 4/3 exhibited all three modes of
failure, that is yield, bond failure and diagonal cracking.
211
L Beams with ID equal to 2 however failed to mobilize sufficient bond
to result in flexural failure. Although an anchorage length of 150 mm
was calculated to result in flexural failure (Figure 10.2(c» the
beams with this amount of end anchorage (0.5A-17, 0.5A-40) fell short
of the predicted failure load. This is probably a result of the
inclination of the load path, for beams of this LID ratio, having a
lesser effect on the restraint at the reaction.
This is shown better in Figure 10.4 which compares· the
average deep beam bond stresses calculated from Equations 10.1 to
10.5 for beams with LID ratios of I, 4/3 and 2, to the semi-beam test
results. Excellent agreement is observed for beams with 100 mm
embedment (12.5 bar diameters). The trend of increasing bond strength
with lateral pressure up to the limiting matrix value is very clear.
As predicted by the semi-beam tests beams with 150 mm
embedment (18.75 bar diameters) reach the compliance of the bar before
the limiting matrix bond strength is reached. At low values of
lateral pressure·the ultimate bond strength calculated for the deep
beams falls below that observed in the semi-beam tests. These beams
correspond to LID equal to 2 (0.5A-17, 0.5A-40) and as mentioned
previously it.would appear that for beams with this configuration the
lateral pressure is less able to mobilize the increased bond strength.
10.2.2 Series B
For beams provided with web reinforcement as in Series B
anchorage detailing is less cri tical than for beams wi thout. The reason
for this being that the web reinforcement behaves in the same way as
tensile reinforcement in resisting the applied moment, so for a given
load the stress in the steel of a beam with··web reinforcement will be
less than one without.
212
Also the web reinforcement has been shown to increase the diagonal
cracking load (Section 9;2) so that when anchorage becomes necessary
the affect of the bearing pressure on the bond will also be
proportionally greater,
Figure 10,3 shows how the improved bond performance of the
anchorages resulted in none of the beams in Series B 1ailing at
diagonal cracking arid that flexural failure was obtained for beams
wi.th all LID ratios including LID equal to 2,
.Anchorage Design to Codes of Practice
10,3,1 Comparison of Design Anchorage to Experimental
The design methods for detailing anchorages described in
Section 7,7 have been used to calculate the required anchorage
reinforcement for the deep beams used in this study, Table 10,2
compares these design values to anchorage lengths from the study that
resulted in flexural failure.
It is clear that all the design methods provide very large
factors of safety, Even the anchorage for simple supports recommended
by CPIlO (2) and the minimum ACI (3) anchorage are safe for beams of
L L ID = 1 and also for ID 4/3 when confining pressures are high, The.
'factor of·safety increases with reduction of the LID ratio and the
addition of web reinfor~ement, This reflects the increase in
anchorage afforded by the greater bearing pressures that occur.
10,3,2 The Case for Specified Bond Strengths in CPllO (2)
Although Table 10.2 shows large factors of safety for the
anchorage designed according to Table 22 of CPllO' (2) using average
permissible anchorage bond stresses, the comparison of design and actual
anchorage bond lengths for these small diameter bars hides an important
variable.
,
213
Figure 10.5 compares the CPIIO (2) design anchorage bond stress for
2 30 N/mm concrete with deformed bars in tension, to average bond.
stress for various bar sizes obtained from these experiments, also to the
maximum average bond stress that can be achieved by Lytag,(Equation 4.1)
(62) and to values predicted ·by Tepfers splitting theory, (Equation 6.13).
Bond strengths to CPIlO (2) clearly do not take into account
the ,effect of the bar dia~eter. For small bar diameters, significant,
possibiy over conservative factors of safety are provided but for large
diameters the factor of safety is reduced and for very large bar
diameters it is possibly not sufficient.
As suggested by the ACI 408 Committee a fundamental design
formula is required for the prediction of bond strengths. (62)
Tepfers
formula has been found to provide a reasonable estimate of lower bound
values and is used, together with the observations from the bond tests,
in the following section to provide a rational design method for deep
beam anchorages.
10.4 Proposed Method of Design
10.4.1 Preliminary Remarks
The experimental programme has demonstrated that for beams
with LID greater than 2 failure occurs by flexural or shear cracking
within the span. Bar stresses within the span are distributed according
to the bending moment diagram and for simply supported members
anchorage is of secondary importance and only nominal anchorage need
be provided.
214
Deep beams with L/D ratio less than 2 rely on anchorage at
the supports after the onset of diagonal cracking and accrue
significant increases in bond strength as a result of the large
bearing pressures existing at the supports.
The semi-beam test results in which the effect of lateral
pressure on bond was investigated haVfbeen shown to provide good
agreement with the results of anchorage of deep beam main steel.
In Chapter 6 a method based on Tepfers (62) splitting approach and a
limiting matrix bond value for the Lytag concrete was used· to predict
the experimental bond strengths. This method can now be applied to
the design of deep beam anchorages for beams with L/D less than 2.
10.4.2 Design Approach
After the design of the main and web reinforcement
necessary to resist ultimate loads, the detailing of anchorage re-
inforcement is then dealt with.
Properly designed concrete deep beams will usually fail in
shear and although it is prudent to design the anchorage assuming that
the full tensile strength of the bar must be achieved; in practice
the stress in the steel at failure will most probably be very much
less than thi s.
Calculation of the diagonal cracking load according to
C . . (119) ( . ) de OSS10 and S1ess Equat10n 10.6 serves two purposes. Firstly,
it is a servicibility check to ensure that unsightly cracking will not
occur within the range of· working loads for the beam. Secondly, the
diagonal cracking load corresponds to the point at which the anchorage
must transmit large stresses at the support.
215
Although the tensile reinforcement will not have reached
the yield stress at this stage, it is considered prudent that the
anchorage provided is sufficient to ensure that the full tensile
strength of the reinforcement can be attained.
The lateral pressure existing over the support at the onset
of diagonal cracking is
= 2 x b x ~
where is the diagonal cracking load predicted by
. .. (119) de COSS10 and Siess ;
b the breadth of the deep beam;
~ is the bearing block length or 0.2 x clear span,
whichever is less.
When (a)
the required anchorage length to ensure full yield capacity of the
reinforcement is given by
where
or (b)
~d = fy x As x 0.87 1T x d x fbs
is the bond spli tting strength as shown in
Figure 10.6.
For Lytag lightweight concrete the matrix limiting bond strength is
reached for lateral pressures greater than 0.3fcu •
The average bond strength can be taken as
l.Bjt;u
and therefore the required anchorage length is
id = .fy x As x 0.B7
.11 x d x fbt
The experimental work described in Section 2 of this
216
thesis has shown that sufficient restraint is provided by the friction
between the reaction blocks and beam to ensure that the enhanced bond
is attained. Stirrups or.helices should be placed around the
anchorage steel however since these might well.provide additional
restraint at,low lateral pressures.
10.5 Design Example
In practice ,the dimensions of deep beams used in construction
are often upwards of 3m x 3m. For this design example, beam dimensions
have been chosen which are comparable to those of the test beams so
that comparison to the actual anchorage requirement can be made. The
design of the main web and tensile reinforcement has been carried out
in accordance with the design formula proposed by Kong, Robins and
Sh (lOB)
arp • This method is cited in the Reinforced Concrete Design-
ers Handbook (i09) and has also been adopted by the CIRIA Design
G . d (92)
U1 e , which is at present the most authoritative document on
design of reinforced concrete deep beams.
The dimensions and properties of a lightweight concrete deep
beam are shown in Figure 10.7.
217
I f the total service load, Ws , acting on the beam is 275 k N (which
includes an allowance for the self weight of the beam) design the
longi tudinal, web and anchorage reinforcements.
2 Concrete compressive strength = 33 N/mm ,concrete tensile strength =
. 2 2.3 N/mm
Tensile Reinforcement
Design bending moment M = x Ws x 600 Yt 2
(where Yt = 1.4 and Ws = 275 KN).
Area of tensile reinforcement to resist design moment
> Clause 2.4.1
The lever arm Z is assumed to be:
Z = 0.2 L + 0.4 ha
where L is the effective span.
CIRIA (92)
where ha = D when L > D Clause 2.2.1 CIRIA (92)
= L when D > L
Z = 0.2 L + 0.4 x D
= 0.2 x 1200 + 0.4 x 750
= 240 + 300
= 540 mm.
As = GOO mm 2
. 2 Use two No. 20 mm diameter bars (628 mm )
Shear Reinforcement
From Figure 10.6
.. X
ha
218
= 0.56'
Shear resistance of main bars only Clause 3.42 CIRIA(92)
=
=
"
=
=
Ad 1 - 0.3~) rt:"u ha j -""
n + A2 LIOOA y sin2 e
bha 2
0.32 for lightweight aggregates
1.95 N/mm2 for deformed bars
0.32(1 _ 0.35 x 0.566) 133 + 1.95 x 100 x 628 x 710 sin2
67 .j -- 100 x 7502
208.8 KN.
Since Ws < 2Vu strictly no web reinforcement is required.
However use ACI minimum web reinforcement
= Av
+ bS v = 0.0025 + 0.0015
Provide 6 mm deformed bars at 85 mm vertical spacing and
200 mm horizontal spacing.
Check servicibility requirement that no diagonal cracking
occurs below working loads.
. i l19( . ·t) Diagonal crack1ng load by de Coss 0 metr1c un1 s •
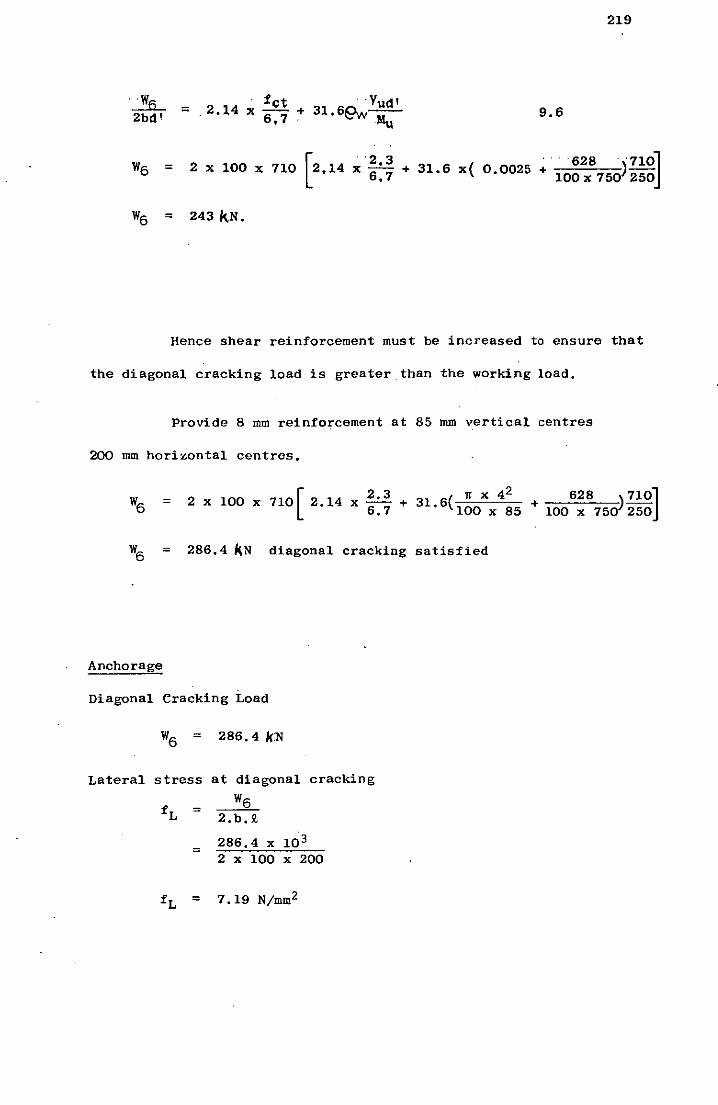
.JI1L 2ba'
. fct = .2.14 x 6.7 + 31 6n· Vua '
• <:;'W .Mu 9.6
219
= [
. ·2 3 .. ·628 . ·7101 2 x 100 x 710 2.14 x 6:7 + 31.6 x( 0.0025 + 100x 750) 250J
= 243 k,N.
Hence shear reinforcement must be increased to ensure that
the diagonal cracking load is greater.than the working load.
Provide 8 mm reinforcement at 85 mm vertical centres
200 mm horizontal centres.
= 2 x 100 x [
2.3 ( 11 x 4 2 710 2.14 x 6.7 + 31.6 100 x 85
W6 = 286.4 KN diagonal cracking satisfied
Anchorage
Diagonal Cracking Load
=
Lateral stress
=
=
=
286.4 /(N
at diagonal
W6 2.b.ll
286.4 x 10³
cracking
2 x 100 x 200
7.19 N/mm2
628 ) 710] + 100 x 750 250
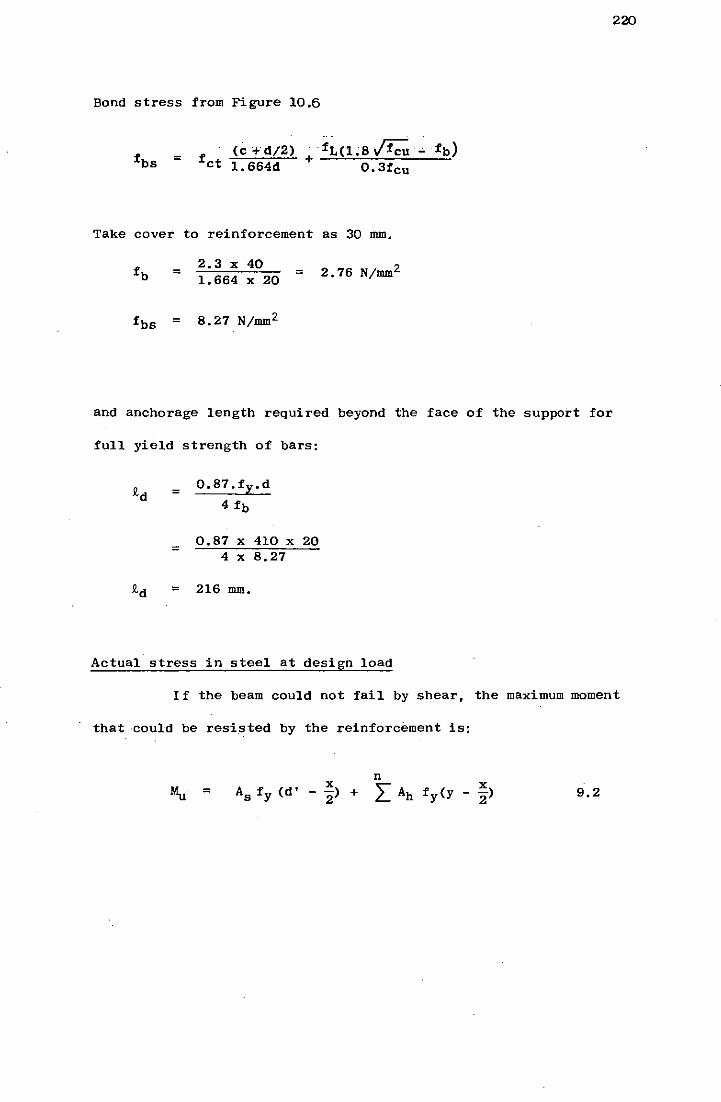
Bond stress from Figure 10.6
= (c+d/2)
fct 1.664d
Take cover to reinforcement as 30 mm.
=
=
2.3 x 40 1.664 x 20
8.27 N/mm2
= 2.76 N/mm2
and anchorage length required beyond the face of the support for
full yield strength of bars:
£d = 0.87.fl!.d
4 fb
0.87 x 410 x 20 =
4 x 8.27
£d = 216 mm.
Actual stress in steel at design load
220
If the beam could not fail by shear, the maximum moment
that ·could be resisted by the reinforcement is:
n = As fy (d' - ~) + L Ah fy(y - ~) 9.2
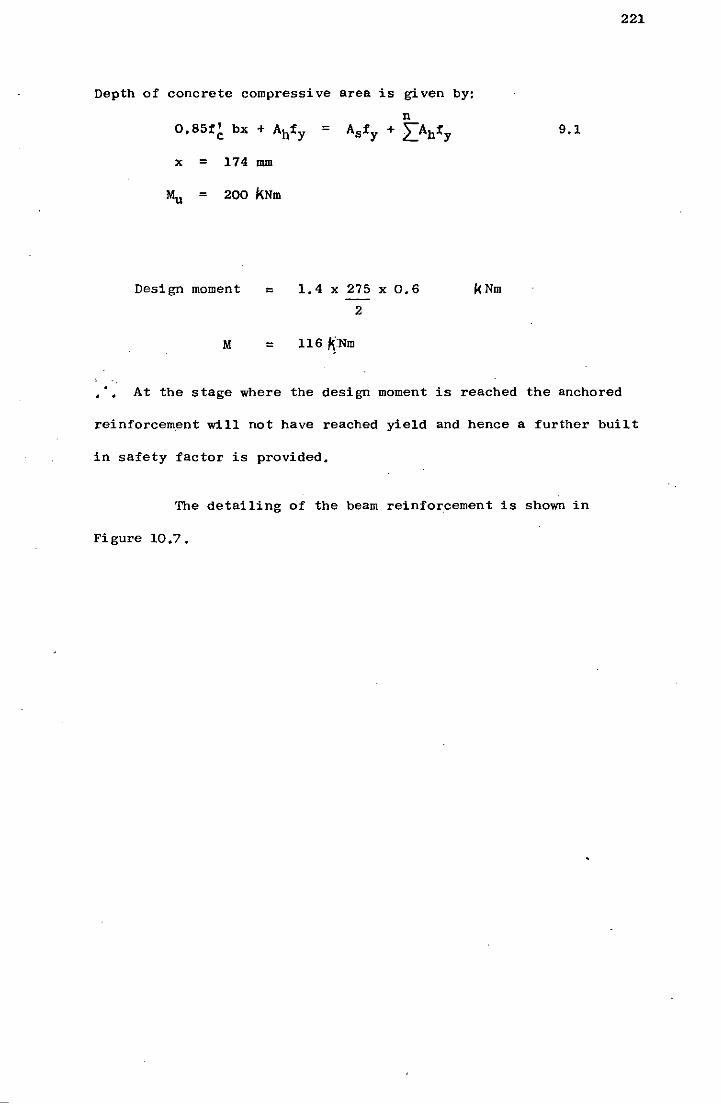
Depth of concrete compressive area is given by:
174 mm
200 KNm
Design moment
M =
n Asfy + LAhfy
1.4 x 275 x 0.6
2
116 ~Nm
221
9.1
kNm
At the stage where the design moment is reached the anchored
reinforcement will not have reached yield and hence a further built
in safety factor is provided.
The detailing of the beam reinforcement is shown in
Figure 10.7.
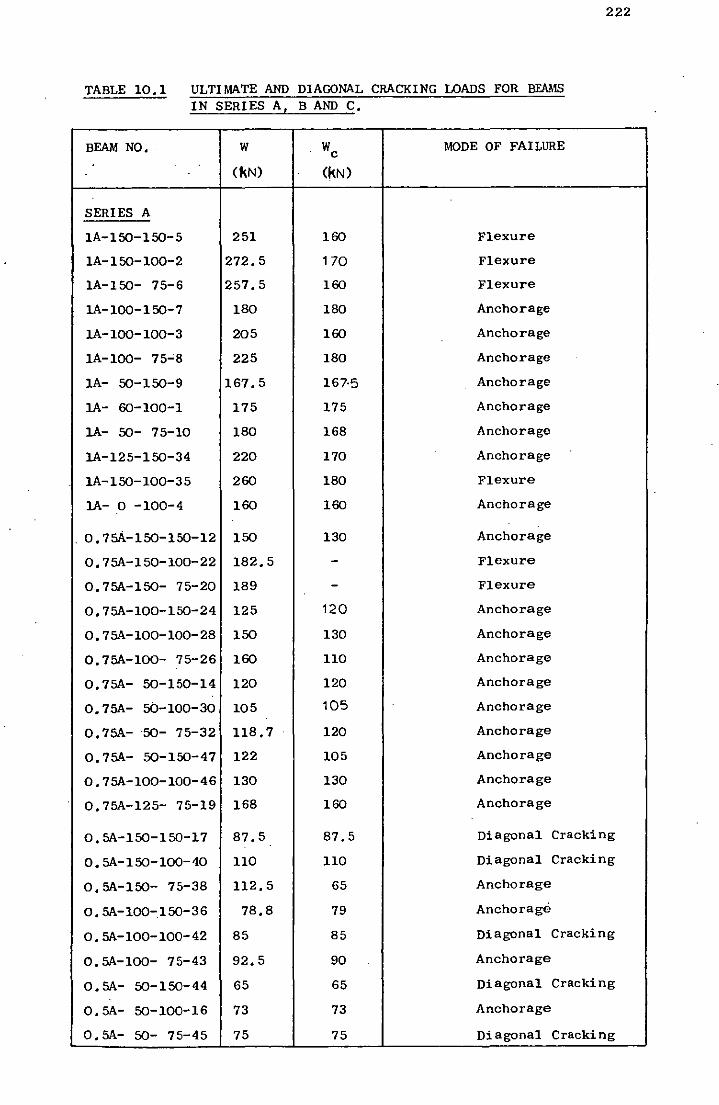
222
TABLE 10.1 ULTIMATE AND DIAGONAL CRACKING LOADS FOR BEAMS IN SERIES A, B AND C.
BEAM NO. w
(kN) (kN)
SERIES A
1A-150-150-5 251
1A-150-100-2 272.5
1A-150- 75-6 257.5
lA-l00-150-7 ISO
lA-l00-100-3 205
lA-l00- 75~8 225
1A- 50-150-9 167.5
lA- 60-100-1 175
lA- 50- 75-10 ISO
lA-125-150-34 220
lA-150-100-35 260
lA- 0 -100-4 160
. 0.75A-150-150-12 150
0.75A-150-100-22 182.5
0.75A-150- 75-20 189
0.75A-I00-150-24 125
0.75A-I00-100-28 150
0.75A-I00- 75-26 160
0.75A- 50-150-14 120
0.75A- 50-100-30 105
O. 75A-50- 75-32 118.7
0.75A- 50-150-47 122
0.75A-I00-I00-46 130
0.75A-125- 75-19 168
0.5A-150-150-17 87.5
0.5A-150-100-40 110
0.5A-150- 75-38 112.5
0.5A-100-150-36 78.8
0.5A-lOO-100-42 85
0.5A-I00- 75-43 92.5
0.5A- 50-150-44 65
0.5A- 50-100-16
0.5A- 50- 75-45
73
75
160
170
160
180
160
180
167·5
175
168
170
180
160
130
120
130
110
120
105
120
105
130
160
87.5
110
65
79
85
90
65
73
75
MODE OF FAILURE
Flexure
F1exure
Flexure
Anchorage
Anchorage
Anchorage
Anchorage
Anchorage
Anchorage
Anchorage
Flexure
Anchorage
Anchorage
Flexure
Flexure
Anchorage
Anchorage
Anchorage
Anchorage
Anchorage
Anchorage
Anchorage
Anchorage
Anchorage
Di agonal Cracki ng
Diagonal Cracking
Anchorage
Anchorage
Diagonal Cracking
Anchorage
Diagonal Cracking
Anchorage
Di agonal Cracki ng
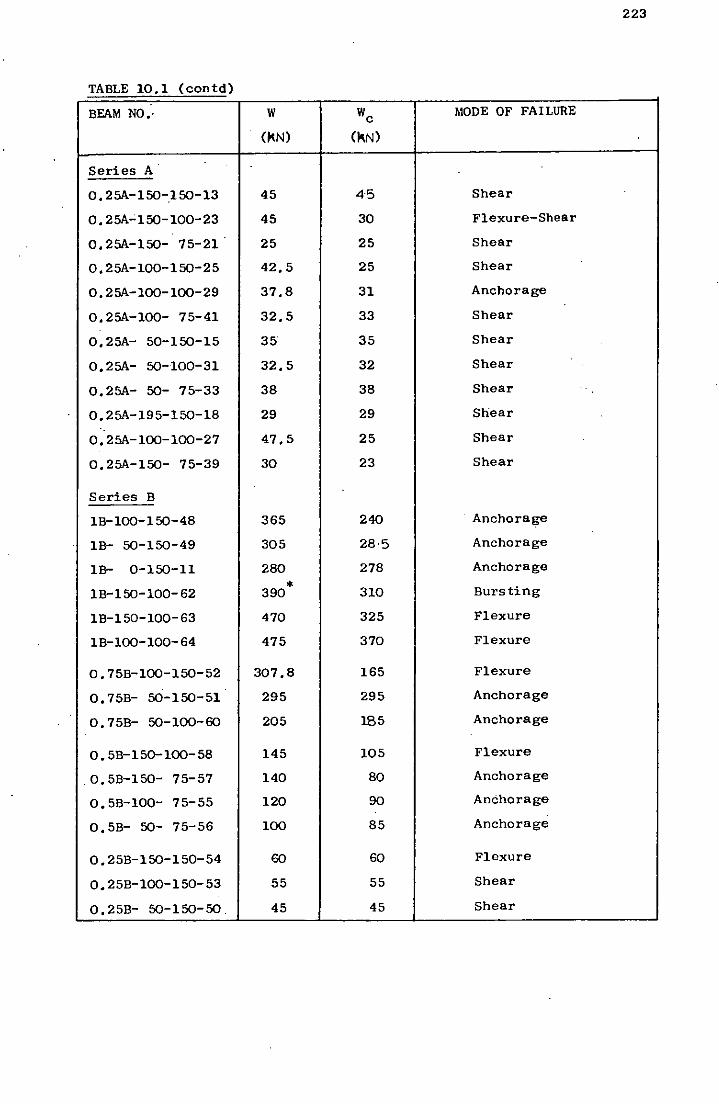
223
TABLE 10 1 (contd) ,
BEAM NO,- W Wc MODE OF FAILURE
(kN) (Jo.N)
Series A·
O,25A-150-150-13 45 45 Shear
O,25A-'150-100-23 45 30 Flexure-Shear
O,25A-150- 75-21 25 25 Shear
O,25A-100-150-25 42,5 25 Shear
O,25A-I00-loo-29 37,8 31 Anchorage
O,25A-100- 75-41 32,5 33 Shear
O,25A- 50-150-15 35 35 Shear
O,25A- 50-100-31 32,5 32 Shear
O,25A- 50- 75-33 38 38 Shear
O,25A-195-150-18 29 29 Shear
O,25A-l00-lOO-27 47,5 25 Shear
O,25A-150- 75-39 30 23 Shear
Series B
IB-lOO-150-48 365 240 Anchorage
IB- 50-150-49 305 28-5 Anchorage
IB- 0-150-11 280 278 Anchorage
* IB-150-100-62 390 310 Bursting
1 B-150-100- 63 470 325 Flexure
IB-lOO-100-64 475 370 Flexure
O,75B-l00-150-52 307,8 165 Flexure
O,75B- 50-150-51 295 295 Anchorage
O,75B- 50-100-60 205 185 Anchorage
O,5B-150-1OO-58 145 105 Flexure
.O,5B-150- 75-57 140 80 Anchorage
O,5B-100- 75-55 120 90 Anchorage
O,5B- 50- 75-56 100 85 Anchorage
O,25B-150-150-54 60 60 F1exure
O,25B-lOO-150-53 55 55 Shear
O,25B- 50-150-50 . 45 45 Shear
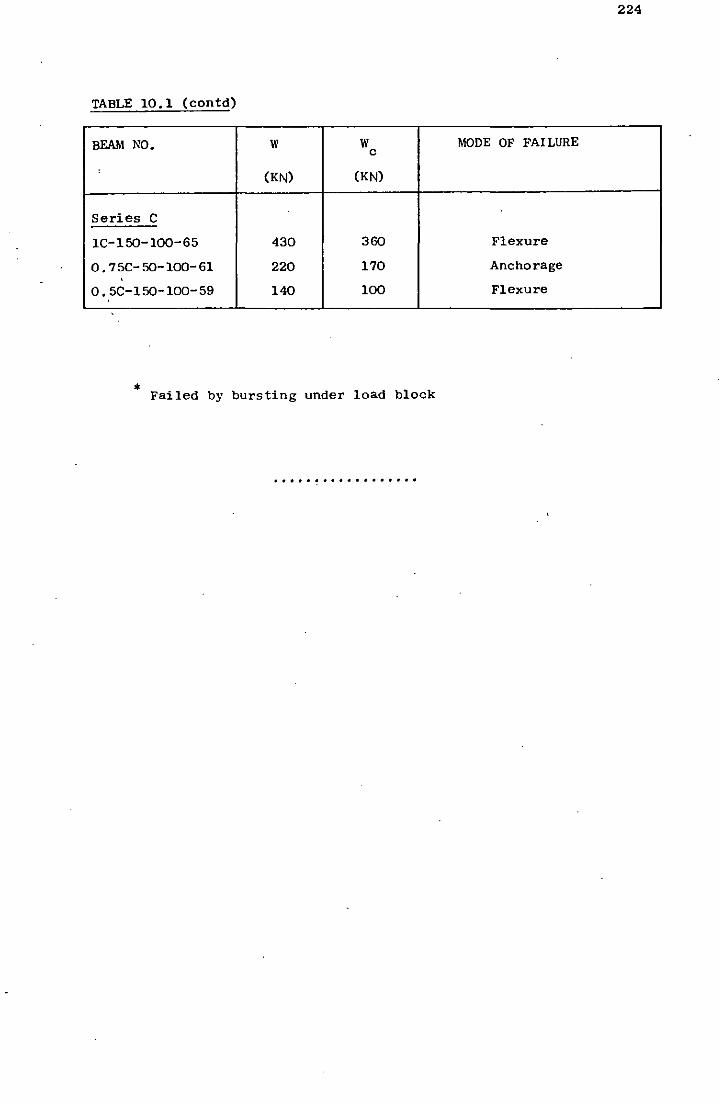
224
TABLE 10.1 (contd)
BEAM NO. W W MODE OF FAILURE c
, (KN) (KN)
Series C
lC-150-l00-65 430 360 Flexure
0.75C-50-l00-6l 220 170 Anchorage ,
0.5C-150-100-59 140 100 Flexure
* Failed by bursting under load block
......... ~ ...................... ..
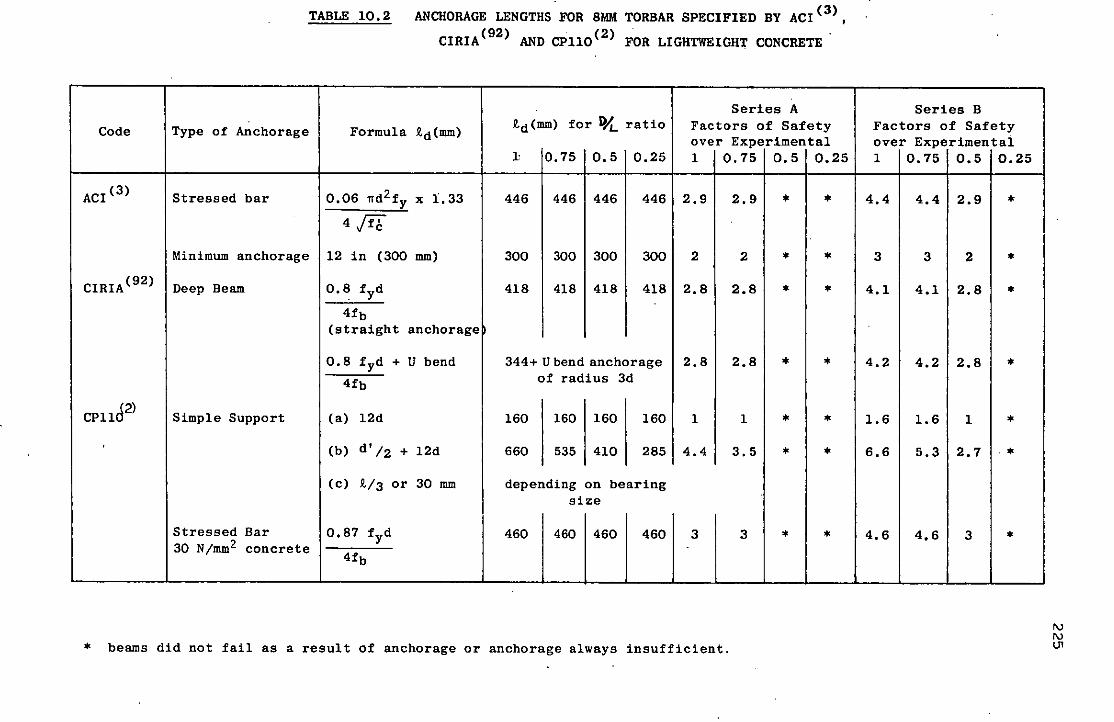
Code
ACI(3)
CIRIA(92)
cpud2)
TABLE 10.2 ANCHORAGE LENGTHS FOR 8MM TORBAR SPECIFIED BY ACI (3) ,
CIRIA (92) AND CPllO(2) FOR LIGHTWEIGHT CONCRETE'
Series A
Type of Anchorage Formula R.d(mm) R.d (mm) for !VI- ratio Factors of Safety over Experimental
1 0.75 0.5 0.25 1 0.75 0.5 0.25
Stressed bar 0.06 7rd2fy x 1. 33 446 446 446 446 2.9 2.9 '" '" 4 Jfb
Minimum anchorage 12 in (300 mm) 300 300 300 300 2 2 • '" Deep Beam 0.8 fyd 418 418 418 418 2.8 2.8 • •
4fb (straight anchorage
0.8 fyd + U bend 344+ U bend anchorage 2.8 2.8 '" '" 4fb of radius 3d
Simple Support (a) l2d 160 160 160 160 1 1 • • (b) d'/2 + 12d 660 535 410 285 4.4 3.5 '" '" (c) R./3 or 30 mm depending on bearing
size
Stressed Bar 0.87 fyd 460 460 460 460 3 3 '" • 30 N/mm2 concrete
4fb
• beams did not fail as a result of anchorage or anchorage always insufficient.
Series B Factors of Safety over Experimental 1 0.75 0.5 0.25
4.4 4.4 2.9 '"
3 3 2 • 4.1 4.1 2.8 '"
4.2 4.2 2.8 •
1.6 1.6 1 • 6.6 5.3 2.7 ••
4.6 4.6 3 •
I\) I\)
\Jl
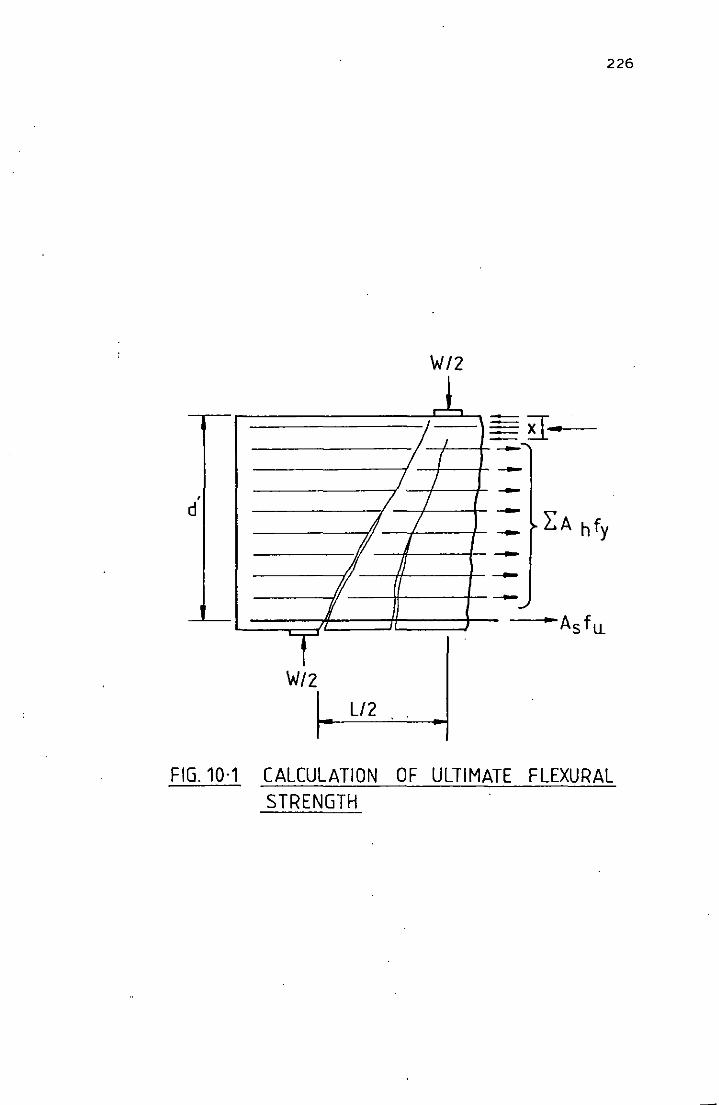
226
W/2
.l. 1, I {
=~-.. ---7 / --
, / / d 7 7 -
~ / /I 11
~ f
------T W/2
Ll2
FIG. 10·1 CALCULATION OF ULTIMATE FLEXURAL STRENGTH
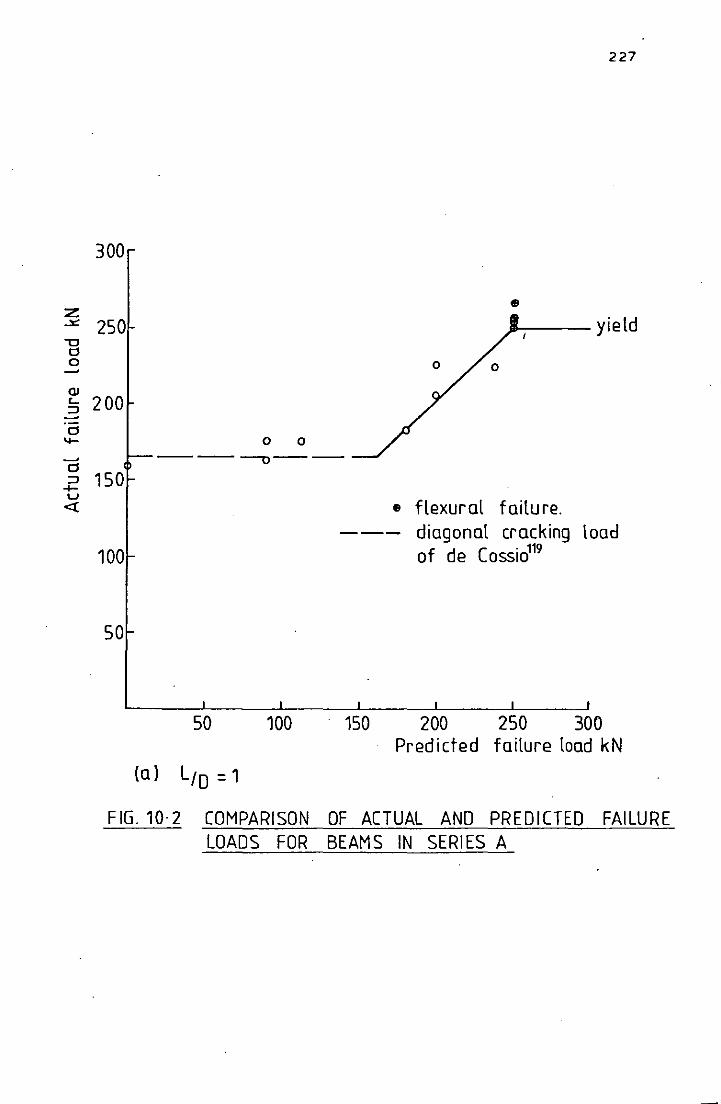
Z ..><:
-0 d 0 ~
QJ t.. :::J ~
d ..... ~
d :::J +-u «
227
300
e
250 yield
200
0 0 ----.,--
150 e flexurol failure.
--- diagonal cracking load 100 of de Cossio119
50
50 100 150 200 250 300 Predicted failure load kN
(a) LID = 1
FIG. 10·2 COMPARISON OF ACTUAL AND PREDICTED FAILURE LOADS FOR BEAMS IN SERIES A
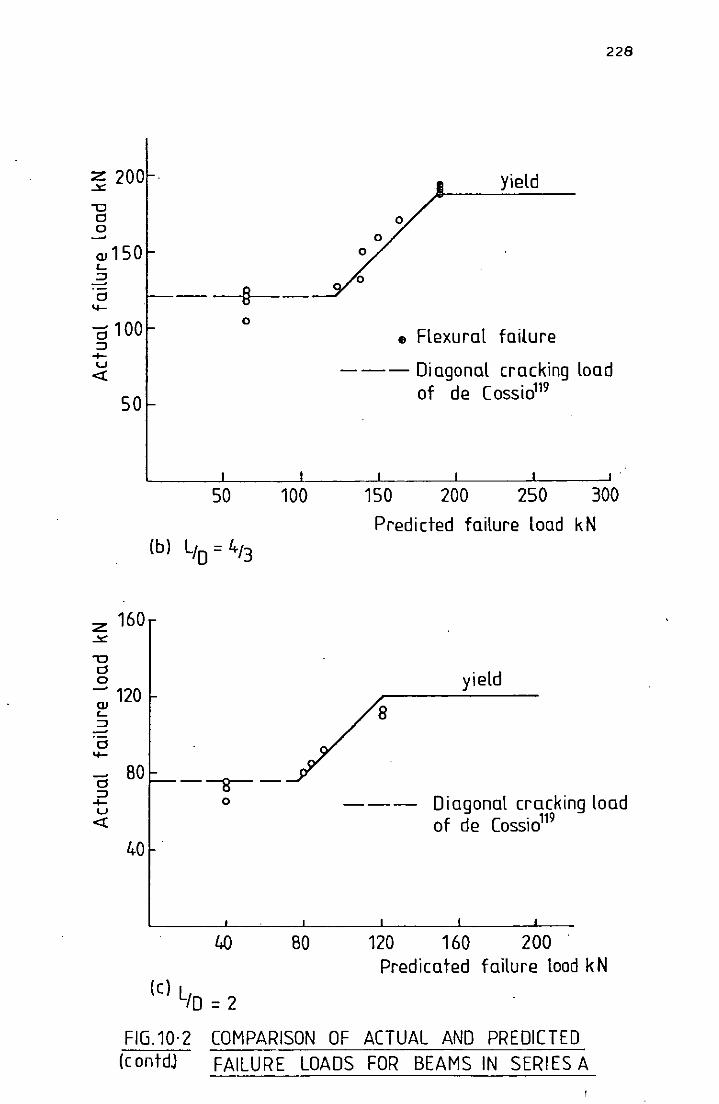
z 200 -'I::
"1:l Cl o
QJ 150
Cl ...... d 100 :::J
-+u <t
50
z 160
"1:l Cl o ~ 120 QJ L :::J
Cl ...... d 80 :::J
-+u <t
40
o
228
yield
e Flexural failure
---- Diagonal cracking load of de COSSiO
l19
L-____ L-____ ~ _____ _L ____ ~ ______ L_ __ ~I
50 100
-~-o
80
(cl LID = 2
150 200 250 300
Predicted failure load kN
yield
---- Diagonal crocking load of de COSSiO
l19
120 160 200 Predicated failure lood k N
FIG.10·2 COMPARISON OF ACTUAL AND PREDICTED (c ontdJ FAILURE LOADS FOR BEAMS IN SERIES A
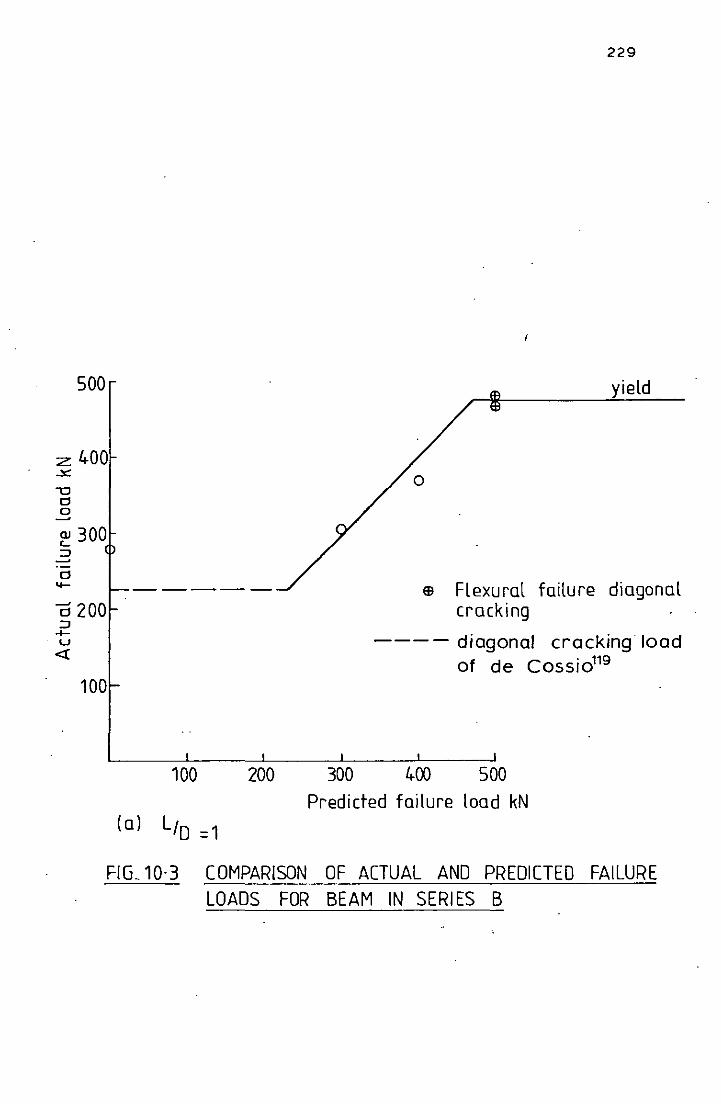
500
:z: 400 ..x: ""Cl c o ~
w 300 ':::l ~
0200 :::l ..... u <{
100
100
(a) LID =1
200 300
229
yield
EB Flexural failure diagonal cracking
---- diagonal cracking load of de Cossi0119
400 500 Predicted failure load kN
FIG_ 10· 3 COMPARISON OF ACTUAL AND PREDICTED FAILURE LOADS FOR BEAM IN SE RI ES B
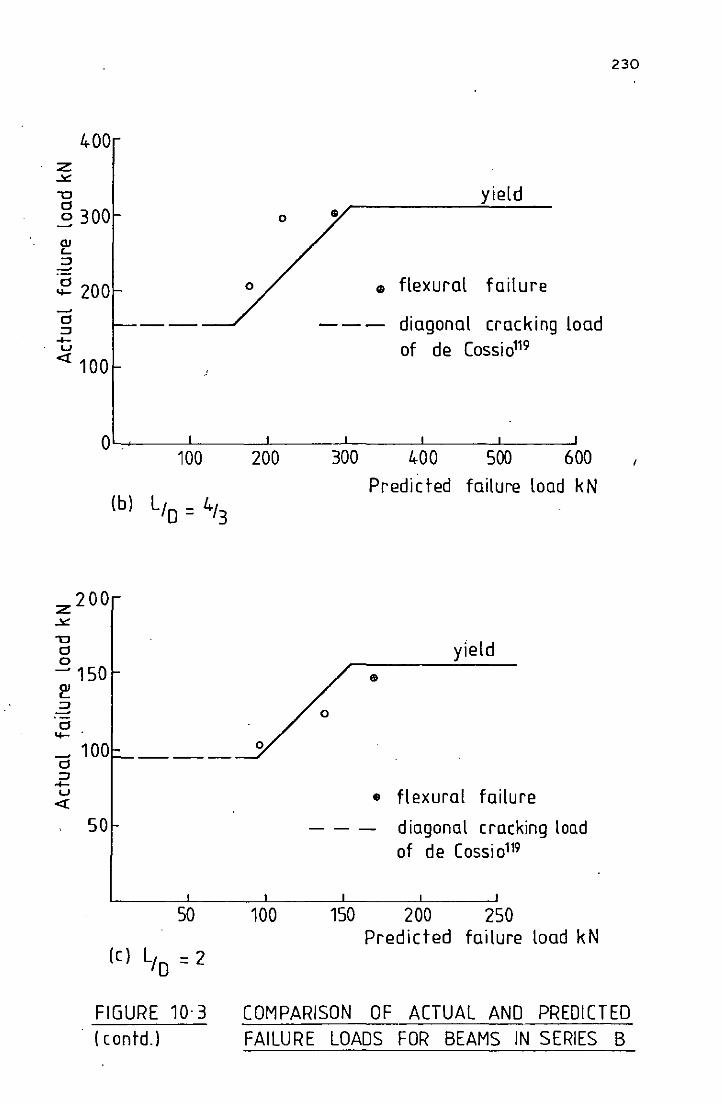
400 :z ~
-0
~ 300
.g 200 ~
C ::J ..... u
<t 100
c .....
o ,
~ 100 c ::J ..... u <t
so
100
50
(c) LID = 2
FIGURE 10· 3 (contd.l
200
100
yield
Cl) flexural failure
-- - diagonal cracking load of de Cossi 0119
300 400 500 600
Predicted failure load kN
yield
• flexural failure
- - - diagonal cracking load of de Cossi 0119
150 200 250 Predicted failure load kN
230
COMPARISON OF ACTUAL AND PREDICTED FAILURE LOADS FOR BEAMS IN SERIES B
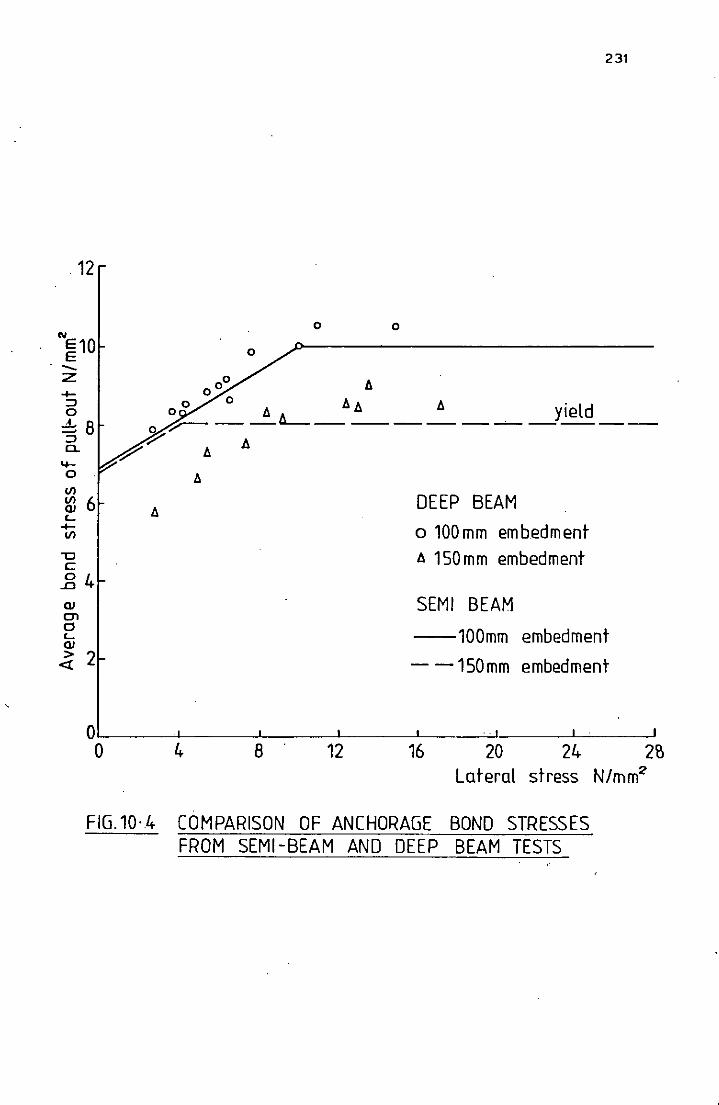
. --z -+::J o
12
~8 ::J a.
..... o III
~ 6 r....
-+III
"0 c B4 QJ CTI C r.... QJ
~ 2
231
o 0
o
o 00 I!.
o 0 0 I!. I!. I!. I!. yield v---L-----------.---------
?? I!. ~ I!.
l:.
DEEP BEAM
o 100mm embedment
I!. 1S0mm embedment
SEMI BEAM
--100mm embedment
- -1S0mm embedment
01L-___ ~ ___ ~ ____ ~ ___ -L ____ ~ ____ _L~_~
o 4 8 . 12 16 20 24 2B Lateral stress N/mm2
FIG.10·.4 COMPARISON OF ANCHORAGE BOND STRESSES FROM SEMI-BEAM AND DEEP BEAM TESTS
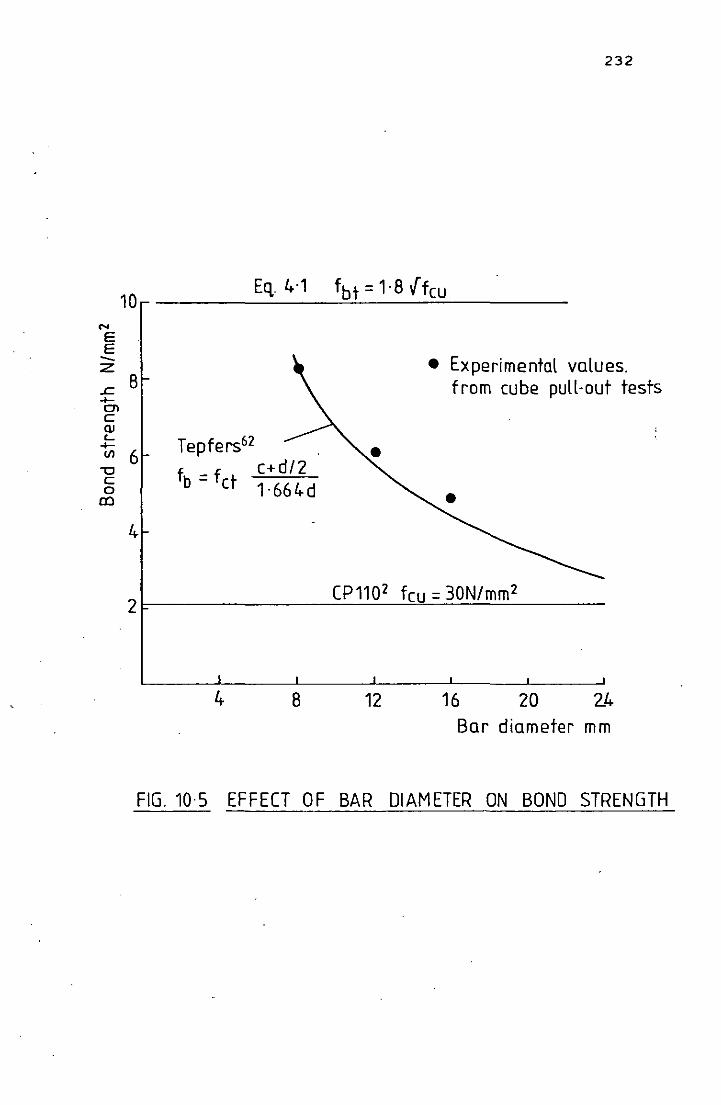
232
10 Eq.4·1 fbt = 1·8 {feu
'" E E -- • Experimental values. :z .c 8 from eube pUll-out tests -f-en c QJ L
Tepfers62 -f-Vl 6
-0 fb = f et c+d/2 c
1·664d 0 co
4.
(P1102 feu = 30N/mm2 2~--------------~~--~~~~=--------
4 8 12 16 20 24 Bar diameter mm
FIG. 10·5 EFFECT OF BAR DIAMETER ON BOND STRENGTH
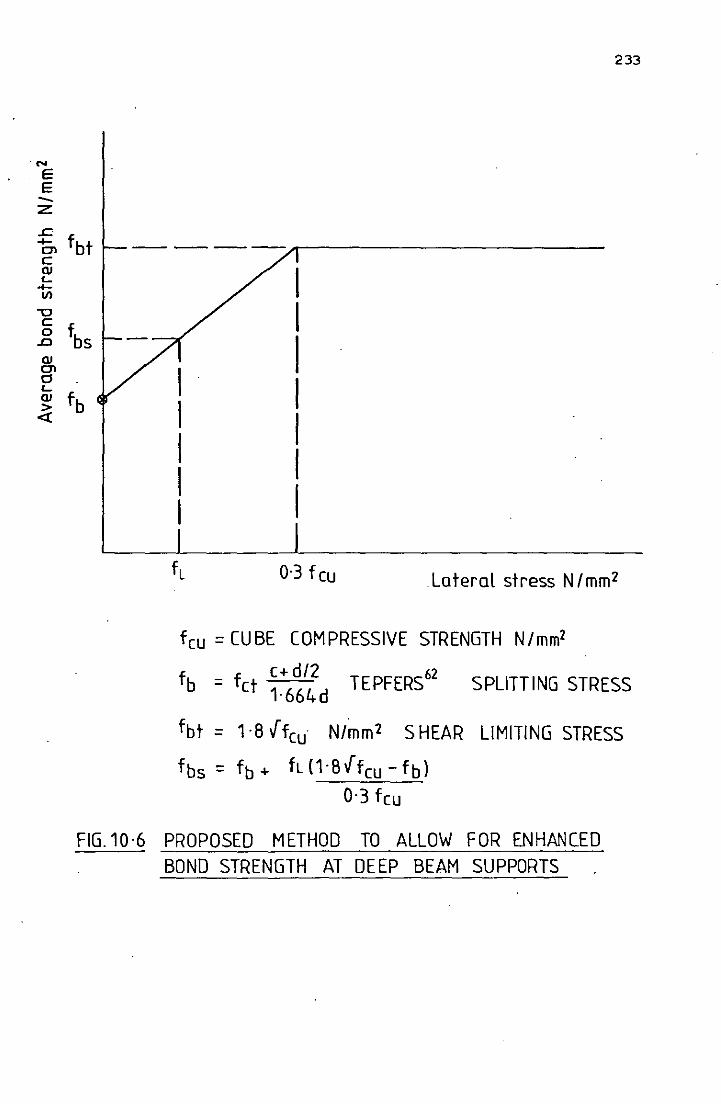
·N
E E -z: .c 1:;, fbt c QI L.
t; "U C
..8 fbs QI Cl Cl L.
g fb «
233
- ---...,-------------
0·3 feu . Lateral stress NI mm2
feu = CUBE COMPRESSIVE STRENGTH N/mm2
fb = f e+ d/2 TEPFERS62 et 1-664d
fbt = 1·sffeu N/~m2 SHEAR
fbs = fb + fL(1·sffeu - fb)
0'3 feu
SPLITTING STRESS
LIMITING STRESS
FIG.10·6 PROPOSED METHOD TO ALLOW FOR ENHANCED BOND STRENGTH AT DEEP BEAM SUPPORTS
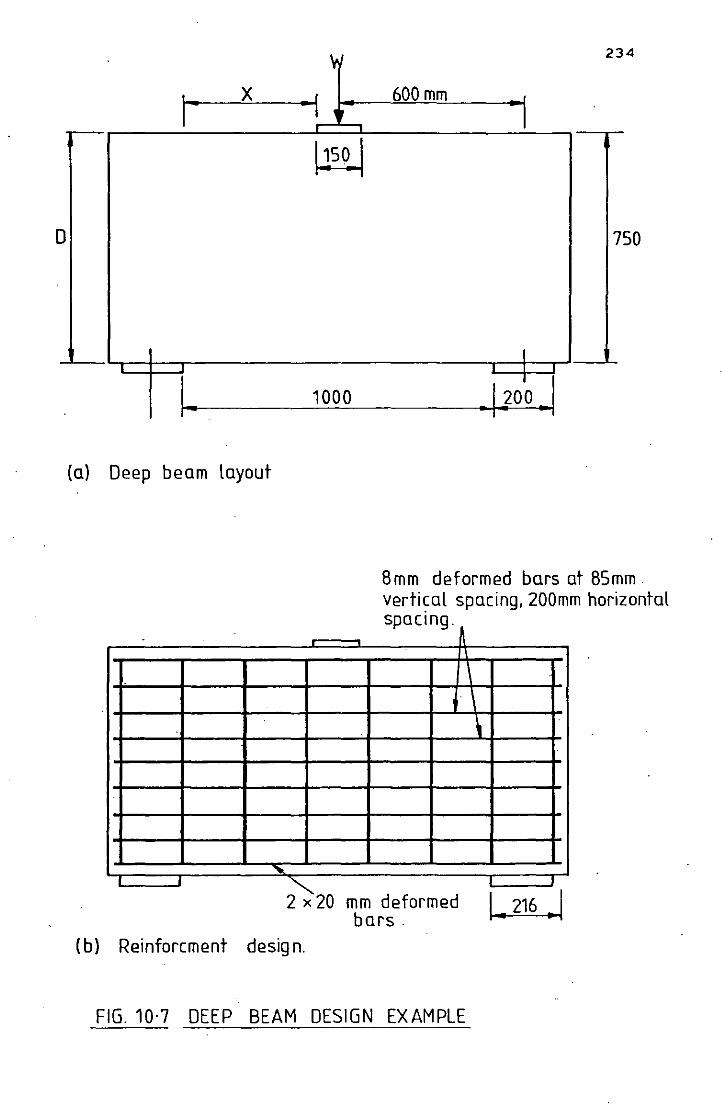
D
I- x
I ..
(a) Deep beam layout
L -.I
~
.. I
~
1000
234
600 mm --'
1
7 50
I
.llo'o .. 1
8mm deformed bars at 85mm. verti~al spacing, 200mm horizontal spoclng
\
I ~ 2 x 20 mm deformed I .. 216 .. I
bars. (b) Reinforcment desig n.
FIG. 10·7 DEEP BEAM DESIGN EXAMPLE
SECTION 3
CONCLUSIONS
I 1 ]
w
I d
I u
I P'
J
235
CHAPTER 11 CONCLUSIONS
11.1 Pull-out Tests and Semi-beam Tests with no Applied Laterial Stress
The conclusions from tests in which the pull-out and semi-
beam specimens were tested in the normal manner (i.e. without applied
lateral stress) support the conclusions of other investigations.
The mode of bond resistance at failure of round bars was
found to be frictional and is dependent on the value of shrinkage of
the concrete matrix. Equation 5.4 gives reasonable agreement with
the experiment results.
Deformed bars with no applied lateral stress fail by.
splitting the concrete cover about· the bar, or if sufficient embedment
is provided, by yielding of the steel. (62) .
Tepfers theory for the
partly cracked elastic stage (Equation 6.13) gives a reasonable lower
bound estimate of the average bond strength.
The results from a strain gauged semi-beam specimen
demonstrated that the bond stress is distributed evenly along the
embedment length of a deformed bar just before bond failure.
The geometrical properties of the bar have an effect on the
bond strength at failure •. Bars with annular type deformations were
found to mobilise greater bond strengths than helical deformations.
As in other investigations bond strength for deformed bars
was found to increase in proportion to the square root of the cube
compressive strength.
benel
I anchc.
less
streJ
sup~
load]
I porta
corrE
. arch
steel
1 conel
beam
deep'
anche
I equal . I failE
late!
I excel
CIRIA
1 plai[
237
For lateral pressures from 0 to 0.3 f the primary cause of failure cu
was splitting or bursting of the concrete. cover •. Lateral pressures
greater than 0.3 f yielded no further increase in bond strength cu
. and' a shear type bond failure was observed wi th no spli tting of the
concrete cover. The limiting value of bond strength for Lytag
lightweight concrete, for concrete strengths within the structural
range, is given by Equation 4.3.
11.3 Comparison of Anchorage Bond Test Methods
Although various criticisms have been levelled at the
simple cube pull-out test, results from this investigation show that
both this and the semi-beam tests yield comparable values of bond
strength and similar load/slip behaviour.
The cube tests gave greater values of bond strength but
for the deformed bar specimens this can be accounted for'by the
difference in cover to the embedded bar.
The semi-beam method however provides a more realistic
comparison to the conditions at the anchorage of a real flexural
member and is recommended for use in further bond investigation~.
11;4 Deep Beam Experiments
It is apparent that the effect of bearing stress at the
supports of deep beams can result in significant improvements of the
efficiency of the anchorage. In a similar way to the lateral
pressures applied to the bond test specimens, bearing pressures delay
·thesplitting of the concrete cover over the reinforcement and com-
parable improvements in bond strength are observed.
.... ..., " _ .. l
l
,
239
11.5 Design Recommendations for Deep Beams
It is not sufficient to design a reinforced concrete deep
beam with just the use of an ultimate shear force design equation.
Reinforced concrete deep beams can have a significant reserve of
strength beyond diagonal cracking and a serviceability check must be
made to ensure that unsightly diagonal cracking does not occur within
(119) the working load range of the beam. De Cossio and Siess'
formula fits the results of this investigation best and includes the
effect of web reinforcement in increasing the diagonal cracking load.
A design approach has been proposed (Section 10.4.2) which
takes into account the increased bond strength 'resulting from the bearing
pressure at the onset of diagonal cracking. The bond strength at
zero lateral stress is calculated by a fundamental bond equation and
will increase with increasing bearing pressure up to a matrix
limiting bond strength which for Lytag lightweight aggregate concrete
is given by Equation 4.1.
The anchorage length of the bar can be taken from the inside
face of the support and the enhanced bond resulting from the bearing
pressure will even· be experienced by bars with some overhang of the
support. The conclusions are limited to a maximum bearing length of
the support equal to 0.15 x clear span length.
Main tensile reinforcement should be placed as near to the
support as is reasonably possible to take advantage of the localised
effect of the bearing pressure. Web reinforcement should also be
adequately anchored since it provides a significant contribution to
the ultimate moment of resistance of the member and to the load at
which diagonal cracking occurs.
This increased anchorage capacity was observed for beams
with LID equal to 1 and 4/3. Beams with LID equal to 2 and with
embedment length greater than 12.5 bar diameters, did not achieve the
same degree of enhanced bond at low lateral pressures.
11.6 Further Work
The conclusions' of this investigation are limited to
Lytag lightweight concrete only. Other work (4) has indicated that
significantly greater improvements of bond strength can be obtained
with normal weight concrete. FUrther investigation is required in
this area.
Uniaxial lateral pressure increases the bond of deformed
bars by restraint between the load block and the concrete. The
comparative effectiveness of confinement provided by transverse
reinforcement and helices in similar situations needs to be
examined.
The bar diameter has been shown to have a significant
effect on the average ultimate bond strength. This questions the
validity of using average permissible bond strengths which are the
same. for all bar diameters. Values of ultimate average anchorage bond
strength in Table 22 of CPIIO (2) may provide conservative design values
for small diameter bars and yet be unsatisfactory for large bar
diameters.
Lateral pressures also exist at beam column connections,
corbels and pile caps where similar improvements in bond to that
observed in this deep beam investigation may be obtained.
241
REFERENCES
1. ACI Committee 408., Opportunities in Bond Research. ACI.
J.Proc. Vol. 67, No. 11, (1970), pp 857-867
2. The Council for Codes of Practice, British Standards Institution,
The Structural Use of Concrete, Code of Practice 110, (Nov. 1972).
3. ACI Committee 318. Building Code Requirements for Reinforced
Concrete (ACI.318-77), American Concrete Institute, Detroit,
(Michigan , 1971).
4. ROBINS, P.J., and STANDISH, I.G., Effect of Lateral Pressure on
Bond of Reinforcing Bars in Concrete. Proc. Int • Conf. on
Bond in Concrete, Paisley College of Technology. (Applied
Science Publishers, London, June 1982) pp 262-272.
5. KONG, F.K., GAHUNlA, A.S., and SHARP, G.R., Anchorage of Tension
Reinforcement in Lightweight Concrete Deep Beams. Unpublished paper,
University of Cambridge.
6. . Comite European Beton - Federation Internationale de la Precon
t~ainte. International recommendations for the design and con
struction of conrete structures - Appendix 3 : Deep Beams.
Prague, (June, 1970) p 19.
7. HYATT, T., An Account of Some Experiments with Portland Cement
Concrete combined with Iron, as a Building Material with reference
to Economy of Metal in Construction and for Security against Fire
in the making of Roofs, Floors and Walking Surfaces. (Chiswick
Press, London , 1877~
8. ABRAMS, D.A., Test of Bond between Concrete and Steel. University
of Illinois Bulletin, Vol. Xl, No. 15, Bulletin No. 71. (1913),
P 238.
242
.. 9. MORSCH, E., Der Eisenbetonbau, seine Theorie und Anwendung,
Vol. 1, Part 1, 6th Ed. Stuttgart. (Konrad Wi ttwer) (1923),
PP 21-22.
10. GRAF, 0., Die Wichtigsten Ergebnisse der Versuche mit Eisenbeton •
.. Handbuch fur Eisenbetonbau, Vol. 1, 4th Ed. Berlin, (Wilhelm
Ernst and Son) (1930), pp 61-62.
11. GLANVILLE, W.H., Studies in Reinforced Concrete: Bond Resistance.
Building Research Technical Paper No. 10 (H,M.S.D. London) (1930),
p 37.
12. GILKEY, H.J., CHAMBERLIN, S.J., and HEAL, R.W., Bond between
Concrete and Steel. Iowa Engineering Experiment Station. Vol. 39,
No. 29, Bulletin No. 147 (1940) P 120.
13. CLARK, A.P., Comparative Bond Efficiency of Deformed Concrete
Reinforcing Bars. ACI.J. Proc. Vol. 43. (Dec. 1946), pp 381.
14. CLARK, A.P., Bond of Concrete Reinforcing Bars. ACI,J. Proc.
Vol. 46, (Nov. 1949) pp 161.
15. ASTM A 305-47T. Minimum requirements for the Deformations of
Deformed Steel Bars for Concrete Reinforcement. American Soc.
for Testing Materials (1947).
16. PLOWMAN, J.M., Bond between Concrete and Steel (2) in Theory
and Practice. Structural Concrete. (1962) pp 391-401.
17. WILKINS, R.J .• , Some Experiments on the Load Distribution in
Bond Tests. Magazine of Concrete Research, Vol. 2, No. 5,
(Jan. 1951) pp 65-72.
18. MAINS, R.M., Measurement of the Distribution of Tensile and Bond
Stresses along Reinforcing Bars. ACI.J. Proc. Vol. 48, No. 3.,
(Nov.1951) pp 225-252.
243
19. PEATTIE, K.R., and POPE, J.A., Effect of Age of Concrete on Bond
Resistance. ACI.J. Proc. Vol. 27, No. 6, (Feb.1956), pp 661-672.
20. BERNANDER, K.G., An Investigation of Bond by means of Strain
Measurements in High Tensile Bars embedded in Long cylindrical
PUll-out Specimens. RILEM Symposium on Bond and Crack Formation
in Reinforced Concrete, Vol. 1, Stockholm, Sweden (1957) pp 203-210.
21. PERRY, E.S., and THOMPSON, J.N., Bond Stress Distribution on
Reinforcing Steel in Beams and Pull-out Specimens. ACI. J. Proc.
Vol. 63, No. 8, (Aug. 1966) pp 865-875.
22. NILSON, A.H., Internal Measurement of Bond Slip. ACI.J. Proc.
Vol. 69, No. 7, (July 1972) PP 439-441.
23. EVANS, R.H., and WILLIAMS, A., Bond Stress and Crack Width in
Beams reinforced with Square Grip Reinforcement. RlLEM Symposium
on Bond and Crack Formation in Reinforced Concrete, Vol. l,Stockholm,
Sweden (1957) PP 105-116.
24. PARLAND, H., Inelasticity of Bond between Steel and Concrete and
distribution of Stress in Steel in Cracked and Uncracked Structural
Members. RILEM Symposium on Bond. and Crack Formation in Reinforced
Concrete, Vol. 2, Stockholm, Sweden (1957) PP 307-316.
25. LEONHARDT, F., On the Need to Consider the Influence of Lateral
Stresses on Bond. RlLEM Symposium on Bond and Crack Formation in
Reinforced Concrete, Vol. 1, Stockholm, Sweden (1957) pp 29-34.
26. PLOW~~, J.M., The Measurement of Bond Strength. RlLEM Symposium
on Bond and Crack Formation in Reinforced Concrete, Vol. 1,
Stockholm, Sweden (1957) pp 147-159.
244
27. BROMS, B.B., Technique for Investigation of Internal Cracks
in Reinforced Concrete Members. ACI. J. Proc. Vol. 62, No. I,
(Jan. 1965) pp 35-44.
28. GOTO, Y., Cracks formed in Concrete around Deformed Tension Bars.
ACI. J. Proc. Yol. 68, No. 4, (April 1971) pp 244-251.
29. FERGUSON, P.M., and THOMPSON, N.J., Development Length of High
Strength Reinforcing Bars in Bond. ACI. J. Proc.< Yol. 59, No. 7,
(July 1962) pp 887-917.
30. LUTZ, L.A., Information on the Bond of Deformed Bars from special
pull-out Tests. ACI.J. Proc. Yol. 67, No. 11, (Nov.1970) ,
pp 885-887.
31. JIMENEZ, R., WHITE, R.N., and GERGELY, P., Bond and Dowel
Capacities of Reinforced Concrete. ACI.J. Proc. Yol. 76, No. I,
(Jan. 1979) pp 73-92.
32. KEMP, E.L., and WILHELIII, W.J., Investigation of the Parameters
influencing Bond Cracking. ACI.J. Proc. Yo1. 76, No. I,
pp 47-71.
33. MORITA, S., and KAKU, T., Splitting Bond Failures of Large De
formed Reinforcing Bars. ACI.J. Proc. Yol. 76, No.l, (Jan 1979)
pp 93-110.
34. LOSBERG, A., and OLSSON, p., Bond Failure of Deformed Reinforcing
Bars based on the Longitudinal Splitting Effect of the Bars.
ACI.J. Proc. Yol. 76, No. I, (Jan. 1979) pp 5-18.
35. ACI Committee 408. A Guide for Determination of Bond Strength in
Beam Specimens. ACI.J. Proc. Yo1. 61, No. 2, (Feb.1964) pp 129-135.
36. EDWARDS, A.D., and YANNOPOULOS, p.J., Local Bond-Stress-Slip
Relationships under repeated loading. Magazine of Concrete
Research, Vol. 30, No. 103, (June 1978) pp 62-72.
245
37. EDWARDS, A.D., and PlCARD, A., Bonding Properties of ! in. dia.
strand. ACI. J. Proe. Vol. 69, No. 11, (Nov.1972) pp 684-689.
38. FERGUSON, P.M., BREEN, J.E., and THOMPSON, J .N., Pull-out Tests
on High Strength Reinforced Bars. ACI,J. Proe. Vol. 62, No. 8,
(Aug.1965) pp 933-950.
39. FERGUSON, P.M., Small Bar Spacing or Cover - a Bond Problem
for the Designer. ACI, J. Proe. Vol. 74 , No. 9, (Sept.1977),
pp 435-439.
40. MATHEY, R.G., and WATSTEIN, D., Investigation of Bond in Beam
and Pull-out Specimens with high-yield Strength Deformed Bars.
ACI.J. Proe. Vol. 32, No. 9, (March 1961), pp 1071-1090.
41. REHM, G., Veber Die Grundlagen des Verbundes zurisehen Stahl
und Beton. (The fundamentals of bond between steel reinforce
ment and concrete) (1961), Cement and Concrete Assoe. Library
Translation No. 134.
42. NGO, P., and SCORDELIS, A.L., Finite Element Analysis of
Reinforced Concrete Beams. ACI. J. Proe. Vol. 64, No. 3, (March
1967) pp 152-163.
43. LUTZ, L.A., Analysis of Stresses in Concrete near a Reinforcing
Bar due to Bond and Transverse Cracking. ACI.J. Proe, Vol. 67,
No.lO, (Oct.1970) pp 778-787.
44. NILSON, A.H., Non-linear Analysis of Reinforced Concrete by the
Fini te Element Method. ACI. J. Proe. Vol. 65, (Sept.1968)
pp 757-766.
246
45. ALLWODD, R.J., Reinforcement Stresses in a Reinforced Concrete
Beam-column Connection. Magazine of Concrete Research. Vol, 32,
No.H2, (Sept.1980) pp 143-147.
46. PINCHIN, D.J., The Cement-steel Interface: friction and adhesion,
Ph.D. dissertation, UniverSity of Cambridge, (April 1977).
47. BARTOS, P., Bond characteristics in fibrous composites with
brittle matrices, Ph.D. dissertation, University of Southampton,
(March 1977).
48. TEPFERS, R., Bond Stresses along lapped reinforcing bars.
Magazine of Concrete Research. Vol. 32, No. 112, (Sept. 1980),
pp 135-143.
49. CAIRNS, J., An Analysis of the Ultimate Strength of Lapped Joints
of Compression Reinforcement. Magazine of Concrete Research.
Vol. 31, No. 106, (March 1979) pp 19-28.
50. WURZNER, K., Uber die Ursache der Haftung des Betons an Eisen in
Eisenbeton-konstruktionen. Zement. Vol. 19, (1937).
51. VON RODT, Der Erhartungsvorgang auf Physikalischer Grundlage.
Zement, Vol. 22, (1940).
52. POGANY, A., Neuere Untersuchungen Uber das Wesen der Haftfestigkeit.
Zement, Vol. 19, (1940).
53. MARTIN, H., Die Haftung der Bewehrung in Stahlbeton. Radex -
Rundschau, No. 2, (April 1967) pp 486-509.
54. SCHNITTGRUND, G.D., and SCOTT, J.K., Bonding between Cement
Hydrates and Steel. Construction Engineering Research Lab.,
Technical Manuscript M-176, (Jan. 1976).
247
55. ALEXANDER, K.M., The M3chanism of 91ear F.ai1ure at the Steel-
cement and Aggregate-cement Interface. Int. Conf. on SD1id
'Mechanics and Engineering Design in Civil Engineering Materials.
University of Southampton. (April 1969). pp 317-326.
56. BROWN, C.B., Bond failure between Steel and Concrete. Journal
of the Franklin Inst. Vol. 282, No. 5 (Nov. 1966) pp 271-290.
57. PI NCHlN , D.J., and TABOR, D., Interfacial Phenomena in Steel
Fibre Reinforced Cement, 1 : Structure and Strength of the Inter-
facial Region. Cement and Concrete Research, Vol. 8, No. 1
(1978) pp 15-24.
58. TAKAKU, A., and ARRIDGE, R.G.C., The Effect of Interfacial
Radial and Shear Stress on Fibre Pull-out in Composite Materials.
J. Phys. (D), Appl. Phys., 6, (1973) pp 2038-2047.
59. COWAN, H.J., The Theory of Prestressed Concrete Design,
(Macmillan & Co. Ltd., 1956) P 135.
GO. KEMP, E.L., BREZNEY, F.S., and UNTERSPAN, J.A., Effect of Rust
and Scale on the Bond Characteristics of Deformed Reinforcing
Bars. ACI.J. Proc. Vol. 65, No. 9, (Sept.1968) pp 743-756.
61. LUTZ, L.A., and GERGELY, P., Mechanics of Bond and Slip of
Deformed Bars in Concrete. ACI. J. Proc. Vol. 64, (Nov.1967),
pp 711-721.
62. TEPFERS, R., Cracking of Concrete Cover along Anchored Deformed
Reinforcing Bars. Magazine of Concrete Research. Vol. 31, No.
106, (March 1979) pp 3-13.
" 63. SORETZ, S., and HOLZE"lilEIN, H., Influence of Rib Dimensions of
Reinforcing Bars on Bond and Bendability. ACI. J. Proc. Vol. 76,
(Jan. 1979) pp 111- 125.
248
64. TAYLOR, H.P.J., CLARKE, J.L., Some Detailing Problems in Concrete
Frame Structures. The Structural Engineer, Vol. 54, No. I,
(Jan. 1976) pp 19-32.
65. ORANGUN, C.O., JIRSA, J.O. and BREEN, J.E., The Reevaluation of
Test Data on Development Length and Splices. ACI. J. Proc. Vol.
74, No. 3, (March 1977) pp 114-122.
66. UNTRAUER, R.E. and HENRY, R.L., Influence of Normal Pressure
on Bond Strength. ACI. J. Proc, Vol. 62, No. 5, (May 1965),
pp 577-585.
67. ROBINS, p.J., Unpublished Results on Effect of Lateral Pressure
on Bond of Deformed Bars. Department of Civil Engineering,
Loughborough Univer~ty of Technology.
68. The Council for Codes of Practice, British Standards Inst.,
,The Structural Use of Concrete, Code of Practice 114,
( Sept, 1957).
69. HUGHES, B.P. ,_", BAHRAMI AN , B., Cube Tests on the Uniaxial
Compressive Strength of Concrete. Magazine of Concrete Research.
Vol. 17, No. 53, (Dec. 1965) pp 177-182.
70. British Standards Inst., Methods for Tensile Testing of Metals.
8818;Part 1:1970.
71, British Standards Inst., Specification for Hot Rolled Steel Bars
for the Reinforcement of Concrete. 884449:1978.
72. British Standards Inst., Specification for Cold Worked Steel Bars
'for 'the Reinforcement of Concrete. 884461:1978,
73. LYTAG GENERAL INFORMATION BROCHURE, The All-round Lightweight
Aggregate, (Sept.1967) p 8.
249
74. GRlMER, F.J., The Full Stress-strain Curve of Lightweight
Aggregate Concrete. Session B. First International Congress on
Lightweight Concrete. Vol. 2 Discussion. (May 1968) pp 61.
75. MIHUL, A., Measuring the Shear Strength of Lightweight Aggregate
Concrete. Session B. First International Congress on Lightweight
Concrete. Vol. 2 : Discussion. (May 1968) pp 100.
76. GERRITISE, A., Design Considerations for Reinforced Lightweight
Concrete. Ho11andsche Beton Groep N.V. Supplementary Paper
CI-80 (April 1980).
77. NEVILLE, A.M., Properties of Concrete, Second Ed. (Pitman Pub.
Ltd. 1973).
78. British Standards Inst., Methods of Testing Hardened Concrete for
other than Strength. BS1881: part 5 : 1970.
79. PICKETT, G., Effect of Gypsum Content and other Factors on
Shrinkage of Concrete Prisms. ACI. J. Proc. Vol. 44, (Oct.1947),
pp 149-75.
80. HELMY, I.M:;:, Bond and Cracking in Concrete Members with Plain
Reinforcing Bars. Ph.D. Thesis, Leeds University (March 1978).
81. CAIRNS, J. and JONES, K., Bond Performance of Ribbed Reinforcing
Bars in Lapped Joints. Procs. Int. Conf. on Bond in Concrete.
Paisley College of Technology (App1d. Science Pub. London. June
1982) pp 342-353.
82. VOELLMY, A. and BERNARDI, B., Remarques sur l'adherence et la
formation des fissures dans le beton arme, RlLEM Symposium on
Bond and Crack Formation in Reinforced Concrete, Vol. 2, Stockholm,
Sweden (1957) pp 347-359.
83. FARNDON, S.J., The Effect of Normal Pressure on Bond in Lightweight
Concrete. Final Year Proj. Dept. Civil Eng. Loughborough University,
(April 1982) P 112.
250
84. U.S. Federal Test Method Standard No. 406, Method 1041, (Oct.196l).
85. REYNOLDS, G.C., and BEEBY, A.W., Bond Strength of Deformed Bars.
Proc. Int. Conf. on Bond in Concrete. Paisley College of Tech.
(Appld. Science Pub. London. June 1982). pp 434-446.
86. TIMOSHENKO, S., Strength of Materials part 11. 3rd Ed.
(D. van Nostrand Company, Inc., 1956).
,87. FERGUSON, P.M., Reinforced Concrete Fundamentals. 4th Ed.
(John Wiley and Sons Inc, 1979).
88. TINSLEY TELCON LTD. Strain gauges TT4-79 Technical Brochure.
89. Commodore Business Computer. Users Guide. Series 8000 (1980).
90. Solartron Instrumentation Group. System Voltmeters 7060.
Operating Manual. Issue 1 (August 1980).
91. Solartron Instrumentation Group. Minate 7010. Analog Scanner.
Operating Manual. Issue 1. (Dec. 1979).
92. CIRIA Design Guide 2. The Design of Deep Beams in Reinforced
Concrete. Ove Arup and Partners and CIRIA, London. (Jan.1977),
p 131.
93. DE PAIVA, H.A.R. and SIESS, C.P., Strength and Behaviour of Deep
Beams in Shear. Proc. A.S.C.E., Vol. 91, ST5, (Oct.1965) pp 19-41.
94. Bibliography on Deep Beams, Library Bibliography No. Ch. 71
(3/69), Cement and Concrete Assoc. London, (1969) p 8.
95. SWAMY, R.N., ANDRIOPOULOS, A., and ADEPEGBA, D., Arch Action and
Bond in Concrete Shear Failures. Proc. A.S.C.E., Vol. 96,
ST6, (June 1970) pp 1069-1091.
96. POULL, A. Stress Analysis of Deep Beams and Walls. Engineer, Vol. 221,
No. 5744, (Feb. 1966) pp 310-312.
251
97. NlLSON, A.H., Non-linear Analysis of Reinforced Concrete by the
Finite Element Method. ACI. J. Proc. Vol. 65, No. 9,
(Sept. 1968) pp 757-766.
98. ROBINS, P.J., Reinforced Concrete Deep Beams Studied Experimentally
and by the Finite Element Method. Ph.D. thesis, University of
Nottingham, (October 1971) p 258.
99. CONWAY, H.D., CHOW, L. and WINTER, G., Stresses in Deep Beams.
Proc. A.S.C.E., Vol. 78, Separate No. 127, (May 1952) pp 686-708.
100. DISCHINGER, F., Beitragzur Theorie der Ha1bscheibe und des
wandartigen ba1ken. Int. Assn. for Bridge and Structural Engineers
Publications, Zurich,-Vo1. 1, (1932) pp 69-93 •
. 101. UHLMANN, H.L.B., The Theory of Girder Walls with Special
Reference to Reinforced Concrete Design. Struct. ,Eng., Vol. 30,
(Aug. 1952) pp 172-181.
102. SAAD, S., and HENDRY, A.W., Stresses in a Deep Beam with a Central
Concentrated Load. Exp. Mech., Vol. 1, No. 6, (June 1961)
pp 192-198.
103. PORTLAND CEMENT ASSOCIATION. DeSign of Deep Girders. Concrete
Information No. ST66, (1946) plO.
104. GEER, E., Stresses in Deep Beams. Proc. ACI. J. Vol. 56,
(Jan. 1960) pp 6517661.
105. CRIST, R., Static and Dynamic Shear Behaviour of uniformly
Loaded Reinforced Concrete Deep Beams. Ph.D. thesis, University
of New Mexico, (1971), p 249.
252
106. VARGHESE, P.C., and KRISHNAMOORTHY, C.S., Strength and Behaviour
of Deep Reinforced Concrete Beams.- Indian Concrete Journal, Vol.
40, No. 3, (March 1966) pp 104-108.
107. LEONHARDT, F. and WALTHER, R., Deep Beams. Bulletin 178, Deutscher ..
Ausschus fur Stahlbeton, Berlin, (1966), p 159.
108. KONG, F.K. and ROBINS, P.J., Shear Strength of Reinforced Concrete
Deep Beams. Concrete, Vol. 6, No. 3, (March 1972) pp 34-36.·
109. REYNOLDS, C.E., and STEEDMAN, J.C., Reinforced Concrete Designer's
Handbook. 9th Ed. (A Viewpoint Publication 1981). pp 402.
o 110. NYLANIJER, H., and HOLST, H •. , Nagra undersokningar rorande skiror
och hoga baltcar ar armerad betong (some investigations relating
to reinforced concrete beams), Transaction - Royal Tech. University
Stockholm, No. 2 (1946).
Ill. CARDENAS,A.E.,HANSON,J.M, CORLEY,nG., and HOGNESTAD, E.,
Design Provision for Shear Walls. ACI. J. Proc. Vol. 70,
No. 3, (March 1973), pp 221-230.
112. KONG, F.K., and SINGH, A., Shear Strength of Lightweight Concrete
Deep Beams subjected to repeated Loads. ACI Publication SP42 :
Shear in Reinforced Concrete, ACI (1974) pp 461-476.
113. KONG, F.K., and SHARP, G.R., Shear Strength of Lightweight Re-
inforced Concrete Deep Beams with Web Openings, The Structural
Engineer, Vol. 51, No. 8, (Aug. 1973)(pp 267-275).
114. KONG, F.K., and SINGH, A., Diagonal Cracking and Ultimate Loads
of Lightweight Concrete Deep Beams, ACI. J. Proc. Vol. 69, No. 8,
(Aug. 1972) pp 513-521.
253
115. KONG, F.K. and ROBINS, p.J., Web Reinforcement Effects on
Lightweight Concrete Deep Beams, ACI. J. Proc. Vol. 68, No. 7,
(July 1971) pp 514-520.
116. MANUEL, R.F., SLIGHT, B.W., and SUTER, G.T., Deep Beam Behaviour
affected by Length and Shear Span Variations. ACI. J. Proc.
Vol. 68, No. 12, (Dec. 1971) pp 954-958.
117. TANER, N., FAZIO, P.P., and ZIELINSKI, Z.A., Strength and
Behaviour of Beam-panels. Tests and Analysis. ACI. J. Proc.
Vol.74, No. 10, (Oct. 1977) pp 511-520.
118. WINTER, G. and NILSON, A.H., Design of Concrete Structures.
9th Ed. (McGraw-Hill Book Co. 1979).
119. DE COSSIO, R., and SIESS, C.P., Behaviour and Strength in
Shear of Beams and Frames without Web Reinforcement. ACI. J.
Proc. Vol; 56, No. 2, (Feb.1960) pp 695-735.
120. MATTOCK,A.H.,. Discussion of Reference ACI. J. Proc. Vol. 29,
No. 6, (Dec.'1951) in ACI. J. Proc. Vol. 53,
pp 145-156. pp 1352-1353.
121. RAMAKRISHNAN, V., and ANANATHANARAYANA, Y., Ultimate Strength
of Deep Beams in Shear. ACI. J. Proc. Vol. 65, No. 2,
(Feb. 1968) pp 87-98.
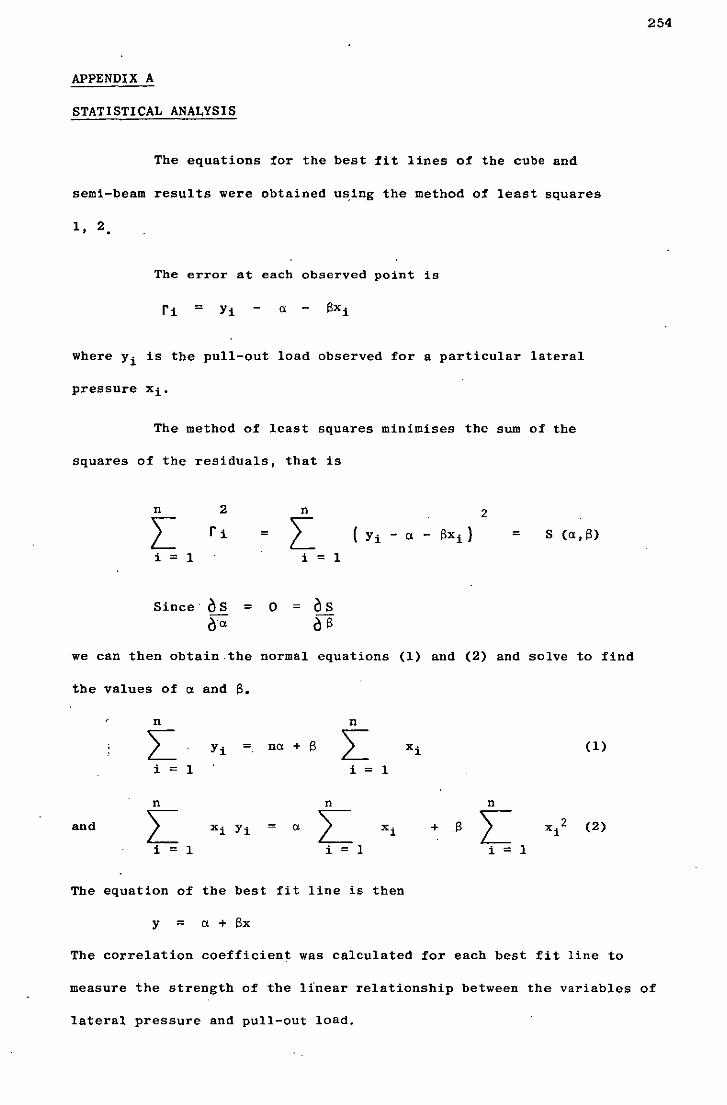
APPENDIX A
STATISTICAL ANALYSIS
The equations for the best fit lines of the cube and
semi-beam results were obtained using the method of least squares
1. 2
The error at each observed point is
where Yi is the pull-out load observed for a particular lateral
pressure xi-
The method of least squares minimises the sum of the
squares of the residuals, that is
n n 2
[ L S (a.ll)
i = 1
Since' 0 S = Oa
i = 1
o = 0 S
~
we can then obtain.the normal equations (1) and (2) and solve to find
the values of a and Il.
n n
L na + Il L i = 1 i = 1
and
The equation of the best fit line is then
Y a + Ilx
x 2 1
(1)
(2)
The correlation coefficient was calculated for each best fit line to
254
measure the strength of the Ifnear relationship between the variables of
lateral pressure and pull-out load.
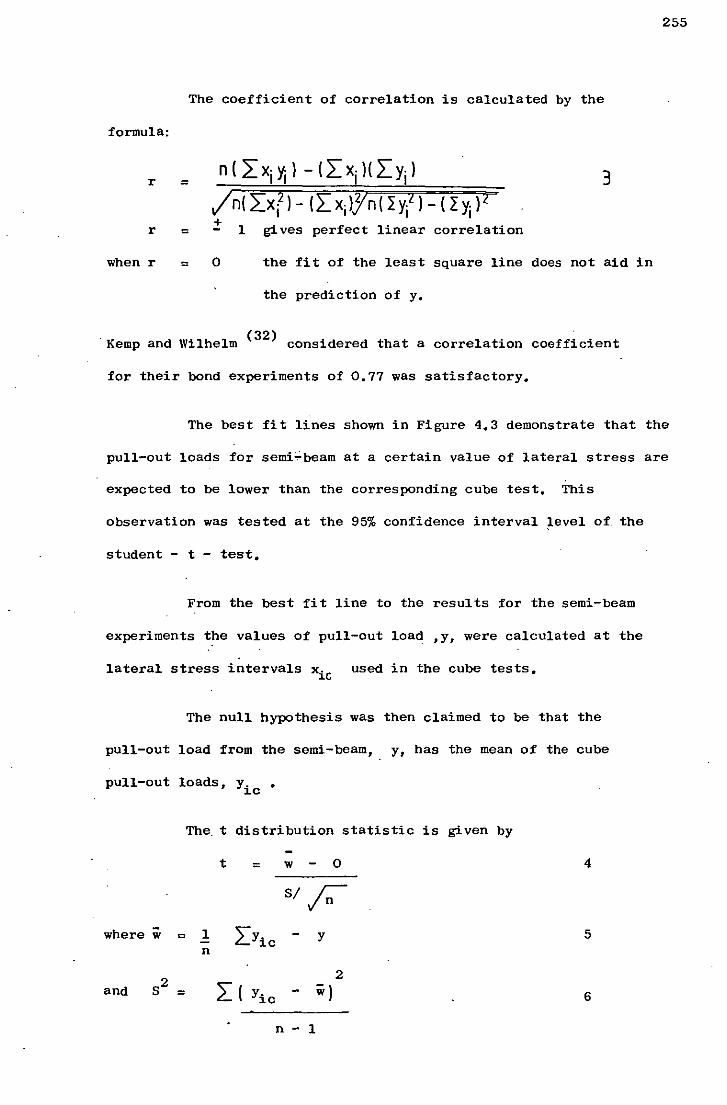
255
The coefficient of correlation is calculated by the
formula:
r = n ( L x, ~. ) - ( 2:: X· )( 2:: y. )
I I I I 3 In( LXjZ) - (2:: xjljn( zYjZ) - (LYj )1 + 1 gives perfect linear correlation r =
when r = 0 the fit of the least square line does not aid in
the prediction of y.
'Kemp and Wilhelm (32) considered that a correlation coefficient
for their bond experiments of 0.77 was satisfactory.
The best fit lines shown in Figure 4.3 demonstrate that the
pull-out loads for semi;beam at a certain value of lateral stress are
expected to be lower than the corresponding cube test. This
observation was tested at the 95% confidence interval level of the
student - t - test.
From the best fit line to the results for the semi-beam
experiments the values of pull-out load ,y, were calculated at the
lateral stress intervals xic used in the cube tests.
The null hypothesis was then claimed to be that the
pull-out load from the semi-beam, y, has the mean of the cube
pull-out loads, Yic •
The, t distribution statistic is given by
t = w 0 4
SI ;;:-where w = 1 2::Yic Y 5
n
S2 2
and = 2::( Yic w) 6
n - 1
256
n = number of observations.
For the null hypothesis to be correct at the 95% level the
value. of t in equation 4 must be less than t o .025
from Tables
wi th n ,., 1 degrees of freedom. I f the value of t > t 0.025 then
the null hypothesis is rejected and the di~ference in results between
the semi-beam and cube test methods is significant at the 5% level
of the student - t - test.
REFERENCES
BAJPAI, A.C ... MUSTOE, L.R., and WALKER, D. , Advanced Engineering
Mathematics. (John Wiley & Son, 1977).
FREUND, J.E., Modern Elementary Statistics .4th Ed. (Prentice/Hall
International, Inc, London, 1973),


![[XLS] · Web view1 140 2 140 3 140 4 140 5 140 6 140 7 140 8 140 9 140 10 140 11 140 12 140 13 140 14 140 15 140 16 140 17 140 18 140 19 140 20 140 21 140 22 140 23 140 24 140 25](https://img.pdfslide.net/doc/110x75/5b0e34b97f8b9a96478b4bbf/xls-view1-140-2-140-3-140-4-140-5-140-6-140-7-140-8-140-9-140-10-140-11-140-12.jpg)