Embed Size (px)
Citation preview
THE EFFECT OF LOWER LIMB LOADING ON ECONOMY AND KINEMATICS
OF SKATE ROLLER SKIING
by
Tyler Johnson Reinking
A thesis submitted in partial fulfillment of the requirements for the degree
of
Master of Science
in
Health and Human Development
MONTANA STATE UNIVERSITY Bozeman, Montana
May 2014

©COPYRIGHT
by
Tyler Johnson Reinking
2014
All Rights Reserved
ii
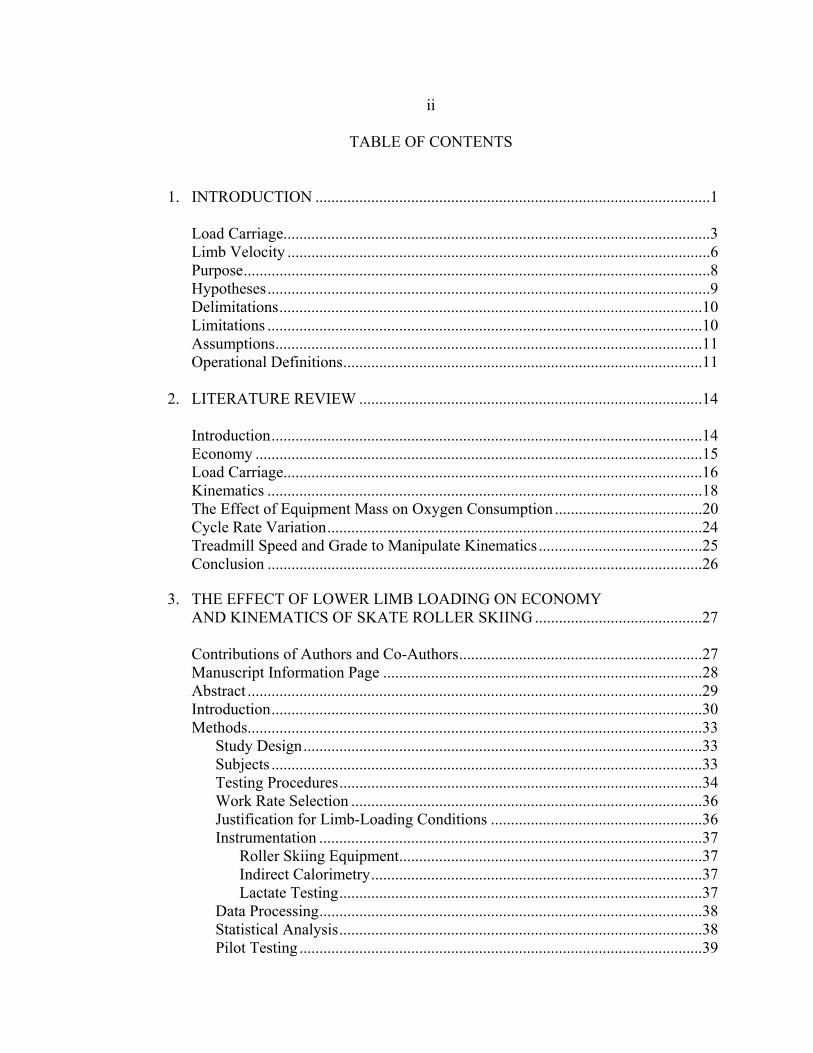
TABLE OF CONTENTS
1. INTRODUCTION ...................................................................................................1
Load Carriage...........................................................................................................3 Limb Velocity ..........................................................................................................6 Purpose .....................................................................................................................8 Hypotheses ...............................................................................................................9 Delimitations ..........................................................................................................10 Limitations .............................................................................................................10 Assumptions ...........................................................................................................11 Operational Definitions ..........................................................................................11
2. LITERATURE REVIEW ......................................................................................14
Introduction ............................................................................................................14 Economy ................................................................................................................15 Load Carriage.........................................................................................................16 Kinematics .............................................................................................................18 The Effect of Equipment Mass on Oxygen Consumption .....................................20 Cycle Rate Variation ..............................................................................................24 Treadmill Speed and Grade to Manipulate Kinematics .........................................25 Conclusion .............................................................................................................26
3. THE EFFECT OF LOWER LIMB LOADING ON ECONOMY
AND KINEMATICS OF SKATE ROLLER SKIING ..........................................27 Contributions of Authors and Co-Authors .............................................................27 Manuscript Information Page ................................................................................28 Abstract ..................................................................................................................29 Introduction ............................................................................................................30 Methods..................................................................................................................33
Study Design ....................................................................................................33 Subjects ............................................................................................................33 Testing Procedures ...........................................................................................34 Work Rate Selection ........................................................................................36 Justification for Limb-Loading Conditions .....................................................36 Instrumentation ................................................................................................37
Roller Skiing Equipment............................................................................37 Indirect Calorimetry ...................................................................................37 Lactate Testing ...........................................................................................37
Data Processing ................................................................................................38 Statistical Analysis ...........................................................................................38 Pilot Testing .....................................................................................................39

iii
TABLE OF CONTENTS – CONTINUED
Results ....................................................................................................................40 Subjects ............................................................................................................40 Physiological Variables ...................................................................................40 Reliability Analysis ..........................................................................................41 Cycle Rate ........................................................................................................43
Discussion ..............................................................................................................44 Physiological Variables ...................................................................................44
Primary Analysis ........................................................................................44 Sub-Analysis ..............................................................................................45 Reliability ...................................................................................................45 Cardiovascular Drift...................................................................................46
Cycle Rate ........................................................................................................51 Future Considerations ......................................................................................52 Conclusions ......................................................................................................53
4. CONCLUSIONS....................................................................................................55
REFERENCES CITED ................................................................................................58 APPENDICES .............................................................................................................64
APPENDIX A: Subject Consent Form ...........................................................65 APPENDIX B: Health History Quesionnaire .................................................71

iv
LIST OF TABLES
Table Page
2.1 Effect of added mass on running and walking studies. Percent differences in oxygen consumption (VO2) from the control condition have been standardized to the observed increase per 100 grams per foot ......................................................................................23 3.1 Mean oxygen consumption (VO2) and heart rate (HR) for a subject with four different limb loads during a pilot test. The percent difference in VO2 from the control condition is also listed. ............................................................39 3.2 Subject Demographics (Mean±SD) .....................................................40 3.3 Physiological values (Mean ± SE) observed at each limb load condition for both low (L) and high (H) work rates. ...................41 3.4 Physiological variables by testing sequence and work rate (Mean ± SE) .................................................................41 3.5 ANOVA p-values comparing the mean values for physiological variables during the fourth minute with the same values from the fifth minute at each test stage. Note that each skier performed only one of the work rates for each stage (i.e., either 1 (L) or 1 (H) but not both) for a total of 8 of the 16 stages .............................................42

v
LIST OF FIGURES
Figure Page
3.1 Mean (±SE) cycle rate values for each limb load condition at both high and low work rates. Cycle rates at the low work rate were all statistically lower (p<0.05) than those at the high work rates ...........................................43

vi
ABSTRACT It has been proposed that skate skiing economy and racing performance have improved as a result of lighter equipment. Despite the many studies that have found running and walking economy to improve with lighter shoes, there are no published studies that show any relationship between the mass of skate skiing equipment and markers of skate skiing performance. To investigate the effects of skate skiing equipment mass on markers of performance, this study added mass to the lower limbs of skate roller skiers and measured changes in economy and gross movement kinematics. Twelve male (Mean±SD; Age (yrs): 21.4±3.9) and eight female (Mean±SD; Age (yrs): 19.9±2.2) competitive cross-country skiers completed two laboratory visits to roller ski on an oversized treadmill. In the first visit, subjects completed a graded exercise test to determine their lactate threshold. In the second visit, subjects completed 5 minutes of roller skiing at a low work rate (2 m/s for women and 3 m/s for men both at 2⁰) and a high work rate (2 m/s for women and 3 m/s for men both at 3.15⁰) for each of the four limb loading conditions (0 g, 200 g, 400 g, and 600 g). Oxygen consumption (VO2), heart rate (HR), and cycle rate were measured during the last 2 minutes of each stage and used for analysis. There were no significant differences in HR, VO2, or cycle rate between any of the limb loading conditions at either work rate. However, cycle rate neared significance (P = 0.06), with increases in cycle rate observed during greater limb loading. Interestingly, VO2 and HR significantly increased throughout testing, independent of limb loading condition. The most notable increases were observed in HR values, and increases began within the very first testing stage. Thus, it is likely that the subjects experienced cardiovascular drift due to mild hyperthermia. The effects of hyperthermia might have masked the true effects of lower limb loading. Therefore, future studies still need to investigate the effects of lower limb loading on skate skiing economy and kinematics.

1
1. INTRODUCTION
In the late 1980s, cross country ski manufacturers began developing equipment
that was specifically designed for skate skiing. Since then, the design of skate ski
equipment and the manufacturing materials have continually evolved. For example, the
material composition of skis, boots, and poles have changed to lighter materials.
Specifically, the plastic soles and cuffs of skate ski boots, the wood cores of skis, as well
as fiberglass ski pole shafts have all been replaced, primarily with carbon fiber. As a
result, the use of modern materials within elite-level equipment has greatly decreased the
mass of modern cross country ski equipment.
Complementing the evolution of ski equipment is the ever-increasing speeds
observed in Nordic ski racing. For example, 10 km skate ski race times decreased by
27.4% from the 1985 World Championships to a 2012 World Cup race (31.0 minutes in
1985 to 22.5 minutes in 2012; fis-ski.com 2013). While skiing times are each affected by
varying snow conditions and course profiles, these two times are representative of a
typical time to complete the 10 km during the respective race seasons. Certainly,
advances in training programs and sports nutrition have contributed to some of this
improvement. However, if training and nutrition were the primary causes of this change,
then similar time improvements would be expected in other endurance sports. For
example, the 10 km run is an endurance-based competition with similar metabolic
demands to Nordic skiing, so improvements in race times due to training and nutrition
advances should be comparable over the same time period. However, the winning time
in the 10,000 m run on the track at the 2012 Olympics was only 1.0% faster than the

2
same event at the 1984 Olympics (27:30.42 in 2012, 27:47.54 in 1984), which indicates
that additional factors have contributed to the improvement in Nordic ski race times
(Olympic.org 2013). Among the proposed factors that have added to the increased speed
in Nordic skiing are improvements in trail grooming, ski waxing, and equipment (Street
1992). Although Street (1992) postulated that the decreased mass of ski equipment likely
contributed to the incredible improvement in ski race times, no studies have evaluated the
relationship between Nordic ski equipment mass and skiing performance.
A study addressing equipment mass be useful from a historical perspective, and it
would also be useful for evaluating current equipment. A common claim by ski
equipment manufacturers is a reduction in equipment mass between generations. Ski
equipment generally gets lighter with each generation, but it is unknown how much of a
decrease in mass is needed to impact performance. For example, the elite line of skate
ski boots for one company will drop about 450 g when their new skate boots become
available during the 2013-2014 ski season (from the S-Lab Pro, 1300 g, to the Carbon
Skate, approximately 850 g; A. Gerlach, personal communication). Additionally, other
ski companies have recently reduced the mass of their equipment. For example, much of
the elite equipment unveiled for the 2010-2011 season was lighter according to the gear
review published in Cross-Country Skier magazine (Cross-Country Skier Magazine
2010). Specific mass decreases included 175 g from Rottefella’s top line of bindings,
160 g from Atomic’s Featherlight World Cup skis, and 200 g from Rossignol’s Xium
World Cup skate boots (all reductions per pair). Similarly, differences in mass exist
between many entry level packages and elite racing packages. For example, a skate ski

3
package could weigh approximately 3000 g (Fischer CRS 187 cm skis, Salomon Pilot
Equipe bindings, and size 42 Salomon S-Lab Pro boots; rei.com 2013; Salomon Nordic
2012). In contrast, another option for the same skier could weigh 2260 g (Fischer
Carbonlite RCS 187 cm skis, Rottefella Xcelerator bindings, and size 42 Rossignol Xium
WC boots; rossignol.com 2013; skinnyskis.com 2013). Whether or not this 740 g
difference would significantly affect skiing performance is unknown.
Load Carriage
It has been documented that additional mass added to the body increases the
energy required to move. At submaximal activity levels, the energy expended to move
can be calculated by measuring oxygen consumption, and a person’s oxygen
consumption required to move at a set absolute work rate has been termed “economy”
(Cavanagh & Kram 1985a). The extent to which load carriage impacts economy depends
not only on the amount of mass added, but also the placement of the mass. Additional
mass placed on the torso will cause a relative increase in oxygen consumption (VO2)
directly proportional to the relative increase in total mass (Taylor et al. 1980). As the
mass is placed more distally (e.g., on the lower extremity), the effect on VO2 increases
substantially. The larger VO2 increase is caused, in part, by the greater distance traveled
by any given point on the lower extremity than the torso. In the case of skis, bindings,
and boots, the mass not only has to be moved forward with the skier’s center of mass, it
also must be moved laterally with every leg push during skating. Another reason greater
VO2 changes are observed when mass is added more distally is because of the effect mass

4
has on torque requirements. In skate skiing, every stride consists of accelerating the leg
about the hip axis using a forceful abduction phase followed by a swing adduction phase
to return the leg to a neutral position. According to the rotational component of
Newton’s second law of motion, the torque required to create angular acceleration is
proportional to the moment of inertia of the object (the leg and equipment), which is
exponentially related to the radius from the axis (hip joint). Hence, as a load is placed
more distally on the limb, the torque necessary to accelerate the limb will increase
exponentially. Because more torque is required during each stride when the limb is
loaded, the leg muscles must generate more force, and thus expend more energy, for a
given rate of limb movement.
Many researchers have documented increases in energy expenditure due to limb
loading while running (Divert et al. 2008; Franz, Wierzbinski, & Kram 2012; Jones et al.
1984; Martin 1984; & Myers & Steudel 1985). The researchers have all found that VO2
increases by between 0.9 - 1.5% for every additional 100 g on each foot. Since these
studies have found very similar findings despite using a variety of subject populations, it
is unlikely that other variables such as gender, length of the lower limb, and amount of
muscle mass on the lower limb substantially change the effect of limb loading on running
economy. A similar effect is expected in Nordic skiing because Stöggl & Müller (2009)
noted that skiing and running have similar energetic demands and neural patterns.
Adding a load to the upper extremity during walking has also been found to increase
energy expenditure (Hendrickson, Porcari, Terry, Walsko, & Walter 1997; Rodgers,
VanHeest, & Schachster 1995). In each study, VO2 increased while walking with poles

5
compared to walking without poles. Adding mass in the form of poles to the hands is
similar to adding mass to the lower extremity in the form of Nordic skis because the mass
is located beyond the most distal point of the limb. Given the research on running shoes
and hiking poles, it is reasonable to assume that a similar relationship exists between the
amount of added mass on the lower limb and increases in energy expenditure during
Nordic skiing. However, no published studies are available to verify that a similar
relationship exists.
Interestingly, a pilot test of limb loading for one subject during skate roller skiing
indicated that the effect of added mass on skate roller skiing economy may be smaller
than what has been documented in running. Specifically, the subject consumed 1% more
VO2 for 500 g of added mass per foot. This is in contrast to research on running, which
has consistently found that the addition of only 100 g per foot will cause a 1% increase in
VO2. Clearly, there might be a difference in the effect of limb loading in skate skiing
compared to running. It is possible that runners are more sensitive to limb loading
because the foot is lifted higher off the ground during a running stride compared to a
skate skiing cycle. Further, stride rates used during running are typically faster than the
cycle rates used in skate skiing because skiers can utilize glide to increase their cycle
length, whereas runners cannot. The faster rate of limb movement in running might
cause a greater effect of lower limb loading on running economy compared to skate
skiing economy. However, a full study is necessary to investigate the relationship
between added mass on the foot and economy of skate skiing.
6
Load carriage on the limbs while Nordic skiing is also likely to influence gross
skiing kinematics, such as cycle length and cycle rate. These movement kinematic
variables are of importance because many researchers have found that the cycle rate
and/or cycle length used by skiers while racing are correlated to their skiing velocity
(Andersson et al. 2008; Bilodeau et al. 1996; Millet et al. 1998; Rundell & McCarthy
1996; Sandbakk et al. 2011; Stöggl & Müller 2009). Further, Sandbakk et al. (2011)
found a correlation between the cycle rate used during submaximal roller skiing and
performance in ski races. Cycle rate and cycle length are theorized to be affected by limb
loading because limb loading has been found to influence gross running kinematics. For
example, several researchers have documented that an increase in the mass of a runner’s
shoes led to decreased stride rate (Divert et al. 2008; Lussiana, Fabre, Hebert-Losier, &
Mourot 2013). Since both running and skiing involve a stride cycle consisting of
accelerating the foot in opposing directions, including both a propulsive and a swing
phase, it is possible that limb loading will similarly affect stride rate (i.e., cycle rate) in
skiing. However, there are no published studies documenting the effect of added mass on
cycle rate or cycle length in Nordic skiing.
Limb Velocity
The effect of additional limb mass on economy and movement kinematics of
skate roller skiing might vary with the skier’s cycle rate. For example, it was noted
earlier that a substantial portion of the energy required to move is devoted to accelerating
the limbs, and that small changes in mass on the distal point of the limb will greatly

7
impact the force required to cause the acceleration. Myers & Steudel (1984) supported
this conclusion and calculated that the proportion of energy devoted to swinging the
limbs substantially increases with increased limb velocities. Increases in cycle rate are
responsible for these changes in limb velocities because a faster cycle rate forces the
limbs to complete a similar range of motion in a shorter amount of time. Therefore, it
might be beneficial to investigate the effects of limb loading at two different cycle rates,
so that researchers can investigate whether an interaction exists between cycle rate and
added mass on economy.
In previous studies, cycle rates have been shown to change with work rate
(Lussiana et al. 2013; Stöggl & Müller 2009). While it is possible that cycle rate will
vary slightly with altered limb loading, the changes in cycle rate are expected to be small
relative to the changes associated with changing work rate. For instance, Lussiana et al.
(2013) found that increasing the mass of running shoes by 146 g per foot caused stride
rate to decrease by approximately 0.035 Hz, whereas increasing the treadmill grade from
-8% to +8% caused an increase in stride rate of 0.140 Hz. Similarly, Divert et al. (2008)
found that the stride rate of runners significantly increased by 0.050 Hz with an addition
of 350 g per foot. However, larger stride rate changes result from varied work rates. For
instance, in Nordic skiing, Stöggl & Müller (2009) found cycle rate increased by 0.100
Hz while roller skiing at a grade of 8% compared to roller skiing at a grade of 2%. As a
result, testing roller skiers at two different work rates will induce notable cycle rate
changes and allow researchers to investigate the interaction between cycle rate and added
mass on VO2.
8
This study will investigate the relationship between added mass on the limb with
changes in economy (submaximal VO2) and movement kinematics (cycle length and
cycle rate) at two different work rates. Specifically, mass will be added to the ankle
outside of the boots to simulate changes in equipment mass. While adding mass in this
manner will not perfectly replicate the distribution of added mass throughout the
ski/boot/binding system, this study will serve as an initial examination of the effect of
changing equipment mass on economy and movement kinematics. For example, the
placement of added mass on the outside of the boot might underestimate the true effect
because additional mass from the ski has a greater radius from the hip axis and has an
even greater effect on torque. Thus, differences in economy and movement kinematics
observed in this study due to added mass could be even greater when the added mass is
distributed throughout the equipment. The mass added to the boots in this study,
however, should provide a necessary initial investigation into the effect of added mass on
economy and movement kinematics of Nordic skate roller skiing.
Purpose
The primary purpose of this study was to identify the effects of added lower limb
mass on economy during submaximal skate roller skiing. A secondary purpose was to
determine the effects of added lower limb mass on movement kinematics during the same
activity. The third purpose was to investigate whether the observed changes in economy
and movement kinematics varied with work rate.

9
Hypotheses
The primary null hypothesis (H0) was that no differences existed between the
mean oxygen consumption (VO2) values for the different limb-loading conditions. The
alternative hypothesis (HA) was that the mean VO2 for at least one added mass condition
was greater than the mean VO2 for the control condition (i.e., no added mass).
H0: µM0 = µMx
HA: µM0 < µMx
where µM0 represented the population mean for VO2 while roller skiing at a standardized
work rate with no additional mass, and µMx represented population means for VO2 while
roller skiing at a standardized work rate with added mass (x) for at least one limb load
condition.
The secondary null hypothesis (H0) was that no differences existed between the
mean movement kinematic (i.e., cycle rate) values for the different limb-loading
conditions. The alternative hypothesis (HA) was that the mean movement kinematics for
at least one added mass condition was different from the mean movement kinematics for
the control condition.
H0: µM0 = µMx
HA: µM0 ≠ µMx
where µM0 represented the population mean for cycle rate while roller skiing at a
standardized work rate with no additional mass, and µMx represented population means
for cycle rate while roller skiing at a standardized work rate with added mass (x) for at
least one limb load condition. A non-directional alternative hypothesis was used because

10
very little is known about the selection of a cycle rate by skate skiers. Therefore, if limb
loading does affect cycle rate, it was unknown whether it would cause a decrease or an
increase in cycle rate.
The third null hypothesis (H0) was that work rate did not affect the observed
changes in economy or movement kinematics. The alternative hypothesis (HA) was that
work rate affected at least one of the observed differences in economy or movement
kinematics.
H0: µL = µH
HA: µL ≠ µH
where µL and µH were the mean differences in economy or movement kinematics (i.e.,
cycle rate) at either a low (L) or high (H) work rate while roller skiing.
Delimitations
1. The study was delimited to 16-30 year old male and female cross country ski
racers who were involved in pre-season training for the 2013-2014 racing season.
2. The study was delimited to submaximal treadmill skate roller skiing using the G3
technique.
Limitations
1. The sample was not random, but a convenience sample of volunteers from the
local community.
11
2. This was not a blind study because subjects were aware of how much mass was
added during each condition.
Assumptions
1. It was assumed that subjects were at steady state of exercise after 3 minutes at a
submaximal work rate.
2. It was assumed that subjects followed the pre-testing instructions to abstain from
exercise 24 hours prior to testing. Accordingly, subjects were assumed to be able
to maintain the submaximal work rates without fatigue influencing measures of
economy or movement kinematics.
Operational Definitions
Cycle length – A measure of the distance traveled per one repetition of a skate ski
cadence. Cycle length was measured by dividing the treadmill speed by
the cycle rate (Units of m/cycle).
Cycle rate – Cycle rate is a measure of the number of complete skate ski strides
performed per unit of time. A complete G3 skate cycle, for example,
consists of one right and one left leg push, each associated with a double
pole plant (units of Hz).
Economy – According to Cavanagh & Kram (1985b), economy is the submaximal
oxygen consumption per unit body mass required to perform a given task.

12
Energy expenditure – The rate of calorie utilization within tissues throughout the
body, which can be estimated by measuring oxygen consumption during
submaximal activities (Units of kcal/min).
G3 Technique – A symmetric cross country skate skiing motion where both poles are
planted simultaneously, occurring just prior to each leg push when the
body weight is shifted from one ski to the other. Also referred to as 1-
skate or V2 technique.
Heart Rate (HR) – Heart rate is the rate of ventricular contractions which is often
used as an indicator of aerobic exercise intensity (Units of beats/min, or
bpm).
Lactate Threshold – The exercise intensity at which the rate of lactate appearance
exceeds the rate of lactate disappearance in the blood. Intensities below
lactate threshold are considered submaximal.
Oxygen consumption (VO2) – The rate of oxygen used by the body to create energy
from fuels during aerobic metabolism. When comparing different
subjects, oxygen consumption values are often divided by body mass to
produce a relative measure of oxygen consumption (Units of mL/kg/min).
Roller ski – A composite shaft of approximately 500 x 38 x 25mm (20 x 1.5 x 1”)
with a wheel attached to each end and mounted with a skate skiing
binding. Roller skis are used to imitate cross country skiing on smooth,
non-snow surfaces.
13
Steady state – A condition where physiological measurements such as heart rate and
oxygen consumption are stable during exercise at a constant submaximal
work rate.
Submaximal intensity – Exercise at a work rate below that at which lactate
accumulates in the blood (lactate threshold). Submaximal intensity is
characterized by the use of aerobic metabolism exclusively to fulfill
energy demands. As such, oxygen consumption is an accurate
representation of total energy expenditure.
Work rate – The amount of power the roller skier must generate in the forward
direction to stay on the treadmill, which is determined by the subject’s
mass, the rolling and friction resistances from the roller ski wheels, and
the speed and grade of the treadmill (m/s and degrees). The total work
rate is measured in Watts (W).

14
2. LITERATURE REVIEW
Introduction
Cross-country ski racers today ski at dramatically faster racing speeds compared
to speeds seen in equal distance races in the past. In fact, Street (1992) specified that
elite level ski races in the early 1900’s took almost twice as long as an equal distance race
today. Across all sports, performance has improved over the last century due to better
training and nutrition practices. However, the improvements by Nordic skiers in the last
50 years are far greater than those observed in similar endurance sports. For example,
over the last 65 years, the world record marathon running time has improved by 15%,
from 2:25:39 in 1947 to 2:03:38 today (Marathon Records 2013). Meanwhile,
comparable cross country ski races, such as a 30 kilometer classic, have seen race times
drop by 41%, from approximately 125 minutes in 1950 (Street 1992) to just under 75
minutes in 2012 World Cup races (fis-ski.com 2013). Clearly, cross country ski race
times have decreased to a greater extent than running race times, which indicates that
Nordic ski racing has benefitted from advancements beyond those that have also affected
running. Street (1992) believed the increased speed of Nordic skiing resulted from
advancements in grooming and equipment technology. Specifically, the author theorized
that the switch from wood to laminate skis, the change to modern pole materials, and the
reduction in boot/ski/binding mass caused significant increases in race speed.
Unfortunately, there is very little research that supports the conclusion that equipment
was a factor in the improvement of race times.

15
Every successive generation of ski equipment is touted as being better than the
previous generation and will improve skiing performance. Recently, every generation of
skate skiing equipment has decreased mass, which the companies claim will enable racers
to ski faster. As an example, the elite line of skate skiing equipment from Rossignol in
2010 was 210 g lighter per foot than the equivalent 2009 equipment (Rossignol Xium
skis and boots; Cross-Country Skier Magazine 2010). Unfortunately, there are no
published studies that have investigated the effects of Nordic ski equipment mass on
performance, or markers of performance, so it is unknown whether this 210 g reduction
in mass actually affects skiing performance. The proposed study would investigate the
effects of added lower limb mass on economy and movement kinematics of roller skiing,
both of which are considered markers of Nordic skiing performance.
Economy
In 1985(b), Cavanagh & Kram stated that an athlete’s energy utilization is directly
associated with endurance performance. The authors determined that the ability for one
athlete to expend less energy while performing the same task as another athlete is an
important attribute and can help explain performance differences. The authors noted that
the measure of efficiency that is most applicable to performance is that of economy,
which is the relative submaximal oxygen consumption required to perform a given task.
As an example, when two subjects run at an equal absolute work rate, the runner with
better economy has a lower relative VO2. Further, Mahood, Kenefick, Kertzer, & Quinn
(2001) found that better economy while skate roller skiing correlated to better

16
performance in ski races. Therefore, roller skiing economy can be used as a marker of
Nordic ski performance. Differences in economy often result from varied effectiveness
of neuromuscular activation patterns; however, external factors, such as equipment
characteristics, can also impact economy. Equipment mass is presumed to be one such
factor in Nordic skiing, however, that has not been proven.
Load Carriage
In many situations, it is useful to know how energy expenditure is impacted by
the addition of a load. When a load is added, more work must be performed to accelerate
a greater mass, so it is expected that more energy is expended. This was confirmed when
Taylor, Heglund, McMahon, & Looney (1980) found that mass added to animals
increased their VO2 in a directly proportional manner with the increase in total mass
(body mass+load). Specifically, they identified a 1:1 ratio between percent increase in
VO2 with percent increase in total mass. In Nordic skiing, the observed differences in
equipment mass are small relative to the total mass of the skier and equipment, so
according to the findings by Taylor et al. (1980), the proportional increase in VO2 is
expected to be small. However, it is well-documented that placing mass on the limb, as
is the case for ski equipment, produces a much larger effect than when the same mass is
placed on the torso (Marsh, Ellerby, Carr, Henry, & Buchanan 2004; Myers & Steudel
1985). Specifically, Myers & Steudel (1985) found increases in VO2 were 1.5 and 5.5
times larger when mass was added to the thigh or ankle, respectively, than when the same
mass was added to the torso. The authors proposed that the placement of the mass was

17
important because of its impact on the limb’s moment of inertia. The moment of inertia
is a property of an object that defines how much torque is required to accelerate the
object about an axis. The moment of inertia exponentially grows as the radius from the
axis increases. Thus, as mass is placed more distally on a limb, the torque required to
accelerate the limb increases exponentially. For the muscles to generate greater torque
about the hip joint, they must apply more force, which increases energy expenditure, as
was observed by Myers & Steudel (1985). Clearly, accelerating the limbs can be
energetically expensive. In fact, Myers and Steudel (1985) calculated that simply
changing the kinetic energy of the lower limbs accounted for approximately 30% of the
total energy expended by their subjects while running. By extending these calculations,
they noted that at higher speeds of running, the portion of energy devoted solely to
kinetic energy changes would notably increase.
While Myers & Steudel (1985) only used theoretical calculations, Marsh et al.
(2004) collected data that validated the theory. Marsh et al. (2004) used blood flow
tracking to determine the proportion of energy required by each of the muscles that were
active while running. The authors observed that 74% of the energy used by the lower
limbs in a running stride was used by stance-phase muscles, and the remaining 26% was
used by swing-phase muscles. Swing phase muscles are solely used to accelerate the
limb, with no propulsion of the body, so it is impressive that they consume more than a
quarter of the energy required for running. The high cost of simply swinging the limbs
reflects the torque requirements to accelerate the leg about the hip and knee joints. An
increase in torque requirements, as with additional mass on the foot, will cause an

18
increase in the proportion of energy devoted to swinging the limbs. Many researchers
have agreed and found that even an addition of a small limb load to the feet of runners
causes a significant increase in economy (Divert et al 2008; Franz et al. 2012; Martin
1984). Even though skate skiing has a different motion pattern than running, the limbs
are similarly accelerated, including a propulsive stance phase and a swing phase, and
there are similar energetic and neural demands (Stöggl & Müller 2009). As a result, it is
likely that the effect of added mass on the lower limbs in skate skiing is similar to that of
running.
Kinematics
A kinematic analysis of motion involves describing the position of a body in
space and how it changes over a period of time without regard to the forces required to
create the motion. Important information can be gained from kinematic analyses, such as
the rate of movement of body segments or the range of motion of a joint. These and
other descriptive factors can be used to identify differences between amateur and elite
athletes, the discovery of which can guide the training of young athletes as they strive to
improve (Kinematics 2008). Within a cyclic activity such as Nordic skiing, two
movement kinematic variables interact to determine skiing velocity: 1) the distance
travelled per skate stride (cycle length) and 2) the frequency of strides taken (cycle rate).
If either cycle rate or cycle length changes while the other remains constant, the skier’s
velocity will change. Interestingly, several studies have shown that skiers tend to
increase their speed by increasing their cycle rates (Andersson et al. 2008; Millet et al.

19
1998; Stöggl & Müller 2009). In contrast, when skiers of varied skill levels are
compared on similar terrain, faster skiers use longer cycle lengths with similar cycle rates
(Bilodeau et al. 1996; Rundell & McCarthy 1996; Sandbakk et al. 2011). As a result,
both cycle rate and cycle length are important components in the ability to ski quickly,
and a decrease in either factor could negatively impact racing performance.
It is well documented that there is a relationship between the amount of force a
muscle generates and the velocity at which it is able to contract (Rahikainen, Avela, &
Virmavirta 2012). Specifically, as the force requirements of a contraction increase, the
maximal velocity of that muscle contraction decreases, which is a relationship defined as
the force-velocity curve. In cross-country skiing, propulsive forces are generated
quickly, followed by a recovery period (Stöggl & Müller 2009). Because of its distal
placement, ski equipment exponentially increases the moment of inertia of the lower
limb. If skiers have heavier equipment, the force required to accelerate the leg is
substantially greater, which, according to the force-velocity curve, will slow the speed of
contraction. To compensate, the skier are likely to reduce their overall cycle rate.
Unfortunately, a lower cycle rate has been suggested to result in slower overall speed,
which decreases performance in races (Andersson et al. 2008; Millet et al. 1998; Stöggl
& Müller 2009). While the phenomenon of decreased cycle rate with increased
equipment mass of skate ski equipment has not been documented, several researchers
have found significant differences in running stride due to shoe mass. In multiple studies,
heavier shoes have been found to decrease stride rate in running (Divert et al. 2008;
Lussiana, Fabre, Hebert-Losier, & Mourot 2013). On average, Lussiana et al. (2013)

20
found that when subjects ran in minimalist shoes, their stride rates were approximately
0.035 Hz higher (1.3% increase) than when they ran in traditional shoes that were 146 g
heavier per foot. The authors noted that foot strike patterns were different between the
shoe types and might have contributed to the different stride rates observed. However,
Divert et al. (2008) made similar findings without a change in type of footwear.
Specifically, the researchers added weights to running socks so that the mass of a
traditional running shoe could be investigated without changing the other characteristics
of the footwear. In doing so, they found that the stride rate of runners varied by 0.050 Hz
with an addition of 350 g per foot. Since mass added to the lower extremity affects
movement kinematics in running, it is possible that a similar phenomenon occurs in
Nordic skiing, but no published studies have investigated the effect of limb loading on
Nordic skiing movement kinematics.
The Effect of Equipment Mass on Oxygen Consumption
There are no currently published studies available that have investigated the effect
of limb-loading in Nordic skiing. In contrast, the effect of added mass to running and
hiking shoes is well-studied. Despite the fact that running involves a different movement
pattern than skate skiing, Stöggl & Müller (2009) noted that running has similar
neuromuscular and aerobic demands to Nordic skiing. Thus, added mass to the lower
limb will likely have similar effects on both forms of locomotion.
The energetic impact of added mass on the feet was first studied in the 1940’s,
when the US Army hired Russell & Belding (1946) to investigate the energetic difference

21
between walking barefoot and walking wearing combat boots. For every kilometer the
subjects walked, it was found that oxygen consumption increased by 0.25 liters/kg while
walking in the combat boots compared to barefoot (910 g difference per foot). In 1969,
two research groups drew similar conclusions in their research on hiking boots.
Specifically, Soule & Goldman (1969) researched the impact of adding 6 kg to each foot
of hikers at three different speeds. They found not only that there was a significant
increase in oxygen consumption when the feet were loaded, but that there was a non-
significant trend of greater increase at higher speeds. While walking at 4, 4.8, and 5.6
km/hr, the added mass caused absolute VO2 to increase by 70%, 95%, and 103% above
the unloaded condition, respectively. At the same time, Ralston & Lukin (1969) found
that energy expenditure of hiking increased by 30.9% with an addition of a 2 kg mass on
each foot. Clearly, the mass of boots has an impact on the energy required for hiking.
After several studies confirmed the effects of mass on hiking, many researchers
investigated the effect of the shoe mass on running energetics. For example, Jones,
Toner, Daniels, & Knapik (1984) studied the effect of hiking and running in athletic
shoes compared to leather boots in both trained and untrained individuals. The subjects
performed trials at three different walking speeds and three different running speeds, and
the running speeds were repeated using mass added to the athletic shoes such that the
mass was equal to the heavy boots. They found significant differences in energy
expenditure for both walking and running, regardless of training status. Oxygen
consumption per 100 g additional mass on each foot increased by an average of 1.2%,
1.5%, and 0.9% for walking, running in boots, and running in athletic shoes with added

22
mass, respectively. Similarly, Martin (1984) reported 3% and 7% increases in VO2 when
runners were loaded with 250 g and 500 g per foot, respectively.
Recently, researchers have investigated the economy differences between running
in shoes and running barefoot. The conclusions from the early studies suggest that
running barefoot should result in better economy because there is less mass on the feet,
but Divert et al. (2008) noted that several of the studies compared two different models of
footwear, which added an uncontrolled variable. They believed that the characteristics of
the shoe, such as different amounts of cushioning, might have altered the runners’
kinematics and confounded the results. As a result, Divert et al. (2008) attempted to
investigate the effects of mass without a change in shoe properties. They did so by
having the subjects run in socks that resembled barefoot running, and then they added
weights to the socks to resemble the extra mass of running shoes. By comparing running
in socks without extra mass to running in socks with added mass, the researchers found
that VO2 increased by about 1.2% per 100 g of mass added to each foot. Later, Franz,
Wierzbinski, & Kram (2012) commented that foot-strike type was not documented in the
study by Divert et al. (2008). Franz et al. (2012) theorized that the subjects might have
used different foot-strike patterns, which could have impacted the results. Franz et al.
(2012) performed a follow-up study that controlled for strike type. The researchers
confirmed the results of Divert et al. (2008) by finding a 0.9% increase in VO2 per 100 g
increase in mass on each foot.
Decades of research has confirmed that adding mass to the lower extremity
significantly changes oxygen consumption. When these studies are standardized to an

23
addition of 100 g per foot, they conclude that VO2 will increase by 0.9-1.5%, which is
summarized in Table 2.1.
Table 2.1. Effect of added mass on running and walking studies. Percent differences in oxygen consumption (VO2) from the control condition have been standardized to the observed increase per 100 grams per foot.
Date Authors Run/Walk Mass Added per Foot
VO2 Diff per 100 g per Foot (%)
1969 Ralston & Lukin Walk 2.00 kg 1.54 1969 Soule & Goldman Walk 6.00 kg 1.49 1984 Jones et al. Both 0.58 kg 1.26 1984 Martin Run 0.25 & 0.50 kg 1.38 2008 Divert et al. Run 0.10 & 0.30 kg 1.24 2012 Franz et al. Run 0.15, 0.30, & 0.45
kg 0.91
When mass is added to a running shoe, it is directly attached to the foot and
swings exactly as the foot does. This is not necessarily the case in Nordic ski equipment,
where skis extend beyond the feet. As a result, the effects of additional mass distributed
throughout a ski might be different than those of a running shoe. While there are no
published studies that investigate the effect of the mass of skis on economy, researchers
have investigated the effect of using hiking poles on economy of hiking. The use of
poles is similar to skis in that they extend beyond the extremity and the swing pattern
does not directly follow that of the hand. Walking with hiking poles has been found to
increase VO2 by 12% and 23% when the poles are 340 g and 450 g each, respectively
(Hendrickson et al. 1997; Rodgers, VanHeest, & Schachster 1995). These findings
equate to 3.5% and 5.1% increases in VO2 per 100 grams added to each hand.
Interestingly, neither study included poles of different masses, so the only comparison
24
was between walking without poles to walking with poles. Because the addition of poles
changes the kinematics of walking, it is likely that the altered movement patterns
contributed to the change in VO2. However, the increased mass at the distal point of the
upper extremity was presumed to be the primary cause of the increased energy
expenditure. Similar to the addition of mass to a running shoe, the hiking poles needed to
be accelerated with every stride, which increased the energy demands of the extremity.
The same increase theoretically occurs when the mass of Nordic skis, boots, and bindings
increase, but the exact relationship is unknown.
Clearly, adding mass to the extremity can influence the economy of movement,
but the precise amount of lower limb loading required to significantly affect skate skiing
has not been investigated. In one review article by Street (1992), it was proposed that for
every reduction of 100 g per foot for the ski/boot/binding system, a ski racer will reduce
race time by 0.8%. Unfortunately, no study is referenced to validate the statement, so the
effect of lower limb loading on skate skiing economy remains unknown.
Cycle Rate Variation
It is expected that lower limb loading during skate skiing will increase energy
expenditure because the added mass will affect the torque requirements to swing the legs.
Swinging the limbs is energetically expensive even without limb loading and will
increase dramatically when loaded. Further, Myers & Steudel (1985) commented that the
proportion of energy devoted to swinging the legs during running substantially increases
with faster running speeds. When the energy devoted to leg swing increases, the effect of

25
mass on the distal portion of the limb might be exaggerated. For instance, a higher cycle
rate might result in greater changes in economy with the same amount of limb loading.
Interestingly, in running and walking studies, the relationship between added limb mass
and economy has consistently been found to be approximately 1% for every 100 g
addition to the leg, regardless of stride rate or running speed (Divert et al. 2008; Franz et
al. 2012; & Jones et al. 1984). However, none of these studies have specifically
investigated whether stride rate interacts with added mass. An intentional manipulation
of cycle rate would be useful to investigate whether an increased cycle rate affects the
observed changes in economy or kinematics from limb-loading.
Treadmill Speed and Grade to Manipulate Kinematics
In Nordic skiing, velocity is determined by a combination of the cycle rate and
cycle length used (Sandbakk et al. 2012a). When athletes are allowed to freely choose
their own cadence, they tend to pick a cadence close to that which optimizes their
economy of motion (Cavanagh & Williams 1982). For skate roller skiing, Reinking
(2013) determined that sub-elite level skiers chose a cadence solely based on the total
external power demand, rather than selecting a cycle rate based on either the speed or the
grade alone. This indicates that the manipulation of cycle rate requires variation of the
total external power demand. As such, this study will use two work rates that vary in
external power demand in order to investigate the possible interaction between cycle rate
and added mass on economy.
26
In the proposed study, subjects will use the G3 technique, which is typically
selected by skiers while skiing at moderate speeds over flat or gradual uphill terrain
(Sandbakk et al. 2012). When the G3 technique is used in other circumstances, skate
skiing efficiency decreases. For example, Kvamme et al. (2009) recently observed that
the G3 technique is an efficient skate skiing technique for sub-elite competitive male
skiers for grades of up to 5⁰. At steeper inclines, the subjects were still able to perform
the G3 technique, but their efficiency decreased. Further, Sandbakk et al. (2012a) found
that elite level skiers were more efficient using the G3 technique at an 8% grade (4.5⁰) than a 2% grade (1.1⁰), indicating that the use of the G3 technique at low gradients is also
inefficient. Clearly, the G3 technique is optimized at moderate uphill grades. Because
subjects should be roller skiing as efficiently as possible, the work rates selected for this
study included grades of 2⁰ and 3.15⁰.
Conclusion
Using running shoe research as a model, it has been argued that the decreased
mass of Nordic ski equipment has contributed to the improvement in Nordic skiing
performances over recent decades. Similarly, it is possible that the differences in the
mass of equipment between successive generations, as well as between current models of
equipment, affect skiing performance. However, no research has been published that
would support these claims. A study to investigate the effects of limb loading on the
economy and movement kinematics of skate roller skiing is necessary to better
understand how variations in equipment mass impact Nordic skiing.

27
CHAPTER THREE
THE EFFECT OF LOWER LIMB LOADING ON ECONOMY AND KINEMATICS OF SKATE ROLLER SKIING
Contribution of Authors and Co-Authors
Manuscript in Chapter 3 Author: Tyler J. Reinking Contributions: Assisted with study design, implemented data collection, processed and analyzed data, and wrote manuscript. Co-Author: Daniel P. Heil Contributions: Conceived the study design, assisted with data processing and analysis, discussed results and implications, and was primary editor of the manuscript at all stages.

28
Manuscript Information Page
Tyler J. Reinking, Daniel P. Heil Journal name: European Journal of Applied Physiology Status of Manuscript _x_ Prepared for submission to a peer-reviewed journal ___ Officially submitted to a peer-reviewed journal ___ Accepted by a peer-reviewed journal ___ Published in a peer-reviewed journal
29
Abstract
It has been proposed that skate skiing economy and racing performance have
improved as a result of lighter equipment. Despite the many studies that have found
running and walking economy to improve with lighter shoes, there are no published
studies that show any relationship between the mass of skate skiing equipment and
markers of skate skiing performance. To investigate the effects of skate skiing equipment
mass on markers of performance, this study added mass to the lower limbs of skate roller
skiers and measured changes in economy and gross movement kinematics. Twelve male
(Mean±SD; Age (yrs): 21.4±3.9) and eight female (Mean±SD; Age (yrs): 19.9±2.2)
competitive cross-country skiers completed two laboratory visits to roller ski on an
oversized treadmill. In the first visit, subjects completed a graded exercise test to
determine their lactate threshold. In the second visit, subjects completed 5 minutes of
roller skiing at a low work rate (2 m/s for women and 3 m/s for men both at 2⁰) and a
high work rate (2 m/s for women and 3 m/s for men both at 3.15⁰) for each of the four
limb loading conditions (0 g, 200 g, 400 g, and 600 g). Oxygen consumption (VO2),
heart rate (HR), and cycle rate were measured during the last 2 minutes of each stage and
used for analysis. There were no significant differences in HR, VO2, or cycle rate
between any of the limb loading conditions at either work rate. However, cycle rate
neared significance (P = 0.06), with increases in cycle rate observed during greater limb
loading. Interestingly, VO2 and HR significantly increased throughout testing,
independent of limb loading condition. The most notable increases were observed in HR
values, and increases began within the very first testing stage. Thus, it is likely that the

30
subjects experienced cardiovascular drift due to mild hyperthermia. The cardiovascular
drift might have masked the true effects of lower limb loading. Therefore, future studies
still need to investigate the effects of lower limb loading on skate skiing economy and
kinematics.
Introduction
Cross country skiing is typically considered to be an aerobic sport. As such, there
has been considerable focus on skiers’ capacities for maximal oxygen consumption
(VO2max). In fact, it is well documented that VO2max is a strong predictor of cross
country ski performance among heterogeneous populations (Hoffman & Clifford, 1992;
Losnegard, et al., 2012a; Sandbakk et al., 2010). Unfortunately, within homogeneous
populations, the correlation between VO2max and performance significantly weakens and
other variables have been found to better predict performance. Among the other
variables that correlate with cross country skiing performance are upper body power
(Alsobrook & Heil 2009; Staib et al. 2000), treadmill velocity at lactate threshold (Stöggl
et al. 2007; Vesterinen et al. 2009), accumulated oxygen deficit during a time trial
(Losnegard et al. 2012a; Reinking et al. 2012), and skate roller skiing economy (Mahood
et al. 2001). Athletes can use this research to learn which characteristics are most
important to performance, which can then become the focus of their training. The
knowledge gained from research allows athletes in all sports to improve their
performance capabilities, as can be demonstrated in individual sports by progressively
decreasing race times.
31
Throughout the last several decades, improvements in training and nutrition
practices have led to faster race times in many endurance based sports. For example, the
winning time in the 10 km run at the 2012 Olympics was 1.0% faster than the same event
at the 1984 Olympics (27:30.42 in 2012, 27:47.54 in 1984; Olympic.org 2013).
Interestingly, the improvements in cross country skiing over the same time frame have
been dramatically greater. For example, the winning time in a World Cup 10 km skate
ski race in 2012 was 27.4% less than the winning time of the 10 km skate ski race in the
1985 World Championships (31.0 minutes in 1985 to 22.5 minutes in 2012; fis-ski.com
2013). Clearly, there have been improvements in cross country skiing that have not been
observed for other endurance sports, such as running, over the same time frame.
It has been proposed that improvements in grooming, more advanced ski wax and
ski structure, and lighter equipment have enabled better skiing economy and, therefore,
faster ski racing speed (Street 1992). Within the external factors affecting economy,
Street (1992) stated that the largest contributor to improvements in ski racing
performance was the reduction in the mass of ski equipment. Specifically, the author
proposed that a skier’s race time would decrease by 0.8% for every 100 g reduction in the
combined mass of the ski, boot, and binding on each leg. Unfortunately, no published
data exists that identifies the effect of reduced mass on the lower limb on skate skiing
economy.
Although no research exists specific to skate skiing, many studies have
investigated the effect of lower limb loading on walking and running economy. These
studies have consistently found that VO2 while hiking or running increases by around 1%

32
for each additional 100 g per foot (Divert et al. 2008; Franz et al. 2012; Jones et al. 1984;
Martin 1984; Ralston & Lukin 1969; Soule & Goldman 1969). Therefore, if skate skiers
respond to decreased limb loading in a similar manner as that of runners, then a decreased
lower limb load would improve skiing economy and possibly improve skiing
performance.
A study investigating the effect of lower limb loading on skate skiing economy
would help assess whether the improvements in skate ski race times between 1980 and
1992 resulted from changes in equipment mass, as Street (1992) proposed. Also, a study
would help identify the importance of more recent changes in skate skiing equipment, as
significant advancements in equipment have been made since Street’s article was
published in 1992. Notably, ski equipment released each year continues to become
lighter than the previous commercially available equipment. For example, in 2010-2011,
several companies advertised mass reductions of between 150-200 g for a pair of elite-
level skis, boots, or bindings compared to the best available pair of skis, boots, or
bindings from the previous year (Cross-Country Skier Magazine 2010). Further, the
masses of skate ski packages available within each generation of equipment can vary
dramatically. In fact, in 2013, two skate ski packages could differ by as much as 740 g.
When a skier upgrades from an old sub-elite equipment package to a new elite equipment
package, even greater decreases in mass could be observed. However, it is unknown
whether a 740 g reduction in equipment mass affects skate skiing economy or
performance. Therefore, this study added mass to the lower limbs of skate roller skiers (0
g, 200 g, 400 g, and 600 g per foot) to simulate skiing with heavier equipment and

33
identify the effects of lower limb loading on markers of skate skiing performance. Skate
roller skiing economy and gross movement kinematics were used as markers of skate
skiing performance. The purpose of this study was to test the hypothesis that oxygen
consumption and cycle rate are affected by the addition of mass on the lower limb.
Specifically, it was expected that increased lower limb loading would increase oxygen
consumption.
Methods
Study Design
During this study, mass was added to subjects’ lower limbs to investigate the
effect of limb loading while treadmill skate roller skiing on measures of oxygen
consumption (VO2), heart rate (HR), and cycle rate. This was a repeated measures study
with a crossover design. Test order for the four limb loading conditions (0 g, 200 g, 400
g, and 600 g per foot) was counterbalanced between the subjects and across a pre-
determined sequence of two treadmill work rates. These mass conditions were chosen
because pilot testing indicated that differences in energy cost begin to appear with ≥ 500
g per foot. Additionally, similar mass differences can be observed between commercially
available skate ski equipment packages.
Subjects
Twenty 16-29 year old male and female cross-country skiers from the Montana
State University and Bridger Ski Foundation ski teams, all of whom were actively
training for the current competitive ski season, were recruited to participate in this study.

34
The subjects were informed of the research protocol prior to participating and signed an
informed consent form approved by the Montana State University Institutional Review
Board. Parental consent was obtained for all subjects under 18 years of age. Subjects
also completed a physical activity readiness questionnaire for health screening prior to
exercise testing.
Testing Procedures
All subjects performed two testing sessions. During the first visit, subjects were
familiarized to roller skiing on the treadmill and performed a lactate threshold (LT) test.
The second visit entailed roller skiing on the treadmill under each of the four limb
loading conditions (0 g, 200 g, 400 g, or 600 g attached to each foot) to simulate heavier
ski equipment. The subjects performed each limb loading condition at two standardized
work rates (3 m/s at 2⁰ and 3.15⁰ for men and 2 m/s at 2⁰ and 3.15⁰ for women).
Subjects utilized the G3 skating technique throughout all test stages. Subjects were
requested to abstain from high volume or high intensity exercise within 24 hours prior to
each test session to minimize the effects of fatigue.
Upon arriving at the lab for the first visit, each skier, while wearing only exercise
clothing and no ski boots, was measured for both body height (cm) and mass (kg)
(Health-O-Meter beam scale, Continental Scale Corp., Bridgeview, IL, USA) using
standard procedures. Then, the subject roller skied on the treadmill at a freely chosen
work rate for 10 minutes to warm up. Next, the subject began a graded exercise test.
Each stage lasted 4 minutes during which 3 minutes of roller skiing was followed by 1
minute of rest before progressing to the next stage. During the one-minute rest, a

35
fingertip blood sample was collected and then measured for blood lactate concentration
using a handheld analyzer. The LT protocol was stopped when a blood lactate measure
both exceeded 4.0 mmol/L and exceeded the previous blood lactate measure by ≥ 1.0
mmol/L. Once this occurred, the subject began 5 minutes of active recovery while roller
skiing at 2° and 1.8 m/s (4 mph). The results from each subject’s lactate threshold test
were processed prior to their second visit to the laboratory. This allowed the researchers
to ensure that all subjects were roller skiing at a submaximal intensity during visit 2.
The second visit also began with the measurement of body weight prior to 10
minutes of roller skiing on the treadmill to warm-up. The warm-up for the second visit
consisted of 5 minutes of roller skiing at a freely chosen work rate followed by 5 minutes
of roller skiing at the lower standardized work rate that would be used during testing.
The subject then had 5 minutes of rest while the researcher set up the portable metabolic
system and added mass for the first limb load condition. The limb load was applied by
securing 100 g mass discs to the plastic cuff of the ski boot at the lateral malleolus using
athletic tape. Once all equipment was in place, the subject completed stage 1 by roller
skiing for 5 minutes at the first test condition and work rate, which was followed
immediately by another 5 minutes of roller skiing at the same limb load condition and the
second work rate. Upon completion of the first two stages, the subject had 5 minutes to
rest while the mass condition was changed. The same procedures were then repeated for
the remaining three limb loading conditions. Test order for mass conditions was
counterbalanced between the subjects and across a pre-set sequence of work rates. After
every two stages, the amount of mass on the boots was changed, and the subject was

36
allowed to rest for 5 minutes. Once all eight stages were completed, the subject roller
skied for 5 minutes to cool down on the treadmill at a freely chosen work rate.
Work Rate Selection
During visit 2, each skier roller skied at standardized low (L) and high (H) work
rates. All male subjects roller skied at 3 m/s at a grade of 2⁰ (L) and 3.15⁰ (H), while all
female subjects roller skied at 2 m/s at 2⁰ (L) and 3.15⁰ (H). These work rates were
based upon previous testing of skiers with similar fitness and skill, and were found to be
submaximal for all subjects (Reinking 2013). Also, the grades were chosen because the
G3 technique has been shown to be optimal while roller skiing between 1.5⁰ and 4⁰ (Kvamme et al. 2009; Sandbakk et al. 2012a).
Justification for Limb-Loading Conditions
Pilot testing with a single subject indicated no meaningful changes in VO2 while
skate roller skiing with 200 or 300 g added per foot when compared to the control
condition. A 1% increase in VO2 required the addition of 500 g added per foot. Further,
mass differences of up to 600 g are relevant when compared to recent changes in total
ski/boot/binding equipment mass. For example, two equipment packages from the most
recent generation can differ by up to 370 g per foot. Thus, an upgrade from a previous
generation of sub-elite equipment to new elite equipment would likely include a larger
reduction in total equipment mass.

37
Instrumentation
Roller Skiing Equipment. All testing was performed in Montana State
University’s Movement Science Lab on an oversized treadmill (2.5 meters wide, 3 meters
long; Fitnex Fitness Equipment Inc., Dallas, TX) using Marwe 610 skate roller skis
(Hyvinkaa, Finland) with either SNS (Salomon, Annecy, France) or NNN (Rottefella,
Klokkarstua, Norway) bindings. Subjects also used either Swix CT1 (Swix,
Lillehammer, Norway) or Madshus Carbon Race 70 (Madshus, Biri, Norway) poles
selected to the nearest 2.5 cm increment of preferred length. Both models of poles are
similar, high-level racing poles, and the subject used the same pair for both
visits. Subjects completed all testing using their own skate ski boots. Video was
recorded during the last two minutes of each stage during visit 2 and used for analysis of
gross movement kinematics (Logitech Pro C920 webcam; Logitech, Silicon Valley, CA,
USA ).
Indirect Calorimetry. Oxygen consumption was measured and recorded with a
portable metabolic system (Oxycon Mobile, Viasys Healthcare, Yorba Linda, CA) using
standard indirect calorimetry procedures. The metabolic system was calibrated according
to manufacturer’s guidelines before the start of each test. Polar RS400 heart rate monitor
chest straps (Polar Electro, Inc., Lake Success, NY) were used to measure HR, which was
remotely transmitted to and recorded by the Oxycon metabolic system.
Lactate Testing. During lactate threshold testing, a whole-blood sample was
taken from the fingertip using a single-use lancet. Blood lactate concentrations were
38
measured using a Lactate Pro analyzer (Lactate Pro; Arkray, Inc., Kyoto, Japan).
Calibration of the Lactate Pro analyzer was performed prior to each testing session
according to the manufacturer’s guidelines.
Data Processing
The metabolic system measured breath-by-breath data and then summarized these
data as 5 second averages. Steady-state values for VO2 and HR were taken as an average
over the final 2 minutes of each stage. Threshold values of HR and VO2 were determined
by averaging the steady state values from the last two stages of the first visit.
The video from visit 2 was used to manually record the time taken to complete 10
skate cycles. The skate cycle both started and finished with a double-pole plant
associated with a left leg push. Cycle rate (in Hz) was then calculated by dividing 10 by
the time (in seconds) to complete 10 cycles.
Statistical Analysis
A multivariate repeated measures two-way analysis of variance (ANOVA) was
performed with added mass (4 levels) and work rate (2 levels) serving as the main effects
tested. Post-hoc comparisons were performed with Tukey’s multiple comparisons tests.
All tests were performed at the 0.05 alpha level.
After the primary analysis was performed, it was decided that a sub-analysis was
necessary to test for significant differences between test stages, independent of the limb
loading condition. For the sub-analysis, an ANOVA test was performed to compare the
four test stages at each work rate. As with the primary analysis, post-hoc comparisons

39
were made using Tukey’s multiple comparisons test, and all tests were performed at the
0.05 alpha level.
To test the assumption that subjects were at a steady-state during the last 2
minutes of each stage, the physiological variables were assessed for reliability between
the fourth and fifth minutes. Each stage of the test sequence was evaluated with high and
low work rates analyzed separately. Reliability was analyzed with an ANOVA as well as
by observing the intraclass correlation coefficients (ICC) and the standard error of
measurements (SEM) for each variable.
Pilot Testing
In May, 2013, a subject roller skied for 4 minutes at a set work rate (2.9 m/s at
3.4⁰) using four different limb loading conditions (0 g, 200 g, 300 g, and 500 g per foot).
Oxygen consumption (VO2) and heart rate (HR) values were recorded throughout the
testing. Values from the last minute of each stage were considered steady-state and
averaged for analysis. The results from this test are summarized in Table 3.1.
Table 3.1. Mean oxygen consumption (VO2) and heart rate (HR) for a subject with four different limb loads during a pilot test. The percent difference in VO2 from the control condition is also listed.
Stage Mass Added (g per foot)
Average VO2 (mL/kg/min)
Average HR (bpm)
Difference in VO2 from
Control (%) 1 0 45.45 147.0 -- 2 200 45.78 148.3 0.72 3 300 45.98 146.3 1.16 4 500 47.25 146.0 3.96
40
Results
Subjects
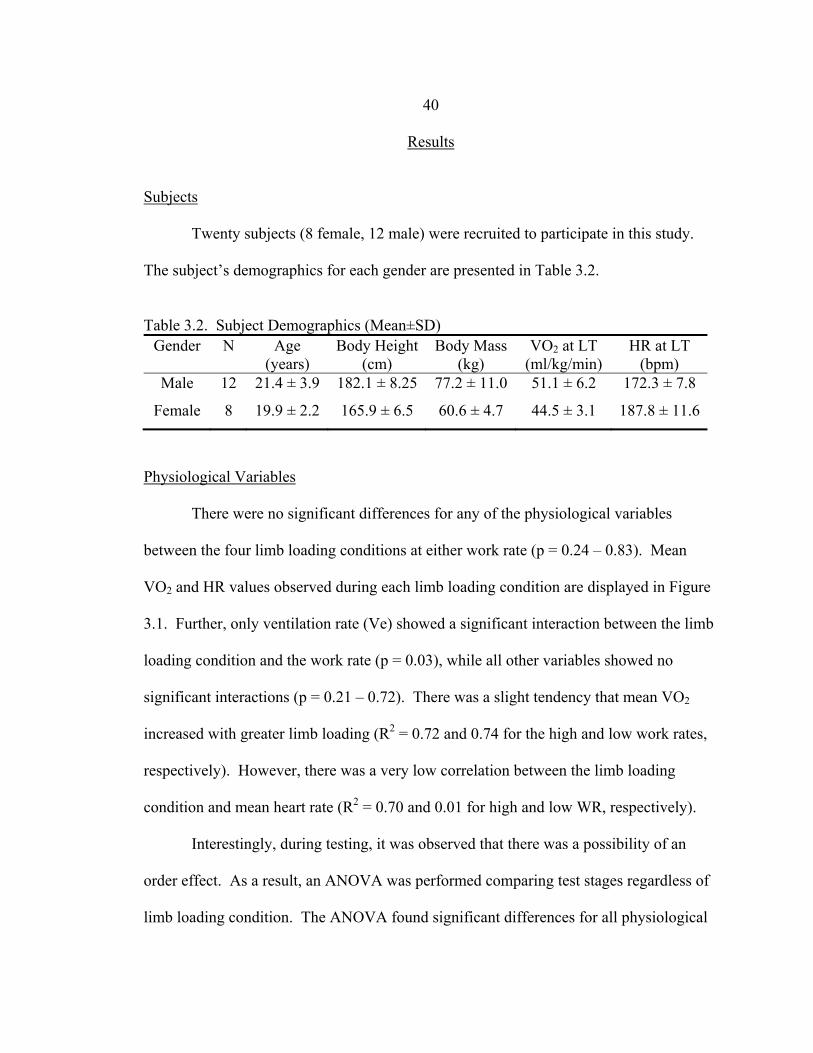
Twenty subjects (8 female, 12 male) were recruited to participate in this study.
The subject’s demographics for each gender are presented in Table 3.2.
Table 3.2. Subject Demographics (Mean±SD)
Gender N Age (years)
Body Height (cm)
Body Mass (kg)
VO2 at LT (ml/kg/min)
HR at LT (bpm)
Male 12 21.4 ± 3.9 182.1 ± 8.25 77.2 ± 11.0 51.1 ± 6.2 172.3 ± 7.8
Female 8 19.9 ± 2.2 165.9 ± 6.5 60.6 ± 4.7 44.5 ± 3.1 187.8 ± 11.6
Physiological Variables
There were no significant differences for any of the physiological variables
between the four limb loading conditions at either work rate (p = 0.24 – 0.83). Mean
VO2 and HR values observed during each limb loading condition are displayed in Figure
3.1. Further, only ventilation rate (Ve) showed a significant interaction between the limb
loading condition and the work rate (p = 0.03), while all other variables showed no
significant interactions (p = 0.21 – 0.72). There was a slight tendency that mean VO2
increased with greater limb loading (R2 = 0.72 and 0.74 for the high and low work rates,
respectively). However, there was a very low correlation between the limb loading
condition and mean heart rate (R2 = 0.70 and 0.01 for high and low WR, respectively).
Interestingly, during testing, it was observed that there was a possibility of an
order effect. As a result, an ANOVA was performed comparing test stages regardless of
limb loading condition. The ANOVA found significant differences for all physiological
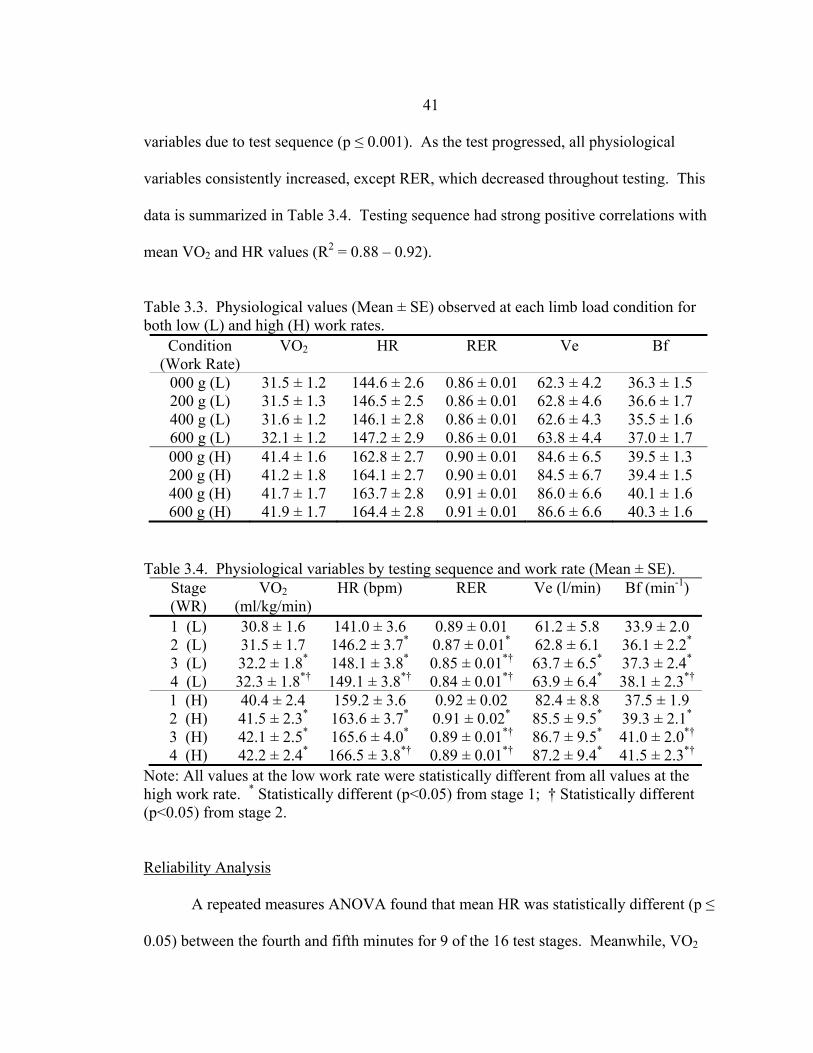
41
variables due to test sequence (p ≤ 0.001). As the test progressed, all physiological
variables consistently increased, except RER, which decreased throughout testing. This
data is summarized in Table 3.4. Testing sequence had strong positive correlations with
mean VO2 and HR values (R2 = 0.88 – 0.92).
Table 3.3. Physiological values (Mean ± SE) observed at each limb load condition for both low (L) and high (H) work rates.
Condition (Work Rate)
VO2 HR RER Ve Bf
000 g (L) 31.5 ± 1.2 144.6 ± 2.6 0.86 ± 0.01 62.3 ± 4.2 36.3 ± 1.5 200 g (L) 31.5 ± 1.3 146.5 ± 2.5 0.86 ± 0.01 62.8 ± 4.6 36.6 ± 1.7 400 g (L) 31.6 ± 1.2 146.1 ± 2.8 0.86 ± 0.01 62.6 ± 4.3 35.5 ± 1.6 600 g (L) 32.1 ± 1.2 147.2 ± 2.9 0.86 ± 0.01 63.8 ± 4.4 37.0 ± 1.7 000 g (H) 41.4 ± 1.6 162.8 ± 2.7 0.90 ± 0.01 84.6 ± 6.5 39.5 ± 1.3 200 g (H) 41.2 ± 1.8 164.1 ± 2.7 0.90 ± 0.01 84.5 ± 6.7 39.4 ± 1.5 400 g (H) 41.7 ± 1.7 163.7 ± 2.8 0.91 ± 0.01 86.0 ± 6.6 40.1 ± 1.6 600 g (H) 41.9 ± 1.7 164.4 ± 2.8 0.91 ± 0.01 86.6 ± 6.6 40.3 ± 1.6
Table 3.4. Physiological variables by testing sequence and work rate (Mean ± SE). Stage (WR)
VO2 (ml/kg/min)
HR (bpm) RER Ve (l/min) Bf (min-1)
1 (L) 30.8 ± 1.6 141.0 ± 3.6 0.89 ± 0.01 61.2 ± 5.8 33.9 ± 2.0 2 (L) 31.5 ± 1.7 146.2 ± 3.7* 0.87 ± 0.01* 62.8 ± 6.1 36.1 ± 2.2* 3 (L) 32.2 ± 1.8* 148.1 ± 3.8* 0.85 ± 0.01*† 63.7 ± 6.5* 37.3 ± 2.4* 4 (L) 32.3 ± 1.8*† 149.1 ± 3.8*† 0.84 ± 0.01*† 63.9 ± 6.4* 38.1 ± 2.3*†
1 (H) 40.4 ± 2.4 159.2 ± 3.6 0.92 ± 0.02 82.4 ± 8.8 37.5 ± 1.9 2 (H) 41.5 ± 2.3* 163.6 ± 3.7* 0.91 ± 0.02* 85.5 ± 9.5* 39.3 ± 2.1* 3 (H) 42.1 ± 2.5* 165.6 ± 4.0* 0.89 ± 0.01*† 86.7 ± 9.5* 41.0 ± 2.0*†
4 (H) 42.2 ± 2.4* 166.5 ± 3.8*† 0.89 ± 0.01*† 87.2 ± 9.4* 41.5 ± 2.3*†
Note: All values at the low work rate were statistically different from all values at the high work rate. * Statistically different (p<0.05) from stage 1; † Statistically different (p<0.05) from stage 2.
Reliability Analysis
A repeated measures ANOVA found that mean HR was statistically different (p ≤
0.05) between the fourth and fifth minutes for 9 of the 16 test stages. Meanwhile, VO2

42
values were not significantly different (p = 0.06 – 0.92) between the fourth and fifth
minute for any stage. The remaining physiological variables (RER, Ve, and Bf) had 1-3
stages where the last two minutes were significantly different (p < 0.05). Mean values
for the fourth minute at all other stages were statistically similar to mean values from the
fifth minute (p = 0.06 – 0.94). The results of the ANOVA are shown in Table 3.5.
Table 3.5. ANOVA p-values comparing the mean values for physiological variables during the fourth minute with the same values from the fifth minute at each test stage. Note that each skier performed only one of the work rates for each stage (i.e., either 1 (L) or 1 (H) but not both) for a total of 8 of the 16 stages.
Stage (WR) VO2 HR RER Ve Bf 1 (L) 0.27 0.09 <0.01* 0.02* 0.33 1 (H) 0.28 0.02* 0.58 0.28 0.26 2 (L) 0.20 0.64 0.31 0.15 0.60 2 (H) 0.10 0.06 0.15 0.29 0.10 3 (L) 0.26 0.01* 0.04* 0.06 0.42 3 (H) 0.35 0.01* 0.27 0.30 0.31 4 (L) 0.60 0.01* 0.28 0.86 0.87 4 (H) 0.24 0.65 0.75 0.50 0.40 5 (L) 0.26 <0.01* 0.69 0.09 0.02* 5 (H) 0.92 0.02* 0.08 0.50 0.54 6 (L) 0.68 0.30 0.16 0.55 0.22 6 (H) 0.06 0.01* 0.93 0.03* 0.19 7 (L) 0.26 0.41 0.01* 0.18 0.24 7 (H) 0.49 0.01* 0.79 0.51 0.49 8 (L) 0.74 0.51 0.94 0.35 0.18 8 (H) 0.59 0.05* 0.57 0.76 0.69
*Significant difference (p≤0.05) between minutes 4 and 5.
In contrast to the results of the ANOVA, each physiological variable analyzed had
high ICC (0.79 – 1.00) and low SEM (0.00 – 4.21) values at every stage. The high ICC
and low SEM values resulted from the high variability between subjects, and therefore
were less useful for identifying trends within subjects. As a result, the reliability analysis
as a whole indicated that HR tended to drift and could not be considered steady-state,

43
whereas the other variables were fairly consistent within each stage and could be
considered steady-state values.
Cycle Rate
Cycle rate was significantly different between work rates (p < 0.01) for all limb
load conditions. Interestingly, cycle rate was the only variable measured that was not
statistically different between the test stages at either work rate (p = 0.27, 0.95). Also,
cycle rate was the only variable that approached significance between limb load
conditions (p=0.06). Mean cycle rate values from each condition are displayed in Figure
3.1.
Figure 3.1. Mean (±SE) cycle rate values for each limb load condition at both high and low work rates. Cycle rates at the low work rate were all statistically lower (p<0.05) than those at the high work rates. Cycle rate was similar to the physiological variables in that there was no
interaction between the limb loading condition and the work rate (p=0.52). However,
cycle rate differed from the physiological variables in that there was a moderate positive
44
correlation with the limb loading conditions (R2 = 0.73 and 0.83 for the high and low
WR, respectively), but only weak correlations with the test sequence (R2 = 0.47 and 0.44
for the high and low WR, respectively).
Discussion
The primary purpose of this investigation was to determine the effect of lower
limb loading on skate roller skiing economy and gross movement kinematics. Four
different limb loading conditions (0 g, 200 g, 400 g, and 600 g added per foot) were each
evaluated at both a high and a low work rate. The study found no significant differences
in VO2 or cycle rate between the four limb loading conditions at either work rate.
However, a sub-analysis found that all physiological variables significantly increased
throughout the progression of test stages, except for RER, which steadily decreased.
Interestingly, these changes were independent of limb loading conditions.
Physiological Variables
Primary Analysis. No significant differences existed between the four lower limb
loading conditions at either work rate for any of the variables tested (VO2, HR, RER, Ve,
or Bf). This finding was unexpected because previous research has found that added
mass significantly increases VO2 for other forms of locomotion. For example, it is well
documented that VO2 while running or walking increases by about 1% for every
additional 100 g on each foot (Divert et al. 2008; Franz et al. 2012; Jones et al. 1984;
Martin 1984; Ralston & Lukin 1969; Soule & Goldman 1969). In contrast, the present
45
study added as much as 600 g on each boot of skate roller skiers, yet did not find any
significant changes in VO2. This finding may suggest that added lower limb mass has a
smaller effect on skate roller skiing economy than running economy.
Sub-analysis. In the present study, it was observed that VO2, Ve, and Bf values
tended to increase throughout test stages independent of limb loading condition.
Consequently, a sub-analysis was performed to investigate the effect of testing sequence
on the resulting physiological variables. This analysis found that all physiological
variables had significant differences between test stages at both work rates. A Tukey’s
multiple comparisons test revealed a clear pattern that all values increased as the test
progressed, except RER, which decreased throughout testing. These differences were
observed independent from the order of limb loading conditions. In fact, HR and VO2
each had a stronger correlation with the testing sequence than they did with the limb
loading condition. The phenomenon of increasing cardiovascular values over time
despite a constant work rate has previously been observed and is referred to as
cardiovascular (CV) drift. Cardiovascular drift is primarily characterized by a continuous
increase in HR such that a steady state is not attained. If subjects were experiencing CV
drift, then it is possible that they were not in a steady state at the end of each stage of
testing.
Reliability
Since it was an assumption of this study that subjects were at a steady state during
the last two minutes of each stage, a reliability analysis was performed that compared the

46
mean cardiovascular values from the fourth minute of each stage with the mean values
from the fifth minute of the same stage. The analysis consisted of an ANOVA and
calculation of ICC and SEM values for each stage. This analysis found that mean HR
values were significantly different in the fourth minute compared to the fifth minute in 9
of the 16 test stages. Eight of the nine differences in HR between the fourth and fifth
minutes were increases. Clearly, steady state HR was not consistently attained during the
test stages. In contrast, VO2 had no significant differences between the fourth and fifth
minute of any stage, while the remaining physiological variables (RER, Ve, Bf) each had
significant differences in only 1-3 of the 16 test stages. All variables had high ICC and
low SEM values for every stage. However, the calculation of both the ICC and the SEM
involve comparing the variability within subjects to the variability between subjects. The
variability between subjects in this study was high, especially between male and female
subjects, so the high ICC and low SEM values are the result of large variability between
subjects rather than small variability within. Thus, the ICC and SEM values are less
informative than the ANOVA results. As a result, all variables except for HR can be
considered steady state values during the last two minutes of each test stage.
Cardiovascular Drift. A gradual increase in HR is the characteristic feature of
cardiovascular drift (Ekelund & Holmgren 1964; Ekelund 1967; Fritzsche 1998;
Mattsson et al. 2011). In this study, HR clearly increased within each stage, as well as
throughout the progression of test stages. Even though the remaining variables appeared
to reach a steady state within each stage of this study, it is still likely that CV drift
occurred. In fact, while increased VO2 is usually observed with CV drift, it is typically a

47
small change (Ekelund & Holmgren 1964; Mattsson et al. 2010) and is not always
significant over 60 minutes of exercise (Ekelund 1967). Meanwhile increases in other
pulmonary measures such as Ve and Bf have been recorded in some (Ekelund &
Holmgren 1964), but not all CV drift studies (Ekelund 1967; Mattsson et al. 2010).
Therefore achievement of a steady state for two minutes at the end of a five minute stage
is not strong enough evidence to reject the possibility that CV drift affected subjects in
this study.
Fatigue is the most common cause of CV drift (Fritsche 1998). Therefore, CV
drift usually occurs during high intensity or long duration exercise. In this study,
however, subjects seemed to experience CV drift without roller skiing at a high intensity
or for a long duration. The exercise intensity was below lactate threshold for all subjects,
yet subjects were unable to attain a steady state HR even in the first five-minute stage at
the high work rate. This finding conflicts with previous research, which has shown that a
steady state heart rate can be maintained for at least 30 minutes while exercising at a
work rate up to that at which anaerobic threshold is reached (Vobejda et al. 2006). Thus,
it is unlikely that the drifting observed in this study was due to fatigue from an exercise
bout of high intensity or long duration.
A more likely explanation for the CV drift is that subjects experienced mild
hyperthermia, which is an increase in core body temperature. Hyperthermia has been
shown to directly increase HR (Cooper et al. 1963) as well as increase sympathetic
stimulation (Kenney et al. 1995). The sympathetic nervous system has effects on many
cardiorespiratory factors, including HR, Bf, and Ve. Therefore, it is possible that

48
hyperthermia could have caused the cardiovascular drifting observed in this study
through increased sympathetic nervous system stimulation. Unfortunately, no
measurements of body temperature were taken during this study to confirm this
speculation.
It would be somewhat surprising if the subjects experienced hyperthermia because
they roller skied in moderate ambient temperatures (20-22⁰C) in front of a fan, whereas
hyperthermia is generally observed while exercising in a hot (>30⁰C) environment
(Claremont, Redden, & Brooks 1975). However, the ability to maintain a low core
temperature during exercise requires adaptations. Specifically, exercise in warm
temperatures increases the ability to dissipate heat by increased cutaneous blood flow and
sweating (Saat et al. 2005). When the stimulus of heat exposure is removed, heat
acclimatization decays within 1-4 weeks (Saat et al. 2005; Williams, Wyndham, &
Morrison 1967). Testing for this study occurred in January and February, so any heat
acclimatization that the subjects had from training in warm temperatures during the
summer and fall had decayed.
Further, exercise in cold temperatures, as in cross country skiing, not only causes
decay of heat acclimatization, but also leads to cold acclimatization. The adaptations
associated with cold acclimatization are different from those associated with heat
acclimatization. Primarily, when exercising in hot or moderate ambient temperatures, the
primary method of heat dissipation is by vascular convection, requiring increased skin
blood flow (Gonzalez-Alonzo 2012). In contrast, when exercising in cold ambient
temperatures, the primary method of heat dissipation is simple conduction from muscle to

49
cutaneous tissue (Gonzalez-Alonzo 2012). Further, heat acclimatization allows
individuals to maintain a lower skin temperature, whereas cold acclimatization has been
shown to increase skin temperatures in both cold and moderate ambient temperatures
(Maakinen et al. 2008). Since exercise in the cold uses a different mechanism for
thermoregulation, cold acclimatization is very different from heat acclimatization.
In the current study, testing occurred in the middle of winter, and the subjects had
been exercising outside in temperatures often well below 0⁰C for several months. Not
only were subjects de-acclimatized to exercise in heat, but they also likely had some cold
acclimatization from training outside. As a result, exercise in the moderate ambient
temperatures could have induced a rise in sympathetic nervous stimulation as a result of
mild hyperthermia. Increased sympathetic stimulation could have occurred quickly,
which would explain the cardiac drift observed during the very first test stage. The
increases in Ve and Bf between successive test stages can also be explained by
hyperthermia as both variables have previously been reported to increase with elevated
core temperature (Hayashi et al. 2006).
It is unlikely that the increase in VO2 between test stages of this study is directly
associated with an increase in core temperature because previous studies on mild
hyperthermia have shown no association between core temperature and VO2 (Hayashi et
al. 2006). However, the increase in VO2 might be indirectly caused by hyperthermia via
a combination of several factors. First, it has been reported that the energy expended by
respiratory muscles increases with increased Ve and Bf (Coast et al. 1993; Mattsson et al.
2010). Since both Ve and Bf increased throughout the test stages, it is possible that at

50
least a part of the increase in VO2 between test stages may be explained by the elevated
energy expenditure of respiratory muscles. However, Mattsson et al. (2010) reported that
the drifting VO2 during exercise at a constant work rate was only slightly affected by the
energy expenditure of respiratory muscles. They postulated that VO2 increases in their
study were more likely due to decreased mitochondrial efficiency and decreased
economy of movement resulting from changes in motor unit recruitment patterns. The
change in motor unit recruitment was due to decreased force production by muscle fibers
as a result of fatigue and muscle damage. In this study, subjects were well trained in
skate skiing, so it is unlikely that a change in motor unit recruitment was required during
a 40 minute bout of submaximal roller skiing. However, it is possible that the rise in
temperature could have slightly decreased enzymatic efficiency within the mitochondria.
Therefore, decreased mitochondrial efficiency might have contributed to the increases in
VO2 throughout the progression of testing. A final explanation is that the increases in
VO2 were simply due to an artifact of the metabolic system calculations. Specifically, the
metabolic system only measures the volume of air expired and the composition of gases
expired. It then uses this data to calculate a VO2. If the volume of expired air increases,
the metabolic system calculations for VO2 are inflated. Therefore, it is possible that the
increased VO2 observed was not actually caused by increases in oxygen consumption. In
the present study, it is likely that the observed drift in VO2 is due to a combination of
these factors.
Evaluation of the physiological data in this study suggested that mild
hyperthermia was the cause of the significant differences between test stages. Since the

51
cardiovascular responses were affected by hyperthermia, it cannot be concluded that the
limb loads used in this study did not have any effect on skate roller skiing economy. In
fact, the moderate correlation between the limb loading condition and the physiological
variables suggest that the amounts of mass added to the lower limb in this study might
cause significant differences, but they could not be identified because they were masked
by CV drift. Clearly, more testing is necessary to acquire more information on the effects
of lower limb loading on skate roller skiing economy.
Cycle Rate
Cycle rate was the only measured variable that approached significant changes
between limb loading conditions. While non-significant, it is interesting to note that
cycle rate tended to increase with greater limb loading, which is in contrast to some
studies, which have observed an increase in step frequency while running with a limb
load. It had been postulated that added mass on the distal end of the lower limb might
reduce the speed at which the limbs would move, thus forcing a lower cycle rate. In
contrast, the results showed a trend towards a greater cycle rate with increasing limb
loading. However, it is unlikely that added mass on the lower limb directly increased
cycle rate. Instead, it is more likely that the added mass directly decreased cycle length,
which then caused the subjects to use a faster cycle rate to be able to maintain constant
velocity. Unfortunately, there are no currently published studies investigating limb
loading and cycle rate or cycle length with which to compare these findings. However,
future research into the relationship between limb loading and cycle length would be
valuable because cycle length has been positively correlated with ski race performance
52
(Bilodeau et al. 1996; Rundell & McCarthy 1996; Sandbakk et al. 2011). Therefore,
heavier equipment might negatively impact performance if the extra mass on the lower
limb forces skiers to use a shorter cycle length.
Cycle rates used during each stage at the low work rate were all significantly
lower than the cycle rates used during each stage at the high work rate. This is in
agreement with previous research, which has shown that a skier uses the same cycle rate
at all work rates that have a constant external power demand (Reinking 2013). Further, a
skier’s cycle rate will increase when the external power demand increases.
Cycle rate was the only variable measured that was not significantly different
between test stages. This finding is supports the postulation that the physiological
variables drifted due to hyperthermia because mild hyperthermia would not have affected
cycle rate. If fatigue had been the factor causing the CV drift, then it is possible that
kinematics, including cycle rate, might have changed due to different motor unit
recruitment as the test progressed.
Future Considerations
In this study, it is possible that mild hyperthermia was the cause of gradual
increases in all physiological variables throughout the progression of test stages
independent of limb loading condition. It is also possible that the drifting masked the
true effects of the lower limb loading. As a result, future testing is necessary to identify
the effects of added mass on skate roller skiing economy independent of the effects of
mild hyperthermia. In future testing, care should be taken to ensure that subjects are
adequately acclimatized to the testing environment. One method of doing so would be to

53
perform the testing in the summer or fall when subjects have been training in warm air
temperatures and have adapted accordingly. Alternatively, a cooler ambient temperature
in the lab or greater wind chill by using a second fan could prevent hyperthermia during
winter testing. Either of these options might reduce the cardiovascular drift and enable a
better investigation of the effects of lower limb loading on skate roller skiing economy.
Conclusions
It has been suggested that the speed of skate ski races has increased as a result of
improved skate skiing economy due to lighter equipment (Street 1992). Unfortunately,
no studies exist that investigate the effect of the mass of skate ski equipment on any
markers of performance. The present study added mass to the lower limbs of skate roller
skiers to simulate the effects of heavier skate skiing equipment on roller skiing economy
and gross movement kinematics.
This study found no significant differences in skate roller skiing economy or
kinematics between lower limb loads of 0 g, 200 g, 400 g, and 600 g on each foot.
However, there were significant differences between test stages independent of limb
loading condition. Also, a reliability analysis between the fourth and fifth minutes of
each test stage indicated that HR values were not at steady state during testing.
Collectively, these findings suggest that subjects experienced cardiovascular drift. The
most obvious increases over time were observed for mean HR values. This finding is
consistent with previous research showing that the primary attribute of CV drift is a
gradual increase in HR (Ekelund & Holmgren 1964; Ekelund 1967; Saat 2005). Oxygen

54
consumption, Ve, and Bf were stable enough to reach a steady state in each stage, but
gradually increased throughout the progression of test stages. It was speculated that these
changes were the result of greater stimulation by the sympathetic nervous system due to
mild hyperthermia. Unfortunately, since VO2 and HR values drifted throughout testing,
the effects of the limb loading conditions might have been masked. As a result, further
research is still necessary to identify the true effects of lower limb loading on skate roller
skiing economy, and those studies should take care to ensure subjects are adequately
acclimatized to the testing environment to prevent hyperthermia.
Finally, there was a non-significant trend that cycle rate increased with limb
loading. This finding was opposite of what was expected, and the researchers do not
have an explanation for this result. However, it is likely that the added mass indirectly
affected cycle rate by directly decreasing cycle length. Further research is necessary to
identify the effects of lower limb loading on gross movement kinematics.

55
4. CONCLUSIONS
Cross country skate ski race speed has increased over recent decades at a much
greater rate than that of similar endurance based sports. Among the many factors that
contribute to performance in cross country skiing, economy has been proposed as the
primary cause of the dramatic increase in ski race speed (Street 1992). Skate skiing
economy is affected by both internal factors, such as movement patterns and motor unit
recruitment, and external factors, such as the coefficient of sliding friction and the mass
of the equipment. Street (1992) specifically identified reductions in the mass of ski
equipment as the most important change that led to increases in skate ski racing speed.
While no currently published studies exist that establish a relationship between
skate skiing economy and the mass of skate skiing equipment, it has been well
documented that equipment mass affects running and walking economy. In general,
studies have found that for every 100 g added to each foot while walking or running,
oxygen consumption (VO2) increases by about 1% (Divert et al. 2008; Franz et al. 2012;
Jones et al. 1984; Martin 1984; Ralston & Lukin 1969; Soule & Goldman 1969). Further,
mass added to running shoes has been found to decrease stride rate (Divert et al. 2008;
Lussiana et al. 2013). Since the metabolic and neural patterns of cross country skiing are
similar to those of distance running (Stöggl & Müller 2009), it is likely that skate skiers
respond to lower limb loading similar to runners. Therefore, changes in the mass of skate
skiing equipment are expected to affect skate skiing economy and kinematics, and,
possibly, ski racing performance.

56
This study added mass (0 g, 200 g, 400 g, and 600 g per foot) to the lower limbs
of skate roller skiers to simulate heavier ski equipment and to determine the effects of
heavier equipment on skate skiing economy and cycle rate. It was theorized that a greater
limb load would increase VO2 and HR at a constant work rate. However, the results of
this study were that no significant differences existed between the different limb loading
conditions. Interestingly, heart rate, VO2, and respiratory measures were significantly
higher in later test stages compared to the first stages, regardless of the order of limb
loading conditions. A reliability analysis was then performed to evaluate the assumption
that subjects were in a steady state during each stage of the test. The results of the
reliability analysis suggested that HR did not reach a steady state, but instead continued
to increase in the last two minutes of at least half of the test stages. The combined results
of the sub-analysis indicated that subjects experienced cardiovascular drift.
Cardiovascular drift typically results from fatigue due to an exercise bout being of
high intensity or of long duration. However, it is unlikely that either the intensity or the
duration of the exercise performed in this study was great enough to cause the
cardiovascular drift. Alternatively, the cardiovascular drift observed in this study might
have resulted from mild hyperthermia because the subjects were cold acclimatized but
were being testing in moderate ambient temperatures. The effects of hyperthermia could
explain the significant differences between the test stages as well as the HR drift that was
observed within stages. Unfortunately, it is also possible that the limb loading conditions
used in this study did have an effect on economy, but the effect could not be identified
because it was masked by the cardiovascular drift. As a result, further testing is

57
necessary to identify the effects of added mass on the lower limbs while skate roller
skiing. In future tests, researchers should attempt to minimize cardiovascular drift, which
might involve adequately habituating the subjects to the temperature of the testing
environment.
The final finding of this study was that gross movement kinematics showed a
non-significant trend towards increased cycle rate with increases in limb loading. This
finding is in contrast to some previous research on limb loading, which has found that
added lower limb mass causes a decrease in stride rate while running (Divert et al. 2008;
Lussiana et al. 2013). The researchers do not have an explanation for this discrepancy.
Therefore, it would be valuable for future research to investigate the effects of lower limb
loading on cycle rate and cycle length of skate skiing in greater detail.

58
REFERENCES CITED

59
Andersson, E., Supej, M., Sandbakk, Ø., Sperlich, B., Stöggl, T., & Holmberg, H. (2010). Analysis of sprint cross-country skiing using a differential global navigation satellite system. Eur J Appl Physiol, 110, 585-595. Doi: 10.1007/s00421-010-1535-2
Astrand, P.O. (1967). Measurement of maximal aerobic capacity. Can Med Assoc J,
96(12), 732-735. Bilodeau, B., Rundell, K.W., Roy, B., & Boulay, M.R. (1996). Kinematics of cross-
country ski racing. Med Sci Sport Exer, 28(1), 128-138. Blegen, M., Szmedra, L., Kammermeier, P., & Rundell, K.W. (1996). Cross-country
skiing economy of two skating techniques. Med Sci Sport Exer, 28(5), 134. Cavanagh, P.R., & Kram, R. (1985a). Mechanical and muscular factors affecting the
efficiency of human movement. Med Sci Sport Exer, 17(3), 326-331. Cavanagh, P.R., & Kram, R. (1985b). The efficiency of human movement – a statement
of the problem. Med Sci Sport Exer, 17(3), 304-308. Cavanagh, P.R., & Williams, K.R. (1982). The effect of stride length variation on
oxygen uptake during distance running. Med Sci Sport Exer, 14(1), 30-35. Claremont, A.D., Nagle, F., Reddan, W.D., & Brooks, G.A. (1975). Comparison of
metabolic, temperature, heart rate, and ventilator responses to exercise at extreme ambient temperatures (0⁰ and 35⁰C). Med Sci Sport Exer, 7(2), 150-154.
Coast, J.R., Rasmussen, S.A., Krause, K.M., O’Kroy, J.A., Loy, R.A., & Rhodes, J.
(1993). Ventilatory work and oxygen consumption during exercise and hyperventilation. J Appl Physiol, 74(2), 793-798.
Conley, D.L., & Krahenbuhl, G.S. (1980). Running economy and distance running
performance of highly trained athletes. Med Sci Sport Exer, 12(5), 357-360. Cooper, T., Willman, V.L., & Hanlon, C.R. (1963). Cardiovascular responses to
hyperthermia. Chest, 44(1), 88-89. Doi: 10.1378/chest.44.1.88 Cross-Country Skier Magazine. (2010). New Equipment. Cross-Country Skier.
Retrieved from < http://viewer.zmags.com/publication/cdf4ba7d#/cdf4ba7d/23>. Divert, C., Mornieux, G., Freychat, P., Baly, L., Mayer, F., & Belli, A. (2008). Barefoot-
shod running differences: Shoe or mass effect? Int J Sports Med, 29, 512-518. Doi: 10.1055/s-2007-989233

60
Ekelund, L.G. (1967). Circulatory and respiratory adaptation during prolonged exercise of moderate intensity in the sitting position. Acta Physiol Scand, 69, 327-340.
Ekelund, L.G., & Holmgren, A. (1964). Circulatory and respiratory adaptation during
long-term, non-steady state exercise in the sitting position. Acta Physiol Scand, 62, 240-255.
Fis-ski.com. (2013). Race results. Retrieved from <http://data.fis-
ski.com/dynamic/results.html?sector=CC&raceid=20653>. Franz, J.R., Wierzbinski, C.M., & Kram, R. (2012). Metabolic cost of running barefoot
versus shod: Is lighter better? Med Sci Sport Exer, 44(8), 1519-1525. Doi: 10.1249/MSS.0b013e3182514a88.
Frederick, E.C. (1984). Physiological and ergonomics factors in running shoe design.
Appl Ergon, 15(4), 281-287. Fritzsche, R.G. (1998). Cardiovascular drift during prolonged exercise: Determinants
and effects on performance. Retrieved from ProQuest Digital Dissertations. (9837980).
Gonzalez-Alonzo, J. (2012). Human thermoregulation and the cardiovascular system.
Exp Physiol, 97(3), 340-346. Doi: 10.1113/expphysiol.2011.058701 Hayashi, K., Honda, Y., Ogawa, T., Kondo, N., & Nishiyasu, T. (2006). Relationship
between ventilator response and body temperature during prolonged submaximal exercise. J Appl Physiol, 100, 414-420. Doi: 10.1152/japplphysiol.00541.2005
Hendrickson, T.L., Porcari, J.P., Terry, L., Walsko, G., & Walkter, P.R. (1997). The
physiological responses to walking with and without Power Poles on treadmill exercise. Res Q Exercise Sport, 68(2), 161.
Jones, B.H., Toner, M.M., Daniels, W.L., & Knapik, J.J. (1984). The energy cost and
heart rate response of trained and untrained subjects walking and running in shoes and boots. Ergonomics, 27(8), 895-902.
Kenney, M.J., Barney, C.C., Hirai, T., & Gisolfi, C.V. (1995). Sympathetic nerve
responses to hyperthermia in the anesthetized rat. J Appl Physiol, 78(3), 881-889. Kinematics. (2008). Key Concepts in Sport & Exercise Sciences. Retrieved from
<http://proxybz.lib.montana.edu/login?qurl=http%3A%2F%2Fwww.credoreference.com/entry/sageuksport/kinematics>.

61
Kvamme, B., Jakobsen, V., Hetland, S., & Smith, G. (2005). Ski skating technique and physiological responses across slopes and speeds. Eur J Appl Physiol, 95, 205-212. Doi: 10.1007/s00421-005-1332-5.
Lussiana, T., Fabre, N., Hebert-Losier, K., & Mourot, L. (2013). Effect of slope and
footwear on running economy and kinematics. Scand J Med Sci Spor, 23(4), e246-e253. Doi: 10.1111/sms.12057.
Maakinen, T.M., Maantysaari, M., Paakkonen, T., Jokelainen, J., Palinkas, L.A., Hassi,
J., Leppaaluoto, J., Tahvanainen, K, & Rintamaaki, H. (2008). Autonomic nervous function during whole-body cold exposure before and after cold acclimation. Aviat Space Environ Med, 79, 875-882. Doi: 10.3357/ASEM.2235.2008
Mahood, N.V., Kenefick, R.W., Kertzer, R., & Quinn, T.J. (2001). Physiological
determinants of cross-country ski racing performance. Med Sci Sport Exer, 33(8), 1379-1384.
Marathon Records (2013). Marathon Guides. Retrieved from
<http://www.marathonguide.com/history/records/>. Marsh, R.L., Ellerby, D.J., Carr, J.A., Henry, H.T., & Buchanan, C.I. (2004).
Partitioning the energetics of walking and running: Swinging the limbs is expensive. Science, 303(5654), 80-83.
Martin, P.E. (1984). Mechanical and physiological responses to lower extremity loading
during running. Med Sci Sport Exer, 17(4), 427-433. Mattsson, C.M., Enqvist, J.K., Brink-Elfegoun, T., Johansson, P.H., Bakkman, L., &
Ekblom, B. (2010). Reversed drift in heart rate but increased oxygen uptake at fixed work rate during 24h ultra-endurance exercise. Scand J Med Sci Sports, 20, 298-304. Doi: 10.1111/j.1600-0838.2009.00878.x
Mattsson, C.M., Ståhlberg, M., Larsen, F.J., Braunschweig, F., & Ekblom, B. (2011).
Late cardiovascular drift observable during ultraendurance exercise. Med Sci Sports Exer, 43(7), 1162-1168. Doi: 10.1249/MSS.0b013e318208f773
Millet, G.Y., Hoffman, M.D., Candau, R.B., & Clifford, P.S. (1998). Poling forces
during roller skiing: Effects of grade. Med Sci Sport Exer, 30(11), 1637-1644. Myers, M.L., & Steudel, K. (1985). Effect of limb mass and its distribution on the
energetic cost of running. J Exp Biol, 116, 363-373.

62
Olympic.org. (2013). Event results. Retrieved from < http://www.olympic.org/olympic-results>.
Rahikainen, A., Avela, J., & Virmavirta, M. (2012). Modeling the force-velocity
relationship in arm. World J Mechanics, 2(2), 90-97. Doi: 10.4236/wjm.2012.22011
Ralston, H.J., & Lukin, L. (1969). Energy levels of human body segments during level
walking. Ergonomics, 12(1), 39-46. REI.com. (2013). Race/performance XC skiing. Retrieved from
<http://www.rei.com/category/4500302>. Reinking, B.W. (2013). Treadmill grade as a determinant of roller skiing oxygen
consumption at a constant external power demand. (Master’s Thesis). Montana State University, Bozeman, Montana.
Rodgers, C., VanHeest, J., & Schachter, C. (1995). Energy expenditure during
submaximal walking with Exerstriders[R]. Med Sci Sport Exer, 4, 607-611. Rossignol.com. (2013). Retrieved from <http://www.rossignol.com/US/US/home-
nordic.html>. Rundell, K.W., & McCarthy, J.R. (1996). Effect of kinematic variables on performance
in women during a cross-country ski race. Med Sci Sport Exer, 28(11), 1413-1417.
Saat, M., Sirisinghe, R.G., Singh, R., & Tochihara, Y. (2005). Decay of heat acclimation
during exercise in cold and exposure to cold environment. Eur J Appl Physiol, 95, 313-320. Doi: 10.1007/s00421-005-0012-9
Salomon Nordic. (2012). Fall/winter 2012/2013 catalog. Salomon USA, Ogden, UT. Sandbakk, Ø., Ettema, G., & Holmberg, H. (2012a). The influence of incline and speed
on work rate, gross efficiency and kinematics of roller ski skating. Eur J Appl Physiol, 112, 2829-2838. Doi: 10.1007/s00421-011-2261-0.
Sandbakk, Ø., Ettema, G., Leirdal, S., & Holmberg, H. (2012b). Gender differences in
the physiological responses and kinematic behavior of elite sprint cross-country skiers. Eur J Appl Physiol, 112, 1087-1094. Doi: 10.1007/s00421-011-2063-4.
Sandbakk, Ø., Ettema, G., Leirdal, S., Jakobsen, V., & Holmberg, H. (2011). Analysis of
a sprint ski race and associated laboratory determinants of world-class

63
performance. Eur J Appl Physiol, 111, 947-957. Doi: 10.1007/s00421-010-1719-9.
SkinnySkis.com. (2013). Retrieved from <http://skinnyskis.com/home>. Soule, R.G., & Goldman, R.F. (1969). Energy cost of loads carried on the head, hands,
or feet. J Appl Physiol, 27(5), 687-690. Stöggl, T.L., & Müller, E. (2009). Kinematic determinants and physiological response of
cross-country skiing at maximal speed. Med Sci Sport Exer, 41(7), 1476-1487. Doi: 10.1249/MSS.0b013e31819b0516.
Street, G.M. (1992). Technological advances in cross-country ski equipment. Med Sci
Sport Exer, 24(9), 1048-1054. Taylor, C.R., Heglund, N.C., McMahon, T.A., & Looney, T.R. (1980). Energetic cost of
generating muscular force during running: A comparison of large and small animals. J Exp Biol, 86, 9-18.
Vobejda, C., Fromme, K., Samson, W., & Zimmermann, E. (2006). Maximal constant
heart rate – A heart rate based method to estimate maximal lactate steady state in running. Int J Sports Med, 27, 368-372.
Williams, C.G., Wyndham, C.H., & Morrison, J.F. (1967). Rate of loss of
acclimatization in summer and winter. J Appl Physiol, 22(1), 21-26.

64
APPENDICES

65
APPENDIX A
SUBJECT CONSENT FORM

66
SUBJECT CONSENT FORM FOR PARTICIPATION IN HUMAN RESEARCH AT MONTANA STATE UNIVERSITY – BOZEMAN
PROJECT TITLE: The effect of lower limb loading on economy and kinematics of skate roller skiing
FUNDING: This study is NOT a funded project PROJECT DIRECTOR: Tyler Reinking, Masters Student Department of Health and Human Development Movement Science / Human Performance Laboratory H&PE Complex, Montana State University Bozeman, MT, 59717, 970-389-6187, [email protected] PURPOSE: The purpose of this project is to determine the effect of lower limb loading on energy expenditure and movement patterns. Additional mass attached to ski boots will simulate mass differences that are observed between different skate skiing equipment packages. The different amounts of mass added to your boots will allow us to evaluate changes in the energy cost of roller skiing as well as changes in body movements due to limb loading. You have been identified as a potential subject for this research project because of your skills in Nordic skiing. Each participant is presented with this Informed Consent Document which explains the purpose of the testing, as well as risks and benefits associated with participation. Also, each participant is asked to complete a health history questionnaire for the purpose of identifying any health conditions that increase the risks associated with participation in this research project. If a concern is identified in your health history questionnaire, it is YOUR responsibility to acquire written medical clearance from your physician, and provide a copy of this written clearance to the Project Director, prior to participation. This procedure is in compliance with policies formulated by the American College of Sports Medicine.1
PROJECT OUTLINE: There is no cost to you (the participant) and participation in this research project is voluntary. If you agree to participate you will be asked to make two separate visits to the Movement Science / Human Performance Lab at Montana State University – Bozeman, which will each last 60 to 90 minutes. Before arriving at the lab you should refrain from all forms of exercise for at least 24 hours. Also, you should refrain from ingesting any foods, drinks (with the exception of plain water), or medications, both prescription and over the counter medications, for at least 2 hours. Water will be allowed prior to and during the testing visits as desired. If any food, drink (other than water), or medication (including cold or allergy medication) is taken within the 2 hours prior to your test visit, please inform the Project Director BEFORE any testing begins and we will gladly reschedule your visit. If you use a rescue inhaler to treat asthma, make certain to bring the inhaler with you to the lab. You should arrive at the lab
1 American College of Sports Medicine (2010). ACSM’s Guidelines for Exercise Testing and Prescription (8Th Edition). Williams & Wilkins, Philadelphia, PA.
67
ready to engage in high intensity exercise. Therefore, you should dress (lightweight exercise clothing suitable for roller skiing), eat, and drink fluids appropriately for the occasion. The first visit to the lab will involve the completion of a roller skiing lactate threshold (LT) test. The primary purpose of this test is to identify the power demand at which your blood lactate concentrations increase rapidly. This will allow us to calculate your skiing intensity relative to your lactate threshold while roller skiing during visit two. After measuring body height and weight, you will be allowed to warm-up roller skiing on the treadmill at 2° (3.5%) and at a self-selected speed for 10 minutes before starting the LT protocol. The test itself will start out easy and will gradually increase in difficulty with each stage as the treadmill speed is increased. Each stage will involve three minutes of roller skiing using the V2 technique followed by one minute of rest. During each one-minute rest, a fingertip blood sample will be collected from the left hand with the purpose of analyzing your blood lactate concentration. This procedure involves a prick at the end of the finger with a sterile lancet to produce a small droplet of blood that is then absorbed onto a blood lactate test strip. The finger is then wrapped with a bandage and the next stage begins. You will continue to progress to each additional stage until the Project Director observes a significant spike in blood lactate, which means that you have crossed lactate threshold. Once this happens, the LT protocol will be terminated and you will begin a 5-10 minute active recovery by roller skiing on the treadmill at 2° and 1.8 m/s (4 mph). These protocols typically last 3-5 stages for a total of 12-20 minutes. The second visit will involve submaximal roller skiing under four different limb loading conditions (0 g, 200 g, 400 g, and 600 g on each boot; or 0 lbs, 0.44 lbs, 0.88 lbs, and 1.32 lbs on each boot), each at two work rates. The masses used are representative of possible variations observed in skate skiing equipment packages. This will allow us to determine the effect of added mass to the lower limb on economy and movement patterns. Once again, you will begin by roller skiing to warm-up on the treadmill at 2° (3.5%) and at a self-selected speed for 10 minutes. After completion of the warm-up period, you will be allowed to rest for five minutes while the first limb load condition is placed upon you. Mass will be attached by taping disc weights to the lateral aspect of each of your boots at the ankle (specifically, the lateral malleolus). Once the mass is secure, you will roller ski for five minutes at one of the two work rates (3 m/s at 2° and 4° [6.7 mph at 3.5% and 7%] for males; 2 m/s at 2° and 4° [4.5 mph at 3.5% and 7%] for females). Then, the treadmill grade will be changed and you will roller ski for another five minutes at the second work rate. Upon completion of the second work rate, you will be given another five minutes to rest while the limb load is changed. Once again, you will roller ski for ten minutes, which will include five minutes at each work rate. The process will be repeated for all four limb load conditions and include a total of 40 minutes of roller skiing. Upon completion of the last stage, you will begin a 5-10 minute active recovery by roller skiing on the treadmill at 2° and 1.8 m/s (4mph). For the duration of both visits, warm-up and recovery excluded, you will be breathing through a facemask and wearing a small backpack holding a portable metabolic system (< 6 lbs) so that the amount of oxygen you are using can be measured. At the same time, you will be wearing a heart rate monitor strap around your chest to measure heart rate via telemetry. Finally, to increase safety you will be wearing a climbing harness that attaches to an overhead suspension system to catch you in the event of a fall while roller skiing.

68
During the second visit, video recordings of you will be taken for analytical purposes. These videos will not be shared in any form. Also, you will have the option of allowing photographs to be taken of you during testing. If photographs are allowed, they may be shared during professional presentations of the research project. POTENTIAL RISKS: You should be aware that submaximal LT tests may cause fatigue immediately after the tests and possibly during the next day. Treadmill testing protocols also involve a chance of precipitating a cardiac event (such as abnormal heart rhythms) or even death. However, the possibility of such an occurrence is very slight (less than 1 in 10,000). These statistics are for maximal treadmill tests and since you are participating in a submaximal test, these risks are even lower. Also, the risks are low since 1) you are in good physical condition with no known symptoms of heart disease and 2) the test will be administered by trained personnel familiar with the lab’s emergency action plan. These risks are certainly no greater than those experienced by trained athletes in actual race competition. The measuring and safety devices (facemask, heart rate monitor, and climbing harness) may feel somewhat restricting and/or uncomfortable during testing, but all possible adjustments will be made to achieve the greatest comfort for you. The safety harness is worn to suspend you above the treadmill in the unlikely event of a fall on while roller skiing. While falling is always a possibility for any type of treadmill-based activity, a fall resulting in injury during the current study is unlikely but possible given your experience with roller skiing outdoors. Wearing the harness may feel somewhat odd at first, but the harness should not restrict your movement abilities whatsoever while roller skiing. Approximately 3-5 drops of blood will be removed by fingertip sampling (i.e., 1 drop per finger puncture). This is a standard method used to obtain blood for routine hospital laboratory tests. You will experience pain when a sterile lancet goes into your finger. Other than momentary pain, the discomfort of the finger prick should be minimal. However, in about 10% of cases a small amount of bleeding under the skin will produce a bruise (hematoma). A small scar may persist for several weeks. The risk of local infection is less than 1 in 1,000. All possible precautions will be taken to ensure your safety and make you feel comfortable before any testing takes place. SUBJECT COMPENSATION: You will receive a copy or your LT test results directly. There are no other forms of compensation available for participating in this project. BENEFITS: There are no direct benefits to you as a volunteer for this project. However, the Project Director, Tyler Reinking, is willing to discuss the interpretation of your own test results. You may contact Tyler Reinking by phone (970-389-6187) or E-mail ([email protected]) at any time to discuss this option further. In regards to overall project benefits, the conclusions of this study will be used to investigate the effect of limb loading on economy and kinematics of skate roller skiing. This information may be used to postulate the effect of differences in the mass of Nordic skiing equipment on markers of performance such as economy. CONFIDENTIALITY: The data and personal information obtained from this project will be regarded as privileged and confidential. Your test results will not be released to anyone else except upon your written request/consent. Your right to privacy will be maintained in any

69
ensuing analysis and/or presentation of the data by using coded identifications of each person’s data. FREEDOM OF CONSENT: You may withdraw consent for participation in writing, by telephone, or in person without prejudice or loss of benefits (as described above). Participation in this project is completely voluntary. In the UNLIKELY event that your participation in the project results in physical injury to you, the Project Director will advise and assist you in receiving medical treatment. No compensation is available from Montana State University for injury, accidents, or expenses that may occur as a result of your participation in the project. Additionally, no compensation is available from Montana State University for injury, accidents, or expenses that may occur as a result of traveling to and from you appointments at the Movement Science / Human Performance Laboratory. Further information regarding medical treatment may be obtained by calling the Project Director, Tyler Reinking, at 970-389-6187 or the Lab Director, Dan Heil, at 406-994-6324. You are encouraged to express any questions, doubts, or concerns regarding this project. The Project Director will attempt to answer all questions to the best of his ability prior to any testing. The Project Director fully intends to conduct the study with your best interest, safety, and comfort in mind. If you have additional questions about the rights of human subjects you can contact the Chair of the Institutional Review Board, Mark Quinn, at 406-994-4707 or [email protected].

70
PROJECT TITLE: The effect of lower limb loading on economy and kinematics of skate roller
skiing
STATEMENT OF AUTHORIZATION
I have read the above and understand the discomforts, inconvenience, and risk of this study. I,
_____________________________ (print your name), agree to participate in this research. I
understand that I may later refuse to participate, and that I may withdraw from the study at any
time. I have received a copy of this consent form for my own records.
____________________________________ ______________ Signature of Participant Date ____________________________________ ______________ Signature of Parent or Guardian (if under 18) Date ____________________________________ __________________ Print Name of Parent or Guardian Relationship to Subject ____________________________________ ______________ Investigator Date
Please initial one of the following:
I give permission for photographs to be taken of me during this project with the understanding that these photographs may be used in professional presentations.
I DO NOT give permission for photographs to be taken of me during this project.

71
APPENDIX B
HEALTH HISTORY QUESTIONNAIRE

72
Health History Questionnaire (HHQ) - Montana State University Movement Science / Human Performance Laboratory
INSTRUCTIONS Complete each of the following questions as accurately as possible by filling in the blanks or checking the most appropriate box. All information provided is confidential and no information will be released without your written consent. Today’s Date _______________
GENERAL INFORMATION Mr. ❍ Ms. ❍ Miss ❍ Mrs. ❍ Dr. ❍ Last Name _____________________________ First Name _____________________ Mailing Address _____________________________________________________ _____________________________________________________ Home Phone _________________________ Office Phone ______________________ Occupation __________________________________________________________ Employer __________________________________________________________ Person to Contact in Emergency: Name _____________________________________ Relationship ________________________________ Phone ________________________________ ▪ Descriptive information: Gender: Male ❍ Female ❍ Body Weight ______________ Age _______ Date of Birth ___________ Body Height ______________ ▪ Why are you filling out this questionnaire? ❍ You have volunteered for a research study or project.
❍ You are being screened for fitness testing in the Movement Science Lab. ❍ Other reason...______________________________________________

73
MEDICAL HISTORY Name of your physician ________________________________________________
(Address/phone?) ________________________________________________
▪ Family History: Did your father, or other first degree male relative (like a brother) die before the age of 55?
No ❍ Yes ❍ If Yes, cause? _____________________
Age at death? _____________________
Which relative? _____________________
Did your mother, or other first degree female relative (like a sister) die before the age of 65?
No ❍ Yes ❍ If Yes, cause? _____________________
Age at death? _____________________
Which relative? _____________________
▪ List any food or drug allergies: __________________________________________
__________________________________________
__________________________________________
__________________________________________
▪ List any medication you are currently taking (non-prescription and prescription, including oral contraceptives). Please comment on the reason for each medication. _____________________________________________________________________
_____________________________________________________________________
_____________________________________________________________________
_____________________________________________________________________
_____________________________________________________________________
▪ Please describe any recent illnesses, hospitalizations, or surgical procedures: _____________________________________________________________________
_____________________________________________________________________
_____________________________________________________________________
_____________________________________________________________________

74
▪ Any of these health symptoms that occurs frequently (ranked as either a 4 or 5 below), either at rest or during physical exertion, is the basis for a prompt medical evaluation. Circle the number indicating how often you have each of the following: 0 = Never 1 = Practically never 2 = Infrequently 3 = Sometimes 4 = Fairly often 5 = Very often a. Coughing up blood. 0 1 2 3 4 5
b. Abdominal pain. 0 1 2 3 4 5
c. Low-back pain. 0 1 2 3 4 5
d. Chest pain. 0 1 2 3 4 5
e. Neck, jaw, arm, or shoulder pain. 0 1 2 3 4 5
f. Leg pain. 0 1 2 3 4 5
g. Swollen joints, especially the ankles. 0 1 2 3 4 5
h. Feel faint. 0 1 2 3 4 5
i. Feeling of dizziness. 0 1 2 3 4 5
j. Breathless with slight exertion. 0 1 2 3 4 5
k. Palpitation or fast heart rate. 0 1 2 3 4 5
l. Unusual fatigue with normal activity. 0 1 2 3 4 5
m. Abnormal/labored breathing at night. 0 1 2 3 4 5
For any score of “4" or higher, use the space below to explain the frequency and the conditions under which you experience that particular symptom: _____________________________________________________________________
_____________________________________________________________________
_____________________________________________________________________
_____________________________________________________________________
_____________________________________________________________________
_____________________________________________________________________
_____________________________________________________________________
_____________________________________________________________________

75
· Please indicate which of the following for which you have been diagnosed or treated by a physician or health professional. Please be as complete as possible. Check if “Yes” If “Yes”, please comment further... ❍ Alcoholism ________________________________________________ ❍ Anemia, sickle cell ________________________________________________ ❍ Anemia, other ________________________________________________ ❍ Asthma ________________________________________________ ❍ Back strain ________________________________________________ ❍ Blood pressure - High?___________________________________________ Low?____________________________________________ ❍ Bronchitis ________________________________________________ ❍ Cancer ________________________________________________ ❍ Cirrhosis, liver ________________________________________________ ❍ Cholesterol - High?___________________________________________ ❍ Concussion ________________________________________________ ❍ Congenital defect ________________________________________________ ❍ Diabetes Type?___________________________________________ ❍ Emphysema ________________________________________________ ❍ Epilepsy ________________________________________________ ❍ Eye problems ________________________________________________ ❍ Gout ________________________________________________ ❍ Hearing loss ________________________________________________ ❍ Heart problems ________________________________________________ ❍ Hypoglycemia ________________________________________________ ❍ Hyperlipidemia ________________________________________________ ❍ Infectious mononucleosis ____________________________________________ ❍ Kidney problems ________________________________________________ ❍ Menstrual irregularities______________________________________________ ❍ Mental illness ________________________________________________ ❍ Neck strain ________________________________________________ ❍ Obesity ________________________________________________ ❍ Phlebitis ________________________________________________ ❍ Rheumatoid arthritis________________________________________________ ❍ Stroke ________________________________________________ ❍ Thyroid problems ________________________________________________ ❍ Ulcer ________________________________________________ ❍ Other ________________________________________________ ________________________________________________ ________________________________________________

76
BLOOD CHEMISTRY PROFILE
▪ Have you ever had a fasting blood sample analyzed for cholesterol? ❍ Yes ❍ No
If “Yes”, when was last time your blood was analyzed? ___________________
If “Yes”, please provide as much detail as possible with regard to the specific blood
components requested below (most recent test results only). Ideally, we would like both
the numerical value of the test result AND the units of the measurement (the units are
typically reported along with the numerical value of the test result).
⋅ Total serum cholesterol _________ units? __________
⋅ HDL (high density lipoprotein) _________ units? __________
⋅ LDL (low density lipoprotein) _________ units? __________
⋅ VLDL (very low density lipoprotein) _________ units? __________
⋅ Triglycerides _________ units? __________
⋅ Blood glucose _________ units? __________
⋅ Hemoglobin _________ units? __________
⋅ Hematocrit _________ units? __________
⋅ Iron _________ units? __________
HEALTH-RELATED BEHAVIORS ▪ Do you now smoke? ❍ Yes ❍ Infrequently ❍ No If “Yes” or “Infrequently”, indicate the number smoked per day (on average): Cigarettes: 40 or more 20-39 10-19 1-9 Cigars/pipes - describe:_______________________________________ ▪ Have you recently quit smoking? ❍ Yes ❍ No

77
If “Yes”, how long ago did you quit? ________ years _________ months ▪ Do you currently work in an environment where smoking is allowed? ❍ Yes ❍ No If “Yes”, where do you work AND how frequently do you work in this environment? ▪ Do you drink alcoholic beverages on a regular basis? ❍ Yes ❍ No (ie. at least once/week) If “Yes”, please answer the following: 1) How frequently do you drink? 2) What alcoholic beverages do you typically consume? ▪ Have you exercised regularly in the past 4 weeks? ❍ Yes ❍ No If “Yes”, describe in terms of frequency, duration, intensity, and type of exercise: ▪ Do you consider yourself physically active due to work-related demands, home or farm chores, etc.? ❍ Yes ❍ No If “Yes”, describe in terms of frequency, duration, intensity, and type of exercise: ▪ Please describe anything not already described on this questionnaire that might cause you problems during exercise (use the space below). ▪ Are there any other health-related problems or concerns NOT addressed on this questionnaire that we should know about? ❍ Yes ❍ No If “Yes”, please describe: