Embed Size (px)
DESCRIPTION
jurnal
Citation preview
DOI: 10.1111/j.1475-679X.2010.00390.xJournal of Accounting Research
Vol. 49 No. 1 March 2011Printed in U.S.A.
The Effect of Mandatory IFRSAdoption on Financial Analysts’
Information Environment
D O N A L B Y A R D , ∗ Y I N G L I , † A N D Y O N G Y U ‡
Received 8 May 2009; accepted 15 October 2010
ABSTRACT
This paper examines the effect of the mandatory adoption of International Fi-nancial Reporting Standards (IFRS) by the European Union on financial ana-lysts’ information environment. To control for the effect of confounding con-current events, we use a control sample of firms that had already voluntarilyadopted IFRS at least two years prior to the mandatory adoption date. We findthat analysts’ absolute forecast errors and forecast dispersion decrease relativeto this control sample only for those mandatory IFRS adopters domiciled incountries with both strong enforcement regimes and domestic accountingstandards that differ significantly from IFRS. Furthermore, for mandatoryadopters domiciled in countries with both weak enforcement regimes anddomestic accounting standards that differ significantly from IFRS, we find
∗Baruch College—CUNY; †The George Washington University; ‡University of Texas atAustin. We thank an anonymous referee and the editor, Richard Leftwich, for many help-ful suggestions and comments. We also thank Bill Baber, Anna Brown, Jay Dahya, MasakoDarrough, Paquita Davis-Friday, Angela Gore, Nicole Heron, Gilles Hilary, Thomas Jeanjean,Sok-Hyon Kang, Krishna Kumar, Fred Lindahl, Carol Marquardt, Yun Zhang and seminarparticipants at George Washington University, the 2008 AAA annual meetings, and the 2010European Accounting Association annual meetings. Additionally, we are also grateful to MariaHelena Almeida, Ingrid Engshagen, Julie Erhardt, Frank-Thomas Graefe, David Grunberger,Virpi Haaramo, Jitka Hrudova, Liza McAndrew-Mobery, Paul Munter, Emmanuel Paret, Flem-ming Petersen, and Siw-Mette Thomassen for providing valuable input regarding institutionaldetails. We acknowledge the contribution of IBES International Inc. for providing earningsper share forecast data; Donal Byard also gratefully acknowledges the financial support pro-vided by a PSC-CUNY grant from the City University of New York (PSC-CUNY # 61815-00 39).
69
Copyright C©, University of Chicago on behalf of the Accounting Research Center, 2010
70 D. BYARD, Y. LI, AND Y. YU
that forecast errors and dispersion decrease more for firms with stronger in-centives for transparent financial reporting. These results highlight the im-portant roles of enforcement regimes and firm-level reporting incentives indetermining the impact of mandatory IFRS adoption.
1. Introduction
The adoption of International Financial Reporting Standards (IFRS) in Eu-rope and around the world represents perhaps the most important account-ing regulatory change in recent years. In 2002, the European Union (EU)required all firms listed in its 27 member countries to switch to IFRS forfinancial reporting purposes for fiscal years beginning on or after January1, 2005. This move forced over 7,000 public companies to replace variousdomestic accounting standards with IFRS. Despite the widespread manda-tory adoption of IFRS, there is relatively little evidence as to the relatedeconomic consequences (see Ball [2006], Daske et al. [2008]).
This study examines the effect of the EU-wide mandatory adoption ofIFRS on financial analysts’ information environment. Ex ante, it is unclearhow mandatory IFRS adoption would affect analysts’ information environ-ment. On the one hand, IFRS adoption may improve analysts’ informationenvironment by enhancing disclosure and transparency or by increasingthe comparability of financial reports (e.g., Bae, Tan, and Welker [2008],Barth, Landsman, and Lang [2008]). On the other hand, if the “one sizefits all” IFRS are suboptimal relative to firms’ domestic accounting stan-dards in reflecting firm performance, IFRS adoption may render financialreporting less informative, thereby reducing the quality of analysts’ infor-mation. In addition, earnings may become more volatile and thus moredifficult for analysts to forecast under IFRS ( Ball [2006]). However, it is alsopossible that mandatory IFRS adoption may have little impact on analysts’information environment. If mandatory adopters already optimize their fi-nancial reporting strategies under their domestic standards, they may lackincentives to rigorously implement IFRS. This lack of incentive can be fur-ther exacerbated by the weak enforcement regimes in many EU countries.As a result, firms may adopt IFRS in name only and make little change totheir financial reporting practices. Further, even if IFRS are properly imple-mented, the adoption effect should be small in EU countries with domesticaccounting standards similar to IFRS (Ashbaugh and Pincus [2001]).
We employ a difference-in-difference research design to examine the im-pact of mandatory IFRS adoption. Our test sample includes 1,168 manda-tory IFRS adopters in Europe. To control for the effect of concurrent con-founding events such as the EU’s ongoing efforts to strengthen the enforce-ment of accounting standards (Hail and Leuz [2007]), we identify a controlsample of 250 European firms that had already voluntarily adopted IFRS atleast two years prior to the mandatory adoption date. Because these con-trol firms use IFRS both before and after mandatory adoption, changes forthese firms likely reflect the impact of concurrent economic and regulatory
THE EFFECT OF MANDATORY IFRS ADOPTION 71
changes, but not mandatory IFRS adoption. To test the impact of manda-tory IFRS adoption, we focus on the difference between the test and controlfirms in the change in analysts’ information environment from the two-yearpre-mandatory-adoption period to the two-year post-mandatory-adoption pe-riod. We capture the properties of analysts’ information environment usingabsolute forecast errors, forecast dispersion, and analyst following, wheresmaller absolute forecast errors, smaller forecast dispersion, or higher ana-lyst following generally indicates a richer information environment.
We perform three levels of analysis: (1) an examination of the averageeffect of mandatory IFRS adoption, (2) an examination conditioned oncountry-level institutional characteristics, and (3) an examination condi-tioned on firm-level reporting incentives. In the first analysis, we find thatmandatory adopters exhibit no statistically significant change relative tothe control firms in analysts’ forecast errors, forecast dispersion, or ana-lyst following, thus providing no evidence that mandatory IFRS adoptionchanges analysts’ information environment on average. In the second anal-ysis, we partition mandatory adopters into groups based on the strength ofcountry-level enforcement regimes and the extent to which their domesticaccounting standards differ from IFRS. For mandatory adopters domiciledin countries with both strong enforcement regimes and domestic account-ing standards that differ substantially from IFRS, we find statistically andeconomically significant decreases relative to the control firms in both fore-cast errors and dispersion. In contrast, we find no statistically significant dif-ferences between the control firms and the mandatory adopters based inother countries. In the third analysis, we explore how firm-level incentivesfor transparent financial reporting affect the adoption effect. To increasethe power of our test, we focus on mandatory adopters domiciled in coun-tries with both weak enforcement environments and domestic accountingstandards that differ significantly from IFRS. For such firms, the changesrequired by IFRS adoption are substantial, and weak country-level enforce-ment allows firm-level reporting incentives to play a relatively greater rolein shaping reporting outcomes (Daske et al. [2008], Holthausen [2009]).We find larger decreases in analysts’ forecast errors and dispersion forfirms with stronger reporting incentives (i.e., more growth opportunities,a smaller proportion of closely held shares, or higher-quality auditors). Inaddition to these three analyses, further tests suggest that mandatory IFRSadoption improves analysts’ information environment by increasing bothanalysts’ public and private information. Taken together, our results sug-gest that the adoption effect is uneven across countries and firms, and thatanalysts’ information environment improves only when the changes man-dated by IFRS are both substantial and rigorously enforced.
Our findings highlight that simply mandating IFRS is not sufficient toensure actual changes to firms’ financial reporting practices. Our studymay be of interest to policy makers in evaluating the costs and benefitsof mandatory IFRS adoption and to financial statement users who wish tounderstand the effect of mandatory IFRS adoption.
72 D. BYARD, Y. LI, AND Y. YU
Two caveats are in order. First, our control sample has some limitations.Our results would understate the adoption effect if the changes for thecontrol firms are attributable to either concurrent changes in IFRS require-ments or positive externalities arising from mandatory IFRS adoption. Onthe other hand, if the control sample does not fully control for contempo-raneous changes unrelated to mandatory IFRS adoption (e.g., due to somefundamental differences between the test and control samples), our resultswould overstate the adoption effect. Second, we examine only two yearsfollowing the adoption, so our results may not shed light on the long-termadoption effect. It is possible that in the long run, IFRS adoption may resultin an across-the-board improvement for all firms.
2. Hypotheses
Our first hypothesis, stated in the null form, is:
H1: On average, the EU-wide mandatory adoption of IFRS is not associ-ated with a change in the quality of analysts’ information environment.
We next exploit cross-country differences to identify countries where theadoption effect is likely to be greater. The adoption effect, if any, is likely tobe more pronounced for mandatory adopters domiciled in countries withboth strong enforcement regimes and domestic accounting standards thatdiffer substantially from IFRS.1 For these firms, mandatory IFRS adoptionrequires substantial accounting changes, while strong enforcement forcesfirms to comply with these changes. Our second hypothesis, stated in thenull form, is thus:
H2: In countries with both strong enforcement regimes and domesticaccounting standards that differ significantly from IFRS, the EU-widemandatory adoption of IFRS is not associated with a change in the qual-ity of analysts’ information environment.
Holding country-level enforcement constant, the adoption effect likelyvaries with firm-level incentives for transparent financial reporting. If IFRSadoption improves financial reporting, we expect firms with stronger re-porting incentives to implement IFRS more rigorously, leading to a greaterimprovement in analysts’ information environment for these firms. Con-versely, if IFRS adoption does not improve financial reporting, we expectno relation between firm-level reporting incentives and the change in ana-lysts’ information environment. Therefore, our third hypothesis examineshow the adoption effect varies with firm-level reporting incentives. Becausefirms’ reporting incentives likely play a more prominent role in determin-ing reporting outcomes when country-level enforcement is weak and the
1 However, as long as there is discretion in financial reporting and firms have differingreporting incentives, strong enforcement will not eliminate all variation in reporting qualityacross firms (Leuz [2006]).
THE EFFECT OF MANDATORY IFRS ADOPTION 73
changes required by IFRS are larger, we focus on firms domiciled in coun-tries with both weak enforcement and domestic accounting standards thatdiffer significantly from IFRS. Our third hypothesis, stated in the null form,is thus:
H3: For firms domiciled in countries with both weak enforcement anddomestic accounting standards that differ significantly from IFRS, theimpact of the EU-wide mandatory adoption of IFRS on analysts’ infor-mation environment is not related to firm-level reporting incentives.
3. Sample Selection and Study Design
3.1. SAMPLE SELECTION
We obtain analysts’ forecast data from the IBES international (split unad-justed) database and accounting and market data from the Global Compus-tat or Datastream/Worldscope database. European firms subject to manda-tory IFRS adoption were required to switch to IFRS for financial report-ing purposes for fiscal years beginning on or after January 1, 2005. Sincewe study the change in analysts’ information environment after mandatoryIFRS adoption, we divide the sample period into two reporting regimes: thepre-mandatory-adoption window is the last two fiscal years a firm reportedusing its domestic accounting standards, while the post-mandatory-adoptionwindow is the first two fiscal years a firm reported using IFRS. For example,for a December year-end firm, the pre-mandatory-adoption window is 2003and 2004, while the post-mandatory-adoption window is 2005 and 2006.
We begin our sample-selection process by selecting from I/B/E/S allpublic companies domiciled in Europe with analysts’ annual earnings fore-casts for our four-year sample period.2 We exclude firms that were cross-listed in the United States as American Deposit Receipts (ADRs) during oursample period based on the ADR databases of the Bank of New York andCitibank. We also exclude firms that changed their country of domicile orprimary exchange listing during our sample period. We require that annualearnings announcements be made no later than 240 calendar days after thefiscal year-end. For each firm-year, we retrieve all annual earnings forecastsissued during the 12-month period prior to the year-end from each analystcovering the firm. If an analyst issues more than one annual forecast fora firm-year, we retain only the last forecast. We further require each ana-lyst to issue at least one annual forecast for a firm within both the pre- andpost-mandatory-adoption windows. Thus, our sample is composed of a con-stant set of analyst-firm pairs matched across the pre- and post-mandatory-adoption windows. This alleviates potential concerns that any changesin analysts’ information environment are driven by changes in sample
2 Our sample includes two non-EU-member countries (Norway and Switzerland) that alsomandated IFRS adoption. Our results are robust to excluding these two countries.
74 D. BYARD, Y. LI, AND Y. YU
composition, as both firm and analyst characteristics can affect propertiesof analysts’ forecasts.
Next, to identify mandatory IFRS adopters, we obtain information onfirms’ accounting standards from both Global Compustat and Datastream/Worldscope, and retain firms that reported under their domestic account-ing standards during the two-year pre-mandatory-adoption window. WhenGlobal Compustat and Datastream/Worldscope provide conflicting infor-mation as to which accounting standards a firm used, we verify data fromthe firm’s annual reports. Finally, we exclude firms with missing accountingor market data from both Global Compustat and Datastream/Worldscopethat are needed to construct the variables we use in our analyses (discussedbelow). Our final test sample contains 1,168 firms.
To control for the impact of potentially confounding concurrent events,we select a control sample of European firms that voluntarily adopted IFRSat least two years before the mandatory adoption deadline. We also requirethe control sample to have a constant analyst-firm composition over the pre-and post-mandatory-adoption windows. For each voluntary adopter, we de-fine the pre-mandatory-adoption window as the last two fiscal years endingbefore mandatory adoption, and the post-mandatory-adoption window asthe first two fiscal years beginning on or after January 1, 2005, the manda-tory adoption date. The two windows for the control sample are thus con-current with the windows for the mandatory adopters. All other data re-quirements for the control sample are the same as those for the test sample.The control sample contains 250 firms.3
The control firms use IFRS during both windows, while the test firmsswitch accounting standards between the two windows. To the extent thatIFRS requirements are unchanged around the mandatory adoption, thechange for the control firms likely reflects the impact of concurrent eco-nomic and regulatory changes, but not the impact of mandatory IFRSadoption. To identify the impact of mandatory IFRS adoption, we there-fore focus on the difference in the change from the pre- to post-mandatory-adoption window between the test and control firms.
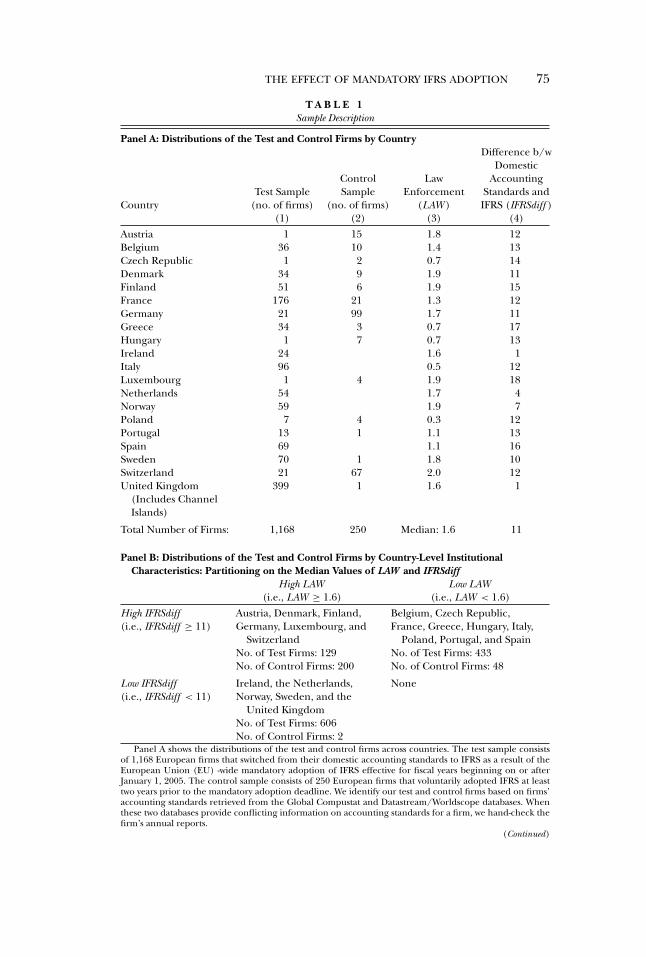
The first two columns of table 1, panel A, provide the distributions of ourtest and control samples by country. The test (control) sample representsfirms from 20 (15) different countries, with heavy concentrations in theUnited Kingdom and France (Germany and Switzerland).4 We note thatthe country distributions of our test and control samples differ substantially,so we later explore the robustness of our results to this feature of the data.
3 December year-end firms account for 75% (88%) of the test (control) sample.4 Our control sample includes firms domiciled in European countries (i.e., Hungary,
France, Poland, and Sweden) that did not allow voluntary IFRS adoption for domestic listedfirms. We inspected the annual reports of these firms to confirm that these firms voluntar-ily released IFRS financial statements in addition to the required domestic GAAP financialstatements in the pre-mandatory-adoption period. Our results are, however, robust to remov-ing these firms from our control sample. In addition, our inferences remain unchanged if weexclude UK firms from both the test and control samples.
THE EFFECT OF MANDATORY IFRS ADOPTION 75
T A B L E 1Sample Description
Panel A: Distributions of the Test and Control Firms by Country
CountryTest Sample
(no. of firms)
ControlSample
(no. of firms)
LawEnforcement
(LAW )
Difference b/wDomestic
AccountingStandards andIFRS (IFRSdiff )
(1) (2) (3) (4)Austria 1 15 1.8 12Belgium 36 10 1.4 13Czech Republic 1 2 0.7 14Denmark 34 9 1.9 11Finland 51 6 1.9 15France 176 21 1.3 12Germany 21 99 1.7 11Greece 34 3 0.7 17Hungary 1 7 0.7 13Ireland 24 1.6 1Italy 96 0.5 12Luxembourg 1 4 1.9 18Netherlands 54 1.7 4Norway 59 1.9 7Poland 7 4 0.3 12Portugal 13 1 1.1 13Spain 69 1.1 16Sweden 70 1 1.8 10Switzerland 21 67 2.0 12United Kingdom
(Includes ChannelIslands)
399 1 1.6 1
Total Number of Firms: 1,168 250 Median: 1.6 11
Panel B: Distributions of the Test and Control Firms by Country-Level InstitutionalCharacteristics: Partitioning on the Median Values of LAW and IFRSdiff
High LAW Low LAW(i.e., LAW ≥ 1.6) (i.e., LAW < 1.6)
High IFRSdiff Austria, Denmark, Finland, Belgium, Czech Republic,(i.e., IFRSdiff ≥ 11) Germany, Luxembourg, and
SwitzerlandFrance, Greece, Hungary, Italy,
Poland, Portugal, and SpainNo. of Test Firms: 129 No. of Test Firms: 433No. of Control Firms: 200 No. of Control Firms: 48
Low IFRSdiff Ireland, the Netherlands, None(i.e., IFRSdiff < 11) Norway, Sweden, and the
United KingdomNo. of Test Firms: 606No. of Control Firms: 2
Panel A shows the distributions of the test and control firms across countries. The test sample consistsof 1,168 European firms that switched from their domestic accounting standards to IFRS as a result of theEuropean Union (EU) -wide mandatory adoption of IFRS effective for fiscal years beginning on or afterJanuary 1, 2005. The control sample consists of 250 European firms that voluntarily adopted IFRS at leasttwo years prior to the mandatory adoption deadline. We identify our test and control firms based on firms’accounting standards retrieved from the Global Compustat and Datastream/Worldscope databases. Whenthese two databases provide conflicting information on accounting standards for a firm, we hand-check thefirm’s annual reports.
(Continued)
76 D. BYARD, Y. LI, AND Y. YU
T A B L E 1 — Continued
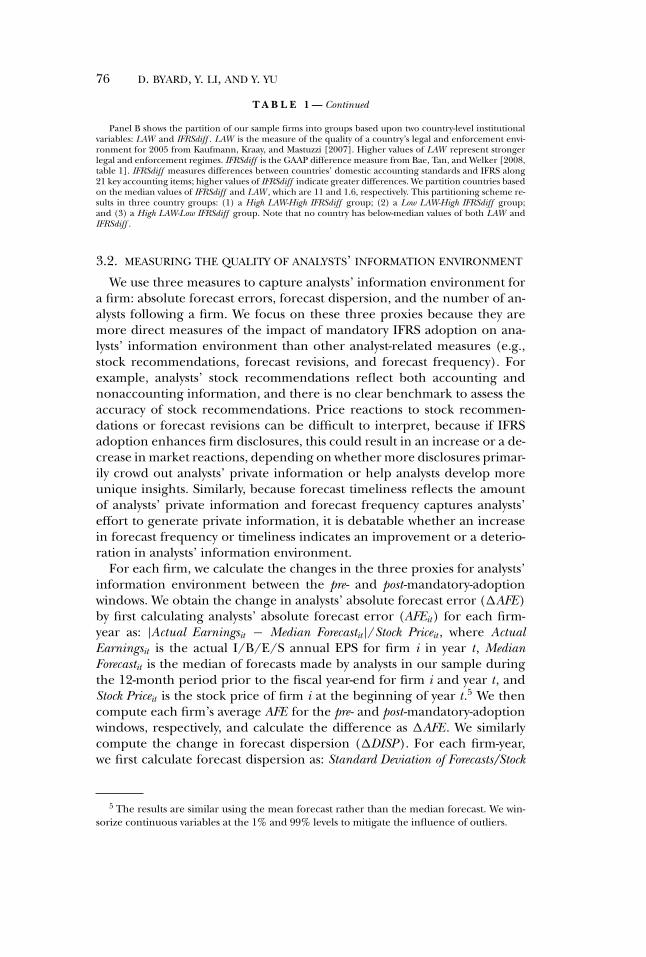
Panel B shows the partition of our sample firms into groups based upon two country-level institutionalvariables: LAW and IFRSdiff . LAW is the measure of the quality of a country’s legal and enforcement envi-ronment for 2005 from Kaufmann, Kraay, and Mastuzzi [2007]. Higher values of LAW represent strongerlegal and enforcement regimes. IFRSdiff is the GAAP difference measure from Bae, Tan, and Welker [2008,table 1]. IFRSdiff measures differences between countries’ domestic accounting standards and IFRS along21 key accounting items; higher values of IFRSdiff indicate greater differences. We partition countries basedon the median values of IFRSdiff and LAW , which are 11 and 1.6, respectively. This partitioning scheme re-sults in three country groups: (1) a High LAW-High IFRSdiff group; (2) a Low LAW-High IFRSdiff group;and (3) a High LAW-Low IFRSdiff group. Note that no country has below-median values of both LAW andIFRSdiff .
3.2. MEASURING THE QUALITY OF ANALYSTS’ INFORMATION ENVIRONMENT
We use three measures to capture analysts’ information environment fora firm: absolute forecast errors, forecast dispersion, and the number of an-alysts following a firm. We focus on these three proxies because they aremore direct measures of the impact of mandatory IFRS adoption on ana-lysts’ information environment than other analyst-related measures (e.g.,stock recommendations, forecast revisions, and forecast frequency). Forexample, analysts’ stock recommendations reflect both accounting andnonaccounting information, and there is no clear benchmark to assess theaccuracy of stock recommendations. Price reactions to stock recommen-dations or forecast revisions can be difficult to interpret, because if IFRSadoption enhances firm disclosures, this could result in an increase or a de-crease in market reactions, depending on whether more disclosures primar-ily crowd out analysts’ private information or help analysts develop moreunique insights. Similarly, because forecast timeliness reflects the amountof analysts’ private information and forecast frequency captures analysts’effort to generate private information, it is debatable whether an increasein forecast frequency or timeliness indicates an improvement or a deterio-ration in analysts’ information environment.
For each firm, we calculate the changes in the three proxies for analysts’information environment between the pre- and post-mandatory-adoptionwindows. We obtain the change in analysts’ absolute forecast error (�AFE)by first calculating analysts’ absolute forecast error (AFEit) for each firm-year as: |Actual Earningsit − Median Forecastit |/Stock Priceit , where ActualEarningsit is the actual I/B/E/S annual EPS for firm i in year t, MedianForecastit is the median of forecasts made by analysts in our sample duringthe 12-month period prior to the fiscal year-end for firm i and year t, andStock Priceit is the stock price of firm i at the beginning of year t.5 We thencompute each firm’s average AFE for the pre- and post-mandatory-adoptionwindows, respectively, and calculate the difference as �AFE . We similarlycompute the change in forecast dispersion (�DISP). For each firm-year,we first calculate forecast dispersion as: Standard Deviation of Forecasts/Stock
5 The results are similar using the mean forecast rather than the median forecast. We win-sorize continuous variables at the 1% and 99% levels to mitigate the influence of outliers.
THE EFFECT OF MANDATORY IFRS ADOPTION 77
Price. We then calculate �DISP as the difference between the averages ofDISP for the pre-and post-mandatory-adoption windows. For each firm-year,we measure analyst following (FOLLOW ) as the total number of analystswho issue at least one annual forecast for that firm-year. Note that we in-clude all analysts following a firm, not just the analysts included in our con-stant analyst-firm sample. For each firm, we then calculate the change inanalyst following, �LogFOLLOW , as the difference in the log of averageanalyst following between the pre- and post-mandatory-adoption windows.6
Because a minimum of two analysts’ forecasts in each firm-year is needed tomeasure dispersion, the sample size is slightly smaller for �DISP than for�AFE and �LogFOLLOW . For ease of exposition, we multiply both �AFEand �DISP by 100.
3.3. TESTING THE AVERAGE EFFECT OF MANDATORY IFRS ADOPTION (H1)
To test H1, we estimate the following model7
�Info. Environmenti = α0 + a1DMANDi + α j �Controlsi + εi , (1)
where the subscript i refers to firm i. The dummy variable DMAND equals one(zero) for the test (control) firms, and �Info. Environment refers to �AFE,�DISP, or �LogFOLLOW . The intercept, α0, captures the change aroundmandatory IFRS adoption for the control firms. The key coefficient of in-terest, α1, captures the difference in the change in analysts’ informationenvironment between the test and control firms and, thus, the impact ofmandatory IFRS adoption.
We control for changes in firm size, analyst following, and forecast hori-zon (i.e., the number of days between the forecast issuing date and the earn-ings announcement date) in the �AFE and �DISP regressions.8 Largerfirms and firms with greater analyst following tend to have smaller fore-cast errors and forecast dispersion (Bhushan [1989]); forecast errors anddispersion also decrease as forecast horizon shortens. We control for thechange in firm size in the �logFOLLOW regression, because larger firmstend to attract a larger analyst following (Bhushan [1989]). To measure thechange in firm size (�logSIZE), we first calculate the beginning-of-the-yearmarket capitalization in U.S. dollars for each firm-year using the exchangerate in effect at the beginning of the year from I/B/E/S. We then compute
6 We use a log transformation to reduce the skewness in FOLLOW . Our results are robustto reestimating the change in analyst following using an ordered-probit model.
7 The results are robust to allowing the coefficients on the control variables to vary betweenthe test and control firms.
8 Our results are robust to including three additional control variables used by Lang andLundholm [1996]: the standard deviation of return on assets, the return-earnings correlation,and earnings surprise based on a random-walk model. We do not include these variables inour reported results because the first two require a long time-series of data to compute, andearnings surprise constructed based on actual earnings is mechanically associated with forecasterrors (Hope[2003]). In addition, our results are also robust to controlling for the change infirm risk, measured by the standard deviation of monthly stock returns.
78 D. BYARD, Y. LI, AND Y. YU
the difference in the log of average market capitalization between the pre-and the post-mandatory-adoption windows.9 Since multiple forecasts mayexist for a firm-year, we first compute the average horizon (i.e., the numberof days between the forecast issuing date and the earnings announcementdate) across all forecasts for that firm-year. Then for each firm, we compute�logHORIZON as the change in the log of average horizon between the pre-and post-mandatory-adoption windows.
3.4. TESTS CONDITIONAL ON COUNTRY-LEVEL INSTITUTIONALCHARACTERISTICS (H2)
We use the “Rule of Law” (LAW ) variable for 2005 from Kaufmann,Kraay, and Mastuzzi [2007] as a proxy for the quality of countries’ legaland enforcement regimes. Higher values of LAW indicate stronger en-forcement. We base our measure of the difference between a country’s ac-counting standards and IFRS on the gaapdiff1 measure of Bae, Tan, andWelker[2008, table 1]. This is a comprehensive measure that captures dif-ferences between domestic accounting standards and IFRS along 21 key ac-counting items. We relabel this measure IFRSdiff to emphasize that it mea-sures differences between domestic accounting standards and IFRS. Highervalues of IFRSdiff indicate greater difference. Columns (3) and (4) of table1, panel A, show the LAW and IFRSdiff scores for each country in our sam-ple.
We classify sample firms into country groups based on the median valuesof LAW (1.6) and IFRSdiff (11) as follows:
(1) a High LAW-High IFRSdiff group (LAW ≥ 1.6 and IFRSdiff ≥ 11),(2) a Low LAW-High IFRSdiff group (LAW ≤ 1.6 and IFRSdiff ≥ 11), and(3) a High LAW-Low IFRSdiff group (LAW ≥ 1.6 and IFRSdiff ≤ 11).
No country is below the median values of both LAW and IFRSdiff . PanelB of table 1 shows the distributions of the test and control firms across thesethree country groups. The numbers of test and control firms are highly un-balanced within the High LAW-Low IFRSdiff and the Low LAW-High IFRSdiffgroups: in the former (latter) group, there are only 2 (48) control firms, farfewer than the 606 (433) test firms. Hence, the distribution of the data re-stricts meaningful comparisons within each group. As a result, we comparemandatory adopters in each of the three country groups with the controlfirms pooled across all countries using the following equation:
�Info. Environmenti = β0 + β1DMANDi ∗ DHLAW −HDIFFi
+β2DMANDi ∗ DLLAW −HDIFFi + β3DMANDi ∗ DHLAW −LDIFFi
+β j �Controlsi + εi , (2)
9 We measure firm size by market value of equity because financial analysts mainly serveequity investors. However, the results are robust to measuring firm size by enterprise value(defined as the sum of market value of equity and book value of debt).
THE EFFECT OF MANDATORY IFRS ADOPTION 79
where the subscript i refers to firm i. �Info. Environment refers to �AFE,�DISP, or �LogFOLLOW . DHLAW −HDIFF is a dummy variable coded one ifa test or control firm is from the High LAW-High IFRSdiff country group;similarly, DLLAW −HDIFF and DHLAW −LDIFF are dummy variables indicating testor control firms from the Low LAW-High IFRSdiff and High LAW-Low IFRSdiffgroups. The controls are the same as in equation (1). The intercept, β0,reflects the change in analysts’ information environment for the controlfirms. The coefficient of interest, β1, reflects the difference between the testfirms in the High LAW-High IFRSdiff group and the control firms. Similarly,β2 (β3) capture the difference between the test firms in the Low LAW-HighIFRSdiff (High LAW-Low IFRSdiff ) group and the control firms.
3.5. TESTS OF FIRM-LEVEL REPORTING INCENTIVES (H3)
Prior research (e.g., Ashbaugh [2001], Pagano et al. [2002], Leuz [2006],Christensen, Lee, and Walker [2007], Daske et al.[2007], Barth, Landsman,and Lang [2008]) suggests that firms that: (1) are more profitable, (2) havemore growth opportunities, (3) are more highly leveraged, (4) have a lessconcentrated ownership structure, (5) are more international, and (6) havehigher-quality auditors have stronger incentives to provide high-quality fi-nancial reporting. We measure these firm characteristics using account-ing and market data from Global Compustat or Datastream/Worldscope.We measure profitability by return on assets (ROA), defined as net in-come/total assets; growth opportunities by Tobin’s q (TOBIN Q), definedas market value of assets/book value of assets, where the numerator ismeasured as (book value of assets + market value of common equity –book value of common equity – balance sheet deferred taxes). Financialleverage (LEVERAGE) is measured as total liabilities/total assets, owner-ship concentration is the percentage of closely held shares (CLOSEHELD)as reported by Datastream/Worldscope, and international diversificationis the percentage of foreign sales (FOREIGNSALES) reported by Datas-tream/Worldscope. These variables are all measured as the mean valuesfor the two-year pre-mandatory-adoption period. Finally, we use a dummyvariable to indicate the presence of a big four auditor (BIG4) in the yearimmediately preceding mandatory IFRS adoption.
To test H3, we estimate the following model using mandatory adoptersdomiciled in countries with both weak enforcement regimes and domesticaccounting standards that differ significantly from IFRS (i.e., the Low LAW-High IFRSdiff group)
�Info. Environmenti = δ0 + δ1ROAi + δ2TOBIN Qi + δ3LEVERAGEi
+ δ4CLOSEHELDi + δ5FOREIGNSALESi + δ6BIG4i
+ δ j �Controlsi + εi , (3)
where the subscript i refers to mandatory adopter i. �Info. Environmentrefers to �AFE, �DISP, or �LogFOLLOW ; the control variables are thesame as in equations (1) and (2). We estimate this equation using only
80 D. BYARD, Y. LI, AND Y. YU
test firms because our focus is on the cross-sectional variation in reportingincentives within the sample of mandatory adopters. As long as concur-rent confounding events have the same effect on all mandatory adopters,this effect is cancelled out in this within-mandatory-sample comparison. Iffirms with stronger reporting incentives experience a greater improvementin analysts’ information environment, we expect the coefficients on ROA,TOBIN Q , LEVERAGE , FOREIGNSALE , and BIG4 to be negative for the�AFE and �DISP regressions, and positive for the �LogFOLLOW regres-sion; additionally, we expect the coefficient on CLOSEHELD to be positivefor the �AFE and �DISP regressions, and negative for the �LogFOLLOWregression.
4. Results
4.1. DESCRIPTIVE STATISTICS
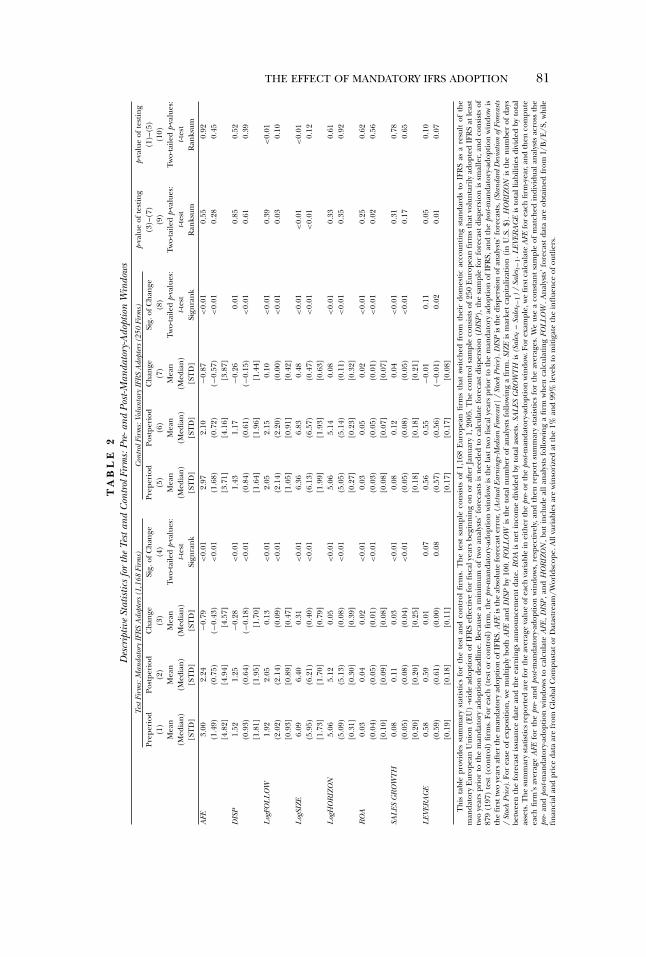
Table 2 provides descriptive statistics for the test and control samples, andpresents univariate comparisons across the two samples to explore poten-tial differences. For the test sample, the means (medians) of �AFE, �DISP,and �LogFOLLOW are −0.79 (−0.43), −0.28 (−0.18), and 0.13 (0.09), re-spectively; these changes are all statistically significant (two-tailed p ≤ 0.01).The reductions in analysts’ forecast errors and dispersion and increase inanalyst following suggest an improvement in analysts’ information environ-ment. However, we also observe a similar improvement for the control sam-ple: the means (medians) of �AFE, �DISP, and �LogFOLLOW are −0.87(−0.57), −0.26 (−0.15), and 0.10 (0.00), respectively, for the control firms;again, these changes are all statistically significant (two-tailed p ≤ 0.01).More importantly, Column (9) shows that �AFE, �DISP, and �LogFOLLOWare not statistically different between the test and control firms, except forthe median �LogFOLLOW , which is higher for the test sample (two-tailedp = 0.03). Thus, table 2 provides little evidence of an incremental change inanalysts’ information environment for the test firms relative to the controlfirms. However, because these univariate comparisons do not control forcorrelated factors that potentially influence the change in analysts’ infor-mation environment (e.g., changes in firm size), the results only providepreliminary evidence on H1 and should be interpreted with caution.
The improvement in analysts’ information environment for the controlfirms could reflect: (1) concurrent economic or regulatory shocks suchas the EU’s efforts to improve the enforcement of accounting standards,(2) IFRS changes between the pre- and post-mandatory-adoption windows,and/or (3) some positive externality—such as increased comparability—arising from mandatory IFRS adoption. It is difficult to distinguish amongthese effects in our setting. To the extent that the improvement for thecontrol firms is attributable to either IFRS changes around mandatoryadoption or to some positive externality arising from the adoption, exam-ining the difference between the test and control firms may understate theadoption effect.
THE EFFECT OF MANDATORY IFRS ADOPTION 81
TA
BL
E2
Des
crip
tive
Stat
istic
sfo
rth
eTe
stan
dC
ontr
olFi
rms:
Pre-
and
Post
-Man
dato
ry-A
dopt
ion
Win
dow
sTe
stFi
rms:
Man
dato
ryIF
RS
Ado
pter
s(1
,168
Firm
s)C
ontr
olFi
rms:
Volu
ntar
yIF
RS
Ado
pter
s(2
50Fi
rms)
p-va
lue
ofte
stin
gp-
valu
eof
test
ing
Prep
erio
dPo
stpe
riod
Cha
nge
Sig.
ofC
hang
ePr
eper
iod
Post
peri
odC
hang
eSi
g.of
Cha
nge
(3)–
(7)
(1)–
(5)
(1)
(2)
(3)
(4)
(5)
(6)
(7)
(8)
(9)
(10)
Mea
nM
ean
Mea
nTw
o-ta
iled
p-va
lues
:M
ean
Mea
nM
ean
Two-
taile
dp-
valu
es:
Two-
taile
dp-
valu
es:
Two-
taile
dp-
valu
es:
(Med
ian)
(Med
ian)
(Med
ian)
t-tes
t(M
edia
n)(M
edia
n)(M
edia
n)t-t
est
t-tes
tt-t
est
[ST
D]
[ST
D]
[ST
D]
Sign
rank
[ST
D]
[ST
D]
[ST
D]
Sign
rank
Ran
ksum
Ran
ksum
AFE
3.00
2.24
−0.7
9<
0.01
2.97
2.10
−0.8
7<
0.01
0.55
0.92
(1.4
9)(0
.75)
(−0.
43)
<0.
01(1
.68)
(0.7
2)(−
0.57
)<
0.01
0.28
0.45
[4.8
2][4
.94]
[4.5
7][3
.71]
[4.1
6][3
.87]
DIS
P1.
521.
25−0
.28
<0.
011.
431.
17−0
.26
0.01
0.85
0.52
(0.9
3)(0
.64)
(−0.
18)
<0.
01(0
.84)
(0.6
1)(−
0.15
)<
0.01
0.61
0.39
[1.8
1][1
.95]
[1.7
0][1
.64]
[1.9
6][1
.44]
Log
FOL
LO
W1.
922.
050.
13<
0.01
2.05
2.15
0.10
<0.
010.
39<
0.01
(2.0
2)(2
.14)
(0.0
9)<
0.01
(2.1
4)(2
.20)
(0.0
0)<
0.01
0.03
0.10
[0.9
3][0
.89]
[0.4
7][1
.05]
[0.9
1][0
.42]
Log
SIZE
6.09
6.40
0.31
<0.
016.
366.
830.
48<
0.01
<0.
01<
0.01
(5.9
5)(6
.21)
(0.4
0)<
0.01
(6.1
3)(6
.57)
(0.4
7)<
0.01
<0.
010.
12[1
.73]
[1.7
0][0
.79]
[1.9
9][1
.93]
[0.6
3]L
ogH
OR
IZO
N5.
065.
120.
05<
0.01
5.06
5.14
0.08
<0.
010.
330.
61(5
.09)
(5.1
3)(0
.08)
<0.
01(5
.05)
(5.1
4)(0
.11)
<0.
010.
350.
92[0
.31]
[0.3
0][0
.39]
[0.2
7][0
.23]
[0.3
2]R
OA
0.03
0.04
0.02
<0.
010.
030.
050.
02<
0.01
0.25
0.62
(0.0
4)(0
.05)
(0.0
1)<
0.01
(0.0
3)(0
.05)
(0.0
1)<
0.01
0.02
0.56
[0.1
0][0
.09]
[0.0
8][0
.08]
[0.0
7][0
.07]
SAL
ESG
RO
WT
H0.
080.
110.
03<
0.01
0.08
0.12
0.04
<0.
010.
310.
78(0
.05)
(0.0
8)(0
.04)
<0.
01(0
.05)
(0.0
8)(0
.05)
<0.
010.
170.
65[0
.20]
[0.2
0][0
.25]
[0.1
8][0
.18]
[0.2
1]L
EVER
AG
E0.
580.
590.
010.
070.
560.
55−0
.01
0.11
0.05
0.10
(0.5
9)(0
.61)
(0.0
0)0.
08(0
.57)
(0.5
6)(−
0.01
)0.
020.
010.
07[0
.19]
[0.1
8][0
.11]
[0.1
7][0
.17]
[0.0
8]
Thi
sta
ble
prov
ides
sum
mar
yst
atis
tics
for
the
test
and
cont
rol
firm
s.T
hete
stsa
mpl
eco
nsis
tsof
1,16
8E
urop
ean
firm
sth
atsw
itche
dfr
omth
eir
dom
estic
acco
untin
gst
anda
rds
toIF
RS
asa
resu
ltof
the
man
dato
ryE
urop
ean
Uni
on(E
U)
-wid
ead
optio
nof
IFR
Sef
fect
ive
for
fisca
lyea
rsbe
ginn
ing
onor
afte
rJa
nuar
y1,
2005
.The
cont
rols
ampl
eco
nsis
tsof
250
Eur
opea
nfir
ms
that
volu
ntar
ilyad
opte
dIF
RS
atle
ast
two
year
spr
ior
toth
em
anda
tory
adop
tion
dead
line.
Bec
ause
am
inim
umof
two
anal
ysts
’for
ecas
tsis
need
edto
calc
ulat
efo
reca
stdi
sper
sion
(DIS
P),
the
sam
ple
for
fore
cast
disp
ersi
onis
smal
ler,
and
cons
ists
of87
9(1
97)
test
(con
trol
)fir
ms.
For
each
(tes
tor
cont
rol)
firm
,the
pre-
man
dato
ry-a
dopt
ion
win
dow
isth
ela
sttw
ofis
caly
ears
prio
rto
the
man
dato
ryad
optio
nof
IFR
S,an
dth
epo
st-m
anda
tory
-ado
ptio
nw
indo
wis
the
first
two
year
saf
ter
the
man
dato
ryad
optio
nof
IFR
S.A
FEis
the
abso
lute
fore
cast
erro
r,(A
ctua
lEar
ning
s-Med
ian
Fore
cast
|/St
ock
Pric
e).D
ISP
isth
edi
sper
sion
ofan
alys
ts’f
orec
asts
,(St
anda
rdD
evia
tion
ofFo
reca
sts
/St
ock
Pric
e).F
orea
seof
expo
sitio
n,w
em
ultip
lybo
thA
FEan
dD
ISP
by10
0.FO
LL
OW
isth
eto
taln
umbe
rof
anal
ysts
follo
win
ga
firm
.SIZ
Eis
mar
ket
capi
taliz
atio
n(i
nU
.S.$
).H
OR
IZO
Nis
the
num
ber
ofda
ysbe
twee
nth
efo
reca
stis
suan
ceda
tean
dth
eea
rnin
gsan
noun
cem
ent
date
.RO
Ais
net
inco
me
divi
ded
byto
tala
sset
s.SA
LES
GR
OW
TH
is(S
ales
t–
Sale
s t−1
)/
Sale
s t−1
.LEV
ERA
GE
isto
tall
iabi
litie
sdi
vide
dby
tota
las
sets
.The
sum
mar
yst
atis
ticsr
epor
ted
are
for
the
aver
age
valu
eof
each
vari
able
inei
ther
the
pre-
orth
epo
st-m
anda
tory
-ado
ptio
nw
indo
w.Fo
rex
ampl
e,w
efir
stca
lcul
ate
AFE
for
each
firm
-yea
r,an
dth
enco
mpu
teea
chfir
m’s
aver
age
AFE
for
the
pre-
and
post
-man
dato
ry-a
dopt
ion
win
dow
s,re
spec
tivel
y,an
dth
enre
port
sum
mar
yst
atis
tics
for
the
aver
ages
.We
use
aco
nsta
ntsa
mpl
eof
mat
ched
indi
vidu
alan
alys
tsac
ross
the
pre-
and
post
-man
dato
ry-a
dopt
ion
win
dow
sto
calc
ulat
eA
FE,D
ISP
,and
HO
RIZ
ON
,but
incl
ude
alla
naly
sts
follo
win
ga
firm
whe
nca
lcul
atin
gFO
LL
OW
.Ana
lyst
s’fo
reca
stda
taar
eob
tain
edfr
omI/
B/E
/S,w
hile
finan
cial
and
pric
eda
taar
efr
omG
loba
lCom
pust
ator
Dat
astr
eam
/Wor
ldsc
ope.
All
vari
able
sar
ew
inso
rize
dat
the
1%an
d99
%le
vels
tom
itiga
teth
ein
flue
nce
ofou
tlier
s.
82 D. BYARD, Y. LI, AND Y. YU
In table 2, we also compare other financial and analyst variables acrossthe test and control samples to gauge whether and how the two samplesdiffer. We find a statistically significant increase in firm size and analysts’forecast horizon for both the test and control samples. Although the in-crease in analysts’ forecast horizon is not statistically different across thetwo samples, the increase in firm size is statistically greater for the controlfirms. Both return on assets and sales growth increase for the test and con-trol samples, but the increases are not statistically different across the twosamples. We find that leverage increases for the test sample, but there isweak evidence that it decreases for the control sample. Column (10) com-pares the pre-mandatory-adoption levels of all these variables across the testand control samples: control firms tend to be larger and have higher ana-lyst following and lower leverage, but differences between the two samplesin forecast errors, dispersion, analysts’ forecast horizons, sales growth, orfirm performance are statistically insignificant.
Overall, the results in tables 1 and 2 indicate that our test and controlfirms differ in important ways, most prominently country of origin and firmsize. Although our results are robust to comparing test and control firmswithin country groups and to controlling for various firm characteristics,we cannot rule out the possibility that some unknown difference betweenthe test and control firms may cause them to react differently to confound-ing concurrent events, and, consequently, our control firms may not fullycapture the impact of these events on our test firms.
4.2. THE AVERAGE EFFECT OF MANDATORY IFRS ADOPTION (H1)
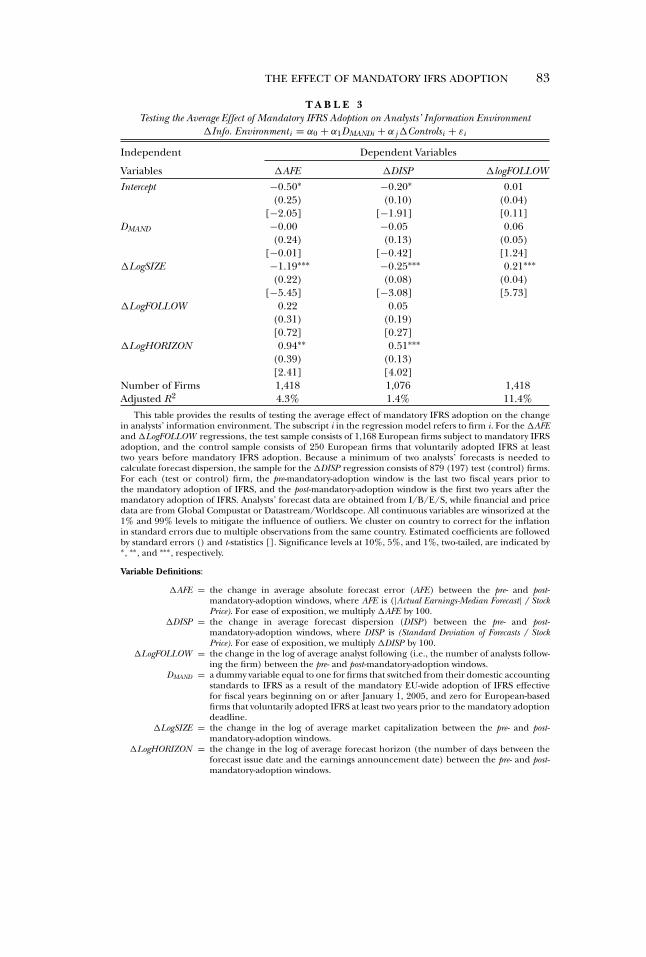
Table 3 reports the results of estimating equation (1), which regressesthe change in analysts’ information environment (measured by �AFE,�DISP, or �LogFOLLOW ) on a dummy variable indicating mandatory IFRSadopters (DMAND) and the control variables. The estimated coefficients onDMAND are: −0.00 (t-stat = −0.01), −0.05 (t-stat = −0.42), and 0.06 (t-stat= 1.24) for the �AFE, �DISP, and �logFOLLOW regressions, respectively.These results indicate that on average mandatory adopters exhibit no incre-mental change in analysts’ information environment relative to the controlfirms. Thus, we are unable to reject H1.
The sum of the intercept and the coefficient on DMAND is negative andstatistically significant for both the �AFE and �DISP regressions (untab-ulated), indicating that mandatory adopters experience decreases in bothforecast errors and dispersion. The intercept, which captures the changefor the control firms, is negative and statistically significant for both the�AFE and �DISP regressions, indicating an improvement in analysts’ infor-mation environment for the control firms (see section 4.1 for a discussionof possible reasons). Overall, the regression results in table 3 confirm theunivariate results in table 2.
THE EFFECT OF MANDATORY IFRS ADOPTION 83
T A B L E 3Testing the Average Effect of Mandatory IFRS Adoption on Analysts’ Information Environment
�Info. Environmenti = α0 + α1DMANDi + α j �Controlsi + εi
Independent Dependent Variables
Variables �AFE �DISP �logFOLLOW
Intercept −0.50∗ −0.20∗ 0.01(0.25) (0.10) (0.04)
[−2.05] [−1.91] [0.11]DMAND −0.00 −0.05 0.06
(0.24) (0.13) (0.05)[−0.01] [−0.42] [1.24]
�LogSIZE −1.19∗∗∗ −0.25∗∗∗ 0.21∗∗∗(0.22) (0.08) (0.04)
[−5.45] [−3.08] [5.73]�LogFOLLOW 0.22 0.05
(0.31) (0.19)[0.72] [0.27]
�LogHORIZON 0.94∗∗ 0.51∗∗∗(0.39) (0.13)[2.41] [4.02]
Number of Firms 1,418 1,076 1,418Adjusted R2 4.3% 1.4% 11.4%
This table provides the results of testing the average effect of mandatory IFRS adoption on the changein analysts’ information environment. The subscript i in the regression model refers to firm i. For the �AFEand �LogFOLLOW regressions, the test sample consists of 1,168 European firms subject to mandatory IFRSadoption, and the control sample consists of 250 European firms that voluntarily adopted IFRS at leasttwo years before mandatory IFRS adoption. Because a minimum of two analysts’ forecasts is needed tocalculate forecast dispersion, the sample for the �DISP regression consists of 879 (197) test (control) firms.For each (test or control) firm, the pre-mandatory-adoption window is the last two fiscal years prior tothe mandatory adoption of IFRS, and the post-mandatory-adoption window is the first two years after themandatory adoption of IFRS. Analysts’ forecast data are obtained from I/B/E/S, while financial and pricedata are from Global Compustat or Datastream/Worldscope. All continuous variables are winsorized at the1% and 99% levels to mitigate the influence of outliers. We cluster on country to correct for the inflationin standard errors due to multiple observations from the same country. Estimated coefficients are followedby standard errors () and t-statistics []. Significance levels at 10%, 5%, and 1%, two-tailed, are indicated by∗, ∗∗, and ∗∗∗, respectively.
Variable Definitions:
�AFE = the change in average absolute forecast error (AFE) between the pre- and post-mandatory-adoption windows, where AFE is (|Actual Earnings-Median Forecast| / StockPrice). For ease of exposition, we multiply �AFE by 100.
�DISP = the change in average forecast dispersion (DISP) between the pre- and post-mandatory-adoption windows, where DISP is (Standard Deviation of Forecasts / StockPrice). For ease of exposition, we multiply �DISP by 100.
�LogFOLLOW = the change in the log of average analyst following (i.e., the number of analysts follow-ing the firm) between the pre- and post-mandatory-adoption windows.
DMAND = a dummy variable equal to one for firms that switched from their domestic accountingstandards to IFRS as a result of the mandatory EU-wide adoption of IFRS effectivefor fiscal years beginning on or after January 1, 2005, and zero for European-basedfirms that voluntarily adopted IFRS at least two years prior to the mandatory adoptiondeadline.
�LogSIZE = the change in the log of average market capitalization between the pre- and post-mandatory-adoption windows.
�LogHORIZON = the change in the log of average forecast horizon (the number of days between theforecast issue date and the earnings announcement date) between the pre- and post-mandatory-adoption windows.
84 D. BYARD, Y. LI, AND Y. YU
4.3. RESULTS CONDITIONAL ON COUNTRY-LEVEL INSTITUTIONALCHARACTERISTICS (H2)
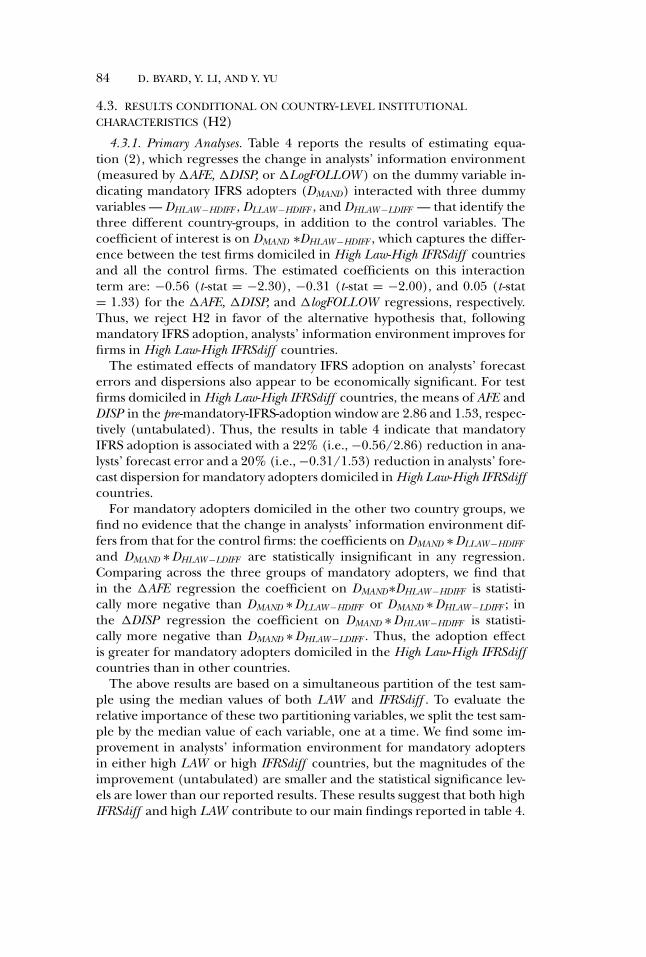
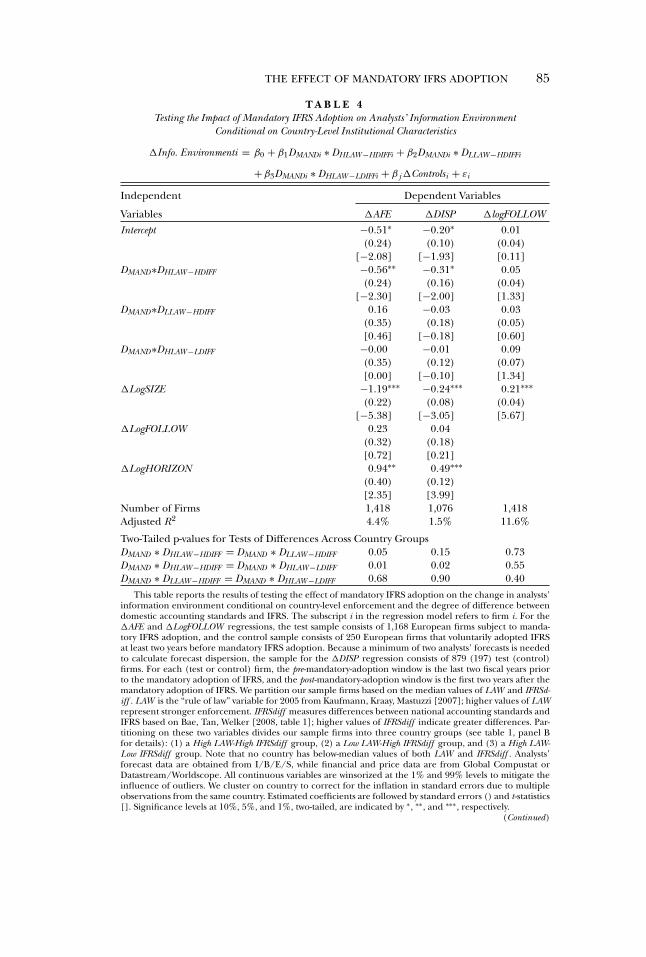
4.3.1. Primary Analyses. Table 4 reports the results of estimating equa-tion (2), which regresses the change in analysts’ information environment(measured by �AFE, �DISP, or �LogFOLLOW ) on the dummy variable in-dicating mandatory IFRS adopters (DMAND) interacted with three dummyvariables — DHLAW −HDIFF , DLLAW −HDIFF , and DHLAW −LDIFF — that identify thethree different country-groups, in addition to the control variables. Thecoefficient of interest is on DMAND ∗DHLAW −HDIFF , which captures the differ-ence between the test firms domiciled in High Law-High IFRSdiff countriesand all the control firms. The estimated coefficients on this interactionterm are: −0.56 (t-stat = −2.30), −0.31 (t-stat = −2.00), and 0.05 (t-stat= 1.33) for the �AFE, �DISP, and �logFOLLOW regressions, respectively.Thus, we reject H2 in favor of the alternative hypothesis that, followingmandatory IFRS adoption, analysts’ information environment improves forfirms in High Law-High IFRSdiff countries.
The estimated effects of mandatory IFRS adoption on analysts’ forecasterrors and dispersions also appear to be economically significant. For testfirms domiciled in High Law-High IFRSdiff countries, the means of AFE andDISP in the pre-mandatory-IFRS-adoption window are 2.86 and 1.53, respec-tively (untabulated). Thus, the results in table 4 indicate that mandatoryIFRS adoption is associated with a 22% (i.e., −0.56/2.86) reduction in ana-lysts’ forecast error and a 20% (i.e., −0.31/1.53) reduction in analysts’ fore-cast dispersion for mandatory adopters domiciled in High Law-High IFRSdiffcountries.
For mandatory adopters domiciled in the other two country groups, wefind no evidence that the change in analysts’ information environment dif-fers from that for the control firms: the coefficients on DMAND ∗ DLLAW −HDIFF
and DMAND ∗ DHLAW −LDIFF are statistically insignificant in any regression.Comparing across the three groups of mandatory adopters, we find thatin the �AFE regression the coefficient on DMAND∗DHLAW −HDIFF is statisti-cally more negative than DMAND ∗ DLLAW −HDIFF or DMAND ∗ DHLAW −LDIFF ; inthe �DISP regression the coefficient on DMAND ∗ DHLAW −HDIFF is statisti-cally more negative than DMAND ∗ DHLAW −LDIFF . Thus, the adoption effectis greater for mandatory adopters domiciled in the High Law-High IFRSdiffcountries than in other countries.
The above results are based on a simultaneous partition of the test sam-ple using the median values of both LAW and IFRSdiff . To evaluate therelative importance of these two partitioning variables, we split the test sam-ple by the median value of each variable, one at a time. We find some im-provement in analysts’ information environment for mandatory adoptersin either high LAW or high IFRSdiff countries, but the magnitudes of theimprovement (untabulated) are smaller and the statistical significance lev-els are lower than our reported results. These results suggest that both highIFRSdiff and high LAW contribute to our main findings reported in table 4.
THE EFFECT OF MANDATORY IFRS ADOPTION 85
T A B L E 4Testing the Impact of Mandatory IFRS Adoption on Analysts’ Information Environment
Conditional on Country-Level Institutional Characteristics
�Info. Environmenti = β0 + β1DMANDi ∗ DHLAW −HDIFFi + β2DMANDi ∗ DLLAW −HDIFFi
+β3DMANDi ∗ DHLAW −LDIFFi + β j �Controlsi + εi
Independent Dependent Variables
Variables �AFE �DISP �logFOLLOW
Intercept −0.51∗ −0.20∗ 0.01(0.24) (0.10) (0.04)
[−2.08] [−1.93] [0.11]DMAND∗DHLAW −HDIFF −0.56∗∗ −0.31∗ 0.05
(0.24) (0.16) (0.04)[−2.30] [−2.00] [1.33]
DMAND∗DLLAW −HDIFF 0.16 −0.03 0.03(0.35) (0.18) (0.05)[0.46] [−0.18] [0.60]
DMAND∗DHLAW −LDIFF −0.00 −0.01 0.09(0.35) (0.12) (0.07)[0.00] [−0.10] [1.34]
�LogSIZE −1.19∗∗∗ −0.24∗∗∗ 0.21∗∗∗(0.22) (0.08) (0.04)
[−5.38] [−3.05] [5.67]�LogFOLLOW 0.23 0.04
(0.32) (0.18)[0.72] [0.21]
�LogHORIZON 0.94∗∗ 0.49∗∗∗(0.40) (0.12)[2.35] [3.99]
Number of Firms 1,418 1,076 1,418Adjusted R2 4.4% 1.5% 11.6%
Two-Tailed p-values for Tests of Differences Across Country GroupsDMAND ∗ DHLAW −HDIFF = DMAND ∗ DLLAW −HDIFF 0.05 0.15 0.73DMAND ∗ DHLAW −HDIFF = DMAND ∗ DHLAW −LDIFF 0.01 0.02 0.55DMAND ∗ DLLAW −HDIFF = DMAND ∗ DHLAW −LDIFF 0.68 0.90 0.40
This table reports the results of testing the effect of mandatory IFRS adoption on the change in analysts’information environment conditional on country-level enforcement and the degree of difference betweendomestic accounting standards and IFRS. The subscript i in the regression model refers to firm i. For the�AFE and �LogFOLLOW regressions, the test sample consists of 1,168 European firms subject to manda-tory IFRS adoption, and the control sample consists of 250 European firms that voluntarily adopted IFRSat least two years before mandatory IFRS adoption. Because a minimum of two analysts’ forecasts is neededto calculate forecast dispersion, the sample for the �DISP regression consists of 879 (197) test (control)firms. For each (test or control) firm, the pre-mandatory-adoption window is the last two fiscal years priorto the mandatory adoption of IFRS, and the post-mandatory-adoption window is the first two years after themandatory adoption of IFRS. We partition our sample firms based on the median values of LAW and IFRSd-iff . LAW is the “rule of law” variable for 2005 from Kaufmann, Kraay, Mastuzzi [2007]; higher values of LAWrepresent stronger enforcement. IFRSdiff measures differences between national accounting standards andIFRS based on Bae, Tan, Welker [2008, table 1]; higher values of IFRSdiff indicate greater differences. Par-titioning on these two variables divides our sample firms into three country groups (see table 1, panel Bfor details): (1) a High LAW-High IFRSdiff group, (2) a Low LAW-High IFRSdiff group, and (3) a High LAW-Low IFRSdiff group. Note that no country has below-median values of both LAW and IFRSdiff . Analysts’forecast data are obtained from I/B/E/S, while financial and price data are from Global Compustat orDatastream/Worldscope. All continuous variables are winsorized at the 1% and 99% levels to mitigate theinfluence of outliers. We cluster on country to correct for the inflation in standard errors due to multipleobservations from the same country. Estimated coefficients are followed by standard errors () and t-statistics[]. Significance levels at 10%, 5%, and 1%, two-tailed, are indicated by ∗, ∗∗, and ∗∗∗, respectively.
(Continued)
86 D. BYARD, Y. LI, AND Y. YU
T A B L E 4 — Continued
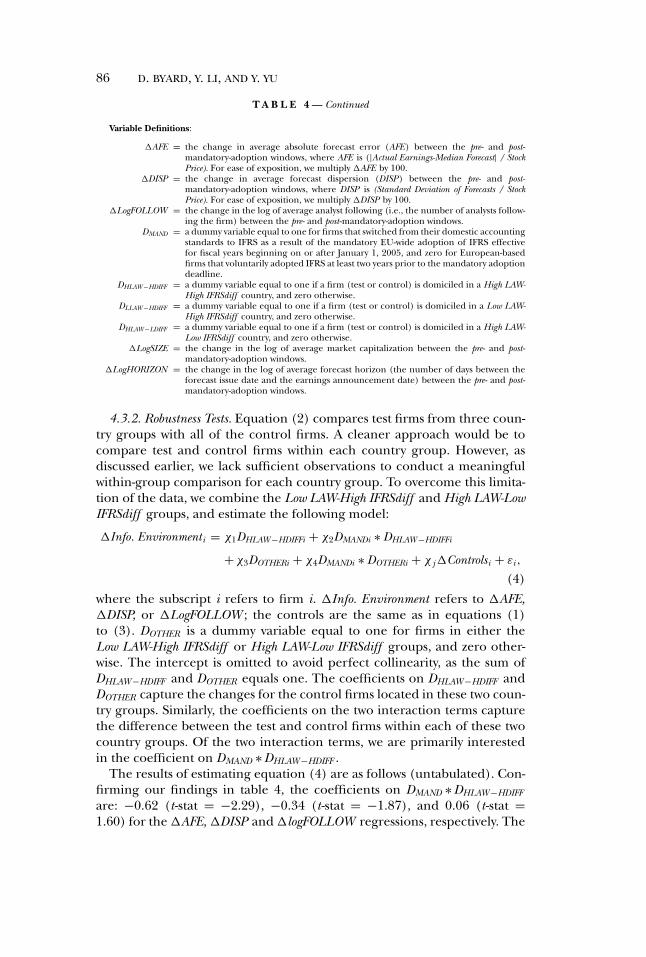
Variable Definitions:
�AFE = the change in average absolute forecast error (AFE) between the pre- and post-mandatory-adoption windows, where AFE is (|Actual Earnings-Median Forecast| / StockPrice). For ease of exposition, we multiply �AFE by 100.
�DISP = the change in average forecast dispersion (DISP) between the pre- and post-mandatory-adoption windows, where DISP is (Standard Deviation of Forecasts / StockPrice). For ease of exposition, we multiply �DISP by 100.
�LogFOLLOW = the change in the log of average analyst following (i.e., the number of analysts follow-ing the firm) between the pre- and post-mandatory-adoption windows.
DMAND = a dummy variable equal to one for firms that switched from their domestic accountingstandards to IFRS as a result of the mandatory EU-wide adoption of IFRS effectivefor fiscal years beginning on or after January 1, 2005, and zero for European-basedfirms that voluntarily adopted IFRS at least two years prior to the mandatory adoptiondeadline.
DHLAW −HDIFF = a dummy variable equal to one if a firm (test or control) is domiciled in a High LAW-High IFRSdiff country, and zero otherwise.
DLLAW −HDIFF = a dummy variable equal to one if a firm (test or control) is domiciled in a Low LAW-High IFRSdiff country, and zero otherwise.
DHLAW −LDIFF = a dummy variable equal to one if a firm (test or control) is domiciled in a High LAW-Low IFRSdiff country, and zero otherwise.
�LogSIZE = the change in the log of average market capitalization between the pre- and post-mandatory-adoption windows.
�LogHORIZON = the change in the log of average forecast horizon (the number of days between theforecast issue date and the earnings announcement date) between the pre- and post-mandatory-adoption windows.
4.3.2. Robustness Tests. Equation (2) compares test firms from three coun-try groups with all of the control firms. A cleaner approach would be tocompare test and control firms within each country group. However, asdiscussed earlier, we lack sufficient observations to conduct a meaningfulwithin-group comparison for each country group. To overcome this limita-tion of the data, we combine the Low LAW-High IFRSdiff and High LAW-LowIFRSdiff groups, and estimate the following model:
�Info. Environmenti = χ1DHLAW −HDIFFi + χ2DMANDi ∗ DHLAW −HDIFFi
+χ3DOTHERi + χ4DMANDi ∗ DOTHERi + χ j �Controlsi + εi ,
(4)where the subscript i refers to firm i. �Info. Environment refers to �AFE,�DISP, or �LogFOLLOW ; the controls are the same as in equations (1)to (3). DOTHER is a dummy variable equal to one for firms in either theLow LAW-High IFRSdiff or High LAW-Low IFRSdiff groups, and zero other-wise. The intercept is omitted to avoid perfect collinearity, as the sum ofDHLAW −HDIFF and DOTHER equals one. The coefficients on DHLAW −HDIFF andDOTHER capture the changes for the control firms located in these two coun-try groups. Similarly, the coefficients on the two interaction terms capturethe difference between the test and control firms within each of these twocountry groups. Of the two interaction terms, we are primarily interestedin the coefficient on DMAND ∗ DHLAW −HDIFF .
The results of estimating equation (4) are as follows (untabulated). Con-firming our findings in table 4, the coefficients on DMAND ∗ DHLAW −HDIFF
are: −0.62 (t-stat = −2.29), −0.34 (t-stat = −1.87), and 0.06 (t-stat =1.60) for the �AFE, �DISP and �logFOLLOW regressions, respectively. The
THE EFFECT OF MANDATORY IFRS ADOPTION 87
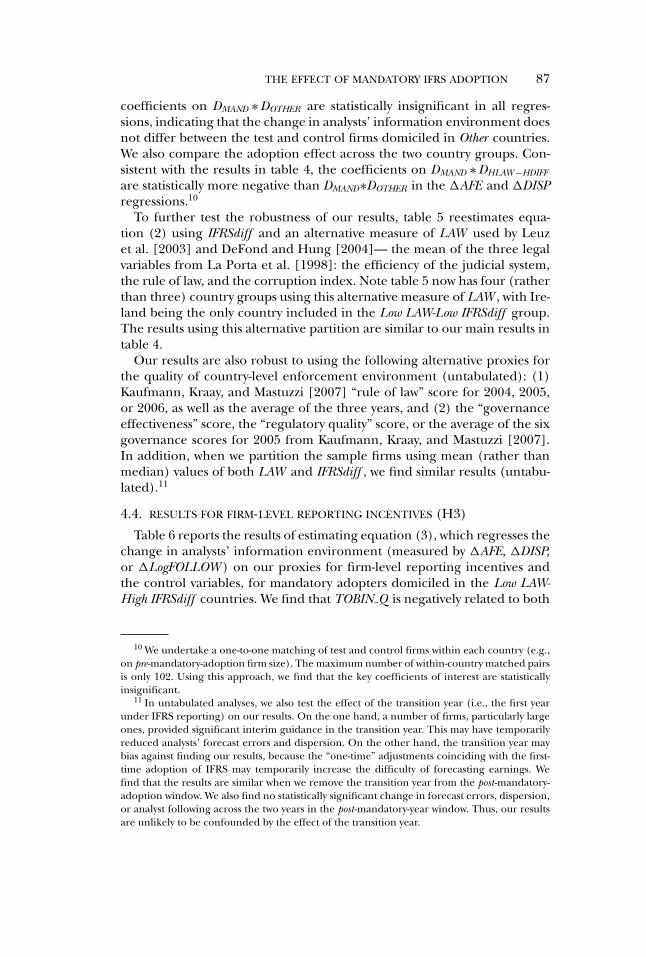
coefficients on DMAND ∗ DOTHER are statistically insignificant in all regres-sions, indicating that the change in analysts’ information environment doesnot differ between the test and control firms domiciled in Other countries.We also compare the adoption effect across the two country groups. Con-sistent with the results in table 4, the coefficients on DMAND ∗ DHLAW −HDIFF
are statistically more negative than DMAND∗DOTHER in the �AFE and �DISPregressions.10
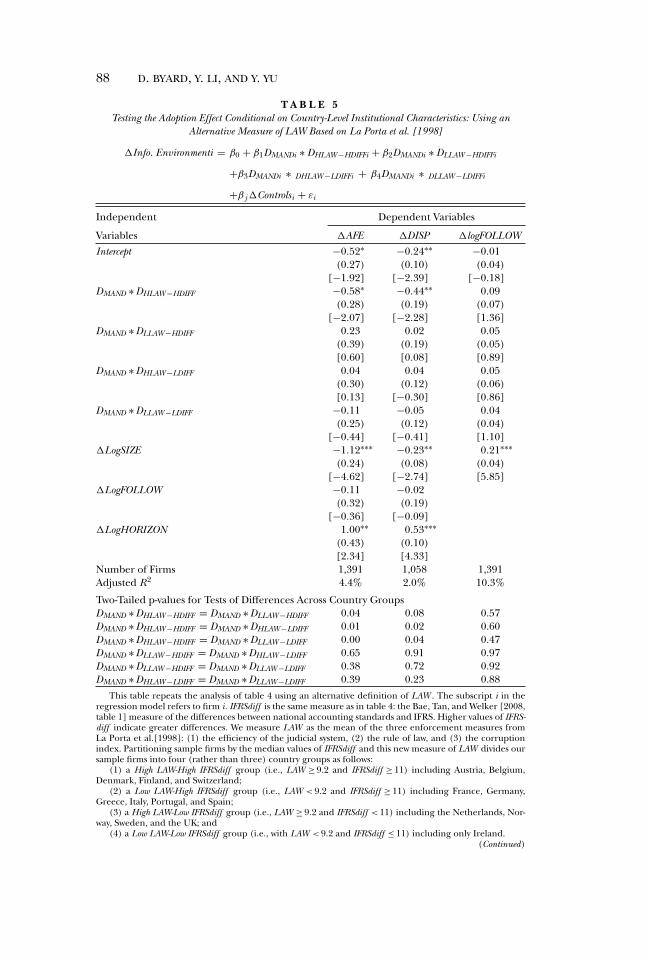
To further test the robustness of our results, table 5 reestimates equa-tion (2) using IFRSdiff and an alternative measure of LAW used by Leuzet al. [2003] and DeFond and Hung [2004]— the mean of the three legalvariables from La Porta et al. [1998]: the efficiency of the judicial system,the rule of law, and the corruption index. Note table 5 now has four (ratherthan three) country groups using this alternative measure of LAW , with Ire-land being the only country included in the Low LAW-Low IFRSdiff group.The results using this alternative partition are similar to our main results intable 4.
Our results are also robust to using the following alternative proxies forthe quality of country-level enforcement environment (untabulated): (1)Kaufmann, Kraay, and Mastuzzi [2007] “rule of law” score for 2004, 2005,or 2006, as well as the average of the three years, and (2) the “governanceeffectiveness” score, the “regulatory quality” score, or the average of the sixgovernance scores for 2005 from Kaufmann, Kraay, and Mastuzzi [2007].In addition, when we partition the sample firms using mean (rather thanmedian) values of both LAW and IFRSdiff , we find similar results (untabu-lated).11
4.4. RESULTS FOR FIRM-LEVEL REPORTING INCENTIVES (H3)
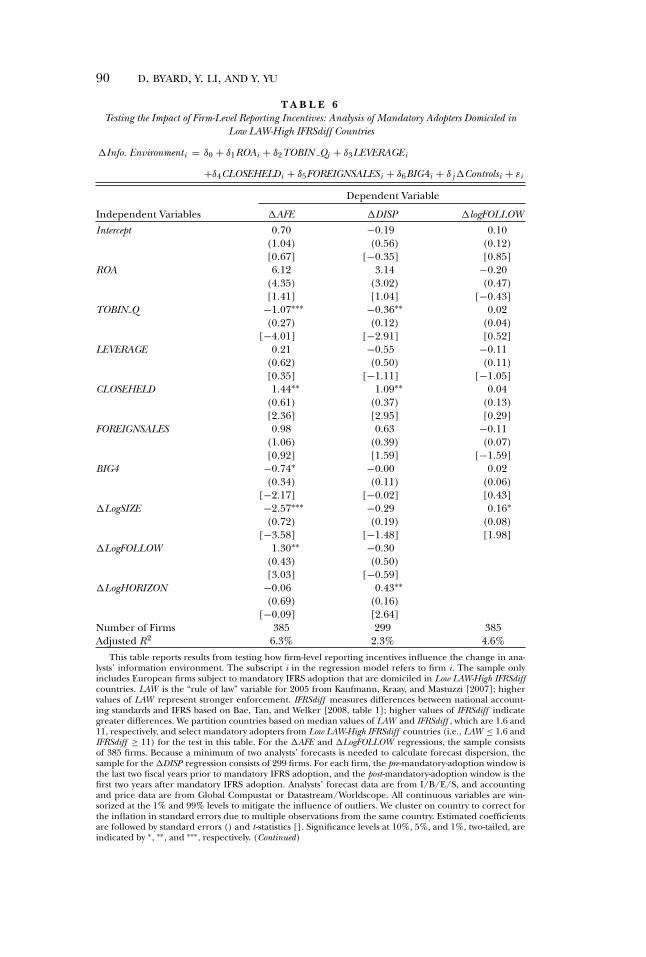
Table 6 reports the results of estimating equation (3), which regresses thechange in analysts’ information environment (measured by �AFE, �DISP,or �LogFOLLOW ) on our proxies for firm-level reporting incentives andthe control variables, for mandatory adopters domiciled in the Low LAW-High IFRSdiff countries. We find that TOBIN Q is negatively related to both
10 We undertake a one-to-one matching of test and control firms within each country (e.g.,on pre-mandatory-adoption firm size). The maximum number of within-country matched pairsis only 102. Using this approach, we find that the key coefficients of interest are statisticallyinsignificant.
11 In untabulated analyses, we also test the effect of the transition year (i.e., the first yearunder IFRS reporting) on our results. On the one hand, a number of firms, particularly largeones, provided significant interim guidance in the transition year. This may have temporarilyreduced analysts’ forecast errors and dispersion. On the other hand, the transition year maybias against finding our results, because the “one-time” adjustments coinciding with the first-time adoption of IFRS may temporarily increase the difficulty of forecasting earnings. Wefind that the results are similar when we remove the transition year from the post-mandatory-adoption window. We also find no statistically significant change in forecast errors, dispersion,or analyst following across the two years in the post-mandatory-year window. Thus, our resultsare unlikely to be confounded by the effect of the transition year.
88 D. BYARD, Y. LI, AND Y. YU
T A B L E 5Testing the Adoption Effect Conditional on Country-Level Institutional Characteristics: Using an
Alternative Measure of LAW Based on La Porta et al. [1998]
�Info. Environmenti = β0 + β1DMANDi ∗ DHLAW −HDIFFi + β2DMANDi ∗ DLLAW −HDIFFi
+β3DMANDi ∗ DHLAW −LDIFFi + β4DMANDi ∗ DLLAW −LDIFFi
+β j �Controlsi + εi
Independent Dependent Variables
Variables �AFE �DISP �logFOLLOW
Intercept −0.52∗ −0.24∗∗ −0.01(0.27) (0.10) (0.04)
[−1.92] [−2.39] [−0.18]DMAND ∗ DHLAW −HDIFF −0.58∗ −0.44∗∗ 0.09
(0.28) (0.19) (0.07)[−2.07] [−2.28] [1.36]
DMAND ∗ DLLAW −HDIFF 0.23 0.02 0.05(0.39) (0.19) (0.05)[0.60] [0.08] [0.89]
DMAND ∗ DHLAW −LDIFF 0.04 0.04 0.05(0.30) (0.12) (0.06)[0.13] [−0.30] [0.86]
DMAND ∗ DLLAW −LDIFF −0.11 −0.05 0.04(0.25) (0.12) (0.04)
[−0.44] [−0.41] [1.10]�LogSIZE −1.12∗∗∗ −0.23∗∗ 0.21∗∗∗
(0.24) (0.08) (0.04)[−4.62] [−2.74] [5.85]
�LogFOLLOW −0.11 −0.02(0.32) (0.19)
[−0.36] [−0.09]�LogHORIZON 1.00∗∗ 0.53∗∗∗
(0.43) (0.10)[2.34] [4.33]
Number of Firms 1,391 1,058 1,391Adjusted R2 4.4% 2.0% 10.3%
Two-Tailed p-values for Tests of Differences Across Country GroupsDMAND ∗ DHLAW −HDIFF = DMAND ∗ DLLAW −HDIFF 0.04 0.08 0.57DMAND ∗ DHLAW −HDIFF = DMAND ∗ DHLAW −LDIFF 0.01 0.02 0.60DMAND ∗ DHLAW −HDIFF = DMAND ∗ DLLAW −LDIFF 0.00 0.04 0.47DMAND ∗ DLLAW −HDIFF = DMAND ∗ DHLAW −LDIFF 0.65 0.91 0.97DMAND ∗ DLLAW −HDIFF = DMAND ∗ DLLAW −LDIFF 0.38 0.72 0.92DMAND ∗ DHLAW −LDIFF = DMAND ∗ DLLAW −LDIFF 0.39 0.23 0.88
This table repeats the analysis of table 4 using an alternative definition of LAW . The subscript i in theregression model refers to firm i. IFRSdiff is the same measure as in table 4: the Bae, Tan, and Welker [2008,table 1] measure of the differences between national accounting standards and IFRS. Higher values of IFRS-diff indicate greater differences. We measure LAW as the mean of the three enforcement measures fromLa Porta et al.[1998]: (1) the efficiency of the judicial system, (2) the rule of law, and (3) the corruptionindex. Partitioning sample firms by the median values of IFRSdiff and this new measure of LAW divides oursample firms into four (rather than three) country groups as follows:
(1) a High LAW-High IFRSdiff group (i.e., LAW ≥ 9.2 and IFRSdiff ≥ 11) including Austria, Belgium,Denmark, Finland, and Switzerland;
(2) a Low LAW-High IFRSdiff group (i.e., LAW < 9.2 and IFRSdiff ≥ 11) including France, Germany,Greece, Italy, Portugal, and Spain;
(3) a High LAW-Low IFRSdiff group (i.e., LAW ≥ 9.2 and IFRSdiff < 11) including the Netherlands, Nor-way, Sweden, and the UK; and
(4) a Low LAW-Low IFRSdiff group (i.e., with LAW < 9.2 and IFRSdiff ≤ 11) including only Ireland.(Continued)
THE EFFECT OF MANDATORY IFRS ADOPTION 89
T A B L E 5 — Continued
This alternative measure of LAW is not available for four countries: the Czech Republic, Hungary, Lux-embourg, and Poland. As a result, the sample size is reduced by 27 firms for the �AEF and �LogFOLLOWregressions, and by 18 firms for the �DISP regression compared with the sample used in table 4. For the�AFE and �LogFOLLOW regressions, the total number of sample firms (test and control) is 1,391; for the�DISP regression, the total number of sample firms (test and control) is 1,058. Analysts’ forecast data arefrom I/B/E/S, while financial and price data are from Global Compustat or Datastream/Worldscope. Foreach (test or control) firm, the pre-mandatory-adoption window is the last two fiscal years prior to manda-tory IFRS adoption, and the post-mandatory-adoption window is the first two years after mandatory IFRSadoption. All continuous variables are winsorized at the 1% and 99% levels to mitigate the influence of out-liers. We cluster on country to correct for the inflation in standard errors due to multiple observations fromthe same country. Estimated coefficients are followed by standard errors () and t-statistics []. Significancelevels at 10%, 5%, and 1%, two-tailed, are indicated by ∗, ∗∗, and ∗∗∗, respectively.
Variable Definitions:
�AFE = the change in average absolute forecast error (AFE) between the pre- and post-mandatory-adoption windows, where AFE is (|Actual Earnings-Median Forecast| / StockPrice). For ease of exposition, we multiply �AFE by 100.
�DISP = the change in average forecast dispersion (DISP) between the pre- and post-mandatory-adoption windows, where DISP is (Standard Deviation of Forecasts / StockPrice). For ease of exposition, we multiply �DISP by 100.
�LogFOLLOW = the change in the log of average analyst following (i.e., the number of analysts follow-ing the firm) between the pre- and post-mandatory-adoption windows.
DMAND = a dummy variable equal to one for firms that switched from their domestic accountingstandards to IFRS as a result of the mandatory EU-wide adoption of IFRS effectivefor fiscal years beginning on or after January 1, 2005, and zero for European-basedfirms that voluntarily adopted IFRS at least two years prior to the mandatory adoptiondeadline.
DHLAW −HDIFF = a dummy variable equal to one if a firm (test or control) is domiciled in a High LAW-High IFRSdiff country, and zero otherwise.
DLLAW −HDIFF = a dummy variable equal to one if a firm (test or control) is domiciled in a Low LAW-High IFRSdiff country, and zero otherwise.
DHLAW −LDIFF = a dummy variable equal to one if a firm (test or control) is domiciled in a High LAW-Low IFRSdiff country, and zero otherwise.
DLLAW −LDIFF = a dummy variable equal to one if a firm (test or control) is domiciled in a Low LAW-Low IFRSdiff country, and zero otherwise.
�LogSIZE = the change in the log of average market capitalization between the pre- and post-mandatory-adoption windows.
�LogHORIZON = the change in the log of average forecast horizon (the number of days between theforecast issue date and the earnings announcement date) between the pre- and post-mandatory-adoption windows.
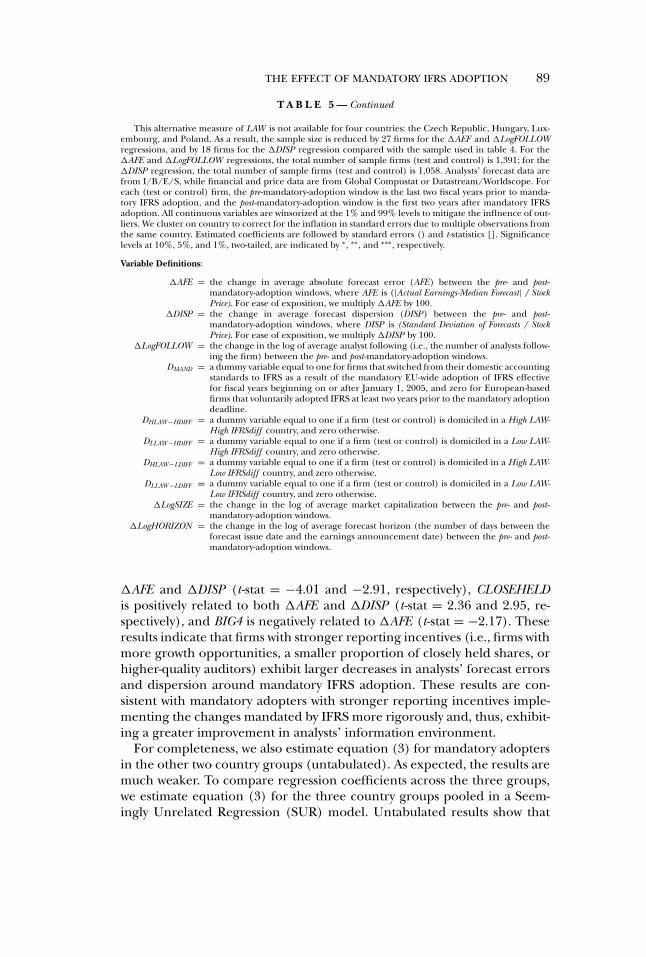
�AFE and �DISP (t-stat = −4.01 and −2.91, respectively), CLOSEHELDis positively related to both �AFE and �DISP (t-stat = 2.36 and 2.95, re-spectively), and BIG4 is negatively related to �AFE (t-stat = −2.17). Theseresults indicate that firms with stronger reporting incentives (i.e., firms withmore growth opportunities, a smaller proportion of closely held shares, orhigher-quality auditors) exhibit larger decreases in analysts’ forecast errorsand dispersion around mandatory IFRS adoption. These results are con-sistent with mandatory adopters with stronger reporting incentives imple-menting the changes mandated by IFRS more rigorously and, thus, exhibit-ing a greater improvement in analysts’ information environment.
For completeness, we also estimate equation (3) for mandatory adoptersin the other two country groups (untabulated). As expected, the results aremuch weaker. To compare regression coefficients across the three groups,we estimate equation (3) for the three country groups pooled in a Seem-ingly Unrelated Regression (SUR) model. Untabulated results show that
90 D. BYARD, Y. LI, AND Y. YU
T A B L E 6Testing the Impact of Firm-Level Reporting Incentives: Analysis of Mandatory Adopters Domiciled in
Low LAW-High IFRSdiff Countries
�Info. Environmenti = δ0 + δ1ROAi + δ2TOBIN Qi + δ3LEVERAGEi
+δ4CLOSEHELDi + δ5FOREIGNSALESi + δ6BIG4i + δ j �Controlsi + εi
Dependent Variable
Independent Variables �AFE �DISP �logFOLLOW
Intercept 0.70 −0.19 0.10(1.04) (0.56) (0.12)[0.67] [−0.35] [0.85]
ROA 6.12 3.14 −0.20(4.35) (3.02) (0.47)[1.41] [1.04] [−0.43]
TOBIN Q −1.07∗∗∗ −0.36∗∗ 0.02(0.27) (0.12) (0.04)
[−4.01] [−2.91] [0.52]LEVERAGE 0.21 −0.55 −0.11
(0.62) (0.50) (0.11)[0.35] [−1.11] [−1.05]
CLOSEHELD 1.44∗∗ 1.09∗∗ 0.04(0.61) (0.37) (0.13)[2.36] [2.95] [0.29]
FOREIGNSALES 0.98 0.63 −0.11(1.06) (0.39) (0.07)[0.92] [1.59] [−1.59]
BIG4 −0.74∗ −0.00 0.02(0.34) (0.11) (0.06)
[−2.17] [−0.02] [0.43]�LogSIZE −2.57∗∗∗ −0.29 0.16∗
(0.72) (0.19) (0.08)[−3.58] [−1.48] [1.98]
�LogFOLLOW 1.30∗∗ −0.30(0.43) (0.50)[3.03] [−0.59]
�LogHORIZON −0.06 0.43∗∗(0.69) (0.16)
[−0.09] [2.64]Number of Firms 385 299 385Adjusted R2 6.3% 2.3% 4.6%
This table reports results from testing how firm-level reporting incentives influence the change in ana-lysts’ information environment. The subscript i in the regression model refers to firm i. The sample onlyincludes European firms subject to mandatory IFRS adoption that are domiciled in Low LAW-High IFRSdiffcountries. LAW is the “rule of law” variable for 2005 from Kaufmann, Kraay, and Mastuzzi [2007]; highervalues of LAW represent stronger enforcement. IFRSdiff measures differences between national account-ing standards and IFRS based on Bae, Tan, and Welker [2008, table 1]; higher values of IFRSdiff indicategreater differences. We partition countries based on median values of LAW and IFRSdiff , which are 1.6 and11, respectively, and select mandatory adopters from Low LAW-High IFRSdiff countries (i.e., LAW ≤ 1.6 andIFRSdiff ≥ 11) for the test in this table. For the �AFE and �LogFOLLOW regressions, the sample consistsof 385 firms. Because a minimum of two analysts’ forecasts is needed to calculate forecast dispersion, thesample for the �DISP regression consists of 299 firms. For each firm, the pre-mandatory-adoption window isthe last two fiscal years prior to mandatory IFRS adoption, and the post-mandatory-adoption window is thefirst two years after mandatory IFRS adoption. Analysts’ forecast data are from I/B/E/S, and accountingand price data are from Global Compustat or Datastream/Worldscope. All continuous variables are win-sorized at the 1% and 99% levels to mitigate the influence of outliers. We cluster on country to correct forthe inflation in standard errors due to multiple observations from the same country. Estimated coefficientsare followed by standard errors () and t-statistics []. Significance levels at 10%, 5%, and 1%, two-tailed, areindicated by ∗, ∗∗, and ∗∗∗, respectively. (Continued)
THE EFFECT OF MANDATORY IFRS ADOPTION 91
T A B L E 6 — Continued
Variable Definitions:
�AFE = the change in average absolute forecast error (AFE) between the pre- and post-mandatory-adoption windows, where AFE is (|Actual Earnings-Median Forecast| / StockPrice). For ease of exposition, we multiply �AFE by 100.
�DISP = the change in average forecast dispersion (DISP) between the pre- and post-mandatory-adoption windows, where DISP is (Standard Deviation of Forecasts / StockPrice). For ease of exposition, we multiply �DISP both by 100.
�LogFOLLOW = the change in the log of average analyst following (i.e., the number of analysts follow-ing the firm) between the pre- and post-mandatory-adoption windows.
ROA = average return on assets (net income / total assets) for the pre-mandatory-adoptionwindow.
TOBIN Q = average Tobin’s q for the pre-mandatory-adoption window. Tobin’s q is market valueof assets / book value of assets, where the numerator is measured as (book value ofassets + market value of common equity – book value of common equity – balancesheet deferred taxes).
LEVERAGE = average leverage (total liabilities / total assets) for the pre-mandatory-adoption win-dow.
CLOSEHELD = average percentage of closely hold shares (number of closely held shares / commonshares outstanding) as reported by Datastream/Worldscope in the pre-mandatory-adoption window.
FOREIGNSALES = average percentage of foreign sales (foreign sales / total sales) for the pre-mandatory-adoption window as reported by Datastream/Worldscope.
BIG4 = a dummy variable indicating the presence of a big-four auditor in the year immedi-ately before switching to IFRS.
�LogSIZE = the change in the log of average market capitalization between the pre- and post-mandatory-adoption windows.
�LogHORIZON = the change in the log of average forecast horizon (the number of days between theforecast issue date and the earnings announcement date) between the pre- and post-mandatory-adoption windows.
the effects of TOBIN Q , CLOSEHELD, and BIG4 are statistically larger forthe Low LAW-High IFRSdiff group than the other two groups. These resultsconfirm our expectation that in countries with weak enforcement regimes,firm-level reporting incentives play a relatively greater role in determiningthe effect of mandatory IFRS adoption.
4.5. ANALYSIS OF ANALYSTS’ PUBLIC AND PRIVATE INFORMATION
In this subsection, we examine if the improvement in analysts’ informa-tion environment documented above is attributable to an increase in ana-lysts’ public information, private information, or both. We expect enhanceddisclosures and transparency under IFRS to increase analysts’ public infor-mation. However, it is an open question how mandatory IFRS adoptionwould change analysts’ private information. Theory (e.g., Kim and Verrec-chia [1991, 1994]) suggests that more firm disclosures could either sub-stitute for analysts’ private information, or complement analysts’ privateknowledge, allowing analysts to develop more private information.
We use the Barron et al. [1998] measures to capture the average preci-sion of analysts’ public (PUBLIC) and private (PRIVATE) information, andanalysts’ consensus (CONSENSUS). PUBLIC and PRIVATE are measured us-ing the variance of analysts’ forecasts (D), the squared error in the meanforecast (SE), and the number of forecasts (N ) as follows (see Barron et al.
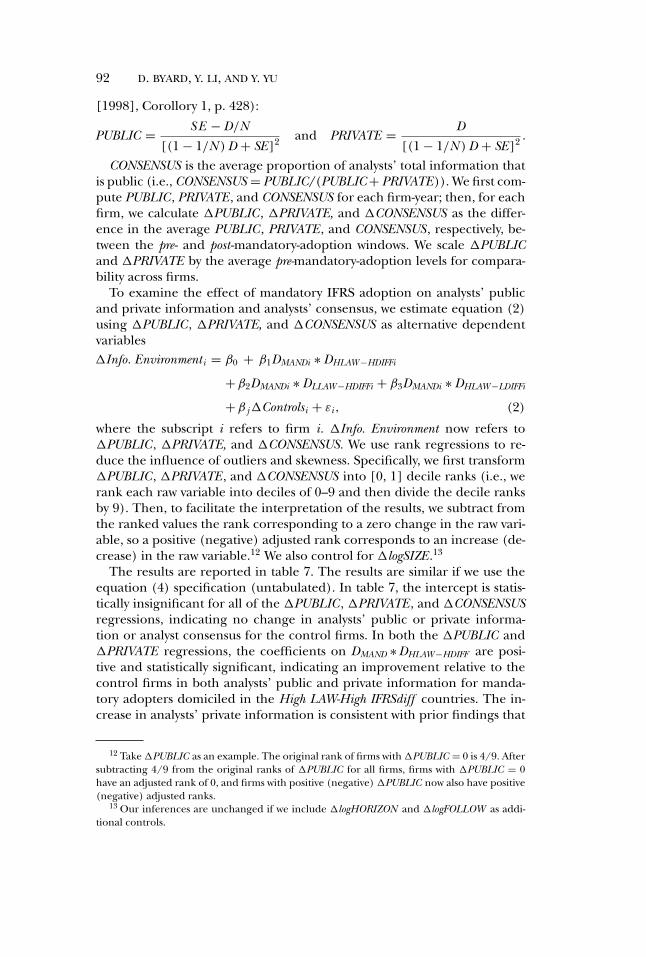
92 D. BYARD, Y. LI, AND Y. YU
[1998], Corollory 1, p. 428):
PUBLIC = S E − D/N
[(1 − 1/N ) D + SE]2 and PRIVATE = D
[(1 − 1/N ) D + SE]2 .
CONSENSUS is the average proportion of analysts’ total information thatis public (i.e., CONSENSUS = PUBLIC/(PUBLIC + PRIVATE)). We first com-pute PUBLIC , PRIVATE , and CONSENSUS for each firm-year; then, for eachfirm, we calculate �PUBLIC , �PRIVATE, and �CONSENSUS as the differ-ence in the average PUBLIC , PRIVATE , and CONSENSUS, respectively, be-tween the pre- and post-mandatory-adoption windows. We scale �PUBLICand �PRIVATE by the average pre-mandatory-adoption levels for compara-bility across firms.
To examine the effect of mandatory IFRS adoption on analysts’ publicand private information and analysts’ consensus, we estimate equation (2)using �PUBLIC , �PRIVATE, and �CONSENSUS as alternative dependentvariables�Info. Environmenti = β0 + β1DMANDi ∗ DHLAW −HDIFFi
+β2DMANDi ∗ DLLAW −HDIFFi + β3DMANDi ∗ DHLAW −LDIFFi
+β j �Controlsi + εi , (2)
where the subscript i refers to firm i. �Info. Environment now refers to�PUBLIC , �PRIVATE, and �CONSENSUS. We use rank regressions to re-duce the influence of outliers and skewness. Specifically, we first transform�PUBLIC , �PRIVATE , and �CONSENSUS into [0, 1] decile ranks (i.e., werank each raw variable into deciles of 0–9 and then divide the decile ranksby 9). Then, to facilitate the interpretation of the results, we subtract fromthe ranked values the rank corresponding to a zero change in the raw vari-able, so a positive (negative) adjusted rank corresponds to an increase (de-crease) in the raw variable.12 We also control for �logSIZE .13
The results are reported in table 7. The results are similar if we use theequation (4) specification (untabulated). In table 7, the intercept is statis-tically insignificant for all of the �PUBLIC , �PRIVATE , and �CONSENSUSregressions, indicating no change in analysts’ public or private informa-tion or analyst consensus for the control firms. In both the �PUBLIC and�PRIVATE regressions, the coefficients on DMAND ∗ DHLAW −HDIFF are posi-tive and statistically significant, indicating an improvement relative to thecontrol firms in both analysts’ public and private information for manda-tory adopters domiciled in the High LAW-High IFRSdiff countries. The in-crease in analysts’ private information is consistent with prior findings that
12 Take �PUBLIC as an example. The original rank of firms with �PUBLIC = 0 is 4/9. Aftersubtracting 4/9 from the original ranks of �PUBLIC for all firms, firms with �PUBLIC = 0have an adjusted rank of 0, and firms with positive (negative) �PUBLIC now also have positive(negative) adjusted ranks.
13 Our inferences are unchanged if we include �logHORIZON and �logFOLLOW as addi-tional controls.
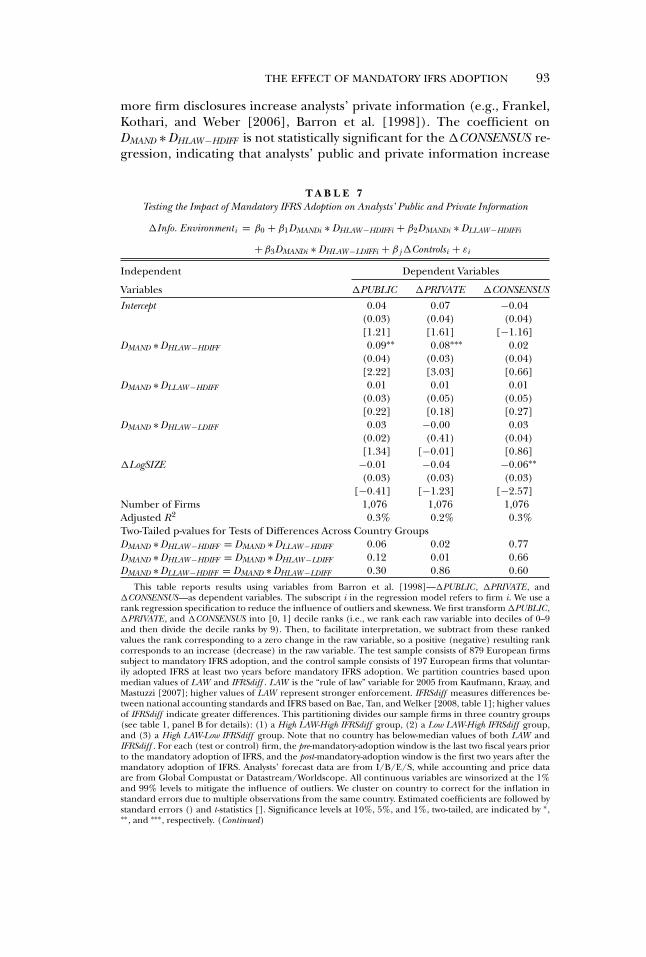
THE EFFECT OF MANDATORY IFRS ADOPTION 93
more firm disclosures increase analysts’ private information (e.g., Frankel,Kothari, and Weber [2006], Barron et al. [1998]). The coefficient onDMAND ∗ DHLAW −HDIFF is not statistically significant for the �CONSENSUS re-gression, indicating that analysts’ public and private information increase
T A B L E 7Testing the Impact of Mandatory IFRS Adoption on Analysts’ Public and Private Information
�Info. Environmenti = β0 + β1DMANDi ∗ DHLAW −HDIFFi + β2DMANDi ∗ DLLAW −HDIFFi
+β3DMANDi ∗ DHLAW −LDIFFi + β j �Controlsi + εi
Independent Dependent Variables
Variables �PUBLIC �PRIVATE �CONSENSUS
Intercept 0.04 0.07 −0.04(0.03) (0.04) (0.04)[1.21] [1.61] [−1.16]
DMAND ∗ DHLAW −HDIFF 0.09∗∗ 0.08∗∗∗ 0.02(0.04) (0.03) (0.04)[2.22] [3.03] [0.66]
DMAND ∗ DLLAW −HDIFF 0.01 0.01 0.01(0.03) (0.05) (0.05)[0.22] [0.18] [0.27]
DMAND ∗ DHLAW −LDIFF 0.03 −0.00 0.03(0.02) (0.41) (0.04)[1.34] [−0.01] [0.86]
�LogSIZE −0.01 −0.04 −0.06∗∗(0.03) (0.03) (0.03)
[−0.41] [−1.23] [−2.57]Number of Firms 1,076 1,076 1,076Adjusted R2 0.3% 0.2% 0.3%Two-Tailed p-values for Tests of Differences Across Country GroupsDMAND ∗ DHLAW −HDIFF = DMAND ∗ DLLAW −HDIFF 0.06 0.02 0.77DMAND ∗ DHLAW −HDIFF = DMAND ∗ DHLAW −LDIFF 0.12 0.01 0.66DMAND ∗ DLLAW −HDIFF = DMAND ∗ DHLAW −LDIFF 0.30 0.86 0.60
This table reports results using variables from Barron et al. [1998]—�PUBLIC , �PRIVATE , and�CONSENSUS—as dependent variables. The subscript i in the regression model refers to firm i. We use arank regression specification to reduce the influence of outliers and skewness. We first transform �PUBLIC ,�PRIVATE , and �CONSENSUS into [0, 1] decile ranks (i.e., we rank each raw variable into deciles of 0–9and then divide the decile ranks by 9). Then, to facilitate interpretation, we subtract from these rankedvalues the rank corresponding to a zero change in the raw variable, so a positive (negative) resulting rankcorresponds to an increase (decrease) in the raw variable. The test sample consists of 879 European firmssubject to mandatory IFRS adoption, and the control sample consists of 197 European firms that voluntar-ily adopted IFRS at least two years before mandatory IFRS adoption. We partition countries based uponmedian values of LAW and IFRSdiff . LAW is the “rule of law” variable for 2005 from Kaufmann, Kraay, andMastuzzi [2007]; higher values of LAW represent stronger enforcement. IFRSdiff measures differences be-tween national accounting standards and IFRS based on Bae, Tan, and Welker [2008, table 1]; higher valuesof IFRSdiff indicate greater differences. This partitioning divides our sample firms in three country groups(see table 1, panel B for details): (1) a High LAW-High IFRSdiff group, (2) a Low LAW-High IFRSdiff group,and (3) a High LAW-Low IFRSdiff group. Note that no country has below-median values of both LAW andIFRSdiff . For each (test or control) firm, the pre-mandatory-adoption window is the last two fiscal years priorto the mandatory adoption of IFRS, and the post-mandatory-adoption window is the first two years after themandatory adoption of IFRS. Analysts’ forecast data are from I/B/E/S, while accounting and price dataare from Global Compustat or Datastream/Worldscope. All continuous variables are winsorized at the 1%and 99% levels to mitigate the influence of outliers. We cluster on country to correct for the inflation instandard errors due to multiple observations from the same country. Estimated coefficients are followed bystandard errors () and t-statistics []. Significance levels at 10%, 5%, and 1%, two-tailed, are indicated by ∗,∗∗, and ∗∗∗, respectively. (Continued)
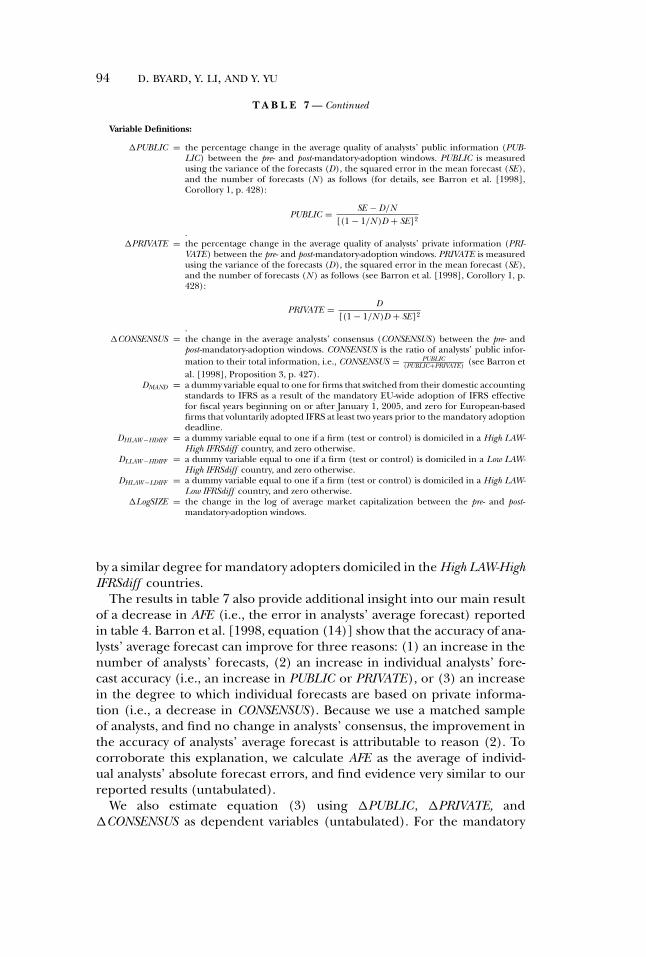
94 D. BYARD, Y. LI, AND Y. YU
T A B L E 7 — Continued
Variable Definitions:
�PUBLIC = the percentage change in the average quality of analysts’ public information (PUB-LIC) between the pre- and post-mandatory-adoption windows. PUBLIC is measuredusing the variance of the forecasts (D), the squared error in the mean forecast (SE),and the number of forecasts (N ) as follows (for details, see Barron et al. [1998],Corollory 1, p. 428):
PUBLIC = SE − D/N[(1 − 1/N )D + SE]2
.�PRIVATE = the percentage change in the average quality of analysts’ private information (PRI-
VATE) between the pre- and post-mandatory-adoption windows. PRIVATE is measuredusing the variance of the forecasts (D), the squared error in the mean forecast (SE),and the number of forecasts (N ) as follows (see Barron et al. [1998], Corollory 1, p.428):
PRIVATE = D[(1 − 1/N )D + SE]2
.�CONSENSUS = the change in the average analysts’ consensus (CONSENSUS) between the pre- and
post-mandatory-adoption windows. CONSENSUS is the ratio of analysts’ public infor-mation to their total information, i.e., CONSENSUS = PUBLIC
(PUBLIC+PRIVATE) (see Barron etal. [1998], Proposition 3, p. 427).
DMAND = a dummy variable equal to one for firms that switched from their domestic accountingstandards to IFRS as a result of the mandatory EU-wide adoption of IFRS effectivefor fiscal years beginning on or after January 1, 2005, and zero for European-basedfirms that voluntarily adopted IFRS at least two years prior to the mandatory adoptiondeadline.
DHLAW −HDIFF = a dummy variable equal to one if a firm (test or control) is domiciled in a High LAW-High IFRSdiff country, and zero otherwise.
DLLAW −HDIFF = a dummy variable equal to one if a firm (test or control) is domiciled in a Low LAW-High IFRSdiff country, and zero otherwise.
DHLAW −LDIFF = a dummy variable equal to one if a firm (test or control) is domiciled in a High LAW-Low IFRSdiff country, and zero otherwise.
�LogSIZE = the change in the log of average market capitalization between the pre- and post-mandatory-adoption windows.
by a similar degree for mandatory adopters domiciled in the High LAW-HighIFRSdiff countries.
The results in table 7 also provide additional insight into our main resultof a decrease in AFE (i.e., the error in analysts’ average forecast) reportedin table 4. Barron et al. [1998, equation (14)] show that the accuracy of ana-lysts’ average forecast can improve for three reasons: (1) an increase in thenumber of analysts’ forecasts, (2) an increase in individual analysts’ fore-cast accuracy (i.e., an increase in PUBLIC or PRIVATE), or (3) an increasein the degree to which individual forecasts are based on private informa-tion (i.e., a decrease in CONSENSUS). Because we use a matched sampleof analysts, and find no change in analysts’ consensus, the improvement inthe accuracy of analysts’ average forecast is attributable to reason (2). Tocorroborate this explanation, we calculate AFE as the average of individ-ual analysts’ absolute forecast errors, and find evidence very similar to ourreported results (untabulated).
We also estimate equation (3) using �PUBLIC , �PRIVATE, and�CONSENSUS as dependent variables (untabulated). For the mandatory
THE EFFECT OF MANDATORY IFRS ADOPTION 95
adopters in the Low LAW-High IFRSdiff group, TOBIN Q is positively re-lated to both �PUBLIC and �PRIVATE (two-tailed p ≤ 0.01 for both), andCLOSEHELD is negatively related to �PRIVATE (two-tailed p = 0.04). Theseresults indicate a greater improvement in both analysts’ public and privateinformation for mandatory adopters with stronger reporting incentives.
5. Conclusion
We examine the impact of the 2005 EU-wide mandatory adoption of IFRSon analysts’ information environment, as measured by forecast errors, fore-cast dispersion, and analyst following. To control for the effect of confound-ing concurrent events, we use a control sample of firms that had alreadyvoluntarily adopted IFRS at least two years prior to the mandatory adop-tion date. We find that analysts’ absolute forecast errors and forecast disper-sion decrease relative to this control sample only for mandatory adoptersdomiciled in countries with both strong enforcement regimes and domes-tic accounting standards that differ significantly from IFRS. Furthermore,for mandatory adopters located in countries with both weak enforcementregimes and domestic accounting standards that differ significantly fromIFRS, analysts’ forecast errors and dispersion decrease more for firms withstronger reporting incentives. Overall, these results suggest that mandatoryIFRS adoption improves analysts’ information environment only when thechanges mandated by IFRS are substantial and rigorously enforced.
REFERENCES
ASHBAUGH, H. “Non-U.S. Firms’ Accounting Standard Choices.” Journal of Accounting and PublicPolicy 20 (2001): 129–53.
ASHBAUGH H., AND M. PINCUS. “Domestic Accounting Standards, International AccountingStandards, and the Predictability of Earnings.” Journal of Accounting Research 39 (2001):417–34.
BAE, K.; H. TAN; AND M. WELKER. “International GAAP Differences: The Impact on ForeignAnalysts.” The Accounting Review 83 (2008): 593–628.
BALL, R. “IFRS: Pros and Cons for Investors.” Accounting, and Business Research, InternationalAccounting Policy Forum (2006): 5–27.
BARRON, O.; D. BYARD; AND Y. YU. “Earnings Surprises that Motivate Analysts to Reduce theAverage Forecast Error.” The Accounting Review 83 (2008): 303–26.
BARRON, O.; O. KIM; S. LIM; AND D. STEVENS. “Using Analysts’ Forecasts to Measure Propertiesof Analysts’ Information Environment.” The Accounting Review 73 (1998): 421–33.
BARTH, M.; W. LANDSMAN; AND M. LANG. “International Accounting Standards and AccountingQuality.” Journal of Accounting Research 46 (2008): 467–98.
BHUSHAN, R. “Firm Characteristics and Analyst Following.” Journal of Accounting and Economics11 (1989): 255–74.
CHRISTENSEN, H.; E. LEE; AND M. WALKER. “Cross-Sectional Variation in the Economic Conse-quences of International Accounting Harmonization: The Case of Mandatory IFRS Adop-tion in the U.K.” The International Journal of Accounting 42 (2007): 341–79.
DASKE, H.; L. HAIL; C. LEUZ; AND R. VERDI. “Adopting a Label: Heterogeneity in the EconomicConsequences of IFRS Adoptions.” Working paper, University of Chicago, 2007. Availablefrom: http://papers.ssrn.com/sol3/papers.cfm?abstract id=979650.
DASKE, H.; L. HAIL; C. LEUZ; AND R. VERDI. “Mandatory IFRS Reporting Around the World:Early Evidence on the Economic Consequences.” Journal of Accounting Research 46 (2008):1085–142.
96 D. BYARD, Y. LI, AND Y. YU
DEFOND, M., AND M. HUNG. “Investor Protection and Corporate Governance: Evidence fromWorldwide CEO Turnover.” Journal of Accounting Research 42 (2004): 269–312.
FRANKEL, R.; S.P. KOTHARI; AND J. WEBER. “Determinants of the Informativeness of Analysts’Research.” Journal of Accounting and Economics 41 (2006): 29–54.
HAIL, L., AND C. LEUZ. “Capital Market Effects of Mandatory IFRS Reporting in the EU: Empiri-cal Evidence.” Amsterdam: Netherlands Authority for the Financial Markets, 2007. Availablefrom: http://www.afm.nl/corporate/default.ashx?documentId=10519.
HOLTHAUSEN, R. “Accounting Standards, Financial Reporting Outcomes and Enforcement.”Journal of Accounting Research 47 (2009): 447–58.
HOPE, O. “Disclosure Practices, Enforcement of Accounting Standards, and Analysts’ ForecastAccuracy: An International Study.” Journal of Accounting Research 41 (2003): 235–72.
KAUFMANN, D.; A. KRAAY; AND M. MASTUZZI. “Governance Matters VI: Aggregate and IndividualGovernance Indicators 1996–2006.” Washington, DC: The World Bank, 2007.
KIM, O., AND R. VERRECCHIA. “Trading Volume and Price Reactions to Public Announce-ments.” Journal of Accounting Research 29 (1991): 302–21.
KIM, O., AND R. VERRECCHIA. “Market Liquidity and Volume Around Earnings Announce-ments.” Journal of Accounting and Economics 29 (1994): 41–67.
LANG, M., AND R. LUNDHOLM. “Corporate Disclosure Policy and Analyst Behavior.” The Account-ing Review 71 (1996): 467–92.
LA PORTA, R.; F. LOPEZ-DE-SILANES; A. SHLEIFER; AND R. VISHNY. “Law and Finance.” Journal ofPolitical Economy 106 (1998): 1113–55.
LEUZ, C. “Cross Listing, Bonding and Firms’ Reporting Incentives: A Discussion of Lang, Raedyand Wilson (2006).” Journal of Accounting and Economics 42 (2006): 285–99.
LEUZ, C.; D. NANDA; AND P. WYSOCKI. “Earnings Management and Investor Protection: AnInternational Comparison.” Journal of Financial Economics 69 (2003): 505–27.
PAGANO, R.; A. ROELL; AND J. ZECHNER. “The Geography of Equity Listings: Why Do EuropeanFirms List Abroad?” Journal of Finance (2002): 2651–94.

Copyright of Journal of Accounting Research is the property of Wiley-Blackwell and its content may not be
copied or emailed to multiple sites or posted to a listserv without the copyright holder's express written
permission. However, users may print, download, or email articles for individual use.


![IFRS AU Taxonomy 2012 Guide€¦ · Web viewThe use of the word “Mandatory” is to be read as “MUST”. Introduction. ... [901100] Axis - Departure from requirement of IFRS](https://img.pdfslide.net/doc/110x75/5c341d7609d3f217298bb118/ifrs-au-taxonomy-2012-guide-web-viewthe-use-of-the-word-mandatory-is-to.jpg)


![DOES MANDATORY IFRS ADOPTION IMPROVE THE … · The paper examines the effects of mandatory International Financial Reporting Standards (‘IFRS’) ... Ball [2006] notes that mark-to-model](https://img.pdfslide.net/doc/110x75/60bd69c217e8eb43d8524e47/does-mandatory-ifrs-adoption-improve-the-the-paper-examines-the-effects-of-mandatory.jpg)