Embed Size (px)
Citation preview

REPORT 145
THE EFFECT OF MIXING TECHNIQUES(MANUAL, CLOSED SYSTEM, VACUUM)
ON BONE CEMENT
Verdonschot N, De Groes S
Orthopedic Research Laboratory, University of Nijmegen, The Netherlands

2
Introduction
Aim of the study was to compare two bone cements: CemexXL and SimplexP.
The discriminating factors to evaluate an aspect of the quality of the bone cement were volume,
density and porosity changes in time.
Cemex XL is also available in a closed mixing system with the brand name of Cemex System.
The Cemex System allows the preparation and delivery of bone cement.
In the human body, the bone cement is exposed to liquid. Most cement tests performed nowadays
take place in a dry environment 4,5,6,7,8,9; therefore it might be not realistic. As the authors believe
that the liquid is of great influence to the material properties of the bone cement, the tests are
performed for both specimens kept in a dry environment and specimens kept in physiologic water.
Three questions are addressed in this report:
• How large is the porosity of Cemex XL relative to Simplex P
• Is Cemex System proper to mix Cemex XL (In other words can differences in density and
dimension change of bone cements be related to the preparation method)?
• What is the difference in dimension and density change of cement kept in a dry environment and
kept in water over time?
Materials and methods
Two bone cements were used; CemexXL (Tecres Spa) and SimplexP (Howmedica
International). These two bone cements were hand mixed and vacuum mixed; Cemex XL was
eventually prepared with CemexSystem.
Therefore 5 groups were created:
A. Cemex XL hand mixed
B. Cemex XL mixed with Cemex System
C. Cemex XL vacuum mixed
D. Simplex P hand mixed
E. Simplex P vacuum mixed
Of every group, 8 specimens were made.

3
Mixing techniques
The room in which all the specimens are made was kept at a constant temperature of 23 degrees,
which was the recommended temperature by the manufacturers of the cements. All the specimens
were made out of the same batch.
The first way was hand mixing. This means mixing by hand in a bowl, as can be seen in figure 1.
Fig. 1 Manual mixing
The spatula was turned at a frequency of 2 turns per second for 90 seconds, accordingly to the
guidelines of the manufacturer of the cement.
The second way was mixing under vacuum, as can be seen in figure 2. The Optivac System was
used. First the monomer is poured in the system and than the powder. Before the mixing starts, the
mixing chamber is put under vacuum, which prevents air to react with the cement mix. After 10
seconds the mixing was started by pushing and turning the plunger up and down, with the chamber
still under vacuum. The mixing was continued for 90 seconds.
Fig. 2 Vacuum mixing
Another way was Cemex System, which is a mixing device designed by Tecres. In figure 3 the
device is shown. When this system is used, the powder and monomer are already present in the
system. So it is a closed system. In this system the monomer and powder are mangled just by
striking the system to the hand with a frequency of 1 strike per second, rotating it by a quarter of a
turn at each strike, as indicated by the manufacturer. This striking continues for about 90 seconds.
Fig. 3 Cemex System

4
Test specimen preparation
After the cement was mixed, the cement was introduced in a glass test tube for curing, using a syringe in all
three cases, which makes a retrograde filling fashion possible. This test tube had an internal diameter of 14.3
mm and a length of 200 mm. The bottom of the test tube was closed. After cement injection, the test tube was
closed with a plunger, which had a hole to allow air to escape as the plunger was pushed down. When all the
air had escaped, the glass side of the test tube closed the hole. With one batch of bone cement two test tubes
could be filled. In figure 4 the filled test tube is shown.
Fig. 4 Filled test tube
A force of 170 N was applied to the plunger, for 20 min (figure 5). Usually in current total hip
arthroplasty, the cement is pressurized. Many studies are done to measure the pressure in the
cement during pressurisation. One of these studies was done by Yee et al.. They measured
pressures of about 150 psi (pounds per square inch), which equals 1.03 MPa. With our test tube
diameter, a force of about 170 N has to be applied to get this pressure. The force was applied by a
mass of 5,7 kg and an arm of 1:3 to the plunger.
Fig. 5 Pressurizing bone cement
Plunger
Cement

5
After pressurizing, the cement cylinder was taken out of the test tube, by breaking the glass.
After that the cement cylinders were separated into 8 specimens of 24 mm in length, the diameter of the
specimens was machined to 13 mm, to get a reproducible surface/diameter.
The test
The 8 specimens were divided into two groups of 4 specimens. One group was kept in a dry constant
environment. The other group was kept in physiologic water (0,9% salt water) of 37°C.
The diameter (average of 4 measurements) and the length (average of 4 measurements) were measured with a
micrometer. The weight (average of 3 measurements) of both groups and the weight under water (average of
3 specimens = mwet) were determined using a very accurate balance (see figure 6). Weighting under water is
necessary to perform the archimedes test.
Fig. 6 The Archimedes test set-up
The cement specimen was placed in a basket made of very thin wire, which was of very little
influence to the weight measured in the water (shown in figure 7). The balance was compensated
for the weight of the metal basket. After that the specimen was lowered into the demineralized
water very carefully (not to be confused with the physiologic water in which the specimens are
kept between the measurements), so that the surface was free of air bubbles. The normal weight
minus the weight measured in the water equals the upward weight of the cement specimen
generated by the water (mupw).
Fig. 7 Metal basket

6
With the weight results the increase/decrease in density and Archimedean volume of thespecimens could be determined. The Archimedes’ principle is the principle that proves why boatsetc. float. This is done with the following formulas:
EurekagmVgFAghF
AppFApApF
waterbuoyant
buoyant
buoyant
buoyant
→⋅=⋅⋅=
=
−=
−=
ρρ )(
)( 12
12
After transposition the density of the specimens can be calculated with:
opw
waterdryspecimen m
m ρρ
⋅=
To determine the porosity, specimens under very high pressure (139.85 MPa) were made. These
specimens should have negligible porosity. When the density of these specimens is compared to
the density of the specimens made in the ‘normal’ way, the relative porosity can be determined.
Measurements were performed four times:
1. One day after making the specimens;
2. Three days after making the specimens;
3. Two weeks after making the specimens;
4. Four weeks after making the specimens.
These times were chosen to get an idea of the saturation speed of the water.
Before the first measurement the specimens were all kept in a dry environment, after the first
measurements the specimens were divided into two groups, one group for the wet environment and
the other group for the dry environment.
Whether these results were significant different has to be determined with the MANOVA-test.
This test is a variance analyse for repeated measurements, which indicates between which
variables a significant difference can be detected. The order of significance can than be determined
with the students T-test, which is a test for independent variables. As significance level, p=0.05
was chosen.
Results
The three determined values were:
1. volume; 2. density; 3. porosity.
The six groups measured were:
A. Cemex XL hand mixed
B. Cemex XL mixed with Cemex System
p1 = pressure on cementspecimen p2 = pressure inside cementspecimen (air) A = surface of cement specimen
7
C. Cemex XL vacuum mixed
D. Simplex P hand mixed
E. Simplex P vacuum mixed
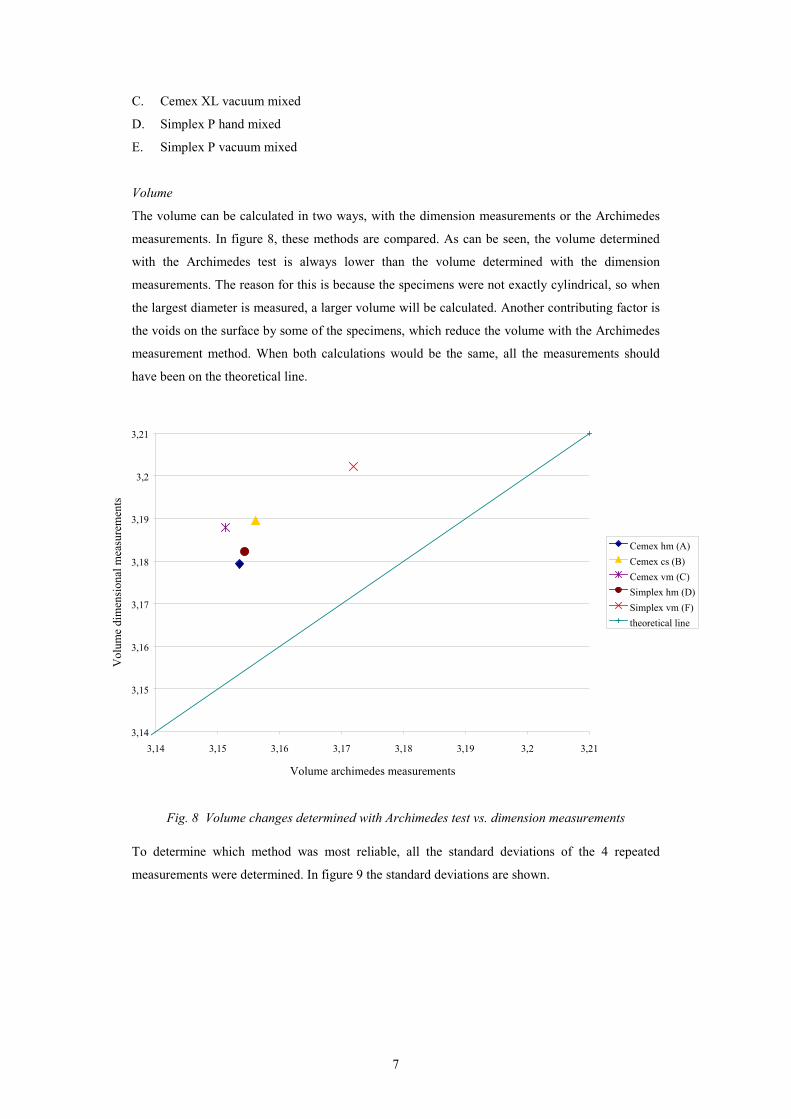
Volume
The volume can be calculated in two ways, with the dimension measurements or the Archimedes
measurements. In figure 8, these methods are compared. As can be seen, the volume determined
with the Archimedes test is always lower than the volume determined with the dimension
measurements. The reason for this is because the specimens were not exactly cylindrical, so when
the largest diameter is measured, a larger volume will be calculated. Another contributing factor is
the voids on the surface by some of the specimens, which reduce the volume with the Archimedes
measurement method. When both calculations would be the same, all the measurements should
have been on the theoretical line.
Fig. 8 Volume changes determined with Archimedes test vs. dimension measurements
To determine which method was most reliable, all the standard deviations of the 4 repeated
measurements were determined. In figure 9 the standard deviations are shown.
3,14
3,15
3,16
3,17
3,18
3,19
3,2
3,21
3,14 3,15 3,16 3,17 3,18 3,19 3,2 3,21
Volume archimedes measurements
Vol
ume
dim
ensi
onal
mea
sure
men
ts
Cemex hm (A)Cemex cs (B)Cemex vm (C)Simplex hm (D)Simplex vm (F)theoretical line

8
Fig. 9 Standard deviations for both measurement systems
It can be clearly seen that the reproducibility of the Archimedes measurements is much higher than
the reproducibility of the dimensional measurements. Therefore only the Archimedes measurements
are considered in the rest of the report.
In figure 10 the volume change percentage in time is shown for Cemex XL and Simplex P kept in
both a dry and a wet environment determined with the Archimedes measurements. The first
measurements are taken as the zero-measurements (0%), the reference value.
Fig. 10 Volume change of Cemex XL vs. Simplex P kept in a dry or wet environment determined with theArchimedes measurements
-0,2
0
0,2
0,4
0,6
0,8
1
0 2 4 6 8 10 12 14 16 18 20 22 24 26 28
D ays after preparation
Vol
ume
chan
ge (%
)
C em ex hm -dry (A )C em ex hm -w et (A)C em ex cs-dry (B)C em ex cs-w et (B )C em ex vm -dry (C)C em ex vm -w et (C)Sim plex hm -dry (D)Sim plex hm -w et (D )Sim plex vm -dry (F)S im plex vm -w et (F)
0
0,0002
0,0004
0,0006
0,0008
0,001
0,0012
A-d A-w B-d B-w C-d C-w D-d D-w E-d E-w
Stan
dard
dev
iatio
n
DimensionalArchimedes

9
It can be clearly seen that the specimens kept in a wet environment have a significantly (p <<
0.001) larger volume increase than the specimens kept in the dry environment. Between the
specimens kept in a dry environment, no significant differences were detected. But when placed in
water, there are significant differences, as shown in figure 11. (Left = dry; Right = wet)
Cem
ex h
and-
mix
ed
Cem
ex S
yste
m-m
ixed
Cem
ex v
acuu
m-m
ixed
Sim
plex
han
d-m
ixed
Sim
plex
vac
uum
-mix
ed
Cem
ex h
and-
mix
ed
Cem
ex S
yste
m-m
ixed
Cem
ex v
acuu
m-m
ixed
Sim
plex
han
d-m
ixed
Sim
plex
vac
uum
-mix
ed
Cemex hand-mixed Cemex hand-mixed H H H HCemex System-mixed Cemex System-mixedCemex vacuum-mixed Cemex vacuum-mixedSimplex hand-mixed Simplex hand-mixedSimplex vacuum-mixed Simplex vacuum-mixed
H = 'significantly higher when looked at from left to above'L = 'significantly lower when looked at from left to above'
Fig. 11 Significant differences in volume between different groups for both dry and wet environment after 28days
With regard to the volume change, there is no effect of cement type or mixing method (fig. 10 and
11), when the specimen is kept in a dry environment.
Density
The density differences between the two bone cements are large, 1.268⋅103 kg/m3 (Cemex XL) to
1.239⋅103 kg/m3 (Simplex P) (initial average density). A reason for this might be the larger amount
of barium in Cemex XL than in Simplex P (12% vs. 10%). Initially, between the mixing methods
there was just only a small variation detected (± 0.005 ⋅103 kg/m3). In figure 12 the density
changes of the different specimens, kept in a dry environment, are shown.

10
Fig. 12 Density change of Cemex XL and Simplex P kept in a dry environment
Figure 13 shows density increase of the specimens kept in water.
FIg. 13 Density change of Cemex XL vs. Simplex P kept in water
The significant differences are shown in figure 14.
0
0,05
0,1
0,15
0,2
0,25
0,3
0,35
0,4
0,45
1 3 14 28
Days after preparation
Den
sity
cha
nge
(%)
Cemex hm (A)Cemex cs (B)Cemex vm (C)Sim plex hm (D)Sim plex vm (F)
-0,04
-0,02
0
0,02
0,04
0,06
0,08
0,1
0,12
0,14
0,16
1 3 14 28
Days after preparation
Den
sity
cha
nge
(%)
Cemex hm (A)Cemex cs (B)Cemex vm (C)Simplex hm (D)Simplex vm (F)

11
Dry Wet
Cem
ex h
and-
mix
ed
Cem
ex S
yste
m-m
ixed
Cem
ex v
acuu
m-m
ixed
Sim
plex
han
d-m
ixed
Sim
plex
vac
uum
-mix
ed
Cem
ex h
and-
mix
ed
Cem
ex S
yste
m-m
ixed
Cem
ex v
acuu
m-m
ixed
Sim
plex
han
d-m
ixed
Sim
plex
vac
uum
-mix
ed
Cemex hand-mixed L Cemex hand-mixed LCemex System-mixed Cemex System-mixedCemex vacuum-mixed Cemex vacuum-mixed HSimplex hand-mixed H Simplex hand-mixed HSimplex vacuum-mixed Simplex vacuum-mixed
H = 'significantly higher when looked at from left to above'L = 'significantly lower when looked at from left to above'
Fig. 14 Significant differences in density between different groups for both dry and wetenvironment after 28 days
Porosity
The third factor to look at was the porosity grade. This porosity grade was determined with the
density of the specimens made under high pressure (which are expected to have negligible
porosity). The following formula was used:
%100×−
=presssurehigh
specimenpressurehighporosityρ
ρρ
The high pressure-density of Cemex XL is 1.26799⋅103 kg/m3 (average of 3 specimens). ForSimplex P it is 1.24534⋅103 kg/m3 (average of 2 specimens).The results of the initial porosity of the specimens are shown in figure 15. To determine the initialporosity of all the specimens, the average of all the 8 specimens was used, because all thespecimens were treated similar till the first measurements.
Fig. 15 Initial porosity of Cemex XL vs. Simplex P (averaged per group)
-0 ,5
0
0 ,5
1
1 ,5
2
2 ,5
3
1
Initi
al p
oros
ity (%
)
C e m e x h m (A )C e m e x c s (B )C e m e x v m (C )S im p le x h m (D )S im p le x v m (F )

12
It can clearly be seen that for both the cements, the lowest porosity is created with vacuum mixing.
The overall porosity of Cemex XL is lower than Simplex P. Between the HP-specimens of Cemex
XL and the ‘normal’ specimens, there were no significant differences found. This can have three
reasons, or the three mixing method are very good or the high pressure was of no influence to the
porosity or the porosity is already decreased by the pressurisation during making the specimens
(which would be nice). For Simplex P, mixing with Cemex System is better than hand mixing.
This result is in agreement with the expectations and theory. There are some significant differences
detected as can be seen in figure 16.
Fig. 16 Significant differences on porosity for different groups
Conclusions
In general we have observed that Cemex had a lower porosity as compared to Simplex P.
Porosity of Cemex ranged from –0.2% (vacuum mixed) and 0.02% (hand mixed); of Simplex P ranged
between 2.1%(Vacuum mixed) and 2.5% (hand mixed). These differences are significant. The negative
value (Cemex XL vacuum mixed) was obtained because the porosity of the vacuum mixed specimens was
found lower than the high pressure manufactured specimens assumed as “0” porosity reference.
Cemex System had a porosity of 0.2%, significantly lower than Simplex P group. This value was instead
significantly higher than Cemex XL vacuum mixed.
Differences in density and volume change between Cemex System and Cemex XL vacuum mixed or
Simplex P group were not significant. Within the Cemex group differences in porosity were significant
only for vacuum mixed Cemex XL.
These data together with porosity results suggest that Cemex System is a proper device for mixing Cemex
XL bone cement.
The environment plays an important role for dimensions stability and material density.
The dimensions increase, after 28 days at 37°C, was significant for all the wet specimens (0.8%), whereas
it was not for dry specimens (at 23°C).
Cem
ex h
and-
mix
edC
emex
Sys
tem
-mix
edC
emex
vac
uum
-mix
edSi
mpl
ex h
and-
mix
edSi
mpl
ex S
yste
m-m
ixed
Sim
plex
vac
uum
-mix
ed
Cemex hand-mixed H L L LCemex System-mixed H L L LCemex vacuum-mixed L L LSimplex hand-mixed H HSimplex System-mixedSimplex vacuum-mixed
H = 'significantly higher when looked at from left to above'L = 'significantly lower when looked at from left to above'

13
The density increase was not significant for the specimens kept in a dry environment whereas it was
significant for the specimens kept in water (0.4 %).