Embed Size (px)
Citation preview
The Effect of Nitrogenous Fertiliser on the Quality of Atle WheatAuthor(s): P. A. SpillaneSource: Irish Journal of Agricultural Research, Vol. 1, No. 3 (Oct., 1962), pp. 237-250Published by: TEAGASC-Agriculture and Food Development AuthorityStable URL: http://www.jstor.org/stable/25555266 .
Accessed: 18/06/2014 23:05
Your use of the JSTOR archive indicates your acceptance of the Terms & Conditions of Use, available at .http://www.jstor.org/page/info/about/policies/terms.jsp
.JSTOR is a not-for-profit service that helps scholars, researchers, and students discover, use, and build upon a wide range ofcontent in a trusted digital archive. We use information technology and tools to increase productivity and facilitate new formsof scholarship. For more information about JSTOR, please contact [email protected].
.
TEAGASC-Agriculture and Food Development Authority is collaborating with JSTOR to digitize, preserve andextend access to Irish Journal of Agricultural Research.
http://www.jstor.org
This content downloaded from 185.2.32.121 on Wed, 18 Jun 2014 23:05:41 PMAll use subject to JSTOR Terms and Conditions
THE EFFECT OF NITROGENOUS FERTILISER ON THE
QUALITY OF ATLE WHEAT
P. A. Spillane
An Foras Takintais, Cereal Chemistry Department, Kinsealy, Malahide, Co. Dublin
ABSTRACT
This paper is mainly concerned with the influence of applied nitrogen on the quality of Atle wheat grown under different environmental conditions. Results obtained with other varieties are included for comparative purposes. A progressive increase in protein content was obtained by increased
application of nitrogenous fertiliser but this was not paralleled by improvement in baking quality. The increase in protein content was greatest when the fertiliser was applied just before ear emergence. The properties of the carbohydrate fraction were also modified and the effect of these changes on
baking quality are discussed.
INTRODUCTION
In Ireland farmers have traditionally been cautious in the application of nitrogen fertiliser to the wheat crop mainly because of the danger of lodging. With the advent of stiff-strawed varieties, this is no longer a problem and most growers to-day apply nitrogen as a standard constituent of the mixed fertiliser used for combine drilling. There has been an increasing tendency in recent years to apply additional nitrogen as a topdressing at the grass corn stage so that total dressings of 2 cwt. per acre of nitro
genous fertiliser (ammonium sulphate) are becoming common.
There has been little information until recently on the response to be expected from applied nitrogen, the best time to apply it, the optimum quantity to be applied and whether it should be combine drilled or broadcast. Furthermore there is no data available on the effect of applied nitrogen on milling and baking quality. This factor is of particular importance under Irish climatic conditions, and may, apart from
agronomic considerations, set a limit in the use of nitrogenous fertilisers.
Brady (1), in Irish experiments, found that the average responses of wheat to
applications of 1 and 2 cwt. of ammonium sulphate were respectively about 2 cwt. and
3 cwt. of wheat per acre. Masterson (2), reporting the results of trials on wheat at
Johnstown Castle, stated that responses varying from 2.2 - 2.7 cwt. of grain per acre
from a dressing of 1 cwt. ammonium sulphate, and up to 3.9 cwt. from the application
of 2 cwt. ammonium sulphate, had been obtained. These responses are lower than
those obtained in Great Britain, where Bullen and Lessels (3) state that 1 cwt. of ammonium sulphate gave an average 3.3 cwt., and 2 cwt. ammonium sulphate, 5 cwt.
of grain per acre respectively. This difference between Irish and English yields is most
237
This content downloaded from 185.2.32.121 on Wed, 18 Jun 2014 23:05:41 PMAll use subject to JSTOR Terms and Conditions
238 IRISH JOURNAL OF AGRICULTURAL RESEARCH, VOL. I, NO. 3,1962
probably due to the fact that in our predominantly grassland economy, soil organic matter and nitrogen levels are higher than in England.
Time of application is of considerable importance. Masterson (2), reporting results of experiments carried out over a 4-year period, comparing the relative effects of
nitrogen applied at four different growth stages, found that early application gave best results and little difference between application at sowing time and at grass corn
(four leaf) stage. Ryan (4) found that combine drilling of nitrogen gave no agronomic advantage as compared with broadcasting, and that quantities as high as 2 cwt.
ammonium sulphate per acre could be applied without damage to germination.
Regarding the amount of nitrogen which should be applied to wheat, Walsh et ah
(5) showed that the most profitable level under Irish conditions was the equivalent of about 2 cwt. ammonium sulphate per acre. This, however, was not a constant
quantity since it varied according to the cost of fertiliser and the value of the crop.
In view of the increased percentage of native wheat in millers grists it was consid
ered desirable to investigate the influence of crop husbandry practices on wheat
quality. In particular it was decided to study the effects of applied nitrogen which is such a mobile and unstable element in soil fertility. Experiments were laid down at
Johnstown Castle and use was made of other experiments on nitrogen manuring to
study the problem.
Some preliminary information is now available on the influence of applied nitrogen on the milling and baking properties of Irish wheat, and the results obtained over the
period 1956-1959 are discussed in the present paper. Samples used in the investigations were taken from the experiments of Masterson (2), from nitrogen top-dressing trials
at the Department of Agriculture Schools, and from a long term fertiliser experiment on a midland fluvio-glacial soil.
EXPERIMENTAL
All samples were carefully dried to 14.5 percent moisture content and milled on a
Buhler mill to give flour comparable in extraction rate and quality with commercially
produced flour. Adjustments in milling technique were made from year to year depend
ing on the quality of the crop but in each year a standard method was adopted for each variety. Assessment of milling quality was made on flour yield, colour and the
handling properties of mill stocks. The flours were tested by standard physical and chemical methods. Diastatic activity was estimated by the "Maltose" test which
measures the quantity of reducing sugars produced under standard conditions of time
and temperature. This test was also used as a measure of the mechanical damage to
the starch fraction during milling. Starch viscosity was determined on the Brabender
amylograph which shows the gelatinising properties of a flour paste when subjected to a controlled rise in temperature. Flours with poor quality starch or which produce dextrin during baking invariably give low figures. As the distribution of nitrogen between bran and endosperm may vary for different varieties and for different environ
mental conditions, protein content of both wheat and flour was determined. The
physical characteristics of the flours, which are influenced to a considerable extent by
This content downloaded from 185.2.32.121 on Wed, 18 Jun 2014 23:05:41 PMAll use subject to JSTOR Terms and Conditions
SPILLANE: QUALITY OF ATLE WHEAT 239
protein or gluten quality, were determined on the extensograph. In baking tests a
straight dough system was used giving a total fermentation time of 3 hours between
mixing and oven. The doughs were scaled at 2 lb. 3 oz. and baked as pan bread. Water
absorption was determined on the "Research" water-absorption meter. Bread was
scored for crumb quality and texture. No points were given for colour as the flours
were unbleached.
RESULTS
Maximum nitrogen trials, Johnstown Castle, 1957-9
Experiments were carried out to assess the effect of increasing quantities of
nitrogen on yield and quality of Atle wheat. The layout was a latin square giving six
replications of each treatment. An adequate basal phosphorus and potassium dressing was applied broadcast to the whole experimental area before sowing, and nitrogen treatments comprised 0, 2, 4, 6, 8 and 10 cwt. ammonium sulphate per acre. All treat
ments were broadcast, at the rate of 2 cwt. at sowing time, and, in the case of the
higher levels, with further applications of 2 cwt. every 2 weeks until the whole dressing was applied. Composite samples of the replicates of each treatment were taken for
testing in 1957 and 1959. Severe lodging occurred in 1958 and no samples were taken.
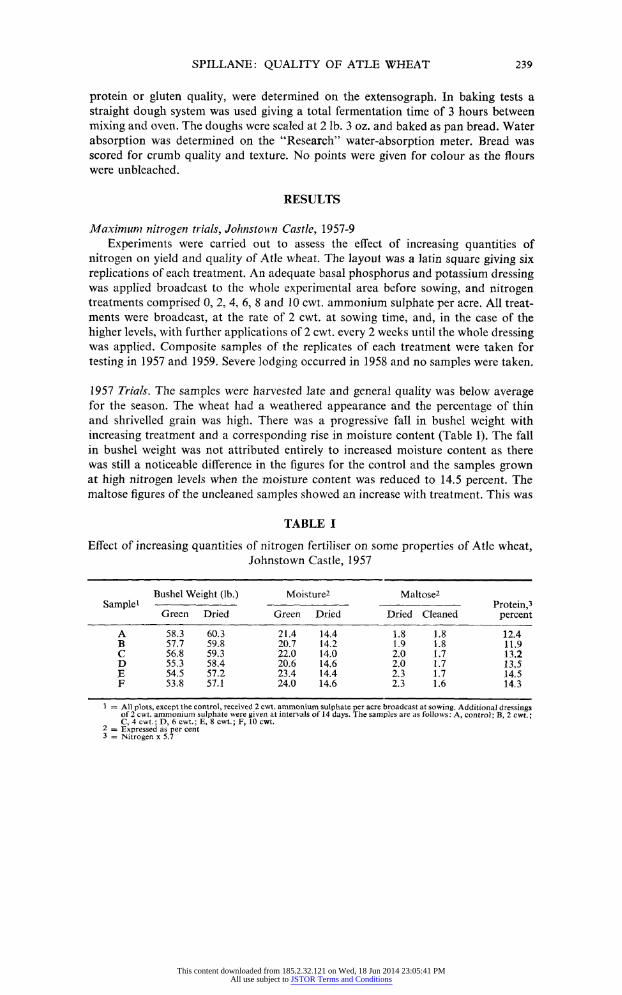
1957 Trials. The samples were harvested late and general quality was below average
for the season. The wheat had a weathered appearance and the percentage of thin
and shrivelled grain was high. There was a progressive fall in bushel weight with
increasing treatment and a corresponding rise in moisture content (Table I). The fall in bushel weight was not attributed entirely to increased moisture content as there
was still a noticeable difference in the figures for the control and the samples grown at high nitrogen levels when the moisture content was reduced to 14.5 percent. The
maltose figures of the uncleaned samples showed an increase with treatment. This was
TABLE I
Effect of increasing quantities of nitrogen fertiliser on some properties of Atle wheat,
Johnstown Castle, 1957
Bushel Weight (lb.) Moisture2 Maltose2 Samplei- Protein,3
Green Dried Green Dried Dried Cleaned percent
A 58.3 60.3 21.4 14.4 1.8 1.8 12.4 B 57.7 59.8 20.7 14.2 1.9 1.8 11.9 C 56.8 59.3 22.0 14.0 2.0 1.7 13.2 D 55.3 58.4 20.6 14.6 2.0 1.7 13.5
E 54.5 57.2 23.4 14.4 2.3 1.7 14.5 F 53.8 57.1 24.0 14.6 2.3 1.6 14.3
1 ? All plots, except the control, received 2 cwt. ammonium sulphate per acre broadcast at sowing. Additional dressings of 2 cwt. ammonium sulphate were given at intervals of 14 days. The samples are as follows: A, control; B, 2 cwt.; C, 4 cwt.; D, 6 cwt.; E, 8 cwt.; F, 10 cwt.
2 = Expressed as per cent 3 = Nitrogen x 5.7
This content downloaded from 185.2.32.121 on Wed, 18 Jun 2014 23:05:41 PMAll use subject to JSTOR Terms and Conditions
240 IRISH JOURNAL OF AGRICULTURAL RESEARCH, VOL. I, NO. 3,1962
not apparent in the cleaned samples as weathered and sprouted kernels, having lower
density than sound grain, were removed during cleaning. There was an increase in
protein content with treatments up to 8 cwt. but under the conditions of the experi
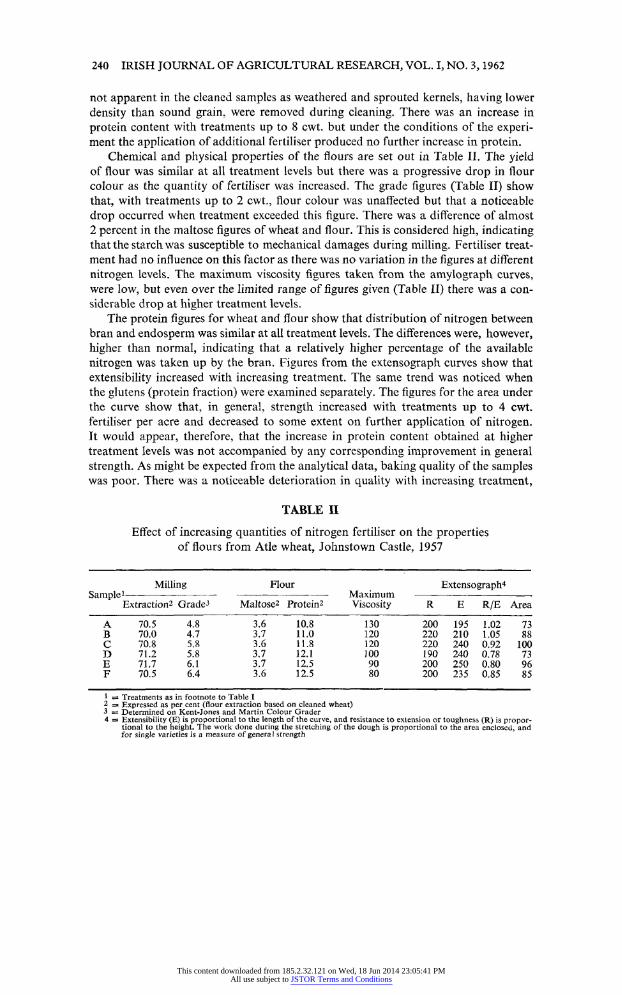
ment the application of additional fertiliser produced no further increase in protein. Chemical and physical properties of the flours are set out in Table II. The yield
of flour was similar at all treatment levels but there was a progressive drop in flour
colour as the quantity of fertiliser was increased. The grade figures (Table II) show
that, with treatments up to 2 cwt., flour colour was unaffected but that a noticeable
drop occurred when treatment exceeded this figure. There was a difference of almost
2 percent in the maltose figures of wheat and flour. This is considered high, indicating that the starch was susceptible to mechanical damages during milling. Fertiliser treat
ment had no influence on this factor as there was no variation in the figures at different
nitrogen levels. The maximum viscosity figures taken from the amylograph curves,
were low, but even over the limited range of figures given (Table II) there was a con siderable drop at higher treatment levels.
The protein figures for wheat and flour show that distribution of nitrogen between bran and endosperm was similar at all treatment levels. The differences were, however,
higher than normal, indicating that a relatively higher percentage of the available
nitrogen was taken up by the bran. Figures from the extensograph curves show that
extensibility increased with increasing treatment. The same trend was noticed when
the glutens (protein fraction) were examined separately. The figures for the area under
the curve show that, in general, strength increased with treatments up to 4 cwt.
fertiliser per acre and decreased to some extent on further application of nitrogen. It would appear, therefore, that the increase in protein content obtained at higher treatment levels was not accompanied by any corresponding improvement in general
strength. As might be expected from the analytical data, baking quality of the samples was poor. There was a noticeable deterioration in quality with increasing treatment,
TABLE n
Effect of increasing quantities of nitrogen fertiliser on the properties of flours from Atle wheat, Johnstown Castle, 1957
Milling Flour Extensograph4 Sample1- Maximum-?
Extraction2 Grade3 Maltose2 Protein2 Viscosity R E R/E Area
A 70.5 4.8 3.6 10.8 130 200 195 1.02 73 B 70.0 4.7 3.7 11.0 120 220 210 1.05 88 C 70.8 5.8 3.6 11.8 120 220 240 0.92 100
D 71.2 5.8 3.7 12.1 100 190 240 0.78 73 E 71.7 6.1 3.7 12.5 90 200 250 0.80 96 F 70.5 6.4 3.6 12.5 80 200 235 0.85 85
1 ? Treatments as in footnote to Table I 2 = Expressed as per cent (flour extraction based on cleaned wheat) 3 = Determined on Kent-Jones and Martin Colour Grader 4 -=s Extensibility (E) is proportional to the length of the curve, and resistance to extension or toughness (R) is propor
tional to the height. The work done during the stretching of the dough is proportional to the area enclosed, and for single varieties is a measure of genera 1 strength
This content downloaded from 185.2.32.121 on Wed, 18 Jun 2014 23:05:41 PMAll use subject to JSTOR Terms and Conditions
SPILLANE: QUALITY OF ATLE WHEAT 241
and the difference in the appearance and quality of samples A and F was striking. No attempt was made to score the bread, but samples were graded as follows on crumb
quality: (i) Samples A andB: Quality fair and crumb dry, (ii) Samples C and D: Crumb soft and cell walls rather thick,
(Hi) Samples E and F: Quality very poor, crumb sticky and bread difficult to cut. Loaf volumes of samples E and F were smaller than the other pairs, the crust colour was pale and the texture coarse and open.
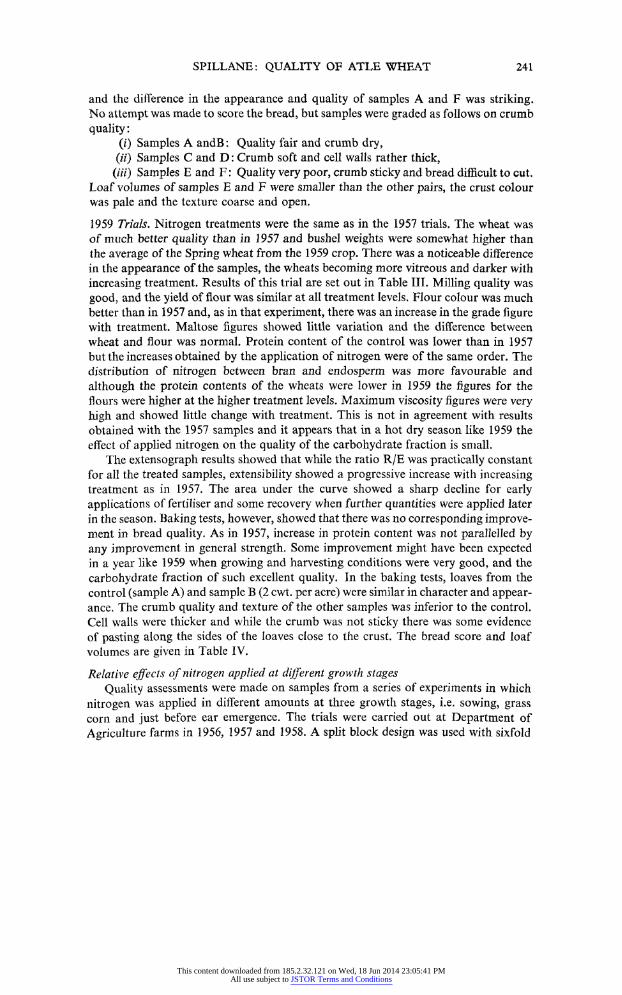
1959 Trials. Nitrogen treatments were the same as in the 1957 trials. The wheat was
of much better quality than in 1957 and bushel weights were somewhat higher than the average of the Spring wheat from the 1959 crop. There was a noticeable difference in the appearance of the samples, the wheats becoming more vitreous and darker with
increasing treatment. Results of this trial are set out in Table III. Milling quality was
good, and the yield of flour was similar at all treatment levels. Flour colour was much better than in 1957 and, as in that experiment, there was an increase in the grade figure with treatment. Maltose figures showed little variation and the difference between wheat and flour was normal. Protein content of the control was lower than in 1957 but the increases obtained by the application of nitrogen were of the same order. The distribution of nitrogen between bran and endosperm was more favourable and
although the protein contents of the wheats were lower in 1959 the figures for the flours were higher at the higher treatment levels. Maximum viscosity figures were very
high and showed little change with treatment. This is not in agreement with results obtained with the 1957 samples and it appears that in a hot dry season like 1959 the effect of applied nitrogen on the quality of the carbohydrate fraction is small.
The extensograph results showed that while the ratio R/E was practically constant
for all the treated samples, extensibility showed a progressive increase with increasing treatment as in 1957. The area under the curve showed a sharp decline for early
applications of fertiliser and some recovery when further quantities were applied later in the season. Baking tests, however, showed that there was no corresponding improve
ment in bread quality. As in 1957, increase in protein content was not parallelled by any improvement in general strength. Some improvement might have been expected
in a year like 1959 when growing and harvesting conditions were very good, and the
carbohydrate fraction of such excellent quality. In the baking tests, loaves from the
control (sample A) and sample B (2 cwt. per acre) were similar in character and appear ance. The crumb quality and texture of the other samples was inferior to the control.
Cell walls were thicker and while the crumb was not sticky there was some evidence
of pasting along the sides of the loaves close to the crust. The bread score and loaf
volumes are given in Table IV.
Relative effects of nitrogen applied at different growth stages
Quality assessments were made on samples from a series of experiments in which
nitrogen was applied in different amounts at three growth stages, i.e. sowing, grass
corn and just before ear emergence. The trials were carried out at Department of
Agriculture farms in 1956, 1957 and 1958. A split block design was used with sixfold
This content downloaded from 185.2.32.121 on Wed, 18 Jun 2014 23:05:41 PMAll use subject to JSTOR Terms and Conditions
TABLE HI K Effect of increasing quantities of nitrogen
fertiliser
on the properties of flours from Atle wheat, 53
Johnstown Castle, 1959 gj
_,_,______^? ??
O
Milling Maltose2 Protein2 Maximum Extensograph d
Sample*--g
Bushel viscosity $
weight, lb. Extraction2 Grade
Wheat
Flour Wheat Flour R E R/E Area |5
A 66.3 72.2 1.4 1.0 1.7
10.4
9.5 1050 440 135 3.3 88 8 B 66.8 72.3 1.4 1.1 1.8
11.3
10.4 1110 250 160 1.6 65 ^ C 67.0 72.0 1.7 1.1 1.8 12.0 11.1 1110 220 165 1.3 58 n D 67.0 73.0 1.9 1.0 1.8
12.6
11.8 1100 230 165 1.4 60 5d E 67.0 73.2 2.4 1.0 1.7
13.9
12.9 1090 240 170 1.4 70 S F 66.8 73.2 2.6 1.1 1.6
13.9
13.1 1100 260 175 1.5 80 ?
_ t"1
1 = Rates of application of ammonium sulphate:?A=control, B = 2, C=4, D = 6, E=8 and F = 10 cwt. per acre ^
2 = Expressed as percent (protein = N x 5.7) C
TABLE IV g
W
Loaf volume, bread score
and
water absorption of flours s? milled from Atle
wheat, Johnstown Castle, 1959 Q
- <
Sample* Loaf Volume2 Bread Score Absorption^ p
A 2395 10.0
14.8 ^ B 2450 10.3
15.5 Z C 2400
8.3 15.6 O D 2370 8.5 15.8 uo E 2315
8.3 15.9 ^ F 2335
8.0 16.0 ^
1 = Rates of application of ammonium
sulphate for these samples were the same as in Table III
2 == Cubic centimetres
3 ic Expressed as gallons per sack (280 lb.)
This content downloaded from 185.2.32.121 on Wed, 18 Jun 2014 23:05:41 PMAll use subject to JSTOR Terms and Conditions
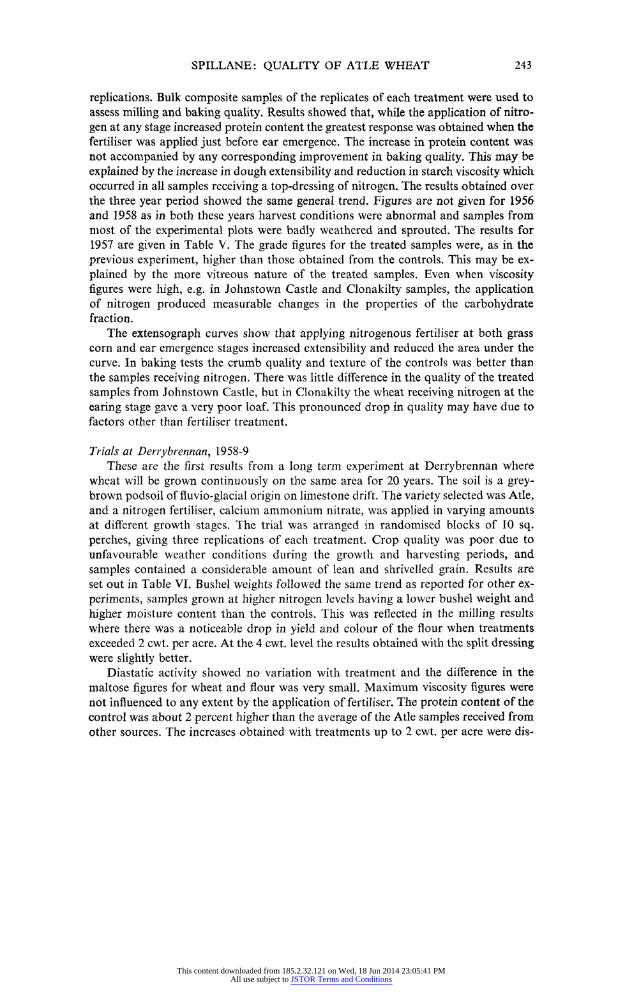
SPILLANE: QUALITY OF ATLE WHEAT 243
replications. Bulk composite samples of the replicates of each treatment were used to assess milling and baking quality. Results showed that, while the application of nitro
gen at any stage increased protein content the greatest response was obtained when the
fertiliser was applied just before ear emergence. The increase in protein content was
not accompanied by any corresponding improvement in baking quality. This may be
explained by the increase in dough extensibility and reduction in starch viscosity which occurred in all samples receiving a top-dressing of nitrogen. The results obtained over
the three year period showed the same general trend. Figures are not given for 1956 and 1958 as in both these years harvest conditions were abnormal and samples from
most of the experimental plots were badly weathered and sprouted. The results for 1957 are given in Table V. The grade figures for the treated samples were, as in the
previous experiment, higher than those obtained from the controls. This may be ex
plained by the more vitreous nature of the treated samples. Even when viscosity
figures were high, e.g. in Johnstown Castle and Clonakilty samples, the application of nitrogen produced measurable changes in the properties of the carbohydrate fraction.
The extensograph curves show that applying nitrogenous fertiliser at both grass corn and ear emergence stages increased extensibility and reduced the area under the
curve. In baking tests the crumb quality and texture of the controls was better than
the samples receiving nitrogen. There was little difference in the quality of the treated
samples from Johnstown Castle, but in Clonakilty the wheat receiving nitrogen at the
earing stage gave a very poor loaf. This pronounced drop in quality may have due to
factors other than fertiliser treatment.
Trials at Derrybrennan, 1958-9
These are the first results from a long term experiment at Derrybrennan where
wheat will be grown continuously on the same area for 20 years. The soil is a grey
brown podsoil of fluvio-glacial origin on limestone drift. The variety selected was Atle, and a nitrogen fertiliser, calcium ammonium nitrate, was applied in varying amounts
at different growth stages. The trial was arranged in randomised blocks of 10 sq.
perches, giving three replications of each treatment. Crop quality was poor due to
unfavourable weather conditions during the growth and harvesting periods, and
samples contained a considerable amount of lean and shrivelled grain. Results are
set out in Table VI. Bushel weights followed the same trend as reported for other ex
periments, samples grown at higher nitrogen levels having a lower bushel weight and
higher moisture content than the controls. This was reflected in the milling results where there was a noticeable drop in yield and colour of the flour when treatments exceeded 2 cwt. per acre. At the 4 cwt. level the results obtained with the split dressing were slightly better.
Diastatic activity showed no variation with treatment and the difference in the
maltose figures for wheat and flour was very small. Maximum viscosity figures were
not influenced to any extent by the application of fertiliser. The protein content of the
control was about 2 percent higher than the average of the Atle samples received from other sources. The increases obtained with treatments up to 2 cwt. per acre were dis
This content downloaded from 185.2.32.121 on Wed, 18 Jun 2014 23:05:41 PMAll use subject to JSTOR Terms and Conditions
TABLE V K Effect of nitrogen fertiliser applied at different growth stages, 1957 crop ^
- ;a
Milling Maltose2 Protein2 Maximum Extensograph S
Centre Treatment1- - - viscosity -?-?? ,__, Extraction2 Grade Wheat Flour Wheat Flour R E R/E Area O
- d
Johnstown A 73.7 3.4 1.1 1.8 10.9 10.1 800 340 155 2.2 91 2
B 73.7 3.5 1.1 2.0 11.8 11.0 700 200 200 1.0 66 ? C 72.2 3.7 1.1 1.9 12.1 11.6 930 200 200 1.0 68 p
Clonakilty A 74.0 1.3 1.1 1.5 10.0 9.4 1200 280 145 1.9 64 2
B 74.8 2.0 1.1 1.7 10.4 9.7 1150 200 165 1.2 57 \T C 74.5 3.1 1.1 1.7 11.0 10.5 880 120 175 0.7 35 g
Abbotstown3 A 73.0 4.4 1.5 2.3 10.0 9.5 130 330 155 2.1 84 ?
B 72.6 5.5 1.7 3.4 10.3 9.7 90 180 185 1.0 57 Q
_ P
1 _= A=controI; B=2 cwt. grass corn stage; C=2 cwt. ear emergence stage H
2 = Expressed as percent C
3 = Treatment C not received from this source J?
r
TABLE VI 8 Effect of varying rate and time of application of nitrogen fertiliser, Derrybrennan, 1958 >
Maltose2 Protein2 Maximum Extensograph X
Sample1 Bushel Moisture2 Extrac- Grade - - viscosity -?- \*
weight, lb. tion2 Wheat
Flour
Wheat Flour R E R/E Area q
-_-.-.-_- fH
1 51.5 22.5 65.2 6.9 1.7 2.0 14.7 13.5 265 395 185 2.1 139 ;_ 2 51.0 24.0 65.0 7.0 1.7 2.0 15.0 13.7 240 325 200 1.6 124 " 3 50.0 23.4 63.6 7.4 1.7 1.9 15.1 14.0 270 320 210 1.6 122 ? 4 51.8 23.9 65.3 7.0 1.6 1.9 15.2 13.8 240 295 210 1.4 123 P 5 47.0 24.8 63.3 8.8 1.5 2.0 17.0 15.3 225 180 225 0.8 70 ^ 6 49.0 23.8 63.8 8.0 1.8 1.9 16.2 14.7 250 225 185 1.2 108 -
vo _ ON
1 ? A basal dressing of 2 cwt. superphosphate and 1 cwt. potash was combined drilled at sowing. Nitrogen was applied as follows:?Sample 1, control; Sample 2, 1 cwt. at sowing; Sample 3, 1 cwt. at sowing and at grass cornstage2; Sample 4, 2 cwt. at sowing; Sample 5, 2 cwt. at sowing and at grass corn stage; Sample 6, 4 cwt. at sowing.
2 = Expressed as percent
This content downloaded from 185.2.32.121 on Wed, 18 Jun 2014 23:05:41 PMAll use subject to JSTOR Terms and Conditions
SPILLANE: QUALITY OF ATLE WHEAT 245
appointing, but at the 4 cwt. level the response was similar to that obtained in other
parts of the country. A greater increase in protein was obtained by the application of
a split dressing of 2 cwt. (sample 5) than with a single dressing of 4 cwt. at sowing. The extensograph curves showed that nitrogen had a normal, if less pronounced, effect
on dough quality. The application of up to 2 cwt. of fertiliser had little effect on baking quality but there was a noticeable deterioration at the 4 cwt. level. Bread from samples
1, 2, 3 and 4 was similar in character, with scores lying between 9.5 and 10.2. Sample 5
gave a very poor loaf (score 6.1), while the bread from No. 6 was somewhat better with a score of 8.3. Loaf volumes were similar, and except for sample 5, deviation from
the average (2160 c.c.) was small.
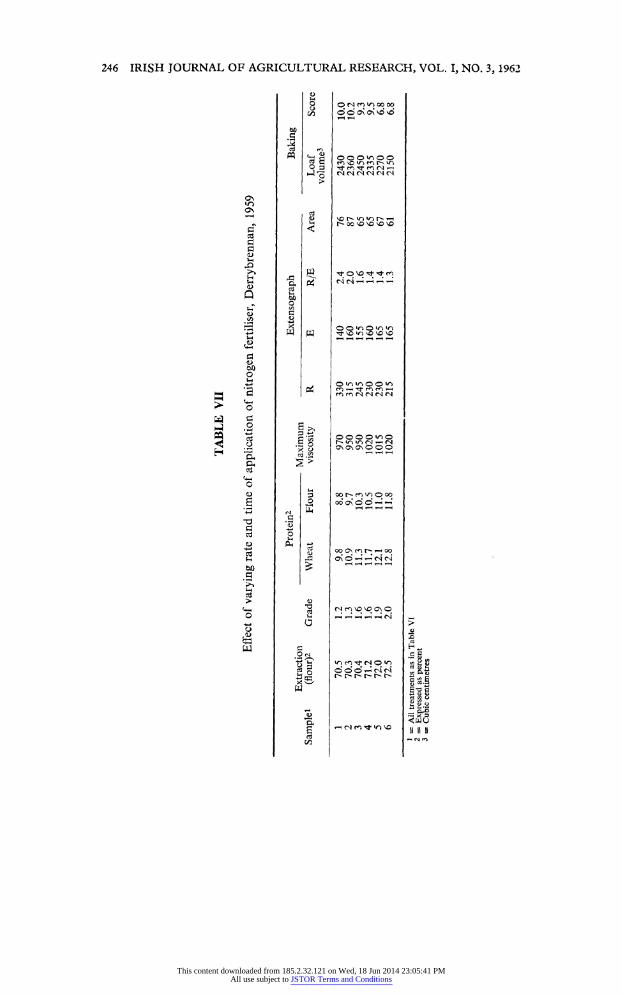
The results for the 1959 trials are given in Table VII. The weather during the ripen ing period was unusually hot and dry and the quality of the crop was well above the
average for wheat harvested in this country. Bushel weights were high (averaging 66.7 lb.) and moisture content very low (averaging 16.5 percent). The properties of the
grain and, to some extent, the action of the fertiliser were influenced by the unusual
environmental conditions. Maltose figures (not given in Table VII), were low and showed no variation with treatment. The average for wheat was 1.0 percent and for
flour 1.8 percent. Maximum viscosity figures were very high and were not affected to
any extent by treatment. There was a slight increase at the higher nitrogen levels
instead of the reduction normally observed. The extensograph curves followed the same pattern as in 1958, but the area under the curve was considerably smaller for all
samples, due probably, to the lower protein contents. There was a noticeable deteriora
tion in baking quality at the higher treatment levels. This could not be correlated with the analytical data and no adequate explanation can be offered at this stage of the
investigation.
Effect of applied nitrogen on varietal characteristics The trials reported showed the comparative effects of nitrogenous top-dressing on
some of the properties of Atle and other varieties under Irish climatic conditions. The work to date on the quality of different wheat varieties grown under Irish conditions has emphasised the importance of the carbohydrate fraction and the influence of environment on starch quality and enzyme activity. Varieties which give excellent results when grown under high fertility conditions in countries like Sweden may be
quite unsatisfactory for use as bread-making wheats when grown in Ireland. The faults
are associated more with the starch than with the protein fraction and it appears that the varieties which have poor quality starch or high enzyme activity are also less tolerant to nitrogen fertilising. Figures are given for six varieties grown in 1956 when the weather at harvest was mild and wet. The trend was similar but less pronounced
in 1959 when the grain was harvested under ideal conditions. 1956 crop
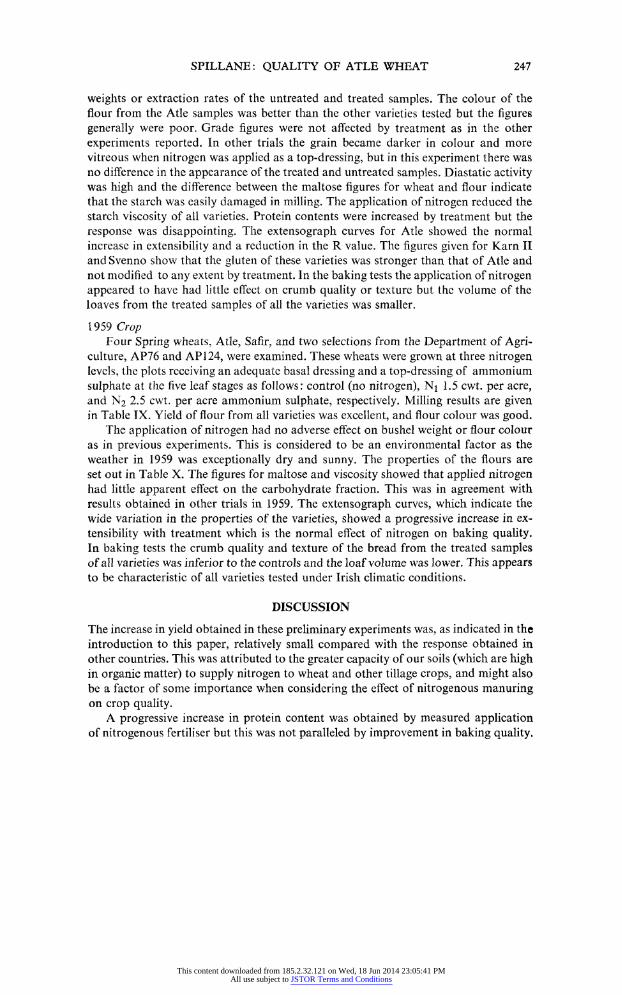
Varieties tested were Atle, Atson, Svenno, Karn II, Koga II and Peko. All samples received an adequate basal dressing while the treated samples received in addition 2 cwt. ammonium sulphate at the ear emergence stage. The milling results and prop
erties of the flours are given in Table VIII. There was little difference in the bushel
This content downloaded from 185.2.32.121 on Wed, 18 Jun 2014 23:05:41 PMAll use subject to JSTOR Terms and Conditions
ISJ 4^ 0\ 3 ?( G/3 *-H o d
TABLE vn r
o
Effect of varying rate and time of application of nitrogen fertiliser, Derrybrennan, 1959 >
O
I I II I M , I I. ,--? , , I , ? , . I - I . ... - II II I , HH
Protein2 Extensograph Baking C
Extraction - Maximum- ?]
Sample1 (flour)2 Grade Wheat Flour viscosity R E R/E Area Loaf Score *3
volume3 g
1 70.5 1.2 9.8 8.8 970 330 140 2.4 76 2430 10.0 r 2 70.3 1.3 10.9 9.7 950 315 160 2.0 87 2360 10.2 w
3 70.4 1.6 11.3 10.3 950 245 155 1.6 65 2450 9.3 W 4 71.2 1.6 11.7 10.5 1020 230 160 1.4 65 2335 9.5 2} 5 72.0 1.9 12.1 11.0 1015 230 165 1.4 67 2270 6.8 > 6 72.5 2.0 12.8 11.8 1020 215 165 1.3 61 2150 6.8 ja
______ _____________ ^__^_________ Ci
1 ?= All treatments as in Table VI ? 2 = Expressed as percent <J 3 s= Cubic centimetres Q
r p I-* vO o\
This content downloaded from 185.2.32.121 on Wed, 18 Jun 2014 23:05:41 PMAll use subject to JSTOR Terms and Conditions
SPILLANE: QUALITY OF ATLE WHEAT 247
weights or extraction rates of the untreated and treated samples. The colour of the
flour from the Atle samples was better than the other varieties tested but the figures generally were poor. Grade figures were not affected by treatment as in the other
experiments reported. In other trials the grain became darker in colour and more
vitreous when nitrogen was applied as a top-dressing, but in this experiment there was
no difference in the appearance of the treated and untreated samples. Diastatic activity was high and the difference between the maltose figures for wheat and flour indicate that the starch was easily damaged in milling. The application of nitrogen reduced the
starch viscosity of all varieties. Protein contents were increased by treatment but the
response was disappointing. The extensograph curves for Atle showed the normal
increase in extensibility and a reduction in the R value. The figures given for Karn II and Svenno show that the gluten of these varieties was stronger than that of Atle and
not modified to any extent by treatment. In the baking tests the application of nitrogen appeared to have had little effect on crumb quality or texture but the volume of the loaves from the treated samples of all the varieties was smaller.
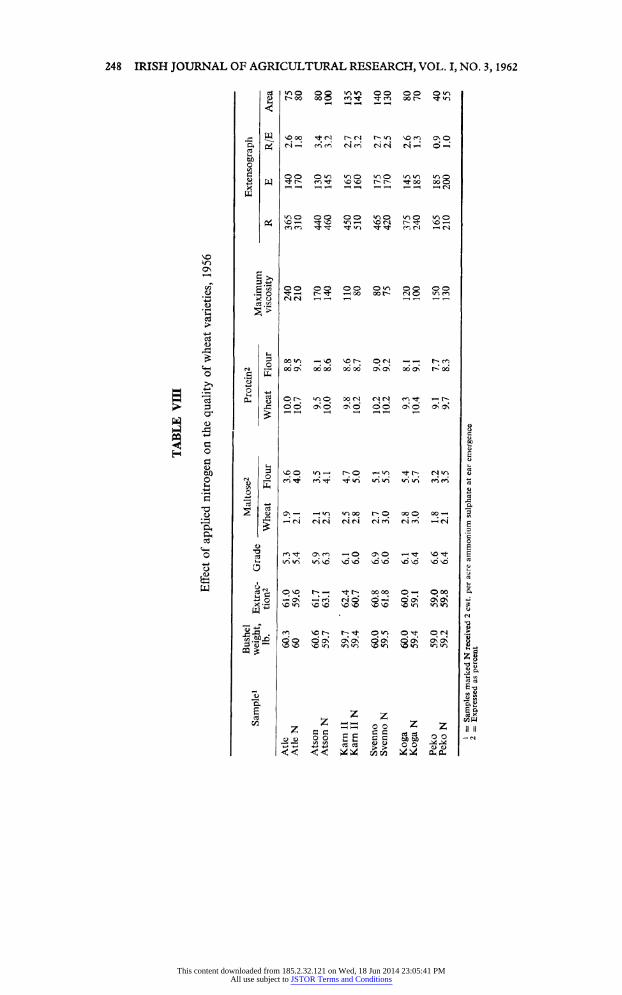
1959 Crop Four Spring wheats, Atle, Safir, and two selections from the Department of Agri
culture, AP76 and API24, were examined. These wheats were grown at three nitrogen
levels, the plots receiving an adequate basal dressing and a top-dressing of ammonium
sulphate at the five leaf stages as follows: control (no nitrogen), Ni 1.5 cwt. per acre,
and N2 2.5 cwt. per acre ammonium sulphate, respectively. Milling results are given
in Table IX. Yield of flour from all varieties was excellent, and flour colour was good.
The application of nitrogen had no adverse effect on bushel weight or flour colour as in previous experiments. This is considered to be an environmental factor as the
weather in 1959 was exceptionally dry and sunny. The properties of the flours are
set out in Table X. The figures for maltose and viscosity showed that applied nitrogen had little apparent effect on the carbohydrate fraction. This was in agreement with
results obtained in other trials in 1959. The extensograph curves, which indicate the wide variation in the properties of the varieties, showed a progressive increase in ex
tensibility with treatment which is the normal effect of nitrogen on baking quality. In baking tests the crumb quality and texture of the bread from the treated samples of all varieties was inferior to the controls and the loaf volume was lower. This appears
to be characteristic of all varieties tested under Irish climatic conditions.
DISCUSSION
The increase in yield obtained in these preliminary experiments was, as indicated in the introduction to this paper, relatively small compared with the response obtained in other countries. This was attributed to the greater capacity of our soils (which are high in organic matter) to supply nitrogen to wheat and other tillage crops, and might also
be a factor of some importance when considering the effect of nitrogenous manuring on crop quality.
A progressive increase in protein content was obtained by measured application
of nitrogenous fertiliser but this was not paralleled by improvement in baking quality.
This content downloaded from 185.2.32.121 on Wed, 18 Jun 2014 23:05:41 PMAll use subject to JSTOR Terms and Conditions
-fe. 00 GO a
TABLE Vffl o
G
Effect of applied nitrogen on the quality of wheat varieties, 1956 g
-o
Bushel Maltose2 Protein2 Extensograph ^
Sample1 weight, Extrac- Grade- Maximum - n
lb. tion2 Wheat Flour Wheat Flour viscosity R E R/E Area %}
Atle 60.3 61.0 5.3 1.9 3.6 10.0 8.8 240 365 140 2.6 75 Q AtleN 60 59.6 5.4 2.1 4.0 10.7 9.5 210 310 170 1.8 80 p
H
Atson 60.6 61.7 5.9 2.1 3.5 9.5 8.1 170 440 130 3.4 80 G
Atson N 59.7 63.1 6.3 2.5 4.1 10.0 8.6 140 460 145 3.2 100 ?>
Karn II 59.7 " 62.4 6.1 2.5 4.7 9.8 8.6 110 450 165 2.7 135 ? Karn UN 59.4 60.7 6.0 2.8 5.0 10.2 8.7 80 510 160 3.2 145 gj Svenno 60.0 60.8 6,9 2.7 5.1 10.2 9.0 80 465 175 2.7 140 W Svenno N 59.5 61.8 6.0 3.0 5.5 10.2 9.2 75 420 170 2.5 130 g
Koga 60.0 60.0 6.1 2.8 5.4 9.3 8.1 120 375 145 2.6 80 &J
Koga N 59.4 59.1 6.4 3.0 5.7 10.4 9.1 100 240 185 1.3 70 ^ Peko 59.0 59.0 6.6 1.8 3.2 9.1 7.7 150 165 185 0.9 40 ? Peko N 59.2 59.8 6.4 2.1 3.5 9.7 8.3 130 210 200 1.0 55 ^
- ^
1 = Samples marked N received 2 cwt. per acre ammonium sulphate at ear emergence q
2 = Expressed as percent .
3 ON
This content downloaded from 185.2.32.121 on Wed, 18 Jun 2014 23:05:41 PMAll use subject to JSTOR Terms and Conditions
TABLE IX Effect of different amounts of nitrogen on milling quality of wheat varieties, 1959
Bushel weight, lb.1 Extraction2 Grade
Variety - ?? ?--??
Control Nx N2 Control N, N2 Control Ni N2 Atle 66.0 66.0 66.0 72.0 71.8 71.8 2.3 2.4 2.3 Safir 66.0 66.4 66.5 71.0 71.3 72.0 1.8 1.6 2.0 oo
Selection 76 65.8 66.0 66.0 72.0 72.6 72.6 1.8 2.0 2.0 2 Selection 124 65.6 66.0 66.0 71.4 72.0 72.0 2.0 2.2 2.3 r
_ _r
-,?-^
1 = Treatment Ni = 1.5 cwt., and N2=2.5 cwt. per acre ammonium sulphate 2
2 = Expressed as percent ?j
TABLE X O Effect of applied nitrogen on the quality of wheat varieties^ 1959 r
-:- 3
Maltose2 Protein2 Maximum Extensograph Baking ^
Variety Treatment1 - ?-viscosity ?- - O
Wheat Flour Wheat Flour R E R/E Area Loaf Score *fl
volume3
>
-,- i-3
Atle Control 1.0 1.7 11.8 11.0 1050 320 160 2.0 90 2350 10.0 r
Ni 1.0 1.7 12.5 11.5 1100 260 180 1.4 95 2340 9.0 w N2 1.0 1.6 13.0 11.9 1100 210 190 1.1 76 2280 8.4 ^
Safir Control 1.1 1.8 11.8 11.1 1140 220 160 1.4 56 2270 7.8 tfl
N, 1.1 2.0 12.5 11.4 1140 200 180 1.1 62 1130 6.0 > N2 1.0 2.0 13.2 12.1 1140 180 185 1.0 50 2110 6.3 H
Selection 76 Control 1.0 1.6 10.7 10.0 980 300 160 1.9 75 2280 9.0
Nx 1.0 1.6 11.2 10.4 1020 300 180 1.7 90 2230 8.5 N2 1.0 1.7 12.0 11.1 1000 250 185 1.4 85 2160 7.0
Selection 124 Control 1.0 1.5 11.4 10.3 1050 200 160 1.3 50 2290 8.0
Nt 1.0 1.6 12.0 11.0 1050 180 200 0.9 50 2180 7.0 N2 1.1 1.6 12.4 11.5 1050 150 180 0.8 42 2120 6.2
______________________?^???^?~?^?^~?^?.^??-,-? 4^
1 = Treatments as in Table IX ^ 2 ?= Expressed as percent 3 s? Cubic centimetres
This content downloaded from 185.2.32.121 on Wed, 18 Jun 2014 23:05:41 PMAll use subject to JSTOR Terms and Conditions
250 IRISH JOURNAL OF AGRICULTURAL RESEARCH, VOL. I, NO. 3,1962
In some cases increase in protein content was associated with a drop in baking quality
which may be partly explained by the lower flour viscosity and increased enzyme activity of the treated samples. It would appear that greater changes are produced in
the carbohydrate than in the protein fraction by nitrogen manuring. The result ob
tained on the 1959 crop samples show that other factors may also be involved. The weather during the ripening and harvesting period was hot and dry, and flour viscosity
figures were remarkably high for wheat grown in Ireland. There was no apparent
change in the quality of the starch, and little modification of the protein fraction with the application of nitrogen, nevertheless baking quality was adversely affected. In all
cases loaf volume was smaller and crumb quality inferior to the controls. No adequate
explanation can be offered at this stage of the investigation for these results.
Ti me of fertiliser application is of some importance, and the greatest increase in
protein content was obtained by fertilising at the stage of ear emergence. A top
dressing at the 4 or 5 leaf stage seems to have a more depressing effect on baking quality than when applied earlier or later. The use of slow-acting fertiliser which could be applied in adequate amounts at sowing might be the answer to some of our prob lems. It would appear that the equivalent of 2 cwt. of ammonium sulphate, which
gives the greatest agronomic advantage, represents a maximum dressing for quality
response. Under some conditions of soil and climate this quantity may be excessive,
and with increased emphasis on grassland improvement, reassessment may be neces
sary in the near future. The introduction of a variety capable of tolerating a higher
level of nitrogen might be the ideal solution. Atle, the only wheat of commercial
importance in Ireland, is not considered a suitable variety for cultivation under con
diti ons of hgh fertility. The datai presented indicate the nature and scope of this preliminary investigation
into the effect of nitrogenous fertilisers on the quality of wheat grown under Irish climatic conditions. There is an obvious necessity for further experimental work cover
ing more variables. The findings of the National Soil Survey could be of considerable
help in evaluating the effect of the soil factor on this rather complex problem.
ACKNOWLEDGMENTS
The author wishes to thank the Director of the Institute for Industrial Research and Standards, Dublin, for permission to publish results of the investigation from 1956-1959; Mr. P. F. Ryan, Chief Soils Division, An Foras Taluntais; Mr. J. J.
Brady, Department of Agriculture, who supplied most of the samples for this work from their field trials; and the staff of the Cereal Chemistry Department, particularly
Miss H. McGovern, Miss K. McGrath and Miss E. Cooper.
REFERENCES
1. Ryan, P. F., J. Dept. Agric, Ireland, 57: 117, 1960. 2. Masterson, C, Agrochimica, 5(3): 246, 1961. 3. Brady, J. J., /. Dept. Agric, Ireland, 55: 1958-1959. 4. Bullen, E. R. and Lessells, W. J., /. Agric Sci., 49(3): 1957. 5. Walsh, T., Ryan, P. F. and Kilroy, J., /. Statist. Social Inquiry, Ireland, 19: 104, 1956-7.
Received February 14, 1962
This content downloaded from 185.2.32.121 on Wed, 18 Jun 2014 23:05:41 PMAll use subject to JSTOR Terms and Conditions