Embed Size (px)
Citation preview
MSc Thesis Human Nutrition
The effect of protein-enriched products on protein intake and functional status of older adults after hospital discharge: The Cater with Care effect study
Merel Snellen
June 2015
The effect of protein-enriched products on protein intake and functional status of older adults after
hospital discharge: The Cater with Care effect study
HNE-80936 Thesis Human Nutrition
January 2015 – June 2015
Student: Merel Snellen Registration number: 870929-781-020 Main supervisor: Dr. ir. NM de Roos Division of Human Nutrition Wageningen University, The Netherlands Daily supervisor: J Beelen, MSc
Division of Human Nutrition Wageningen University, The Netherlands
Examiner: Prof. dr. ir. EJM Feskens Professor in Nutrition and Health over the Lifecourse
Division of Human Nutrition Wageningen University, The Netherlands
This MSc Thesis report is not an official publication of the Division of Human Nutrition of Wageningen University ©

Preface
This thesis was written as a part of the two-year master’s programme Nutrition and Health at
Wageningen University. From January 2015 until June 2015 I studied the effect of protein-enriched Cater
with Care products on the protein intake and functional status of older adults. This was done as part of
the Cater with Care effect study, performed in a collaboration between Hospital Gelderse Vallei, Ede and
Wageningen University.
The choice for conducting my thesis within the Cater with Care project was mostly driven by my
background in Nutrition and Dietetics. Having worked as a dietitian in elderly care has taught me much
about the challenges in improving the dietary intake of older, and often vulnerable, individuals.
I believe that the Cater with Care project is a relevant initiative to optimize nutritional care for elderly
patients in the nearby future.
I can say I feel proud of this thesis as the final result of six months of hard work. The process of finishing
this thesis was not always easy and there certainly were some ups and downs along the way.
Nevertheless, I believe that the knowledge and experience gained during this process forms a solid base
for my future career in nutrition research.
I would like to thank my main supervisor Nicole de Roos and my daily supervisor Janne Beelen for their
positive guidance, relevant feedback and support. Thank you both for making me feel like a true member
of the Cater with Care team.
Furthermore, I would like to thank all other students who were part of the Cater with Care project. Anne,
Emilie, Myrte, Rick and Cora: it was fun working together as a team. Thank you for your tips and support.
Also, I would like to thank Astrid and Renske, for their calming words, laughter and relevant advice.
Finally, my gratitude goes out to all participants of the Cater with Care effect study. I was truly amazed by
their high level of motivation to participate in the study, even though this was not always easy due to
health reasons. Furthermore, I appreciate their willingness to share personal information and to undergo
several measurements in order to contribute to a successful completion of the Cater with Care effect
study.
Merel Snellen
Wageningen, June 2015
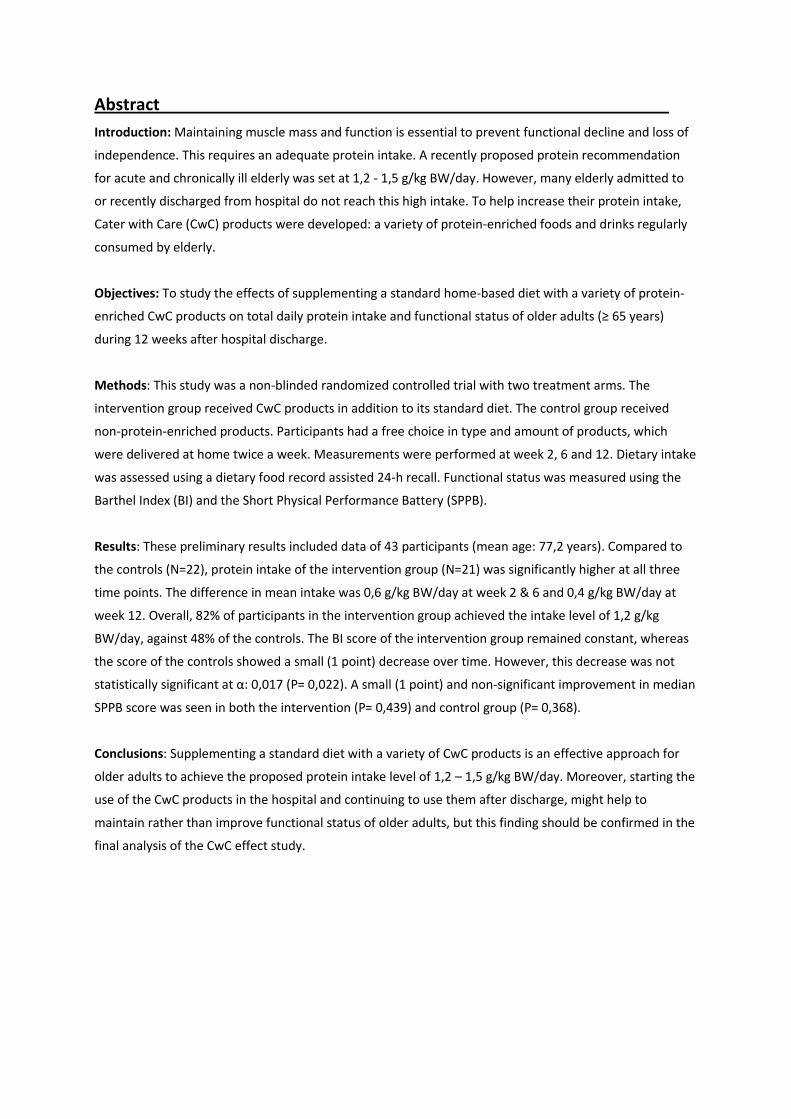
Abstract
Introduction: Maintaining muscle mass and function is essential to prevent functional decline and loss of
independence. This requires an adequate protein intake. A recently proposed protein recommendation
for acute and chronically ill elderly was set at 1,2 - 1,5 g/kg BW/day. However, many elderly admitted to
or recently discharged from hospital do not reach this high intake. To help increase their protein intake,
Cater with Care (CwC) products were developed: a variety of protein-enriched foods and drinks regularly
consumed by elderly.
Objectives: To study the effects of supplementing a standard home-based diet with a variety of protein-
enriched CwC products on total daily protein intake and functional status of older adults (≥ 65 years)
during 12 weeks after hospital discharge.
Methods: This study was a non-blinded randomized controlled trial with two treatment arms. The
intervention group received CwC products in addition to its standard diet. The control group received
non-protein-enriched products. Participants had a free choice in type and amount of products, which
were delivered at home twice a week. Measurements were performed at week 2, 6 and 12. Dietary intake
was assessed using a dietary food record assisted 24-h recall. Functional status was measured using the
Barthel Index (BI) and the Short Physical Performance Battery (SPPB).
Results: These preliminary results included data of 43 participants (mean age: 77,2 years). Compared to
the controls (N=22), protein intake of the intervention group (N=21) was significantly higher at all three
time points. The difference in mean intake was 0,6 g/kg BW/day at week 2 & 6 and 0,4 g/kg BW/day at
week 12. Overall, 82% of participants in the intervention group achieved the intake level of 1,2 g/kg
BW/day, against 48% of the controls. The BI score of the intervention group remained constant, whereas
the score of the controls showed a small (1 point) decrease over time. However, this decrease was not
statistically significant at α: 0,017 (P= 0,022). A small (1 point) and non-significant improvement in median
SPPB score was seen in both the intervention (P= 0,439) and control group (P= 0,368).
Conclusions: Supplementing a standard diet with a variety of CwC products is an effective approach for
older adults to achieve the proposed protein intake level of 1,2 – 1,5 g/kg BW/day. Moreover, starting the
use of the CwC products in the hospital and continuing to use them after discharge, might help to
maintain rather than improve functional status of older adults, but this finding should be confirmed in the
final analysis of the CwC effect study.
Table of contents Preface ______________________________________________________________________________ 1
Abstract _____________________________________________________________________________ 2
1. Introduction ________________________________________________________________________ 4
2. Materials and methods _______________________________________________________________ 7
2.1 Study design _______________________________________________________________________ 7
2.2 Participants _____________________________________________________________________ 7
2.2.1 Inclusion and exclusion criteria ___________________________________________________ 8
2.2.2 Randomization and blinding _____________________________________________________ 8
2.3 Nutritional intervention ____________________________________________________________ 9
2.4 Study parameters ________________________________________________________________ 10
2.4.1 Protein intake _______________________________________________________________ 10
2.4.1.1. Relative contribution of different food groups and CwC products to total protein intake 10
2.4.2 Functional status _____________________________________________________________ 11
2.4.2.1 Barthel index ____________________________________________________________ 11
2.4.2.2 Short physical performance battery __________________________________________ 11
2.4.3 Other outcome measures ______________________________________________________ 12
2.5 Sample size calculation ___________________________________________________________ 13
2.6 Statistical analysis _______________________________________________________________ 14
3. Results ___________________________________________________________________________ 15
3.1 Study population ________________________________________________________________ 15
3.1.1 Body weight, BMI and MNA score during follow-up____________________________________ 17
3.2 Protein intake ___________________________________________________________________ 18
3.2.1 Daily protein intake at week 2, 6 and 12 __________________________________________ 18
3.2.2 Daily protein intake levels compared to the recommendations ________________________ 19
3.2.3 Relative contribution of different food groups to the total protein intake ________________ 20
3.2.4 Relative contribution of the Cater with Care products to the total protein intake __________ 21
3.3 Daily energy intake at week 2, 6 and 12 ______________________________________________ 22
3.3.1 Oral nutritional supplements ___________________________________________________ 23
3.4 Functional status ________________________________________________________________ 24
3.4.1 Barthel Index ________________________________________________________________ 24
3.4.2 Short Physical Performance Battery ______________________________________________ 26
3.4.3 Association between Barthel Index and Short Physical Performance Battery ______________ 28
4. Discussion and conclusion ____________________________________________________________ 29
References __________________________________________________________________________ 32
Appendices __________________________________________________________________________ 35
Appendix I: Cater with Care products assortment and nutritional content ___________________ 35
Appendix II: Control products assortment and nutritional content __________________________ 38
Appendix III: Dietary food record ____________________________________________________ 40
Appendix IV: Barthel Index questionnaire ______________________________________________ 47
Appendix V: Instructions and scoring criteria Short Physical Performance Battery ______________ 48
Appendix VI: Previous studies reporting mean daily protein intake levels of older adults admitted to
the hospital or recently discharged from the hospital __________________________ 56
Appendix VII: Tests for normality _____________________________________________________ 57
Appendix VIII: Body weight, BMI and MNA score of study population at week 2, 6 and 12. ________ 59
Appendix IX: Proportion of participants achieving the recommended protein intake levels _______ 60
Appendix X: Relative contribution of different food groups to total protein intake. _____________ 61
Appendix XI: Daily protein and energy intake after excluding participants using ONS. ___________ 62
Appendix XII: Change in BI score and SPPB score between different time points in both groups. ___ 63
4
1. Introduction
The number of older adults within our society is rapidly increasing. In the year 2012 the Dutch population
consisted of 2,7 million people aged 65 years and above. This number is estimated to increase to 4,7
million people in 2040, accounting for 26% of the total population [1]. In accordance with Dutch
government policy the vast majority of this older population will be living independently, for which an
optimal health status is an important criterion [1]. However, as people get older they often face multiple
chronic diseases and physiological changes that have a negative effect on food intake and thereby
increase the risk of undernutrition [2]. Undernutrition is an important problem in the Netherlands,
particularly among hospitalized older adults. Depending on the definition used the prevalence is
estimated to be 18 or 33% [3]. A poor nutritional status is associated with several adverse clinical
outcomes such as an impaired immune function, delayed wound healing and prolonged treatment
duration [4]. Moreover, as a result of an inadequate dietary intake combined with reduced physical
activity, older adults are prone to develop sarcopenia [5]. Sarcopenia is defined as the age-related loss of
skeletal muscle mass and function, which increases the risk of falls, mobility disorders and difficulties in
performing activities of daily living (ADL) [4-6]. This decline in functionality subsequently reduces the
independence and quality of life of older individuals [7].
An adequate dietary protein intake plays an important role in the prevention and management of
undernutrition and sarcopenia. It is believed that muscle mass and function of older adults is better
maintained with a protein intake at a higher level than the current recommended dietary allowance (RDA)
of 0,8 grams per kilogram body weight per day (g/kg BW/day) [8, 9]. The need for more dietary protein is
partly due to an age-related decline in anabolic response to the ingested protein [8, 9]. For this reason,
the PROT-AGE study group recently recommended a daily intake as high as 1,2 – 1,5 g/kg BW/day for
older individuals suffering from acute or chronic diseases [8]. However, studies show that the intake of
hospitalized and recently discharged older adults averages 0,9 g/kg BW/day, which is well below the
levels as recommended by the PROT-AGE group (unpublished data in Master Thesis Joyce van Geel, 2014)
[10, 11].
In general, it is difficult for elderly people to simply increase the amount of food they consume in
order to obtain a sufficient protein intake. Many experience a loss of appetite due to physiological
changes such as impaired senses of taste and smell and increased satiation signals [2, 12, 13]. This
situation is worsened when they are acute or chronically ill and suffer from side effects of medication,
poor dentition, functional disabilities or social isolation and depression [2, 12, 13]. Consequently, when an
adequate protein intake is not achieved through regular foods, often oral nutritional supplements (ONS)
are advised [12, 14]. However, compliance for ONS is generally poor because of a low palatability,
negative effects on satiety and gastrointestinal side effects [12, 14, 15].
5
To overcome elderly’s difficulties in consuming enough protein, enriching products they are used to
consume within their daily menu might be an effective alternative. For this reason, the Cater with Care
consortium developed a variety of protein-enriched regular foods, such as bread, beverages and soups,
tailored to the needs and preferences of elderly people [16]. The effectiveness of these products in
increasing the dietary protein intake of older adults at risk of undernutrition will be assessed in the Cater
with Care effect study.
Recently, a trial by Stelten et al. [10] already found promising short-term results for protein-enriched
regular foods in acute hospitalized elderly patients. In this study, supplementing a standard hospital menu
with protein-enriched bread and drinking yoghurt, resulted in a mean protein intake of 1,1 g/kg BW/day
in the intervention group compared to 0,9 g/kg BW/day in the control group [10]. Despite this improved
mean intake, still the majority (64%) of patients in the intervention group failed to meet the
recommended intake level of 1,2 g/kg BW/day. Moreover, Stelten and colleagues did not yet examine
whether a longer-term use of the products also resulted in a better clinical outcome. Therefore, the
recent Cater with Care effect study wants to examine whether continuing to use a variety of protein-
enriched regular products after hospital discharge, improves the functional recovery of older individuals.
Physical function of elderly people is commonly measured in terms of mobility, endurance or activities
of daily living (ADL) [8]. Preservation of independence in ADL is one of the most important goals of
(medical) treatment of older persons [17]. Next to that, it is an important determinant of quality of life
[7]. To assess ADL, the Barthel Index (BI) [18] is often used. This is an easy to apply self-report instrument
to evaluate a patient’s level of independence in 10 items of basic ADL, including: feeding, bathing,
mobility and transfers [19]. Until now, only a few studies have been published on the effects of dietary
protein supplementation on the BI score of older individuals. Besides, most trials used protein
supplementation in the form of ONS. For example, McMurdo and colleagues [20] supplied a liquid
formula containing 40 grams of dietary protein to undernourished older adults upon hospital discharge.
Unfortunately, after a 16-week study period no significant effect on change in BI score was found. This
was also the case for the studies of Wouters-Wesseling et al. [21] and Smoliner et al. [22]. In a more
recent trial by Lee et al. [23], the use of a liquid supplement containing 9,5 grams of soy-protein did result
in a significant improvement in BI score of geriatric nursing home residents. However, the effect was only
seen after 24 weeks and when adjusting for baseline nutritional status using Generalized Estimating
Equations (GEE).
The limited effects found within these studies, might be the result of different factors. First of all, three
of the studies [21-23] were conducted in nursing home residents, of which some were very old (mean
age: 85 years) and suffering from dementia [21]. Since disabilities in ADL may have been one of the causes
of nursing home admission, improvement in the BI score of this population seems unlikely. Moreover, in
the study of Wouters-Wesseling et al. [21] participants had a median BI score of 5 on a 20-point scale at
baseline. Since the sensitivity of the BI is affected by so called “floor and ceiling effects” [24] [25], a (small)
change in the ADL-independence of this already severely dependent study population might have gone
undetected. Finally, the BI being a self-report measure of physical function, might play a role. Self-report
measures reflect people’s perception of their ability to (independently) perform a task [26]. These often
6
called ‘subjective’ measures may be inaccurate when people over- or underestimate their capabilities
[27]. In contrast to self-report measures, performance-based measures of physical function examine
people’s ability by observing their physical performance [26]. In early studies these measures were found
to have a better reproducibility and greater sensitivity to change [28, 29]. Next to that, they were
considered to be less influenced by external factors such as poor cognition and education [28, 29]. For this
reason, performance-based measures are sometimes described as being a more objective and valid
method to assess physical function in elderly people [27]. That this is not always the case was shown in a
recent study by Latham et al. [30]: they did not find the psychometric properties of performance-based
measures to be better than those of self-report measures. Instead of one type of measure being superior
to the other, it is believed that they provide complementary information regarding physical functioning
[30]. In fact, a study by Volpato et al. [31] even found that a low score on a performance-based test at
hospital discharge and one month after discharge, was predictive for the level of self-reported difficulties
in ADL over a one-year follow-up period. For this reason, previous studies concluded that combining both
types of measures allows to obtain a more complete overview on functional status [27, 30].
One of the performance-based measures commonly used in elderly people is the Short Physical
Performance Battery (SPPB). The SPPB comprises a set of three objective measures of lower extremity
function: a balance test, a chair rise test and a gait speed test [29]. Its reliability and responsiveness to
change were already demonstrated in a study by Ostir et al. [32]: the SPPB had an excellent test-retest
reliability in measurements performed one week apart and a good long-term test-retest reliability in
measurements performed 6 months apart. Moreover, recent trials demonstrated that protein
supplementation in the form of ONS positively affects the SPPB score of older individuals. For example,
Tieland and colleagues [33] found a significant increase in the SPPB score (+ 1 point) of frail elderly
subjects supplied with a liquid formula containing 30 grams of protein during a 24-week study period.
Also, Kim and colleagues [34] found that, compared to the decline in the control group, the SPPB score
remained stable in frail older adults receiving a liquid formula containing 25 grams of protein during a 12-
week study period. At this point, the effect of protein-enriched regular products on the SPPB score of
elderly people, has not yet been examined.
Given these considerations, both the BI and the SPPB will be used within this thesis to assess whether
supplementing a standard home-based diet with a variety of protein-enriched regular products (Cater
with Care) improves the functional recovery of older individuals (≥ 65 years). At first, it will be examined
whether the use of the Cater with Care products increases dietary protein intake to the recommended
level of 1,2 – 1,5 g/kg BW/day. The aim is to find a between-group difference of at least 0,3 g/kg BW/day
at 12 weeks after hospital discharge. Subsequently, it will be examined whether a higher protein intake
results in a better functional status (either a greater change in BI score or SPPB score) in this three-month
post-discharge period.
7
2. Materials and methods
2.1 Study design
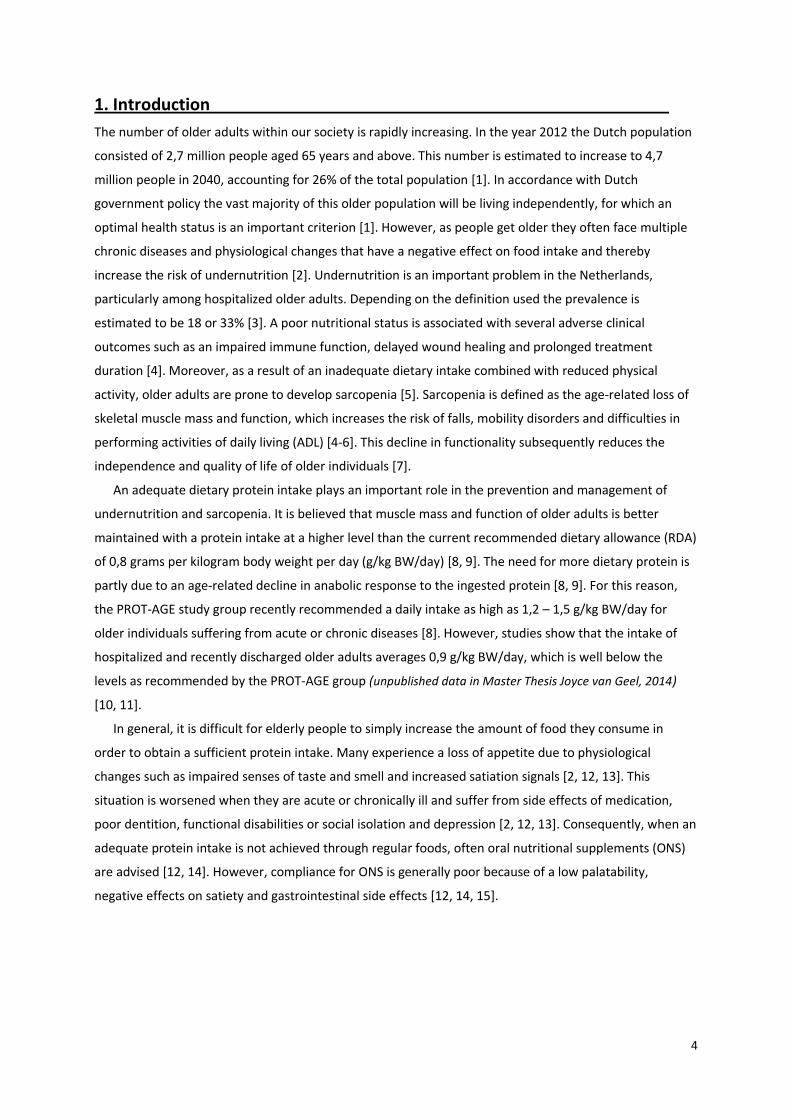
This thesis was part of the Cater with Care (CwC) effect study which started in hospital Gelderse Vallei,
Ede, the Netherlands, in October 2014 and was still being carried out at the time this manuscript was
written. The study was designed as a randomized controlled trial, consisting of two treatment arms. The
intervention group received a variety of protein-enriched CwC products in addition to its standard diet.
The control group received non-protein-enriched variants of some of the CwC products. The effect study
consisted of two phases: a hospital and a home phase. The hospital phase started within 2 days after
admission and lasted until the day of discharge. Patients received the products as part of the hospital
menu. Data were collected within the first four days after admission and on the day before discharge.
The home phase started directly after patients left the hospital. During this phase products were
delivered at home twice a week to participants in the intervention as well as the control group, but only
for the first 12 weeks. Data were collected by trained students who visited the participants at home at 2,
6 and 12 weeks after hospital discharge. In addition, a final measurement was conducted after a follow-up
phase of another 12 weeks without the investigational products (week 24). For this thesis, only the data
that were collected during the first 12 weeks after hospital discharge were used. Between-group
comparisons were made with the data collected at week 2, 6 and 12. Figure 1 gives a complete overview
of the study design.
Figure 1: Schematic overview of the study (triangles represent measurement moments, red frame marks the focus of this thesis).
2.2 Participants All elderly patients (≥ 65 years) admitted to the wards of Pulmonary medicine and Geriatric medicine of
hospital Gelderse Vallei were screened for eligibility. Those eligible on the basis of the criteria as listed in
section 2.2.1 received additional written information about the study and were asked for their consent to
participate in the hospital phase. Subsequently, participants of the hospital phase were further checked
for eligibility for the home phase. These patients were visited by a research assistant as soon as the day of
discharge was known and received additional written information and an informed consent form for the
home phase. The study was approved by the Medical Ethics Research Committee of the Wageningen
University.

8
2.2.1 Inclusion and exclusion criteria
Patients had to meet all of the following inclusion criteria for the hospital phase:
admitted to the wards of Geriatric medicine or Pulmonary medicine in hospital Gelderse Vallei;
aged 65 years or over;
eligible to receive a standard protein enriched menu based on hospital protocol;
Exclusion criteria for the hospital phase were:
unwilling to give consent for gathering data from the medical record or meal service system;
unable to understand the Dutch language
suffering from food allergies, food intolerances or other dietary restrictions that prevented the
patient from receiving the standard protein enriched menu or Cater with Care products based on
the judgement of a dietitian and/or medical staff;
expected length of hospital stay < 2 days;
suffering from renal insufficiency (eGFR < 30ml/min);
starting with tube feeding or total parenteral nutrition within 2 days after admission;
a refeeding syndrome score > 0 based on a screening tool of hospital Gelderse Vallei for refeeding
risk;
suffering from delirium at admission;
receiving palliative care.
Patients had to meet all of the following inclusion criteria for the home phase:
included in the hospital phase of the study;
signed informed consent to continue treatment and study participation after hospital discharge.
Exclusion criteria for the home phase were:
going to a nursing home, rehabilitation centre or hospice after hospital discharge;
suffering from cognitive impairment or diagnosed with dementia;
legally incapacitated.
2.2.2 Randomization and blinding
Participants were randomly assigned to either the intervention or control group by means of permuted
blocks of size four, stratified by gender and hospital department. Randomization was performed by an
independent person using statistical software. As a final check and to ensure participants’ safety, the
actual treatment assignment was done by an independent dietitian. When participants continued in the
home phase of the study they remained within the assigned treatment arm. Blinding was not possible as
the product labels and hospital menu revealed whether products were protein-enriched. Therefore, both
participants as well as researchers were aware of group assignment.
9
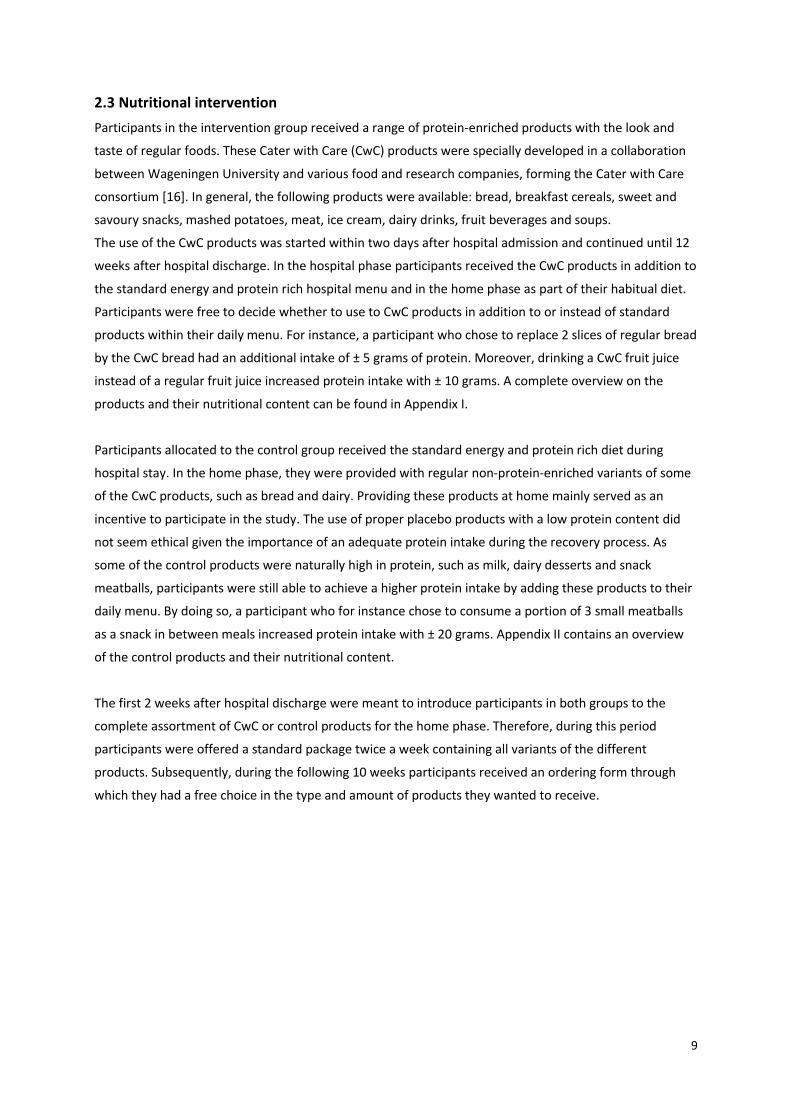
2.3 Nutritional intervention
Participants in the intervention group received a range of protein-enriched products with the look and
taste of regular foods. These Cater with Care (CwC) products were specially developed in a collaboration
between Wageningen University and various food and research companies, forming the Cater with Care
consortium [16]. In general, the following products were available: bread, breakfast cereals, sweet and
savoury snacks, mashed potatoes, meat, ice cream, dairy drinks, fruit beverages and soups.
The use of the CwC products was started within two days after hospital admission and continued until 12
weeks after hospital discharge. In the hospital phase participants received the CwC products in addition to
the standard energy and protein rich hospital menu and in the home phase as part of their habitual diet.
Participants were free to decide whether to use to CwC products in addition to or instead of standard
products within their daily menu. For instance, a participant who chose to replace 2 slices of regular bread
by the CwC bread had an additional intake of ± 5 grams of protein. Moreover, drinking a CwC fruit juice
instead of a regular fruit juice increased protein intake with ± 10 grams. A complete overview on the
products and their nutritional content can be found in Appendix I.
Participants allocated to the control group received the standard energy and protein rich diet during
hospital stay. In the home phase, they were provided with regular non-protein-enriched variants of some
of the CwC products, such as bread and dairy. Providing these products at home mainly served as an
incentive to participate in the study. The use of proper placebo products with a low protein content did
not seem ethical given the importance of an adequate protein intake during the recovery process. As
some of the control products were naturally high in protein, such as milk, dairy desserts and snack
meatballs, participants were still able to achieve a higher protein intake by adding these products to their
daily menu. By doing so, a participant who for instance chose to consume a portion of 3 small meatballs
as a snack in between meals increased protein intake with ± 20 grams. Appendix II contains an overview
of the control products and their nutritional content.
The first 2 weeks after hospital discharge were meant to introduce participants in both groups to the
complete assortment of CwC or control products for the home phase. Therefore, during this period
participants were offered a standard package twice a week containing all variants of the different
products. Subsequently, during the following 10 weeks participants received an ordering form through
which they had a free choice in the type and amount of products they wanted to receive.
10
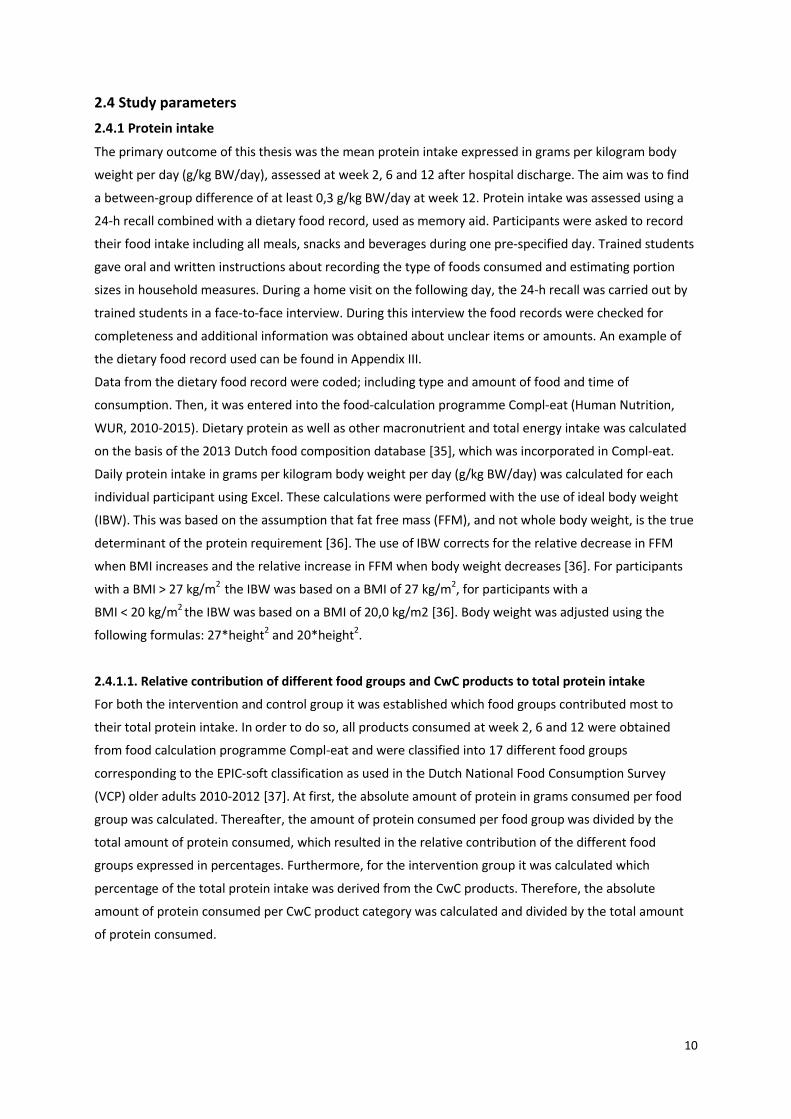
2.4 Study parameters
2.4.1 Protein intake
The primary outcome of this thesis was the mean protein intake expressed in grams per kilogram body
weight per day (g/kg BW/day), assessed at week 2, 6 and 12 after hospital discharge. The aim was to find
a between-group difference of at least 0,3 g/kg BW/day at week 12. Protein intake was assessed using a
24-h recall combined with a dietary food record, used as memory aid. Participants were asked to record
their food intake including all meals, snacks and beverages during one pre-specified day. Trained students
gave oral and written instructions about recording the type of foods consumed and estimating portion
sizes in household measures. During a home visit on the following day, the 24-h recall was carried out by
trained students in a face-to-face interview. During this interview the food records were checked for
completeness and additional information was obtained about unclear items or amounts. An example of
the dietary food record used can be found in Appendix III.
Data from the dietary food record were coded; including type and amount of food and time of
consumption. Then, it was entered into the food-calculation programme Compl-eat (Human Nutrition,
WUR, 2010-2015). Dietary protein as well as other macronutrient and total energy intake was calculated
on the basis of the 2013 Dutch food composition database [35], which was incorporated in Compl-eat.
Daily protein intake in grams per kilogram body weight per day (g/kg BW/day) was calculated for each
individual participant using Excel. These calculations were performed with the use of ideal body weight
(IBW). This was based on the assumption that fat free mass (FFM), and not whole body weight, is the true
determinant of the protein requirement [36]. The use of IBW corrects for the relative decrease in FFM
when BMI increases and the relative increase in FFM when body weight decreases [36]. For participants
with a BMI > 27 kg/m2 the IBW was based on a BMI of 27 kg/m2, for participants with a
BMI < 20 kg/m2 the IBW was based on a BMI of 20,0 kg/m2 [36]. Body weight was adjusted using the
following formulas: 27*height2 and 20*height2.
2.4.1.1. Relative contribution of different food groups and CwC products to total protein intake
For both the intervention and control group it was established which food groups contributed most to
their total protein intake. In order to do so, all products consumed at week 2, 6 and 12 were obtained
from food calculation programme Compl-eat and were classified into 17 different food groups
corresponding to the EPIC-soft classification as used in the Dutch National Food Consumption Survey
(VCP) older adults 2010-2012 [37]. At first, the absolute amount of protein in grams consumed per food
group was calculated. Thereafter, the amount of protein consumed per food group was divided by the
total amount of protein consumed, which resulted in the relative contribution of the different food
groups expressed in percentages. Furthermore, for the intervention group it was calculated which
percentage of the total protein intake was derived from the CwC products. Therefore, the absolute
amount of protein consumed per CwC product category was calculated and divided by the total amount
of protein consumed.
11
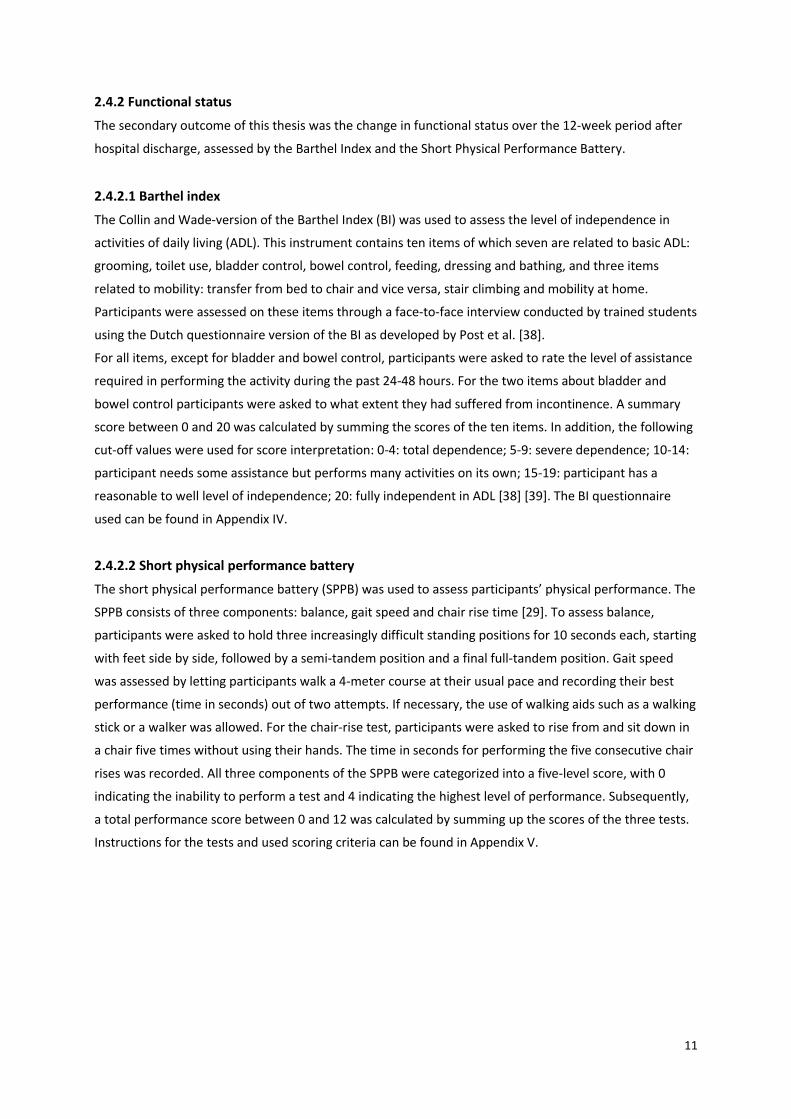
2.4.2 Functional status
The secondary outcome of this thesis was the change in functional status over the 12-week period after
hospital discharge, assessed by the Barthel Index and the Short Physical Performance Battery.
2.4.2.1 Barthel index
The Collin and Wade-version of the Barthel Index (BI) was used to assess the level of independence in
activities of daily living (ADL). This instrument contains ten items of which seven are related to basic ADL:
grooming, toilet use, bladder control, bowel control, feeding, dressing and bathing, and three items
related to mobility: transfer from bed to chair and vice versa, stair climbing and mobility at home.
Participants were assessed on these items through a face-to-face interview conducted by trained students
using the Dutch questionnaire version of the BI as developed by Post et al. [38].
For all items, except for bladder and bowel control, participants were asked to rate the level of assistance
required in performing the activity during the past 24-48 hours. For the two items about bladder and
bowel control participants were asked to what extent they had suffered from incontinence. A summary
score between 0 and 20 was calculated by summing the scores of the ten items. In addition, the following
cut-off values were used for score interpretation: 0-4: total dependence; 5-9: severe dependence; 10-14:
participant needs some assistance but performs many activities on its own; 15-19: participant has a
reasonable to well level of independence; 20: fully independent in ADL [38] [39]. The BI questionnaire
used can be found in Appendix IV.
2.4.2.2 Short physical performance battery
The short physical performance battery (SPPB) was used to assess participants’ physical performance. The
SPPB consists of three components: balance, gait speed and chair rise time [29]. To assess balance,
participants were asked to hold three increasingly difficult standing positions for 10 seconds each, starting
with feet side by side, followed by a semi-tandem position and a final full-tandem position. Gait speed
was assessed by letting participants walk a 4-meter course at their usual pace and recording their best
performance (time in seconds) out of two attempts. If necessary, the use of walking aids such as a walking
stick or a walker was allowed. For the chair-rise test, participants were asked to rise from and sit down in
a chair five times without using their hands. The time in seconds for performing the five consecutive chair
rises was recorded. All three components of the SPPB were categorized into a five-level score, with 0
indicating the inability to perform a test and 4 indicating the highest level of performance. Subsequently,
a total performance score between 0 and 12 was calculated by summing up the scores of the three tests.
Instructions for the tests and used scoring criteria can be found in Appendix V.
12
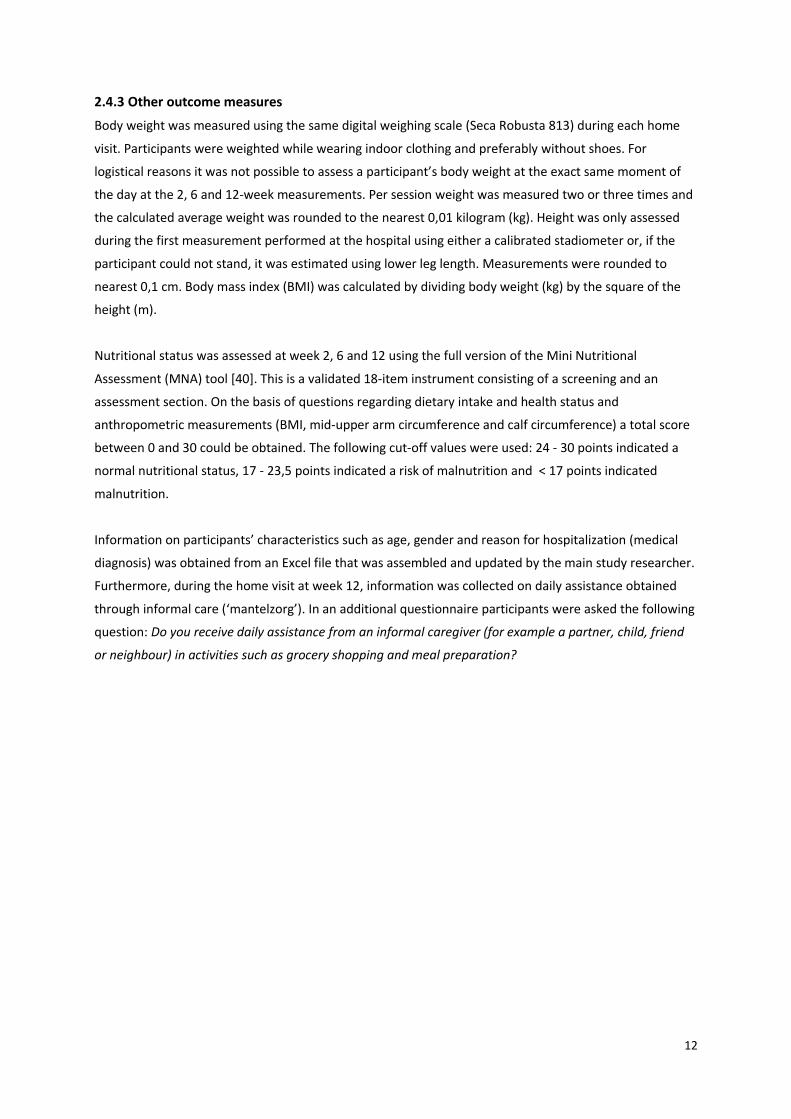
2.4.3 Other outcome measures
Body weight was measured using the same digital weighing scale (Seca Robusta 813) during each home
visit. Participants were weighted while wearing indoor clothing and preferably without shoes. For
logistical reasons it was not possible to assess a participant’s body weight at the exact same moment of
the day at the 2, 6 and 12-week measurements. Per session weight was measured two or three times and
the calculated average weight was rounded to the nearest 0,01 kilogram (kg). Height was only assessed
during the first measurement performed at the hospital using either a calibrated stadiometer or, if the
participant could not stand, it was estimated using lower leg length. Measurements were rounded to
nearest 0,1 cm. Body mass index (BMI) was calculated by dividing body weight (kg) by the square of the
height (m).
Nutritional status was assessed at week 2, 6 and 12 using the full version of the Mini Nutritional
Assessment (MNA) tool [40]. This is a validated 18-item instrument consisting of a screening and an
assessment section. On the basis of questions regarding dietary intake and health status and
anthropometric measurements (BMI, mid-upper arm circumference and calf circumference) a total score
between 0 and 30 could be obtained. The following cut-off values were used: 24 - 30 points indicated a
normal nutritional status, 17 - 23,5 points indicated a risk of malnutrition and < 17 points indicated
malnutrition.
Information on participants’ characteristics such as age, gender and reason for hospitalization (medical
diagnosis) was obtained from an Excel file that was assembled and updated by the main study researcher.
Furthermore, during the home visit at week 12, information was collected on daily assistance obtained
through informal care (‘mantelzorg’). In an additional questionnaire participants were asked the following
question: Do you receive daily assistance from an informal caregiver (for example a partner, child, friend
or neighbour) in activities such as grocery shopping and meal preparation?
13
2.5 Sample size calculation
Primary objective
A sample size calculation was performed using the primary objective of this thesis, which was to examine
the effectiveness of the CwC products on increasing the protein intake of older adults to an intake of 1,2 -
1,5 g/kg BW/day during a 12-week period after hospital discharge. The desired effect size was calculated
with the use of previous studies reporting mean daily protein intake levels of older adults admitted to the
hospital or recently discharged from the hospital. The results of these studies are summarized in Appendix
VI. Based on these results a current mean intake of 0,9 g/kg BW/day was used. The aim was to increase
protein intake to the recommended level of 1,2 g/kg BW/day at week 12 after hospital discharge,
resulting in a difference (D) of at least 0,3 g/kg BW/day. Based on the similarities in the intervention
method, namely, the use of protein-enriched regular products, a within-group standard deviation (SD) of
0,3 g/kg BW/day as reported by Stelten and colleagues [10] was chosen for the sample size calculation.
Calculations were performed using the following formula, where ‘N’ represents the number of
participants per treatment arm:
At a power level of 80% and α of 5%, this resulted in a minimum requirement of 17 participants per
treatment arm. When taking into account a 30% drop-out rate [11] a sample size of 23 participants per
treatment group at the start of the home phase was considered to be adequate.
Secondary objective
Additional calculations were done for the secondary objective of this thesis, which was to
assess whether using the CwC products resulted in a better functional status: either a greater change in
Barthel Index (BI) score or Short Physical Performance Battery (SPPB) score in the three-month post-
discharge period. To allow for a complete analysis of all the 2,6 and 12-week data before finishing this
manuscript (June 2015) the total number of 34 participants, as calculated for the primary objective,
seemed realistic. For this reason, a sample size of 17 participants per treatment group (N) was used to
calculate the expected difference (D) that could be picked up in both the BI and the SPPB.
Unfortunately, no data were published on the standard deviation (SD) of change in BI scores over time in
older adults receiving any form of nutritional supplementation. Therefore, it was decided to use data from
a study that examined the effects of intensive and non-intensive home-based rehabilitation in stroke and
hip fracture patients aged ≥ 65 years [41]. In this study, the largest reported SD of mean change from
baseline to 12 weeks after hospital discharge was 2,1 points. Using this SD in the aforementioned formula,
indicated that it would be possible to detect a true between-group difference in change not smaller than
2,1 points at a power level of 80% and α 5%. This is almost equal to the Minimal Clinically Important
Difference (MCID) of 1,85 points as reported by Hsieh et al. [42]. To be able to pick this MCID at a power
level of 80% and α 5%, a minimum of 21 participants per treatment group would be required.
In the study by Hsieh and colleagues, the MCID was established using an anchor-based method in a group
of stroke rehabilitation patients. Participants rated their perceptions of the magnitude of change in ADL-
14
independence on a 15-point Likert-type scale. The MCID corresponded to the mean change in BI score of
patients rating their independence level within the ranges of a little better to somewhat better and a little
worse to somewhat worse. Because this MCID was established in stroke patients, additional information
was searched on a relevant outcome in the BI score of older adults with other (chronic) medical
conditions. This was done in literature and by consulting a geriatric physician from hospital Gelderse
Vallei. However, as far as known, a clinically important or meaningful change in BI score has not yet been
established for this population specifically.
The same method was applied for the Short Physical Performance Battery (SPPB). Again, calculations were
based on sample size of 17 participants per treatment group. A standard deviation of change in SPPB
score over time of 1,48 points was taken from a study by Perera and colleagues [43]. Calculations with the
aforementioned formula indicated that it would be possible to detect a true between-group difference
(D) in change not smaller than 1,5 points at a power level of 80% and α 5%. In contrast: to pick up the
substantial meaningful change of 1,0 point difference in total SPPB score as reported by Perera et al. [43],
a minimum of 35 participants per treatment group would be required.
2.6 Statistical analysis
Statistical analysis was performed using Excel software and SPSS statistics 22 (SPSS Inc, Chicago, IL).
Statistical significance was set at alpha (α) 0,05. Data were analysed according to the intention-to-treat
principle. This implies that all available data of the randomized participants were incorporated into the
final analyses, regardless whether they had completed the full study. Prior to inclusion into the analyses
all variables were examined for normality by means of a Shapiro-Wilk test and visual inspection (QQ-plot).
Statistical differences in energy and protein intake between groups were analysed by independent
samples T-test in case of normally distributed data or Mann-Whitney U test in case of a non-normal
distribution. Statistical differences between proportions of participants achieving the recommended
protein intake levels were analysed by Chi-square or Fisher’s exact test. For the analysis of the BI and
SPPB, only the total scores of both instruments were used. Prior to the statistical analyses the data were
displayed in a column scatter in order to examine the distribution of the scores per group over the
different time points. Since none of the data followed a normal distribution, between-group comparisons
in BI and SPPB total scores were performed using a Mann-Whitney U test. A nonparametric Friedman’s
two-way analysis of variance (ANOVA) was used to test for significant differences in total scores within
groups. In case of a statistical significant outcome on the Friedman’s test, post-hoc analyses were
performed. This was done using a Wilcoxon signed-rank test to make pairwise comparisons between the
scores at the separate time points (week 2, 6 and 12). In order to correct for the multiple tests applied on
the same data, a Bonferroni-correction was used and the alpha level was set at 0,017. Finally, the degree
of association between the SPPB and BI was examined using correlation. In order to do so, all SPPB and BI
total scores obtained by both groups at week 2, were used. Because of the small sample size and the non-
normally distributed data, a nonparametric Spearman’s rank-order correlation was used to determine the
strength of the relationship.
15
3. Results
3.1 Study population
From October 2014 to April 2015 all elderly patients (≥ 65 years) admitted to the wards of Pulmonary
medicine and Geriatric medicine of hospital Gelderse Vallei were screened for eligibility to participate in
the CwC effect study. In order to finish this manuscript on time, the analysis for this thesis was restricted
to the data from patients who were first admitted between October 2014 and the end of January 2015 at
the latest. During this period, 91 patients who were enrolled in the hospital phase of the study were
screened for eligibility to continue study participation in the home phase. A total of 38 subjects were
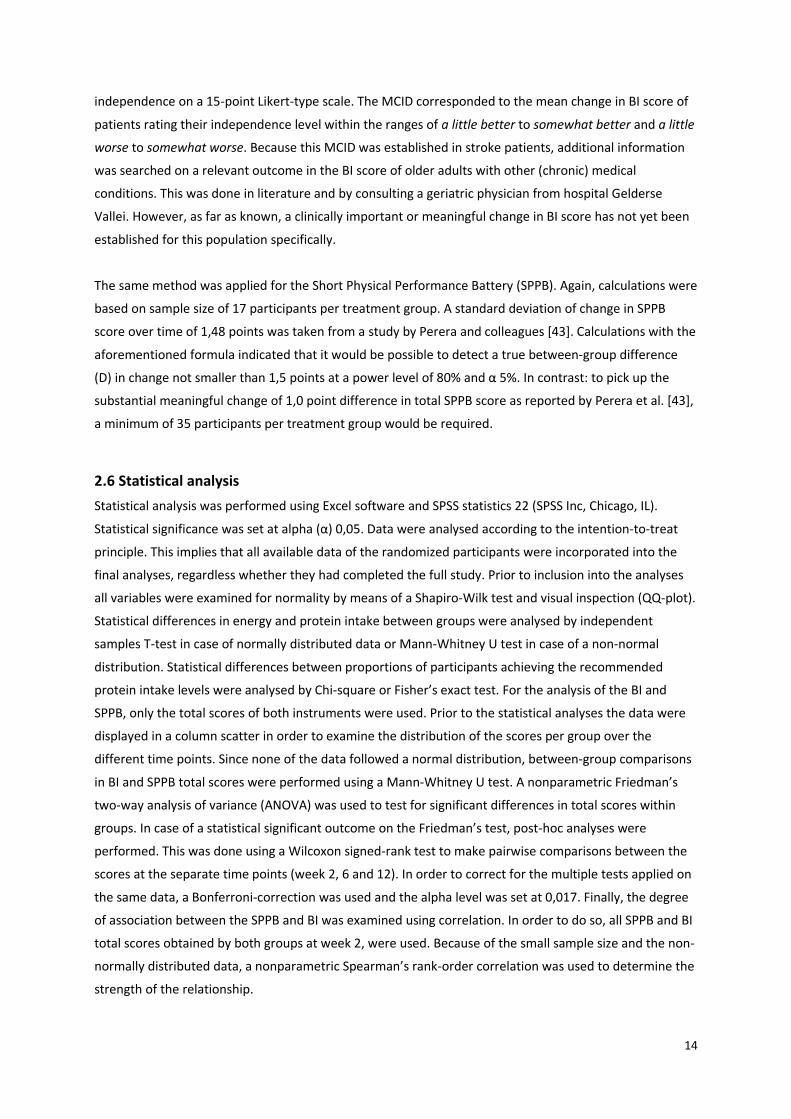
excluded for the reasons described in Figure 2. In total, 53 participants were included in the home phase:
26 in the intervention group and 27 in the control group. For 13 participants the follow-up data were
incomplete: in the intervention group 5 participants withdrew before the week-2 measurements and one
participant was admitted to a hospice before having completed 12 study weeks. In the control group 5
participants withdrew before the week-2 measurements, one participant was admitted to a rehabilitation
centre before week 6 and one participant died before study completion (week 12).
Patients assessed for
eligibility to participate in
home phase (N=91)
Excluded (N=38) Declined to participate (N=15) Not meeting inclusion criteria (N=13)
Cognitive impairment, N=2;
Going to a nursing home, N=5;
Going to a rehabilitation centre, N=1;
Starting palliative care, N=1;
Legally incapacitated, N=2;
Starting enteral nutrition, N=2. Other (N=10)
Confusion/delirium at time of screening, N=3;
Discharged early, N=4;
Transfer to other hospital ward, N=2;
Communication problems, N=1.
Included within home phase
(N=53)
Intervention (N= 26) Control (N=27)
Drop-out (N=6)
Withdrawal N=5 Going to a hospice N=1
Analysed by intention-to-treat
Week 2 (N=21)
Week 6 (N=21)
Week 12 (N=20)
Drop-out (N=7)
Withdrawal N=5 Death N=1 Starting rehabilitation N=1
Analysed by intention-to-treat
Week 2 (N=22)
Week 6 (N=21)
Week 12 (N=20)
Figure 2: Flowchart of inclusion of participants in home phase CwC effect study.
Drop-out (N=13)
Analysis
16
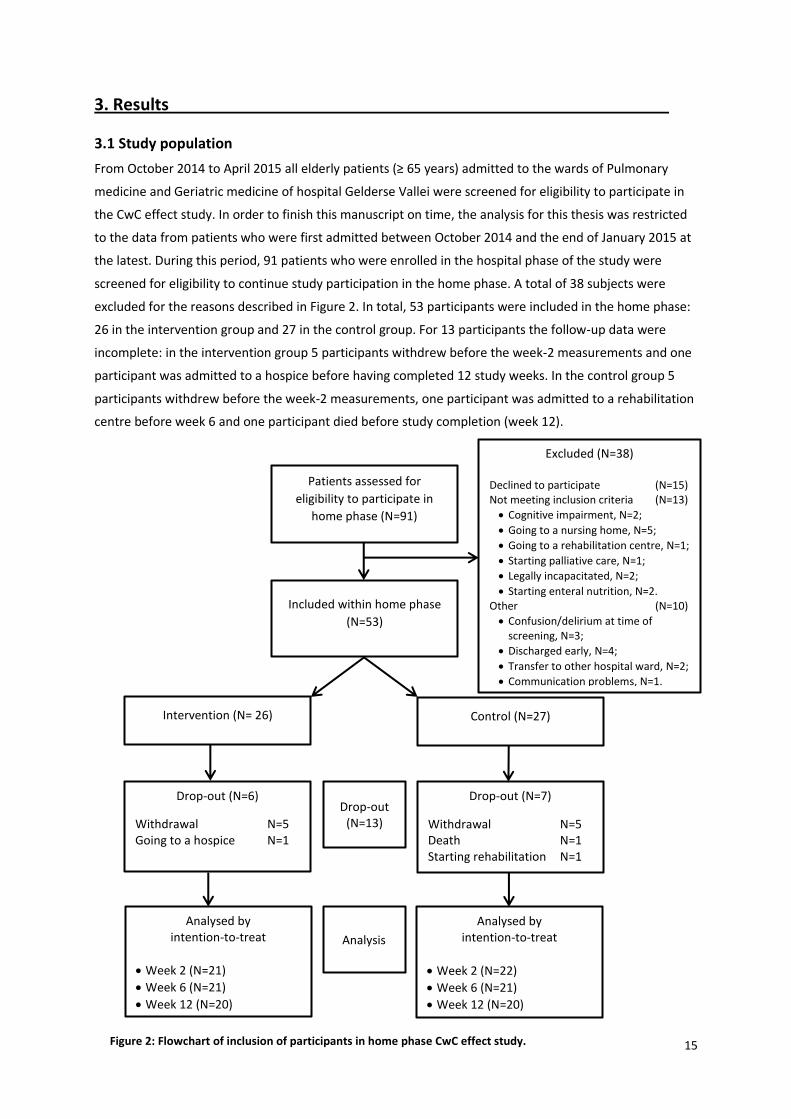
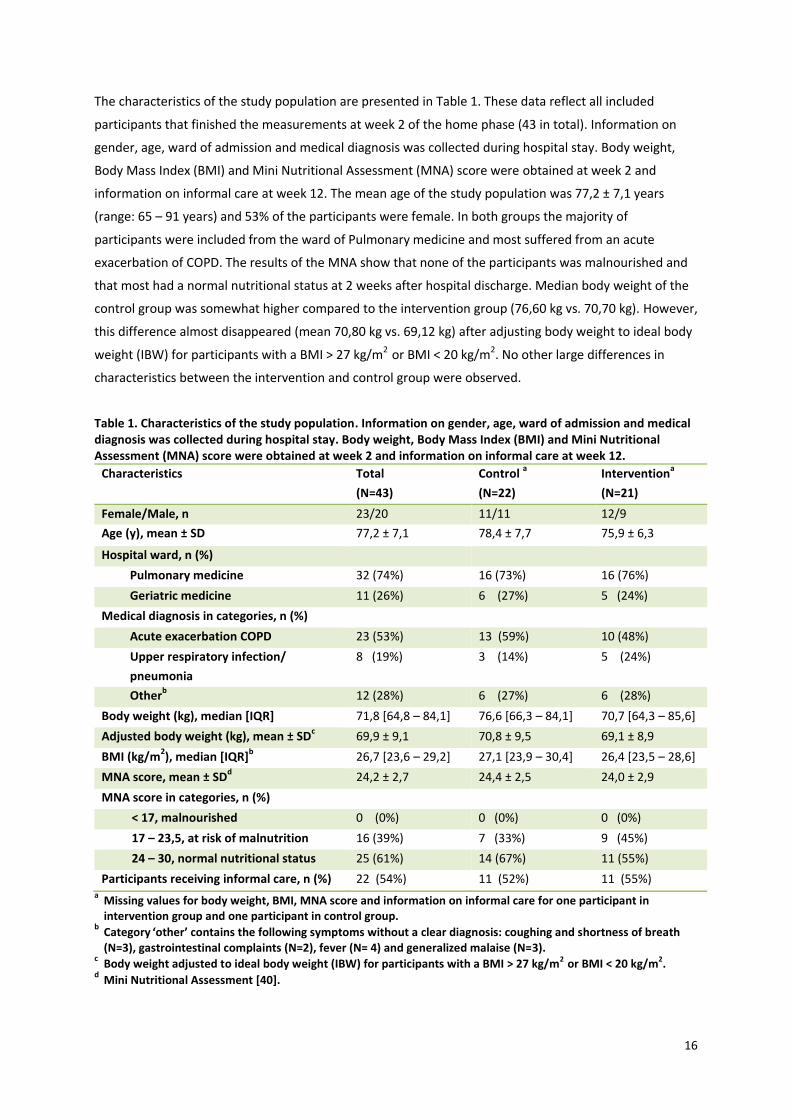
The characteristics of the study population are presented in Table 1. These data reflect all included
participants that finished the measurements at week 2 of the home phase (43 in total). Information on
gender, age, ward of admission and medical diagnosis was collected during hospital stay. Body weight,
Body Mass Index (BMI) and Mini Nutritional Assessment (MNA) score were obtained at week 2 and
information on informal care at week 12. The mean age of the study population was 77,2 ± 7,1 years
(range: 65 – 91 years) and 53% of the participants were female. In both groups the majority of
participants were included from the ward of Pulmonary medicine and most suffered from an acute
exacerbation of COPD. The results of the MNA show that none of the participants was malnourished and
that most had a normal nutritional status at 2 weeks after hospital discharge. Median body weight of the
control group was somewhat higher compared to the intervention group (76,60 kg vs. 70,70 kg). However,
this difference almost disappeared (mean 70,80 kg vs. 69,12 kg) after adjusting body weight to ideal body
weight (IBW) for participants with a BMI > 27 kg/m2 or BMI < 20 kg/m2. No other large differences in
characteristics between the intervention and control group were observed.
Table 1. Characteristics of the study population. Information on gender, age, ward of admission and medical diagnosis was collected during hospital stay. Body weight, Body Mass Index (BMI) and Mini Nutritional Assessment (MNA) score were obtained at week 2 and information on informal care at week 12.
Characteristics Total
(N=43)
Control a
(N=22)
Interventiona
(N=21)
Female/Male, n 23/20 11/11 12/9
Age (y), mean ± SD 77,2 ± 7,1 78,4 ± 7,7 75,9 ± 6,3
Hospital ward, n (%)
Pulmonary medicine 32 (74%) 16 (73%) 16 (76%)
Geriatric medicine 11 (26%) 6 (27%) 5 (24%)
Medical diagnosis in categories, n (%)
Acute exacerbation COPD 23 (53%) 13 (59%) 10 (48%)
Upper respiratory infection/
pneumonia
8 (19%) 3 (14%) 5 (24%)
Otherb
12 (28%) 6 (27%) 6 (28%)
Body weight (kg), median [IQR] 71,8 [64,8 – 84,1]
76,6 [66,3 – 84,1]
70,7 [64,3 – 85,6]
Adjusted body weight (kg), mean ± SDc
69,9 ± 9,1 70,8 ± 9,5 69,1 ± 8,9
BMI (kg/m2), median [IQR]
b 26,7 [23,6 – 29,2] 27,1 [23,9 – 30,4] 26,4 [23,5 – 28,6]
MNA score, mean ± SDd 24,2 ± 2,7 24,4 ± 2,5 24,0 ± 2,9
MNA score in categories, n (%)
< 17, malnourished 0 (0%) 0 (0%) 0 (0%)
17 – 23,5, at risk of malnutrition 16 (39%) 7 (33%) 9 (45%)
24 – 30, normal nutritional status 25 (61%) 14 (67%) 11 (55%)
Participants receiving informal care, n (%) 22 (54%) 11 (52%) 11 (55%) a Missing values for body weight, BMI, MNA score and information on informal care for one participant in intervention group and one participant in control group. b Category ‘other’ contains the following symptoms without a clear diagnosis: coughing and shortness of breath
(N=3), gastrointestinal complaints (N=2), fever (N= 4) and generalized malaise (N=3). c Body weight adjusted to ideal body weight (IBW) for participants with a BMI > 27 kg/m2 or BMI < 20 kg/m2.
d Mini Nutritional Assessment [40].
17
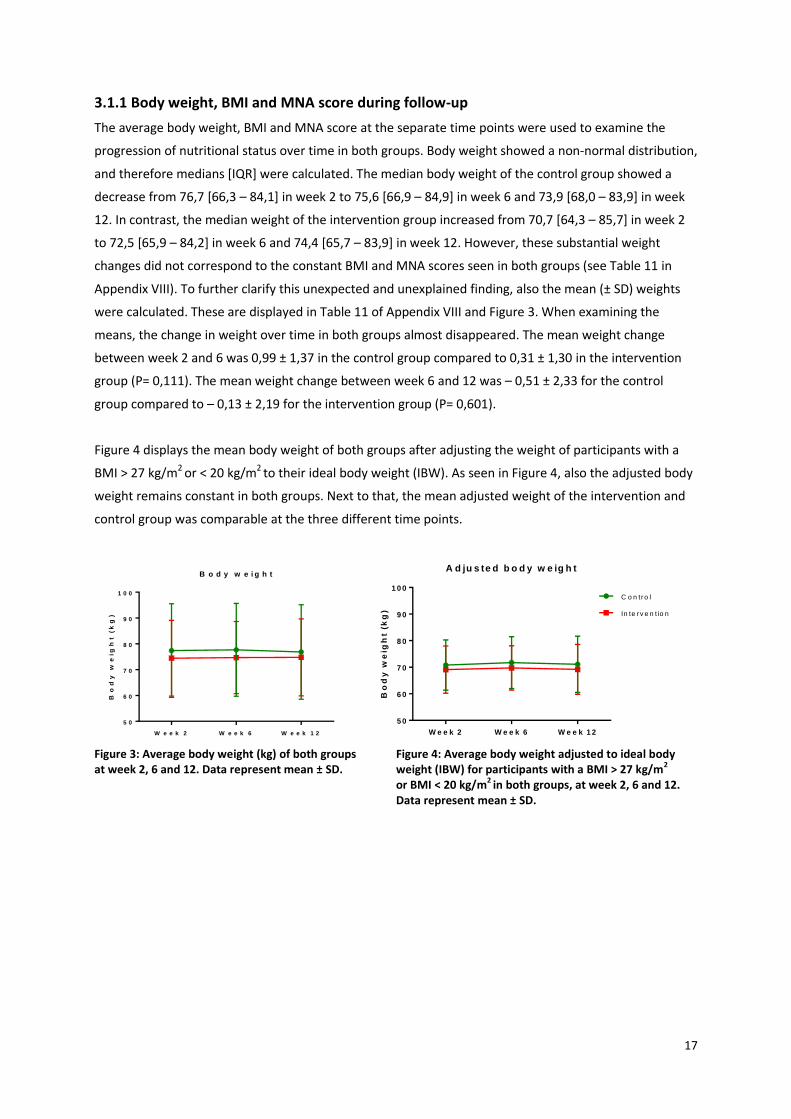
3.1.1 Body weight, BMI and MNA score during follow-up
The average body weight, BMI and MNA score at the separate time points were used to examine the
progression of nutritional status over time in both groups. Body weight showed a non-normal distribution,
and therefore medians [IQR] were calculated. The median body weight of the control group showed a
decrease from 76,7 [66,3 – 84,1] in week 2 to 75,6 [66,9 – 84,9] in week 6 and 73,9 [68,0 – 83,9] in week
12. In contrast, the median weight of the intervention group increased from 70,7 [64,3 – 85,7] in week 2
to 72,5 [65,9 – 84,2] in week 6 and 74,4 [65,7 – 83,9] in week 12. However, these substantial weight
changes did not correspond to the constant BMI and MNA scores seen in both groups (see Table 11 in
Appendix VIII). To further clarify this unexpected and unexplained finding, also the mean (± SD) weights
were calculated. These are displayed in Table 11 of Appendix VIII and Figure 3. When examining the
means, the change in weight over time in both groups almost disappeared. The mean weight change
between week 2 and 6 was 0,99 ± 1,37 in the control group compared to 0,31 ± 1,30 in the intervention
group (P= 0,111). The mean weight change between week 6 and 12 was – 0,51 ± 2,33 for the control
group compared to – 0,13 ± 2,19 for the intervention group (P= 0,601).
Figure 4 displays the mean body weight of both groups after adjusting the weight of participants with a
BMI > 27 kg/m2 or < 20 kg/m2 to their ideal body weight (IBW). As seen in Figure 4, also the adjusted body
weight remains constant in both groups. Next to that, the mean adjusted weight of the intervention and
control group was comparable at the three different time points.
W e e k 2 W e e k 6 W e e k 1 2
5 0
6 0
7 0
8 0
9 0
1 0 0
B o d y w e i g h t
Bo
dy
we
igh
t (
kg
)
W e e k 2 W e e k 6 W e e k 1 2
5 0
6 0
7 0
8 0
9 0
1 0 0
A d ju s te d b o d y w e ig h t
Bo
dy
we
igh
t (k
g)
C o n tro l
In te r v e n t io n
Figure 3: Average body weight (kg) of both groups Figure 4: Average body weight adjusted to ideal body at week 2, 6 and 12. Data represent mean ± SD. weight (IBW) for participants with a BMI > 27 kg/m2
or BMI < 20 kg/m2 in both groups, at week 2, 6 and 12. Data represent mean ± SD.
18
3.2 Protein intake
3.2.1 Daily protein intake at week 2, 6 and 12
Table 2 shows the mean protein intake expressed in grams per day (g/day) of both groups at week 2, 6
and 12. An independent samples T-test was used to compare the mean protein intake between groups. As
shown in Table 2, the intervention group had a significantly higher mean daily protein intake at all three
time points. In week 2 the mean intake was ± 42 grams higher (P<0,001) and in week 6 it was ± 43 grams
higher (P= 0,002). In week 12 the mean difference had reduced to ± 29 grams, but remained highly
significant (P= 0,014). Overall, the mean protein intake of the control group remained fairly constant over
the different time points, whereas for the intervention group a decrease of 12 grams was seen between
week 2 and 12.
Table 2. Daily protein intake of both groups in grams per day (g/day) at week 2, 6 and 12.
Control
Intervention
Mean difference ± SE Difference
P-value
Week 2a 80,6 ± 20,1 122,5 ± 38,4 41,8 ± 9,6 <0,001*
Week 6b
77,4 ± 21,0 120,2 ± 51,5 42,9 ± 12,1 0,002*
Week 12c
81,1 ± 19,7 110,4 ± 43,4 28,9 ± 10,9 0,014*
Data are presented as mean ± standard deviation and were analysed with independent samples T-test. * p< 0,05 indicates significance. a Control (N=21) and Intervention (N=20). b Control (N=21) and Intervention (N=21). c Control (N=19) and Intervention (N=19).
The daily protein intake of both groups at week 2, 6 and 12 expressed in grams per kilogram body weight
per day (g/kg BW/day) is presented in Table 3. A Shapiro-Wilk test that was applied prior to performing
any additional statistical tests, showed a non-normal distribution of the data in the intervention group
(see Table 5 in Appendix VII). Therefore, results are presented as median [IQR] and between-group
comparisons were made with a nonparametric test (Mann-Whitney U). Because the objective of this
thesis was formulated in terms of comparing the mean protein intake per group (not median), Table 3
also indicates the mean and SD of the intake in g/kg BW/day. The results in Table 3 reveal a significant
difference in the protein intake of both groups at all three time points. The intervention group had a
higher mean protein intake level compared to control group. At week 2 and 6 the difference was 0,6 g/kg
BW/day and at week 12 it was 0,4 g/kg BW/day.
Table 3. Daily protein intake of both groups in grams per kilogram body weight per day (g/kg BW/day) at week 2, 6 and 12.
Control Intervention P-value
Median [IQR] Mean ± SD Median [IQR] Mean ± SD
Week 2a 1,2 [0,9 – 1,3] 1,2 ± 0,3 1,8 [1,3 – 1,9] 1,8 ± 0,6 <0,001*
Week 6b
1,0 [0,8 – 1,4] 1,1 ± 0,4 1,6 [1,3 – 2,0] 1,7 ± 0,8 0,001*
Week 12c
1,1 [0,9 – 1,4] 1,2 ± 0,3 1,5 [1,1 – 1,8] 1,6 ± 0,7 0,020*
Data are presented as median [IQR] and mean ± SD and were analysed with Mann-Whitney U test. * p< 0,05 indicates significance. a Control (N=21) and Intervention (N=20). b Control (N=21) and Intervention (N=21). c Control (N=19) and Intervention (N=19).
19
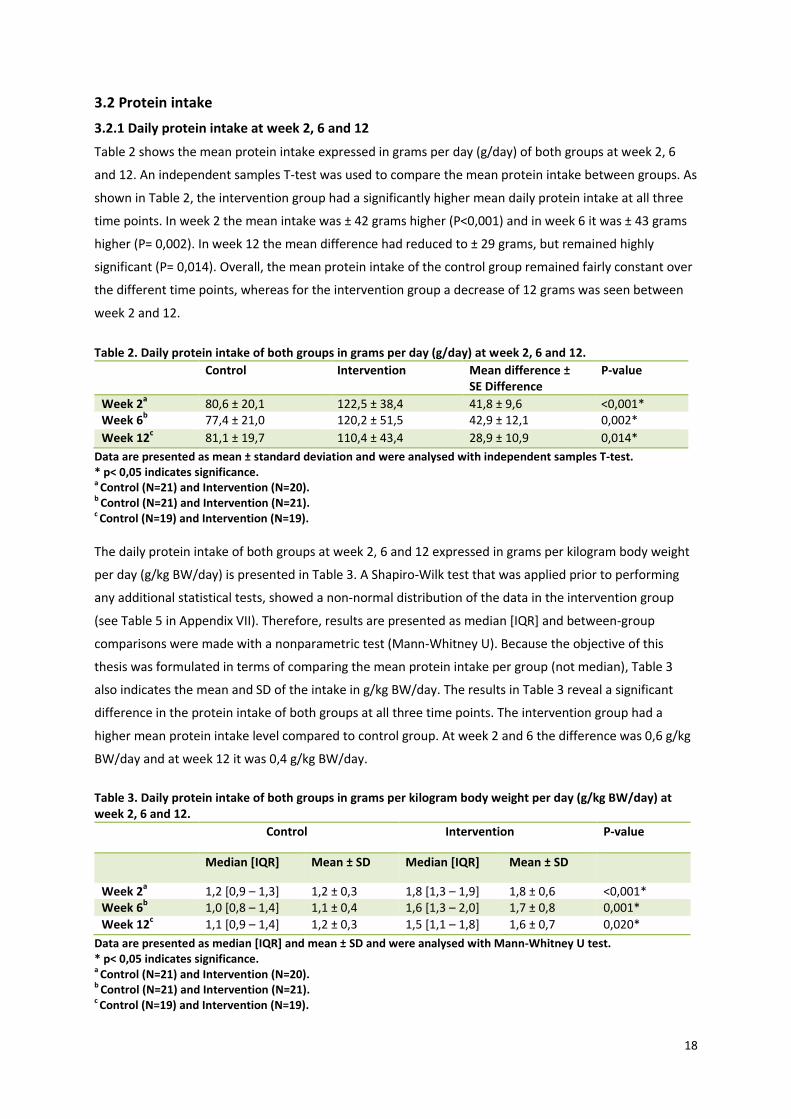
3.2.2 Daily protein intake levels compared to the recommendations
Figure 5 displays the distribution of the protein intake in grams per kilogram body weight per day (g/kg
BW/day) of participants in both groups at the three different measurement moments. The current
recommended intake level (RDA) of 0,8 g/kg BW/day as well as the intake levels of 1,2 – 1,5 g/kg BW/day,
as recommended by the PROT-AGE group, are highlighted within the graphs. For both groups it was
calculated which percentage of the participants achieved the recommended intake levels. Subsequently, a
Chi-square or Fisher’s exact test was used to compare these proportions between groups. The results of
these tests are presented in Table 12 and 13 in Appendix IX.
At week 2 all participants in the intervention group achieved the RDA of 0,8 g/kg BW/day, whereas 3
participants in the control group failed to meet this intake level (P= 0,232). Furthermore, all but two
participants (90%) in the intervention group had a protein intake of 1,2 g/kg BW/day compared to 11
participants (52%) in the control group (P= 0,008). The intake level of 1,5 g/kg BW/day was achieved by 13
participants in the intervention group (65%) compared to only 3 (14%) in the control group (P=0,001).
In week 6, the protein intake of the intervention group showed a greater variability compared two week
2, with intake levels ranging between 0,47 g/kg BW/day and 3,90 g/kg BW/day. One of the participants in
the intervention group was not able to meet the RDA of 0,8 g/kg BW/day compared to 4 in the control
group (P= 0,343). Overall, the proportion of participants achieving the intake level of 1,2 g/kg BW/day
remained significantly higher in the intervention group (81%) compared to the control group (38%) (P=
0,005). The same result was found for the intake level of 1,5 g/kg BW/day, which was achieved by 15
participants in the intervention group (71%) compared to 3 (14%) in the control group (P<0,001).
In week 12 the number of participants in the intervention group with an intake level of 1,2 g/kg BW/day
had reduced to 14 (74%) compared to an unchanged number of 8 participants (42%) in the control group.
A borderline significant difference in proportions was found (P= 0,045). Moreover, 10 participants (53%)
in the intervention group were able to achieve the intake level of 1,5 g/kg BW/day compared to 3
participants (16%) in the control group (P= 0,017).
20
g/k
g B
W/d
ay
C o n tr o l In te r v e n t io n
0
0 .8
1 .2
1 .5
2
3
4
W e e k 2
g/k
g B
W/d
ay
C o n tr o l In te r v e n t io n
0
0 .8
1 .2
1 .5
2
3
4
W e e k 6
g/k
g B
W/d
ay
C o n tr o l In te r v e n t io n
0
0 .8
1 .2
1 .5
2
3
4
W e e k 1 2
Figure 5: Total daily protein intake (g/kg BW/day) of participants in both groups compared to the recommended intake levels.
3.2.3 Relative contribution of different food groups to the total protein intake
The three food groups contributing most to the total protein intake of both groups at the different time
points were ‘Dairy products’, ‘Meat and meat products’ and ‘Cereals and cereal products’. There was a
slight variation in the level of contribution of these food groups per treatment group and per week, but on
average ‘Dairy products’ were responsible for 30%, ‘Meat and meat products’ for 25% and ‘Cereals and
cereal products’ for 18% of the total protein intake. Overall, the food groups ‘Legumes’ and ‘Sugar and
confectionery’ contributed the least to the total protein intake (no more than 1%). Differences between
groups were seen for the level of contribution of ‘Non-alcoholic beverages’ and ‘Soups, bouillon’. In the
control group these foods contributed no more than 4% to the total protein intake, whereas in the
intervention group this was up to 10%. This difference is most likely explained by the presence of CwC
alternatives within these food groups. A complete overview on the relative contribution of the different
food groups to the total protein intake of both groups can be found in Appendix X.
21
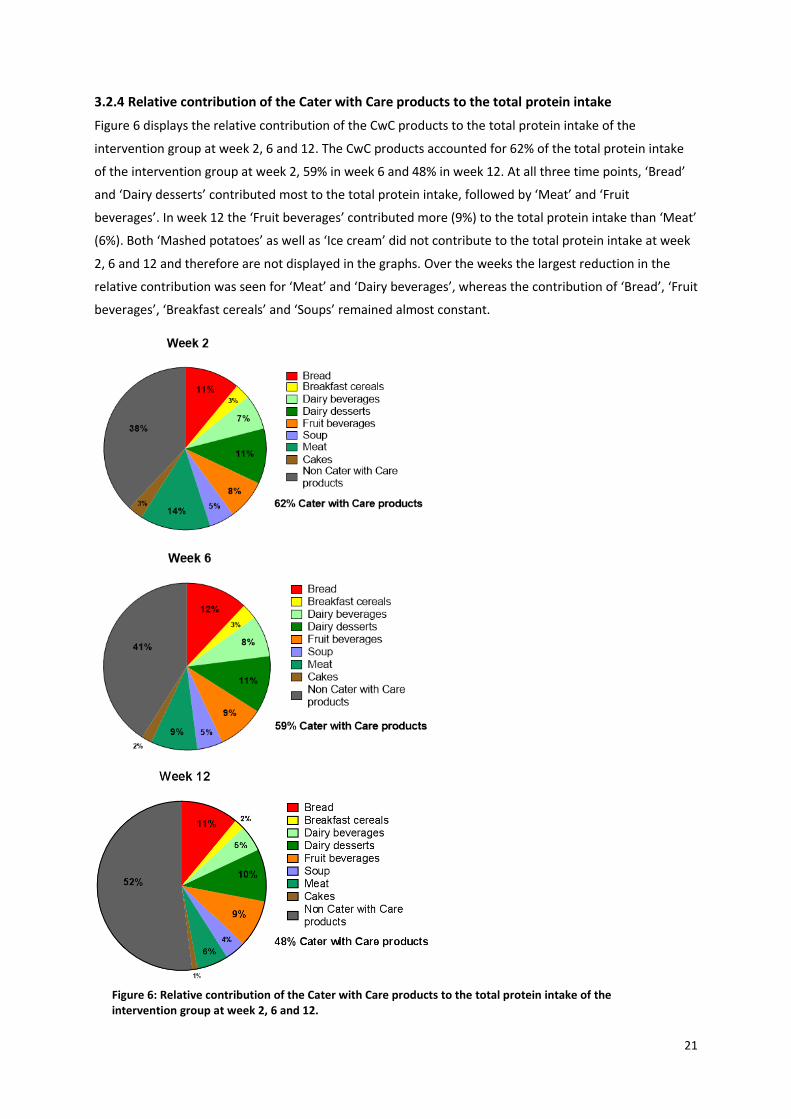
3.2.4 Relative contribution of the Cater with Care products to the total protein intake
Figure 6 displays the relative contribution of the CwC products to the total protein intake of the
intervention group at week 2, 6 and 12. The CwC products accounted for 62% of the total protein intake
of the intervention group at week 2, 59% in week 6 and 48% in week 12. At all three time points, ‘Bread’
and ‘Dairy desserts’ contributed most to the total protein intake, followed by ‘Meat’ and ‘Fruit
beverages’. In week 12 the ‘Fruit beverages’ contributed more (9%) to the total protein intake than ‘Meat’
(6%). Both ‘Mashed potatoes’ as well as ‘Ice cream’ did not contribute to the total protein intake at week
2, 6 and 12 and therefore are not displayed in the graphs. Over the weeks the largest reduction in the
relative contribution was seen for ‘Meat’ and ‘Dairy beverages’, whereas the contribution of ‘Bread’, ‘Fruit
beverages’, ‘Breakfast cereals’ and ‘Soups’ remained almost constant.
Figure 6: Relative contribution of the Cater with Care products to the total protein intake of the intervention group at week 2, 6 and 12.
22
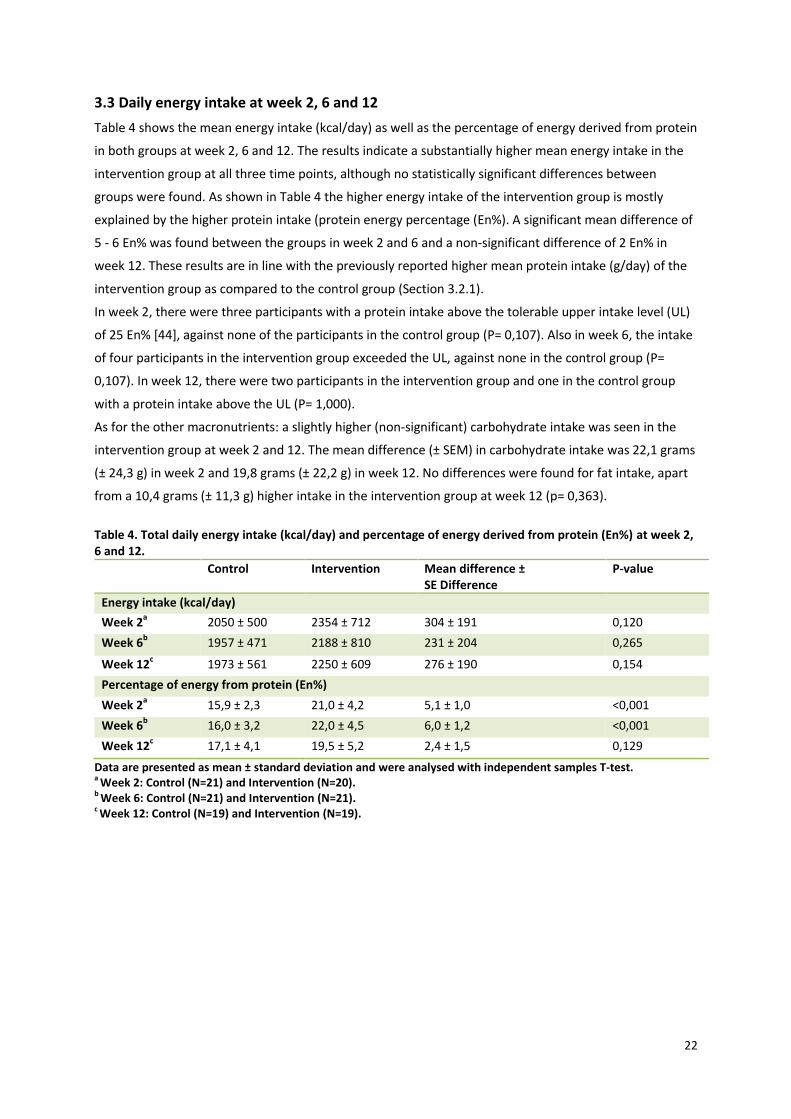
3.3 Daily energy intake at week 2, 6 and 12
Table 4 shows the mean energy intake (kcal/day) as well as the percentage of energy derived from protein
in both groups at week 2, 6 and 12. The results indicate a substantially higher mean energy intake in the
intervention group at all three time points, although no statistically significant differences between
groups were found. As shown in Table 4 the higher energy intake of the intervention group is mostly
explained by the higher protein intake (protein energy percentage (En%). A significant mean difference of
5 - 6 En% was found between the groups in week 2 and 6 and a non-significant difference of 2 En% in
week 12. These results are in line with the previously reported higher mean protein intake (g/day) of the
intervention group as compared to the control group (Section 3.2.1).
In week 2, there were three participants with a protein intake above the tolerable upper intake level (UL)
of 25 En% [44], against none of the participants in the control group (P= 0,107). Also in week 6, the intake
of four participants in the intervention group exceeded the UL, against none in the control group (P=
0,107). In week 12, there were two participants in the intervention group and one in the control group
with a protein intake above the UL (P= 1,000).
As for the other macronutrients: a slightly higher (non-significant) carbohydrate intake was seen in the
intervention group at week 2 and 12. The mean difference (± SEM) in carbohydrate intake was 22,1 grams
(± 24,3 g) in week 2 and 19,8 grams (± 22,2 g) in week 12. No differences were found for fat intake, apart
from a 10,4 grams (± 11,3 g) higher intake in the intervention group at week 12 (p= 0,363).
Table 4. Total daily energy intake (kcal/day) and percentage of energy derived from protein (En%) at week 2, 6 and 12.
Control
Intervention Mean difference ± SE Difference
P-value
Energy intake (kcal/day)
Week 2a 2050 ± 500 2354 ± 712 304 ± 191 0,120
Week 6b
1957 ± 471 2188 ± 810 231 ± 204 0,265
Week 12c
1973 ± 561 2250 ± 609 276 ± 190 0,154
Percentage of energy from protein (En%)
Week 2a 15,9 ± 2,3 21,0 ± 4,2 5,1 ± 1,0 <0,001
Week 6b 16,0 ± 3,2 22,0 ± 4,5 6,0 ± 1,2 <0,001
Week 12c 17,1 ± 4,1 19,5 ± 5,2 2,4 ± 1,5 0,129
Data are presented as mean ± standard deviation and were analysed with independent samples T-test. a Week 2: Control (N=21) and Intervention (N=20). b Week 6: Control (N=21) and Intervention (N=21). c Week 12: Control (N=19) and Intervention (N=19).
23
3.3.1 Oral nutritional supplements
Two participants in both groups reported the use of oral nutritional supplements (ONS) during the study
period. The total amount of energy obtained from ONS by the two participants in the intervention group
was 1450 kcal/day in week 2, 1200 kcal/day in week 6 and 1150 kcal/day in week 12.
The two participants in the control group obtained a total of 300 kcal/day in week 2 and 600 kcal/day in
week 12. None of the participants in the control group reported the use of ONS in week 6.
Exclusion of these participants from the analyses did not change the significant differences found in mean
protein intake (g/day) at any of the time points (see Table 14 in Appendix XI). However, a slight reduction
of 35 kcal/day was seen in the mean difference in energy intake (kcal/day) at week 6 and a reduction of
43 kcal/day in week 12. The mean differences in energy intake between groups remained non-significant
at all three time points (see Table 15 in Appendix XI).
24
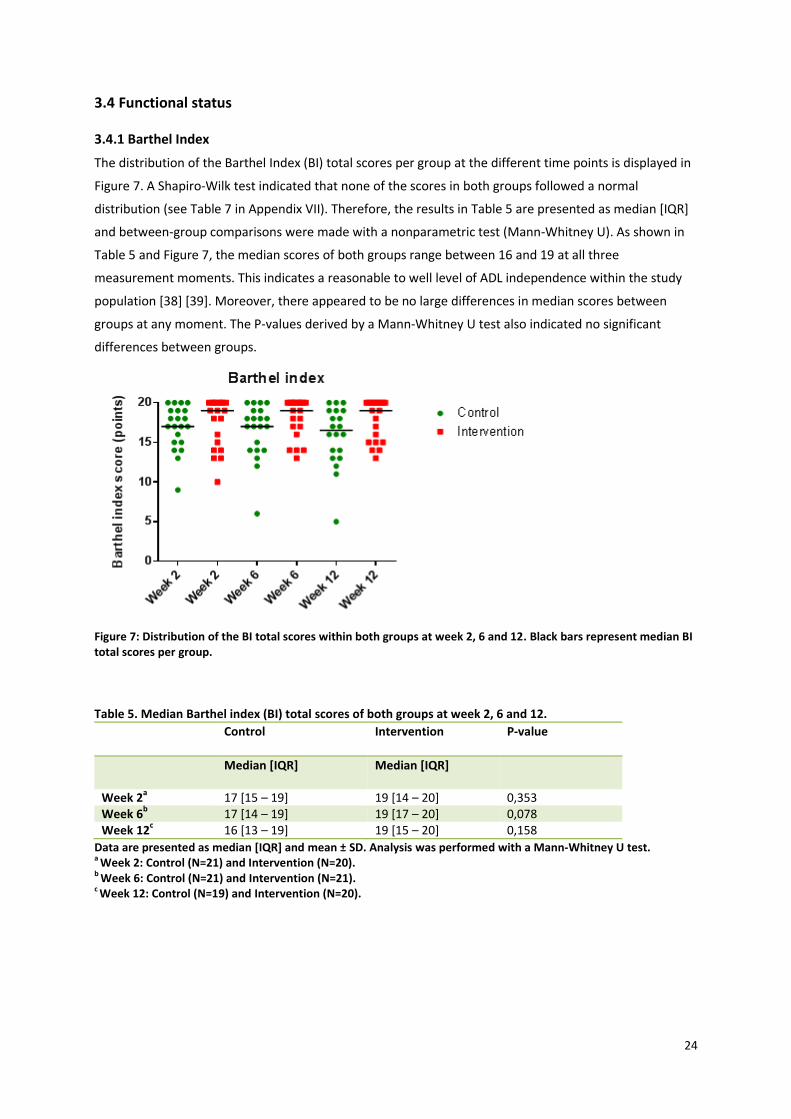
3.4 Functional status 3.4.1 Barthel Index
The distribution of the Barthel Index (BI) total scores per group at the different time points is displayed in
Figure 7. A Shapiro-Wilk test indicated that none of the scores in both groups followed a normal
distribution (see Table 7 in Appendix VII). Therefore, the results in Table 5 are presented as median [IQR]
and between-group comparisons were made with a nonparametric test (Mann-Whitney U). As shown in
Table 5 and Figure 7, the median scores of both groups range between 16 and 19 at all three
measurement moments. This indicates a reasonable to well level of ADL independence within the study
population [38] [39]. Moreover, there appeared to be no large differences in median scores between
groups at any moment. The P-values derived by a Mann-Whitney U test also indicated no significant
differences between groups.
Figure 7: Distribution of the BI total scores within both groups at week 2, 6 and 12. Black bars represent median BI total scores per group.
Table 5. Median Barthel index (BI) total scores of both groups at week 2, 6 and 12.
Control
Intervention
P-value
Median [IQR] Median [IQR]
Week 2a 17 [15 – 19] 19 [14 – 20] 0,353
Week 6b
17 [14 – 19] 19 [17 – 20] 0,078 Week 12
c 16 [13 – 19] 19 [15 – 20] 0,158
Data are presented as median [IQR] and mean ± SD. Analysis was performed with a Mann-Whitney U test. a Week 2: Control (N=21) and Intervention (N=20). b Week 6: Control (N=21) and Intervention (N=21). c Week 12: Control (N=19) and Intervention (N=20).
25
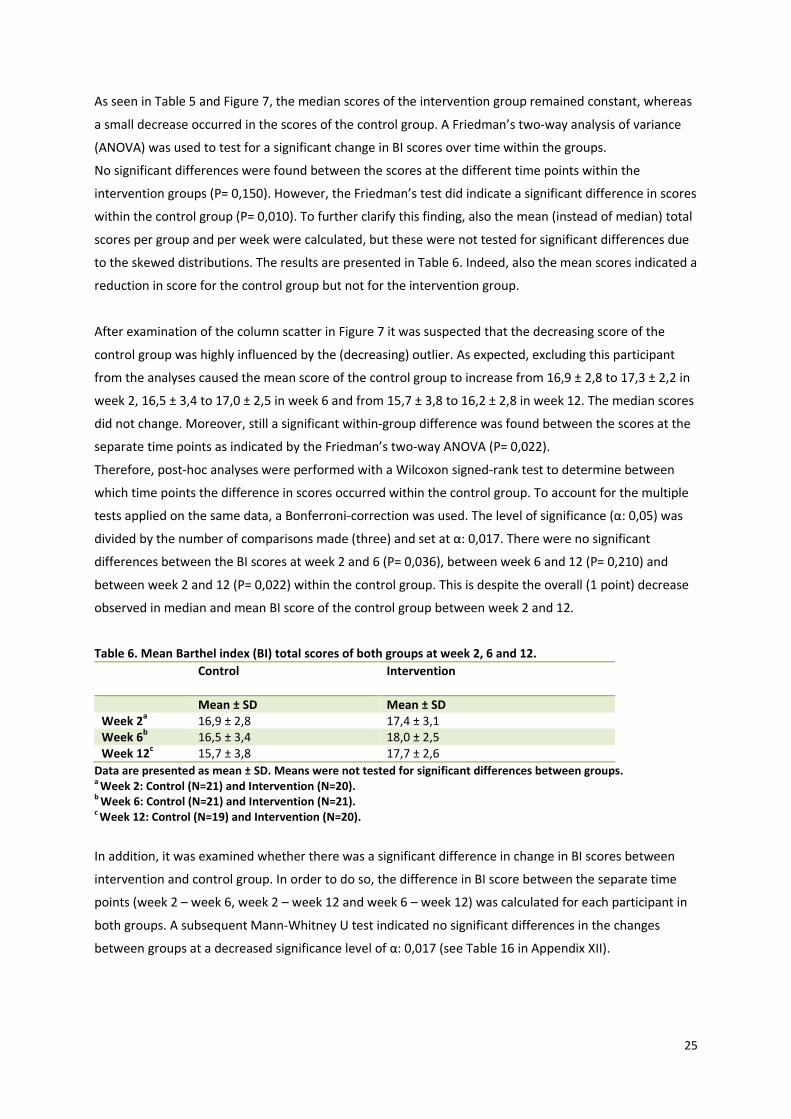
As seen in Table 5 and Figure 7, the median scores of the intervention group remained constant, whereas
a small decrease occurred in the scores of the control group. A Friedman’s two-way analysis of variance
(ANOVA) was used to test for a significant change in BI scores over time within the groups.
No significant differences were found between the scores at the different time points within the
intervention groups (P= 0,150). However, the Friedman’s test did indicate a significant difference in scores
within the control group (P= 0,010). To further clarify this finding, also the mean (instead of median) total
scores per group and per week were calculated, but these were not tested for significant differences due
to the skewed distributions. The results are presented in Table 6. Indeed, also the mean scores indicated a
reduction in score for the control group but not for the intervention group.
After examination of the column scatter in Figure 7 it was suspected that the decreasing score of the
control group was highly influenced by the (decreasing) outlier. As expected, excluding this participant
from the analyses caused the mean score of the control group to increase from 16,9 ± 2,8 to 17,3 ± 2,2 in
week 2, 16,5 ± 3,4 to 17,0 ± 2,5 in week 6 and from 15,7 ± 3,8 to 16,2 ± 2,8 in week 12. The median scores
did not change. Moreover, still a significant within-group difference was found between the scores at the
separate time points as indicated by the Friedman’s two-way ANOVA (P= 0,022).
Therefore, post-hoc analyses were performed with a Wilcoxon signed-rank test to determine between
which time points the difference in scores occurred within the control group. To account for the multiple
tests applied on the same data, a Bonferroni-correction was used. The level of significance (α: 0,05) was
divided by the number of comparisons made (three) and set at α: 0,017. There were no significant
differences between the BI scores at week 2 and 6 (P= 0,036), between week 6 and 12 (P= 0,210) and
between week 2 and 12 (P= 0,022) within the control group. This is despite the overall (1 point) decrease
observed in median and mean BI score of the control group between week 2 and 12.
Table 6. Mean Barthel index (BI) total scores of both groups at week 2, 6 and 12.
Control
Intervention
Mean ± SD Mean ± SD Week 2
a 16,9 ± 2,8 17,4 ± 3,1
Week 6b
16,5 ± 3,4 18,0 ± 2,5 Week 12
c 15,7 ± 3,8 17,7 ± 2,6
Data are presented as mean ± SD. Means were not tested for significant differences between groups. a Week 2: Control (N=21) and Intervention (N=20). b Week 6: Control (N=21) and Intervention (N=21). c Week 12: Control (N=19) and Intervention (N=20).
In addition, it was examined whether there was a significant difference in change in BI scores between
intervention and control group. In order to do so, the difference in BI score between the separate time
points (week 2 – week 6, week 2 – week 12 and week 6 – week 12) was calculated for each participant in
both groups. A subsequent Mann-Whitney U test indicated no significant differences in the changes
between groups at a decreased significance level of α: 0,017 (see Table 16 in Appendix XII).
26
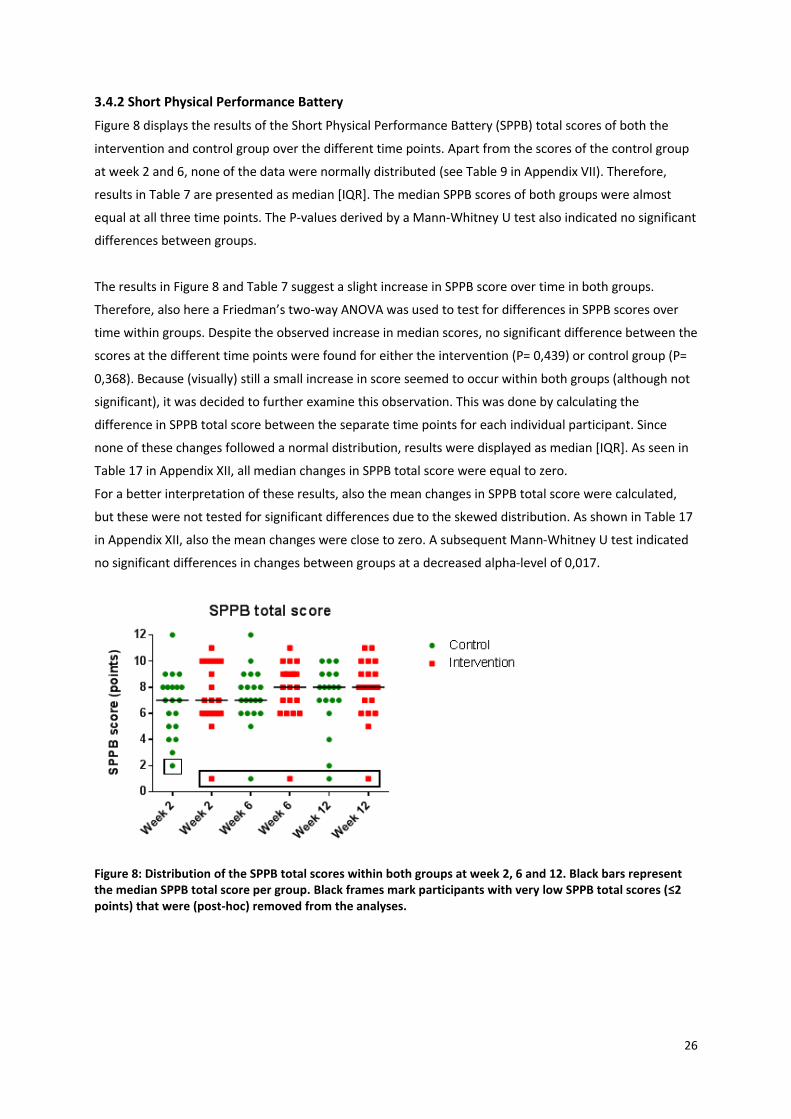
3.4.2 Short Physical Performance Battery
Figure 8 displays the results of the Short Physical Performance Battery (SPPB) total scores of both the
intervention and control group over the different time points. Apart from the scores of the control group
at week 2 and 6, none of the data were normally distributed (see Table 9 in Appendix VII). Therefore,
results in Table 7 are presented as median [IQR]. The median SPPB scores of both groups were almost
equal at all three time points. The P-values derived by a Mann-Whitney U test also indicated no significant
differences between groups.
The results in Figure 8 and Table 7 suggest a slight increase in SPPB score over time in both groups.
Therefore, also here a Friedman’s two-way ANOVA was used to test for differences in SPPB scores over
time within groups. Despite the observed increase in median scores, no significant difference between the
scores at the different time points were found for either the intervention (P= 0,439) or control group (P=
0,368). Because (visually) still a small increase in score seemed to occur within both groups (although not
significant), it was decided to further examine this observation. This was done by calculating the
difference in SPPB total score between the separate time points for each individual participant. Since
none of these changes followed a normal distribution, results were displayed as median [IQR]. As seen in
Table 17 in Appendix XII, all median changes in SPPB total score were equal to zero.
For a better interpretation of these results, also the mean changes in SPPB total score were calculated,
but these were not tested for significant differences due to the skewed distribution. As shown in Table 17
in Appendix XII, also the mean changes were close to zero. A subsequent Mann-Whitney U test indicated
no significant differences in changes between groups at a decreased alpha-level of 0,017.
Figure 8: Distribution of the SPPB total scores within both groups at week 2, 6 and 12. Black bars represent the median SPPB total score per group. Black frames mark participants with very low SPPB total scores (≤2 points) that were (post-hoc) removed from the analyses.
27
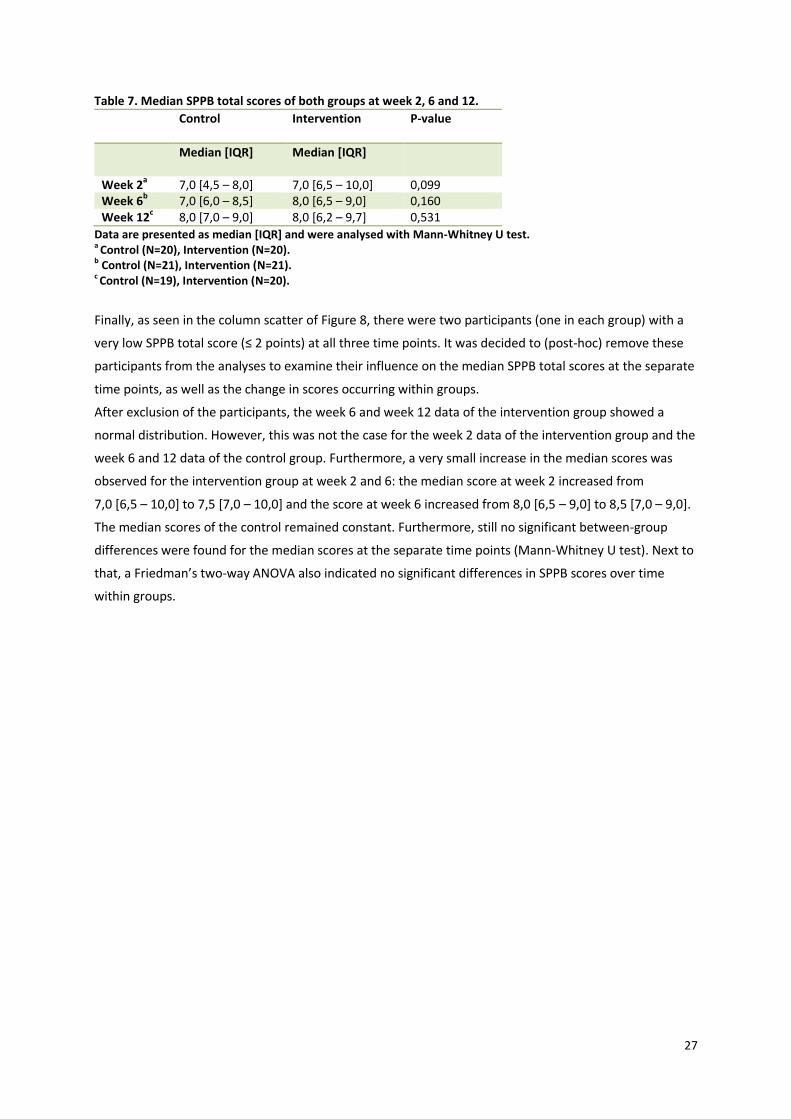
Table 7. Median SPPB total scores of both groups at week 2, 6 and 12.
Control
Intervention
P-value
Median [IQR] Median [IQR]
Week 2a 7,0 [4,5 – 8,0] 7,0 [6,5 – 10,0] 0,099
Week 6b
7,0 [6,0 – 8,5] 8,0 [6,5 – 9,0] 0,160 Week 12
c 8,0 [7,0 – 9,0] 8,0 [6,2 – 9,7] 0,531
Data are presented as median [IQR] and were analysed with Mann-Whitney U test. a Control (N=20), Intervention (N=20). b Control (N=21), Intervention (N=21). c Control (N=19), Intervention (N=20).
Finally, as seen in the column scatter of Figure 8, there were two participants (one in each group) with a
very low SPPB total score (≤ 2 points) at all three time points. It was decided to (post-hoc) remove these
participants from the analyses to examine their influence on the median SPPB total scores at the separate
time points, as well as the change in scores occurring within groups.
After exclusion of the participants, the week 6 and week 12 data of the intervention group showed a
normal distribution. However, this was not the case for the week 2 data of the intervention group and the
week 6 and 12 data of the control group. Furthermore, a very small increase in the median scores was
observed for the intervention group at week 2 and 6: the median score at week 2 increased from
7,0 [6,5 – 10,0] to 7,5 [7,0 – 10,0] and the score at week 6 increased from 8,0 [6,5 – 9,0] to 8,5 [7,0 – 9,0].
The median scores of the control remained constant. Furthermore, still no significant between-group
differences were found for the median scores at the separate time points (Mann-Whitney U test). Next to
that, a Friedman’s two-way ANOVA also indicated no significant differences in SPPB scores over time
within groups.
28
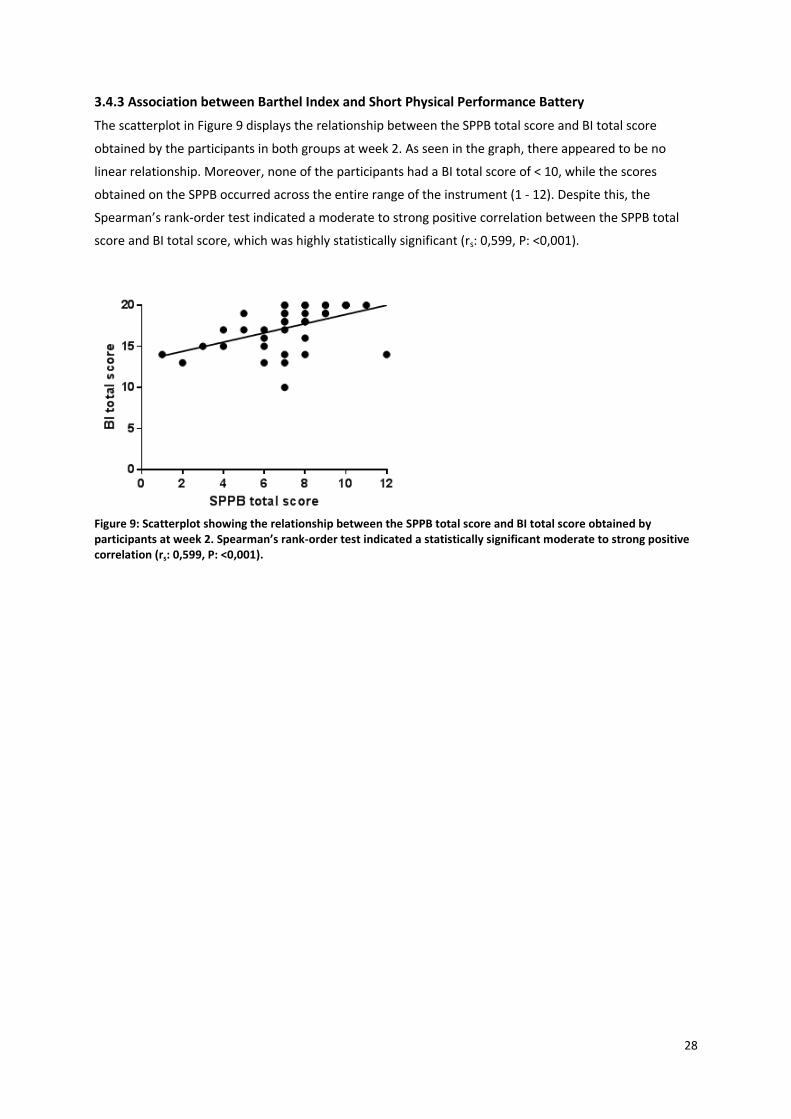
3.4.3 Association between Barthel Index and Short Physical Performance Battery
The scatterplot in Figure 9 displays the relationship between the SPPB total score and BI total score
obtained by the participants in both groups at week 2. As seen in the graph, there appeared to be no
linear relationship. Moreover, none of the participants had a BI total score of < 10, while the scores
obtained on the SPPB occurred across the entire range of the instrument (1 - 12). Despite this, the
Spearman’s rank-order test indicated a moderate to strong positive correlation between the SPPB total
score and BI total score, which was highly statistically significant (rs: 0,599, P: <0,001).
Figure 9: Scatterplot showing the relationship between the SPPB total score and BI total score obtained by participants at week 2. Spearman’s rank-order test indicated a statistically significant moderate to strong positive correlation (rs: 0,599, P: <0,001).
29
4. Discussion and conclusion
The results of this thesis show that the use of a variety of protein-enriched Cater with Care (CwC)
products significantly increases the total daily protein intake of older individuals recently discharged from
the hospital. One of the most important strengths of this study was that the large majority of participants
in the intervention group was able to achieve at least the minimum intake level of 1,2 g/kg BW/day as
recommended by the PROT-AGE group [8]. On average, 82% of participants in the intervention group
achieved this intake level, against 48% of the controls. Furthermore, the higher protein intake was
achieved without actively stimulating participants to use the CwC products. Instead, participants were
free to choose the type and amount of products they wanted to consume. We believe that this is the best
approach to enhance compliance to the products. Another important strength of this study is its
randomized controlled trial design with statistical analyses performed according to the intention-to-treat
principle. Since randomization occurred shortly after hospital admission and not all participants continued
to the home phase of the study, there was a risk that randomization would not hold. However, the
population characteristics described in this thesis, indicate that the groups were still comparable at the
start of the home phase. A final strength of this study is that we not only assessed the effect on protein
intake, as was done by two recent comparable studies [10, 45], but also included relevant outcome
measures on physical function. One of these measures provided information on participants’ level of
independence in ADL and thereby has a direct association with quality of life [7].
In this thesis, we aimed to find a between-group difference in protein intake of 0,3 g/kg BW/day at the
end of the study period. However, a striking mean difference of 0,6 g/kg BW/day was already observed at
two weeks after hospital discharge, and after twelve weeks this was still 0,4 g/kg BW/day. These
differences in mean intake are a positive finding, especially when considering the relatively high mean
protein intake of the control group. The high protein intake of the controls was a surprising observation in
the current thesis. It most likely reflects the fact that participants were aware of the importance of a
sufficient protein intake, since they received a protein rich menu and written dietary advice during
hospitalisation. We believe that this caused them to increase the consumption of products that are
naturally high in protein.
Our results on protein intake are positive when compared to a similar study by Stelten et al. [10]. In
this study, performed in a hospital setting, only 36% of participants in the intervention group achieved the
intake level of 1,2 g/kg BW/day, against 8% of the controls. However, Stelten and colleagues only used
protein-enriched bread and drinking yoghurt. We therefore believe that the use of a larger variety of
products in the current study is an important explanation for the much higher proportion found.
However, not all products appeared to be suitable to provide protein supplementation, as indicated by
their low relative contribution to the total protein intake. Moreover, during the three months of follow-up
we observed a 14% reduction in the relative contribution of the CwC products. This indicates a lower
compliance to the products when used over a longer period of time. A reassuring finding was that the use
of the CwC products did not cause the participants to consume less from other meal components, as is
reflected by their non-significant but substantially higher mean energy intake. This is despite the regularly
reported strong satiating effects of dietary proteins [12, 46]. Moreover, body weight, BMI and MNA score
remained constant in both groups, which indicates a stable nutritional status over time.
30
Despite the positive findings on protein intake, our results do not indicate that continuing the use of
the CwC products after hospital discharge, improves the functional recovery of older individuals. None of
the groups showed an improvement in the level of independence in activities of daily living (ADL), as
measured by the Barthel Index (BI). Instead, we observed a small (1 point) decrease in the BI score of the
control group, whereas the score of the intervention group remained constant. This may indicate that the
use of the CwC products in addition to a standard diet is an effective approach to maintain physical
function of older individuals. However, this finding should be interpreted with caution since the
preliminary analyses lacked power to find a statistically significant effect. Our results are in line with
previous studies who also reported no significant improvement in the BI score of older individuals using
dietary protein supplementation [20] [21] [22].
Also for lower-extremity physical performance, as measured by the Short Physical Performance
Battery (SPPB), we found no significant differences between groups. Both groups showed a very small
non-significant improvement in SPPB score over time, which indicates that at least some improvement in
physical performance occurs after hospital discharge, but this is not influenced by a higher protein intake.
It is possible that a longer intervention period might have resulted in larger effects, since for instance
Tieland et al. [33] found a significant 1 point increase in the SPPB score of frail older adults after 24 weeks
of protein supplementation. The same holds for ADL: in one of the few studies that did report a significant
improvement in the BI score of older individuals using protein supplementation, the effect occurred only
after 24 weeks [23]. Next to that, the relatively high BI score observed within our population, indicates
that participants already had a reasonable to well level of ADL independence [38] [39]. We therefore
believe a ceiling-effect may have occurred.
The use of both the Barthel Index as well as the Short Physical Performance Battery within the current
thesis was chosen on the basis of previous studies [27, 30]. These studies concluded that the combination
of a self-report and a performance-based measure allows to obtain a more complete overview on
functional status. The results of this thesis indicate a relatively strong and highly significant correlation
between the two measures on a group level, but not on the individual level.
The results of this study should be interpreted in the light of some limitations. The first one is its non-
blinded design. Blinding of participants and researchers was not possible since product labels revealed
whether products were protein-enriched. Since participants were aware of group assignment and knew
about the goal of the study, it can be questioned whether this has influenced our results found on protein
intake. For example, participants in the intervention group may have over reported their use of the CwC
products, resulting in a higher protein intake than what was actually consumed. However, if this was the
case, we believe that the between-group differences in mean intake would be larger than those found in
the current thesis. Instead, the control group had a surprising high mean protein intake as compared to
what was expected on the basis of previous studies. This indicates that, if overreporting on protein intake
occurred, this happened in similar amount in both groups. Furthermore, any possible overreporting on
protein intake within the control group did not interfere with the proposed intervention effect, since the
observed difference in mean intake still exceeds the goal of 0,3 g/kg BW/day at all three time points.
31
A second limitation is that the measurements of participants were performed by different students,
which may have led to a large inter-observer variability. Training sessions were arranged to ensure that all
students knew how to perform the measurements and how to properly handle study equipment.
Furthermore, since each student measured participants in both groups, systematic errors and bias are
unlikely. A third limitation of this study is that we did not examine the effect of physical training. Apart
from an adequate protein intake also regular (resistance-type) exercise has been shown to be beneficial
for muscle mass and function of older adults [8, 47]. Therefore, for future studies it would be of interest
to examine whether functional status of older adults could possibly improve more when combining the
use of the CwC products with physical training.
In conclusion, these preliminary results of the CwC effect study indicate that supplementing a standard
home-based diet with a variety of CwC products is an effective approach for older individuals to achieve
the proposed recommended protein intake level of 1,2 – 1,5 g/kg BW/day. Moreover, from the current
results it appears that starting the use of the CwC products in the hospital and continuing to use them
after discharge, might help to maintain rather than improve functional status of older individuals.
However, due to the lack of power with the current sample size, this finding should be confirmed in the
final analysis of the effect study.
32
References
1. Giesbers, H., A. Verweij, and J.d. de Beer. Vergrijzing samengevat. In: Volksgezondheid Toekomst
Verkenning, Nationaal Kompas Volksgezondheid. Bilthoven: RIVM. 2013 [cited 2015 January 12]; Available from: http://www.nationaalkompas.nl/bevolking/vergrijzing/vergrijzing-samengevat/.
2. Inzitari, M., et al., Nutrition in the age-related disablement process. J Nutr Health Aging, 2011. 15(8): p. 599-604.
3. Health Council of the Netherlands, Undernutrition in the elderly. The Hague: Health Council of the Netherlands, 2011; publication no. 2011/32. 2011.
4. Norman, K., et al., Prognostic impact of disease-related malnutrition. Clin Nutr, 2008. 27(1): p. 5-15.
5. Morley, J.E., Sarcopenia in the elderly. Fam Pract, 2012. 29 Suppl 1: p. i44-i48. 6. Cruz-Jentoft, A.J., et al., Sarcopenia: European consensus on definition and diagnosis: Report of
the European Working Group on Sarcopenia in Older People. Age Ageing, 2010. 39(4): p. 412-23. 7. Rizzoli, R., et al., Quality of life in sarcopenia and frailty. Calcif Tissue Int, 2013. 93(2): p. 101-20. 8. Bauer, J., et al., Evidence-based recommendations for optimal dietary protein intake in older
people: a position paper from the PROT-AGE Study Group. J Am Med Dir Assoc, 2013. 14(8): p. 542-59.
9. Wolfe, R.R., S.L. Miller, and K.B. Miller, Optimal protein intake in the elderly. Clin Nutr, 2008. 27(5): p. 675-84.
10. Stelten, S., et al., Protein-enriched 'regular products' and their effect on protein intake in acute hospitalized older adults; a randomized controlled trial. Clin Nutr, 2014.
11. Neelemaat, F., et al., Post-discharge nutritional support in malnourished elderly individuals improves functional limitations. J Am Med Dir Assoc, 2011. 12(4): p. 295-301.
12. Nieuwenhuizen, W.F., et al., Older adults and patients in need of nutritional support: review of current treatment options and factors influencing nutritional intake. Clin Nutr, 2010. 29(2): p. 160-9.
13. Morley, J.E., Decreased food intake with aging. J Gerontol A Biol Sci Med Sci, 2001. 56 Spec No 2: p. 81-8.
14. Volkert, D., et al., ESPEN Guidelines on Enteral Nutrition: Geriatrics. Clin Nutr, 2006. 25(2): p. 330-60.
15. Milne, A.C., et al., Protein and energy supplementation in elderly people at risk from malnutrition. Cochrane Database Syst Rev, 2009(2): p. CD003288.
16. Cater with Care. Cater with Care. 2012; Available from: http://www.caterwithcare.nl/. 17. Neelemaat, F., et al., Oral nutritional support in malnourished elderly decreases functional
limitations with no extra costs. Clin Nutr, 2012. 31(2): p. 183-90. 18. Mahoney, F.I. and D.W. Barthel, Functional Evaluation: The Barthel Index. Md State Med J, 1965.
14: p. 61-5. 19. Hartigan, I., A comparative review of the Katz ADL and the Barthel Index in assessing the activities
of daily living of older people. Int J Older People Nurs, 2007. 2(3): p. 204-12. 20. McMurdo, M.E., et al., Should oral nutritional supplementation be given to undernourished older
people upon hospital discharge? A controlled trial. J Am Geriatr Soc, 2009. 57(12): p. 2239-45. 21. Wouters-Wesseling, W., et al., Study of the effect of a liquid nutrition supplement on the
nutritional status of psycho-geriatric nursing home patients. Eur J Clin Nutr, 2002. 56(3): p. 245-51.
22. Smoliner, C., et al., Effects of food fortification on nutritional and functional status in frail elderly nursing home residents at risk of malnutrition. Nutrition, 2008. 24(11-12): p. 1139-44.
23. Lee, L.C., A.C. Tsai, and J.Y. Wang, Need-based nutritional intervention is effective in improving handgrip strength and Barthel Index scores of older people living in a nursing home: A randomized controlled trial. Int J Nurs Stud, 2015.
24. de Morton, N.A., J.L. Keating, and M. Davidson, Rasch analysis of the barthel index in the assessment of hospitalized older patients after admission for an acute medical condition. Arch Phys Med Rehabil, 2008. 89(4): p. 641-7.
33
25. Quinn, T.J., P. Langhorne, and D.J. Stott, Barthel index for stroke trials: development, properties, and application. Stroke, 2011. 42(4): p. 1146-51.
26. Brach, J.S., et al., Identifying early decline of physical function in community-dwelling older women: performance-based and self-report measures. Phys Ther, 2002. 82(4): p. 320-8.
27. Reuben, D.B., et al., Refining the categorization of physical functional status: the added value of combining self-reported and performance-based measures. J Gerontol A Biol Sci Med Sci, 2004. 59(10): p. 1056-61.
28. Hoeymans, N., et al., Measuring functional status: cross-sectional and longitudinal associations between performance and self-report (Zutphen Elderly Study 1990-1993). J Clin Epidemiol, 1996. 49(10): p. 1103-10.
29. Guralnik, J.M., et al., A short physical performance battery assessing lower extremity function: association with self-reported disability and prediction of mortality and nursing home admission. J Gerontol, 1994. 49(2): p. M85-94.
30. Latham, N.K., et al., Performance-based or self-report measures of physical function: which should be used in clinical trials of hip fracture patients? Arch Phys Med Rehabil, 2008. 89(11): p. 2146-55.
31. Volpato, S., et al., Predictive value of the Short Physical Performance Battery following hospitalization in older patients. J Gerontol A Biol Sci Med Sci, 2011. 66(1): p. 89-96.
32. Ostir, G.V., et al., Reliability and sensitivity to change assessed for a summary measure of lower body function: results from the Women's Health and Aging Study. J Clin Epidemiol, 2002. 55(9): p. 916-21.
33. Tieland, M., et al., Protein supplementation improves physical performance in frail elderly people: a randomized, double-blind, placebo-controlled trial. J Am Med Dir Assoc, 2012. 13(8): p. 720-6.
34. Kim, C.O. and K.R. Lee, Preventive effect of protein-energy supplementation on the functional decline of frail older adults with low socioeconomic status: a community-based randomized controlled study. J Gerontol A Biol Sci Med Sci, 2013. 68(3): p. 309-16.
35. National Institute for Public Health and the Environment (RIVM). NEVO-online versie 2013/4.0, RIVM, Bilthoven, 2013. Available from: http://nevo-online.rivm.nl/.
36. Weijs, P.J., H.P. Sauerwein, and J. Kondrup, Protein recommendations in the ICU: g protein/kg body weight - which body weight for underweight and obese patients? Clin Nutr, 2012. 31(5): p. 774-5.
37. Ocke MC, B.-R.E., de Boer EJ, Wilson-van den Hooven C, Etemad-Ghameslou Z, Drijvers JJMM, van Rossum CTM, Diet of community-dwelling older adults : Dutch National Food Consumption Survey Older adults 2010-2012. 2013.
38. Post, M., Van Asbeck, FWA., Van Dijk, AJ., Schrijvers, AJP. , Nederlandse interviewversie van de Barthel-index onderzocht by dwarslaesiepatiënten. Nederlands Tijdschrift voor Geneeskunde, 1995. 139(27).
39. De Haan, R., Limburg, M., Schuling, J., Broeshart, J., Jonkers, L., Van Zuylen, P. , Klinimetriche evaluatie van de Barthel-index, een maat voor beperkingen in het dagelijks functioneren. Nederlands Tijdschrift voor Geneeskunde, 1993. 137(18).
40. Guigoz, Y., The Mini Nutritional Assessment (MNA) review of the literature--What does it tell us? J Nutr Health Aging, 2006. 10(6): p. 466-85; discussion 485-7.
41. Ryan, T., P. Enderby, and A.S. Rigby, A randomized controlled trial to evaluate intensity of community-based rehabilitation provision following stroke or hip fracture in old age. Clin Rehabil, 2006. 20(2): p. 123-31.
42. Hsieh, Y.W., et al., Establishing the minimal clinically important difference of the Barthel Index in stroke patients. Neurorehabil Neural Repair, 2007. 21(3): p. 233-8.
43. Perera, S., et al., Meaningful change and responsiveness in common physical performance measures in older adults. J Am Geriatr Soc, 2006. 54(5): p. 743-9.
44. Health Council of the Netherlands, Dietary reference intakes: energy, proteins, fats, and digestible carbohydrates. 2001: The Hague: Health Council of the Netherlands.
45. van Til, A.J., et al., Effects of the daily consumption of protein enriched bread and protein enriched drinking yoghurt on the total protein intake in older adults in a rehabilitation centre: a single blind randomised controlled trial. J Nutr Health Aging, 2015. 19(5): p. 525-30.

34
46. Halton, T.L. and F.B. Hu, The effects of high protein diets on thermogenesis, satiety and weight loss: a critical review. J Am Coll Nutr, 2004. 23(5): p. 373-85.
47. Deutz, N.E., et al., Protein intake and exercise for optimal muscle function with aging: recommendations from the ESPEN Expert Group. Clin Nutr, 2014. 33(6): p. 929-36.
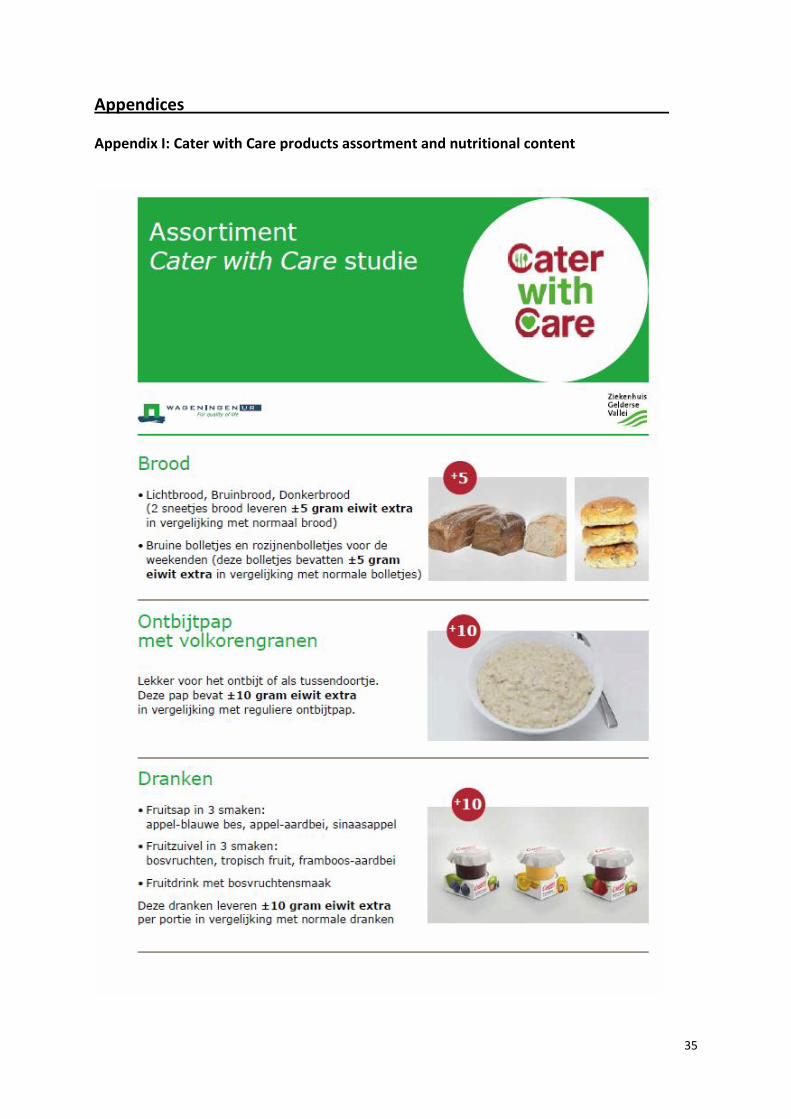
35
Appendices
Appendix I: Cater with Care products assortment and nutritional content

36
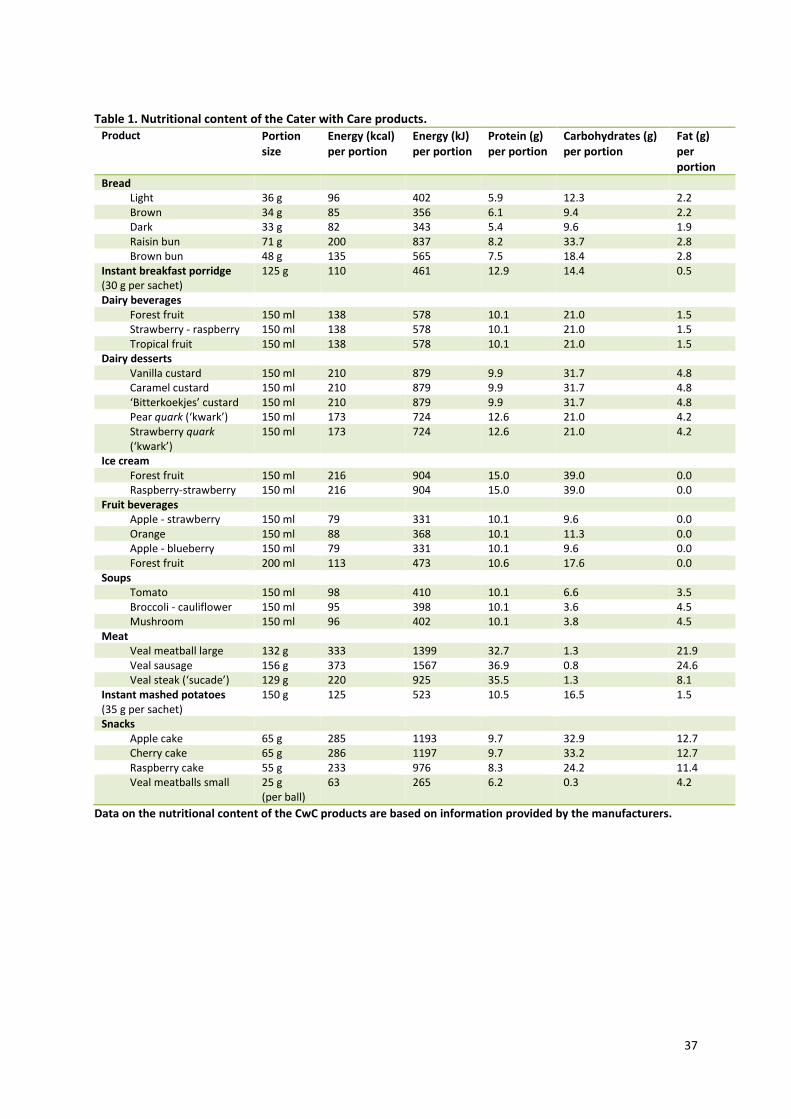
37
Table 1. Nutritional content of the Cater with Care products.
Product Portion size
Energy (kcal) per portion
Energy (kJ) per portion
Protein (g) per portion
Carbohydrates (g) per portion
Fat (g) per portion
Bread Light 36 g 96 402 5.9 12.3 2.2 Brown 34 g 85 356 6.1 9.4 2.2 Dark 33 g 82 343 5.4 9.6 1.9 Raisin bun 71 g 200 837 8.2 33.7 2.8 Brown bun 48 g 135 565 7.5 18.4 2.8
Instant breakfast porridge (30 g per sachet)
125 g 110 461 12.9 14.4 0.5
Dairy beverages Forest fruit 150 ml 138 578 10.1 21.0 1.5 Strawberry - raspberry 150 ml 138 578 10.1 21.0 1.5 Tropical fruit 150 ml 138 578 10.1 21.0 1.5
Dairy desserts Vanilla custard 150 ml 210 879 9.9 31.7 4.8 Caramel custard 150 ml 210 879 9.9 31.7 4.8 ‘Bitterkoekjes’ custard 150 ml 210 879 9.9 31.7 4.8 Pear quark (‘kwark’) 150 ml 173 724 12.6 21.0 4.2 Strawberry quark (‘kwark’)
150 ml 173 724 12.6 21.0 4.2
Ice cream Forest fruit 150 ml 216 904 15.0 39.0 0.0 Raspberry-strawberry 150 ml 216 904 15.0 39.0 0.0
Fruit beverages Apple - strawberry 150 ml 79 331 10.1 9.6 0.0 Orange 150 ml 88 368 10.1 11.3 0.0 Apple - blueberry 150 ml 79 331 10.1 9.6 0.0 Forest fruit 200 ml 113 473 10.6 17.6 0.0
Soups Tomato 150 ml 98 410 10.1 6.6 3.5 Broccoli - cauliflower 150 ml 95 398 10.1 3.6 4.5 Mushroom 150 ml 96 402 10.1 3.8 4.5
Meat Veal meatball large 132 g 333 1399 32.7 1.3 21.9 Veal sausage 156 g 373 1567 36.9 0.8 24.6 Veal steak (‘sucade’) 129 g 220 925 35.5 1.3 8.1
Instant mashed potatoes (35 g per sachet)
150 g 125 523 10.5 16.5 1.5
Snacks Apple cake 65 g 285 1193 9.7 32.9 12.7 Cherry cake 65 g 286 1197 9.7 33.2 12.7 Raspberry cake 55 g 233 976 8.3 24.2 11.4 Veal meatballs small 25 g
(per ball) 63 265 6.2 0.3 4.2
Data on the nutritional content of the CwC products are based on information provided by the manufacturers.

38
Appendix II: Control products assortment and nutritional content
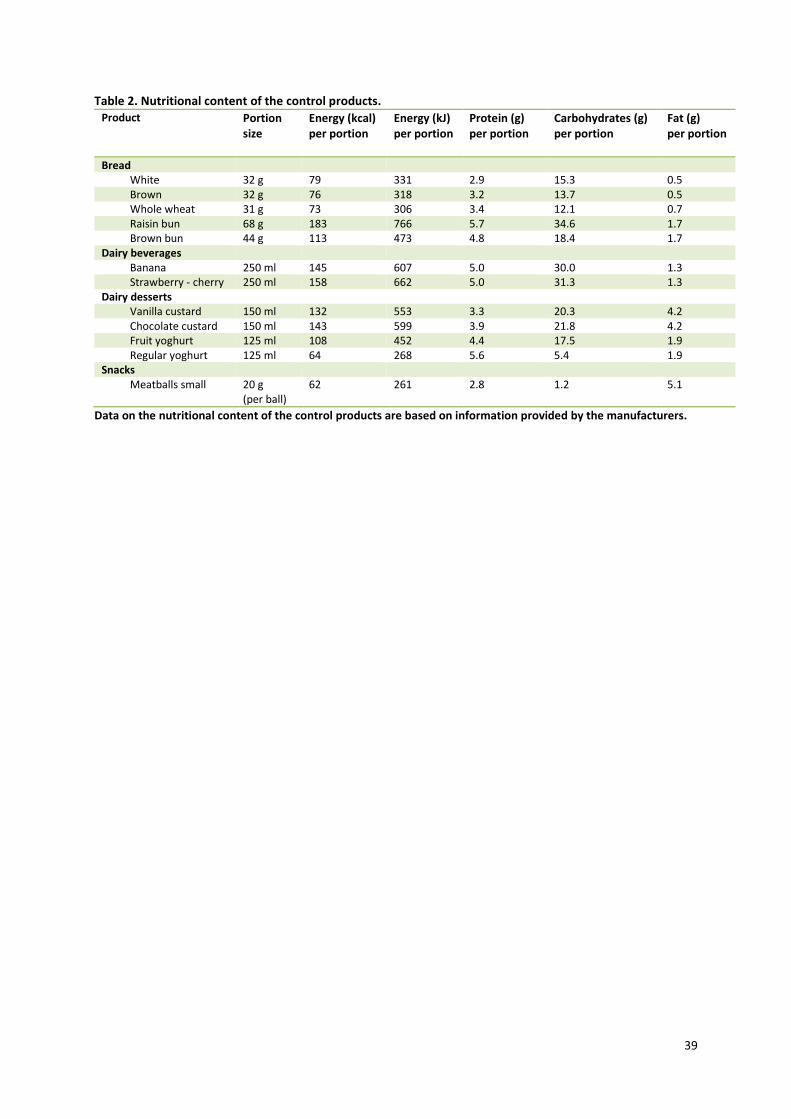
39
Table 2. Nutritional content of the control products. Product Portion
size Energy (kcal) per portion
Energy (kJ) per portion
Protein (g) per portion
Carbohydrates (g) per portion
Fat (g) per portion
Bread White 32 g 79 331 2.9 15.3 0.5 Brown 32 g 76 318 3.2 13.7 0.5 Whole wheat 31 g 73 306 3.4 12.1 0.7 Raisin bun 68 g 183 766 5.7 34.6 1.7 Brown bun 44 g 113 473 4.8 18.4 1.7
Dairy beverages Banana 250 ml 145 607 5.0 30.0 1.3 Strawberry - cherry 250 ml 158 662 5.0 31.3 1.3
Dairy desserts Vanilla custard 150 ml 132 553 3.3 20.3 4.2 Chocolate custard 150 ml 143 599 3.9 21.8 4.2 Fruit yoghurt 125 ml 108 452 4.4 17.5 1.9 Regular yoghurt 125 ml 64 268 5.6 5.4 1.9
Snacks Meatballs small 20 g
(per ball) 62 261 2.8 1.2 5.1
Data on the nutritional content of the control products are based on information provided by the manufacturers.
40
Appendix III: Dietary food record

41

42

43
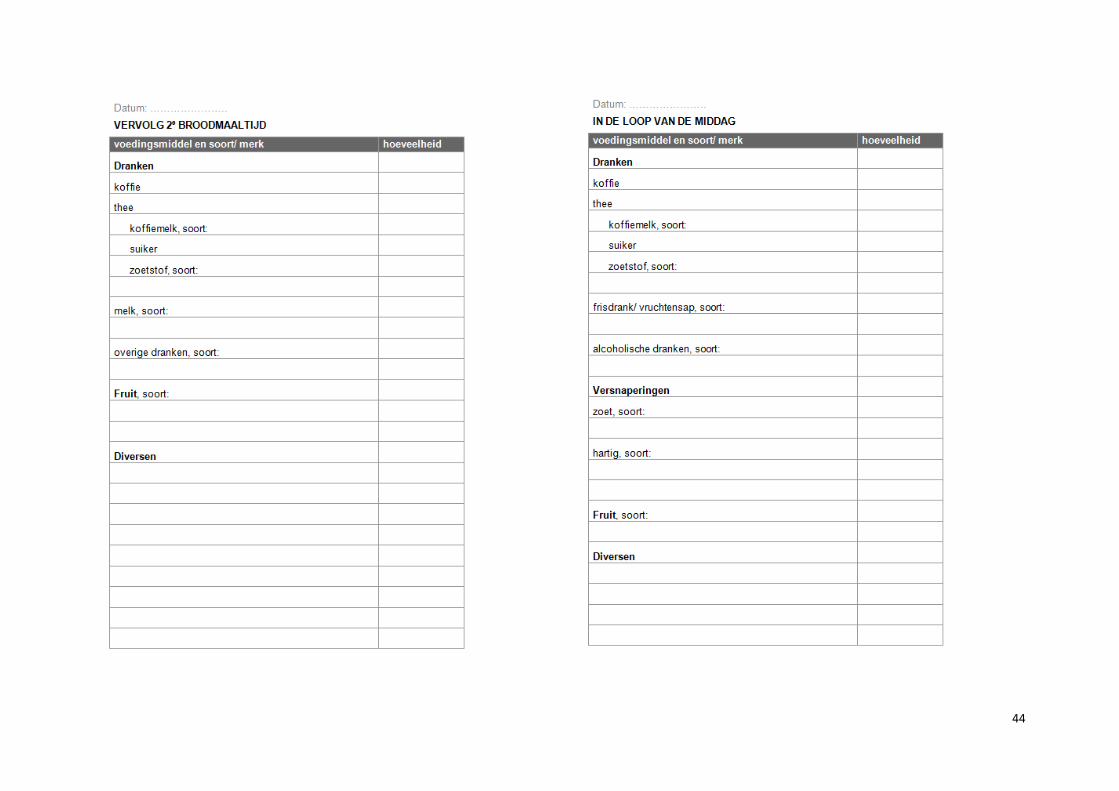
44

45

46
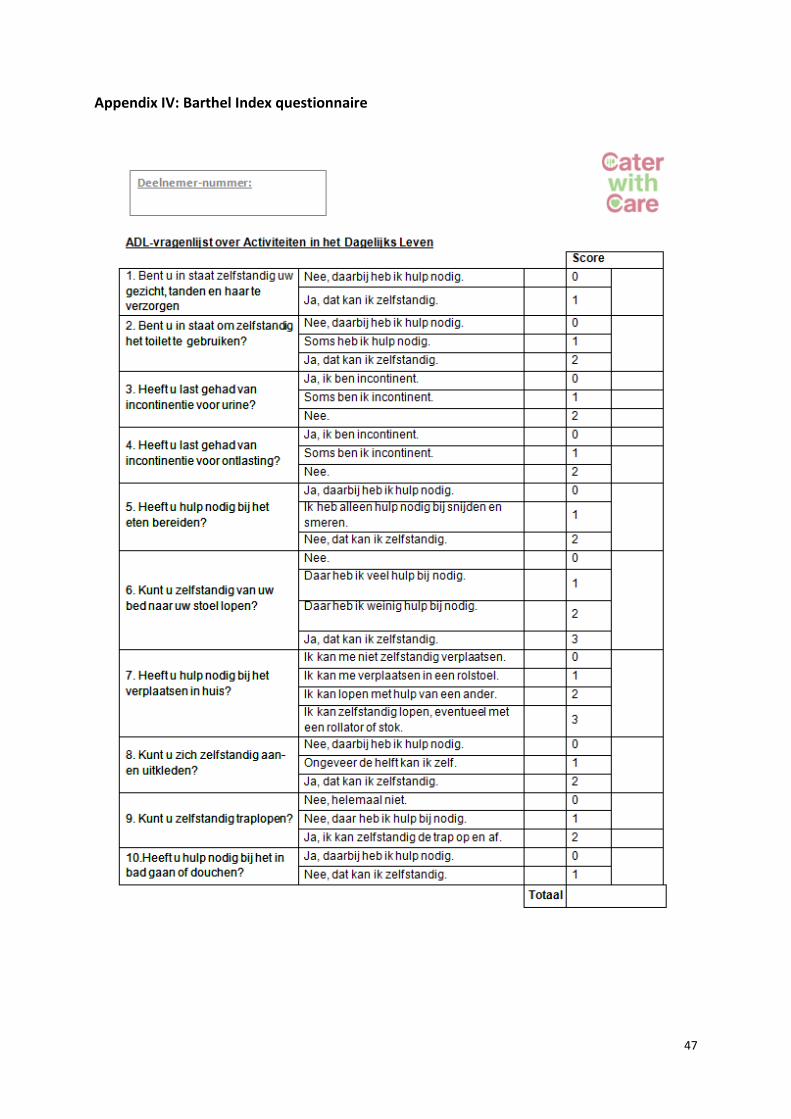
47
Appendix IV: Barthel Index questionnaire

48
Appendix V: Instructions and scoring criteria Short Physical Performance Battery

49

50

51
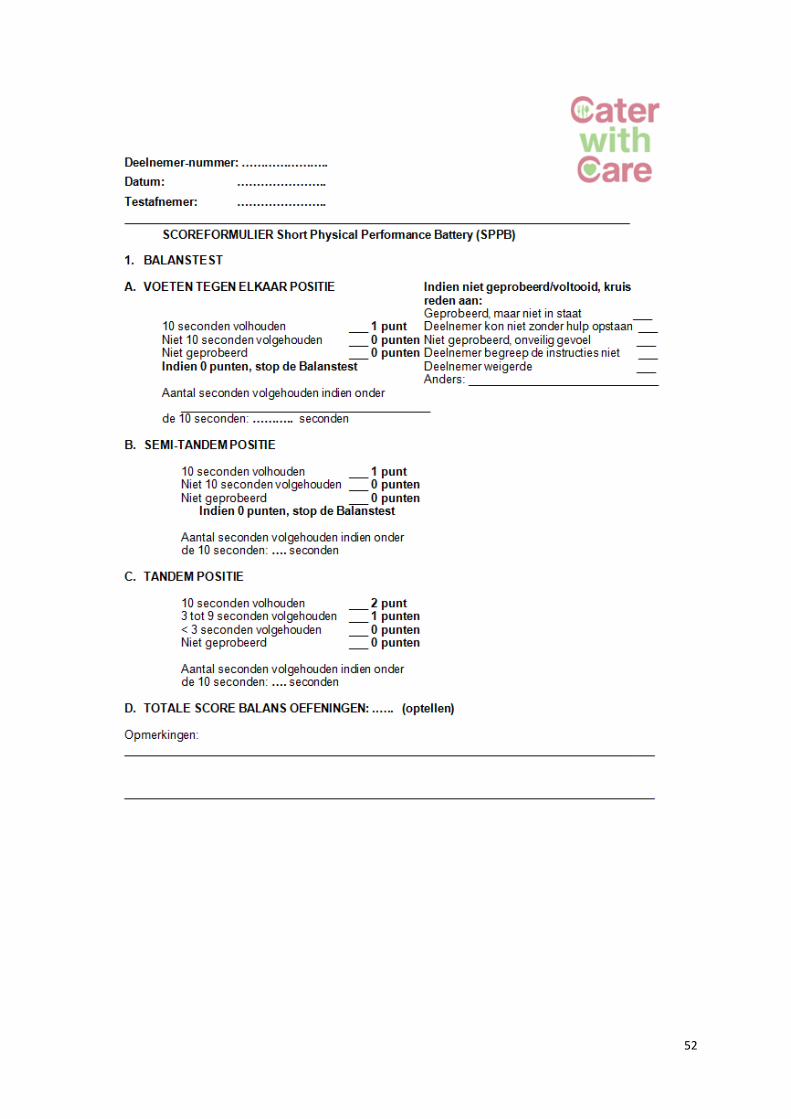
52

53

54

55
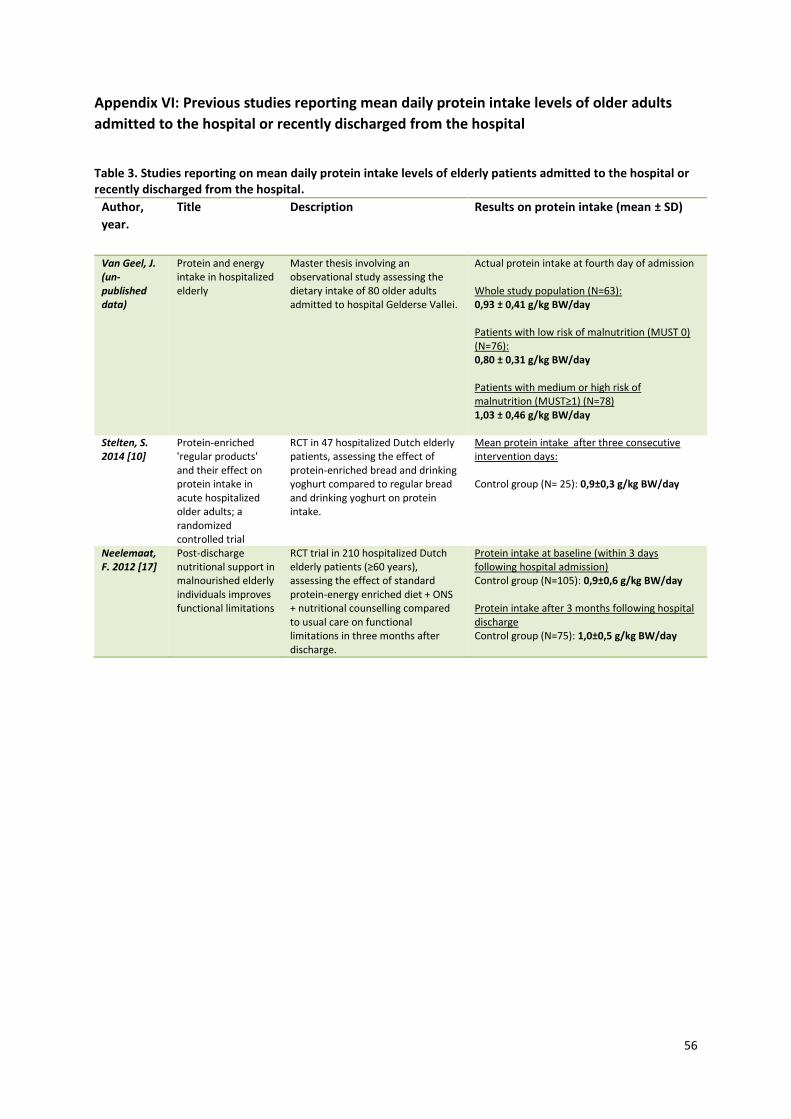
56
Appendix VI: Previous studies reporting mean daily protein intake levels of older adults
admitted to the hospital or recently discharged from the hospital
Table 3. Studies reporting on mean daily protein intake levels of elderly patients admitted to the hospital or recently discharged from the hospital.
Author,
year.
Title Description Results on protein intake (mean ± SD)
Van Geel, J. (un-published data)
Protein and energy intake in hospitalized elderly
Master thesis involving an observational study assessing the dietary intake of 80 older adults admitted to hospital Gelderse Vallei.
Actual protein intake at fourth day of admission Whole study population (N=63): 0,93 ± 0,41 g/kg BW/day Patients with low risk of malnutrition (MUST 0) (N=76): 0,80 ± 0,31 g/kg BW/day Patients with medium or high risk of malnutrition (MUST≥1) (N=78) 1,03 ± 0,46 g/kg BW/day
Stelten, S. 2014 [10]
Protein-enriched 'regular products' and their effect on protein intake in acute hospitalized older adults; a randomized controlled trial
RCT in 47 hospitalized Dutch elderly patients, assessing the effect of protein-enriched bread and drinking yoghurt compared to regular bread and drinking yoghurt on protein intake.
Mean protein intake after three consecutive intervention days: Control group (N= 25): 0,9±0,3 g/kg BW/day
Neelemaat, F. 2012 [17]
Post-discharge nutritional support in malnourished elderly individuals improves functional limitations
RCT trial in 210 hospitalized Dutch elderly patients (≥60 years), assessing the effect of standard protein-energy enriched diet + ONS + nutritional counselling compared to usual care on functional limitations in three months after discharge.
Protein intake at baseline (within 3 days following hospital admission) Control group (N=105): 0,9±0,6 g/kg BW/day Protein intake after 3 months following hospital discharge Control group (N=75): 1,0±0,5 g/kg BW/day
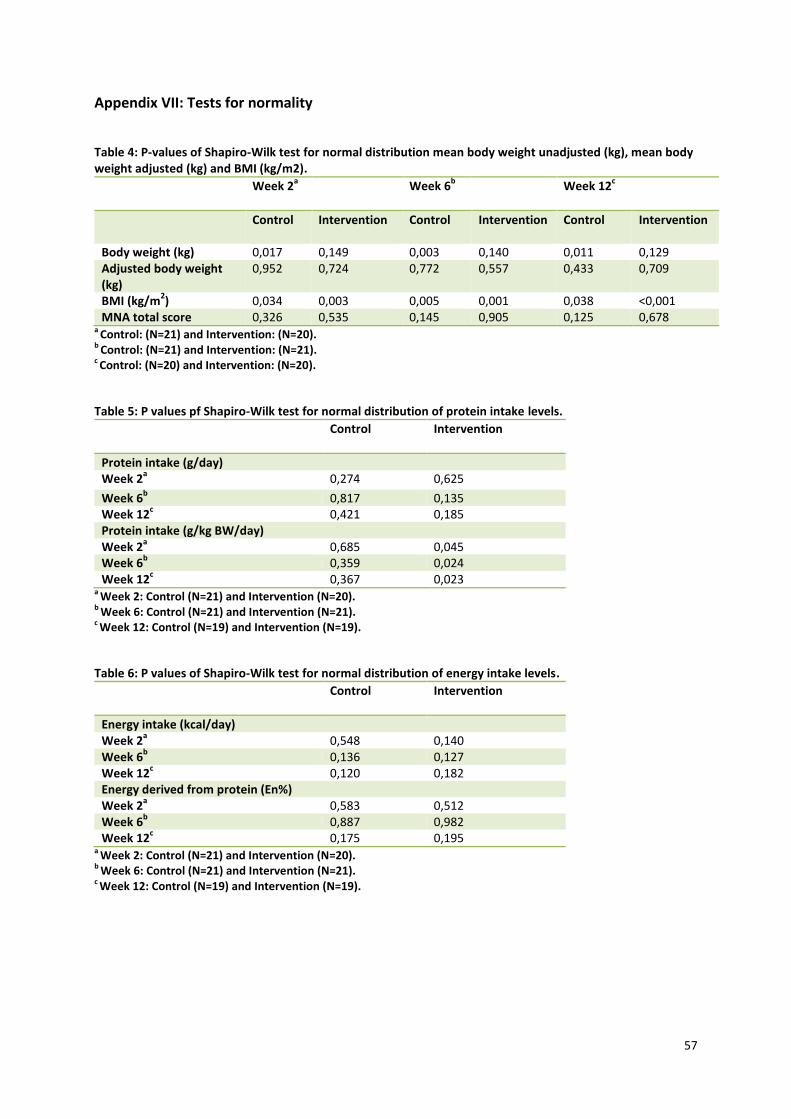
57
Appendix VII: Tests for normality
Table 4: P-values of Shapiro-Wilk test for normal distribution mean body weight unadjusted (kg), mean body weight adjusted (kg) and BMI (kg/m2).
Week 2a
Week 6b
Week 12c
Control
Intervention
Control
Intervention
Control
Intervention
Body weight (kg) 0,017 0,149 0,003 0,140 0,011 0,129 Adjusted body weight (kg)
0,952 0,724 0,772 0,557 0,433 0,709
BMI (kg/m2) 0,034 0,003 0,005 0,001 0,038 <0,001
MNA total score 0,326 0,535 0,145 0,905 0,125 0,678 a Control: (N=21) and Intervention: (N=20). b Control: (N=21) and Intervention: (N=21). c Control: (N=20) and Intervention: (N=20).
Table 5: P values pf Shapiro-Wilk test for normal distribution of protein intake levels.
Control
Intervention
Protein intake (g/day) Week 2
a 0,274 0,625
Week 6b
0,817 0,135 Week 12
c 0,421 0,185
Protein intake (g/kg BW/day) Week 2
a 0,685 0,045
Week 6b
0,359 0,024 Week 12
c 0,367 0,023
a Week 2: Control (N=21) and Intervention (N=20). b Week 6: Control (N=21) and Intervention (N=21). c Week 12: Control (N=19) and Intervention (N=19).
Table 6: P values of Shapiro-Wilk test for normal distribution of energy intake levels.
Control
Intervention
Energy intake (kcal/day) Week 2
a 0,548 0,140
Week 6b
0,136 0,127 Week 12
c 0,120 0,182
Energy derived from protein (En%) Week 2
a 0,583 0,512
Week 6b
0,887 0,982 Week 12
c 0,175 0,195
a Week 2: Control (N=21) and Intervention (N=20). b Week 6: Control (N=21) and Intervention (N=21). c Week 12: Control (N=19) and Intervention (N=19).
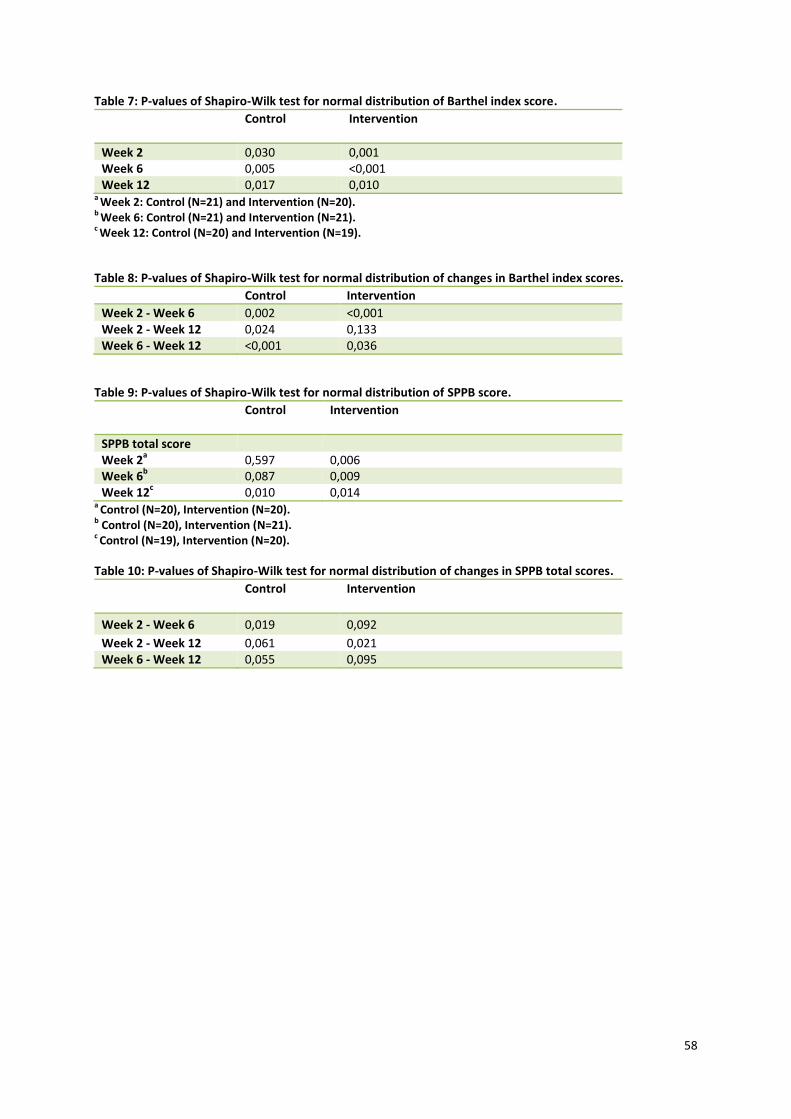
58
Table 7: P-values of Shapiro-Wilk test for normal distribution of Barthel index score.
Control
Intervention
Week 2 0,030 0,001 Week 6 0,005 <0,001 Week 12 0,017 0,010
a Week 2: Control (N=21) and Intervention (N=20). b Week 6: Control (N=21) and Intervention (N=21). c Week 12: Control (N=20) and Intervention (N=19).
Table 8: P-values of Shapiro-Wilk test for normal distribution of changes in Barthel index scores.
Control Intervention
Week 2 - Week 6 0,002 <0,001 Week 2 - Week 12 0,024 0,133 Week 6 - Week 12 <0,001 0,036
Table 9: P-values of Shapiro-Wilk test for normal distribution of SPPB score.
Control
Intervention
SPPB total score Week 2
a 0,597 0,006
Week 6b
0,087 0,009 Week 12
c 0,010 0,014
a Control (N=20), Intervention (N=20). b Control (N=20), Intervention (N=21). c Control (N=19), Intervention (N=20).
Table 10: P-values of Shapiro-Wilk test for normal distribution of changes in SPPB total scores.
Control Intervention
Week 2 - Week 6 0,019 0,092
Week 2 - Week 12 0,061 0,021 Week 6 - Week 12 0,055 0,095
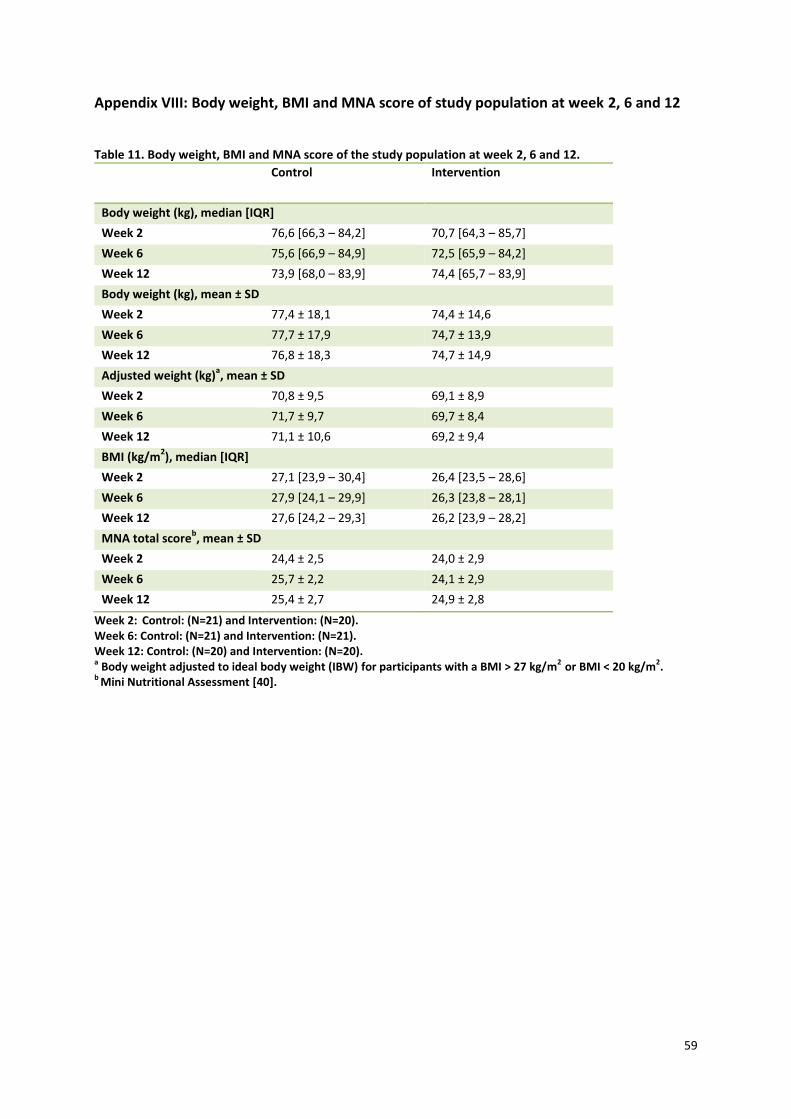
59
Appendix VIII: Body weight, BMI and MNA score of study population at week 2, 6 and 12 Table 11. Body weight, BMI and MNA score of the study population at week 2, 6 and 12.
Control
Intervention
Body weight (kg), median [IQR]
Week 2 76,6 [66,3 – 84,2] 70,7 [64,3 – 85,7]
Week 6 75,6 [66,9 – 84,9] 72,5 [65,9 – 84,2]
Week 12 73,9 [68,0 – 83,9] 74,4 [65,7 – 83,9]
Body weight (kg), mean ± SD
Week 2 77,4 ± 18,1 74,4 ± 14,6
Week 6 77,7 ± 17,9 74,7 ± 13,9
Week 12 76,8 ± 18,3 74,7 ± 14,9
Adjusted weight (kg)a, mean ± SD
Week 2 70,8 ± 9,5 69,1 ± 8,9
Week 6 71,7 ± 9,7 69,7 ± 8,4
Week 12 71,1 ± 10,6 69,2 ± 9,4
BMI (kg/m2), median [IQR]
Week 2 27,1 [23,9 – 30,4] 26,4 [23,5 – 28,6]
Week 6 27,9 [24,1 – 29,9] 26,3 [23,8 – 28,1]
Week 12 27,6 [24,2 – 29,3] 26,2 [23,9 – 28,2]
MNA total scoreb, mean ± SD
Week 2 24,4 ± 2,5 24,0 ± 2,9
Week 6 25,7 ± 2,2 24,1 ± 2,9
Week 12 25,4 ± 2,7 24,9 ± 2,8
Week 2: Control: (N=21) and Intervention: (N=20). Week 6: Control: (N=21) and Intervention: (N=21). Week 12: Control: (N=20) and Intervention: (N=20). a Body weight adjusted to ideal body weight (IBW) for participants with a BMI > 27 kg/m2 or BMI < 20 kg/m2. b Mini Nutritional Assessment [40].
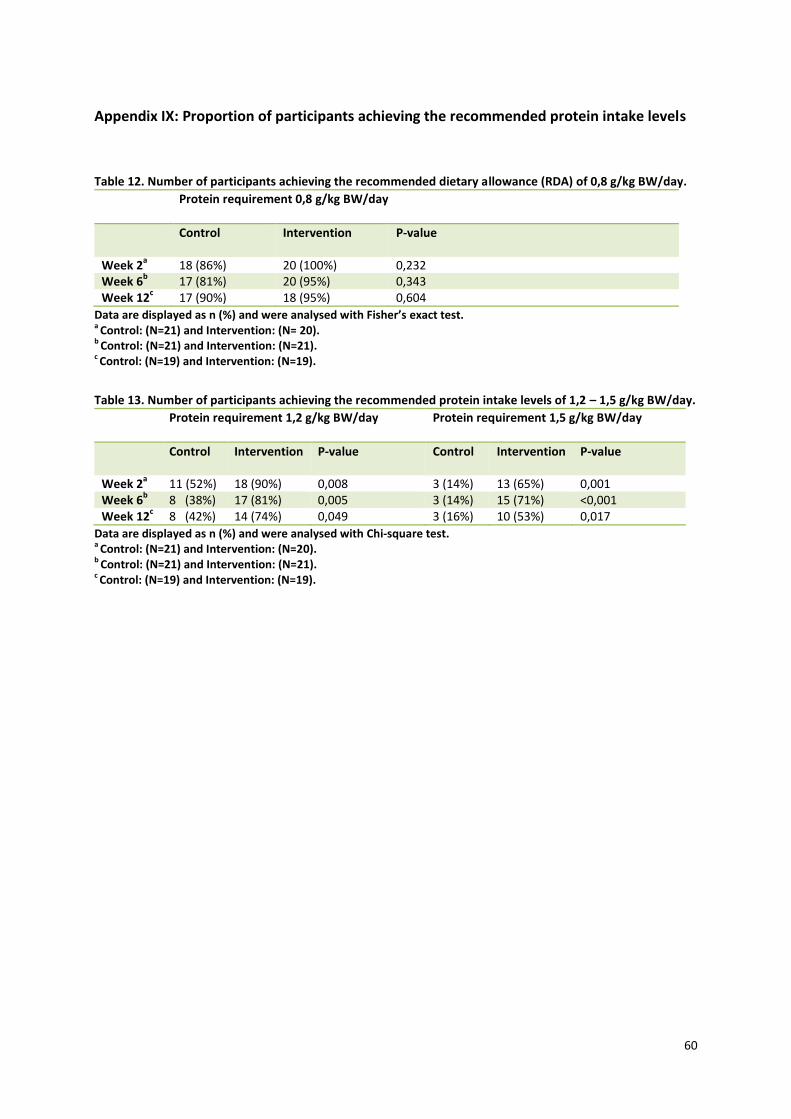
60
Appendix IX: Proportion of participants achieving the recommended protein intake levels
Table 12. Number of participants achieving the recommended dietary allowance (RDA) of 0,8 g/kg BW/day.
Protein requirement 0,8 g/kg BW/day
Control
Intervention
P-value
Week 2a
18 (86%) 20 (100%) 0,232 Week 6
b 17 (81%) 20 (95%) 0,343
Week 12c
17 (90%) 18 (95%) 0,604
Data are displayed as n (%) and were analysed with Fisher’s exact test. a Control: (N=21) and Intervention: (N= 20). b Control: (N=21) and Intervention: (N=21). c Control: (N=19) and Intervention: (N=19).
Table 13. Number of participants achieving the recommended protein intake levels of 1,2 – 1,5 g/kg BW/day.
Protein requirement 1,2 g/kg BW/day Protein requirement 1,5 g/kg BW/day
Control
Intervention
P-value Control
Intervention
P-value
Week 2a
11 (52%) 18 (90%) 0,008 3 (14%) 13 (65%) 0,001 Week 6
b 8 (38%) 17 (81%) 0,005 3 (14%) 15 (71%) <0,001
Week 12c
8 (42%) 14 (74%) 0,049 3 (16%) 10 (53%) 0,017
Data are displayed as n (%) and were analysed with Chi-square test. a Control: (N=21) and Intervention: (N=20). b Control: (N=21) and Intervention: (N=21). c Control: (N=19) and Intervention: (N=19).
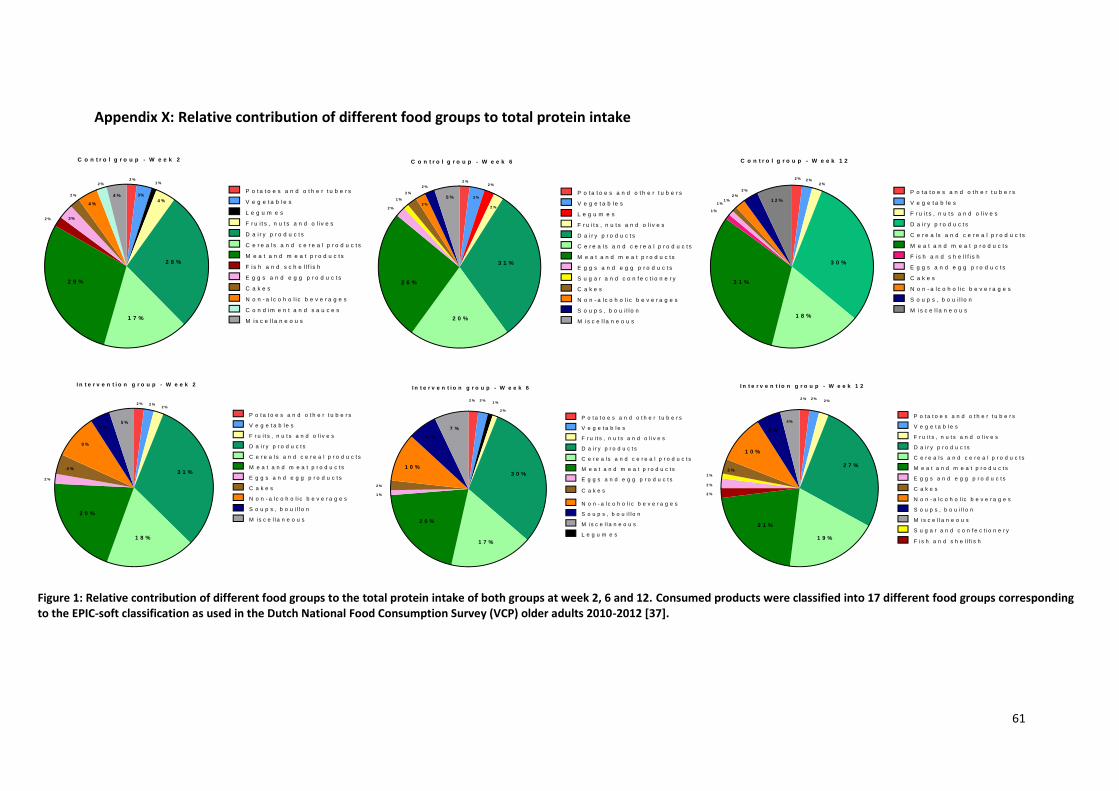
61
Appendix X: Relative contribution of different food groups to total protein intake
P o t a t o e s a n d o t h e r t u b e r s
V e g e t a b l e s
L e g u m e s
F r u i t s , n u t s a n d o l i v e s
D a i r y p r o d u c t s
C e r e a l s a n d c e r e a l p r o d u c t s
M e a t a n d m e a t p r o d u c t s
F i s h a n d s c h e l l f i s h
E g g s a n d e g g p r o d u c t s
C a k e s
N o n - a l c o h o l i c b e v e r a g e s
C o n d im e n t a n d s a u c e s
M is c e l l a n e o u s
2 8 %
1 7 %
2 9 %
4 %
1 %
3%4 %
4 %
3%
2 %
2 %
2 %
2 %
C o n t r o l g r o u p - W e e k 2
P o t a t o e s a n d o t h e r t u b e r s
V e g e t a b l e s
L e g u m e s
F r u i t s , n u t s a n d o l i v e s
D a i r y p r o d u c t s
C e r e a l s a n d c e r e a l p r o d u c t s
M e a t a n d m e a t p r o d u c t s
E g g s a n d e g g p r o d u c t s
S u g a r a n d c o n f e c t i o n e r y
C a k e s
N o n - a l c o h o l i c b e v e r a g e s
3 1 %
2 0 %
2 6 %
2 %
2 %
3 %5 %
2 %
1 %
2 %
2 %
2 %
2 %
C o n t r o l g r o u p - W e e k 6
S o u p s , b o u i l l o n
M is c e l l a n e o u s
P o t a t o e s a n d o t h e r t u b e r s
V e g e t a b l e s
F r u i t s , n u t s a n d o l i v e s
D a i r y p r o d u c t s
C e r e a l s a n d c e r e a l p r o d u c t s
M e a t a n d m e a t p r o d u c t s
F i s h a n d s h e l l f i s h
E g g s a n d e g g p r o d u c t s
C a k e s
N o n - a l c o h o l i c b e v e r a g e s
3 0 %
1 8 %
3 1 %
2 %2 %
1 2 %
3 %
1 %
2 %
2 %
1 %
C o n t r o l g r o u p - W e e k 1 2
S o u p s , b o u i l l o n
M is c e l l a n e o u s
1 %
P o t a t o e s a n d o t h e r t u b e r s
V e g e t a b l e s
F r u i t s , n u t s a n d o l i v e s
D a i r y p r o d u c t s
C e r e a l s a n d c e r e a l p r o d u c t s
M e a t a n d m e a t p r o d u c t s
E g g s a n d e g g p r o d u c t s
C a k e s
N o n - a l c o h o l i c b e v e r a g e s
3 1 %
1 8 %
2 0 %
2 %2 %
5 %4 %
9 %
2 %
2 %
4 %
I n t e r v e n t i o n g r o u p - W e e k 2
S o u p s , b o u i l l o n
M is c e l l a n e o u s
P o t a t o e s a n d o t h e r t u b e r s
V e g e t a b l e s
F r u i t s , n u t s a n d o l i v e s
D a i r y p r o d u c t s
C e r e a l s a n d c e r e a l p r o d u c t s
M e a t a n d m e a t p r o d u c t s
E g g s a n d e g g p r o d u c t s
C a k e s
N o n - a l c o h o l i c b e v e r a g e s
3 0 %
1 7 %
2 0 %
2 %
2 %
7 %
2 %
2 %
1 0 %
I n t e r v e n t i o n g r o u p - W e e k 6
S o u p s , b o u i l l o n
M is c e l l a n e o u s
L e g u m e s
6 %
1 %
1 %
P o t a t o e s a n d o t h e r t u b e r s
V e g e t a b l e s
F r u i t s , n u t s a n d o l i v e s
D a i r y p r o d u c t s
C e r e a l s a n d c e r e a l p r o d u c t s
M e a t a n d m e a t p r o d u c t s
E g g s a n d e g g p r o d u c t s
C a k e s
N o n - a l c o h o l i c b e v e r a g e s
2 7 %
1 9 %
2 1 %
2 %
5 %
2 %
2 %
3 %
I n t e r v e n t i o n g r o u p - W e e k 1 2
S o u p s , b o u i l l o n
M is c e l l a n e o u s
1 0 %
2 %
2 %
F i s h a n d s h e l l f i s h
S u g a r a n d c o n f e c t i o n e r y
1 %
4%
Figure 1: Relative contribution of different food groups to the total protein intake of both groups at week 2, 6 and 12. Consumed products were classified into 17 different food groups corresponding to the EPIC-soft classification as used in the Dutch National Food Consumption Survey (VCP) older adults 2010-2012 [37].
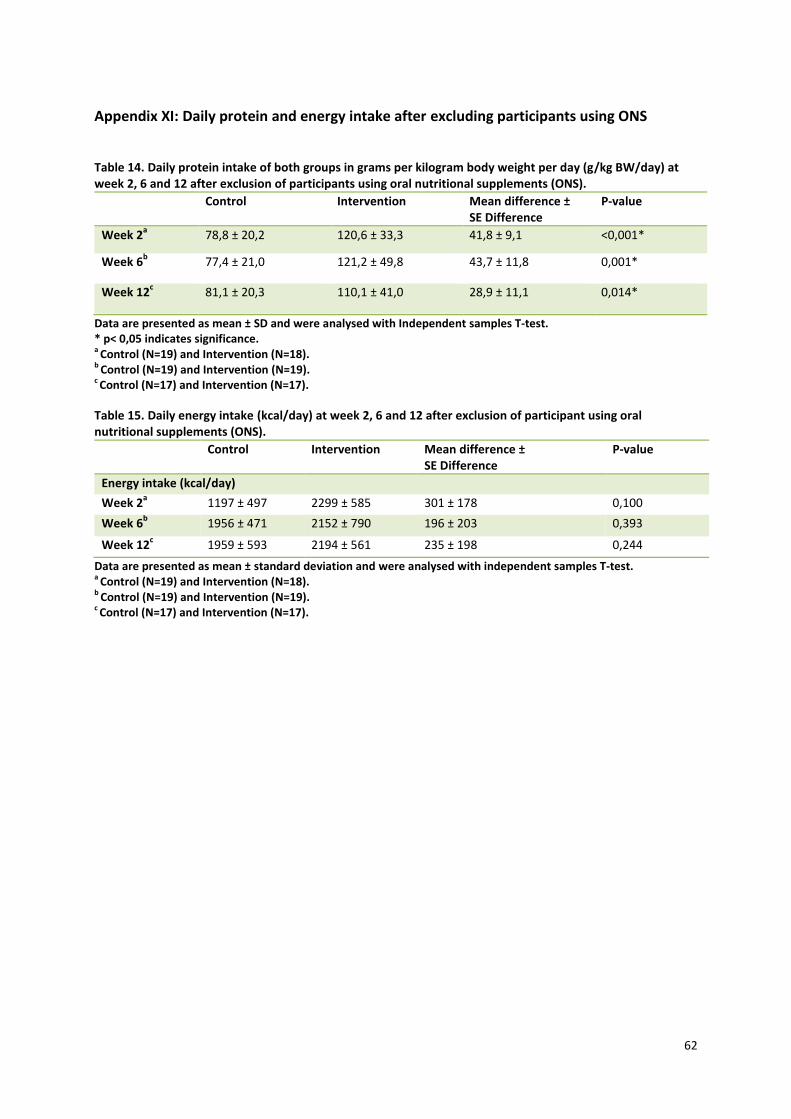
62
Appendix XI: Daily protein and energy intake after excluding participants using ONS
Table 14. Daily protein intake of both groups in grams per kilogram body weight per day (g/kg BW/day) at week 2, 6 and 12 after exclusion of participants using oral nutritional supplements (ONS).
Control
Intervention
Mean difference ± SE Difference
P-value
Week 2a 78,8 ± 20,2 120,6 ± 33,3 41,8 ± 9,1 <0,001*
Week 6b
77,4 ± 21,0 121,2 ± 49,8 43,7 ± 11,8 0,001*
Week 12c
81,1 ± 20,3 110,1 ± 41,0 28,9 ± 11,1 0,014*
Data are presented as mean ± SD and were analysed with Independent samples T-test. * p< 0,05 indicates significance. a Control (N=19) and Intervention (N=18). b Control (N=19) and Intervention (N=19). c Control (N=17) and Intervention (N=17).
Table 15. Daily energy intake (kcal/day) at week 2, 6 and 12 after exclusion of participant using oral nutritional supplements (ONS).
Control
Intervention Mean difference ± SE Difference
P-value
Energy intake (kcal/day)
Week 2a 1197 ± 497 2299 ± 585 301 ± 178 0,100
Week 6b
1956 ± 471 2152 ± 790 196 ± 203 0,393
Week 12c
1959 ± 593 2194 ± 561 235 ± 198 0,244
Data are presented as mean ± standard deviation and were analysed with independent samples T-test. a Control (N=19) and Intervention (N=18). b Control (N=19) and Intervention (N=19). c Control (N=17) and Intervention (N=17).
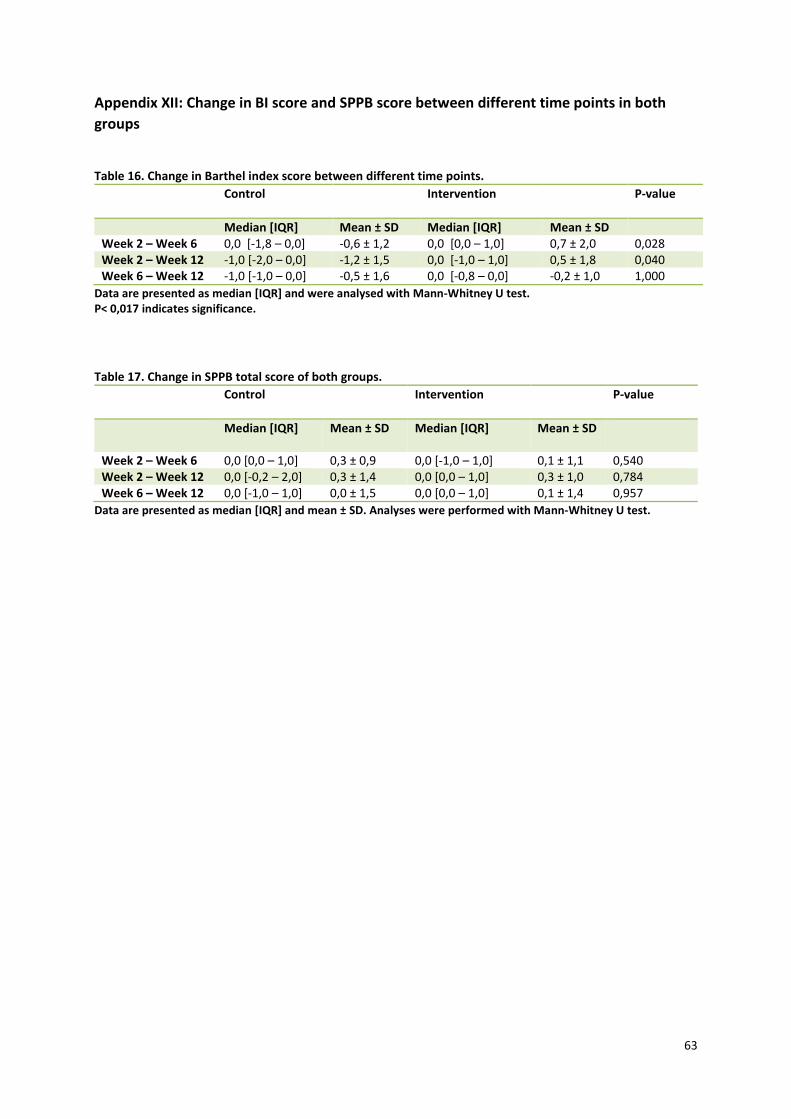
63
Appendix XII: Change in BI score and SPPB score between different time points in both
groups
Table 16. Change in Barthel index score between different time points.
Control
Intervention
P-value
Median [IQR] Mean ± SD Median [IQR] Mean ± SD Week 2 – Week 6 0,0 [-1,8 – 0,0] -0,6 ± 1,2 0,0 [0,0 – 1,0] 0,7 ± 2,0 0,028 Week 2 – Week 12 -1,0 [-2,0 – 0,0] -1,2 ± 1,5 0,0 [-1,0 – 1,0] 0,5 ± 1,8 0,040 Week 6 – Week 12 -1,0 [-1,0 – 0,0] -0,5 ± 1,6 0,0 [-0,8 – 0,0] -0,2 ± 1,0 1,000
Data are presented as median [IQR] and were analysed with Mann-Whitney U test. P< 0,017 indicates significance.
Table 17. Change in SPPB total score of both groups.
Control
Intervention
P-value
Median [IQR] Mean ± SD Median [IQR] Mean ± SD
Week 2 – Week 6 0,0 [0,0 – 1,0] 0,3 ± 0,9 0,0 [-1,0 – 1,0] 0,1 ± 1,1 0,540 Week 2 – Week 12 0,0 [-0,2 – 2,0] 0,3 ± 1,4 0,0 [0,0 – 1,0] 0,3 ± 1,0 0,784 Week 6 – Week 12 0,0 [-1,0 – 1,0] 0,0 ± 1,5 0,0 [0,0 – 1,0] 0,1 ± 1,4 0,957
Data are presented as median [IQR] and mean ± SD. Analyses were performed with Mann-Whitney U test.


![Identification and characterisation of seed storage protein ......lupin seed protein and fibre significantly influences sub-sequent energy intake [9]. Furthermore, bread enriched with](https://img.pdfslide.net/doc/110x75/60d38a14d6347e377f76baf8/identification-and-characterisation-of-seed-storage-protein-lupin-seed-protein.jpg)


![A Role for CCAAT/Enhancer Binding Protein b-Liver-enriched ......[CANCER RESEARCH 61, 261–269, January 1, 2001] A Role for CCAAT/Enhancer Binding Protein b-Liver-enriched Inhibitory](https://img.pdfslide.net/doc/110x75/60e994919589f573f85d40e1/a-role-for-ccaatenhancer-binding-protein-b-liver-enriched-cancer-research.jpg)