Embed Size (px)
Citation preview

The Effect of Quality Improvement on The Effect of Quality Improvement on Racial Disparities in Diabetes CareRacial Disparities in Diabetes Care
Thomas D. Sequist, MD MPHThomas D. Sequist, MD MPH
Alyce S. Adams, PhDAlyce S. Adams, PhD
Fang Zhang, MSFang Zhang, MS
Dennis Ross-Degnan, ScDDennis Ross-Degnan, ScD
John Z. Ayanian, MD MPPJohn Z. Ayanian, MD MPP
Division of General Medicine, Brigham and Women’s HospitalDivision of General Medicine, Brigham and Women’s Hospital
Department of Health Care Policy, Harvard Medical SchoolDepartment of Health Care Policy, Harvard Medical School
Department of Ambulatory Care and Prevention, Harvard Medical SchoolDepartment of Ambulatory Care and Prevention, Harvard Medical School

BackgroundBackground
Gaps between evidence and quality exist Gaps between evidence and quality exist for diabetes carefor diabetes care
Racial disparities in quality well Racial disparities in quality well documenteddocumented
Generic quality improvement is a potential Generic quality improvement is a potential solution to reduce disparitiessolution to reduce disparities

Study GoalsStudy Goals
Assess baseline racial differences in Assess baseline racial differences in diabetes care within a large diabetes care within a large multispecialty group practicemultispecialty group practice
Analyze impact of generic quality Analyze impact of generic quality improvement efforts on existing racial improvement efforts on existing racial disparitiesdisparities

Methods – Study SiteMethods – Study Site Harvard Vanguard Medical AssociatesHarvard Vanguard Medical Associates
Integrated multispecialty group practiceIntegrated multispecialty group practice– 14 health centers in Boston area14 health centers in Boston area
– 250,000 adult patients250,000 adult patients
Generic QI efforts during 1997 to 2001Generic QI efforts during 1997 to 2001– Implemented electronic health recordImplemented electronic health record
– Computerized reminders to physiciansComputerized reminders to physicians
– Disease registries/ centralized outreach to patientsDisease registries/ centralized outreach to patients

Methods - Study PopulationMethods - Study Population Adult patients Adult patients 18 years with 24 months 18 years with 24 months
continuous enrollment in Harvard Pilgrim continuous enrollment in Harvard Pilgrim Health CareHealth Care
Diabetes diagnosisDiabetes diagnosis 1 inpatient diagnosis diabetes mellitus, or1 inpatient diagnosis diabetes mellitus, or 2 outpatient diagnoses diabetes mellitus, or2 outpatient diagnoses diabetes mellitus, or– Dispensing of diabetes drug (insulin, oral agent)Dispensing of diabetes drug (insulin, oral agent)
Rolling annual cohortRolling annual cohort– 1997 to 20011997 to 2001– Diagnosis of diabetes for entire calendar yearDiagnosis of diabetes for entire calendar year

Methods - Quality MeasuresMethods - Quality Measures Collected from electronic medical recordCollected from electronic medical record
Cholesterol managementCholesterol management– Annual lipid testingAnnual lipid testing– LDL control (< 130 mg/dL)LDL control (< 130 mg/dL)– Statin dispensing (pharmacy claims)Statin dispensing (pharmacy claims)
Glycemia managementGlycemia management– Annual HbA1c testingAnnual HbA1c testing– HbA1c control (< 7.0%)HbA1c control (< 7.0%)
Annual retinopathy screeningAnnual retinopathy screening

Methods - AnalysisMethods - Analysis Baseline (1997) racial differences in careBaseline (1997) racial differences in care
– Multivariate logistic regressionMultivariate logistic regression– GEE to account for clustering of patientsGEE to account for clustering of patients– Adjusted for age, genderAdjusted for age, gender
Longitudinal changes in disparitiesLongitudinal changes in disparities– Similar to baseline modelsSimilar to baseline models– Data included for 1997 to 2001Data included for 1997 to 2001– Race*year interaction termRace*year interaction term

Patient CharacteristicsPatient Characteristics
WhiteWhite
(n = 5,101)(n = 5,101)
BlackBlack
(n = 1,987)(n = 1,987)
p p valuevalue
Mean age, yearsMean age, years
Male, %Male, %
Long Term Enrollment*, %Long Term Enrollment*, %
60.260.2
5151
7474
53.853.8
4141
7373
<0.001<0.001
<0.001<0.001
0.440.44
* Enrolled for at least 3 out of the 5 study years

Annual LDL Cholesterol MonitoringAnnual LDL Cholesterol Monitoring
43 4651
63 65
2935
40
5362
0
10
20
30
40
50
60
70
80
90
100
1997 1998 1999 2000 2001
% R
ecei
ving
Ann
ual L
DL
Tes
ting
WhiteBlack
Adjusted p<0.001 (race*year interaction)

LDL Cholesterol ControlLDL Cholesterol Control
18 2129
4045
913
19
3039
0
10
20
30
40
50
60
70
80
90
100
1997 1998 1999 2000 2001
% A
chei
ving
LD
L <
130
mg/
dL
WhiteBlack
Adjusted p<0.001 (race*year interaction)

Statin UseStatin Use
2226
3035
39
15 1823
27 30
0
10
20
30
40
50
60
70
80
90
100
1997 1998 1999 2000 2001
% P
resc
ribe
d St
atin
White
Black
Adjusted p=0.23 (race*year interaction)

Annual HbA1c MonitoringAnnual HbA1c Monitoring
74 75 76
79 80 77 76 77
76 75
0
10
20
30
40
50
60
70
80
90
100
1997 1998 1999 2000 2001
% R
ecei
ving
Ann
ual H
bA1c
WhiteBlack
Adjusted p=0.11 (race*year interaction)

HbA1c ControlHbA1c Control
37 34 36
24 26 28 27 26
34 35
0
10
20
30
40
50
60
70
80
90
100
1997 1998 1999 2000 2001
% A
chei
ving
HbA
1c <
7.0
%
WhiteBlack
Adjusted p=0.47 (race*year interaction)

Dilated Eye ExamsDilated Eye Exams
68 69 71
7166 63 65 66
7571
0
10
20
30
40
50
60
70
80
90
100
1997 1998 1999 2000 2001
% R
ecei
ving
Ann
ual E
ye E
xam
WhiteBlack
Adjusted p=0.77 (race*year interaction)

LimitationsLimitations
Single multispecialty group practice with Single multispecialty group practice with advanced EMRadvanced EMR
Unmeasured confoundingUnmeasured confounding
No measures of patient experience with careNo measures of patient experience with care

DiscussionDiscussion
Baseline disparities in diabetes careBaseline disparities in diabetes care– Substantial disparity in low performing measuresSubstantial disparity in low performing measures– No disparity in high performing measuresNo disparity in high performing measures
Cholesterol management quality improvementCholesterol management quality improvement– Reduction in process measure disparityReduction in process measure disparity– Less marked reduction in outcome measure disparityLess marked reduction in outcome measure disparity– Disparity in statin use persistedDisparity in statin use persisted
Glycemia managementGlycemia management– No disparity in process measureNo disparity in process measure– No quality improvement in outcome measureNo quality improvement in outcome measure– Disparity in outcome measure persistedDisparity in outcome measure persisted
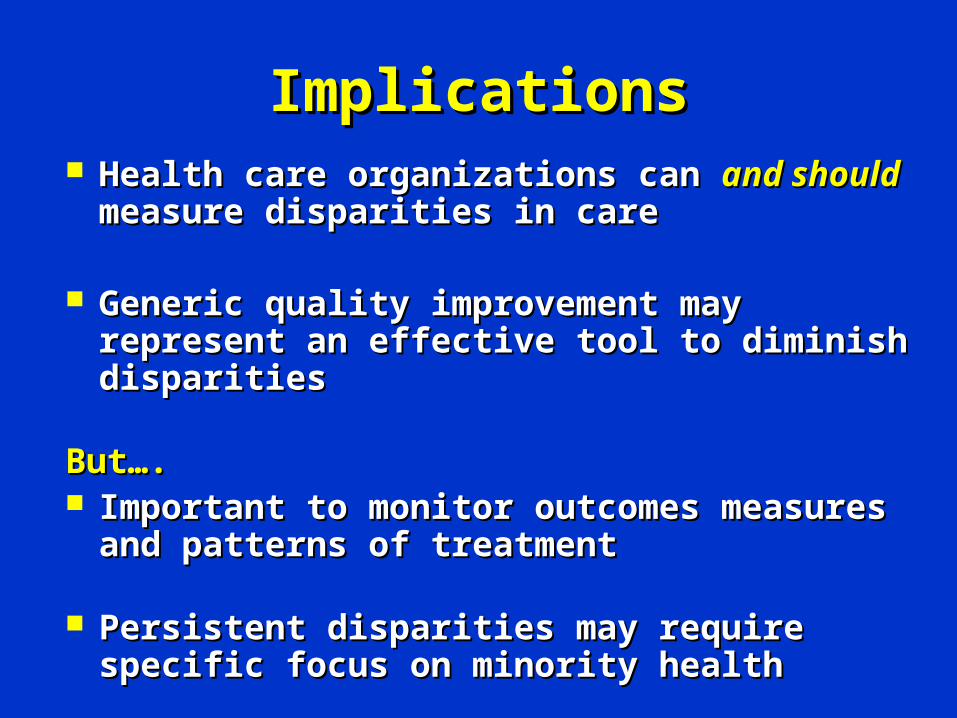
ImplicationsImplications Health care organizations can Health care organizations can and shouldand should measure measure
disparities in caredisparities in care
Generic quality improvement may represent an Generic quality improvement may represent an effective tool to diminish disparitieseffective tool to diminish disparities
But….But…. Important to monitor outcomes measures and Important to monitor outcomes measures and
patterns of treatmentpatterns of treatment
Persistent disparities may require specific focus on Persistent disparities may require specific focus on minority healthminority health


Electronic RemindersElectronic Reminders

Centralized Patient MailingsCentralized Patient Mailings

Changes in Cholesterol Management by GenderChanges in Cholesterol Management by Gender

Annual LDL Testing by Center*Annual LDL Testing by Center*
19971997 20012001
HVMA HVMA CenterCenter
WhiteWhite BlackBlack WhiteWhite BlackBlack in Disparityin Disparity
11
22
33
44
55
3636
3939
4242
5050
3838
2020
2828
3030
3838
3030
6363
6868
6868
6868
6464
6060
6363
6565
6363
6060
1313
66
99
66
44
* Among centers with at least 50 black patients
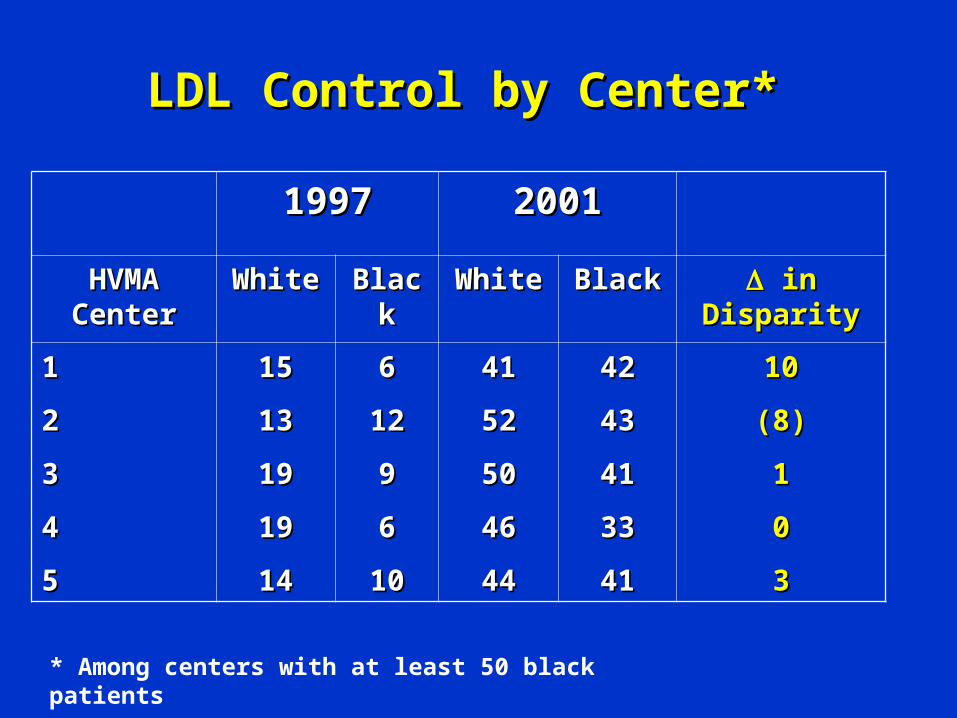
LDL Control by Center*LDL Control by Center*
19971997 20012001
HVMA HVMA CenterCenter
WhiteWhite BlackBlack WhiteWhite BlackBlack in Disparityin Disparity
11
22
33
44
55
1515
1313
1919
1919
1414
66
1212
99
66
1010
4141
5252
5050
4646
4444
4242
4343
4141
3333
4141
1010
(8)(8)
11
00
33
* Among centers with at least 50 black patients