Embed Size (px)
Citation preview

The effect of reference groups and lifestyle on the buying behaviour of
Singletons
L Groenewald
orcid.org/0000-0001-7931-6195
Dissertation submitted in fulfilment of the requirements for the degree Master of Commerce in Marketing Management at the
North-West University
Supervisor: Dr RH Goldberg
Co-Supervisor: Prof LR Jansen van Rensburg
Graduation: October 2019
Student number: 25032194

i
ACKNOWLEDGEMENTS
This dissertation is dedicated to my parents, Louw and Mari Groenewald, who provided me with
the opportunity, love and support to complete this degree. Thank you for always believing in me,
encouraging me and inspiring me to do the best and be the best that I can be.
I would like to acknowledge a few people who have supported me throughout my journey to
completing my dissertation.
Firstly, I would like to thank my two outstanding promoters Dr Roland Goldberg and Prof
Renier Jansen van Rensburg. Thank you for guiding me, motivating me and providing me
with the opportunity to further my studies and realise my potential. I greatly appreciate
your knowledge, time and effort throughout my studies. Thank you for your continuous
feedback and willingness to help at any time. I would not have been able to complete this
journey without your input.
Secondly, I would like to thank my family – my father, mother, brother and Lemon. Your
endless love, advice, assistance, understanding and comfort food motivated me on the
days I needed it most.
Thirdly, I would like to thank my boyfriend Gerhard de Kock. Thank you for having the
world’s patience with me during this process. Thank you for encouraging me, listening to
my complaints, advising me and believing in me when I did not believe in myself. You
inspire me every day.
Fourthly, I would like to thank Prof Nedia Mackay for believing in me and encouraging me
to complete my Master’s degree. I have learned more than I could have hoped for and
would not have taken on this journey if it were not for you. Thank you for helping me to
believe in myself.
Fifthly, special thanks to my best friend Leje Fritz for your uplifting spirit, care, love and
support.
Finally, I would like to thank all my family and friends for the words of encouragement, for
motivating me not to give up and offering to help. I am truly blessed.

ii
ABSTRACT
Numerous studies have been conducted on consumers’ buying behaviour, socio-demographics
as well as the psychographic dimensions of married people and traditional familial set-ups.
Marketers and organisations have, however, overlooked the increasing and profitable Singletons
consumer segment. Based on the literature review, it was found that Singletons have financial
freedom and greater spending power because as they do not have family constraints and
responsibilities. It is of great importance for marketers to identify Singleton consumers and to gain
greater insight into this segment. Such knowledge will enable marketers to provide products and
services that address the specific needs, wants and preferences of Singletons.
This study investigated various concepts including buying behaviour, reference groups,
segmentation and lifestyle segmentation in order to identify and describe Singletons. Studying
the buying behaviour of Singletons, asking questions such as how, what, where, when and why
consumers purchase and consume various products or services, will help marketers to develop
appropriate marketing strategies. Effectively segmenting a market will also enable marketers to
position their products so that they appeal to the targeted consumer segment. This study hopes
to assist marketers and organisations in their efforts to devise marketing strategies that target the
Singleton segment more effectively.
In order to determine the influence of reference groups and lifestyle on the buying behaviour of
Singletons as the primary objective of this study, 12 secondary research objectives were
formulated. Various statements pertaining to reference groups were provided by the SUSCEP
scale, which were used to determine their effect on the buying behaviour of Singletons. To
determine the lifestyle of Singletons, the AIO-approach was used by measuring six lifestyle
dimensions in terms of fashion consciousness, cost consciousness, health consciousness,
recreations, E-shopping and career orientation. The study used a descriptive research design.
Respondents were selected using convenience sampling and the data was collected using a self-
administrated questionnaire. A sample size of 207 was realised from respondents in the
Johannesburg and Pretoria areas of Gauteng province.
The results of the study indicate that Singletons’ experience moderately low reference groups
effect as well as having a moderately low level of fashion consciousness. Moderately high levels
of cost consciousness, health consciousness, recreation, recreation, E-shopping and career
orientation were found among the respondents. The study also determined the underlying
relationships between the various lifestyle dimensions, as well as the relationships between
reference groups and the six lifestyle dimensions. The significant differences in terms of the

iii
perceptions of Singletons towards reference groups and the lifestyle dimensions with regard to
their demographic differences in terms of age, monthly income, highest level of education and
gender were determined.
It is recommended that marketers and organisations should focus their efforts and resources on
adjusting their marketing strategies so that these are in line with the preferences of Singletons
with regard to the lifestyle dimensions of cost consciousness, health consciousness, recreation,
E-shopping and career orientation. Marketers can consider the effect of reference groups and
lifestyle, along with the difference in perceptions based on the demographic differences to develop
effective and efficient marketing strategies and product offerings for Singletons.
Recommendations for future research include considering a larger sample size, examining the
effect of reference groups and lifestyle of Singletons in a wider geographic area, conducting a
comparative study of Singletons in different geographical areas. In order to gain greater
knowledge of the lifestyle of Singletons, a wider variety of AIO-statements can be measured.
Furthermore, external influences such as culture, family and social class can be used to determine
the buying behaviour of Singletons. To improve external validity, a longitudinal research design
can be incorporated. Finally, research can be conducted by focusing on one lifestyle dimension
and gaining a more profound understanding of a specific dimension (e.g. cost consciousness),
and how Singletons perceive these dimensions.

iv
KEY TERMINOLOGIES USED IN THE STUDY
Reference groups
Cant and Van Heerden (2013:69) explain that reference groups are individuals or groups of
individuals that a person uses as a standard when making decisions. Consumers value the
opinions of these referents that could include, inter alia, a family member, a friend or a celebrity.
These referents influence the consumer’s behaviour, values, conduct and decisions (Joubert,
2013:26).
Lifestyle
Lifestyle can be defined as the way in which consumers conduct their daily lives
(Ratanasawadwat & Jiamthapthaksin, 2017:972). Levy et al. (2014:111) propound that lifestyle
refers to how consumers spend their time and money; the various activities they partake in; and
the perceptions and opinions they form about the world around them. Krishnan (2011:284)
describes lifestyle as a patterned way of life in which consumers engage in on a daily basis.
Buying behaviour
Buying behaviour refers to the decisions consumers make when deciding on the amount of money
that they want to spend on certain products as well as the effort they make to gather information
on the type of products they would like to purchase (Cunningham, 2018:67). Prakash (2012:64)
states that buying behaviour is most typically affected by an array of cultural, psychological, social
and personal factors.
Singleton
A person, above the age of 18, who is not married or in a long-term relationship and who lives
alone (Bouhlel et al., 2011:23; Macmillan Dictionary, 2018; Schlacter et al., 1979:39-40).
Key terms: Reference groups, buying behaviour, segmentation, lifestyle, Singletons.

v
TABLE OF CONTENTS
ACKNOWLEDGEMENTS .......................................................................................................... I
ABSTRACT .............................................................................................................................. II
KEY TERMINOLOGIES USED IN THE STUDY ....................................................................... IV
CHAPTER 1: CONTEXTUALISATION OF THE STUDY ........................................................ 1
1.1 INTRODUCTION ................................................................................................ 1
1.2 OVERVIEW OF THE STUDY ............................................................................. 1
1.2.1 Singletons ........................................................................................................... 1
1.2.2 Consumer buying behaviour ............................................................................... 2
1.2.3 Reference group ................................................................................................. 3
1.2.4 Market Segmentation .......................................................................................... 4
1.2.5 Lifestyle .............................................................................................................. 5
1.3 PROBLEM STATEMENT ................................................................................... 6
1.4 OBJECTIVES OF THE STUDY .......................................................................... 8
1.4.1 Primary objective ................................................................................................ 8
1.4.2 Secondary objectives .......................................................................................... 8
1.5 RESEARCH METHODOLOGY .......................................................................... 9
1.5.1 Literature study ................................................................................................... 9
1.5.2 Empirical investigation ...................................................................................... 10
1.5.2.1 Research design ............................................................................................... 10
1.5.2.2 Data collection method ..................................................................................... 11
1.5.2.3 Developing the sample plan .............................................................................. 12
1.5.2.4 Measurement instrument .................................................................................. 14

vi
1.5.2.5 Pilot study ......................................................................................................... 17
1.5.2.6 Data analysis .................................................................................................... 17
1.6 PRELIMINARY CHAPTER CLASSIFICATION ................................................ 17
1.7 CONCLUSION ................................................................................................. 18
CHAPTER 2: CONSUMER BEHAVIOUR ............................................................................ 19
2.1 INTRODUCTION .............................................................................................. 19
2.2 MARKETING AND CONSUMER BEHAVIOUR ............................................... 19
2.3 DEFINING CONSUMER BEHAVIOUR............................................................. 20
2.4 CONSUMER DECISIONS ................................................................................ 22
2.4.1 Consumer decision-making styles .................................................................... 23
2.4.2 The consumer decision-making process ........................................................... 24
2.4.2.1 Step 1: Need recognition .................................................................................. 25
2.4.2.2 Step 2: Search for information .......................................................................... 26
2.4.2.3 Step 3: Pre-purchase evaluation of alternatives ................................................ 27
2.4.2.4 Step 4: Purchase .............................................................................................. 27
2.4.2.5 Step 5: Consumption ........................................................................................ 28
2.4.2.6 Step 6: Post-consumption evaluation ................................................................ 28
2.4.2.7 Step 7: Divestment ........................................................................................... 29
2.4.3 Types of consumer purchasing decisions ......................................................... 30
2.5 INFLUENCES ON THE CONSUMER DECISION-MAKING PROCESS ........... 31
2.5.1 Psychological influences ................................................................................... 32
2.5.1.1 Motivation ......................................................................................................... 32
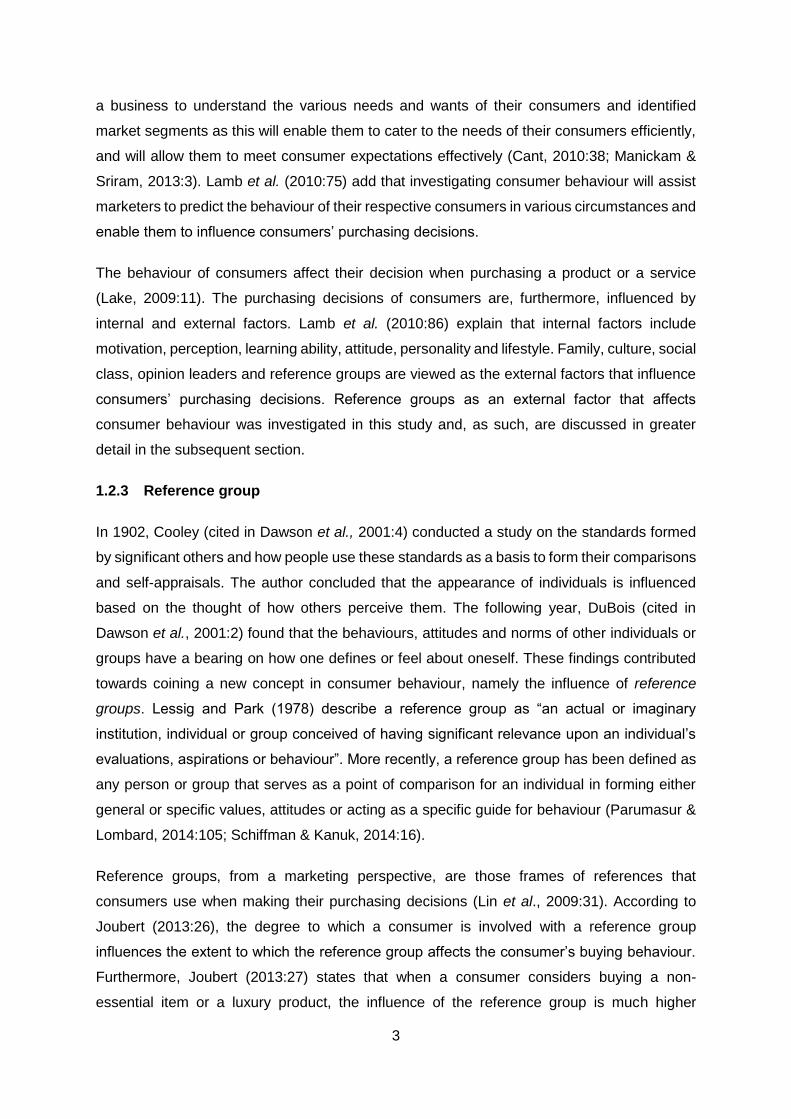
2.5.1.2 Perception ........................................................................................................ 33

vii
2.5.1.3 Learning ........................................................................................................... 33
2.5.1.4 Attitude ............................................................................................................. 34
2.5.1.5 Personality ........................................................................................................ 35
2.5.2 External influences ........................................................................................... 35
2.5.2.1 Family ............................................................................................................... 36
2.5.2.2 Social class ...................................................................................................... 37
2.5.2.3 Culture .............................................................................................................. 38
2.5.2.4 Reference groups ............................................................................................. 38
2.6 REFERENCE GROUPS AS AN INFLUENCE ON CONSUMER BUYING
BEHAVIUR ....................................................................................................... 38
2.6.1 Defining reference groups ................................................................................ 39
2.6.2 Types of reference groups ................................................................................ 41
2.6.2.1 Formality of the reference group ....................................................................... 42
2.6.2.2 Importance of the reference group .................................................................... 42
2.6.2.3 Aspiration to the reference group ...................................................................... 43
2.6.2.4 Affiliation to the reference group ....................................................................... 43
2.6.3 Marketing implications of reference groups ....................................................... 44
2.6.3.1 Understanding information transmission ........................................................... 45
2.6.3.2 Formal reference groups as potential targets .................................................... 45
2.6.3.3 Homophily consumers as targets ...................................................................... 45
2.6.3.4 Targeting the reference group .......................................................................... 46
2.6.3.5 Understanding the strength of weak ties ........................................................... 46
2.6.4 The strength of reference group influence on consumer buying behaviour ....... 46

viii
2.7 REFERENCE GROUPS AS BASIS FOR MARKET SEGMENTATION............ 47
2.8 CONCLUSION ................................................................................................. 48
CHAPTER 3: MARKET SEGMENTATION ........................................................................... 49
3.1 INTRODUCTION .............................................................................................. 49
3.2 MARKET SEGMENTATION ............................................................................. 49
3.3 IMPORTANCE AND CRITERIA FOR SEGMENTING A MARKET .................. 51
3.3.1 Selection of a target market .............................................................................. 52
3.3.2 Designing appropriate marketing mix strategies ............................................... 53
3.3.3 Differentiation ................................................................................................... 53
3.3.4 Identification of opportunities and threats in a market ....................................... 54
3.3.5 Effective allocation of resources ....................................................................... 54
3.4 CHARACTARISTICS OF PROSPEROUS MARKET SEGMENTS ................... 54
3.5 MARKET SEGMENTATION STRATEGIES ..................................................... 56
3.5.1 Undifferentiated mass market segmentation: .................................................... 57
3.5.2 Differentiated segmentation: ............................................................................. 57
3.6 FACTORS INFLUENCING THE MARKET SEGMENTATION PROCESS ....... 58
3.6.1 Market aggregation ........................................................................................... 58
3.6.2 Consumer preference heterogeneity ................................................................. 58
3.6.3 Majority fallacy .................................................................................................. 59
3.6.4 Sales-cost trade-off .......................................................................................... 59
3.6.5 Cannibalisation ................................................................................................. 59
3.7 BASES FOR MARKET SEGMENTATION ....................................................... 59
3.7.1 Demographic segmentation .............................................................................. 61

ix
3.7.1.1 Age ................................................................................................................... 62
3.7.1.2 Gender ............................................................................................................. 62
3.7.1.3 Income, education and occupation ................................................................... 63
3.7.1.4 Life stages ........................................................................................................ 64
3.7.2 Behaviouristic segmentation ............................................................................. 64
3.7.2.1 Purchase occasion ........................................................................................... 65
3.7.2.2 Benefits sought ................................................................................................. 65
3.7.2.3 User status ....................................................................................................... 65
3.7.2.4 Loyalty status ................................................................................................... 65
3.7.2.5 Buyer readiness stage ...................................................................................... 66
3.7.2.6 Attitude towards the product ............................................................................. 66
3.7.3 Geographic segmentation ................................................................................. 66
3.7.4 Psychographic segmentation ............................................................................ 67
3.7.4.1 Social class ...................................................................................................... 67
3.7.4.2 Personality ........................................................................................................ 67
3.7.4.3 Lifestyle ............................................................................................................ 68
3.8 CONSUMER LIFESTYLE................................................................................. 68
3.8.1 Towards a definition of lifestyle ......................................................................... 69
3.8.2 Characteristics of lifestyle ................................................................................. 71
3.8.3 Emerging lifestyle groups ................................................................................. 71
3.8.4 The AIO-approach ............................................................................................ 73
3.9 SINGLETONS .................................................................................................. 77
3.9.1 The significance of the Singleton segment ........................................................ 77

x
3.9.2 Towards a definition of Singletons .................................................................... 79
3.9.3 Sub-segments of Singletons ............................................................................. 80
3.9.3.1 Suddenly Singletons ......................................................................................... 81
3.9.3.2 Solus Singletons ............................................................................................... 81
3.9.3.3 Struggling Singletons ........................................................................................ 82
3.9.3.4 Starting out Singletons ...................................................................................... 82
3.9.3.5 Freemales ........................................................................................................ 82
3.9.3.6 Male Singletons ................................................................................................ 82
3.9.3.7 Regretful loners ................................................................................................ 82
3.9.4 Consumption orientation of Singletons ............................................................. 83
3.9.4.1 Variety-seeking propensity................................................................................ 84
3.9.4.2 Risk aversion .................................................................................................... 84
3.9.4.3 Brand consciousness ........................................................................................ 84
3.9.4.4 Price consciousness ......................................................................................... 84
3.9.4.5 Impulsivity ......................................................................................................... 85
3.9.4.6 Convenience seeking ....................................................................................... 85
3.9.5 Singletons in the South African market ............................................................. 85
3.10 CONCLUSION ................................................................................................. 86
CHAPTER 4: RESEARCH METHODOLOGY ...................................................................... 87
4.1 INTRODUCTION. ............................................................................................. 87
4.2 THE MARKETING RESEARCH PROCESS ..................................................... 87
4.2.1 Step 1: Identify the research problem and objectives ........................................ 88
4.2.1.1 Primary objective .............................................................................................. 88

xi
4.2.1.2 Secondary objectives ........................................................................................ 88
4.2.2 Step 2: Determine the research design ............................................................. 89
4.2.2.1 Causal research ............................................................................................... 90
4.2.2.2 Exploratory research......................................................................................... 90
4.2.2.3 Descriptive research ......................................................................................... 91
4.2.3 Step 3: Design the data collection method ........................................................ 94
4.2.3.1 Secondary data sources ................................................................................... 94
4.2.3.2 Primary data sources ........................................................................................ 95
4.2.3.3 Data collection method used in this study ......................................................... 98
4.2.3.4 Research instrument......................................................................................... 98
4.2.3.5 Types of response formats ............................................................................. 100
4.2.3.6 Measurement scales used in questionnaire .................................................... 101
4.2.3.7 Linking the objectives with the questionnaire .................................................. 108
4.2.3.8 Pilot study of the questionnaire used for this study ......................................... 109
4.2.4 Step 4: Design the sample and collect data .................................................... 109
4.2.4.1 Sample design ................................................................................................ 109
4.2.4.2 Phase 1: Define the target population ............................................................. 110
4.2.4.3 Phase 2: Identify the sample frame ................................................................. 111
4.2.4.4 Phase 3: Select a sampling procedure ........................................................... 111
4.2.4.5 Phase 4: Determine the sample size .............................................................. 115
4.2.4.6 Phase 5: Select the sample elements ............................................................. 116
4.2.4.7 Collection of data ............................................................................................ 117
4.2.5 Step 5: Analyse and interpret the data ............................................................ 118

xii
4.2.5.1 Reliability ........................................................................................................ 119
4.2.5.2 Validity ............................................................................................................ 121
4.2.5.3 Methods and statistical techniques ................................................................. 122
4.2.5.4 Statistical analysis applied in this study .......................................................... 123
4.2.6 Step 6: Prepare the research report ................................................................ 126
4.3 CONCLUSION ............................................................................................... 126
CHAPTER 5: REPORTING OF RESULTS ......................................................................... 127
5.1 INTRODUCTION ............................................................................................ 127
5.2 RESULTS OBTAINED FROM SECTION A OF THE QUESTIONNAIRE:
SCREENING QUESTIONS ............................................................................ 127
5.3 RESULTS OBTAINED FROM SECTION B OF THE QUESTIONNAIRE:
REFERENCE GROUPS ................................................................................. 127
5.3.1 Reliability of section B ..................................................................................... 127
5.3.2 Validity of section B ........................................................................................ 128
5.3.3 The effect of reference groups on the buying behaviour of respondents ......... 129
5.4 RESULTS OBTAINED FROM SECTION C OF THE QUESTIONNAIRE:
LIFESTYLE .................................................................................................... 130
5.4.1 Reliability of section C .................................................................................... 131
5.4.2 Validity of section C ........................................................................................ 131
5.4.2.1 Fashion consciousness .................................................................................. 132
5.4.2.2 Cost consciousness ........................................................................................ 132
5.4.2.3 Health consciousness ..................................................................................... 132
5.4.2.4 Recreation ...................................................................................................... 132
5.4.2.5 E-shopping ..................................................................................................... 133

xiii
5.4.2.6 Career orientation ........................................................................................... 133
5.4.3 Lifestyle dimensions ....................................................................................... 133
5.5 RESULTS OBTAINED FROM SECTION D OF THE QUESTIONNAIRE:
DEMOGRAPHIC INFORMATION .................................................................. 135
5.5.1 Demographic profiles of respondents ............................................................. 135
5.6 THE UNDERLINING RELATIONSHIP BETWEEN THE VARIOUS
LIFESTYLE DIMENSIONS ............................................................................. 137
5.7 THE UNDERLINING RELATIONSHIP BETWEEN THE LEVEL OF
REFERENCE GROUPS INFLUENCE AND THE LIFESTYLE
DIMENSIONS OF SINGLETONS ................................................................... 139
5.8 THE DIFFERENCE IN PERCEPTION OF REFERENCE GROUP
INFLUENCE AND THE LIFESTYLE DIMENSIONS OF SINGLETONS
WITH REGARDS TO THEIR DEMOGRAPHIC DIFFERENCES .................... 141
5.8.1 Demographic differences: Age ....................................................................... 141
5.8.2 Demographic differences: Monthly income ..................................................... 145
5.8.3 Demographic differences: Highest level of education...................................... 149
5.8.4 Demographic differences: Gender .................................................................. 154
5.9 CONCLUSION ............................................................................................... 155
CHAPTER 6: CONCLUSIONS, RECOMMENDATIONS AND LIMITATIONS .................... 156
6.1 INTRODUCTION ............................................................................................ 156
6.2 OVERVIEW .................................................................................................... 156
6.3 ANSWERING THE RESEARCH OBJECTIVES ............................................. 157
6.4 CONCLUSIONS AND RECOMMENDATION ................................................. 159
6.4.1 Secondary research objective 1 ...................................................................... 159
6.4.2 Secondary research objective 2 ...................................................................... 159

xiv
6.4.3 Secondary research objective 3 ...................................................................... 160
6.4.4 Secondary research objective 4 ...................................................................... 161
6.4.5 Secondary research objective 5 ...................................................................... 162
6.4.6 Secondary research objective 6 ...................................................................... 162
6.4.7 Secondary research objective 7 ...................................................................... 163
6.4.8 Secondary research objective 8 ...................................................................... 164
6.4.9 Secondary research objective 9 ...................................................................... 165
6.4.10 Secondary research objective 10 .................................................................... 166
6.4.11 Secondary research objective 11 .................................................................... 167
6.4.12 Secondary research objective 12 .................................................................... 167
6.5 LINKING ALL ASPECTS OF THE STUDY: RESEARCH OBJECTIVES.
QUESTIONS IN THE QUESTIONNAIRE, MAIN FINDINGS,
CONCLUSIONS AND RECOMMENDATIONS ............................................... 171
6.6 LIMITATIONS OF THE STUDY ...................................................................... 174
6.6.1 Limitations of the literature review................................................................... 174
6.6.2 Limitations of the empirical study .................................................................... 174
6.7 SUGGESTIONS FOR FUTURE RESEARCH ................................................. 175
6.8 CONCLUSION ............................................................................................... 176
BIBLIOGRAPHY ................................................................................................................... 177
APPENDIX A: QUESTIONNAIRE ...................................................................................... 190
APPENDIX B: LETTER OF INVITATION ........................................................................... 196
APPENDIX C: STATISTICAL ANALYSIS .......................................................................... 198
APPENDIX D: LETTER FROM LANGUAGE EDITOR ....................................................... 199
APPENDIX E: LETTER FROM TECHNICAL EDITOR ....................................................... 200
xv
LIST OF TABLES
Table 1-1: Sample sizes for marketing research studies ............................................... 13
Table 1-2: Sampling plan for the study .......................................................................... 14
Table 2-1: Towards a definition of consumer behaviour ................................................ 20
Table 2-2: Towards a definition of reference groups ..................................................... 40
Table 3-1: Towards a definition of market segmentation ............................................... 50
Table 3-2: Marketing mix components .......................................................................... 53
Table 3-3: Towards a definition of lifestyle .................................................................... 70
Table 3-4: Lifestyle dimensions ..................................................................................... 74
Table 3-5: Appellations of the term Singleton as used in the literature .......................... 79
Table 3-6: Towards a definition of Singleton ................................................................. 79
Table 4-1: Uses and methods of the research designs ................................................. 93
Table 4-2: Comparing qualitative and quantitative research .......................................... 96
Table 4-3: The advantages and disadvantages of secondary and primary data
sources ........................................................................................................ 97
Table 4-4: Measurement of reference group influence (SUSCEP-scale) ..................... 105
Table 4-5: Measuring of lifestyle ................................................................................. 106
Table 4-6: Measuring demographics ........................................................................... 108
Table 4-7: Relationship between objectives and questionnaire ................................... 108
Table 4-8: Summary of the target population .............................................................. 111
Table 4-9: Summary of the sample plan for this study ................................................. 117
Table 5-1: Cronbach alpha reliability coefficient for section B of the questionnaire...... 128
Table 5-2: KMO measure value indicator .................................................................... 129

xvi
Table 5-3: Mean and standard deviation of reference groups ..................................... 130
Table 5-4: Cronbach alpha reliability coefficient for section C of the questionnaire ..... 131
Table 5-5: Mean and standard deviation of the lifestyle dimensions ............................ 134
Table 5-6: Demographic profile of respondents ........................................................... 136
Table 5-7: Pearson correlation coefficients between the various lifestyle dimensions
of Singletons .............................................................................................. 137
Table 5-8: Pearson correlation coefficients between reference groups and the
lifestyle dimensions of Singletons ............................................................... 140
Table 5-9: Cohen’s effect sizes of the difference in perceptions of reference groups
influence and the lifestyle dimensions of Singletons with regards to the
different age cohorts .................................................................................. 142
Table 5-10: Cohen’s effect sizes of difference in perceptions of reference group
influence and the lifestyle dimensions of Singletons with regards to their
monthly income .......................................................................................... 146
Table 5-11: Cohen’s effect sizes of the difference in perceptions of reference group
influence and the lifestyle dimensions of Singletons with regards to their
level of education ....................................................................................... 150
Table 5-12: Cohen’s effect sizes of the difference in perceptions of reference group
influence and the lifestyle dimensions of Singletons with regards to their
gender. ....................................................................................................... 154
Table 6-1: Summary of the links between the research objectives, literature review
and empirical study .................................................................................... 158
Table 6-2: Conclusions to secondary objective 1 ........................................................ 159
Table 6-3: Conclusions and recommendations for secondary objective 2 ................... 159
Table 6-4: Conclusions and recommendations for secondary objective 3 ................... 160
Table 6-5: Conclusions and recommendations for secondary objective 4 ................... 161
Table 6-6: Conclusions and recommendations for secondary objective 5 ................... 162

xvii
Table 6-7: Conclusions and recommendations for secondary objective 6 ................... 163
Table 6-8: Conclusions and recommendations for secondary objective 7 ................... 164
Table 6-9: Conclusions and recommendations for secondary objective 8 ................... 164
Table 6-10: Conclusions and recommendations for secondary objective 9 ................... 165
Table 6-11: Conclusions and recommendations for secondary objective 10 ................. 166
Table 6-12: Conclusions and recommendations for secondary objective 11 ................. 167
Table 6-13: Conclusions for secondary objective 12 ..................................................... 168
Table 6-14: Links between research objectives, questions, main findings,
conclusions and recommendations ............................................................ 172

xviii
LIST OF FIGURES
Figure 2-1: The model of consumer behaviour ............................................................... 22
Figure 2-2: The consumer decision-making process model ............................................ 25
Figure 2-3: Factors influencing the consumer decision-making process ......................... 31
Figure 2-4: The perceptual process ................................................................................ 33
Figure 2-5: Types of reference group ............................................................................. 42
Figure 2-6: Factors used to describe a reference group ................................................. 44
Figure 3-1: The three-level market model ....................................................................... 49
Figure 3-2: The importance of market segmentation ...................................................... 52
Figure 3-3: Characteristics of an ideal market segment .................................................. 55
Figure 3-4: Market segmentation strategies ................................................................... 57
Figure 3-5: Bases for market segmentation .................................................................... 60
Figure 3-6: Observable and unobservable variables of segmentation bases .................. 61
Figure 3-7: Understanding the influence of consumer lifestyle on marketing efforts ....... 69
Figure 3-8: Global Households by family type: 2016-2030 ............................................. 77
Figure 3-9: The goals and aspirations of Singletons ....................................................... 78
Figure 3-10: The identified sub-segments of Singletons ................................................... 81
Figure 3-11: Factors to consider when studying consumption orientation of
consumers ................................................................................................... 83
Figure 4-1: The marketing research process .................................................................. 88
Figure 4-2: The relationship between a marketing research problem and research
design .......................................................................................................... 92
Figure 4-3: Different types of secondary data sources ................................................... 95

xix
Figure 4-4: Primary data collection techniques ............................................................... 97
Figure 4-5: Steps in designing an effective questionnaire ............................................... 99
Figure 4-6: Sample design framework .......................................................................... 110
Figure 4-7: Sampling procedure ................................................................................... 112
Figure 4-8: The relationship between reliability and validity .......................................... 119

1
CHAPTER 1: CONTEXTUALISATION OF THE STUDY
1.1 INTRODUCTION
Chapter 1 provides a brief overview of the study by discussing the newly identified Singletons
consumer segment and related salient factors, namely consumer buying behaviour, reference
groups, market segmentation and lifestyle segmentation. The chapter continues by presenting
the problem statement of the study, after which the primary and secondary objectives of the
study are stated. Following these, the research methodology selected to reach these
objectives is presented. The chapter concludes with a brief description of each chapter of the
study and explains how the chapters fit together as a coherent whole.
1.2 OVERVIEW OF THE STUDY
An overview of the study is provided below in order to highlight the importance of the key terms
and concepts used in the study.
1.2.1 Singletons
The number of single-person households is increasing all over the world (Quintos, 2019). For
example, a 2011 census found that there were over seven million single-person households
in England and Wales, with a projected growth of 70% by the year 2026 (Cardona, 2013;
Euromonitor International, 2008). According to Flynn (2017), the 2014 census conducted in
the United States of America (USA) showed that single people who are eighteen years of age
and older represent 50% of the country’s adult population. South Africa has been identified as
one of nine countries that experienced a 20% growth in single-person households over a six-
year period (Euromonitor International, 2008). Higher divorce rates, the increase of work
opportunities for women in the workplace and the breakdown of traditional households lead to
an increased number of people choosing to live a single life (Flynn, 2017). With the ever-
increasing number of single-person households around the world, businesses should conduct
further research into this market segment in order to ensure that they understand and
effectively cater to the needs of this growing segment.
The growing number of single-person households around the world has, therefore, led to the
identification of a new segment of consumers (Quintos, 2019). Bouhlel et al. (2011:23)
describe this newly identified segment by using different appellations, including singletons,
singles, bachelors, bachelorettes, or solos. For the purpose of this study, all the above
terminologies will be referred to collectively as Singletons. Singletons can be defined as those

2
consumers who are solitary with constraint because of divorce or bereavement, or those who
choose singlism - they do not find the coupled life appealing and have no desire to be coupled
up and hence choose to live alone (Bouhlel et al., 2011:26). Sweeney (2015) is of the opinion
that people are exchanging relationships for education and for the furthering of their careers;
to work on their self-development; and to become more financially flexible.
Singletons are perceived as having greater purchasing power and a high disposable income
due to their lack of dependents (Mascolo, 2017). The absence of such restraints allows them
to spend more money on non-essential items and luxury products. Research indicates that
Singletons spend a greater share of their disposable income on clothing, shoes, alcoholic
beverages and tobacco products, which is in stark contrast with family households that tend
to spend more of their disposable income on essential housekeeping items and services such
as insurance and medical aid (Schultz, 2010).
Singletons have a unique lifestyle and the reason for choosing a particular lifestyle differs from
person to person. Due to their lack of family constraints and their limited responsibilities,
Singletons are able to participate in a large variety of activities. Flynn (2017) and Mascolo
(2017) assert that 51% of Singletons are more willing and able to try new things and are less
price-sensitive. Cheap travel, technological advancements and the availability of an
assortment of entertainment options offer Singletons more carefree fun, resulting in a lower
incentive for them to settle down and take on familial responsibilities (Hundal, 2005).
According to Cardona (2013), single consumers are present in different age groups, each with
different needs and preferences, in different stages of their respective lifestyles, income levels
and consumer profiles. Thus, it is important for marketers to bear in mind that Singletons are
not demographically identical, but constitute a market segment comprised of single consumers
with varying traits and buying behaviours. Manickam and Sriram (2013:3) and Quintos (2019)
explain that a more profound understanding of Singletons’ buying behaviour will enable
marketers to satisfy the needs and wants of this particular market segment more effectively
and efficiently.
1.2.2 Consumer buying behaviour
Schiffman and Kanuk (2014:4) define consumer buying behaviour as the study of individual
consumers, groups or businesses whilst searching, purchasing, using and disposing of
products to satisfy their various needs. The study of consumer behaviour enables marketers
to gain greater insight into the preferences of different consumers. Furthermore, it provides
answers to questions like who, what, when, why and how (Lake, 2009:10). It is important for
3
a business to understand the various needs and wants of their consumers and identified
market segments as this will enable them to cater to the needs of their consumers efficiently,
and will allow them to meet consumer expectations effectively (Cant, 2010:38; Manickam &
Sriram, 2013:3). Lamb et al. (2010:75) add that investigating consumer behaviour will assist
marketers to predict the behaviour of their respective consumers in various circumstances and
enable them to influence consumers’ purchasing decisions.
The behaviour of consumers affect their decision when purchasing a product or a service
(Lake, 2009:11). The purchasing decisions of consumers are, furthermore, influenced by
internal and external factors. Lamb et al. (2010:86) explain that internal factors include
motivation, perception, learning ability, attitude, personality and lifestyle. Family, culture, social
class, opinion leaders and reference groups are viewed as the external factors that influence
consumers’ purchasing decisions. Reference groups as an external factor that affects
consumer behaviour was investigated in this study and, as such, are discussed in greater
detail in the subsequent section.
1.2.3 Reference group
In 1902, Cooley (cited in Dawson et al., 2001:4) conducted a study on the standards formed
by significant others and how people use these standards as a basis to form their comparisons
and self-appraisals. The author concluded that the appearance of individuals is influenced
based on the thought of how others perceive them. The following year, DuBois (cited in
Dawson et al., 2001:2) found that the behaviours, attitudes and norms of other individuals or
groups have a bearing on how one defines or feel about oneself. These findings contributed
towards coining a new concept in consumer behaviour, namely the influence of reference
groups. Lessig and Park (1978) describe a reference group as “an actual or imaginary
institution, individual or group conceived of having significant relevance upon an individual’s
evaluations, aspirations or behaviour”. More recently, a reference group has been defined as
any person or group that serves as a point of comparison for an individual in forming either
general or specific values, attitudes or acting as a specific guide for behaviour (Parumasur &
Lombard, 2014:105; Schiffman & Kanuk, 2014:16).
Reference groups, from a marketing perspective, are those frames of references that
consumers use when making their purchasing decisions (Lin et al., 2009:31). According to
Joubert (2013:26), the degree to which a consumer is involved with a reference group
influences the extent to which the reference group affects the consumer’s buying behaviour.
Furthermore, Joubert (2013:27) states that when a consumer considers buying a non-
essential item or a luxury product, the influence of the reference group is much higher

4
compared to the influence needed when making the purchasing decisions of essential
products. The buying behaviour of a consumer is measured in comparison with other members
who belong to the same reference group. The consumer, therefore, draws on the value system
of the reference group and uses it as a guide when making their purchasing decisions
(Parumasur & Lombard, 2014:106-107).
Hyman (cited by Schulz, 2015:212) claims that reference groups can be classified as either
normative or comparative reference groups. Normative reference groups are groups with
whom consumers feel they have a strong connection and are the result of direct and constant
interaction between the consumer and the normative referent (Lei et al., 2017:1915). Lake
(2009:168) concurs that normative referents comprises mainly the individual’s family, co-
workers, friends and peers. Consumers perceive these referents to be more reliable and
influential because of the significant role they play in the consumer’s life (Lin & Chen, 2009:29).
Comparative reference groups, in turn, are considered more impersonal as an individual’s
physical interaction with comparative referents are restrained (Lake, 2009:169). Schulz
(2015:214) states that celebrities and sport stars are examples of comparative referents.
Consumers sometimes refer to comparative referents as role models as the lives they lead
create the ideal to which the aspiring consumer strives (Lin & Chen, 2009:29).
Apart from Hyman’s normative and comparative classifications of reference groups, Joubert
(2013:26) distinguishes four types of reference groups: membership reference groups, formal
and informal reference groups, primary and secondary reference groups as well as
aspirational reference groups.
Lake (2009:169) explains that once a clear understanding of the different types of reference
groups and the influences they exert has been gained, marketers will have a clearer
understanding of how to appeal to different consumer segments. Marketers who acknowledge
the significant influence inflicted by reference groups on consumer buying behaviour can
utilise this information to successfully segment the market. Market segmentation can,
therefore, enable marketers to fulfil consumers’ specific wants and needs by effectively
providing differentiated products or services for each group (Schiffman & Kanuk, 2014:50).
1.2.4 Market Segmentation
According to Kotler and Armstrong (2013:200), market segmentation refers to the process by
which consumers are divided into groups that have similar characteristics and needs.
Segmentation allows marketers to develop a customised marketing strategy. Furthermore, it
provides marketers with an indication as to what products and goods should be made available

5
in order to meet the specific needs and wants of their identified consumers (Ratanasawadwat
& Jiamthapthaksin, 2017:972).
Cunningham (2018:145) differentiates between four segmentation variables that can be used
for segmenting consumer markets, namely geographic, demographic, behavioural and
psychographic segmentation variables. Psychographics, in particular, provides marketers with
valuable insights into the consumer (Krishan, 2011:285). Sociologist Max Weber and
psychoanalyst Alfred Adler originally referred to the concept lifestyle to describe
psychographics. Lazer (1963) introduced this concept in the marketing field, which became
one of the key variables used to segment a market.
Kurtz and Boone (2012:290) assert that psychographic segmentation entails dividing
consumers into groups based on similar values and lifestyles. Using psychographic
segmentation variables such as lifestyle, social class and personality allows marketers to “get
into the mind of the consumer”. These variables can enhance the understanding of the
consumer’s motives when making purchasing decisions. Businesses that understand the
lifestyles of their consumers will be more successful in providing consumer-specific products
and services (Ratanasawadwat & Jiamthapthaksin, 2017:973).
1.2.5 Lifestyle
Lifestyle, as a key psychographic segmentation variable, is one of the widely used variables
to segment a consumer market. Lifestyle is commonly defined as the way consumers live their
daily lives and how they spend their time and money (Hur et al., 2010:297; Ratanasawadwat
& Jiamthapthaksin, 2017:972). According to Bruwer and Li (2017:1557), lifestyle provides
marketers with an overall view of consumers, by investigating their motivations and personal
values. Cant (2010:49) states that lifestyle enables marketers to gain a better understanding
of how consumers see themselves and how they experience the world.
According to Parumasur and Lombard (2014:66), the lifestyle of an individual has a significant
bearing on the products or services they buy and consume. Hoyer et al. (2018:391) explain
that lifestyle refers to the manifestations or patterns of behaviour that an individual follows to
acquire a chosen lifestyle. Furthermore, the authors note that the activities, interests and
opinions (AIO’s) of the consumer represent these patterns of behaviour most effectively. The
values, interests, opinions and activities in which an individual participates provide an
indication of the type of lifestyle they aspire to attain (Cant, 2010:49). Joubert (2013:75)
propounds that lifestyle influences the buying behaviour of consumers as certain products or
services must be purchased in order for the consumer to procure a desired lifestyle.

6
Based on the abovementioned discussion, it is clear that these aspects are of great
significance in the lives of Singletons. These constructs can help to understand the lifestyle of
the Singleton segment and what marketers should do to cater to their specific wants and
needs. The following section provides the problem statement that addresses the influence of
reference groups and lifestyle on the buying behaviour of Singletons.
1.3 PROBLEM STATEMENT
An extensive review of the literature revealed that at the time of this study, no previous
research could be found that has been conducted on the effect of reference groups and
lifestyle on the buying behaviour of Singletons in South Africa.
Singletons represent a newly identified segment of consumers who choose singlism – to live
a single lifestyle (Moscolo, 2017). Living in an ever-changing world, it is important for
marketers to adjust to a 21st century reality (Ren et al., 2016:2). The traditional household of
three or more consumers is drastically decreasing as compared to the growth rate of the
single-person household (Cardona, 2013). Singletons are therefore an ever-increasing market
segment, with the growth of single-households predicted to increase worldwide by 48 million
by 2020 (Envision, 2016) therefore making it the fastest growing household group around most
parts of the world.
Economic freedom is an expression that best describes the financial situations of Singletons
(Mascolo, 2017). Singletons have flexible spending power, as they have more time and money
to invest in products and services that facilitate their lifestyle (Henricks, 2014). Singletons have
great willingness to spend, if the right product or service is provided. Marketing products and
services to Singletons should be focused as Singletons differ in age, gender, nationality,
preferences, dislikes and interests (Henricks, 2014). Cunningham, (2018:143) propounds that
marketers who use a “one size fits all” approach will be unsuccessful when trying to sell their
products. Customised marketing strategies should be devised in order to appeal to the
different types of Singletons (Ren et al., 2016:5). Understanding the different products and
qualities Singletons need and value will enable marketers to provide more specific and need-
fulfilling products to the single consumer (Cunningham, 2018:144). These consumers tend to
be quite meticulous and demanding. As with other segments, Singleton’s buying behaviour is
influenced by the consumers’ preferences, product requirements, beliefs and lifestyle.
According to Armstrong et al. (2013:185) marketers use these factors to determine similarities
among consumers and their buying behaviour.

7
According to Solomon (2010:49), consumer buying behaviour is an observational activity
conducted to determine how consumers, individuals or groups acquire, consume and dispose
of products and services. Through studying consumers, organisations can improve their
marketing strategies by obtaining a better understanding of how consumers think, feel, reason
and choose when presented with different alternatives (Mykhailyk, 2014:350). Family, friends,
celebrities and co-workers influence consumers when proceeding through the decision-
making and purchasing processes. Studying the consumer behaviour of Singletons is
potentially of great interest to marketers as it influences how a product should be positioned
in order to optimise customer consumption (Mykhailyk, 2014:351). There are several factors
that influence the decision-making process of a consumer. Psychological (motivation,
perception, learning, attitude and personality) and external factors (family, social class, culture
and reference groups) help to determine the way in which consumers think and feel about
different products and services (Hoyer et al., 2018:389).
Reference groups are people who have their own perspectives regarding products and
services. Research indicates that consumers frequently base their consumption choices on
the influences and perspectives of various reference groups (Schulz, 2015:212). It is important
for marketers and organisations to gain insight into the different referents in the consumers’
lives and the level of impact that these referents have on Singletons’ buying behaviour (Cant,
2010:69). Marketers will benefit from studying the effects of these referents on Singletons, as
it provides them with an indication of what products and services the single consumer needs
and desires (Sankar, 2016:50).
Lodha and Vyas (2012:147) state that consumer buying behaviour is affected by the lifestyle
of consumers. The activities, interests and opinions of a consumer have a significant influence
on their various lifestyles and the way in which they interact with the world (Lodha & Vyas,
2012:148). According to Husain and Akhtar (2015:30), conducting a lifestyle analysis is one
of the most effective approaches that marketers can use to gain a more profound
understanding of the specific requirements that Singletons may have. The desired lifestyle
that the consumer would like to live by will become clear once marketers formulate positioning
strategies to provide these consumers with the desired products and services in order to
complement their desired lifestyles (Husnain & Akhtar, 2015:32). With the number of
Singletons rapidly increasing, marketers should invest in greater efforts to address the diverse
needs and desires of this segment more effectively (Henricks, 2014). According to Envision
(2016), although there is a rise in the number of Singletons, they still feel as if there is a stigma
to being alone. Therefore, it is critical for marketers to understand the buying behaviour of
Singletons (Quintos, 2019). This, in turn, will enable marketers to provide effective

8
communication and strategies that will contribute towards delivering appropriate products and
services.
This study aims to address a prevalent gap in the current marketing literature by conducting
an investigation into how lifestyle and reference groups affect the buying behaviour of
Singletons. An analysis of the various lifestyle dimensions of Singletons will enable marketers
to more cater to the needs and wants of Singletons effectively and efficiently. Identifying and
understanding the reference groups to whom Singletons refer when making purchasing
decisions will allow marketers to position their products and services aptly. Thus, by identifying
the referents and lifestyle choices Singletons consider when making their buying decisions,
marketers have the opportunity to reach this segment more effectively by developing fitting
marketing strategies and policies. The reason for undertaking this study was to determine
the effect of reference groups and lifestyle on the buying behaviour of Singletons.
1.4 OBJECTIVES OF THE STUDY
1.4.1 Primary objective
The primary objective of the study is to determine the effect of reference groups and lifestyle
on the buying behaviour of Singletons.
1.4.2 Secondary objectives
To attain the primary objective, the following secondary objectives have been formulated:
1. To provide an overview of the literature related to the main constructs of this study, namely
consumer behaviour, reference groups, market segmentation and lifestyle segmentation.
2. To develop a demographic profile of consumers who form part of the Singleton market
segment and who participated in this study.
3. To determine the extent to which reference groups have an effect on the buying behaviour
of Singletons.
4. To determine the lifestyle of Singletons in terms of fashion-consciousness.
5. To determine the lifestyle of Singletons in terms of cost-consciousness.
6. To determine the lifestyle of Singletons in terms of health orientation.
7. To determine the lifestyle of Singletons in terms of recreation.

9
8. To determine the lifestyle of Singletons in terms of E-shopping.
9. To determine the lifestyle of Singletons in terms of career-orientation.
10. To determine the underlying relationships between the various lifestyle dimensions of
Singletons.
11. To determine the underlying relationships between the effect that the reference groups
have and the lifestyle dimensions of Singletons.
12. To determine the difference in perception of reference group influence and the lifestyle
dimensions of Singletons with regard to their demographic differences.
1.5 RESEARCH METHODOLOGY
This section provides an overview of the research methodology that was used to collect and
evaluate the data needed for this study. The research design, population and sampling,
measurement instrument, data collection, and data analysis are discussed below,
demonstrating the procedures that were followed in order to achieve the research objectives.
1.5.1 Literature study
Hair et al. (2010:51) define a literature study as a thorough examination of information that is
relevant to the research topic. Articles, books, theses and scholarly journals were consulted
during this study to structure the literature review. Different electronic databases (mentioned
below), were used to acquire existing literature needed for this study.
EbscoHost: International journals on Academic Search Premier, Business Source,
Communication and Mass Media Complete and EconLit.
Emerald: International journals.
Internet: Google Scholar.
ProQuest: International dissertations in full text.
SACat: National catalogue of books and journals in South Africa.
ScienceDirect: International journals.

10
NEXUS: Databases compiled by the NRF of current and completed research in South
Africa
1.5.2 Empirical investigation
The empirical investigation provides insight into how primary data was obtained for this study.
The research design, data collection method, sample plan, measurement instrument, pilot
study and data analysis are discussed below.
1.5.2.1 Research design
The research design is a master plan or outline that provides guidance when collecting and
analysing data (Burns & Bush, 2014:98). Conducting a successful study will be more feasible
as the research design helps to detail all the necessities for the study. Zikmund and Babin
(2012:50) identify three general types of research designs, namely exploratory, causal and
descriptive research.
Exploratory research, as explained by Zikmund et al. (2012:55), is used when a basis for
further research is needed when novel marketing concepts are being tested. Burns and Bush
(2014:101) state that the primary goals of exploratory research are to gain background
information, clarify problems and establish research priorities. With exploratory research, the
research is highly adjustable and un-structured, and is typically conducted in areas of research
that have not yet been studied (Schiffman & Kanuk, 2014:24).
Causal research aims to determine those aspects that give rise to some event or another
(Burns & Bush, 2014:74). According to McDaniel and Gates (2010:77), causal research
determines whether the value of one variable will influence the value of another variable.
Iacobucci and Churchill (2010:123) state that experiments provide the most convincing
indications of causal relations in causal research. Causal research is expensive, complex and
time-consuming, thus making it more difficult to conduct (Feinberg et al., 2013:108).
Descriptive research has a primary objective to describe a marketing phenomenon (Burns &
Bush, 2014:74). Answers to questions such as who, what, where and how are provided when
conducting descriptive research (McDaniel & Gates, 2010:49). Hair et al. (2010:36) propose
that descriptive research attempts to provide a comprehensive and accurate description of
characteristics such as attitudes, intentions, preferences, beliefs or opinions.
Businesses can describe a consumer segment by conducting a lifestyle analysis and by
determining the extent of influence exerted upon consumers by various reference groups. The

11
empirical research for this study was therefore based on a descriptive research design
because the purpose of this study is:
To describe the demographic profile of consumers who form part of the Singleton market
segment and who participated in this study.
To describe the lifestyle of Singletons in terms of various lifestyle dimensions that have an
effect on the buying behaviour of these consumers.
To describe the extent to which reference groups have an effect on the buying behaviour
of Singletons.
To describe the underlying relationships between the various lifestyle dimensions of
Singletons.
To describe the underlying relationships between the level of reference group influence
and the lifestyle dimensions of Singletons.
To describe the differences in perception regarding reference group influence and the
lifestyle dimensions of Singletons with regard to their demographic differences.
1.5.2.2 Data collection method
Cant (2010:48) describes two types of data collection methods, namely primary and secondary
data collection. Primary data refers to data that has not yet been collected. A formal marketing
investigation must be conducted to collect this type of data (Wiid & Diggines, 2009:71).
Qualitative or quantitative research can be used to collect information for a specific purpose
(Bradley, 2010:518). Secondary data has been previously collected and pertains to a problem
or issue (Hair et al., 2010:26). The relevance, timeliness, accuracy and reliability are factors
that should be kept in consideration when using secondary data (Wiid & Diggines, 2009:58).
Furthermore, Burns and Bush (2014:146) classify data collection into two categories, namely
qualitative and quantitative research.
Qualitative research, as explained by Berndt and Petzer (2011:45), is used to obtain insight
into a person’s perspective and allows the researcher to gain background information and a
clear understanding of a research problem. Wiid and Diggines (2009:89) identify focus groups,
observation and interviews as the primary data collection methods most commonly used.

12
Quantitative research is research that aims to measure and quantify data by generalising the
results from the acquired sample to the broader targeted population during data collection
(Malhotra, 2010:171). Burns and Bush (2014:146) and Burns et al. (2017:143) state that
quantitative research is a form of conclusive research, as it usually involves the administration
of a structured questionnaire, with predetermined response options.
For the present study, primary data was collected by means of self–administrative
questionnaires. Statistical data analysis was used to quantify the data in order to address the
study’s primary and secondary objectives. Therefore, quantitative research was conducted
in this study.
1.5.2.3 Developing the sample plan
A population refers to a set of respondents who have the same characteristics, contributing to
all the elements that belong to the target group of the study (De Vos et al., 2009:202; Henn et
al., 2009:153). The population used for this study included consumers who form part of the
Singleton segment, and who are residing in the Gauteng province of South Africa. The sample
was drawn from this population by using an appropriate method of sampling.
Burns et al. (2017:241) distinguishes between two types of sampling, namely probability
sampling and non-probability sampling.
With probability sampling, each individual of the population has an equal chance of being
included into the sample (Steven et al., 2012:185). Berndt and Petzer (2011:173) state that
probability sampling is based on the notion of random selection and the use of an available
sample frame (McDaniels & Gates, 2010:423). Probability sampling techniques include simple
random sampling, systematic sampling, stratified sampling and cluster sampling (Hair et al.,
2010:133).
Simple random sampling refers to when the researcher uses random numbers from a table or
a random selection procedure to select specific respondents for inclusion in the sample (Burns
& Bush, 2014:243; McDaniel & Gates, 2010:429). Systematic sampling entails that
researchers use a sample frame and randomly choose the starting point of the first sample
member. The subsequent members are chosen according to a pre-selected interval (Malhotra,
2010:377). With stratified sampling, the researcher identifies subpopulations in the sample
frame known as “strata” (Burns & Bush, 2014:243). The researcher randomly selects sub-
samples from each stratum to participate in the study (Wiid & Diggines, 2009:205). Cluster
sampling, in turn, divides the sample frame into smaller clusters that are similar to one another.

13
After selecting a few clusters, researchers can conduct a census on each cluster (Burns &
Bush, 2014:243).
According to Wiid and Diggines (2009:199), non-probability sampling refers to the probability
of the element in the population, being selected to participate in the study, as unknown. Non-
probability sampling is arbitrary and subjective, as researchers depend on their own
judgement (Berndt & Petzer, 2011:175). According to Zikmund and Babin (2012:312)
purposive sampling, referral sampling, quota sampling and convenience sampling are all
sampling techniques that form part of non-probability sampling.
Purposive sampling allows researchers to identify a respondent for the sample by using their
own knowledge or knowledge obtained from others (McDaniel & Gates, 2013:293). With
referral sampling, respondents are gathered by referrals from initial respondents. These
referrals tend to have the same characteristics, interests and dislikes as the individual who
referred them (Struwig & Stead, 2013:121). Quota sampling allows the researcher to identify
quota characteristics, and it enables the researcher to categorise the population by relevant
properties (Burns & Bush, 2014:255). Convenience sampling takes place when potential
respondents are conveniently intercepted whilst visiting high–traffic locations such as
shopping malls (Aaker et al., 2011:351).
For this study, non–probability, convenience sampling was used.
According to Malhotra (2010:374), sample size is generally described as the number of sample
elements included in a study. Burns and Bush (2014:267) add that the accuracy of the sample
is determined by the size of the sample. A larger sample will provide the researcher with more
accurate information (Burns & Bush, 2017:264).
Malhotra (2010:374) furthermore explains that the nature of a study, as well as previous
studies, influence the selected sample size of the study. Table 1-1 provides insight into
different sample sizes that can be used for conducting different research studies.
Table 1-1: Sample sizes for marketing research studies

14
Type of study Minimum size Typical range
Source: Adapted from Malhotra (2010:375).
For this study, problem-solving research was conducted by using 207 respondents, which
ensured the accumulation of accurate data.
Table 1-2 provides a summary of the sample plan implemented in the study.
Table 1-2: Sampling plan for the study
1.5.2.4 Measurement instrument
Wiid and Diggines (2009:171) define a questionnaire as a list of questions that is designed
primarily to obtain data. This data will, in turn, contribute towards accomplishing the primary
and secondary objectives of a study. Iacobucci and Churchill (2010:328) define data collection
as an act where the information needed for the completion of the study is gathered. Data for
this study was collected by means of a questionnaire.
According to Burns and Bush (2014:172), there are four basic types of questionnaires that
researchers can use for obtaining data, namely a person-administrated questionnaire,
computer-assisted questionnaires, computer-administrated questionnaires, and self–
administrated questionnaires. Person–administrated questionnaires are questionnaires where
Problem-identification research 500 1 000 – 2 500
Problem-solving research 200 300 – 500
Product tests 200 300 – 500
Test-marketing studies 200 300 – 500
TV/radio/print advertising 150 200 – 300
Design elements Application to empirical study
Population
Sampling element Consumers who form part of the singleton segment, residing in Gauteng province, South Africa, in 2018.
Extent Gauteng province
Time 2018
Sampling method Non-probability convenience sampling.
Sample size Researcher interviewed 207 sampling elements.

15
the questions are read and explained (if necessary) to the respondents by the interviewer. The
interviewer is responsible for recording the answers provided by the respondents. When using
computer-assisted questionnaires, the questions are presented to the respondents verbally.
The interviewer depends on the computer to present him or her with the questions being
asked, while providing spaces where the interviewer can fill in the answers provided. A
computer–administrated questionnaire enables respondents to complete the questionnaire on
the computer itself. The computer is responsible for providing the respondents with the
questions and then recording the answers that they indicate. Burns and Bush (2014:178)
define self–administrative questionnaires as questionnaires that are completed by the
respondents on their own. The respondents do not receive any assistance from agents,
humans or computers administrating the interviews. For the purpose of this study, a self–
administrated questionnaire was used as the research instrument. This ensured that the
respondents did not feel rushed, anxious or pressured when answering questions, which in
turn, resulted in more truthful and insightful information being obtained (Burns & Bush,
2014:178). Screening questions were used by trained fieldworkers, which helped to identify
respondents who qualified to participate in the study.
The layout of the questionnaire included the purpose of the study, instructions on how to
complete the questionnaire, as well as the rights of the respondents concerning the completion
of the questionnaire. The four sections (A, B, C and D) containing the various questions and
scales followed. These sections comprised of the following:
Section A: This section comprised screening questions that determined whether the
respondent qualified to participate in this study. This study is very specific, since it
considered only single respondents. Screening questions for this study include:
1) Are you older than 18?
2) Are you single?
3) Do you live alone?
Section B: This section aimed to measure the effect of reference groups on the buying
behaviour of Singletons. The Susceptibility to Interpersonal Influence (SUSCEP) scale,
based on the measures used by Bearden et al. (1989), was used to measure the effect
that reference groups have on Singletons. The normative influences constitute statements
B1 to B8, whereas statements B9 to B12 constitute informational influences. De Marais
(2015:10) confirmed the reliability of the SUSCEP scale by determining its Cronbach Alpha
coefficient. The normative scale presented a coefficient of 0.09 with the informational scale

16
coefficient being 0.72. A Likert–type scale was used to measure the responses to the
statements where 1 = strongly disagree and 7 = strongly agree.
Section C: A lifestyle analysis of respondents was conducted through the use of 37 AIO
(activities, interests and opinions) statements, as proposed by Plummer (1974). According
to Hur et al. (2010:296), when conducting a lifestyle analysis, the AIO statements are the
most typically used approach. Investigating how consumers conduct their daily lives
through work and play can allow researchers to divide consumers with different tendencies
and feelings into compatible segments, to ensure that more efficient marketing strategies
are developed and implemented (Kucukemiroglu et al., 2006:60). Anantachart (2013:87)
states that when using the AIO lifestyle framework developed by Plummer, the reliability
of each lifestyle dimension in terms of activities, interests and opinions was 0.85, 0.86 and
0.88 respectively. A seven–point Likert–type scale (1 = strongly disagree and 7 = strongly
agree) was used to measure the 37 AIO statements. The following lifestyle dimensions
were defined by placing the 37 AIO statements in sub–categories:
Fashion-consciousness
Cost-consciousness
Health orientation
Recreation
E-shopping
Career orientation.
Section D: This section comprised information on the respondents’ demographic
background. Questions based on the respondents’ age, income, marital status, gender,
occupation and education were asked. According to Burns and Bush (2014:176), in order
to accumulate accurate data from respondents, challenging or delicate questions should
be asked towards the end of the questionnaire. This helps to alleviate potential stress and
provides respondents with a sense of safety when answering the questions. Closed–
ended questions with predetermined answers were used as the format of these
demographic questions.

17
1.5.2.5 Pilot study
In order to complete a pilot study of the questionnaire, the formulated questions should be
presented to a small sample size of respondents who are of relevance to the study (Burns &
Bush, 2014:229). Upon completion of the questionnaire, any problems concerning the
wording, phrases, question flow, directions, length or items identified by respondents should
be changed and corrected in order to improve the quality of the questionnaire.
The North-West University’s Statistical Consultation services analysed the questionnaire for
this study in order to determine whether the questions asked were applicable in terms of
achieving the objectives of the study.
A sample of twenty respondents was asked to complete the questionnaire in Gauteng. The
test sample consisted of Singletons and enabled the researcher to determine their
understanding of and responses to the questions asked.
In order to achieve the primary objective of this study, which is to determine the effect of
reference groups and lifestyle on the buying behaviour of Singletons, the data gathered
through the completion of the self-administrative questionnaires was analysed.
1.5.2.6 Data analysis
Zikmund et al. (2010:462) state that once the data has been collected, it should be captured,
analysed and interpreted for the researcher to obtain information applicable to the study.
Editing, capturing, coding and the cleaning of the data are of great importance as the study is
quantitative of nature. The Statistical Package for Social Science (SPSS) was used to
calculate the frequencies in sections B and D respectively. Cronbach-Alpha values were
calculated to determine the reliability of the questionnaires. Confirmatory Factor Analysis
(CFA) determined the validity of the questionnaire as a measuring instrument. The practical
significance by means of effected size was determined through the use of d-values of Cohen.
The means and standard deviations were calculated. Linear relationships were determined
through the use of the Pearson product-moment correlation coefficients.
1.6 CHAPTER CLASSIFICATION FOR THIS STUDY
Chapter 1: Contextualisation of the study
This chapter commences with an introduction to the study. Background to the study, the
research problem, primary and secondary objectives and an overview of the research

18
methodology are presented. The significance and relevance of the study are also noted here.
Chapter 1 concludes with a proposed outline of the study.
Chapter 2: Analysing consumer buying behaviour
A theoretical overview of consumer buying behaviour is provided in this chapter. A discussion
of the decision-making process and the various influences on the decision-making process is
presented. Reference groups, as one of the predominant external influencing factors on the
consumer decision-making process, are discussed and analysed.
Chapter 3: Market segmentation
This chapter focuses on a theoretical and contextual discussion of the market segmentation
concept with emphasis on the psychographic (lifestyle) segmentation variable. Singletons, as
a consumer segment, and their relevance for marketers in South Africa conclude this chapter.
Chapter 4: Research methodology
Insight into the research methodology used in this study is provided. The research
methodology was based on the marketing research principles. Aspects such as the literature
study, empirical investigation, research design, data collection methods, the sample plan, the
measurement instrument, and the data analysis methods are addressed.
Chapter 5: Reporting of results
The results of the study are presented in this chapter. The main findings are drawn and
described in agreement with the objectives of the study.
An overview of the study is provided, along with the conclusions obtained by analysing the
results obtained, recommendations for future research, and limitations of the study.
1.7 CONCLUSION
Chapter 1 provides the motivation reasoning for undertaking the present study by considering
the research problem, along with the primary objective of the study and secondary objectives
set in order to achieve the primary objective. The methodology implemented in this study is
referred to.
Chapter 2 will focus on discussing consumer behaviour as a framework for determining the
effect of reference groups and lifestyle on the buying behaviour of Singletons.

19
CHAPTER 2: CONSUMER BEHAVIOUR
2.1 INTRODUCTION
The aim of this chapter is to provide theoretical insights into the nature of consumer behaviour.
The chapter commences by defining the concept of consumer behaviour and elaborating on
what it entails and how it relates to the marketing concept. Consumer decisions along with the
consumer decision-making process are explained, followed by a discussion on the influences
of the decision-making process. Thereafter, reference groups, as one of the primary
influencers of the study, are discussed by elaborating on the different types of reference
groups, their marketing implications and the strength of their influence on consumer buying
behaviour. The chapter concludes with a description of how reference groups can be used as
a basis for market segmentation.
2.2 MARKETING AND CONSUMER BEHAVIOUR
Kurtz and Boone (2012:7) propound that marketing encompasses a considerable number of
activities and ideas which makes the formulation of a single definition for marketing quite
challenging. Kotler and Keller (2016:26) offer a concise definition stating that marketing
concerns the practice of meeting consumer needs most profitably. Kotler and Keller (2016:26)
add that marketing is “the art and science of choosing target markets and recruiting, keeping
and growing customers through creating, delivering and communicating superior customer
value”. In order to gain a comprehensive understanding of marketing, the American Marketing
Association (AMA) provides the following definition of marketing: “The activity, set of
institutions and processes for creating, communicating, delivering and exchanging offerings
that have value for customers, clients, partners and society at large” (AMA, 2017).
Marketing from a consumers’ perspective comprises of activities such as advertising and
personal selling, but in reality, the process of marketing begins long before products are
produced and made available for consumers to purchase and consume (Kurtz & Boone,
2012:7). Furthermore, Kurtz and Boone (2012:7) propound that marketing involves identifying
and analysing the needs of consumers to gather information needed in order to design and
produce products and services, which will meet consumers’ expectations and satisfy their
needs and wants and to create and build relationships with consumers and suppliers.
Kotler and Keller (2016:27) stress that the aim of marketing is to identify and understand
consumers by studying their behaviours and getting to know them so well that marketers will
be able to develop products and services which will align with their specific needs and desires.

20
Marketers who understand consumers, the way in which they behave and their wants and
needs, will be able to create customised marketing strategies that will effectively appeal to the
consumers in their selected target market(s). The study of consumer behaviour is thus
regarded as a core component of marketing (Kotler & Keller, 2016:27).
2.3 DEFINING CONSUMER BEHAVIOUR
Schiffman and Kanuk (2014:4) explain that consumers demonstrate certain types of behaviour
whilst selecting, securing, using, evaluating and disposing of products and services, which
they feel, will facilitate their lifestyle. Babin and Harris (2018:4) define consumer behaviour as
to how consumers acquire, use and dispose of the offerings presented by organisations.
Furthermore, it is stated that consumers cannot only acquire these offerings through direct
purchase, but by means of barter, leasing or borrowing as well. Whilst studying consumer
behaviour, marketers strive to firstly understand consumer buying behaviour, predict
consumer patterns and lastly attempt to influence the purchase decisions made by consumers
(Lamb et al., 2010:75). Over the years, several authors have provided various definitions for
the concept of consumer behaviour. Table 2-1 presents some of the more popular definitions
used in marketing literature today.
Table 2-1: Towards a definition of consumer behaviour
Author Definition
Joubert (2013:2) “An investigation done into the methods used by individuals, groups and organisations to identify, purchase, asses and discard goods and services in order to satisfy their particular needs and wants.”
Hoyer et al. (2018:5) “The totality of consumers’ decisions with respect to the acquisition, consumption and disposition of goods, services, time and ideas by human decision-making units.”
Parumasur et al. (2014:2) “A combination of activities and influences that occur before, during and after the purchase itself.”

21
Table 2-1: Towards a definition of consumer behaviour (continued)
By taking into consideration the various definitions of consumer behaviour mentioned in Table
2-1, for the purpose of this study, consumer behaviour is defined as the activities of searching
for, purchasing, consuming and disposing of goods and services that consumers believe will
satisfy their unmet needs and desires.
Noel (2009:12) highlights the fact that organisations should bear in mind that the consumption
of goods and services is undertaken by consumers from various age categories, including
adults, senior citizens and/or teenagers. It is therefore important that marketers should
conduct research on the behaviour of consumers in various different age groups. Once
marketers gain a better understanding of the behaviour patterns of consumers in different age
categories, they will be able to adjust their marketing strategies to best provide consumers
with products and services they want and need (Horner & Swarbrooke, 2016:14). Schiffman
and Kanuk (2014:5) concur, stating that the study of consumer behaviour focuses on providing
effective and efficient marketing strategies to assist consumers whilst proceeding through the
decision-making process (Horner & Swarbrooke, 2016:14; Schiffman & Kanuk, 2014:5).
According to Al Zoubi and Bataineh (2011:61), the decision-making process concerns the
various stages through which consumers proceed when deciding on how to spend their effort,
time and money on the products and services they wish to purchase. Marketers should not
only understand the different decisions made by consumers, but also the factors that influence
these purchasing decisions (Parkash, 2017:64). Figure 2-1 depicts a model of consumer
behaviour explaining how different factors (both psychological and external in nature) affect
the consumer decision-making process.
Author Definition
Schiffman and Kanuk (2014:4) “The behaviour that consumers display in searching, purchasing, using, evaluating and disposing of products and services that they expect will satisfy their needs. “
Kardes et al. (2015:7) “Consumer activities associated with the purchase, use and disposal of goods and services, including the consumer’s emotional, mental and behavioural responses that precede, determine or follow these activities.”
Babin and Harris (2018:4) “The set of value-seeking activities that take place as people go about addressing and attempting to address real needs.”

22
Figure 2-1: The model of consumer behaviour
Source: Adapted from Kardes et al. (2015:234) and Schiffman and Kanuk (2014:16).
The decisions that consumers make, as well as the psychological and external influences
exerted on these decisions, are discussed in greater detail in the subsequent section.
2.4 CONSUMER DECISIONS
In 2016, Joel Hoomans published an article concerning choices made by strategic leaders,
stating that on average a person makes 35 000 decisions a day (Hoomans, 2016). It is
important for marketers to know how and why consumers choose to make their purchasing
decisions whilst considering all the available alternatives. According to Schiffman and Kanuk
(2014:406), a decision is made when a consumer selects an option where there are two or
more alternatives available. The authors add that a decision can only be made if there are
available options to choose from. Cant et al. (2010:193) propounds that consumers engage in
making decisions, as these decisions will satisfy their perceived needs. According to Lombard
et al. (2016:262), consumers make decisions in order to alleviate tension that occurs as a
result of their unmet needs.

23
A no-choice situation, also commonly referred to as a Hobson’s choice (Schiffman & Kanuk,
2014:406), is defined as a situation in which the consumer does not have alternatives to
choose from and thus the situation does not constitute a decision. Furthermore, Schiffman
and Kanuk (2014:406) state that a Hobson’s choice rarely occurs, and that consumers are
more likely to be faced with a decision as they usually have a variety of products and services
from which they can choose. Baoku et al. (2010:629) add that consumers have different styles
of making decisions between available alternatives.
2.4.1 Consumer decision-making styles
According to Parkash (2017:63), decision-making styles entail the approaches, orientation and
influences that consumers experience when making their purchase decisions. Zhou et al.
(2010:46) identify eight decision-making styles used by consumers:
Price or value consciousness: These consumers are more apprehensive about the price
paid for a product or a service than they are concerned about the perceived value.
Perfectionism or quality consciousness: Consumers wish to acquire available products or
services that are of the highest quality.
Impulsiveness and carelessness: Consumers purchase products or services without
considering the price.
Confusion due to over-choice: Consumers struggle to make purchase decisions due to too
many alternatives to select from.
Brand consciousness: Consumers choose to purchase products that are prestigious in
nature as they believe that a higher price represents a higher quality product.
Recreational and hedonistic shopping consciousness: Consumers use shopping as a form
of recreation and considers it to be a fun activity.
Novelty and fashion consciousness: Consumers are focused on purchasing the latest and
most distinctive products.
Habitual, brand loyal orientation: Consumers are loyal towards a certain brand or store
and choose to re-purchase products from their preferred brand category or store without
considering other alternatives.

24
Understanding the diverse consumer decision-making styles will provide marketers with a
more profound understanding of consumer behaviour. Marketers can use this insight to
effectively identify segments of consumers who share in the same decision-making styles.
Upon identifying the consumer segments, marketers will be able to devise effective marketing
campaigns and strategies (Shin, 2010:36). In addition to understanding the diverse range of
consumer decision-making styles, it is beneficial for marketers to gain a holistic understanding
of the consumer decision-making process, as this will enable them to realise at what point in
the process certain decisions are made, and by so doing, place them in a better position to
alter or affect these decisions.
2.4.2 The consumer decision-making process
According to Noel (2009:133), the foremost essential assumption of decision-making is the
availability of two or more alternatives. Consumers constantly strive toward satisfying their
desires and needs. Consumer decision-making is considered to be a cognitive process, during
which consumers identify their specific wants and needs and then implement actions to fulfil
these needs (Joubert, 2013:124).
The process of consumer decision-making comprises seven steps including need recognition,
search for information, pre-purchase evaluation of alternatives, purchase, consumption, post-
consumption evaluation and divestment (Lombard et al., 2014:261). Marketers who study the
various steps in the consumer decision-making process are better equipped to understand
how consumers make decisions and what their specific preferences are. This will enable
marketers to be more persuasive in their marketing strategies, campaigns and product
offerings (Noel, 2009:135). Mpinganjira and Dos Santos (2013:325) add that once marketers
gain an in-depth understanding of the different steps in the consumer decision-making
process, this will provide them with more profound consumer insight enabling them to
effectively comprehend the complexity of the different decisions made by consumers;
understand why some consumer decisions are more time-consuming and demand more
attention than others; and have a clearer view of the risks that some decisions may impose
on consumers.
Joubert (2013:126) states that upon understanding these steps, marketers can tailor their
marketing strategies, product offerings and communication to best appeal to the consumers
and provide them with products and services they most likely seek. The consumer decision-
making process model is illustrated in Figure 2-2.

25
Figure 2-2: The consumer decision-making process model
Source: Adapted from Joubert (2013:126) and Schiffman and Kanuk (2014:16).
The various steps in the consumer decision-making model are discussed subsequently.
2.4.2.1 Step 1: Need recognition
The decision-making process of a consumer begins with the recognition of unsatisfied needs
and desires. A need can be fulfilled by acquiring products or services (Szmigin & Piacentini,
2018:84) According to Noel (2009:136), need recognition occurs once the consumer’s actual
state of affairs does not measure up to their desired state. Consumers who are not satisfied
with their desired state will present motivational behaviour in which they will engage in relevant
activities to ensure that they reach their desired state.
Schiffman and Kanuk (2014:414) identified two different styles of need recognition by which
consumers can be classified. Consumers who find that their products or services no longer
satisfy them recognise that their present state constitutes a problem. This can also be caused
by a decrease in the actual state of the current product or service, for example when a

26
consumer has run out of milk, they recognise their need and replace it with a new full bottle.
The desired state represents the second need recognition style identified by Schiffman and
Kanuk (2014:414). The desired state occurs when consumers yearn for something new; for
example, if a consumer does not own a motor vehicle, but all of his friends do. The consumer’s
desired state is thus to have a vehicle of his own.
According to Joubert (2013:126), whilst consumers are going through the process of need
recognition, they are influenced by several factors such as environmental influences, memory,
individual differences and social influences. These factors affect the complexity of the
decisions made by consumers.
2.4.2.2 Step 2: Search for information
Upon recognising their needs, consumers will start searching for information on various
products and/or services that could possibly satisfy their unmet needs and desires. Lombard
et al. (2013:270) explain that the process that consumers go through whilst searching for
information comprise physical and mental activities. Consumers will collect information about
the brands and product alternatives, as well as the nature of the product’s price, terms of sales,
product availability and quality. Mpinganjira and Dos Santos (2013:342) add that consumers
go through this information search process in order to find products or services with specific
attributes which they believe will fulfil their unmet needs.
Pride and Ferrell (2010:196) propound that the information-seeking process of consumers can
be internal or external. The internal search for information ensues when consumers recollect
their past experiences within their memory or draw on genetic tendencies. Consumers who
reflect on their memories will shorten the lengthy process of searching for alternatives, as
experience and knowledge enable them to recall whether they were satisfied with a certain
product or not (Joubert, 2013:128). An external search comprises information collected by
means of consulting family, friends or peers – collectively referred to as reference groups (see
section 2.5.2.4) (Pride & Ferrell, 2010:196).
According to Joubert (2013:128), there are individual differences and environmental
influences that affect the information search process of a consumer including attitudes,
personality, consumer resources (time and money), lifestyle, motivation, involvement,
knowledge and demographics. External influences include factors such as marketing
campaigns, advertising, social and cultural influences, selling strategies and promotions. After
collecting sufficient information, consumers will process the information and arrive at a
conclusion based on what they have learned (Peter & Donnelley, 2011:50).

27
2.4.2.3 Step 3: Pre-purchase evaluation of alternatives
Having identified promising solutions to their recognised needs, consumers engage in the third
step of the decision-making process during which they will evaluate their alternative solutions.
According to Lombard et al. (2013:273), consumer evaluation is part of this step and it entails
that the consumer measures each alternative’s advantages and disadvantages whilst using
pre-established evaluation criteria.
Joubert (2013:131) explains that the evaluation criteria of each consumer varies. Consumers
all have unique and different needs, which means they have different limits they deem as
adequate when searching and selecting the best alternative to fulfil their unmet needs.
Furthermore, Joubert (2013:131) states that the particular situation or environment in which
these alternatives are evaluated depends on the type of product under consideration. Less
time will be spent on evaluating the everyday products (such as bread and milk), whereas
more time is devoted to high-value, once-off purchases where product characteristics,
specifications and special features will be assessed to determine which alternative is of best
fit to the consumer (Lantos, 2011:69).
2.4.2.4 Step 4: Purchase
The fourth step in the decision-making process as proposed by Peter and Donnelly (2011:51)
is the actual purchase of the product which has been evaluated by the consumer through
means of their pre-determined set of criteria. Consumers purchase these products based on
their belief that they will satisfy their unmet needs and desires.
Schiffman and Kanuk (2014:49) identify trial purchases, repeat purchases and long-term
commitment purchases as the three types of purchases that consumers make. Trial purchases
are known as the exploratory purchase phase of a consumer. Consumers explore the product
or service by purchasing and using it for the first time. The quantity of products or services
bought will be trivial at first, since consumers are unsure about the manner in which they will
experience the product or service. Promotions are a strategy that can be implemented and
are regarded as an encouraging and influencing factor for consumers to try new products on
a trial basis. Coupons, free samples and price discounts are a few possibilities that form part
of the promotional strategy.
Repeat purchases take place when a new brand is introduced to an established product
category. According to Schiffman and Kanuk (2014:429), consumers who experience the new
brand as more satisfying than older brands will engage in repeat purchasing behaviour of the

28
new brands once they have concluded the trial purchase. According to Schiffman and Kanuk
(2014:429), a consumer may also make repeat purchases of an existing brand or product
category once it has satisfied and met the needs of the consumer. A stable marketplace will
be met through repeat purchases as consumers become loyal towards the brand and this
ultimately leads to the purchase of products in larger quantities (Schiffman & Kanuk,
2014:429).
Long-term commitment purchases constitute the last consumer purchase type identified by
Schiffman and Kanuk (2014:429). This concept refers to consumers buying larger, more
expensive products which are meant to last longer than a year. Trial purchases are not
practical in terms of long-term purchases, as these products cannot be obtained in small
quantities and are usually purchased after the evaluation process has been completed
2.4.2.5 Step 5: Consumption
Upon purchasing the products or services, consumers now possess these products and
decide on when and how they prefer to consume it (Mpinganjira & Dos Santos, 2013:345).
According to Goodwin et al. (2008:3), consumption represents the end of all the economic
activities and is the step during which the product or service is put to final use by consumers.
2.4.2.6 Step 6: Post-consumption evaluation
Noel (2009:150) states that it is imperative for marketers to remain in touch and involved with
consumers even after they have purchased and consumed the products or services. This will
enable marketers to receive feedback based on the satisfaction levels that consumers
experienced whilst consuming the product or service.
In this step of the consumer decision-making process, consumers evaluate the products or
services that they have consumed and determine whether these met their expectations or not.
Schiffman and Kanuk (2014:429) propound that the post-consumption evaluations conducted
by the consumer could result in one of the following three outcomes: (1) the actual
performance of the product or service matches the consumer’s expectations; (2) the
performance of the product or service exceeds the consumer’s expectations; or (3) the
performance of the product or service is below the expectations of the consumer. When
making purchase decisions in the future, consumers make use of their memory and how they
perceived the product or service, making the decision process easier (Schiffman & Kanuk,
2014:429). Thus, the outcomes compared to the consumer’s expectations are of great
significance.

29
Mpinganjira and Dos Santos (2013:345) refer to the terms positive disconfirmation and
negative disconfirmation to denote the outcome of post-consumption evaluation. Positive
disconfirmation occurs when consumers are pleasantly surprised by the outcome that they
have received whilst consuming the product or service. Exceeding the expectations set by the
consumer results in the consumer being satisfied with the product. Satisfied consumers return
to re-purchase the products that they know will satisfy their needs, which increases the
likelihood of spreading positive word-of-mouth. Furthermore, Mpinganjira and Dos Santos
(2013:345) explain that negative disconfirmation occurs once consumers have consumed the
product or service but their expectations and unmet needs have not been satisfied.
Dissatisfaction is directly related to negative disconfirmation. Consumers feel let down by the
product or service, making their decision to discard the product and searching for alternatives
more likely. Consumers who are dissatisfied may also be proactive in spreading negative
word-of-mouth and discourage other consumers to purchase and use the product or service.
According to Peter and Donnelly (2011:10), organisational success is defined by the ability of
an organisation to satisfy the needs and desires of consumers most effectively and efficiently,
thus implying that the main focus of an organisation should be to satisfy the diverse wants and
needs of consumers and thus to gain a competitive advantage
2.4.2.7 Step 7: Divestment
Divestment represents the final step in the consumer decision-making process. Consumers
have to decide whether they are going to recycle, reuse (i.e. product packaging) or dispose of
the consumed product and how they will go about doing so.
Szimigin and Piacentini (2018:108) explain that consumers seldom think about the ways in
which they are going to dispose of a product or service whilst purchasing or consuming it and
do not always choose the same method of doing so. Disposing products or services to friends
and family or giving it away freely are some of the initial methods opted by consumers
(Szimigin & Piacentini, 2018:108). Other methods include donating it to charity, direct disposal,
whether it is in general rubbish or by means of recycling, represents yet another method. The
last method comprises the consumer exchanging it for another product or service (Szimigin &
Piacentini, 2018:109).

30
2.4.3 Types of consumer purchasing decisions
Prakash (2017:67) affirms that consumers are forced to make various purchasing decisions
on a daily basis. The complexity of a consumer’s decision varies according to the type of
decision being made (Lei et al., 2017:193). Prakash (2017:68) identifies four general
consumer purchasing decisions:
Minor new purchase: These represent the new purchases a consumer makes; however,
the value they represent are insignificant to the consumer.
Minor re-purchase: These purchases represent routine purchases of a product which
previously satisfied the needs of the consumer. Thus, the consumer has no desire to look
at alternative options, but would rather opt to buy the same product or brand again.
Major new purchase: These purchase decisions are regarded as the most difficult
decisions of all, as the product category from which these decisions are made usually
comprise more expensive products and require the consumer to spend more time and
effort when deciding whether to purchase the product or not. New purchases complicate
the decision-making process and lengthens the amount of time spent on it, as consumers
may have very little experience with the product or brand when making these decisions,
and as such engage in a lengthy search for information (see section 2.4.2.2)
Major re-purchase: Consumers have more confidence when making major re-purchase
decisions as they have gained experience and knowledge of the product or brand category
due to previous consumption of products or brands of the same or similar nature.
Marketers should understand the types of purchasing decisions that consumers make so that
they can develop effective marketing strategies for specific products. The marketing efforts
and strategies used for minor new purchases differ from those used for major new purchases.
Marketers should identify the influences that a consumer encounters when making their
purchasing decisions and develop strategies that will enable them to cater to the diverse needs
of their consumers (Prakash, 2017:69).

31
2.5 FACTORS INFLUENCING THE CONSUMER DECISION-MAKING PROCESS
Rani (2014:52) confirms that consumer decisions are influenced by numerous factors,
specifications and characteristics. Organisations and brands will be able to cater more
meritoriously to their consumers and provide them with more effective marketing campaigns,
strategies and marketing messages once they have identified the different factors influencing
their consumers’ decisions. According to Prakash (2017:65), marketers who understand the
influences affecting their consumers’ decisions will be able to tailor their marketing efforts in
order to satisfy the needs of their consumers.
According to Huang and Kieng (2011:535) and Schiffman and Kanuk (2014:37), the factors
influencing the consumer decision-making process can be psychological or external in nature.
Psychological influences include motivation, perception, learning, attitude and personality.
External influences comprise family, social class, culture and reference groups. Elaboration
on these influences will be provided below.
Figure 2-3: Factors influencing the consumer decision-making process
Source: Adapted from Schiffman and Kanuk (2014:16) and Sethna and Blythe (2016:70).

32
2.5.1 Psychological influences on consumer decision making
Psychological influences are those internal factors that determine a consumer’s preferences
and which, in turn, affect their purchasing decisions (Parkash, 2017:66). Ramya (2016:77)
states that the five most important psychological factors include motivation, perception,
learning, attitude and personality.
2.5.1.1 Motivation
Joubert (2013:66) defines motivation as a force that determines the behaviour of humans.
Stanton (cited in Ramya, 2016:77) concurs that a motive can be defined as “a drive or an urge
for which an individual seeks satisfaction”. Consumers have a motive to purchase products in
order to satisfy their unmet needs. Motivation is the driving force that encourages consumers
to purchase specific products and services in order for them to satisfy their needs and desires
(Ramya, 2016:78). According to Rani (2014:58), consumers recognise a need, which
becomes pressing to the point where it motivates them to take the necessary purchasing
actions to satisfy their needs. The buying behaviour of consumers are directly affected by the
level of motivation to satisfy their needs (Szmigin & Piacentini, 2018:271). Ramya (2016:78)
differentiates between two types of needs, namely psychological needs and biogenic needs.
Psychological needs comprise esteem, affection, prestige and learning. Biogenic needs are
needs that arise from a physiological state of tension including food, water and shelter.
In order to satisfy the various needs of consumers, appropriate goals should be set
(Joubert, 2013:67). Goals are the result of motivated consumer behaviour
(Lombard et al., 2014:183). According to Noel (2009:92), goals can be divided into generic
goals, which represent a general product or service category that will fulfil a consumers’ need,
whereas product-specific goals refer to the goals consumers set in order to acquire a specific
product or brand.
Consumers who present goal-related behaviour, and who are highly motivated to satisfy their
needs, will enter a physical state known as involvement (Noel, 2009:93). According to Babin
and Harris (2018:96), involvement is synonymous to motivation. Consumers who are more
motivated have greater involvement and personal relevance, devoting more time and attention
in finding value from a product or service. Noel (2009:93) explains that higher levels of
motivation and involvement will lead to consumers being more attentive to advertisements
pertaining to their specific needs or desires. Furthermore, he states that the way in which a
consumer perceives a product or services will increase the level of motivation and involvement
when wanting to fulfil their needs.
33
2.5.1.2 Perception
According to Babin and Harris (2018:53), perception is the interpretation and awareness
regarding reality from a consumer’s point of view. Lombard et al. (2014:160) define perception
as a process during which a consumer is first exposed to a stimulus, after which the
consumer’s attention is drawn to the stimulus, being interrupted by the consumer using a set
criteria eventually resulting in the consumer reacting to the stimulus in a particular manner.
Perception is selective, as it refers to the way in which a consumer filters stimuli (Prakash,
2017:65). Lombard et al. (2014:162) add that consumers only take notice of a trivial number
of stimuli in their environment, attending to and processing an even smaller number thereof.
Consumers tend to see, hear and notice things that are of interest to them, as these represent
what they value, who they are and their beliefs (Ramya, 2016:77). Lombard et al. (2014:163)
identify four stages of the perceptual process, which signifies the process consumers go
through when being exposed to a stimulus. Figure 2-4 presents the perceptual process:
Figure 2-4: The perceptual process
Source: Adapted from Lombard et al. (2014:163).
2.5.1.3 Learning
Learning is defined by Schiffman and Kanuk (2014:162) as a process during which consumers
continually acquire new knowledge by means of different activities and experiences.

34
Consumers use this knowledge as a source for feedback and a basis for similar behaviour in
the future. Rani (2014:59) states that the acquisition of information and experience could lead
to consumer changing and/or adapting their behaviour in accordance with what they have
learnt. Unsatisfied consumers who have a negative experience with a brand or product will
learn not to buy that specific product or service again, as it failed to satisfy their specific needs
and desires. Satisfied consumers who have a positive experience with a brand or product will
learn that their needs and desires are met by consuming the specific brand or product, and
will, therefore, most likely engage in re-purchase behaviour.
Learning may be intentional, in which case consumers will actively search for information
about a specific product or brand, or it may be incidental, in which case it was not the intention
of the consumer to acquire more information concerning a product or brand (Schiffman and
Kanuk, 2014:162). Information concerning new products and services is provided to
consumers through advertisements, allowing them to learn more about the marketers’
offerings.
Consumers develop attitudes towards products or services as they acquire more knowledge
by learning about them through means of advertisements, direct interaction with the product
and information provided by peers, family and other reference groups (Rani, 2014:59).
2.5.1.4 Attitude
Prakash (2017:66) propounds that a consumers’ attitude affects the way an individual acts or
judges objects, people and events. Marketers should, therefore, conduct attitude research, as
this will enable them to identify how consumers will react to product changes and whether they
will accept a product or not. Lombard et al. (2014:203) define attitudes as an individual’s
persistent favourable or unfavourable evaluations, emotions and action tendencies towards
some object or idea. According to Joubert (2013:81), consumer attitudes are learned and tend
to be consistent.
Consumers form attitudes towards products or services as they acquire more knowledge by
learning about them through means of advertisements, direct interaction with the product and
information provided by peers, family and others. Attitudes are moderately consistent with the
behaviour they reflect, making it a challenge to persuade consumer attitudes as they
economise on energy and thought.
According to Lombard et al. (2014:204), a consumers’ attitude comprises three components
known as affect (emotions and feelings) which refers to when consumers deal with certain

35
emotions and feelings experienced towards a product or service and is measured by the
satisfaction of a consumer. Behaviour is the second component, which includes the actions
and respect of consumers and how they engage with different products. The cognitive
component refers to the beliefs or judgements of the consumers about the apparent benefits
of the product. The authors add state that one of these three components will be the
dominating influence while consumers are developing an attitude towards a product or service.
Joubert (2013:84) explain that once a component changes, this will affect the other
components too, as the three components (affect, behaviour and cognitive) are interrelated.
2.5.1.5 Personality
Babin and Harris (2018:112) define personality as the propensities, intentions, thoughts and
behaviour exercised by individuals as they adapt to different environments. Personality, as
described by Schiffman and Kanuk (2014:100), is the internal psychological characteristics an
individual possesses that determine how they respond to their environment. Prakash
(2017:66) explains that an individual’s personality is a social identity that they create for
themselves and it represents the sum of sensory experiences that other people encounter
whilst interacting with them. Babin and Harris (2018:112) further propound that individuals
have their own unique personalities; personality traits are combined in order to form the
personality of an individual; and behaviour is influenced by relatively stable personality traits.
However, personality traits cannot predict the behaviour of individuals with precision.
According to Lantos (2011:316), a consumer’s personality is comprised of various traits, and
every individual’s traits are different. A trait refers to any distinctive, relatively permanent way
in which individuals vary from each other (Schiffman & Kanuk, 2014:105). According to
Schiffman and Kanuk (2014:105), personality is related to the consumer’s decision-making
process, as it indicates how and why consumers choose to purchase or consume a broad
category of products, rather than focusing on one brand only. Pride and Ferrell (2010:205)
add that marketers aim to design various marketing strategies and advertisements aimed at
certain personality types. Marketers should incorporate positive traits such as amiability,
individuality or competitiveness in their marketing efforts, as consumers do not react well to
advertisements they feel may have a negative impact on their moods.
2.5.2 External influences
According to Peter and Donnely, the consumer decision-making process is directly or indirectly
affected by external influences. Marketers have no control over external influences; however,
it is important for them to gain a better understanding of the effects thereof on consumers and

36
their decisions. This will assist marketers to target their selected audiences more effectively
and efficiently by devising bespoke marketing strategies (Rani, 2014:54). Rani (2014:53)
continues by stating that some of the more profound external influences on the consumer
decision-making process include family, social class, culture and reference groups.
2.5.2.1 Family
Family is defined as two or more individuals who are related to each other through blood,
matrimony or adoption, and who live together in a single housing unit (Schiffman & Kanuk,
2014:262). Szmigin and Piacentini (2018:324) define family as two adults who form a unit and
take on the responsibility of portraying certain roles. Furthermore, they explain that family can
be considered as one of the most important reference groups, as it acts as a source of
information, portray the value expressed towards preferred products and brands and acts as
a utilitarian influence that in turn shapes consumer buying behaviour.
According to Mpinganjira and Dos Santos (2013:219), one can distinguish between two types
of families, namely nuclear families and extended families. A nuclear family is comprised of a
married couple and their children. An extended family is defined as a nuclear family to which
additional relatives are added, for example, brothers, sisters, cousins, nieces, aunts, uncles
and grandparents. Extended families usually comprise at least two generations of family
members. According to Sankar (2016:104), family can be considered as the primary
mechanism by which cultural values and behaviour patterns are passed on to the following
generation.
According to Ramya (2016:78), a consumer’s buying behaviour and the decisions they make
are influenced by different members of the family. Each member of the family has different
preferences, dislikes, tastes and lifestyle, which are rooted in the family buying behaviour
(Mpinganjira, 2013:218; Ramya, 2016:79). Pride and Ferrell (2010:208) explain that family
decision-making influences what products will be consumed in order to cater to the needs of
all the family members. Hawkins and Mothersbaugh (2010:208) identify various different roles
that family members assume when making purchasing decisions:
Initiator: The member of the family who identifies the need and starts the purchasing
process.
Information gatherer: The member of the family who shows interest in the purchase and
seeks out more information regarding the purchase.

37
Influencer: The member of the family who influences the alternatives under consideration,
product criteria and the final choice.
Decision-maker: The member of the family who is responsible for making the final decision.
Purchaser: The member of the family who is responsible for the actual purchase of the
product.
User: The member of the family who consumes the purchased product.
2.5.2.2 Social class
Mpinganjira and Dos Santos (2013:162) state that social class can be described as a class
stratification system in which members of a society who share similar class values, power,
interest, behaviour and status are grouped together. Consumers are aware of their society,
social class system and their position within this class stratification system (Mpinganjira & Dos
Santos, 2013:162). Schiffman and Kanuk (2014:282) define a social class as a continuum or
a range of special positions in which each individual member within a society can be placed.
According to Ramya (2016:79), the social class to which a consumer belongs determines their
buying behaviour. Rani (2014:54) identifies three social class tiers that differ in terms of
consumer buying behaviour, namely the upper-class tier, middle-class tier and the lower-class
tier. The upper-class tier represents consumers who strive to acquire high-class, high-quality
brands and products in order to maintain their high status in society. Consumers who form
part of the middle-class tier are more careful when purchasing products, as they seek out
information about brands prior to purchasing them in order to obtain the best value for their
money. Consumers who belong to the lower-class tier purchase products on impulse without
focusing on brands, often purchasing “no-name” brands.
It is important for marketers to identify and conduct research on the different social classes as
a consumer’s buying behaviour is influenced by their social class (Ramya, 2016:79). By
studying the influence of social class on the buying behaviour of consumers, marketers will be
able to classify the value and purchasing patterns of consumers who belong to a specific social
class (Mpinganjira & Dos Santos, 2013:166). Upon identifying their targeted consumers and
the social class to which they belong, marketers can formulate effective marketing and product
strategies, brand images and product mixes that will facilitate and complement the desired
lifestyle of their targeted consumers (Lantos, 2011:215).

38
2.5.2.3 Culture
A consumer’s family and the environment in which they find themselves largely determine their
culture (Lawan & Zana, 2013:521). Culture can be defined as the set of values and beliefs
consumers within a specific social system share (Ramya, 2016:79). According to Babin and
Harris (2018:181), culture provides consumers with guidelines on how to act appropriately in
everyday situations. Thus, culture can be regarded as one of the main determinants of
consumer behaviour (Peter & Donnelly, 2011:43).
Ramya (2016:80) affirms that the consumer decision-making process is considerably
influenced by culture. Rani (2014:54) stresses the importance of marketers considering
different cultures amongst their targeted audience when devising marketing strategies, brands
and marketing campaigns, as it will influence the perceptions, behaviours and expectations of
those targeted consumers. Certain cultures experience certain actions offensive, thus
marketers should collect sufficient information about cultural factors, which are inherent to the
market, so as to provide a suitable product, advertising and marketing offerings (Ramya,
2016:81).
2.5.2.4 Reference groups
Some of the most prominent human needs include a sense of belonging; the desire to feel
important to others; and to be accepted by others in society (Lombard et al., 2014:106).
Consumers base their actions, activities, opinions and decision-making on the influence
exerted on them by other individuals, organisations or groups (Lawan & Zana, 2013:158).
According to Babin and Harris (2018:158), a reference group can be considered as a group of
individuals that a consumer admires and who have a prominent impact on their purchase
decisions.
2.6 REFERENCE GROUPS AS AN INFLUENCE ON CONSUMER BUYING
BEHAVIOUR
Szmigin and Piacentini (2018:298) state that consumption does not take place in isolation.
This is because consumer buying behaviour is affected by the people he or she knows, whom
they surround themselves with and the groups with whom they associate.
Szmigin and Piacentini (2018:298) propound that reference groups enable marketers to
understand the various patterns of consumer buying behaviour. The values and beliefs
exerted by an individual belonging to a certain reference group provide marketers with insights
on how to position their marketing activities in order to appeal to the values and beliefs of in a

39
specific target market or who form part of a particular reference group (Lombard et al.,
2014:110). According to Joubert (2013:27), the values and beliefs associated with a certain
reference group determine the behaviour of its members. Sankar (2016:102) state that the
effect of reference groups on individuals can be normative or informational in nature.
Individuals who purchase or consume certain products or services in order to comply with
someone else’s expectations are being influenced normatively, whereas the influence of
individuals who obtain information from other individuals and then base their purchasing
decisions on the information gathered is informational in nature.
Joubert (2013:27) further propounds that reference groups affect consumer behaviour through
value-expressiveness. The term value-expressiveness refers to the behaviour exerted by a
specific reference group that determine the value portrayed by its members, for example,
individuals belonging to a health-conscious reference group will only purchase organic
vegetables and fruits. Information and experience provided by a reference group influence the
buying behaviour of its members by providing information on products and services through
first-hand experiences (Lombard et al., 2014:110). An individual is more likely to consult a
member of a reference group to whom they both belong when seeking purchasing advice
(Joubert, 2013:28). Furthermore, Joubert (2013:28) explains that an individual will be more
receptive to receiving advice on his or her purchasing decision when it comes from a member
of the same reference group, as individuals perceive fellow members as more credible.
Reference groups aid marketers’ abilities to develop products, brands and effective
communication strategies for consumers by using the information and knowledge gained
when studying the particular reference group to whom the consumer belongs (Lombard et al.,
2014:106). This section focuses on the importance of reference groups and how marketers
can improve their offerings by having a more profound understanding thereof.
2.6.1 Defining reference groups
Consumer behaviour is influenced by various factors on a daily basis both consciously and/or
subconsciously (Lombard et al., 2014:206). One such factor is that of reference groups.
Reference groups infiltrate the social lives of its members, altering their perceived needs and
values of products and services, which greatly affect their buying behaviour (Babin & Harris,
2018:158-159).
Over the years, various authors articulated different definitions of the term reference groups.
Table 2-2 presents some of the more commonly used definitions of reference groups as found
in the literature.

40
Table 2-2: Towards a definition of reference groups
By taking into consideration all of the definitions of reference groups mentioned in Table 2-2,
for the purpose of this study, reference groups are defined as the individuals or groups with
whom the consumer would like to identify with, by using them as a point of comparison when
forming their beliefs, attitude and behaviours.
Reference groups may vary in size, tangibility or intangibility, and individuals may belong to
various reference groups simultaneously, but they tend to refer back to one primary reference
group in any given situation (Sankar, 2016:101). Consumers could form part of a physical
group, or of a virtual group on the Internet on social media platforms like Facebook, Instagram,
Spotify and Pinterest. These physical and interpersonal groups are commonly known as
reference groups and all have different influences, standards, beliefs and norms that they
exert on individuals belonging to them. The following section provides a brief explanation of
the different types of reference groups that have an effect on a consumer’s buying behaviour.
Author Definition
Lessig and Park (1978)
“An actual or imaginary institution, individual or group conceived of having significant relevance upon an individual’s evaluations, aspirations or behaviour.”
Schiffman and Kanuk (2004)
“A reference group is any person or group that serves as a point of comparison for an individual in forming either general or specific values, attitude or a specific guide for behaviour.”
Cant (2010) “Reference groups are one or more people that a consumer uses as a basis for comparison or point of reference in forming responses and performing behaviours.”
Joubert (2013) “People or institutions whose opinions are valued and to whom a person looks for guidance in his or her own behaviour, values and conduct, such as family, friends or celebrities.”
Lei et al. (2017) “Reference groups consist of group members, who share interests and mutual objectives, communicate with each other, share expectations and influence the behaviours, estimations and attitudes of other members and aspiring members of a group.”
Babin and Harris (2018)
“Reference groups represent an actual or imaginary institution consisting of an individual or groups, whose presumed values and perspectives exert significant relevance on the behaviour of consumers.”
Szmigin and Piacentini (2018)
“Reference groups are those groups that are used by a person as a basis for comparison and guidance when forming their beliefs, attitudes and behaviours.”

41
2.6.2 Types of reference groups
Szmigin and Piacentini (2018:298) note that the associations’ consumers make or avoid, with
various types of reference groups are fundamental to marketing. Reference groups provide
consumers with a framework for comparison and guidance when forming their respective
buying behaviours (Babin & Harris, 2018:158). A consumer’s social identity is formed based
on the type of reference group(s) to which he/she belongs (Lei et al., 2017:1915).
Peter and Donnelly (2011:45) classify reference groups into primary and secondary reference
groups. Family, close friends, peers and co-workers comprise primary reference groups.
Individuals have social ties with these referents through frequent and direct interaction (Babin
& Harris, 2018:160). Secondary reference groups consist of religious groups, professional
associations, sport stars and celebrities (Peter & Donnelly, 2011:45).
Szmigin and Piacentini (2018:298) use membership and the attractiveness of a particular
reference group to describe the different dimensions of a reference group. The attractiveness
of a reference group is determined by deciding whether a group has a positive or a negative
influence on a consumer. Membership refers to the reference groups to whom consumers
belong such as contractual or associative and disclaimant groups. Contractual or associative
groups refer to groups where there is a degree of proximity through mutual interests or family
and friendship ties. Disclaimant groups are the groups to whom a consumer belongs or used
to belong but do not wish to be associated with (Szmigin & Piacentini, 2018:299). Non-member
groups consist of aspirational and avoidance groups. According to Szmigin and Piacentini
(2018:300-301) aspirational groups are groups that a consumer admires and aspires to be
like, whereas avoidance groups are those groups that a consumer tends to avoid and
demonstrate negative feelings toward. Lombard et al. (2014:107) use basic descriptors such
as formality, importance, aspiration and affiliation to accurately describe different reference
groups. Figure 2-5 provides an illustration of the different types of reference groups, after
which each is elaborated on in the sections that follow.

42
Figure 2-5: Types of reference groups
Source: Adapted from Lombard et al. (2014:108).
2.6.2.1 Formality of the reference group
Differentiating between formal and informal reference groups determines the level of formality
thereof. Formal reference groups represent a group to which an individual becomes a member
of (Babin & Harris, 2018:160). Structure, rules and membership affiliations represent the key
concepts of a formal reference group (Lombard et al., 2014:108). According to Babin and
Harris (2018:160), members belonging to a formal reference group are expected to adhere to
set rules, values and codes of conduct. Formal reference groups comprise of people whom a
consumer works with as well as the clubs and organisations to which they belong (Lombard
et al., 2014:108). Informal reference groups, consisting of a consumer’s family, friends and
peers, have no formal values, rules and code of conduct requirements, whilst still maintaining
their own distinctive interactions. Szmigin and Piacentini (2018:303) assert that a group of
individuals who interact due to some commonality in a mutual interest or through friendship
effectively form an informal reference group.
2.6.2.2 Importance of the reference group
Lombard et al. (2014:109) explain that the buying behaviour of a consumer is influenced based
on how important the consumer perceives the reference group to be. Primary and secondary
reference groups can be distinguished in this regard. Primary reference groups are defined by

43
Babin and Harris (2018:160) as reference groups in which members frequently interact with
one another, communicating and interacting face-to-face. Joubert (2013:27) affirms that
primary reference groups comprise of a consumer’s family, neighbours, friends and
colleagues. Strong social ties are formed amongst members of a primary reference group,
making it the most influential group that have a bearing on certain behaviours with respect to
different brands, products and services (Lombard et al., 2014:109). Secondary reference
groups include religious and professional groups with whom consumers interact less
frequently. The social ties and influence of secondary reference groups concerning products
and services are valued less than those of primary reference groups (Babin & Harris,
2018:160).
2.6.2.3 Aspiration to the reference group
Aspirational reference groups are those groups to which consumers do not currently, but
would like to belong (Joubert, 2013:26). Babin and Harris (2018:160) state that consumers
aspire to belong to aspirational groups as they often appeal to the consumers’ ideal self.
Szmigin and Piacentini (2018:300) add that consumers aspire to become like someone in the
group, as this individual could represent a position, skills or lifestyle that the aspiring consumer
wishes to acquire, i.e. that of sport stars and celebrities. Consumers will emulate these
individuals by purchasing products and services that they use or promote so as to be more
like them (Szmigin & Piacentini, 2018:300).
According to Szmigin and Piacentini (2018:301), dissociative reference groups are groups to
which consumers have no desire to belong to and tend to demonstrate negative feelings
towards such groups. Consumers do not want to emulate these groups at all and thus have
no desire to behave or consume products or services that are consumed by the members in
a dissociative reference group. Babin and Harris (2018:161) state that consumers classify
dissociative reference groups as an “out-group” as a consumer does not identify with the
particular group.
2.6.2.4 Affiliation to the reference group
Lombard et al. (2014:109) propound that affiliation or membership has an effect on the buying
behaviour of consumers. Membership to a reference group suggests that an individual has
qualified to become part of that particular group. Members of certain reference groups have
certain behaviours and new members will model their behaviours based on those of the
existing members (Lombard et al., 2014:109). Non-members, according to Joubert (2013:28),

44
are consumers who do not belong to a certain group. They do not have membership to a
reference group, but yet model their behaviours based on someone belonging to the group.
Schulz (2015:213) explains that whilst consumers interact in social environments they portray
certain behaviours in order to attach themselves to specific reference groups and the members
within those groups. Consumer buying behaviour is directly affected by reference groups, as
they determine what products or brands the consumer purchases (Lei et al., 2017:1915).
Babin and Harris (2018:306) highlight the importance of marketers understanding the core
characteristics and importance of reference groups. Hoyer et al. (2018:300) state that
reference groups can be described according to the degree of contact, formality, similarity
among group members, group attractiveness, density, degree of identification and the strength
of the ties connecting members within a reference group. Figure 2-6 portrays the factors used
to describe a reference group.
Figure 2-6: Factors used to describe a reference group
Source: Adapted from Hoyer et al. (2018:300).
2.6.3 Marketing implications of reference groups
Gaining a more profound understanding of reference groups in the market, and the role they
play on affecting consumer behaviour is of great importance to marketers, as it has a direct
influence on their segmentation, targeting and positioning efforts and even on the design and

45
production of their respective products and services. The significance and implication of
reference groups and their prominent role in marketing are discussed below.
2.6.3.1 Understanding information transmission
The transmission of information within a reference group is affected by the degree of contact,
network density and tie-strength. Quick transmission of information can be accomplished
when there is constant interaction between members, who have strong social ties, who share
information about obtaining, consuming and disposing of product offerings. Marketers should
focus on identifying reference groups with strong social ties and dense networks in order to
achieve the optimal spreading of information concerning their products, brands or service
offerings.
2.6.3.2 Formal reference groups as potential targets
Hoyer et al. (2018:308) propound that formal reference groups (i.e. work colleagues, clubs
and organisations) provide marketers with clarity when deciding on their target market(s),
marketing campaigns and the products or services being provided to targeted consumers.
Marketers focus on certain aspects when providing products, brands or services with the
assurance that their marketing efforts will be successful. The characteristics exhibited by
members of a formal reference group provides marketers with greater insight required to target
a segment effectively and efficiently. Marketers could thus provide custom products and
services to the specific segment comprised of formal reference group members, and promote
these products to the group using bespoke marketing messages devised according to the
segment’s unique reference group traits.
2.6.3.3 Homophily consumers as targets
Homophily is defined by Centola (2010:905) as a situation in which people have similar
characteristics and are more likely to interact with each other than with people whose
characteristics are different from theirs. Homophily is a term not commonly used by many
authors and thus only a few reliable sources that accurately describe this term is available.
McPherson (2004:270-271) describes this concept as a case in which consumers share
similar backgrounds, experiences, social entities and friends. These consumers are more
likely to communicate amongst one another, with their viewpoints, assumptions, needs and
desires tending to be the same. Considering homophily from a marketing perspective,
marketers promote their products, brands or services and sell them to consumers based on
previous purchases from members in the same reference group. Homophily helps marketers

46
to identify common characteristics amongst a specific reference group in a segment, and thus
marketers are able to provide unique products and marketing messages that appeal to all the
members of such a reference group, due to them having a set of shared characteristics.
2.6.3.4 Targeting the reference group
Marketers make use of various networks (i.e. social media platforms) in order to increase
product or brand awareness amongst potential consumers. Hoyer et al. (2018:309) state that
social networks have a tendency to have a profound influence on members of the same
reference group. It is common for reference groups to devise their own social media webpages
and/or groups to which members of the reference groups belong, subscribe and interact on a
regular basis. By identifying reference groups, marketers would be able to identify their unique
use of social media platforms, and could thus promote their products and services on these
specific social media pages and groups, and by so doing, effectively targeting members of the
same reference group.
2.6.3.5 Understanding the strength of weak ties
Weak ties are not necessarily unworkable, as they provide a platform to spread information
across networks and connect members and/or non-members (Hoyer et al., 2018:308).
Consumers within one group may not have strong ties with another group, but are still able to
spread information across to each other, albeit not forming part of the same reference group.
For example, Hoyer et al. (2018:308) state that a reference group member may share
information that he/she has obtained about products or brands with his/her family or friends
with whom he/she shares strong ties, albeit not belonging to the same reference group.
Therefore, if a product or service is marketed to a specific reference group using customised
marketing strategies, then the members of the reference group could spread positive word-of-
mouth to non-members. Marketers should, therefore, grab every opportunity to ensure the
optimal spread of product or brand information and to gather critical information regarding
potential consumers and the reference groups to which they belong. This will ensure they
provide appropriate and bespoke product and brand offerings to fulfil the pressing needs and
desires of the consumers and members within a reference group (Schulz, 2015:213).
2.6.4 The strength of reference group influence on consumer buying behaviour
Considering the influence that reference groups exert on consumers, marketers should take
note that reference groups may influence consumers based on the product category, type of
product consumed or the preferred brand used. However, it is also possible for a reference

47
group to have no influence on the consumers whilst purchasing certain products or brands
(Sankar, 2016:127). Schulz (2015:212) explains that consumers base their purchasing and
consumption decisions on the interests, preferences and values of the certain group to ensure
it corresponds with the beliefs and values of the particular reference group. Kotler and Keller
(2009:194) note that reference groups influence the buying behaviour of individuals as they
create pressure to conform. Marketers who identify and study the different reference groups,
as well as the influence they exert on individuals will be able to provide consumers with fitting
product and service offerings (Cant, 2010:69; Lake, 2009:169).
Lombard et al. (2014:111) identify the following determinates of reference group influence:
The influence that reference groups have on consumers is the strongest when the product
or brand is noticeable to the members belonging to the groups. For example, consumers
who form part of a group supporting the Forever New brand, will be more likely to only
purchase from their store and make the clothing visible by wearing it around the other
group members.
Reference groups are more influential when consumers are considering buying a luxury
product such as designer clothing. Consumers who want to purchase non-essential
products find that the influence exerted from reference groups is considerably low.
Consumers are more likely to conform to the requirements and norms of a reference group
when they are completely devoted to the reference group and its members.
The importance of certain activities within a group, which accounts for the functioning of a
reference group, will determine the pressure experienced by a consumer in order to
conform to the norms of the group.
Marketers should identify the strength of the ties consumers form with their reference groups,
as this will provide them with the knowledge and ability to communicate their product offering
effectively to consumers in order to increase product sales.
2.7 REFERENCE GROUPS AS BASIS FOR MARKET SEGMENTATION
The primary objective of an organisation from a marketing perspective is to identify the specific
needs and desires of their consumers (Kardes et al., 2015:39). Segmentation enables
marketers to divide a large and diverse mass market into smaller segments of consumers who
have the same traits, wants, needs, characteristics and behaviours. Schiffman and Kanuk
(2014:52) state that sociological (group) variables can be used as a consumer rooted

48
segmentation base. Reference groups represent a group whose beliefs, attitudes and
behaviours align, which in turn contribute towards aligning their consumer purchasing
behaviour (Thanyamon, 2012:15). Considering the above, marketers can use reference
groups as a base for segmentation as they represent a group (segments) of consumers who
all have a need or desire to consume the same type of product or service.
2.8 CONCLUSION
This chapter emphasised the importance of consumer behaviour to marketers by providing
insight into how consumers make decisions while encountering various psychological and
external influences. The reference groups construct have also been discussed, which provides
a clear indication of the importance of identifying the reference groups that influence
Singletons, while considering the implications and strengths the offer. The chapter concludes
by stating the importance of reference groups and how they can be used as a basis for
segmentation. Chapter 3 provides a perusal of the practice of segmentation in marketing and
considers various methods of effectively segmenting a market.

49
CHAPTER 3: MARKET SEGMENTATION
3.1 INTRODUCTION
This chapter aims to provide theoretical insights into the concept of market segmentation by
providing a comprehensive discussion of market segmentation and by elaborating on the
importance and criteria used for successful market segmentation. Furthermore, the various
factors that influence market segmentation, as well as the specific bases used for segmenting
a market are discussed. The chapter continues by discussing the psychographic variable of
market segmentation, with specific reference to the use of consumer lifestyle as basis for
segmentation. The Singletons segment, a newly identified global consumer segment, is then
introduced after which the significance of the Singletons segment and its various sub-
segments are emphasised. The chapter concludes by substantiating why it is important for
marketers to conduct further research into this market segment.
3.2 MARKET SEGMENTATION
Jadczakova (2010:16) defines a market as “the aggregation of all products that appear to
satisfy the same need”. Building on this definition, Kotler and Keller (2016:28) propound that
a market represents an assortment of consumers and sellers who transact a certain product
or service. Marketers can describe consumer groups by analysing the different markets such
as product, geographic, needs, demographics and labour markets (Kotler & Keller, 2016:28).
Jadczakova (2010:16) developed a three-level market model as presented in Figure 3-1, that
consists of the relevant market, the defined market and the target market.
Figure 3-1: The three-level market model
Source: Jadczakova (2010:16).

50
Jadczakova (2010:16) states that upon reaching level three of the three-level market model,
marketers consider and implement different segmentation bases (see section 3.7) to define
the segments that form part of the identified target market.
Bug et al. (2015:9) explain that consumers are not homogenous. The diverse behaviours,
needs, preferences, dislikes, attitudes and values of consumers should be identified, after
which consumers who have similar traits should be grouped accordingly. These groups are
more commonly known as segments (Bug et al., 2015:9). According to Jadczakova (2010:6),
segmentation is the process during which consumers are divided into segments in which their
shared needs and characteristics are believed to influence their behaviour when introduced to
a particular marketing mix. Marketers consider the process of market segmentation as highly
significant when identifying their target consumers and devising their marketing mix. Table 3-
1 presents a number of definitions that have been devised for the process of market
segmentation.
Table 3-1: Towards a definition of market segmentation
By considering the key elements of the definitions presented in Table 3-1, the following
definition of market segmentation will be used in this study: Market segmentation is the
process in which marketers divide the heterogeneous market into sub-sets of consumers, who
share common needs and characteristics and who will respond in a similar way to marketing
efforts.
Author Definition
Joubert (2013:97) “Market segmentation divides the heterogeneous market into fairly homogeneous subsets of customers”.
Mpinganjira and Dos Santos (2013:275)
“Market segmentation refers to the process of dividing a market into smaller and distinct groups of customers with similar needs or other characteristics that make them respond in a similar way to marketing efforts”.
Lombard et al. (2014:54)
“Market segmentation is a process of dividing a market into sub-sets or segments of customers so that the members of each segment share characteristics and are distinct from members of other segments”.
Kardes et al. (2015:42) “The process of dividing the large and diverse mass market into subsets of consumers who share common needs, characteristics or behaviours and then targeting one or more of those segments with a marketing mix”.
Babin and Harris (2018:36)
“Market segmentation is the separation of a market into groups based on the different demand curves associated with each group".
51
Kardes et al. (2015:39) note that an organisation has the potential to effectively match their
capabilities and maximise their success and revenue by providing products and services that
are tailored for a specific target segment. Organisations are able to profit through the
implementation of effective market segmentation practices by focusing their capital, marketing
efforts and resources on suitable consumer segments, whilst avoiding unyielding competition
and consumers who do not form part of the identified target segments (Kardes et al., 2015:41).
Lombard et al. (2014:242) propound that a variety of bases can be used to segment a market,
namely usage or behavioural segmentation, demographic segmentation, geographic
segmentation, needs/benefits segmentation, market-value-based segmentation,
psychological segmentation and/or decision-makers segmentation. It is beyond the scope of
this study to discuss all the market segmentation bases, and therefore only the four widely-
used segmentation bases will be explored, namely behavioural, geographical, demographical
and psychological segmentation, the latter which is one of the core constructs of this study
(see section 3.7.4).
3.3 IMPORTANCE AND CRITERIA FOR SEGMENTING A MARKET
Bruwer et al. (2017:4) assert that market segmentation is considered to be a key aspect of the
marketing strategy of an organisation. It provides an organisation with a competitive
advantage in the marketplace, because targeting specific segments can lead to superior
financial performance (Bruwer et al., 2017:4). An organisation considers the homogenous
consumer segments when creating product offerings to specifically cater and satisfy these
consumers’ needs, desires, preferences and tastes (Bug et al., 2015:10). According to Bug et
al. (2015:10), consumers and organisations can only survive in a globalised community in
which increasing cost-effectiveness and the efficiency of providing consumers with products
that align with their unique needs and desires can be achieved by means of market
segmentation. Mpinganjira and Dos Santos (2013:276) provide a variety of reasons as to why
segmentation is crucial for the survival and success of an organisation. The importance of
market segmentation is presented in Figure 3-2 and is discussed subsequently.

52
Figure 3-2: The importance of market segmentation
Source: Mpinganjira and Dos Santos (2013:276).
3.3.1 Selection of a target market
Market segmentation enables organisations to identify and understand the different traits and
behaviours of consumers within a specific market segment. Gaining a more profound
understanding of the differences and similarities within each group will aid the organisation to
decide which market segments would be most profitable to target – considering the
organisation’s product and/or service offering – and also allows the organisation to determine
which market segments should be avoided (Mpinganjira & Dos Santos, 2013:276).
Jadczakova (2010:24) states that the marketing strategy that an organisation wishes to pursue
will determine the type and number of market segments to be selected. Furthermore,
Jadczakova (2010:24) explains that organisations may choose to target multiple segments
simultaneously, each with its unique marketing strategy, to serve the consumers in that
specific segment most effectively and efficiently. Organisations that target multiple market
segments must devise tailored marketing mix strategies for each market segment selected,
and in so doing, improve their market performance and limit the waste of resources
(Jadczakova, 2010:24).

53
3.3.2 Designing appropriate marketing mix strategies
Mpinganjira and Dos Santos (2013:276) explain that once consumers are grouped into
segments according to their similarities, suitable and alluring marketing mixes can be created
that satisfy the needs and desires of the targeted consumers. According to Jadczakova
(2010:24), various marketing mix components should be considered by marketers, after which
the optimal combination should be selected and reflected in the marketing mix strategy in
order to maximise the profitability of each identified market segment. Table 3-2 presents the
various marketing mix components that should be taken into account when devising each
segment’s marketing mix strategy.
Table 3-2: Marketing mix components
Source: Adapted from Jadczakova (2010:24).
By considering the array of various marketing mix components listed in Table 3-2, marketers
will be able to devise a marketing mix strategy that can satisfy the specific needs and desires
of consumers in each identified market segment that will ultimately lead to repeat purchases
(Mpinganjira & Dos Santos, 2013:276).
3.3.3 Differentiation
Kardes et al. (2015:42) note that organisations tend to cater for larger consumer segments,
and as such, larger markets experience a stronger competitive edge and thus require
Product Place
New product development
Product/service quality, features and use
Product lines, packaging and branding
Installations, instructions, warranty
Channel decision
Shelf policy
Inventory policy
Transportation
Promotion Price
Advertising
Sales promotion
Publicity
Brand names
Package design
Point of purchase, salespeople
Media selection:
What media?
Reach, frequency and cost
Price levels:
Penetration pricing
Skim pricing
Price changes:
Size
Timing
Duration
What products?
Against which competitors?

54
improved differentiation of their brands, products, services and marketing strategies. The
Business Dictionary (2018) defines differentiation as “the result of efforts to make a product or
brand stand out as a provider of unique value to customers in comparison with its competitors.”
According to Mpinganjira and Dos Santos (2013:276), in the present increasingly competitive
global community, it is important for an organisation to differentiate its product offerings from
those of its competitors. Market segmentation provides organisations with the opportunity to
offer their consumers' more attractive and unique marketing mixes by making informed
choices as to which specific segments to target.
3.3.4 Identification of opportunities and threats in a market
Mpinganjira and Dos Santos (2013:276) propound that whilst implementing the market
segmentation process, organisations analyse the wants and needs of consumers, which
simultaneously enables organisations to identify untapped gaps in the market. Organisations
can thus use the opportunity to develop new product offerings that will meet the wants and
needs of consumers. Similarly, threats presented in the market can also be identified.
3.3.5 Effective allocation of resources
The market segmentation process helps organisations to identify market segments with
optimal profit potential (Mpinganjira & Dos Santos, 2013:276). The more attractive a segment
is perceived to be, the more likely an organisation is to target that segment and focus all their
efforts and available resources on providing products or services that will satisfy the needs
and desires of consumers in those segments most effectively. The allocation of available
resources to prosperous market segments will enable marketers to utilise them meritoriously.
3.4 CHARACTERISTICS OF PROSPEROUS MARKET SEGMENTS
Considering the importance of market segmentation, marketers should strive to implement the
market segmentation process successfully (Schiffman & Kanuk, 2014:51). According to
Jadczakova (2010:16) as well as Schiffman and Kanuk (2014:51), marketers can provide
targeted consumers with an appropriate marketing mix by ensuring that the selected market
segment is identifiable, sustainable, stable, actionable, accessible and responsive. The
characteristics of an ideal market segment in presented in figure 3-3 and discussed
subsequently.

55
Figure 3-3: Characteristics of an ideal market segment
Source: Adapted from Jadczakova (2010:16) and Schiffman and Kanuk (2014:51).
Identifiable: Marketers should ensure that their selected market segments are easily
identifiable by grouping consumers with similar characteristics, needs and wants together.
Jadczakova (2010:16) states that grouping consumers of a segment will be easier if they
can be recognised without difficulty. According to Schiffman and Kanuk (2014:51), some
characteristics and variables used to define a segment can be identified easily, whilst
others may be more challenging to recognise.
Sustainable: Schiffman and Kanuk (2014:51) propound that a segment may be
established, but may not be sufficiently large to be deemed profitable. A segment should
comprise a substantial number of consumers in order for marketers to be able to estimate
the size, buying propensity and spending power of the selected consumers. In addition,
the segment size should be large enough for the organisation to earn sufficient profits from
serving the segment.
Stable: Jadczakova (2010:16) states that marketers prefer to target consumer segments
that are relatively stable over time and present the most potential for growth. The stability
of a market segment refers to the preferences of the consumers within a segment that
remain the same for a considerable period of time before changing. Schiffman and Kanuk
THE IDEAL MARKET
SEGMENT
Identifiable
Sustainable
Stable
Actionable
Accessible
Responsive

56
(2014:51) note that marketers should avoid unpredictable and fickle segments that
suggest minimal growth opportunities.
Actionable: In order to present the consumer segment with a distinctive marketing mix
strategy effectively, marketers should be able to communicate easily and effectively with
the consumer segment with a view to ensure that the strategy is heard and understood
without having to face communication barriers (Jadczakova, 2010:16).
Accessible: Schiffman and Kanuk (2014:51) explain that in order for marketers to reach a
consumer segment in an economical manner, it should be accessible and easy to reach.
Various forms of media such as magazines, journals, the Internet and cellular phone
advertisements can be incorporated and used to communicate with a particular consumer
segment (Jadczakova, 2010:16). Schiffman and Kanuk (2014:52) add that the use of
various forms of media allows marketers to customise their promotional messages and
product and/or service offering to the preferences of the targeted market segment.
Responsive: Jadczakova (2010:16) explains that the promotional messages and product
and/or service offering presented to consumers by the marketing mix should be devised
in such a way that the targeted consumer segment directly responds to it. The marketing
mix elements should, therefore, be congruent with the specific characteristics, needs and
wants of the consumers in the identified market segment.
Marketers should, therefore, ensure that their identified market segments adhere to the
proposed criteria listed above so that they select and target segments that will be most
prosperous and to which the proposed marketing mix will fit appropriately. A consumer
segment that conforms to the proposed criteria will be deemed as a successful segment to
target (Joubert, 2013:100). Marketers should also consider the fact that not all market
segmentation strategies will be successful, and should thus bear in mind the different factors
that could influence the market segmentation process (Kardes et al., 2015:44).
3.5 MARKET SEGMENTATION STRATEGIES
According to Kardes et al. (2015:44), there are four different market segmentation strategies
that an organisation can implement. Figure 3-4 illustrates and elaborates on the various
market segmentation strategies that an organisation could implement.

57
Figure 3-4: Market segmentation strategies
Source: Adapted from Kardes et al. (2015:42).
3.5.1 Undifferentiated mass market segmentation:
This type of market segmentation strategy entails that an organisation devises a single
marketing mix strategy to serve all the consumers within a given market segment. No
customisation of products, services or promotional branding occurs (Kardes et al., 2015:42).
3.5.2 Differentiated segmentation:
Kardes et al. (2015:43) assert that this type of market segmentation strategy entails that an
organisation targets several segments and devises a customised marketing mix strategy that
appeals to the needs, wants and characteristics of each market segment.
Differentiated segmentation
Concentrated niche
segmentation
Micro marketing or mass
customisation segmentation
Undifferentiated mass marketing segmentation

58
3.5.3 Concentrated niche segmentation:
This type of market segmentation strategy constitutes a unique segment of consumers who
wants to acquire specific products or services within a small, specialised market (The
Economic Times, 2018). Kardes et al. (2015:43) consider this to be a special type of
differentiated segmentation strategy. Here, marketers aim to obtain and serve a large section
of consumers belonging to a small niche market.
3.5.4 Micromarketing or mass customisation segmentation:
This type of segmentation strategy entails the implementation of marketing mix strategies by
organisations on a one-to-one basis with their consumers. Mass customisation represents a
specialised form of micromarketing, where consumers from large segments or mass markets
can customise the products or services offered by the organisation (Kardes et al., 2015:43).
3.6 FACTORS INFLUENCING THE MARKET SEGMENTATION PROCESS
Kardes et al. (2015:42) state that market segmentation is synonymous with a multi-product
strategy where products are developed for specific sub-segments identified within a larger
market segment. According to Kardes et al. (2015:42), various factors influence the market
segmentation process, including market aggregation, consumer preference heterogeneity,
majority fallacy, sales-cost trade-off and cannibalisation. These factors are discussed in
greater detail below.
3.6.1 Market aggregation
The Dictionary of Marketing (2018) defines market aggregation as a form of undifferentiated
marketing where marketers implement a one-size-fits-all approach. All consumers are served
in the same manner, without taking their differences into account. Market aggregation and
market segmentation can be considered as complete opposites.
3.6.2 Consumer preference heterogeneity
Szmigin and Piacentini (2018:324) explain that consumer preference refers to the brands,
products or services that a consumer prefers and chooses to consume. Consumers have
varying preferences. Kardes et al. (2015:44) affirm that the importance and implementation of
the market segmentation process will increase as consumer preference heterogeneity
increases. Organisations will then focus on the larger, more profitable consumer segments

59
that have a more prominent preference heterogeneity of a specific product or service, whilst
neglecting the smaller, less typical segments.
3.6.3 Majority fallacy
Marketers tend to cater to larger market segments, as they believe that it will be more
profitable. Kardes et al. (2015:44) refer to this as the “majority fallacy”, explaining that although
larger market segments may include more potential consumers, smaller market segments
could be more profitable. A larger market segment typically experiences more intense
competition. Smaller market segments have less competition, and therefore could lead to
increased profitability and sales (Kardes et al., 2015:44).
3.6.4 Sales-cost trade-off
Kardes et al. (2015:44) are of the opinion that an increase in sales is directly related to the
ability of organisations to align their product offerings with the specific preferences of
consumers within their identified market segments.
3.6.5 Cannibalisation
Cannibalisation occurs when an organisation has too many product offerings that are too
similar to each other. The similarities of the products result in them competing against each
other and not with other organisations’ products in the market (Kardes et al., 2015:44).
Cannibalisation is the outcome of over-segmentation, according to Walters et al. (2018:21).
Over-segmenting a segment will result in having a segment that is too small to be considered
as a separate segment.
By gaining a holistic understanding of the various factors that influence the market
segmentation process, marketers can decide on and select a suitable market segmentation
base.
3.7 BASES FOR MARKET SEGMENTATION
Jeong (2018:2) asserts that market segmentation represents a process whereby marketers
extract homogenous markets that have parallel characteristics and develop tailored products
and services that appeal to the chosen market. Segmentation considers the different traits and
characteristics of the consumer and not those of the product or service that is provided. By
knowing and understanding the characteristics of a consumer, marketers can select a
segmentation base for implementation that is most congruent with consumers’ needs, wants

60
and characteristics (Lombard et al., 2014:242). Jadczakova (2010:16) defines a segmentation
base as “a set of variables or characteristics used to assign potential customers to
homogenous groups”. Schiffman and Kanuk (2014:52) propound that a form of hybrid
segmentation can be implemented when segmenting a market. Hybrid segmentation refers to
the use of two or more segmentation bases simultaneously. Jeong (2018:2) states that the
bases most often used for segmenting a market include, inter alia, demographic,
behaviouristic, geographic and psychographic segmentation bases. Figure 3-5 outlines the
segmentation bases and the specific variables associated with each base.
Figure 3-5: Bases for market segmentation
Source: Adapted from Armstrong and Kotler (2011:204); Joubert (2013:100) and Schiffman and Kanuk (2014:52).

61
Asiedu (2016:3) asserts that segmentation bases can further be classified into observable
bases and unobservable bases, where observable bases refer to those bases that marketers
are able to measure directly and unobservable bases to those bases where the results are
inferred. Asiedu (2016:3) and Jadczakova (2010:16) divide the different segmentation bases
into general bases and product-specific bases. General bases are those bases that are
autonomous of products, services or circumstances, whereas product-specific bases relate to
the consumer and the product, service or circumstance (Jandczakova, 2010:16). Figure 3-6
portrays the observable and unobservable variables of segmentation bases.
Figure 3-6: Observable and unobservable variables of segmentation bases
Source: Adapted from Asiedu (2016:3).
The following section provides a brief description of the more popular segmentation bases
used in both academia and practice today, and those that are specifically relevant to this study.
3.7.1 Demographic segmentation
Asiedu (2016:3), Nasiopoulos (2015:2) and Schiffman and Kanuk (2014:53) all support the
notion that demographics is the main, most dominant and most common form of market
segmentation. Nasiopoulos (2015:2) states that it is the foremost used approach as it is easy
to comprehend the scales of measurement used in demographic segmentation and the
collection and interpretation of demographic information is an uncomplicated process. Asiedu
(2016:3) supports this notion by adding that it is easy for marketers to conjunct other variables
with those of the demographic base. According to Schiffman and Kanuk (2014:53), marketers
tend to favour the use of demographics as a base when segmenting a market, because it:

62
Represents the easiest and most logical manner in which marketers should classify
consumers, and they are measured more precisely as compared to other segmentation
bases.
It enables marketers to locate and reach specific segments in a cost-effective manner.
It helps marketers to identify opportunities in the market by indicating changes in
consumers’ age, income, distribution and population of numerous regions.
It identifies variables such as attitudes, consumer behaviour and media exposure patterns
that directly relate to the demographics of a consumer segment.
Madeira et al. (2015:5) propound that the variables most commonly used for demographic
segmentation are age, gender, income, education and occupation, and life stages.
3.7.1.1 Age
According to Schiffman and Kanuk (2014:53), marketers should consider the age of
consumers when segmenting a market because the needs, wants and product preferences of
consumers vary according to their age categories. Cleveland et al. (2011:248) concur that the
buying behaviour of consumers in the younger age groups are ever-changing with the constant
evolvement of technology, making them more willing to try new products. Consumers in the
older age groups have more time and money to spend on physical, luxury and leisure activities
(Barry, 2009:316). Schiffman and Kanuk (2014:53) illustrate the influence of age on consumer
buying behaviour by comparing the buying behaviours of students to those of adults. Students
perceive certain products or services to be more expensive and luxurious, whereas adults
perceive the same products as reasonably priced. Therefore, age is an important demographic
element to consider when segmenting a market.
3.7.1.2 Gender
According to Lombard et al. (2014:245), to segment, a market according to gender requires
marketers to distinguish between male and female consumers. Gender is a factual
segmentation variable considered to be the demographic variable most used by marketers to
segment a household market (Lombard et al., 2014:245; Schiffman & Kanuk, 2014:53).
Schiffman and Kanuk (2014:53) assert that gender roles have changed slightly over the past
few years as men are increasingly purchasing more grooming products whilst women are
buying household tools. Although some roles have changed slightly with regard to gender-
specific buying behaviour, Lombard et al. (2014:245) note that marketing products such as

63
clothing, hair-care products, toiletries and cosmetics are is different for male and female
market segments.
3.7.1.3 Income, education and occupation
Lombard et al. (2014:245) and Schiffman and Kanuk (2014:54) propound that using income
as a variable to distinguish between different consumer segments is of great importance as it
has a significant effect on the products and services that consumers choose to purchase and
consume. An increase in a consumer’s income will increase their purchasing power, and as
such their expenditure on various product categories (Schiffman & Kanuk, 2014:53).
According to Palmer (2009:195), the income of consumers can be measured using the
following approaches: (1) total income before taxation, which represents the gross income of
a consumer; (2) disposable income, which represents the income available to consumers after
taxation; and (3) discretionary income, which is the disposable income of consumers less the
expenditure on the necessities of life (i.e. mortgage payments). According to Cleveland et al.
(2011:240), marketers strive to target consumers with higher income due to their larger
purchasing power. However, marketers should consider that not all consumers feel
comfortable sharing information concerning their income, which presents a limitation when
using income as a segmentation variable (Palmer, 2009:195).
Well-educated individuals tend to form new perspectives and norms rather than following local
behavioural norms (Cleveland et al., 2011:248). Higher education provides an individual with
skills and reasoning abilities not possessed by everyone else. Having various skills, ways of
reasoning and their own perspectives and norms, the needs and preferences of consumers
with higher education levels differ from consumers with lower levels of education (Schiffman
& Kanuk, 2014:54). According to Cleveland et al. (2011:248), marketers who want to segment
a market using the education variable must consider the perceptions of consumers and their
levels of education, and adjust their marketing strategies accordingly.
Sathish and Rajamohan (2012:152) concur that the occupation of consumers determine the
lifestyle they lead, the social circles in which they move, their behaviour as well as the products
or services that they prefer to consume. Considering the occupation variable to segment a
market adds significantly towards understanding a typical description of the consumer and
demographic aspects. Wei (2015:266) considers the following categories of occupation:
workers, professionals, government employees, service workers, joint-venture employees,
teachers, researchers, self-employed, unemployed and students. Marketers can consider
these categories when developing marketing strategies based on occupation. Ray and
Choudhury (2015:8) propose that occupation is a prominent factor determining the purchase

64
decisions of a consumer. The “bandwagon effect” is used to describe the above statement by
asserting that the colleagues of consumers influence them to make certain purchase decisions
(Wei, 2015:266).
Income, education and occupation correlate with each other as consumers with higher levels
of education qualify for higher-level jobs, and they earn noticeably more compared to
consumers who have had little education and work in the lower-level jobs (Schiffman & Kanuk,
2014:54). Income, education and occupation are also variables that relate closely to the
various life stages through which consumers proceed.
3.7.1.4 Life stages
The life stages of a consumer (i.e. bachelorhood, honeymooners, parenthood, post-
parenthood and dissolution) can be used by marketers as a demographic variable to segment
a market (Lombard et al., 2014:245). Schiffman and Kanuk (2014:54) assert that consumers
have different requirements during each stage of the lifecycle. For example, young singles are
looking for furniture to fill their apartments, whilst new parents are searching for housing that
is child-friendly. Marketers can identify the specific life stages and select a segment to serve
which they feel will be most profitable based on a specific stage of the consumer lifecycle
(Schiffman & Kanuk, 2014:54).
Marketers can use the various demographic variables to describe who the consumers are that
are purchasing specific products and services effectively (Solomon, 2011:263). Combining
these demographic segmentation variables with one or more of the other segmentation bases
will allow marketers to understand the needs, wants and buying behaviour of their consumers
better, and will ensure that they deliver appropriate products and services to their targeted
segments (Joubert, 2013:105).
3.7.2 Behaviouristic segmentation
Another method used by marketers to segment a consumer market effectively is to apply
consumer behaviour as a basis for segmentation. Based on the knowledge, responses, usage
and attitudes that a consumer has towards a product, marketers can divide consumers into
segments using behaviouristic elements (Kotler & Keller, 2016:207). Nasiopoulos (2015:4)
propound that segmenting consumers based on their buying behaviour will allow marketers to
categorise consumers into segments according to the purchase occasion; the benefits sought;
user status; loyalty status; buyer readiness stage; and attitude towards the product. These
behaviouristic variables are briefly discussed below.

65
3.7.2.1 Purchase occasion
The purchase occasion refers to how many times consumers purchase a product or service
(Nasiopoulos, 2015:4). According to Joubert (2013:107), marketers distinguish between
regular occasion users and special occasion users, where regular occasion users are those
consumers who purchase products and services on a consistent basis, and special occasion
users are those consumers who purchase products and services on special occasions only,
such as graduations, engagements, birthdays and weddings.
3.7.2.2 Benefits sought
Consumers seek different benefits from products and services (Lombard et al., 2014:243).
Some consumers, for instance, seek the benefits of a car to get them from point A to point B,
whereas other consumers seek the benefit of a car as a status symbol or perhaps for the
benefit of speed (Joubert, 2013:107). Marketers can satisfy the needs of consumers in a
specific segment successfully if they take note of the particular benefits sought and offer
products or services that are most likely to provide for these (Joubert, 2013:107).
3.7.2.3 User status
Consumers can be segmented based in terms of how often they purchase and use products
(Nasiopoulos, 2015:3). Keegan and Green (2011:247) assert that consumers can be
segmented into groups consisting of heavy users, medium users, potential users, ex-users
and non-users. Heavy users refer to those consumers who purchase many of an
organisation’s products, representing the bulk of sales revenue (Joubert, 2013:107). Medium
users refer to those consumers that purchase and use an organisation’s products less
frequently than the heavy users, yet more often as compared to light users. Marketers are
more likely to focus on heavy users, as they are the consumers from whom they generate the
most profit (Lombard et al., 2014:243). Joubert (2013:107) proposes that marketers should
focus their efforts on potential users as well, as these may represent the growth of the
organisation and its products moving forward.
3.7.2.4 Loyalty status
Bothma (2013:35) states that consumers can be segmented into four categories based on
their loyalty towards a product, service or organisation. These categories are: (1) Hard-core
loyalists, referring to those consumers who insist on using the same products, services or
brands every time; (2) Soft-core loyalists, referring to consumers who are willing to choose
from a limited set of products and brands; (3) Shifting loyalists, referring to consumers who

66
shift their loyalty from one product, brand or organisation to another; and (4) Switchers,
referring to consumers who show no loyalty towards any product, brand or organisation
whatsoever.
3.7.2.5 Buyer readiness stage
Consumers can be segmented by determining whether they are unaware, aware, informed,
interested, desirous or intending to purchase an organisation’s product, service or brand
(Nasiopoulos, 2015:4). Marketers can design and incorporate various strategies to specifically
fit the consumers’ readiness stage – whether it is to inform, persuade or sell the products or
services of the organisation. Doing so will increase the sales and profits of the organisation
(Joubert, 2013:106).
3.7.2.6 Attitude towards the product
Joubert (2013:107) is of the opinion that organisations can increase the effectiveness of their
marketing efforts when their targeted consumers are segmented based on their attitudes
displayed towards the product. Marketers can avoid allocating resources towards marketing
efforts targeted at consumers who are negative or hostile towards the product or brand, thus
focusing all their resources and efforts on consumers who are enthusiastic and positive
towards the product or brand offering (Joubert, 2013:107).
Armstrong and Kotler (2011:207) state that understanding the behaviour of various consumers
will help marketers to position their product offerings in accordance with their targeted
consumers’ requests, requirements, behaviour and attitudes – making the behaviouristic
segmentation base more effective than those of demographics.
3.7.3 Geographic segmentation
By using a geographic basis of segmentation, marketers divide a market according to the
cities, town, regions and countries in which their consumers reside. A market segment can
then be divided even further by grouping consumers into various geographical units based on
climate, area, size of the city and population density (Lombard et al., 2014:249; Nasiopoulos,
2015:3). Schiffman and Kanuk (2014:54) propound that the geographical location in which a
consumer resides influences their buying behaviour. For example, the climate of an area
determines the type of clothes, food and beverages consumers purchase. Consumers residing
in rural areas have different wants, needs and buying behaviours compared to those who live
in urban and suburban areas (Joubert, 2013:101). Lombard et al. (2014:249) note that
marketers can localise their advertising and marketing efforts by basing them on a specific

67
area. Then, marketers can position their marketing mix, plan their marketing strategy, as well
as their distribution function accordingly.
3.7.4 Psychographic segmentation
Psychographic segmentation considers the psychological factors that affect a consumer’s
behaviour when purchasing products or services (Nasiopoulos, 2015:3). Lantos (2011:37)
notes that the thoughts of consumers, their beliefs, and the way in which they choose to live
and spend their money can be used to determine their behaviour, and as such, to segment
them into groups of consumers with the same or similar psychographic traits. Baharun et al.
(2011:5041) state that the use of psychographic segmentation provides organisations with a
competitive advantage as it identifies the interests of consumers, the activities in which they
participate as well as their opinions on various subject matters. When segmenting a consumer
market based on psychographic traits, marketers consider the social class, personality and
lifestyle of a consumer (Lombard et al., 2014:246).
3.7.4.1 Social class
Social class is defined by Mpinganjira and Dos Santos (2013:162) as a class stratification
system in which members of a society who share similar class values, power, interests,
behaviour and status are grouped together. To determine the social class of a consumer,
Nasiopoulos (2015:3) propound that marketers should identify and understand their
background, income, spending patterns and purchase frequency, as these determine
purchasing power. Furthermore, Nasiopoulos (2015:3) argues that consumers will keep
purchasing certain products or services to remain in the social class to which they belong.
There are various social class tiers to which consumers can belong, namely the upper-class
tier; the lower-uppers; the upper-middles; the middle-class tier; the working class; the upper-
lowers; and the lower-class tier (Armstrong & Kotler, 2011:204; Rani, 2014:54). Consumers
belonging to the same class tier are more likely to have the same needs, desires and buying
behaviours (Schiffman & Kanuk, 2014:55).
3.7.4.2 Personality
Schiffman and Kanuk (2014:105) define personality as the distinctive and permanent way in
which individuals differ from each other. Babin and Harris (2018:112) further describe
personality as internal psychological characteristics such as propensities, intentions, thoughts
and behaviours that a consumer has and that determine their buying behaviour in various
situations.

68
Consumers have unique personalities and will thus react differently to marketing efforts,
products and services (Kotler & Keller, 2016:197). According to Nasiopoulos (2015:3), the
social class tier to which a consumer belongs and the type of lifestyle they lead have a bearing
on their personalities. Nasiopoulos (2015:3) explains that consumers who lead a luxurious
lifestyle have a higher disposable income and will have a more luxuriant personality.
Consumers who live off necessities and who can be classified in the lower-class tier will tend
to have a down-to-earth, basic personality.
Pride and Ferrell (2010:205) assert that once marketers have identified a dominating
personality type within a segment, it is important for them to provide a marketing mix and
advertising campaigns that are congruent with the personalities of consumers within that
specific segment, as this will influence the consumer decision-making process and ultimately
increase sales figures.
3.7.4.3 Lifestyle
Lifestyle can be considered as the most popular psychographic variable used by marketers to
segment a market (Nasiopoulos, 2015:4). Lombard et al. (2014:247) affirm that a consumer’s
lifestyle can be defined by studying their activities, interests and opinions (AIO). According to
Marketers should thus develop marketing mixes and strategies according to the AIO’s of
consumers that will, in turn, provide them with the products or services to achieve their desired
lifestyle. Lifestyle is one of the core concepts of this study and is therefore discussed in the
section that follows.
3.8 CONSUMER LIFESTYLE
The lifestyle of a consumer is considered to be of great importance in the modern marketing
era because as it has a profound effect on the consumer’s decision-making process and
determines their buying behaviour (Husnain & Akhtar, 2015:30). A large number of consumer
research companies, marketing firms and academic institutions study lifestyle variables as
these provide valuable information regarding consumers (Babin & Harris, 2018:123; Bruwer &
Li, 2017:1557). Narang (2010:537) agrees that the study of consumer lifestyle helps marketers
to devise effective marketing and communication strategies. According to Sathish and
Rajamohan (2012:154), different aspects of consumer behaviour such as products and
services consumed; activities, interests and opinions; personality traits and self-concept; value
systems; and attitudes towards various product classes are used to create psychographic
profiles of consumers within a specific segment. Figure 3-7 presents a graphical illustration of
how the study of consumer lifestyle helps marketers to devise effective marketing strategies.

69
Figure 3-7: Understanding the influence of consumer lifestyle on marketing
efforts
Source: Adapted from Sathish and Rajamohan (2012:154).
3.8.1 Towards a definition of lifestyle
Babin and Harris (2018:123) note that consumers use the term lifestyle to describe their
everyday life, whether they live healthy, unhealthy, dangerous, alternative or adventurous
lifestyles. Hoyer et al. (2018:391) affirm that marketers can determine the lifestyles of
consumers by identifying what they choose to do in their spare time. Lifestyle can be used to
reflect on consumers’ various modes of living and provide insight into the patterns of
consumption associated with them (Vaidya, 2015:33). Bruwer and Li (2017:1557) assert that
the use of lifestyle variables to identify and comprehend consumers has become the principle
of psychographic segmentation, with marketers and academia realising its significance in the
field of marketing. Table 3-3 offers a range of definitions that have been formulated by authors
over the years in order to describe the psychographic dimension of lifestyle.

70
Table 3-3: Towards a definition of lifestyle
By considering the key elements in the definitions provided in Table 3-3, for the purpose of
this study, lifestyle is defined as manifestations or actual patterns exerted by consumers,
focusing on the activities, interests and opinions they choose to spend their time and money
on.
Husnain and Akhtar (2015:25) assert that lifestyle is valuable because it provides marketers
with the ability to predict the wants and needs of consumers within a specific segment.
Products can be considered to be the building blocks of lifestyle, as certain products may
represent a particular lifestyle of a set of consumers whilst other consumers may use products
that are more unique or exclusive. According to Armstrong and Kotler (2011:175), lifestyle
allows marketers to develop a consumer profile based on how a consumer interacts with the
world. Baharun et al. (2011:5041) propound that segmenting a market using lifestyle variables
measures consumer activities based on what their interests are and the level of importance
attached to their surroundings; how they spend their time and money; basic demographic
characteristics; and how they view themselves and the world around them.
Babin and Harris (2018:123) reiterate that marketers can devise effective and efficient
marketing strategies by studying the lifestyles of consumers within a specific segment as this
relates directly to their product purchase and consumption behaviours. Babin and Harris
(2018:124) advise that marketers should focus on devising marketing strategies that appeal
Author Definition
Narang (2010:539) “Lifestyle refers to an individual’s activities, interests and opinions and the way they spend their time and money.”
Solomon (2011:54)
“Lifestyle is a pattern of consumption that reflects a consumer’s choice of how they live and how they spend their time and money.”
Sathish and Rajamohan (2012:152)
“Lifestyle refers to a distinctive mode of behaviour centred around activities, interests, opinions, attitudes and demographic characteristics, distinguishing one segment of a population from another.”
Bug et al. (2015:13) “Lifestyle focuses on what people like to do, what their areas of interests are and what opinion they hold on various matters.”
Ratanasawadwat and Jiamthapthansin (2017:972)
“Lifestyle provides marketers with a deeper understanding of their consumers’ buying behaviour, by looking at the way people live their daily lives and how they spend their time and money.”
Babin and Harris (2018:122)
“Lifestyle represents distinctive modes of living, including how people spend their time and money.”
Hoyer et al. (2018:391) “Lifestyle refers to manifestations or actual patterns of consumers, which are represented by a consumer’s activities, interests and opinions.”

71
to the lifestyle of their targeted consumers rather than implementing marketing efforts that are
solely based on the definite product itself.
3.8.2 Characteristics of lifestyle
Sathish and Rajamohan (2012:153) highlight the following characteristics of lifestyle:
Lifestyle implies a central life interest: Religion, family, friends, work, leisure, politics and
hobbies represent a few of the central life interests of consumers, and determine how they
interact with the environment around them.
Lifestyle suffuses various aspects of life: The behaviour of a consumer can be considered
to be relatively consistent, due to the nature of his or her lifestyle. Marketers can predict
the behaviour of consumers in different stages of their lives by observing how they conduct
themselves in specific situations.
Lifestyle varies according to sociologically relevant variables: Variations in the lifestyle of
consumers are rapidly changing due to the rate of social change within society. These
variations are represented by the change in consumer age, sex, ethnicity, social class and
religion. The lifestyles of consumers all over the world have changed over the past few
decades; for example, as women have been promoted to higher positions within the
working class and the number of double-income families have increased considerably.
Lifestyle is a group occurrence: The relationships of, and the reference groups to whom a
consumer belongs influence his/her lifestyle.
By understanding and analysing the characteristics of lifestyle from a marketing perspective,
marketers can gain a more profound understanding of their consumers and will thus be more
focused when positioning and marketing their products and services (Sathish & Rajamohan,
2012:154). Sathish and Rajamohan (2012:154) add that various reference groups and
individuals influence a consumer’s lifestyle, and therefore marketers have identified various
emerging consumer lifestyle groups. These emerging lifestyle groups are discussed
subsequently.
3.8.3 Emerging lifestyle groups
Baharun et al. (2011:5041) suggest that there are various lifestyle groups to which consumers
belong and that the behaviour demonstrated by consumers in the various groups are not
necessarily similar. Hur et al. (2010:269) concur that consumers in different lifestyle groups

72
have diverse interests, preferences and requirements. Identifying and understanding what a
specific lifestyle group needs, wants and prefers to enable marketers to devise marketing
strategies and product offerings that will appeal to those consumers’ specific requirements
(Sathish & Rajamohan, 2012:163). Lantos (2011:347) differentiates between the following
lifestyle groups:
Alpha women: This lifestyle group comprises women who strive to “have it all”; who do not
believe in the old “stay-at-home-mom” or “women do not work” traditions. They work hard
and are career-orientated whilst still maintaining a healthy balance between work and
family relations.
Metro-men: This lifestyle group comprises men in their twenties who have a keen sense
of fashion, who are in touch with their feminine side, and who take the time to groom
themselves. They tend to have the style and taste of those associated with gay men, but
are heterosexual.
Scuppies: This lifestyle group comprises consumers who are environmentally and health
conscious. They strive to live a “clean” life by purchasing products from organisations with
a green footprint and consume organic products.
Ubersexuals: This lifestyle group comprises male consumers who embrace masculinity.
They enjoy the finer things in life and consider themselves to be gentlemen. They
acknowledge that they have a feminine side, but do not fear, nor flaunt it.
Retrosexuals: These male consumers deny their feminine side and would rather be
perceived as being a “macho-man” – participating in traditional male behaviour, and tend
not to concern themselves with grooming rituals.
Marketers who segment a market based on consumer lifestyle can divide consumers into
different groups based on the lifestyle they lead and the buying behaviour they display. By
conducting research on the lifestyle of consumers within a targeted segment, marketers can,
therefore, devise customised marketing and promotional messages in order to ensure that
they inform consumers of their product and/or service offerings effectively and efficiently
(Baharun et al., 2011:5042).
There are various methods available to marketers to conduct consumer lifestyle research
studies. The AIO-approach is the most used approach and entails analysing the activities,
interests and opinions of consumers (Hur et al., 2010:296). For the purpose of this study, the

73
AIO-approach will be used to determine the lifestyle and the influence thereof on the buying
behaviour of Singletons in South Africa.
3.8.4 The AIO-approach
Lifestyle represents a psychographic approach where marketers focus on identifying trends
and factors that have an influence on a consumer’s life, work and leisure (Anantachart,
2013:86; Bug et al., 2015:16). The AIO-approach used to analyse consumer lifestyle was first
introduced in the 1970s by Wells and Tigert, and has since been used by various well-known
researchers such as Plummer (1974), Bowls (1988), Swingyard and Smith (2003), Bergman
et al. (2005), Kumar and Sarkar (2008) and Hur et al. (2010). These studies explored the
segmentation of markets based on lifestyle variables, making effective use of the AIO-
approach to analysing consumer lifestyle.
The AIO-approach is a measurement instrument that is used to measure the activities,
interests and opinions of consumers (Suresh et al., 2011:22). This approach entails providing
consumers with a battery of three hundred statements that focus on their activities, interests
and opinions, usually in a survey format in which they indicate on a 10-point Likert-scale
whether they agree or disagree with the provided statements (Narang, 2010:538). According
to Sathish and Rajamohan (2012:155), analysing the activities referred to in the AIO-approach
provide a clear indication of how consumers spend their money and include activities such as
work, hobbies, vacations, social events and entertainment. Anantachart (2013:86) propose
that analysing the interests referred to in the AIO-approach indicates a consumer’s preference
in terms of family life, career, community, recreation, food and home. The opinions analysed
by using the AIO-approach highlight how consumers feel about various matters and include
items such as themselves, social issues, economics, products and business (Bug et al.,
2015:18). Table 3-4 provides a list of some of the various lifestyle dimensions used in an AIO
analysis.

74
Table 3-4: Lifestyle dimensions
Source: Adapted from Bug et al. (2015:17) and Solomon (2011:264).
For the purpose of this study, the following lifestyle dimensions will be analysed by using the
AIO approach:
Fashion consciousness:
Consumers who consider themselves to be fashion-conscious perceive themselves as having
style, being inventive and finding pleasure in seeking out new things that are not associated
with the norm (Zhou et al., 2010:47).
Cost consciousness:
According to Zhou et al. (2010:46), consumers who are cost-conscious are more hesitant
about the price they have to pay for a product or a service than they are concerned about its
perceived value.
Health orientation:
Hong (2009:3) states that health-orientated consumers consider themselves as being
sensitive to health hazards, and as such, they tend to avoid health issues by engaging in
frequent exercise, managing stress levels to the best of their abilities and take great care in
what they eat. Health conscious consumers have various nutritional and health needs that
result in them seeking out organic, natural and unmodified products to maintain their healthy
lifestyles (Bemporad & Baranowksi, 2011:83).
Activities Interests Opinions Demographics
Work Family Themselves Dwelling
Hobbies Homemaking Social issues Education
Social events Career Politics Income
Vacation Community Business Occupation
Entertainment Recreation Economics Family size
Club-membership Fashion Education Dwelling
Community Health Products Geography
Shopping Media Future City size
Sports Achievements Culture Stage in life-cycle

75
Recreation:
According to Hall (2017:5), recreation can be considered as a period of time, a specific activity
or state of mind that an individual engages in, in order to meet a personal requirement or
desire primarily for his or her own satisfaction. Hurd and Anderson (2017:17) propound that
recreation is the period an individual enters after heavy work in order to regain energy and to
rest. Recreational activities can take place outside, such as exercising or exploring mountains,
deserts, forests, the ocean and wildlife. Reading, meditation, photography, painting, dancing,
singing and yoga are other forms of recreation.
E-shopping:
Jusoh and Ling (2012:223) define e-shopping as a process during which consumers embrace
the viable alternative of electronic commerce and purchase products from the comfort of their
own homes on the Internet by visiting online stores and completing the transaction online.
Considering the rapid rise in consumers choosing to shop online, marketers can make an
effort to invest more of their resources in online retail formats in order to increase their sales
and profits (Ha & Stoel, 2010:568).
Career orientation:
The Business Dictionary (2018) defines career orientation as “the pattern of job-related
preferences that remain fairly stable over a person’s work life.” By analysing consumers’
career orientation, marketers can deduce the extent to which consumers invest in their
careers, how hard they work, and how important they consider their careers to be.
The lifestyle dimensions discussed above will be analysed by using the AIO-approach in order
to compile an accurate profile of the lifestyle and its influence on the behaviour of Singletons
(see section 3.8) in South Africa. Schariff et al. (2014:11) propound that the AIO statements
enable marketers to distinguish between two polar approaches, which are: (1) the situation-
specific approach, where marketers aim to determine whether a specific product offering will
be accepted or rejected based on the lifestyle of the consumer; and (2) the general approach
which is concerned with obtaining a more profound understanding of the lifestyle and buying
behaviours of consumers. The viability of a specific product is not applicable to this approach
(He et al., 2010:617). For the purpose of this study, the AIO statements will be general in
nature, as the primary objective is to determine the lifestyle of consumers within a specific
segment. Implementing a general approach to analysing the AIO statements enable marketers
to gain a more holistic understanding of the lifestyle and behaviour of consumers within the

76
segment under study and this will help to create consumer profiles that are in accordance with
their lifestyles (Schariff et al., 2014:12).
Solomon (2011:264) asserts that besides creating consumer lifestyle profiles and determining
the influence that lifestyle has on consumer behaviour, the information obtained by conducting
lifestyle studies can be used in the following ways:
Create a new view of the market: Marketers may have developed and based their
marketing strategies on the lifestyle of the consumers within the target market. Their views
of this consumer market can change as they realise that the consumers do not match their
assumptions.
Defining a target market: The information provided by conducting a lifestyle study can be
used to surpass simple product consumption or demographic clarifications.
Better communication of product attributes: Marketers can incorporate the information
obtained from lifestyle studies to devise advertising campaigns that will communicate the
product’s attributes to the consumers in the target market in such a way that it appeals to
their specific lifestyles.
Positioning of the product: Marketers can use consumer lifestyle information as a guideline
when positioning their products in order to appeal to the specific requirements of the
consumers in the target market.
Development of a product strategy: Marketers can identify new product opportunities,
marketing strategies and promotions based on their understanding of how a product forms
part of the consumer’s specific lifestyle.
Schariff (2014:13) adds that lifestyle studies can also be used to provide a better
understanding of consumer behaviour; introduce new and innovative products; minimise risk
for a new product or business ventures; and to improve an organisation’s overall marketing
strategy.
One of the consumer segments in South Africa that has not as yet been researched sufficiently
with regards to their lifestyle and the influence of reference groups (see Chapter 2) on their
behaviour is the Singletons segment. By conducting a lifestyle analysis, consumer profiles can
be developed for the Singletons segment in South Africa. Moreover, by using the information
obtained from the lifestyle study, marketers can deduce how lifestyle, and specifically those
lifestyle dimensions analysed within this study, have an impact on the behaviour and decision-

77
making process of consumers within the Singletons segment. By obtaining this information,
marketers will gain a more profound understanding of the consumers within the South African
Singleton segment, and can, therefore, serve this segment more effectively and efficiently by
devising marketing strategies that are congruent with their specific lifestyle and needs.
3.9 SINGLETONS
This section concerns the Singletons segment in South Africa. A discussion on the segment
will commence by firstly emphasising the significance of the Singletons segment to marketers
by formulating an appropriate description of the Singleton consumer. Upon defining what it
entails to be qualified as a Singleton, the various sub-segments are discussed, followed by
the consumption orientations of Singletons. This section introduces the Singletons segment
and provides the knowledge that marketers need in order to target this growing consumer
segment in South Africa effectively.
3.9.1 The significance of the Singleton segment
Bouhlel (2011:22) states that the concept of being “single” has been a topic of great interest
for research fields like social psychology, sociology and marketing on a global scale (Quintos,
2019). One is no longer the loneliest number as single consumers currently represent the
largest, rapidly growing and untapped consumer segment globally (Mascolo, 2017). The
Euromonitor International research group states that by the year 2030, the single household
is predicted to increase by 15.7%, resulting in 331-million single households globally (Jacobs,
2013). Figure 3-8 presents the growth projections of global households based on the family
type from 2016 to 2030.
Figure 3-8: Global Households by family type: 2016-2030
Source: Euromonitor International (2015).
0 5 10 15 20 25 30 35
Couple with children
Single-parent family
Couple without children
Single person
GLOBAL HOUSEHOLDS BY FAMILY TYPE: 2016-2030
% growth

78
The information provided in Figure 3-8 indicates that the single person household is projected
to show the greatest growth over the next few years. Bouhlel (2011:24) and Jacobs (2013)
explain that this growth phenomenon is driven by factors such as the desire for individual
accomplishment, mass urbanisation, longevity, increase in the divorce rate and increased
female employment. According to Wortzel (2014:324) the “single” stage of the traditional family
lifecycle is changing from searching for a mate and marriage preparations to one where
singles would rather focus on personal growth and enriching their personal experiences. In
terms of their individual goals and aspirations, Flynn (2017 asserts that most of the Singletons
would like to improve and maintain their physical health and wellbeing. A great majority would
like to be financially independent, and thus tend to focus on their wealth-building activities.
Only some of the Singletons aspire to get married, with an even smaller number wanting to
have children. These statistics are presented in Figure 3-9.
Figure 3-9: The goals and aspirations of Singletons
Source: Adapted from Flynn (2017).
In order to gain a better understanding of the Singletons segment, it is firstly necessary to
identify and define the various appellations used for the term Singletons.
56%
46%
26%
14%
Improve my physical health Be financially independent
Get married Have children

79
3.9.2 Towards a definition of Singletons
In order to construct a more precise definition of the term Singletons, various synonyms of the
terms used in literature have been identified. A preliminary review of the literature on
Singletons has indicated that various appellations are used interchangeably with the term
Singleton. Table 3-5 presents the appellations that have been identified by authors in the field
as well as their accompanying definitions.
Table 3-5: Appellations of the term Singleton as used in the literature
Given the identified synonyms of Singleton listed in Table 3-5, Table 3-6 provides a list of
definitions that can be identified in the literature to denote these appellations respectively.
Table 3-6: Towards a definition of Singleton
Author Appellation / Synonym
Bouhlel et al. (2011:22); Euromonitor (2017); Macmillan Dictionary (2018)
Singles
Bouhlel et al. (2011:22) Solos
Macmillan Dictionary (2018) Bachelor
Euromonitor (2017) Single-person Households
Author Definition
Singles
Bouhlel et al. (2011:22) “A person who has never been married”.
Solos
Stern et al. (1987) quoted by Bouhlel et al. (2011:23)
“Those consumers who choose to live alone and follow a specific lifestyle; who seek pleasure, have sufficient time on their hands and who have above average buying power”.
Musset (2003) quoted by Bouhlel et al. (2011:23)
“Consumers who are solitary with constraint and who spend less due to economic reasons”.
Bachelor
Schlacter et al. (1979:39-40) “A young, single person who lives in an apartment or small house”.
Cambridge Dictionary (2018) “A man who is not married”.
Singleton
Oxford Dictionary (2018) “A person who is not married or in a long-term relationship”.
Macmillan Dictionary (2018) “A person who is not married or is not in a romantic relationship”.

80
By considering the above definitions, the term Singleton is defined as follows for the purpose
of this study:
A person who is not married or in a long-term relationship and who lives alone and follows a
specific lifestyle.
Bouhlel et al. (2011:23) propose that Singletons can be divided into two main categories,
namely those consumers who have voluntarily decided to live alone – and thereby fully
embracing their Singleton lifestyle; and those consumers who live alone due to bereavement
or divorce. Those consumers who have decided to live alone have more time and money to
spend on activities and products to fulfil their needs and wants. They live a specific lifestyle as
they take advantage of their freedom in the absence of personal engagements (Sweeny,
2015). Those consumers who form part of the second category of Singletons, those who are
solitary with constraint due to bereavement or divorce, do not always have the financial
capacity of the first group, and they tend to spend less due to economic reasons (Bouhlel et
al., 2011:23).
Mascolo (2017) propounds that marketers cannot create valuable product or service offerings
without knowing and understanding the consumers to whom they are catering. Singletons
have unique wants and needs. Segmenting the Singletons segment by analysing their lifestyle
dimensions will enable marketers to satisfy their needs appropriately.
The following section provides a brief description of the sub-segments of Singletons that have
been identified to date by authors in the field.
3.9.3 Sub-segments of Singletons
Jacobs (2013) states that it is a dangerous notion for marketers to define Singletons as a
homogenous group. In reality, Singletons have different lifestyle profiles, income levels,
interests and preferences (Cardona, 2013). Schultz (2010) propounds that the Singletons
segment is an emerging and expanding segment that will enjoy rapid growth compared to any
other household segment globally by the year 2030. According to Euromonitor International
(2017) and Thompson (2013), Singletons can be divided into various sub-segments, each
demonstrating different behaviours. These sub-segments are depicted in Figure 3-10 and are
described subsequently.

81
Figure 3-10: The identified sub-segments of Singletons
Source: Euromonitor International (2017) and Thompson (2013).
3.9.3.1 Suddenly Singletons
The Suddenly Singletons sub-segment represents Singletons who are in their early 40s and
who are well-paid executives. They are career-orientated and are often employed in IT,
pharmaceuticals, finance and publishing, to name a few. These Singletons are regular users
of the Internet and use it to stay abreast of news headlines and networking.
3.9.3.2 Solus Singletons
The Solus Singletons sub-segment mainly comprises the elderly. They have downsized to
modern small flats and receive the majority of their income from their private pensions. They
can further be categorised as frequent shoppers who regularly visit their nearest supermarket
to purchase groceries.

82
3.9.3.3 Struggling Singletons
The Struggling Singletons sub-segment comprises the least affluent of the Singletons market
segment. They are aged between 18 and 25 years, unskilled, and have no tertiary education.
These Singletons have a 60% likelihood of being unemployed.
3.9.3.4 Starting out Singletons
The younger Singletons between the ages of 26 and 30 comprise the Starting Out Singletons
sub-segment. They have skills and tend to have well-paid jobs in advertising, telecoms, media,
IT and pharmaceuticals. These Singletons have the financial capability to rent or buy a small
house or an apartment.
3.9.3.5 Freemales
The Freemales sub-segment of Singletons consists of independent women who are between
the ages of 23 and 44 and who are career-driven and confident. These women have been
dubbed “freemales” as they embrace single life. Freemales tend to be complacent about their
finances and would much rather shop for new shoes than save money for the future. Statistics
provided by Euromonitor International (2008) show that 25% of Freemales own at least 30
pairs of shoes.
3.9.3.6 Male Singletons
The Male Singletons sub-segment comprises successful and intelligent men. These
Singletons opt to remain single, not because they fear commitment or marriage, but usually
because of an unsuccessful marriage. These Singletons found contentment in living a single
life by focusing on their careers, spending time with friends and following their ambitions.
3.9.3.7 Regretful loners
There was a brief moment when Singletons were out and proud, embracing the single life.
However, that time has ended. Male Singletons aged between 25 and 44 have been dubbed
“Regretful Loners”. This sub-segment has been named as such due to the belief that these
Singletons are living lonely, miserable and unfulfilled lives (Euromonitor International, 2008).
The Singletons sub-segments were segmented by means of demographic segmentation by
considering variables such as gender, age, income and education (Parumasur & Lombard,
2013:244). Schultz (2010) emphasises the importance of demographics when segmenting

83
Singletons into sub-segments as the consumption orientation between male and female
Singletons differ significantly.
3.9.4 Consumption orientation of Singletons
According to Schultz (2010), the consumption orientation of Singletons differs considerably
from those of married consumers. It is, therefore, necessary for marketers to gain a better
understanding of the buying behaviour of Singletons in order to improve the effectiveness of
marketing to this segment of consumers. Singletons tend to spend more money and time on
leisure activities such as vacation trips, dining out, cinema and outings. Singletons consume
products, brands and services that they feel will valorise their image. The product categories
they deem most important include beauty, fashion and hygiene (Bouhlel et al., 2011:23;
Schultz, 2010). Singletons embrace their single lifestyles by consuming products and services
that they find most appealing and that they feel will complement their single way of life. To
gain a better understanding of the consumption orientation of Singletons, it is important for
marketers to consider the following aspects: (1) variety-seeking propensity; (2) risk aversion;
(3) brand consciousness; (4) price consciousness; (5) impulsivity; and (6) convenience
seeking. These factors are presented in figure 3-11 and discussed subsequently.
Figure 3-11: Factors to consider when studying consumption orientation of
consumers
Source: Adapted from Bouhlel et al. 2011:23 and Schultz, 2010.

84
3.9.4.1 Variety-seeking propensity
Variety-seeking propensity can be defined as “the tendency of a consumer to purchase an
item that is different from their last purchase” (Binge et al., 2009:104). Kim et al. (2018:101)
state that consumers are sometimes likely to choose the lesser known items, as these provide
some variety. Bouhlel et al. (2011:23) assert that Singletons seek out variety more than the
married consumer segment. Singletons live a busy lifestyle, form part of various reference
groups and are more willing to try new products and services. Since they belong to various
reference groups, these Singletons show a willingness to try and experience new things. This
is evidence that they do have a high level of variety-seeking propensity and are able to alter
their buying behaviour more easily than married consumers.
3.9.4.2 Risk aversion
According to Chiu et al. (2014:94), perceived risk is a multidimensional construct, mainly
consisting of financial loss, product performance, privacy and product delivery. Furthermore,
Chiu et al. (2014:94) define perceived risk as the consequences of buying certain products or
services faced by the consumer that cannot be anticipated with certitude and can prove to be
unpleasant. Singletons are characterised as being free from family life constraints and
commitment responsibilities (Schultz, 2010), providing them with independence and low-risk
aversion (Bouhlel, 2011:23). Singletons have also gained a reputation for splurging, as they
are not restricted with their spending and tend to be financially well off. Bouhlel (2011:23)
propounds that Singletons are less risk averse that married consumers.
3.9.4.3 Brand consciousness
Brand conscious consumers tend to purchase products or services that well-known, more
expensive brands (Ismail, 2017:131). According to Phau and Teah (2009:59) consumers
purchase certain products or service brands in order to express their personal characteristics
and to use the brands as symbols of status and prestige. Singletons consider brands a sign
of social affiliation and a representation of the certain lifestyle they wish to portray to the world
(Bouhlel et al., 2012:24). Thus, Bouhlel et al. (2011:24) conclude that Singletons are more
brand conscious than married consumers.
3.9.4.4 Price consciousness
Price consciousness reflects a consumers’ preference for inexpensive products and services.
These consumers want to pay the lowest price for all products and services and do not
85
consider the quality or brand of the product to be of great importance (Bindroo et al.,
2016:118). According to Bouhlel et al., (2011:24) and Schultz (2010), Singletons are not
considered to be price conscious. They have financial freedom and spend more time and
money on themselves. Their buying power is considerably higher than those of married
consumers and they do not shop for special or search for promotions (Bouhlel et al., 2011:24).
3.9.4.5 Impulsivity
Zhang et al. (2015:1282) consider impulsivity as a psychological feature exemplifying the
impulse buying tendency of consumers. Bouhlel (2011:24) defines impulsive purchases as
purchases that are made by an individual who accedes to a sudden and intense desire to
purchase a product or service for which they have not planned. Singletons are considered
impulsive buyers, as they have more spending power and the willingness to try new, unfamiliar
things. They are motivated by instantaneous gratifications (Phau & Teah, 2009:64).
3.9.4.6 Convenience seeking
Convenience seeking can be defined as the degree to which consumers look for savings in
both time and money (Hou & Elliot, 2016:127). Consumers want the purchasing process to be
simple, understandable, without constraints and no unpardonable restrictions (Bindroo et al.,
2016:118.) Singletons are perceived as being convenience seeking, as they want a shopping
experience to be fast and convenient. Considering that Singletons are willing to try new things,
they will utilise e-shopping as it is a faster, more convenient method of acquiring the products
they need (Bouhlel, 2011:24).
Marketers who realise the importance of the above-mentioned variables and who incorporate
these variables in their marketing strategies would be able to provide accurate products and
services to the Singletons segment. However, in some markets, like the South African market,
organisations and academia alike have yet to define the Singletons market more appropriately,
and are thus likely not serving this segment optimally.
3.9.5 Singletons in the South African market
At the time of this study, very little or no research has been conducted on the Singletons
market segment in South Africa. This is despite the fact that the Singletons segment has been
receiving increased attention from organisations and marketers internationally due to their
high spending power and growth in segment size. Due to the lack of conclusive research
conducted on the Singletons in South Africa, this study aims to contribute to the literature on
the Singletons segment, and to provide a more comprehensive definition of the segment by

86
means of describing their specific lifestyle preferences and the effect that reference groups
have on their buying behaviour. This would, in turn, aid marketers to target the Singletons
segment more effectively and efficiently by devising marketing strategies aimed at their
specific preferences.
3.10 CONCLUSION
This chapter emphasised the importance of market segmentation by discussing the various
segmentation bases that marketers can choose to use. This study focusses on using lifestyle
as a basis to effectively segment the Singleton consumer market. The Singleton segment is
introduced and more insight into the growing consumer segment has been provided by
distinguishing between the various sub-segments of Singletons and their consumption
orientation. Chapter 4 will elaborate on the research methodology implemented in this study,
in order to fill the identified gap within the marketing literature

87
CHAPTER 4: RESEARCH METHODOLOGY
4.1 INTRODUCTION.
This chapter focuses on the research methodology implemented to address the research
problem of this study. The various stages of the marketing research process serve as the
structuring principle of this chapter. Identifying the research problem along with the various
objectives is the first step in the process. The second step is to determine the research design
to use - here causal, exploratory and descriptive research designs are discussed. Designing
the data collection method is the third step, where secondary and primary data sources are
perused. The fourth step in the marketing research process elaborates on designing the
sample and data collection method. Step five entails analysing and interpreting the data, with
the research report being step six of the process. The chapter concludes by providing an
explanation of the forms of data analysis used in the study.
4.2 THE MARKETING RESEARCH PROCESS
In order for marketers to make effective decisions concerning their brand, products or services,
marketing research should be conducted by studying opportunities and specific problems
through market surveys or product-preference tests (Kotler & Keller, 2016:60). According to
Kardes et al. (2015:18), market research that is conducted effectively will improve the
organisation’s profits, reduce uncertainty among marketers and provide them with consumer
insights. Marketing research is a systematic process that plans, collects, analyses and
interprets data, which is used to define marketing problems and opportunities (AMA, 2018;
Kardes et al., 2015:15; Kotler & Keller, 2016:61; McDaniel & Gates, 2010:7).
Kotler and Keller (2016:62) assert that marketers who adopt a good marketing research
process make the most effective and efficient use of the practices and resources available.
The marketing research process has six consecutive steps that are portrayed in Figure 4-1.
As noted, the marketing research process serves as the chapter outline and acts as a roadmap
to structure this chapter.

88
Figure 4-1: The marketing research process
Source: Adapted from Babin and Zikmund (2016:62); Bradley (2013:36) and Iacobucci and Churchill (2015:37).
4.2.1 Step 1: Identify the research problem and objectives
Schiffman and Kanuk (2014:24) propound that the first step of the marketing research process,
which entails the identification of research problem and the defining of the research objectives,
can be considered the most difficult step. Kotler and Keller (2016:62) add that when defining
the research problem, marketing managers should avoid making it too broad or too narrow.
This step also comprises the formulation of specific research objectives that are based on the
research problem and that can be used as a guide as to what information should be collected
in order to solve the research problem (Babin & Zikmund, 2016:62; Iacobucci & Churchill,
2010:29). The research problem for this study was presented and demarcated in section 1.4
and the objectives of this study emanate from this.
4.2.1.1 Primary objective
The primary objective of this study is to determine the effect of reference groups and lifestyle
on the buying behaviour of Singletons.
4.2.1.2 Secondary objectives
The following secondary objectives have been formulated in order to achieve the primary
objective of this study:

89
1. To provide an overview of the research literature related to the main constructs of this
study, namely consumer behaviour, reference groups, market segmentation and lifestyle
segmentation.
2. To develop a demographic profile of consumers who form part of the Singletons market
segment and who participated in this study.
3. To determine the extent to which reference groups have an effect on the buying behaviour
of Singletons.
4. To determine the lifestyle of Singletons in terms of fashion consciousness.
5. To determine the lifestyle of Singletons in terms of cost consciousness.
6. To determine the lifestyle of Singletons in terms of health orientation.
7. To determine the lifestyle of Singletons in terms of recreation.
8. To determine the lifestyle of Singletons in terms of E-shopping.
9. To determine the lifestyle of Singletons in terms of career orientation.
10. To determine the underlying relationships between the various lifestyle dimensions of
Singletons.
11. To determine the underlying relationships between the level of reference group effect and
the lifestyle dimensions of Singletons.
12. To determine the difference in perceptions of reference group effect and the lifestyle
dimensions of Singletons with regards to their demographic differences.
4.2.2 Step 2: Determine the research design
Determining the research design for the study is the second step in the marketing research
process. Sontakki (2009:65) defines the research design as a framework that the researcher
uses to ensure that that the right data is collected and that it is analysed correctly. The
research design provides the researcher with specific methods and procedures to allocate
resources in order to obtain the information needed to answer the research question.
According to Kotler and Keller (2016:63), the market researcher has to consider the sources
of data, the research approaches, the research instrument, sampling plan and the available
methods of contact to develop the research design effectively. A research design requires

90
detailing all the necessities for the study, which help the market researcher to conduct a
successful study (Burns & Bush, 2014:98). Clow and James (2014:27) classify the various
research design frameworks into three basic categories: causal, exploratory and descriptive.
4.2.2.1 Causal research
Rahman (2017:17) asserts that a causal research design is suitable for understanding a
phenomenon in the attempt to explain the cause and effect relationship between the
dependent and independent variables. McDaniel and Gates (2010:77) concur that a causal
research design is implemented in order to determine the impact of specific changes on
existing norms, assumptions and different processes. Causal research aims to clarify the
relationship patterns between the variables by focusing, analysing and interpreting a specific
situation or problem (Dawar, 2016:135). Therefore, the causality can be determined by
considering the variable that is assumed to have a bearing on another variable and in order to
measure the changes on the other variable.
Causal research, therefore, involves conducting experiments in order to determine whether a
variable has an effect on another variable (Iacobucci & Churchill, 2015:51). According to
Sontakki (2009:72), an experiment refers to a research process where the independent
variable is manipulated in order to determine the effect on the dependent variable.
Furthermore, Sontakki (2009:73) notes that there are three basic components involved when
conducting an experiment, namely the variable being manipulated (independent variable); the
actual alteration (treatment); and the dependent variable (the actual variables chosen to
measure the subject response). When conducting causal research, laboratory experiments or
field experiments can be selected (Wiid & Diggines, 2009:56). Laboratory experiments occur
in an artificial setting in which the variables can be controlled or manipulated and where the
subjects are aware of their participation in the experiment (Sontakki, 2009:74). Field
experiments are conducted in the real world, where the natural setting serves as the base of
the field experiment and the subjects are unaware of their participation. When conducting field
experiments, the variables cannot be controlled (Wiid & Diggines, 2009:56). Feinberg et al.
(2013:108) note that causal research may be difficult to conduct as it is expensive, time-
consuming and fairly complex to implement.
4.2.2.2 Exploratory research
Exploratory research is research conducted in order to investigate a problem or situation (Mooi
et al., 2018:14). Kardes et al. (2015:22) suggest that exploratory research is a broad research
design that is implemented in order to generate ideas or help formulate problems to be used

91
for further research. According to Iacobucci and Churchill (2015:59), exploratory research
enables a researcher to understand a research problem when there is little information
available on the identified problem area.
When conducting exploratory research, the researcher can gain a clear understanding of the
problem, as well as obtain guidance, ideas and insights on how to conduct future research
that can eventually lead to the provision of a definite solution to the problem (Kardes et al.,
2015:22). Sontakki (2009:68) considers exploratory research essential for the researcher to
properly define the problem at hand. According to Sontakki (2009:68) exploratory research
can be pinpointed and used to:
Formulate a problem for more precise investigation
Establish priorities for further research
Gather information about the practical problems for conducting research on particular
academic statements.
Improve the researcher’s familiarity with the research problem
Clarify the research concepts.
Exploratory research is flexible and various methods can be used to gather information about
a problem or a situation. Literature searches consider both secondary and primary data
sources to provide information on the problem. Primary data collection methods of an
exploratory research approach include focus groups, in-depth interviews, projective
techniques, observational studies and ethnographies (Mooi et al., 2018:15).
4.2.2.3 Descriptive research
Descriptive research is conducted in order to describe certain phenomena, characteristics,
behaviours, functions or to formulate predictions about trends or variables. Descriptive
research also helps to describe market segments, consumers, competitors and performance
measurement accurately (Kardes et al., 2015:25; Mooi et al., 2018:17). Conducting descriptive
research provides answers to the who, what, when, where and why of the research as well as
determining the frequency when something occurs or how variables vary from each other
(Brown & Suter, 2014:34; Feinberg et al., 2013:57). According to Mooi et al. (2018:17),
descriptive research can focus on one or more variables simultaneously.

92
Sontakki (2009:70) notes that the data obtained by means of descriptive research can be used
as a basis for making marketing decisions. According to Sontakki (2009:70), a descriptive
research design can be used to:
Describe characteristics of certain groups by gathering demographic information such as
consumer’s age, gender, income, education level and marital status
Estimate the proportion of consumers in a specific population who behave in a certain
manner;
Make specific predictions
Determine whether certain variables are associated with one another.
Mooi et al. (2018:13) are of the opinion that the various research designs (causal, exploratory
and descriptive) are interrelated. Figure 4-2 presents a funnel which is used as a metaphor to
explain the relationship between the marketing research problem and the various research
designs.
Figure 4-2: The relationship between a marketing research problem and research
design
Source: Adapted from Mooi et al. (2018:13).
Furthermore, Mooi et al. (2018:14) identify the various uses of the research designs.
Researchers should understand and consider the various uses and methods of each research
design in order to be able to select and apply an appropriate research design to the marketing

93
research problem. Table 4-2 compares the three research designs in terms of use and
methods.
Table 4-1: Uses and methods of the research designs
Source: Adapted from Brown and Suter (2014:29) and Mooi et al. (2018:14).
In this study, a review of the literature provided evidence that minimal knowledge of the
Singletons consumer segment and their buying behaviour exists, and in effect formed the
basis from which the research problem was formulated (see section 1.4). The research
problem accentuates that little or no research is available on the Singletons segment in South
Africa. This study adopted a descriptive research design to obtain adequate information
pertaining to the research problem in order to describe the Singletons segment, draw
conclusions and make specific predictions. Following a descriptive research design allows the
researcher to:
Provide a description of the research literature related to the main constructs of this study,
namely consumer behaviour, reference groups, market segmentation and lifestyle
segmentation.
Describe the demographic profile of consumers who form part of the Singletons market
segment and who participated in this study.
Describe the extent to which reference groups have an effect on the buying behaviour of
Singletons.
Describe the lifestyle of Singletons in terms of fashion consciousness, cost consciousness,
health orientation, recreation, E-shopping and career orientation.
Exploratory research Descriptive research Causal research
Uses Understand structure
Formulate problem precisely
Generate hypotheses
Develop measurement scales
Describe consumers and competitors
Understand market size
Segment markets
Measure performance
Uncover causality
Understand the performance effects of marketing mix elements.
Methods Literature search
Case analyses
Focus groups
In-depth interviews
Literature search
Panels
Observations
Surveys
Laboratory experiments
Field experiments

94
Describe the underlying relationships between the various lifestyle dimensions of
Singletons.
Describe the underlying relationships between the level of reference group effect and the
lifestyle dimensions of Singletons.
Describe the different perceptions of reference group influence and the lifestyle
dimensions of Singletons with regards to their demographic differences.
Considering the purpose of the study, a descriptive research design was used in order to draw
conclusions and to describe a situation.
4.2.3 Step 3: Design the data collection method
The third step in the marketing research design process is to design a data collection method
based on the research problem and objectives defined in step 1 and the research design
selected in step 2. Bradley (2013:139) defines data collection as an assortment of facts
obtained to be used by a researcher as a basis for analysis, reasoning or discussion. Mooi et
al. (2018:28) describe data as the heart of marketing research. Kotler and Keller (2016:63)
warn that data collection can be quite expensive and error-prone, and therefore great care
should be taken when designing and implementing the data collection method. Kardes et al.
(2015:30) and Kotler and Keller (2016:63) distinguish between two types of data that can be
collected, namely secondary data and primary data. These are discussed subsequently.
4.2.3.1 Secondary data sources
Secondary data is described by Kotler and Keller (2016:63) as data that was previously
collected for another purpose by individuals or organisations. Secondary data is readily
available to researchers in various forms (Sontakki, 2009:138). According to Brown et al.
(2018:60), the information provided by secondary data sources have been collected and
considered prior to and based on a preceding research problem and not on the problem at
hand. Various types of secondary data sources, whether they are internal or external
secondary data sources, are available to researchers. The various sources of secondary data
are presented in Figure 4-3.

95
Figure 4-3: Different types of secondary data sources
Source: Adapted from Iacabucci and Churchill (2015:143) and Kardes et al. (2015:30).
4.2.3.2 Primary data sources
Primary data, also referred to as “new-to-the-world” data, is the data that is specifically
gathered to address a specific research problem under consideration (Brown et al., 2018:60;
Kotler & Keller, 2016:63). Kardes et al. (2015:30) propound that lifestyle information, attitudes,
preferences, motivations, behaviours and demographics are the type of information that can
be gathered using the primary data collection method. Primary data can be collected by means
of qualitative and quantitative research.
Qualitative research allows the researcher to gain more background information on the
research problem, without using numbers as a form of measurement (Zikmund et al.,
2017:63). According to Wiid and Diggines (2009:89), observations, words, pictures, audio and
stories are some of the forms in which qualitative research can be conducted. Qualitative
research adopts an interpretive approach to data that allows the researcher to obtain an idea
of a persons’ perspective and how they experience various situations (Harreveld et al.,
2016:18). Zikmund et al. (2017:63) assert that compared to quantitative research, qualitative
research is less structured and mostly makes use of open-ended formats, thus enabling the
research participants to answer questions at length.

96
Quantitative research is considered to be a form of conclusive research presented in values,
where data is collected by means of a structured questionnaire with predetermined response
options (Burns & Bush, 2017:143). Quantitative data allows for a larger sample to be
considered when collecting data (Feinberg et al. 2013:219). Mooi et al. (2018:32) argue that
quantitative data is based on qualitative judgements. Elsbach and Kramer (2016:43) support
this notion by affirming that the hypotheses formulated using qualitative research is tested
whilst conducting quantitative research. Table 4-3 provides a comparison of the differences
between qualitative and quantitative research.
Table 4-2: Comparing qualitative and quantitative research
Sources: Adapted from McDaniel and Gates (2010:92); Shiu et al. (2009:171) and Zikmund et al. (2017:66).
Malhotra and Dash (2016:175) suggest that qualitative and quantitative research each have
various data collection techniques. Figure 4-4 illustrates the qualitative and quantitative
research techniques that can be implemented to collect primary data.
Research aspect Quantitative research Qualitative research
Common purpose Test hypotheses or specific research questions
Discover new ideas, thoughts and feelings used in exploratory research with general research objectives
Type of research design Descriptive or causal design Exploratory design
Approach Measure and test Observe and interpretive
Type of questions Limited probing, structured response categories
Probing, unstructured, free form
Research independence Results are subjective, the researcher is intimately involved
Results are objective, a researcher is an uninvolved observer
Sample size Large sample with a good representation of the population
Small samples
Type of analysis Statistical and mathematical procedures
Interpretive, subjective, semiotic analysis
Outcome Recommend a final course of action
Develop an initial understanding

97
Figure 4-4: Primary data collection techniques
Source: Adapted from Cant (2010:48) and Malhotra and Dash (2016:175).
When considering the primary and secondary sources of data, it is important that the
advantages and disadvantages of each data source are considered. Obtaining this knowledge
will assist researchers to understand and collect the correct data that is most applicable to the
research problem (Wiid & Diggines, 2009:69). The advantages and disadvantages of each
data source are presented in Table 4-4.
Table 4-3: The advantages and disadvantages of secondary and primary data
sources
Source: Adapted from Mooi et al. (2018:31).
Secondary data Primary data
Advantages
Cost-effective
Greater sample sizes
Greater level of authority
Quick to access
Easy to compare research
More accurate
Recent data
Conducted specific for the purpose/research study
Proprietary
Disadvantages
Data may be outdated
May not fully fit the research problem
Hidden errors in data can occur
Difficult to assess data quality
No control over data
Tendency to be expensive
Larger time period is `required to obtain data

98
4.2.3.3 Data collection method used in this study
For the purpose of this study, secondary data was collected by means of an extensive
literature review (Chapters 2 to 3). The literature review provided the researcher with
knowledge of the theoretical constructs investigated in this study, which included consumer
buying behaviour and reference groups (Chapter 2), as well as market segmentation with a
specific focus on lifestyle segmentation of the Singletons consumer segment (Chapter 3).
This study followed a quantitative research approach to collect primary data. Babin and
Zikmund (2016:13) assert that following a quantitative research approach enables researchers
to use scales to measure concepts. Likert, ordinal and nominal scales were used in this study
to measure the responses of respondents. Quantitative research is used to determine the
behaviour of the respondents as well as the relationship between variables (Struwig & Stead,
2013:177). For these reasons, a quantitative research approach was used in order to
determine the effect of reference groups and lifestyle on the buying behaviour of Singletons.
A self-administrative semi-structured questionnaire was used, where fieldworkers intercepted
potential respondents at high traffic areas in order to gather the data for the study. According
to Burns and Bush (2014:172), questionnaires are the descriptive method mostly used for
collecting data and conducting market research. This is due to the fact that questionnaires are
an inexpensive, accurate and efficient way for researchers to obtain information about the
target population (Burns & Bush, 2014:172). The questionnaire in this study was used to
determine and describe the characteristics of Singletons in terms of demographics, reference
groups and lifestyle.
4.2.3.4 Research instrument
Primary data was collected for this study by using a standardised questionnaire. Kardes et al.
(2015:26) explain that a questionnaire is a set of structured questions with response options
for the participants. The primary goal of questionnaires is to obtain data through a list of
questions that will generate the data needed to solve the research problem (Wiid & Diggines,
2009:171). Mooi et al. (2018:171) note that there are seven steps to follow that will ensure that
an effective questionnaire is designed. Figure 4-5 provides a schematic representation of
these steps.

99
Figure 4-5: Steps in designing an effective questionnaire
Source: Adapted from Mooi et al. (2018:64)
Kotler and Keller (2016:63) assert that researchers use questionnaires in order to assess the
knowledge, satisfaction, beliefs and preferences of individuals as well as to measure these
magnitudes in the general population. According to Kardes et al. (2015:26), questionnaires
can be structured in a variety of forms including oral or written formats, which can be
administrated by means of telephone, the Internet, mail, face-to-face or e-mail.
Schiffman and Kanuk (2014:37) identify four basic types of questionnaires, namely person-
administrated questionnaires; computer-assisted questionnaires; computer-administrated
questionnaires; and self-administrative questionnaires. This study made use of a self-
administrative questionnaire. According to Burns and Bush (2014:142), self-administrative
questionnaires are presented to the respondents where they have the opportunity to complete
them without interference by the interviewer or fieldworkers. Mooi et al. (2018:68) propound
that no interviewer bias occurs, as the trained fieldworkers are responsible for distributing and
collecting the completed questionnaires. The researcher is not present to influence the
answers provided by the respondents in any way.
1. Set the survey goal
2. Determine the type of
questionnaire and method of
administration
3. Design the items
4. Set the scale5. Design the questionnaire
6. Pretest the questionnaire
7. Execution

100
4.2.3.5 Types of response formats
Rao (2011:140) affirms that developing and deciding on a response format is a crucial stage
when designing a questionnaire. Struwig and Stead (2013:115) propound that attitude scales
and projective techniques influence the type of measurement techniques that will be used
when developing the response format. According to Wiid and Diggines (2009:117), the
researcher must consider the probable reaction or answer of the respondents on the question.
Rao (2011:140) distinguishes between five forms of questions that can be used in a
questionnaire: open-ended, close-ended, multiple choice, dichotomous and scaled-response
questions.
A. Open-ended questions
Open-ended questions are unstructured and offer the respondents the freedom of answering
the questions in their own words, based on how they think and feel (Rao, 2011:140). Mooi et
al. (2018:402) assert that these questions can also be referred to as verbatim items, where
respondents write their answers in the response box provided. According to Hyman and Sierra
(2010:154), open-ended questions are most effective when used in face-to-face interviews,
as some answers provided by the respondents are unpredicted and follow-up questions need
to be asked in order for the interviewer to gain a better perspective. Articulation of respondent
bias, interviewer bias, hard-to-record answers, coding inconsistency and difficulty, reduced
cross-study comparability and complexity and costliness are some of the disadvantages
associated with open-ended questions (Hyman & Sierra, 2010:155).
B. Close-ended questions
Close-ended questions are more structured as compared to open-ended questions, and here
respondents select an answer from a fixed set of alternative answers (Rao, 2011:141). Hyman
and Sierra (2010:156) propose the following advantages when using close-ended questions:
The communication skills required by respondents are less critical.
Close-ended questions enable speedy responses from the respondents.
The questions are easy to answer.
Coding, entering and analysing the data can be done quickly compared to open-ended
questions.
The skills needed for interviewing respondents are less important.

101
Iacobucci and Churchill (2010:215) confirm that multiple-choice questions, dichotomous
questions and scaled-response questions are all forms of close-ended questions.
Multiple-choice questions
Clow and James (2014:332) note that multiple-choice questions provide the respondents with
multiple answers, usually more than three from which they can choose. According to Rao
(2011:141), the response options provided can be considered as alternative options so that
they can be closest to the view or opinion of the respondent completing the questionnaire.
Multiple-choice questions ideally require the respondent to choose only one answer from the
total number of options available (Smith & Albaum, 2010:228).
Dichotomous questions
Babin and Zikmund (2016:309) define dichotomous questions as the questions where the
respondents have to select only one of the two alternative options available. “Yes or No” and
“Agree or Disagree” are examples of dichotomous questions’ response options. Neutral
answer options can be used as supplements to the Yes/No option, where respondents have
response options such as “Neither”, “Can’t say” or “Don’t know” (Smith & Albaum, 2010:227).
According to Iacobucci and Churchill (2010:215), respondents prefer dichotomous questions
as they are easy to answer, whereas researchers share this preference due to the ease of
coding and tabulation of the answers provided by using this format.
Scaled-response options
Iacobucci and Churchill (2010:233) consider scaled-response questions parallel to multiple-
choice questions, as both forms offer various alternative response options. However, scaled-
response options differ from multiple-choice questions in the sense that they use various forms
of measurement scales. The Semantic differential scale, Likert scale, Rating scale and the
Importance scale are the different measuring scales that can be used when considering
scaled-response options as a form of response.
4.2.3.6 Measurement scales used in the questionnaire
According to Arora and Mahankale (2013:94), the level of measurement helps the researcher
to decide how the data obtained from the variable will be interpreted. Researchers who know
the level of measurement can decide which statistical analysis should be used for the assigned
values. Mooi et al. (2018:35) assert that the four basic levels of measurement include nominal,
ordinal, interval and ratio scales.

102
Nominal scale
Malhotra (2010:253) consider nominal scales to be the most basic and least precise level that
a researcher uses to measure something where a numerical value is used to substitute a word.
The characteristics of a specific outcome when using a nominal scale only fits into one class
or category (Salkind, 2017:32). Babin and Zikmund (2016:272) assert that the numerical value
assigned to an object should only to be used for identification purposes. Nominal scaling does
not require any spacing or ordering (Arora & Mahankale, 2013:96). Arora and Mahankale
(2013:96) consider pin codes, gender, marital status and geographic locations as nominal
scale variables.
Ordinal scale
As indicated in the first three letters, the ord in ordinal level scales stands for order, where the
items are ranked or graded and sequenced with regards to a common variable (Salkind,
2017:32). According to Benzo et al. (2016:145), ordinal scales provide richer data and
information than nominal scales. Mooi et al. (2018:37) assert that ordinal scales provide the
researcher with information comprising of the order of the respondent's observations. Ordinal
scales can position items based on the comparative magnitude of a concept and allow items
to be arranged based on how much of a certain concept they represent (Babin & Zikmund,
2016:275).
Interval scale
Iacobucci and Churchill (2010:235) explain that the numerical value assigned to the responses
are meaningful when they allow equal increments of the attribute being measured. The interval
scale enables the researcher to achieve a higher level of measurement in comparison with
those of the nominal and ordinal scales (Babin & Zikmund, 2016:275). According to Arora and
Mahankale (2013:97) there is no fixed zero-point location, since zero does not signify the
absence of the attribute. Clow and James (2014:262) note that using interval scales allow
researchers to calculate a mean and conduct tests like t-tests and ANOVAs. Considering the
above, interval scales have desirable properties, allowing researchers to analyse the resulting
number using the entire range of statistical operations (Arora & Mahankale, 2013:97).
Ratio scale
Ratio scales have a meaningful zero point as well as all the characteristics of the nominal,
ordinal and interval scales (Mooi et al., 2018:38). Salkind (2017:33) notes that the zero-point

103
means that although certain traits are not present, they are still being measured. According to
Arora and Mahankale (2013:97), the ratio scale is the only type of scale that permits
researchers to make comparisons of absolute magnitude. Cant et al. (2010:135) consider the
ratio scale to be the highest scale level from which the most information can be collected.
The questionnaire used for this study consists of the four sections (refer to Appendix A) that
are described below.
Section A – Screening questions: Screening questions were asked in order to ensure that
the respondents who completed the questionnaire qualified to participate in the study.
Section B – Reference groups: The purpose of section B of the questionnaire was to
measure the effect of reference groups on the buying behaviour of Singletons by using the
12-item SUSCEP (the Consumer Susceptibility to Interpersonal Influence) scale introduced
by Bearden et al. (1989). The SUSCEP-scale is used by marketers in order to measure
consumer behaviour of individuals (DeMarais, 2015:8), as well as the tendency of an individual
to change due to social pressure (Huang et al., 2012:140). Bearden et al. (1989) define
susceptibility to interpersonal influences as the extent to which an individual is sensitive to the
opinions of others. The SUSCEP-scale measures how the choices of individuals are
influenced by significant others. Such individuals try to enhance their image by consuming
products and brands approved of by others (Paulose & Ramanathan, 2016:10). The SUSCEP-
scale measures the normative dimensions (conformity and enhancing one’s image) by using
eight items and uses four items to measure the informative dimensions (utility information)
(Paulose & Varghese, 2016:38). The reliability and validity were established regarding the
effect of the SUSCEP-scale’s ability to effectively measure the effect of reference groups on
the buying behaviour of Singletons. DeMarais (2015:11) determined the reliability of the
SUSCEP-scale by calculating the Cronbach Alpha coefficient of the normative dimension
(0.09) and the informative dimension (0.72). Studies that used the SUSCEP-scale have also
been conducted by Ebren (2009), Huang et al. (2012), Paulose and Varghese (2016) and
Paulose and Ramanathan (2016).
Section B of the questionnaire incorporated 12 items of the SUSCEP-scale on a Likert type
scale in order to measure the responses. A seven-point Likert type scale was used to rate the
response to each statement of the SUSCEP-scale in ascending degree of agreement, where
1 – strongly disagree and 7 = strongly agree.
Section C - Lifestyle: The purpose of this section was to conduct a lifestyle analysis of
Singletons, using 37 AIO statements as proposed by Plummer (1974). The statements used

104
in this study were obtained and adapted from previous lifestyle studies conducted by
Anantachart (2013), Kucukemiroglu et al. (2006), Lee et al. (2009) and Narang (2010).
According to Hur et al. (2010:296), conducting an analysis based on the activities, interests
and opinions (AIO) is the foremost used approach to determine the lifestyle of consumers, as
well as how they spend their time and money. AIO-lifestyle studies conform to using a
psychographic inventory, where the battery of statements are used to determine the activities,
interests and opinions in which the respondents participate (Hur et al., 2010:296).
Section C of the questionnaire set out to determine the lifestyle of Singletons by using 37 AIO-
statements. Sub-categories of the 37 AIO-statements were created in order to determine the
following lifestyle dimensions: fashion consciousness, cost-consciousness, health orientation,
recreation, E-shopping and career orientation respectively.
The AIO measurement scale implements a seven-point Likert scale to rate the response to
each AIO statement in ascending degree of agreement, where 1 = strongly disagree and 7 =
strongly agree.
Section D – Demographic information: The aim of this section was to obtain information
regarding the respondents’ demographics such as age, gender, income, marital status, level
of education and current occupation. The information obtained from this section helps the
researcher to create a sample profile of the respondents.
For the purpose of this study, the questionnaire comprised of close-ended questions that
included dichotomous, multiple-choice and scaled questions. Tables 4-5 to 4-7 provide a
summary of the response format and level of measurement used in each question of the
questionnaire.

105
Table 4-4: Measurement of reference group influence (SUSCEP-scale)
Question Statement Response format
Level of measurement
B1 I rarely purchase the latest fashion styles until I am sure my friends will approve of them.
Scaled Likert
B2 It is important that others like the products and brands I use.
Scaled Likert
B3 When buying products, I generally purchase those brands that I think others will approve of.
Scaled Likert
B4 If other people can see me using a product, I often purchase the brand they expect me to buy.
Scaled Likert
B5 I like to know what brands and products make good impressions on others.
Scaled Likert
B6 I achieve a sense of belonging by purchasing the same products and brands that others purchase.
Scaled Likert
B7 If I want to be like someone, I often try to buy the same brands that they buy.
Scaled Likert
B8 I often identify with other people by purchasing the same products and brands they purchase.
Scaled Likert
B9 To make sure I buy the right product or brand, I often observe what others are buying and using.
Scaled Likert
B10 If I have little experience with a product, I often ask my friends about the product.
Scaled Likert
B11 I often consult other people to help choose the best alternative from a product class.
Scaled Likert
B12 I frequently gather information from friends or family about a product before I buy.
Scaled Likert

106
Table 4-5: Measuring of lifestyle
Question Statements Response format
Level of measurement
C1.1- C1.10
Fashion consciousness
I usually have one or more outfits that are of the very latest style.
When I must choose between the two, I usually dress for fashion, not for comfort.
An important part of my life and activities is dressing smartly.
I often try the latest hairstyles when they change.
I dress more fashionably than most people do.
People can realise your social status by looking at the brand of clothes you wear.
I read fashion-related magazines.
I consult the internet for the latest fashion and styles.
I spend a lot of time talking with my friends about the latest fashion trends.
I like to watch fashion-related programmes on television.
Scaled Likert
C2.1 – C2.5
Cost consciousness
I shop for specials.
I find myself checking the prices in the grocery store even for small items.
I usually watch the advertisements for announcements of sales.
A person can save a lot of money by shopping around for bargains.
I like to pay cash for everything I buy.
Scaled Likert
C4.1 – C4.4
Recreation
I thoroughly enjoy my leisure time.
Leisure is worth the extra money spent for it.
I would rather enjoy leisure time than work hard.
I prefer to do nothing but watch TV or movies during the holidays.
Scaled Likert

107
Table 4-5: Measuring of lifestyle (continued)
Question Statements Response format
Level of measurement
C5.1 – C5.7
E-shopping
I think online buying is a novel, fun way to shop.
E-shopping is easier than local shopping.
I like browsing on the internet.
I think e-shopping offers lower prices than local stores.
I enjoy buying things on the internet.
Buying things on the internet scares me.
I think e-shopping offers a better selection than local stores.
Scaled Likert
C6.1 – C6.5
Career orientation
My work is stressful.
My work is of primary importance to me in life.
My work is my true identity.
I lack perseverance and focus to achieve goals.
My work gives me satisfaction.
Scaled Likert

108
Table 4-6: Measuring demographics
4.2.3.7 Linking the objectives with the questionnaire
Table 4-8 links the objectives of the study with the questions used in the questionnaire.
Question Statements Response format
Level of measurement
D1 How old are you? Multiple-choice Ordinal
D2 What is your monthly disposable income? Multiple-choice Ordinal
D3 What is your gender? Dichotomous Nominal
D4 Please indicate your highest level of education.
Multiple-choice Nominal
D5 Please specify your current occupation. Open-ended -
Secondary objectives Questions
1. To provide an overview of the research literature related to the main constructs of this study, namely consumer behaviour, reference groups, market segmentation and lifestyle segmentation.
Chapters 2 & 3
2. To develop a demographic profile of consumers who form part of the singletons market segment and who participated in this study.
D1 – D5
3. To determine the extent to which reference groups have an effect on the buying behaviour of Singletons.
B1 – B12
4. To determine the lifestyle of singletons in terms of fashion consciousness. C1.1 – C1.10
5. To determine the lifestyle of singletons in terms of cost consciousness. C2.1 – C2.5
6. To determine the lifestyle of Singletons in terms of health orientation. C3.1 – C3.4
7. To determine the lifestyle of Singletons in terms of recreation C4.1 – C4.4
8. To determine the lifestyle of Singletons in terms of E-shopping. C5.1 – C5.7
9. To determine the lifestyle of Singletons in terms of career orientation. C6.1 – C6.5
10. To determine the underlying relationships between the various lifestyle dimensions of Singletons.
C1.1 – C6.5
11. To determine the underlying relationships between the level of reference group effect and the lifestyle dimensions of Singletons.
B1 – B12; C1.1 – C6.5
12. To determine the difference in perception of reference group influence and the lifestyle dimensions of singletons with regards to their demographic differences.
B1 – B12; C1.1 – C6.5; D1 – D5
109
Table 4-7: Relationship between objectives and questionnaire
4.2.3.8 Pilot study of the questionnaire used for this study
A pilot study is conducted once a draft questionnaire has been completed. A small sample of
respondents are asked to complete the questionnaire before it is launched in order to identify
any reading difficulties or errors (Struwig & Stead, 2013:97). According to Flynn and Foster
(2009:157), pretesting the questionnaire allows the researcher to make the necessary
improvements in order to collect correct and efficient data. Several steps need to be followed
before the pilot study can commence.
The first step was to submit the questionnaire to the Ethical Committee of the North-West
University. The questionnaire was examined and a few changes regarding the demographic
section required adjustment. Upon receiving clearance from the Ethical Committee, the
questionnaire was submitted to the Statistical Consultation Services of the North-West
University. The questionnaire was analysed to ensure that the data obtained is relevant and
will achieve the objectives of the study.
Upon receiving approval from the Statistical Consultation Services, a sample of twenty
respondents who formed part of the target population, namely Singletons who reside in the
Gauteng, were asked to complete the questionnaire. An analysis of the completed
questionnaires derived from the pilot study indicated that it was easy for the respondents to
understand and complete the questionnaire and that no further amendments were necessary.
4.2.4 Step 4: Design the sample and collect data
The fourth step of the marketing research process comprises the implementation and
management of the data collection method, where the researcher designs the sample and
obtains the data required for the research study.
4.2.4.1 Sample design
A sample represents a limited number of respondents who form part of the total population
used by researchers in order to make assumptions or conclusions of the entire population
(Sontakki, 2009:106). According to Feinberg et al. (2013:58), participants are selected from a
target population to participate in a study. Malhotra (2010:335) asserts that the sample serves
as a representation of the total population who shares characteristics similar to those of the
population at large. The selected sample have the characteristics and information pursued by
the researcher (Malhotra, 2010:372). McDaniel and Gates (2010:326) argue that selecting a

110
sample allows researchers to form various inferences of the characteristics of the target
population accurately.
Babin and Zikmund (2016:340) propound that when researchers select a sample as a
representation of the population, several phases should be considered during the sampling
process. Figure 4-6 illustrates these phases.
Figure 4-6: Sample design framework
Source: Adapted from Babin and Zikmund (2016:340) and Malhotra (2010:372).
4.2.4.2 Phase 1: Define the target population
Sontakki (2009:110) describes sampling as a process of making decisions, where determining
the target population is an important decision to be made. According to Neelankavil
(2015:240), sampling concerns the identification of a sub-group of a larger population used as
a basis for representing and arriving at conclusions about the entire population. Population
characteristics are used to form sub-groups in the population (Zikmund & Babin, 2010:310).
Benzo et al. (2016:129) describe a target population as the individuals under examination with
relation to the research objectives of the study. According to Mooi et al. (2018:42), a target
population consists of the group of units that a researcher considers when forming
judgements. The research problem will determine whether the units from the population
consist of groups of individuals, consumers, products or organisations. Defining the target
population is of great importance, as a clearly defined target population will ensure that the
selected sample is representative of the characteristics of the total population (Shiu et al.,
2009:485).
Feinberg et al. (2013:303) and Malhotra (2010:336) define a target population by considering
the elements, sampling units, extent, geographical areas and the time period in which the data
will be collected. Babin and Zikmund (2016:343) assert that population elements refer to an

111
individual or object that belongs to the target. Table 4-5 provides a summary of the target
population considered for this study.
Table 4-8: Summary of the target population
The target population for this study comprised of consumers in the Singletons segment who
reside in Gauteng province in the Republic of South Africa. The sampling elements comprise
of consumers who form part of the Singletons consumer segment and who reside in Gauteng
during 2018 and 2019. The sampling unit for this study can be defined as the Singletons
consumer segment. The extent of this study comprises the Gauteng province. Data was
obtained from the sampling elements from November 2018 to February 2019.
4.2.4.3 Phase 2: Identify the sample frame
Phase two in the sampling process is to identify the sampling frame from which samples can
be drawn. Dawar (2016:141) describes a sampling frame as a list or set of directories such as
telephone directories, mailing lists and internal databases that comprise of the sampling
elements from which the researcher can draw actual samples.
Considering this study, no sampling frame was available from which to draw a sample. A non-
probability convenience sampling method was used to obtain an appropriate sample that
comprised of consumers within the Singletons segment in Gauteng province during October
2018 and January 2019.
4.2.4.4 Phase 3: Select a sampling procedure
The third phase in selecting a sample for the study is to select a suitable sampling procedure.
Gbadamosi (2013:122) asserts that researchers rely on drawing samples from the target
population due to the exorbitant costs involved when including an entire population in a study.
In addition, it could prove to be unrealistic to study the entire population of interest. By
implementing an effective sampling procedure, the researcher can save time when conducting
Dimension Application to the study
Sampling elements Consumers who form part of the Singletons segment, residing in Gauteng, South Africa in 2018/2019.
Sampling unit Singletons segment in Gauteng, South Africa in 2018/2019.
Extent The Gauteng province of the Republic of South Africa.
Time period October 2018 to January 2019.

112
the study and collecting the relevant information. Similarities in the characteristics of members
of the same population enable marketers to use a sample to gauge the entire population of
interest.
Sampling is considered important because it identifies respondents who actively embody the
target population. If the wrong target population and respondents are identified, there is a
strong likelihood that misleading conclusions will be made (Boone & Kurtz, 2014:320). Brown
et al. (2014:306) identify probability sampling and non-probability sampling as methods that
can be used to draw a representative sample. Figure 4-6 provides a schematic representation
of the sampling procedure and its various methods of implementation.
Figure 4-7: Sampling procedure
Source: Adapted from Mooi et al. (2018:44)
A. Probability sampling
Probability sampling entails a systematic selection of sampling units so that each member of
the target population has a known, non-zero probability of being selected for the sample
(Brown et al., 2014:307). Babin and Zikmund (2016:351) assert that probability sampling
consists of random sampling components that ensure that the elements selected are objective
and not based on the researcher’s bias and judgement. Boone and Kurtz (2014:320) identify
simple random sampling, systematic sampling, stratified sampling and cluster sampling as
techniques for conducting probability sampling.

113
Simple random sampling
Babin and Zikmund (2016:351) consider simple random sampling a one-stage sample
selection, where each element belonging to the population has an equal probability of being
chosen for the sample. Researchers select elements by allocating a specific identification
number to an element on the sampling frame, and specialised software or strata is used to
randomly select numbers and compile the sample (Mooi et al., 2018:44). According to
Gbadamosi (2013:123), the advantages of simple random sampling include that it is simple to
conduct and justifies the criteria of probability sampling. However, this sampling technique has
the disadvantages of being expensive and time-consuming.
Systematic sampling
A systematic sampling technique requires the researcher to devise a list of the research
elements alphabetically, numerically, geographically or in the way the researcher wishes
(Sontakki, 2009:119). The researcher randomly selects the starting point of the first element,
where a fixed skip interval is implemented to select the subsequent elements (Gbadamosi,
2013:123). McDaniel and Gates (2010:429) propound that systematic sampling is more time,
cost and economically effective. Brown et al. (2014:307) and Zikmund et al. (2017:353) explain
that in order to determine the value of the skip interval, the researcher divides the total target
population size with the determined sample size.
Stratified sampling
Stratified sampling entails grouping the population into various identifiable and homogenous
groups, where samples are then chosen from each of the sub-groups (Mooi et al., 2018:45).
Zikmund et al. (2017:354) assert that the homogenous groups can also be referred to as
strata. According to Brown et al. (2014:309), a sample from each identified sub-group will be
taken in order to gain an accurate representation of the final sample. Stratified sampling is
most effective in research studies where various groups of individuals have several divergent
viewpoints (Boone & Kurtz, 2014:320).
Cluster sampling
Gbadamosi (2013:124) asserts that the goal of cluster sampling is to obtain the characteristics
of a probability sample as economically possible. Cluster sampling, as defined by Boone and
Kurtz (2014:320), is similar to stratified sampling in that the researcher selects a population
from which samples are drawn. Zikmund et al. (2017:355) considers the area sample to be

114
the most prevalent type of cluster sample. Area samples represent a large cluster with various
areas that are located close to one another. Researchers consider cluster sampling most
effective when the population consists of geographic areas and not of individual elements such
as people (Wiid & Diggnes, 2009:207). Babin and Zikmund (2016:355) warn that when the
attitudes and characteristics of the cluster are too similar, these may prove to be problematic.
B. Non-probability sampling
Non-probability sampling is distinguished from probability sampling by the fact that it is not
known whether any element of the target population will be selected (Zikmund et al.,
2017:357). According to Brown et al. (2014:305), the researcher’s personal judgement is at
play when selecting a sample. The probability of an element being included in the sample
cannot be estimated due to the fact that not all elements have the opportunity to be included.
Gbadamosi (2013:124) asserts that non-probability sampling does not incorporate any
statistical methods like those of probability sampling when selecting a sample and can thus
be considered to be arbitrary in nature. Researchers use non-probability sampling techniques
since they are less costly and can be executed more easily as compared to probability
sampling techniques (Aaker et al., 2011:387). Techniques used for non-probability sampling
include judgement sampling, snowball sampling, quota sampling and convenience sampling.
Judgement sampling
Judgement sampling, also known as purposive sampling, refers to a technique of sampling in
which an experienced researcher trusts his or her own judgement when selecting the research
elements to be included in the sample (McDaniel & Gates, 2013:293). According to Zikmund
et al. (2017:357), researchers may select samples that do not necessarily represent the entire
population, but have specific aspects and characteristics that the researcher finds compelling.
Malhotra (2010:379) asserts that judgement sampling is inexpensive and easy to administer.
Researchers should pay attention to the judgements they make, because an error in
judgement can lead to identifying the wrong sample (Shiu et al., 2009:481).
Snowball sampling
Snowball sampling entails obtaining information from the initial respondents about additional
respondents who qualify to participate in the study (Zikmund et al., 2017:358). The additional
respondents are likely to display the same activities, interests and opinions as the initial
respondents (Struwig & Stead, 2013:121). According to Burns et al. (2017:242), researchers
may use probability sampling in order to recruit the initial respondents. Babin and Zikmund
(2016:350) concur that snowball sampling is most effective when the population is small or

115
difficult to reach. The sample will continue to grow when the additional respondents are asked
to refer even more potential respondents. The initial, additional and potential respondents
need to have the characteristics and qualities that the researcher requires. These qualities
include, inter alia, gender, age, education and income (Gbadamosi, 2013:126).
Quota sampling
Iacobucci and Churchill (2015:271) propound that quota sampling occurs when a sample is
selected based on pre-specified characteristics that are in accordance with the proportion of
the population. These characteristics include demographics, attitudes and consumer
behaviour that are based on the researcher’s judgements and desires (Feinberg et al.,
2013:305; Gbadamosi, 2013:126). Babin and Zikmund (2016:350) emphasise that some of
the advantages associated with quota sampling include the speed at which data can be
collected; the convenience of collecting the data; and the relatively low costs involved when
collecting the data.
Convenience sampling
Convenience sampling entails the collection of data from respondents who are readily and
conveniently available (Mooi et al., 2018:63). Boone and Kurtz (2014:320) assert that
convenience sampling mostly occurs at the place and time where the research is being
conducted, due to the availability of suitable respondents. A sample collected by means of
convenience sampling can be referred to as the “accidental sample”, with mall interception
surveys and TV call-in opinion polls being appropriate examples of data collection techniques.
Although the place and selection of respondents are subjective, Gbadamosi (2013:125) assert
that convenience sampling saves time and money and is easy to implement. Mooi et al.
(2018:63) state that the researcher’s decision as to who can form a part of the sample is limited
as it is largely influenced by situational factors.
For the purpose of this study, non-probability convenience sampling was used since no
sampling frame was available, and not all Singleton consumers could effectively be identified.
Singleton consumers were intercepted by fieldworkers at high-traffic locations in Gauteng.
These areas were deemed to be convenient since the researcher and the fieldworkers of this
study reside in Gauteng.
4.2.4.5 Phase 4: Determine the sample size
The fourth phase in establishing a sample design is to determine the sample size. Cant et al.
(2009:139) propound that the sample size includes the total number of elements that are
116
selected to be included in the study. Dawar (2016:142) proclaims that the size of the sample
is affected by the nature of the research. Numerous qualitative and quantitative considerations
have to be thoroughly examined when determining the sample size, which can prove to be a
complex process (Dawar, 2016:142). According to Mooi et al. (2018:64), when samples are
selected accurately, they have a stronger representation of the population, rather than
selecting the sample according to size. Mooi et al. (2018:64) consider a smaller sample to be
sufficiently precise and argue that the larger the sample size is, the less precise the gains
become. Over time, various misconceptions and generalisations have been formed regarding
an adequate sample size. Wiid and Diggnes (2009:208) state that some of the general
misconceptions regarding sample size is that a sample size is fixed and proportionate to the
size of the population; and that the accuracy of the study’s results increase with a larger
sample size. Malhotra (2010:374-375) mentions the following factors that influence the size of
a sample:
The number of variables needed for data collection.
The type of data that has to be collected.
The nature of the research.
The complexity of the data analysis.
The availability of resources such as time, finances and skilled fieldworkers
This study followed a quantitative research approach by implementing a descriptive
research design. The influence of the various constructs on consumer buying behaviour were
analysed by collecting data by means of semi-structured questionnaires. With regards to
quantitative research, Struwig and Stead (2013:125) assert that an acceptable reflection of
the population can be obtained with a sample size consisting of 150 to 200 respondents.
According to Kent (2007:145) (as cited by Dawar, 2016:163), to conduct any kind of
quantitative analysis, a minimum sample size of 100 respondents are needed. In this study,
the sample size consisted of 251 responses, and 208 responses were considered due to
response errors in the remaining responses.
4.2.4.6 Phase 5: Select the sample elements
The fifth and final phase in establishing a sample design is to select the sample elements. The
sample elements of the study refer to the respondents from whom the researcher would like

117
to collect information, based on their activities, interests and opinions (Wiid and Diggnes,
2009:214).
In this study, non-probability convenience sampling was used to select the sampling
elements. The sampling elements for this study can be defined as consumers in the Singletons
segment who reside in the Gauteng province of the Republic of South Africa during 2018 and
2019. Table 4-6 provides a summary of the sample plan implemented in this study.
Table 4-9: Summary of the sample plan for this study
4.2.4.7 Collection of data
With the sample designed, the next step is to implement the sample plan and collect the
required data. In order to collect the required data, the researcher and the fieldworkers need
to be trained in order to assure that the data is collected effective and usable (Feinberg et al.,
2013:31).
For this study, the researcher consulted with students who are in their final year of studies in
order to fill the fieldworker’s positions. It was imperative that the fieldworkers comprised of a
broad understanding of academia and the research process. Background information on the
study and its objectives were provided to the candidates, along with practicalities on how the
data collection process will work. The roles, responsibilities and expectations of the
fieldworkers were explained. The explanation was followed by a Q&A session where all
uncertainties and questions were addressed.
In order to assure that no bias occurred during the data collection process the questionnaires
incorporated neutrally worded questions, with non-leading answers. Fieldworkers collected
Design elements Application to empirical study
Population
Sampling element Consumers who form part of the Singleton segment, residing in Gauteng province, South Africa in 2018.
Sampling unit Singletons consumer segment
Extent Gauteng province
Time 2018
Sample frame No sampling frame.
Sampling method Non-probability convenience sampling.
Sample size 200 sampling elements.
118
the data, which ensured that the researcher could not influence the responses provided by the
respondents.
The trained fieldworkers started distributing self-administrative semi-structured questionnaires
to Singletons in and around the Johannesburg and Pretoria areas of Gauteng province as
from October 2018 to January 2019. The fieldworkers were responsible for identifying
Singletons by conveniently intercepting them at high-traffic locations which was identified as
Menlyn Park Mall, Menlyn Maine, Eastgate, Nelson Mandela Square, Bedfordview Mall, The
Grove, Mall of the South, Greenstone Shopping Centre and Mall of Africa.
4.2.5 Step 5: Analyse and interpret the data
The fifth step in the marketing research process is to analyse the primary data collected for
the study. Arora and Mahankale (2013:107) state that the data collected for the study contains
facts and answers with regards to the research problem and that a meaningful interpretation
thereof can only be made once it has been processed accordingly. Rao (2011:145) is of the
opinion that the process of analysing raw data and interpreting it into useable information is a
lengthy and complicated process – one in which various techniques are used to obtain the
required information. Whilst analysing the data, researchers have to apply appropriate
statistical techniques in order to make useful inferences (Babin & Zikmund, 2016:352; Hyman
& Sierra, 2010:314).
The questionnaires collected for this study were checked manually in order to ensure that only
those questionnaires that have been completed properly, accurately and that are numbered
correctly are analysed. The questionnaires were submitted to the Statistical Consultation
Services of the North-West University to be analysed.
Reliability and validity are important concepts in quantitative research as these indicate
whether the data collected for a study is truthful and representative of the reality thereof
(Baines & Page, 2013:113). A brief discussion of the analysis and interpretation of the data is
provided below. Clow and James (2014:272) suggest the following figure to illustrate the
relationship between reliability and validity.

119
Figure 4-8: The relationship between reliability and validity
Source: Adapted from Clow and James (2014:272).
4.2.5.1 Reliability
Babin and Zikmund (2016:280) assert that reliability indicates the internal consistency of a
measuring instrument. Clow and James (2014:267) consider a measuring instrument as
reliable when consistent results are provided as a criterion for evaluating measurement scales
that reflects on the consistency of the measuring instrument (Baines & Page, 2013:113).
According to Clow and James (2014:267), reliability can be evaluated by using three different
approaches: test-retest, equivalent forms and internal consistency.
Test-retest reliability
With test-retest reliability, the researcher repeats the measurement process by using the same
instrument at two different time periods on the same respondents (Clow and James,
2014:267). According to Hyman and Sierra (2010:125), test-retest reliability represent the
degree to which the answers provided by the respondents are similar on both the occasions
of measurement. Clow and James (2014:268) and Malhotra (2010:319) identify the following
potential problems that can occur whilst using test-retest reliability:
Testing effects: Having been previously exposed to the measurement instrument may
have an impact on the responses provided the second time around.
Researchers gave a limited time interval and budget when retesting the measurement
instrument.

120
Environmental factors such as personal factors, the respondent’s health or mood can
alter the responses provided whilst retesting.
Locating the same respondents may prove to be difficult as the respondents may not
be available or willing to cooperate.
Equivalent forms reliability
Equivalent forms reliability involves the completion of two measurement instruments at
different time periods by the same respondent. This form illustrates the internal reliability that
provides correlated results of the two instruments and that determines the reliability of the test
(Baines & Page, 2013:113). McDaniel and Gates (2010:315) assert that the problems
associated with test-retesting can be prevented when creating equivalent forms to be used for
measurement. However, this method also has its own disadvantages, such the time, cost and
effort needed to assemble two equivalent forms (Brown et al., 2014:256).
Internal consistency
The internal-consistency method measures reliability with only one exposure and represents
a measure’s homogeneity (Hyman & Sierra, 2010:126). According to Babin and Zikmund
(2016:280), internal consistency considers different items in the measuring instrument and the
consistency of the results produced by the items. The internal-consistency reliability method
does not present the problem areas identified when using the methods mentioned above
tTest-retest and equivalent-form), as it is only administered once (Hyman & Sierra, 2010:126).
Clow and James (2014:268) assert that Cronbach’s alpha coefficient can be used in order to
determine the internal-consistency reliability and the scales used to measure the same
construct. The higher the score of the Cronbach alpha, the more reliable the measurement is.
Scales that have a Cronbach alpha coefficient score of 1 indicate perfect reliability, and 0
indicates no reliability. Poor reliability is achieved when the scales have a Cronbach alpha
score of 0.06 or lower. Scales that have a low correlation can be discarded by the researcher
and the construct reliability can be retested (Clow & James, 2014:269; Shiu et al., 2009:403).
For the purpose of this study, the reliability of the data was measured by using the interval-
consistency reliability method, determining the Cronbach alpha coefficient by using
confirmatory factor analysis.

121
4.2.5.2 Validity
Mooi et al. (2018:408) define validity as the degree to which the researcher measures the
research components in order for it to be meaningful. Using a valid measuring instrument
means that the measure is free from systematic errors. The measuring instrument, the
respondents and the environment are all aspects from which a systematic error may arise
(Smith & Albaum, 2010:253). According to Iacobucci and Churchill (2010:319), the true
characteristics of the respondents, businesses or situations can be measured by using a valid
measuring instrument. In testing the validity of a scale, Smith and Albaum (2010:253) consider
the following different types of validity: content validity, criterion validity and construct validity.
Content validity
Content validity represents the extent to which a measurement represents all aspects of a
given construct. In other words, content validity assesses whether the objectives of the study
are sufficiently addressed by the specific measuring instrument (Mooi et al., 2018:394). Hyman
and Sierra (2010:126) affirm that content validity can be assessed by ensuring that the items
seem sensible by consulting various experts on the subject matter (Smith & Albaum,
2010:253). According to Fwhen the target population of the study has an appropriate
representative sample, the content validity can be considered to be sufficient.
Criterion validity
Criterion validity, also referred to as pragmatic validity, considers two types of measures that
are measured at the same time in order to conclude how one measure predicts the outcome
of the other measure (Mooi et al., 2018:394). Smith and Albaum (2010:253) identify the two
measures as concurrent and predictive validity. According to Clow and James (2014:271),
predictive validity considers how the measurement instrument can predict future behaviour
and actions.
Construct validity
Construct validity, as described by Clow and James (2014:271), assesses the measuring
instrument with regards to capturing the constructs and items being considered in the study
and how these relate to the theoretical information of the study. Smith and Albaum (2010:253)
propound that construct validation considers the questions of “does it work?” and “why does it
work?” when answering theoretical questions. Babin and Zikmund (2016:283) assert that
construct validity is a concept represented by a reliable and truthful measure. Two types of
construct validity have been identified by Babin and Zikmund (2016:283) and Hyman and
122
Sierra (2010:126), namely convergent validity and discriminant validity. Convergent validity
refers to a clear understanding of the research questions and problem by the researcher as
well as the knowledge to measure it appropriately. Discriminant validity, in turn, represents the
phenomena of interest in a model, not captured by other measures, by using a measure that
is empirically unique (Hyman & Sierra, 2010:126; Mooi et al., 2018:395).
In this study, the construct validity of the questionnaire was confirmed by using confirmatory
factor analysis.
4.2.5.3 Methods and statistical techniques
According to Struwig and Stead (2013:164), the properties, purpose and underlying
assumptions should be considered when selecting the techniques to analyse data since a
rationale should be provided in order to gather applicable information. The methods and
statistical techniques used in this study are discussed below.
Descriptive statistics
Salkind (2017:8) states that descriptive statistics is used when the researcher wants to
organise and describe the characteristics of a large data set. By using descriptive statistics,
the researcher can actively understand and interpret raw data about the patterns in the
population and sample (Dawar, 2016:145). Struwig and Stead (2013:165) assert that the
purpose of using descriptive statistics is to analyse a large amount of data, and in turn, gain
an inclusive, articulate and forthright depiction thereof. According to Babin and Zikmund
(2016:387) and Dawar (2016:145), calculating the mode, standard deviation, frequencies and
percentages by using descriptive statistics enables researchers to describe the sample of the
study and to identify the pattern of responses. Babin and Zikmund (2016:382) identify the
following techniques that can be used when analysing variables:
Univariate analysis – researchers only analyse one variable in order to obtain
frequency counts.
Bivariate analysis – researchers consider two variables at a time in order to draw
conclusions of the pattern between them.
Multivariate analysis – two or more variables are analysed in order to determine
properties and trends within the data.
Inferential statistics

123
Inferential statistics is used by considering the score of a measure to make generalisations,
assumptions or inferences about a sample that represents the whole population (Struwig &
Stead, 2013:167). Inferential statistics allows the researcher to test hypotheses and
conceptual models based on the samples that were measured (Dawar, 2016:145). According
to Salkind (2017:8), inferential statistics is used to make inferences on smaller data sets that
represent the entire population compared to descriptive statistics. Struwig and Stead
(2013:165) assert that inferential statistics can be divided into four groups that:
Measure the relationships between variables
Provide comparisons between dependant groups
Predict group membership ensure the differences between groups that have been
randomly assigned.
4.2.5.4 Statistical analysis applied in this study
The descriptive statistical analysis used in this study is briefly discussed, with Chapter 5
presenting the results obtained from the data analysis.
Frequency and Percentage distribution:
Babin and Zikmund (2016:373) assert that frequencies can be considered as the most
rudimentary of statistical descriptions that indicate how often each response occurs. The f
symbol is used when indicating frequency. According to Salkind (2017:63) the frequency can
be determined by considering the raw data and counting how many times a score occurs, and
then enter that number in each of the class intervals as presented by the count.
The percentage is articulated by using the % symbol and is used to describe the respondents
who have answered a question in a specific way (Aaker et al., 2011:438). Using percentages
in data analysis allows researchers to simplify the data and to make comparisons between
portions of data (Cooper & Schindler, 2011:506).
Means
The mean is the most commonly used measure of central tendency and reduces the amount
of analysed data (Busany & Maoz, 2016:886). Mooi et al. (2018:400) define a mean as a
method used to describe a typical value of a list of numbers by dividing the number of
observations with the sum of a variable’s value. According to Hyman and Sierra (2010:321),

124
means can also be referred to as arithmetic mean or just average. Salkind (2017:22) provides
the following formula for calculating the mean:
x̅ = ∑𝑋
𝑛
Standard deviation for individual items of the questionnaire
Dawar (2016:146) defines a standard deviation as a measure that is widely used to describe
the sample distribution values’ variability from the mean. According to Malhotra (2010:487),
determining the standard deviation enables researchers to examine the differences between
the respondents in the sample. Standard deviation averages the deviations by considering the
mean and then measuring the deviation of each score (Struwing & Stead, 2013:165). Babin
and Zikmund (2016:382) propose a rule of thumb when determining the standard deviation,
stating that the value of the standard deviation should be expected to be one-sixth of the
range.
Factor analysis
Benzo et al. (2016:135) affirm that factor analysis can be regarded as complex statistics that
is used to categorise data into simpler dimensions. Factor analysis considers a large number
of items, which are then reduced into a smaller subset of factors, in order to determine
underlying construct dimensions by analysing a set of items (Clow & James, 2014:311).
Furthermore, Clow and James (2014:311) assert that factor analysis allows researchers to
examine the questions that measure facets of the same components. According to Dawar
(2016:36), the significance of the factor analysis value can be indicated as follows:
A factor value of >0.6 indicates that the variable describes the factor very well.
A factor value of >0.3 indicates that the variable describes the factor moderately well.
A factor value of <0.3 should be ignored, as the variable fails to describe the factor
properly.
Where:
�̅� = value of the scores/mean ∑ = indicates that all the individual values are summed
𝑋 = individual scores in the group of scores n = size of sample

125
For this study, factor analysis was used in order to determine the factor value, which was
then used to attain the Cronbach alpha to test the reliability of the study. Chapter 5 presents
the results obtained from conducting a factor analysis for this study.
Pearson’s product-moment correlation coefficient
In order to determine whether linear relationships exist between reference groups, fashion
consciousness, cost consciousness, health orientation, recreation, E-shopping and career
orientation, Pearson’s product-moment correlation coefficients were calculated. Brown et al.
(2014:397) assert that the Pearson product-moment correlation coefficient evaluates the
consistent change of two continuous variables across cases that in turn indicates the degree
of linear associations. A small letter r is used to represent the Pearson’s product-moment
correlation coefficient (Salkind, 2017:84). According to Babin and Zikmund (2016:469)
researchers use the correlations to form conclusions as to how the different characteristics
relate to one another. Struwig and Stead (2013:168) propound that the Pearson product-
moment correlation indicates the strength of the relationship between two variables,
determining whether they are positive, zero or negative. A perfect negative relationship has a
correlation coefficient from -1.00, a perfect positive relationship has a correlation coefficient of
+1.00, whereas a correlation coefficient of 0.00 represents no relationship at all (Arora &
Mahankale, 2013:110). Iacobucci and Churchill (2010:452) affirm that perfect relationships are
rare and that coefficients have a tendency of being preceded by decimals. Cooper and
Schnindler (2011:513) and Brown et al. (2014:396) provide the following formula for
calculating Pearson’s r:
𝐫 = ∑𝐱𝐲
(𝐍−𝟏)𝐬𝐱𝐬𝐲
Cohen’s effective size conventions
Cohen’s effective size provides researchers with the opportunity to interpret and form
comparisons between group means (Kreamer & Blasey, 2016:312). Salkind (2017:207) assert
that Cohen’s effective size can range from small, medium and large. A small effect size is
when Cohen’s d is 0.2. A Cohen’s d of 0.3 represents a medium effect size, whereas a large
effect size is represented by a Cohen’s d of ≥ 0.8. Kraemer and Blasey (2016:312) affirm that
it is crucial that the correct size is selected with context to the research.
Where:
𝒓 = Pearson’s product-moment correlation coefficient ∑ = indicates that all the individual values are summed
N = the number of pairs of cases Sx,Sy = the standard deviation for x and y

126
4.2.6 Step 6: Prepare the research report
To conclude the marketing research process, the sixth and final step (see Figure 4-1)
comprises the preparation of the research report in which the results of the study are
presented and in which the implications and limitations of the study are discussed. The results
of the study are presented in Chapter 5, and the conclusions, implications and limitations of
the study are discussed in Chapter 6.
4.3 CONCLUSION
This chapter described the methodology followed in the study by discussing the marketing
research process. The research problem and objectives of the study have been identified and
the research design was developed and discussed. Furthermore, this chapter elaborated on
the process of selecting a research method and identifying a fitting sample used in the study.

127
CHAPTER 5: REPORTING OF RESULTS
5.1 INTRODUCTION
This chapter presents the results obtained from the empirical part of the study after
implementing the research methodology as set out in Chapter 4. The chapter commences by
providing the results of the influence of reference groups on the buying behaviour of
Singletons, followed by the results obtained from conducting a lifestyle analysis on Singletons.
The chapter concludes by reporting on the relationships identified between the core constructs
of this study.
5.2 RESULTS OBTAINED FROM SECTION A OF THE QUESTIONNAIRE: SCREENING
QUESTIONS
The respondents who provided the data for this study by means of completing a questionnaire,
successfully qualified to participate in this study by answering the screening questions in
section A of the questionnaire. Initially, 251 questionnaires were collected, but only 207 could
be used as the questionnaires of the respondents who did not qualify to participate were
discarded. Therefore, all respondents who participated in this study were over the age of 18,
single and lived by themselves at the time that this study was conducted.
5.3 RESULTS OBTAINED FROM SECTION B OF THE QUESTIONNAIRE:
REFERENCE GROUPS
Section B of the questionnaire set out to measure the effect of reference groups on the buying
behaviour of Singletons. The SUSCEP scale (see section 4.2.3.6) was used to obtain the
necessary data for this section of the study.
5.3.1 Reliability of section B
The reliability of this section of the questionnaire was determined by deriving the Cronbach
alpha value, and as such, determining the homogeneity or correlation between the 12 items
of the SUSCEP scale. In order to derive the overall Cronbach alpha value of the SUSCEP
scale, confirmatory factor analysis was used. The effect of reference groups among the
respondents was measured. The internal reliability of the 12 items of the SUSCEP-scale was
confirmed by dividing the items into two sub-scales, namely the normative scale and the
informational scale. The Cronbach alpha coefficient values were determined for the normative
scale, which comprised of items B1-B9 and the informational scale which consisted of items

128
B10-B12. An overall Cronbach alpha value was determined by considering items of both the
normative and informational scale, and this is the value that was considered for this study.
Table 5.1 presents the Cronbach alpha values of both the normative and informational scales,
along with the overall Cronbach alpha value for the SUSCEP scale used to determine the
effect of reference groups on the buying behaviour of Singletons.
Table 5-1: Cronbach alpha reliability coefficient for section B of the
questionnaire
Table 5-1 indicates that a Cronbach alpha value of 0.95 was derived by considering the 12
items of the SUSCEP scale, thus indicating a high level of reliability. An overall Cronbach
alpha value of >0.8 was found, which serves as an indication that the 12 items of the SUSCEP
scale used to measure the effect of reference groups on the respondents has a high-level of
reliability.
Main Finding B1: The 12 items of the SUSCEP scale are reliable to measure the effect of
reference groups on the buying behaviour of respondents.
5.3.2 Validity of section B
The validity of the items used in the SUSCEP scale was determined by applying confirmatory
factor analysis. The Kaiser-Meyer-Olkin (KMO) measure of sampling adequacy was used to
determine the appropriateness of the factor analysis. The amount of variance that a variable
share with all other variables was also derived. Field (2009:677) asserts that the following
values of the KMO measure can be regarded as follow:
Construct Cronbach alpha value
Normative items
(B1 – B9) 0.95
Informational items
(B10 – B12) 0.89
Reference groups
(Overall Cronbach alpha) 0.95

129
Table 5-2: KMO measure value indicator
<0.5 = not good sampling adequacy
0.5 – 0.7 = mediocre sampling adequacy
0.7 – 0.8 = good sampling adequacy
0.8 – 0.9 = great sampling adequacy
>0.9 = superb sampling adequacy
Source: Field (2009:677)
A p-value of Bartlett’s test of sphericity was calculated in order to determine whether there is
sufficient correlation between the items of the SUSCEP scale. The amount of variance an item
shares with all the other items is considered by deriving the commonalities. The values of the
commonalities should be >0.3 in order to be deemed acceptable.
The SUSCEP scale used in section B of the questionnaire comprised of items B1-B12. By
conducting a confirmatory factor analysis on the SUSCEP-scale’s items, a variance of 75.91%
was obtained. The KMO measure of sampling adequacy was 0.93, which represents superb
sampling adequacy. The p-value of Bartlett’s test of sphericity was calculated as <0.001, which
is an indication of a sufficiently large correlation between the items, making them suitable to
perform an exploratory factor analysis. The commonalities varied between 0.44 and 0.86.
Considering the above-mentioned findings, the construct validity of the SUSCEP scale was
therefore confirmed.
Main finding B2: The confirmatory factor analysis indicated that the SUSCEP scale is a valid
instrument to measure the effect of reference groups on the buying behaviour of respondents.
5.3.3 The effect of reference groups on the buying behaviour of respondents
The SUSCEP scale made use of a 7-point Likert scale to rate the response to each of the
scale’s 12 items, where 1 = disagree strongly, 2 = disagree moderately, 3 = disagree a little,
4 = neither agree nor disagree, 5 = agree a little, 6 = agree moderately and 7 = agree strongly.
Considering the response options, the following four independent groups were identified:

130
Respondents who responded between 1 and 3 were placed in a group representing low
levels of reference group influence.
Respondents who responded between 3 and 4 were placed in a group representing
moderately low levels of reference group influence.
Respondents who responded between 4 and 5 were placed in a group representing
moderately high levels of reference group influence.
Respondents who responded between 5 and 7 were placed in a group representing high
levels of reference group influence.
The mean and standard deviation (SD) derived from the respondents’ responses with regards
to this section of the questionnaire are listed in Table 5-3.
Table 5-3: Mean and standard deviation of reference groups
From Table 5-3 it can be deduced that a moderately low level (mean=3.62) of reference group
influence is exerted upon the buying behaviour of respondents. The standard deviation
(SD=1.48) is relatively low, indicating that the responses provided by respondents did not differ
much.
Main finding B3: A moderately low level of reference group influence is exerted on the buying
behaviour of respondents.
5.4 RESULTS OBTAINED FROM SECTION C OF THE QUESTIONNAIRE: LIFESTYLE
The aim of section C of the questionnaire was to determine the lifestyle of respondents in
terms of six specific lifestyle dimensions, namely fashion consciousness; cost consciousness;
health consciousness; recreation; E-shopping; and career orientation. The AIO-approach (see
section 3.8.4) was used to obtain the necessary data in order to determine the lifestyle of
respondents. A battery of 37 AIO-statements was used to determine the lifestyle of
respondents in terms of the six lifestyle dimensions identified. The results of this section of the
questionnaire are discussed subsequently.
Construct Mean Standard deviation
Reference groups 3.62 1.48

131
5.4.1 Reliability of section C
The reliability of this section of the questionnaire was determined by deriving the Cronbach
alpha value for each of the lifestyle dimensions in this section of the questionnaire. In order to
derive the overall Cronbach alpha values, confirmatory factor analysis was used. Table 5.4
presents the overall Cronbach alpha value for the statements of each lifestyle dimension.
Table 5-4: Cronbach alpha reliability coefficient for section C of the
questionnaire
From Table 5-4 it can be deduced that the Cronbach alpha value for five groups of lifestyle
dimension statements is ≥ 0.7. One of the lifestyle dimensions has a Cronbach alpha value
that is <0.7, and therefore making it an unreliable form of measure for the construct
(recreation).
Main finding C1: From the six lifestyle dimensions in section C of the questionnaire, only five
dimensions and their statements are considered reliable.
Main finding C2: The statements used to determine the lifestyle dimension of recreation are
considered unreliable.
5.4.2 Validity of section C
The validity of the items used to measure each of the lifestyle dimensions was determined by
applying confirmatory factor analysis. The Kaiser-Meyer-Olkin (KMO) measure of sampling
adequacy was used to determine the appropriateness of the factor analysis. The amount of
variance that a variable share with all other variables was also derived. A p-value of Bartlett’s
test of sphericity was calculated in order to determine whether there is sufficient correlation
between the items of the SUSCEP scale. The results pertaining to the validity of the items
used to measure each of the lifestyle dimensions are discussed subsequently.
Lifestyle dimension Cronbach alpha
C1: Fashion consciousness 0.93
C2: Cost consciousness 0.79
C3: Health consciousness 0.88
C4: Recreation 0.62
C5: E-shopping 0.84
C6: Career orientation 0.74

132
5.4.2.1 Fashion consciousness
The statements used to measure the level of respondents’ fashion consciousness comprised
of items C1.1 - C1.10. By conducting a confirmatory factor analysis on these items, a variance
of 74.02% was obtained. The KMO indicated a superb sampling adequacy with it being 0.92.
The p-value of Bartlett’s test of sphericity was calculated as <0.001, which is an indication of
a sufficiently large correlation between the items, making it suitable to perform an exploratory
factor analysis. The communalities varied between 0.42 and 0.81. The construct validity of
the statements used to measure fashion consciousness was thus confirmed.
5.4.2.2 Cost consciousness
The statements used to measure the level of respondents’ cost consciousness comprised of
items C2.1-C2.5. By conducting a confirmatory factor analysis on these items, a variance of
59.71% was obtained. The KMO measure of sampling adequacy was 0.81, which represents
great sampling adequacy. The p-value of Bartlett’s test of sphericity was calculated as <0.001,
which is an indication of a sufficiently large correlation between the items, making it suitable
to perform an exploratory factor analysis. The communalities varied between 0.55 and 0.76.
The construct validity of the statements used to measure cost consciousness was thus
confirmed.
5.4.2.3 Health consciousness
The statements used to measure the level of respondents’ health consciousness comprised
of items C3.1-C3.4. By conducting a confirmatory factor analysis on these items, a variance
of 73.64% was obtained. The KMO measure of sampling adequacy was 0.77, representing
good sampling adequacy The p-value of Bartlett’s test of sphericity was calculated as <0.001,
which is an indication of a sufficiently large correlation between the items, making it suitable
to perform an exploratory factor analysis. The communalities varied between 0.51 and 0.78.
The construct validity of the statements used to measure cost consciousness was thus
confirmed.
5.4.2.4 Recreation
The statements used to measure the level of respondents’ health consciousness comprised
of items C4.1-C4.4. By conducting a confirmatory factor analysis on these items, a variance
of 79.42% was obtained. The KMO measure of sampling adequacy was 0.56, indicating
mediocre sampling adequacy The p-value of Bartlett’s test of sphericity was calculated as
<0.001, which is an indication of a sufficiently large correlation between the items, making it

133
suitable to perform an exploratory factor analysis. The communalities varied between 0.39
and 0.75. The construct validity of the statements used to measure cost consciousness was
thus confirmed.
5.4.2.5 E-shopping
The statements used to measure the level of E-shopping comprised of items C5.1-C5.7. By
conducting a confirmatory factor analysis on these items, a variance of 76.19% was obtained.
The KMO measure of sampling adequacy was 0.87, representing a great sampling adequacy
The p-value of Bartlett’s test of sphericity was calculated as <0.001, which is an indication of
a sufficiently large correlation between the items, making it suitable to perform an exploratory
factor analysis. The communalities varied between 0.27 and 0.80. The construct validity of the
statements used to measure E-shopping was thus confirmed.
5.4.2.6 Career orientation
The statements used to measure the level of respondents’ career orientation comprised of
items C6.1-C6.5. By conducting a confirmatory factor analysis on these items, a variance of
50.57% was obtained. The KMO measure of sampling adequacy was 0.74, indicating good
sampling adequacy The p-value of Bartlett’s test of sphericity was calculated as <0.001, which
is an indication of a sufficiently large correlation between the items, making it suitable to
perform an exploratory factor analysis. The communalities varied between 0.09 and 0.65. The
construct validity of the statements used to measure career orientation was thus confirmed.
Main finding C3: The confirmatory factor analysis indicated that the statements in section C
of the questionnaire are valid for measuring the lifestyle dimensions of respondents.
5.4.3 Lifestyle dimensions
The scales used to determine the lifestyle dimensions of respondents’ made use of a 7-point
Likert scale to rate the response to each of the scale’s 12 items, where 1 = disagree strongly,
2 = disagree moderately, 3 = disagree a little, 4 = neither agree nor disagree, 5 = agree a little,
6 = agree moderately and 7 = agree strongly. Considering the response options, the following
four independent groups were identified:
Respondents who responded between 1 and 3 were placed in a group representing low
levels of agreement.

134
Respondents who responded between 3 and 4 were placed in a group representing
moderately low levels of agreement.
Respondents who responded between 4 and 5 were placed in a group representing
moderately high levels of agreement.
Respondents who responded between 5 and 7 were placed in a group representing high
levels of agreement.
The mean and standard deviation (SD) derived from the respondents’ responses with regards
to this section of the questionnaire are listed in Table 5-5.
Table 5-5: Mean and standard deviation of the lifestyle dimensions
According to Table 5-5, five out of six lifestyle dimensions present moderately high levels of
agreement. Fashion consciousness presented a moderately low level of agreement
(mean=3.64). A moderately high level of agreement (mean=4.80) exists among respondents
in terms of cost consciousness. Health consciousness (mean=4.89), recreation (mean=4.68),
E-shopping (mean=4.03) and career orientation (mean=4.32) represent moderately high
levels of agreement among respondents. The standard deviation of all the lifestyle dimensions
was relatively low, ranging between 1.27 and 1.52, indicating that there was little difference in
the responses provided by the respondents.
Lifestyle dimension Mean Standard deviation
C1: Fashion consciousness 3.64 1.52
C2: Cost consciousness 4.80 1.40
C3: Health consciousness 4.89 1.52
C4: Recreation 4.68 1.18
C5: E-shopping 4.03 1.34
C6: Career orientation 4.32 1.27

135
Main finding C4: A moderately low level of fashion consciousness was found among
respondents.
Main finding C5: A moderately high level of cost consciousness was found among
respondents.
Main finding C6: A moderately high level of health consciousness was found among
respondents.
Main finding C7: A moderately high level of recreation was found among respondents.
Main finding C8: A moderately high level of E-shopping was found among respondents.
Main finding C9: A moderately high level of career orientation was found among respondents.
5.5 RESULTS OBTAINED FROM SECTION D OF THE QUESTIONNAIRE:
DEMOGRAPHIC INFORMATION
Demographic profiles of respondents were compiled by considering the information obtained
from section D of the questionnaire.
5.5.1 Demographic profiles of respondents
In order to determine the demographic profiles of respondents effectively, their age, monthly
income, gender and level of education were considered. In this section, the symbol “F” is the
abbreviation for frequency and the symbol “%” is used to refer to percentage.
A sample of 207 was realised. Questions that were not answered by respondents have been
indicated at the frequency count of each question in section D. Table 5-6 presents the
demographic information used to construct the sample profile.

136
Table 5-6: Demographic profile of respondents
Variable Frequency Percentage
Age
18 to 29 years 122 59.2%
30 to 39 years 49 23.8%
40 to 49 years 21 10.2%
50 to 59 years 7 3.4%
60 years or older 7 3.4%
Total 206
Frequency missing 1
Monthly disposable income
Less than R10 000 pm 70 34.1%
R11 000 to R20 000 pm 59 28.8%
R21 000 to R30 000 pm 30 14.6%
R31 000 to R 40 000 pm 20 9.8%
More than R40 000 pm 8 3.9%
Prefer not to say 18 8.8%
Total 205
Frequency missing 2
Gender
Male 75 36.4%
Female 123 59.7%
Prefer not to say 8 3.9%
Total 206
Frequency missing 1
Level of education
Primary school 2 1.0%
Matric/Grade 12 completed 57 27.5%
Technical college diploma 29 14.0%
University or technology diploma 28 13.5%
University degree (B-degree or Honours) 74 35.7%
Postgraduate degree (Masters or Doctorate) 12 5.8%
Total 202
Frequency missing 5

137
With regards to demographic variables, the sample primarily consisted of respondents who
are between the ages of 18 and 29 years of age (59.2%). Thirty-four percent of respondents
are aged between the ages of 30 and 49 (23.8% + 10.2%). Respondents who are 50 years of
age and older represent only 6.8% (3.4% + 3.4%) of the sample.
The monthly disposable income of the majority of the respondents ranged between R10 000
pm to R30 000 pm (34.1% + 28.8% + 14.6% = 77.5%). Twenty respondents account for the
9.8% who earn between R31 000 and R40 000 pm, with only 8.8% of the respondents
preferring not to indicate their monthly disposable income.
More female (59.7%) than male respondents (36.4%) participated in the study, with 3.9% of
the respondents who have chosen not to indicate their gender.
Regarding the level of education among respondents, 35.7% had a university or postgraduate
degree, 13.5% had a university or technology diploma, 14.0% had a technical college diploma
and 27.5% only had a matric certificate.
5.6 THE UNDERLINING RELATIONSHIP BETWEEN THE VARIOUS LIFESTYLE
DIMENSIONS
In order to identify the underlining relationship between the various lifestyle dimensions of
respondents in terms of fashion consciousness (FC), cost consciousness (CC), health
consciousness (HC), recreation (R), E-shopping (E-s) and career orientation (CO), Pearson
product-moment correlation coefficients were determined. Table 5-6 illustrates the correlations
that emerged between the various lifestyle dimensions.
Table 5-7: Pearson correlation coefficients between the various lifestyle
dimensions of Singletons
FC CC HC R E-s CO
FC (C1.1 - C1.10)
Pearson correlation
1 -0,005 0.321** 0.413** 0.433** 0.191**
Sig. (2-tailed)
0,948 0,000 0,000 0,000 0,006
CC (C2.1 - C2.5)
Pearson correlation
-0,005 1 0.152* 0,023 -0,070 0.147*
Sig. (2-tailed)
0,948 0,029 0,745 0,314 0,036

138
Table 5-8: Pearson correlation coefficients between the various lifestyle dimensions
of Singletons (continued)
FC CC HC R E-s CO
HC (C3.1 - C3.4)
Pearson correlation
.321** .152* 1 0.234** 0.252** 0.224**
Sig. (2-tailed)
0,000 0,029 0,001 0,000 0,001
R (C4.1 - C4.4)
Pearson correlation
.413** 0,023 .234** 1 0.416** -0,016
Sig. (2-tailed)
0,000 0,745 0,001 0,000 0,819
E-s (C5.1 - C5.7)
Pearson correlation
.433** -0,070 .252** .416** 1 -0,016
Sig. (2-tailed)
0,000 0,314 0,000 0,000 0,824
CO (C6.1 - C6.5)
Pearson correlation
.191** .147* .224** -0,016 -0,016 1
Considering Table 5-7 it can be deduced that there is a medium statistically significant effect
between the following dimensions:
Fashion consciousness & Health consciousness – 0.32
Fashion consciousness & Recreation – 0.41
Health consciousness & E-shopping – 0.31
Fashion consciousness & E-shopping – 0.43
Recreation & E-shopping – 0.42
A small statistically significant effect was found between the following dimensions:
Fashion consciousness & Cost consciousness – 0.19
Career orientation & Health consciousness – 0.15
Cost consciousness & Career orientation – 0.14
Health consciousness & Recreation – 0.23
Health consciousness & Career orientation – 0.22
No statistically significant effect was found between the following dimensions:
Fashion consciousness & Cost consciousness
Cost consciousness & Recreation
Cost consciousness & E-shopping
Recreation & Career orientation

139
E-shopping & Career orientation
Main finding D1: A practically significant relationship was found between fashion
consciousness & health consciousness.
Main finding D2: A practically significant relationship was found between fashion
consciousness & recreation.
Main finding D3: A practically significant relationship was found between fashion
consciousness & E-shopping.
Main finding D4: A practically significant relationship was found between recreation & E-
shopping.
Main finding D5: A practically significant relationship was found between health
consciousness & E-shopping.
5.7 THE UNDERLINING RELATIONSHIP BETWEEN THE LEVEL OF REFERENCE
GROUPS INFLUENCE AND THE LIFESTYLE DIMENSIONS OF SINGLETONS
The underlining relationship between the reference group (RG) construct and the six
dimensions of lifestyle – fashion consciousness (FC), cost consciousness (CC), health
consciousness (HC), recreation (R), E-shopping (E-s) and career orientation (CO), were
determined by calculating the Pearson product-moment correlation coefficient. Table 5-7
presents the results.

140
Table 5-9: Pearson correlation coefficients between reference groups and the
lifestyle dimensions of Singletons
From Table 5-8 it can be deduced that there is a statistically significant effect between
reference groups and fashion consciousness (0.64) as well as reference groups and E-
shopping (0.52). Reference groups and recreation presented a medium statistically significant
effect of 0.38, whilst no statistically significant effect was found between reference groups and
cost consciousness; reference groups and health consciousness; and reference groups and
career orientation.
RG FC CC HC R E-s CO
RG
(B1.1 - B1.12)
Pearson correlation
1 .645** -0,096 .213** .383** .518** 0,078
Sig. (2-tailed)
0,000 0,170 0,002 0,000 0,000 0,270
FC (C1.1 - C1.10)
Pearson correlation
.645** 1 -0,005 .321** .413** .433** .191**
Sig. (2-tailed)
0,000 0,948 0,000 0,000 0,000 0,006
CC (C2.1 - C2.5)
Pearson correlation
-0,096 -0,005 1 .152* 0,023 -0,070 .147*
Sig. (2-tailed)
0,170 0,948 0,029 0,745 0,314 0,036
HC (C3.1 - C3.4)
Pearson correlation
.213** .321** .152* 1 .234** .252** .224**
Sig. (2-tailed)
0,002 0,000 0,029 0,001 0,000 0,001
R (C4.1 - C4.4)
Pearson correlation
.383** .413** 0,023 .234** 1 .416** -0,016
Sig. (2-tailed)
0,000 0,000 0,745 0,001 0,000 0,819
E-s (C5.1 - C5.7)
Pearson correlation
.518** .433** -0,070 .252** .416** 1 -0,016
Sig. (2-tailed)
0,000 0,000 0,314 0,000 0,000 0,824
CO (C6.1 - C6.5)
Pearson correlation
0,078 .191** .147* .224** -0,016 -0,016 1
Sig. (2-tailed)
0,270 0,006 0,036 0,001 0,819 0,824

141
Main finding D6: A statistically significant relationship was found between reference groups
and fashion consciousness.
Main finding D7: A statistically significant relationship was found between reference groups
and E-shopping.
Main finding D8: A practically significant relationship was found between reference groups
and recreation.
5.8 THE DIFFERENCE IN PERCEPTION OF REFERENCE GROUP INFLUENCE AND
THE LIFESTYLE DIMENSIONS OF SINGLETONS WITH REGARDS TO THEIR
DEMOGRAPHIC DIFFERENCES
Cohen’s effect sizes were determined in order to establish whether statistically significant
differences exist between respondents in terms of their demographic differences, with
reference to their perceptions of reference group influence and the various lifestyle
dimensions. The practically significant differences of the demographical categories such as
age, income gender and level of education are discussed below.
5.8.1 Demographic differences: Age
In order to ensure that the age categories used to determine practical significance are
sufficient in size, only the following age categories were considered: (1) 18 to 29 years; (2) 30
to 39 years; (3) 30 to 39 years; and 40 to 49 years. The last two categories of 50 to 59 years
and 60 to 69 years were discarded. Table 5-8 indicates the means, standard deviation and
effect sizes when comparing the perceptions of respondents by examining the demographic
variables in terms of the respondents’ age categories to determine their practical significance
when compared to reference groups (RG) and the six lifestyle dimensions.

142
Table 5-10: Cohen’s effect sizes of the difference in perceptions of reference
groups influence and the lifestyle dimensions of Singletons with
regards to the different age cohorts
Age
Age category N Mean
Std. deviation
Sig. Effect size - Age categories
1 vs 2 1 vs 3 2 vs 3
RG (B1.1 - B1.12)
1 122 3,79 1,51 0,21 0,05 0,42 0,37
2 49 3,72 1,40
3 21 3,17 1,33
Total 192 3,70 1,47
FC (C1.1 - C1.10)
1 122 3,64 1,53 0,35 0,21 0,14 0,34
2 49 3,94 1,53
3 21 3,42 1,47
Total 192 3,69 1,53
CC (C2.1 - C2.5)
1 122 4,58 1,33 0,08 0,27 0,42 0,13
2 49 4,97 1,31
3 21 5,15 1,62
Total 192 4,74 1,37
HC (C3.1 - C3.4)
1 122 4,86 1,48 0,51 0,08 0,23 0,30
2 49 4,74 1,53
3 21 5,20 1,69
Total 192 4,87 1,52
R (C4.1 - C4.4)
1 122 4,66 1,22 0,99 1,01 0,02 1,01
2 49 4,68 1,15
3 21 4,69 1,30
Total 192 4,67 1,20
E-s (C5.1 - C5.7)
1 122 4,30 1,23 0,02 0,27 0,60 0,30
2 49 3,90 1,34
3 21 3,52 1,47
Total 192 4,11 1,30
CO (C6.1 - C6.5)
1 121 4,11 1,29 0,03 0,31 0,49 0,12
2 49 4,56 1,17
3 20 4,71 1,05
Total 190 4,29 1,25
Considering Table 5-9, it can be observed that medium significant effect sizes were found
between the three age categories in terms of reference group influence and the various
lifestyle dimensions.

143
Reference groups
Age category one (mean= 3,79) and age category two (mean=3.72) had a small effect size,
indicating that respondents in these two categories experienced the same level of reference
group effect. A difference of medium effect was found between age categories one and three
(mean=3.17) as well as age categories two and three. It can be deduced that the respondents
from age category one and age category two experienced a greater level of influence of
reference groups compared to respondents in age category three.
Fashion consciousness
There was a practically significant difference between age category one (mean=3.64) and age
category two (mean=3.94) as well as age category one (mean=3.64) and age category three
(mean=3.42) in terms of fashion consciousness. A difference of medium effect between age
category two (mean=3.94) and age category three (mean=3.42) respondents was found.
Therefore, the respondents in age category two are more fashion conscious than the
respondents in age category one and three.
Cost consciousness
Age category one (mean=4.58) and age category three (mean=5.15) exerted a difference of
medium effect concerning the level of cost consciousness. Practically significant differences
were found between age category one (mean=4.58) and age category two (mean=4.97) as
well as between age category two (mean=4.97) and age category three (mean=5.15)
respectively. Respondents in age category two and three are less cost-conscious than the
respondents in age category one.
Health consciousness
Respondents in age category one (mean=4.86) and age category two (mean=4.74) had an
effect size of 0.08, indicating that respondents in these two categories experience health
consciousness similarly. Respondents in age category three (mean=5.20) are more health
conscious than respondents in age categories one and two.
Recreation
Respondents in age category one (mean=4.66) and age category two (mean=4.68) both
exerted great effect sizes of 1.01, while a small to no effect was found between age category
one (mean=4.66) and age category three (mean=4.69) respondents with an effect size of 0.02.

144
E-shopping
A medium, leaning towards a great effect of 0.60 was found between respondents in age
category one (mean=4.30) and age category three (mean=3.52) respectively. Respondents
from age category two (mean=3.90) are more willing to shop online than respondents in age
category one and three.
Career orientation
In terms of career orientation, respondents in age categories two (mean=4.56) and three
(mean=4.71) were found to be more career orientated than respondents in age category one
(mean=4.11). A small effect size of 0.12 was identified between age categories two and three,
whilst medium effect sizes were found between age categories one and two (0.31) and age
categories one and three (0.49).
Main finding E1: Respondents who are between the ages of 18 and 29 and respondents
between the ages of 30 and 39 are significantly more influenced by reference groups than the
respondents between the ages of 40 and 49.
Main finding E2: Respondents between the ages of 30 and 39 were found to be more fashion
conscious than those between the ages of 18 and 29 and 40 to 49 respectively.
Main finding E3: Respondents between the ages of 30 and 39 and 40 and 49 are more cost
conscious than the respondents between the ages of 18 and 29.
Main finding E4: Respondents between 30 and 39 years of age are the least health
conscious, with respondents between the ages of 40 and 49 being the most health conscious.
Main finding E5: The respondents of all three age categories thoroughly enjoy and participate
in recreational activities. Respondents between 40 to 49 of age enjoy these the most.
Main finding E6: Respondents between the ages of 18 and 29 found the concept of E-
shopping more appealing than respondents aged between 30 and 49 of age.
Main finding E7: Respondents between the ages of 30 and 39 and 40 and 49 are more career
orientated than respondents between the ages of 18 and 29.

145
5.8.2 Demographic differences: Monthly income
To determine the practical significance with regards to the monthly income of respondents,
only the following categories were considered to ensure that the number of responses are
sufficiently large: (1) Less than R10 000 pm;(2) R11 000 – R20 000 pm;(3) R21 000 – R30 000
pm; and (4) R31 000 – R40 000 pm or more. Table 5-10 indicates the means, standard
deviation and effect sizes when comparing the perceptions of respondents, by examining the
demographic variables in terms of respondents’ monthly income, in order to determine the
practical significance between reference groups and the six lifestyle dimensions.

146
Table 5-11: Cohen’s effect sizes of difference in perceptions of reference group influence and the lifestyle dimensions of
Singletons with regards to their monthly income
Monthly income
N Mean Std.
Deviation Sig.
Effect size - Income categories
Category 1 vs 2 1 vs 3 1 vs 4 2 vs 3 2 vs 4 3 vs 4
Reference groups (B1.1 - B1.12)
1 70 3,63 1,39 0,93 0,07 0,06 0,04 0,13 0,11 0,02
2 59 3,53 1,41
3 30 3,72 1,55
4 28 3,69 1,68
Total 187 3,62 1,46
Fashion consciousness (C1.1 - C1.10)
1 70 3,45 1,46 0,57 0,11 0,14 0,31 0,04 0,21 0,17
2 59 3,61 1,50
3 30 3,67 1,30
4 28 3,92 1,79
Total 187 3,61 1,50
Cost Consciousness (C2.1 - C2.5)
1 70 4,85 1,39 0,73 0,07 0,18 0,01 0,24 0,06 0,20
2 59 4,94 1,32
3 30 4,59 1,33
4 28 4,86 1,72
Total 187 4,84 1,41
Health consciousness (C3.1 - C3.4)
1 70 4,84 1,59 0,27 0,07 0,04 0,37 0,03 0,44 0,41
2 59 4,73 1,42
3 30 4,78 1,30
4 28 5,40 1,77
Total 187 4,88 1,53

147
Table 5-10: Cohen’s effect sizes of difference in perceptions of reference group influence and the lifestyle dimensions of
Singletons with regards to their monthly income (continued)
Monthly income
N Mean Std.
Deviation Sig.
Effect size - Income categories
Category 1 vs 2 1 vs 3 1 vs 4 2 vs 3 2 vs 4 3 vs 4
Recreation (C4.1 - C4.4)
1 70 4,50 1,23 0,52 0,18 0,10 0,31 0,08 0,13 0,21
2 59 4,71 1,12
3 30 4,62 0,81
4 28 4,86 1,28
Total 187 4,64 1,15
E-shopping (C5.1 - C5.7)
1 70 4,18 1,19 0,47 0,26 0,14 0,25 0,12 0,01 0,11
2 59 3,83 1,29
3 30 3,99 1,38
4 28 3,85 1,63
Total 187 3,99 1,32
Career Orientation (C6.1 - C6.5)
1 69 3,79 1,40 0,01 0,60 0,59 1,13 0,01 0,53 0,54
2 59 4,51 1,03
3 30 4,51 0,95
4 27 5,16 1,27
Total 185 4,34 1,29

148
From Table 5-10 it is clear that medium and sufficient effect sizes were obtained between the
monthly income categories of respondents and the health consciousness and career
orientation lifestyle dimensions. Insignificant effect sizes were identified in reference groups,
fashion consciousness, cost consciousness, recreation and E-shopping and these will thus
not be discussed.
Health consciousness
Respondents in category one (mean=4.84) and category four (mean=5.40) had a difference
of medium effect of 0.37. A difference of medium effect was found between monthly income
category two (mean=4.73) and monthly income category four (mean=5.40) of 0.44 as well as
between monthly income category three and four with a medium effect six of 0.41.
Respondents in monthly income category three and four have more disposable income to
spend on maintaining a healthy lifestyle.
Career orientation
Considering the monthly income categories and career orientation dimension, the following
can be deduced: a difference of medium effect leaning towards a great effect was found
between monthly income category 1 (mean=3.79) and monthly income category 2
(mean=4.51), having an effect size of 0.60. Monthly income categories 1 and 3 (mean=4.51)
had a medium difference in effect of 0.59. Income categories 2 (mean=4.51) and 4
(mean=5.16) had a medium effect of 0.53, where a difference of medium effect was also found
between income categories 3 and 4. A difference of great effect - 1.13, was found between
income categories 1 and 4.
Main finding E8: Respondents with a monthly income of less than R10 000 pm and those
earning R31 000 and more per month were more health conscious than the respondents in
the other income categories.
Main finding E9: Respondents with a monthly income of R31 000 and more are the most
career orientated.

149
5.8.3 Demographic differences: Highest level of education
For the purpose of this section of the questionnaire, only five out of the six educational levels
were considered. The question pertaining to the primary schooling among respondent was
discarded as only two respondents were placed in this category. The following categories were
considered in determining the effect sizes of the respondents with regards to their highest
level of education:
1. Level of education category one: Primary school completed
2. Level of education category two: Matric/ Grade 12 completed
3. Level of education category three: Technical College diploma
4. Level of education category four: University or Technology diploma
5. Level of education category five: University degree (B-degree or Honours)
6. Level of education category six: Post Graduate degree (Masters or Doctors)
As previously mentioned, no effects and small effects (0.2) are to be observed in table 5-11,
as only medium (0.35) and great effects (0.8) will be discussed. Table 5-11 presents the
means, standard deviations and effect size when comparing the perceptions of the
respondents by examining the demographic variable in terms of the level of education of the
respondents, to determine the practical significance between reference groups and the six
lifestyle dimensions.

150
Table 5-12: Cohen’s effect sizes of the difference in perceptions of reference group influence and the lifestyle dimensions of
Singletons with regards to their level of education
Education
N Mean Std.
Deviation Sig.
Effect size - Level of education
Category 2 vs
3 2 vs
4 2 vs
5 2 vs
6 3 vs
4 3 vs
5 3 vs
6 4 vs
5 4 vs
6 5 vs
6
Reference groups (B1.1 - B1.12)
2 57 3,70 1,60 0,33 0,02 0,35 0,12 0,34 0,32 0,09 0,36 0,23 0,69 0,46
3 29 3,66 1,62
4 28 3,19 1,44
5 74 3,53 1,33
6 12 4,20 1,31
Total 200 3,59 1,47
Fashion consciousness (C1.1 - C1.10)
2 57 3,65 1,69 0,26 0,19 0,12 0,16 0,42 0,31 0,35 0,23 0,04 0,54 0,58
3 29 3,94 1,24
4 28 3,48 1,55
5 74 3,41 1,39
6 12 4,29 1,96
Total 200 3,62 1,53
Cost consciousness (C2.1 - C2.5)
2 57 4,83 1,33 0,19 0,36 0,11 0,16 0,07 0,25 0,53 0,29 0,27 0,03 0,24
3 29 5,33 1,32
4 28 4,98 1,27
5 74 4,61 1,46
6 12 4,93 1,34
Total 200 4,85 1,38

151
Table 5-11: Cohen’s effect sizes of the difference in perceptions of reference group influence and the lifestyle dimensions of
Singletons with regards to their level of education (continued)
Health consciousness (C3.1 - C3.4)
2 57 4,80 1,70 0,70 0,26 0,06 0,02 0,25 0,19 0,27 0,01 0,08 0,19 0,27
3 29 5,20 1,35
4 28 4,90 1,72
5 74 4,78 1,38
6 12 5,19 1,55
Total 200 4,89 1,53
Recreation (C4.1 - C4.4)
2 57 4,77 1,44 0,50 0,02 0,16 0,15 0,37 0,14 0,13 0,39 0,01 0,53 0,52
3 29 4,74 1,12
4 28 4,58 1,27
5 74 4,59 0,97
6 12 5,21 1,06
Total 200 4,70 1,19
E-shopping (C5.1 - C5.7)
2 57 4,14 1,39 0,07 0,18 0,51 0,02 0,40 0,33 0,16 0,57 0,49 0,90 0,41
3 29 3,90 1,45
4 28 3,46 1,84
5 74 4,12 1,05
6 12 4,67 0,99
Total 200 4,03 1,36
Career orientation (C6.1 - C6.5)
2 56 3,85 1,45 0,00 0,82 0,43 0,44 0,83 0,39 0,38 0,01 0,01 0,40 0,39
3 29 4,86 1,11
4 28 4,38 1,12
5 73 4,39 1,17
6 12 4,87 0,73
Total 198 4,33 1,26

152
Reference groups:
Table 5-11 indicated that the following education categories had a medium effect size:
Education category 2 (mean=3.66) and 4 (mean=3.53) – 0.35
Education category 3 (mean=3.19) and 6 (mean=4.20) – 0.36
Education category 5 (mean=3.53) and 6 (mean=4.20) – 0.46
A medium, leaning towards a great effect size of 0.69 was found between education category 4
(mean=3.53) and education category 6 (mean=4.20).
Fashion consciousness:
A medium effect of difference in practical significance was found between the following education
categories in terms of fashion consciousness:
Education category 2 (mean=3.94) and 6 (mean=4.29) – 0.42
Education category 3 (mean=3.48) and 5 (mean=3.41) – 0.35
Education category 4 (mean=3.48) and 6 (mean=4.29) – 0.54
Education category 5 (mean=3.41) and 6 (mean=4.29) – 0.58
Cost consciousness:
Education category 2 (mean=5.33) and 3 (mean=4.980 had a medium statistical significant
difference of 0.36, where the education categories 3 (mean=4.98) and 5 (mean=4.61) also had a
medium effect size of 0.53.
Recreation:
Respondents in education category 2 (mean=4.74) and 6 (mean=5.21) had a difference of
medium effect of 0.37. A similar effect size of 0.39 was found between education categories 3
(mean=4.58) and 6 (mean=5.21). Similar differences in effect size was also found between
education categories 4 and 6 – 0.53 and education categories 5 and 6 – 0.52.

153
E-shopping:
A difference of great effect of 0.90 was found between education categories 4 (mean=4.12) and
6 (mean=4.67). Difference of medium effect was found between the following education
categories in terms of E-shopping:
Education category 2 (mean=4.14) and 4 (mean=3.46) – 0.51
Education category 2 (mean=4.14) and 6 (mean=4.67) – 0.40
Education category 3 (mean=3.90) and 6 (mean=4.67) – 0.57
Education category 4 (mean=3.46) and 5 (mean=4.12) – 0.49
Education category 5 (mean=4.12) and 6 (mean=4.67) – 0.41
Career orientation:
There was a practically significant difference with medium effect between the following education
categories in terms of the level of education among the respondents and the lifestyle dimensions:
Education category 2 (mean=3.85) and 4 (mean=4.38) – 0.43
Education category 2 (mean=3.82) and 5 (mean=4.39) – 0.44
Education category 3 (mean=4.86) and 4 (mean=4.38) – 0.39
Education category 3 (mean=4.86) and 5 (mean=4.39) – 0.38
Education category 5 (mean=4.39) and 6 (mean=4.87) – 0.39
A great effect of 0.82 was found between education category 2 and 3, with a similar effect size of
0.83 between education categories 2 and 6.
Main finding E10: Respondents who were influenced by reference groups the most had
completed matric and have obtained Postgraduate degrees.
Main finding E11: Respondents with a Technical college diploma and respondents who obtained
Postgraduate degrees are more fashion conscious.
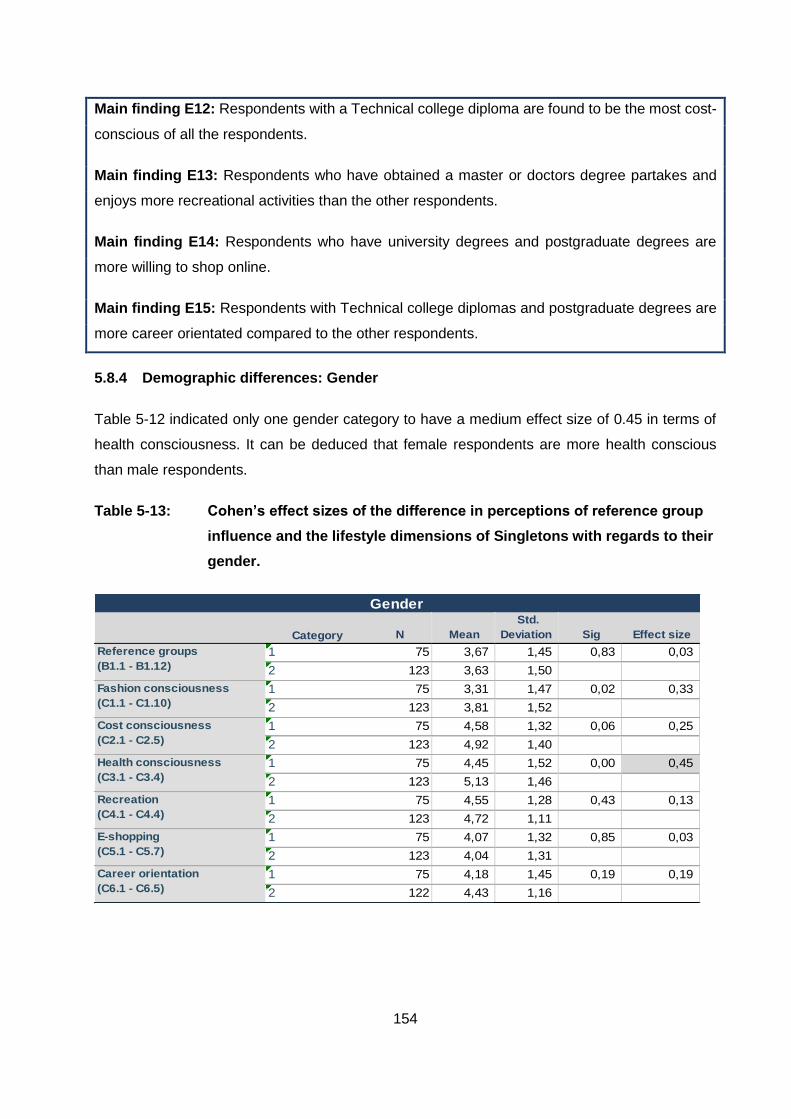
154
Main finding E12: Respondents with a Technical college diploma are found to be the most cost-
conscious of all the respondents.
Main finding E13: Respondents who have obtained a master or doctors degree partakes and
enjoys more recreational activities than the other respondents.
Main finding E14: Respondents who have university degrees and postgraduate degrees are
more willing to shop online.
Main finding E15: Respondents with Technical college diplomas and postgraduate degrees are
more career orientated compared to the other respondents.
5.8.4 Demographic differences: Gender
Table 5-12 indicated only one gender category to have a medium effect size of 0.45 in terms of
health consciousness. It can be deduced that female respondents are more health conscious
than male respondents.
Table 5-13: Cohen’s effect sizes of the difference in perceptions of reference group
influence and the lifestyle dimensions of Singletons with regards to their
gender.
Category N Mean
Std.
Deviation Sig Effect size
1 75 3,67 1,45 0,83 0,03
2 123 3,63 1,50
1 75 3,31 1,47 0,02 0,33
2 123 3,81 1,52
1 75 4,58 1,32 0,06 0,25
2 123 4,92 1,40
1 75 4,45 1,52 0,00 0,45
2 123 5,13 1,46
1 75 4,55 1,28 0,43 0,13
2 123 4,72 1,11
1 75 4,07 1,32 0,85 0,03
2 123 4,04 1,31
1 75 4,18 1,45 0,19 0,19
2 122 4,43 1,16
Gender
Recreation
(C4.1 - C4.4)
E-shopping
(C5.1 - C5.7)
Career orientation
(C6.1 - C6.5)
Reference groups
(B1.1 - B1.12)
Fashion consciousness
(C1.1 - C1.10)
Cost consciousness
(C2.1 - C2.5)
Health consciousness
(C3.1 - C3.4)

155
Main finding E16: Female respondents are more health conscious than male respondents.
Main finding E17: Male respondents experience a greater influence from reference groups than
female respondents.
Main finding E18: Female respondents are more fashion conscious than male respondents.
Main finding E19: Female respondents enjoy and partake in recreational activities more than
male respondents.
Main finding E20: Female respondents are more cost-conscious than male respondents.
Main finding E21: Male respondents enjoy E-shopping more than female respondents.
Main finding E22: Female respondents are more career orientated than male respondents.
5.9 CONCLUSION
This chapter presented the results obtained from the questionnaire, with regard to determining
the effect of reference groups and lifestyle on the buying behaviour of Singletons. The results of
each section was presented along with the main findings thereof. The secondary research
objectives were linked to the main findings of the study. Chapter 6 provides conclusions based
on the results in this chapter, along with recommendations, the limitations of this study and
suggestions for future studies.

156
CHAPTER 6: CONCLUSIONS, RECOMMENDATIONS AND
LIMITATIONS
6.1 INTRODUCTION
Chapter 6 provides a brief overview of the research study, after which the conclusions and
recommendations pertaining to the objectives of the study are presented. Marketers and
organisations can utilise the recommendations, as they are based on the main findings of the
study and will, therefore, help marketers to target the Singletons consumer segment in South
Africa. The chapter concludes by discussing the limitations of the study, along with suggestions
for future research in the field.
6.2 OVERVIEW
The effect of reference groups and lifestyle on the buying behaviour of Singletons was the primary
objective of this study. The primary constructs of the study, namely consumer behaviour (chapter
2), reference groups (chapter 2), segmentation (chapter 3) and lifestyle (chapter 3) were
discussed and analysed in the literature review in order to gain a more profound understanding
of the theoretical bases of this study.
Chapter 2 focused on consumer behaviour and how, what, when, where and why consumers
purchase, use, evaluate and dispose of the products and services that they consume in order to
satisfy their wants and needs (cf. Sankar & Zakkariya, 2016:20). An elaboration on consumer
behaviour was provided by discussing consumer decisions; the decision-making process; and the
various influences on the decision-making process. Reference groups are considered to be one
of the primary external influences on the buying behaviour and decision-making process of
Singletons. Reference groups, as defined by Irelan and Considine (2015:3), refer to the groups
or individuals that a person uses as a basis for comparison and guidance when deciding on the
product or service that they wish to purchase. Reference groups, as one of the main constructs
of this study, were discussed by examining the different types of reference groups, their marketing
implications and the strength of their influence exerted on the buying behaviour of consumers.
This study made use of the SUSCEP scale to measure the effect of reference groups on
Singletons. The SUSCEP scale was developed by Bearden et al. (1989), after which its validity
and reliability were confirmed.
Chapter 3 focused on the market segmentation process by elaborating on the criteria used to
successfully segment a market. Joubert (2013:97) asserts that segmenting a market is a process

157
whereby heterogeneous markets are divided into homogeneous subsets, where the consumers
all have similar wants and needs. Market segmentation is thus an important concept for
marketers, as it allows them to focus all their efforts and resources on developing and selling
products and services to a well-defined group of consumers. The literature overview in this
chapter of the study focused on elaborating on the various factors that influence market
segmentation, along with the bases used when segmenting a market. This study incorporated
psychographic segmentation as a base for market segmentation. Psychographic segmentation
comprises numerous variables such as social class, values and attitudes, personality and lifestyle
(Armstrong & Kotler, 2011:204; Schiffman & Kanuk, 2014:52). Lifestyle segmentation is regarded
as one of the main constructs of the study, as this entails the manner in which consumers are
segmented based on the way they spend their time and money. According to Nasiopoulos
(2015:4), the lifestyle psychographic variable is the most popular variable that marketers use to
segment markets. A consumer’s mode of living is represented by his or her lifestyle and entails
the activities, interests and opinions (AIO’s) in which they participate. This study aimed at
identifying and describing the lifestyle of Singletons in order to establish the effect thereof on the
consumer segment’s buying behaviour. The AIO (activities, interests and opinions) approach is
based on various statements that measure different lifestyle dimensions of respondents. Six
lifestyle dimensions of Singletons were analysed in this study, including fashion consciousness,
cost consciousness, health consciousness, recreation, E-shopping and career orientation.
6.3 ANSWERING THE RESEARCH OBJECTIVES
In this section, answers are provided to the research objectives that were formulated for the
present study. In order to address the primary objective of this study, which is to determine the
effect of reference groups and lifestyle on the buying behaviour of Singletons, 12 secondary
objectives were formulated. Table 6-1 provides an indication as to how the study’s research
objectives are linked to the literature review and the empirical study.

158
Table 6-1: Summary of the links between the research objectives, literature review
and empirical study
The following section provides the conclusions and recommendations for each research
objective. The conclusions and recommendations were drawn on the empirical results presented
in Chapters 4 and 5, as well as the literature review presented in Chapters 2 and 3.
Research objectives
Literature review
Empirical study
Primary objective
To determine the effect of reference groups and lifestyle on the buying behaviour of Singletons.
Chapters 2 and 3.
Questions: B1-12, C1.1-C6.5, D1-D5.
Secondary objectives
1. To provide an overview of the research literature related to the main constructs of this study, namely consumer behaviour, reference groups, market segmentation and lifestyle segmentation.
Chapters 2 and 3.
-
2. To develop a demographic profile of consumers who form part of the Singletons market segment and who participated in this study.
Chapter 3. Questions: D1-D5.
3. To determine the extent to which reference groups have an effect on the buying behaviour of Singletons.
Chapter 2. Questions: B1-B12.
4. To determine the lifestyle of Singletons in terms of fashion-consciousness.
Chapter 3. Questions: C1.1-C1.10.
5. To determine the lifestyle of Singletons in terms of cost-consciousness.
Chapter 3. Questions: C2.1-C2.5.
6. To determine the lifestyle of Singletons in terms of health orientation.
Chapter 3. Questions: C3.1-C3.4.
7. To determine the lifestyle of Singletons in terms of recreation.
Chapter 3. Questions: C4.1-C4.4.
8. To determine the lifestyle of Singletons in terms of E-shopping.
Chapter 3. Questions: C5.1-C5.7.
9. To determine the lifestyle of Singletons in terms of career orientation.
Chapter 3. Questions: C6.1-C6.5.
10. To determine the underlying relationships between the various lifestyle dimensions of Singletons.
Chapter 3. Questions: C1.1-C6.5.
11. To determine the underlying relationships between the level of reference group effect and the lifestyle dimensions of Singletons.
Chapters 2 and 3.
Questions: B1-B12, C1.1-C6.5.
12. To determine the difference in perceptions of reference groups’ influence and the lifestyle dimensions of Singletons with regards to their demographic differences.
Chapters 2 and 3.
Questions: B1-B12, C1.1-C6.5, D1-D5.

159
6.4 CONCLUSIONS AND RECOMMENDATION
This section indicates the secondary objectives that were set out to achieve the primary objective,
by discussing the conclusions and recommendations.
6.4.1 Secondary research objective 1
The aim of secondary research objective 1 was to provide an overview of the research literature
related to the main constructs of the study, namely consumer behaviour, reference groups, market
segmentation and lifestyle segmentation. Table 6.2 presents the conclusions pertaining to this
objective.
Table 6-2: Conclusions to secondary objective 1
6.4.2 Secondary research objective 2
The aim of secondary research objective 2 was to develop a demographic profile of consumers
who form part of the Singletons consumer segment who participated in this study. Table 6-3
presents the main findings and conclusions pertaining to this objective.
Table 6-3: Conclusions and recommendations for secondary objective 2
Conclusions: Secondary research objective 1
Conclusion 1.1: From secondary objective 1, no recommendations can be made, but it can be concluded that the literature needed for this study was perused and discussed. The following chapters provided the required literary overview:
Chapter 2: Consumer behaviour and reference groups
Chapter 3: Market segmentation and lifestyle segmentation
Conclusions: Secondary research objective 2
The results of the study pertaining to various demographic elements of respondents allowed the researcher to develop a demographic profile of Singletons who participated in this study. The following conclusions relate to these demographic variables:
Conclusion 2.1: Singletons who participated in this study were primarily aged between 18 and 29 years of age.
Conclusion 2.2: Singletons who participated in this study primarily receive a monthly disposable income of R20 000 pm and less.
Conclusion 2.3: Singletons who participated in this study are mainly female.
Conclusion 2.4: Singletons who participated in this study mostly have a university degree (B-degree or Honours).

160
Table 6-3: Conclusions and recommendations for secondary objective 2 (continued)
6.4.3 Secondary research objective 3
The aim of secondary research objective 3 was to determine the extent to which reference groups
have an effect on the buying behaviour of Singletons. Table 6-4 presents the conclusions and
recommendations pertaining to this objective.
Table 6-4: Conclusions and recommendations for secondary objective 3
Recommendations: Secondary research objective 2
In order to devise effective and efficient marketing strategies, and for marketers to develop and promote products and services that are aligned with the specific needs of Singletons, it is important for marketers and organisations to identify and understand the demographics of this unique segment. It is for this reason that the following recommendations are provided:
Recommendation 2.1: Marketers who are actively targeting Singletons will need to conduct further research on female consumers aged between 18 and 29 years of age with university degrees earning a disposable income of R20 000 pm and less with the aim of identifying the unique needs, wants and other characteristics of this specific consumer group.
Recommendation 2.2: Marketers and organisations should develop and promote products and services that are aligned to the dominant demographic elements identified in this study in order to improve communication with this consumer group.
Recommendation 2.3: Marketers should make use of celebrities and other spokespersons and/or actors that are female, aged 18 to 29 and who portray a sense of intelligence in order to improve the effectiveness of communication with Singletons, in light of the fact that the majority of consumers in this group fall within this demographic profile. These dominant demographic elements should be considered when devising marketing campaigns directed towards Singletons.
Conclusions: Secondary research objective 3
In order to determine the effect of reference groups on the buying behaviour of Singletons, the SUSCEP scale was incorporated in the questionnaire. The SUSCEP scale consists of 12 items. Responses were rated using a 7-point Likert scale. Secondary objective 3 was addressed in main findings B1, B2 and B3. Conclusions pertaining to the effect of reference groups on the buying behaviour of Singletons are as follows:
Conclusion 3.1: It can be concluded that the 12 items of the SUSCEP scale were reliable for measuring the effect of reference groups on the buying behaviour of Singletons.
Conclusion 3.2: It can be concluded that the SUSCEP scale is a valid instrument to measure the effect of reference groups on the buying behaviour of respondents.
Conclusion 3.3: It can be concluded that a moderately low level of reference group influence is exerted on the buying behaviour of Singletons.
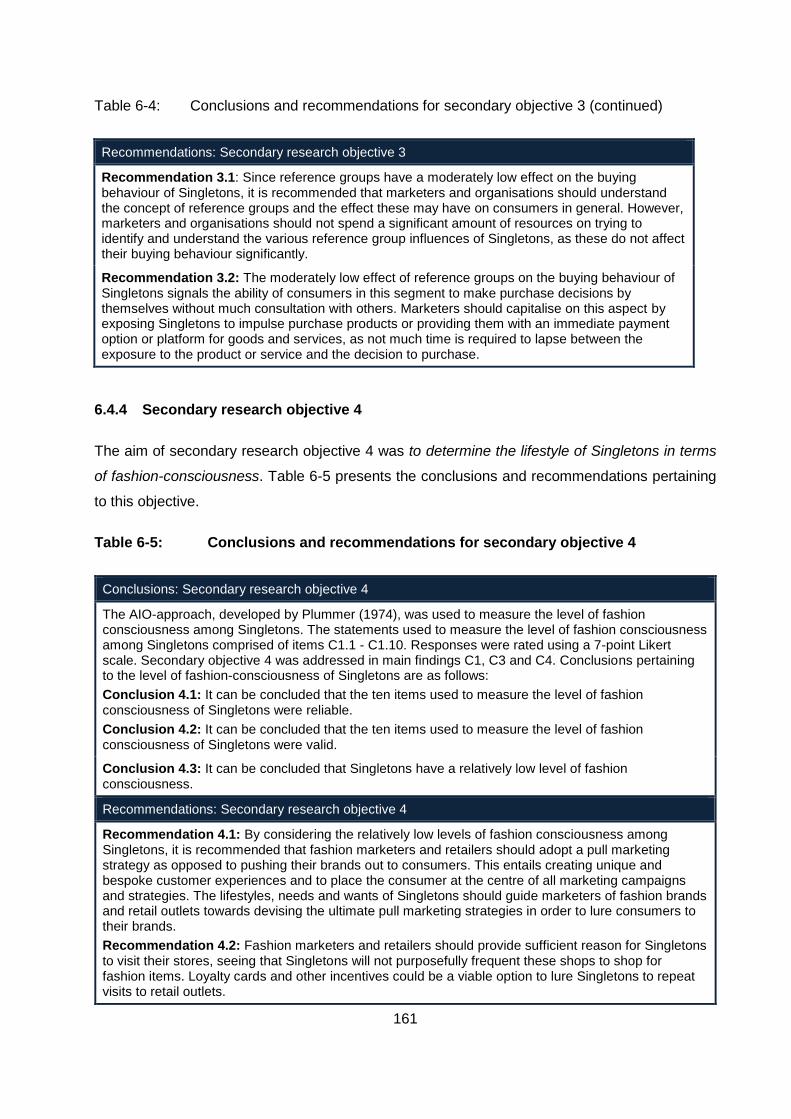
161
Table 6-4: Conclusions and recommendations for secondary objective 3 (continued)
6.4.4 Secondary research objective 4
The aim of secondary research objective 4 was to determine the lifestyle of Singletons in terms
of fashion-consciousness. Table 6-5 presents the conclusions and recommendations pertaining
to this objective.
Table 6-5: Conclusions and recommendations for secondary objective 4
Recommendations: Secondary research objective 3
Recommendation 3.1: Since reference groups have a moderately low effect on the buying behaviour of Singletons, it is recommended that marketers and organisations should understand the concept of reference groups and the effect these may have on consumers in general. However, marketers and organisations should not spend a significant amount of resources on trying to identify and understand the various reference group influences of Singletons, as these do not affect their buying behaviour significantly.
Recommendation 3.2: The moderately low effect of reference groups on the buying behaviour of Singletons signals the ability of consumers in this segment to make purchase decisions by themselves without much consultation with others. Marketers should capitalise on this aspect by exposing Singletons to impulse purchase products or providing them with an immediate payment option or platform for goods and services, as not much time is required to lapse between the exposure to the product or service and the decision to purchase.
Conclusions: Secondary research objective 4
The AIO-approach, developed by Plummer (1974), was used to measure the level of fashion consciousness among Singletons. The statements used to measure the level of fashion consciousness among Singletons comprised of items C1.1 - C1.10. Responses were rated using a 7-point Likert scale. Secondary objective 4 was addressed in main findings C1, C3 and C4. Conclusions pertaining to the level of fashion-consciousness of Singletons are as follows:
Conclusion 4.1: It can be concluded that the ten items used to measure the level of fashion consciousness of Singletons were reliable.
Conclusion 4.2: It can be concluded that the ten items used to measure the level of fashion consciousness of Singletons were valid.
Conclusion 4.3: It can be concluded that Singletons have a relatively low level of fashion consciousness.
Recommendations: Secondary research objective 4
Recommendation 4.1: By considering the relatively low levels of fashion consciousness among Singletons, it is recommended that fashion marketers and retailers should adopt a pull marketing strategy as opposed to pushing their brands out to consumers. This entails creating unique and bespoke customer experiences and to place the consumer at the centre of all marketing campaigns and strategies. The lifestyles, needs and wants of Singletons should guide marketers of fashion brands and retail outlets towards devising the ultimate pull marketing strategies in order to lure consumers to their brands.
Recommendation 4.2: Fashion marketers and retailers should provide sufficient reason for Singletons to visit their stores, seeing that Singletons will not purposefully frequent these shops to shop for fashion items. Loyalty cards and other incentives could be a viable option to lure Singletons to repeat visits to retail outlets.

162
6.4.5 Secondary research objective 5
The aim of secondary research objective 5 was to determine the lifestyle of Singletons in terms
of cost consciousness. Table 6-6 presents the conclusions and recommendations pertaining to
this objective.
Table 6-6: Conclusions and recommendations for secondary objective 5
6.4.6 Secondary research objective 6
The aim of secondary research objective 6 was to determine the lifestyle of Singletons in terms
of health-consciousness. Table 6-7 presents the conclusions and recommendations pertaining to
this objective.
Conclusions: Secondary research objective 5
The AIO-approach, developed by Plummer (1974), was used to measure the level of cost-consciousness among Singletons. The statements used to measure the level of cost consciousness among Singletons comprised of items C2.1 – C2.5.
Responses were rated using a 7-point Likert scale. Secondary objective 5 was addressed in main findings C1, C3 and C5. Conclusions pertaining to the level of cost consciousness of Singletons are as follows:
Conclusion 5.1: It can be concluded that the five items used to measure the level of cost consciousness of Singletons were reliable.
Conclusion 5.2: It can be concluded that the five items used to measure the level of cost consciousness of Singletons were valid.
Conclusion 5.3: It can be concluded that Singletons have a moderately high level of cost consciousness.
Recommendations: Secondary research objective 5
Recommendation 5.1: Due to the moderately high level of cost consciousness among Singletons, marketers should focus on the value of their products and downplay the price of the product if, indeed, the product is expensive. Marketers should strive to convince Singletons that their products are worthy of the price, even during recessions or economically challenging times.
Recommendation 5.2: Marketers could appeal to the frugality of Singletons’ cost consciousness by offering discounts on their products and by handing out coupons and other such incentives to convince Singletons that they are buying at a discounted or bargain price.
Recommendation 5.3: Marketers could promote their products on a monthly sale as opposed to traditional seasonal sales. Singletons will be more willing to spend their hard-earned money on sale items than paying the full price. Marketers could implement clever pricing strategies to ensure that they still earn a suitable profit on products placed on sale.

163
Table 6-7: Conclusions and recommendations for secondary objective 6
6.4.7 Secondary research objective 7
The aim of secondary research objective 7 was to determine the lifestyle of Singletons in terms
of recreation. Table 6-8 presents the conclusions and recommendations pertaining to this
objective.
Conclusions: Secondary research objective 6
The AIO-approach, developed by Plummer (1974), was used to measure the level of health consciousness among Singletons. The statements used to measure the level of health consciousness among Singletons comprised of items C3.1 – C3.4. Responses were rated using a 7-point Likert scale. Secondary objective 6 was addressed in main findings C1, C3 and C6. Conclusions pertaining to the level of health consciousness of Singletons are as follows:
Conclusion 6.1: It can be concluded that the four items used to measure the level of health consciousness of Singletons were reliable.
Conclusion 6.2: It can be concluded that the four items used to measure the level of health consciousness of Singletons were valid.
Conclusion 6.3: It can be concluded that Singletons have a moderately high level of health consciousness.
Recommendations: Secondary research objective 6
Recommendation 6.1: Due to the moderately high level of health consciousness among Singletons, marketers should emphasise the health benefits of their products and services and downplay potential health hazards that could be brought about through the use of said products and services.
Recommendation 6.2: It could be beneficial, in some instances, to add healthier alternatives to existing product lines in order to cater to health-conscious Singletons. This could be especially beneficial for marketers and organisations that produce products or provide services that could be perceived as harmful to consumers’ health, i.e. candy or chocolate producers.
Recommendation 6.3: It could be advantageous for brands that are actively targeting Singleton consumers to partner or collaborate with well-known health brands, such as Virgin Active or Discovery. This would lure Singletons towards the brand as they might perceive the brand as a healthy alternative to competitors in the same industry due to its collaboration with a health partner.
Recommendation 6.4: Marketers and organisations that are actively targeting Singletons should opt to advertise and promote their brands at areas where health-conscious consumers can be found (such as gymnasiums) or within targeted media platforms like health magazines and newsletters. This will ensure that health-conscious Singletons are reached more effectively and efficiently.
Recommendation 6.5: Marketers should place extensive information pertaining to the health benefits and/or hazards on their digital platforms as health-conscious Singletons are prone to conduct additional research on the health benefits of certain product categories.

164
Table 6-8: Conclusions and recommendations for secondary objective 7
6.4.8 Secondary research objective 8
The aim of secondary research objective 8 was to determine the lifestyle of Singletons in terms
of E-shopping. Table 6-9 presents the conclusions and recommendations pertaining to this
objective.
Table 6-9: Conclusions and recommendations for secondary objective 8
Conclusions: Secondary research objective 7
The AIO-approach, developed by Plummer (1974), was used to measure the level of recreation among Singletons. The statements used to measure the level of recreation among Singletons comprised of items C4.1 – C4.4. Responses were rated using a 7-point Likert scale. Secondary objective 7 was addressed in main findings C2, C3 and C7. Conclusions pertaining to the level of recreation of Singletons are as follows:
Conclusion 7.1: It can be concluded that the four items used to measure the level of recreation of Singletons were unreliable.
Conclusion 7.2: It can be concluded that the four items used to measure the level of recreation of Singletons were valid.
Conclusion 7.3: It can be concluded that Singletons have a moderately high level of recreation.
Recommendations: Secondary research objective 7
Recommendation 7.1: Due to the moderately high level of recreation among Singletons, marketers should conduct further research in order to deduce the exact recreational activities Singletons participate in, and by so doing, allowing marketers a more holistic picture to focus on when devising marketing strategies for this specific segment.
Recommendation 7.2: Seeing that Singletons enjoy recreational activities, marketers could create or promote recreational activities that are devised specifically for Singleton consumers, i.e. travel packages for solo travellers or gym membership packages for single consumers at discounted rates (taking into consideration their moderately high levels of cost consciousness).
Recommendation 7.3: Due to the ever-changing recreational activities on the market today, marketers and organisations that are actively targeting Singletons should keep abreast of the latest recreational trends and activities available to their consumers.
Conclusions: Secondary research objective 8
The AIO-approach, developed by Plummer (1974), was used to measure the level of E-shopping among Singletons. The statements used to measure the level of E-shopping among Singletons comprised of items C5.1 – C5.7. Responses were rated using a 7-point Likert scale. Secondary objective 8 was addressed in main findings C1, C3 and C8. Conclusions pertaining to the level of E-shopping of Singletons are as follows:
Conclusion 8.1: It can be concluded that the seven items used to measure the level of E-shopping of Singletons were reliable.
Conclusion 8.2: It can be concluded that the seven items used to measure the level of E-shopping of Singletons were valid.
Conclusion 8.3: It can be concluded that Singletons have a moderately high level of E-shopping.

165
Table 6-9: Conclusions and recommendations for secondary objective 8 (continued)
6.4.9 Secondary research objective 9
The aim of secondary research objective 9 was to determine the lifestyle of Singletons in terms
of career-orientation. Table 6-10 presents the conclusions and recommendations pertaining to
this objective.
Table 6-10: Conclusions and recommendations for secondary objective 9
Recommendations: Secondary research objective 8
Recommendation 8.1: Due to their moderately high level of preference for E-shopping, marketers and organisations should ensure that their products and services targeted at Singletons’ are made available for purchase online.
Recommendation 8.2: Marketers should ensure that they communicate the option to purchase their products and services online to their Singleton consumers.
Recommendation 8.3: Due to the amount of time spent online browsing and shopping for products and services, marketers and organisations should make use of online advertising
space to promote their products and services, or to advertise any promotions to Singletons. This would improve the reach of their marketing messages to the Singletons segment.
Conclusions: Secondary research objective 9
The AIO-approach, developed by Plummer (1974), was used to measure the level of career orientation among Singletons. The statements used to measure the level of career orientation among Singletons comprised of items C6.1 – C6.5. Responses were rated using a 7-point Likert scale. Secondary objective 9 was addressed in main findings C1, C3 and C9. Conclusions pertaining to the level of career orientation of Singletons are as follows:
Conclusion 9.1: It can be concluded that the seven items used to measure the level of career orientation of Singletons were reliable.
Conclusion 9.2: It can be concluded that the seven items used to measure the level of career -orientation of Singletons were valid.
Conclusion 9.3: It can be concluded that Singletons have a moderately high level of career orientation.
Recommendations: Secondary research objective 9
Recommendation 9.1: Due to their moderately high levels of career orientation, marketers and organisations should pitch career-oriented events and functions to Singleton consumers, i.e. hosting a networking event or seminar. By luring career oriented Singletons to such events, marketers can advertise and promote their specific brands, products and services at such events in order to improve their reach to consumers in the Singletons segment.
Recommendation 9.2: Marketers and organisations promoting and selling products and services that could possibly assist consumers in honing their skills or progress in their careers should emphasise the ability of their products and/or services in assisting Singletons in improving their efficiency and/or effectiveness at their place of work.

166
6.4.10 Secondary research objective 10
The aim of secondary research objective 10 was to determine the underlying relationships
between the various lifestyle dimensions of Singletons. Table 6-11 presents the conclusions and
recommendations pertaining to this objective.
Table 6-11: Conclusions and recommendations for secondary objective 10
Conclusions: Secondary research objective 10
This section of the study set out to determine whether linear relationships exist between the various lifestyle dimensions of Singletons including fashion consciousness, cost consciousness, health consciousness, recreation, E-shopping and career orientation. Secondary objective 10 was addressed in main findings D1, D2, D3, D4 and D5. Conclusions pertaining to the underlying relationships between the lifestyle dimensions of Singletons are as follows:
Conclusion 10.1: It can be concluded that a practically significant relationship exists between the lifestyle dimensions of fashion consciousness and health consciousness.
Conclusion 10.2: It can be concluded that a practically significant relationship exists between the lifestyle dimensions of fashion consciousness and recreation.
Conclusion 10.3: It can be concluded that a practically significant relationship exists between the lifestyle dimensions of fashion consciousness and E-shopping.
Conclusion 10.4: It can be concluded that a practically significant relationship exists between the lifestyle dimensions of recreation and E-shopping.
Conclusion 10.5: It can be concluded that a practically significant relationship exists between the lifestyle dimensions of health consciousness and E-shopping.
Conclusion 10.6: Singletons who are fashion conscious tend to be more health-conscious, enjoy partaking in recreational activities and have a preference for E-shopping.
Conclusion 10.7: Singletons who enjoy a preference for E-shopping also enjoy partaking in recreational activities and also tend to be more health conscious.
Recommendations: Secondary research objective 10
By considering the conclusions pertaining to the underlying relationships of the lifestyle dimensions of Singletons, the following recommendations are provided:
Recommendation 10.1: It is important for marketers and organisations that are actively targeting Singletons to take heed of these results and conclusions when devising their marketing strategies for this segment of consumers. This information should be used as guidelines when devising marketing strategies, implementing promotions and/or when communicating information to Singletons.
Recommendation 10.2: Given the interrelationships between fashion consciousness, recreation, health consciousness and E-shopping, marketers could advertise and sell trendy and fashionable active wear or recreational outfits (i.e. hiking gear) online.
Recommendation 10.3: Given the interrelationships between recreation, health consciousness and E-shopping, marketers and organisations could advertise and sell recreational activities or travel packages for single consumers online that are geared towards improving the consumers’ levels of health, i.e. mountain climbing or European skiing excursions.
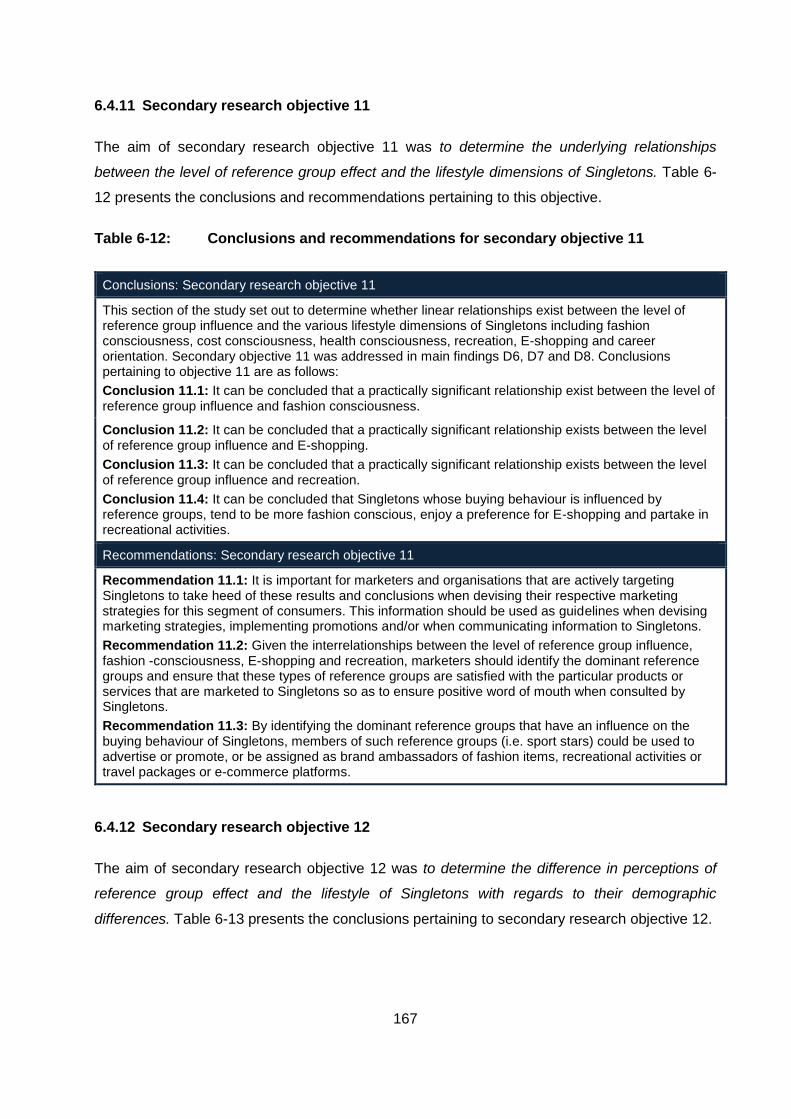
167
6.4.11 Secondary research objective 11
The aim of secondary research objective 11 was to determine the underlying relationships
between the level of reference group effect and the lifestyle dimensions of Singletons. Table 6-
12 presents the conclusions and recommendations pertaining to this objective.
Table 6-12: Conclusions and recommendations for secondary objective 11
6.4.12 Secondary research objective 12
The aim of secondary research objective 12 was to determine the difference in perceptions of
reference group effect and the lifestyle of Singletons with regards to their demographic
differences. Table 6-13 presents the conclusions pertaining to secondary research objective 12.
Conclusions: Secondary research objective 11
This section of the study set out to determine whether linear relationships exist between the level of reference group influence and the various lifestyle dimensions of Singletons including fashion consciousness, cost consciousness, health consciousness, recreation, E-shopping and career orientation. Secondary objective 11 was addressed in main findings D6, D7 and D8. Conclusions pertaining to objective 11 are as follows:
Conclusion 11.1: It can be concluded that a practically significant relationship exist between the level of reference group influence and fashion consciousness.
Conclusion 11.2: It can be concluded that a practically significant relationship exists between the level of reference group influence and E-shopping.
Conclusion 11.3: It can be concluded that a practically significant relationship exists between the level of reference group influence and recreation.
Conclusion 11.4: It can be concluded that Singletons whose buying behaviour is influenced by reference groups, tend to be more fashion conscious, enjoy a preference for E-shopping and partake in recreational activities.
Recommendations: Secondary research objective 11
Recommendation 11.1: It is important for marketers and organisations that are actively targeting Singletons to take heed of these results and conclusions when devising their respective marketing strategies for this segment of consumers. This information should be used as guidelines when devising marketing strategies, implementing promotions and/or when communicating information to Singletons.
Recommendation 11.2: Given the interrelationships between the level of reference group influence, fashion -consciousness, E-shopping and recreation, marketers should identify the dominant reference groups and ensure that these types of reference groups are satisfied with the particular products or services that are marketed to Singletons so as to ensure positive word of mouth when consulted by Singletons.
Recommendation 11.3: By identifying the dominant reference groups that have an influence on the buying behaviour of Singletons, members of such reference groups (i.e. sport stars) could be used to advertise or promote, or be assigned as brand ambassadors of fashion items, recreational activities or travel packages or e-commerce platforms.

168
Table 6-13: Conclusions for secondary objective 12
Conclusions: Secondary research objective 12
This section of the study set out to determine whether linear relationships exist between the level of reference group influence and the various lifestyle dimensions of Singletons including fashion consciousness, cost consciousness, health consciousness, recreation, E-shopping and career orientation. Secondary objective 12 was addressed in main findings E1 – E22. Conclusions pertaining to objective 12 are as follows:
Demographic element: Age
Conclusion 12.1: Singletons between the ages of 18 and 29 and 30 and 39 are significantly more influenced by reference groups than Singletons between the ages of 40 and 49.
Conclusion 12.2: Singletons between the ages of 30 and 39 are more fashion conscious than those between the ages of 18 and 29 and 40 to 49 respectively.
Conclusion 12.3: Singletons between the ages of 30 and 39 and 40 and 49 are more cost-conscious than Singletons between the ages of 18 and 29.
Conclusion 12.4: Singletons between the ages of 30 and 39 are the least health-conscious whilst Singletons between the ages of 40 and 49 are the most health conscious.
Conclusion 12.5: Singletons between the ages of 40 and 49 enjoy participating in recreational activities the most.
Conclusion 12.6: Singletons between the ages of 18 and 29 share a preference for E-shopping more than those aged between 30 and 49 years of age.
Conclusion 12.7: Singletons between the ages of 30 and 39 and 40 and 49 are more career orientated than Singletons aged 18 to 29.
Conclusion 12.8: Singletons earning a monthly income of less than R10 000 pm and those earning R31 000 and more per month are more health conscious than those Singletons in other income categories.
Conclusion 12.9: Singletons earning a monthly income of R31 000 and more are the most career orientated.
Demographic element: Level of education
Conclusion 12.10: Reference groups mostly influence the buying behaviour of Singletons who have completed matric and Singletons who have obtained a postgraduate degree.
Conclusion 12.11: Singletons who have obtained a technical college diploma and Singletons who have obtained a postgraduate degree are more fashion conscious.
Conclusion 12.12: Singletons who have obtained a technical college diploma are the most cost-conscious.
Conclusion 12.13: Singletons who have obtained a postgraduate degree share a preference for participating in recreational activities.
Conclusion 12.14: Singletons who have obtained a university degree and Singletons who have obtained a postgraduate degree share a preference for E-shopping.
Conclusion 12.15: Singletons who have obtained a technical college diploma and Singletons who have obtained a postgraduate degree are more career oriented.

169
Table 6-13: Conclusions for secondary objective 12 (continued)
Conclusions: Secondary research objective 12
Demographic element: Gender
Conclusion 12.16: Female Singletons are more health conscious than male Singletons.
Conclusion 12.17: Male Singletons experience a greater influence from reference groups than female Singletons.
Conclusion 12.18: Female Singletons are more fashion conscious than male Singletons.
Conclusion 12.19: Female Singletons participate in recreational activities more than male Singletons.
Conclusion 12.20: Female Singletons are more cost-conscious than male Singletons.
Conclusion 12.21: Male Singletons enjoy E-shopping more than female Singletons.
Conclusion 12.22: Female Singletons are more career orientated than male Singletons.
Recommendations: Secondary research objective 12
Demographic element: Age
Recommendation 12.1: Marketers and organisations that are actively targeting Singletons should strive to identify the dominant reference groups of Singletons aged younger than 40 years in order to align their marketing strategies and messages with the unique characteristics and needs of these reference groups.
Recommendation 12.2: Marketers and organisations should focus on producing and marketing fashion items that are age-appropriate for Singletons between the ages of 30 and 39 years. Marketers could conduct additional research (for example, by means of focus group sessions) on what this age group of Singletons like and what they would prefer to wear.
Recommendation 12.3: In order to provide Singletons aged between 30 and 39 and 40 and 49 years with products and services at a reasonable price, marketers and organisations should investigate and determine the products and services that Singletons in these age groups these prefer and purchase the most. Upon gaining this information, product promotions, product groupings, sales and discounts can be provided as incentives by the marketers and organisations to ensure that they retain these consumers.
Recommendation 12.4: Marketers and organisations can target health-conscious Singletons aged between 40 and 49 by providing them with special gym facilities and classes designed specifically for their needs. Organisations in the healthcare industry can award Singletons aged between 40 and 49 with benefits in terms of discount on healthy food and beverages and free yoga classes.
Recommendation 12.5: Marketers and organisations can identify the recreational activities that are mostly enjoyed by Singletons between the ages of 40 and 49 and develop recreational packages or offers specifically targeted at those recreational activities they prefer.
Recommendation 12.6: Marketers and organisations should ensure that the product lines and/or services targeted at Singletons aged between 30 are made available for purchase online, across all ecommerce sites i.e. Amazon.
Recommendation 12.7: Marketers and organisations could arrange for career events and/or functions specifically targeted at Singletons aged between 30 and 49. This could be mid-career change seminars or talks on how to improve performance at work and excel in one’s career. At these events, marketers can expose other brand and/or products targeted at Singletons in this specific age group.

170
Table 6-13: Conclusions for secondary objective 12 (continued)
Recommendations: Secondary research objective 12
Demographic element: Monthly income
Recommendation 12.8: Marketers and organisations that are actively targeting Singletons with health-related products should take note that Singletons who earn less than R10 000 pm and R31 000 pm or more are more prone to spend their disposable income on health-related products and services. Further research should be conducted on the lifestyle of these age groups, as well as their personal preferences so that marketers can position health-related products accordingly and advertise such products in media platforms that are mostly used by Singletons in these age groups.
Recommendation 12.9: Marketers should conduct further research on Singletons who earn R31 000 pm or more in order to gauge what their specific career needs and preferences are. Based on these findings, career-related events, functions, seminars and/or products and services could be marketed to Singletons in this specific income category.
Demographic element: Level of education
Recommendation 12.10: Marketers and organisations should make sure that they identify and understand who the reference groups are that Singletons consult when making purchase decisions, specifically those Singletons who have completed matric or who have obtained a postgraduate degree. This will allow them to customise their marketing strategies and messages to conform to the needs and unique characteristics of Singletons with these levels of education.
Recommendation 12.11: Marketers and organisations who promote fashion brands and items to Singletons should customise their marketing strategies and campaigns according to the needs and unique characteristics of Singletons who have obtained a technical college diploma and/or a postgraduate degree, seeing that Singletons who have obtained these levels of education are more fashion-conscious than others.
Recommendation 12.12: Marketers should pitch promotional products and discounted goods and services specifically to Singletons who have obtained a technical college diploma, seeing that they tend to be more cost-conscious.
Recommendation 12.13: Marketers and organisations that are actively targeting Singletons with recreational products or packages should conduct further research on Singletons who have obtained a postgraduate degree. By doing so, marketers will gain a more profound understanding of the exact needs and preference pertaining to their recreational activities, and will, therefore, be able to customise products and packages to cater for the exact needs of this group of Singletons.
Recommendation 12.14: Products that are specifically aimed at Singletons who have obtained a university degree and/or a postgraduate degree should be made available online for purchase, seeing that such consumers share a preference for E-shopping. In addition, further research can be conducted on the personal preferences and needs of Singletons who have obtained a university degree or postgraduate degree in order to ensure that such products are produced or made available to such consumers.
Recommendation 12.15: Marketers and organisations who market and promote products and services that are aimed at advancing consumers’ careers should specifically aim their marketing efforts at Singletons who have obtained a technical college diploma and those who have obtained a postgraduate degree.

171
Table 6-13: Conclusions for secondary objective 12 (continued)
6.5 LINKING ALL ASPECTS OF THE STUDY: RESEARCH OBJECTIVES. QUESTIONS IN
THE QUESTIONNAIRE, MAIN FINDINGS, CONCLUSIONS AND RECOMMENDATIONS
A summary of the links between all aspects of the study in terms of the study’s primary and
secondary research objectives, the questions posed in the questionnaire, the main findings,
conclusions and recommendations are presented in Table 6-15.
Demographic element: Gender
Recommendation 12.16: Marketers and organisations that are actively targeting Singletons with health-related products and services should bear in mind that female Singletons are more inclined to be interested in, and to purchase such products. Thus, marketers could capitalise on this by making use of female spokespersons and brand ambassadors in order to communicate with this group of Singletons more effectively. Packaging and other brand elements should also be aligned with female preference.
Recommendation 12.17: Marketers and organisations that are actively targeting Singletons with health-related products and services should keep in mind that female Singletons are more inclined to be interested and to purchase such products. Thus, marketers could capitalise on this by making use of female spokespersons and brand ambassadors in order to communicate with this group of Singletons more effectively. Packaging and other brand elements should also be aligned with females’ preferences.
Recommendation 12.18: Marketers and organisations that are actively targeting Singletons with fashion brands and items should invest more time and resources on targeting female Singletons than male Singletons, as female Singletons are more fashion conscious than male Singletons.
Recommendation 12.19: Marketers and organisations that are actively targeting Singletons with recreational activities and excursions should invest more time and resources on targeting female Singletons than male Singletons, since female Singletons are more prone to participate in recreational activities.
Recommendation 12.20: Marketers and organisations that are targeting Singletons with value-added products, discounted products, vouchers and sales should focus more on targeting male Singletons, as these consumers are more cost-conscious than female Singletons and are more likely to react to such marketing efforts.
Recommendation 12.21: Products and services targeted at male Singletons should be made available online, as male Singletons have a preference for E-shopping. In addition, marketers can capitalise on this fact by advertising brands and products targeted at male Singletons online, as this will improve the chances of reaching male Singletons more effectively, seeing that they are active online.
Recommendation 12.22: Career-advancing opportunities, products, service, as well as seminars, events and functions aimed at consumers who wish to progress in their careers or change careers, should be targeted at female Singletons as they are more career-oriented than male Singletons.

172
Table 6-14: Links between research objectives, questions, main findings, conclusions and recommendations
Questions Main finding Conclusions Recommendations
Secondary objective 1: To provide an overview of the research literature related to the main constructs of this study, namely consumer behaviour, reference groups, market segmentation and lifestyle segmentation.
Chapters 2 & 3 - 1.1 -
Secondary objective 2: To develop a demographic profile of consumers who form part of the Singleton market segment and who participated in this study.
Section D: D1 – D5 5.5 2.1 – 2.4 2.1 – 2.3
Secondary objective 3: To determine the extent to which reference groups have an effect on the buying behaviour of Singletons.
Section B: B1 – B12 5.3 3.1 – 3.3 3.1 – 3.2
Secondary objective 4: To determine the lifestyle of Singletons in terms of fashion consciousness.
Section C: C1.1 – C1.10 5.4 4.1 – 4.3 4.1 – 4.3
Secondary objective 5: To determine the lifestyle of Singletons in terms of cost consciousness.
Section C: C2.1 – C2.5 5.4 5.1 – 5.3 5.1 – 5.3
Secondary objective 6: To determine the lifestyle of Singletons in terms of health consciousness.
Section C: C3.1 – C3.4 5.4 6.1 – 6.3 6.1 – 6.5

173
Table 6-14: Links between research objectives, questions, main findings, conclusions and recommendations (continued)
Secondary objective 7: To determine the lifestyle of Singletons in terms of recreation.
Section C: C4.1 – C4.4 5.4 7.1 – 7.3 7.1 – 7.3
Secondary objective 8: To determine the lifestyle of Singletons in terms of E-shopping.
Section C: C5.1 – C5.7 5.4 8.1 – 8.3 8.1 – 8.3
Secondary objective 9: To determine the lifestyle of Singletons in terms of career orientation.
Section C: C6.1 – C6.5 5.4 9.1 – 9.3 9.1 – 9.2
Secondary objective 10: To determine the underlying relationships between the various lifestyle dimensions of Singletons.
Section C: C1.1 – C6.5 5.6 10.1 – 10.7 10.1 – 10.3
Secondary objective 11: To determine the underlying relationships between the level of reference group effect and the lifestyle dimensions of Singletons.
Section B & C: B1 – B12 ; C1.1 – C6.5
5.7 11.1 – 11.4 11.1 – 11.3
Secondary objective 12: To determine the difference in perception of reference group influence and the lifestyle dimensions of Singletons with regards to their demographic differences.
Section B, C & D: B1-B12 ; C1.1 – C6.5 ; D1 – D5
5.8 12.1 – 12.22 12.1 – 12.22

174
Considering the information presented in Table 6-29, it can be concluded that the secondary
objectives set out to achieve the primary objective of this study, which was to determine the effect
of reference groups and lifestyle on the buying behaviour of Singletons, have been met.
6.6 LIMITATIONS OF THE STUDY
Upon conducting a research study, it is unavoidable to experience limitations that influence the
study. This section presents the limitations pertaining to the literature review and empirical
research.
6.6.1 Limitations of the literature review
Extensive literature is available on consumer behaviour and lifestyle; however, a limited
amount of information is available on the Singletons consumer segment.
Secondary sources concerning Singletons are limited, consisting mostly of Internet sources.
Minimal, to non-existing resources of Singleton consumers in South Africa are available, thus
compelling the researcher to rely on information provided by international studies.
A large body of literature is available with regard to lifestyle segmentation; however, limited
information concerning the AIO-approach and the various statements. The battery of
statements is not easily accessible or properly explained.
6.6.2 Limitations of the empirical study
No sampling frame of Singletons in South Africa was available for this study, resulting in the
choice of using a non-probability convenience questionnaire.
This study only considered Singletons in the Johannesburg and Pretoria areas of Gauteng,
thus making it an inaccurate representation of the entire South African population.
The final sample of this study consisted of 207 respondents. A larger sample is needed in
order to obtain more conclusive results.
The lifestyle of Singletons was only represented by measuring six lifestyle dimensions. More
insight should be gathered on the lifestyle of Singletons by considering more lifestyle
dimensions.

175
The study had more female respondents than male respondents, which also indicated a
possible misrepresentation of the larger South African Singleton population.
Bearing these limitations in mind, recommendations for future research are presented in the
following section.
6.7 SUGGESTIONS FOR FUTURE RESEARCH
Considering the above mentioned limitations, a number of recommendations can be made for
future studies:
A more accurate representation of the target population can be gained if a larger sample size
is considered in future research.
Future studies should consider a wider geographic are of study, by considering all the densely
populated provinces in South Africa.
A comparative can be conducted to determine how Singletons and their lifestyles differ with
regard to the various geographic locations.
Similar studies can be conducted by determining the lifestyle of Singletons and analysing
various dimensions and their statements, from the AIO-approach.
Future studies can consider determining the effect of other external influences such as culture,
family and social class that may affect the buying behaviour of Singletons.
Probability sampling can be implemented in future studies in order to assure that the results
obtained represent the entire population and not only the participating respondents.
It is recommended that longitudinal research designs should be incorporated, as it will improve
the external validity of this study. This study was conducted at one point in time only, and
greater and more accurate results could have been obtained by using a longitudinal research
design.
Future studies can consider one of the lifestyle dimensions and gain a more profound
understanding of Singletons with regard to that specific dimension, for example considering
the cost consciousness dimension of Singletons and then determining their financial
aspirations, expenditure and preferred banking schemes.

176
6.8 CONCLUSION
This chapter presented an overview of the study as well as the main findings, conclusions,
recommendations and limitations. The secondary objectives were used to draw conclusions,
which are based on the main findings formulated in Chapter 5. Recommendations were
formulated to assist marketers and organisations in their efforts to target Singleton consumers
effectively based on their preferences as identified in the main findings. A summary is provided
of the links between all the aspects of the study. The chapter concluded by discussing the various
limitations that the researcher experienced while conducting this study. Finally, a number of
suggestions based on the limitations was offered for future studies.

177
BIBLIOGRAPHY
Aaker, D.A., Kumar, V., Day, G.S. & Leone, R.P. 2011. Marketing research. 10th ed. New
Jersey: Wiley.
Al Zoubi, M.O. & Bataineh, M.T. 2011. The effects of using celebrities in advertising on the
buying decision: empirical study on students in Jarash private university. American journal of
scientific research, 13(2011):59-70.
American Marketing Association (AMA). 2017. Definition of marketing. http://www.marketing-
dictionary.org/Marketing. Date of access: 26 Sept. 2018.
American Marketing Association (AMA). 2018. Definition of marketing research.
http://www.marketing-dictionary.org/Marketing+research. Date of access: 2 Jan. 2019.
Anantachart, S. 2013. Discovering Thai senior consumers’ patterns of consumption in
Bangkok. Journal of health research, 27(2):85-91.
Arora, R. & Mahankale, N.R. 2013. Marketing research. New Delhi: PHI learning.
Asiedu, E. 2016. A study of use and impact of market segmentation practices on bank
performance: with special reference to commercial banks in Colombia. Journal of business and
financial affairs, 5(1):3-5.
Babin, B. & Zikmund, W. 2016. Exploring marketing research. 11th ed. Boston, MA: Cengage
Learning.
Babin, B.J. & Harris, E. 2018. Consumer behaviour. 8th ed. Boston: Cengage.
Baharun, R., Hamid, A.B.A., Shamsudin, A.S., Salleh, N.Z.M., Zaidin, N. & Sulaiman, Z. 2011.
Market segmentation in Malaysia by using psychographic dimensions for unit trust products.
African journal of business management, 5(13):5040-5047.
Baines, P., Fill, C. & Page, K. 2013. Essentials of marketing. UK: Oxford University Press.
Baoku, L., Cuixia, Z. & Weimn, B. 2010. An empirical study on the decision-making styles of
the Chinese peasant consumers. Journal of consumer marketing, 27(7):629-637.
Barry, T.E. 2009. Assessing the nomological validity of a cognitive age segmentation of
Japanese seniors. Asia Pacific journal of marketing, 21(3):315-328.Bemporad, R. &

178
Baranowski, M. 2011. Conscious consumers are changing the rules of marketing. Are you
ready?
http://docs.google.com/viewer?a=v&q=cache:938rT3oqav4J:www.fmi.org/docs/sustainability/BB
MG_Conscious_Consumer Date of access: 12 Oct. 2018.
Benzo, R., Monsen, M.G. & Fourali, C. 2016. Marketing research: planning, process, practice.
USA: Sage Publications.
Berndt, A. & Petzer, D. 2011. Marketing research. Cape Town: Pearson.
Bindroo, V. & Echambadi, X.H. 2016. Satisfaction-repurchase intention relationship: exploring
the contingent roles of consideration set size in price consciousness. Journal of marketing and
management, 3(1):15-125.
Binge, J.E., Sanchez, I. & Andreu, L. 2009. The role of variety seeking in short and long run
revisit intentions in holiday destinations. International journal of culture, tourism and hospitality
research, 3(2):103-115.
Boone, L.E. & Kurtz, D.L. 2014. Contemporary marketing. 16th ed. Mason, OH: South-Western.
Bothma, C. 2013. Product management. Cape Town: Juta.
Bouhlel, O., Mzoughi, M.N. & Chaieb, S. 2011. Singles: an expanding market. Business
management dynamics, 1(3):22-32.
Bradley, N. 2010. Marketing research: tools & techniques. 2nd ed. New York, NY: Oxford.
Bradley, N. 2013. Marketing research: tools and techniques. 3rd ed. Oxford: Oxford University
Press.
Brown, T.J. & Suter, T.A. 2014. Marketing research. 2nd ed. Mason, OH: South-Western.
Brown, T.J., Suter, T.A. & Churchill, G.A. 2018. Basic marketing research: customer insights
and managerial action. 9th ed. Boston, MA: Cengage Learning.
Bruwer, J & Li, E. 2017. Domain-specific market segmentation using a latent class mixture
modelling approach and wine-related lifestyle (WRL) algorithm. European journal of marketing,
51(10):1552-1576.
Bug, P. & Topfer, M. 2015. Classical consumer lifestyle segmentation methods. International
marketing review, 2(2):10-31.

179
Burns, A.C. & Bush, R.F. 2014. Marketing research. 7th ed. Harlow: Pearson.
Burns, A.C., Veeck, A. & Bush, R.F. 2017. Marketing research. 8th ed. Harlow: Pearson.
Busany, N. & Maoz, S. 2016. Behavioural log analysis with statistical guarantees.
Cambridge Dictionary. 2018. Bachelor.
https://dictionary.cambridge.org/dictionary/english/bachelor Date of access: 31 Aug 2018
Cant, M. 2010. Marketing: an introduction. Lansdowne, Cape Town: Juta.
Cant, M.C. & Van Heerden, C.H. 2010. Marketing management: A South African
perspective. Cape Town: Juta.
Cardona, M. 2013. Single-minded marketing: a multitrillion-dollar opportunity.
www.cmo.com/features/articles/2013/4/16/single-minded-marketing.html Date of access: 13
Mar. 2018.
Centola, D. 2010. The spread of behavior in an online social network experiment. Journal of
science, 32(59):1194-1197.
Chiu, C.M., Wang, E.Y., Fang, Y.H. & Huang, H.Y. 2014. Understanding consumers’ repeat
purchase intentions in b2c e-commerce: the roles of utilitarian value, hedonic value and
perceived risk. Information systems journal, 24(1):85-114.
Churchill, G.A., Brown, T.J. & Suter, T.A. 2010. Basic marketing research. 7th ed. Southern-
Western: Cengage.
Cleveland, M., Papadopoulos, N. & Laroche, M. 2011. Identity, demographics, and consumer
behaviors: international market segmentation across product categories. International marketing
review, 28(3):244-266.
Clow, K.E. & James, K.E. 2014. Essentials of marketing research: putting research into
practice. London: Sage.
Cooper, D.R. & Schindler, P.S. 2011. Business research methods. 11th ed. Singapore:
McGraw-Hill.
Cunningham, N. 2018. Introduction to marketing: a Southern African perspective. Pretoria:
Van Schaik.

180
Dawar, S. 2016. Impact of technological innovation on marketing mix of mobile phone industry
in Rajasthan.
Dawson, E. & Chatman, E. 2001. Reference group theory with implications for information
studies: a theoretical essay. Information research, 6(3):1-5.
De Vos, A.S., Strydom, H., Fouché, C.B. & Delport, C.S.L. 2009. Research at grass roots: for
the social sciences and human service professions. 3rd ed. Pretoria: Van Schaik Publishers.
DeMarais, D. 2015. Validation of the SUSCEP scale: an independent second look. In
proceedings of the 1990 academy of marketing science (AMS) annual conference. Cham:
Springer.
DMA. 2013. Meet the 4 new singleton consumer types you need to get to know.
www.dma.org.uk/article/meet-the-new-singletons-you-need-to-get-to-know/1474 Date of
access: 12 Mar. 2018.
Dos Santos, M. 2013. Consumer behaviour: South African psychology and marketing
applications. Cape Town: Oxford.
Ebren, F. 2009. Susceptibility to interpersonal influence: a study in Turkey. Social behaviour
and personality, an international journal, 37(8):1051-1063.
Elsbach, K.D. & Kramer, R.M. 2016. Handbook of qualitative business research: innovative
pathways and methods. New York, NY: Routledge.
Envision. 2016. The single shopper – an overlooked consumer ready to connect.
http://www.dialogue-international.com/the-single-shopper-an-overlooked-consumer-ready-to-
connect/ Date of access: 11 Jun. 2018.
Euromonitor. 2017. https://www.stylus.com/solo-living-independent-singletons Date of access:
15 Aug. 2018.
Euromonitor International. 2008. Singletons: a consumer group you can’t afford to ignore.
www.marketresearchworld.net/content/view/2064/78/ Date of access: 17 Jan. 2018.
Euromonitor International. 2017. Households in 2030: rise of the singletons.
www.blog.euromonitor.com/2017/03/households-2030-singletons.html Date of access: 12 Mar.
2018.

181
Feinberg, F.M., Kinnear, T.C. & Taylor, J.R. 2013. Modern marketing research: concepts,
methods and cases. 2nd ed. South-Western: Cengage.
Field, A. 2009. Discovering statistics using SPSS. 3rd ed. London: Sage.
Flynn, J.Z. & Foster, I.M. 2009. Research methods for the fashion industry. New York:
Fairchild.
Flynn, M. 2017. Infographic: marketing to singles.
www.martinoflynn.com/blog/2017/04/12/infographic-marketing-singles/ Date of access: 17 Jan.
2018.
Gbadamosi, A. 2013. Principles of marketing: a value-based approach. NY: Palgrave
Macmillan.
Ha, S. & Stoel, L. 2010. Consumer E-shopping acceptance: antecedents in a technology
acceptance model. Journal of business research, 62(5):565-571.
Hair, J.F., Wolfinbarger, M.F., Ortinau, D.J. & Bush, R.P. 2010. Essentials of marketing
research. 2nd ed. New York, NY: McGraw-Hill.
Harreveld, B., Danaher, M., Lawson, C., Knight, B.A. & Busch, G. 2016. Constructing
methodology for qualitative research. London: Macmillan Publishers.
Hawkins, D.I. & Mothersbaugh, D.L. 2010. Consumer behavior: building marketing strategy.
11th ed. New York, NY: McGraw-Hill.
He, Y., Zou, D. & Jin, L. 2010. Exploiting the goldmine: a lifestyle analysis of affluent Chinese
consumers. Journal of consumer marketing, 27(7):615-628.
Henn, M., Weinstein, M. & Foard, N. 2009. A critical introduction to social research. 2nd ed.
London: Sage Publications.
Henricks, M. 2014. Marketing to singles: why one isn’t the loneliest number.
https://www.americanexpress.com/us/small-business/openforum/articles/marketing-to-singles-
why-one-isnt-the-loneliest-number/ Date of access: 11 Jun. 2014.
Hong, H. 2009. Scale development for measuring health consciousness: re-conceptualization.
Social and behavioural sciences, 1(1):3-24.

182
Hoomans, J. 2016. 35 000 decisions: the great choices of strategic leaders.
https://www.go.roberts.edu. Date of access: 30 Aug. 2018.
Horner, S. & Swarbrooke, J. 2016. Consumer behaviour in tourism. 3rd ed. New York:
Routledge.
Hou, J. & Elliot, K. 2016. Gender differences in online auctions. Electronic commerce research
and applications, 17(1):123-133.
Hoyer, W., McInnis, D. & Pieters, R. 2018. Consumer behaviour. 7th ed. Boston: Cengage.
Huang, Y., Shi, J. & Wang, L. 2012. Consumer susceptibility to interpersonal influence in
mainland China. Asian journal of social psychology, 15(2):140-144.
Hundal, A. 2005. Psychographics of singletons: implications for marketers. Management and
labour studies, 1(1):26-28.
Hur, W., Kim, H. & Park, J. 2010. Food and situation – specific lifestyle segmentation of
kitchen appliance market. British food journal, 112(3):294-305.
Hur, W., Kim, H.K. & Park, J. 2010. Food and situation-specific lifestyle segmentation of
kitchen appliance market. British food journal, 112(3):294-305.
Hurd, A. & Anderson, D.M. 2017. Kraus’ recreation and leisure in modern society. Burlington:
Jones and Bartlett Learning.
Husnain, M. & Akhtar, M. 2015. Impact of lifestyle on brand preferences. Journal of business
administration research, 4(2):30-38.
Hyman, M.R. & Sierra, J.J. 2010. Marketing research kit for dummies. Indiana: Wiley
Publishing.
Iacobucci, D. & Churchill, G.A. 2010. Marketing research: methodological foundations. 10th ed.
Mason: Cengage.
Iacobucci, D. & Churchill, G.A. 2015. Marketing research: methodological foundations. 11th ed.
Nashville, TN: Earlie Lite Books.
Jacobs, E. 2013. Singular behaviour. https://www.ft.com/content/94417e42-fab2-11e2-a7aa-
00144feabdc0 Date of access: 19 Mar 2018.
183
Jadczakova, V. 2010. Evaluation and analysis of questionnaire lifestyle segmentation. Journal
of economics and management, 1(1):3-26.
Jeong, Y., Zielinski, S., Chang, J. & Kim, S. 2018. Comparing motivation-based and
motivation-attitude-based segmentation of tourists visiting sensitive destinations. Journal of
sustainability, 10(2):1-16.
Joubert, P. 2013. Introduction to consumer behaviour. 2nd ed. Lansdowne, Cape Town: Juta.
Jusoh, Z.M. & Ling, G.H. 2012. Factors influencing consumer attitudes towards e-commerce
purchases through online shopping. International journal of humanities and social science,
2(4):223.
Kardes, F.R., Cronley, M.L. & Cline, T.W. 2011. Consumer behaviour. 2nd ed. South–
Western: Cengage.
Kardes, F.R., Cronley, M.L. & Thomas, W.C. 2015. Consumer behaviour. 2nd ed. Stamford:
Cengage.
Keegan, W.J. & Green, M.C. 2011. Global marketing. 6th ed. Upper Saddle River, N.J.:
Pearson.
Kim, J., Kim, P. & Kim, J.E. 2018. Different or similar choices: the effect of decisions framing
on variety seeking n travel bundle packages. Journal of travel research, 57(1):99-115.
Kotler, P. & Keller, K.L. 2009. Marketing management. 13th ed. Upper Saddle River, NJ:
Pearson.
Kotler, P. & Keller, K.L. 2016. A framework for marketing management. 6th ed. Essex,
England: Pearson.
Kotler, P., Armstrong G. & Tait M. 2013. Principles of marketing: global and Southern African
perspectives. Cape Town: Pearson.
Kreamer, H.C. & Blasey, C. 2016. How many subjects? Statistical power analysis in research.
USA: Sage publications.
Krishnan, C.V. 2011. Determinants of consumer buying behaviour: an empirical study of
private label brands in apparel retail. Journal of economics and management, 2(3):24-27.

184
Krishnan, J. 2011. Lifestyle – a tool for understanding buyer behaviour. Journal of economics
and management, 5(1):283 – 298.
Lake, L.A. 2009. Consumer behaviour for dummies. Hoboken, NJ: Wiley.
Lamb, C.W., Hair, J.F. & McDaniel, C. 2010. MKTG2. Mason, Oh.: Cengage Learning.
Lantos, G.P. 2011. Consumer behaviour in action: real-life applications for marketing
managers. New York, NY: Sharpe.
Lawan, L. & Zanna, R. 2013. Evaluation of socio-cultural factors influencing consumer buying
behaviour of clothes in Borno State, Nigeria. International journal of basic and applied
sciences, 1(3):519-529.
Lei, Y., Yayla, A. & Kahai, S. 2017. Guiding the Herd: the effect of reference groups in
crowdfunding decision making. Journal of business and economics, 1(1):50-62.
Lessig, V.P. & Park, C.W. 1978. Promotional perspectives of reference group influence:
advertising implications. Journal of advertising, 7(2):41-47.
Levy, M., Weitz, B.A. & Grewal, D. 2014. Retail management. 9th ed. New York, NY: McGraw-
Hill.
Lin, L. & Chen, Y. 2009. A study on the influence of purchase intentions on repurchase
decisions: the moderating effects of reference groups and perceived risks. Tourism review,
64(3):28-48.
Lin, Z., Heng, C. & Goh, K. 2013. Social media brand community and consumer behaviour:
quantifying the relative impact of users and marketer generated content. Information system
research, 24(1):88-107.
Lodha, G. & Vyas, A. 2012. Sales promotion approaches & marketing strategies followed in
domestic LPG sector of India. International journal of marketing and technology, 2(10):137-151.
Macmillan Dictionary. 2018. Singletons.
https://www.macmillandictionary.com/dictionary/british/singleton Date of access: 31 Aug 2018
Madeira, A.B., da Silveira, J.A.G. & Toledo, L.A. 2015. Marketing segmentation: your role for
diversity in dynamical systems. Journal of marketing, 13(1):71-78.

185
Malhotra, N.K. 2010. Marketing research: an applied orientation. 6th ed. Upper Saddle River,
NJ: Pearson Education.
Malhotra, N.K. & Dash, S. 2016. Marketing research: an applied orientation. 7th ed. India:
Pearson.
Manickam, S. & Sriram, B. 2013. Modelling the impact of marketing information on consumer
buying behaviour in a matured marketing environment: an exploratory study of the Middle East
consumers. Journal of promotion management, 19(1):1-16.
Mascolo, K. 2017. How marketing to singles may be good for small businesses.
www.voices.Whitman.syr.edu/programs/marketing Date of access: 17 Jan. 2018.
McDaniel, C.J & Gates, R. 2013. Marketing research essentials. 8th ed. New Jersey: Wiley.
McDaniel, C.J. & Gates, R. 2010. Marketing research essentials. 7th ed. Danvers: Wiley.
McPherson, M. 2004. A Blau space primer: prolegomenon to an ecology of affiliation.
Industrial and corporate change, 13(1):263-280.
Mooi, E., Sarsteat, M. & Reci, I. 2018. Market research: the process, data and methods using
strata. Singapore: Springer.
Mpinganjira, M. & Dos Santos, M.A.O. 2013. Consumer behaviour: South African psychology
and marketing applications. Cape Town: Oxford University Press.
Mykhailyk, N. 2014. Consumer behaviour: the psychology of marketing. Journal of marketing,
1(1):350-353.
Narang, R. 2010. Psychographic segmentation of youth in the evolving Indian retail market.
The international review of retail, distribution and consumer research, 20(5):535-557.
Nasiopoulos, D.K. 2015. Modelling of market segmentation for new IT product development.
International journal of marketing and technology, 12(1): 1-16.
Neelankavil, J.P. 2015. International business research. 2nd ed. New York, NY: Taylor &
Francis.
Noel, H. 2009. Basics marketing 01: Consumer behaviour. 1st ed. Switzerland: AVA
Publishing.

186
Oxford Dictionary. 2018. Singletons. https://en.oxforddictionaries.com/definition/singleton
Date of access: 31 Aug 2018
Palmer, A. 2009. Introduction to marketing. 2nd ed. New York: Oxford University Press.
Parumasur, S.B. & Lombard, M.R. 2014. Consumer behaviour. 3rd ed. Cape Town: Juta.
Paulose, D. & Varghese, R. 2016. A study on the role of materialism and interpersonal
influence in triggering conspicuous consumption among emigrants from Kerala. Rajagiri
management journal, 10(1):38-62.
Paulose, M.D. & Ramanathan, H.N. 2016. A study on social antecedents of conspicuous
consumption among emigrants from Kerala. Journal of research in business and management,
4(2):8-19.
Peter, J.P. & Donnelly, J.H. 2011. Marketing management: knowledge and skills. 10th ed. New
York, NY: McGraw-Hill.
Phau, I. & Teah, M. 2009. Devil wears (counterfeit) Prada: a study of antecedents and
outcomes of attitudes towards counterfeits of luxury brands. Journal of consumer marketing
26(1):15-27.
Prakash, S. 2017. Consumer buying behaviour: the 21st century consumers. Journal of
marketing, 1(1):63-68.
Pride, W.M. & Ferrell, O.C. 2010. Marketing. 15th ed. Mason, OH: Cengage Learning.
Quintosn C. 2019. Loner living – solitude is bliss. https://blog.euromonitor.com/;oner-living-
solitude-is-bliss/ Date of access: 26 Jul. 2019.
Rahman, T. 2017. Analysis on consumer recall, recognition and brand association pf the
Savlon social media campaign. Journal of business management, 1(1):17.
Ramya, N. 2016. Factors affecting consumer buying behaviour. International journal of
applied research, 2(10):76-80.
Rani, P. 2014. Factors influencing consumer behaviour. Journal of customer behaviour,
2(9):52-61.
Rao, K.R.M. 2011. Services marketing. 2nd ed. New Delhi: Dorling Kindersley.

187
Ratanasawadwat, N. & Jiamthapthaksin, R. 2017. Incorporating social network Thai text
mining with lifestyle segmentation analysis. International congress on advanced applied
informatics, 1(1):971-975.
Ray, D. & Choudhury, S.R. 2015. Factors affecting consumer decision making for purchasing
selected home appliance products based on market segmentation: a feedback study of people
associated with management education. Journal of research in business and management,
3(2):6-11.
Ren, H., Liu, L., Wang, D., Liu, J. & Luo, X. 2016. The battle for singles day: how social media
marketing campaigns boost sales. Pacific Asia conference of information systems, 1(1):2-5.
Salkind, N.J. 2017. Statistics for people who (think they) hate statistics. 6th ed. London: Sage
publications.
Sankar, D. 2016. Pre-owned car market in Kerala: a model linking attitudes, product and
dealer related factors to post purchase behaviour. Journal of academy of business and
economics, 1(1):50-62.
Sathish, S.SA. & Rajamohan, A. 2012. Consumer behaviour and lifestyle marketing.
International journal of marketing, financial serviced and management research, 1(10):150-172.
Schariff, R.T.S., Shafi, A.R.M. & Hasim, N.H.H. 2014. Application of consumer lifestyle
research in marketing perspective. Global engineers and technologists review, 4(1):11-15.
Schiffman, L.G. & Kanuk, L.L. 2014. Consumer behaviour. 10th ed. Upper Saddle River, NJ:
Pearson.
Schlacter, J., Razzauk, N. & Mills, M. 1979. The family lifecycle revisited. (In Gitlow, H.S. &
Wheatley, E.W., eds. Developments in marketing science: proceedings of the academy of
marketing science, Miami, FL. New York, NY: Springer. p. 38-43).
Schultz, E.J. 2010. As single becomes new norm, how to market without stigma.
www.adage.com/artical/news/advertising-market-singles-stigma/146376/ Date of access: 17
Jan. 2018.
Sethna, Z. & Blythe, J. 2016. Consumer behaviour. 3rd ed. London: Sage.

188
Shin, H.K. 2010. The relationship between consumer decision-making styles and acculturation:
a study of Korean American golfers in Southern California. Albuquerque, NM: The University of
New Mexico. (Dissertation – D.Phil.).
Smith, S.M. & Albaum, D.S. 2010. An introduction to marketing research.
Solomon, M.R. 2011. Consumer behaviour: buying, having, and being. 8th ed. Upper Saddle
River, NJ: Pearson.
Sontakki, C.N. 2010. Marketing research. Himalaya Publishing House.
Stevens, R.E., Loudon, D.L., Ruddick, E.M., Wrenn, B., & Sherwood, P.K. 2012. The
marketing research guide. 2nd ed. Binghamton, NY: Taylor & Francis.
Struwig, F.W. & Stead, G.B. 2013. Planning, designing and reporting research. Cape Town:
Pearson.
Suresh, S., Rarichandran, S. & Ganesan, P. 2011. Understanding wellness cener loyalty
through lifestyle analysis. Health marketing quarterly, 28(1):16-37.
Sweeney, B. 2015. Singles have money, so why is business ignoring them?
http://www.chicagobusiness.com/article/20150214/ISSUE01/302149982/singles-have-money-
so-why-is-business-ignoring-them Date of access: 17 Jan. 2018.
Szmigin, I. & Piacentini, M. 2018. Consumer behaviour. 2nd ed. Oxford: Oxford University
Press.
Thanyamon, S. 2012. Consumer behaviour in purchasing home furnishing products in
Thailand. Journal of marketing, 1(1):4-12.
The Business dictionary. 2018. Defining differentiation.
http://www.businessdictionary.com/definition/differentiation.html Date of access: 29 Nov 2018
The Dictionary of Marketing. 2018. Defining market aggregation.
https://trackmaven.com/?post_type=dictionary_term&s=market+aggregation Date of access: 29
Nov 2018
The Economic Times. 2018. Definition of niche marketing.
https://economictimes.indiatimes.com/definition/niche-marketing Date of access: 4 Nov 2018

189
Thompson, D. 2013. Meet the 4 new Singleton consumer types that you need to get to know.
https://dma.org.uk/article/meet-the-4-new-singleton-consumer-types-you-need-to-get-tp-
know/1441274 Date of access: 12 Mar 2018.
Vaidya, I.N. 2015. Lifestyle based segmentation of rural consumers of central Gujarat: an
empirical study with special reference to gender and age. Journal of business and
management, 17(7):33-41.
Wiid, J. & Diggines, C. 2009. Marketing research. Lansdowne, Cape Town: Juta.
Wortzel, L.H. 2014. Young adults: single people and single person households. Advances in
consumer research, 4(1):324-329.
Zhou, J.X., Arnold, M.J., Pereira, A. & Yu, J. 2010. Chinese consumer decision-making styles:
a comparison between inland and coastal regions. Journal of business research, 63(1):45-51.
Zikmund, W.G. & Babin, B.J. 2010. Exploring marketing research. 10th ed. Melbourne: South-
Western.
Zikmund, W.G., Babin, B.J., Carr, J.C. & Griffin, M. 2012. Business research methods. 8th ed.
Mason, OH: South-Western.
Zikmund, W.G., D’Alessandi, S., Winzar, H., Lowe, B. & Babin, B. 2017. Marketing research:
Asia-Pacific edition. 4th ed. Cengage.

190
APPENDIX A: QUESTIONNAIRE
Fieldworker initials and surname: Questionnaire number:
This survey forms part of a Master’s study in Marketing Management at the North-West University
(Potchefstroom Campus), with a specific focus on the effect of reference groups and lifestyle
on the buying behaviour of Singletons.
Objective:
The objective of this study is to determine the effect of reference groups and lifestyle on the buying
behaviour of Singletons.
Confidentiality and anonymity:
Participating in this survey is voluntary, and you may withdraw from the process at any time. All
information that you provide will be treated with the highest standard of privacy and will remain
entirely anonymous. No data will be disclosed to any other parties and no data will be reported
on an individual basis.
Results:
The research results will only be used empirically for the written dissertation of the study. All
participants are welcome to request results upon completion of the study.
Completing the questionnaire should take approximately 10 minutes of your time. When
evaluating a question, please answer from your own perspective, by marking or completing where
required. Please accept my gratitude in anticipation of your willingness to participate in this
research. Should you have any questions, please contact Dr R.H. Goldberg at 018 285 2207 or
Yours faithfully
Liani Groenewald
Supervisors: Dr R.H. Goldberg
Prof. L.R. Jansen van Rensburg

191
SECTION A – SCREENING QUESTIONS
Are you older than 18? Yes No
Are you single? Yes No
Do you live alone? Yes No
If your answer is ‘Yes’ to all the above questions, please complete the questionnaire.
If your answer is ‘No’ to all the above questions, you do not have to complete the questionnaire.
SECTION B – REFERENCE GROUPS
Please indicate your level of agreement with the following statements on a scale of 1 to 7 where 1 = ‘Strongly disagree’ and 7 = ‘Strongly agree’.
Statement
Str
on
g
ly
dis
ag
r
ee 2 3 4 5 6
Str
on
g
ly
ag
ree
B1 I rarely purchase the latest fashion styles until I am sure my friends will approve of them.
1 2 3 4 5 6 7
B2 It is important that others like the products and brands I use.
1 2 3 4 5 6 7
B3 When buying products, I generally purchase those brands that I think others will approve of.
1 2 3 4 5 6 7
B4 If other people can see me using a product, I often purchase the brand they expect me to buy.
1 2 3 4 5 6 7
B5 I like to know what brands and products make good impressions on others.
1 2 3 4 5 6 7
B6 I achieve a sense of belonging by purchasing the same products and brands that others purchase.
1 2 3 4 5 6 7
B7 If I want to be like someone, I often try to buy the same brands that they buy.
1 2 3 4 5 6 7
B8 I often identify with other people by purchasing the same products and brands they purchase.
1 2 3 4 5 6 7
B9 To make sure I buy the right product or brand, I often observe what others are buying and using.
1 2 3 4 5 6 7
B10 If I have little experience with a product, I often ask my friends about the product.
1 2 3 4 5 6 7
B11 I often consult other people to help choose the best alternative from a product class.
1 2 3 4 5 6 7
B12 I frequently gather information from friends or family about a product before I buy.
1 2 3 4 5 6 7

192
SECTION C – LIFESTYLE
Please indicate how you feel about the following statements on a scale of 1 to 7, where 1 = ‘strongly disagree’ and 7 = ‘strongly agree’.
C1 – Fashion Consciousness
Statement
Str
on
gly
dis
ag
ree
2 3 4 5 6
Str
on
gly
ag
ree
C1.1 I usually have one or more outfits that are of the very latest style.
1 2 3 4 5 6 7
C1.2 When I must choose between the two, I usually dress for fashion, not for comfort.
1 2 3 4 5 6 7
C1.3 An important part of my life and activities is dressing smartly.
1 2 3 4 5 6 7
C1.4 I often try the latest hairstyles when they change.
1 2 3 4 5 6 7
C1.5 I dress more fashionably than most people do. 1 2 3 4 5 6 7
C1.6 People can realise your social status by looking at the brand of clothes you wear.
1 2 3 4 5 6 7
C1.7 I read fashion-related magazines. 1 2 3 4 5 6 7
C1.8 I consult the internet for the latest fashion and styles.
1 2 3 4 5 6 7
C1.9 I spend a lot of time talking with my friends about the latest fashion trends.
1 2 3 4 5 6 7
C1.10 I like to watch fashion-related programs on television.
1 2 3 4 5 6 7
C2 – Cost-Consciousness
Statement
Str
on
gly
dis
ag
ree
2 3 4 5 6
Str
on
gly
ag
ree
C2.1 I shop for specials. 1 2 3 4 5 6 7
C2.2 I find myself checking the prices in the grocery store even for small items.
1 2 3 4 5 6 7
C2.3 I usually watch the advertisements for announcements of sales.
1 2 3 4 5 6 7
C2.4 A person can save a lot of money by shopping around for bargains.
1 2 3 4 5 6 7
C2.5 I like to pay cash for everything I buy. 1 2 3 4 5 6 7

193
C3 – Health-Consciousness
Statement
Str
on
gly
dis
ag
ree
2 3 4 5 6
Str
on
gly
ag
ree
C3.1 I drink a lot of water or low-calorie drinks. 1 2 3 4 5 6 7
C3.2 I prefer to buy low-calorie, healthy foods. 1 2 3 4 5 6 7
C3.3 I do physical exercises regularly. 1 2 3 4 5 6 7
C3.4 I would say that I lead a healthy lifestyle. 1 2 3 4 5 6 7
C4 – Recreation
Statement
Str
on
gly
dis
ag
ree
2 3 4 5 6
Str
on
gly
ag
ree
C4.1 I thoroughly enjoy my leisure time. 1 2 3 4 5 6 7
C4.2 Leisure is worth the extra money spent for it. 1 2 3 4 5 6 7
C4.3 I would rather enjoy leisure time than work hard. 1 2 3 4 5 6 7
C4.4 I prefer to do nothing but watch TV or movies during the holidays.
1 2 3 4 5 6 7
C5 – E-shopping
Statement
Str
on
gly
dis
ag
ree
2 3 4 5 6
Str
on
gly
ag
ree
C5.1 I think online buying is a novel, fun way to shop. 1 2 3 4 5 6 7
C5.2 E-shopping is easier than local shopping. 1 2 3 4 5 6 7
C5.3 I like browsing on the internet. 1 2 3 4 5 6 7
C5.4 I think e-shopping offers lower prices than local stores.
1 2 3 4 5 6 7
C5.5 I enjoy buying things on the internet. 1 2 3 4 5 6 7
C5.6 Buying things on the internet scares me. 1 2 3 4 5 6 7
C5.7 I think e-shopping offers a better selection than local stores.
1 2 3 4 5 6 7

194
C6 – Career orientation
Statement
Str
on
gly
dis
ag
ree
2 3 4 5 6
Str
on
gly
ag
ree
C6.1 My work is stressful. 1 2 3 4 5 6 7
C6.2 My work is of primary importance to me in life. 1 2 3 4 5 6 7
C6.3 My work is my true identity. 1 2 3 4 5 6 7
C6.4 I lack perseverance and focus to achieve goals. 1 2 3 4 5 6 7
C6.5 My work gives me satisfaction. 1 2 3 4 5 6 7
SECTION D – DEMOGRAPHIC INFORMATION
D1. How old are you?
18 to 29 years 1
30 to 39 years 2
40 to 49 years 3
50 to 59 years 4
60 to 69 years 5
70 or older 6
D2. What is your monthly disposable income?
D3. What is your gender?
Male 1
Female 2
Prefer not to say 3
Less than R10 000 p.m. 1
R11 000 to R20 000 p.m. 2
R21 000 to R30 000 p.m. 3
R31 000 to R40 000 p.m. 4
More than R40 000 p.m. 5
Prefer not to say 6

195
D4. Please indicate your highest level of education:
Primary school completed 1
Matric / Grade 12 completed 2
Technical College diploma 3
University or Technology diploma 4
University degree (B-degree or Honours) 5
Postgraduate degree (Masters or Doctorate) 6
D5. Please specify your current occupation:
Thank you for taking the time to partake in this study!

196
APPENDIX B: LETTER OF INVITATION
Dear XYZ 15 October 2018
This is an invitation to participate in a research study focusing on the newly identified Singleton consumer
segment in South Africa. I am currently conducting research towards a Master’s degree in Marketing
Management at the North-West University, with specific focus on the effect of reference groups and lifestyle
on the buying behaviour of Singletons.
Objective:
The purpose of this study is to gain a profound understanding of what it entails to be s Singleton. The
information accumulated will enable marketers to identify and apprehend this new consumer segment,
aiding them in their task of creating appropriate products, services and marketing campaigns.
Sample and methodology:
The researchers aims to use self-administrated questionnaire, where the respondents will be able to
complete the questionnaire by themselves. Trained fieldworkers will be responsible for identifying
respondents who qualify to partake in the study by asking them screening questions. Upon completing the
questionnaire the trained fieldworkers will be present should the respondents have any questions. It will
take the respondent approximately 10 to 15 minutes to complete the questionnaire.
Confidentiality and anonymity:
All results will be used as empirical research for the written Master’s Dissertation on the topic under study.
All research participants are welcome to request results upon completion of this study.
Participation:
If you are willing to complete the self-administrated questionnaire, the fieldworkers will provide a
questionnaire for you to fill in. Upon completion of answering the questionnaire, the trained fieldworkers will
collect it from you.
Please accept my thanks in anticipation of your willingness to participate in this research study. Feel free
to contact me directly with any queries.
Private Bag X6001, Potchefstroom
South Africa 2520
Tel: 018 299-1111/2222
Web: http://www.nwu.ac.za

197
Yours sincerely,
…………………….
Liani Groenewald
Master Student
Mobile: 082 826 1870
Email: [email protected]
Student number: 25032194
Promoters: Dr R Goldberg (NWU) and Prof. L.R.J van Rensburg (NWU)

198
APPENDIX C: STATISTICAL ANALYSIS

199
APPENDIX D: LETTER FROM LANGUAGE EDITOR
Declaration
This is to declare that I, Dr. L Combrink
Language editor and translator
have language edited the study
with the title
THE EFFECT OF REFERENCE GROUPS AND LIFESTYLE ON THE BUYING BEHAVIOUR OF
SINGLETONS
by
LIANI GROENEWALD
Date: 17 May 2019

200
APPENDIX E: LETTER FROM TECHNICAL EDITOR