Embed Size (px)
Citation preview

The Effect of Restorative
Juvenile Justice on Future Educational Outcomes
Iryna Rud, Chris Van Klaveren,
Wim Groot, Henriëtte Maassen van den Brink
TIER WORKING PAPER SERIES
TIER WP 14/01
The E�ect of Restorative Juvenile Justice on Future
Educational Outcomes∗
Iryna Rud
Chris Van Klaveren
Wim Groot
Henriette Maassen van den Brink
Abstract
In this article, we study the e�ects of a Dutch restorative justice program for adoles-
cent �rst-time o�enders on early school leaving and years of education attained. Causal
statistical estimates are presented using data from a randomized experiment, in which
944 adolescent o�enders are randomly assigned to the experimental condition, and by
linking these data to registration data that track the educational careers of all adoles-
cents in the Netherlands. We �nd that the program reduces early school leaving by 6
percentage points and increases years of education attained by 0.29 years. The �ndings
show that restorative juvenile justice programs have signi�cant educational bene�ts and
should be considered as a tool to reduce early school leaving and increase educational
attainment.
JEL Codes: I2, K4, C93
Keywords: Restorative Justive, Education, Juvenile Crime, Field Experiment
1 Introduction
For most types of crime, there is a negative association between education and criminal
behavior (see Lochner, 2010). The impact of education on criminal behavior has been well
∗We thank Bill Evans, Randi Hjalmarsson, Mathew Lindquist, Hessel Oosterbeek, Erik Plug, and DinandWebbink for valuable comments and discussions. Furthermore, we thank participants of the SOLE, EEA-ESAM and ESPE conference for providing valuable comments and the Dutch Ministry of Security and Justicefor providing us the experimental data.
1

documented for adults (see Becker, 1968; Lochner and Moretti, 2004; Machin et al., 2011a)
and for the e�ect of educational interventions on criminal behavior (see Grossman and Tier-
ney, 1998; Rodriguez-Planas, 2012; Heller et al., 2013). The empirical results generally
indicate that more schooling or speci�c educational interventions can lead to a signi�cant
decrease in criminal activity. Hence, it is argued that educational interventions can be used
to �ght crime (see, for example, Meghir et al., 2011; Hjalmarsson et al., 2011).
Part of the observed negative correlation between educational and criminal outcomes is
likely to be produced by unobserved individual characteristics. This has been the reason
why many empirical studies have exploited exogenous variation in educational outcomes to
obtain a better estimate of the e�ect of education on criminal activity. Remarkably, little
attention has been paid to the reverse relation: whether reducing criminal involvement at a
young age can improve educational outcomes or whether criminal prevention policies can be
used to improve educational outcomes (some positive exceptions are McGarvey et al., 2007;
Hjalmarsson, 2008; Webbink et al., 2013). This lack of attention may have been caused
by the lack of exogenous variation with respect to criminal juvenile activity to identify the
causal impact of crime prevention on educational outcomes. This study exploits exogenous
variation from a large randomized �eld experiment in the Netherlands to estimate the e�ects
of a Dutch restorative justice program for juvenile o�enders on early school leaving and
educational attainment.
The Dutch restorative justice program Halt is targeted at juvenile �rst-time o�enders,
aged between 12 and 18, who committed a non-violent crime. Halt is incorporated in the
Dutch juvenile justice system. The program aims to change the behavior and attitudes
of juvenile �rst-o�enders by addressing their behavioral and development problems. The
program explicitly emphasizes that it cooperates with schools to create a more safe living-
and learning environment in which students can achieve better educational outcomes.
Many countries, including the US, Canada, Australia and the UK, have integrated very
similar restorative justice programs in their juvenile justice system. Restorative justice pro-
grams are sometimes also referred to as intermediate punishment (Morris and Tonry, 1990),
community justice (Bazemore and Schi�, 1996) and alternative sanctions (Kahan, 1996).
Similarly to Halt, these programs rely on sociological theories to prevent juveniles from
re-o�ending by improving their social behavior, and attitudes. Improving behavior and at-
titudes may reduce the chance of re-o�ending directly, but also indirectly through its e�ects
on educational achievements. It is the latter relation that is the topic of this paper.
A few previous studies have examined the e�ects of criminal outcomes on schooling out-
2
comes. Webbink et al. (2013) use twin-information from the Australian Twin Register and
�nd that being arrested before the age of 18 results in 0.7 to 0.9 fewer years of education
and lowers the probability of �nishing high school by 20 to 23 percentage points. They
furthermore show that the impact of being arrested is largest for children between the age
of 13 and 15. McGarvey et al. (2007) use school-level data from a large urban district in
the U.S. and apply an instrumental variable analysis to examine how schooling outcomes are
a�ected by school and neighborhood crime. They use instruments, such as the total number
of adults in the school and distance from school to the nearest public housing, and argue
that these factors a�ect schooling outcomes only through their correlation with crime and
socioeconomic status. Their study suggests that school violence and neighborhood violence
each have a negative e�ect on schooling outcomes. More precisely, they �nd that an addi-
tional violent incident in a school is associated with a 4 percentage point decline in academic
pass rate. Hjalmarsson (2008) examines whether previous criminal involvement a�ects high
school graduation using U.S. data. Following Altonji et al. (2005), she uses a linear multi-
level probability model to examine the potential e�ects of selection on unobservables. The
results suggest that arrest (incarceration) before the age of 16 reduces the probability of
graduating from high school by 11 (26) percentage points.
The Big Brothers Big Sisters program (BBBS), the Quantum Opportunity Project (QOP)
and the `Becoming a Man' program (BAM) are particularly interesting for this study. These
programs are not targeted at adolescents who are �rst-o�enders, but similarly to most
restorative justice programs they aim to improve schooling and criminal outcomes by chang-
ing the behavior of adolescents at-risk (i.e. adolescents who live in low-income, racially
segregated and criminal neighborhoods). These programs were moreover evaluated through
large-scale randomized �eld experiments which enabled estimation of the program's causal
impact on educational and criminal outcomes.Grossman and Tierney (1998) evaluate BBBS,
a mentoring program for juveniles aged between 10 and 16. The empirical results indicate
that the program improved the academic performance of girls and reduces violence in school
and substance abuse. Rodriguez-Planas (2012) evaluated the QOP, which also provides
mentoring, but additionally provides educational services and �nancial rewards to juveniles
at-risk at the age of 14 or 15. The �nancial rewards implied that adolescents received a
�nancial reward if they obtain a high school diploma and if they continue their education
at the postsecondary level. The empirical results indicate that the program has weak posi-
tive e�ects on educational outcomes and a reducing e�ect on criminal activity for youths in
the top-half of the risk distribution. The program, however, was not e�ective for youths in
3
the bottom-half of the risk distribution. Heller et al. (2013) evaluated BAM which exposes
adolescents to regular interactions with pro-social adults, keeps adolescents busy during the
high-risk after-school hours, and implements aspects of cognitive behavioral therapy. The
empirical outcomes indicate that educational outcomes are positively in�uenced and that
the amount of violent crime-arrests has reduced. The results of these studies therefore sug-
gest that that educational programs may signi�cantly in�uence educational and criminal
outcomes, and hence, it may be that restorative justice programs establish a similar e�ect.
This study uses data from a unique �eld experiment that was conducted in 2003. In this
experiment 1,064 juvenile �rst-o�enders who were who are apprehended by the police for
a non-violent o�ense were invited to participate in the Halt-experiment. Juveniles had an
incentive to participate in the experiment because by participation they avoided criminal
charges and a criminal record. 944 juveniles agreed to participate in the experiment and
were randomly assigned to the Halt program and a control group. Juvenile �rst-o�enders
assigned to the control group were sent home without a criminal record and criminal charges,
but with the obligation to come back after 6 months to complete a questionnaire.
To determine the program e�ects on early school leaving and educational attainment, we
linked the experimental data to education data of Statistics Netherlands, such that we could
track the educational careers of juvenile �rst-o�enders who were invited to participate in the
experiment. 19 percent of the juveniles in the Halt group did not complete the program and
to control for the potential bias that is imposed by the (un)observed selective dropout we
apply an instrumental variable approach in which we instrument actual participation by the
assignment status.
The empirical results show that the restorative justice program Halt reduces early school
leaving by 6 percentage points and increases years of education attained by 0.29 years. Tests
for heterogeneous treatment e�ects indicate that there are insigni�cant di�erences for sub-
groups in the sense that the program e�ects are (insigni�cantly) smaller for boys, adolescents
whose parents are born in the Netherlands and juveniles in single parent households. Our
�ndings therefore show that criminal intervention programs targeted at juveniles can sig-
ni�cantly improve educational outcomes and, hence, that criminal policies can be used to
improve educational outcomes.
This study contributes in several ways to the literature on criminal and educational
outcomes. First of all, our study is the �rst that evaluates the causal impact of a restorative
justice program on educational outcomes. Hence, it is also the �rst study that empirically
shows that criminal intervention programs signi�cantly reduces early school leaving and
4
increases years of education. Because the Dutch program appears to be representative for
restorative justice programs in many other countries it is informative about the potential
e�ects that restorative justice may have in these countries.
The second contribution is that this study not only focuses on the short-term program
e�ects, as is often the case in randomized �eld experiments, but also examines the medium-
and long-term program e�ects (e.g. see Reynolds et al., 1997).
Finally, the empirical �ndings of this study contribute to the current debate on the value
and cost-e�ectiveness of restorative justice programs, which takes place in many countries,
such as the U.K., Canada and the U.S. (Carreira Da Cruz, 2010). Restorative justice pro-
grams are rather controversial because they are implemented on a large scale, while there is
no consistent evidence that it reduces criminal outcomes (see Miers et al., 2001; Sherman and
Strang, 2007) and (until now) no evidence that it improves educational outcomes. Neverthe-
less, the costs of restorative justice programs are often assumed to be lower than the costs
of the traditional justice system (Sherman et al., 2010; Murphy, 2008). The program costs
of Halt are ¿485 per person (KPMG, 2011) and this allows us to translate the estimated
e�ect sizes into the costs per early school leaver less.
This study proceeds as follows. Section 2 describes the restorative justice program Halt.
Section 3 discusses the experimental design of the study. Section 4 describes the data and
descriptive statistics. Section 5 shows and discusses the estimation strategy and empirical
�ndings. Finally, Section 6 concludes.
2 Restorative Justice Program Halt
The restorative justice program Halt1 was initiated in 1981 and is aimed to combat and pre-
vent vandalism among juveniles. In 1995 the program was integrated in the Dutch juvenile
justice system. It is targeted towards adolescent �rst-o�enders who have been apprehended
by the police, among others, for vandalism, theft or �rework nuisance. Appendix A presents
the full list of o�enses for which juveniles are sent to the Halt program. An important
argument for integrating Halt in the Dutch juveniles justice system was that criminal of-
fenses often result from behavioral problems or result from problems at home or at school.
According to the Dutch Ministry of Security and Justice it is important to address these
problems at an early stage to prevent that juveniles will continue to commit more, and
1Halt is the Dutch acronym for Het Alternatief, which means The Alternative, and it refers to the factthat the Halt arrangement is an alternative to traditional junvile justice.
5
more serious, o�enses. As a consequence, Halt aims to change the behavior and attitudes
of juvenile �rst-o�enders by addressing their behavioral and development problems. The
program explicitly emphasizes that it cooperates with schools to create a more safe living-
and learning environment in which students can perform better (see also the Halt website
at http://www.halt.nl/index.cfm/site/Halt English).
Adolescent �rst-time o�enders who are apprehended by the police for a Halt-worthy
o�ense are directly referred to the Halt bureau where they are `screened' by professionals.
First juveniles are confronted with the reasons and consequences of their criminal behavior.
They are then presented with a choice between participating in the Halt program or being
sent to the Public Prosecutor. Clearly juveniles have an incentive to participate in and
complete the Halt program because it means that crminal charges and a criminal record is
avoided.
Halt professionals develop individual programs that include sessions with juveniles and
their parents, taking the committed o�ense into account. This results in a tailor-made
punishment program that consists of the following components: more sessions with the
Halt professional, community work, learning assignments and compensating (�nancially)
the damage that was done. A crucial component of the program is that juveniles must
apologize to their victims, if possible. Victims then explain how they were a�ected by
the criminal o�ense, such that juveniles are directly confronted with how their behavior
has a�ected others. The program duration is on average one year and the time spent on
community work and learning assignments varies between 2 and 20 hours per week after-
school time. The variation in time-intensity depends on the committed criminal o�ense and
on the diagnosed emotional or behavioral disorder of the o�ender by the Halt professional.
The program is built on several sociological theories of criminal behavior (see Ferwerda
et al., 2006). We shortly elaborate on the three main sociological theories that underlie the
Halt program: (I) social learning theory (Bandura, 1969), (II) reintegrative shaming the-
ory (Braithwaite, 1989), and (III) strain theory (Merton, 1957; Cloward and Ohlin, 1960).
According to social learning theory, criminal behavior is acquired through observational
learning and therefore it depends largely on social and environmental factors. Halt therefore
confronts juveniles with their antisocial and criminal behavior through learning assignments.
These learning assignments teach �rst o�enders how to re�ect on their own behavior and
show them behavioral `role models' to improve their antisocial behavior. Juvenile �rst of-
fenders moreover receive training, if necessary, such that they are better able to handle their
behavioral disturbances. Juveniles who, for example, tend to behave aggressively follow an
6
Aggression Replacement Training (better known as ART), which is an evidence based cog-
nitive behavioral intervention program that aims to improve social skill competences and
moral reasoning, improve anger management, and reduce aggressive behavior (see, among
others, Goldstein and Glick, 1994, 1999).
Reintegrative Shaming Theory (RST) emphasizes the important role of guilt and shame
feelings for conscience formation and for the observed behavior of �rst o�enders. The neu-
ropsychological literature shows that the part of the brain which controls reasoning and
impulses (Prefrontal Cortex) does not fully mature until the age of 25, and consequently
adolescents are not able to oversee what the consequences are of their actions for others and
for themselves (see, for example, Bogin, 1999; Paus, 2005). This explains for example why
adolescents have a strong preference for high excitement and low e�ort activities (Steinberg,
2005). Because feelings of guilt and shame during adolescence play an important role in
conscience formation it is believed that a program that focuses on these feelings instead
of confronting adolescents only with the (long-term) consequences of their actions is more
e�ective to improve behavior. This is the reason why juvenile �rst o�enders must apolo-
gize to (and sometimes work for) their victims, if possible, so that they feel how victims
were a�ected (in terms of shame and guilt). This in turn should positively impact on their
behavior.
According to the strain theory individuals can be driven into criminal activities because
of social pressure or because it is not possible to achieve the desired status and goals in
a legal way. It is well known that social deprivation highly correlates with juvenile delin-
quency (see, among others, Utting et al., 1993) and in socially deprived neighborhoods the
investments of parents in their children's education are relatively low (Moon, 2010). This is
one of the reasons why many early childhood and adolescent interventions aim at improving
simultaneously crime prevention and educational attainment (e.g. Perry Preschool program,
the Chicago Child-Parent Center, Head Start, the Seattle Social Development Project). Halt
therefore cooperates intensively with school and involves parents in the program in order to
release the social pressure and to improve the educational perspectives.
.
3 Experimental Design
The Halt experiment was an initiative of the Dutch Ministry of Security and Justice and
Beke Consultancy, a specialized research bureau in crime-related research, which conducted
7
the experiment. 1064 adolescent �rst-time o�enders who were caught by the police and
committed a Halt-worthy o�ense (see Appendix A) were invited in 2003 to participate in
the Halt experiment. At the police station they were informed about the nature of the Halt
program and were told that participation in the experiment implies that they would not
get a criminal record and would not be prosecuted by the public prosecutor. Participation
in the Halt experiment was possible if �rst-time o�enders were willing to participate in the
program and if their parents gave their consent. This resulted in 944 participants in the Halt
experiment and 120 adolescents who participated in the Halt program but not in the Halt
experiment.
The 944 participating juveniles were randomly assigned to a treatment group (465) and
a control group (479) at the 12 participating Halt bureaus. There are 62 Halt bureaus in
the Netherlands and the 12 participating Halt bureaus were selectively chosen to ensure that
the experimental sample contained bureaus located in the largest Dutch cities and bureaus
located outside the high urbanized Randstad area. The number of juveniles assigned per
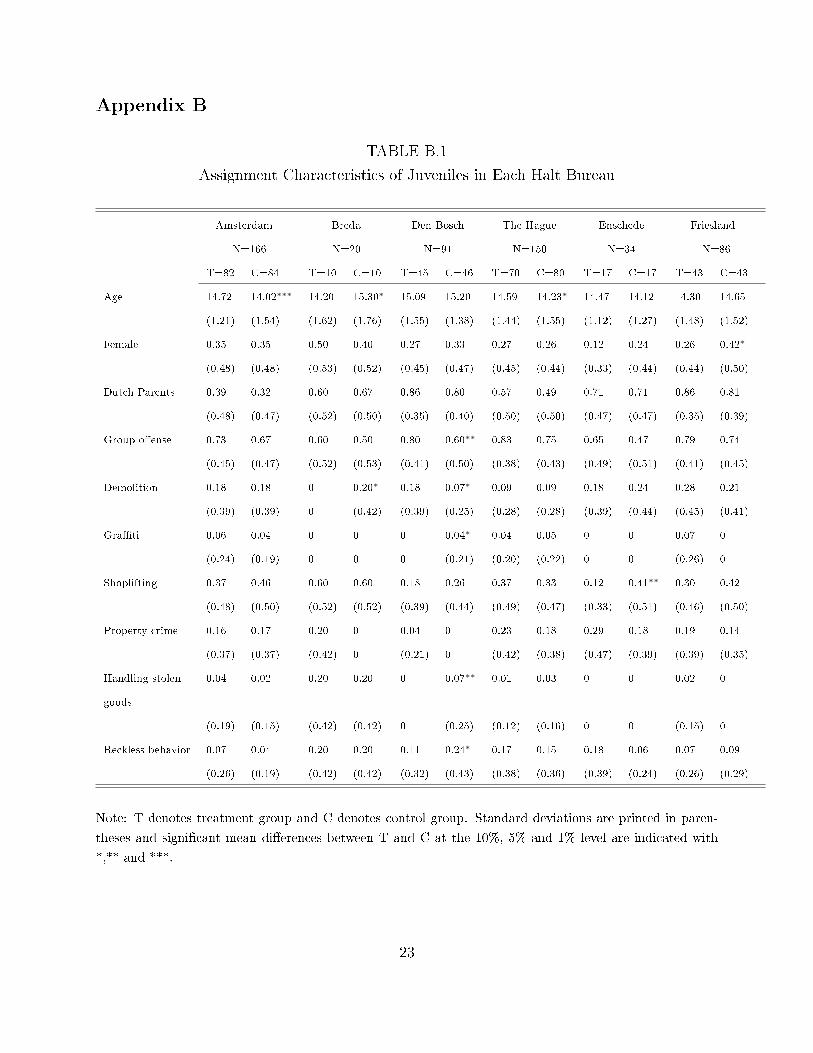
Halt bureau is limited and varies between 20 and 166 juveniles (see Appendix B for the exact
numbers). Schulz and Grimes (2002) and Use of randomisation in clinical trials: a survey
of UK practice (2012) showed that unconditional randomization can lead to imbalances on
baseline characteristics between the treatment and control group and therefore strati�ed
block randomization was used to assign juveniles to the Halt treatment conditionally on age,
gender, ethnicity and type of o�ense.
The randomization was performed in �ve subsequent steps. First, representative Halt
sta� members were appointed by the 12 Halt bureaus and these representatives and the
�rst-time o�enders had to �ll in a �rst-round questionnaire. In the second step, Halt repre-
sentatives provided the researchers of Beke Consultancy with the background characteristics
needed for the randomization (i.e. age, gender, ethnicity, whether a group o�ense was com-
mitted and type of o�ense). In the third step, strati�ed block randomization was applied to
assign juvenile �rst-o�enders to the Halt program and to a control group. To avoid contam-
ination, group o�enders were assigned to the treatment or the control group as one group.
In the empirical analysis it is therefore crucial to cluster the standard errors at the level of
the group in which the o�ense was committed. In step four, researchers informed Halt rep-
resentatives on who was assigned to the Halt program and who was assigned to the control
group. In the �nal step, juveniles received information on whether they had to participate
in the Halt program.
All 944 juveniles and their parents had to return to the Halt bureau six months after the
8
�rst Halt-meeting to complete a second-round questionnaire. To encourage participation,
they received 15 euros during this visit. Still, the main incentive of juveniles to participate
in the experiment and to complete the experiment successfully was that it released them
from any juridical charges. For juveniles in the treatment group, completion also meant
completing the entire Halt program. Juveniles from the Halt group who did not appear at
the second-round questionnaire meeting, even after sending reminders, were considered as
program dropouts. Even though there were strong incentives to complete the program, 91
juveniles dropped out of the Halt program, and as a consequence were prosecuted by the
public prosecutor and obtained a criminal record.
4 Data and Descriptive Statistics
This study links the Halt experimental data to registration data of Statistics Netherlands that
tracks the educational careers of all Dutch adolescents in secondary and vocational education
between 2004 and 2010. The Halt experimental data contain a wide range of background
and assignment characteristics for the 944 juveniles who participated in the Halt experiment
and their parents, and contain background characteristics for the 120 juveniles who refused
to participate in the Halt experiment.
The educational tracking system for students in secondary and vocational education was
initiated by the Dutch Ministry of Education in 2003 to determine the number of early
school leavers. All Dutch students received a personal identi�cation number and their en-
rollment status in secondary and vocational education was registered. The registration data
furthermore contain information on ethnicity, family structure, secondary education type,
grade and living area. The educational tracking data allow us to follow juveniles in their
educational careers six years after enrolment in the Halt program.
The number of years of education attained can be directly derived from the educational
tracking data and based on the information on education type and grade for each student
each year. Information on early school leaving is derived from the educational tracking data
using the de�nition of the Dutch Ministry of Education (2012). This de�nition states that
students are not considered as early school leavers if they are (1) registered in secondary
or vocational education, or (2) �nished senior general secondary, pre-university, or a level 2
post-secondary vocational education with a diploma.
Table 1 presents the characteristics of the participants in the experimental group and
compares the assignment characteristics of juveniles assigned to Halt and the control group.
9
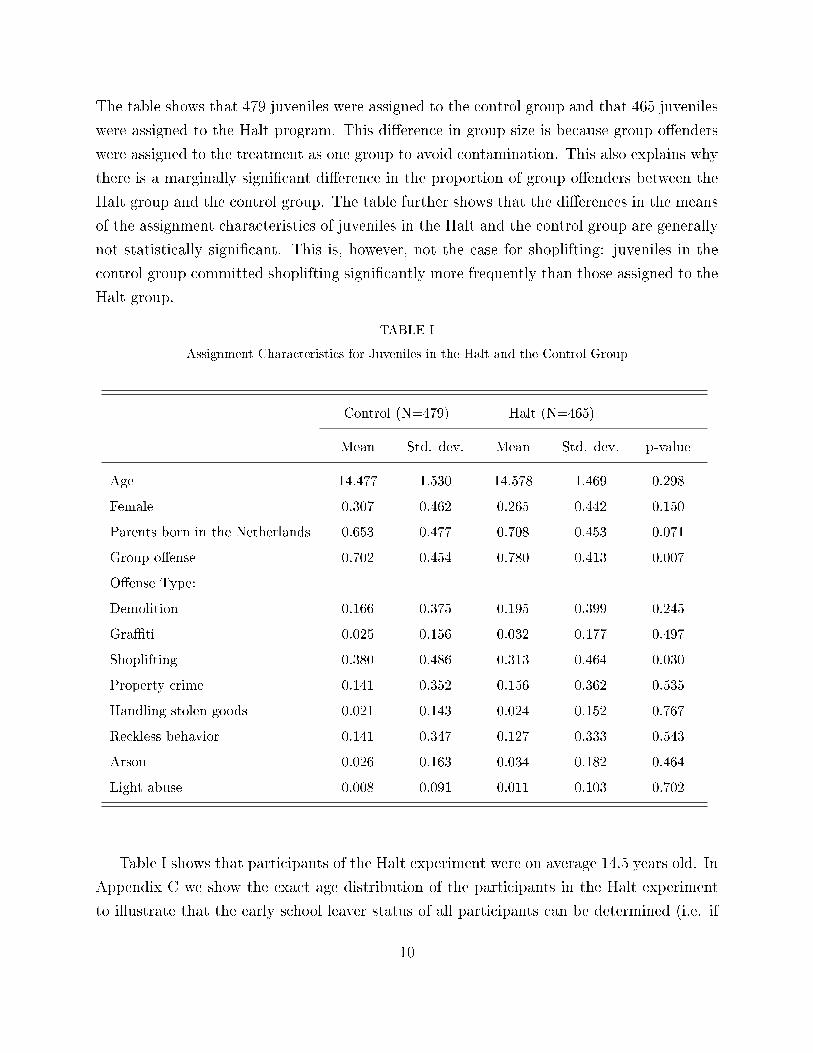
The table shows that 479 juveniles were assigned to the control group and that 465 juveniles
were assigned to the Halt program. This di�erence in group size is because group o�enders
were assigned to the treatment as one group to avoid contamination. This also explains why
there is a marginally signi�cant di�erence in the proportion of group o�enders between the
Halt group and the control group. The table further shows that the di�erences in the means
of the assignment characteristics of juveniles in the Halt and the control group are generally
not statistically signi�cant. This is, however, not the case for shoplifting: juveniles in the
control group committed shoplifting signi�cantly more frequently than those assigned to the
Halt group.
TABLE I
Assignment Characteristics for Juveniles in the Halt and the Control Group
Control (N=479) Halt (N=465)
Mean Std. dev. Mean Std. dev. p-value
Age 14.477 1.530 14.578 1.469 0.298
Female 0.307 0.462 0.265 0.442 0.150
Parents born in the Netherlands 0.653 0.477 0.708 0.453 0.071
Group o�ense 0.702 0.454 0.780 0.413 0.007
O�ense Type:
Demolition 0.166 0.375 0.195 0.399 0.245
Gra�ti 0.025 0.156 0.032 0.177 0.497
Shoplifting 0.380 0.486 0.313 0.464 0.030
Property crime 0.141 0.352 0.156 0.362 0.535
Handling stolen goods 0.021 0.143 0.024 0.152 0.767
Reckless behavior 0.141 0.347 0.127 0.333 0.543
Arson 0.026 0.163 0.034 0.182 0.464
Light abuse 0.008 0.091 0.011 0.103 0.702
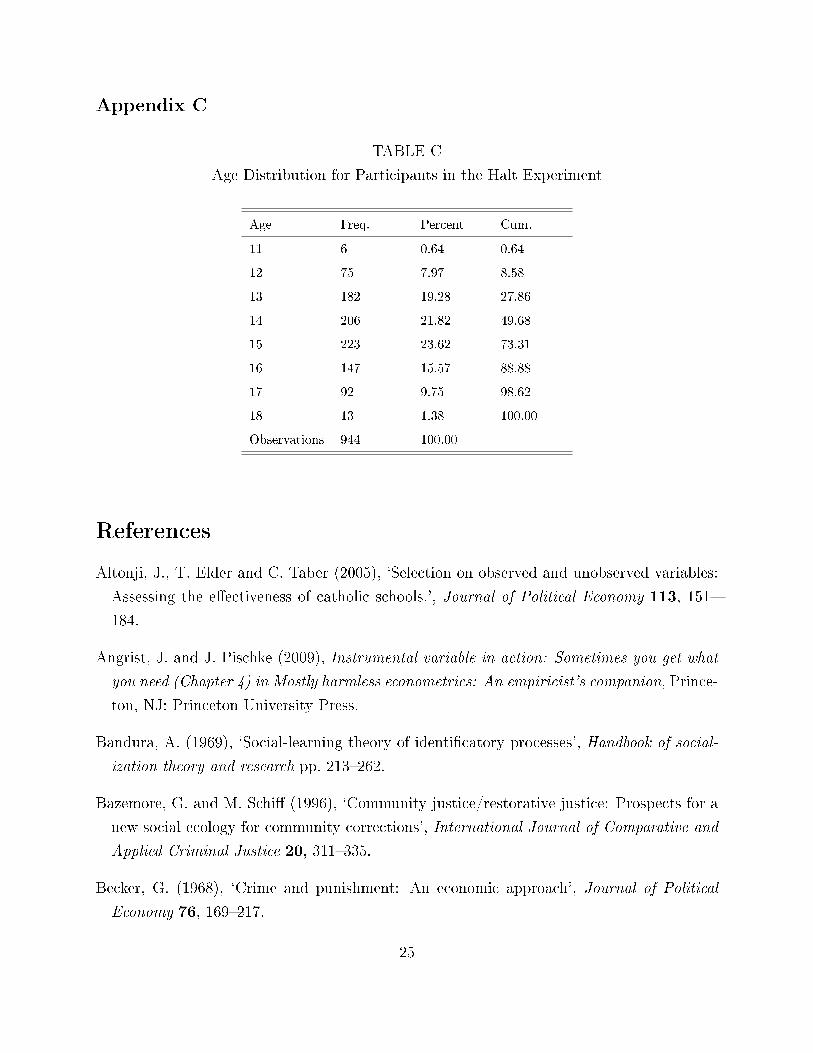
Table I shows that participants of the Halt experiment were on average 14.5 years old. In
Appendix C we show the exact age distribution of the participants in the Halt experiment
to illustrate that the early school leaver status of all participants can be determined (i.e. if
10
they �nished a senior general secondary, pre-university, or a level 2 post-secondary vocational
education with a diploma). Around 30 percent of the o�enders were women and 70 percent
had parents who were born in the Netherlands. Approximately 70 percent of the o�enses
were group o�enses and the most frequently committed o�enses were demolition, shoplifting,
reckless behavior and property crime.
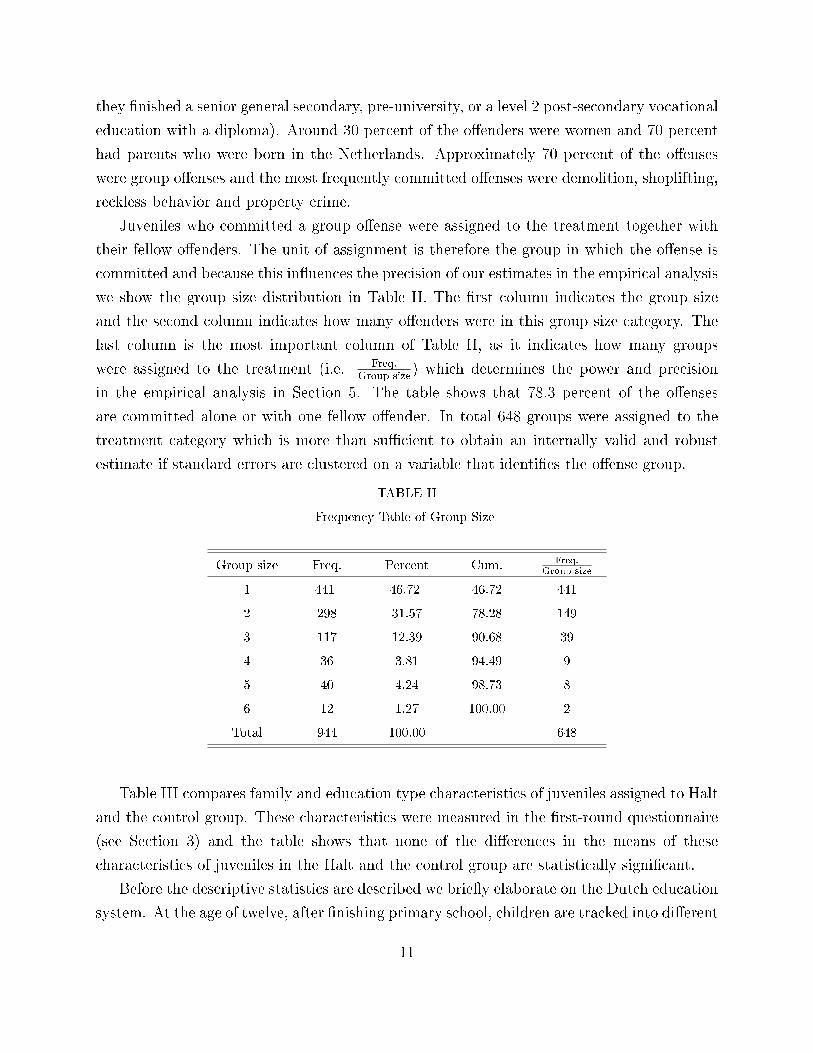
Juveniles who committed a group o�ense were assigned to the treatment together with
their fellow-o�enders. The unit of assignment is therefore the group in which the o�ense is
committed and because this in�uences the precision of our estimates in the empirical analysis
we show the group size distribution in Table II. The �rst column indicates the group size
and the second column indicates how many o�enders were in this group size category. The
last column is the most important column of Table II, as it indicates how many groups
were assigned to the treatment (i.e. Freq.Group size
) which determines the power and precision
in the empirical analysis in Section 5. The table shows that 78.3 percent of the o�enses
are committed alone or with one fellow o�ender. In total 648 groups were assigned to the
treatment category which is more than su�cient to obtain an internally valid and robust
estimate if standard errors are clustered on a variable that identi�es the o�ense group.
TABLE II
Frequency Table of Group Size
Group size Freq. Percent Cum. Freq.
Group size
1 441 46.72 46.72 441
2 298 31.57 78.28 149
3 117 12.39 90.68 39
4 36 3.81 94.49 9
5 40 4.24 98.73 8
6 12 1.27 100.00 2
Total 944 100.00 648
Table III compares family and education type characteristics of juveniles assigned to Halt
and the control group. These characteristics were measured in the �rst-round questionnaire
(see Section 3) and the table shows that none of the di�erences in the means of these
characteristics of juveniles in the Halt and the control group are statistically signi�cant.
Before the descriptive statistics are described we brie�y elaborate on the Dutch education
system. At the age of twelve, after �nishing primary school, children are tracked into di�erent
11
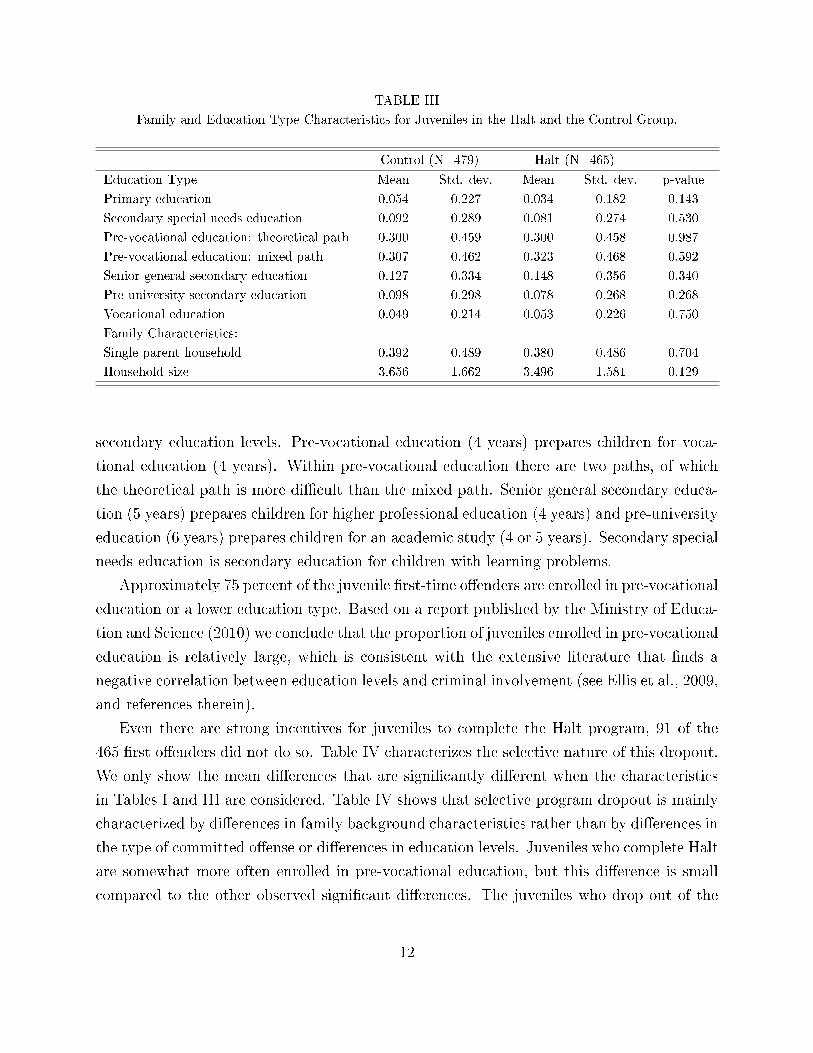
TABLE III
Family and Education Type Characteristics for Juveniles in the Halt and the Control Group.
Control (N=479) Halt (N=465)
Education Type Mean Std. dev. Mean Std. dev. p-value
Primary education 0.054 0.227 0.034 0.182 0.143
Secondary special needs education 0.092 0.289 0.081 0.274 0.530
Pre-vocational education: theoretical path 0.300 0.459 0.300 0.458 0.987
Pre-vocational education: mixed path 0.307 0.462 0.323 0.468 0.592
Senior general secondary education 0.127 0.334 0.148 0.356 0.340
Pre-university secondary education 0.098 0.298 0.078 0.268 0.268
Vocational education 0.049 0.214 0.053 0.226 0.750
Family Characteristics:
Single parent household 0.392 0.489 0.380 0.486 0.704
Household size 3.656 1.662 3.496 1.581 0.129
secondary education levels. Pre-vocational education (4 years) prepares children for voca-
tional education (4 years). Within pre-vocational education there are two paths, of which
the theoretical path is more di�cult than the mixed path. Senior general secondary educa-
tion (5 years) prepares children for higher professional education (4 years) and pre-university
education (6 years) prepares children for an academic study (4 or 5 years). Secondary special
needs education is secondary education for children with learning problems.
Approximately 75 percent of the juvenile �rst-time o�enders are enrolled in pre-vocational
education or a lower education type. Based on a report published by the Ministry of Educa-
tion and Science (2010) we conclude that the proportion of juveniles enrolled in pre-vocational
education is relatively large, which is consistent with the extensive literature that �nds a
negative correlation between education levels and criminal involvement (see Ellis et al., 2009,
and references therein).
Even there are strong incentives for juveniles to complete the Halt program, 91 of the
465 �rst o�enders did not do so. Table IV characterizes the selective nature of this dropout.
We only show the mean di�erences that are signi�cantly di�erent when the characteristics
in Tables I and III are considered. Table IV shows that selective program dropout is mainly
characterized by di�erences in family background characteristics rather than by di�erences in
the type of committed o�ense or di�erences in education levels. Juveniles who complete Halt
are somewhat more often enrolled in pre-vocational education, but this di�erence is small
compared to the other observed signi�cant di�erences. The juveniles who drop out of the
12
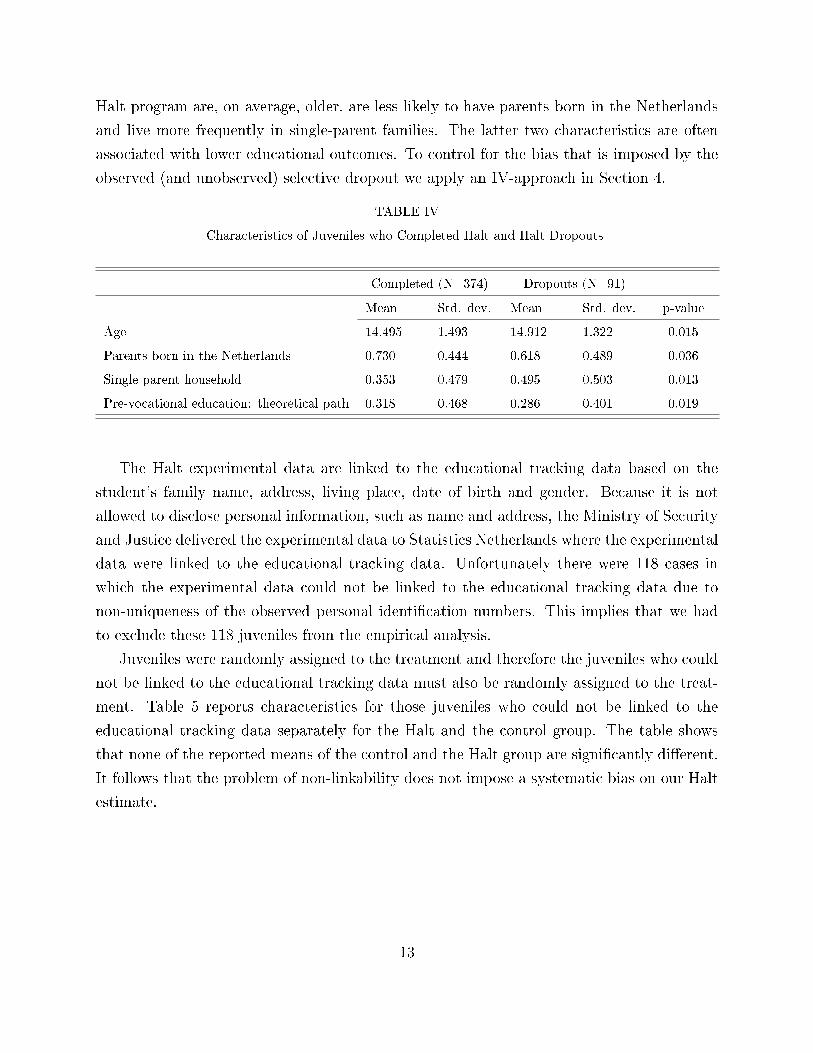
Halt program are, on average, older, are less likely to have parents born in the Netherlands
and live more frequently in single-parent families. The latter two characteristics are often
associated with lower educational outcomes. To control for the bias that is imposed by the
observed (and unobserved) selective dropout we apply an IV-approach in Section 4.
TABLE IV
Characteristics of Juveniles who Completed Halt and Halt Dropouts
Completed (N=374) Dropouts (N=91)
Mean Std. dev. Mean Std. dev. p-value
Age 14.495 1.493 14.912 1.322 0.015
Parents born in the Netherlands 0.730 0.444 0.618 0.489 0.036
Single parent household 0.353 0.479 0.495 0.503 0.013
Pre-vocational education: theoretical path 0.318 0.468 0.286 0.401 0.019
The Halt experimental data are linked to the educational tracking data based on the
student's family name, address, living place, date of birth and gender. Because it is not
allowed to disclose personal information, such as name and address, the Ministry of Security
and Justice delivered the experimental data to Statistics Netherlands where the experimental
data were linked to the educational tracking data. Unfortunately there were 118 cases in
which the experimental data could not be linked to the educational tracking data due to
non-uniqueness of the observed personal identi�cation numbers. This implies that we had
to exclude these 118 juveniles from the empirical analysis.
Juveniles were randomly assigned to the treatment and therefore the juveniles who could
not be linked to the educational tracking data must also be randomly assigned to the treat-
ment. Table 5 reports characteristics for those juveniles who could not be linked to the
educational tracking data separately for the Halt and the control group. The table shows
that none of the reported means of the control and the Halt group are signi�cantly di�erent.
It follows that the problem of non-linkability does not impose a systematic bias on our Halt
estimate.
13
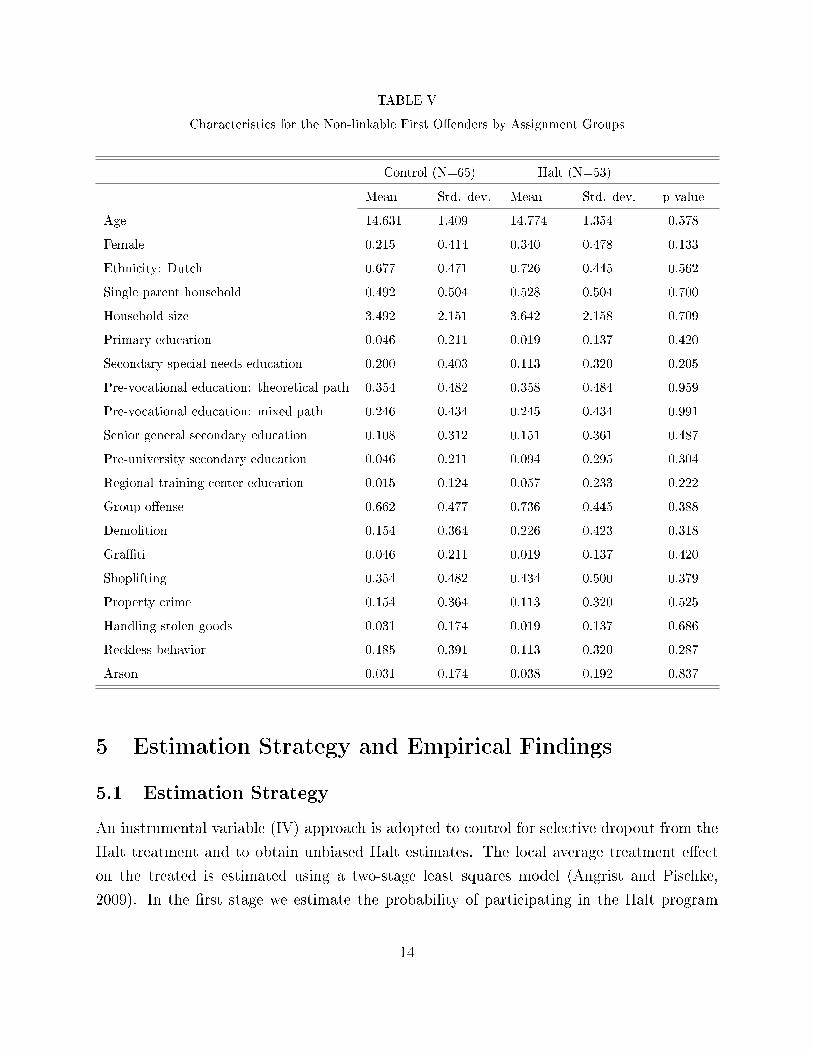
TABLE V
Characteristics for the Non-linkable First O�enders by Assignment Groups
Control (N=65) Halt (N=53)
Mean Std. dev. Mean Std. dev. p-value
Age 14.631 1.409 14.774 1.354 0.578
Female 0.215 0.414 0.340 0.478 0.133
Ethnicity: Dutch 0.677 0.471 0.726 0.445 0.562
Single parent household 0.492 0.504 0.528 0.504 0.700
Household size 3.492 2.151 3.642 2.158 0.709
Primary education 0.046 0.211 0.019 0.137 0.420
Secondary special needs education 0.200 0.403 0.113 0.320 0.205
Pre-vocational education: theoretical path 0.354 0.482 0.358 0.484 0.959
Pre-vocational education: mixed path 0.246 0.434 0.245 0.434 0.991
Senior general secondary education 0.108 0.312 0.151 0.361 0.487
Pre-university secondary education 0.046 0.211 0.094 0.295 0.304
Regional training center education 0.015 0.124 0.057 0.233 0.222
Group o�ense 0.662 0.477 0.736 0.445 0.388
Demolition 0.154 0.364 0.226 0.423 0.318
Gra�ti 0.046 0.211 0.019 0.137 0.420
Shoplifting 0.354 0.482 0.434 0.500 0.379
Property crime 0.154 0.364 0.113 0.320 0.525
Handling stolen goods 0.031 0.174 0.019 0.137 0.686
Reckless behavior 0.185 0.391 0.113 0.320 0.287
Arson 0.031 0.174 0.038 0.192 0.837
5 Estimation Strategy and Empirical Findings
5.1 Estimation Strategy
An instrumental variable (IV) approach is adopted to control for selective dropout from the
Halt treatment and to obtain unbiased Halt estimates. The local average treatment e�ect
on the treated is estimated using a two-stage least squares model (Angrist and Pischke,
2009). In the �rst stage we estimate the probability of participating in the Halt program
14

by regressing the participation status, Hi on a set of covariates, Xi and on a variable that
indicates if a juvenile was assigned to the Halt treatment (Zi=1) or to the control group
(Zi=0):2
Hi = α0 + α1Zi +X ′iα2 + εi. (1)
Subscript i is a student indicator and we assume that the error term, εi, is normally dis-
tributed with mean zero and variance σ2ε . In the second stage we regress the two educational
outcome variables considered in this study (Yij) on the predicted probability of participating
in Halt (i.e. Hi) and on the set of covariates (Xi) included the �rst stage regression:
Yij = β0j + β1jHi +X ′iβ2j + ηij. (2)
Subscript j refers to the fact we consider the educational outcomes early school leaving
(ESL) and After-Program Education Years (APEY ) and therefore estimate two second
stage models. The error term ηij is assumed to be normally distributed with mean zero
and variance σ2ηjand the correlation between ηij and εi are assumed to be nonzero. The
estimated local average treatment e�ect is unbiased because instrument Zi is by construction
uncorrelated with the error terms ηij and εi due to the randomization and can only in�uence
the considered educational outcomes through Hi. We note that the �rst and second stage
equations are estimated simultaneously such that the standard errors are correctly estimated
(Wooldridge, 2009).
5.2 Empirical Findings
Table VI shows the descriptive statistics of the educational outcome variables, early school
leaving and after-program years of education, and shows whether there are signi�cant dif-
ferences between the Halt group and the control group. The Table shows di�erences in
educational outcomes that are favorable for juveniles in the Halt group, but these di�er-
ences are not statistically signi�cant. Selective dropout is however not taken into account
in Table VI, and observed di�erences in the educational outcome variables hence represent
di�erences between juveniles conform their assignment status, not conform their treatment
status. The presented mean di�erences can therefore be viewed as intend-to-treat estimates,
2The covariates included in the regression analysis are age, gender, ethnicity, living in a single-parenthousehold, working status of both parents, household size, group o�ense indicator, o�ense type, educationallevel at the start of the program, if juveniles �nished school before the program started, Halt bureau dummies.
15
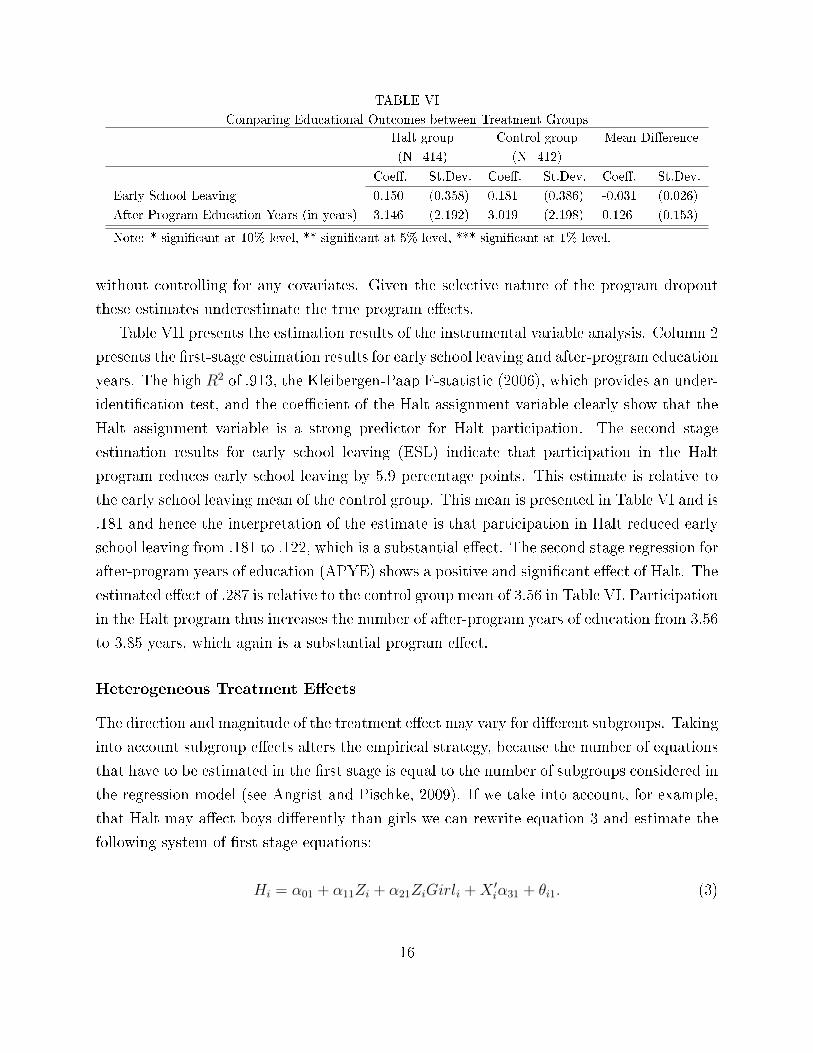
TABLE VI
Comparing Educational Outcomes between Treatment Groups
Halt group Control group Mean Di�erence
(N=414) (N=412)
Coe�. St.Dev. Coe�. St.Dev. Coe�. St.Dev.
Early School Leaving 0.150 (0.358) 0.181 (0.386) -0.031 (0.026)
After-Program Education Years (in years) 3.146 (2.192) 3.019 (2.198) 0.126 (0.153)
Note: * signi�cant at 10% level, ** signi�cant at 5% level, *** signi�cant at 1% level.
without controlling for any covariates. Given the selective nature of the program dropout
these estimates underestimate the true program e�ects.
Table VII presents the estimation results of the instrumental variable analysis. Column 2
presents the �rst-stage estimation results for early school leaving and after-program education
years. The high R2 of .913, the Kleibergen-Paap F-statistic (2006), which provides an under-
identi�cation test, and the coe�cient of the Halt assignment variable clearly show that the
Halt assignment variable is a strong predictor for Halt participation. The second stage
estimation results for early school leaving (ESL) indicate that participation in the Halt
program reduces early school leaving by 5.9 percentage points. This estimate is relative to
the early school leaving mean of the control group. This mean is presented in Table VI and is
.181 and hence the interpretation of the estimate is that participation in Halt reduced early
school leaving from .181 to .122, which is a substantial e�ect. The second stage regression for
after-program years of education (APYE) shows a positive and signi�cant e�ect of Halt. The
estimated e�ect of .287 is relative to the control group mean of 3.56 in Table VI. Participation
in the Halt program thus increases the number of after-program years of education from 3.56
to 3.85 years, which again is a substantial program e�ect.
Heterogeneous Treatment E�ects
The direction and magnitude of the treatment e�ect may vary for di�erent subgroups. Taking
into account subgroup e�ects alters the empirical strategy, because the number of equations
that have to be estimated in the �rst stage is equal to the number of subgroups considered in
the regression model (see Angrist and Pischke, 2009). If we take into account, for example,
that Halt may a�ect boys di�erently than girls we can rewrite equation 3 and estimate the
following system of �rst stage equations:
Hi = α01 + α11Zi + α21ZiGirli +X ′iα31 + θi1. (3)
16

TABLE VII
The Halt E�ects on Early School Leaving (ESL) and After-Program Education Years (APEY)
ESL APEY
1st Stage 2nd Stage 2nd Stage
Halt assignment 0.897∗∗∗
(0.014)
Instrumented Halt participation -0.059∗∗ 0.287∗∗
(0.026) (0.143)
Age -0.006∗ -0.006 -0.724∗∗∗
(0.004) (0.009) (0.052)
Girl 0.002 -0.056∗ -0.09
(0.015) (0.032) (0.166)
Parents born in the Netherlands 0.016 0.057∗ -0.384∗∗
(0.014) (0.031) (0.158)
Household size -0.010∗∗∗ 0.007 0.031
(0.004) (0.009) (0.044)
Other controls Yes Yes Yes
Constant 0.152∗∗ 0.430∗∗ 12.436∗∗∗
(0.068) (0.18) (0.937)
R2 0.9126 0.1318 0.3567
Kleibergen-Paap F-statistic 3876.56
Observations 826
Note: Other controls are dummies for single-parent household, school graduation before Halt, o�ense type,group o�ender, working status of parents. SEs are clustered at the group o�ense level and printed inparenthesis. * signi�cant at 10% level, ** signi�cant at 5% level, *** signi�cant at 1% level.
17
HiGirli = α02 + α12Zi + α22ZiGirli +X ′iα32 + θi2. (4)
In the second stage, the educational outcome variables (Yij) are regressed on the set of
covariates (Xi) and on the predicted participation probabilities resulting from the �rst stage
regressions. The second stage regression when we consider the subgroup e�ects with respect
to gender is then:
Yij = β0j + β1jHi + β2j ˆHiGirli +X ′iβ3j + ηij. (5)
The error terms θi1 and θi2 are assumed to be normally distributed and to be positively
correlated with ηij. Intuitively, β1jmeasures the Halt e�ect for girls on educational outcome
j and β2jmeasures if the Halt e�ect for boys on educational outcome j di�ers from the
estimated e�ect for girls (i.e. di�ers from β1j).
Table VIII shows whether the estimated Halt e�ects on early school leaving and after-
program education years di�er by gender, ethnicity, group o�ense and single-parent family.
We only show the second-stage estimation results, because the system of �rst stage regres-
sions di�ers for each subgroup. Based on the estimated coe�cients the estimation results
suggest that smaller program e�ects are observed for boys, Dutch adolescents and juve-
niles in single parents household. The interaction e�ects are, however, generally statistically
non-signi�cant such that we cannot reject that there are constant program e�ects for the
subgroups considered. Table VIII however shows that the standard errors are larger than
those reported in Table VII, especially for years of education. The standard errors are larger
because two �rst-stage equations are estimated such that more noise is included in the sec-
ond stage regression, and this makes the estimated coe�cients less precise (see also Angrist
and Pischke, 2009). The interaction e�ect for group o�ense is statistically signi�cant for
after-program years of education, which suggests that the program is less e�ective for group
o�enders. This result may possibly be explained by a negative peer-e�ect, in the sense that
the program was less e�ective for those adolescents who were surrounded by peer-o�enders.3
3We also tested whether the program e�ect depends on the type of o�ense. For this purpose we estimated5 and 9 �rst-stage equations (depending on the de�nition of o�ense categories) and this resulted in secondstage estimates that are not so precise. The results are available on request.
18

TABLE VIII
The Halt E�ects on Early School Leaving (ESL) and After-Program Education Years (APEY)
ESL APEY
Girl Halt -0.063∗∗ 0.246
(0.031) (0.172)
Halt*Girl 0.014 0.157
(0.064) (0.356)
Parents born in the Netherlands (PBN) Halt -0.115∗∗ 0.651∗∗
(0.049) (0.300)
Halt*PBN 0.080 -0.517
(0.062) (0.367)
Single Parent Halt -0.076∗∗ 0.385∗∗
(0.031) (0.174)
Halt*Single 0.051 -0.277
(0.066) (0.333)
Group o�ense (G) Halt -0.215∗∗∗ 0.956∗∗∗
(0.064) (0.314)
Halt*G 0.197 -0.876∗∗
(0.073) (0.369)
Observations 826
Note: Control variables are similar to those in Table VII. SEs are clustered at the group o�ense level and
printed in parenthesis. * signi�cant at 10% level, ** signi�cant at 5% level, *** signi�cant at 1% level.
6 Discussion
This is the �rst article that documents that there are statistically signi�cant positive e�ects
of a restorative justice program on the educational outcomes early school leaving and years
of education attained. Previous studies have estimated the causal in�uence of educational
e�ects on criminal outcomes (see, among others, Lochner and Moretti, 2004; Cullen et al.,
2006; Machin et al., 2011b), but the possibility that criminal intervention programs can pos-
itively a�ect the educational outcomes of juveniles tends to be ignored. In many countries
there is, however, a consensus that criminal behavior is determined by (behavioral) problems
at home and school and that criminal behavior of adolescents may lead to more criminal
19
behavior and lower educational outcomes in the future. It is therefore not surprising that
many countries, such as the US, Canada, Australia, the UK and the Netherlands, currently
have very similar restorative punishment programs that are part of the juvenile justice sys-
tem. Because of the similarity in restorative punishment programs between countries, the
results of this study are informative for the potential e�ects that restorative justice can have
on educational outcomes in other countries.
Our estimates indicate that the Dutch restorative justice program, Halt, reduces early
school leaving by 6 percentage points and increases years of education attained by .29 years.
The direction and magnitude of the program e�ect appear to be remarkably similar for
several subgroups considered. Tests for heterogeneous treatment e�ects indicate that the
program e�ects are smaller for boys, adolescents whose parents are born in the Netherlands
and juveniles in single parents household. The interaction e�ects were, however, never sta-
tistically signi�cant. An interesting result for after-program years of education is that the
program tends to be signi�cantly less e�ective for group o�enders. This result possibly
points at a negative peer-e�ect, in the sense that the program was less e�ective for those
adolescents who were surrounded with peer-o�enders.
The IV estimates that early school leaving is reduced by 28 juveniles if 465 juveniles
are treated. The treatment costs for each juvenile are ¿450. The total costs of the HALT
are therefore ¿209,250 (i.e. 465·450) and the costs per early school leaver less are therefore
about ¿7,472. This seems a favorable cost-e�ectiveness and worth the investment, given that
these juveniles leave school with at least a level 2 post-secondary vocational education and
considering that the costs of one extra year of education are roughly similar to the program
costs of Halt for one early school leaver less.
A drawback of the Halt experiment is that juveniles in the control group did not receive
the Halt treatment, but were also not sent to the public prosecutor or obtained a criminal
record. Normally, juvenile �rst-o�enders can choose between Halt participation or being sent
to the public prosecutor and getting a criminal record. The control group thus does not ad-
equately represent the counterfactual outcome and we, as a consequence, estimate the Halt
e�ect relative to receiving no treatment instead of relative to receiving the counterfactual
treatment (i.e. being sent to the public prosecutor and obtaining a criminal record). This
does not a�ect the internal validity of our estimation results, but if the educational out-
comes of �rst-o�enders in the control group di�er from the educational outcomes of juvenile
o�enders who received the counterfactual treatment then we may not estimate the e�ect we
are interested in.
20
Two explanations can be given why educational outcomes of �rst-o�enders in the control
group are a good proxy for the counterfactual educational outcomes. First of all, the risk of
being caught by the police and receiving a criminal record apparently did not prevent these
juveniles to commit a minor o�ense. Juveniles who were asked to participate in the Halt
experiment were moreover not aware that participation could imply receiving no treatment.
Secondly, it is unlikely that a criminal record signi�cantly impacts on educational outcomes
in the long run. Juveniles decided to risk receiving a criminal record, and this risk attitude is
not in�uenced (in the long run) by the fact that they received no treatment and no criminal
record.
In this study we show that restorative justice programs have strong positive e�ects on
educational outcomes. Hence there are positive e�ects from investments in crime prevention
programs on educational outcomes. We therefore conclude that investments in criminal
intervention programs should be considered as a policy tool to reduce early school leaving
and increase the number of years of education. More generally, governments should not
only consider the positive spill-over e�ects of educational investments on crime, but should
also consider that there are positive spill-over e�ects of investments in crime prevention on
educational outcomes for adolescents .
Appendix
Appendix A
Table A shows the o�enses for which juveniles are referred to the Halt program. The �rst
column refers to the section of the book of law, the second column describes the o�ense and
the third column categorizes the o�enses.
21
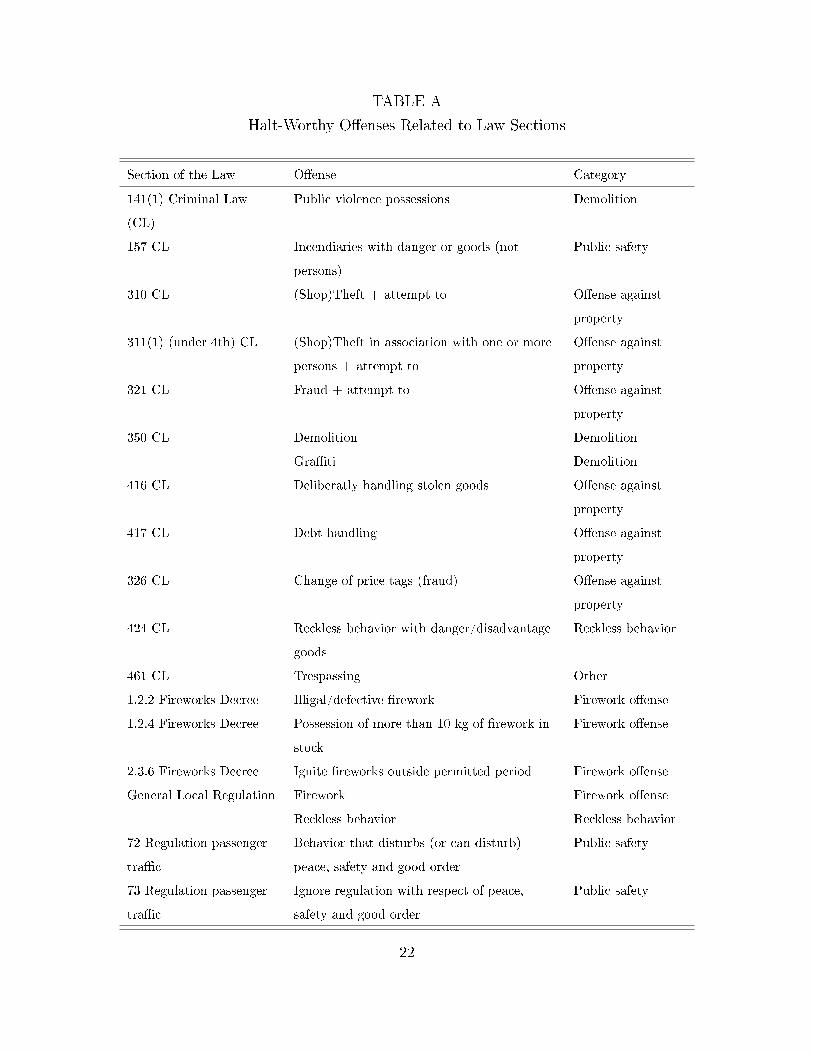
TABLE A
Halt-Worthy O�enses Related to Law Sections
Section of the Law O�ense Category
141(1) Criminal Law
(CL)
Public violence possessions Demolition
157 CL Incendiaries with danger or goods (not
persons)
Public safety
310 CL (Shop)Theft + attempt to O�ense against
property
311(1) (under 4th) CL (Shop)Theft in association with one or more
persons + attempt to
O�ense against
property
321 CL Fraud + attempt to O�ense against
property
350 CL Demolition Demolition
Gra�ti Demolition
416 CL Deliberatly handling stolen goods O�ense against
property
417 CL Debt handling O�ense against
property
326 CL Change of price tags (fraud) O�ense against
property
424 CL Reckless behavior with danger/disadvantage
goods
Reckless behavior
461 CL Trespassing Other
1.2.2 Fireworks Decree Illigal/defective �rework Firework o�ense
1.2.4 Fireworks Decree Possession of more than 10 kg of �rework in
stock
Firework o�ense
2.3.6 Fireworks Decree Ignite �reworks outside permitted period Firework o�ense
General Local Regulation Firework Firework o�ense
Reckless behavior Reckless behavior
72 Regulation passenger
tra�c
Behavior that disturbs (or can disturb)
peace, safety and good order
Public safety
73 Regulation passenger
tra�c
Ignore regulation with respect of peace,
safety and good order
Public safety
22
Appendix B
TABLE B.1
Assignment Characteristics of Juveniles in Each Halt Bureau
Amsterdam Breda Den Bosch The Hague Enschede Friesland
N=166 N=20 N=91 N=150 N=34 N=86
T=82 C=84 T=10 C=10 T=45 C=46 T=70 C=80 T=17 C=17 T=43 C=43
Age 14.72 14.02∗∗∗ 14.20 15.30∗ 15.09 15.20 14.59 14.23∗ 14.47 14.12 14.30 14.65
(1.21) (1.54) (1.62) (1.76) (1.55) (1.38) (1.44) (1.55) (1.12) (1.27) (1.48) (1.52)
Female 0.35 0.35 0.50 0.40 0.27 0.33 0.27 0.26 0.12 0.24 0.26 0.42∗
(0.48) (0.48) (0.53) (0.52) (0.45) (0.47) (0.45) (0.44) (0.33) (0.44) (0.44) (0.50)
Dutch Parents 0.39 0.32 0.60 0.67 0.86 0.80 0.57 0.49 0.71 0.71 0.86 0.81
(0.48) (0.47) (0.52) (0.50) (0.35) (0.40) (0.50) (0.50) (0.47) (0.47) (0.35) (0.39)
Group o�ense 0.73 0.67 0.60 0.50 0.80 0.60∗∗ 0.83 0.75 0.65 0.47 0.79 0.74
(0.45) (0.47) (0.52) (0.53) (0.41) (0.50) (0.38) (0.43) (0.49) (0.51) (0.41) (0.45)
Demolition 0.18 0.18 0 0.20∗ 0.18 0.07∗ 0.09 0.09 0.18 0.24 0.28 0.21
(0.39) (0.39) 0 (0.42) (0.39) (0.25) (0.28) (0.28) (0.39) (0.44) (0.45) (0.41)
Gra�ti 0.06 0.04 0 0 0 0.04∗ 0.04 0.05 0 0 0.07 0
(0.24) (0.19) 0 0 0 (0.21) (0.20) (0.22) 0 0 (0.26) 0
Shoplifting 0.37 0.46 0.60 0.60 0.18 0.26 0.37 0.33 0.12 0.41∗∗ 0.30 0.42
(0.48) (0.50) (0.52) (0.52) (0.39) (0.44) (0.49) (0.47) (0.33) (0.51) (0.46) (0.50)
Property crime 0.16 0.17 0.20 0 0.04 0 0.23 0.18 0.29 0.18 0.19 0.14
(0.37) (0.37) (0.42) 0 (0.21) 0 (0.42) (0.38) (0.47) (0.39) (0.39) (0.35)
Handling stolen
goods
0.04 0.02 0.20 0.20 0 0.07∗∗ 0.01 0.03 0 0 0.02 0
(0.19) (0.15) (0.42) (0.42) 0 (0.25) (0.12) (0.16) 0 0 (0.15) 0
Reckless behavior 0.07 0.04 0.20 0.20 0.11 0.24∗ 0.17 0.15 0.18 0.06 0.07 0.09
(0.26) (0.19) (0.42) (0.42) (0.32) (0.43) (0.38) (0.36) (0.39) (0.24) (0.26) (0.29)
Note: T denotes treatment group and C denotes control group. Standard deviations are printed in paren-
theses and signi�cant mean di�erences between T and C at the 10%, 5% and 1% level are indicated with
*,** and ***.
23
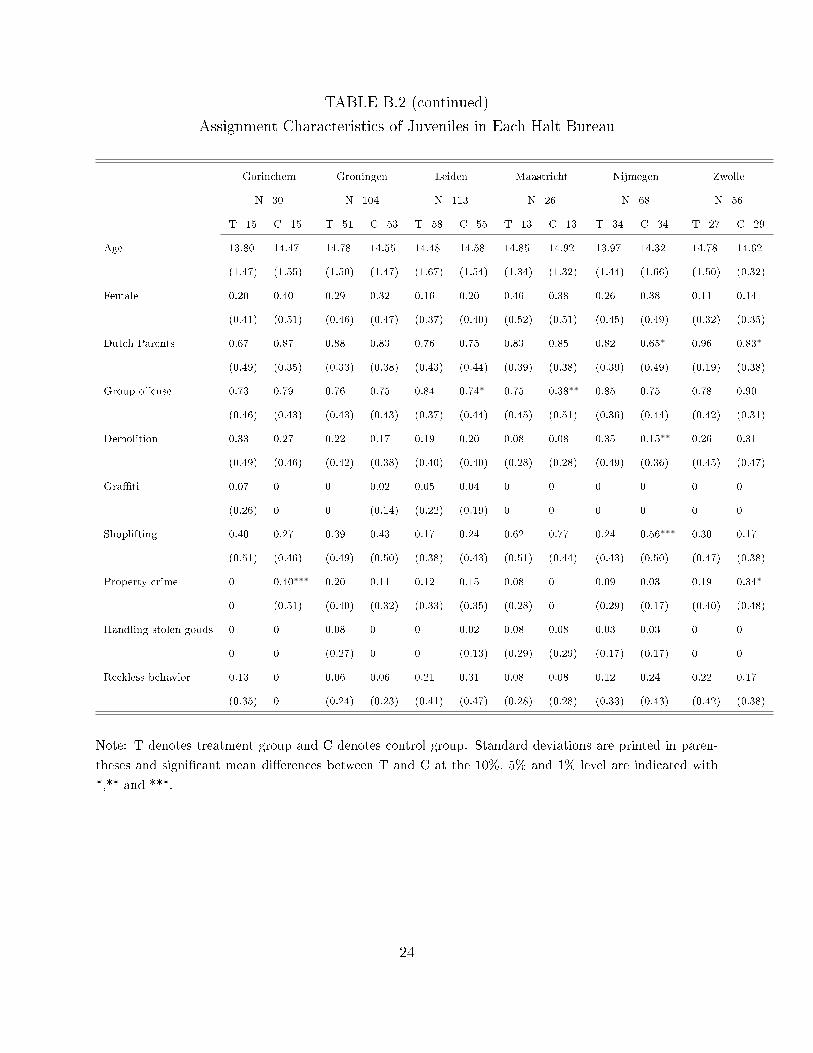
TABLE B.2 (continued)
Assignment Characteristics of Juveniles in Each Halt Bureau
Gorinchem Groningen Leiden Maastricht Nijmegen Zwolle
N=30 N=104 N=113 N=26 N=68 N=56
T=15 C=15 T=51 C=53 T=58 C=55 T=13 C=13 T=34 C=34 T=27 C=29
Age 13.80 14.47 14.78 14.55 14.48 14.58 14.85 14.92 13.97 14.32 14.78 14.62
(1.47) (1.55) (1.50) (1.47) (1.67) (1.54) (1.34) (1.32) (1.44) (1.66) (1.50) (0.32)
Female 0.20 0.40 0.29 0.32 0.16 0.20 0.46 0.38 0.26 0.38 0.11 0.14
(0.41) (0.51) (0.46) (0.47) (0.37) (0.40) (0.52) (0.51) (0.45) (0.49) (0.32) (0.35)
Dutch Parents 0.67 0.87 0.88 0.83 0.76 0.75 0.83 0.85 0.82 0.65∗ 0.96 0.83∗
(0.49) (0.35) (0.33) (0.38) (0.43) (0.44) (0.39) (0.38) (0.39) (0.49) (0.19) (0.38)
Group o�ense 0.73 0.79 0.76 0.75 0.84 0.74∗ 0.75 0.38∗∗ 0.85 0.75 0.78 0.90
(0.46) (0.43) (0.43) (0.43) (0.37) (0.44) (0.45) (0.51) (0.36) (0.44) (0.42) (0.31)
Demolition 0.33 0.27 0.22 0.17 0.19 0.20 0.08 0.08 0.35 0.15∗∗ 0.26 0.31
(0.49) (0.46) (0.42) (0.38) (0.40) (0.40) (0.28) (0.28) (0.49) (0.36) (0.45) (0.47)
Gra�ti 0.07 0 0 0.02 0.05 0.04 0 0 0 0 0 0
(0.26) 0 0 (0.14) (0.22) (0.19) 0 0 0 0 0 0
Shoplifting 0.40 0.27 0.39 0.43 0.17 0.24 0.62 0.77 0.24 0.56∗∗∗ 0.30 0.17
(0.51) (0.46) (0.49) (0.50) (0.38) (0.43) (0.51) (0.44) (0.43) (0.50) (0.47) (0.38)
Property crime 0 0.40∗∗∗ 0.20 0.11 0.12 0.15 0.08 0 0.09 0.03 0.19 0.34∗
0 (0.51) (0.40) (0.32) (0.33) (0.35) (0.28) 0 (0.29) (0.17) (0.40) (0.48)
Handling stolen goods 0 0 0.08 0 0 0.02 0.08 0.08 0.03 0.03 0 0
0 0 (0.27) 0 0 (0.13) (0.29) (0.29) (0.17) (0.17) 0 0
Reckless behavior 0.13 0 0.06 0.06 0.21 0.31 0.08 0.08 0.12 0.24 0.22 0.17
(0.35) 0 (0.24) (0.23) (0.41) (0.47) (0.28) (0.28) (0.33) (0.43) (0.42) (0.38)
Note: T denotes treatment group and C denotes control group. Standard deviations are printed in paren-
theses and signi�cant mean di�erences between T and C at the 10%, 5% and 1% level are indicated with
*,** and ***.
24
Appendix C
TABLE C
Age Distribution for Participants in the Halt Experiment
Age Freq. Percent Cum.
11 6 0.64 0.64
12 75 7.97 8.58
13 182 19.28 27.86
14 206 21.82 49.68
15 223 23.62 73.31
16 147 15.57 88.88
17 92 9.75 98.62
18 13 1.38 100.00
Observations 944 100.00
References
Altonji, J., T. Elder and C. Taber (2005), `Selection on observed and unobserved variables:
Assessing the e�ectiveness of catholic schools.', Journal of Political Economy 113, 151�
184.
Angrist, J. and J. Pischke (2009), Instrumental variable in action: Sometimes you get what
you need (Chapter 4) in Mostly harmless econometrics: An empiricist's companion, Prince-
ton, NJ: Princeton University Press.
Bandura, A. (1969), `Social-learning theory of identi�catory processes', Handbook of social-
ization theory and research pp. 213�262.
Bazemore, G. and M. Schi� (1996), `Community justice/restorative justice: Prospects for a
new social ecology for community corrections', International Journal of Comparative and
Applied Criminal Justice 20, 311�335.
Becker, G. (1968), `Crime and punishment: An economic approach', Journal of Political
Economy 76, 169�217.
25
Bogin, B. (1999), `Evolutionary perspective on human growth', Annual Review of Anthro-
pology 28, 109�153.
Braithwaite, J. (1989), Crime, Shame, and Reintegration, Cambridge: Cambridge University
Press.
Carreira Da Cruz, M. (2010), `A potential use of crime statistics - measuring costs e�ective-
ness of restorative justice programmes: a cross eye on the british and canadian debate',
E�ectius Newsletter 10.
Cloward, R. and L. Ohlin (1960), Delinquency and Opportunity, New York: Free Press.
Cullen, J.B., B.A. Jacob and S. Levitt (2006), `The e�ect of school choice on participants:
Evidence from randomized lotteries', Econometrica 74(5), 1191.
Ellis, L., K.M. Beaver and J. Wright (2009), Handbook of Crime Correlate, Academic Press.
Ferwerda, H. B., I. M. G. G. van Leiden, N. A. M. Arts and Hauber A. R. (2006), Halt: Het
alternatief? de e�ecten van halt beschreven, 244. Onderzoek en beleid.
Goldstein, A. P. and B. Glick (1994), `Aggression replacement training: Curriculum and
evaluation.', Simulation and Gaming 25(1), 9�26.
Goldstein, A. P. and B. Glick (1999), `Aggression reduction strategies: E�ective and ine�ec-
tive', School Psychology Quarterly 14(1), 41�57.
Grossman, J. and J. Tierney (1998), `Does mentoring work? an impact study of the big
brothers big sisters program.', Evaluation Review 22, 403�426.
Heller, S., H. Pollack, R. Ander and J. Ludwig (2013), `Preventing youth violence and
dropout: A randomized �eld experiment.'.
URL: http://www.nber.org/papers/w19014
Hjalmarsson, R. (2008), `Criminal justice involvement and high school completion', Journal
of Urban Economics 63, 613�630.
Hjalmarsson, R., H. Holmlund and M. Linquist (2011), `Can education policy be used to
�ght crime?'.
URL: http://www.voxeu.org/article/can-education-policy-be-used-�ght-crime
26
Kahan, D. (1996), `What do alternative sanctions mean?', The University of Chicago Law
Review 63, 591�653.
Kleibergen, F. and R. Paap (2006), `Generalized reduced rank tests using the singularvalue
decomposition', Journal of Econometrics 127, 97�126.
KPMG (2011), `Halt nederland. onderzoek kostprijsvergelijking. vergelijking van de kosten
van een halt-afdoening en de behandeling via de justitiele lijn.'.
Lochner, L. (2010), `Education policy and crime', (15894).
Lochner, L. and E. Moretti (2004), `The e�ect of education on crime: Evidence from prison
inmates, arrests, and self-reports', American Economic Review 94(1), 155�189.
Machin, S., O. Marie and S. Vujic (2011a), `The crime reducing e�ect of education', The
Economic Journal 121, 463�484.
Machin, S.J., O. Marie and S. Vujic (2011b), `The crime reducing e�ect of education', The
Economic Journal 121, 463�484.
McGarvey, M., W. Smith and M. Walker (2007), `The interdependence of school outcomes
and school and neighborhood crime'.
Meghir, C., M. Palme and M. Schnabel (2011), `The e�ect of education policy on crime: an
intergenerational perspective'.
Merton, R.K. (1957), Social Theory and Social Structure (Rev. ed.), New York: Free Press.
Miers, D., M. Maguire, Sh. Goldie, K. Sharpe, Ch. Hale, A. Netten, S. Uglow, K. Doolin,
A. Hallam, J. Enterkin and T. Newburn (2001), An exploratory evaluation of restorative
justice schemes, Home O�ce Research, Development and Statistics Directorate, U.K.
Ministery of Education, Culture and Science (2010), `Kerncijfers 2005-2009 onderwijs, cul-
tuur en wetenschap'.
Ministry of Education, Culture and Science (2012), `The approach to early school leaving'.
Moon, S. H. (2010), `Multi-dimensional human skill formation with multi-dimensional
parental investment'. Unpublished manuscript.
Morris, N. and M. Tonry (1990), Between prison and probation, Oxford University Press.
27

Murphy, C. (2008), The juvenile justice system: Dealing with young people under the young
o�enders act 1994, number 4 in `Auditor General's Report', Auditor General for Western
Australia.
URL: http://www.audit.wa.gov.au
Paus, T. (2005), `Mapping brain maturation and cognitive development during adolescence',
Trends in Cognitive Sciences 9(2), 60.
Reynolds, A., E . Mann, W. Miedel and P. Smokowski (1997), The state of early child-
hood intervention: E�ectiveness, myths, and realities, new directions, Vol. 19 of Focus:
Newsletter of the University of Wisconsin Institute for Poverty, chapter 1, pp. 5�11.
Rodriguez-Planas, N. (2012), School and drugs: Closing the gap: Evidence from a random-
ized trial in the us, IZA DP 6770.
Schulz, K. F. and D. Grimes (2002), `Allocation concealment in randomized trials: defending
against deciphering', The Lancet 359, 614�618.
Sherman, L., H. Strang and C. Barnes (2010), Pisa 2009 results: What makes a school
successful? - resources, policies and practices, OECD.
URL: http://www.oecd.org
Sherman, L. W. and H. Strang (2007), Restorative justice: The evidence, The Smith Insti-
tute.
URL: http://www.sas.upenn.edu
Steinberg, L. (2005), `A social neuroscience perspective on adolescent risk-taking', Develop-
mental Review 28(1), 78.
Use of randomisation in clinical trials: a survey of UK practice (2012), Trials.
URL: http://www.trialsjournal.com/content/pdf/1745-6215-13-198.pdf
Utting, D., J. Bright and C. Henricson (1993), Crime and the family. improving child-rearing
and preventing delinquency, London: Family Policy Studies Centre.
Webbink, D., P. Koning, S. Vujic and N. Martin (2013), `Why are criminals less educated
than non-criminals? evidence from a cohort of young australian twins', The Journal of
Law, Economics, and Organization 29, 115�144.
28

Wooldridge, J. (2009), Instrumental variables and two stage least squares (Chapter 15) in In-
troductory econometrics: A modern approach, 4 edn, Mason, OH: South-Western Cengage
Learning.
29

TIER WORKING PAPER SERIES
TIER WP 14/01 © TIER 2014
ISBN 978-94-003-0066-8