Embed Size (px)
Citation preview
DOE/NASA/51 040-34 NASA TM-82726 TR-81-C-29 ASA-TM-82726 1982000524 1
The Effect of Rotor Blade Thickness and Surface Finish on the erformance of a Small Axial Flow Turbine
Richard J. Roelke National Aeronautics and Space Administration Lewis Research Center
and
Jeffrey E. Haas Propulsion Laboratory AVRADCOM Research and Technology Laboratories Lewis Research Center
Work performed for U.S. DEPARTMENT OF ENERGY Conservation and Renewable Energy Office of Vehicle and Engine R&D
Prepared for 1982 Gas Turbine Annual Meeting sponsored by American Society of Mechanical Engineers London, England, April 18-22, 1982
L!9RA Y COpy F'7 B 3 1982
LANGLEY RESEARCH CENTER LIBRARY, NASA
HAMPTON, VIRGI~.II\
- --. I I
https://ntrs.nasa.gov/search.jsp?R=19820005241 2019-04-27T17:04:09+00:00Z

NOTICE
This report was prepared to document work sponsored by the United States Government Neither the United States nor Its agent , the United States Department of Energy , nor any Federal employees , nor any of their contractors , subcontractors orthelr employees , makes any warranty , express or Implied, or assumes any legal liability or responsloillty for the accuracy , completeness , or uselulness 01 any Information , apparatus , product or process disclosed, or represents that its use would not infringe prlvalely owned rights
I .
- - -- - - -
DOE/NASA/51 040-34 NASA TM-82726 TR-81-C-29
The Effect of Rotor Blade Thickness and Surface Finish on the Performance of a Small Axial Flow Turbine
Richard J. Roel,ke National Aeronautics and Space Administration Lewis Research Center Cleveland, Ohio 44135
and
Jeffrey E. Haas Propulsion Laboratory AVRADCOM Research and Technology Laboratories Lewis Research Center Cleveland, Ohio 44135
Work performed for U.S. DEPARTMENT OF ENERGY Conservation and Renewable Energy Office of Vehicle and Engine R&D Washington, D.C. 20545 Under Interagency Agreement DE-AI01-77CS51 040
1982 Gas Turbine Annual Meeting sponsored by American Society of Mechanical Engineers London, England, April 18-22, 1982
r-
L
THE EFFECT OF ROTOR BLADE THICKNESS AND SURFACE FINISH
ON THE PERFORMANCE OF A SMALL AXIAL FLOW TURBINE
by Richard J. Roelke
National Aeronautics and Space Administr2tion Lewis Research Center
Cleveland, Ohio 44135
and Jeffrey E. Haas
Propulsion Laboratory AVRADCOM Research and Technology Laboratories
Lewis Research Center Cleveland, Ohio 44135
ABSTRACT
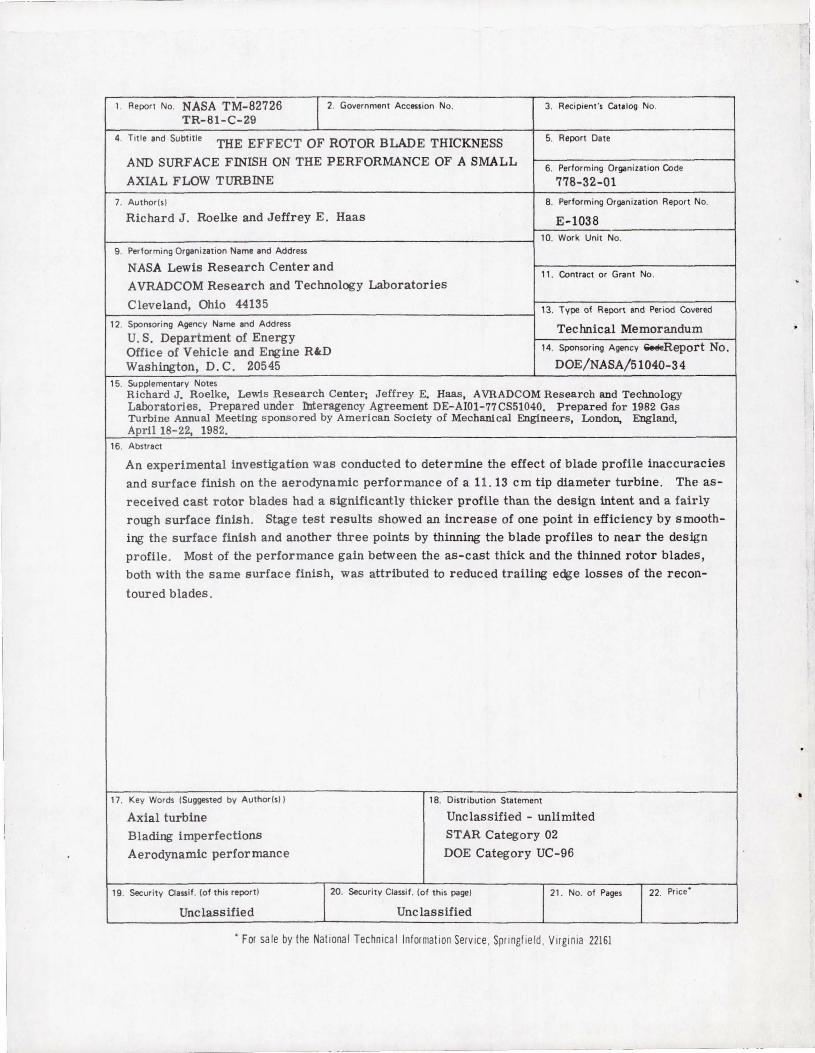
An experimental investigation was conducted to determine the effect of blade profile inaccuracies and surface finish on the aerodynamic performance of a 11.15 cm tip diameter turbine. The as-received cast rotor blades had a significantly thicker profile than the design intent and a fairly rough surface finish. Stage test results showed an increase of one point in efficiency by smoothing the surface finish and another three points by thinning the blade profiles to near the design profile. Most of the ptrformance gain between the as-cast thick and the thinned rotor blades, both with the same surface finish, was attributed to reduced trailing edge losses of the recontoured blades.
I I
: - _____ - __ . J
ro M o ~
I W
THE EFFECT OF ROTOR BLADE THICKNESS AND SURFACE FINISH
ON THE PERFORMANCE OF A SMALL AXIAL FLOW lURBINE
by Richard J . Roelke
National Aeronautics and Space Administration Lewis Research Center
Cleveland, Ohio 44135
end Jeffrey E. Haas
Propulsion Laboratory AVRADCOM Research and Technology Laboratories
Lewis Research Center Cleveland, Ohio 44135
INTRODUCTION
The efficiency of small (under about 15 cm tip diameter) axial turbines has not equaled that demonstrated in larger machines . The chief reasons for this are Reyno lds number effects and compromises made in the aerodynamic design to accommodate limitations in mechanical design and fabrication processes . A practical small turbine design will almost always have a lower blade aspect ratio, higher trailing edge blockage , and a higher rotor tip clearance than a similar large turbine. Further performance degradation may also be caused by manufacturing imperfections because it is difficult to make the blade profiles with the same precision or relative surface smoothness as large turbines . The effect of these manufacturing imperfections on the performance of a small single stage turbine is the subject of this paper .
Few reports have appeared on the effect of these manufacturing imperfections in comparison to the other causes affecting the performance of small turbines . Bammert and Sandstede (1) reported on a series of cascade tests and a four stage turbine test where the surface roughness was changed and the blade profiles were either uniformly thinned or thickened to simulate manufacturinQ errors. Their results indicated dramatic changes-in blade losses.
The results of the investigation described herein are an outgrowth of the automotive gas turbine technology program conducted at the NASA- Lewis Research Center. A part of that program consisted of a series of component performance tests of the compressor-orive turbine for the Department of
Energy automotive gas turbine d~monstrator engine . The engine and technology program are described in (2). The turbine blading used in the subject tests consisted of duplicates of the stator and rotor castings used in the demonstrator engine . Inspection of the blading made before the start of the turbine component tests showed significant deviations from design in the profile shape and a fairly rough surface . The initial tests were made to determine the performance of the as- cast bl ading. After these initial tests two subsequent turbine builds were evaluated . One build had reduced rotor blade surface roughness and in the other build the rotor blade profiles were reworked to more nearly approach the design profile.
All performance tests were conducted with air at a nominal inl~t temperature of 320 K and an inlet pressure of 0.827 bars. The results reported in this paper were obtained by measuring the overall stage performance for a range of pressure rat ios with the turbine operating at design speed . Rotorexit radial surveys of angle, total pressure and total temperature were taken at design equivalent values of speed and specific work . Results are presented in terms of efficiency and mass flow for each of the three turbine builds . Also included is the effect of the blading changes on the static pressures within the stage and the calculated changes in local efficiency hased on the rotor-exit surveys . The results of the complete series of performance tests conducted with this turbine are reported in (3) .
SYMBOLS
m mass flow rate, kg/sec r radius, m U blade velocity V absolute gas velocity, m/sec W relative gas velocity, m/sec a absolute gas angle measured from axial
direction, deg
e relative gas angle measu red from axial direction, ceg
viscosity, kg/(m)(s ec)
Subscripts:
cr condition corresponding t o Mach number of unity m blade midspan o stat ion at vortex manifold inlet (Fig. 1) 1 station at st ator inl et (Fig. 1) 2 sta tion at stator exit (Fig . 1) 3 station at rotor ex i t (Fig. 1)
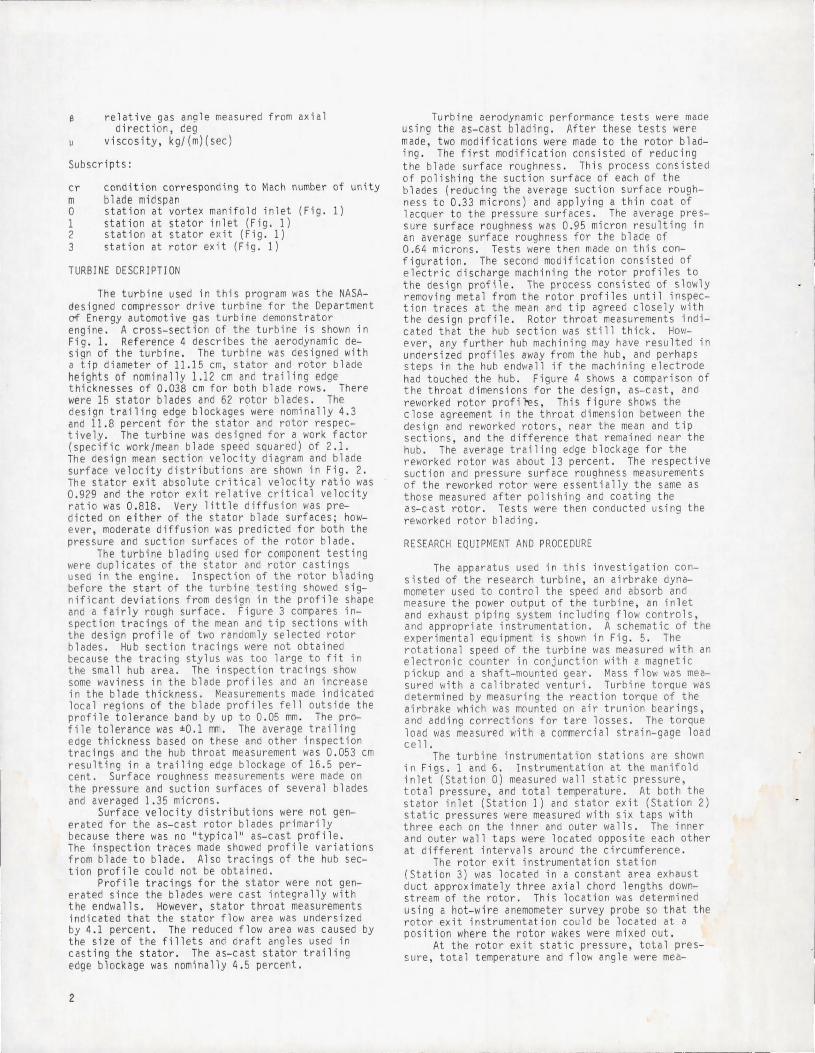
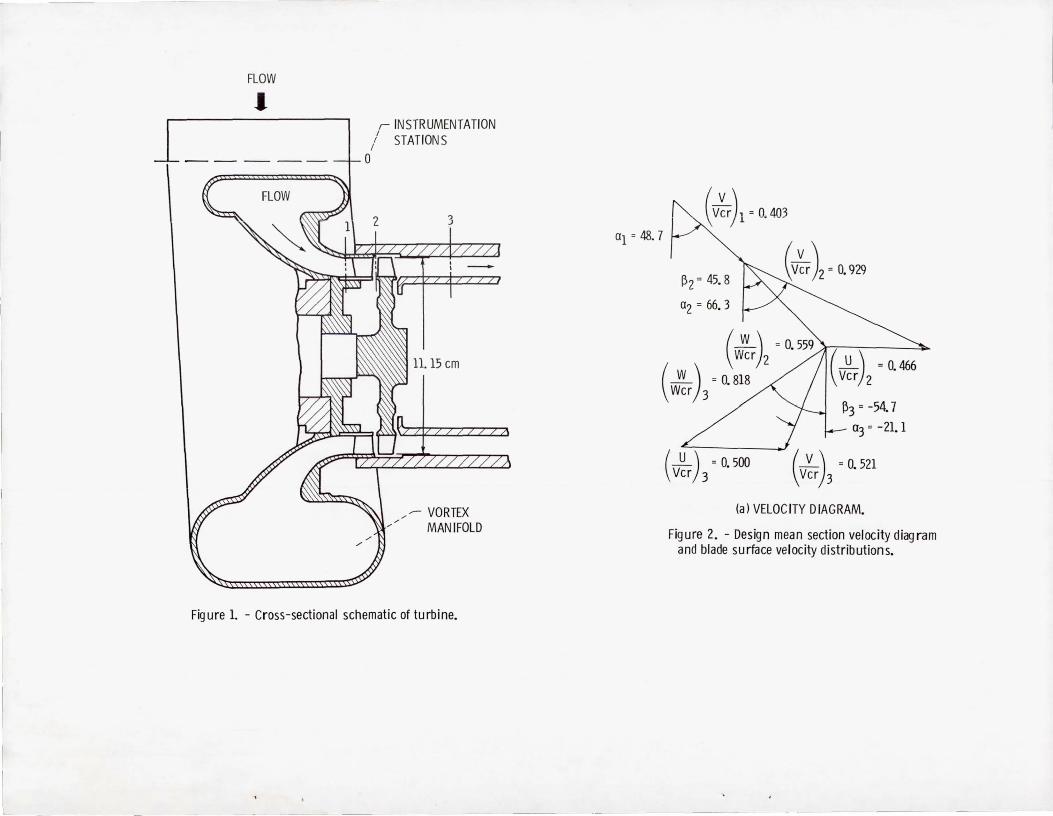
TURBIN E DESCRIPTION
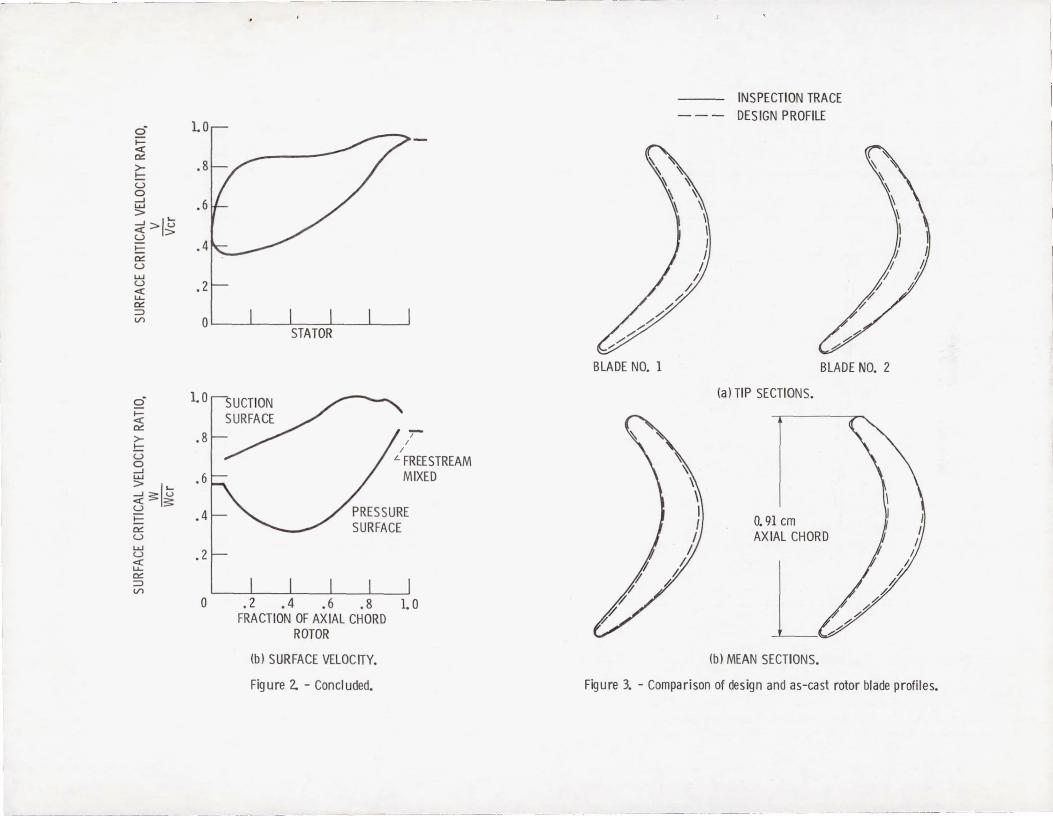
The turbine used in this program was the NASAdesigned compressor drive turbine for the Department of Energy automotive gas turbine demonstrator engine . A cross-section of the turbine is shown in Fi g. 1. Reference 4 describes the aerodynamic design of the turbine. The turbine was des igned with a ti p diameter of 11.15 cm, stator and rotor blade heights of nominall y 1.12 cm and trailing edge thicknesses of 0.038 cm for both blade rows. There were 15 st ator blades and 62 rQtor blades . The design trailing edge blockages were nominally 4.3 and 11.8 percent for the stator and rotor respectively. The turbine was designed for a wo rk factor (specific work/mean blade speed squared) of 2.1. The design mean section velocity diagram and blade surface velocity distributions are shown in Fig . 2. The stator exit absolute crit ica l velocity ratio was 0 .929 and the rotor exit relative critical velocity rat io was 0.818. Very litt le diffusion was predicted on either of the stator blade surfaces; however, moderate diffusion was predicted for both the pressure and suction surfaces of the rotor bl ade.
The turbine blading used for component testing were duplicates of the stator and rotor castings used in the engine. Inspection of the rotor blading before the start of the turbine testing showed significant deviations from design in the profile shape and a fairly rough surface. Figure 3 compares inspection tracings of the mean and tip sections with the design profile of two randomly selected rotor blades . Hub section tracings were not obtained because the tracing stylus was too large to fit in the smal l hub area. The inspection tracings show some wav iness in the blade profiles and an increase in the blade thickness. Measurements made indicated local regions of the blade profiles fell outside the profile tolerance band by up to 0.05 mm. The profile tolerance \\'as ±O.l mm. The average trailing edge thickness based on these and other inspection tracings and the hub throat measurement was 0 . 053 cm resulting i n a trailing edge blockage of 16.5 percent. Surface roughness measurements were made on the pressure and suction surfaces of several blades and averaged 1.35 microns .
Surface velocity distributions were not generated for the as-cast rotor blades primarily because there was no "typical" as-cast profil e. The inspection traces made showed profile variations from blade t o blade. Also tracings of the hub section profile could not be obtaineo .
Profile tracings for the stator were not generated since the blades were cast integrally with the endwalls. However, stator throat measurements indicated that the stator flow area was undersized by 4.1 percent . The reduced flow area was caused by the size of t he fill ets and draft angles used i n casting the stator. The as-cast stator trailing edge blockage was nominally 4.5 percent.
2
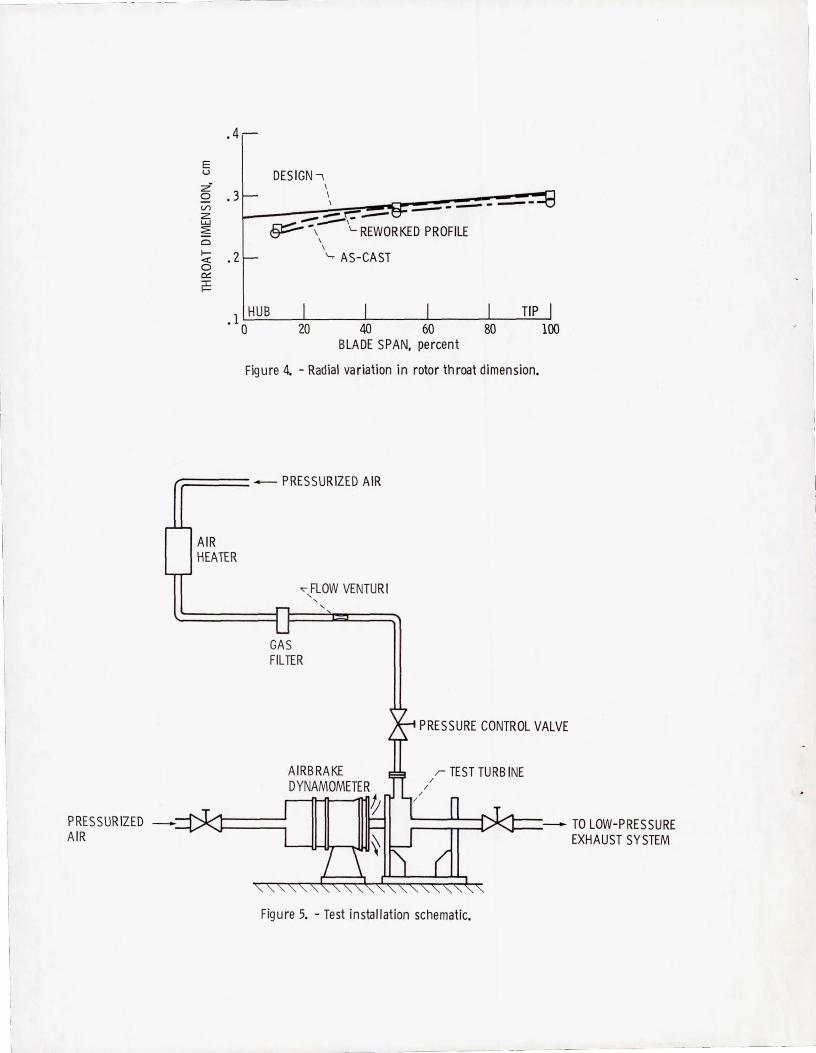
Turb ine aerodynami c performance tests were made using the as-cast blading . After these tests were made, two modific ation s were made to the rotor blading. The fir st modificat ion ccnsisted of reducing the blade surface roughness. This process consisted of polishing the suct ion surface of each of the blades (reducing the average suction surface roughness t o 0.33 microns) and ap plying a thin coat of lacquer to the pressure surfaces . The average pressure surface roughness was 0 .95 micron resulting i n an average surface roughness for the blade of 0 .6 4 microns. Te sts we re t hen made on this configuration . The second mod ification consisted of electr ic discharge machining the rotor proflles to the des ign profile. The process consisted of slow ly removing met al from the rotor,profiles until ins~ection traces at the mean and tlP agreed closely wlt h the design profile . Rotor throat measurements indicated that the hub section was sti ll thick. However, any further hub mach ining may have resulted in undersized profil es away from the hub , and perhaps steps in the hub endwal l if the machining electrode had touched the hub. Figure 4 shows a comparison of the throa t dimension s for the design, as-cast, and reworked rotor profires , This figure shows the close agreement in the throat dimension between the design and reworked rotors, near the mean and tip sections , and the difference that remained near the hub. The average trailing edge blockage for the reworked rotor was about 13 percent . The respective suction and pressure surface roughness measurements of the reworked rotor we re essentia ll y the same as those measured after polishing and coating the as-cast rotor. Tests were then conducted using the reworked rotor blading .
RESEARCH EQUIPMENT AND PROCEDURE
The apparatus used in this investigation consisted of the r esearch turbine, an airbrake dynamometer used to control the speed and absorb and measure the power output of the turbine, an inlet and exhaust piping system including flow controls, and appropriate instrumentation . A schematic of the experimental equipment i s shown in Fig. 5. The rotational speed of the turbine was measured with an electronic counter in conjurction with 0 magnetic pickup and a shaft-mounted gear . Mass flow was measured with a calibrated venturi . Turbine torque was determined by measuring the reaction torque of the airbrake which was mounted on air trunion bearings, and adding corrections for tare losses. The torque load was measured with a commercial strain-gage load ce 11 .
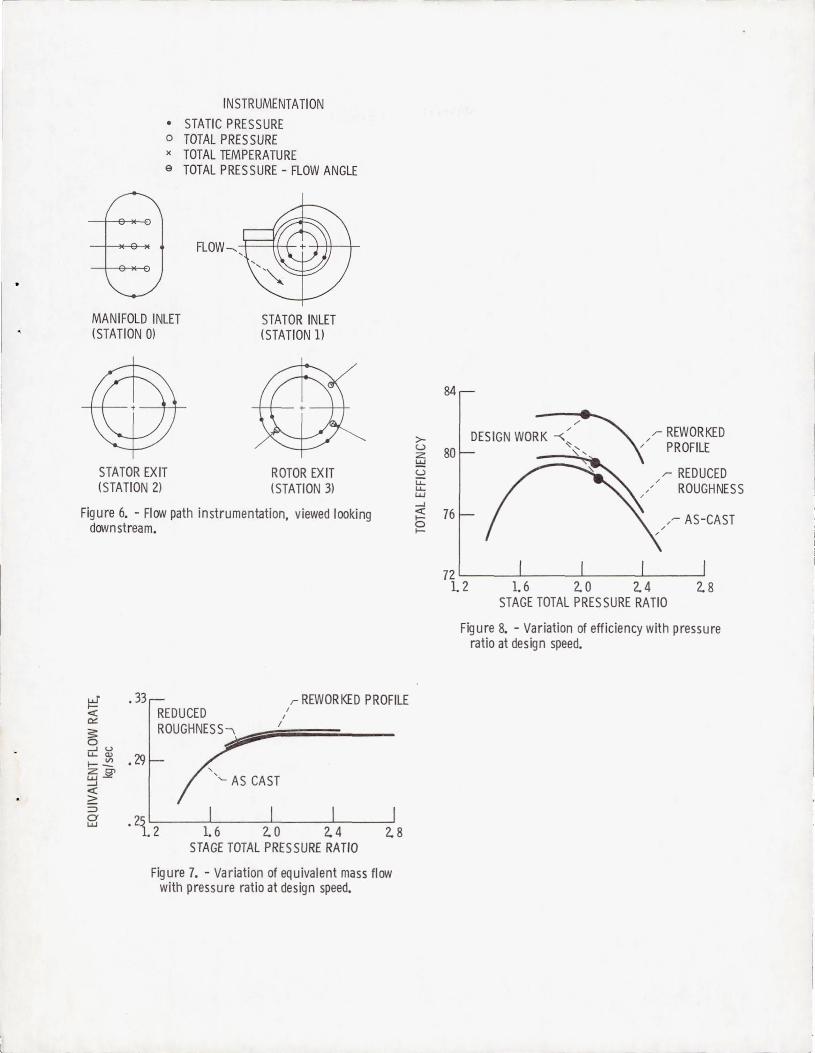
The turbine instrumentation stations are shown in Fi gs. 1 and 6. Instrumentation at the manifold inlet (Station 0) measured wal l static pressure, total pressure, and total temperature. At both the stator inlet (Station 1) and stator exit (Station 2) static pressures were measured with six taps with three each on the inner and outer walls . The inner and outer wall taps we re located opposite each other at di ff erent intervals around the c irc umference .
The r otor exit instrumentation station (Station 3) was located in a constant area exhaust duct approximately three axial chord lengths downstream of the rotor. This location was determined us i ng a hot-wire anemometer survey probe so that the rotor exit instrumentat i on could be located at a position where the rotor wakes we re mixed out .
At t he rotor exit static pressure, total pressllre, total temperature and flow ang le were mea-
~ ._J
sured. The static pressure was measured with six taps with three each on the inner and outer walls . Three self-aligning probes locateo around the circumference were used for measurement of total pressure, total temperature, and flow angle .
Fo r each rotor configuration data were obtained over a ranoe of manifo10 in1et-to-rotor exit static pressure ratio at design equivalent speed . Data were obtained at nominal inlet flow conditions of 320 K and 0.827 bars. The turbine Reynolds number, m/~rm' at these conditions was about 2.44x10⁵. The rotor tip clearance was the same for all turbine configurations tested and equaled 1.7 percent of the blade length .
For each rotor configuration a rotor exit radial survey was first conducted at de~ign equivalent values of speed and specific work . Mass averaged values of flow angle, total temperature, and total pressure were obtained for each of the three survey locations. These mass-averaged values were then arithmetically averaged to obtain overall values . The survey probes were then positioned with one each near the tip, near midspan, and near the hub so that the average flow angle from these three positions would correspond closely to the overall mass-averaged value obtained from the survey . The radial positions of the survey probes, so determined, were not changed during the remainder of the testing of that rotor configuration. Performance data were then obtained over a range of turbine pressure ratio at design equivalent speed.
The turbine was rateD on the basis of total efficiency. The actual work was calculated from torqup, speed, and mass flow measurements. The ideal work was based on the manifold inlet-to-rotor exit total pressure ratio. The manifold inlet and rotor exit total pressures were calculated from mass flow, static pressure, total temperature, and flow angle . For the calculation of manifold inlet total pressure, the flow angle was assumed to be zero.
RESULTS AND DISCUSSION
The variation in equivalent mass flow with stage total-pressure ratio at 100 percent of design speed is shown in Fig. 7. The turbine configuration with the as-cast rotor had the lowest mass flow. When the blade surface roughness of this rotor was reduced there was a slight increase in flow in the unchoked pressure ratio range but the choking flow was the same as the original rotor . The highest flow was measured with the reworked profile but the difference is small, only about 0.7 percent. The flow increase with the reworked rotor was much less than the increase in flow area of that rotor which was three percent. These results indicate, that at this rotor speed, the as-cast rotor choked before the stator but with the reworked rotor installed the stator choked first and therefore controlled the stage mass flow.
The changes in stage efficiency for the three turbine builds are shown in Fig. 8. The difference in efficiency between the as-cast and reduced roughness rotor was nominally one point and between the as-cast and reworked profile was nominally four points. These differences could be expected to increase further if it were possible to thin the rotor profile near the hub and to further smooth the surface finish of the rotor and stator blades. A probable explanation for a major portion of the increase in performance of the reworked rotor configuration is the reduced trailing edge losses. An analysis of these losses is discussed later in this paper.
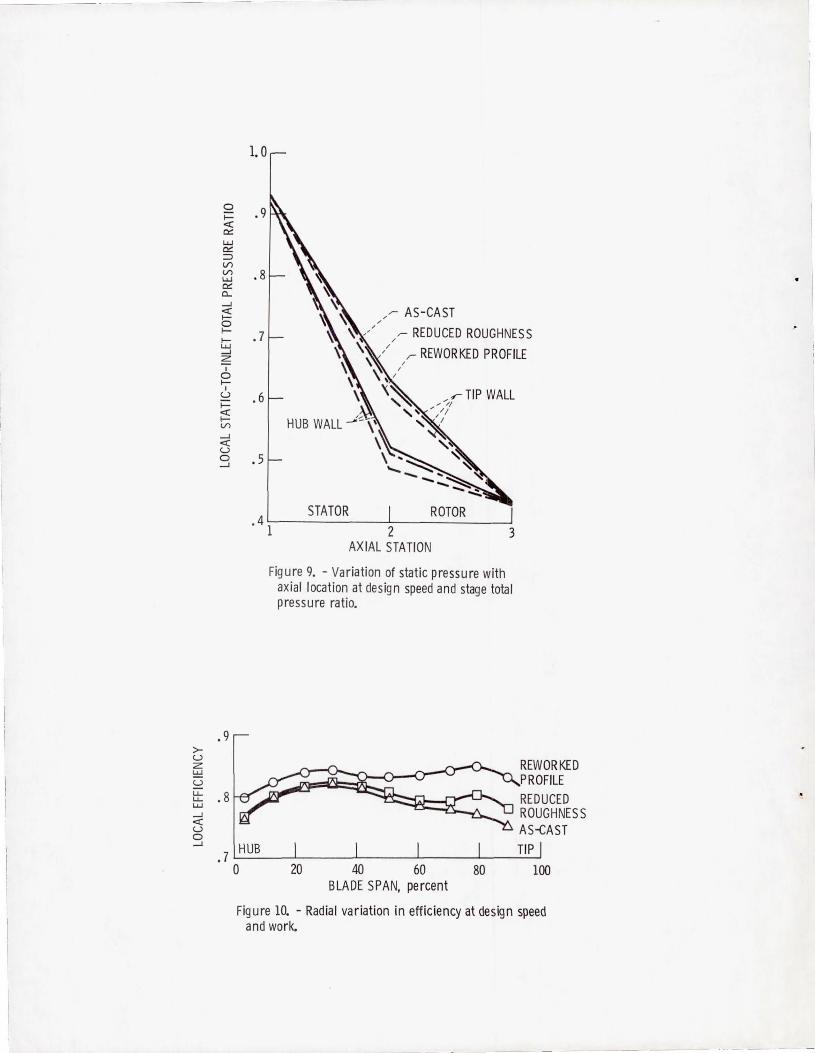
The changes in wall static pressure through the turbine for the design equivalent tota1-to-tota1 pressure ratio of 2.01 are shown in Fig. g. All pressures were ratioed to the inlet total pressure at Station O. As the rotor blades were first smoothed and then thinned the static pressure between the stator and rotor decreased slightly. This change increased the reaction across the stator and reduced it across the rotor; however, positive rotor reaction was always maintained. It was felt that the decrease in rotor reaction was not large enough to decrease either the rotor or stage efficiency.
The rotor exit radial surveys of total temperature, total pressure, and flow angle conducted at design equivalent values of speed and specific work were used to determine radial variations in stage performance. The radial variations in turbine efficiency calculated from these survey data are shown in Fig. 10. These results show that the largest benefits of reducing the surface roughness and thinning the blade profile occurred from midspan out to the tip. This may have occurred because, as mentioned earlier, it was difficult to improve the blade surface finish and profile near the hub. With these results mass-averaged efficiencies were calculated and compared to the corresponding efficiencies shown in Fig. 8 that are based on torque measurements . In all cases the two methods of calculating the efficiencies gave values that were within 0.8 point of each other . In most comparisons the difference was only 0.1 to 0.2 point.
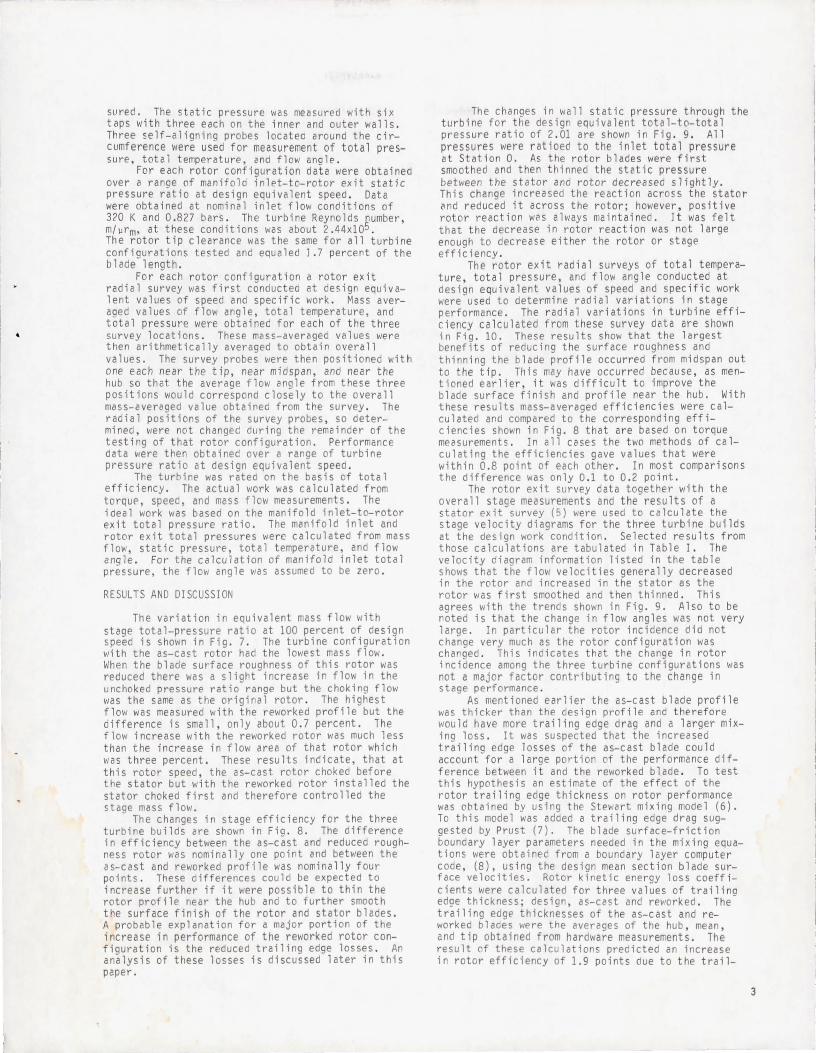
The rotor exit survey data together with the overall stage measurements and the results of a stator exit survey (5) were used to calculate the stage velocity diagrams for the three turbine builds at the design work condition. Selected results from those calculations are tabulated in Table I. The velocity diagram information listed in the table shows that the flow velocities generally decreased in the rotor and increased in the stator as the rotor was first smoothed and then thinned. This agrees with the trends shown in Fig. g. Also to be noted is that the change in flow angles was not very large. In particular the rotor incidence did not change very much as the rotor configuration was changed . This indicates that the change in rotor incidence among the three turbine configurations was not a major factor contributing to the change in stage performance .
As mentioned earlier the as-cast blade profile was thicker than the design profile and therefore would have more trailing edge drag and a larger mixing loss. It was suspected that the increased trailing edge losses of the as-cast blade could account for a large portion of the performance difference between it and the reworked blade. To test this hypothesis an estimate of the effect of the rotor trailing edge thickness on rotor performance was obtained by using the Stewart mixing model (6) . To this model was added a trailing edge drag suggested by Prust (7). The blade surface-friction boundary layer parameters needed in the mixing equations were obtained from a boundary layer computer code, (8), using the design mean section blade surface velocities. Rotor kinetic energy loss coefficients were calculated for three values of trai1ino edge thickness; design, as-cast and re~orked. The trailing edge thicknesses of the as-cast and reworked blades were the averages of the hub, mean, and tip obtained from hardware measurements. The result of these calculations predicted an increase in rotor efficiency of 1.9 points due to the trai1-
3
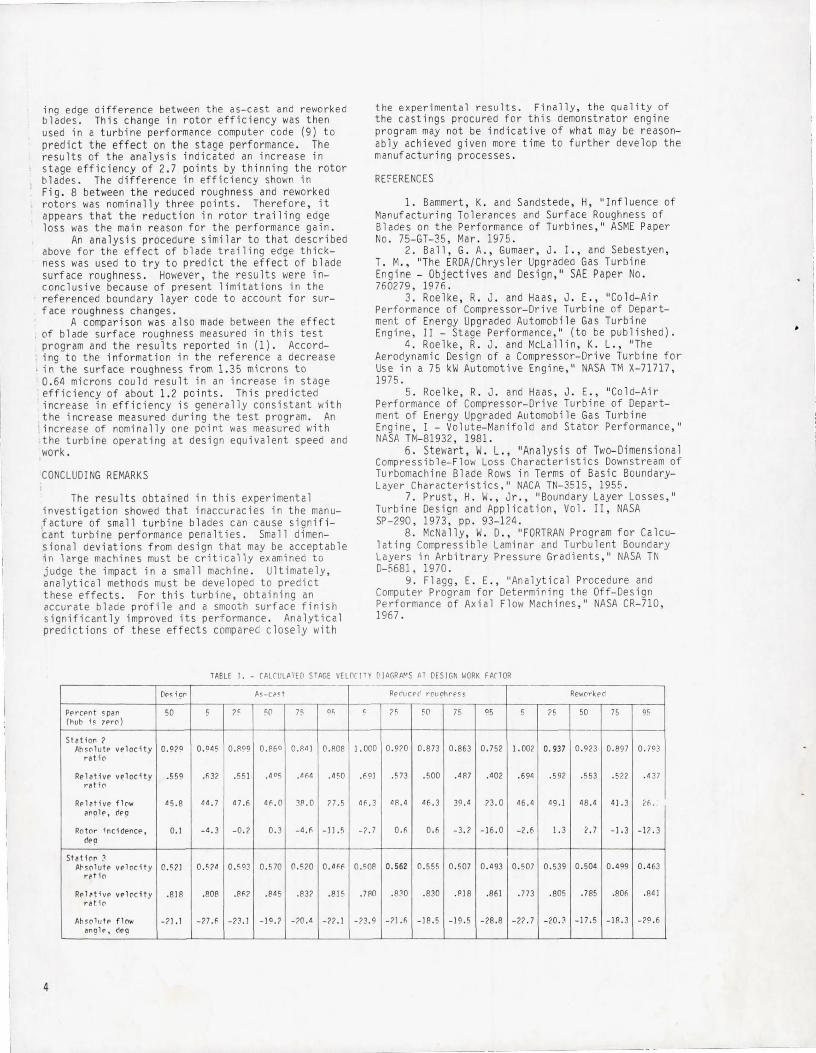
ing edge di f ference between the as-cast and reworke d blades. This change in rotor efficiency was then used in c turb i ne perfo rma nce computer code (9) to predict the effect on the stage performance . The results of t he analysis indicated an increase in stage effic iency of 2.7 poi nt s by th i nn i ng the rotor blades . The difference in efficiency shown in Fig . 8 be tween the red uc ed roug hness and r eworked rotors was nomina ll y three points . Therefore , it appears that t he reduction in rotor t railing edge loss was the ma i n reason for the performance ga i n.
An analys i s procedure similar to that described above for the effect of blade trailing edge thickness was used t o t ry to pred ict the effect of blade surface roughness . However, the results were inconclusive because of present limitations in the referenced boundary layer code to account for surface roughness changes .
A comparison was also made between the effect of blade surface roughness measured in this test program and the results reported in (1) . Accord
. i ng to the i nformat i on i n the reference a decrease
. in the surface roughness from 1. 35 microns t o 0.64 microns could result in an increase in stage efficiency of about 1.2 poi nts . Th i s pred icted increa se in efficiency is gene ra ll y consistant with the increase measured during t he t est program . An increase of nomina l ly one point was me asu red with the turbine operating at design equivalent speed and work .
CONCLUDING REMARKS
The resu l ts obtained in this experimental i nves tigation showed that i naccuracies in the manuf acture of smal l t urbine blades can cause signif icant turbine performance pen al t ies . Small dimensional deviations from design t hat may be acceptable in l arge machines must be crit ica lly examined to judge the impact in a small machine . Ultimately, analytical methods must be developed to predict these effects. For this turbi ne , obt aining an accurate bl ade prof ile and a smooth surface finish s ignificantly improved its performance . Analytical predi cti ons of these effects compared closely with
the experimental results . Finally . the quality of the castings procured for this demonstrator eng i ne program may not be i ndicative of what may be reasonably achieved given more time to further develop the manufacturing processes .
RE~ERENCES
1. Bammert , K. and Sandst ede , H, "I nfluence of Manufacturing Tolerances and Surface Rou ghness of Blades on the Performance of Tur bi nes ," ASME Paper No . 75-GT- 35 , Mar . 1975.
2. Ball , G. A. , Gumaer , J . I., and Sebestyen , T. M. , "T he ERDA/Chrysler Upgraded Gas Turbine Eng i ne - Objectives and Design ," SAE Paper No . 760279 , 1976 .
3 . Roelke , R. J . and Haas , J . E. , "Co ld-A i r Perfo rmance of Compressor-Drive Turbine of Department of Energy Upgraded Automob il e Gas Turb i ne Engine, II - Stage Performance, " (to be published) .
4. Roelke , R. J . and Mclallin , K. l ., "The Aerodynamic Design of a Compressor-Dr ive Turbine for Use in a 75 kW Automotive Engine ," NASA TM X-71717 , 1975 .
5. Roelke , R. J. and Haas , J . E. , "Cold-Air Performance of Compressor-Dr i ve Turbine of Department of Energy Upgraded Automobile Gas Turbine Engine , I - Volute-Man ifold and Stator Performance , " NASA TM-81932 , 1981 .
6. Stewart , W. L. , "Analys i s of Two- Dimens ional CompreSSible-Flow Lo ss Characteristics Oown st ream of Turbomachine Blade Rows in Terms of Basic BoundaryLaye r Characterist i cs , " NACA TN- 35 15, 1955.
7. Prust , H. W., Jr ., "Boundary layer Losses," Turbine Design and Application, Vol. II , NASA SP-290 , 1973 , pp . 93-124 .
8. McNally , W. D. , "FORTRAN Program for Calcul ati ng Compress ibl e laminar and Turbulent Bou ndary layers i n Arbitrary Pressure Gradients," NASA TN D-5681, 1970 .
9. Flagg, E. E. , "Analytical Procedure and Computer Prog r am for Determining the Off-Design Performance of Axial Fl ow Machines," NASA CR-710, 1967 .
TABLE I . - (AL(ULPTEO SlPGE VEL0(JTY OIAGRA~'S AT DESIGN WORK fACTOR -
[Ips i9" As-c(!< t Rf'rucf"c' r('lllohrfS$ Reworked
PPrcpnt ~ pan 50 5 7~ 50 75 Q~ 5 75 50 75 ~5 5 75 50 75 95 (hub i, ?Pro)
Station 2 Ahsolute velocity 0 . 9 2~ 0. 045 0 .A09 0 .860 O.Artl 0 .A08 J . 000 0 . ~20 0 .a73 0 .a63 0.752 1. 002 0. 937 0 .923 0 . a97 0.7Q3
rat ;C'
Relative velocity .5 59 .fi 32 .55J .40S .4~4 .450 .6~J .5 73 .500 . 4A7 .402 .694 .5 92 . 553 . 522 . 437 rat if'
Rplative flow 45 .a 44.7 47.6 46 . 0 38.0 ?7 .5 46. 3 4A.4 46 . 3 3~ .4 73.0 46.4 49. J 4a.4 41. 3 ~6 . i,,'~lp, dep
Rotor inCidence, O. J -4.3 -0.2 0 . 3 -4.6 -lJ .5 -7.7 0.6 0.6 -3.2 -1 6 . 0 - 2.6 1.3 2. 7 - 1. 3 -1 2 . 3 dep
Station 3 A~sol ute velocity 0.521 0.574 0. 593 0.570 0.520 0.4~6 0.508 0.562 0 .555 0.507 0 . 493 0.507 0.5 39 0 . 504 0 . 4~9 0.4 63
r~t in
Rel~tivp v e l~cHy .aJa .aoa . 8~2 .84 5 .837 .8 J5 .7 ~0 . a~o .a30 .P1a .a61 .773 .a05 .7a5 .a06 .a4 J rat io
Ahsol"tp flow - 71.1 -77 . 6 -nJ -J Q. 7 - 70 .4 - 77. J -73 . 9 -71.6 -J a . 5 -J 9 . 5 -2a.a -27 . 7 -20.3 - J 7. 5 - J8 . 3 - 2~ .6 anglp . de~
4
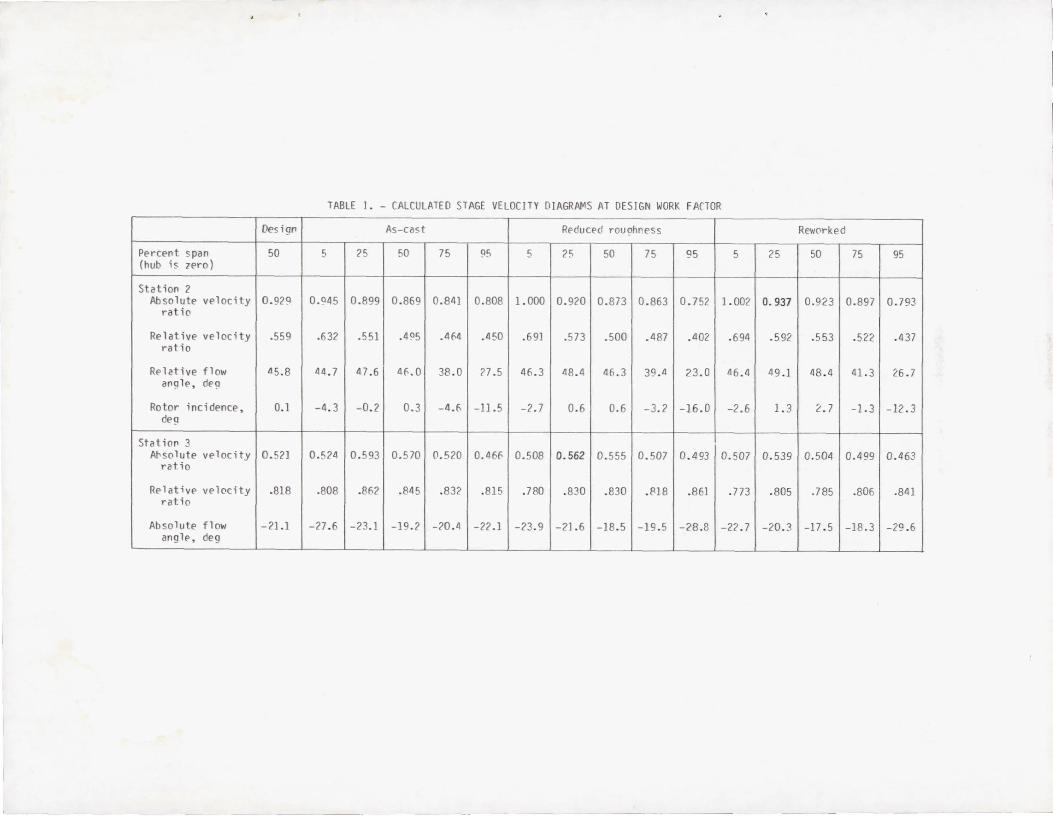
TABLE I . - CALCULATED STAGE VELOCITY DIAGRAMS AT DESIGN WORK FACTOR
Design As-cast Rpducpd rOU9hl"eSs
Percent span 50 5 25 50 75 95 5 25 50 75 gs (hub is zpro)
Station 2 Absolute velocity 0.929 0.945 0.899 0.869 0.841 0.808 1.000 0.920 0.873 0.863 0.752
ratio
Relative velocity .559 .632 .551 .495 .464 .450 .691 .573 .500 .487 .402 ratio
Rplative flow 45.8 44 . 7 47 .6 46.0 38.0 77 .5 46 .3 48 .4 46.3 39 .4 23.0 ang le , deg
Rotor incidence, 0.1 -4 . 3 -0 .2 0.3 -4.6 -11.5 -2.7 0.6 0.6 -3.2 -16 . 0 deg
Stat iol" 3 A~solute velocity 0.521 0.524 0.593 0.570 0.520 0.466 0.508 0. 562 0 .555 0.507 0.493
ratio
Relative velocity .818 .808 .862 .845 .832 .815 .780 .830 .830 .818 .861 ratio
Absolute flow -21.1 -27 .6 -23 .1 -19 .7 -20 .4 -22.1 -23. 9 -21.6 -18 .5 -19 .5 -28 .8 anglp, deg
- -
(_. __ .
Reworked
5 25 50
1. 002 0.937 0.923
.694 .592 .553
116.4 49.1 48 .4
-2.6 1.3 2. 7
0.507 0.539 0 .504
.773 .805 .785
-22 . 7 -20.3 -17 .5
75 95
0.897 0 .793
.522 . 437
41.3 26 .7
-1.3 -12 . 3 !
I
0.499 0.4631
.806 .841
-18.3 -29 .6
I
I
I
I
I ,
I i
I
I
I I
~
FLOW
1
o
I INSTRUMENTATION / STATION S
/ ---- VORTEX ---- MANIFOLD
Figure 1. - Cross-sectional schematic of turbine.
al = 48.7
(v~r) 1 = 0. 403
~2 = 45.8
a2 = 66.3
(~) _ (w~r)2 · 0.559 L ~ Wcr - 0.818
3 ~3 = -54.7
a3 = -21. 1
(JL) = 0.500 Vcr 3
(al VELOCITY DIAGRAM.
Figure 2. - Design mean section velocity diagram and blade surface velocity distributions.
cf 1.0 f-c:x: 0:: ~ .8 !::: u 0 ....J w .6 > ....J>lb 5 > !::: 0:: U w u .2 c:x: lJ... 0:: ::J Vl 0
o· 1.0 f-c:x: 0::
~ .8 !::: u 0 ....J w .6 > ....J~lb 5 ~ E .4 0:: u w U .2 c:x: lJ... 0:: ::J Vl
0
'/ I
I
L FREESTREAM MIXED
.2 .4 .6 .8 1.0 FRACTION OF AXIAL CHORD
ROTOR
BLADE NO.1
INSPECTION TRACE --- DESIGN PROFILE
BLADE NO.2
(al TIP SECTIONS.
0.91 em AXIAL CHORD
(bl SURFACE VELOCITY. (bl MEAN SECTIONS.
Figure 2. - Concluded. Figure 3. - Comparison of design and as-cast rotor blade profiles.
----- ----------- ---------
1
I I I I
PRESSURIZED AIR
.4-
E u
z· .3 2
Vl z UJ
~ 0 t- .2 <t: 0 ~ :::c t-
1 HUB . 0
DESIGN """"\ \ \
\ ------ -----_-r=----, ~ - , L REWORKED PROFILE
20
\ \
'-,. AS-CAST
40 60 80 BLADE SPAN, percent
Figure 4. - Radial variation in rotor throat dimension.
~===== - PRESSURIZED AIR
AIR HEATER
" FLOW VENTURI
GAS FIL TER
" , "
AIRBRAKE DYNAMOMETER ~~---nf1~ /
PRESSURE CONTROL VALVE
/ I
/
r TEST TURB INE
./\-__ ----l
.----......... --V-' ...... __ - TO LOW-PRESSURE EXHAUST SYSTEM
Figure 5. - Test installation schematic.
I
I . \
I
I
INSTRUMENTATION
• STATIC PRESSURE o TOTAL PRESSURE x TOTAL TEMPERATURE e TOTAL PRESSURE - FLOW ANGLE
FLOW--..-f, --+t-f-
MANIFOLD INLET (STATION 0)
STATOR INLET (STATION 1)
STATOR EXIT (STATION 2)
ROTOR EXIT (STATION 3)
Figure 6. - Flow path instrumentation, viewed looking downstream.
1==" .33 « c:::
~ -' u u... Q.) 29 I- ~ •
~~ -' « 2:
r REWORKED PROFILE REDUCED / ROUGHNES S\~;iiiiiii;'/ iiiiiiiii==-__ _
/5 CAST :=J a w .25L-----~-----L------L---~
1.2 1.6 ~O ~4 ~8 STAGE TOTAL PRESSURE RATIO
Figure 7. - Va riation of equivalent mass flow with pressure ratio at design speed.
84
>-~ 80 !:!:! u u:: u... w -' g 76 I--
/ /
.,- REWORKED
72L-----~-----L----~L---~ 1.2 1.6 ~O ~4 ~8
STAGE TOTAL PRESSURE RATIO
Figure 8. - Variation of efficiency with pressure ratio at design speed.
>-u z L.U
u L.L.. L.L.. L.U
...J <t: u 0 ...J
2 t<t: 0:: L.U 0:: ;:) Vl Vl L.U 0:: a... ...J
~ o t-tL.U ...J Z
o
o t-
o U ;::: ~ Vl ...J <t: u o ...J
. 9
.8
1.0
.9
.8
.7
.6
.5
STATOR .4Ll----------~2----------~3
AXIAL STATION
Figure 9. - Variation of static pressure with axial location at design speed and stage total pressure ratio •
REWORKED PROFILE REDUCED ROUGHNESS AS-CAST
.7 HUB 0 20 40 60 80 100
BLADE SPAN, percent
Figure 10. - Radial variation in efficiency at design speed and work.
I
J
1. Report No . NASA TM-82726 I 2. Government Accession No. 3. Recipient's Catalog No.
TR-81-C-29 4. Title and Subtitle THE EFFECT OF ROTOR BLADE THICKNESS 5. Report Date
AND SURFACE FINISH ON THE PERFORMANCE OF A SMALL 6. Performing Organizat ion Code
AXIAL FLOW TURBINE 778-32-01
7. Author(s) B. Performing Organization Report No .
Richard J. Roelke and Jeffrey E. Haas E-1038 10. Work Unit No .
9 . Performing Organization Name and Address
NASA Lewis Research Center and 11. Contract or Grant No .
A VRADCOM Research and Technology Laboratories
Cleveland, Ohio 44135 13. Type of Report and Per iod Covered
12. Sponsoring Agency Name and Address Technical Memorandum U. S. Department of Energy Office of Vehicle and Engine R&D 14. Sponsoring Agency -.eeReport No.
Washington, D. C. 20545 DOE/NASA/51040-34 15. Supplementary Notes
Richard J. Roelke, Lewis Research Center; Jeffrey E. Haas, AVRADCOM Research and Technology Laboratories. Prepared under Interagency Agreement DE-AI01-77CS51040. Prepared for 1982 Gas Turbine Annual Meeting sponsored by American Society of Mechanical Engineers, London, England, April 18-22, 1982.
16. Abstract
An experimental investigatien was conducted to determine the effect of blade profile inaccuracies
and surface finish on the aerodynamic performance of a 11.13 cm tip diameter turbine, The as-
received cast rotor blades had a significantly thicker profile than the design intent and a fairly
rough surface finish. Stage test results showed an increase of one point in efficiency by smooth-
ing the surface finish and another three points by thinning the blade profiles to near the design
profile . Most of the performance gain between the as-cast thick and the thinned rotor blades,
both with the same surface finish, was attributed to reduced trailing edge losses of the recon-
toured blades.
17. Key Words (Suggested by Author(s)) 18. Distribution Statement
Axial turbine Unclassified - unlimited
Blading imperfections ST AR Category 02
Aerodynamic performance DOE Category UC-96
19. Secur ity Classif . (of this report) 20. Security Classif. (of this page) 21. No . of Pages 22. Price
Unclassified Unclassified
• For sale by the Nat iona l Technical Informat ion Serv ice , Spll ngf ield . Virginia 22161

l
11 11 1 111111 1~~]111111IfllI1r~llijrlllli ~~I1f111111 1 11111 I
3 1176 00507 3151
. I I