Embed Size (px)
Citation preview
INDONESIAN JOURNAL OF ECONOMICS, SOCIAL, AND HUMANITIES ijesh.unri.ac.id
DOI . https://doi.org/10.31258/ijesh.1.1.1 1 © 2019 Youlanda et al.
The Effect of Sales Growth, Capital Expenditure, and Working Capital Efficiency on Indonesian-Listed-Consumer-Goods Firms’ Financial
Performance with Capital Structure as Moderating Variable
Youlanda Githa Dovita, Andewi Rokhmawati*, Ahmad Fauzan Fathoni
The Faculty of Economics and Business Universitas Riau, Pekanbaru, Indonesia
Introduction
Trade liberalization provides flexibility for the entry of imported goods, especially consumer
goods to Indonesia; so that, this may slow down the growth of domestic industries. Competition
in the Indonesian manufacturing industry is getting tougher. According to data from the
Indonesian Ministry of Industry (Kementerian Perindustrian, 2013), the manufacturing index,
which are consists of the consumer goods sectors, basic industry and various industries which
increased 9.37% since the beginning of the year until August 2, 2013. Manufacturing was
mainly supported by the consumer sector which grew 28% and the performance of the consumer
sector was also high (Kementerian Perindustrian, 2013).
According to Rozuli (2017), trade liberalization becomes the main threat of the
consumer goods sector because the government widens the import facet of consumer goods. In
2013 to 2014, the consumer goods import has reached the level of 5,599.10 tons and in 2015
decreased to the level of 4,929.20 tons. However, in 2016 imports of consumer goods increased
by 960.30 tons so that the total imports in 2016 were 5,889.50 tons. Adhinegara (2017) said that
when looking at the profile of 2016 economic growth in more detail, there are approximately
nine business sectors in Indonesia down. Industrial sector performance declined from 4.52
percent in the third quarter to 3.36 percent in the fourth quarter of 2016. Meanwhile, on an
annual basis, the growth of the industrial sector dropped to 4.29 percent compared to 2015 at
4.33 percent. Another impact of trade liberalization is the increasing number of firms in the
industry; thus driving the industry becomes more competitive. The increase in the level of
competitiveness has an impact on the level of profits obtained by the firms. In addition to trade
liberalization, technology also affects firms’ competitiveness. By using new technology, firms
Article Info Abstract
Received : 2019-01-01
Accepted : 2019-01-15
Published : 2019-01-28
This study aims to determine the effect of sales growth, capital
expenditure and working capital efficiency on financial performance
which is moderated by the capital structure. The population in this
study was all consumer goods industry firms listed on the Indonesia
Stock Exchange in 2014-2017. Sampling in this study was based on
purposive sampling and obtained as many as 35 firms. The
analytical method used was Partial Least Square (PLS) analysis. The
results showed that sales growth and capital expenditure do not
significantly affect capital structure; working capital and capital
structure has a positive and significant effect on financial
performance. Meanwhile, as a moderating variable, capital structure
is not able to moderate the influence of sales growth on financial
performance. Capital structure weakens the effect of capital
expenditure and efficiency working capital on financial
performance.
Keywords: Sales Growth,
Capital Expenditure, Working
Capital Efficiency, Capital
Structure, Financial Performance

The Effect of Sales Growth, Capital Expenditure, and Working Capital Efficiency
INDONESIAN JOURNAL OF ECONOMICS, SOCIAL, AND HUMANITIES . 1 (1) : 1 – 15 2
can produce goods more efficiently and are able to compete with other firms so that they can
generate more profit. One indicator to measure firms’ profits is Return on Assets (ROA). Return
on Assets measures a firm’s ability to utilize its assets to make a profit. The greater the ROA
means the higher the profitability of the firm. The following data illustrates the development of
the level of corporate profitability from the consumer goods industry in the period 2013-2016 as
seen from Return on Assets (ROA).
Table 1. Return on Asset
2013 2014 2015 2016
ROA (%) 12.86 11.14 11.54 11.01
Source: Computed data based on firms’ annual and financial report published in IDX (2017)
The firms’ financial performance measured in the average value of Return on Assets has
a declining trend. This decrease in profitability may be caused by an increase in assets not
followed by an increase in net income where the total value of assets from 2013-2016 has
increased each year with the total assets per year of IDR 4,456,865 in 2013; IDR 4,947,874 in
2014; IDR 5,666,140 in 2015; and IDR 6,015,807 in 2016 (Indonesian Stock Exchange, 2017).
The decline in the profitability growth may be because the firms are not able to compete.
According to Sari (2013), there are several ways to increase a firm's competitiveness: First,
increase sales by using sophisticated technology. By using that sophisticated technology, firms
are able to produce goods with good and consistent quality in which this allows firms to
minimize their production costs. This eventually can increase the firm's sales. Second, the use of
the technology may allow firms to work at an economic scale so that firms can minimize
production costs per unit so that this can improve firms’ competitiveness. Third, the
improvement of working capital management leads firms to reduce costs. In carrying out
operational activities, firms require working capital in which working capital may be financed
from equity and debt. If there is an excess or lack of funds, this will affect the level of firms’
profitability. Fourth, managers need the availability of sufficient funds to finance their
expansion. The availability of funds can be from internal that is from equity and external sources
of the fund that is from debts.
Many studies have been conducted in the literature on the relationship between sales
growth and capital expenditure on ROA. The generally examine the direct effect of the
relationship. However, few studies have been conducted to examine the moderating effect of
capital structure direct included in the model of the relationship between sales growth and capital
expenditure on ROA. Furthermore, there also few studies that include working capital efficiency
in a research model and then examining the moderating effect of capital structure on the effect of
working capital efficiency on ROA. These moderating effects are the gap that intends to be
filled by this research. Hence, the contribution of this research is laid on the empirical results of
these moderating effects.
Based on the background described above, the purpose of this study is to analyze and
provide empirical evidence regarding the effect of sales growth, capital expenditure, working
capital efficiency on the financial performance and capital structure as moderating variables.
This study covers Consumer Goods firms listed on the Stock Exchange for the period 2014-
2017.

3
Literature Review
Theoretical basis
Resource-Based Theory
Resource-based theory was pioneered by Penrose (1959). This theory considers the firm as a
collection of resources and capabilities in managing the resources owned by the firm. Resource-
based theory believes that firms will achieve excellence if they have superior resources.
Pecking Order Theory
This theory was first introduced by Donaldson (1961), while the Pecking Order Theory was
conducted by Myers and Majluf (1984). In the perspective of pecking order theory, a capital
structure can be ordered from the cheapest cost of capital to the most expensive one. Firms are
more likely to choose the cheapest source of funding. The cheaper fund is from internal rather
than external. If the internal fund is not enough, firms can find funding from external by
following the capital cost order of funding source. Debt is the second choice after internal
funding sources and if the firm still needs funds, it may issue common stock (external equity).
Pecking order theory refers to firms that aim to maximize the prosperity of the owner of the
firms. Pecking order theory predicts that external debt funding is based on internal funding
deficits.
Trade-off Theory
The trade-off theory is a capital structure theory which states that firms may exchange tax
benefits because firms use debts for problems caused by potential bankruptcy because firms use
debts (Brigham & Houston, 2016). The trade-off theory assumes that the firm's capital structure
is the result of a trade-off of tax profits by using debt with costs that will arise as a result of
using the debt.
Firms with high levels of profitability will certainly try to reduce taxes by increasing the
debt ratio so that the additional debt will reduce taxes. The trade-off theory shows that the value
of a firm with debt will increase with increasing levels of debt. The use of debt will increase the
value of the firm but only to a certain point. After that point, the use of debt actually decreases
the value of the firm.
Firm Performance
Performance is the achievement of the activity implementation in order to realize the firm's
goals, where one of the important goals is to maximize shareholder wealth through increasing
corporate value (Brigham & Houston, 2016). According to Ikatan Akuntan Indonesia (2007)
financial performance is the firm's ability to manage and control the resources it has.
Capital Structure
According to Brigham and Houston (2016), capital structure is a combination of debt and equity
in the firm's long-term financial structure. Capital structure is an important issue for firms. The
bad capital structure will have a direct effect on the financial position of the firm, especially with
the existence of a very large debt that will burden the firm to achieve its goal. The optimal
capital structure is a capital structure that optimizes the balance between risks and returns so as
this may maximize stock prices (Brigham and Houston, 2016).
Sales Growth
Sales growth shows the level of absorption of market demand by firms. The higher sales growth
means firms can meet market demand that accordingly firm sales will increase (Nugraha &
The Effect of Sales Growth, Capital Expenditure, and Working Capital Efficiency
INDONESIAN JOURNAL OF ECONOMICS, SOCIAL, AND HUMANITIES . 1 (1) : 1 – 15 4
Haryanto, 2016). By using the ratio of sales growth, firms can see their sales trend from year to
year. Sales must cover costs so that the firms can increase their profits.
Capital Expenditure
Capital expenditure is costs incurred in order to obtain fixed assets, to improve operational
efficiency, to increase the productive capacity of fixed assets, and to extend the useful life of
fixed assets. These costs are usually a large amount, not often occur, not charged directly as an
expense in the income statement, but capitalized first as a fixed asset on the balance sheet,
because this expenditure will benefit the firm in a long run (Kalungan, Ilat, & Gamaliel, 2017).
The Efficiency of Working Capital
According to Brigham and Houston (2016), working capitals are all short-term assets or current
assets such as cash, securities that can be traded, inventories and accounts receivable. Keown,
Martin, Petty, and Scott-Jr (2010) stated that working capital is the firm's total investment in
current assets or assets expected to be converted into cash within one year or less than one year.
The efficiency of working capital can be seen from working capital turnover, accounts
receivable turnover, and inventory turnover (Wibowo & Wartini, 2012).
Previous Research
Research on corporate performance has been carried out. Some of them are research conducted
by Jatismara (2011) which examines the effect of sales growth on return on firm assets. The
results of this study indicate that sales growth has a positive and significant effect on return on
assets, which means that the higher the sales growth, the higher the level of profit gained from
sales activities, the greater the return on assets obtained. Conversely, research conducted by
Nugraha and Haryanto (2016) states that sales growth does not affect the return on assets, which
means that firms with large sales growth do not always have higher ROA.
Andrian (2012) conducted a study on the effect of capital expenditure on profitability
which showed that capital expenditure had an influence on the profitability of the firm, where
capital expenditure was able to expand business opportunities and would have an impact on
increasing the profitability of the firm. While the research conducted by Asror (2016) stated that
capital expenditure does not affect the firm's performance.
Ainiyah (2016) research on the effect of working capital efficiency on firm performance
states that working capital efficiency has a significant effect on profitability, which means that
the receivable turnover period depends on the length of time stipulated in the credit payment
terms, so that the longer the credit payment terms mean the longer the working capital is tied to
the receivables and means the smaller the turnover rate of accounts receivable in one period and
vice versa the shorter the payment terms of credit, the shorter the level of bonded working
capital in accounts receivable so that the accounts receivable turnover rate in one period is
greater. Aprilia (2017) stated that accounts receivable turnover has a negative and significant
effect on profitability. If accounts receivable turnover is high, this will result in a decrease in the
firm's profitability.
Research on the effect of capital structure on firm performance has been carried out by
Jatismara (2011) stating that DER has a negative and significant effect on ROA. That is, the
greater the proportion of debt used for the capital structure of a firm, the less likely the rate of
profit will be obtained. This is because the bigger the debt, the higher the interest cost. Wibowo
and Wartini (2012) stated that debt does not affect ROA, because firms may not depend solely
on debt, so to increase profitability the firm does not need to increase the amount of its debt.

5
Hypothesis Development
Sales Growth and Firm Performance
Resource-Based Theory considers the firm as a collection of resources and capabilities in
managing the resources owned by the firm. The firm's ability to manage resources well can
create competitive advantages so that it can create value for the firm. Sales are the spearhead of a
firm. Proper sales forecasts are needed, so the firm can prepare everything needed for the
production process.
By using the ratio of sales growth, firms can find out the sales trend for their products
from year to year. Brigham and Houston (2016) state that sales must be able to cover costs so
that it will increase profits. Hence, the firm can determine the steps to be taken to anticipate the
possibility of rising or falling sales in the coming years. From the explanation above, we can
take the following hypothesis:
Ha1: Sales Growth has an effect on ROA
Capital Expenditure and Firm Performance
According to resource-based theory, firms will excel in business competition and obtain good
financial performance by owning, controlling and utilizing important strategic assets, both
tangible assets and intangible assets (Untara, 2014). To carry out operational activities, firms
need investment or capital expenditure in the form of tangible assets such as purchasing and
updating existing facilities so that the firm is able to deal with competition. Investment is
expected to provide the profit that it can be measured as return on assets. If the return on firm
assets goes up, it can be concluded that the firm is successful in investing capital. However, if
the opposite occurs where the return on assets falls, it can be concluded that the firm failed in
investing capital. From the explanation above, we can take the following hypothesis:
Ha2: Capital Expenditure affects ROA
Working Capital Efficiency and Firm Performance
The firm's ability to generate profits by managing accounts receivable efficiently can be seen
from the turnover of accounts receivable. Account receivable turnover shows how long a firm
collects receivables in one period where the funds invested in the receivables by the firm switch
to cash. According to Kasmir (2010), the higher the ratio reveals that the working capital
invested in accounts receivables is lower and of course this condition is good for the firm. That
is, high accounts receivable turnover will switch to cash which will be used by firms in
production to meet consumer demand so that the condition can affect profitability. This is in line
with the research conducted by Ainiyah (2016) which states that working capital efficiency has a
positive and significant effect on profitability. From the explanation above, we can take the
following hypothesis:
Ha3: Working Capital Efficiency has an effect on ROA
Capital Structure and Financial Performance
The firm's policy to use a great number of debts affects the profits obtained by the firm. This is
because the use of excessive debt can increase the failure risk of corporate. The higher the risk of
a firm, the higher the level of profitability expected in return for high risk and vice versa the
lower the risk of the firm, the lower the level of profitability expected in return for low risk.
Pecking order theory can explain why firms that have a high level of profit actually have
a smaller debt level. The small debt level is not because the firm has a small debt level target,
but because they do not need external funds. High-profit rates make their internal funds

The Effect of Sales Growth, Capital Expenditure, and Working Capital Efficiency
INDONESIAN JOURNAL OF ECONOMICS, SOCIAL, AND HUMANITIES . 1 (1) : 1 – 15 6
sufficient to meet their investment needs. If the level of debt changes the profitability of a firm
will also change. But these changes have two sides. First, the increase in debt will also increase
profitability and vice versa the decline in debt also decreases profitability. Second, the increase
in debt will reduce profitability and decrease in debt will increase profitability (Hazmi, 2017).
From the explanation above, we can draw the following hypothesis:
Ha4: Capital Structure affects ROA
Sales Growth and Firm Performance Moderated by Capital Structure
Pecking order theory has the purpose of maximizing the prosperity of the owner of the firm. A
firm with lower risk is a firm that has stable sales growth. We can know the success or failure of
a firm can be seen through sales volume. When sales growth decreases, profitability may
decrease as well. If in this condition, firms use a high level of debts, the debts will strengthen the
effect. In other words, the magnitude of the decrease will enlarge. From the explanation above,
we can take the following hypothesis:
Ha5: Capital structure moderates the effect of sales growth on ROA
Capital Expenditure and Firm Performance Moderated by the Capital Structure
In resource-based theory, one of the factors that might be able to support business
competitiveness is the cost of capital. Firms can invest or upgrade existing facilities or assets. To
support their operations, firms need more funds to be able to renew or to upgrade their existing
assets. Firms can use internal or external funds to invest in capital expenditures so that upgraded
assets or facilities are expected to reduce costs and improve efficiency and are expected to
improve firm performance. From the explanation above, we can draw the following hypothesis:
Ha6: Capital structure moderates the effect of capital expenditure on ROA
Working Capital Efficiency and Firm Performance Moderated by Capital Structure
Pecking order theory explains that firms are more likely to choose funds from internal rather
than external firms and debt is external funding source that becomes the second choice after
internal funding sources. Efficient capital turnover is able to control the operational costs of the
firm. Account receivable turnover shows how long the collection of receivables is in a certain
period that the funds invested in the receivables by the firm become cash again (Aprilia, 2017).
Kasmir (2010) said that the higher ratio shows that the working capital invested in receivables is
lower and of course this condition is good for the firm. Firms often finance their working capital
from debts. As it is acknowledged that the higher level of debts may increase profit or the lower
level of debts may reduce profit because firms miss their business opportunity. In contrast, the
increase in the level of debts may decrease profit because the benefit from tax saving and the
incremental of benefit are not able to cover costs resulted from increasing used debts (such as an
increase in interest and costs associated with financial distress or bankruptcy); vice versa. From
the explanation above, we can draw the following hypothesis:
Ha7: Capital structure moderates the effect of working capital efficiency on ROA

7
Based on the explanation above, a research model can be drawn as follows:
Source: Developed by the authors, 2018
Research Methods
Data
The population in this study is all consumer goods firms that are listed in the Indonesia Stock
Exchange (IDX) in 2014-2017, with the population of 38 firms. This study uses a purposive
sampling method to choose the sample in which the purposive sampling method is based on a
particular assessment of some characteristics of the sample members adjusted for the purpose of
the study. The sample in this study numbered to 35 firms. This study uses secondary data
obtained from the financial report provided by the firms.
Operational Definition of Variables and Variable Measurements
The dependent variable used in this study is firm financial performance. Financial performance
is firms’ achievement of activity implementation to realize the firms’ goals. In measuring
financial performance, this study uses Return on Assets (ROA) that measures the ability of a
firm to earn profits in a certain period. Brigham and Houston (2016) stated that ROA is the ratio
of net income to total assets.
𝑅𝑂𝐴 =Earning After Tax
Total Assets
The independent variables in this research include sales growth, capital expenditure, and
working capital efficiency. Sales growth shows sales activities measured from net sales. Sales
growth can be calculated by implementing this following formula (Barus & Leliani, 2013):
𝑆𝑎𝑙𝑒𝑠 𝐺𝑟𝑜𝑤𝑡ℎ =𝑆𝑎𝑙𝑒𝑠𝑡 − 𝑆𝑎𝑙𝑒𝑠𝑡−1
𝑆𝑎𝑙𝑒𝑠𝑡−1
Capital expenditure (CAPEX) is an expense made by a firm to obtain fixed assets.
Rokhmawati (2017) stated that the fixed assets cover Plant, Property, and Equipment (PPE). In
this study, capital expenditure is measured as the growth of capital expenditure in which capital
expenditure is measured as the ratio of PPE divided by total assets as it is measured by Ilma,
Amin, and Afifudin (2018). Hence, the measurement can be seen as follows:
Sales Growth (X1)
Capital Expenditure (X2)
Working Capital Efficiency measured
as Receivable Turn Over (X3)
Return on Assets
(Y)Return on Assets (Y)
Capital Structure measured as
Debt to Equity Ratio (Z)

The Effect of Sales Growth, Capital Expenditure, and Working Capital Efficiency
INDONESIAN JOURNAL OF ECONOMICS, SOCIAL, AND HUMANITIES . 1 (1) : 1 – 15 8
CAPEX =Net PPE (Fixed Assets)
Total Assets
𝐶𝐴𝑃𝐸𝑋 =𝐶𝑎𝑝𝑒𝑥𝑡 − 𝐶𝑎𝑝𝑒𝑥𝑡−1
𝐶𝑎𝑝𝑒𝑥𝑡−1
Working capital efficiency can be seen from working capital turnover, accounts
receivable turnover, and inventory turnover (Wibowo & Wartini, 2012). In this study, the
efficiency of working capital can be measured using the accounts receivable turnover ratio.
According to Kashmir (2010), receivable turnover is a ratio used to measure how many times the
funds invested in these accounts rotates in one period. The formulas used to look for accounts
receivable turnover are as follows (Rokhmawati, 2016):
Receivable turn over =Sales
Receivables
The moderating variable in this study is capital structure calculated as Debt to Equity
Ratio. Capital structure is a comparison between total debt and equity. The optimal capital
structure is a capital structure that optimizes the equilibrium between risks and returns so as to
maximize stock prices (Brigham & Houston, 2016). The capital structure of a firm can be
measured by comparing the total debt with total equity.
𝐷𝐸𝑅 =Total debts
Equities
Data Analysis
This study uses the partial least square (PLS) with WarpPLS to analyze the data. This research
uses PLS because although we have tried a various method to transform the data to get the
normal residual of regression, the data is still not normal. Furthermore, the data still does not
meet the classic assumption (normality, multicollinearity, heteroscedasticity, and
autocorrelation) as it is required in the regression based on ordinary least square (OLS).
This article provides descriptive statistics to give a portrayal of the data that cover the
mean, standard deviation, maximum and minimum values of the data. Descriptive statistics are
useful to provide an overview of the distribution and behavior of the sample data (Ghozali,
2016). Then, the evaluation of the structural model (inner model) is provided. This model
provides the model fit, path coefficient, and R². Before analyzing the path coefficient
significance and R², the model should be checked for the fit of the model. The fit model test is
used to determine whether a model has a match with the data. In the fit model test, there are
three test indices must be met, namely average path coefficient (APC), average R-squared (ARS)
and average variance factor (AVIF) with criteria:
1. Average path coefficient (APC) has a value of P < 0.05.
2. Average R-squared (ARS) has a value of P < 0.05.
3. Average block Variance Inflation Factor (AVIF) has a value of < 5 and ideally 3.3.
After that, a hypothesis test can be conducted. From the test result, it can be seen the
direction of the relationship between the independent variable as well as moderating variable and
dependent variable. The results provide path coefficients and the significance level which is then
we can conclude the relationship between independent variables as well as moderating variable

9
and dependent variable. The level of significance used in this study is 5%. Based on the
explanation above, a hypothesis can be accepted or rejected based on the following criteria:
P-value > 0.05, then H0 is accepted
P-value < 0.05, then H0 is rejected and Ha is accepted
Results and Discussion
Results
Descriptive statistics provide the mean, standard deviation, maximum and minimum values of
sales growth, capital expenditure, receivable turnover, financial performance (ROA) and capital
structure (DER) as moderating variables. The numbers can be seen in Table 2 as follows:
Table 2. Descriptive Statistics Test Results
Descriptive Statistics
N
Minimum
in percent
Maximum
in percent
Mean
in percent Std.Deviation
Sales Growth 140 31.22 36.34 32.1056 .41551
CAPEX 140 31.32 35.30 32.0558 .33652
Working Capital Efficiency 140 32.58 99.16 42.6838 10.08017
Capital Structure 140 .96 45.98 32.7866 3.08907
Financial performance 140 15.29 85.00 42.0224 11.47077
Valid N (listwise) 140
Source: computed data
After performing the descriptive statistics, we evaluate the fitness of the research model
by checking the indices of the results that are provided in Table 3. Furthermore, Figure 1
provides the model diagram of this research model.
Table 3. Model Fit Test
Fit and Quality Indices Model Index P values Criteria Information
Average path coefficient (APC) 0.200 < 0.001 P < 0.05 Accepted
Average R-squared (ARS) 0.220 < 0.001 P < 0.05 Accepted
Average Adjusted R-
squared (AARS) 0.179 < 0.001 P < 0.05 Accepted
Average block VIF (AVIF) 1.559 ≤ 5 and ideally ≤ 3.3 Accepted
Source: computed Data
The Effect of Sales Growth, Capital Expenditure, and Working Capital Efficiency
INDONESIAN JOURNAL OF ECONOMICS, SOCIAL, AND HUMANITIES . 1 (1) : 1 – 15 10
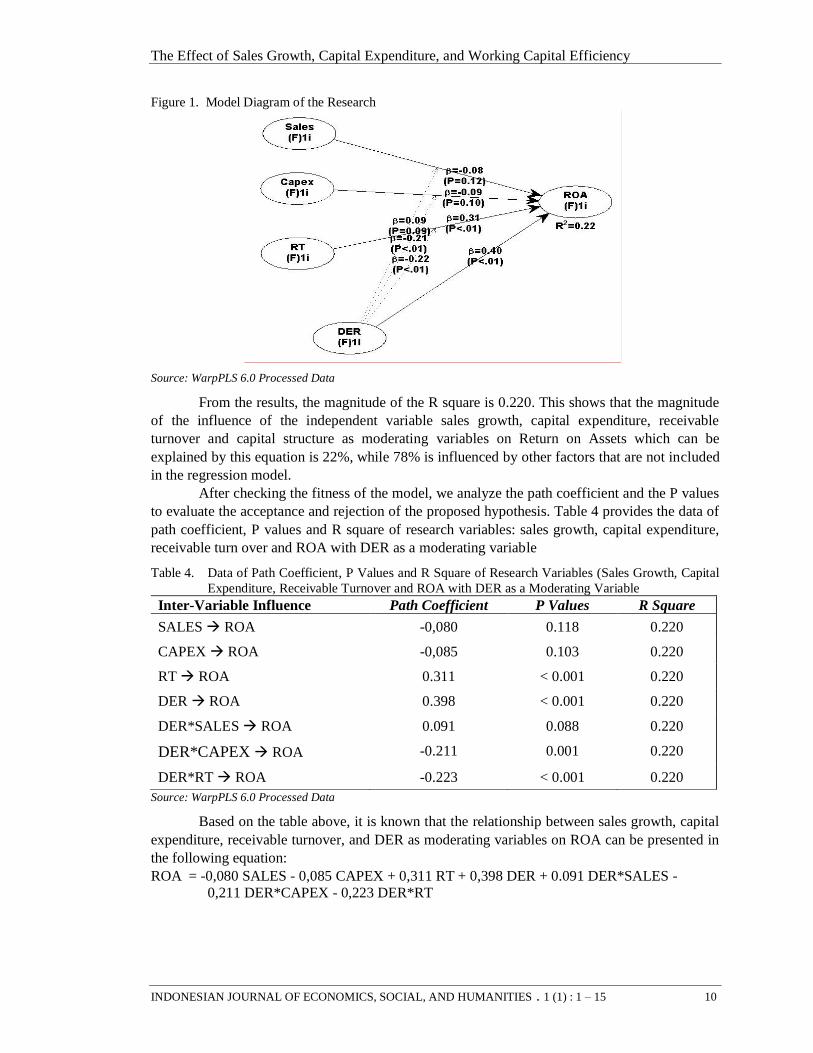
Figure 1. Model Diagram of the Research
Source: WarpPLS 6.0 Processed Data
From the results, the magnitude of the R square is 0.220. This shows that the magnitude
of the influence of the independent variable sales growth, capital expenditure, receivable
turnover and capital structure as moderating variables on Return on Assets which can be
explained by this equation is 22%, while 78% is influenced by other factors that are not included
in the regression model.
After checking the fitness of the model, we analyze the path coefficient and the P values
to evaluate the acceptance and rejection of the proposed hypothesis. Table 4 provides the data of
path coefficient, P values and R square of research variables: sales growth, capital expenditure,
receivable turn over and ROA with DER as a moderating variable
Table 4. Data of Path Coefficient, P Values and R Square of Research Variables (Sales Growth, Capital
Expenditure, Receivable Turnover and ROA with DER as a Moderating Variable
Inter-Variable Influence Path Coefficient P Values R Square
SALES → ROA -0,080 0.118 0.220
CAPEX → ROA -0,085 0.103 0.220
RT → ROA 0.311 < 0.001 0.220
DER → ROA 0.398 < 0.001 0.220
DER*SALES → ROA 0.091 0.088 0.220
DER*CAPEX → ROA -0.211 0.001 0.220
DER*RT → ROA -0.223 < 0.001 0.220
Source: WarpPLS 6.0 Processed Data
Based on the table above, it is known that the relationship between sales growth, capital
expenditure, receivable turnover, and DER as moderating variables on ROA can be presented in
the following equation:
ROA = -0,080 SALES - 0,085 CAPEX + 0,311 RT + 0,398 DER + 0.091 DER*SALES -
0,211 DER*CAPEX - 0,223 DER*RT
11
Discussion
The Effect of Sales Growth on ROA
The statistical results show that sales growth has a negative and insignificant effect on financial
performance. The negative sign means that the increase in sales is likely to reduce the firms’
ROA. In contrast, the decrease in sales of the firms is likely to increase ROA, but the effect is
not significant. The insignificance of the effect of sales growth on ROA may be caused by some
reason. Firstly, the increased sales growth accompanied by the increased costs such as operating
costs that is followed by the increase in asset growth lead to the decrease in ROA. This is
because the profits obtained from sales are used to cover costs incurred in the firm operational
activities so that this impact on the decrease in ROA. Furthermore, the insignificant influence
might be that sales growth is not a major factor affecting firms ROA. According to Ainiyah
(2016), other factors that can influence profitability are receivable turnover and debt to equity
ratio. The results of this study are consistent with research conducted by Nugraha and Haryanto
(2016) which stated that sales growth does not have a significant effect on return on assets.
Effect of Capital Expenditure Growth on ROA
The statistical results show that capital expenditure has a negative and not significant effect on
ROA. A negative sign means that the increase in firms’ capital expenditure growth is likely to
reduce the firms’ ROA. Whereas, the decrease in capital expenditure growth is likely to enhance
the firms’ ROA, but the effect is insignificant. The insignificance of the effect of capital
expenditure growth on ROA may be caused by firstly, if the utilization of fixed assets purchased
from capital expenditure is not adequately efficient, then the fixed costs per unit of product will
increase. This clearly affects the competitiveness of the firms’ products in the market, so that it
will have an impact on firms’ ROA. Second, the mistake in choosing fixed assets will have an
adverse effect on the costs per unit, and the selling price. Accordingly, the firms’ profit will
decline as the firms’ competitiveness decreases. The results of this study are in line with the
research conducted by Asror (2016) which stated that capital expenditure does not have a
significant effect on the firm's financial performance, and the results of this study are not in
accordance with Andrian's research (2012) which states that capital expenditure has a significant
effect on financial performance.
Effect of Receivable Turnover on ROA
Statistical results show that receivable turnover has a positive and significant effect on ROA. A
positive sign means that the increase in receivable turnover will increase firms’ ROA. On the
contrary, the decrease in receivable turnover will significantly reduce the firms’ ROA. The
significant effect of receivable turnover on ROA is caused by the increased credit sales where
the credit can be collected in a short time and the bad debts are low, this will allow firms to
receive their cash from their receivable account in a short time so that the period of payment of
receivables is faster. Accordingly, firms can reduce their costs of working capital so that firms’
profitability will increase. The results of this study are supported by research conducted by
Ainiyah (2016), Wibowo and Wartini (2012) which states that working capital efficiency has a
significant effect on profitability.
Effect of DER Growth on ROA
Statistical results indicate that the capital structure growth has a positive and significant effect on
ROA. A positive sign means that the increase in the use of debt will increase the firms’ ROA.
Conversely, the decrease in the use of debt will reduce the firms’ ROA. The significant effect of
DER growth on ROA may be caused by firstly, firms are able to utilize debts to finance their

The Effect of Sales Growth, Capital Expenditure, and Working Capital Efficiency
INDONESIAN JOURNAL OF ECONOMICS, SOCIAL, AND HUMANITIES . 1 (1) : 1 – 15 12
business efficiently so that it generates profits. Secondly, the use of debt provides benefits
because of the reduction in tax payments due to interest on debt; therefore the firm should use
debt in its capital structure. Thirdly, this result also implies that the current level of debt ratio
used by firms is still at a safe level. Hence, the increase in debts still provides profit for firms.
The results of this study are in line with Wahyuni's research (2012) which stated that the capital
structure has a positive and significant effect on profitability. Hazmi (2017) also stated that the
use of debt has a significant effect on firm profitability.
The Effect of Sales Growth on ROA Moderated by DER
The statistical results indicate that the sales growth which is moderated by DER has an
insignificant effect on ROA. This shows that DER does not moderate the influence of sales
growth on ROA. Optimal capital structure is a composition of debt and capital that is at the most
appropriate and most financially profitable for firms. The use of external funds might have an
influence on the relationship between sales and firms’ ROA. The existence of additional debts
will support firms to finance the expansion of firms’ sales that eventually might increase sales
growth. However, based on the result of the effect of ROS growth on ROA is negative despite
insignificant. This means that the increase in sales growth is not followed by the increase in
ROA. This may be because firms have to bear a high selling cost so that the profit cannot cover
the high selling costs. By employing additional debts, firms must pay a higher interest so that
this will reduce firms’ ROA. Nevertheless, the level of DER seems at the safe level so that the
benefit of adding debts can offset the firms’ selling costs. Hence, DER does not moderate the
effect of sales growth on firms ROA.
The Effect of Capital Expenditure on ROA Moderated by DER
Statistical results show that capital expenditure moderated by DER has a negative and significant
effect on ROA. The result shows that DER weakens the negative effect of capital expenditure on
ROA. This means that the use of debt will reduce the magnitude of the influence of capital
expenditure on ROA. It can be explained as follows. The use of debts to renew or to utilize fixed
assets will affect firms’ ROA. Investment in fixed assets generally requires large amounts of
funds. The use of debts will increase interest so that this will reduce firms’ ROA.
Optimal capital structure is a composition of debt and capital that is at the most
appropriate and most financially profitable for firms. The use of external funds might have an
influence on the relationship between capital expenditure growth and firms’ ROA. The existence
of additional debts will support firms to finance their capital expenditure that eventually will
increase total assets and from the increased assets, firms may gain higher revenues. However,
based on the result of the effect of capital expenditure growth on ROA is negative although
insignificant. This means that the increase in capital expenditure growth is not followed by the
increase in ROA. This may be because firms are not efficient enough in utilizing the fixed assets
so that the additional benefit cannot cover the costs. By employing additional debts, firms must
pay a higher interest so that this will reduce firms’ ROA. Nevertheless, the level of DER seems
still in the safe level so that the benefit of adding debts can offset the firms’ debt costs. Hence,
DER weakens the negative effect of capital expenditure growth on firms ROA. In other words,
DER reduces the magnitude of the negative effect of capital expenditure growth on firms ROA.
Effect of Receivable Turnover on ROA Moderated by DER
The statistical results show that receivable turnover that is moderated by DER has a negative and
significant effect on ROA. This result shows that DER weakens the positive and significant
effect of receivable turnover on ROA. This means that the use of debt will have a moderating
effect on the receivable turnover on firms ROA. The rate of receivable turnover depends on how
13
fast the period of payment of the receivables that the firms will receive. The faster the payment
period will have a positive impact on the firms’ profitability. However, the influence of accounts
receivable which was initially able to increase the firms’ profit with the existence of debt will
weaken the positive influence of accounts receivable on ROA. This may be because receivable
turnover is based on the receivable account of firms in which the account is classified as the
current account. Conversely, DER used in this research is measured as total costs. This implies
that firms also use not only short-term liabilities but also use long terms debt to finance their
receivable accounts. As it is explained by Rokhmawati (2016) that the utilization of a large
portion of long terms debts to finance working capital will reduce risks of firms liquidity and this
lower risks will be followed by the lower benefits. Hence, DER has weakened the positive effect
of receivable turnover on ROA may be because firms adopt a conservative approach to finance
their working capital, where conservative approach suggests firms use many sources of funding
from long terms of funding such as long terms debts. The consequence of using such long terms
debt to finance firms’ working capital is the lower liquidity risks. Nevertheless, the lower the
risks lead firms to get a lower return. Accordingly, DER will reduce the magnitude of the
positive effect of receivable turnover on ROA. In other words, DER will weaken the positive
effect of receivable turnover on ROA.
Conclusions and Suggestions
Conclusion
The results of this study indicate that sales growth and capital expenditure do not affect firms’
ROA. Receivable turnover has a positive and significant effect on ROA. DER has a positive and
significant effect on ROA. DER cannot moderate the influence of sales growth on ROA. DER is
able to moderate the effect of capital expenditure on ROA. DER is able to moderate the effect of
receivable turnover on ROA.
Suggestion
For further researchers, it is expected to re-examine other factors that affect firms’ ROA,
because in this study the independent variables used were only sales growth, capital expenditure
growth, receivable turnover, and DER as moderating variables. It is also expected to use more
diverse proxies in identifying improvements in the firms’ ROA in order to obtain more perfect
results. For firms, they should really utilize the assets owned by the firms in order to improve
their ROA.
References
Adhinegara, B. Y. (2017). Sektor Industri Minim Dukungan. Retrieved March 19, 2018, from
http://www.koran-jakarta.com/sektor-industri-minim-dukungan
Ainiyah, Q. (2016). Pengaruh Perputaran Piutang, Perputaran Persediaan Dan Debt To Equity
Ratio Terhadap Profitabilitas. Jurnal Ilmu dan Riset Manajemen, 5(1).
Andrian, J. (2012). Pengaruh Struktur Modal, Pertumbuhan Perusahaan, Capital Expenditure
Dan Insentif Manajer Terhadap Nilai Perusahaan Dengan Profitabilitas Sebagai Variabel
Intervening. Jurnal Bisnis Strategi, 21(2), 18-39.
Aprilia, E. (2017). Pengaruh Perputaran Piutang, Persediaan Dan Modal Kerjaterhadap
Profitabilitas Tekstil Dan Garmen. Jurnal Ilmu dan Riset manajemen, 6(4).
Asror, M. H. (2016). Pengaruh Kebijakan Perusahaan Dan Human Capita lterhadap Nilai
Perusahaan Dengan Kinerja Perusahaan Sebagai Variabel Intervening (Studi Empiris Pada

The Effect of Sales Growth, Capital Expenditure, and Working Capital Efficiency
INDONESIAN JOURNAL OF ECONOMICS, SOCIAL, AND HUMANITIES . 1 (1) : 1 – 15 14
Perusahaan Consumer Periode 2010-2012). Manuscript. Fakultas Ekonomi dan Bisnis
Universitas Muhammadiyah Surakarta, Indonesia.
Barus, A. C., & Leliani. (2013). Analisis Faktor-Faktor yang Mempengaruhi Profitabilitas pada
Perusahaan manufaktur yang Terdaftar di Bursa Efek Indonesia. Jurnal Wira Ekonomi
Mikroskil, 3(2), 111-121.
Brigham, E. F., & Houston, J. F. (2016). Fundamentals of Financial Management. Boston:
Cengage Learning.
Donaldson, G. (1961). Corporate debt capacity: A study of corporate debt policy and the
determination of corporate debt capacity. Boston: Division of Research Harvard Graduate
School of Business Administration.
Ghozali, I. (2016). Aplikasi Analisis Multivariate dengan SPSS. Semarang: Badan Penerbit
UNDIP.
Hazmi, N. A. (2017). Pengaruh Penggunaan Hutang Dan Kinerja Keuangan Terhadap
Profitabilitas. Jurnal Ilmu dan Riset Manajemen, 6(5).
Ikatan-Akuntan-Indonesia. (2007). Standar Akuntansi Keuangan. Jakarta: Salemba Empat.
Ilma, W., Amin, M., & Afifudin. (2018). Analisis Pengaruh Tingkat Kenaikan Penggunaan
Capital Expenditure Terhadap Kinerja Perusahaan (Studi Empiris Pada Perusahaan
Manufaktur Yang Terdaftar Di Bursa Efek Indonesia 2014-2016). Jurnal Riset Akuntansi,
7(3), 108-118.
Indonesian Stock Exchange. (2017). Laporan Keuangan dan Tahunan. Retrieved October 26,
2017, from IDX: Bursa Efek Indonesia, Laporan Keuangan dan Tahunan,
http://www.idx.co.id/perusahaan-tercatat/laporan-keuangan-dan-tahunan/
Jatismara, R. (2011). Analisis Pengaruh TATO, DER, Dividend, Sales, dan Current Ratio
terhadap Return on Asset studi pada perusahaan manufaktur yang terdaftar di BEI tahun
2008-2010. Thesis. Semarang, Central Java, Indonesia: Universitas Diponegoro.
Kalungan, T. R., Ilat, V., & Gamaliel, H. (2017). Perlakuan Akuntansi Capital Expenditure Dan
Revenue Expenditure Pada PT. Putra Karangetang. Jurnal Riset Akuntansi Going Concern,
12(2), 1044-1054.
Kasmir. (2010). Analisis Laporan Keuangan. Jakarta: PT. Rajagrafindo Persada.
Kementerian Perindustrian. (2013). Manufaktur Ditopang Sektor Barang Konsumsi. Retrieved
November 17, 2017, from Indonesia Finance Today:
www.kemenperin.go.id/artikel/7014/Manufaktur-Ditopang-Sektor-Barang-Konsumsi
Keown, A. J., Martin, J. D., Petty, J. W., & Scott-Jr, D. F. (2010). Manajemen Keuangan.
Jakarta: PT. Indeks.
Myers, S. C., & Majluf, N. S. (1984). Corporate financing and investment decisions when firms
have information that investors do not have. Journal of Financial Economics, 13(2), 187–
221.
Nugraha, P. S., & Haryanto, A. M. (2016). Analisis Pengaruh Sales Growth, ROE, Size, TATO,
Dan Current Ratio Terhadap ROA Dan ROA Terhadap Beta Akuntansi (Accounting Beta)
(Studi Kasus Pada Perusahaan Manufaktur Yang Terdaftar Di BEI Periode. Diponegoro
Journal of management, 5(1), 1-12.
15
Penrose, E. (1959). The Theory of the Growth of the Firm. Cambridge, U.K: John Wiley.
Rokhmawati, A. (2017). Do Financial Constraints Moderate the Impact of Financing Decisions
From Internal-financing Sources on Investment. Jurnal Keuangan dan Perbankan, 21(3),
331–343.
Rokhmawati, A. (2016). Manajemen Keuangan. Yogyakarta: Deepublish.
Rozuli, I. (2017). Sektor Industri Minim Dukungan. Retrieved March 19, 2018, from Koran
Jakarta: http://www.koran-jakarta.com/sektor-industri-minim-dukungan/
Sari, N. M. (2013). Analisis Pengaruh Leverage, Efektivitas Aset Dan Sales Terhadap
Profitabilitas Serta Dampaknya Terhadap Nilai Perusahaan (Studi Pada Perusahaan Di Sektor
Industri Barang Konsumsi Yang Terdaftar Di Bursa Efek. Thesis. Fakultas Ekonomi dan
Bisnis Universitas Diponegoro. Semarang. Indonesia.
Untara, A. P. (2014). Pengaruh Modal Intelektual Terhadap Kinerja Keuangan Perusahaan
Perbankan Yang Terdaftar di BEI. Jurnal Ilmu dan Riset Akuntansi, 3(10).
Wahyuni, S. (2012). Efek Struktur Modal Terhadap Profitabilitas Pada Perusahaan Manufaktur
Yang Terdaftar Di Bursa Efek Indonesia. Management Analysis Journal, 1(2), 29-33.
Wibowo, A., & Wartini, S. (2012). Efisiensi Modal Kerja, Likuiditas dan Leverage terhadap
Profitabilitas pada Perusahaan Manufaktur di BEI. Jurnal Dinamika Manajemen, 3(1), 49-58.