Embed Size (px)
Citation preview
Universidad de Antofagasta
Departamento de Ingeniería Química y Procesos de Minerales
Doctorado en Ingeniería de Procesos de Minerales
The effect of seawater on the thermodynamics and
crystallization of copper sulfate pentahydrate
”THESIS SUBMITTED IN PARTIAL FULFILLMENT OF THE REQUIREMENTS FOR
THE DEGREE OF DOCTOR OF MINERALS PROCESSING ENGINEERING”
Author: Francisca J. Justel Retamal
Director of thesis: Dra. María E. Taboada
Co-Director: Dr. Yecid Jiménez Bellott
October 2017
Antofagasta , Chile
ii
A mi Familia, mis padres Digna y Arturo y a mis hermanos
Pablo y Sebastián por el apoyo incondicional que me brindan…
iii
Agradecimientos
A Dios por bendecirme con perseverancia y sabiduría para alcanzar mis metas.
A mis padres Arturo Justel y Digna Retamal, y a mis hermanos por brindarme su apoyo
incondicional siempre, sobre todo durante el proceso de desarrollo de la tesis doctoral.
A mis supervisores de tesis Dra. María Elisa Taboada y Dr. Yecid Jiménez Bellott, por el
excelente trabajo de dirección, enseñanza y guía realizado en estos años.
Al Dr. Kevin Roberts, por colaborar con nosotros y recibirme 8 meses en el CDT CP3
(Centre for Doctoral Training in Complex Particulate Products and
Processes),Universidad de Leeds, para realizar la estadía de investigación.
A Diana Camacho, por su apoyo incondicional durante mi estadía de Investigación en la
Universidad de Leeds.
Al Gobierno de Chile por la beca doctoral CONICYT doctorado Nacional, Año académico
2013. Nro. 21130894 que ayudó a financiar mis estudios doctorales y al Proyecto Fondecyt
1140169 por el financiamiento de la presente investigación.
A mi querida Elsita por ayudarme en la parte experimental de mi tesis y cada vez que lo
necesité.
A mis amigos, por la compañía y apoyo durante estos años de tesis doctoral.
A todos mis compañeros y profesores del Programa de Doctorado en Ingeniería de
Procesos de Minerales de la Universidad de Antofagasta por los buenos momentos
compartidos y las enseñanzas entregadas.
iv
RESUMEN
En la presente tesis doctoral, se determinó la influencia del agua de mar en el equilibrio
sólido-líquido de soluciones ácidas de sulfato de cobre a diferentes temperaturas (293.15 a
333.15 K) y su efecto sobre las propiedades físicas (densidad, viscosidad y actividad
termodinámica del agua).
La representación termodinámica del equilibrio sólido-líquido del sistema de sulfato de
cobre - ácido sulfúrico - agua de mar se llevó a cabo utilizando una metodología simple
reportada en la literatura a la que se le realizaron algunas modificaciones. Fue utilizado el
modelo de Pitzer y una ecuación tipo Born para modelar el sulfato de cobre y ácido
sulfúrico, respectivamente, además, el agua de mar fue considerada como solvente. Esta
metodología permitió determinar las cantidades de sulfato de cobre precipitadas y el
rendimiento óptimo en función de la concentración de ácido sulfúrico.
A su vez, se realizó un estudio termodinámico del sistema Cu-Na-H-SO4-Cl-HSO4-H2O
utilizando el modelo de Pitzer en el intervalo de temperatura de 293.15 a 333.15 K para
representar el equilibrio sólido-líquido del sistema sulfato de cobre-ácido sulfúrico- agua de
mar y se determinaron nuevos parámetros binarios y ternarios de Pitzer en un amplio rango
de temperaturas, los que pueden ser utilizados para predecir las solubilidades de otros
sistemas sólido-líquido en los que estén implicados los iones Cu2+
, Na+, H
+, SO4
2-, Cl
-,
HSO4- y H2O.
Además, con el fin de determinar el efecto de los principales iones presentes en el agua de
mar (Na+ y Cl
-) en el proceso de cristalización, se evaluó el efecto del cloruro de sodio en la
forma, tamaño, composición y cinética de crecimiento de los cristales de sulfato de cobre
pentahidratado, y se realizaron comparaciones con resultados en agua fresca, donde se
concluye que los cristales obtenidos en los medios con cloruro de sodio, son más grandes y
prismáticos con respecto a los obtenidos en agua fresca. Este comportamiento se atribuye
principalmente a la cinética de crecimiento; debido a que las tasas de crecimiento de las
caras (1-10) y (1-1-1) se ven afectadas cuando el cloruro de sodio está presente en la
solución, especialmente en el caso de la cara (1-10), donde se observa un cambio en el
mecanismo de crecimiento.
v
ABSTRACT
In this doctoral thesis, the influence of seawater on the solid–liquid equilibrium in acidic
solutions of copper sulfate at different temperatures (293.15 to 333.15 K), and its effect on
physical properties (density, viscosity, and thermodynamic water activity) was determined.
The thermodynamic representation of the solid–liquid equilibrium of the copper sulfate–
sulfuric acid–seawater system was carried out using a simple methodology reported in the
literature with some modifications, where the Pitzer model and a Born-type equation were
used for modeling the copper sulfate and sulfuric acid effects, respectively, and the
seawater was considered as a solvent. The amounts of copper sulfate precipitated and the
optimum yield as a function of the sulfuric acid concentration were estimated.
Additionally, a thermodynamic study of the Cu-Na-H-SO4-Cl-HSO4-H2O system using the
Pitzer model in the temperature range of 293.15 to 333.15 K was performed to represent the
solid–liquid equilibrium of the copper sulfate–sulfuric acid–seawater system, where new
binary and ternary Pitzer parameters in a wide temperature range were determined; these
can be used to predict solubilities of other solid-liquid systems where the Cu2+
, Na+, H
+,
SO42-
, Cl-, HSO4
-, and H2O ions are involved.
Furthermore, in order to understand the effect of the principal ions present in seawater (Na+
and Cl-) in the crystallization process, the effect of sodium chloride on the shape, size,
composition, and growth kinetics of copper sulfate pentahydrate crystals was evaluated and
compared with results in freshwater; and it is concluded that crystals grown in sodium
chloride media are larger and more prismatic than those grown in H2O. This behavior is
mainly attributed to the growth kinetics because growth rates of both the (1-10) and (1-1-1)
faces are affected when sodium chloride is present in the solution, especially in the case of
the (1-10) face, where a change in the growth mechanism is observed.
vi
THESIS ORGANIZATION
This thesis consists of six chapters with their respective references; moreover, an
Appendices section is included at the end, where additional information along with a
summary of the publications and different works presented at several national and
international conferences is presented.
Chapter I presents the introduction and background to the study, highlighting the research
problematic, hypotheses, and the objectives.
Chapter II describes the influence of seawater on the solid–liquid equilibrium for acid
solutions of copper sulfate in the temperature range of 293.15 to 318.15 K, and its effect on
the physical properties of density and viscosity. This work was performed in order to gain a
better knowledge of the design of copper sulfate pentahydrate crystallization plants using
seawater by means of the addition of sulfuric acid. This work, entitled ‘Solubilities and
physical properties of saturated solutions in the copper sulfate + sulfuric acid + seawater
system at different temperatures’ was published in the Brazilian Journal of Chemical
Engineering, Vol. 32 (2015) 629-635.
Chapter III presents the experimental determination of the solubilities and water activities
for aqueous solutions of copper sulfate in seawater at different temperatures (from 293.15
to 333.15 K), to represent the solid–liquid equilibrium of a copper sulfate–sulfuric acid–
seawater system. The thermodynamic representation of the phase equilibrium was based on
a simple methodology reported in the literature, which also allowed the estimation of the
amounts of copper sulfate precipitated and the optimum yield as a function of the sulfuric
acid concentration. This work, entitled ‘Solid–liquid equilibrium and copper sulfate
crystallization process design from a sulfuric acid–seawater system in the temperature
range from 293.15 to 333.15 K has been published in the Industrial and Engineering
Chemistry Research Journal, Vol. 56 (2017) 4477-4487.
Chapter IV presents the determination of water activities for aqueous solutions of copper
sulfate, where these values, along with the Pitzer ion-interaction model, were used to
represent the solid–liquid equilibrium of the copper sulfate-sulfuric acid-seawater system
vii
over a wide temperature range. This representation was performed through the
thermodynamic study of the Cu-Na-H-SO4-Cl-HSO4-H2O system. This work, entitled
‘Thermodynamic study of the Cu-Na-H-SO4-Cl-HSO4-H2O system for the solubility of
copper sulfate in acid seawater at different temperatures’ has been accepted for publication
in the Journal of Molecular Liquids.
Chapter V describes the effect of sodium chloride on the shape, size, composition, and
growth kinetics of copper sulfate pentahydrate crystals, in order to understand the effect on
the crystallization process of the principal ions present in seawater (Na+ and Cl
-). This
work, entitled ‘Sodium chloride effect in the copper sulfate pentahydrate crystallization’
has been submitted for publication in the Journal of Crystal Growth.
Chapter VI presents the main conclusions of this work, and makes some recommendations
for future works.
viii
CONTENTS
CHAPTER I 1
GENERALITIES 1
1. INTRODUCTION 1
2. PROBLEMATIC, HYPOTHESES, AND OBJECTIVES 2
2.1 Problematic 2
2.2 Hypotheses 3
2.3 Objectives 4
2.3.1 General objective 4
2.3.2 Specific objectives 4
CHAPTER II 5
STATE OF THE ART 5
1. THE USE OF SEAWATER IN MINING 5
1.1 Introduction 5
1.2 Characteristics of seawater 6
1.3 Consumption of seawater in Chile 8
1.4 Physicochemical properties of seawater 9
2. COPPER SULFATE PENTAHYDRATE 15
2.1 Characteristics and properties 15
2.2 Industrial process of copper sulfate pentahydrate crystallization 16
2.3 Solubilities and physical properties of the copper sulfate-sulfuric acid-water system.
20
2.4 Copper sulfate pentahydrate crystallization. 21
3. CRYSTALLIZATION PROCESS AND CRYSTALLIZATION KINETICS 26
3.1 Sodium chloride effect in crystallization 26
3.2 Growth kinetics of single crystals and Crystal growth mechanisms 27
4. SOLID-LIQUID EQUILIBRIUM MODELING. 29
4.1 Models for electrolyte solutions 29
4.2 Pitzer model applied to the thermodynamics of natural water and copper sulfate. 33
4.2.1 Thermodynamics of natural water systems using the Pitzer model. 33
4.2.2 Thermodynamic properties of copper sulfate solutions 35
4.2.3 Pitzer ion-interaction model applied to the CuSO4-H2SO4-H2O system 36
4.2.4 Thermodynamics of multicomponent solutions involving sodium and copper
chlorides and sulfates. 38
5. REFERENCES 41
ix
CHAPTER III 49
SOLUBILITIES AND PHYSICAL PROPERTIES OF SATURATED SOLUTIONS IN
THE COPPER SULFATE + SULFURIC ACID + SEAWATER SYSTEM AT
DIFFERENT TEMPERATURES 49
ABSTRACT 49
INTRODUCTION 50
MATERIALS AND METHODS 51
2.1 Reagents 51
2.2 Apparatus 51
2.3 Procedures 52
2.3.1 Equilibrium time determination 52
2.3.2 Measurement of physical properties in different conditions 52
3. RESULTS AND DISCUSSION 53
3.1 Experimental results 53
3.1.1 Solubilities 55
3.1.2 Physical properties 55
4. CONCLUSIONS 64
5. REFERENCES 65
CHAPTER IV 67
SOLID–LIQUID EQUILIBRIUM AND COPPER SULFATE CRYSTALLIZATION
PROCESS DESIGN FROM A SULFURIC-ACID–SEAWATER SYSTEM IN THE
TEMPERATURE RANGE FROM 293.15 TO 333.15 K. 67
ABSTRACT 67
1. INTRODUCTION 68
2. EXPERIMENTAL SECTION 70
2.1 Materials 70
2.2 Apparatus and Procedures 71
2.2.1 Solubility measurements for the CuSO4–H2SO4–seawater system at 323.15 and
333.15 K 71
2.2.2 X-ray diffraction and thermogravimetric analysis of copper sulfate crystals 72
2.2.3 Water activity measurements of CuSO4 in seawater at different temperatures 72
3. THERMODYNAMIC FRAMEWORK 73
4. RESULTS AND DISCUSSION 76
4.1 Solubilities of copper sulfate in acidic seawater at different temperatures 76
4.2 Solids analysis: X-ray diffraction and thermogravimetric analysis 78
4.3 Water activities of the copper-sulfate–seawater system at different temperatures 81
4.4 Determination of the Pitzer parameters βMX(0)
, βMX(1)
, βMX(2)
, and CMX(ϕ)
for copper
sulfate in seawater at different temperatures 84
x
4.5 Solubility products of copper sulfate pentahydrate in seawater at different
temperatures 85
4.6 Representation of the solid–liquid equilibrium 86
4.6.1 Experimental and calculated solubility isotherms of the CuSO4–H2SO4–
seawater system at different temperatures 86
4.7 Predictions of precipitated amounts and yield of copper sulfate 87
4.8 Conceptual design of the copper sulfate crystallization process by means of the
addition of sulfuric acid using the phase diagram 90
5. CONCLUSIONS 94
6. REFERENCES 95
CHAPTER V 98
THERMODYNAMIC STUDY OF THE Cu-Na-H-SO4-Cl-HSO4-H2O SYSTEM FOR
THE SOLUBILITY OF COPPER SULFATE IN ACID SEAWATER AT DIFFERENT
TEMPERATURES 98
ABSTRACT 98
1. INTRODUCTION 99
2. EXPERIMENTAL SECTION 101
2.1 MATERIALS 101
2.2 APPARATUS AND PROCEDURES 101
2.2.1 Water activity measurements of CuSO4 in H2O at different temperatures 101
3. THERMODYNAMIC FRAMEWORK. 102
3.1 The ion-interaction model 102
3.2 Ion-interaction parameters in binary aqueous solutions 106
3.3 Ion-mixing interaction parameters in ternary solutions 108
4. RESULTS AND DISCUSSION 112
4.1 Water activities of aqueous CuSO4 solutions at different temperatures. 112
4.2 Determination of the Pitzer parameters 𝛽MX(0)
, 𝛽𝑀𝑋(1)
, 𝛽𝑀𝑋(2)
, and 𝐶𝑀𝑋(𝜙)
for CuSO4, CuCl2,
and Cu(HSO4)2 at different temperatures. 114
4.3 Ternary mixing parameters at different temperatures. 118
4.4 Solubility products of copper sulfate pentahydrate at different temperatures 119
4.5 Representation of the solid-liquid equilibrium of the CuSO4 - H2SO4 - seawater
system at six different temperatures. 120
5. CONCLUSIONS 123
6. REFERENCES 124
CHAPTER VI 128
CRYSTALLIZATION OF COPPER SULFATE PENTAHYDRATE IN ABSENCE AND
PRESENCE OF SODIUM CHLORIDE 128
ABSTRACT 128
1. INTRODUCTION 129
xi
2. MATERIALS AND METHODS 132
2.1 Materials 132
2.2 Equipment and experimental procedure 132
2.2.1 Solubilities measurements of copper sulfate in aqueous solutions and in 2.4 wt
% sodium chloride media. 132
2.2.2 Crystallization experiments. 132
2.2.3 Thermal Analysis (TGA/DSC) and Chemical Analysis 134
2.2.4 Crystal Growth measurements by In-situ Microscopy 134
2.2.5 Determination of activity coefficients for the assessment of ion interactions of
copper sulfate in aqueous solutions and sodium chloride media 136
2.2.6 Assessment of crystals single faces growth kinetics 138
2.2.7 Crystal faces indexation 138
3 RESULTS AND DISCUSSION 139
3.1 Solubilities of copper sulfate in aqueous solutions and in 2.4 wt % sodium chloride
media. 139
3.2 Crystallization and dissolution temperatures of the CuSO4 + H2O and CuSO4 +
NaCl + H2O systems at different cooling rates. 144
3.3 On-line Visualization and Particle size analysis of copper sulfate crystals at
different cooling rates. 146
3.4 Solid-state characterization 150
3.5 Copper sulfate pentahydrate crystals faces indexation 151
3.6 Mean Growth rates and growth rates mechanism of the (1-10) and (1-1-1) faces of
copper sulfate pentahydrate crystals as a function of the growth environment 152
4. CONCLUSIONS 161
5. REFERENCES 163
CHAPTER VII 168
GENERAL CONCLUSIONS AND RECOMMENDATIONS 168
1. GENERAL CONCLUSIONS FOR THIS STUDY 168
2. RECOMMENDATIONS FOR FUTURE WORK 173
APPENDICES SECTION 175
Abstract 175
1. Sequence of images of copper sulfate pentahydrate crystals growing in H2O and 2.4 wt
% NaCl media at different supersaturations. 176
2. Fits of the Power law, B&S and BCF growth models for both the (1-10) and (1-1-1)
faces for copper sulfate pentahydrate grown in H2O and NaCl media. 178
3. Summary of the different works presented at the national and international
conferences
180
4. Published works from the present doctoral thesis 189
xii
LIST OF TABLES
CHAPTER II
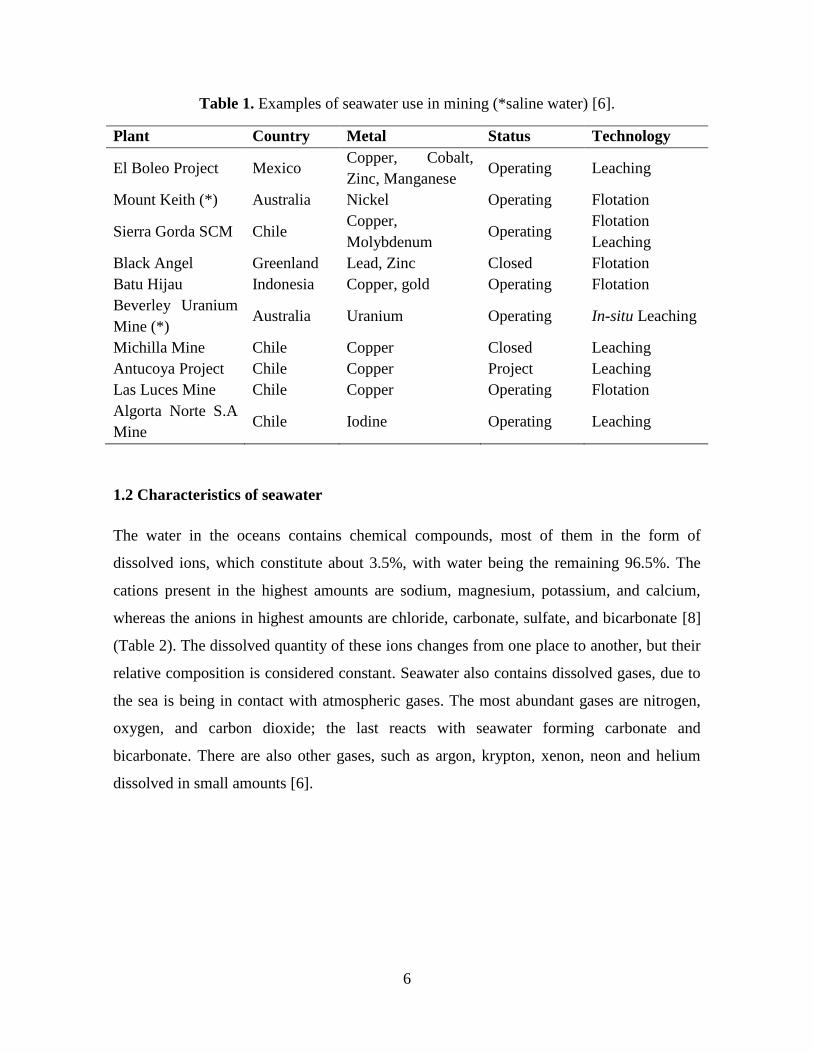
Table 1. Examples of seawater use in mining [6]................................................................... 6
Table 2. Reference composition of seawater [8]. ................................................................... 7
Table 3. Mining operations that use seawater in Chile [9]. .................................................... 8
CHAPTER III
Table 1. Individual ions in seawater from Bahia San Jorge, Chile (mg·L−1
) [4]. ................ 51
Table 2. Solubility (wCuSO4), density (ρ), and viscosity (η) for saturated solutions of
copper sulfate in seawater at various acid concentrations and temperatures. ...................... 54
Table 3. Parameters values for density, viscosity and solubility for saturated copper sulfate
in acidic seawater system. .................................................................................................... 56
Table 4. Parameter values for density and solubility for saturated copper sulfate in acidic
seawater system. ................................................................................................................... 61
CHAPTER IV
Table 1. Chemical composition of synthetic seawater obtained from the literature [15]. .... 70
Table 2. Synthetic seawater densities (g/cm3) at different temperatures. ............................. 71
Table 3. Solubilities for saturated solutions of copper sulfate in acidic seawater from 293.15
to 318.15 K at different acid concentrations obtained in a previous work [12]. .................. 76
Table 4. Solubilities and densities for saturated solutions of copper sulfate in acidic
seawater at 323.15 and 333.15 K at different acid concentrations obtained in the present
work. ..................................................................................................................................... 77
Table 5. Experimental and calculated water activities (aw) at different molalities of CuSO4
in seawater and at five different temperatures. ..................................................................... 82
Table 6. Pitzer parameters of copper sulfate in seawater within the temperature range of
293.15 to 323.15 K. .............................................................................................................. 84
Table 7. Solubility products and activity coefficient values at different temperatures and
copper sulfate concentrations. .............................................................................................. 85
Table 8. 𝐴∅ values for copper sulfate in seawater media at different temperatures. ............ 86
Table 9. Parameter values of the Born-type empirical equation. ......................................... 86
Table 10. Optimum values of 𝑤 and 𝑌 for the CuSO4–H2SO4–seawater system at the six
different temperatures. .......................................................................................................... 90
Table 11. Compositions of the input and output currents at 298.15 and 323.15 K. ............. 92
CHAPTER V
Table 1. Parameters for Equation (22) [20]. ....................................................................... 106
xiii
Table 2. Pitzer binary parameters (𝛽𝑀𝑋(0)
, 𝛽𝑀𝑋(1)
, 𝛽𝑀𝑋(2)
, and 𝐶𝑀𝑋(𝜙)
) for CuSO4 and CuCl2 at
298.15 K. ............................................................................................................................ 107
Table 3. Pitzer binary parameters (𝛽𝑀𝑋(0)
, 𝛽𝑀𝑋(1)
, 𝛽𝑀𝑋(2)
, and 𝐶𝑀𝑋(𝜙)
) for Na2SO4, NaCl, NaHSO4,
HSO4-, HCl, and H2SO4 at six different temperatures. ....................................................... 108
Table 4. 𝜃𝑖𝑗 parameter values used in the present work. .................................................... 109
Table 5. Calculated 𝜓𝑖𝑗𝑘 values using the temperature dependence model from Christov
and Moller. ......................................................................................................................... 111
Table 6. Experimental water activities (aw) at different molalities of CuSO4 and
temperatures........................................................................................................................ 112
Table 7. Pitzer parameters within the temperature range of 293.15 to 323.15 K for CuSO4,
and from 293.15 to 333.15 K for CuCl2, and Cu(HSO4)2. ................................................. 116
Table 8. Values of activity coefficients, water activities, and solubility products at different
copper sulfate concentrations and temperatures. ................................................................ 119
CHAPTER VI
Table 1. Binary Pitzer parameters for copper sulfate solutions in H2O and NaCl media. . 137
Table 2. Experimental solubility and density data of copper sulfate in sodium chloride
media at different temperatures. ......................................................................................... 140
Table 3. Crystallization and dissolution temperatures of the CuSO4 + H2O and CuSO4 +
NaCl + H2O systems at different cooling rates. ................................................................. 144
Table 4. Percentage copper sulfate crystals in three different size ranges at different cooling
rates. .................................................................................................................................... 149
Table 5. Chemical Analysis of CuSO4·5H2O crystals obtained at 1°C/min in NaCl media.
............................................................................................................................................ 151
Table 6. Experimental mean growth rates of (1-10) and (1-1-1) faces of copper sulfate
pentahydrate crystals growing from H2O and 2.4 wt % NaCl media. ................................ 154
Table 7. Crystal growth kinetics parameters obtained from the best fit of the models given
by the Equations (6) and (8) to the experimental 𝐺𝜎 data. ................................................. 158
APPENDICES
Table 4. Crystal growth kinetics parameters obtained from the fit of the Power Law, B&S
and BCF models to the experimental 𝐺𝜎 data. ................................................................... 179
xiv
LIST OF FIGURES
CHAPTER II
Figure 1. Percentage of seawater use of each operation [9]. .................................................. 9
Figure 2. Scheme of the copper sulfate pentahydrate crystallization process. ..................... 16
Figure 3. Industrial copper sulfate pentahydrate crystallization process [33]. .................... 18
Figure 4. Copper sulfate pentahydrate dissolution and re-crystallization processes [33]. ... 19
CHAPTER III
Figure 1. Solubility for the saturated solutions (CuSO4 + acid seawater): ■, 293.15; ♦,
298.15 K; ▲, 308.15 K; ●, 318.15 K; ─, correlations with Eq. (1). .................................... 57
Figure 2. Density for the saturated solutions (CuSO4 + acid seawater): ■, 293.15 K; ♦,
298.15 K; ▲, 308.15 K; ●, 318.15 K; ─, correlations with Eq. (2). .................................... 58
Figure 3. Viscosity for the saturated solutions (CuSO4 + acid seawater): ■, 293.15 K; ♦,
298.15 K; ▲, 308.15 K; ●, 318.15 K; ─, correlations with Eq. (3). .................................... 59
Figure 4. Density for the saturated solutions (CuSO4 + acid seawater): ■, 293.15 K; ♦,
298.15 K; ▲, 308.15 K; ●, 318.15 K; ─, correlations with Eq. (4). .................................... 62
Figure 5. Solubility for the saturated solutions (CuSO4 + acid seawater): ■, 293.15; ♦,
298.15 K; ▲, 308.15 K; ●, 318.15 K; ─, correlations with Eq. (5). .................................... 62
Figure 6. Solubility for the saturated solutions (CuSO4 + acid seawater): ■, 293.15; ♦,
298.15 K; ▲, 308.15 K; ●, 318.15 K. Black lines show freshwater data at different
temperatures from the work of Milligan and Moyer [5]. ..................................................... 63
CHAPTER IV
Figure 1. Solubility of saturated solutions of CuSO4–H2SO4–seawater. ■ = 293.15 K; ♦ =
298.15 K; ▲ = 308.15 K; ● = 318.15 K; × = 323.15 K; * = 333.15 K; Solid line: correlated
data; Dashed line: data predicted by the methodology proposed in this work. .................... 78
Figure 2. XRD patterns of copper sulfate samples obtained at three different temperatures:
a) 293.15 K, b) 308.15 K, and c) 323.15 K. Black and red lines correspond to the standard
patterns and samples, respectively. ...................................................................................... 80
Figure 3. Thermal decomposition curve of copper sulfate pentahydrate crystals obtained
from a CuSO4–H2SO4–seawater solution at 308.15 K. ........................................................ 81
Figure 4. Comparison between the experimental and literature data of water activities of
CuSO4 in seawater and freshwater at 298.15 and 323.15 K: ● and ♦ correspond to the water
activities at 323.15 and 298.15 K, respectively; Solid line: CuSO4–freshwater [10, 11];
Dashed line: CuSO4–seawater [present work]...................................................................... 83
Figure 5. Predicted amounts of copper sulfate pentahydrate precipitated versus sulfuric acid
weight percent at two different temperatures. ♦ and × correspond to the predicted data at
298.15 and 323.15 K, respectively. ...................................................................................... 88
xv
Figure 6. Solubility diagram of CuSO4–H2SO4–seawater system at 298.15 K (♦) and 323.15
K (×). .................................................................................................................................... 91
Figure 7. Process flow sheet of the copper sulfate crystallization process using sulfuric acid.
.............................................................................................................................................. 92
Figure 8. Amount of CuSO4·5H2O precipitated versus sulfuric acid weight percent. Solid
and dashed lines represent the analytical method while the symbols ♦ and × represent the
graph method at 298.15 and 323.15 K, respectively. ........................................................... 93
CHAPTER V
Figure 1. Comparison between the experimental and literature data of the water activities of
CuSO4 in H2O at 298.15 and 323.15 K. ●, CuSO4 - H2O at 323.15 K [this work]; ▲,
CuSO4 - H2O at 298.15 K [this work]; , CuSO4 - H2O at 323.15 K [26]; ---, CuSO4 - H2O
at 298.15 K [19]. ................................................................................................................. 113
Figure 2. a) CuSO4, b) CuCl2, and c) Cu(HSO4)2 activity coefficients at different salt
concentrations: ■, 293.15 K; ♦, 298.15 K; ▲, 308.15 K; ●, 318.15 K; ×, 323.15 K; ,
333.15 K; ---, predicted data; , values from Christov [13] at 298.15 K. .......................... 117
Figure 3. Solubility of saturated solutions of CuSO4 - H2SO4 – seawater system. ■, 293.15
K; ♦, 298.15 K; ▲, 308.15 K; ●, 318.15 K; ×, 323.15 K; *, 333.15 K; − correlated data; ---,
correlated data using predicted Pitzer parameters for CuSO4 at 333.15 K......................... 121
CHAPTER VI
Figure1. Habit of CuSO4·5H2O crystal [6]. ........................................................................ 129
Figure 2. Experimental set up for crystal growth rates measurements. (a) Olympus BX51
optical DIC microscope integrated with QImaging/QICAM camera. (b) Picture of the
crystal growth cell. ............................................................................................................. 135
Figure 3. Example of measurement from the centre of the copper sulfate crystal to the
faces. The distances are obtained by drawing a perpendicular line to each face from the
centre of the crystal using QCapture Pro software. ............................................................ 136
Figure 4. Activity coefficients of CuSO4 in H2O solutions at different salt concentrations:
■, 293.15 K; ▲, 303.15 K; ●, 313.15 K; ×, 323.15 K; , 333.15 K. ................................ 141
Figure 5. Activity coefficients of CuSO4 in 2.4 wt % NaCl solutions at different salt
concentrations: ■, 293.15 K; ▲, 303.15 K; ●, 313.15 K; ×, 323.15 K; , 333.15 K. ...... 141
Figure 6. Activity coefficients comparison between CuSO4 solutions in (■) H2O and (♦) 2.4
wt % NaCl as a function of the concentration at five different temperatures (293.15, 303.15,
313.15, 323.15, and 333.15 K). .......................................................................................... 143
Figure 7. Plot of the crystallization (-) and dissolution (---) temperatures for 29.52 wt %
CuSO4 solutions in different media: (●) H2O and (■) 2.4 wt % NaCl, as a function of
solution cooling rate. .......................................................................................................... 145
xvi
Figure 8. Sequence of pictures of copper sulfate crystals in H2O at different cooling rates.
............................................................................................................................................ 147
Figure 9. Sequence of pictures of copper sulfate crystals in 2.4 wt % NaCl media at
different cooling rates. ........................................................................................................ 148
Figure 10. a) TGA and b) DSC curves for copper sulfate pentahydrate crystals obtained at
1°C/min in H2O and NaCl media. ...................................................................................... 150
Figure 11. a) Prediction of the BFDH morphology of copper sulfate pentahydrate crystals
using the Miller indices in the obtained unique solutions and comparison with the crystal
micrograph obtained experimentally. b) and c) Enlarged pictures of copper sulfate
pentahydrate crystals obtained in aqueous solutions and sodium chloride media,
respectively, from Avantium Crystalline® system. ............................................................ 152
Figure 12. Series of optical micrographs of copper sulfate crystals grown in: a) H2O at σ =
0.682 and σ = 0.787, and b) 2.4 wt % NaCl at σ = 0.348 and σ = 0.458 at the 0.5 ml scale
size showing the growth of the crystals and their morphology as a function of media,
elapsed time, and supersaturation. Black line in the picture represents the scale bar of 100
µm. ...................................................................................................................................... 153
Figure 13. Copper sulfate crystals growing from H2O media. For each set of four plots, a)
𝐺𝜎 experimental data fitted to the Power law and BCF models; b) trend of the total
resistance to mass transfer as a function of ∆𝐶 using the parameters obtained from the data
fitting to these models. The dotted red line shows the trend of the ratio of the resistance to
mass transfer in the bulk to the total mass transfer resistance. Left (♦) refers to the (1-10)
and right (■) to the (1-1-1) faces respectively. ................................................................... 155
Figure 14. Copper sulfate crystals growing from 2.4 wt % NaCl media. For each set of four
plots, a) 𝐺𝜎 experimental data fitted to the BCF model; b) trend of the total resistance to
mass transfer as a function of ∆𝐶 using the parameters obtained from the data fitting to
these models. The dotted red line shows the trend of the ratio of the resistance to mass
transfer in the bulk to the total mass transfer resistance. Left (♦) refers to the (1-10) and
right (■) to the (1-1-1) faces, respectively. ......................................................................... 156
Figure 15. Sodium chloride effect in the a) (1-10) and b) (1-1-1) crystal faces of copper
sulfate pentahydrate. Extrapolated data are given by the black and dotted lines representing
the best fit of the data through the Power law and BCF models, respectively. .................. 160
APPENDICES
Figure 1. Series of optical micrographs of copper sulfate crystals grown in H2O in the
supersaturation range from σ = 0.682 to σ = 0.787 at the 0.5 ml scale size showing the
growth of the crystals and their morphology as a function of elapsed time and
supersaturation. Black line in the picture represents the scale bar of 100 µm. .................. 176
Figure 2. Series of optical micrographs of copper sulfate crystals grown in NaCl media in
the supersaturation range from σ = 0.348 to σ = 0.458 at the 0.5 ml scale size showing the
xvii
growth of the crystals and their morphology as a function of elapsed time and
supersaturation. Black line in the picture represents the scale bar of 100 µm. .................. 177
Figure 3. 𝐺𝜎 experimental data of copper sulfate pentahydrate grown in a) H2O and b)
NaCl media fitted to the Power law, B&S and BCF models. Left (♦) refers to the (1-10) and
right (■) to the (1-1-1) faces respectively. .......................................................................... 178
xviii
LIST OF SYMBOLS
𝐴∅ Debye-Hückel term
𝑏 Constant used in the Pitzer model
𝐴, 𝐵, 𝐶, and 𝐷 Fitting parameters for density, viscosity and solubility
𝑎, 𝑏, 𝑎𝑛𝑑 𝑐 Unit cell parameters
𝑎𝑤 Water activities
𝑎, 𝑏, 𝑐 and 𝑑 Parameter values of the Born-type empirical equation
𝐴1 Growth parameter in B&S model
𝐴2 Growth parameter in the BCF model
𝑏 Constant of the Pitzer model
𝐶∅ Solute-specific interaction parameter of the Pitzer model
𝑏 Dimensionless thermodynamic parameter
𝐶𝑒 Equilibrium concentration (𝑚−3)
∆𝐶 Driving force
𝑒 Electron charge (1.6022∙10-19
)
E𝜃𝑀𝑋 and E𝜃′𝑀𝑋
Higher-order electrostatic terms
𝑓𝛾, 𝐵𝛾, 𝐶𝛾 Ion-interaction parameters of the Pitzer model
𝐹1, 𝐹2, 𝐹3 and 𝐹4 Input and output currents in the crystallizer
𝐺 Single face growth rate (𝑚 · 𝑠−1)
𝐺𝑒𝑥 𝑅𝑇⁄ Excess free energy
𝐼 Ionic strength
𝑘 Boltzmann constant (1.38066∙10-23
),
𝐾𝑠𝑝 Solubility product
xix
𝑘𝐺 Growth rate constant (m(1
𝑚)𝑠−1)
𝑘𝑀𝑇 Mass transfer coefficient (𝑚 · 𝑠−1)
1
𝐾𝑀𝑇𝑂𝑇 Trend of the total resistance to transfer of growth units
𝑚 Molality
𝑚0 Molality in the initial saturated solution
𝑁0 Avogadro number (6.022045∙1023
)
𝑛𝑤 Number of kilograms of solvent
𝑅 Gas constant (8.314 J·mol-1
·K-1
).
𝑟 Growth exponent
𝑇 Solution temperature (𝐾)
𝑇𝑐𝑟𝑦𝑠𝑡 Crystallization temperature (𝐾)
𝑇𝑑𝑖𝑠𝑠 Equilibrium dissolution temperature (𝐾)
𝑢 Standard uncertainties
𝑣 Stoichiometric coefficient
𝑤 Mass fraction
𝑋 Precipitated amount (in mol/Kg)
X Mass percentage of H2SO4 in solution
𝑌 Yield
Y Mass percentage of CuSO4·5H2O in saturated solution
𝑌0 Mass percentage of CuSO4·5H2O in saturated solution with no acid content
𝑧 Charge of ion
xx
Greek Letters
𝛼1 , 𝛼2 Constants used in the Pitzer model
𝛽(0), 𝛽(1), 𝛽(2) Solute-specific interaction parameters of the Pitzer model
𝛼, 𝛽, and 𝛾 Unit cell parameters
Ɛ Dielectric constant of seawater
𝜀0 Vacuum permittivity (C2·J
-1·m
-1)
𝜀𝑟 Relative permittivity of the solution
𝛾± Mean activity coefficient of ions in the solution
𝜌 Density in g·cm-3
𝜂 Viscosity in mPa·s
𝜓𝑖𝑗𝑘 Ion-mixing interaction parameters
𝜇𝑖𝑗𝑘 Third virial coefficients
𝜙 Osmotic coefficient
𝜆𝑖𝑗 , 𝛷𝑖𝑗 Second virial coefficients
𝜃𝑀𝑋 Single parameter for each pair of cations or anions
𝜎 Relative supersaturation
𝜎𝑐𝑟𝑖𝑡 Critical relative supersaturation
Subscripts
𝑖, 𝑗, and 𝑘 Solute species
𝐵 Binary system
𝑇 Ternary system
𝑒𝑥𝑝 Experimental value
xxi
𝑐𝑎𝑙𝑐 Calculated value
𝑀, 𝑐 and 𝑐’ Cations
𝑋, 𝑎 and 𝑎’ Anions
𝑤 Water
LIST OF ABBREVIATIONS
AAD Average absolute deviation
BCF Burton-Cabrera-Frank model
BFDH Bravais-Friedel-Donnay-Harker model
B&S Birth and Spread model
Cif Crystallographic information file
𝑀𝑆𝑍𝑊 Metastable zone width
𝑀𝑊 Molecular weight
𝑁𝑅𝑇𝐿 Non-Random Two-Liquid model
𝑃𝐿𝑆 Pregnant Leach Solution
RIG Rough Interface Growth model
𝑆𝑋 Solvent extraction process
𝑆𝐷 Standard deviation
1
CHAPTER I
GENERALITIES
1. INTRODUCTION
Freshwater is a unique and scarce natural resource, essential for life and productive
activities, and therefore directly related to economic growth. Besides the limited
availability of freshwater in the world, there is an unequal distribution of this resource in
the different continents, creating zones of abundance and scarcity. An example of the latter
is the north of Chile, which is one of the driest areas on the planet, with scarce superficial
water resources and where there is an increasing demand for water by the different
production activities as well as for human consumption [1].
The most important economic activity in Chile is mining, which is concentrated in the arid
northern part of the country; therefore, the mining sector requires the identification of
alternative sources of water; it has been found that seawater can substitute for the limited
freshwater resources in the region [2].
Copper sulfate pentahydrate is the most common commercial product of copper, and is
produced industrially in the form of blue triclinic crystals [3]. The usual method to obtain
these crystals from the solution is through the addition of sulfuric acid, which generates a
supersaturated aqueous solution of the salt [4]. This compound has an extensive range of
agricultural, environmental, industrial, and hydrometallurgical uses.
In Chile, some mining companies crystallize this salt in hydrometallurgical processes using
freshwater, where copper is obtained from ores containing oxidized copper minerals [5].
Nevertheless, in order to minimize the use of freshwater in the crystallization process, the
effect of seawater on crystallization and on the thermodynamic behavior of copper sulfate
pentahydrate needs to be evaluated. The determination and interpretation of the
thermodynamic data related to the interactions of CuSO4 is necessary for a better
understanding of the seawater effect in the industrial production of copper sulfate
pentahydrate. Additionally, the information obtained in this work will be useful in the
2
design of processes to produce copper sulfate pentahydrate crystals using seawater by
means of the addition of sulfuric acid.
2. PROBLEMATIC, HYPOTHESES, AND OBJECTIVES
2.1 Problematic
For mining, which is one of the most important productive activities in Chile, the
availability and adequate management of water is key to its sustainability. As is known, the
national mining activity is developed under particular conditions; most of the deposits are
located in the north of the country, an area that faces a limited availability of freshwater
resources, so that water has become a critical, strategic and high-cost input. Therefore, this
situation of limited availability of the resource, which also presents an increasing demand
that competes with other sectors of the economy, has motivated the mining sector to
continue increasing efficiency levels, using technological solutions.
An alternative is the use of seawater, which is increasingly being used by the mining
industry, giving satisfactory results in several mining processes.
Some small and medium mining companies, to give an added value to the raw materials
that they exploit, obtain copper sulfate pentahydrate crystals (CuSO4·5H2O). However, one
of the problems presented in these crystallization plants is the cooling recrystallization
process required, since the crystals obtained after the addition of sulfuric acid in the
crystallization process are ‘snow’-like, and not of a suitable size, so it is necessary to
dissolve these crystals in water and recrystallize, obtaining crystals of a size and purity
suitable for commercialization; however, this process involves high energy and water
consumption.
In addition, there is information in the literature regarding the effect of sodium chloride on
the crystallization process, where it has been determined that Na+ and Cl
- ions (the principal
ions present in seawater), when present in a medium of crystallization, can cause changes in
the structure, size and growth rate of some crystals. Accordingly, in the present work, the
3
effect of seawater on the thermodynamic behaviour and crystallization of CuSO4·5H2O
needs to be assessed to analyze the feasibility of the use of seawater in this
hydrometallurgical process.
2.2 Hypotheses
Hypothesis 1:
There are differences in the solubilities, and physical properties such as density, viscosity,
and water activities, between the CuSO4-H2SO4-seawater and the CuSO4-H2SO4-H2O
systems, which are attributed to the presence of salts in the seawater.
Hypothesis 2:
The ion interaction model of Pitzer can be successfully applied to mining processes using
seawater, where it can be used to determine the solubilities of complex systems, such as
CuSO4-H2SO4-seawater, at different temperatures.
Hypothesis 3:
If copper sulfate pentahydrate is crystallized in saline solutions, the growth kinetics of the
crystals can be affected, where an increase in the growth rates can lead to obtaining larger
crystals than those obtained in freshwater.
4
2.3 Objectives
2.3.1 General objective
To study the effect of seawater on the thermodynamic behaviour and crystallization of
copper sulfate pentahydrate in order to analyze the feasibility of the use of seawater in this
hydrometallurgical process.
2.3.2 Specific objectives
- To study the effect of the seawater on the solid–liquid equilibrium and physical
properties (density, viscosity, and water activities) of acid solutions of copper
sulfate from 293.15 to 333.15 K. Correlate the obtained results using empirical
equations.
- To represent the solid–liquid equilibrium of a copper sulfate-sulfuric acid-seawater
system using the Pitzer model and a Born-type equation for modeling the effects of
copper sulfate and sulfuric acid, respectively, considering the seawater as a solvent.
- To estimate the amounts of copper sulfate precipitated, and the optimum yield, as a
function of the sulfuric acid concentration.
- To perform a thermodynamic study of the Cu-Na-H-SO4-Cl-HSO4-H2O system
using the Pitzer ion-interaction model in the temperature range of 293.15 to 333.15
K.
- To study the effect of sodium chloride (2.4 wt % NaCl) on the crystal shape, particle
size, composition, and growth kinetics of copper sulfate pentahydrate crystals.
5
CHAPTER II
STATE OF THE ART
1. THE USE OF SEAWATER IN MINING
1.1 Introduction
The largest resource of water in the planet is the water of the oceans, which represent 97%
of available water. The other 3% includes: the 2% of water available in polar ice caps and
glaciers and therefore difficult to use as a water resource; and traditional freshwater
resources (groundwater, lakes, wetlands, rivers, among others) representing 1% of the total
water of the planet [6]. The overexploitation of these traditional resources in arid and semi-
arid areas, such as northern Chile, southern Peru, and some regions of Africa, Asia, and
Australia, has created a situation of scarcity of the resource, which forces a search for new
water sources and for improvements in the efficiency of their use.
The use of seawater in mining has been addressed in numerous studies and publications [7].
There are several examples of its successful application in the processing of copper, zinc,
uranium and iodine minerals, as shown in Table 1, where of mineral concentration
technologies such as flotation and leaching are included [8].
6
Table 1. Examples of seawater use in mining (*saline water) [6].
Plant Country Metal Status Technology
El Boleo Project Mexico Copper, Cobalt,
Zinc, Manganese Operating Leaching
Mount Keith (*) Australia Nickel Operating Flotation
Sierra Gorda SCM Chile Copper,
Molybdenum Operating
Flotation
Leaching
Black Angel Greenland Lead, Zinc Closed Flotation
Batu Hijau Indonesia Copper, gold Operating Flotation
Beverley Uranium
Mine (*) Australia Uranium Operating In-situ Leaching
Michilla Mine Chile Copper Closed Leaching
Antucoya Project Chile Copper Project Leaching
Las Luces Mine Chile Copper Operating Flotation
Algorta Norte S.A
Mine Chile Iodine Operating Leaching
1.2 Characteristics of seawater
The water in the oceans contains chemical compounds, most of them in the form of
dissolved ions, which constitute about 3.5%, with water being the remaining 96.5%. The
cations present in the highest amounts are sodium, magnesium, potassium, and calcium,
whereas the anions in highest amounts are chloride, carbonate, sulfate, and bicarbonate [8]
(Table 2). The dissolved quantity of these ions changes from one place to another, but their
relative composition is considered constant. Seawater also contains dissolved gases, due to
the sea is being in contact with atmospheric gases. The most abundant gases are nitrogen,
oxygen, and carbon dioxide; the last reacts with seawater forming carbonate and
bicarbonate. There are also other gases, such as argon, krypton, xenon, neon and helium
dissolved in small amounts [6].
7
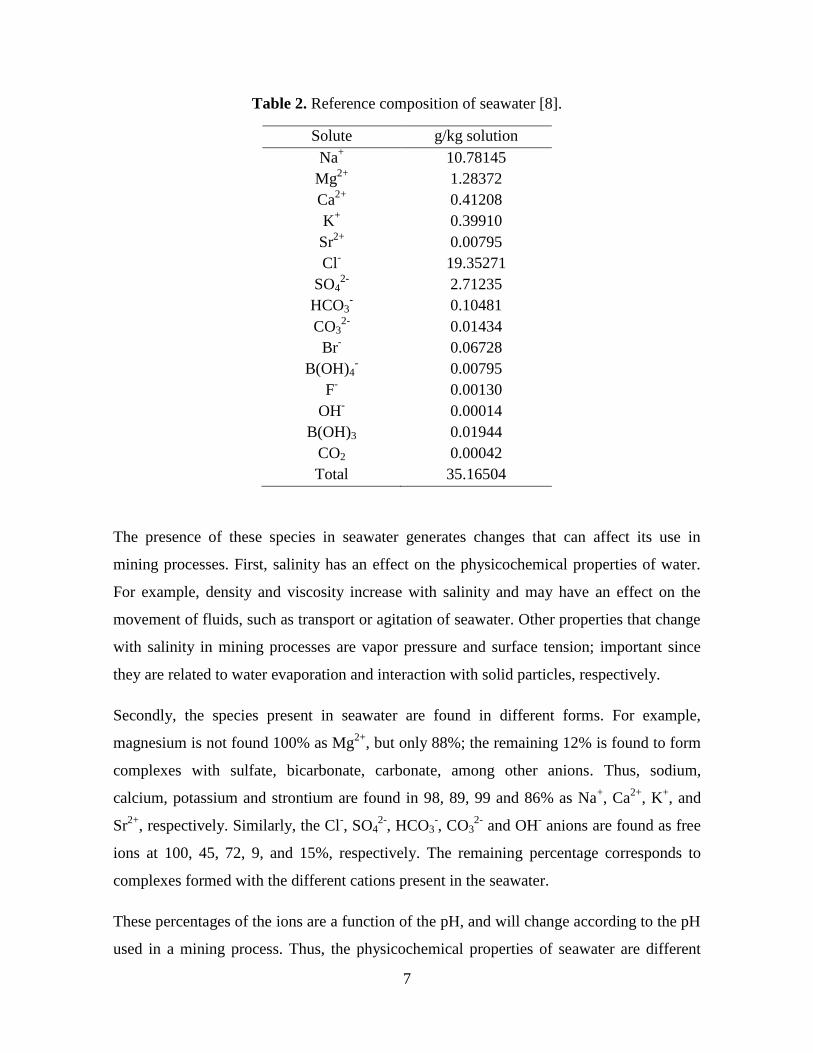
Table 2. Reference composition of seawater [8].
Solute g/kg solution
Na+ 10.78145
Mg2+
1.28372
Ca2+
0.41208
K+ 0.39910
Sr2+
0.00795
Cl- 19.35271
SO42-
2.71235
HCO3- 0.10481
CO32-
0.01434
Br- 0.06728
B(OH)4- 0.00795
F- 0.00130
OH- 0.00014
B(OH)3 0.01944
CO2 0.00042
Total 35.16504
The presence of these species in seawater generates changes that can affect its use in
mining processes. First, salinity has an effect on the physicochemical properties of water.
For example, density and viscosity increase with salinity and may have an effect on the
movement of fluids, such as transport or agitation of seawater. Other properties that change
with salinity in mining processes are vapor pressure and surface tension; important since
they are related to water evaporation and interaction with solid particles, respectively.
Secondly, the species present in seawater are found in different forms. For example,
magnesium is not found 100% as Mg2+
, but only 88%; the remaining 12% is found to form
complexes with sulfate, bicarbonate, carbonate, among other anions. Thus, sodium,
calcium, potassium and strontium are found in 98, 89, 99 and 86% as Na+, Ca
2+, K
+, and
Sr2+
, respectively. Similarly, the Cl-, SO4
2-, HCO3
-, CO3
2- and OH
- anions are found as free
ions at 100, 45, 72, 9, and 15%, respectively. The remaining percentage corresponds to
complexes formed with the different cations present in the seawater.
These percentages of the ions are a function of the pH, and will change according to the pH
used in a mining process. Thus, the physicochemical properties of seawater are different
8
from those of water normally used in mining processes, and these differences can have
positive and negative effects on mineral processing and extraction.
1.3 Consumption of seawater in Chile
This section reviews the consumption of seawater based on studies performed by Cochilco
[9], which concentrate on the copper industry. The total consumption of water in 2015 was
55.8 m3/s; the region of Antofagasta was the one with the highest consumption at national
level, with 51%. The mining companies make efforts to recycle as much water as possible,
and 73% of the water used in the process is made up of recirculated water.
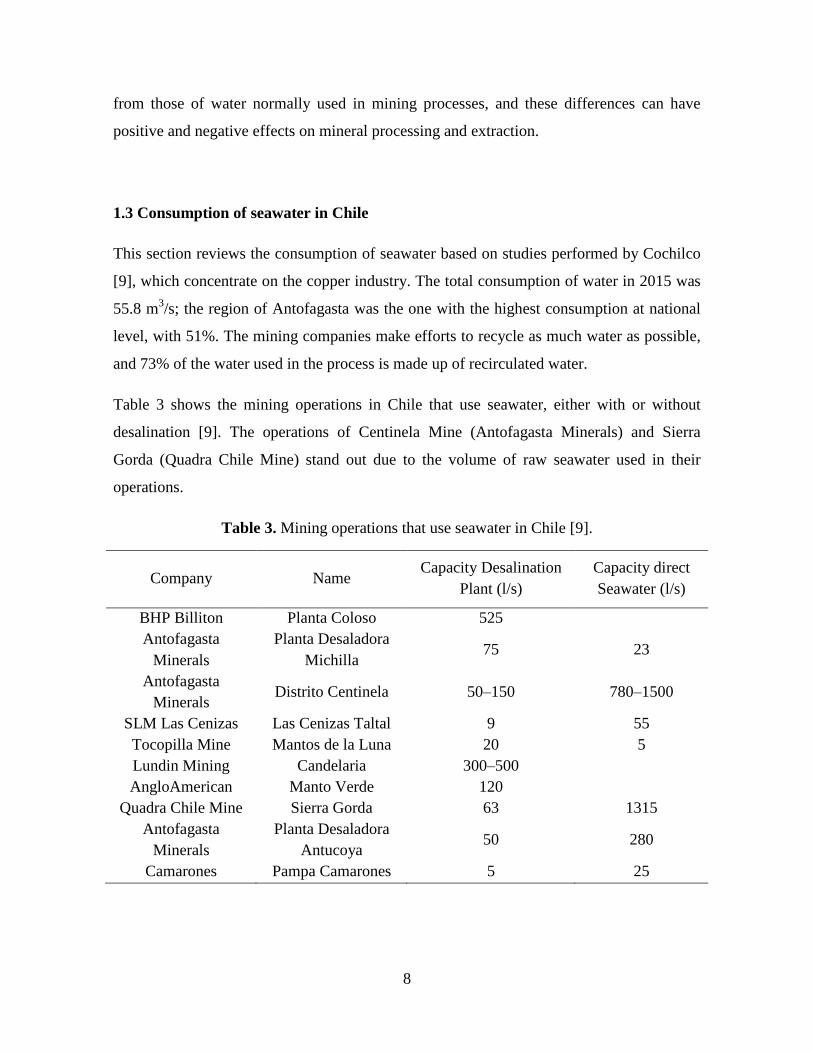
Table 3 shows the mining operations in Chile that use seawater, either with or without
desalination [9]. The operations of Centinela Mine (Antofagasta Minerals) and Sierra
Gorda (Quadra Chile Mine) stand out due to the volume of raw seawater used in their
operations.
Table 3. Mining operations that use seawater in Chile [9].
Company Name Capacity Desalination
Plant (l/s)
Capacity direct
Seawater (l/s)
BHP Billiton Planta Coloso 525
Antofagasta
Minerals
Planta Desaladora
Michilla 75 23
Antofagasta
Minerals Distrito Centinela 50–150 780–1500
SLM Las Cenizas Las Cenizas Taltal 9 55
Tocopilla Mine Mantos de la Luna 20 5
Lundin Mining Candelaria 300–500
AngloAmerican Manto Verde 120
Quadra Chile Mine Sierra Gorda 63 1315
Antofagasta
Minerals
Planta Desaladora
Antucoya 50 280
Camarones Pampa Camarones 5 25
9
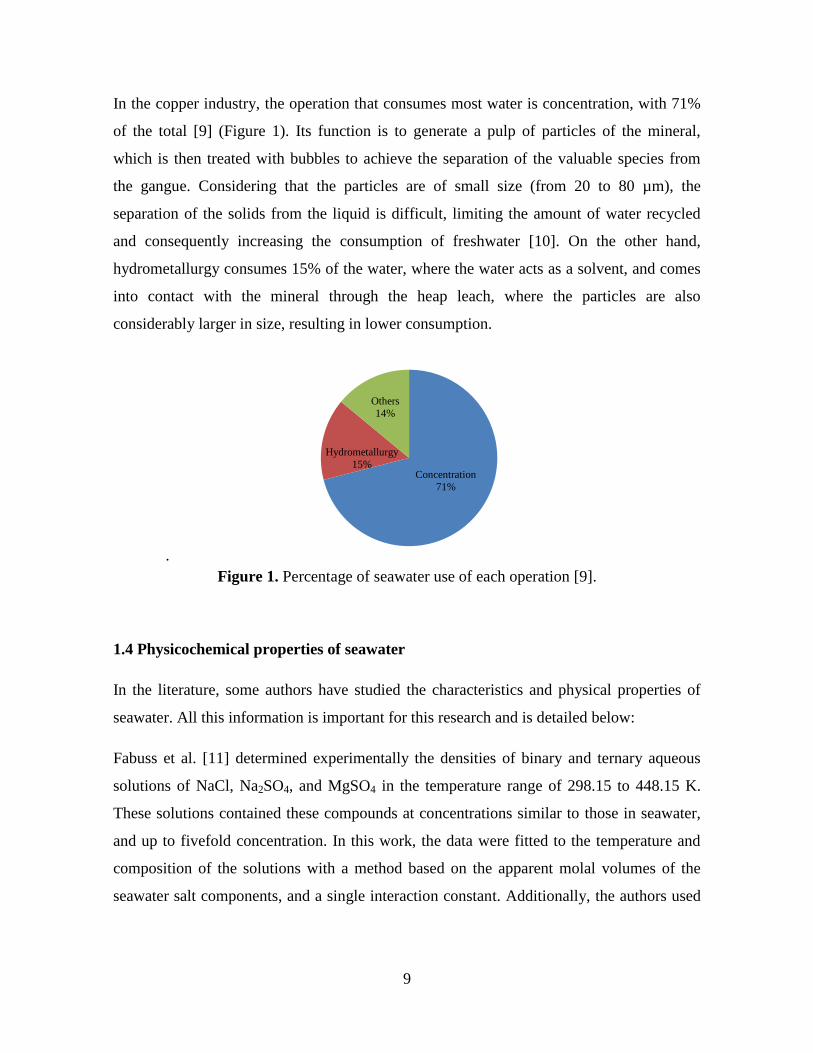
In the copper industry, the operation that consumes most water is concentration, with 71%
of the total [9] (Figure 1). Its function is to generate a pulp of particles of the mineral,
which is then treated with bubbles to achieve the separation of the valuable species from
the gangue. Considering that the particles are of small size (from 20 to 80 µm), the
separation of the solids from the liquid is difficult, limiting the amount of water recycled
and consequently increasing the consumption of freshwater [10]. On the other hand,
hydrometallurgy consumes 15% of the water, where the water acts as a solvent, and comes
into contact with the mineral through the heap leach, where the particles are also
considerably larger in size, resulting in lower consumption.
.
Figure 1. Percentage of seawater use of each operation [9].
1.4 Physicochemical properties of seawater
In the literature, some authors have studied the characteristics and physical properties of
seawater. All this information is important for this research and is detailed below:
Fabuss et al. [11] determined experimentally the densities of binary and ternary aqueous
solutions of NaCl, Na2SO4, and MgSO4 in the temperature range of 298.15 to 448.15 K.
These solutions contained these compounds at concentrations similar to those in seawater,
and up to fivefold concentration. In this work, the data were fitted to the temperature and
composition of the solutions with a method based on the apparent molal volumes of the
seawater salt components, and a single interaction constant. Additionally, the authors used
Concentration
71%
Hydrometallurgy
15%
Others
14%
10
this method to estimate densities of solutions at concentrations similar to seawater and of
the concentrated solutions.
Korosi and Fabuss [12] were interested in the seawater desalination process, so they
determined experimental viscosity and density values of binary salt solutions related to the
principal salts present in seawater: NaCl, KCl, Na2SO4, and MgSO4. In this work, the
solvent was pure water and the measurements were performed in the temperature range of
298.15 to 423.15 K, and at molality ranges of 0.1 to 3.5 mol/kg for chlorides, of 0.03 to
1.18 mol/kg for sodium sulfate, and of 0.025 to 0.885 mol/kg for magnesium sulfate; all
these concentrations are similar to those in seawater. These data were correlated using
Othmer’s rule, and the correlation was compared with literature data.
Fabuss et al. [13] measured experimental viscosity and density of ternary solutions of
several electrolytes present in the seawater, where NaCl is present in each one. These
systems were the following: NaCl-KCl-H2O, NaCl-Na2SO4-H2O and NaCl-MgSO4-H2O.
Here, the studied temperature and ionic strength ranges were from 298.15 to 423.15 K, and
from 0.7 to 3.5 mol/kg, respectively. The experimental viscosity values were correlated
using Othmer’s rule, obtaining a deviation of 0.2 to 0.3% between the experimental and
correlated data, which was considered acceptable.
Bromley et al. [14, 15] measured the heat capacities of solutions of natural seawater in a
salinity range of 1 to 12%, in a temperature range of 275.15 to 353.15 K, and at a pressure
of 1 atm. These data were correlated using the extended Debye-Hückel equation. Later,
Bromley [16] reported experimental measurements of the heats of dilution and
concentration of seawater at 298.15 K; these data were also correlated using the extended
Debye-Hückel equation. Also, values of the relative, apparent, and partial enthalpies of sea-
salt solutions were calculated. These values differed considerably from those for NaCl
solutions. Additionally, Bromley et al. [17] measured the heat capacities and enthalpies of
seawater in a temperature range of 353.15 to 473.15 K, with salinities up to 12%. These
experimental data were correlated using the extended Debye-Hückel model.
Gibbard and Scatchard [18] measured the vapor pressures of synthetic seawater solutions
(prepared in the laboratory) at ionic strengths of 1.0, 2.8, and 5.8 mol/kg, and in the
11
temperature range of 298.15 to 373.15 K. From this experimental information, the osmotic
coefficients were determined, which were fitted to the thermodynamic model of Scatchard,
showing a very good agreement over the whole temperature range, and up to ionic strengths
of 2.8 mol/kg.
Singh and Bromley [19] evaluated the relative enthalpy of seawater, the apparent enthalpy
of sea salts, and the relative partial enthalpies of sea salts and water in the temperature
range of 273.15 to 348.15 K and in the salinity range of 0 to 12%. These data were
evaluated from accurate calorimetric measurements of the heats of mixing of sea-salt
solutions. Additionally, these data were correlated using the extended Debye-Hückel
equation, where the results were consistent with those reported in the literature regarding
heat capacity and the heat of mixing. These data are useful for calculating the change of
free energy of seawater with temperature, the temperature variation of activity and osmotic
coefficients, and the variation of the boiling point with temperature.
Millero [20] performed a detailed review of the physics and chemistry of seawater,
addressing such issues as water structure, ion-water interactions, seawater composition, ion
speciation, and the effects of temperature and pressure.
Feistel [21] determined the specific Gibbs energy of seawater using experimental data of
heat capacities, freezing points, vapor pressures and heats of mixing at atmospheric
pressure in the temperature range of 267.15 to 353.15 K, and in the absolute salinity range
of 0 to 120 g/kg .
Sun et al. [22] established a set of fitted polynomial equations for calculating the physical
variables such as density, entropy, heat capacity, and potential temperature of a thermal
saline fluid. These authors used previously reported experimental information, and the
equations were valid in the temperature range of 273.15 to 647.15 K, a pressure range of
0.1 to 100 MPa, and an absolute salinity range of 0 to 40 g/kg.
Philippe et al. [23] discussed the effects of the use of desalinated seawater compared to raw
seawater in mining projects, and included the economic aspects of both alternatives. In this
work it was shown that the desalination process removes over 99.4% of the dissolved salts
contained in the seawater. As seawater contains only 3.5% of dissolved salts, in desalinated
12
seawater this amount is negligible; this difference in the water quality may have significant
effects on the overall process. Some of the parameters that are directly influenced are:
specific gravity, viscosity, chemical buffering effects, product and by-product
contamination, corrosion, scaling, evaporation, and capillary forces. Additionally, in this
work it was shown that there are differences in the viscosity and density properties between
seawater and desalinated seawater, which have a direct consequence on the operational
costs of pumping. Accordingly, it was concluded that the investment costs associated with a
desalination plant for the supply of seawater to mining projects are generally lower than the
investment associated with the conveyance system, especially under corrosive conditions.
Moreno et al. [24] have given a brief introduction of the unit operations employed in the
‘Las Luces’ beneficiation plant. Even more important, the flow rates and chemical analyses
of the water samples collected from main unit operations at the plant were presented, and
the variations in the chemistry of the recycled seawater as a result of grinding and flotation
were discussed. In this work, the operational measurements showed that metallurgic results
were not affected by the salinity of the seawater. Analytical data showed that the dissolved
salt content of the process increased 0.7 g/L/year, which is essentially due to solar
evaporation. The authors suggested that there is most likely a limit of total dissolved salts
above which flotation operations would not be viable. Based on this finding Las Cenizas is
now investigating options to minimize the loss of water to evaporation.
Torres et al. [2] studied the use of seawater to recover potassium and nitrate from the waste
tails of mining operations. In this study, the performance of four leaching agents was
evaluated for recovering potassium and nitrate from discarded salts: 1) freshwater; 2)
seawater; 3) seawater saturated with chloride ions; and 4) seawater saturated with chloride,
sulfate and magnesium ions. These tests showed that leaching with seawater provides
nearly the same potassium and nitrate leaching efficiency as when freshwater is used.
However, leaching with seawater saturated with chloride, sulfate and magnesium ions
yielded approximately 10% lower potassium and nitrate recoveries compared to the tests
where seawater was used alone. In contrast, the use of saturated seawater is expected to
yield a geomechanically more stable heap because most of the chloride-, sulfate- and
magnesium-containing salts will remain unleached. The main conclusion of this work is
13
that it is possible to leach certain types of salts with seawater, obtaining recovery rates of
nitrates and potassium above 80%, which is attractive from an economic point of view.
With a view to industrial applications, Taboada et al. [25] determined the solubilities and
physical properties (densities, viscosities, refractive indices, and ionic conductivities) of
saturated solutions of sodium nitrate in seawater, caliche mineral in freshwater and caliche
mineral in seawater (3.5% salinity), in the temperature range of 298.15 to 323.15 K.
Additionally, the physical properties of sodium nitrate in seawater were measured for
unsaturated solutions in the concentration range of 1 to 11 mol/kg and at different
temperatures (from 298.15 to 323.15 K). These properties were compared to the sodium
nitrate-freshwater system obtained experimentally in this work; however the solubility was
compared to data from the literature [26]. Results showed that the solubility, density,
refraction index and ionic conductivity of saturated solutions of sodium nitrates in seawater
and in freshwater increased as temperature increased. On the other hand, viscosity showed
an inverse behavior. The solubility and density values of the sodium nitrate-freshwater
system were higher than those of the sodium nitrate-seawater system due to the higher
nitrate concentration in freshwater. The solubility of sodium nitrate in the freshwater
system was higher than that in the seawater system; consequently, leaching with seawater
dissolves less nitrate. The values of refractive index, ionic conductivity and viscosity of
saturated solutions of sodium nitrate in seawater were higher than those obtained in
freshwater. This increase in the viscosity implies a higher cost of pumping the solution;
however, viscosity values for both systems decrease with increasing temperature.
Additionally, the measured properties of caliche in the seawater system were greater than
those of the freshwater system, with the viscosity values showing the most significant
differences. Consequently, using seawater in nitrate treatment systems of mining operations
is a technically viable alternative that does not present major differences with using
freshwater. Its economic viability should be studied case-by-case, considering the costs of
pumping seawater and the cost of accessing freshwater.
In the book of Cisternas and Moreno [7] ‘El Agua de Mar en la Mineria: Fundamentos y
Aplicaciones’ (‘Seawater in Mining: Fundamentals and Applications’) it is stated that due
to the scarce availability of freshwater in the northern regions of Chile, and the constant
14
increase in the required water flow due to the growing and sustained interest in the
development of more new projects, the mining industry has been betting on innovative
solutions, among which is the use of raw or desalinated seawater in production processes.
In addition, it is explained that the sustainable development of mining lies in the search for
new water resources; up to now the main initiative that has been considered to address the
lack of water resources in the activity has been the use of seawater, which appears to be an
attractive alternative supply. The chapters of the book include the following: 1)
Management of water resources in mining; 2) Unprocessed seawater as process water; 3)
Physicochemical properties of seawater for industrial processes; 4) Flotation with seawater;
5) The use of seawater in the leaching of copper; 6) The nitrate industry and water
resources; 7) Measurement and prevention of corrosion; and 8) Thermodynamics of
leaching of copper with seawater.
In the book by Cisternas et al. [6] ‘Agua de Mar Atacama: Oportunidades y Avances para
el uso sostenible de agua de mar en mineria’ (‘Atacama Seawater: Opportunities and
advances for the sustainable use of seawater in mining’), it is discussed that the scarcity of
water sources in northern Chile has generated concern in the mining industry, which
requires large volumes of water for its production processes. Due to this, desalinated
seawater has taken on enough importance to meet this need; however, its use faces different
problems, such as high energy costs, organic and inorganic particles that cause obstructions
in the systems, as well as the accumulation of brines from the treated seawater which
generate ecological problems. The use of raw seawater also faces other challenges, such as
the suitability of the production processes to the characteristics of seawater. Accordingly,
the chapters of the book include the following: 1) Use of seawater in mining; 2) Use of
reverse osmosis brines for the processing of non-metallic minerals; 3) Design of
desalination plants and water distribution networks: A holistic look; 4) Partial removal of
calcium and magnesium from seawater by the addition of carbon dioxide and alkaline
compounds; 5) Application of bio-mineralization processes to the pre-treatment of seawater
for the selective removal of calcium and magnesium ions; 6) Removal of impurities using
flotation for the pre-treatment of seawater and mining effluents; 7) Marine bacteria and
their importance as controllers in the formation of biofouling in water treatment systems; 8)
15
Physicochemical, thermodynamic and transport properties of saline solutions for process
design; 9) Technological evaluation: Support for decision-making in the use of seawater.
2. COPPER SULFATE PENTAHYDRATE
2.1 Characteristics and properties
Copper sulfate pentahydrate (CuSO4·5H2O), also called bluestone, or blue vitriol, is found
in nature as the mineral chalcanthite [4]. It belongs to the triclinic system (sp.gr. P1), and its
unit-cell parameters are: a = 6.1224 (4) Å; b = 10.7223 (4) Å; c = 5.9681 Å; α = 82.35 (2)°;
β = 107.33 (2)°; γ = 102.60 (4)°; V = 364.02 (3) Å3; Z = 2; D = 2.278 g/cm
3 [27].
Copper sulfate pentahydrate is an important industrial compound of copper due to the wide
range of commercial uses and applications:
According to Richardson [4], among the major uses of copper sulfate pentahydrate are the
following: in agriculture it is used to produce active foliar fungicides such as Bordeaux
mixture, tribasic copper(II) sulfate, or copper(II) hydroxide; it is also used in combination
with sodium dichromate and arsenic acid for the preservation of wood; it is an effective and
economical algicide for lakes and ponds; in mining it is used as a flotation activator for
lead, zinc, and cobalt ores. Moreover, this compound is also used as a mordant in textile
dyeing, in the preparation of azo and formazan dyes, as a pigment in paints and varnishes,
for preserving hides and tanning leather, in pyrotechnic compositions, and in synthetic fire
logs.
It is also used in copper electrolysis, the control of fungal diseases, and in the correction of
copper deficiency in soils and in animals [29, 30]. On the other hand, there are some
chemical tests that use copper sulfate; for example, in Fehling's and Benedict's solutions to
test for reducing sugars, which reduce the soluble blue copper(II) sulfate to insoluble red
copper(I) oxide. Moreover, copper sulfate is used in the Biuret reagent to test for proteins
and in the blood test for anemia [31, 32].
16
2.2 Industrial process of copper sulfate pentahydrate crystallization
Direct hydrometallurgical extraction is used to obtain copper from ores containing oxidized
copper minerals such as carbonates, hydroxysilicates, sulfates, and hydroxychlorides [5].
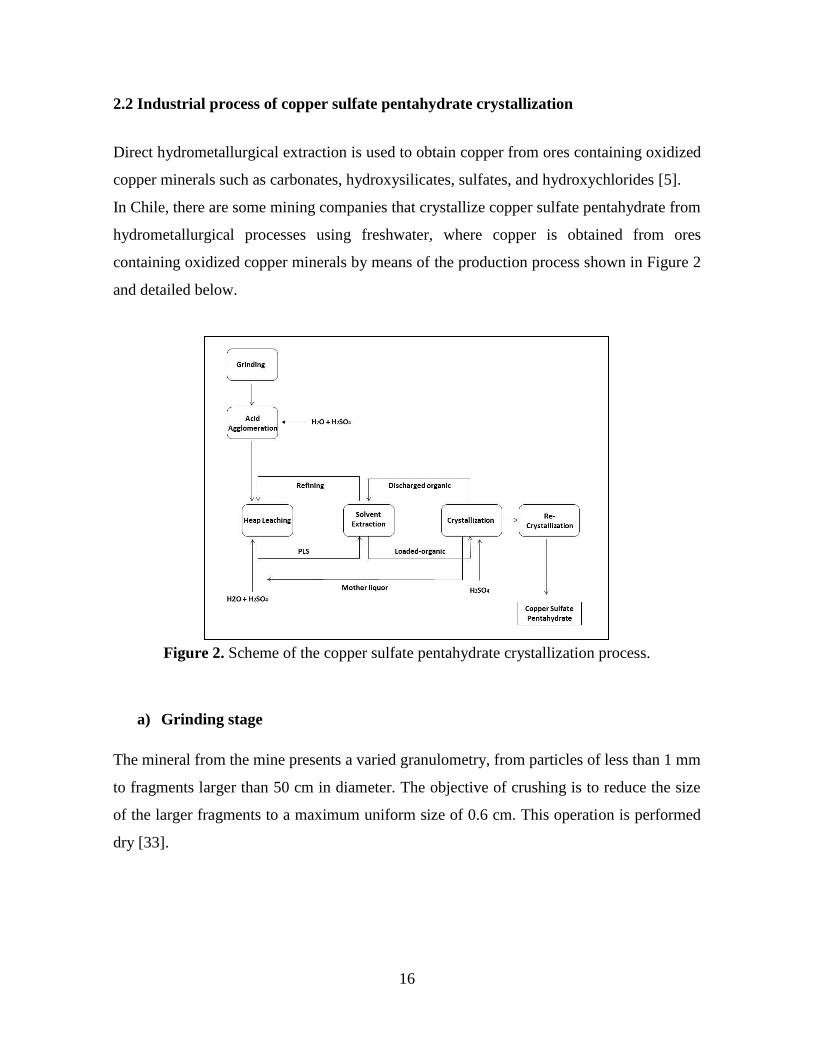
In Chile, there are some mining companies that crystallize copper sulfate pentahydrate from
hydrometallurgical processes using freshwater, where copper is obtained from ores
containing oxidized copper minerals by means of the production process shown in Figure 2
and detailed below.
Figure 2. Scheme of the copper sulfate pentahydrate crystallization process.
a) Grinding stage
The mineral from the mine presents a varied granulometry, from particles of less than 1 mm
to fragments larger than 50 cm in diameter. The objective of crushing is to reduce the size
of the larger fragments to a maximum uniform size of 0.6 cm. This operation is performed
dry [33].
17
b) Acid agglomeration and ‘curing’
In order for the process to proceed, the bed of particles that will make up the leach heap
needs to be permeable to ensure good percolation and dispersion of the leach solution
without preferential runoff. This is achieved by subjecting the material to a moisture
agglomeration process, consisting of moistening the crushed mineral with liquid to a water
content that gives sufficient surface tension; by colliding the particles together, the fines
adhere to the coarse sizes. Then, curing consists of spraying the previously crushed mineral
with the solvent (sulfuric acid), followed by a period of ‘cure’ or rest [33].
c) Copper leaching process
The leaching is mostly performed by dripping dilute sulfuric acid onto of heaps of broken
or crushed ore and allowing the acid to trickle through to collection ponds. In this stage, a
solution called PLS (pregnant leach solution) is obtained, which has a concentration of
copper in the range of 5–7 g/L and 6–15 g/L of sulfuric acid. This rich solution is generally
impure, and has to be purified and concentrated before the metal recovery. In the copper
hydrometallurgy this is realized by the ‘solvent extraction process’ [33].
d) Solvent extraction process (SX)
The solvent extraction (SX) plant, receives the rich solution generated in the heap leaching
process (the PLS). This solution is characterized by its low dissolved copper concentration,
along with impurities such as iron, chloride, aluminum, manganese, magnesium, sodium,
among others. The main objective of the solvent extraction process is to extract selectively
the copper contained in the impure rich solution by an ionic exchange in the aqueous phase
(rich solution) and the organic reagent. This reagent is able to discharge the copper in a
later process step into a high purity solution, forming an electrolyte suitable for the
crystallization [33].
18
e) Copper sulfate pentahydrate crystallization
According to Tabilo [33], in this stage the organic extractant loaded with copper in the
solvent extraction stage is discharged to obtain the crystals of copper sulfate pentahydrate
present in this solution, it is possible by adding concentrated acidic solutions that allow the
organic to release the copper to the solution, obtaining copper sulfate crystals. The loaded
organic is mixed with saturated electrolyte in a ratio of 2:1 and sulfuric acid, in order to
increase the acidity and to increase the efficiency of the system for discharging the loaded
organic. The saturated electrolyte (S-E) is composed of Cu (53–58 g/L) and H+ (200–205
g/L).
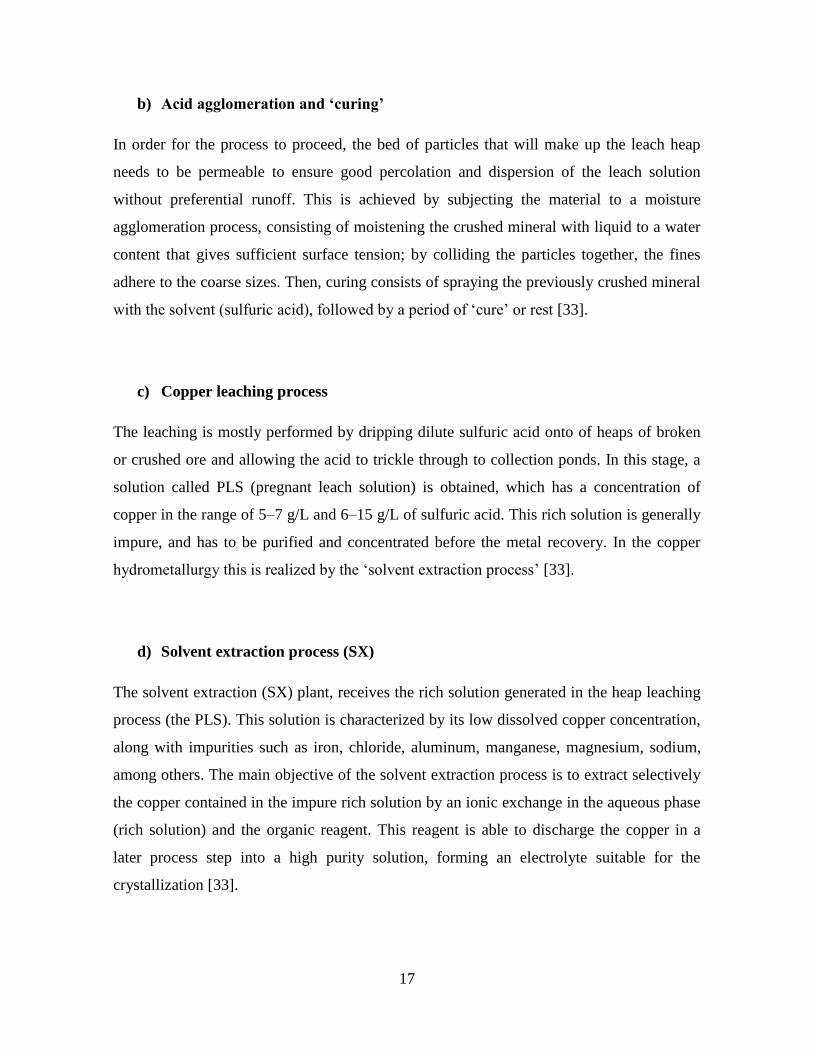
This mixture continues its course through the phase separators and decanters, hereinafter
termed ‘crystallizers’, where the extraction of sulfate is performed by saturation of the
solution, where the organic is discharged, releasing the excess of copper as solid crystals.
These solids called ‘sulfate of mining degree’ are separated from the solution by
decantation, and by means of pumps are brought to ponds called ‘crystal scrubbers’ (Figure
3). In the crystallizers occurs the separation of the discharged organic, which is returned to
the solvent extraction stage, and the saturated electrolyte is recirculated in this
crystallization stage.
Figure 3. Industrial copper sulfate pentahydrate crystallization process [33].
19
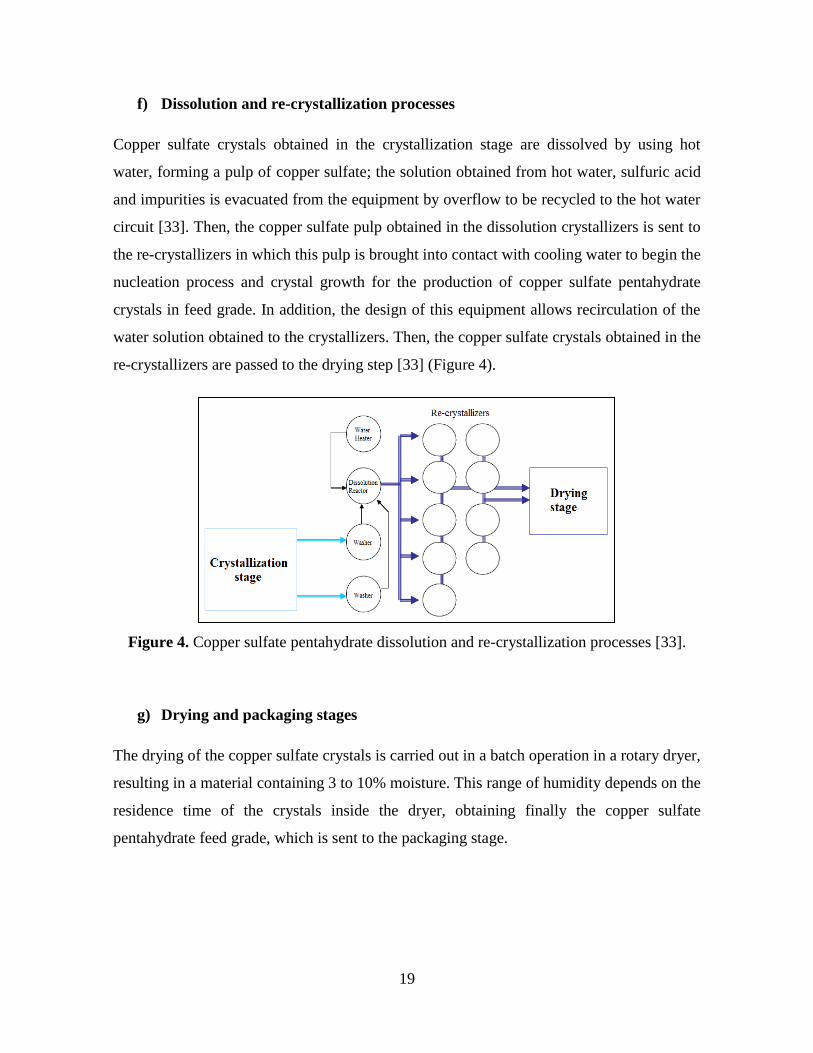
f) Dissolution and re-crystallization processes
Copper sulfate crystals obtained in the crystallization stage are dissolved by using hot
water, forming a pulp of copper sulfate; the solution obtained from hot water, sulfuric acid
and impurities is evacuated from the equipment by overflow to be recycled to the hot water
circuit [33]. Then, the copper sulfate pulp obtained in the dissolution crystallizers is sent to
the re-crystallizers in which this pulp is brought into contact with cooling water to begin the
nucleation process and crystal growth for the production of copper sulfate pentahydrate
crystals in feed grade. In addition, the design of this equipment allows recirculation of the
water solution obtained to the crystallizers. Then, the copper sulfate crystals obtained in the
re-crystallizers are passed to the drying step [33] (Figure 4).
Figure 4. Copper sulfate pentahydrate dissolution and re-crystallization processes [33].
g) Drying and packaging stages
The drying of the copper sulfate crystals is carried out in a batch operation in a rotary dryer,
resulting in a material containing 3 to 10% moisture. This range of humidity depends on the
residence time of the crystals inside the dryer, obtaining finally the copper sulfate
pentahydrate feed grade, which is sent to the packaging stage.
20
2.3 Solubilities and physical properties of the copper sulfate-sulfuric acid-water
system.
One of the first studies carried out into the CuSO4-H2SO4-H2O system was performed by
Holler and Peffer [34] who proposed an empirical model for the determination of density of
this system. Additionally, these authors proposed that density is a function of the
concentration summation (CuSO4·5H2O-H2SO4) rather than of the concentrations of the
individual components. Milligan and Moyer [35], presented two empirical models to
estimate the density and solubility of the CuSO4-H2SO4-H2O system at different
temperatures. In the work of Price and Davenport [36], the densities, electrical
conductivities, and viscosities of CuSO4-H2SO4 solutions in the electrorefining and
electrowinning ranges of composition and temperature were measured. These properties
were studied because density, electrical conductivity, and viscosity all have considerable
economic importance; in the case of conductivity because of its impact on electrical energy
consumption, and density and viscosity because of their influences on mass and heat
transfer. Additionally, density and viscosity also influence the carryover of impure
particulates into the final copper cathode product. In this work empirical and semi empirical
equations describing the measured properties were also presented, where density and
conductivity results showed a good agreement with previously measured values. However,
the viscosity results agreed with previous work at 25 °C, but tended to be somewhat higher
at 50 °C. Hotlos and Jaskula [37] determined densities and kinematic viscosities for the
ternary system CuSO4-H2SO4-H2O in the temperature range of 25 to 60 °C, and over a wide
range of concentrations: for CuSO4 from 0.2 to 1.15 M, and for H2SO4 from 0.25 to 2.5 M.
These results were described using empirical equations, where the results obtained showed
that the density depends on CuSO4 concentration much more than on H2SO4 concentration;
additionally, the temperature dependence is relatively small. On the other hand, the
influence of the concentrations of components on the viscosity is analogous to that on the
density, where an increase in the CuSO4 concentration causes a 3–4 times larger change
than a corresponding increase in the H2SO4 concentration, however, in this case the
influence of temperature is considerable. In the work of De Juan et al. [38] the
crystallization conditions of copper sulfate solutions were determined as a function of the
temperature and sulfuric acid concentration. In this work, an empirical model was proposed
21
to represent the solubility of copper sulfate as a function of the temperature and sulfuric
acid concentration, where it was demonstrated that Cu2+
concentration in the solution is
mainly a direct function of the logarithm of temperature and sulfuric acid concentration. In
addition, in this work the effect of Zn2+
on the copper sulfate solubility was also studied,
where the results obtained led to a multiple linear regression between Cu2+
concentration in
the solution and sulfuric acid and Zn2+
concentrations in the medium. Hernández et al. [39]
studied the effects of seawater on the solid–liquid equilibrium of copper sulfate in acid
solutions in the temperature range of 298.15 to 323.15 K, for possible industrial
applications. In this work, experimental data of solubilities and physical properties such as
density, refractive index, ionic conductivity, and viscosity were provided for CuSO4 in
seawater at pH 2. This pH was used because it is similar to those in copper mining
operations. Moreover, physical properties (density, refractive index, ionic conductivity and
viscosity) were measured for unsaturated solutions of CuSO4 in an acidic seawater system.
These experimental data were fitted using Othmer’s rule, and the Casteel–Amis equation
was used for conductivity. Results showed that the solubility of CuSO4 in an acidic
seawater system is similar to that of CuSO4 in a freshwater system, but the differences
increase at higher temperatures. The physical property values for the saturated system of
copper sulfate in seawater are greater than those of the saturated system of copper sulfate in
freshwater, and both systems (seawater and freshwater) maintain the same trend for the
measured physical property values as a function of temperature. In addition, using
Othmer’s rule, the experimental values for the physical properties in the unsaturated
concentrations of CuSO4 in seawater correlated satisfactorily.
2.4 Copper sulfate pentahydrate crystallization.
Copper sulfate pentahydrate crystallization studies using freshwater have been carried out
by several authors:
Ishii and Fujita [40] measured the crystallization rate of copper sulfate solutions at the first
supersaturation concentration. Here, the stability of aqueous copper sulfate solutions at the
first supersaturation concentration was examined, in a batch-wise stirred reactor, using
22
different temperatures and stirring rates. It was concluded that below the impeller Reynolds
number of 4233 such a solution would be reasonably metastable if the liquid surface were
not cooled. Above the impeller Reynolds number of 4520 such a solution is metastable for
a short latent period only, then a shower of many fine crystals occurs suddenly and the
solute concentration decreases rapidly.
Zumstein and Rosseau [41] examined the formation of agglomerates during the continuous,
semi-batch and batch crystallization of copper sulfate pentahydrate. Additionally, the
feasibility of determining crystallization kinetics from an analysis of measured crystal size
distribution was evaluated. The results from this work showed that the agglomeration was
significant in copper sulfate pentahydrate MSMPR (mixed-suspension, mixed-product-
removal) crystallization, where the agglomeration was increased as supersaturation
increased, agitation decreased, and solids concentration increased. On the other hand,
greater agglomeration was observed among small crystals, and a reduced agglomeration
was observed, in batch crystallization. This is thought to be due to the much shorter periods
of exposure to high supersaturations in batch operations, even though the supersaturation at
nucleation is much higher than that of the MSMPR experiments. Finally, this work
concluded that simple models of the crystal size distribution are ineffective in predicting
the percentage agglomerates because of difficulties in separating anomalous crystal growth
– which may be caused by size dependency, growth rate dispersion, or reductions in active
growth area – from the phenomenon of agglomeration.
Macpherson et al. [42] have developed a novel technique employing the scanning
electrochemical microscope (SECM), in order to study the dissolution kinetics of copper
sulfate pentahydrate single crystals in aqueous sulfuric acid solutions over a wide
concentration range. Here, the general concept was to employ the ultramicroelectrode
(UME) probe of the SECM to induce and monitor the dissolution process of interest by
depleting the concentration of one (or more) of the solution components of a target crystal
surface via electrolysis. For this application, the dissolution reaction was induced and
monitored at a platinum UME through the reduction of Cu2+
ions to Cu. Copper sulfate was
selected as an appropriate material for study because single crystals of the pentahydrate,
exhibiting a variety of well-defined faces, can readily be grown from aqueous solutions.
23
Additionally, it is characterized by high solubility and rapid dissolution kinetics, making
rate measurements difficult when conventional approaches are used. Results have
demonstrated that SECM-induced dissolution is a powerful approach in the study of rapid
dissolution kinetics when one (or more) of the constituent components of the target material
can be detected amperometrically.
Giulietti et al. [43-45] have developed several studies regarding the crystallization of
copper sulfate pentahydrate, where interesting findings have been reported. First, Giulietti
et al. [43], studied the CuSO4·5H2O resulting from batch cooling experiments, in the
temperature range of 70 to 30 °C, where free sulfuric acid was added in some experiments.
In this work, the metastable zone width, nucleation and growth kinetic parameters, as well
as the system kinetic constant, were determined and compared with the data published in
the literature. Later, in the work of Giulietti et al. [44], the morphology of copper sulfate
pentahydrate crystals produced from batch cooling experiments in the temperature range of
70 to 30 °C was described and correlated with the process conditions. Results showed that
slow linear cooling rates (90 min) predominantly caused the appearance of well-formed
crystals. Exponential cooling (120 min) resulted in the additional formation of
agglomerates and twins. However, the presence of seeds in both cooling modes led to round
crystals, agglomerates and twins. A fast linear cooling (15 min) gave rise to a mixture of
the former types, where broken crystals and adhering fragments were often found. The
intense twinning observed in seeded experiments was possibly associated with stresses in
the seed particles, whereas twinning under exponential cooling was consistent with the
additional supersaturation required for twin formation. Growth zoning was pronounced in
seeded and linear cooling experiments. Fluid inclusions were always found and were more
pronounced for larger particles; however, their formation could be avoided to some extent
by choosing conditions that inhibited zoning. Additionally, Giulietti et al. [45], studied the
effects of several additives on copper sulfate pentahydrate crystallization. For this, different
batch cooling modes of copper sulfate aqueous solutions were studied (quick and slow
cooling with constant cooling rate, programmed cooling with nearly constant
supersaturation) in order to find the optimum conditions for the investigation of the effect
of additives on crystallization. Three types of additives (solvents, ionic substances and
surfactants) were used, and their effects on crystal size, habit and yield were studied.
24
Results from this work showed that crystals produced in the absence of additives were
predominantly flat with |1-10| and |110| faces dominant; sometimes |100| and |001|. Ethanol
slightly reduced the |1-10| face and the |100| face was slightly prolonged, but the shape
unchanged. Other solvents (such as n-butyl alcohol and acetone) as well as H+ and Zn
2+ did
not affect the crystal habit significantly. A small amount of Fe3+
induced the formation of
nearly prismatic crystals, where the growth rate of the |001| and |110| faces seemed to be
significantly reduced. Detergents changed significantly the crystal shape of copper sulfate,
resulting in thin plate-like crystals with strongly emphasized |1-10| face. Organic solvents
led to a moderate yield increase due to reduced solubility of copper sulfate in mixed
solvents. The overall growth rate of copper sulfate was significantly reduced by Fe3+
and
detergents; whereas the nucleation rate was increased by these additives.
Lyall et al. [46] applied in situ ultrasonic attenuation spectroscopy for monitoring the
nucleation and growth of copper sulfate pentahydrate crystallized from supersaturated
aqueous solutions. This technique was used because the copper sulfate system is not readily
amenable to analysis via optical methods due to the intense blue colour of the saturated
crystallizing solution. In this work, procedures were developed to retrieve the nucleation
parameters, metastable zone width and apparent order of nucleation, and subsequently the
crystallization parameters, overall mass and linear growth rates, from the dynamically
recorded attenuation spectra, concluding that growth of copper sulfate pentahydrate crystals
was successfully monitored throughout the process and characterized in terms of acoustic
attenuation spectra.
In the work of Aktas [47], the objective was to precipitate copper sulfate selectively, thus
allowing impurities to remain in the solution, and to purify this precipitated compound
thoroughly with repeated precipitations to yield an analytical-grade product. From this
work, it has been suggested that if a higher degree of supersaturation is desired, the copper
sulfate concentration should be near saturation. On the other hand, ethanol was
demonstrated to disrupt the ligand bonds of a metal sulfate in solution and thus promote
selective precipitation. The presence of ethanol lowers the thermodynamic water activity
and makes it less available as a ligand for Cu2+
and SO42−
, so with fewer water ligands,
these two ions can form direct bonds more easily. They consequently precipitate as copper
25
sulfate pentahydrate when a substantial amount of ethanol is added to the solution.
Additionally, in this work it was demonstrated that the copper sulfate precipitation becomes
weaker at lower pH values due to the gradual appearance of HSO4−, which interferes with
the formation of the Cu–SO4 bond, preventing the precipitation to a certain degree and
resulting in poorer efficiencies. Finally, the effect of acid type on copper sulfate
precipitation was investigated, where nitric acid, hydrochloric acid and hydrobromic acid
were employed and it was concluded that almost no precipitate was observed after these
acids were added to the copper sulfate solution along with a substantial amount of ethanol.
In the work of Singh et al. [48], batch cooling and antisolvent crystallization of copper
sulfate pentahydrate using surfactant additives was investigated in order to understand the
effect of various factors on the crystal morphology. It was found that non-ionic surfactants
have a marginal effect on this ionic compound, whereas ionic surfactants are able to modify
the morphology substantially. Additionally, this effect is also specific to the surfactant
used; for example, SDS (sodium dodecylsulfate) produces flake-like crystals, whereas AOT
(dioctyl sodium sulphosuccinate) produces prismatic crystals of different morphology, and
CTAB (cetyltrimethyl ammonium bromide) produces crystals of irregular shape.
Antisolvent crystallization using ethanol produces elongated crystals; moreover, it has been
shown that surfactants and antisolvents can achieve a combined effect. Also, in this work it
was determined that the effect of the surfactant was observed over a certain threshold
concentration.
Manomenova et al. [28] have developed a technique for growing large single CuSO4·5H2O
crystals to apply them as broadband UV optical filters. In this work, samples of crystals
were grown and their transmission spectra, associated impurities, thermal stability, and
crystal structure were investigated. The dehydration onset temperature was determined to
be 46 °С, and the effective distribution coefficients keff of individual impurities in crystal
were evaluated. It was shown that keff >1 for most metals, indicating that the solution must
be additionally purified. Additionally, the internal crystal homogeneity was estimated by X-
ray topography.
26
3. CRYSTALLIZATION PROCESS AND CRYSTALLIZATION KINETICS
Crystallization is a solubility-related process and it represents one of the basic processes in
the process engineering. That is, a solid crystal is formed when a solute exceeds its
solubility in the solution. The crystallization refers also to the separation of solid,
crystalline phases from melts or gases. Some thermal processes, which involve
crystallization, are separation of mixtures of substances, purification of materials, recovery
of solvents or concentration of solutions. The diversity of the crystallization processes is
due to the variety of material systems, operating conditions and product specifications, such
as crystal purity, crystal size distribution, and crystal shape [49].
This section is a brief overview of the crystallization process where topics such as sodium
chloride effect in the crystallization, growth kinetics of single crystals, and crystal growth
mechanisms have been addressed.
3.1 Sodium chloride effect in crystallization
There is limited information in the literature regarding to the effect of seawater in
crystallization processes; however, some authors have studied the effect of sodium chloride
(which is the main salt in seawater) in the crystallization of some salts as follows:
Brandse et al. [50] studied the growth kinetics of gypsum in supersaturated solutions both
in pure water and in the presence of NaCl using a seeded growth technique, where
radioactive tracer techniques were employed to follow the growth process. In this work, the
mean linear growth rate 𝐺 was plotted against the relative supersaturation σ, and the results
showed that for low values of σ, the relation between 𝐺 and σ is given by a linear law; for
higher σ values it was given by a parabolic law; and for the highest σ values it was given by
a growth order higher than two. From this research it was concluded that the addition of
sodium chloride increased the crystallization rate remarkably; that is to say, the higher the
NaCl concentration the higher the growth rate.
In the work of Sheikholeslami and Ong [51] the effect was examined of the salinity on the
kinetics and thermodynamics of precipitation of CaCO3 and CaSO4 when they exist in
27
isolation and together. Batch tests under isothermal conditions (30 °C) were carried out for
salinity values ranging between 0.5 and 1.5 M of NaCl, calcium sulfate in the range of 0.06
to 0.15 M, calcium carbonate in the range of 0.007 to 0.02 M; for the mixed calcium sulfate
carbonate system, the SO4/CO3 molar ratio was changed. In this work, the thermodynamic
solubility constants were determined using the Pitzer model for determination of the
activity coefficients of ionic species, where, as expected, the thermodynamic solubility
constants (Ksp) of the pure salts were not affected by different salinity levels; however, the
salinity level affected Ksp in mixed salt systems. Additionally, images of the pure and
mixed system were produced using scanning electron microscopy (SEM), demonstrating
that the co-precipitation in the mixed system changed the scale morphology of the crystals.
Also, it was shown that as the NaCl concentration was increased from 0.5 to 1.5 M, the size
of calcium sulfate and calcium carbonate crystals increased from approximately 300 to
1000 μm and 30 to 60 μm, respectively. Finally, results showed that the kinetics of pure
CaSO4 precipitation were found to be strongly affected by the level of salinity; however,
the salinity level had no significant effect on the kinetics of pure CaCO3 precipitation.
3.2 Growth kinetics of single crystals and Crystal growth mechanisms
In the book of Garside et al. [52] has been mentioned that the growth rate of each unique
crystal face is different depending on the growth environment such as supersaturation,
temperature, solvents, and impurities. It was pointed out that the most common methods for
the measurement of the growth rate of crystals are the measurement of the linear growth
rate on specific faces of a single crystal or by estimating an overall linear growth rate from
the mass deposition rates on the bulk mass of a large number of crystals.
In the literature, there are some studies regarding to the growth rates measurements of
single crystals that have been carried out in ionic compounds as follows:
In the work of Mullin and Amatavivadhana [53] were measured the growth rates of
ammonium and potassium dihydrogen phosphate crystal faces under controlled conditions
of temperature, supersaturation and solution velocity, and it was found that the growth rates
of the ammonium salt (ADP) were much higher than those of the potassium salt (KDP)
under equivalent conditions. It is suggested that this is due to the occurrence of hydrogen
28
bonding between ADP molecules, which give larger integrating units (thicker growth
layers) than occur with KDP.
Later, Davey and Mullin [54], reported that the (100) faces of ammonium dihydrogen
phosphate (ADP) crystals grow extremely slowly compared with the (101) faces, so it was
not possible to measure their growth rates by direct microscopic measurement by the flow
cell technique used for the (101) faces. However, distinct growth layers could be seen
moving across growing (100) faces so it was characterized the growth kinetics of these
faces by measuring the layer velocities under well-defined conditions of supersaturation
and temperature. According to this, the present work was concerned with the kinetics of
movement of growth layers on the (100) faces of ADP crystals, and was also investigated
the extent to which these impurities are incorporated into the crystal faces during growth.
In the work of Sweegers et al. [55] in-situ optical microscopy to measure the growth rates
of gibbsite single crystals growing from aqueous sodium aluminate solutions was used.
The growth rate was measured to the (001), (110), and (100) crystal faces as a function of
the driving force, and the results were fitted with growth rate equations for various growth
mechanisms.
Later, in the work of Suharso [56] was studied the growth rate mechanism of sodium borate
tetrahydrate (borax) single crystals along the (111) direction at various relative
supersaturations using in situ optical microscopy technique to elucidate the mechanism of
growth and the crystal growth rate equation. The results showed that the growth mechanism
of the (111) face of borax crystal at temperature of 20 °C was spiral growth mechanism
below the relative supersaturation of 0.49 and a Birth and spread mechanism above the
relative supersaturation of 0.49.
Additionally, some studies have been carried out to measure the growth rates of individual
faces in organic materials. Nguyen [57] reported the measurement of the solution
solubilities and crystal growth rates of single (RS)-Ibuprofen crystals as a function of
solvent and supersaturation, where the interfacial growth mechanisms within this range of
supersaturation were characterized. Then, Camacho et al. [58, 59], studied the crystal
29
morphology and the measurement of the growth rates of the individual faces of N-docosane
and methyl stearate crystals as a function of solution environment.
4. SOLID-LIQUID EQUILIBRIUM MODELING.
4.1 Models for electrolyte solutions
Electrolyte solutions are encountered in many natural and industrial processes. Phase
equilibrium calculations for solutions containing electrolytes are gaining increasing
importance and it is important to choose the most suitable thermodynamic model for such
systems [60]. In electrolyte solutions, the ions interact strongly with each other and with the
solvent through their electric charges, so deviations from ideality are important even at low
concentrations. Also, the ions are not volatile at atmospheric pressure and ambient
temperature, so a different approach is needed in order to formulate a limiting law for the
thermodynamic behavior of electrolyte solutions.
A number of activity coefficient models for electrolyte solutions have been developed for
calculating the thermodynamic properties of electrolyte solutions for engineering
applications. A brief description of these models is detailed below:
a) Debye-Hückel Model
Based on the assumption of each ion being surrounded by an ionic atmosphere consisting
of ions of the opposite charge, the Debye-Hückel limiting law for electrolyte solutions was
formulated by Peter Debye and Erich Hückel [61, 62]. The Debye-Hückel limiting law
describes the non-ideal behavior caused by electrostatic forces in extremely dilute
electrolyte solutions. The limiting law expressed for a salt with the stoichiometric
coefficients 𝑣𝑖 and the sum of stoichiometric coefficients 𝑣 is:
ln 𝛾± = −1
𝑣∑ 𝑣𝑖𝑧𝑖
2𝐴𝐼1
2⁄ + ln 𝑥𝑤𝑖 (1)
30
where 𝛾±is the mean molal activity coefficient of ions in the solution and 𝑧𝑖 is the charge of
ion 𝑖,
𝐴 =𝐹3
4𝜋𝑁0[
𝑑
2(𝜀0𝜀𝑟𝑅𝑇)3]1
2⁄
(2)
where 𝐹 corresponds to the Faraday constant (C·mol-1
), 𝑁0 to the Avogadro’s number
(6.022045∙1023
), 𝜀0 to the permittivity of vacuum (8.85418∙10-12
), R is the gas constant
(8.314 J·mol-1
·K-1
), T is the temperature (K), d is the density (kg/m3), 𝜀𝑟 is the relative
permittivity (dielectric constant, dimensionless) of the solution. 𝑑 and 𝜀𝑟 are both functions
of temperature,
𝐼 =1
2∑ 𝑚𝑖𝑧𝑖
2𝑖 (3)
where 𝐼 is the ionic strength and 𝑚𝑖 is the molality of ion 𝑖.
The Debye-Hückel limiting law provides an accurate representation of the limiting
behavior of the activity coefficients in dilute ionic solutions. It is however not valid at ionic
strengths higher than 0.01 mol/kg H2O.
The Debye-Hückel limiting law (Eq. (1)) is derived from the Debye-Hückel theory by
neglecting terms that play a role only at concentrations higher than 0.01 mol/kg H2O. An
extended form of the Debye-Hückel limiting law includes some of these terms. It can be
expressed as:
ln 𝛾± = −1
𝑣∑ 𝑣𝑖𝑧𝑖
2 𝐴𝐼1
2⁄
1+𝑏𝐼1
2⁄+ ln 𝑥𝑤𝑖 (4)
where b is dependent on the size of the ions involved, but is usually considered constant.
The extended Debye-Hückel law is applicable at ionic strengths up to 0.1 mol/kg H2O.
31
b) Guggenheim model
The Guggenheim model [63] makes a distinction between short-range and long-range
interactions to calculate the excess Gibbs energy. The expression of the excess Gibbs
energy becomes:
𝐺𝐸
𝑛𝑠𝑅𝑇= −
4
3𝐴𝛾𝐼
32⁄ 𝜏√𝐼 + 2 ∑ ∑ 𝜆𝑖𝑗𝑚𝑖𝑚𝑗𝑗𝑖 (5)
with
𝜏√𝐼 = (3
𝐼3 2⁄ ) [ln(1 + √𝐼) − √𝐼 +𝐼
2] (6)
where 𝜆𝑖𝑗 are constant parameters, analogous to the second virial coefficient, representing
the net effect of the various short-range interaction forces between cations and anions.
c) Pitzer model
Pitzer model [64] was based on the Guggenheim model to develop his ion interaction
equation for electrolytes. He extended the formulation of the Debye-Hückel equation to
make it consistent with the McMillan-Mayer approach [65] to the theory of osmotic virial
expansion. The excess Gibbs energy of solutions containing 𝑚𝑠 kg of solvent and 𝑚𝑖, 𝑚𝑗,
etc. moles of the solute species i, j, etc. is equal to:
𝐺𝐸
𝑅𝑇= −
1
3𝑛𝑠𝐴𝛾 [
𝐼1 2⁄
1+𝑏𝐼1 2⁄ ] +1
𝑛𝑠∑ ∑ 𝜆𝑖𝑗(𝐼)𝑚𝑖𝑚𝑗 +
1
𝑛𝑠2 ∑ ∑ ∑ 𝜇𝑖𝑗𝑘𝑚𝑖𝑚𝑗𝑚𝑘𝑘𝑗𝑖𝑗𝑖 (7)
Pitzer's model adds to the expression of excess Gibbs energy the second and third terms of
virial expansion. Specifically, the third parameter 𝜇𝑖𝑗𝑘 is constant and represents the net
effect of various short-range interaction forces between three species.
32
Also, Pitzer and Mayorga [66] obtained other relationships that differ from the first, the
dependence of the second virial coefficient (𝜆𝑖𝑗) with respect to ionic strength being the
most important. This is also evident in the tabulated values [66-71].
In 1980 Pitzer [72] published other extensions of the Debye-Hückel equation, using molar
fractions of the components and with differences in the expression of excess Gibbs energy
of long-range interactions:
𝐺𝐸,𝐼,𝑅
𝑅𝑇= −(∑ 𝑛𝑘) (
1000
𝑀𝑠)
1 2⁄
(4𝐴𝛾𝐼
𝑏𝑠) ln(1 + 𝑏𝑠𝐼1 2⁄ ) (8)
The summation of this equation includes all species, whether neutral or ionic. From this
extension new terms are added and with the second virial coefficient written in terms of
ionic strength, one has:
𝐺𝐸
𝑛𝑠𝑅𝑇=
−4𝐼
𝑏𝑠(
𝑀𝑠
1000) 𝐴𝛾 ln(1 + 𝑏𝑠𝐼1 2⁄ ) + (
𝑀𝑠
1000) (∑ ∑ 𝜆𝑖𝑗(𝐼)𝑚𝑖𝑚𝑗 + ∑ ∑ ∑ 𝜇𝑖𝑗𝑘𝑚𝑖𝑚𝑗𝑚𝑘𝑘𝑗𝑖𝑗𝑖 ) (9)
where 𝑏𝑠 is a constant depending on the solvent.
Although the method proposed by Pitzer to calculate the activity coefficient has been
applied successfully to the description of many solutions, other proposals can be found in
the literature, such as the model of Chen and Evans [73] that uses the NRTL (Non-Random
Two-Liquid) model of Renon and Prausnitz [74].
d) NRTL (Non-Random Two-Liquid) model
While the Pitzer model specifically considers the ion–ion interactions, Chen's model takes
into account interactions such as ion–molecule and molecule–molecule, which may
eventually be important. In 1979, Chen et al. [75] proposed an extension of the Pitzer
33
model that allows interactions between all kinds of solutes, ionic or molecular. These
interactions are reduced rapidly with increasing distance, unlike electrostatic interactions.
Therefore, long-range forces have a dominant effect in dilute solutions, but as the
concentration increases the importance of short-range forces increases. The authors used
the extension of the Debye-Hückel model proposed by Pitzer to represent the contribution
of long-range (ion–ion) interactions. The short-range interaction is calculated as a
symmetric model, based on the hypothetical reference state of pure solvent, and
homogeneously mixed with completely dissociated electrolytes. The model is normalized
by the activity coefficient at infinite dilution to obtain an asymmetrical model. The NRTL
model belongs to the group of so-called local-composition models.
Among all the previously detailed models, the present work has focused on the Pitzer ion-
interaction model, due to this model has been successfully used by different authors for the
prediction of solubilities in binary, ternary, and multicomponent systems over a wide range
of concentrations and temperatures [76].
Because of this, the following section outlines the work performed by several authors
related to this topic.
4.2 Pitzer model applied to the thermodynamics of natural waters and copper sulfate.
4.2.1 Thermodynamics of natural waters systems using the Pitzer model.
In the work of Harvie and Weare [76], the accuracy of the Pitzer equations was tested in the
modeling of the mineral solubilities for the Na-K-Mg-Ca-Cl-SO4-H2O system. It has been
developed for predicting mineral solubilities in brines from zero to high ionic strengths.
This model utilizes activity coefficient expressions developed by Pitzer and co-workers and
an algorithm for rapidly identifying the coexisting phases and their composition at
equilibrium. The activity coefficient expressions were parameterized using binary and
ternary system solubility and osmotic data. In this work, it was found that the third virial
coefficients are essential for predicting thermodynamic properties at high concentrations;
however, the addition of a fourth virial coefficient term is not necessary for accurate
34
solubility predictions. The authors also outlined an algorithmic procedure for rapidly
finding the equilibrium configuration of a system; this algorithm has been found to be quite
reliable and efficient.
Moller [77] described a chemical equilibrium model for the Na-Ca-Cl-SO4-H2O system in
the temperature range of 298.15 to 523.15 K and from zero to high concentrations (up to 18
m). The concentration and temperature dependence of the model was established by fitting
available activity, solubility, osmotic and electromotive force (emf) data, where a single ion
complex, CaSO4, which increases in strength with temperature, was included in the model.
The validation of model accuracy by comparison with laboratory and field solubility data
was included. In this work, phase diagrams constructed for the Na-Ca-Cl-SO4-H2O system,
and the predicted solubilities of anhydrite and hemihydrate in concentrated seawater at high
temperature showed very good agreement with the reported data. Calculations of the
temperature of gypsum-anhydrite coexistence as a function of water activity were
compared to reported values, and were used to estimate the composition-temperature
relation for the gypsum–anhydrite transition in natural brine evaporation. A preliminary
model for barite solubility in sodium chloride solutions at high temperatures (from 373.15
to 523.15 K), based on this parameterization of the CaSO4-NaCl-H2O system, showed good
agreement with the reported data. Later, Greenberg and Moller [78] developed an
expansion of the variable temperature model of the Na-Ca-Cl-SO4-H2O system reported
previously by Moller [77]. In this work, a chemical equilibrium model used to calculate
solubilities within the Na-K-Ca-Cl-SO4-H2O system from zero to high ionic strengths and
in the temperature range of 273.15 to 523.15 K was described. It was parameterized by
fitting available osmotic and solubility data in all common ion systems involving the
potassium ion: Na-K-Cl-H2O, Na-K-SO4-H2O, K-Cl-SO4-H2O, K-Ca-Cl-H2O and K-Ca-
SO4-H2O. Limitations of the model due to data insufficiencies were discussed because at
high temperatures there is a lack of data in some ternary systems, and the model was non-
convex at very high ionic strengths (𝐼 > 20 m); therefore, the model must be used cautiously
in the temperature range of 423.15 to 523.15 K. Additionally, model predictions for
solubility in the complex reciprocal systems, Na-K-Cl-SO4-H2O and K-Ca-Cl-SO4-H2O,
were compared with experimental data; however, data for the two systems were available
only in the temperature ranges 273.15–373.15 K and 273.15–328.15 K, respectively. The
35
phase diagram predicted for the halite-saturated Na-K-Ca-Cl-SO4-H2O quinary system at
373.15 K was also presented.
In the work of Christov and Moller [79], a model was described that calculated the solute
and solvent activities and solid-liquid equilibria in the H-Na-K-OH-Cl-HSO4-SO4-H2O
system from dilute to high solution concentration within the temperature range of 0 to
523.15 K. All binary and ternary subsystems were included in the model parameterization.
This model expanded the variable temperature Na-K-Cl-SO4-H2O model reported by
Greenberg and Moller [78] by including acid (H2SO4, HCl) and base (NaOH, KOH)
species, where the behavior of bisulfate formation in multicomponent acidic solutions, the
solid/solution equilibria involving very soluble acid sulfate, and solid-liquid equilibria in
NaOH and KOH solutions were described at high temperatures and concentrations.
Accordingly, in this work temperature functions for the chemical potentials of 11 acidic and
basic sodium and potassium salts were established from solubility data in corresponding
binary and ternary solutions.
4.2.2 Thermodynamic properties of copper sulfate solutions
In the literature, there are several authors who have determined the thermodynamic
properties of copper sulfate, as water activities, osmotic coefficients and activity
coefficients.
Robinson and Jones [80] determined values of osmotic and activity coefficients for aqueous
solutions of CuSO4, MgSO4, ZnSO4, CdSO4, MnSO4, and NiSO4 at 298.15 K over a wide
concentration range. In the case of copper sulfate, the concentration range used was from
0.1 to 1.4 m. The work of Wetmore and Gordon [81] reported the activity coefficients of
copper sulfate at different molalities (up to 1 m) in the temperature range of 288.15 to
318.15 K. Miller et al. [82] presented thermodynamic and transport data for aqueous CuSO4
solutions at 298.15 K from low concentrations to near saturation (from 0.00458 to 0.10355
m). Among the determined values were diffusion coefficients, electrical conductances and
osmotic coefficients. These data were critically compared with those found in the literature.
36
Apelbat [83] presented values for vapor pressures, water activities, and osmotic coefficients
of saturated solutions of KBr, (NH4)2SO4, CuSO4, FeSO4, and MnCl2 in the temperature
range of 283.15 to 308.15 K. The temperature dependence of the vapor pressures at
saturation has permitted the evaluation of enthalpy changes associated with the
simultaneously occurring evaporation and crystallization processes.
In the work of Guendouzi et al. [84], the hygrometric method described in a previous work
[85] was used for the determination of the water activities of aqueous solutions of Li2SO4,
Na2SO4, K2SO4, (NH4)2SO4, MgSO4, MnSO4, NiSO4, CuSO4, and ZnSO4 at 298.15 K, and
in the concentration range of 0.1 mol/kg up to saturation. Using these data, it was possible
to determine thermodynamic properties such as osmotic and activity coefficients for each
salt solution using the Pitzer model. Yang et al. [86] mentioned in their work that the
hydrometallurgical processes based on heavy metal sulfate solutions are important for the
extraction and purification of many important metals, including Mn, Co, Ni, Cu, and Zn.
Accordingly, the water activities of the binary heavy metal sulfate aqueous systems MSO4-
H2O (M = Mn, Co, Ni, Cu, Zn) were measured at 323.15 K using an isopiestic apparatus. In
the case of copper sulfate, the values reported were in the concentration range of 0.1289 to
2.0560 m. The reliability of the apparatus was verified by comparing the present data with
established literature results at 298.15 K for the test systems, and for the two reference
systems; CaCl2-H2O and H2SO4-H2O at both the 298.15 and 323.15 K. From this work it
was concluded that the measured water activities reported can be useful tools to
parameterize thermodynamic models of heavy-metal hydrometallurgical processes.
4.2.3 Pitzer ion-interaction model applied to the CuSO4-H2SO4-H2O system
The modelling of aqueous mixtures of a bivalent metal sulfate (such as copper sulfate) and
sulfuric acid, according to the treatment of Pitzer, is complicated by the formation of
bisulfate ion (HSO4-) and by the need to include the effects of unsymmetrical mixing of
ions of like but unequal charge. Because of the economic importance of the recovery of
copper by the leaching of its ores with sulfuric acid, it is especially important to improve
estimates of the Pitzer parameters for the CuSO4-H2SO4-H2O system.
37
In the literature, there are only a few works where the ion-interaction model of Pitzer have
been applied to systems containing copper sulfate; however, all these works have been
developed at 298.15 K and are detailed below:
Pitzer and Mayorga [66] discussed the behavior of 2-2 and higher valence type electrolytes,
where the model parameters of the binary systems MSO4-H2O (M = Ca, Cu, Zn, Ni, Mn) at
298.15 K, have been reported. In the work of Tanaka [87], the equilibrium distribution
ratios of Cu(II) between sulfuric acid solutions and xylene solutions have been measured
over a wide copper concentration range. In this work, a model was described with special
attention to the aqueous phase formulation, where Pitzer equations for free activity
coefficients of the ions in the aqueous phase were employed. Estimated values of the ratios
of the activity of Cu(II) to the square of the activity of hydrogen ion in the CuSO4-H2SO4-
H2O system have been compared with literature data. These results have supported the
effectiveness of Pitzer’s equations as a tool for the prediction of equilibrium distribution
ratios. Baes et al. [88] applied the Pitzer ion-interaction model to available osmotic,
solubility and emf data for the CuSO4-H2SO4-H2O system at 298.15 K, with inclusion of
unsymmetrical mixing effects, where published parameters for the H2SO4-H2O system and
evaluated literature data were employed to obtain parameters for the CuSO4-H2O system.
This work included numerical results of isopiestic and emf measurements of Majima and
Awakura [89], data on the solubility of CuSO4·5H2O in H2SO4 solutions [26], and emf
results of Holland and Bonner [90]. Wang et al. [91] selected a thermodynamic model to
simulate the properties of binary and ternary systems, and to predict the solubility phase
diagrams of the quaternary systems over a wide concentration range. This work simulated
the solubility of gypsum in the binary and ternary systems MSO4-H2O (M = Ca, Cu, Zn, Ni,
Mn), MSO4-H2SO4-H2O (M = Ca, Cu, Zn, Ni, Mn), and CaSO4- MSO4-H2O (M = Cu, Zn,
Ni, Mn) at 298.15 K with a Pitzer model in its simple form, and also predicted the
solubility of gypsum in the quaternary systems CaSO4-MSO4-H2SO4-H2O (M = Cu, Zn, Ni,
Mn) at 298.15 K. Necessary experiments were carried out to check the reliability of the
model predictions, which showed that the Pitzer thermodynamic model can predict
perfectly the solubilities of gypsum in quaternary systems. These predicted results provided
a profound understanding of how the solubility of gypsum is comprehensively affected by
H2SO4 and MSO4 (M = Cu, Zn, Ni, Mn) concentrations.
38
4.2.4 Thermodynamics of multicomponent solutions involving sodium and copper
chlorides and sulfates.
Studies on the solubility diagrams of ternary and multicomponent solutions involving
sodium and copper chlorides and sulfates are of importance especially for the production of
copper chloride and copper sulfate. This is why these solutions have been the subject of
many experimental and thermodynamic investigations by several authors. However, all
these studies have been carried out at 298.15 K.
Druzhinin and Kosyakina [92] studied the quaternary Na-Cu-Cl-SO4-H2O system at 298.15
K, finding the crystallization zone of the double salt CuSO4·Na2SO4·2H2O in the ternary
CuSO4-Na2SO4-H2O system at 298.15 K. The double salt CuCl2·NaCl·2H2O was present in
the CuCl2-NaCl-H2O ternary system. Nine crystallization fields were determined, including
a Na2SO4·CuSO4·2H2O·nNa2SO4 solid solution, in the reciprocal aqueous system that was
studied.
Filippov et al. [93] and Filippov and Nohrin [94] determined the compositions of the
saturated ternary solutions and the solid phases crystallizing from them in the NaCl-CuCl2-
H2O and Na2SO4-CuSO4-H2O systems at 298.15 K.
Downes and Pitzer [95], have used the isopiestic method to determine the dependence of
the osmotic coefficients on the concentration of the binary CuCl2 (aq) and CuSO4 (aq) and
the ternary NaCl-CuCl2-H2O, Na2SO4-CuSO4-H2O, and CuCl2-CuSO4-H2O solutions. In
addition, the authors also determined the binary and ternary Pitzer ion-interaction
parameters. These mixtures, which also involve a salt of the 2-2 type, seemed likely to be
more complicated because CuCl2 is known to be associated [96]. It was therefore of interest
to compare the experimental osmotic coefficients for the binary mixtures with those
predicted by the equations using only the parameters characteristic of the single-salt
solutions. In addition, the experimental osmotic coefficients for the four-ion mixtures were
compared with the values calculated using the different parameters deduced from the
common-ion mixtures.
In the work of Palaban and Pitzer [97], the solubilities in binary and ternary electrolyte
mixtures in the system Na-K-Mg-Cl-SO4-OH-H2O were calculated at high temperatures
39
using available thermodynamic data for solids and for aqueous electrolyte solutions.
Activity and osmotic coefficients were derived from the ion-interaction model of Pitzer, the
parameters of which were evaluated from experimentally determined solution properties or
from solubility data in binary and ternary mixtures. In this work, a good agreement with
experimental solubilities for binary and ternary mixtures indicated that the model can be
successfully used to predict mineral-solution equilibria at high temperatures. Then, Palaban
and Pitzer [98] developed a model for the thermodynamic properties of Na2SO4 (aq) in
hydrothermal solutions based on the ion-interaction or virial coefficient approach of Pitzer
[64, 99]. In this model, the experimental heat capacities of aqueous Na2SO4 solutions were
used, together with other experimental data on heat capacities, enthalpies and osmotic
coefficients available in the literature. In addition, NaCl (aq) was used as a model substance
to approximate the pressure dependencies of the thermodynamic properties of Na2SO4 (aq).
Standard state properties and activity and osmotic coefficients derived from this model
permitted the calculation of sodium sulfate solubilities up to 573.15 K. In this work, a good
agreement between experimental and predicted solubilities of mirabilite and thenardite in
water indicated that the ion-interaction approach can be used successfully to predict
mineral-solution equilibria up to 573.15 K. In the work of Christov [100] the molalities of
the CuCl2-CuSO4-H2O system were investigated in saturated solutions at 298.15 K by the
physico-chemical analysis method, where the crystallizations of only the simple salts
CuCl2·2H2O, and CuSO4·5H2O were established. The ternary solutions NaCl-CuCl2-H2O,
Na2SO4-CuSO4-H2O and CuCl2-CuSO4-H2O, were simulated thermodynamically at 298.15
K using the Pitzer model. The ternary parameters of ionic interaction were chosen on the
basis of the compositions of saturated ternary solutions, taking into account the
unsymmetrical mixing terms. The calculated thermodynamic properties were used for a
thermodynamic study of the quaternary reciprocal system Na-Cu-Cl-SO4-H2O, where very
good agreement was found between calculated and experimental solubility isotherms.
In addition, some authors have used a simple methodology for the determination of
solubilities in multicomponent systems where the Pitzer model was used to quantify the
effect of a salt, while a similar equation from the Born model was used to quantify a
cosolvent effect. These works are detailed below:
40
Kan et al. [101] presented a model to calculate the effect of methanol on barite, gypsum,
celestite and halite solubility in methanol/water/salt and ethylene glycol/water/salt
solutions. Here, the Pitzer theory was used to model the effect of the salt, while a Born-type
equation approach was used to model the effect of the cosolvent. Results showed that the
barite solubility was significantly reduced with 50% methanol, and other mineral
solubilities were also reduced significantly. On the other hand, ethylene glycol had much
less impact on the mineral solubility than did methanol. In this work, good agreements
between the model predictions and both experimental and literature results were observed,
concluding that these equations provide a predictive algorithm to assess the potentially
adverse effects of methanol and ethylene glycol on mineral scale formation during oil and
gas production.
A similar work was performed by Jiménez et al. [102], where a representation of the solid–
liquid equilibrium of potassium sulfate in diverse water/organic solvent mixtures (water/1-
propanol, water/methanol, water/ethanol, and water/acetone) in the temperature range of
288.15 to 318.15 K was carried out. In this work, the experimental solubility data of
potassium sulfate in diverse mixed solvents were obtained from the literature, while the
thermodynamic representation of the phase equilibrium was based on a simple
methodology reported in the literature [101]. Results of this work showed a good agreement
between the calculated and the experimental solubility data of K2SO4 in the different
solvent mixtures.
It is important to mention that the simple methodology used in these works [101, 102] also
allowed the calculation of amounts of precipitated salt, and the optimum yield, as a function
of the cosolvent concentration.
41
5. REFERENCES
[1] R. Brantes, G. Olivares, Best practices and efficient use of water in the mining industry,
Cochilco (Chilean Copper Commission), (2008).
[2] M.A. Torres, G.E. Meruane, T.A. Graber, P.C. Gutiérrez, M.E. Taboada, Recovery of
nitrates from leaching solutions using seawater, Hydrometallurgy, 133 (2013) 100-105.
[3] J.I. Kroschwitz, A. Seidel, Kirk-Othmer encyclopedia of chemical technology, Wiley-
Interscience, Hoboken, N.J., 2004.
[4] H.W. Richardson, Handbook of copper compounds and applications, CRC Press1997.
[5] W.G. Davenport, M.J. King, M.E. Schlesinger, A.K. Biswas, Extractive metallurgy of
copper, Elsevier2002.
[6] L. Cisternas, E. Gálvez, Y. Leyton, J. Valderrama, Agua de Mar Atacama:
oportunidades y avances para el uso sostenible de agua de mar en minería, Ril editores,
2017, pp. 248.
[7] L.A. Cisternas, L. Moreno, El agua de mar en la minería: Fundamentos y aplicaciones,
RIL editores, 2014, pp. 234.
[8] F.J. Millero, R. Feistel, D.G. Wright, T.J. McDougall, The composition of Standard
Seawater and the definition of the Reference-Composition Salinity Scale, Deep Sea
Research Part I: Oceanographic Research Papers, 55 (2008) 50-72.
[9] Cochilco, Consumo de agua en la minería del cobre al 2015, DEPP 06 (2016).
[10] M. Donoso, P.A. Robles, E.D. Galvez, L.A. Cisternas, Particle Size Effect on the
Efficient Use of Water and Energy in Mineral Concentration Processes, Industrial &
Engineering Chemistry Research, 52 (2013) 17686-17690.
[11] B.M. Fabuss, A. Korosi, A.S. Hug, Densities of Binary and Ternary Aqueous
Solutions of NaCl, Na2SO4 and MgSO4 of Sea Waters, and Sea Water Concentrates,
Journal of Chemical and Engineering Data, 11 (1966) 325-331.
[12] A. Korosi, B.M. Fabuss, Viscosities of binary aqueous solutions of sodium chloride,
potassium chloride, sodium sulfate, and magnesium sulfate at concentrations and
temperatures of interest in desalination processes, Journal of Chemical & Engineering Data,
13 (1968) 548-552.
[13] B.M. Fabuss, A. Korosi, D.F. Othmer, Viscosities of aqueous solutions of several
electrolytes present in sea water, Journal of Chemical and Engineering Data, 14 (1969)
192-197.
42
[14] L.R.A. Bromley, V.A. De Saussure, J.C. Clipp, J.S. Wright, Heat capacities of sea
water solutions at salinities of 1 to 12% and temperatures of 2 °C to 80 °C, Journal of
Chemical and Engineering Data, 12 (1967) 202-206.
[15] L.R.A. Bromley, Heat capacity of sea water solutions. Partial and apparent values for
salts and water, Journal of Chemical & Engineering Data, 13 (1968) 60-62.
[16] L.A. Bromley, Relative enthalpies of sea salt solutions at 25°C, Journal of Chemical &
Engineering Data, 13 (1968) 399-402.
[17] L.A. Bromley, A.E. Diamond, E. Salami, D.G. Wilkins, Heat capacities and enthalpies
of sea salt solutions to 200 °C, Journal of Chemical and Engineering Data, 15 (1970) 246-
253.
[18] H.F. Gibbard Jr, G. Scatchard, Vapor-liquid equilibriums of synthetic seawater
solutions from 25-100 °C, Journal of Chemical and Engineering Data, 17 (1972) 498-501.
[19] D. Singh, L.A. Bromley, Relative enthalpies of sea salt solutions at 0. deg. to 75 °C,
Journal of Chemical and Engineering Data, 18 (1973) 174-181.
[20] F.J. Millero, The physical chemistry of seawater, Annual Review of Earth and
Planetary Sciences, 2 (1974) 101-150.
[21] R. Feistel, A Gibbs function for seawater thermodynamics for − 6 to 80 °C and salinity
up to 120g·kg–1
, Deep Sea Research Part I: Oceanographic Research Papers, 55 (2008)
1639-1671.
[22] H. Sun, R. Feistel, M. Koch, A. Markoe, New equations for density, entropy, heat
capacity, and potential temperature of a saline thermal fluid, Deep Sea Research Part I:
Oceanographic Research Papers, 55 (2008) 1304-1310.
[23] R. Philippe, R. Dixon, S. Dal Pozzo, Seawater supply options for the mining industry,
2nd International Seminar on Geology for the Mining Industry, 2011.
[24] P.A. Moreno, H. Aral, J. Cuevas, A. Monardes, M. Adaro, T. Norgate, W. Bruckard,
The use of seawater as process water at Las Luces copper–molybdenum beneficiation plant
in Taltal (Chile), Minerals Engineering, 24 (2011) 852-858.
[25] M. Taboada, P. Hernández, H. Galleguillos, E. Flores, T. Graber, Behavior of sodium
nitrate and caliche mineral in seawater: Solubility and physicochemical properties at
different temperatures and concentrations, Hydrometallurgy, 113 (2012) 160-166.
[26] W. Linke, A. Seidell, Solubilities of Inorganic and Metal-organic Compounds, (1965),
ACS, Washington DC.
43
[27] C. Beevers, H. Lipson, The Crystal Structure of Copper Sulphate Pentahydrate,
CuSO4·5H2O, Proceedings of the Royal Society of London. Series A, 146 (1934) 570-582.
[28] V. Manomenova, M. Stepnova, V. Grebenev, E. Rudneva, A. Voloshin, Growth of
CuSO4·5H2O single crystals and study of some of their properties, Crystallography
Reports, 58 (2013) 513-516.
[29] M. Courtade, G. Ramel, Bordeaux mixture, process for its manufacture and cupric
fungicidal compositions containing it, Google Patents, 1999.
[30] S. Andras, D. Tamas, M. Tamasne, K. Laszlone, R. Istvan, S. Zoltan, Bordeaux
mixture suspension and process for the preparation thereof, EP, 2 (2009) 713.
[31] P. Shaffer, A.F. Hartmann, The Iiodometric determination of copper and its use in
sugar analysis., Journal of Biological Chemistry, 45 (1921) 365-390.
[32] E.W. N. Wiberg, A.F. Holleman, Inorganic Chemistry, New York, USA, 1995.
[33] F.I. Tabilo Christoforou, Proyecto Anico, (2012).
[34] H. Holler, E. Peffer, The density of aqueous solutions of copper sulfate and sulfuric
acid, Journal of the American Chemical Society, 38 (1916) 1021-1029.
[35] D. Milligan, H. Moyer, Crystallization in the Copper sulphate - Sulfuric acid - Water
System, ENG MIN J, 176 (1975) 85-89.
[36] D.C. Price, W.G. Davenport, Densities, electrical conductivities and viscosities of
CuSO4/H2SO4 solutions in the range of modern electrorefining and electrowinning
electrolytes, Metallurgical Transactions B, 11 (1980) 159-163.
[37] J. Hotlos, M. Jaskuła, Densities and viscosities of CuSO4-H2SO4-H2O solutions,
Hydrometallurgy, 21 (1988) 1-7.
[38] D. De Juan, V. Messenguer, L. Lozano, Una contribución al estudio de la solubilidad
del CuSO4∙5H2O en medio acuoso, Revista de metalurgia, 35 (1999) 47-52.
[39] P.a.C. Hernandez, H.c.R. Galleguillos, T.f.A. Graber, E.K. Flores, M.E. Taboada,
Effect of Seawater on the Solubility and Physicochemical Properties of Acidic Copper
Sulfate Solutions, Journal of Chemical & Engineering Data, 57 (2012) 2430-2436.
[40] T. Ishii, S. Fujita, Crystallization from supersaturated cupric sulfate solutions in a
batchwise stirred tank, The Chemical Engineering Journal, 21 (1981) 255-260.
[41] R.C. Zumstein, R.W. Rousseau, Agglomeration of copper sulfate pentahydrate crystals
within well-mixed crystallizers, Chemical engineering science, 44 (1989) 2149-2155.
44
[42] J.V. Macpherson, P.R. Unwin, A novel approach to the study of dissolution kinetics
using the scanning electrochemical microscope: theory and application to copper sulfate
pentahydrate dissolution in aqueous sulfuric acid solutions, The Journal of Physical
Chemistry, 98 (1994) 1704-1713.
[43] M. Giulietti, S. Derenzo, J. Nývlt, L. Ishida, Crystallization of copper sulphate, Crystal
Research and Technology, 30 (1995) 177-183.
[44] M. Giulietti, M. Seckler, S. Derenzo, J. Valarelli, Changes in copper sulfate crystal
habit during cooling crystallization, Journal of crystal growth, 166 (1996) 1089-1093.
[45] M. Giulietti, M. Seckler, S. Derenzo, L. Schiavon, J. Valarelli, J. Nyvlt, Effect of
selected parameters on crystallization of copper sulphate pentahydrate, Crystal Research
and Technology, 34 (1999) 959-967.
[46] E. Lyall, P. Mougin, D. Wilkinson, K.J. Roberts, In situ ultrasonic spectroscopy study
of the nucleation and growth of copper sulfate pentahydrate batch crystallized from
supersaturated aqueous solutions, Industrial & Engineering Chemistry Research, 43 (2004)
4947-4956.
[47] S. Aktas, A novel purification method for copper sulfate using ethanol,
Hydrometallurgy, 106 (2011) 175-178.
[48] N. Singh, R. Yeri, J. Chakraborty, Effect of Ionic Surfactants and Alcohols on the
Morphology of CuSO4·5H2O Crystals: Combined Use of Factors and Significance of
Threshold Surfactant Concentration, Industrial & Engineering Chemistry Research, 52
(2013) 15041-15048.
[49] T.T.H. Nguyen, Influence of crystallisation environment on the nucleation and growth
of single crystals of (RS)-ibuprofen, University of Leeds 2013.
[50] W. Brandse, G. Van Rosmalen, G. Brouwer, The influence of sodium chloride on the
crystallization rate of gypsum, Journal of Inorganic and Nuclear Chemistry, 39 (1977)
2007-2010.
[51] R. Sheikholeslami, H. Ong, Kinetics and thermodynamics of calcium carbonate and
calcium sulfate at salinities up to 1.5 M, Desalination, 157 (2003) 217-234.
[52] J. Garside, A. Mersmann, J. Nývlt, Measurement of crystal growth and nucleation
rates, IChemE2002.
[53] J. Mullin, A. Amatavivadhana, Growth kinetics of ammonium‐and potassium‐
dihydrogen phosphate crystals, Journal of Chemical Technology and Biotechnology, 17
(1967) 151-156.
45
[54] R. Davey, J. Mullin, Growth of the (100) faces of ammonium dihydrogen phosphate
crystals in the presence of ionic species, Journal of crystal growth, 26 (1974) 45-51.
[55] C. Sweegers, H. Meekes, W. Van Enckevort, I. Hiralal, A. Rijkeboer, Growth rate
analysis of gibbsite single crystals growing from aqueous sodium aluminate solutions,
Crystal Growth & Design, 4 (2004) 185-198.
[56] S. Suharso, In Situ Measurement of the Growth Rate of the (111) Face of Borax Single
Crystal, Jurnal Matematika & Sains, 10 (2009) 101-106.
[57] T. Nguyen, R. Hammond, K. Roberts, I. Marziano, G. Nichols, Precision measurement
of the growth rate and mechanism of ibuprofen (001) and (011) as a function of
crystallization environment, CrystEngComm, 16 (2014) 4568-4586.
[58] D.M. Camacho, K.J. Roberts, K. Lewtas, I. More, The crystal morphology and growth
rates of triclinic N-docosane crystallising from N-dodecane solutions, Journal of crystal
growth, 416 (2015) 47-56.
[59] D.M. Camacho, K.J. Roberts, F. Muller, D. Thomas, I. More, K. Lewtas, Morphology
and growth of methyl stearate as a function of crystallisation environment, Crystal Growth
& Design, (2016).
[60] Y. Lin, A.t. Kate, M. Mooijer, J. Delgado, P.L. Fosbøl, K. Thomsen, Comparison of
activity coefficient models for electrolyte systems, AIChE journal, 56 (2010) 1334-1351.
[61] P. Debye, E. Hückel, De la theorie des electrolytes. I. abaissement du point de
congelation et phenomenes associes, Physikalische Zeitschrift, 24 (1923) 185-206.
[62] P. Debye, E. Huckel, Theory of Electrolytes. II, The Limiting Law of Electrical
Conductivity, Z. Physik, 24 (1923) 305-325.
[63] J.W. Tester, M. Modell, Thermodynamics and its Applications, Prentice Hall
PTR1997.
[64] K.S. Pitzer, Thermodynamics of electrolytes. I. Theoretical basis and general
equations, The Journal of Physical Chemistry, 77 (1973) 268-277.
[65] W.G. McMillan Jr, J.E. Mayer, The statistical thermodynamics of multicomponent
systems, The Journal of chemical physics, 13 (1945) 276-305.
[66] K.S. Pitzer, G. Mayorga, Thermodynamics of electrolytes. III. Activity and osmotic
coefficients for 2–2 electrolytes, Journal of Solution Chemistry, 3 (1974) 539-546.
46
[67] K.S. Pitzer, J.J. Kim, Thermodynamics of electrolytes. IV. Activity and osmotic
coefficients for mixed electrolytes, Journal of the American Chemical Society, 96 (1974)
5701-5707.
[68] K.S. Pitzer, R.N. Roy, L.F. Silvester, Thermodynamics of electrolytes. 7. Sulfuric
acid, Journal of the American Chemical Society, 99 (1977) 4930-4936.
[69] L.F. Silvester, K.S. Pitzer, Thermodynamics of electrolytes. 8. High-temperature
properties, including enthalpy and heat capacity, with application to sodium chloride, The
Journal of Physical Chemistry, 81 (1977) 1822-1828.
[70] K.S. Pitzer, L.F. Silvester, Thermodynamics of electrolytes. 11. Properties of 3:2, 4:2,
and other high-valence types, The Journal of Physical Chemistry, 82 (1978) 1239-1242.
[71] K.S. Pitzer, J.M. Simonson, Thermodynamics of multicomponent, miscible, ionic
systems: theory and equations, The Journal of Physical Chemistry, 90 (1986) 3005-3009.
[72] K.S. Pitzer, Electrolytes. From dilute solutions to fused salts, Journal of the American
Chemical Society, 102 (1980) 2902-2906.
[73] C.C. Chen, L.B. Evans, A local composition model for the excess Gibbs energy of
aqueous electrolyte systems, AIChE journal, 32 (1986) 444-454.
[74] H. Renon, J.M. Prausnitz, Local compositions in thermodynamic excess functions for
liquid mixtures, AIChE journal, 14 (1968) 135-144.
[75] C.C. Chen, H.I. Britt, J.F. Boston, L.B. Evans, Extension and application of the Pitzer
equation for vapor‐liquid equilibrium of aqueous electrolyte systems with molecular
solutes, AIChE journal, 25 (1979) 820-831.
[76] C.E. Harvie, J.H. Weare, The prediction of mineral solubilities in natural waters: the
Na-K-Mg-Ca-Cl-SO4-H2O system from zero to high concentration at 25°C, Geochimica et
Cosmochimica Acta, 44 (1980) 981-997.
[77] N. Møller, The prediction of mineral solubilities in natural waters: A chemical
equilibrium model for the Na-Ca-Cl-SO4-H2O system, to high temperature and
concentration, Geochimica et Cosmochimica Acta, 52 (1988) 821-837.
[78] J.P. Greenberg, N. Møller, The prediction of mineral solubilities in natural waters: A
chemical equilibrium model for the Na-K-Ca-Cl-SO4-H2O system to high concentration
from 0 to 250°C, Geochimica et Cosmochimica Acta, 53 (1989) 2503-2518.
[79] C. Christov, N. Moller, Chemical equilibrium model of solution behavior and
solubility in the H-Na-K-OH-Cl-HSO4-SO4-H2O system to high concentration and
temperature, Geochimica et Cosmochimica Acta, 68 (2004) 1309-1331.
47
[80] R.A. Robinson, R.S. Jones, The activity coefficients of some bivalent metal sulfates in
aqueous solution from vapor pressure measurements, Journal of the American Chemical
Society, 58 (1936) 959-961.
[81] F.E.W. Wetmore, A. Gordon, The Activity Coefficient of Copper Sulphate in Aqueous
Solution, The Journal of chemical physics, 5 (1937) 60-63.
[82] D.G. Miller, J.A. Rard, L.B. Eppstein, R. Robinson, Mutual diffusion coefficients,
electrical conductances, osmotic coefficients, and ionic transport coefficients ij for aqueous
CuSO4 at 25°C, Journal of Solution Chemistry, 9 (1980) 467-496.
[83] A. Apelblat, The vapour pressures of saturated aqueous solutions of potassium
bromide, ammonium sulfate, copper (II) sulfate, iron (II) sulfate, and manganese (II)
dichloride, at temperatures from 283 K to 308 K, The Journal of Chemical
Thermodynamics, 25 (1993) 1513-1520.
[84] M.E. Guendouzi, A. Mounir, A. Dinane, Water activity, osmotic and activity
coefficients of aqueous solutions of Li2SO4, Na2SO4, K2SO4,(NH4)2SO4, MgSO4, MnSO4,
NiSO4, CuSO4, and ZnSO4 at T= 298.15 K, The Journal of Chemical Thermodynamics, 35
(2003) 209-220.
[85] M. El Guendouzi, A. Dinane, Determination of water activities, osmotic and activity
coefficients in aqueous solutions using the hygrometric method, The Journal of Chemical
Thermodynamics, 32 (2000) 297-310.
[86] H. Yang, D. Zeng, W. Voigt, G. Hefter, S. Liu, Q. Chen, Isopiestic measurements on
aqueous solutions of heavy metal sulfates: MSO4+ H2O (M= Mn, Co, Ni, Cu, Zn). 1. T=
323.15 K, Journal of Chemical & Engineering Data, 59 (2013) 97-102.
[87] M. Tanaka, Modelling of solvent extraction equilibria of Cu (II) from nitric and
hydrochloric acid solutions with (β-hydroxyoxime), Hydrometallurgy, 24 (1990) 317-331.
[88] C. Baes Jr, E. Reardon, B.A. Moyer, Ion interaction model applied to the cupric
sulfate-sulfuric acid-water system at 25°C, The Journal of Physical Chemistry, 97 (1993)
12343-12348.
[89] H. Majima, Y. Awakura, Water and solute activities of the solution systems of H2SO4-
CuSO4-H2O and HCl-CuCl2-H2O, Metallurgical Transactions B, 19 (1988) 347-354.
[90] V. Holland, O. Bonner, Activity Coefficient Ratios of Mixed Electrolytes in Aqueous
Solutions at 25 °C. I. Sulfuric Acid and Cupric Sulfate. II. Perchloric Acid and Cupric
Perchlorate, Journal of the American Chemical Society, 77 (1955) 5833-5835.
48
[91] W. Wang, D. Zeng, X. Yin, Q. Chen, Prediction and measurement of gypsum
solubility in the systems CaSO4+ HMSO4+ H2SO4+ H2O (HM= Cu, Zn, Ni, Mn) at 298.15
K, Industrial & Engineering Chemistry Research, 51 (2012) 5124-5134.
[92] I.G.K. Druzhinin, O. A. , Solubility and solid phases in the CuCl2+Na2SO4 ↔
CuSO4+Na2Cl2 aqueous reciprocal system at 25 °C., Russian Journal of Inorganic
Chemistry, 6 (1961) 868-873.
[93] V. Filippov, N. Charykov, Y.A. Fedorov, The NaCl-NiCl2-H2O and NaCl-CuCl2-H2O
systems at 25°C, Russian Journal of Inorganic Chemistry, 31 (1986) 1861-1866.
[94] V. Filippov, V. Nokhrin, Solubility in the Na2SO4-CuSO4-H2O system at 25°C,
Russian Journal of Inorganic Chemistry, 30 (1985) 2963-2965.
[95] C.J. Downes, K.S. Pitzer, Thermodynamics of electrolytes. Binary mixtures formed
from aqueous NaCl, Na2SO4, CuCl2, and CuSO4, at 25°C, Journal of Solution Chemistry, 5
(1976) 389-398.
[96] R.A. Robinson, R.H. Stokes, Electrolyte solutions, Courier Corporation2002.
[97] R.T. Pabalan, K.S. Pitzer, Thermodynamics of concentrated electrolyte mixtures and
the prediction of mineral solubilities to high temperatures for mixtures in the system Na-K-
Mg-Cl-SO4-OH-H2O, Geochimica et Cosmochimica Acta, 51 (1987) 2429-2443.
[98] R.T. Pabalan, K.S. Pitzer, Heat capacity and other thermodynamic properties of
Na2SO4(aq) in hydrothermal solutions and the solubilities of sodium sulfate minerals in the
system Na-Cl-SO4-OH-H2O to 300°C, Geochimica et Cosmochimica Acta, 52 (1988)
2393-2404.
[99] K.S. Pitzer, A thermodynamic model for aqueous solutions of liquid-like density,
Lawrence Berkeley Lab., CA (USA), 1987.
[100] C. Christov, Thermodynamic study of the Na-Cu-Cl-SO4-H2O system at the
temperature 298.15 K, The Journal of Chemical Thermodynamics, 32 (2000) 285-295.
[101] A.T. Kan, G. Fu, M.B. Tomson, Effect of methanol and ethylene glycol on sulfates
and halite scale formation, Industrial & Engineering Chemistry Research, 42 (2003) 2399-
2408.
[102] Y.P. Jimenez, M.E. Taboada, H.R. Galleguillos, Solid–liquid equilibrium of K2SO4
in solvent mixtures at different temperatures, Fluid Phase Equilibria, 284 (2009) 114-117.
49
CHAPTER III
SOLUBILITIES AND PHYSICAL PROPERTIES OF SATURATED SOLUTIONS
IN THE COPPER SULFATE + SULFURIC ACID + SEAWATER SYSTEM AT
DIFFERENT TEMPERATURES
Francisca J. Justel, Martha Claros, María E. Taboada*
Department of Chemical Engineering, University of Antofagasta, Angamos 601,
Antofagasta, Chile
ABSTRACT
In Chile, the most important economic activity is mining, concentrated in the north of the
country. This is a desert region with limited water resources; therefore, the mining sector
requires research and identification of alternative sources of water. One alternative is
seawater, which can be a substitute of the limited freshwater resources in the region. This
work determines the influence of seawater on the solid−liquid equilibrium for acid
solutions of copper sulfate at different temperatures (293.15 to 318.15 K), and its effect on
physical properties (density, viscosity, and solubility). Knowledge of these properties and
solubility data are useful in the leaching process and in the design of copper sulfate
pentahydrate crystallization plants from the leaching process using seawater by means of
the addition of sulfuric acid.
Keywords: Seawater, Copper sulfate, Sulfuric acid.
“This is an extended version of the manuscript presented at the VII Brazilian Congress of
Applied Thermodynamics – CBTermo 2013, Uberlândia, Brazil”
50
INTRODUCTION
The most important economic activity in Chile is mining. Currently, there is a worldwide
shortage of available freshwater. Therefore, mining industries are developing new methods
to optimize water use [1]. In northern Chile, for example, certain mining companies are
using raw seawater in their production processes [2] and purified seawater by reverse
osmosis [3]. In a mining process, the solid−liquid equilibrium and physical properties of
solutions change upon seawater incorporation, especially the density and viscosity; which
are used in pipe-sizing and pumping calculations. These properties are related to the cost of
energy required to bring seawater to mining operations, usually farther than 120 km [4].
Copper sulfate pentahydrate (Blue vitriol) is a copper salt with a wide range of commercial
applications: in agriculture as a pesticide, fungicide, feed, and soil additive [5]; in mining, it
is used as a floatation reagent in recovery of zinc and lead [6]; as a blue and green pigment
in dyes, as a print toner in photography, in the production of other copper compounds, and
in leather tanning [7].
Actually, the production process of copper sulfate pentahydrate includes the following
steps: 1) Heap leaching, where copper is obtained from oxidized ores using a mixture of
sulfuric acid and water; 2) Solvent extraction, where copper is extracted from the leaching
solution by mixing with a product called organic; 3) Crystallization, where the copper-
loaded organic is discharged using a concentrated acid solution; 4) Re-crystallization,
where copper sulfate is dissolved in freshwater at a temperature of 80-90 °C, and then
crystallized by cooling to 25-30 °C, in order to remove the impurities [8].
Copper sulfate in distilled water solutions has been investigated for crystallization,
supersaturation, solid-liquid equilibrium, and properties [5, 6, 9]. In these studies,
crystallization conditions of copper sulfate solutions were determined as a function of both
temperature and sulfuric acid concentration. In order to optimize the water use, it is
interesting to investigate the influence of seawater on the copper sulfate crystallization
process. In the literature, there is a publication available of the behavior of copper sulfate in
a seawater system [4], which provides solubilities and physical properties data of CuSO4 in
seawater at pH 2. The present work studies the effect of seawater (3.5% salinity) on the
solid-liquid equilibrium of copper sulfate in acid solutions at different temperatures (from
293.15 K to 318.15 K). This temperature range was chosen because is within the range in
51
which the crystallization process operates. In addition, the physical properties, density, and
viscosity of the saturated solution are experimentally measured and correlated with
empirical equations, finding a good agreement.
From the results obtained in this investigation, and in order to minimize the use of
freshwater, the next step of this work is to perform the copper sulfate crystallization process
from leaching solutions using seawater to study the effect of the ions present in seawater on
the habit and size of copper sulfate pentahydrate crystals.
2. MATERIALS AND METHODS
2.1 Reagents
Analytical grade reagents were used (copper (II) sulfate pentahydrate, Merck, 99 %;
absolute sulfuric acid, Merck, 95 to 97 %, absolute). The experiments were performed
using filtered natural seawater obtained from San Jorge Bay, Antofagasta, Chile. Table 1
shows the composition of the seawater, obtained by chemical analysis, used in this work
[4].
Table 1. Individual ions in seawater from Bahia San Jorge, Chile (mg·L−1
) [4].
Na+
Mg+2
Ca+2
K+
B+3
Cu2+
Cl-
SO4-2
HCO3-
NO3-
9480 1190 386 374 4.6 0.072 18765 2771 142 2.05
2.2 Apparatus
The solutions were prepared using an analytical balance (Mettler Toledo Co. model
AX204, with 0.07 mg precision). To obtain the phase equilibrium data at different
temperatures, a rotary thermostatic bath (to ± 0.1 K, 50 rpm) with a capacity of ten 90 mL
glass flasks was used. The densities were measured using a Mettler Toledo DE-50 vibrating
tube densimeter with ± 5·10−2
kg·m−3
precision.
The kinematic viscosities were obtained using a calibrated micro-Ostwald viscometer with
a Schott-Gerate automatic measuring unit (model AVS 310), equipped with a thermostat
52
(Schott-Gerate, model CT 52) for temperature regulation. The absolute viscosities were
calculated by multiplying the kinematic viscosity and the respective density.
2.3 Procedures
2.3.1 Equilibrium time determination
The equilibrium time was determined at 298.15 K. Acidic seawater was prepared by adding
sulfuric acid to seawater and stirring the solution until it reached pH 2; this pH was used
because it is similar to the pH levels in copper mining operations. The masses of copper (II)
sulfate pentahydrate in the solution (seawater at pH 2) were measured. An excess of copper
(II) sulfate pentahydrate was added to ensure saturation of the solution. Several saturated
solutions (CuSO4 + acid seawater) were placed in closed glass flasks and immersed in a
rotary water bath at 298.15 K, these solutions were mechanically shaken. Every hour, the
rotation was stopped, one flask was removed from the bath and, maintaining the work
temperature (298.15 K) and using a syringe filter (to ensure that no copper sulfate
pentahydrate solid was present in the solution), the solution density was measured. The
equilibrium time was determined when the solutions that were taken at different times
(every one hour), reached constant densities.
2.3.2 Measurement of physical properties in different conditions
After the equilibrium time was determined, ten solutions (CuSO4 + acid seawater) at
different acid concentrations were prepared.
These solutions were stirred in a rotatory water bath for 8 hours (equilibrium time). The
rotation was then stopped and the solutions were decanted, maintaining the work
temperature. Then, in the thermostatic bath, and using a syringe filter at a slightly elevated
temperature (to prevent salt precipitation at lower temperatures), the solutions (without
solid) were obtained for each equilibrium point.
53
Physical properties (density and viscosity) were measured in triplicate for each solution. On
the other hand, copper (II) concentration was measured in duplicate by atomic absorption
and the CuSO4 solubility was obtained by stoichiometry. All measurements of the physical
properties and solubilities were performed at four different temperatures: 293.15, 298.15,
308.15, and 318.15 K.
3. RESULTS AND DISCUSSION
3.1 Experimental results
The solubilities, densities, and viscosities are shown in Table 2, for the system studied at
different temperatures and acid concentrations.
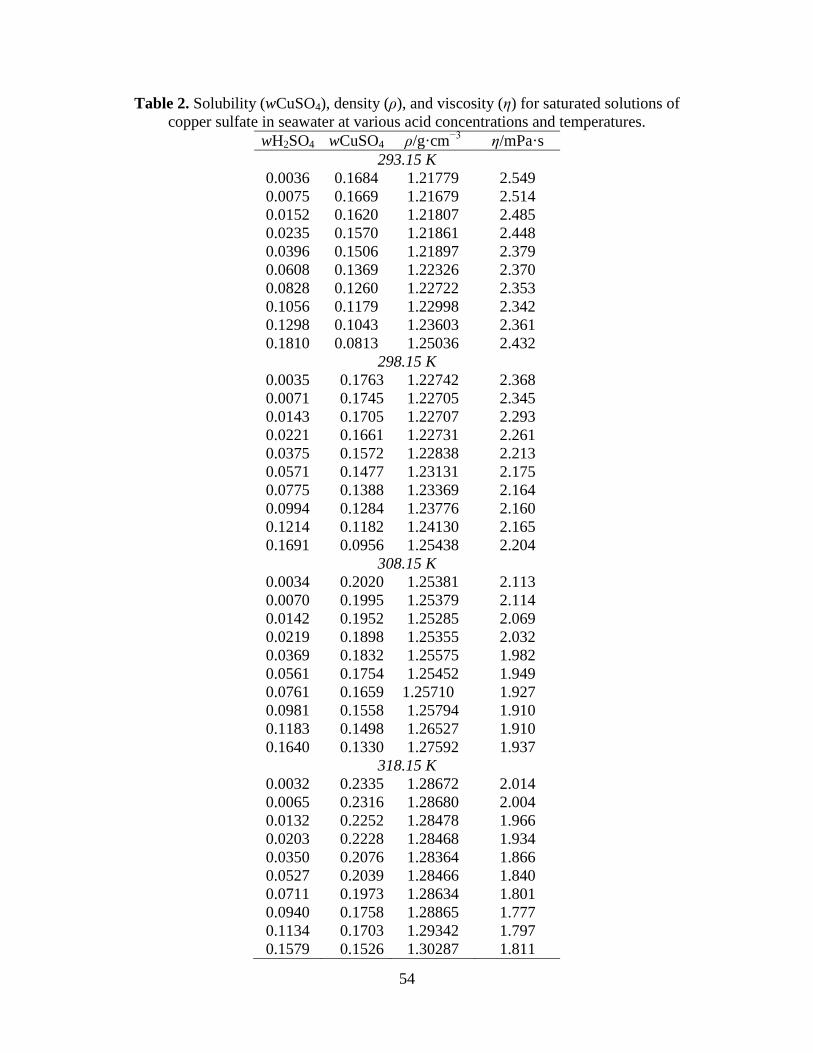
54
Table 2. Solubility (wCuSO4), density (ρ), and viscosity (η) for saturated solutions of
copper sulfate in seawater at various acid concentrations and temperatures.
wH2SO4 wCuSO4 ρ/g·cm−3
η/mPa·s
293.15 K
0.0036 0.1684 1.21779 2.549
0.0075 0.1669 1.21679 2.514
0.0152 0.1620 1.21807 2.485
0.0235 0.1570 1.21861 2.448
0.0396 0.1506 1.21897 2.379
0.0608 0.1369 1.22326 2.370
0.0828 0.1260 1.22722 2.353
0.1056 0.1179 1.22998 2.342
0.1298 0.1043 1.23603 2.361
0.1810 0.0813 1.25036 2.432
298.15 K
0.0035 0.1763 1.22742 2.368
0.0071 0.1745 1.22705 2.345
0.0143 0.1705 1.22707 2.293
0.0221 0.1661 1.22731 2.261
0.0375 0.1572 1.22838 2.213
0.0571 0.1477 1.23131 2.175
0.0775 0.1388 1.23369 2.164
0.0994 0.1284 1.23776 2.160
0.1214 0.1182 1.24130 2.165
0.1691 0.0956 1.25438 2.204
308.15 K
0.0034 0.2020 1.25381 2.113
0.0070 0.1995 1.25379 2.114
0.0142 0.1952 1.25285 2.069
0.0219 0.1898 1.25355 2.032
0.0369 0.1832 1.25575 1.982
0.0561 0.1754 1.25452 1.949
0.0761 0.1659 1.25710 1.927
0.0981 0.1558 1.25794 1.910
0.1183 0.1498 1.26527 1.910
0.1640 0.1330 1.27592 1.937
318.15 K
0.0032 0.2335 1.28672 2.014
0.0065 0.2316 1.28680 2.004
0.0132 0.2252 1.28478 1.966
0.0203 0.2228 1.28468 1.934
0.0350 0.2076 1.28364 1.866
0.0527 0.2039 1.28466 1.840
0.0711 0.1973 1.28634 1.801
0.0940 0.1758 1.28865 1.777
0.1134 0.1703 1.29342 1.797
0.1579 0.1526 1.30287 1.811
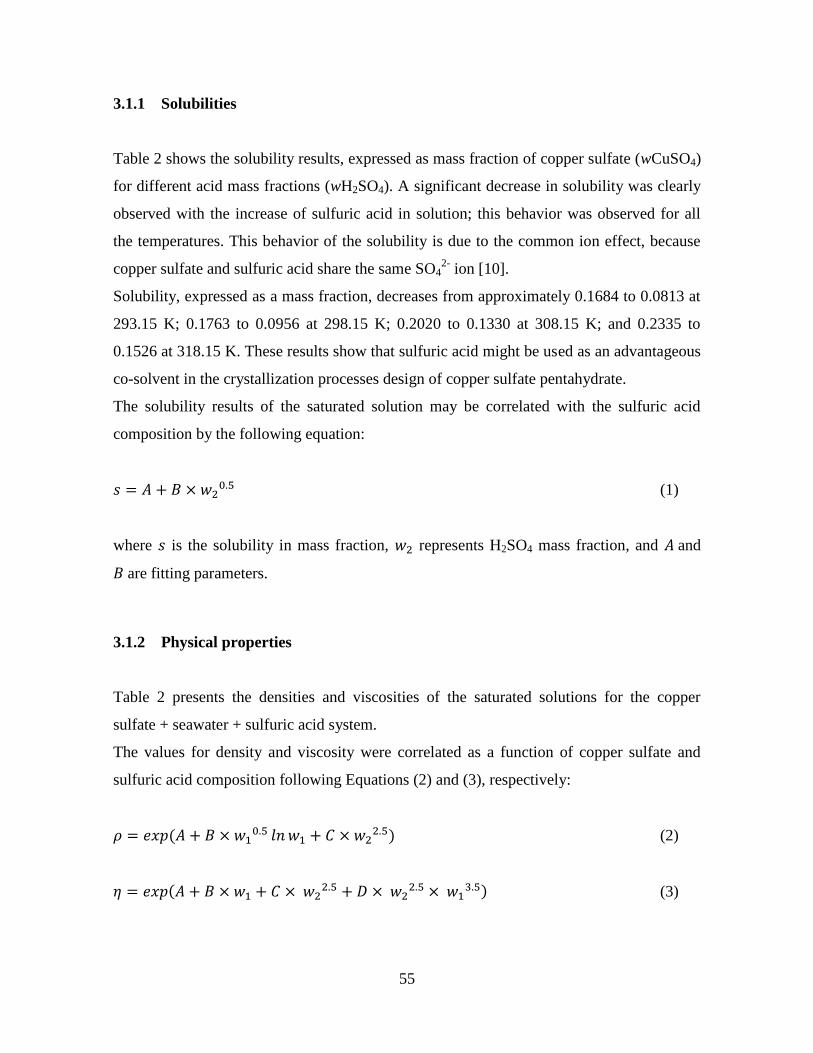
55
3.1.1 Solubilities
Table 2 shows the solubility results, expressed as mass fraction of copper sulfate (wCuSO4)
for different acid mass fractions (wH2SO4). A significant decrease in solubility was clearly
observed with the increase of sulfuric acid in solution; this behavior was observed for all
the temperatures. This behavior of the solubility is due to the common ion effect, because
copper sulfate and sulfuric acid share the same SO42-
ion [10].
Solubility, expressed as a mass fraction, decreases from approximately 0.1684 to 0.0813 at
293.15 K; 0.1763 to 0.0956 at 298.15 K; 0.2020 to 0.1330 at 308.15 K; and 0.2335 to
0.1526 at 318.15 K. These results show that sulfuric acid might be used as an advantageous
co-solvent in the crystallization processes design of copper sulfate pentahydrate.
The solubility results of the saturated solution may be correlated with the sulfuric acid
composition by the following equation:
𝑠 = 𝐴 + 𝐵 × 𝑤20.5 (1)
where 𝑠 is the solubility in mass fraction, 𝑤2 represents H2SO4 mass fraction, and 𝐴 and
𝐵 are fitting parameters.
3.1.2 Physical properties
Table 2 presents the densities and viscosities of the saturated solutions for the copper
sulfate + seawater + sulfuric acid system.
The values for density and viscosity were correlated as a function of copper sulfate and
sulfuric acid composition following Equations (2) and (3), respectively:
𝜌 = 𝑒𝑥𝑝(𝐴 + 𝐵 × 𝑤10.5 𝑙𝑛 𝑤1 + 𝐶 × 𝑤2
2.5) (2)
𝜂 = 𝑒𝑥𝑝(𝐴 + 𝐵 × 𝑤1 + 𝐶 × 𝑤22.5 + 𝐷 × 𝑤2
2.5 × 𝑤13.5) (3)
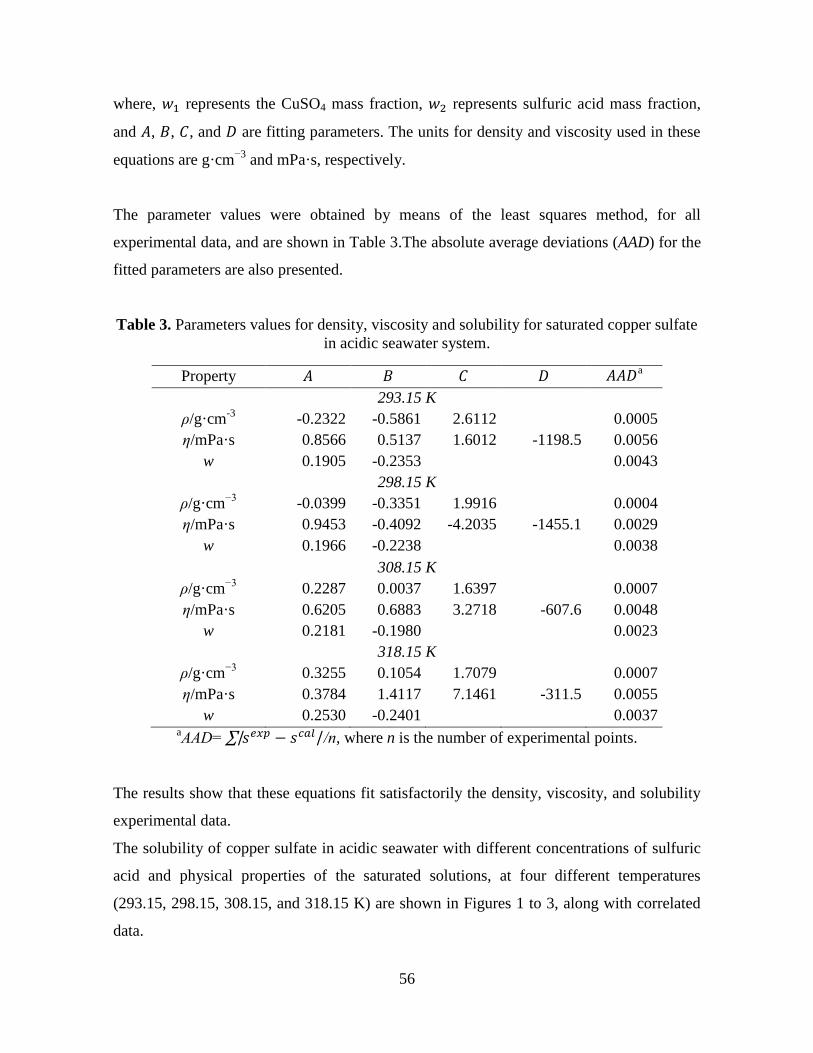
56
where, 𝑤1 represents the CuSO4 mass fraction, 𝑤2 represents sulfuric acid mass fraction,
and 𝐴, 𝐵, 𝐶, and 𝐷 are fitting parameters. The units for density and viscosity used in these
equations are g·cm−3
and mPa·s, respectively.
The parameter values were obtained by means of the least squares method, for all
experimental data, and are shown in Table 3.The absolute average deviations (AAD) for the
fitted parameters are also presented.
Table 3. Parameters values for density, viscosity and solubility for saturated copper sulfate
in acidic seawater system.
Property 𝐴 𝐵 𝐶 𝐷 𝐴𝐴𝐷a
293.15 K
ρ/g·cm-3
-0.2322 -0.5861 2.6112 0.0005
η/mPa·s 0.8566 0.5137 1.6012 -1198.5 0.0056
w 0.1905 -0.2353 0.0043
298.15 K
ρ/g·cm−3
-0.0399 -0.3351 1.9916 0.0004
η/mPa·s 0.9453 -0.4092 -4.2035 -1455.1 0.0029
w 0.1966 -0.2238 0.0038
308.15 K
ρ/g·cm−3
0.2287 0.0037 1.6397 0.0007
η/mPa·s 0.6205 0.6883 3.2718 -607.6 0.0048
w 0.2181 -0.1980 0.0023
318.15 K
ρ/g·cm−3
0.3255 0.1054 1.7079 0.0007
η/mPa·s 0.3784 1.4117 7.1461 -311.5 0.0055
w 0.2530 -0.2401 0.0037 aAAD= ∑|𝑠𝑒𝑥𝑝 − 𝑠𝑐𝑎𝑙| /n, where n is the number of experimental points.
The results show that these equations fit satisfactorily the density, viscosity, and solubility
experimental data.
The solubility of copper sulfate in acidic seawater with different concentrations of sulfuric
acid and physical properties of the saturated solutions, at four different temperatures
(293.15, 298.15, 308.15, and 318.15 K) are shown in Figures 1 to 3, along with correlated
data.
57
Figure 1. Solubility for the saturated solutions (CuSO4 + acid seawater): ■, 293.15; ♦,
298.15 K; ▲, 308.15 K; ●, 318.15 K; ─, correlations with Eq. (1).
It is possible to note that, for all the temperatures, the solubility decreases with increasing
acid concentration. Also, the figure shows that solubility levels increased with temperature;
this is because, as the solution temperature increases, the average kinetic energy of the
molecules that make up the solution also increases. This increase allows the solvent
molecules to break apart the solute molecules more effectively that are held together by
intermolecular attractions.
Figure 2 compares the density of saturated solutions of copper sulfate in acid seawater at
four different temperatures (293.15, 298.15, 308.15, and 318.15 K).
0.07
0.09
0.11
0.13
0.15
0.17
0.19
0.21
0.23
0.25
0 0.05 0.1 0.15 0.2
s (g
/g s
olu
tio
n)
wH2SO4
58
Figure 2. Density for the saturated solutions (CuSO4 + acid seawater): ■, 293.15 K; ♦,
298.15 K; ▲, 308.15 K; ●, 318.15 K; ─, correlations with Eq. (2).
As can be seen, there is a slight decrease in the density of the solutions at low acid
concentrations. However, at a certain point, it begins to increase. This behavior is better
observed at higher temperatures (at low temperatures this decrease is not clear). This
phenomenon could be attributed, at low acid concentrations, to the copper sulfate solubility
decrease, and therefore, the density; however, as the acid concentration increases, the
solution density begins to increase, due to the high density of the sulfuric acid. Figure 2
also shows that the density values increased slightly with temperature.
Figure 3 compares the viscosity of saturated solutions of copper sulfate in acid seawater at
four different temperatures (293.15, 298.15, 308.15, and 318.15 K).
1.21
1.22
1.23
1.24
1.25
1.26
1.27
1.28
1.29
1.3
1.31
0 0.05 0.1 0.15 0.2
𝜌 (
g∙c
m-3
)
wH2SO4
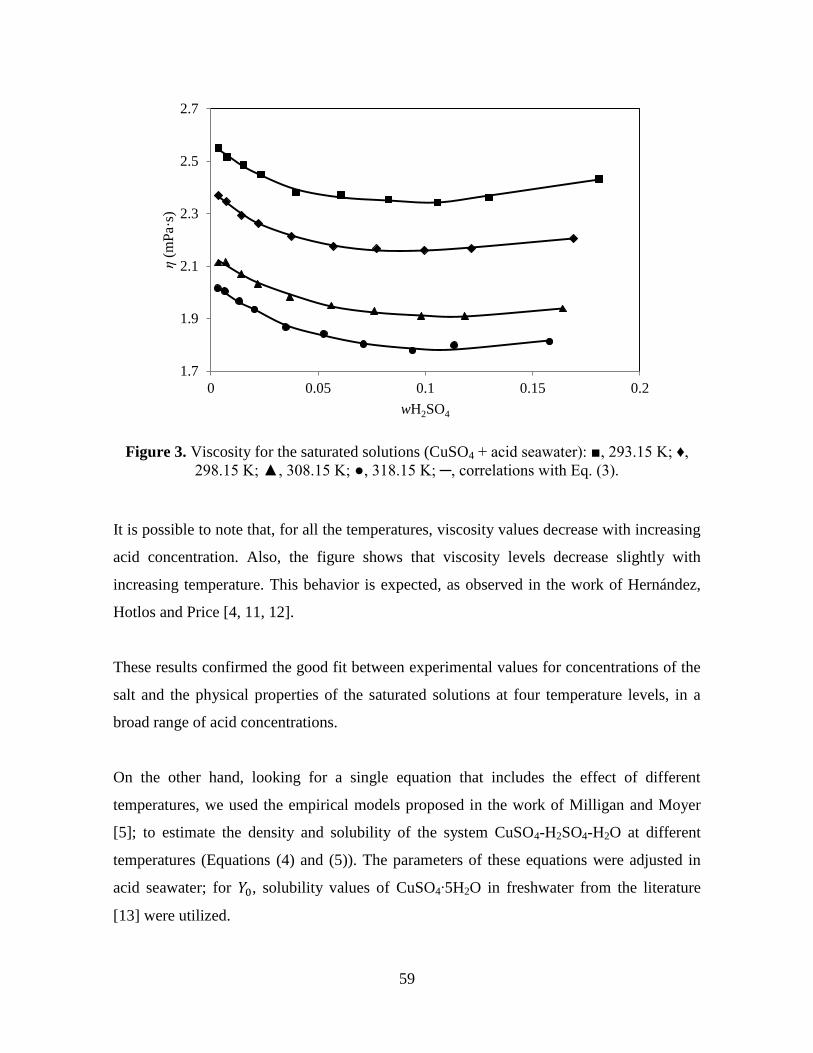
59
Figure 3. Viscosity for the saturated solutions (CuSO4 + acid seawater): ■, 293.15 K; ♦,
298.15 K; ▲, 308.15 K; ●, 318.15 K; ─, correlations with Eq. (3).
It is possible to note that, for all the temperatures, viscosity values decrease with increasing
acid concentration. Also, the figure shows that viscosity levels decrease slightly with
increasing temperature. This behavior is expected, as observed in the work of Hernández,
Hotlos and Price [4, 11, 12].
These results confirmed the good fit between experimental values for concentrations of the
salt and the physical properties of the saturated solutions at four temperature levels, in a
broad range of acid concentrations.
On the other hand, looking for a single equation that includes the effect of different
temperatures, we used the empirical models proposed in the work of Milligan and Moyer
[5]; to estimate the density and solubility of the system CuSO4-H2SO4-H2O at different
temperatures (Equations (4) and (5)). The parameters of these equations were adjusted in
acid seawater; for 𝑌0, solubility values of CuSO4∙5H2O in freshwater from the literature
[13] were utilized.
1.7
1.9
2.1
2.3
2.5
2.7
0 0.05 0.1 0.15 0.2
η (
mP
a·s)
wH2SO4
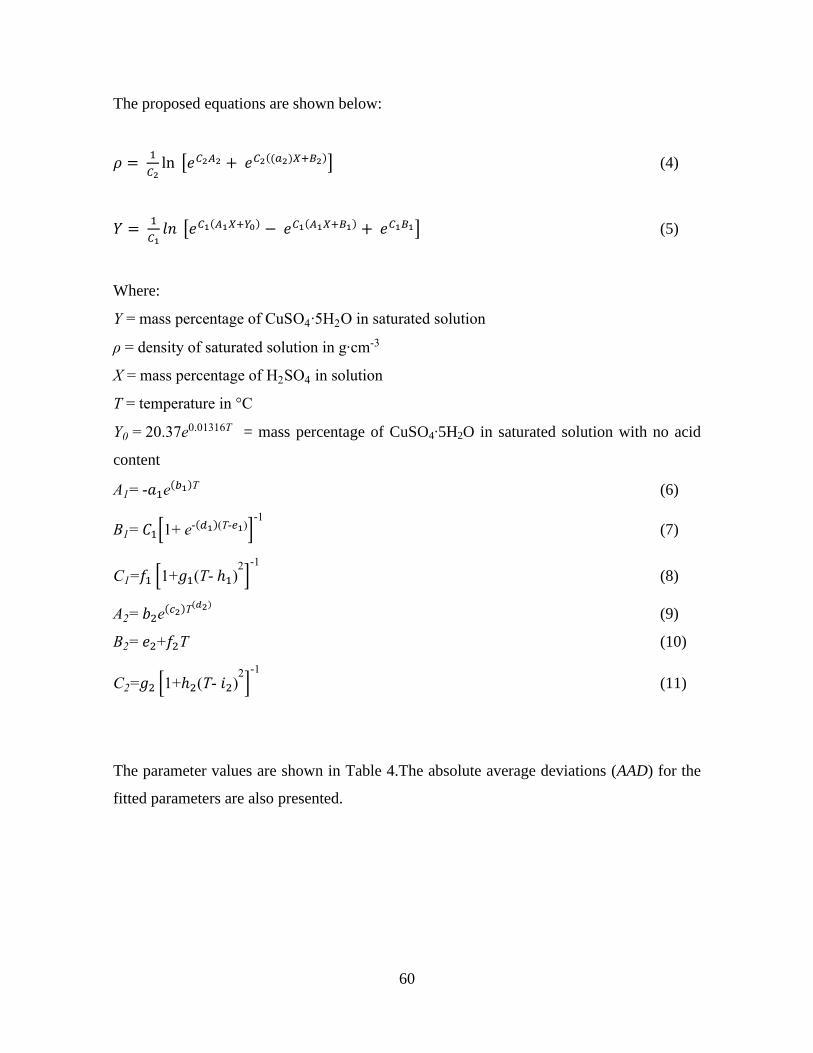
60
The proposed equations are shown below:
𝜌 = 1
𝐶2ln [𝑒𝐶2𝐴2 + 𝑒𝐶2((𝑎2)𝑋+𝐵2)] (4)
𝑌 = 1
𝐶1𝑙𝑛 [𝑒𝐶1(𝐴1𝑋+𝑌0) − 𝑒𝐶1(𝐴1𝑋+𝐵1) + 𝑒𝐶1𝐵1] (5)
Where:
Y = mass percentage of CuSO4∙5H2O in saturated solution
ρ = density of saturated solution in g∙cm-3
X = mass percentage of H2SO4 in solution
T = temperature in °C
Y0 = 20.37e0.01316T = mass percentage of CuSO4∙5H2O in saturated solution with no acid
content
A1= -𝑎1e(𝑏1)T (6)
B1= 𝐶1[1+ e-(𝑑1)(T-𝑒1)]-1
(7)
C1=𝑓1 [1+𝑔1(T- ℎ1)2]
-1
(8)
A2= 𝑏2e(𝑐2)T(𝑑2)
(9)
B2= 𝑒2+𝑓2T (10)
C2=𝑔2 [1+ℎ2(T- 𝑖2)2]
-1
(11)
The parameter values are shown in Table 4.The absolute average deviations (AAD) for the
fitted parameters are also presented.
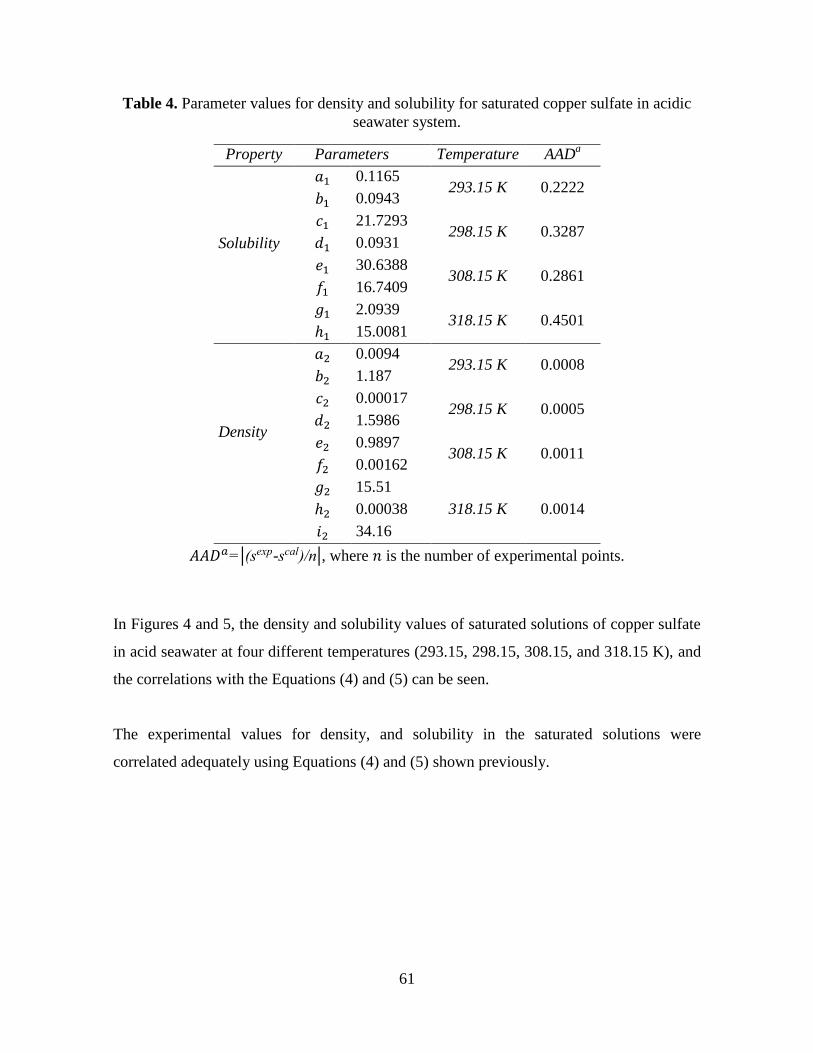
61
Table 4. Parameter values for density and solubility for saturated copper sulfate in acidic
seawater system.
Property Parameters Temperature AADa
Solubility
𝑎1 0.1165 293.15 K 0.2222
𝑏1 0.0943
𝑐1 21.7293 298.15 K 0.3287
𝑑1 0.0931
𝑒1 30.6388 308.15 K 0.2861
𝑓1 16.7409
𝑔1 2.0939 318.15 K 0.4501
ℎ1 15.0081
Density
𝑎2 0.0094 293.15 K 0.0008
𝑏2 1.187
𝑐2 0.00017 298.15 K 0.0005
𝑑2 1.5986
𝑒2 0.9897 308.15 K 0.0011
𝑓2 0.00162
𝑔2 15.51
318.15 K 0.0014 ℎ2 0.00038
𝑖2 34.16
𝐴𝐴𝐷𝑎=|(sexp-scal)/n|, where 𝑛 is the number of experimental points.
In Figures 4 and 5, the density and solubility values of saturated solutions of copper sulfate
in acid seawater at four different temperatures (293.15, 298.15, 308.15, and 318.15 K), and
the correlations with the Equations (4) and (5) can be seen.
The experimental values for density, and solubility in the saturated solutions were
correlated adequately using Equations (4) and (5) shown previously.
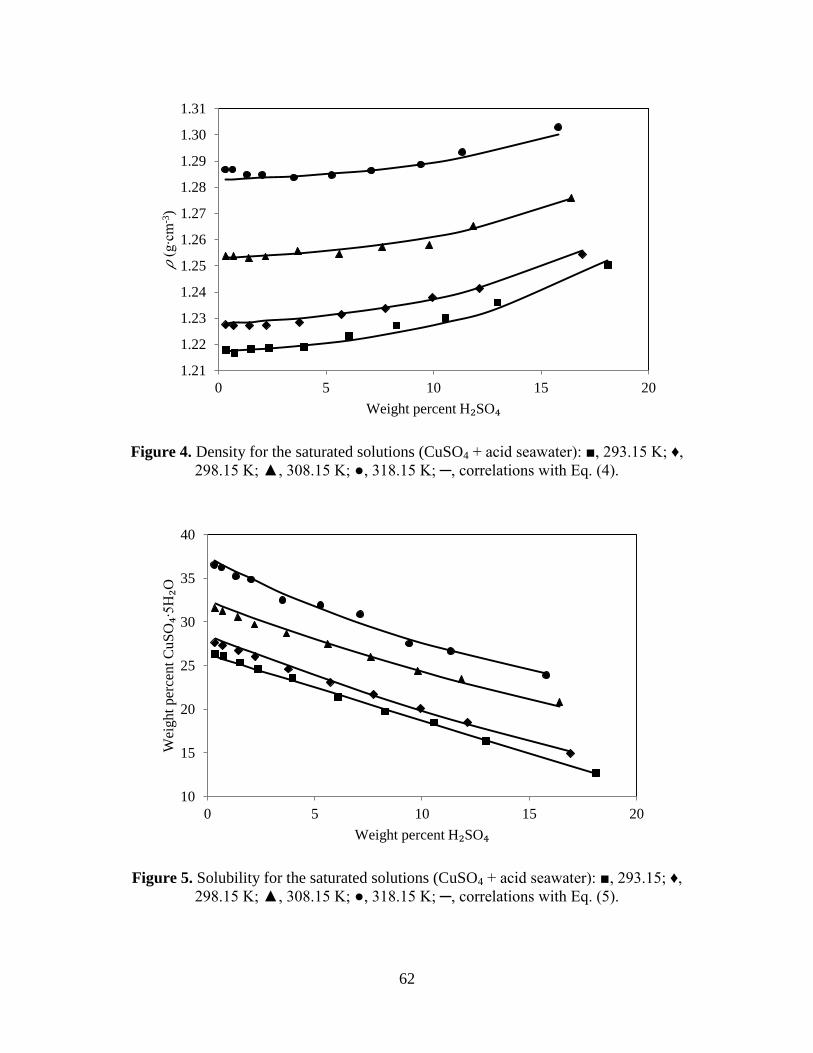
62
Figure 4. Density for the saturated solutions (CuSO4 + acid seawater): ■, 293.15 K; ♦,
298.15 K; ▲, 308.15 K; ●, 318.15 K; ─, correlations with Eq. (4).
Figure 5. Solubility for the saturated solutions (CuSO4 + acid seawater): ■, 293.15; ♦,
298.15 K; ▲, 308.15 K; ●, 318.15 K; ─, correlations with Eq. (5).
1.21
1.22
1.23
1.24
1.25
1.26
1.27
1.28
1.29
1.30
1.31
0 5 10 15 20
𝜌 (
g∙c
m-3
)
Weight percent H₂SO₄
10
15
20
25
30
35
40
0 5 10 15 20
Wei
gh
t per
cent C
uS
O₄∙
5H
₂O
Weight percent H₂SO₄
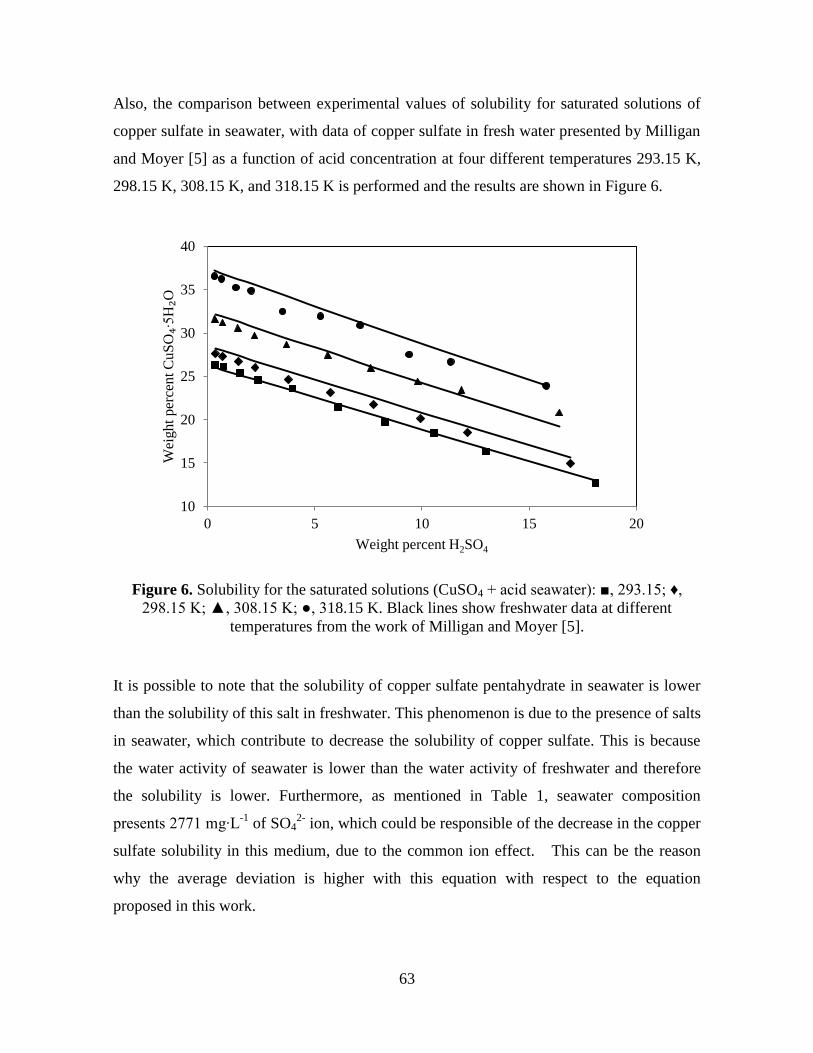
63
Also, the comparison between experimental values of solubility for saturated solutions of
copper sulfate in seawater, with data of copper sulfate in fresh water presented by Milligan
and Moyer [5] as a function of acid concentration at four different temperatures 293.15 K,
298.15 K, 308.15 K, and 318.15 K is performed and the results are shown in Figure 6.
Figure 6. Solubility for the saturated solutions (CuSO4 + acid seawater): ■, 293.15; ♦,
298.15 K; ▲, 308.15 K; ●, 318.15 K. Black lines show freshwater data at different
temperatures from the work of Milligan and Moyer [5].
It is possible to note that the solubility of copper sulfate pentahydrate in seawater is lower
than the solubility of this salt in freshwater. This phenomenon is due to the presence of salts
in seawater, which contribute to decrease the solubility of copper sulfate. This is because
the water activity of seawater is lower than the water activity of freshwater and therefore
the solubility is lower. Furthermore, as mentioned in Table 1, seawater composition
presents 2771 mg∙L-1
of SO42-
ion, which could be responsible of the decrease in the copper
sulfate solubility in this medium, due to the common ion effect. This can be the reason
why the average deviation is higher with this equation with respect to the equation
proposed in this work.
10
15
20
25
30
35
40
0 5 10 15 20
Wei
ght
per
cent C
uS
O₄∙
5H
₂O
Weight percent H2SO4
64
4. CONCLUSIONS
With increasing temperature and acid concentration, an increase is observed in the density
of the solutions, and there is a slight decrease in the density of the solutions at low acid
concentrations.
With increasing acid concentration and temperature, there is a decrease in the solution
viscosity.
With increasing acid concentration, there is a decrease in the solubility; on the other hand,
when the temperature increases, the solubility increases.
The experimental values for density, viscosity, and solubility in the saturated solutions,
were adequately correlated using Equations (1) to (3) proposed in this work, with absolute
average deviations for density, viscosity, and solubility of 0.0005, 0.0056, and, 0.0043,
respectively, at 293.15 K; 0.0004, 0.0029 and, 0.0038, respectively, at 298.15 K; 0.0007,
0.0048, and 0.0023, respectively, at 308.15 K; and 0.0007, 0.0055, and 0.0037,
respectively, at 318.15 K.
The experimental values for density, and solubility in the saturated solutions were
correlated adequately using Equations (4) and (5), with absolute average deviations for
density, and solubility of 0.0008, and 0.2222, respectively, at 293.15 K; 0.0005, and
0.3287, respectively, at 298.15 K; 0.0011, and 0.2861, respectively, at 308.15 K; and
0.0014, and 0.4501, respectively, at 318.15 K.
The solubility of copper sulfate pentahydrate in seawater is lower than the solubility in
freshwater due to the presence of salts in seawater, which contribute to decrease the
solubility of copper sulfate.
ACKNOWLEDEGMENTS: This work was supported by Fondecyt Project 1140169.
Francisca Justel gratefully acknowledges the CONICYT grant.
65
5. REFERENCES
[1] M.A. Torres, G.E. Meruane, T.A. Graber, P.C. Gutiérrez, M.E. Taboada, Recovery of
nitrates from leaching solutions using seawater, Hydrometallurgy, 133 (2013) 100-105.
[2] O.A. Rocha, M. Claros, T.A. Graber, E.K. Flores, M.E. Taboada, Solid–Liquid
Equilibrium and Process Design of CuSO4+ NaCl+(H2O or H2SO4/H2O) Systems at 298.15
K, Industrial & Engineering Chemistry Research, 52 (2013) 6803-6811.
[3] R. Philippe, R. Dixon, S. Dal Pozzo, Seawater supply options for the mining industry,
2nd International Seminar on Geology for the Mining Industry, 2011.
[4] P.a.C. Hernandez, H.c.R. Galleguillos, T.f.A. Graber, E.K. Flores, M.E. Taboada, Effect
of Seawater on the Solubility and Physicochemical Properties of Acidic Copper Sulfate
Solutions, Journal of Chemical & Engineering Data, 57 (2012) 2430-2436.
[5] D. Milligan, H. Moyer, Crystallization in the Copper sulphate - Sulfuric acid - Water
System, ENG MIN J, 176 (1975) 85-89.
[6] D. De Juan, V. Messenguer, L. Lozano, Una contribución al estudio de la solubilidad
del CuSO4∙5H2O en medio acuoso, Revista de metalurgia, 35 (1999) 47-52.
[7] H.W. Richardson, Handbook of copper compounds and applications, CRC Press1997.
[8] F.I. Tabilo Christoforou, Proyecto Anico, (2012).
[9] E. Domic, Hidrometalurgia: Fundamentos, procesos y aplicaciones, Chile. Andros
Impresos, (2001).
[10] L.A. Cisternas, Diagramas de fases y su aplicación, Reverte 2009.
[11] J. Hotlos, M. Jaskuła, Densities and viscosities of CuSO4-H2SO4-H2O solutions,
Hydrometallurgy, 21 (1988) 1-7.
[12] D.C. Price, W.G. Davenport, Densities, electrical conductivities and viscosities of
CuSO4/H2SO4 solutions in the range of modern electrorefining and electrowinning
electrolytes, Metallurgical Transactions B, 11 (1980) 159-163.

66
[13] W. Linke, A. Seidell, Solubilities of Inorganic and Metal-organic Compounds, (1965),
ACS, Washington DC.
67
CHAPTER IV
SOLID–LIQUID EQUILIBRIUM AND COPPER SULFATE CRYSTALLIZATION
PROCESS DESIGN FROM A SULFURIC-ACID–SEAWATER SYSTEM IN THE
TEMPERATURE RANGE FROM 293.15 TO 333.15 K.
Francisca J. Justel, María E. Taboada, Yecid P. Jiménez*
Department of Chemical and Mineral Process Engineering, University of Antofagasta, Av.
Angamos 601, Antofagasta, Chile
ABSTRACT
The objective of this work is to determine experimentally the solubilities and the water
activities for aqueous solutions of copper sulfate in seawater at different temperatures and
to use this information to represent the solid–liquid equilibrium of a copper-sulfate–
sulfuric-acid–seawater system. In a previous work, the experimental solubility data of
copper sulfate in acidic seawater from 293.15 to 318.15 K were obtained experimentally; in
this study, these data were complemented by measuring solubilities at 323.15 and 333.15
K.
The thermodynamic representation of the phase equilibrium is based on a simple
methodology reported in the literature with some modifications, where the Pitzer model and
a Born-type equation were used for modeling the copper sulfate and sulfuric acid effects,
respectively, and the seawater was considered as a solvent.
The amounts of copper sulfate precipitated and the optimum yield as a function of the
sulfuric acid concentration were estimated, giving relevant information for the drowning-
out crystallization process design of copper sulfate using seawater.
Keywords: Solid–liquid equilibrium, Copper sulfate, Sulfuric acid, Seawater.
68
1. INTRODUCTION
Copper mining is the most significant economic activity in the north of Chile. However,
due to the arid conditions in this zone along with water scarcity, mining industries have
required innovative solutions for the optimization of water consumption and have started to
use seawater in their productive processes [1].
Copper sulfate pentahydrate is the most important industrial compound of copper, with a
wide variety of commercial uses [2-4]; it can be crystallized from an acidic solution from
copper leaching by the addition of greater amounts of sulfuric acid, which generates
supersaturation in the aqueous dissolution of the salt [5]. In Chile, some small and medium-
sized mining companies crystallize copper sulfate from hydrometallurgical processes using
freshwater. However, it would be interesting to know the effect of seawater on the
crystallization and on the thermodynamic behavior of copper sulfate pentahydrate. This
information will be useful in the process design to produce copper sulfate pentahydrate
crystals obtained from leaching solutions using seawater by means of the addition of
sulfuric acid.
Thermodynamic properties of copper sulfate (water activities, activity, and osmotic
coefficients) have been reported in the literature by several authors: Wetmore and Gordon
[6] reported the activity coefficients of copper sulfate at different molalities (up to 1 m) and
different temperatures (288.15, 298.15, 308.15, and 318.15 K). Downes and Pitzer [7]
reported the activity and osmotic coefficients of copper sulfate in freshwater at molalities
from 0.1 to 2.0 and at 298.15 K. In this article, the Pitzer equations for 2-2 electrolytes for
the representation of the osmotic and activity coefficients for a salt and the Pitzer
parameters for copper sulfate solutions at 298.15 K were presented. Miller et al. [8]
presented thermodynamic and transport data (diffusion coefficients, electrical
conductances, and osmotic coefficients) for aqueous CuSO4 solutions at 298.15 K from low
concentrations to near saturation, where the osmotic coefficients for CuSO4 at
concentrations from 0.00458 to 0.10355 m were reported. Apelbat [9] reported the water
activities and osmotic coefficients of saturated solutions of copper sulfate in freshwater at
six different temperatures (from 283.15 to 308.15 K). Later, Gendouzi et al. [10] reported
the water activities, osmotic coefficients, and activity coefficients values of copper sulfate
69
in freshwater at 298.15 K at different molalities (from 0.2 to 1.4 m). Furthermore, the Pitzer
parameters for copper sulfate at 298.15 K were also reported. Yang et al. [11] reported the
water activities and osmotic coefficients of the binary systems MSO4 + H2O (M = Mn, Co,
Ni, Cu, and Zn) at 323.15 K from isopiestic measurements. For copper sulfate, the values
reported are in the range of concentrations of 0.1289 to 2.0560 m.
In a previous work, [12] solubility, density, and viscosity values for saturated solutions of a
copper-sulfate–sulfuric-acid–seawater system at four different temperatures (from 293.15
to 318.15 K) were reported.
The objective of the present work is to determine the saturation concentrations and water
activities of copper sulfate in seawater at different concentrations and temperatures (from
293.15 to 323.15 K). All this information was used to represent the solid–liquid equilibrium
of the copper-sulfate–sulfuric-acid–seawater system by the model proposed in this work,
which is based on a variation of the methodology of Kan et al. [13, 14].
Kan’s methodology uses the Pitzer model to quantify the effect of a salt, whereas a similar
equation to the Born model is used to quantify the cosolvent effect. The present work
proposes a variation of this method where the Pitzer model is used to represent the copper
sulfate effect and the Born model is used to represent the sulfuric acid effect, instead of a
cosolvent. Moreover, it is important to mention that in the Pitzer model, seawater is the
solvent and the seawater ions are not considered separately.
Additionally, the amounts of precipitated salt and the maximum yield from the CuSO4–
H2SO4–seawater system at different temperatures in function of the sulfuric acid
concentration were predicted. This information will be useful in the process design to
obtain copper sulfate pentahydrate crystals using seawater by applying a simple
methodology.
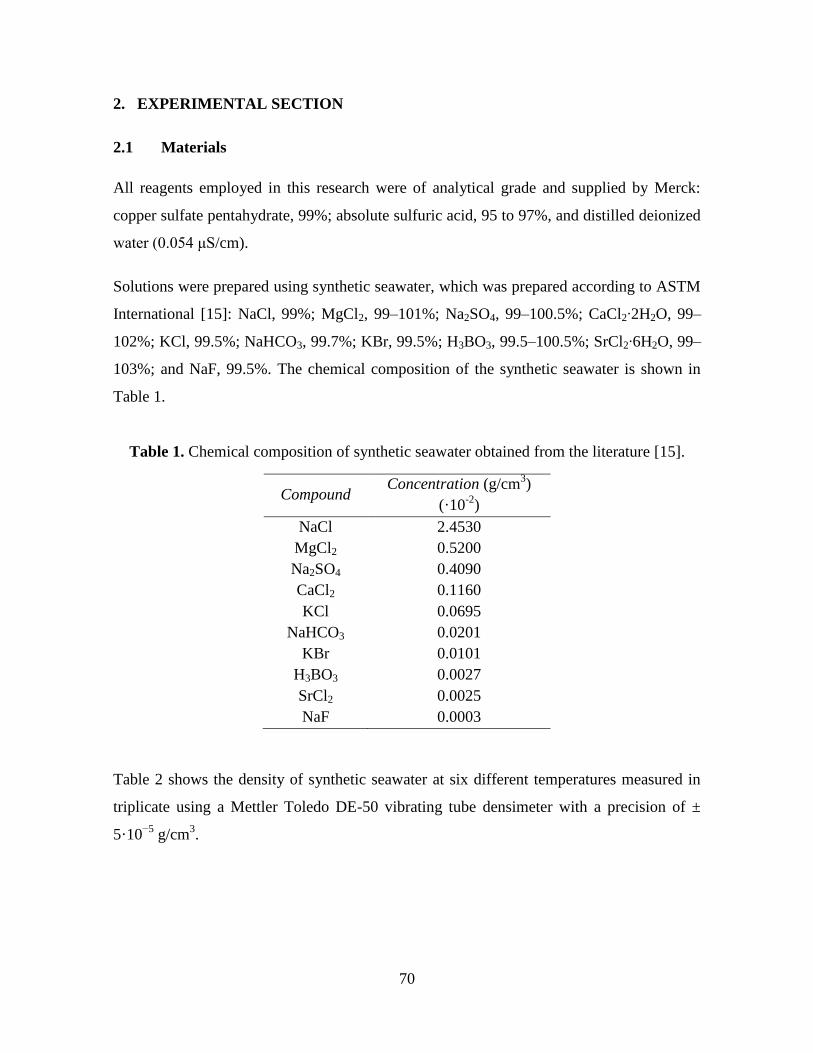
70
2. EXPERIMENTAL SECTION
2.1 Materials
All reagents employed in this research were of analytical grade and supplied by Merck:
copper sulfate pentahydrate, 99%; absolute sulfuric acid, 95 to 97%, and distilled deionized
water (0.054 μS/cm).
Solutions were prepared using synthetic seawater, which was prepared according to ASTM
International [15]: NaCl, 99%; MgCl2, 99–101%; Na2SO4, 99–100.5%; CaCl2∙2H2O, 99–
102%; KCl, 99.5%; NaHCO3, 99.7%; KBr, 99.5%; H3BO3, 99.5–100.5%; SrCl2∙6H2O, 99–
103%; and NaF, 99.5%. The chemical composition of the synthetic seawater is shown in
Table 1.
Table 1. Chemical composition of synthetic seawater obtained from the literature [15].
Compound Concentration (g/cm
3)
(·10-2
)
NaCl 2.4530
MgCl2 0.5200
Na2SO4 0.4090
CaCl2 0.1160
KCl 0.0695
NaHCO3 0.0201
KBr 0.0101
H3BO3 0.0027
SrCl2 0.0025
NaF 0.0003
Table 2 shows the density of synthetic seawater at six different temperatures measured in
triplicate using a Mettler Toledo DE-50 vibrating tube densimeter with a precision of ±
5·10−5
g/cm3.
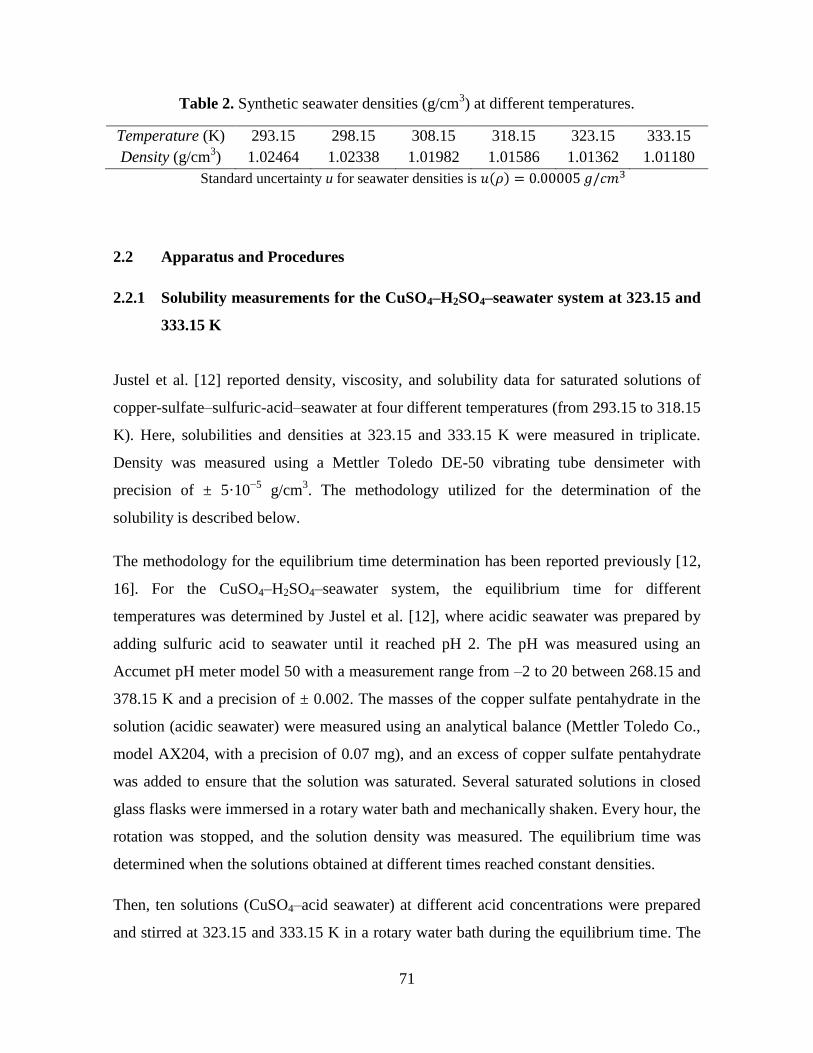
71
Table 2. Synthetic seawater densities (g/cm3) at different temperatures.
Temperature (K) 293.15 298.15 308.15 318.15 323.15 333.15
Density (g/cm3) 1.02464 1.02338 1.01982 1.01586 1.01362 1.01180
Standard uncertainty u for seawater densities is 𝑢(𝜌) = 0.00005 𝑔/𝑐𝑚3
2.2 Apparatus and Procedures
2.2.1 Solubility measurements for the CuSO4–H2SO4–seawater system at 323.15 and
333.15 K
Justel et al. [12] reported density, viscosity, and solubility data for saturated solutions of
copper-sulfate–sulfuric-acid–seawater at four different temperatures (from 293.15 to 318.15
K). Here, solubilities and densities at 323.15 and 333.15 K were measured in triplicate.
Density was measured using a Mettler Toledo DE-50 vibrating tube densimeter with
precision of ± 5·10−5
g/cm3. The methodology utilized for the determination of the
solubility is described below.
The methodology for the equilibrium time determination has been reported previously [12,
16]. For the CuSO4–H2SO4–seawater system, the equilibrium time for different
temperatures was determined by Justel et al. [12], where acidic seawater was prepared by
adding sulfuric acid to seawater until it reached pH 2. The pH was measured using an
Accumet pH meter model 50 with a measurement range from –2 to 20 between 268.15 and
378.15 K and a precision of ± 0.002. The masses of the copper sulfate pentahydrate in the
solution (acidic seawater) were measured using an analytical balance (Mettler Toledo Co.,
model AX204, with a precision of 0.07 mg), and an excess of copper sulfate pentahydrate
was added to ensure that the solution was saturated. Several saturated solutions in closed
glass flasks were immersed in a rotary water bath and mechanically shaken. Every hour, the
rotation was stopped, and the solution density was measured. The equilibrium time was
determined when the solutions obtained at different times reached constant densities.
Then, ten solutions (CuSO4–acid seawater) at different acid concentrations were prepared
and stirred at 323.15 and 333.15 K in a rotary water bath during the equilibrium time. The
72
rotation was then stopped, and the solutions were decanted. In the thermostatic bath, using
a syringe filter, solutions (without solid) were obtained for each equilibrium point. The
copper (II) concentration was measured in triplicate by atomic absorption, and the CuSO4
solubility was obtained by stoichiometry; density was measured in triplicate for each
solution. Solids were kept for further analysis.
2.2.2 X-ray diffraction and thermogravimetric analysis of copper sulfate crystals
To analyze the composition of the crystals obtained in seawater medium at different
temperatures, the same procedure as described above was used, and crystals obtained at
working temperatures of 293.15, 308.15, and 323.15 K were recovered. The crystals
remaining after decantation were dried and analyzed by powder X-ray diffraction (XRD)
using an automatic, computerized X-ray diffractometer (Siemens Co., model D5000), Cu
Kα radiation with a wavelength of 1.5406 Å, and a voltage of 40 kV.
To confirm the XRD results, crystals obtained at 308.15 K (intermediate temperature) were
subjected to thermogravimetric analysis (TGA). Thermal assays were conducted with a
Mettler Toledo Thermogravimetric Analyzer TGA/DSC1, STARe system. The crucibles
used in the TGA instrument were made of platinum and were hermetically sealed. The test
was conducted in a flowing inert nitrogen atmosphere (50 ml/min) at a heating rate of
283.15 K/min. The equipment was calibrated with indium, and the sample mass was 10 mg.
The temperature range used in the experiment was from 298.15 to 573.15 K.
2.2.3 Water activity measurements of CuSO4 in seawater at different temperatures
Water activities were measured using a Novasina Corp. model AW-Center 500 electronic
hydrometer. The hydrometer was calibrated before making each set of measurements by
using standard salt solutions supplied by the manufacturer. This instrument works in the
temperature range from 273.15 to 323.15 K, so the measurements of the activities of
copper-sulfate–seawater solutions were performed in duplicate from 293.15 to 323.15 K. At
each temperature, solutions at six different concentrations of copper sulfate were measured.
73
With the objective of improving the accuracy, calibration curves using sodium sulfate
aqueous solutions were developed at each working temperature (293.15, 298.15, 308.15,
318.15, and 323.15 K). For each temperature, at least five sodium sulfate solutions were
prepared at different molalities, and the obtained data were compared and fitted to the
values reported by Holmes and Mesmer [17] obtaining calibration curves at each
temperature. Using these calibration curves for the water activities, the Pitzer parameters
𝛽(0), 𝛽(1), 𝛽(2), and 𝐶∅ for copper sulfate in synthetic seawater from 293.15 to 323.15 K
were determined.
It is important to mention that in the present work, the solutions were prepared using
synthetic seawater (Table 1) elaborated under ASTM International standards [15], which
makes reproducible all the parameters determined in the present work.
3. THERMODYNAMIC FRAMEWORK
According to Gendouzi et al. [10], using the experimental data of the water activities as a
function of molality, it is possible to determine the osmotic coefficients (∅) for each
solution using Equation (1):
∅ = −(1000 𝑣𝑚𝑀⁄ ) ln 𝑎𝑤 (1)
where 𝑣 is the number of ions released by dissociation, 𝑚 the molality, 𝑀 the molar mass,
and 𝑎𝑤 the water activity.
On the other hand, a simple method based on a variation of Kan’s methodology [13, 14] to
correlate copper sulfate solubilities in acidic seawater is proposed.
Accordingly, the activity coefficients due to the copper sulfate effect 𝛾 ±𝑆 𝐶𝑢𝑆𝑂4 were
determined by the Pitzer model [18], where for 2-2 electrolytes, the mean activity ionic
coefficients are given by the following expression:
ln 𝛾± = 4𝑓𝛾 + 𝑚𝐵𝛾 + 𝑚2𝐶𝛾 (2)
74
where:
𝑓𝛾 = −𝐴∅[𝐼1 2⁄ (1 + 𝑏𝐼1 2⁄ )⁄ + 2 𝑏⁄ ln(1 + 𝑏𝐼1 2⁄ )] (3)
𝐵𝛾 = 2𝛽(0) + (2𝛽(1) 𝛼12𝐼⁄ ) [1 − (1 + 𝛼1𝐼1 2⁄ − 1 2⁄ 𝛼1
2𝐼)𝑒𝑥𝑝−𝛼1𝐼1 2⁄] + (2𝛽(2) 𝛼2
2𝐼⁄ ) [1 −
(1 + 𝛼2𝐼1 2⁄ − 1 2⁄ 𝛼22𝐼)𝑒𝑥𝑝−𝛼2𝐼1 2⁄
] (4)
𝐶𝛾 = 3 2⁄ 𝐶∅ (5)
In these equations, m and I correspond to the molality and ionic strength, respectively. The
symbols 𝛽(0), 𝛽(1), 𝛽(2), and 𝐶∅ are solute specific parameters, and the parameters 𝛼1 , 𝛼2,
and b are constant, with values of 1.4, 12, and 1.2 Kg1/2
·mol-1/2
, respectively. Pitzer and
Mayorga [18], have reported that the values of 𝛽(2) and 𝛼2 reproduce the anomalous
behavior of 2-2 electrolytes, where have been demonstrated that these values fitted all cases
very well and were adopted for all 2-2 electrolytes.
In Equation (3), the function 𝑓𝛾 includes the Debye-Hückel term (𝐴∅) represented by the
following expression [19]:
𝐴∅ = 1 3⁄ √2 ∙ 𝜋 ∙ 𝜌 ∙ 𝑁0[𝑒2 4 ∙ 𝜋 ∙ 𝐸𝑜 ∙ 𝜀 ∙ 𝑘 ∙ 𝑇⁄ ]3 2⁄ (6)
where ρ corresponds to the density of seawater (Kg/m3), N0 to the Avogadro number
(6.022045∙1023
), 𝑘 to the Boltzmann constant (1.38066∙10-23
), e to the electron charge
(1.6022∙10-19
), E0 to the permittivity of vacuum (8.85418∙10-12
), Ɛ to the dielectric constant
of seawater, and T to the temperature in K. The values of the dielectric constant (Ɛ) of
seawater at different temperatures were obtained by the method of Hernández-Walls using
the equations reported by Stogryn [20]. Here 𝐴∅ is calculated considering the seawater as
solvent.
75
The solubility product (𝐾𝑠𝑝) of a hydrated salt is a value obtained from the solubility
(concentration), the water activity, and activity coefficient values of copper sulfate in
seawater (without acid). These last two were calculated using the Pitzer model through the
Equations (1) and (2), respectively. The 𝐾𝑠𝑝values at different temperatures were
determined by the following expression [21]:
𝐾𝑠𝑝𝐶𝑢𝑆𝑂4∙5𝐻2𝑂 = (𝑚𝐶𝑢𝑆𝑂4
)2
(𝛾 ±𝑆 𝐶𝑢𝑆𝑂4 )
2(𝑎𝑤)5 (7)
On the other hand, the sulfuric acid effect 𝛾 ±𝑁 𝐶𝑢𝑆𝑂4 is represented by an empirical equation
similar to the Born expression of the type:
𝛾 ±𝑁 𝐶𝑢𝑆𝑂4 = 10(𝑎+𝑏 𝑇(𝐾)⁄ +𝑐𝐼) 𝑥𝐻2𝑆𝑂4+𝑑𝑥2
𝐻2𝑆𝑂4 (8)
where a, b, c, and d are fitting parameters and 𝑥𝐻2𝑆𝑂4 and 𝐼 represent the mole fraction of
sulfuric acid in the H2O–H2SO4 mixture and the ionic strength, respectively.
From Equation (7), the copper sulfate saturation molality in the ternary CuSO4–H2SO4–
seawater system (𝑚𝑇) is obtained by:
𝑚𝑇 = [(𝐾𝑠𝑝𝐶𝑢𝑆𝑂4∙ 5𝐻2𝑂)
𝐵((𝛾
±𝑆 𝐶𝑢𝑆𝑂4)2 × (𝛾
±𝑁 𝐶𝑢𝑆𝑂4)2 × 𝑎𝑤
5 )𝑇
⁄ ]1 2⁄
(9)
where the subscripts B and T represent the binary (CuSO4–H2O) and ternary (CuSO4–
H2SO4–H2O) systems, respectively.
Experimental data of the solubilities of the copper-sulfate–sulfuric-acid–seawater system at
five different temperatures were correlated, minimizing the following objective function:
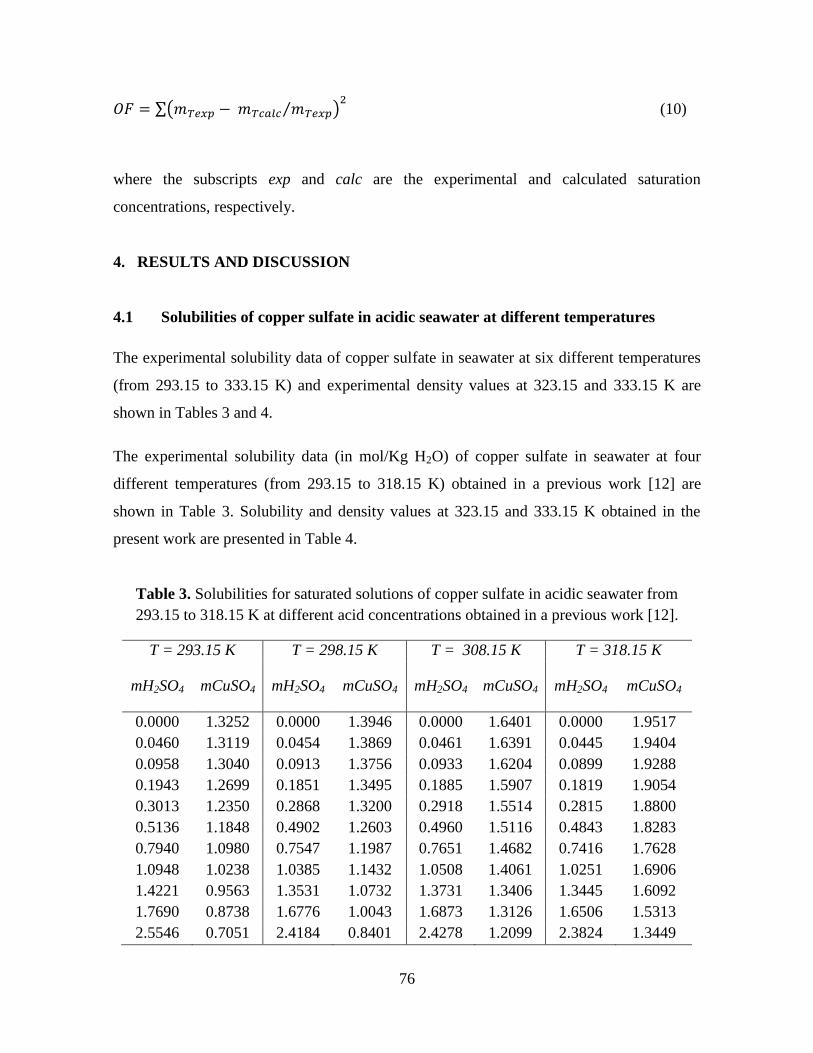
76
𝑂𝐹 = ∑(𝑚𝑇𝑒𝑥𝑝 − 𝑚𝑇𝑐𝑎𝑙𝑐 𝑚𝑇𝑒𝑥𝑝⁄ )2
(10)
where the subscripts exp and calc are the experimental and calculated saturation
concentrations, respectively.
4. RESULTS AND DISCUSSION
4.1 Solubilities of copper sulfate in acidic seawater at different temperatures
The experimental solubility data of copper sulfate in seawater at six different temperatures
(from 293.15 to 333.15 K) and experimental density values at 323.15 and 333.15 K are
shown in Tables 3 and 4.
The experimental solubility data (in mol/Kg H2O) of copper sulfate in seawater at four
different temperatures (from 293.15 to 318.15 K) obtained in a previous work [12] are
shown in Table 3. Solubility and density values at 323.15 and 333.15 K obtained in the
present work are presented in Table 4.
Table 3. Solubilities for saturated solutions of copper sulfate in acidic seawater from
293.15 to 318.15 K at different acid concentrations obtained in a previous work [12].
T = 293.15 K T = 298.15 K T = 308.15 K T = 318.15 K
mH2SO4 mCuSO4 mH2SO4 mCuSO4 mH2SO4 mCuSO4 mH2SO4 mCuSO4
0.0000 1.3252 0.0000 1.3946 0.0000 1.6401 0.0000 1.9517
0.0460 1.3119 0.0454 1.3869 0.0461 1.6391 0.0445 1.9404
0.0958 1.3040 0.0913 1.3756 0.0933 1.6204 0.0899 1.9288
0.1943 1.2699 0.1851 1.3495 0.1885 1.5907 0.1819 1.9054
0.3013 1.2350 0.2868 1.3200 0.2918 1.5514 0.2815 1.8800
0.5136 1.1848 0.4902 1.2603 0.4960 1.5116 0.4843 1.8283
0.7940 1.0980 0.7547 1.1987 0.7651 1.4682 0.7416 1.7628
1.0948 1.0238 1.0385 1.1432 1.0508 1.4061 1.0251 1.6906
1.4221 0.9563 1.3531 1.0732 1.3731 1.3406 1.3445 1.6092
1.7690 0.8738 1.6776 1.0043 1.6873 1.3126 1.6506 1.5313
2.5546 0.7051 2.4184 0.8401 2.4278 1.2099 2.3824 1.3449
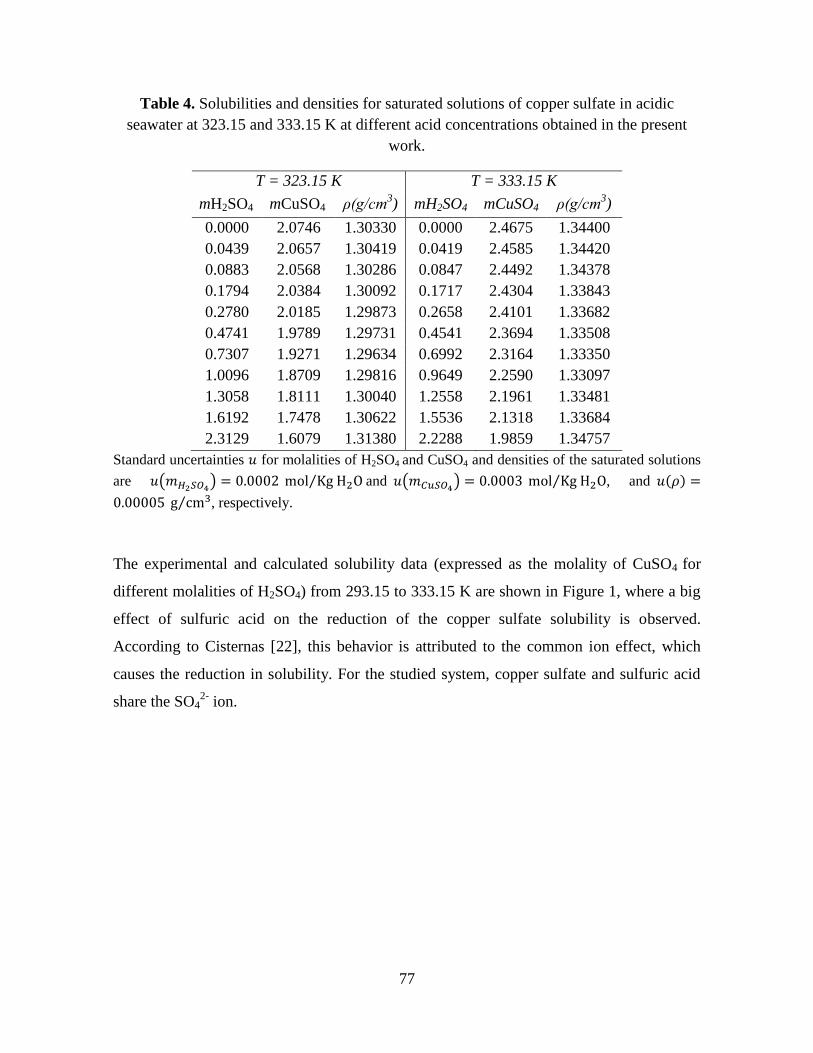
77
Table 4. Solubilities and densities for saturated solutions of copper sulfate in acidic
seawater at 323.15 and 333.15 K at different acid concentrations obtained in the present
work.
T = 323.15 K T = 333.15 K
mH2SO4 mCuSO4 ρ(g/cm3) mH2SO4 mCuSO4 ρ(g/cm
3)
0.0000 2.0746 1.30330 0.0000 2.4675 1.34400
0.0439 2.0657 1.30419 0.0419 2.4585 1.34420
0.0883 2.0568 1.30286 0.0847 2.4492 1.34378
0.1794 2.0384 1.30092 0.1717 2.4304 1.33843
0.2780 2.0185 1.29873 0.2658 2.4101 1.33682
0.4741 1.9789 1.29731 0.4541 2.3694 1.33508
0.7307 1.9271 1.29634 0.6992 2.3164 1.33350
1.0096 1.8709 1.29816 0.9649 2.2590 1.33097
1.3058 1.8111 1.30040 1.2558 2.1961 1.33481
1.6192 1.7478 1.30622 1.5536 2.1318 1.33684
2.3129 1.6079 1.31380 2.2288 1.9859 1.34757
Standard uncertainties 𝑢 for molalities of H2SO4 and CuSO4 and densities of the saturated solutions
are 𝑢(𝑚𝐻2𝑆𝑂4) = 0.0002 mol Kg H2O⁄ and 𝑢(𝑚𝐶𝑢𝑆𝑂4
) = 0.0003 mol Kg H2O⁄ , and 𝑢(𝜌) =
0.00005 g cm3⁄ , respectively.
The experimental and calculated solubility data (expressed as the molality of CuSO4 for
different molalities of H2SO4) from 293.15 to 333.15 K are shown in Figure 1, where a big
effect of sulfuric acid on the reduction of the copper sulfate solubility is observed.
According to Cisternas [22], this behavior is attributed to the common ion effect, which
causes the reduction in solubility. For the studied system, copper sulfate and sulfuric acid
share the SO42-
ion.
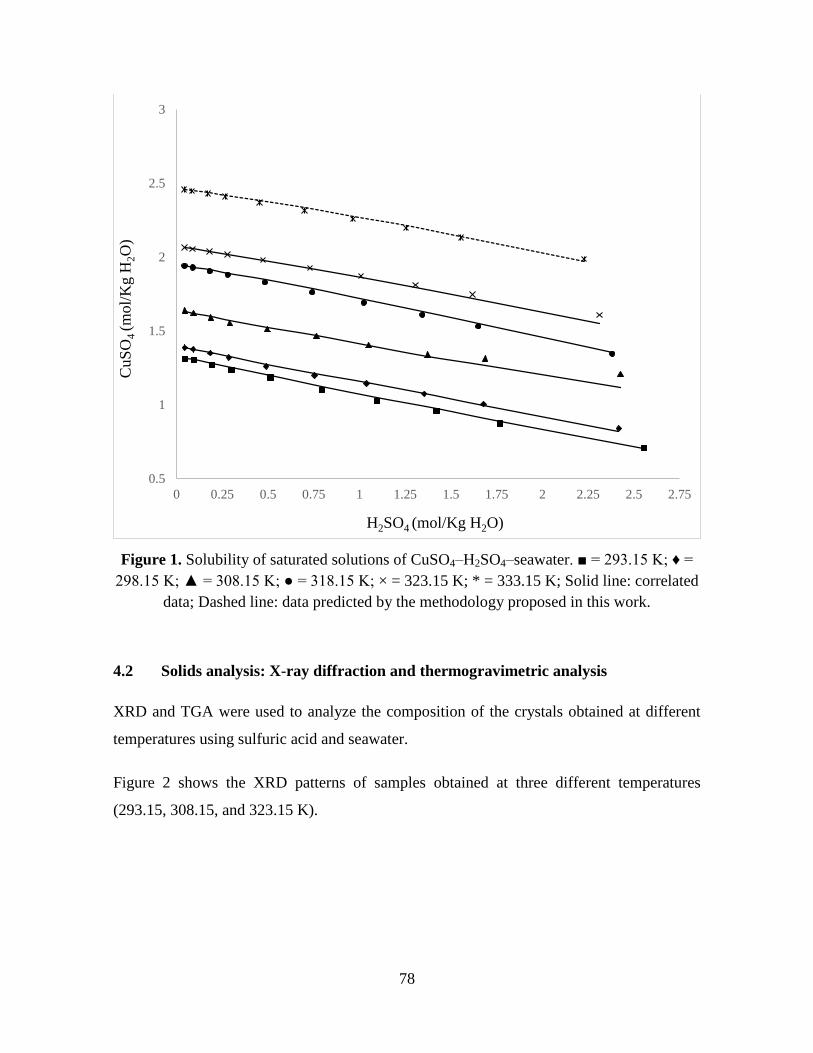
78
Figure 1. Solubility of saturated solutions of CuSO4–H2SO4–seawater. ■ = 293.15 K; ♦ =
298.15 K; ▲ = 308.15 K; ● = 318.15 K; × = 323.15 K; * = 333.15 K; Solid line: correlated
data; Dashed line: data predicted by the methodology proposed in this work.
4.2 Solids analysis: X-ray diffraction and thermogravimetric analysis
XRD and TGA were used to analyze the composition of the crystals obtained at different
temperatures using sulfuric acid and seawater.
Figure 2 shows the XRD patterns of samples obtained at three different temperatures
(293.15, 308.15, and 323.15 K).
0.5
1
1.5
2
2.5
3
0 0.25 0.5 0.75 1 1.25 1.5 1.75 2 2.25 2.5 2.75
CuS
O4
(m
ol/
Kg H
2O
)
H2SO4 (mol/Kg H2O)
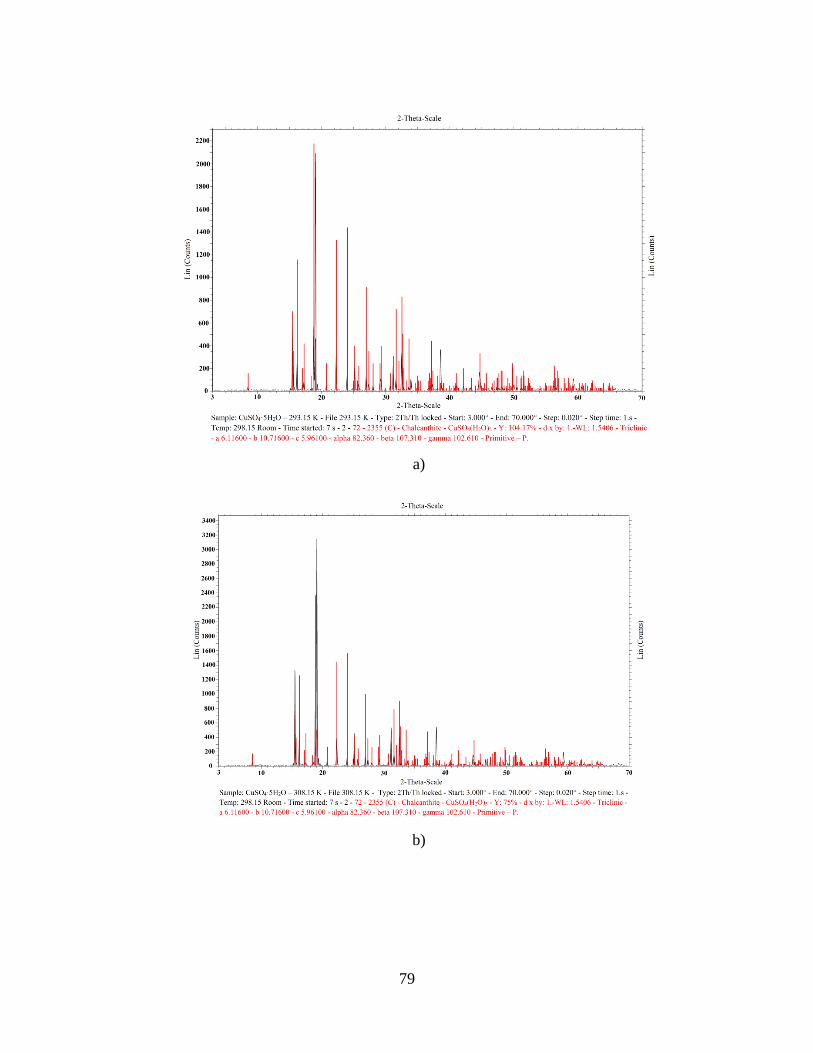
79
a)
b)
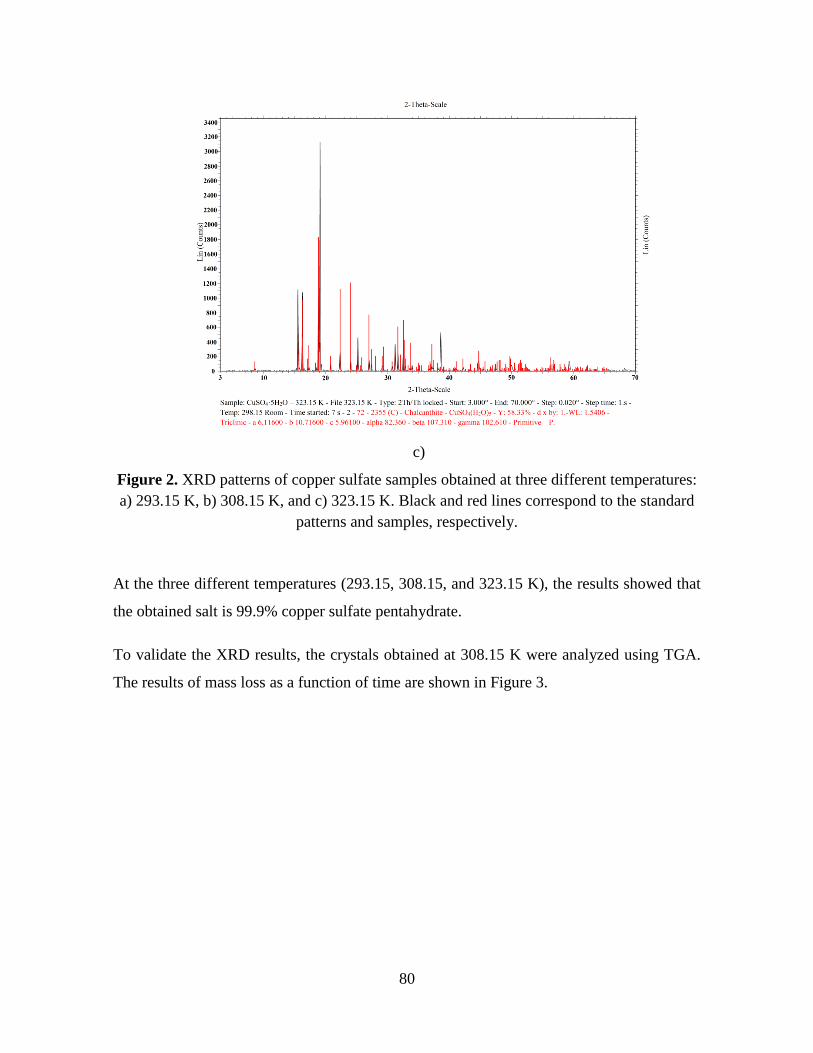
80
c)
Figure 2. XRD patterns of copper sulfate samples obtained at three different temperatures:
a) 293.15 K, b) 308.15 K, and c) 323.15 K. Black and red lines correspond to the standard
patterns and samples, respectively.
At the three different temperatures (293.15, 308.15, and 323.15 K), the results showed that
the obtained salt is 99.9% copper sulfate pentahydrate.
To validate the XRD results, the crystals obtained at 308.15 K were analyzed using TGA.
The results of mass loss as a function of time are shown in Figure 3.
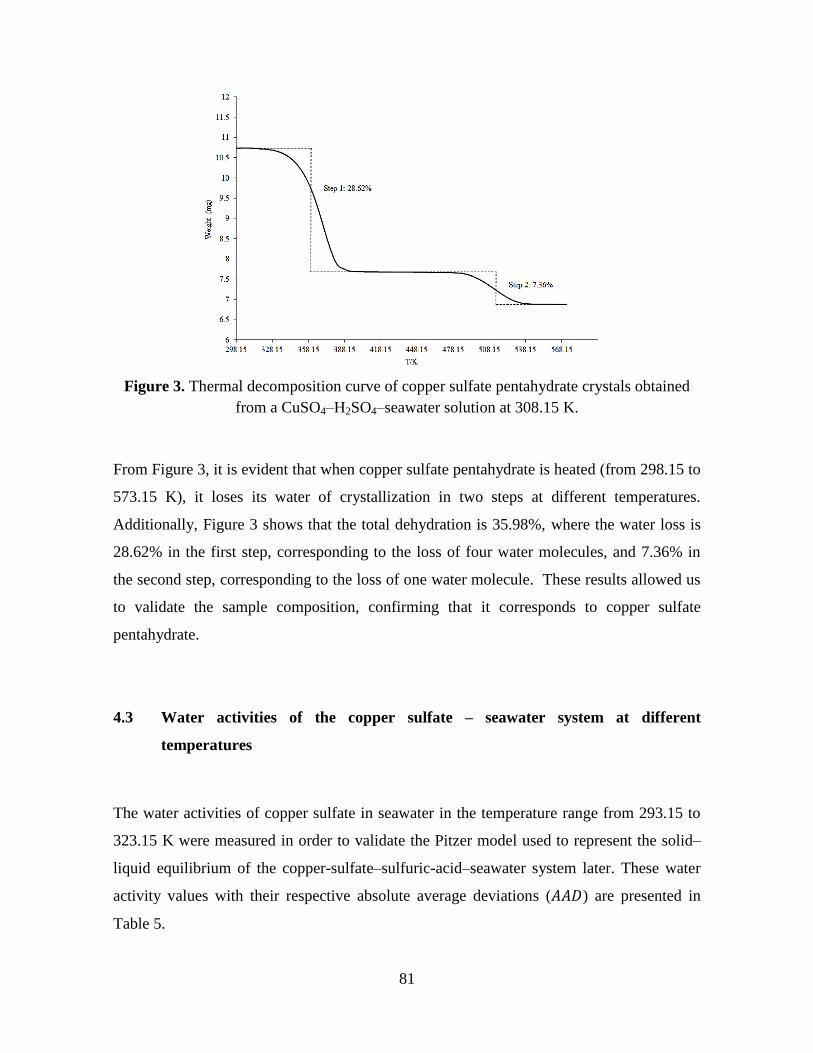
81
Figure 3. Thermal decomposition curve of copper sulfate pentahydrate crystals obtained
from a CuSO4–H2SO4–seawater solution at 308.15 K.
From Figure 3, it is evident that when copper sulfate pentahydrate is heated (from 298.15 to
573.15 K), it loses its water of crystallization in two steps at different temperatures.
Additionally, Figure 3 shows that the total dehydration is 35.98%, where the water loss is
28.62% in the first step, corresponding to the loss of four water molecules, and 7.36% in
the second step, corresponding to the loss of one water molecule. These results allowed us
to validate the sample composition, confirming that it corresponds to copper sulfate
pentahydrate.
4.3 Water activities of the copper sulfate – seawater system at different
temperatures
The water activities of copper sulfate in seawater in the temperature range from 293.15 to
323.15 K were measured in order to validate the Pitzer model used to represent the solid–
liquid equilibrium of the copper-sulfate–sulfuric-acid–seawater system later. These water
activity values with their respective absolute average deviations (𝐴𝐴𝐷) are presented in
Table 5.
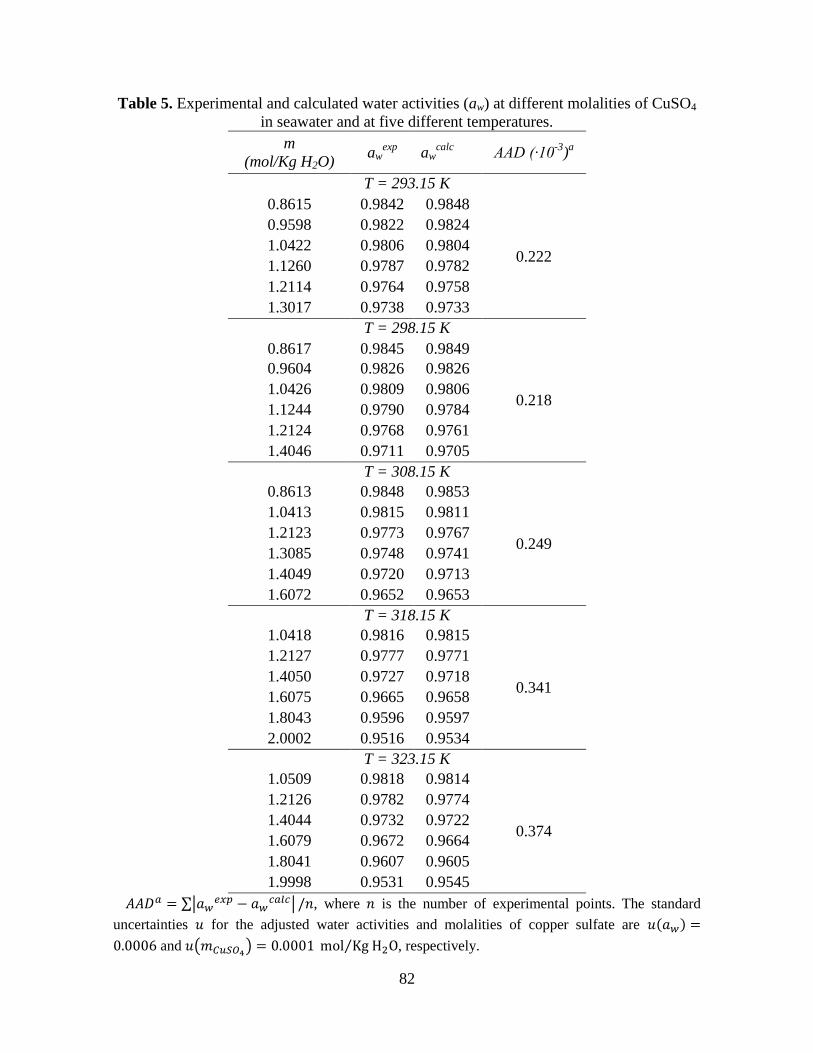
82
Table 5. Experimental and calculated water activities (aw) at different molalities of CuSO4
in seawater and at five different temperatures.
m
(mol/Kg H2O) aw
exp aw
calc AAD (∙10
-3)a
T = 293.15 K
0.8615 0.9842 0.9848
0.222
0.9598 0.9822 0.9824
1.0422 0.9806 0.9804
1.1260 0.9787 0.9782
1.2114 0.9764 0.9758
1.3017 0.9738 0.9733
T = 298.15 K
0.8617 0.9845 0.9849
0.218
0.9604 0.9826 0.9826
1.0426 0.9809 0.9806
1.1244 0.9790 0.9784
1.2124 0.9768 0.9761
1.4046 0.9711 0.9705
T = 308.15 K
0.8613 0.9848 0.9853
0.249
1.0413 0.9815 0.9811
1.2123 0.9773 0.9767
1.3085 0.9748 0.9741
1.4049 0.9720 0.9713
1.6072 0.9652 0.9653
T = 318.15 K
1.0418 0.9816 0.9815
0.341
1.2127 0.9777 0.9771
1.4050 0.9727 0.9718
1.6075 0.9665 0.9658
1.8043 0.9596 0.9597
2.0002 0.9516 0.9534
T = 323.15 K
1.0509 0.9818 0.9814
0.374
1.2126 0.9782 0.9774
1.4044 0.9732 0.9722
1.6079 0.9672 0.9664
1.8041 0.9607 0.9605
1.9998 0.9531 0.9545
𝐴𝐴𝐷𝑎 = ∑|𝑎𝑤𝑒𝑥𝑝 − 𝑎𝑤
𝑐𝑎𝑙𝑐| /𝑛, where 𝑛 is the number of experimental points. The standard
uncertainties 𝑢 for the adjusted water activities and molalities of copper sulfate are 𝑢(𝑎𝑤) =
0.0006 and 𝑢(𝑚𝐶𝑢𝑆𝑂4) = 0.0001 mol Kg H2O⁄ , respectively.
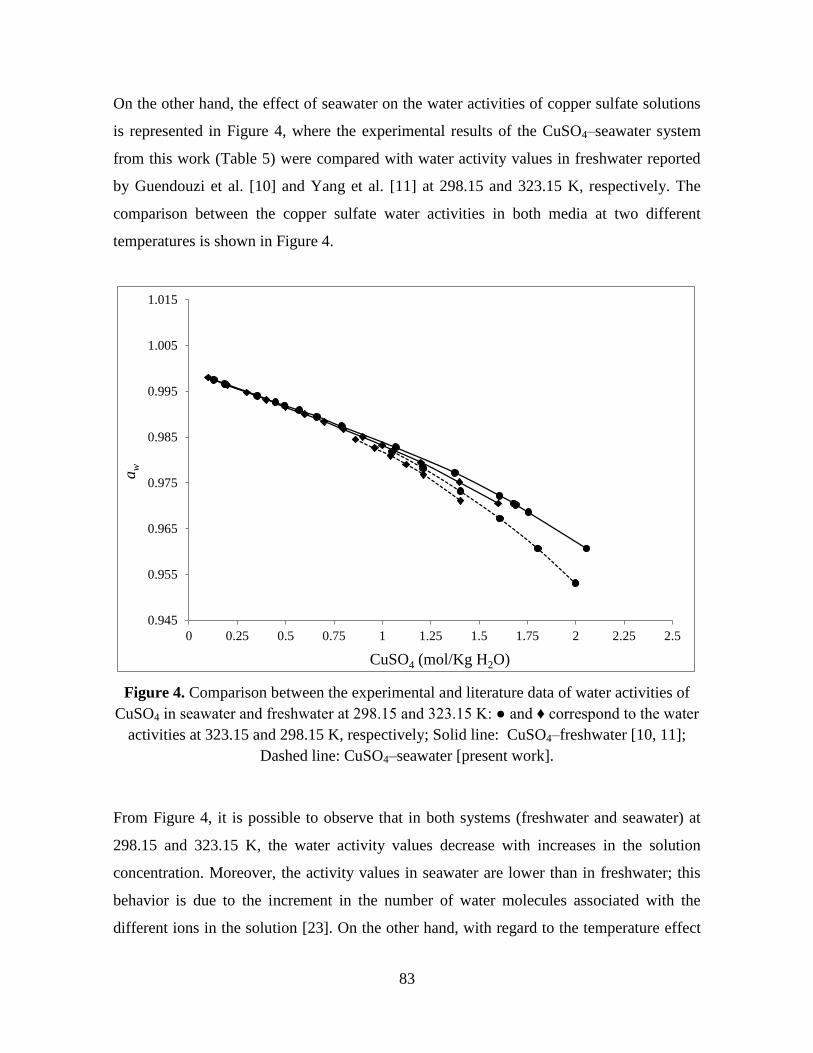
83
On the other hand, the effect of seawater on the water activities of copper sulfate solutions
is represented in Figure 4, where the experimental results of the CuSO4–seawater system
from this work (Table 5) were compared with water activity values in freshwater reported
by Guendouzi et al. [10] and Yang et al. [11] at 298.15 and 323.15 K, respectively. The
comparison between the copper sulfate water activities in both media at two different
temperatures is shown in Figure 4.
Figure 4. Comparison between the experimental and literature data of water activities of
CuSO4 in seawater and freshwater at 298.15 and 323.15 K: ● and ♦ correspond to the water
activities at 323.15 and 298.15 K, respectively; Solid line: CuSO4–freshwater [10, 11];
Dashed line: CuSO4–seawater [present work].
From Figure 4, it is possible to observe that in both systems (freshwater and seawater) at
298.15 and 323.15 K, the water activity values decrease with increases in the solution
concentration. Moreover, the activity values in seawater are lower than in freshwater; this
behavior is due to the increment in the number of water molecules associated with the
different ions in the solution [23]. On the other hand, with regard to the temperature effect
0.945
0.955
0.965
0.975
0.985
0.995
1.005
1.015
0 0.25 0.5 0.75 1 1.25 1.5 1.75 2 2.25 2.5
aw
CuSO4 (mol/Kg H2O)
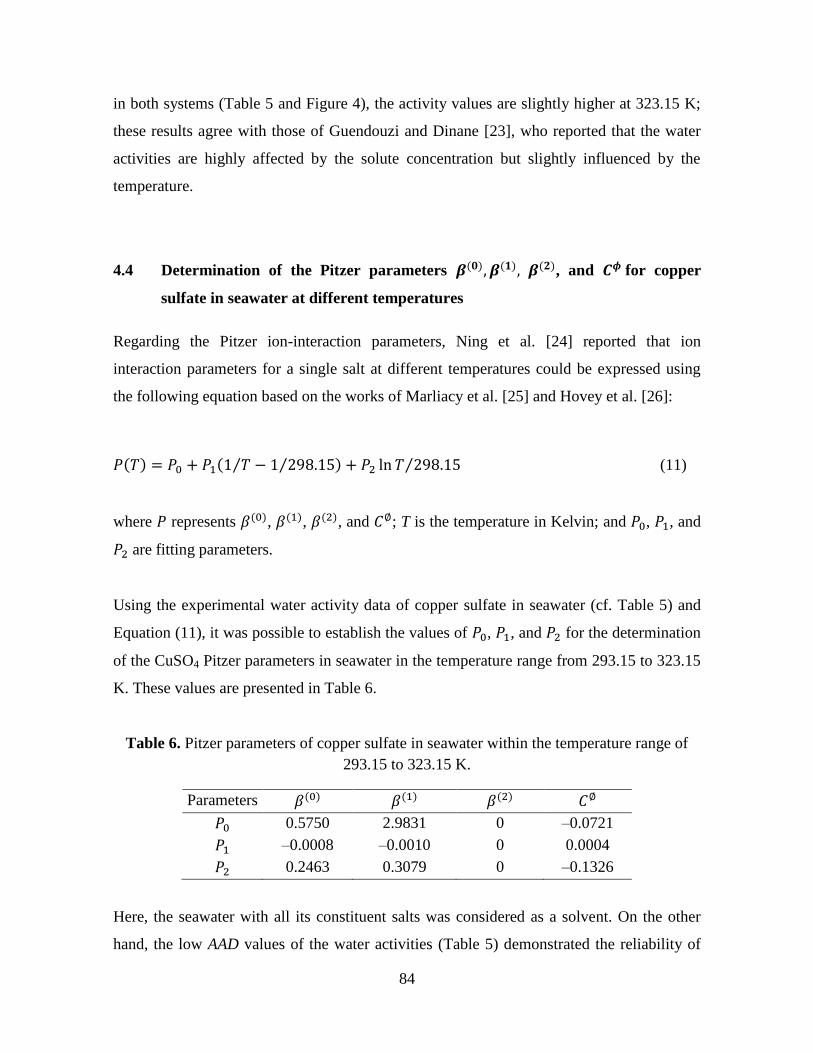
84
in both systems (Table 5 and Figure 4), the activity values are slightly higher at 323.15 K;
these results agree with those of Guendouzi and Dinane [23], who reported that the water
activities are highly affected by the solute concentration but slightly influenced by the
temperature.
4.4 Determination of the Pitzer parameters 𝜷(𝟎), 𝜷(𝟏), 𝜷(𝟐), and 𝑪𝝓 for copper
sulfate in seawater at different temperatures
Regarding the Pitzer ion-interaction parameters, Ning et al. [24] reported that ion
interaction parameters for a single salt at different temperatures could be expressed using
the following equation based on the works of Marliacy et al. [25] and Hovey et al. [26]:
𝑃(𝑇) = 𝑃0 + 𝑃1(1 𝑇⁄ − 1 298.15⁄ ) + 𝑃2 ln 𝑇 298.15⁄ (11)
where 𝑃 represents 𝛽(0), 𝛽(1), 𝛽(2), and 𝐶∅; T is the temperature in Kelvin; and 𝑃0, 𝑃1, and
𝑃2 are fitting parameters.
Using the experimental water activity data of copper sulfate in seawater (cf. Table 5) and
Equation (11), it was possible to establish the values of 𝑃0, 𝑃1, and 𝑃2 for the determination
of the CuSO4 Pitzer parameters in seawater in the temperature range from 293.15 to 323.15
K. These values are presented in Table 6.
Table 6. Pitzer parameters of copper sulfate in seawater within the temperature range of
293.15 to 323.15 K.
Parameters 𝛽(0) 𝛽(1) 𝛽(2) 𝐶∅
𝑃0 0.5750 2.9831 0 –0.0721
𝑃1 –0.0008 –0.0010 0 0.0004
𝑃2 0.2463 0.3079 0 –0.1326
Here, the seawater with all its constituent salts was considered as a solvent. On the other
hand, the low AAD values of the water activities (Table 5) demonstrated the reliability of
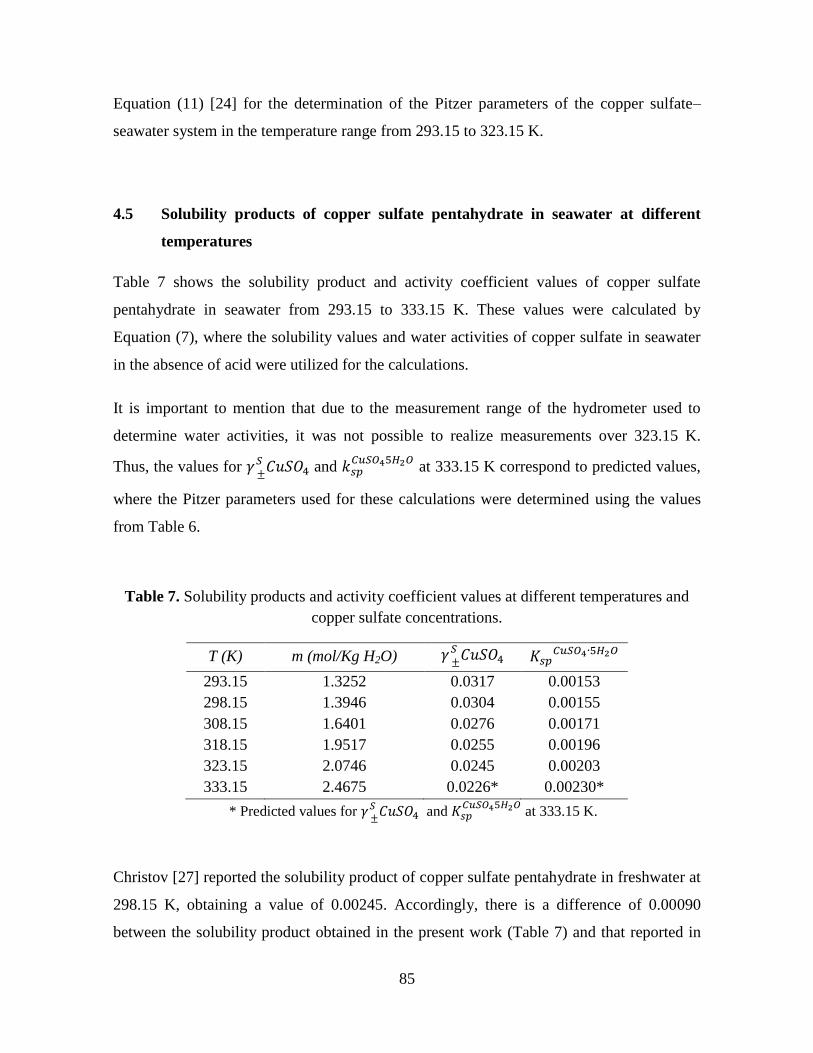
85
Equation (11) [24] for the determination of the Pitzer parameters of the copper sulfate–
seawater system in the temperature range from 293.15 to 323.15 K.
4.5 Solubility products of copper sulfate pentahydrate in seawater at different
temperatures
Table 7 shows the solubility product and activity coefficient values of copper sulfate
pentahydrate in seawater from 293.15 to 333.15 K. These values were calculated by
Equation (7), where the solubility values and water activities of copper sulfate in seawater
in the absence of acid were utilized for the calculations.
It is important to mention that due to the measurement range of the hydrometer used to
determine water activities, it was not possible to realize measurements over 323.15 K.
Thus, the values for 𝛾 ±𝑆 𝐶𝑢𝑆𝑂4 and 𝑘𝑠𝑝
𝐶𝑢𝑆𝑂45𝐻2𝑂 at 333.15 K correspond to predicted values,
where the Pitzer parameters used for these calculations were determined using the values
from Table 6.
Table 7. Solubility products and activity coefficient values at different temperatures and
copper sulfate concentrations.
T (K) m (mol/Kg H2O) 𝛾 ±𝑆 𝐶𝑢𝑆𝑂4 𝐾𝑠𝑝
𝐶𝑢𝑆𝑂4∙5𝐻2𝑂
293.15 1.3252 0.0317 0.00153
298.15 1.3946 0.0304 0.00155
308.15 1.6401 0.0276 0.00171
318.15 1.9517 0.0255 0.00196
323.15 2.0746 0.0245 0.00203
333.15 2.4675 0.0226* 0.00230*
* Predicted values for 𝛾 ±𝑆 𝐶𝑢𝑆𝑂4 and 𝐾𝑠𝑝
𝐶𝑢𝑆𝑂45𝐻2𝑂 at 333.15 K.
Christov [27] reported the solubility product of copper sulfate pentahydrate in freshwater at
298.15 K, obtaining a value of 0.00245. Accordingly, there is a difference of 0.00090
between the solubility product obtained in the present work (Table 7) and that reported in
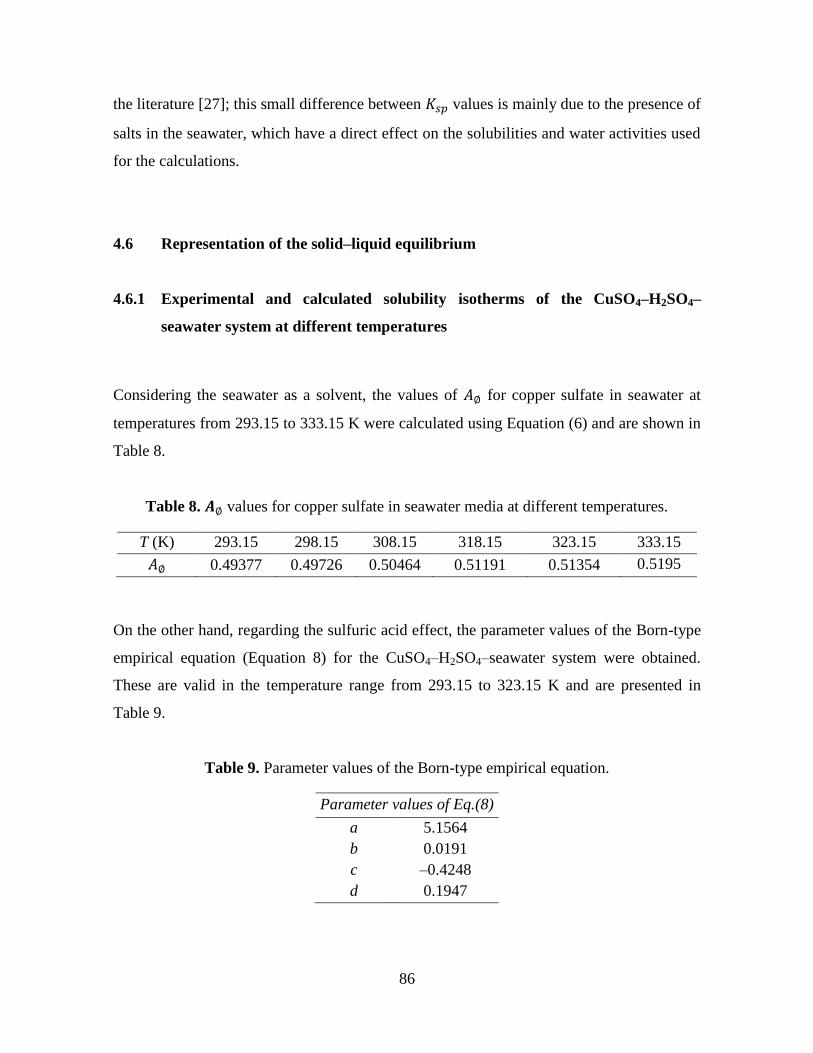
86
the literature [27]; this small difference between 𝐾𝑠𝑝 values is mainly due to the presence of
salts in the seawater, which have a direct effect on the solubilities and water activities used
for the calculations.
4.6 Representation of the solid–liquid equilibrium
4.6.1 Experimental and calculated solubility isotherms of the CuSO4–H2SO4–
seawater system at different temperatures
Considering the seawater as a solvent, the values of 𝐴∅ for copper sulfate in seawater at
temperatures from 293.15 to 333.15 K were calculated using Equation (6) and are shown in
Table 8.
Table 8. 𝑨∅ values for copper sulfate in seawater media at different temperatures.
T (K) 293.15 298.15 308.15 318.15 323.15 333.15
𝐴∅ 0.49377 0.49726 0.50464 0.51191 0.51354 0.5195
On the other hand, regarding the sulfuric acid effect, the parameter values of the Born-type
empirical equation (Equation 8) for the CuSO4–H2SO4–seawater system were obtained.
These are valid in the temperature range from 293.15 to 323.15 K and are presented in
Table 9.
Table 9. Parameter values of the Born-type empirical equation.
Parameter values of Eq.(8)
a 5.1564
b 0.0191
c –0.4248
d 0.1947
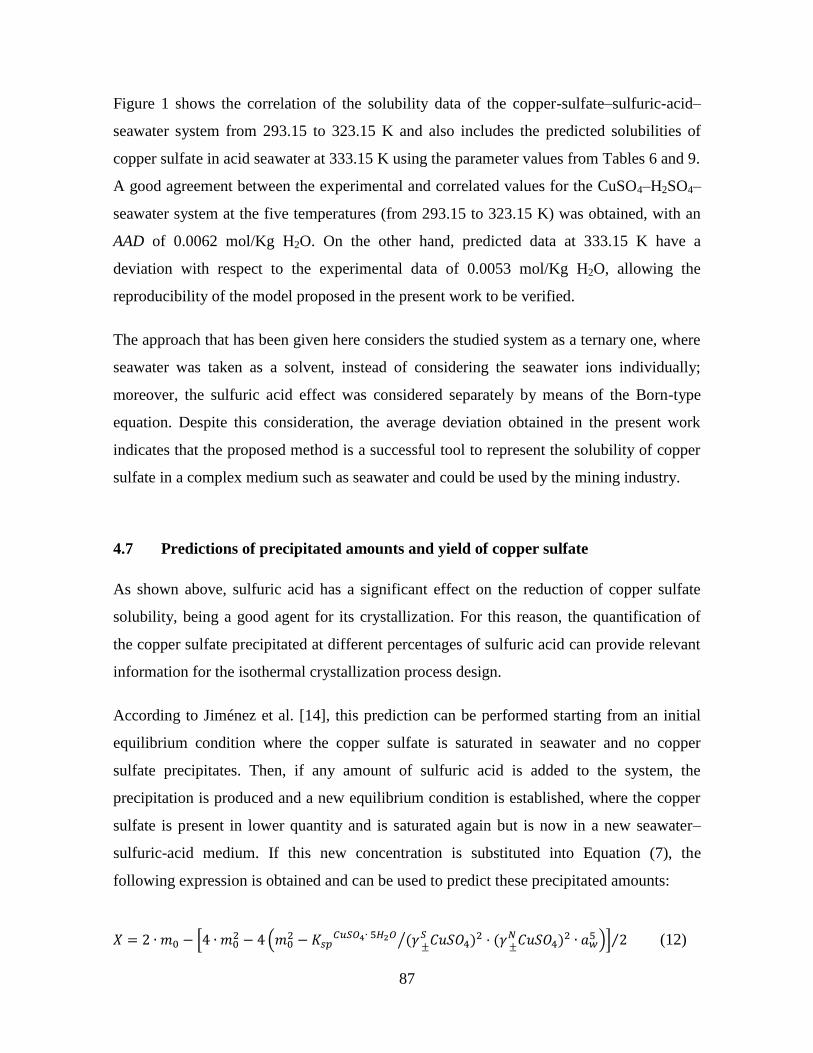
87
Figure 1 shows the correlation of the solubility data of the copper-sulfate–sulfuric-acid–
seawater system from 293.15 to 323.15 K and also includes the predicted solubilities of
copper sulfate in acid seawater at 333.15 K using the parameter values from Tables 6 and 9.
A good agreement between the experimental and correlated values for the CuSO4–H2SO4–
seawater system at the five temperatures (from 293.15 to 323.15 K) was obtained, with an
AAD of 0.0062 mol/Kg H2O. On the other hand, predicted data at 333.15 K have a
deviation with respect to the experimental data of 0.0053 mol/Kg H2O, allowing the
reproducibility of the model proposed in the present work to be verified.
The approach that has been given here considers the studied system as a ternary one, where
seawater was taken as a solvent, instead of considering the seawater ions individually;
moreover, the sulfuric acid effect was considered separately by means of the Born-type
equation. Despite this consideration, the average deviation obtained in the present work
indicates that the proposed method is a successful tool to represent the solubility of copper
sulfate in a complex medium such as seawater and could be used by the mining industry.
4.7 Predictions of precipitated amounts and yield of copper sulfate
As shown above, sulfuric acid has a significant effect on the reduction of copper sulfate
solubility, being a good agent for its crystallization. For this reason, the quantification of
the copper sulfate precipitated at different percentages of sulfuric acid can provide relevant
information for the isothermal crystallization process design.
According to Jiménez et al. [14], this prediction can be performed starting from an initial
equilibrium condition where the copper sulfate is saturated in seawater and no copper
sulfate precipitates. Then, if any amount of sulfuric acid is added to the system, the
precipitation is produced and a new equilibrium condition is established, where the copper
sulfate is present in lower quantity and is saturated again but is now in a new seawater–
sulfuric-acid medium. If this new concentration is substituted into Equation (7), the
following expression is obtained and can be used to predict these precipitated amounts:
𝑋 = 2 ∙ 𝑚0 − [4 ∙ 𝑚02 − 4 (𝑚0
2 − 𝐾𝑠𝑝𝐶𝑢𝑆𝑂4∙ 5𝐻2𝑂 (𝛾
±𝑆 𝐶𝑢𝑆𝑂4)2 · (𝛾
±𝑁 𝐶𝑢𝑆𝑂4)2 ∙ 𝑎𝑤
5⁄ )] 2⁄ (12)
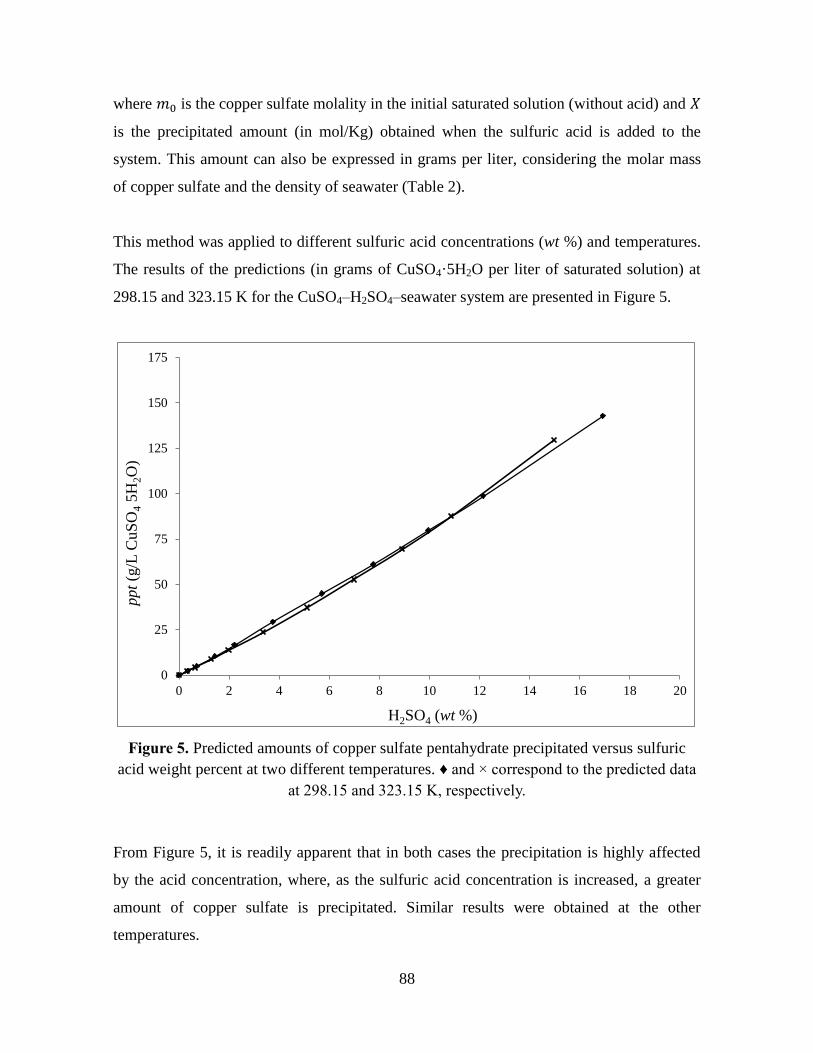
88
where 𝑚0 is the copper sulfate molality in the initial saturated solution (without acid) and 𝑋
is the precipitated amount (in mol/Kg) obtained when the sulfuric acid is added to the
system. This amount can also be expressed in grams per liter, considering the molar mass
of copper sulfate and the density of seawater (Table 2).
This method was applied to different sulfuric acid concentrations (wt %) and temperatures.
The results of the predictions (in grams of CuSO4·5H2O per liter of saturated solution) at
298.15 and 323.15 K for the CuSO4–H2SO4–seawater system are presented in Figure 5.
Figure 5. Predicted amounts of copper sulfate pentahydrate precipitated versus sulfuric
acid weight percent at two different temperatures. ♦ and × correspond to the predicted data
at 298.15 and 323.15 K, respectively.
From Figure 5, it is readily apparent that in both cases the precipitation is highly affected
by the acid concentration, where, as the sulfuric acid concentration is increased, a greater
amount of copper sulfate is precipitated. Similar results were obtained at the other
temperatures.
0
25
50
75
100
125
150
175
0 2 4 6 8 10 12 14 16 18 20
ppt
(g/L
CuS
O4 5
H2O
)
H2SO4 (wt %)
89
Also, it is possible to observe that the precipitated amounts are not highly affected by the
temperature, with similar amounts of copper sulfate pentahydrate being obtained in both
cases when sulfuric acid is added to the system. This is because, in the temperature range
from 293.15 to 333.15 K, the solubility curves of the CuSO4–H2SO4–seawater system (cf.
Figure 1) have similar slopes, which causes the precipitated amounts to be similar at the
different temperatures.
On the other hand, based on the work of Jiménez et al. [14], once the values of 𝑋 have been
determined, it is possible to calculate the percentage of sulfuric acid that produces the
maximum precipitate. This amount is defined as the yield 𝑌.
The prediction of the amount of acid that produces the maximum yield (𝑌) can be
calculated by the following expression [14]:
𝑌 = 𝑋𝑀(100 − 𝑠)(1 − 𝑤)10−5 (13)
where 𝑠 is the CuSO4 solubility expressed as weight percent, and 𝑀 and 𝑤 represent the
molecular weight of copper sulfate and the mass fraction of sulfuric acid (free of salt),
respectively.
This estimation has been performed for the CuSO4–H2SO4–seawater system using the
copper sulfate and sulfuric acid concentrations from Tables 3 and 4 (as a weight percent
and mass fraction, respectively) in the temperature range from 293.15 to 333.15 K. Table
10 shows the results of the optimum values 𝑌, with their respective sulfuric acid
concentrations, obtained at each temperature.
90
Table 10. Optimum values of 𝒘 and 𝒀 for the CuSO4–H2SO4–seawater system at the six
different temperatures.
T (K) H2SO4 (wt %) Yield (%)
293.15 18.1037 11.419
298.15 16.9197 10.523
308.15 16.4071 9.181
318.15 15.7963 10.402
323.15 14.9704 8.858
333.15 14.0057 8.102
From Table 10, it can be noted that independently of the temperature, the yield reaches a
maximum value at the highest concentration of sulfuric acid used at each temperature.
Also, it is important to mention that the higher value of 𝑌 obtained at 293.15 K is attributed
to the higher acid concentration used for the calculations.
As can be seen in Figure 5 and Table 10, with the range of sulfuric acid concentrations used
for the calculations, it was not possible to achieve a maximum precipitated amount (𝑋) and
yield (𝑌), so it is possible that the optimum acid concentration necessary to reach maximum
values of 𝑋 and 𝑌 is higher. However, our calculations of 𝑌 are based on the sulfuric acid
values normally used by the mining industry (over 100 g/L H2SO4) [5].
On the other hand, despite the high copper concentrations present in the initial solutions
(Table 3 and 4), high yields were not obtained (Table 10). So it is proposed that a
continuous crystallization process with recirculation would help to obtain higher values of
𝑌.
4.8 Conceptual design of the copper sulfate crystallization process by means of the
addition of sulfuric acid using the phase diagram
The conventional methodology used to make the graph of yield versus the sulfuric acid
weight percent is through a solubility diagram (graph form). In the present work, this
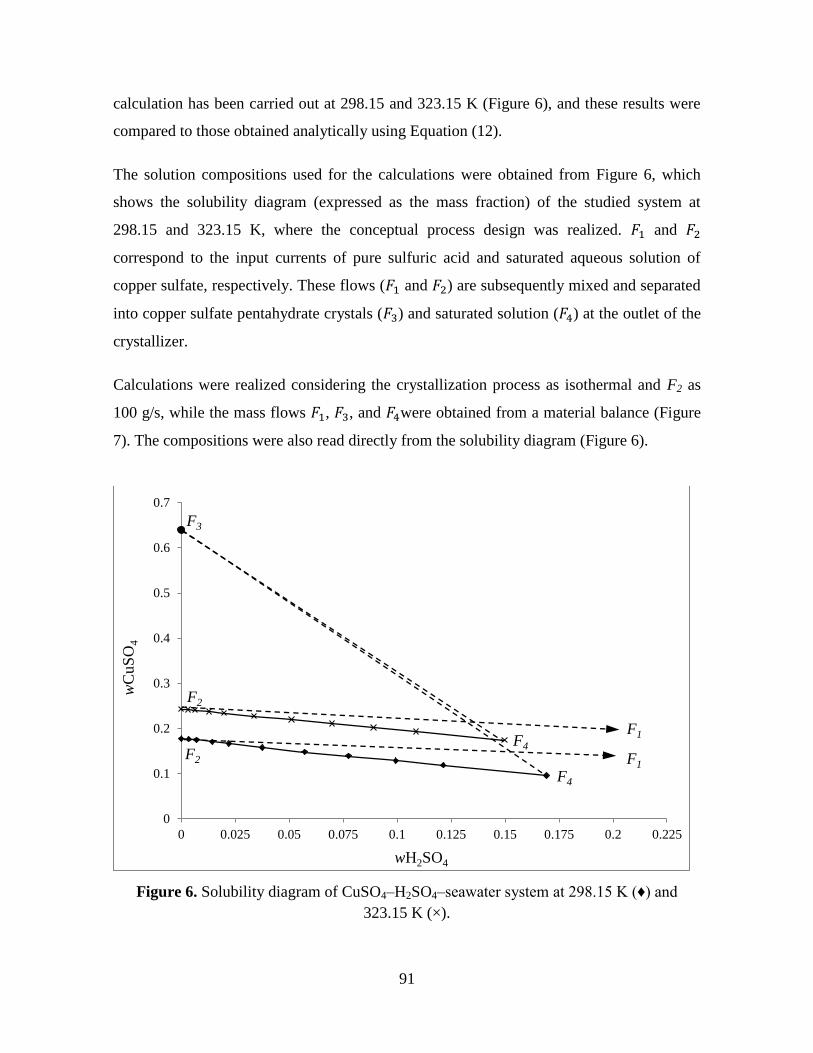
91
calculation has been carried out at 298.15 and 323.15 K (Figure 6), and these results were
compared to those obtained analytically using Equation (12).
The solution compositions used for the calculations were obtained from Figure 6, which
shows the solubility diagram (expressed as the mass fraction) of the studied system at
298.15 and 323.15 K, where the conceptual process design was realized. 𝐹1 and 𝐹2
correspond to the input currents of pure sulfuric acid and saturated aqueous solution of
copper sulfate, respectively. These flows (𝐹1 and 𝐹2) are subsequently mixed and separated
into copper sulfate pentahydrate crystals (𝐹3) and saturated solution (𝐹4) at the outlet of the
crystallizer.
Calculations were realized considering the crystallization process as isothermal and F2 as
100 g/s, while the mass flows 𝐹1, 𝐹3, and 𝐹4were obtained from a material balance (Figure
7). The compositions were also read directly from the solubility diagram (Figure 6).
Figure 6. Solubility diagram of CuSO4–H2SO4–seawater system at 298.15 K (♦) and
323.15 K (×).
0
0.1
0.2
0.3
0.4
0.5
0.6
0.7
0 0.025 0.05 0.075 0.1 0.125 0.15 0.175 0.2 0.225
wC
uS
O4
wH2SO4
F3
F2 F1
F4
F4
F2
F1
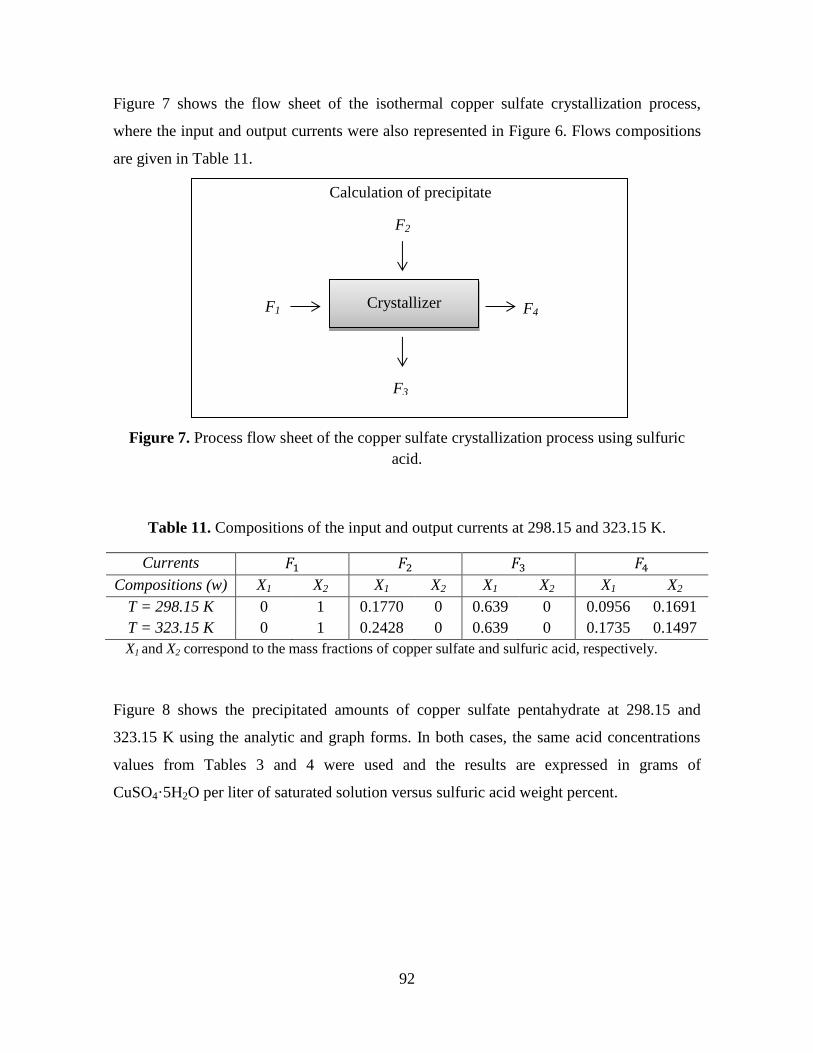
92
Figure 7 shows the flow sheet of the isothermal copper sulfate crystallization process,
where the input and output currents were also represented in Figure 6. Flows compositions
are given in Table 11.
Figure 7. Process flow sheet of the copper sulfate crystallization process using sulfuric
acid.
Table 11. Compositions of the input and output currents at 298.15 and 323.15 K.
Currents 𝐹1 𝐹2 𝐹3 𝐹4
Compositions (w) X1 X2 X1 X2 X1 X2 X1 X2
T = 298.15 K 0 1 0.1770 0 0.639 0 0.0956 0.1691
T = 323.15 K 0 1 0.2428 0 0.639 0 0.1735 0.1497
X1 and X2 correspond to the mass fractions of copper sulfate and sulfuric acid, respectively.
Figure 8 shows the precipitated amounts of copper sulfate pentahydrate at 298.15 and
323.15 K using the analytic and graph forms. In both cases, the same acid concentrations
values from Tables 3 and 4 were used and the results are expressed in grams of
CuSO4·5H2O per liter of saturated solution versus sulfuric acid weight percent.
Crystallizer
Calculation of precipitate
F2
F4
F3
F1
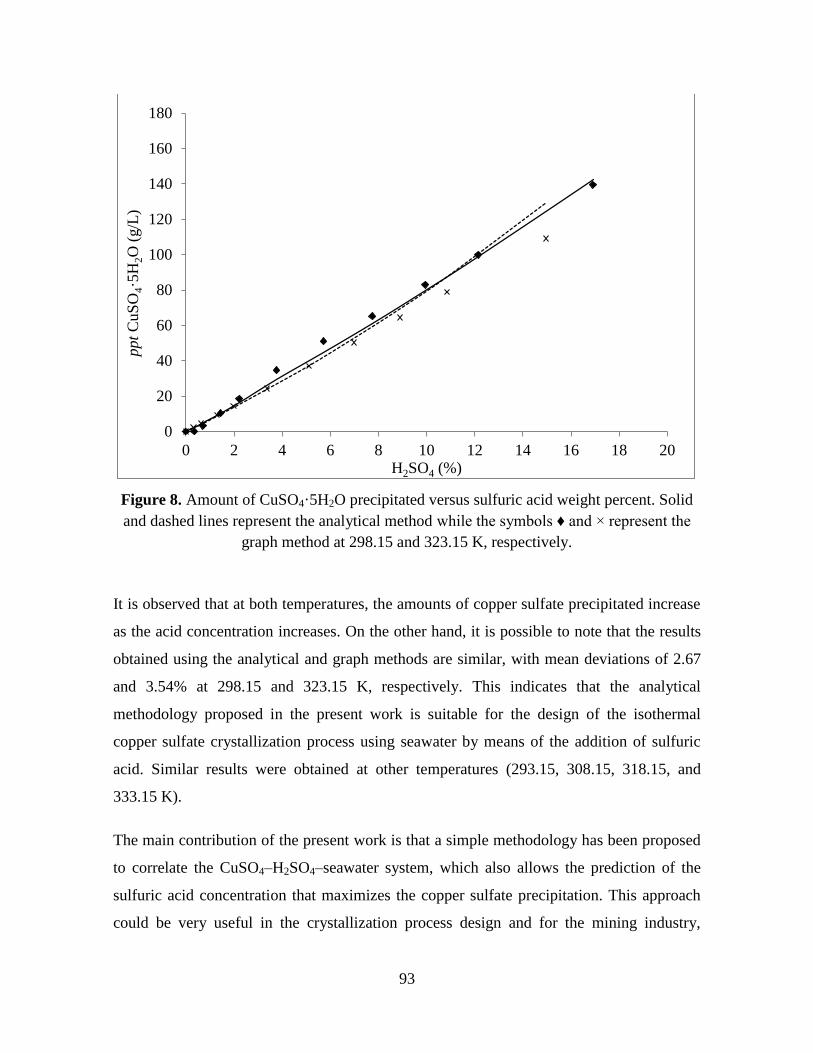
93
Figure 8. Amount of CuSO4·5H2O precipitated versus sulfuric acid weight percent. Solid
and dashed lines represent the analytical method while the symbols ♦ and × represent the
graph method at 298.15 and 323.15 K, respectively.
It is observed that at both temperatures, the amounts of copper sulfate precipitated increase
as the acid concentration increases. On the other hand, it is possible to note that the results
obtained using the analytical and graph methods are similar, with mean deviations of 2.67
and 3.54% at 298.15 and 323.15 K, respectively. This indicates that the analytical
methodology proposed in the present work is suitable for the design of the isothermal
copper sulfate crystallization process using seawater by means of the addition of sulfuric
acid. Similar results were obtained at other temperatures (293.15, 308.15, 318.15, and
333.15 K).
The main contribution of the present work is that a simple methodology has been proposed
to correlate the CuSO4–H2SO4–seawater system, which also allows the prediction of the
sulfuric acid concentration that maximizes the copper sulfate precipitation. This approach
could be very useful in the crystallization process design and for the mining industry,
0
20
40
60
80
100
120
140
160
180
0 2 4 6 8 10 12 14 16 18 20
ppt
CuS
O4·5
H2O
(g/L
)
H2SO4 (%)
94
because only a few solubility data are needed to know the optimal amount of sulfuric acid
to obtain the maximum yield. In the future, the next step is to realize crystallization
experiments with seawater by adding sulfuric acid to validate the model proposed in the
present work.
5. CONCLUSIONS
A simple methodology, based on a variation of Kan’s method, has been applied to represent
the solid–liquid equilibrium of the copper-sulfate–sulfuric-acid–seawater system at
different temperatures and considering the seawater as a solvent, obtaining an AAD of
0.0062 mol/Kg H2O. Also, a simple analytical procedure has been applied to construct
yield-versus-concentration diagrams, which can be used to estimate the sulfuric acid
concentration that maximizes the copper sulfate precipitation.
From the methodology proposed in the present work, it has been possible to obtain valuable
information that could be useful in the design of the copper sulfate crystallization process
by means of the addition of sulfuric acid. So in the future, it would be interesting to prove
the reproducibility of the model through experimental tests, to validate the model, and to
apply it in the mining industry.
ACKNOWLEDGEMENTS: Funding for this research was provided by CONICYT
(Fondecyt Project 1140169 and grant 21130894).
95
6. REFERENCES
[1] L.A. Cisternas, L. Moreno, El agua de mar en la minería: Fundamentos y aplicaciones,
RIL editores, 2014, pp. 234.
[2] D. Milligan, H. Moyer, Crystallization in the Copper sulphate - Sulphuric acid - Water
system, ENG MIN J, 176 (1975) 85-89.
[3] D. De Juan, V. Messenguer, L. Lozano, Una contribución al estudio de la solubilidad
del CuSO4∙5H2O en medio acuoso, Revista de metalurgia, 35 (1999) 47-52.
[4] M. Giulietti, S. Derenzo, J. Nývlt, L. Ishida, Crystallization of copper sulphate, Crystal
Research and Technology, 30 (1995) 177-183.
[5] H.W. Richardson, Handbook of copper compounds and applications, CRC Press1997.
[6] F.E.W. Wetmore, A. Gordon, The Activity Coefficient of Copper Sulphate in Aqueous
Solution, The Journal of chemical physics, 5 (1937) 60-63.
[7] C.J. Downes, K.S. Pitzer, Thermodynamics of electrolytes. Binary mixtures formed
from aqueous NaCl, Na2SO4, CuCl2, and CuSO4, at 25 °C, Journal of Solution Chemistry, 5
(1976) 389-398.
[8] D.G. Miller, J.A. Rard, L.B. Eppstein, R. Robinson, Mutual diffusion coefficients,
electrical conductances, osmotic coefficients, and ionic transport coefficients ij for aqueous
CuSO4 at 25 °C, Journal of Solution Chemistry, 9 (1980) 467-496.
[9] A. Apelblat, The vapour pressures of saturated aqueous solutions of potassium bromide,
ammonium sulfate, copper (II) sulfate, iron (II) sulfate, and manganese (II) dichloride, at
temperatures from 283 K to 308 K, The Journal of Chemical Thermodynamics, 25 (1993)
1513-1520.
[10] M.E. Guendouzi, A. Mounir, A. Dinane, Water activity, osmotic and activity
coefficients of aqueous solutions of Li2SO4, Na2SO4, K2SO4,(NH4)2SO4, MgSO4, MnSO4,
NiSO4, CuSO4, and ZnSO4 at T= 298.15 K, The Journal of Chemical Thermodynamics, 35
(2003) 209-220.
96
[11] H. Yang, D. Zeng, W. Voigt, G. Hefter, S. Liu, Q. Chen, Isopiestic measurements on
aqueous solutions of heavy metal sulfates: MSO4+ H2O (M= Mn, Co, Ni, Cu, Zn). 1. T=
323.15 K, Journal of Chemical & Engineering Data, 59 (2013) 97-102.
[12] F. Justel, M. Claros, M. Taboada, Solubilities and physical properties of saturated
solutions in the copper sulfate + sulfuric acid + seawater system at different temperatures,
Brazilian Journal of Chemical Engineering, 32 (2015) 629-635.
[13] A.T. Kan, G. Fu, M.B. Tomson, Effect of methanol and ethylene glycol on sulfates
and halite scale formation, Industrial & Engineering Chemistry Research, 42 (2003) 2399-
2408.
[14] Y.P. Jimenez, M.E. Taboada, H.R. Galleguillos, Solid–liquid equilibrium of K2SO4 in
solvent mixtures at different temperatures, Fluid Phase Equilibria, 284 (2009) 114-117.
[15] A. D-98, Standard Practice for the Preparation of Substitute Ocean Water, ASTM
International West Conshohocken, PA, 2008.
[16] W. Alavia, J.A. Lovera, B.A. Cortez, T.f.A. Graber, Solubility, density, refractive
index, viscosity, and electrical conductivity of boric acid+ lithium sulfate+ water system at
(293.15, 298.15, 303.15, 308.15 and 313.15) K, Journal of Chemical & Engineering Data,
58 (2013) 1668-1674.
[17] H. Holmes, R. Mesmer, Thermodynamics of aqueous solutions of the alkali metal
sulfates, Journal of Solution Chemistry, 15 (1986) 495-517.
[18] K.S. Pitzer, G. Mayorga, Thermodynamics of electrolytes. III. Activity and osmotic
coefficients for 2–2 electrolytes, Journal of Solution Chemistry, 3 (1974) 539-546.
[19] D. Fernandez, A. Goodwin, E.W. Lemmon, J.L. Sengers, R. Williams, A formulation
for the static permittivity of water and steam at temperatures from 238 K to 873 K at
pressures up to 1200 MPa, including derivatives and Debye–Hückel coefficients, Journal of
Physical and Chemical Reference Data, 26 (1997) 1125-1166.
97
[20] A. Stogryn, Equations for calculating the dielectric constant of saline water
(correspondence), IEEE transactions on microwave theory and Techniques, (1971) 733-
736.
[21] J.A. Lovera, A.P. Padilla, H.R. Galleguillos, Correlation of the solubilities of alkali
chlorides in mixed solvents: Polyethylene glycol + H2O and Ethanol + H2O, Calphad, 38
(2012) 35-42.
[22] L.A. Cisternas, Diagramas de fases y su aplicación, Reverte 2009.
[23] M. El Guendouzi, A. Dinane, Determination of water activities, osmotic and activity
coefficients in aqueous solutions using the hygrometric method, The Journal of Chemical
Thermodynamics, 32 (2000) 297-310.
[24] P. Ning, W. Xu, H. Cao, X. Lin, H. Xu, Determination and modeling for the solubility
of Na2MoO4·2H2O in the (Na++
MoO42−
+ SO42−
) system, The Journal of Chemical
Thermodynamics, 94 (2016) 67-73.
[25] P. Marliacy, R. Solimando, M. Bouroukba, L. Schuffenecker, Thermodynamics of
crystallization of sodium sulfate decahydrate in H2O–NaCl–Na2SO4: application to
Na2SO4·10H2O-based latent heat storage materials, Thermochimica Acta, 344 (2000) 85-
94.
[26] J.K. Hovey, K.S. Pitzer, J.A. Rard, Thermodynamics of Na2SO4 (aq) at temperatures T
from 273 K to 373 K and of ((1-y)H2SO4+ yNa2SO4) (aq) at T= 298.15 K, The Journal of
Chemical Thermodynamics, 25 (1993) 173-192.
[27] C. Christov, Thermodynamic study of the Na-Cu-Cl-SO4-H2O system at the
temperature 298.15 K, The Journal of Chemical Thermodynamics, 32 (2000) 285-295.
98
CHAPTER V
THERMODYNAMIC STUDY OF THE Cu-Na-H-SO4-Cl-HSO4-H2O SYSTEM FOR
THE SOLUBILITY OF COPPER SULFATE IN ACID SEAWATER AT
DIFFERENT TEMPERATURES
Francisca J. Justel, María E. Taboada, Yecid P. Jiménez*
Department of Chemical and Mineral Process Engineering, University of Antofagasta, Av.
Angamos 601, Antofagasta, Chile
([email protected], [email protected], [email protected]*)
ABSTRACT
The objective of the present work is the thermodynamic study of the Cu-Na-H-SO4-Cl-
HSO4-H2O system using the Pitzer model in the temperature range from 293.15 to 333.15
K. Also, the water activities for aqueous solutions of copper sulfate were experimentally
determined. This information and the Pitzer ion-interaction model were used to represent
the solid-liquid equilibrium of the copper sulfate – sulfuric acid – seawater system.
A simplification of the seawater system has been carried out, where the main ions from
seawater (Na+ and Cl
-) have been considered in the modelling. A good agreement between
the correlated and the experimental solubility data of the CuSO4 - H2SO4 - seawater system
was obtained, with an absolute average deviation of 0.0157 mol/kg.
The ion-interaction model of Pitzer has been successfully used to predict the solubilities of
an electrolyte in a system as complex as natural seawater, which makes it a suitable model
to be applied to mining processes using seawater.
Keywords: Copper sulfate; Seawater; Solubility; Water activity; Pitzer model.
99
1. INTRODUCTION
Copper sulfate pentahydrate is the most important industrial compound of copper and has
many commercial uses, including as soil additives, fungicides, bulk preparations of other
copper compounds, and an important component in the electronic industry [1, 2]. The most
common method of crystallizing copper sulfate pentahydrate is through the addition of
sulfuric acid, which generates a supersaturated aqueous solution of the salt [3].
In Chile, there are some mining companies that use seawater in the hydrometallurgical and
flotation concentration processes [4]. Due to this and to understand the effect of the
principal ions present in seawater (Na+
and Cl-), the experimental determination of
thermodynamic properties of salts, especially at moderate or high concentrations is of
interest because it provides information needed to determine the interaction parameters in
thermodynamic models. These models are valuable tools in the study of the optimization
and simulation of industrial processes for the recovery of salts [5].
Accordingly, some authors studied the applicability of the ion interaction or virial-
coefficient model of Pitzer [6, 7] to correlate the solubility data at different temperatures of
multicomponent systems. Harvie and Weare [8], used this model to predict the mineral
solubilities at 298.15 K in the seawater Na-K-Ca-Mg-Cl-SO4-H2O system at high ionic
strengths. The authors used activity coefficient expressions that were parameterized using
the solubility and osmotic data of binary and ternary systems, obtaining a good agreement
between the experimental and calculated solubility data. The authors concluded that the
methodology applied can be accurately used to predict solubilities in more complex
systems. Palaban and Pitzer [9], calculated the mineral solubilities in binary and ternary
electrolyte mixtures of the Na-K-Mg-Cl-SO4-OH-H2O system at high temperatures using
the available thermodynamic data for solid and aqueous electrolyte solutions, and some
parameters were fitted to represent ternary systems. Good agreement with the experimental
solubility data indicates that the model can be successfully used to predict mineral
solubilities at high temperatures. Moller [10] presented a variable temperature model for
the Na-Ca-Cl-SO4-H2O system that calculates the solubilities from dilute to high
concentrations in the temperature range from 298.15 to 523.15 K. Later, Greenberg and
100
Moller [11] extended the model of Moller [10] by including potassium interactions and
increasing the temperature range from 273.15 to 523.15 K. In that work, the Na-K-Ca-Cl-
SO4-H2O system from zero to high ionic strengths was studied. The application of the
variable temperature models for Na-Ca-Cl-SO4-H2O and Na-K-Ca-Cl-SO4-H2O discussed
by Moller [10] and Greenberg and Moller [11], respectively, suggests the utility of a full
seawater variable temperature model in geochemical and industrial studies. Baes et al. [12]
applied the Pitzer ion interaction model to the CuSO4 - H2SO4 - H2O system at 298.15 K,
using available data of osmotic, solubility, and emf data for this system, including
unsymmetrical mixing effects. In that work, an extensive evaluation of available data on the
system CuSO4-H2SO4-H2O has been made. Christov [13] reported a thermodynamic study
of the quaternary system Na-Cu-Cl-SO4-H2O at 298.15 K using the Pitzer model, where the
crystallization of the simple salts CuCl2∙2H2O and CuSO4∙5H2O was evaluated.
Additionally, simulation of the NaCl-CuCl2 (aq), Na2SO4-CuSO4 (aq), and CuCl2-CuSO4
(aq) systems was performed, demonstrating a good agreement between the experimental
and calculated solubility isotherms. Later, Christov and Moller [14] studied the H-Na-K-
OH-Cl-HSO4-SO4-H2O system under high solution concentrations over a wide temperature
range (from 273.15 to 523 K), where the temperature functions for potentials of sodium and
potassium salts from the solubility data of binary and ternary solutions were reported, and a
comparison with the experimental data validated the model. Wang et al. [15] predicted the
solubility of gypsum at 298.15 K in the quaternary systems CaSO4-HMSO4-H2SO4-H2O
(HM=Cu, Zn, Ni, Mn) up to saturated concentrations of heavy metal sulfates and to a
H2SO4 concentration of 2 m by the Pitzer thermodynamic model, where experimental
solubilities and water activities of the sub binary and sub ternary systems were used for the
model parameterization, concluding that the Pitzer model in its simple form can sufficiently
predict the solubility behavior of gypsum in the quaternary system. Justel et al. [16]
determined solubilities and water activity values of copper sulfate in seawater at different
temperatures, and used this information to represent the solid-liquid equilibrium of copper
sulfate-sulfuric acid-seawater system by means of a methodology that uses the Pitzer and
the Born model to quantify the copper sulfate and sulfuric acid effect, respectively.
Additionally, the precipitated amounts of copper sulfate as a function of the sulfuric acid
concentration were predicted.
101
The prediction or correlation of salt solubility data in mixed solvents is an important tool to
design and simulate the drowning-out crystallization process [17]. Thus, the present work is
focused on the representation of the solid-liquid equilibrium of the CuSO4 - H2SO4 -
seawater system in a wide temperature range (from 293.15 to 333.15 K). Here, the
thermodynamic study of the Cu-Na-H-SO4-Cl-HSO4-H2O system using the Pitzer model,
and considering sodium and chloride as seawater components is realized. The necessary
parameters for the binary and ternary systems have been compiled from the literature to
correlate the experimental solubility data of the CuSO4-H2SO4-seawater system. This
information will be useful in the process design to produce copper sulfate pentahydrate
crystals using seawater by means of the addition of sulfuric acid, contributing to the use of
seawater in the hydrometallurgy of copper.
2. EXPERIMENTAL SECTION
2.1 MATERIALS
The reagents used in this work were of analytical grade. Copper (II) sulfate pentahydrate,
Merck, 99-100.5%, and distilled deionized water (0.054 𝜇𝑆 ∙ 𝑐𝑚−1).
2.2 APPARATUS AND PROCEDURES
2.2.1 Water activity measurements of CuSO4 in H2O at different temperatures
The water activities (𝑎𝑤) were measured using a Novasina Corp. model AW-Center 500
electronic hydrometer with the temperature controlled at ± 0.2 K and an accuracy of ±
0.003 𝑎𝑤, this instrument works in the temperature range from 273.15 to 323.15 K, and was
calibrated prior to making each set of measurements by using standard saturated salt
solutions of NaCl and LiCl supplied by the manufacturer. With the objective of improving
the accuracy, calibration curves were developed at each working temperature (293.15,
298.15, 308.15, 318.15, and 323.15 K) using the methodology proposed by Justel et al.
102
[16]. Activities measurements of aqueous solutions of copper sulfate were performed in
duplicate from 293.15 to 323.15 K. At each temperature, solutions at six different
concentrations of copper sulfate were measured, and the results were adjusted with the
calibration curves to maximize the equipment precision.
3. THERMODYNAMIC FRAMEWORK
3.1 The ion-interaction model
The ion interaction model has been discussed in several publications [6-10]. These authors
have shown that this approach could be expanded to accurately calculate solubilities in
complex brines and to predict the behavior of natural fluids.
The ion-interaction model begins with a virial expansion of the excess free energy: 𝐺𝑒𝑥 𝑅𝑇⁄
[8], as shown in Equation (1).
𝐺𝑒𝑥
𝑅𝑇= 𝑛𝑤[𝑓(𝐼) + ∑ ∑ 𝜆𝑖𝑗(𝐼)𝑚𝑖𝑚𝑗 + ∑ ∑ ∑ 𝜇𝑖𝑗𝑘𝑚𝑖𝑚𝑗𝑚𝑘𝑘𝑗𝑖𝑗𝑖 ] (1)
where 𝑛𝑤 is the number of kilograms of solvent and 𝑚𝑖𝑗𝑘 is the molality of species 𝑖, 𝑗, and
𝑘. 𝑓(𝐼) is the Debye-Hückel term and is a function of the ionic strength. 𝜆𝑖𝑗 and 𝜇𝑖𝑗𝑘 are the
second and third virial coefficients, respectively, and represent the effects of short-range
forces between ions [7].
The expressions for the osmotic and activity coefficients follow directly from the equation
𝐺𝑒𝑥 𝑅𝑇⁄ through the appropriate derivatives with respect to 𝑛𝑤 and 𝑚, respectively [9].
Equation (2) shows the expression for modeling the osmotic coefficient (𝜙), and equations
(3) and (4) are used to model the activity coefficients of the cation (M) and anion (X),
respectively.
103
(𝜙 − 1) = 2
(∑ 𝑚𝑖𝑖 )[−
𝐴𝜙𝐼3 2⁄
1+𝑏𝐼1 2⁄ + ∑ ∑ 𝑚𝑐𝑚𝑎(𝐵𝑐𝑎𝜙
+ 𝑍𝐶𝑐𝑎) + ∑ ∑ 𝑚𝑐𝑚𝑐′(𝛷𝑐𝑐′𝜙
+𝑐′𝑐𝑎𝑐
∑ 𝑚𝑎𝜓𝑐𝑐′𝑎𝑎 ) + ∑ ∑ 𝑚𝑎𝑚𝑎′(𝛷𝑎𝑎′𝜙
+ ∑ 𝑚𝑐𝜓𝑎𝑎′𝑐𝑐 )𝑎′𝑎 ] (2)
ln 𝛾𝑀 =
𝑧𝑀2 𝐹 + ∑ 𝑚𝑎(2𝐵𝑀𝑎 + 𝑍𝐶𝑀𝑎)𝑎 + ∑ 𝑚𝑐(2𝛷𝑀𝑐 + ∑ 𝑚𝑎𝜓𝑀𝑐𝑎𝑎 )𝑐 + ∑ ∑ 𝑚𝑎𝑚𝑎𝜓𝑎𝑎′𝑀𝑎′𝑎 +
|𝑧𝑀| ∑ ∑ 𝑚𝑐𝑚𝑎𝐶𝑐𝑎𝑎𝑐 (3)
ln 𝛾𝑋 =
𝑧𝑋2𝐹 + ∑ 𝑚𝑐(2𝐵𝑐𝑋 + 𝑍𝐶𝑐𝑋)𝑐 + ∑ 𝑚𝑎(2𝛷𝑋𝑎 + ∑ 𝑚𝑐𝜓𝑋𝑎𝑐𝑐 )𝑎 + ∑ ∑ 𝑚𝑐𝑚𝑐𝜓𝑐𝑐′𝑋𝑐′𝑐 +
|𝑧𝑋| ∑ ∑ 𝑚𝑐𝑚𝑎𝐶𝑐𝑎𝑎𝑐 (4)
where the subscripts M, c and c’ represent the cations and X, a and a’ are the anions; 𝑧𝑀
and 𝑧𝑥 are the ion charges and 𝑚𝑐 and 𝑚𝑎 are the molalities (mol/kg solvent) of the cations
and anions, respectively; I corresponds to the ionic strength; and b is 1.2 and remains the
same for all solutes.
The double summation indices c<c’ and a<a’ denote the sum over all of the distinguishable
pairs of dissimilar cations and anions, respectively. Additionally, the parameters 𝜓𝑖𝑗𝑘 are
the ion-mixing interaction parameters and are used when 𝑖 and 𝑗 are different anions and 𝑘
is a cation, or vice versa. In all cases, 𝜓𝑖𝑗𝑘 is assumed to be independent of the
concentration.
The function F includes the Debye-Hückel and other terms, as shown in Equation (5).
𝐹 = −𝐴𝜙 [𝐼1 2⁄
1+𝑏𝐼1 2⁄ +2
𝑏ln(1 + 𝑏𝐼1 2⁄ )] + ∑ ∑ 𝑚𝑐𝑚𝑎𝐵′𝑐𝑎𝑎𝑐 + ∑ ∑ 𝑚𝑐𝑚𝑐𝛷′𝑐𝑐′𝑐′𝑐 +
∑ ∑ 𝑚𝑎𝑚𝑎𝛷′𝑎𝑎′𝑎′𝑎 (5)
where 𝐴𝜙 corresponds to the Debye-Hückel term and is given by equation (6) [18].
𝐴𝜙 = 0.13422(4.1725332 − 0.1481291𝑇0.5 + 1.5188505𝐸 − 5 𝑇2 − 1.8016317𝐸 −
8𝑇3 + 9.3816144𝐸 − 10𝑇3.5) (6)
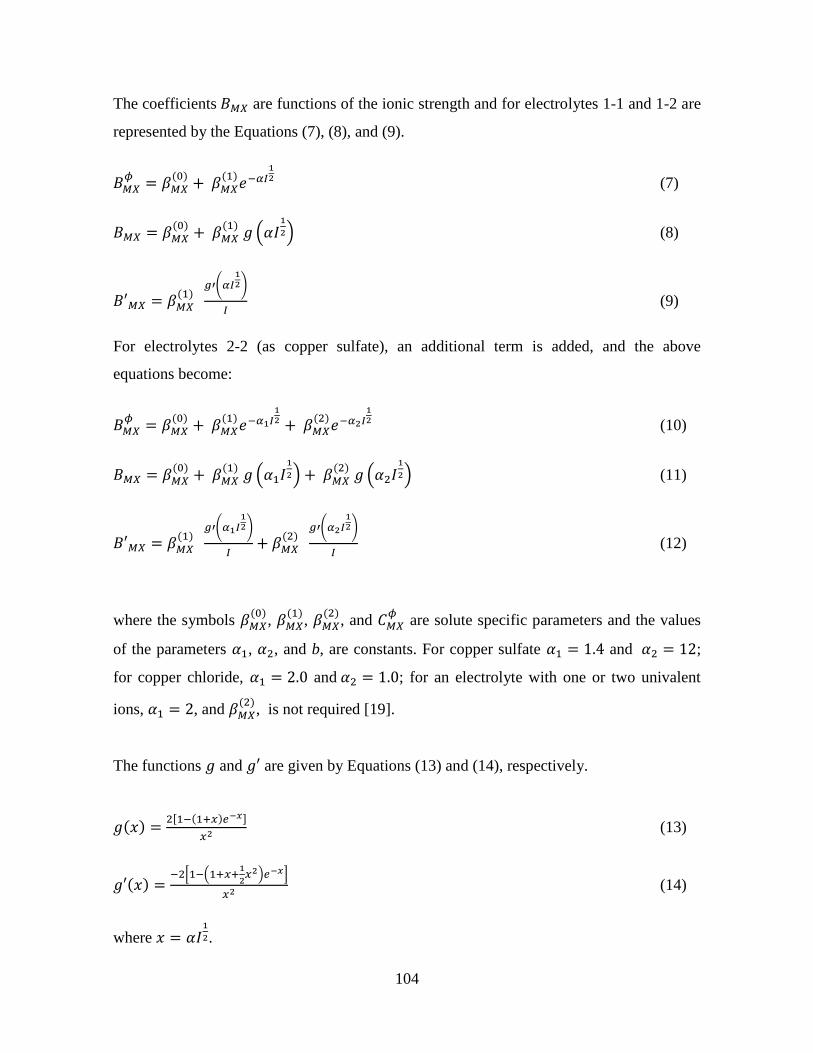
104
The coefficients 𝐵𝑀𝑋 are functions of the ionic strength and for electrolytes 1-1 and 1-2 are
represented by the Equations (7), (8), and (9).
𝐵𝑀𝑋𝜙
= 𝛽𝑀𝑋(0)
+ 𝛽𝑀𝑋(1)
𝑒−𝛼𝐼12 (7)
𝐵𝑀𝑋 = 𝛽𝑀𝑋(0)
+ 𝛽𝑀𝑋(1)
𝑔 (𝛼𝐼1
2) (8)
𝐵′𝑀𝑋 = 𝛽𝑀𝑋(1)
𝑔′(𝛼𝐼
12)
𝐼 (9)
For electrolytes 2-2 (as copper sulfate), an additional term is added, and the above
equations become:
𝐵𝑀𝑋𝜙
= 𝛽𝑀𝑋(0)
+ 𝛽𝑀𝑋(1)
𝑒−𝛼1𝐼12 + 𝛽𝑀𝑋
(2)𝑒−𝛼2𝐼
12 (10)
𝐵𝑀𝑋 = 𝛽𝑀𝑋(0)
+ 𝛽𝑀𝑋(1)
𝑔 (𝛼1𝐼1
2) + 𝛽𝑀𝑋(2)
𝑔 (𝛼2𝐼1
2) (11)
𝐵′𝑀𝑋 = 𝛽𝑀𝑋(1)
𝑔′(𝛼1𝐼
12)
𝐼+ 𝛽𝑀𝑋
(2)
𝑔′(𝛼2𝐼12)
𝐼 (12)
where the symbols 𝛽𝑀𝑋(0)
, 𝛽𝑀𝑋(1)
, 𝛽𝑀𝑋(2)
, and 𝐶𝑀𝑋𝜙
are solute specific parameters and the values
of the parameters 𝛼1, 𝛼2, and b, are constants. For copper sulfate 𝛼1 = 1.4 and 𝛼2 = 12;
for copper chloride, 𝛼1 = 2.0 and 𝛼2 = 1.0; for an electrolyte with one or two univalent
ions, 𝛼1 = 2, and 𝛽𝑀𝑋(2)
, is not required [19].
The functions 𝑔 and 𝑔′ are given by Equations (13) and (14), respectively.
𝑔(𝑥) =2[1−(1+𝑥)𝑒−𝑥]
𝑥2 (13)
𝑔′(𝑥) =−2[1−(1+𝑥+
1
2𝑥2)𝑒−𝑥]
𝑥2 (14)
where 𝑥 = 𝛼𝐼1
2.
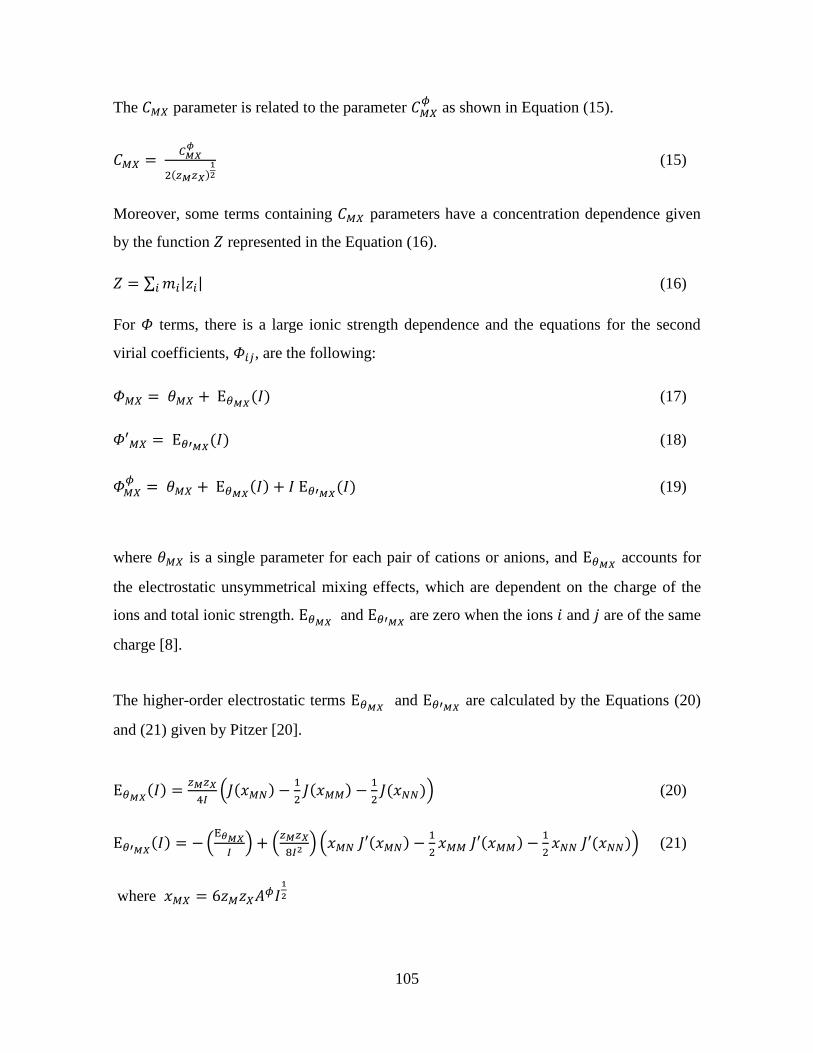
105
The 𝐶𝑀𝑋 parameter is related to the parameter 𝐶𝑀𝑋𝜙
as shown in Equation (15).
𝐶𝑀𝑋 = 𝐶𝑀𝑋
𝜙
2(𝑧𝑀𝑧𝑋)12
(15)
Moreover, some terms containing 𝐶𝑀𝑋 parameters have a concentration dependence given
by the function 𝑍 represented in the Equation (16).
𝑍 = ∑ 𝑚𝑖|𝑧𝑖|𝑖 (16)
For 𝛷 terms, there is a large ionic strength dependence and the equations for the second
virial coefficients, 𝛷𝑖𝑗, are the following:
𝛷𝑀𝑋 = 𝜃𝑀𝑋 + E𝜃𝑀𝑋(𝐼) (17)
𝛷′𝑀𝑋 = E𝜃′𝑀𝑋(𝐼) (18)
𝛷𝑀𝑋𝜙
= 𝜃𝑀𝑋 + E𝜃𝑀𝑋(𝐼) + 𝐼 E𝜃′𝑀𝑋
(𝐼) (19)
where 𝜃𝑀𝑋 is a single parameter for each pair of cations or anions, and E𝜃𝑀𝑋 accounts for
the electrostatic unsymmetrical mixing effects, which are dependent on the charge of the
ions and total ionic strength. E𝜃𝑀𝑋 and E𝜃′𝑀𝑋
are zero when the ions 𝑖 and 𝑗 are of the same
charge [8].
The higher-order electrostatic terms E𝜃𝑀𝑋 and E𝜃′𝑀𝑋
are calculated by the Equations (20)
and (21) given by Pitzer [20].
E𝜃𝑀𝑋(𝐼) =
𝑧𝑀𝑧𝑋
4𝐼(𝐽(𝑥𝑀𝑁) −
1
2𝐽(𝑥𝑀𝑀) −
1
2𝐽(𝑥𝑁𝑁)) (20)
E𝜃′𝑀𝑋(𝐼) = − (
E𝜃𝑀𝑋
𝐼) + (
𝑧𝑀𝑧𝑋
8𝐼2 ) (𝑥𝑀𝑁 𝐽′(𝑥𝑀𝑁) −1
2𝑥𝑀𝑀 𝐽′(𝑥𝑀𝑀) −
1
2𝑥𝑁𝑁 𝐽′(𝑥𝑁𝑁)) (21)
where 𝑥𝑀𝑋 = 6𝑧𝑀𝑧𝑋𝐴𝜙𝐼1
2
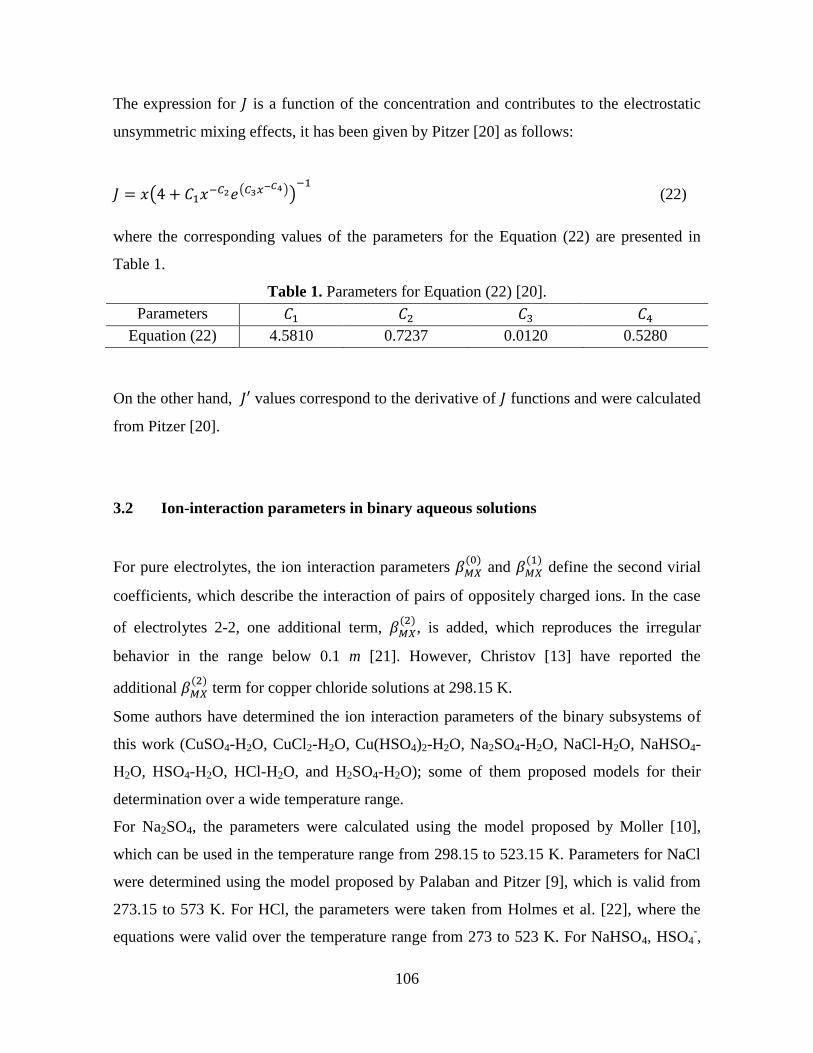
106
The expression for 𝐽 is a function of the concentration and contributes to the electrostatic
unsymmetric mixing effects, it has been given by Pitzer [20] as follows:
𝐽 = 𝑥(4 + 𝐶1𝑥−𝐶2𝑒(𝐶3𝑥−𝐶4))−1
(22)
where the corresponding values of the parameters for the Equation (22) are presented in
Table 1.
Table 1. Parameters for Equation (22) [20].
Parameters 𝐶1 𝐶2 𝐶3 𝐶4
Equation (22) 4.5810 0.7237 0.0120 0.5280
On the other hand, 𝐽′ values correspond to the derivative of 𝐽 functions and were calculated
from Pitzer [20].
3.2 Ion-interaction parameters in binary aqueous solutions
For pure electrolytes, the ion interaction parameters 𝛽𝑀𝑋(0)
and 𝛽𝑀𝑋(1)
define the second virial
coefficients, which describe the interaction of pairs of oppositely charged ions. In the case
of electrolytes 2-2, one additional term, 𝛽𝑀𝑋(2)
, is added, which reproduces the irregular
behavior in the range below 0.1 m [21]. However, Christov [13] have reported the
additional 𝛽𝑀𝑋(2)
term for copper chloride solutions at 298.15 K.
Some authors have determined the ion interaction parameters of the binary subsystems of
this work (CuSO4-H2O, CuCl2-H2O, Cu(HSO4)2-H2O, Na2SO4-H2O, NaCl-H2O, NaHSO4-
H2O, HSO4-H2O, HCl-H2O, and H2SO4-H2O); some of them proposed models for their
determination over a wide temperature range.
For Na2SO4, the parameters were calculated using the model proposed by Moller [10],
which can be used in the temperature range from 298.15 to 523.15 K. Parameters for NaCl
were determined using the model proposed by Palaban and Pitzer [9], which is valid from
273.15 to 573 K. For HCl, the parameters were taken from Holmes et al. [22], where the
equations were valid over the temperature range from 273 to 523 K. For NaHSO4, HSO4-,
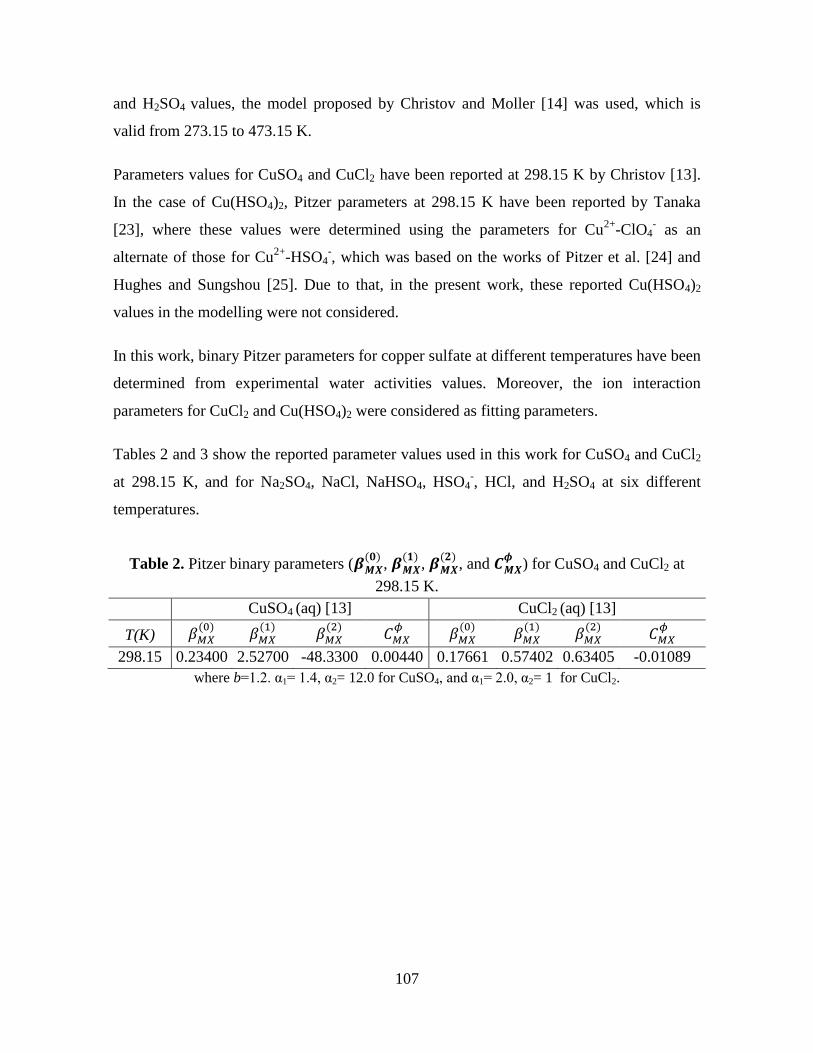
107
and H2SO4 values, the model proposed by Christov and Moller [14] was used, which is
valid from 273.15 to 473.15 K.
Parameters values for CuSO4 and CuCl2 have been reported at 298.15 K by Christov [13].
In the case of Cu(HSO4)2, Pitzer parameters at 298.15 K have been reported by Tanaka
[23], where these values were determined using the parameters for Cu2+
-ClO4- as an
alternate of those for Cu2+
-HSO4-, which was based on the works of Pitzer et al. [24] and
Hughes and Sungshou [25]. Due to that, in the present work, these reported Cu(HSO4)2
values in the modelling were not considered.
In this work, binary Pitzer parameters for copper sulfate at different temperatures have been
determined from experimental water activities values. Moreover, the ion interaction
parameters for CuCl2 and Cu(HSO4)2 were considered as fitting parameters.
Tables 2 and 3 show the reported parameter values used in this work for CuSO4 and CuCl2
at 298.15 K, and for Na2SO4, NaCl, NaHSO4, HSO4-, HCl, and H2SO4 at six different
temperatures.
Table 2. Pitzer binary parameters (𝜷𝑴𝑿(𝟎)
, 𝜷𝑴𝑿(𝟏)
, 𝜷𝑴𝑿(𝟐)
, and 𝑪𝑴𝑿𝝓
) for CuSO4 and CuCl2 at
298.15 K.
CuSO4 (aq) [13] CuCl2 (aq) [13]
T(K) 𝛽𝑀𝑋(0)
𝛽𝑀𝑋(1)
𝛽𝑀𝑋(2)
𝐶𝑀𝑋𝜙
𝛽𝑀𝑋(0)
𝛽𝑀𝑋(1)
𝛽𝑀𝑋(2)
𝐶𝑀𝑋𝜙
298.15 0.23400 2.52700 -48.3300 0.00440 0.17661 0.57402 0.63405 -0.01089
where b=1.2. α1= 1.4, α2= 12.0 for CuSO4, and α1= 2.0, α2= 1 for CuCl2.
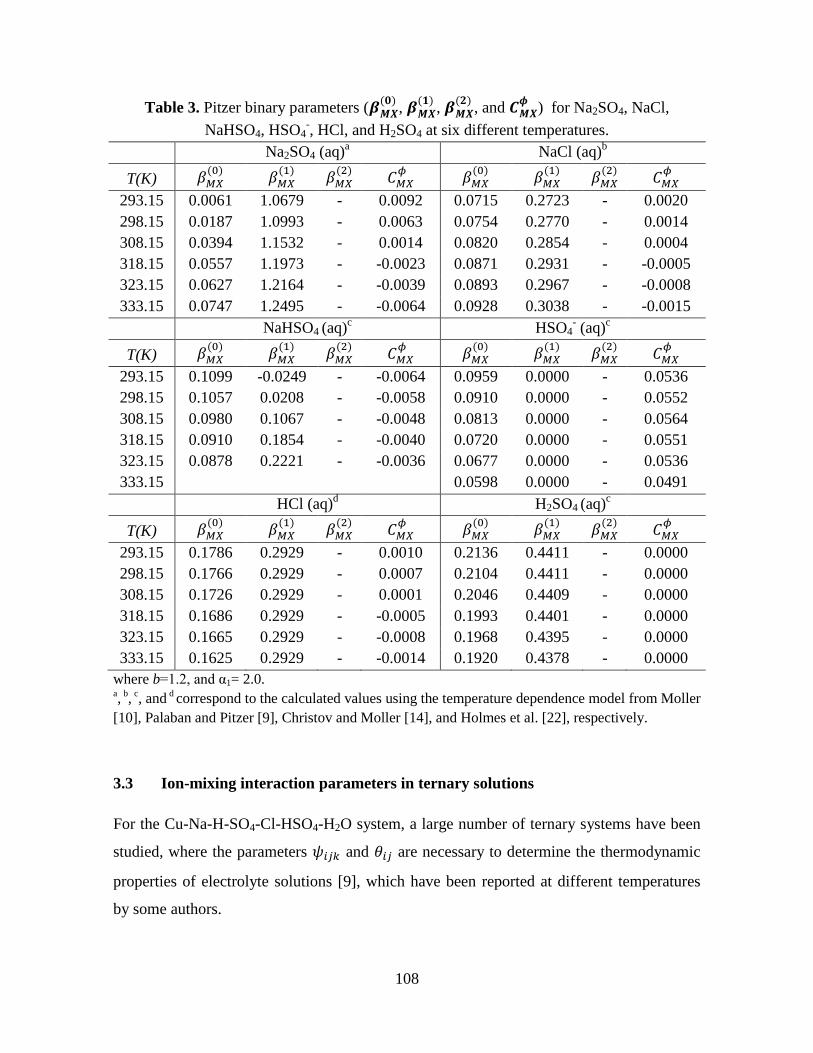
108
Table 3. Pitzer binary parameters (𝜷𝑴𝑿(𝟎)
, 𝜷𝑴𝑿(𝟏)
, 𝜷𝑴𝑿(𝟐)
, and 𝑪𝑴𝑿𝝓
) for Na2SO4, NaCl,
NaHSO4, HSO4-, HCl, and H2SO4 at six different temperatures.
Na2SO4 (aq)a NaCl (aq)
b
T(K) 𝛽𝑀𝑋(0)
𝛽𝑀𝑋(1)
𝛽𝑀𝑋(2)
𝐶𝑀𝑋𝜙
𝛽𝑀𝑋(0)
𝛽𝑀𝑋(1)
𝛽𝑀𝑋(2)
𝐶𝑀𝑋𝜙
293.15 0.0061 1.0679 - 0.0092 0.0715 0.2723 - 0.0020
298.15 0.0187 1.0993 - 0.0063 0.0754 0.2770 - 0.0014
308.15 0.0394 1.1532 - 0.0014 0.0820 0.2854 - 0.0004
318.15 0.0557 1.1973 - -0.0023 0.0871 0.2931 - -0.0005
323.15 0.0627 1.2164 - -0.0039 0.0893 0.2967 - -0.0008
333.15 0.0747 1.2495 - -0.0064 0.0928 0.3038 - -0.0015
NaHSO4 (aq)c HSO4
- (aq)
c
T(K) 𝛽𝑀𝑋(0)
𝛽𝑀𝑋(1)
𝛽𝑀𝑋(2)
𝐶𝑀𝑋𝜙
𝛽𝑀𝑋(0)
𝛽𝑀𝑋(1)
𝛽𝑀𝑋(2)
𝐶𝑀𝑋𝜙
293.15 0.1099 -0.0249 - -0.0064 0.0959 0.0000 - 0.0536
298.15 0.1057 0.0208 - -0.0058 0.0910 0.0000 - 0.0552
308.15 0.0980 0.1067 - -0.0048 0.0813 0.0000 - 0.0564
318.15 0.0910 0.1854 - -0.0040 0.0720 0.0000 - 0.0551
323.15 0.0878 0.2221 - -0.0036 0.0677 0.0000 - 0.0536
333.15 0.0598 0.0000 - 0.0491
HCl (aq)d H2SO4 (aq)
c
T(K) 𝛽𝑀𝑋(0)
𝛽𝑀𝑋(1)
𝛽𝑀𝑋(2)
𝐶𝑀𝑋𝜙
𝛽𝑀𝑋(0)
𝛽𝑀𝑋(1)
𝛽𝑀𝑋(2)
𝐶𝑀𝑋𝜙
293.15 0.1786 0.2929 - 0.0010 0.2136 0.4411 - 0.0000
298.15 0.1766 0.2929 - 0.0007 0.2104 0.4411 - 0.0000
308.15 0.1726 0.2929 - 0.0001 0.2046 0.4409 - 0.0000
318.15 0.1686 0.2929 - -0.0005 0.1993 0.4401 - 0.0000
323.15 0.1665 0.2929 - -0.0008 0.1968 0.4395 - 0.0000
333.15 0.1625 0.2929 - -0.0014 0.1920 0.4378 - 0.0000
where b=1.2, and α1= 2.0. a, b, c, and
d correspond to the calculated values using the temperature dependence model from Moller
[10], Palaban and Pitzer [9], Christov and Moller [14], and Holmes et al. [22], respectively.
3.3 Ion-mixing interaction parameters in ternary solutions
For the Cu-Na-H-SO4-Cl-HSO4-H2O system, a large number of ternary systems have been
studied, where the parameters 𝜓𝑖𝑗𝑘 and 𝜃𝑖𝑗 are necessary to determine the thermodynamic
properties of electrolyte solutions [9], which have been reported at different temperatures
by some authors.
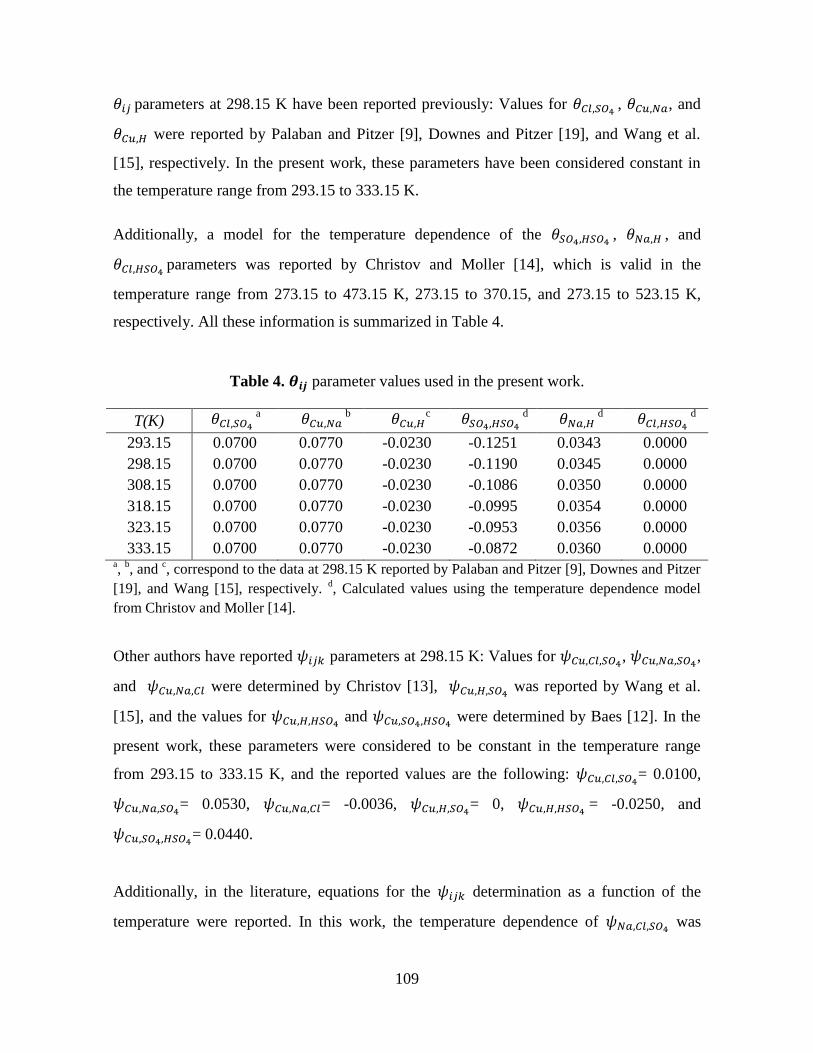
109
𝜃𝑖𝑗 parameters at 298.15 K have been reported previously: Values for 𝜃𝐶𝑙,𝑆𝑂4 , 𝜃𝐶𝑢,𝑁𝑎, and
𝜃𝐶𝑢,𝐻 were reported by Palaban and Pitzer [9], Downes and Pitzer [19], and Wang et al.
[15], respectively. In the present work, these parameters have been considered constant in
the temperature range from 293.15 to 333.15 K.
Additionally, a model for the temperature dependence of the 𝜃𝑆𝑂4,𝐻𝑆𝑂4 , 𝜃𝑁𝑎,𝐻 , and
𝜃𝐶𝑙,𝐻𝑆𝑂4 parameters was reported by Christov and Moller [14], which is valid in the
temperature range from 273.15 to 473.15 K, 273.15 to 370.15, and 273.15 to 523.15 K,
respectively. All these information is summarized in Table 4.
Table 4. 𝜽𝒊𝒋 parameter values used in the present work.
T(K) 𝜃𝐶𝑙,𝑆𝑂4 a 𝜃𝐶𝑢,𝑁𝑎
b 𝜃𝐶𝑢,𝐻
c 𝜃𝑆𝑂4,𝐻𝑆𝑂4
d 𝜃𝑁𝑎,𝐻
d 𝜃𝐶𝑙,𝐻𝑆𝑂4
d
293.15 0.0700 0.0770 -0.0230 -0.1251 0.0343 0.0000
298.15 0.0700 0.0770 -0.0230 -0.1190 0.0345 0.0000
308.15 0.0700 0.0770 -0.0230 -0.1086 0.0350 0.0000
318.15 0.0700 0.0770 -0.0230 -0.0995 0.0354 0.0000
323.15 0.0700 0.0770 -0.0230 -0.0953 0.0356 0.0000
333.15 0.0700 0.0770 -0.0230 -0.0872 0.0360 0.0000 a,
b, and
c, correspond to the data at 298.15 K reported by Palaban and Pitzer [9], Downes and Pitzer
[19], and Wang [15], respectively. d, Calculated values using the temperature dependence model
from Christov and Moller [14].
Other authors have reported 𝜓𝑖𝑗𝑘 parameters at 298.15 K: Values for 𝜓𝐶𝑢,𝐶𝑙,𝑆𝑂4, 𝜓𝐶𝑢,𝑁𝑎,𝑆𝑂4
,
and 𝜓𝐶𝑢,𝑁𝑎,𝐶𝑙 were determined by Christov [13], 𝜓𝐶𝑢,𝐻,𝑆𝑂4 was reported by Wang et al.
[15], and the values for 𝜓𝐶𝑢,𝐻,𝐻𝑆𝑂4 and 𝜓𝐶𝑢,𝑆𝑂4,𝐻𝑆𝑂4
were determined by Baes [12]. In the
present work, these parameters were considered to be constant in the temperature range
from 293.15 to 333.15 K, and the reported values are the following: 𝜓𝐶𝑢,𝐶𝑙,𝑆𝑂4= 0.0100,
𝜓𝐶𝑢,𝑁𝑎,𝑆𝑂4= 0.0530, 𝜓𝐶𝑢,𝑁𝑎,𝐶𝑙= -0.0036, 𝜓𝐶𝑢,𝐻,𝑆𝑂4
= 0, 𝜓𝐶𝑢,𝐻,𝐻𝑆𝑂4 = -0.0250, and
𝜓𝐶𝑢,𝑆𝑂4,𝐻𝑆𝑂4= 0.0440.
Additionally, in the literature, equations for the 𝜓𝑖𝑗𝑘 determination as a function of the
temperature were reported. In this work, the temperature dependence of 𝜓𝑁𝑎,𝐶𝑙,𝑆𝑂4 was
110
determined using the model proposed by Moller [10], which is valid in the temperature
range from 273.15 to 423.15 K. In the case of 𝜓𝐻,𝐶𝑙,𝑆𝑂4, 𝜓𝑁𝑎,𝐻,𝑆𝑂4
, 𝜓𝑁𝑎,𝐻,𝐶𝑙 𝜓𝑁𝑎,𝐻,𝐻𝑆𝑂4,
𝜓𝑁𝑎,𝑆𝑂4,𝐻𝑆𝑂4, 𝜓𝑁𝑎,𝐶𝑙,𝐻𝑆𝑂4
, 𝜓𝐻,𝑆𝑂4,𝐻𝑆𝑂4, and 𝜓𝐻,𝐶𝑙,𝐻𝑆𝑂4
, the temperature dependence was
determined using the model proposed by Christov and Moller [14], which is valid in a wide
temperature range: (273.15 to 523.15 K in the case of 𝜓𝐻,𝐶𝑙,𝑆𝑂4, 𝜓𝑁𝑎,𝐶𝑙,𝐻𝑆𝑂4
, and
𝜓𝐻,𝐶𝑙,𝐻𝑆𝑂4); (273.15 to 370.15 K for 𝜓𝑁𝑎,𝐻,𝑆𝑂4
, 𝜓𝑁𝑎,𝐻,𝐻𝑆𝑂4, 𝜓𝑁𝑎,𝑆𝑂4,𝐻𝑆𝑂4
, and 𝜓𝐻,𝑆𝑂4,𝐻𝑆𝑂4);
and (273.15 to 358.85 K for 𝜓𝑁𝑎,𝐻,𝐶𝑙).
Table 5 shows the calculated 𝜓𝑖𝑗𝑘 values using the temperature dependence model from
Christov and Moller [14] used in the present work.
There is no information in the literature regarding to the 𝜓𝐶𝑢,𝐻,𝐶𝑙 𝜓𝐶𝑢,𝑁𝑎,𝐻𝑆𝑂4 𝜓𝐶𝑢,𝐶𝑙,𝐻𝑆𝑂4
parameters; these values have been considered as fitting parameters constant with the
temperature, and were determined in the present work (cf. section 4.3).
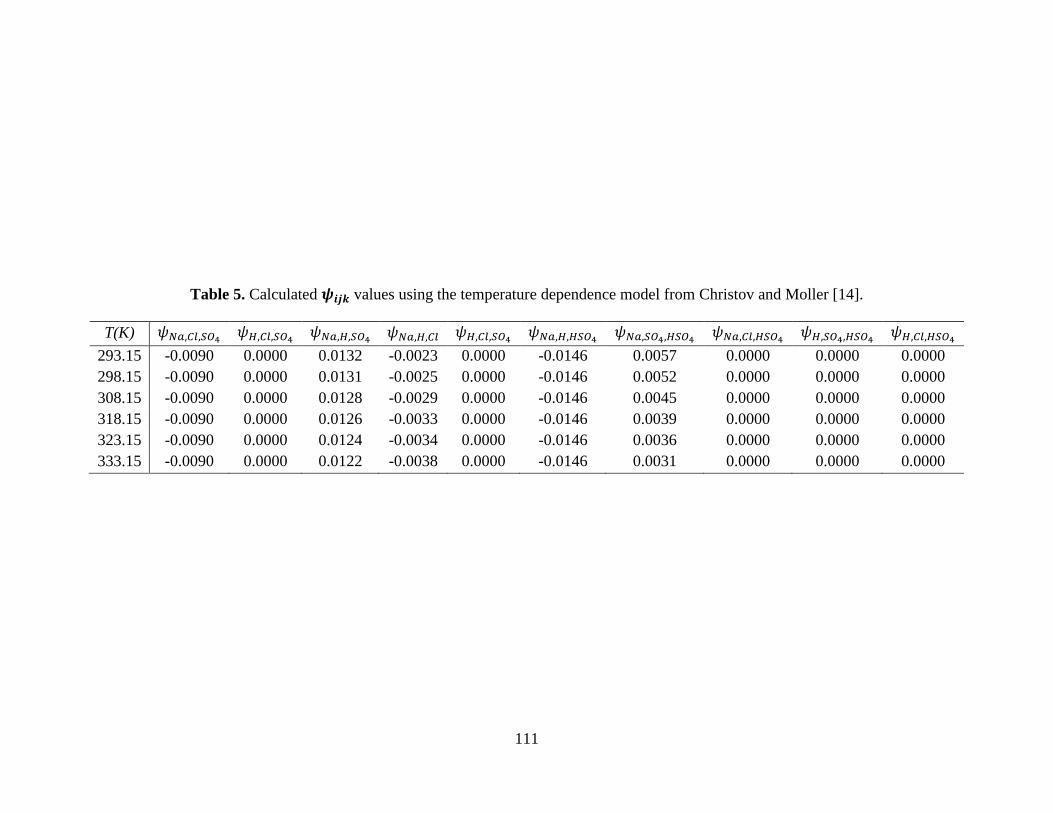
111
Table 5. Calculated 𝝍𝒊𝒋𝒌 values using the temperature dependence model from Christov and Moller [14].
T(K) 𝜓𝑁𝑎,𝐶𝑙,𝑆𝑂4
𝜓𝐻,𝐶𝑙,𝑆𝑂4
𝜓𝑁𝑎,𝐻,𝑆𝑂4
𝜓𝑁𝑎,𝐻,𝐶𝑙 𝜓𝐻,𝐶𝑙,𝑆𝑂4
𝜓𝑁𝑎,𝐻,𝐻𝑆𝑂4 𝜓𝑁𝑎,𝑆𝑂4,𝐻𝑆𝑂4
𝜓𝑁𝑎,𝐶𝑙,𝐻𝑆𝑂4 𝜓𝐻,𝑆𝑂4,𝐻𝑆𝑂4
𝜓𝐻,𝐶𝑙,𝐻𝑆𝑂4
293.15 -0.0090 0.0000 0.0132 -0.0023 0.0000 -0.0146 0.0057 0.0000 0.0000 0.0000
298.15 -0.0090 0.0000 0.0131 -0.0025 0.0000 -0.0146 0.0052 0.0000 0.0000 0.0000
308.15 -0.0090 0.0000 0.0128 -0.0029 0.0000 -0.0146 0.0045 0.0000 0.0000 0.0000
318.15 -0.0090 0.0000 0.0126 -0.0033 0.0000 -0.0146 0.0039 0.0000 0.0000 0.0000
323.15 -0.0090 0.0000 0.0124 -0.0034 0.0000 -0.0146 0.0036 0.0000 0.0000 0.0000
333.15 -0.0090 0.0000 0.0122 -0.0038 0.0000 -0.0146 0.0031 0.0000 0.0000 0.0000
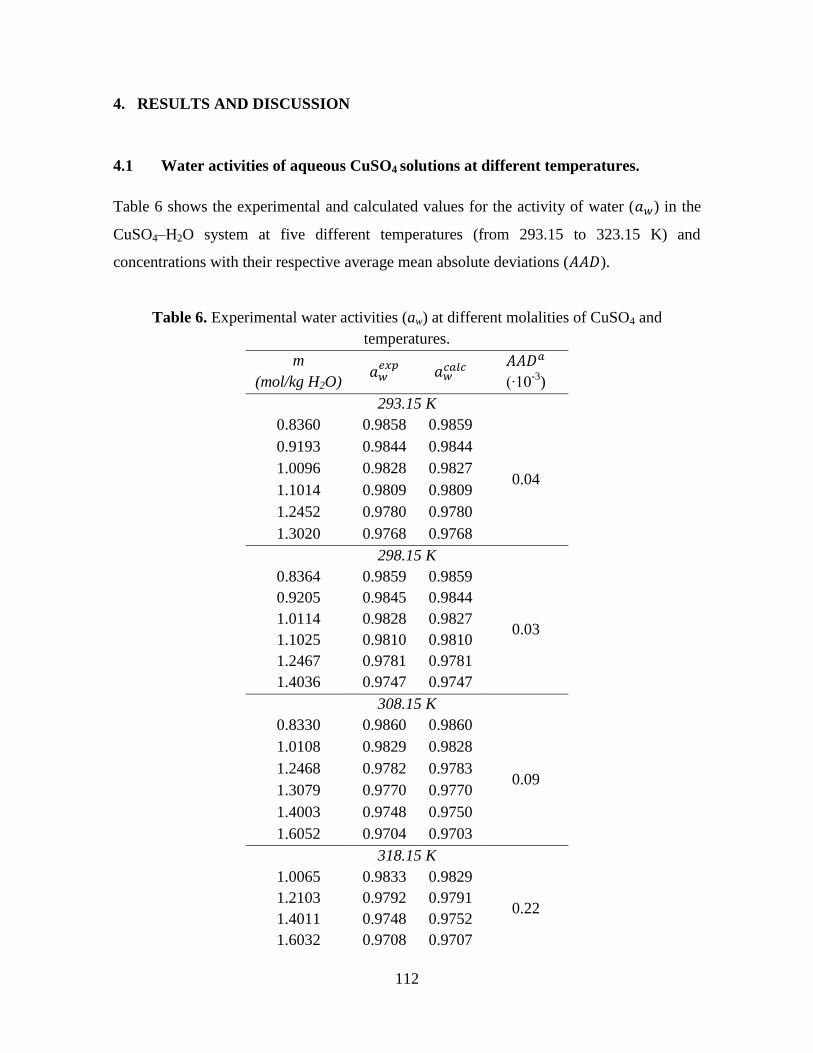
112
4. RESULTS AND DISCUSSION
4.1 Water activities of aqueous CuSO4 solutions at different temperatures.
Table 6 shows the experimental and calculated values for the activity of water (𝑎𝑤) in the
CuSO4–H2O system at five different temperatures (from 293.15 to 323.15 K) and
concentrations with their respective average mean absolute deviations (𝐴𝐴𝐷).
Table 6. Experimental water activities (aw) at different molalities of CuSO4 and
temperatures.
m
(mol/kg H2O) 𝑎𝑤
𝑒𝑥𝑝 𝑎𝑤
𝑐𝑎𝑙𝑐 𝐴𝐴𝐷𝑎
(∙10-3
)
293.15 K
0.8360 0.9858 0.9859
0.04
0.9193 0.9844 0.9844
1.0096 0.9828 0.9827
1.1014 0.9809 0.9809
1.2452 0.9780 0.9780
1.3020 0.9768 0.9768
298.15 K
0.8364 0.9859 0.9859
0.03
0.9205 0.9845 0.9844
1.0114 0.9828 0.9827
1.1025 0.9810 0.9810
1.2467 0.9781 0.9781
1.4036 0.9747 0.9747
308.15 K
0.8330 0.9860 0.9860
0.09
1.0108 0.9829 0.9828
1.2468 0.9782 0.9783
1.3079 0.9770 0.9770
1.4003 0.9748 0.9750
1.6052 0.9704 0.9703
318.15 K
1.0065 0.9833 0.9829
0.22 1.2103 0.9792 0.9791
1.4011 0.9748 0.9752
1.6032 0.9708 0.9707
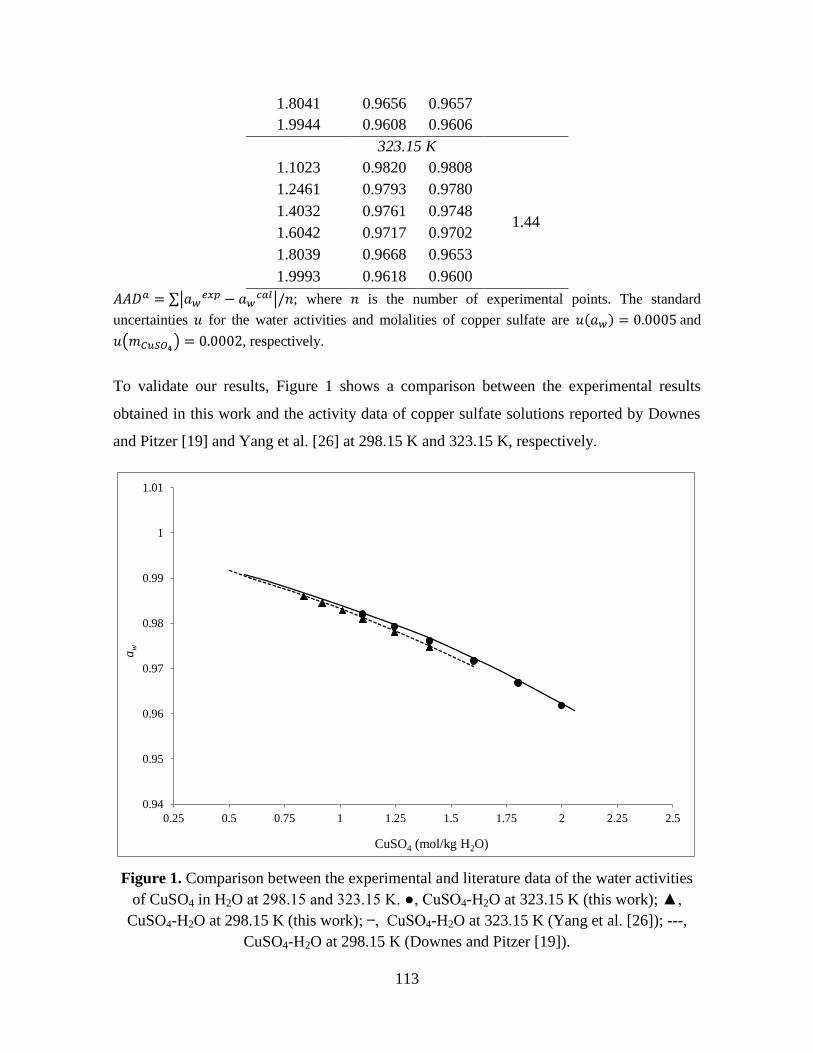
113
1.8041 0.9656 0.9657
1.9944 0.9608 0.9606
323.15 K
1.1023 0.9820 0.9808
1.44
1.2461 0.9793 0.9780
1.4032 0.9761 0.9748
1.6042 0.9717 0.9702
1.8039 0.9668 0.9653
1.9993 0.9618 0.9600
𝐴𝐴𝐷𝑎 = ∑|𝑎𝑤𝑒𝑥𝑝 − 𝑎𝑤
𝑐𝑎𝑙|/𝑛; where 𝑛 is the number of experimental points. The standard
uncertainties 𝑢 for the water activities and molalities of copper sulfate are 𝑢(𝑎𝑤) = 0.0005 and
𝑢(𝑚𝐶𝑢𝑆𝑂4) = 0.0002, respectively.
To validate our results, Figure 1 shows a comparison between the experimental results
obtained in this work and the activity data of copper sulfate solutions reported by Downes
and Pitzer [19] and Yang et al. [26] at 298.15 K and 323.15 K, respectively.
Figure 1. Comparison between the experimental and literature data of the water activities
of CuSO4 in H2O at 298.15 and 323.15 K. ●, CuSO4-H2O at 323.15 K (this work); ▲,
CuSO4-H2O at 298.15 K (this work); , CuSO4-H2O at 323.15 K (Yang et al. [26]); ---,
CuSO4-H2O at 298.15 K (Downes and Pitzer [19]).
0.94
0.95
0.96
0.97
0.98
0.99
1
1.01
0.25 0.5 0.75 1 1.25 1.5 1.75 2 2.25 2.5
aw
CuSO4 (mol/kg H2O)
114
In both cases (298.15 and 323.15 K), the water activity values decrease as the solution
concentration increases. This is attributed to the increment in the number of water
molecules associated with the different ions in the solution [27].
Figure 1 also shows that the temperature has a small effect on the copper sulfate water
activities, where at 323.15 K, the activities are slightly higher than at 298.15 K. These
results agree with those of Guendouzi and Dinane [27], who reported the water activities,
osmotic and activity coefficients of aqueous electrolyte solutions of KCl (aq), Na2SO4 (aq),
and NaNO3 (aq) at different concentrations over a wide temperature range, and concluded
that the water activities are highly affected by the solute concentration; but slightly
influenced by the temperature.
Moreover, the water activities of aqueous solutions of copper sulfate at different
temperatures, have been compared with activities of copper sulfate in seawater [16], where
has been noted that values in freshwater are higher than in seawater, with a mean difference
of 0.0108 due to the seawater salts which lead to an increment in the number of water
molecules associated with the different ions in the solution [27].
4.2 Determination of the Pitzer parameters 𝜷𝑴𝑿(𝟎)
, 𝜷𝑴𝑿(𝟏)
, 𝜷𝑴𝑿(𝟐)
, and 𝑪𝑴𝑿𝝓
for CuSO4,
CuCl2, and Cu(HSO4)2 at different temperatures.
As mentioned in section 3.2, some authors have determined the Pitzer parameters for CuCl2
[19], CuSO4 [19, 28], and Cu(HSO4)2 [23] at 298.15 K.
Pitzer parameters of CuSO4 from 293.15 to 323.15 K were determined from experimental
data of water activities. According to Palaban and Pitzer [9] the activity of water (𝑎𝑤) is
related to the osmotic coefficient (𝜙) by the Equation (23).
∅ = − (1000
𝑣𝑚𝑀𝑤) ln 𝑎𝑤 (23)
115
where 𝑣 is the number of ions released by dissociation, 𝑚 is the molality, and 𝑀𝑤 is the
molecular mass of water.
Additionally, according to Downes and Pitzer [19], the Equation (24) represents the
osmotic coefficient for a salt.
(𝜙 − 1) = |𝑧𝑀𝑧𝑋|𝑓𝜙 + 𝑚2𝑣𝑀𝑣𝑋
𝑣𝐵𝑀𝑋
𝜙+ 𝑚2 2(𝑣𝑀𝑣𝑋)
32
𝑣𝐶𝑀𝑋
𝜙 (24)
where 𝑧𝑀 and 𝑧𝑋 are the charges on the ions 𝑀 and 𝑋, respectively; 𝑚 is the molality;
𝑣 = 𝑣𝑀 + 𝑣𝑋; and 𝐶𝑀𝑋𝜙
is the binary solute specific parameter. 𝑓𝜙 and 𝐵𝑀𝑋𝜙
are defined by:
𝑓𝜙 = −𝐴𝜙 [𝐼
12
(1+𝑏𝐼12)
] (25)
𝐵𝑀𝑋𝜙
= 𝛽𝑀𝑋(0)
+ 𝛽𝑀𝑋(1)
𝑒−𝛼1𝐼12 + 𝛽𝑀𝑋
(2) 𝑒−𝛼2𝐼
12 (26)
In the work of Ning et al. [29] was reported that ion interaction parameters for a single salt
at different temperatures could be expressed using the Equation (27), which is based on the
works of Marliacy et al. [30] and Hovey et al. [31].
𝑃(𝑇) = 𝑃0 + 𝑃1 (1
𝑇−
1
298.15) + 𝑃2 ln (
𝑇
298.15) (27)
where 𝑃 represents 𝛽𝑀𝑋(0)
, 𝛽𝑀𝑋(1)
, 𝛽𝑀𝑋(2)
, and 𝐶𝑀𝑋∅ ; 𝑇 is the temperature in Kelvin; and 𝑃0, 𝑃1,
and 𝑃2 are fitting parameters.
Using the experimental water activity values of copper sulfate in H2O and Equation (27), it
was possible to establish the values of 𝑃0, 𝑃1, and 𝑃2 for the determination of the CuSO4
Pitzer parameters in the temperature range from 293.15 to 323.15 K. In the case of CuCl2
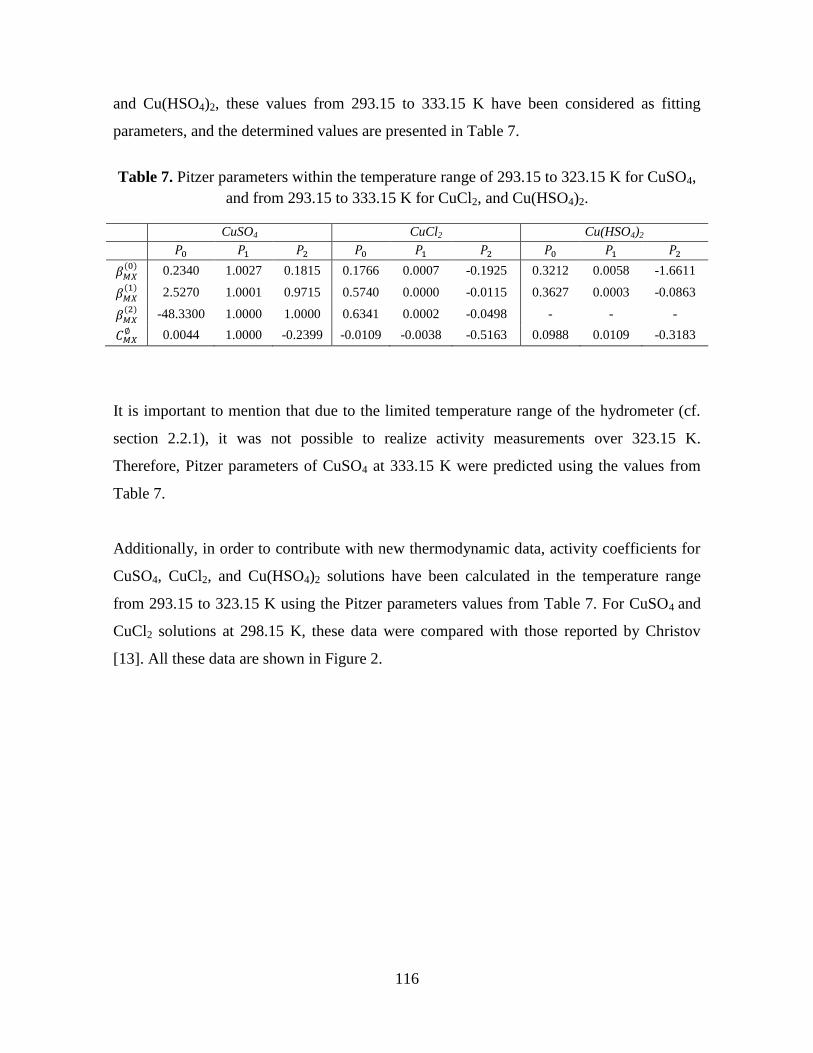
116
and Cu(HSO4)2, these values from 293.15 to 333.15 K have been considered as fitting
parameters, and the determined values are presented in Table 7.
Table 7. Pitzer parameters within the temperature range of 293.15 to 323.15 K for CuSO4,
and from 293.15 to 333.15 K for CuCl2, and Cu(HSO4)2.
CuSO4 CuCl2 Cu(HSO4)2
𝑃0 𝑃1 𝑃2 𝑃0 𝑃1 𝑃2 𝑃0 𝑃1 𝑃2
𝛽𝑀𝑋(0)
0.2340 1.0027 0.1815 0.1766 0.0007 -0.1925 0.3212 0.0058 -1.6611
𝛽𝑀𝑋(1)
2.5270 1.0001 0.9715 0.5740 0.0000 -0.0115 0.3627 0.0003 -0.0863
𝛽𝑀𝑋(2)
-48.3300 1.0000 1.0000 0.6341 0.0002 -0.0498 - - -
𝐶𝑀𝑋∅ 0.0044 1.0000 -0.2399 -0.0109 -0.0038 -0.5163 0.0988 0.0109 -0.3183
It is important to mention that due to the limited temperature range of the hydrometer (cf.
section 2.2.1), it was not possible to realize activity measurements over 323.15 K.
Therefore, Pitzer parameters of CuSO4 at 333.15 K were predicted using the values from
Table 7.
Additionally, in order to contribute with new thermodynamic data, activity coefficients for
CuSO4, CuCl2, and Cu(HSO4)2 solutions have been calculated in the temperature range
from 293.15 to 323.15 K using the Pitzer parameters values from Table 7. For CuSO4 and
CuCl2 solutions at 298.15 K, these data were compared with those reported by Christov
[13]. All these data are shown in Figure 2.
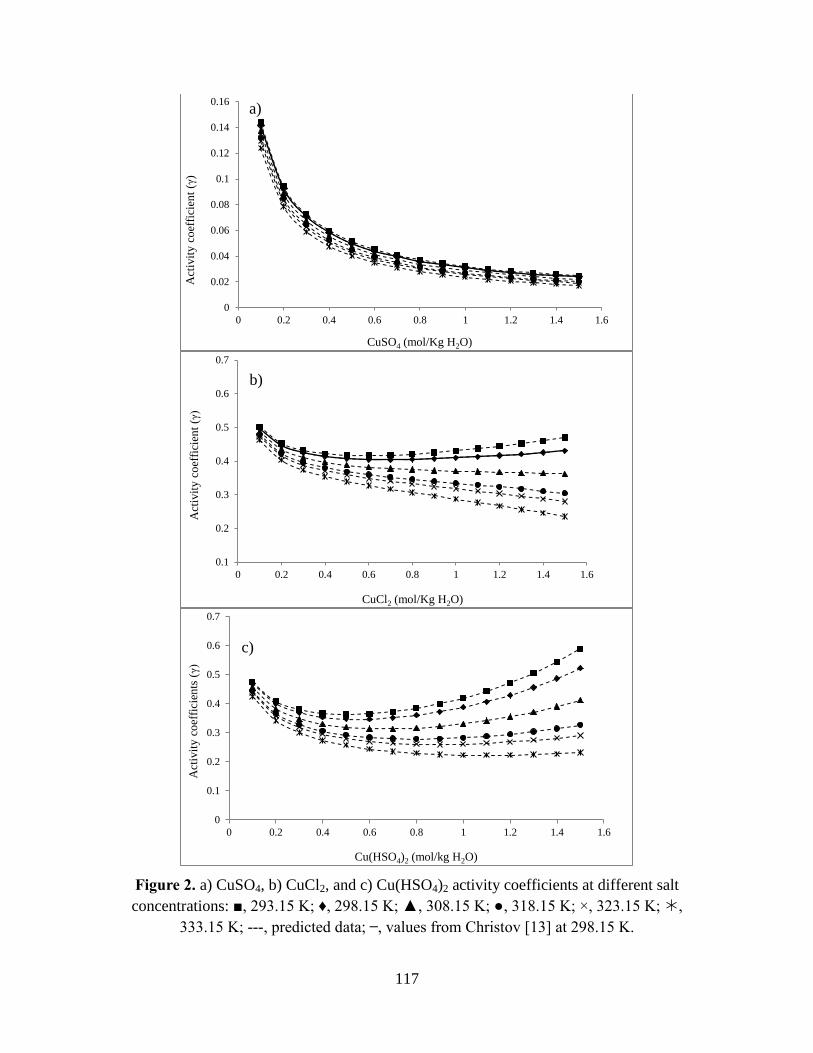
117
Figure 2. a) CuSO4, b) CuCl2, and c) Cu(HSO4)2 activity coefficients at different salt
concentrations: ■, 293.15 K; ♦, 298.15 K; ▲, 308.15 K; ●, 318.15 K; ×, 323.15 K; ,
333.15 K; ---, predicted data; , values from Christov [13] at 298.15 K.
0
0.02
0.04
0.06
0.08
0.1
0.12
0.14
0.16
0 0.2 0.4 0.6 0.8 1 1.2 1.4 1.6
Act
ivit
y c
oef
fici
ent
(γ)
CuSO4 (mol/Kg H2O)
0.1
0.2
0.3
0.4
0.5
0.6
0.7
0 0.2 0.4 0.6 0.8 1 1.2 1.4 1.6
Act
ivit
y c
oef
fici
ent
(γ)
CuCl2 (mol/Kg H2O)
0
0.1
0.2
0.3
0.4
0.5
0.6
0.7
0 0.2 0.4 0.6 0.8 1 1.2 1.4 1.6
Act
ivit
y c
oef
fici
ents
(γ)
Cu(HSO4)2 (mol/kg H2O)
a)
b)
c)
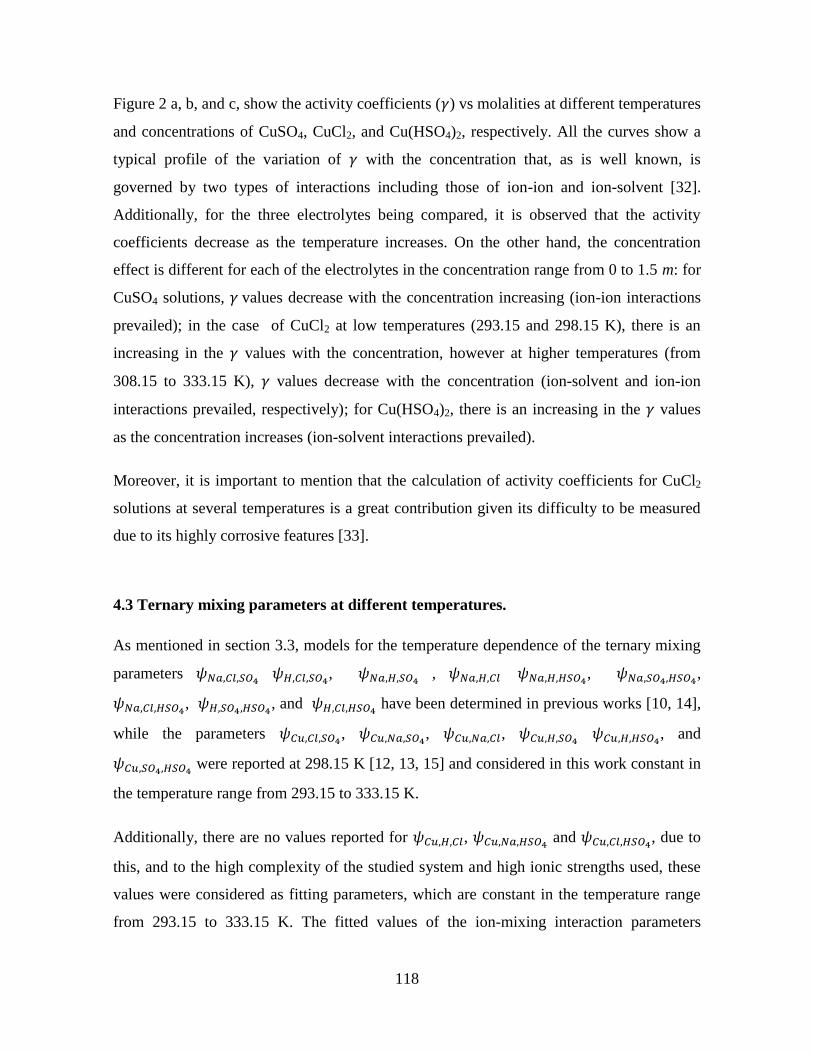
118
Figure 2 a, b, and c, show the activity coefficients (𝛾) vs molalities at different temperatures
and concentrations of CuSO4, CuCl2, and Cu(HSO4)2, respectively. All the curves show a
typical profile of the variation of 𝛾 with the concentration that, as is well known, is
governed by two types of interactions including those of ion-ion and ion-solvent [32].
Additionally, for the three electrolytes being compared, it is observed that the activity
coefficients decrease as the temperature increases. On the other hand, the concentration
effect is different for each of the electrolytes in the concentration range from 0 to 1.5 m: for
CuSO4 solutions, 𝛾 values decrease with the concentration increasing (ion-ion interactions
prevailed); in the case of CuCl2 at low temperatures (293.15 and 298.15 K), there is an
increasing in the 𝛾 values with the concentration, however at higher temperatures (from
308.15 to 333.15 K), 𝛾 values decrease with the concentration (ion-solvent and ion-ion
interactions prevailed, respectively); for Cu(HSO4)2, there is an increasing in the 𝛾 values
as the concentration increases (ion-solvent interactions prevailed).
Moreover, it is important to mention that the calculation of activity coefficients for CuCl2
solutions at several temperatures is a great contribution given its difficulty to be measured
due to its highly corrosive features [33].
4.3 Ternary mixing parameters at different temperatures.
As mentioned in section 3.3, models for the temperature dependence of the ternary mixing
parameters 𝜓𝑁𝑎,𝐶𝑙,𝑆𝑂4 𝜓𝐻,𝐶𝑙,𝑆𝑂4
, 𝜓𝑁𝑎,𝐻,𝑆𝑂4 , 𝜓𝑁𝑎,𝐻,𝐶𝑙 𝜓𝑁𝑎,𝐻,𝐻𝑆𝑂4
, 𝜓𝑁𝑎,𝑆𝑂4,𝐻𝑆𝑂4,
𝜓𝑁𝑎,𝐶𝑙,𝐻𝑆𝑂4, 𝜓𝐻,𝑆𝑂4,𝐻𝑆𝑂4
, and 𝜓𝐻,𝐶𝑙,𝐻𝑆𝑂4 have been determined in previous works [10, 14],
while the parameters 𝜓𝐶𝑢,𝐶𝑙,𝑆𝑂4, 𝜓𝐶𝑢,𝑁𝑎,𝑆𝑂4
, 𝜓𝐶𝑢,𝑁𝑎,𝐶𝑙, 𝜓𝐶𝑢,𝐻,𝑆𝑂4 𝜓𝐶𝑢,𝐻,𝐻𝑆𝑂4
, and
𝜓𝐶𝑢,𝑆𝑂4,𝐻𝑆𝑂4 were reported at 298.15 K [12, 13, 15] and considered in this work constant in
the temperature range from 293.15 to 333.15 K.
Additionally, there are no values reported for 𝜓𝐶𝑢,𝐻,𝐶𝑙, 𝜓𝐶𝑢,𝑁𝑎,𝐻𝑆𝑂4 and 𝜓𝐶𝑢,𝐶𝑙,𝐻𝑆𝑂4
, due to
this, and to the high complexity of the studied system and high ionic strengths used, these
values were considered as fitting parameters, which are constant in the temperature range
from 293.15 to 333.15 K. The fitted values of the ion-mixing interaction parameters
119
determined in the present work are: 𝜓𝐶𝑢,𝐻,𝐶𝑙= 0.0036, 𝜓𝐶𝑢,𝑁𝑎,𝐻𝑆𝑂4= 0.0957, and
𝜓𝐶𝑢,𝐶𝑙,𝐻𝑆𝑂4= -0.0990.
4.4 Solubility products of copper sulfate pentahydrate at different temperatures
The solubility product (𝐾𝑠𝑝) is a value that can be obtained from the solubility, activity
coefficient and water activity of copper sulfate in H2O (without acid). These 𝐾𝑠𝑝 values at
different temperatures (from 293.15 to 333.15 K) were determined by the following
expression reported by Lovera et al. [17].
𝐾𝑠𝑝𝐶𝑢𝑆𝑂4∙5𝐻2𝑂 = (𝑚𝐶𝑢𝑆𝑂4
)2
( 𝛾±𝐶𝑢𝑆𝑂4
)2
(𝑎𝑤)5 (28)
From Equation (28), the copper sulfate saturation molality in the ternary system is obtained
by:
𝑚𝐶𝑢𝑆𝑂4= [
(𝐾𝑠𝑝𝐶𝑢𝑆𝑂4∙5𝐻2𝑂)
(( 𝛾±𝐶𝑢𝑆𝑂4
)2
(𝑎𝑤)5)]
1
2
(29)
Table 8 shows the solubility product, activity coefficient, and water activity values of
copper sulfate in the temperature range from 293.15 to 333.15 K. At 333.15 K these values
were calculated using predicted Pitzer parameters of CuSO4 (Table 7). Moreover, solubility
values of copper sulfate (in mol/kg H2O) in the absence of acid [34] were used for the
calculations.
Table 8. Values of activity coefficients, water activities, and solubility products at different
copper sulfate concentrations and temperatures.
𝑇(K) 𝑚 (mol/kg H2O) 𝛾±𝐶𝑢𝑆𝑂4
𝑎𝑤 𝐾𝑠𝑝𝐶𝑢𝑆𝑂4∙5𝐻2𝑂
293.15 1.26023 0.03961 0.97767 0.00223
298.15 1.39404 0.03679 0.97523 0.00232
308.15 1.63900 0.03197 0.97104 0.00237
318.15 1.97317 0.02714 0.96535 0.00240
323.15 2.12206 0.02496 0.96332 0.00233
333.15* 2.46750 0.02060 0.95951 0.00211
* calculated values using predicted Pitzer parameters of CuSO4 at 333.15 K.
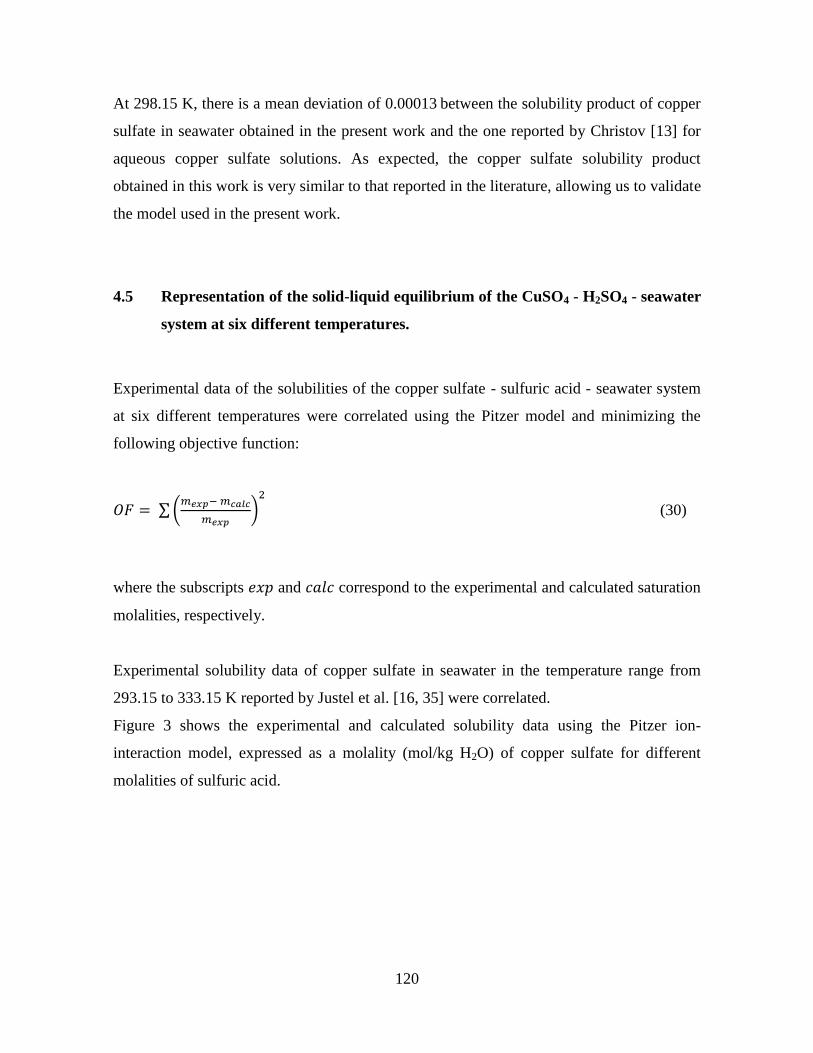
120
At 298.15 K, there is a mean deviation of 0.00013 between the solubility product of copper
sulfate in seawater obtained in the present work and the one reported by Christov [13] for
aqueous copper sulfate solutions. As expected, the copper sulfate solubility product
obtained in this work is very similar to that reported in the literature, allowing us to validate
the model used in the present work.
4.5 Representation of the solid-liquid equilibrium of the CuSO4 - H2SO4 - seawater
system at six different temperatures.
Experimental data of the solubilities of the copper sulfate - sulfuric acid - seawater system
at six different temperatures were correlated using the Pitzer model and minimizing the
following objective function:
𝑂𝐹 = ∑ (𝑚𝑒𝑥𝑝− 𝑚𝑐𝑎𝑙𝑐
𝑚𝑒𝑥𝑝)
2
(30)
where the subscripts 𝑒𝑥𝑝 and 𝑐𝑎𝑙𝑐 correspond to the experimental and calculated saturation
molalities, respectively.
Experimental solubility data of copper sulfate in seawater in the temperature range from
293.15 to 333.15 K reported by Justel et al. [16, 35] were correlated.
Figure 3 shows the experimental and calculated solubility data using the Pitzer ion-
interaction model, expressed as a molality (mol/kg H2O) of copper sulfate for different
molalities of sulfuric acid.
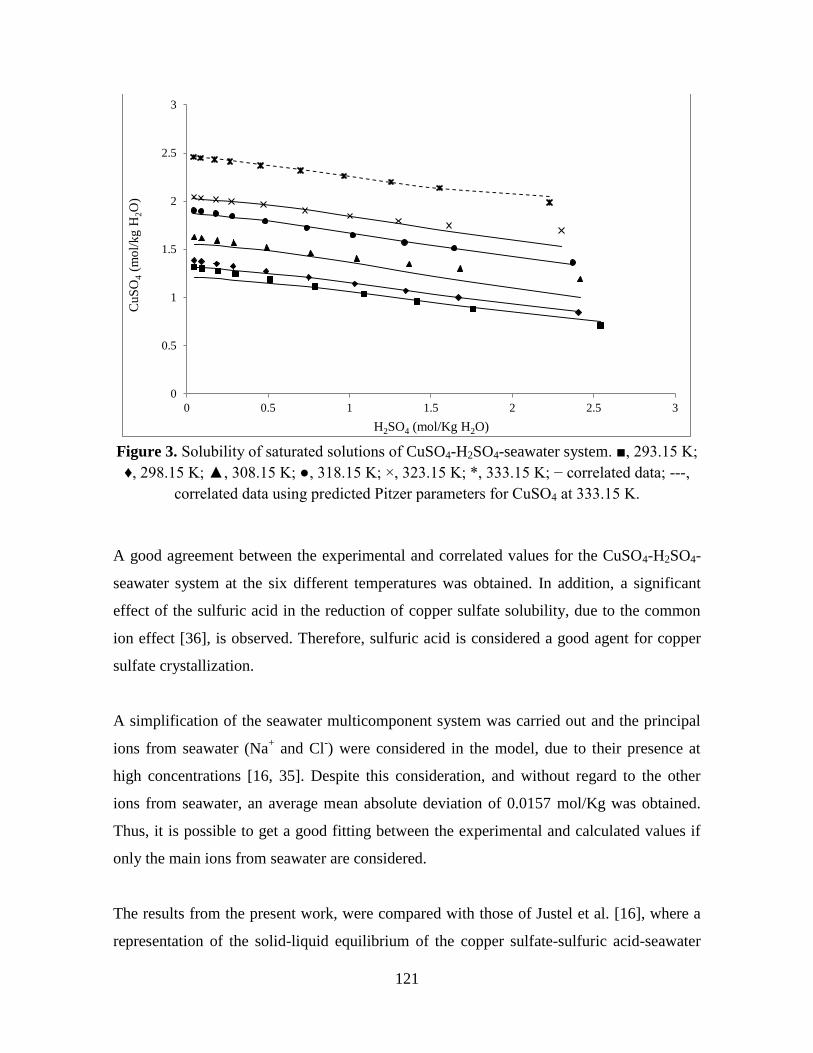
121
Figure 3. Solubility of saturated solutions of CuSO4-H2SO4-seawater system. ■, 293.15 K;
♦, 298.15 K; ▲, 308.15 K; ●, 318.15 K; ×, 323.15 K; *, 333.15 K; − correlated data; ---,
correlated data using predicted Pitzer parameters for CuSO4 at 333.15 K.
A good agreement between the experimental and correlated values for the CuSO4-H2SO4-
seawater system at the six different temperatures was obtained. In addition, a significant
effect of the sulfuric acid in the reduction of copper sulfate solubility, due to the common
ion effect [36], is observed. Therefore, sulfuric acid is considered a good agent for copper
sulfate crystallization.
A simplification of the seawater multicomponent system was carried out and the principal
ions from seawater (Na+ and Cl
-) were considered in the model, due to their presence at
high concentrations [16, 35]. Despite this consideration, and without regard to the other
ions from seawater, an average mean absolute deviation of 0.0157 mol/Kg was obtained.
Thus, it is possible to get a good fitting between the experimental and calculated values if
only the main ions from seawater are considered.
The results from the present work, were compared with those of Justel et al. [16], where a
representation of the solid-liquid equilibrium of the copper sulfate-sulfuric acid-seawater
0
0.5
1
1.5
2
2.5
3
0 0.5 1 1.5 2 2.5 3
CuS
O4 (
mo
l/kg H
2O
)
H2SO4 (mol/Kg H2O)
122
system at different temperatures was performed considering seawater as a solvent,
obtaining an AAD of 0.0062 mol/kg. This comparison allows concluding that the
correlation of solubilities in seawater systems could be performed only considering sodium
and chloride as part of the seawater, without regard to the effect of the other ions, which do
not have a significant influence in the modelling.
Among the greatest contributions of the present work are that the ion-interaction model of
Pitzer has been successfully used to predict the solubilities of an electrolyte in a system as
complex as natural seawater, which makes it a suitable model to be applied to mining
processes using seawater. Additionally, in this work new binary and ternary Pitzer
parameters in a wide temperature range have been determined; these values can be used to
predict solubilities of other solid-liquid systems (ternary, quaternary, quinary, etc.) where
the Cu2+
, Na+, H
+, SO4
2-, Cl
-, HSO4
-, ions are involved.
In a future work, it would be interesting to consider other ions as part of the seawater, in
order to determine their influence in the modelling.
123
5. CONCLUSIONS
This is the first work that applies Pitzer’s ion interaction model to mining processes using
seawater, where binary and ternary Pitzer parameters of the Cu-Na-H-SO4-Cl-HSO4-H2O
system at different temperatures were determined. Additionally, experimental water
activities of copper sulfate solutions at different temperatures were obtained, where it was
concluded that the water activities are highly affected by the solute concentration, but
slightly influenced by the temperature.
The ion interaction model of Pitzer was successfully used to determine the solubilities of
the CuSO4-H2SO4-seawater system at six different temperatures by modelling the Cu-Na-
H-SO4-Cl-HSO4-H2O system. Although only sodium and chloride ions were considered as
seawater components, a good agreement between the experimental and correlated values
was obtained, with an 𝐴𝐴𝐷 of 0.0157 mol/kg.
ACKNOWLEDGEMENTS: Funding for this research was provided by CONICYT
(Fondecyt Project 1140169 and grant 21130894).
124
6. REFERENCES
[1] D. Milligan, H. Moyer, Crystallization in the Copper sulphate - Sulphuric acid - Water
system, ENG MIN J, 176 (1975) 85-89.
[2] M. Giulietti, S. Derenzo, J. Nývlt, L. Ishida, Crystallization of copper sulphate, Crystal
Research and Technology, 30 (1995) 177-183.
[3] H.W. Richardson, Handbook of copper compounds and applications, CRC Press1997.
[4] L.A. Cisternas, L. Moreno, El agua de mar en la minería: Fundamentos y aplicaciones,
RIL editores, 2014, pp. 234.
[5] H.R. Galleguillos, T.A. Graber, M.E. Taboada, F.F. Hernandez-Luis, Activity of Water
in the KI+ KNO3+ H2O Ternary System at 298.15 K, Journal of Chemical & Engineering
Data, 48 (2003) 851-855.
[6] K.S. Pitzer, Thermodynamics of electrolytes. I. Theoretical basis and general equations,
The Journal of Physical Chemistry, 77 (1973) 268-277.
[7] K.S. Pitzer, J.J. Kim, Thermodynamics of electrolytes. IV. Activity and osmotic
coefficients for mixed electrolytes, Journal of the American Chemical Society, 96 (1974)
5701-5707.
[8] C.E. Harvie, J.H. Weare, The prediction of mineral solubilities in natural waters: the
Na-K-Mg-Ca-Cl-SO4-H2O system from zero to high concentration at 25 °C, Geochimica et
Cosmochimica Acta, 44 (1980) 981-997.
[9] R.T. Pabalan, K.S. Pitzer, Thermodynamics of concentrated electrolyte mixtures and the
prediction of mineral solubilities to high temperatures for mixtures in the system Na-K-Mg-
Cl-SO4-OH-H2O, Geochimica et Cosmochimica Acta, 51 (1987) 2429-2443.
[10] N. Møller, The prediction of mineral solubilities in natural waters: A chemical
equilibrium model for the Na-Ca-Cl-SO4-H2O system, to high temperature and
concentration, Geochimica et Cosmochimica Acta, 52 (1988) 821-837.
125
[11] J.P. Greenberg, N. Møller, The prediction of mineral solubilities in natural waters: A
chemical equilibrium model for the Na-K-Ca-Cl-SO4-H2O system to high concentration
from 0 to 250 C, Geochimica et Cosmochimica Acta, 53 (1989) 2503-2518.
[12] C. Baes Jr, E. Reardon, B.A. Moyer, Ion interaction model applied to the cupric
sulfate-sulfuric acid-water system at 25°C, The Journal of Physical Chemistry, 97 (1993)
12343-12348.
[13] C. Christov, Thermodynamic study of the Na-Cu-Cl-SO4-H2O system at the
temperature 298.15 K, The Journal of Chemical Thermodynamics, 32 (2000) 285-295.
[14] C. Christov, N. Moller, Chemical equilibrium model of solution behavior and
solubility in the H-Na-K-OH-Cl-HSO4-SO4-H2O system to high concentration and
temperature, Geochimica et Cosmochimica Acta, 68 (2004) 1309-1331.
[15] W. Wang, D. Zeng, X. Yin, Q. Chen, Prediction and measurement of gypsum
solubility in the systems CaSO4+ HMSO4+ H2SO4+ H2O (HM= Cu, Zn, Ni, Mn) at 298.15
K, Industrial & Engineering Chemistry Research, 51 (2012) 5124-5134.
[16] F.J. Justel, M.E. Taboada, Y.P. Jimenez, Solid–liquid equilibrium and copper sulfate
crystallization process design from a sulfuric-acid–seawater system in the temperature
range from 293.15 to 333.15 K, (2017).
[17] J.A. Lovera, A.P. Padilla, H.R. Galleguillos, Correlation of the solubilities of alkali
chlorides in mixed solvents: Polyethylene glycol + H2O and Ethanol + H2O, Calphad, 38
(2012) 35-42.
[18] S. Clegg, M. Whitfield, Activity coefficients in natural waters, Activity coefficients in
electrolyte solutions, 2 (1991).
[19] C.J. Downes, K.S. Pitzer, Thermodynamics of electrolytes. Binary mixtures formed
from aqueous NaCl, Na2SO4, CuCl2, and CuSO4, at 25°C, Journal of Solution Chemistry, 5
(1976) 389-398.
126
[20] K.S. Pitzer, Thermodynamics of electrolytes. V. Effects of higher-order electrostatic
terms, Journal of Solution Chemistry, 4 (1975) 249-265.
[21] H.T. Kim, W.J. Frederick Jr, Evaluation of Pitzer ion interaction parameters of
aqueous electrolytes at 25°C. 1. Single salt parameters, Journal of Chemical and
Engineering Data, 33 (1988) 177-184.
[22] H. Holmes, R. Busey, J.M. Simonson, R.E. Mesmer, D. Archer, R. Wood, The
enthalpy of dilution of HCl (aq) to 648 K and 40 MPa thermodynamic properties, The
Journal of Chemical Thermodynamics, 19 (1987) 863-890.
[23] M. Tanaka, Modelling of solvent extraction equilibria of Cu (II) from nitric and
hydrochloric acid solutions with (β-hydroxyoxime), Hydrometallurgy, 24 (1990) 317-331.
[24] K.S. Pitzer, R.N. Roy, L.F. Silvester, Thermodynamics of electrolytes. 7. Sulfuric
acid, Journal of the American Chemical Society, 99 (1977) 4930-4936.
[25] M.A. Hughes, S. Hou, Equilibria in the system cobalt di-2-ethylhexylphosphoric
acid/water, Journal of Chemical and Engineering Data, 31 (1986) 4-11.
[26] H. Yang, D. Zeng, W. Voigt, G. Hefter, S. Liu, Q. Chen, Isopiestic measurements on
aqueous solutions of heavy metal sulfates: MSO4+ H2O (M= Mn, Co, Ni, Cu, Zn). 1. T=
323.15 K, Journal of Chemical & Engineering Data, 59 (2013) 97-102.
[27] M. El Guendouzi, A. Dinane, Determination of water activities, osmotic and activity
coefficients in aqueous solutions using the hygrometric method, The Journal of Chemical
Thermodynamics, 32 (2000) 297-310.
[28] K.S. Pitzer, G. Mayorga, Thermodynamics of electrolytes. III. Activity and osmotic
coefficients for 2–2 electrolytes, Journal of Solution Chemistry, 3 (1974) 539-546.
[29] P. Ning, W. Xu, H. Cao, X. Lin, H. Xu, Determination and modeling for the solubility
of Na2MoO4·2H2O in the (Na++
MoO42−
+ SO42−
) system, The Journal of Chemical
Thermodynamics, 94 (2016) 67-73.
127
[30] P. Marliacy, R. Solimando, M. Bouroukba, L. Schuffenecker, Thermodynamics of
crystallization of sodium sulfate decahydrate in H2O–NaCl–Na2SO4: application to
Na2SO4·10H2O-based latent heat storage materials, Thermochimica Acta, 344 (2000) 85-
94.
[31] J.K. Hovey, K.S. Pitzer, J.A. Rard, Thermodynamics of Na2SO4 (aq) at temperatures T
from 273 K to 373 K and of ((1-y)H2SO4+ yNa2SO4)(aq) at T= 298.15 K, The Journal of
Chemical Thermodynamics, 25 (1993) 173-192.
[32] J.O.M. Bockris, A.K.N. Reddy, Modern Electrochemistry, in: N.Y. Reverté (Ed.),
1979.
[33] J. Rard, Isopiestic investigation of water activities of aqueous NiCl2 and CuCl2
solutions and the thermodynamic solubility product of NiCl2·6H2O at 298.15 K, Journal of
Chemical and Engineering Data, 37 (1992) 433-442.
[34] W. Linke, A. Seidell, Solubilities of Inorganic and Metal-organic Compounds, (1965),
ACS, Washington DC.
[35] F. Justel, M. Claros, M. Taboada, Solubilities and physical properties of saturated
solutions in the copper sulfate + sulfuric acid + seawater system at different temperatures,
Brazilian Journal of Chemical Engineering, 32 (2015) 629-635.
[36] L.A. Cisternas, Diagramas de fases y su aplicación, Reverte 2009.
128
CHAPTER VI
CRYSTALLIZATION OF COPPER SULFATE PENTAHYDRATE IN ABSENCE
AND PRESENCE OF SODIUM CHLORIDE
F.J. Justel1, D.M. Camacho
2, M.E. Taboada
1, and K. J. Roberts
2*
1Department of Chemical Engineering and Mineral Processing,
University of Antofagasta,
Antofagasta, Chile
2School of Chemical and Process Engineering, University of Leeds, Leeds, United Kingdom
ABSTRACT
The recrystallization of copper sulfate represents an important unit operation in copper
mining and recovery. The effect of sodium chloride on the shape, size, composition and
growth kinetics of copper sulfate pentahydrate crystals is assessed and compared with
results in freshwater, in order to understand the effect of the principal ions present in
seawater (Na+ and Cl
-) in the crystallization process. The solubility of copper sulfate in
sodium chloride media is found to be slightly lower than in pure aqueous solutions. The
cooling rate and sodium chloride concentration are observed to have an effect in the crystal
shape and size of the copper sulfate crystals albeit the purity of crystals is not significantly
affected by the sodium chloride concentration used.
Analysis of the crystal growth kinetics reveals a significant dependence on the growth
environment, in which the growth of the (1-10) and (1-1-1) faces of crystals grown in
aqueous solutions is consistent with the power law and BCF mechanisms respectively. In
contrast for crystals grown in sodium chloride media the results suggest that both the (1-10)
and (1-1-1) faces grow via the BCF mechanism. This difference in the face-specific growth
mechanisms, in the different crystallization media, is evidenced in the crystal shape
revealing slightly more elongated crystals in aqueous solutions.
Keywords: Copper sulfate, Sodium Chloride, Solubility, Activity Coefficients, Crystal
Growth Kinetics and Morphology.
129
1. INTRODUCTION
Copper mining is the most significant economic activity on the north side of Chile,
however, in the dominant mining region close to the Atacama Desert, mining industries
have required innovative solutions for the optimization of water consumption and have
started to use seawater in their productive processes [1].
Copper sulfate pentahydrate is an important industrial compound of copper due to the wide
range of commercial uses [2-4]. In Chile, some mining companies crystallize this salt from
hydrometallurgical processes using freshwater, where copper is obtained from ores
containing oxidized copper minerals [5]. However, in order to be able to minimize the use
of freshwater in the crystallization process, seawater is now being used for the
crystallization of copper sulfate pentahydrate and the impact of this needs to be assessed.
Copper sulfate pentahydrate (CuSO4·5H2O), also called, bluestone, and blue vitriol, is
found in nature as the mineral chalcanthite [4]. It belongs to the triclinic system
crystallizing in space group P1 with unit-cell parameters: a = 6.1224 (4) Å; b = 10.7223 (4)
Å; c = 5.9681 Å; α = 82.35 (2)°; β = 107.33 (2)°; γ = 102.60 (4)°; V = 364.02 (3) Å3; Z = 2;
D = 2.278 g/cm3. Figure 1 shows the crystal habit of copper sulfate pentahydrate crystals
which is a combination of pinacoids [6].
Figure 1. Habit of CuSO4·5H2O crystal [6].
Copper sulfate pentahydrate crystallization studies using freshwater have been carried out
by several authors: Ishii and Fujita [7], examined the stability of copper sulfate aqueous
solutions at the first supersaturation concentration, in a batchwise stirred reactor, using
different temperatures and stirring rates. Zumstein and Rosseau [8] have focused their work
130
on the agglomerates formation during the batch and continuous copper sulfate
crystallization. Giulietti et al. [2, 9, 10], characterized the copper sulfate pentahydrate
crystallization from batch cooling experiments, and studied the effect of additives on the
crystallization. Manomenova et al. [6] developed a technique for growing large single
crystals for application as optical filters, analyzing the transmission spectra, associated
impurities, thermal stability, and crystal structure.
However, little information is available in the literature regarding the effect of seawater as a
recrystallization solvent. Hernández et al. [11] provided experimental data of solubilities
and physical properties (density, refractive index, ionic conductivity, and viscosity) of
CuSO4 in seawater at various temperatures and at pH 2. Justel et al. [12], studied the
influence of seawater on the solid-liquid equilibrium, and physical properties (density and
viscosity) in copper sulfate solutions at four different temperatures and ten different sulfuric
acid concentrations. Then, Justel et al. [13] determined solubilities and water activities
values of copper sulfate in seawater at different temperatures, and used this information to
represent the solid-liquid equilibrium of copper sulfate-sulfuric acid-seawater system by
means of a methodology that uses the Pitzer and the Born model to quantify the relative
impact of copper sulfate and sulfuric acid effect, respectively on the phase diagram.
Additionally, the precipitated amounts of copper sulfate as a function of the sulfuric acid
concentration were predicted [11-13]. In these studies the sodium chloride concentration
present in seawater was 2.4 wt %, and the experimental data were correlated obtaining
relevant information for the design of copper sulfate pentahydrate plants, using seawater as
a solvent and the addition of sulfuric acid as the crystallization initiator.
The impact of sodium chloride on crystallization processes have been studied previously:
Brandse et al. [14], studied the NaCl effect in the growth kinetics of calcium sulfate
dehydrate and Sheikholeslami and Ong [15] examined the salinity effect on the CaCO3 and
CaSO4 crystallization, where different NaCl concentrations were used to study the crystal
structure and size, among others.
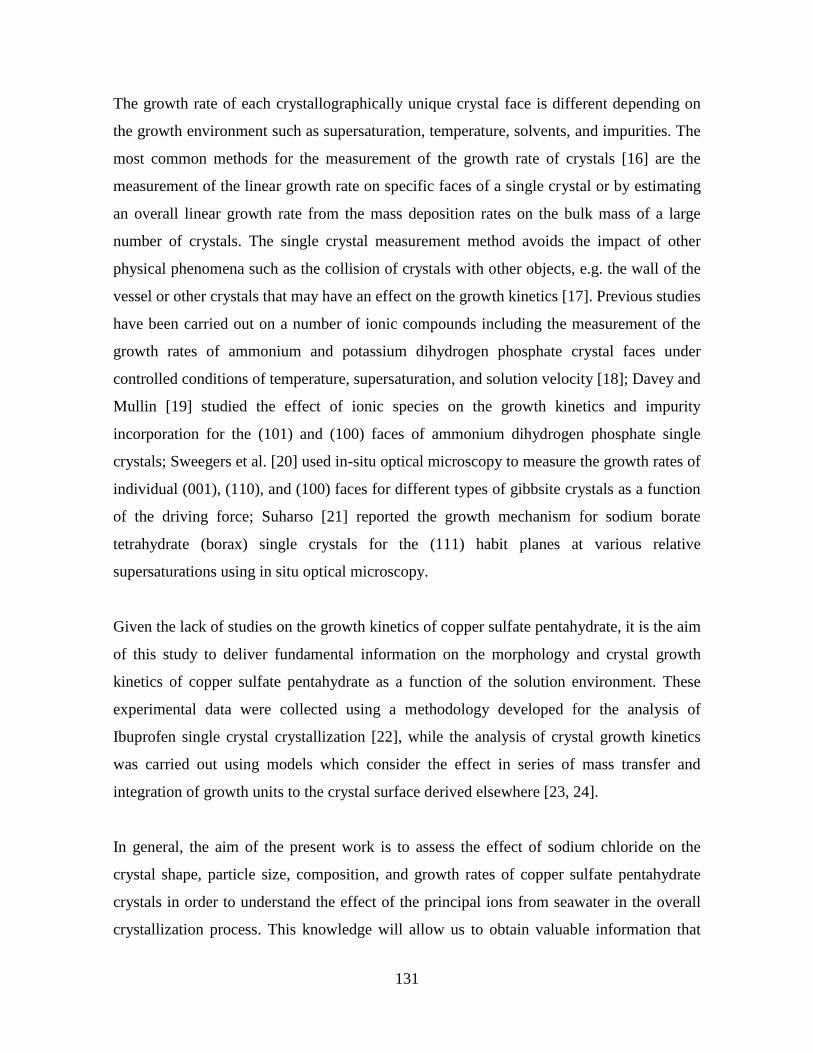
131
The growth rate of each crystallographically unique crystal face is different depending on
the growth environment such as supersaturation, temperature, solvents, and impurities. The
most common methods for the measurement of the growth rate of crystals [16] are the
measurement of the linear growth rate on specific faces of a single crystal or by estimating
an overall linear growth rate from the mass deposition rates on the bulk mass of a large
number of crystals. The single crystal measurement method avoids the impact of other
physical phenomena such as the collision of crystals with other objects, e.g. the wall of the
vessel or other crystals that may have an effect on the growth kinetics [17]. Previous studies
have been carried out on a number of ionic compounds including the measurement of the
growth rates of ammonium and potassium dihydrogen phosphate crystal faces under
controlled conditions of temperature, supersaturation, and solution velocity [18]; Davey and
Mullin [19] studied the effect of ionic species on the growth kinetics and impurity
incorporation for the (101) and (100) faces of ammonium dihydrogen phosphate single
crystals; Sweegers et al. [20] used in-situ optical microscopy to measure the growth rates of
individual (001), (110), and (100) faces for different types of gibbsite crystals as a function
of the driving force; Suharso [21] reported the growth mechanism for sodium borate
tetrahydrate (borax) single crystals for the (111) habit planes at various relative
supersaturations using in situ optical microscopy.
Given the lack of studies on the growth kinetics of copper sulfate pentahydrate, it is the aim
of this study to deliver fundamental information on the morphology and crystal growth
kinetics of copper sulfate pentahydrate as a function of the solution environment. These
experimental data were collected using a methodology developed for the analysis of
Ibuprofen single crystal crystallization [22], while the analysis of crystal growth kinetics
was carried out using models which consider the effect in series of mass transfer and
integration of growth units to the crystal surface derived elsewhere [23, 24].
In general, the aim of the present work is to assess the effect of sodium chloride on the
crystal shape, particle size, composition, and growth rates of copper sulfate pentahydrate
crystals in order to understand the effect of the principal ions from seawater in the overall
crystallization process. This knowledge will allow us to obtain valuable information that
132
could be useful in the design of the copper sulfate crystallization process using seawater. In
all the experiments, a sodium chloride concentration of 2.4 wt % was used in order to
simulate the natural seawater system reported by Hernández et al. [11] and Justel et al. [12].
2. MATERIALS AND METHODS
2.1 Materials
The reagents used in this work were of analytical grade: Copper sulfate pentahydrate,
Merck, 99%; Sodium Chloride, Merck, 99.5%, and Distilled deionized water (0.054 𝜇𝑆 ∙
𝑐𝑚−1). No further purification was carried out.
2.2 Equipment and experimental procedure
2.2.1 Solubilities measurements of copper sulfate in aqueous solutions and in 2.4 wt
% sodium chloride media.
Linke and Seidell [25] reported solubility data of copper sulfate in freshwater at different
temperatures. In the present work, experimental solubility data of copper sulfate with 2.4 wt
% of sodium chloride at different temperatures (from 293.15 to 333.15 K) were determined.
The methodology used for the determination of the solubility have been previously reported
[12, 13].
2.2.2 Crystallization experiments.
Crystallization experiments were carried out using the Avantium Crystalline® system (see:
https://www.crystallizationsystems.com/Crystalline). This facilitates 8 parallel reactors and
can hold up to 8 standard disposable glass vials (O 16.6 mm, flat bottomed, 8 mL). Each
reactor can be independently loaded, programmed, and operated. The temperature range
can be varied from -15 to 150 °C and stirring rates between 0 to 1250 rpm are available
using magnetic and/or overhead agitators. Crystalline provides an inlet for a dry purge gas
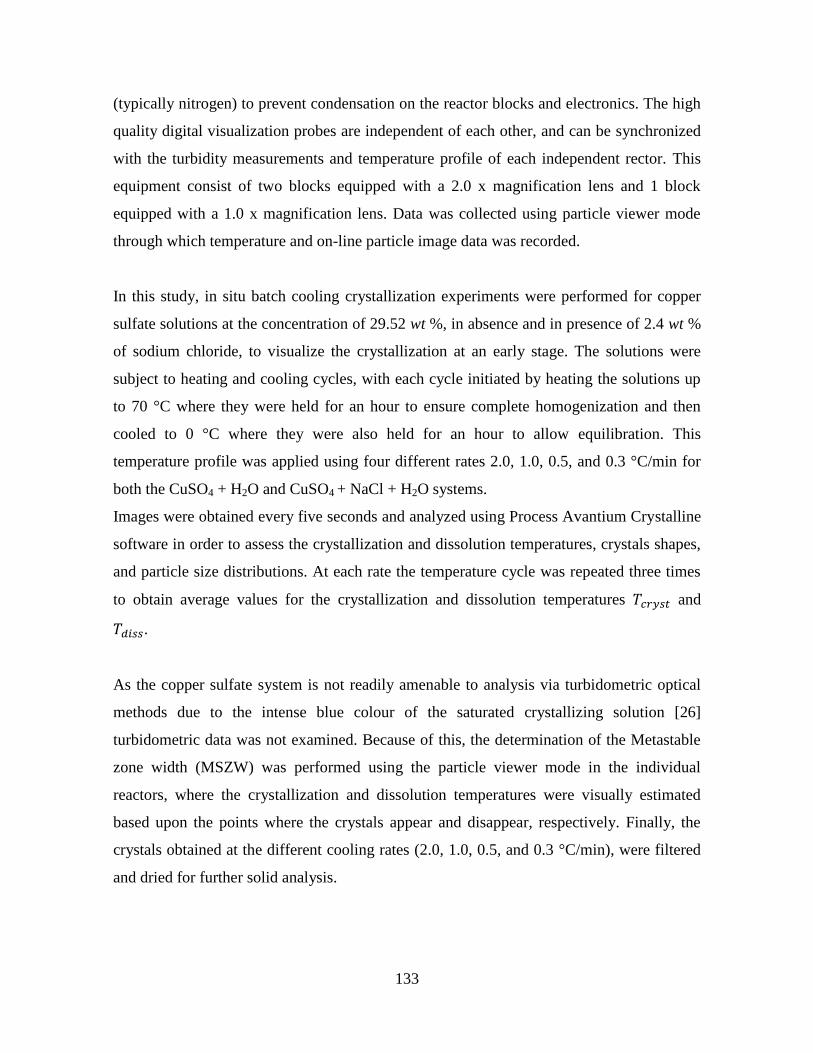
133
(typically nitrogen) to prevent condensation on the reactor blocks and electronics. The high
quality digital visualization probes are independent of each other, and can be synchronized
with the turbidity measurements and temperature profile of each independent rector. This
equipment consist of two blocks equipped with a 2.0 x magnification lens and 1 block
equipped with a 1.0 x magnification lens. Data was collected using particle viewer mode
through which temperature and on-line particle image data was recorded.
In this study, in situ batch cooling crystallization experiments were performed for copper
sulfate solutions at the concentration of 29.52 wt %, in absence and in presence of 2.4 wt %
of sodium chloride, to visualize the crystallization at an early stage. The solutions were
subject to heating and cooling cycles, with each cycle initiated by heating the solutions up
to 70 °C where they were held for an hour to ensure complete homogenization and then
cooled to 0 °C where they were also held for an hour to allow equilibration. This
temperature profile was applied using four different rates 2.0, 1.0, 0.5, and 0.3 °C/min for
both the CuSO4 + H2O and CuSO4 + NaCl + H2O systems.
Images were obtained every five seconds and analyzed using Process Avantium Crystalline
software in order to assess the crystallization and dissolution temperatures, crystals shapes,
and particle size distributions. At each rate the temperature cycle was repeated three times
to obtain average values for the crystallization and dissolution temperatures 𝑇𝑐𝑟𝑦𝑠𝑡 and
𝑇𝑑𝑖𝑠𝑠.
As the copper sulfate system is not readily amenable to analysis via turbidometric optical
methods due to the intense blue colour of the saturated crystallizing solution [26]
turbidometric data was not examined. Because of this, the determination of the Metastable
zone width (MSZW) was performed using the particle viewer mode in the individual
reactors, where the crystallization and dissolution temperatures were visually estimated
based upon the points where the crystals appear and disappear, respectively. Finally, the
crystals obtained at the different cooling rates (2.0, 1.0, 0.5, and 0.3 °C/min), were filtered
and dried for further solid analysis.

134
2.2.3 Thermal Analysis (TGA/DSC) and Chemical Analysis
Copper sulfate crystals as obtained from aqueous and NaCl media at a cooling rate of
1°C/min were filtered, dried, and analyzed by thermogravimetric analysis (TGA) and
Differential Scanning Calorimetry (DSC) to determine their composition, melting points,
and to validate if the crystals grown in different media correspond to copper sulfate
pentahydrate.
Thermal assays were conducted with a Mettler Toledo Thermogravimeter TGA/DSC1,
STARe System. The crucibles used in the TGA/DSC instrument are made of platinum and
were hermetically sealed. The test was conducted in a flowing inert nitrogen atmosphere
(50 ml/min) and at a heating rate of 10 °C/min. The equipment was calibrated with indium
with a sample mass of 10 mg. The temperature used in the experiment ranged from 25 to
300 °C.
In addition to this, chemical analysis of copper sulfate crystals obtained in NaCl media at
1°C/min was performed to determine the chemical composition of the sample and the
concentration range of variation corresponding to the main impurities. Cu2+
and SO42-
concentrations were determined by oxidation-reduction volumetry and gravimetric method
with drying of residue, respectively, and Na+ and Cl
- were determined by Atomic and
Molecular absorption spectrophotometry, respectively.
2.2.4 Crystal Growth measurements by In-situ Microscopy
In-situ crystal growth studies were carried out using an experimental set-up comprising an
optical microscope (Olympus BX51) operated in Differential Interference Contrast (DIC)
mode, which was integrated with a QImaging/QICAM camera which captured crystal
images as a function of time. The images were then analyzed using the QCapture Pro
software (see: http://www.qimaging.com/products/software/qcappro7.php). The associated
growth cell comprised a simple temperature-controlled rectangular tank (10 x 12 cm, depth
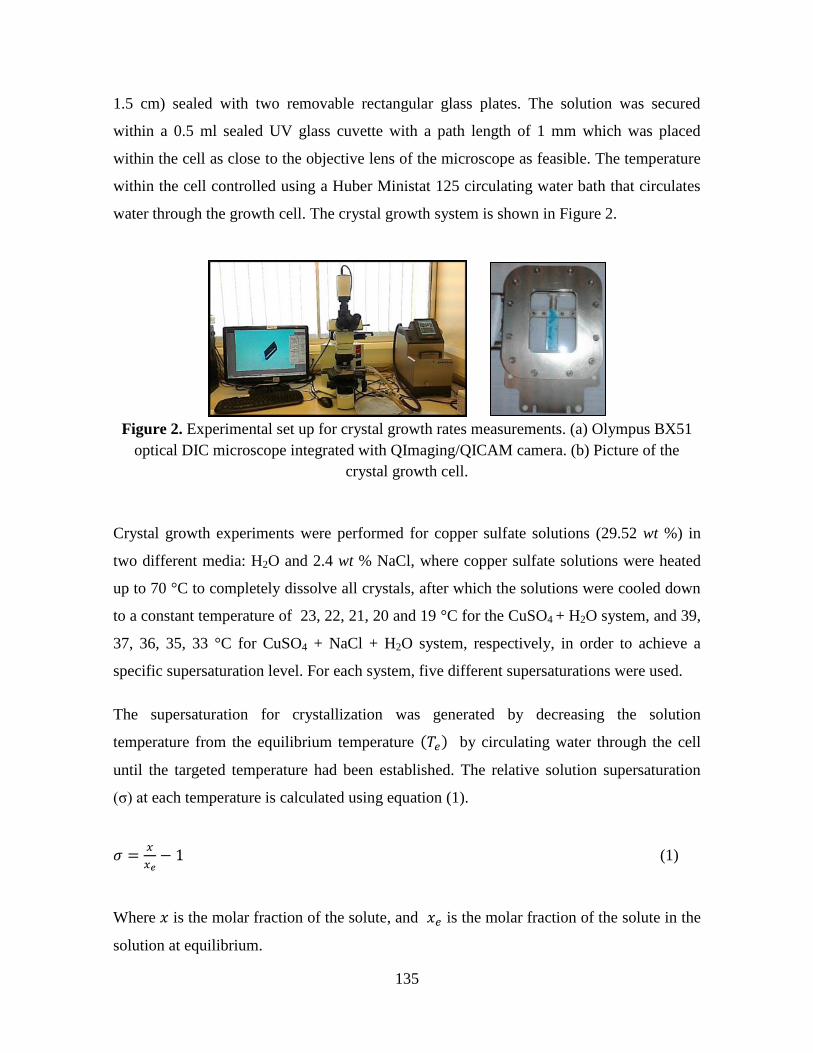
135
1.5 cm) sealed with two removable rectangular glass plates. The solution was secured
within a 0.5 ml sealed UV glass cuvette with a path length of 1 mm which was placed
within the cell as close to the objective lens of the microscope as feasible. The temperature
within the cell controlled using a Huber Ministat 125 circulating water bath that circulates
water through the growth cell. The crystal growth system is shown in Figure 2.
Figure 2. Experimental set up for crystal growth rates measurements. (a) Olympus BX51
optical DIC microscope integrated with QImaging/QICAM camera. (b) Picture of the
crystal growth cell.
Crystal growth experiments were performed for copper sulfate solutions (29.52 wt %) in
two different media: H2O and 2.4 wt % NaCl, where copper sulfate solutions were heated
up to 70 °C to completely dissolve all crystals, after which the solutions were cooled down
to a constant temperature of 23, 22, 21, 20 and 19 °C for the CuSO4 + H2O system, and 39,
37, 36, 35, 33 °C for CuSO4 + NaCl + H2O system, respectively, in order to achieve a
specific supersaturation level. For each system, five different supersaturations were used.
The supersaturation for crystallization was generated by decreasing the solution
temperature from the equilibrium temperature (𝑇𝑒) by circulating water through the cell
until the targeted temperature had been established. The relative solution supersaturation
(σ) at each temperature is calculated using equation (1).
𝜎 =𝑥
𝑥𝑒− 1 (1)
Where 𝑥 is the molar fraction of the solute, and 𝑥𝑒 is the molar fraction of the solute in the
solution at equilibrium.
136
The crystal morphology and growth of the observed crystals were assessed recording
images every five seconds. The growth rates of the individual faces (𝐺) were estimated by
following the increase with time of the perpendicular distance from the centre of the
projected two dimensional crystal to the faces (Figure 3). The central point of the crystals
were determined by drawing lines connecting the crystal’s corners as defined by the two
most important habit faces. For each face, eleven measurements of the normal distance
increase were recorded, and each experiment was performed in duplicate.
Figure 3. Example of measurement from the centre of the copper sulfate crystal to the
faces. The distances are obtained by drawing a perpendicular line to each face from the
centre of the crystal using QCapture Pro software.
2.2.5 Determination of activity coefficients for the assessment of ion interactions of
copper sulfate in aqueous solutions and sodium chloride media
In order to assess the importance of the chemical interactions, the activity coefficients of
the copper sulfate solutions have been evaluated. An activity coefficient is a factor used in
thermodynamics to account for deviations from ideal behaviour in a mixture of chemical
substances [27].
In the present work, the activity coefficients of copper sulfate 𝛾± were determined by the
Pitzer model [28] where for 2-2 electrolytes (as copper sulfate), the mean activity ionic
coefficients are given by the following expressions:
ln 𝛾± = 4𝑓𝛾 + 𝑚𝐵𝛾 + 𝑚2𝐶𝛾 (2)
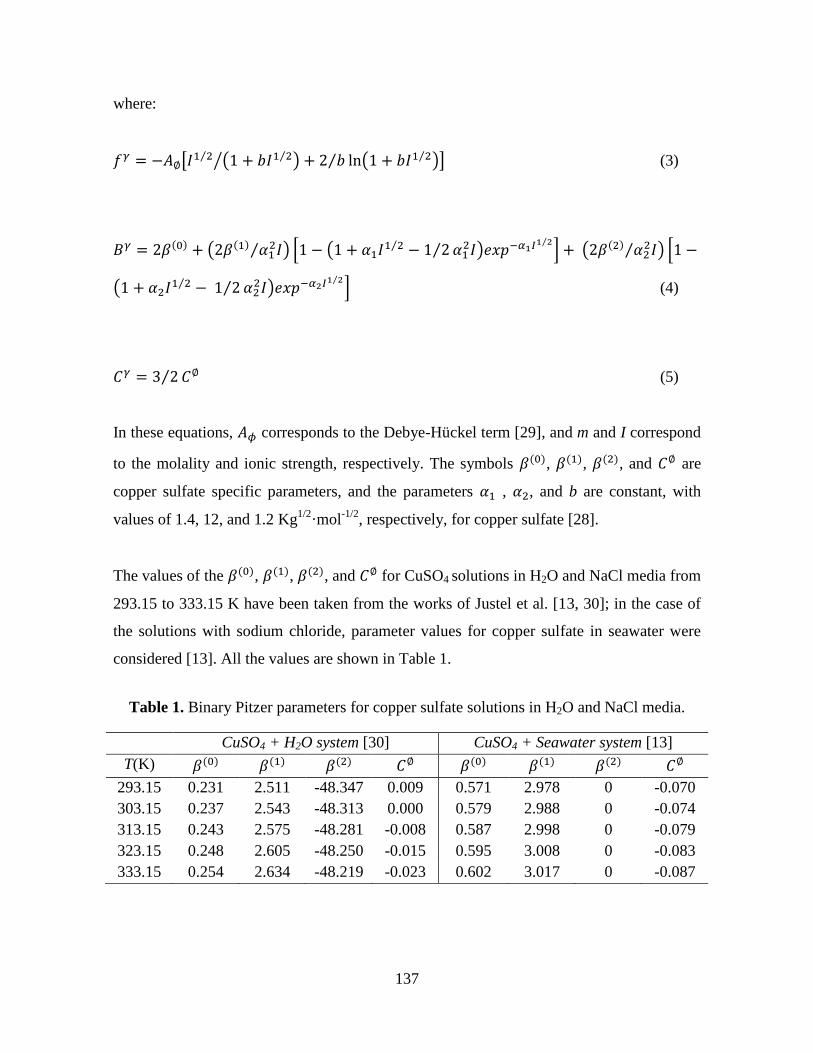
137
where:
𝑓𝛾 = −𝐴∅[𝐼1 2⁄ (1 + 𝑏𝐼1 2⁄ )⁄ + 2 𝑏⁄ ln(1 + 𝑏𝐼1 2⁄ )] (3)
𝐵𝛾 = 2𝛽(0) + (2𝛽(1) 𝛼12𝐼⁄ ) [1 − (1 + 𝛼1𝐼1 2⁄ − 1 2⁄ 𝛼1
2𝐼)𝑒𝑥𝑝−𝛼1𝐼1 2⁄] + (2𝛽(2) 𝛼2
2𝐼⁄ ) [1 −
(1 + 𝛼2𝐼1 2⁄ − 1 2⁄ 𝛼22𝐼)𝑒𝑥𝑝−𝛼2𝐼1 2⁄
] (4)
𝐶𝛾 = 3 2⁄ 𝐶∅ (5)
In these equations, 𝐴𝜙 corresponds to the Debye-Hückel term [29], and m and I correspond
to the molality and ionic strength, respectively. The symbols 𝛽(0), 𝛽(1), 𝛽(2), and 𝐶∅ are
copper sulfate specific parameters, and the parameters 𝛼1 , 𝛼2, and b are constant, with
values of 1.4, 12, and 1.2 Kg1/2
·mol-1/2
, respectively, for copper sulfate [28].
The values of the 𝛽(0), 𝛽(1), 𝛽(2), and 𝐶∅ for CuSO4 solutions in H2O and NaCl media from
293.15 to 333.15 K have been taken from the works of Justel et al. [13, 30]; in the case of
the solutions with sodium chloride, parameter values for copper sulfate in seawater were
considered [13]. All the values are shown in Table 1.
Table 1. Binary Pitzer parameters for copper sulfate solutions in H2O and NaCl media.
CuSO4 + H2O system [30] CuSO4 + Seawater system [13]
T(K) 𝛽(0) 𝛽(1) 𝛽(2) 𝐶∅ 𝛽(0) 𝛽(1) 𝛽(2) 𝐶∅
293.15 0.231 2.511 -48.347 0.009 0.571 2.978 0 -0.070
303.15 0.237 2.543 -48.313 0.000 0.579 2.988 0 -0.074
313.15 0.243 2.575 -48.281 -0.008 0.587 2.998 0 -0.079
323.15 0.248 2.605 -48.250 -0.015 0.595 3.008 0 -0.083
333.15 0.254 2.634 -48.219 -0.023 0.602 3.017 0 -0.087
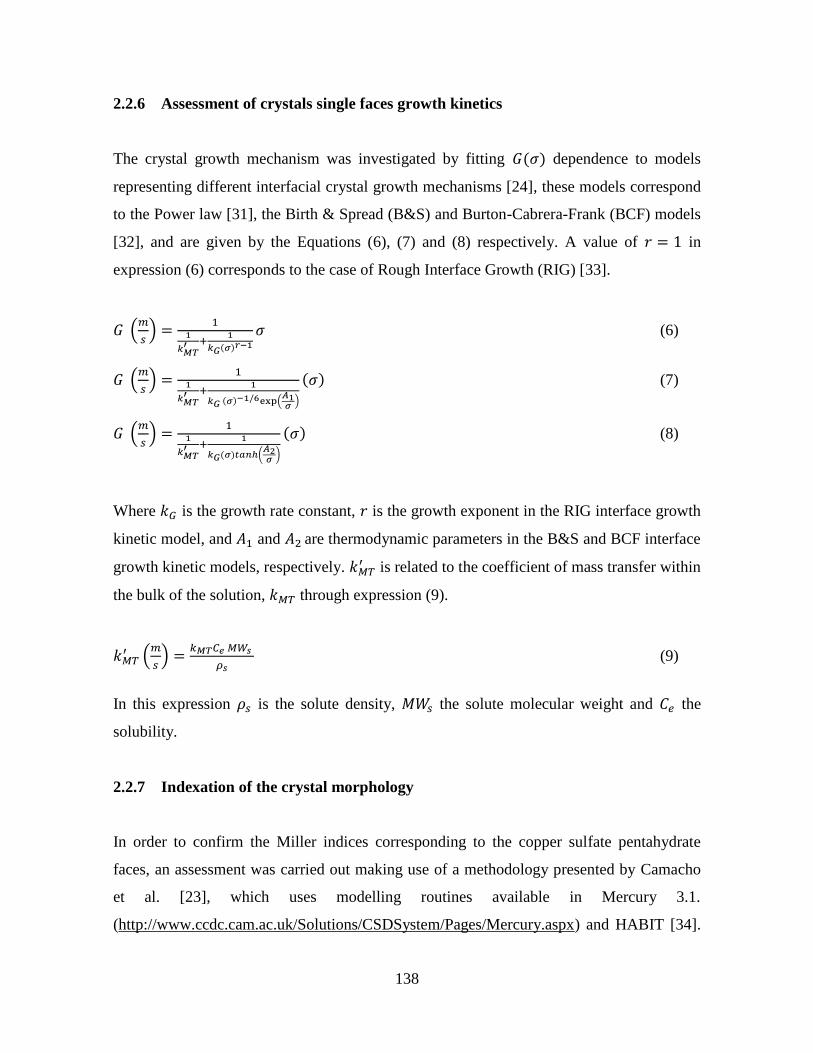
138
2.2.6 Assessment of crystals single faces growth kinetics
The crystal growth mechanism was investigated by fitting 𝐺(𝜎) dependence to models
representing different interfacial crystal growth mechanisms [24], these models correspond
to the Power law [31], the Birth & Spread (B&S) and Burton-Cabrera-Frank (BCF) models
[32], and are given by the Equations (6), (7) and (8) respectively. A value of 𝑟 = 1 in
expression (6) corresponds to the case of Rough Interface Growth (RIG) [33].
𝐺 (𝑚
𝑠) =
11
𝑘𝑀𝑇′ +
1
𝑘𝐺(𝜎)𝑟−1
𝜎 (6)
𝐺 (𝑚
𝑠) =
11
𝑘𝑀𝑇′ +
1
𝑘𝐺 (𝜎)−1/6exp (𝐴1𝜎
)
(𝜎) (7)
𝐺 (𝑚
𝑠) =
11
𝑘𝑀𝑇′ +
1
𝑘𝐺(𝜎)𝑡𝑎𝑛ℎ(𝐴2𝜎
)
(𝜎) (8)
Where 𝑘𝐺 is the growth rate constant, 𝑟 is the growth exponent in the RIG interface growth
kinetic model, and 𝐴1 and 𝐴2 are thermodynamic parameters in the B&S and BCF interface
growth kinetic models, respectively. 𝑘𝑀𝑇′ is related to the coefficient of mass transfer within
the bulk of the solution, 𝑘𝑀𝑇 through expression (9).
𝑘𝑀𝑇′ (
𝑚
𝑠) =
𝑘𝑀𝑇𝐶𝑒 𝑀𝑊𝑠
𝜌𝑠 (9)
In this expression 𝜌𝑠 is the solute density, 𝑀𝑊𝑠 the solute molecular weight and 𝐶𝑒 the
solubility.
2.2.7 Indexation of the crystal morphology
In order to confirm the Miller indices corresponding to the copper sulfate pentahydrate
faces, an assessment was carried out making use of a methodology presented by Camacho
et al. [23], which uses modelling routines available in Mercury 3.1.
(http://www.ccdc.cam.ac.uk/Solutions/CSDSystem/Pages/Mercury.aspx) and HABIT [34].
139
This methodology relies on the prediction of the Bravais-Friedel-Donnay-Harker (BFDH)
morphology using the known triclinic unit cell parameters for copper sulfate pentahydrate
as given by the cif file reported by Beevers [35]. See for example the work of Cunningham
et al. [36].
The BFDH approach relates the external shape of a crystal to the internal crystallographic
lattice dimensions and symmetry and states that: “After allowing for the reduction of the
growth slide thickness from space group symmetry considerations, the most
morphologically important forms (hkl), and hence those with the lowest growth rates, are
those having the greatest inter-planar distance dhkl” [37].
Using the BFDH approach, dhkl spacings can be taken as being inversely proportional to the
perpendicular distance from the centre of the crystals to the corresponding face, which in
turn can be considered as a measure of the relative growth rate for the simulation of the
crystal morphology [23].
3 RESULTS AND DISCUSSION
3.1 Solubilities of copper sulfate in aqueous solutions and in 2.4 wt % sodium
chloride media.
Table 2 shows the solubility data of copper sulfate in freshwater at different temperatures
reported by Linke and Seidell [25], and the experimental solubility and density data of
copper sulfate in sodium chloride media at five different temperatures (from 293.15 to
333.15 K) determined in the present work.
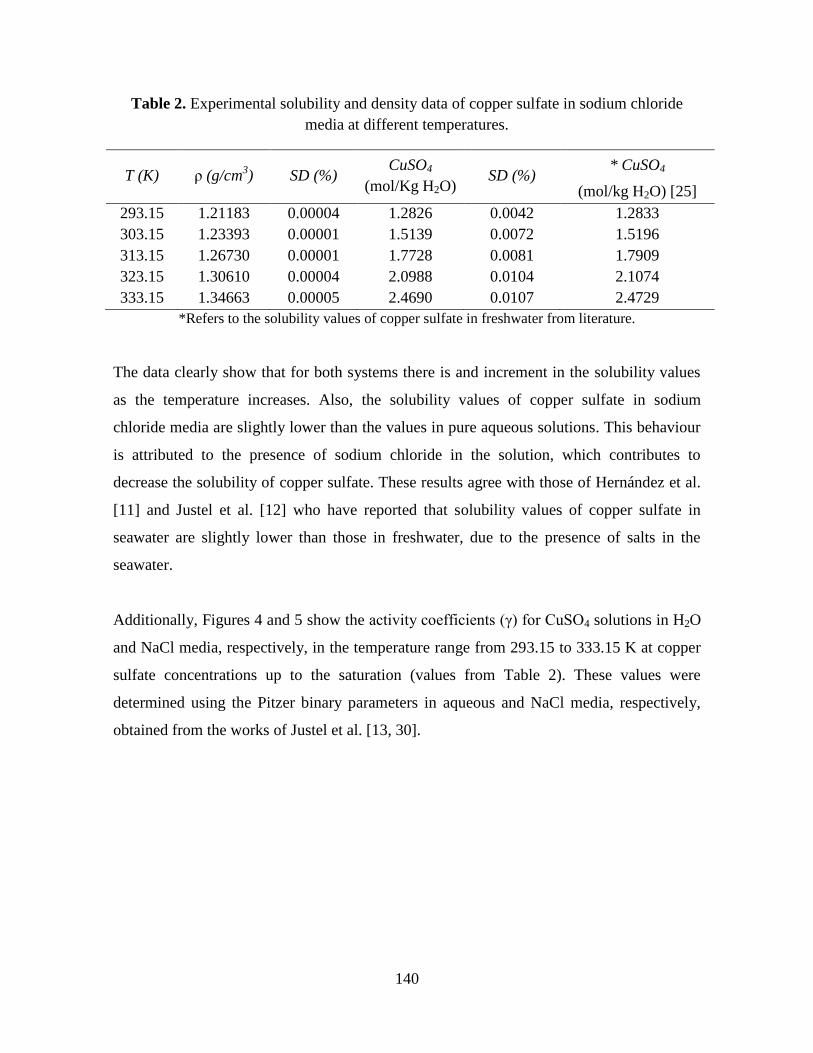
140
Table 2. Experimental solubility and density data of copper sulfate in sodium chloride
media at different temperatures.
T (K) ρ (g/cm3) SD (%)
CuSO4
(mol/Kg H2O) SD (%)
* CuSO4
(mol/kg H2O) [25]
293.15 1.21183 0.00004 1.2826 0.0042 1.2833
303.15 1.23393 0.00001 1.5139 0.0072 1.5196
313.15 1.26730 0.00001 1.7728 0.0081 1.7909
323.15 1.30610 0.00004 2.0988 0.0104 2.1074
333.15 1.34663 0.00005 2.4690 0.0107 2.4729
*Refers to the solubility values of copper sulfate in freshwater from literature.
The data clearly show that for both systems there is and increment in the solubility values
as the temperature increases. Also, the solubility values of copper sulfate in sodium
chloride media are slightly lower than the values in pure aqueous solutions. This behaviour
is attributed to the presence of sodium chloride in the solution, which contributes to
decrease the solubility of copper sulfate. These results agree with those of Hernández et al.
[11] and Justel et al. [12] who have reported that solubility values of copper sulfate in
seawater are slightly lower than those in freshwater, due to the presence of salts in the
seawater.
Additionally, Figures 4 and 5 show the activity coefficients (γ) for CuSO4 solutions in H2O
and NaCl media, respectively, in the temperature range from 293.15 to 333.15 K at copper
sulfate concentrations up to the saturation (values from Table 2). These values were
determined using the Pitzer binary parameters in aqueous and NaCl media, respectively,
obtained from the works of Justel et al. [13, 30].
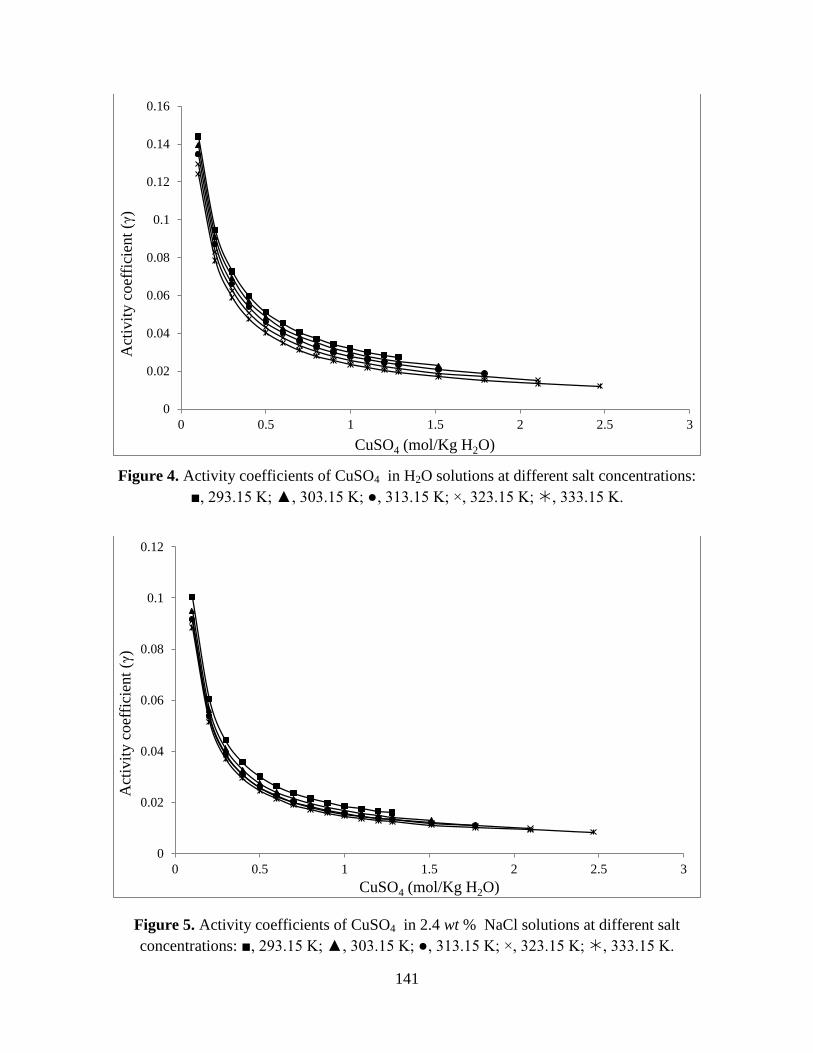
141
Figure 4. Activity coefficients of CuSO4 in H2O solutions at different salt concentrations:
■, 293.15 K; ▲, 303.15 K; ●, 313.15 K; ×, 323.15 K; , 333.15 K.
Figure 5. Activity coefficients of CuSO4 in 2.4 wt % NaCl solutions at different salt
concentrations: ■, 293.15 K; ▲, 303.15 K; ●, 313.15 K; ×, 323.15 K; , 333.15 K.
0
0.02
0.04
0.06
0.08
0.1
0.12
0.14
0.16
0 0.5 1 1.5 2 2.5 3
Act
ivit
y c
oef
fici
ent
(γ)
CuSO4 (mol/Kg H2O)
0
0.02
0.04
0.06
0.08
0.1
0.12
0 0.5 1 1.5 2 2.5 3
Act
ivit
y c
oef
fici
ent
(γ)
CuSO4 (mol/Kg H2O)
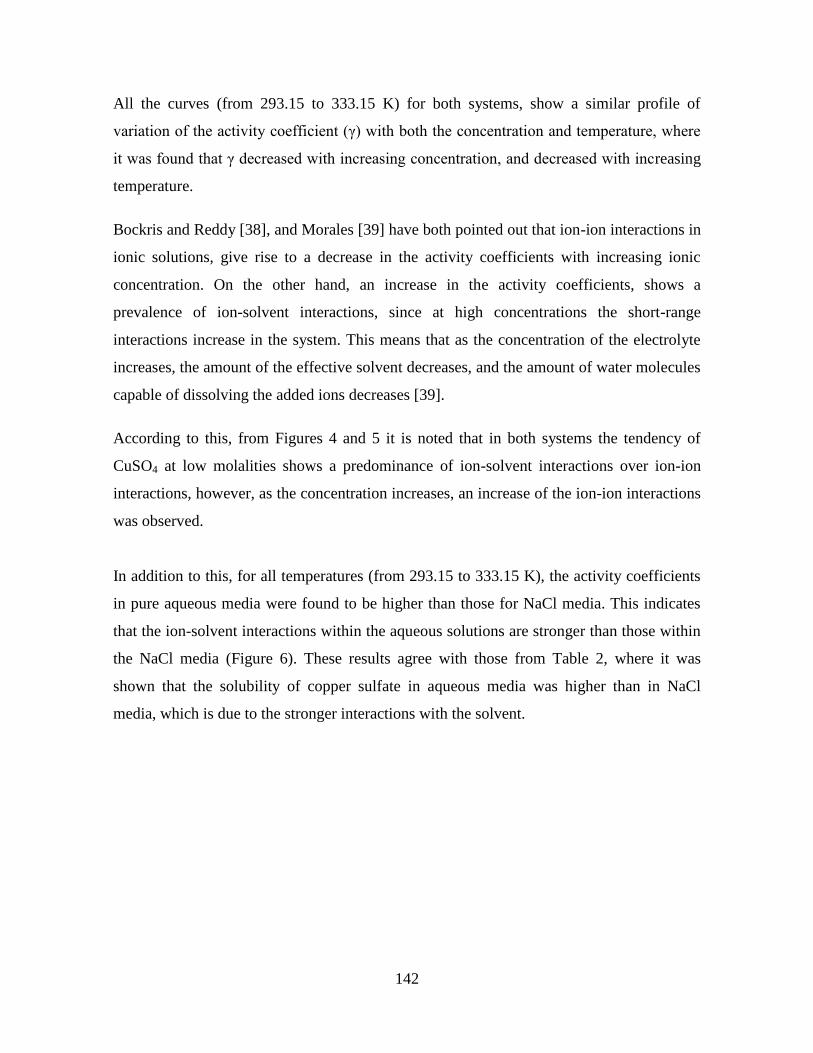
142
All the curves (from 293.15 to 333.15 K) for both systems, show a similar profile of
variation of the activity coefficient (γ) with both the concentration and temperature, where
it was found that γ decreased with increasing concentration, and decreased with increasing
temperature.
Bockris and Reddy [38], and Morales [39] have both pointed out that ion-ion interactions in
ionic solutions, give rise to a decrease in the activity coefficients with increasing ionic
concentration. On the other hand, an increase in the activity coefficients, shows a
prevalence of ion-solvent interactions, since at high concentrations the short-range
interactions increase in the system. This means that as the concentration of the electrolyte
increases, the amount of the effective solvent decreases, and the amount of water molecules
capable of dissolving the added ions decreases [39].
According to this, from Figures 4 and 5 it is noted that in both systems the tendency of
CuSO4 at low molalities shows a predominance of ion-solvent interactions over ion-ion
interactions, however, as the concentration increases, an increase of the ion-ion interactions
was observed.
In addition to this, for all temperatures (from 293.15 to 333.15 K), the activity coefficients
in pure aqueous media were found to be higher than those for NaCl media. This indicates
that the ion-solvent interactions within the aqueous solutions are stronger than those within
the NaCl media (Figure 6). These results agree with those from Table 2, where it was
shown that the solubility of copper sulfate in aqueous media was higher than in NaCl
media, which is due to the stronger interactions with the solvent.
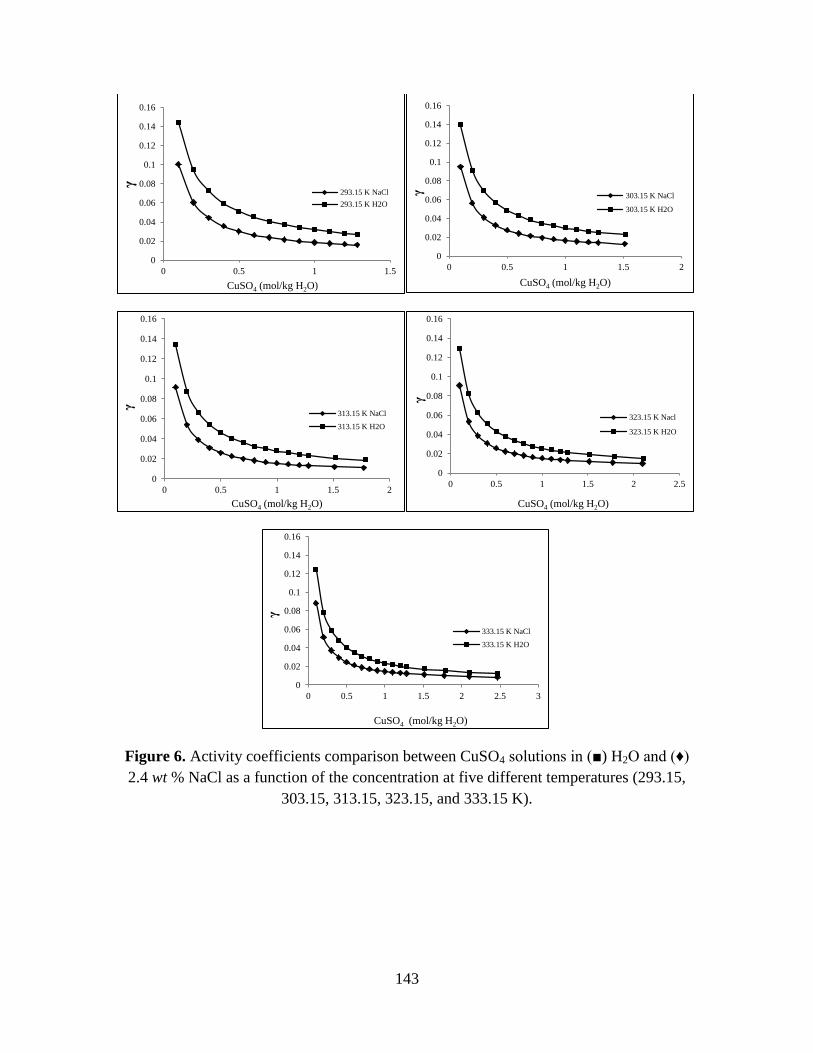
143
Figure 6. Activity coefficients comparison between CuSO4 solutions in (■) H2O and (♦)
2.4 wt % NaCl as a function of the concentration at five different temperatures (293.15,
303.15, 313.15, 323.15, and 333.15 K).
0
0.02
0.04
0.06
0.08
0.1
0.12
0.14
0.16
0 0.5 1 1.5
γ
CuSO4 (mol/kg H2O)
293.15 K NaCl
293.15 K H2O
0
0.02
0.04
0.06
0.08
0.1
0.12
0.14
0.16
0 0.5 1 1.5 2
γ
CuSO4 (mol/kg H2O)
303.15 K NaCl
303.15 K H2O
0
0.02
0.04
0.06
0.08
0.1
0.12
0.14
0.16
0 0.5 1 1.5 2
γ
CuSO4 (mol/kg H2O)
313.15 K NaCl
313.15 K H2O
0
0.02
0.04
0.06
0.08
0.1
0.12
0.14
0.16
0 0.5 1 1.5 2 2.5
γ
CuSO4 (mol/kg H2O)
323.15 K Nacl
323.15 K H2O
0
0.02
0.04
0.06
0.08
0.1
0.12
0.14
0.16
0 0.5 1 1.5 2 2.5 3
γ
CuSO4 (mol/kg H2O)
333.15 K NaCl
333.15 K H2O
144
3.2 Crystallization and dissolution temperatures of the CuSO4 + H2O and
CuSO4 + NaCl + H2O systems at different cooling rates.
Table 3 and Figure 7, show the results of Tcryst and Tdiss as a function of cooling rate for
29.52 wt % copper sulfate solutions in two different media: H2O and 2.4 wt % NaCl.
Table 3. Crystallization and dissolution temperatures of the CuSO4 + H2O and CuSO4 +
NaCl + H2O systems at different cooling rates.
System Cooling rate
(°C/min) Tcryst (°C) SD Tdiss (°C) SD
MSZW
(°C)
CuSO4 + H2O
2.0 20.90 0.14 70.93 0.29 50.03
1.0 26.87 0.29 68.13 0.19 41.27
0.5 30.60 0.28 66.07 0.25 35.47
0.3 34.47 0.29 66.03 0.31 31.57
0.0* 35.28 - 64.85 - 29.57
CuSO4 + NaCl
+ H2O
2.0 33.37 0.37 71.83 0.40 38.47
1.0 37.03 0.19 69.43 0.09 32.40
0.5 39.47 0.17 68.17 0.24 28.70
0.3 41.80 0.08 66.60 0.14 24.80
0.0* 42.33 - 66.30 - 23.97
*represents extrapolated data at 0 °C/min
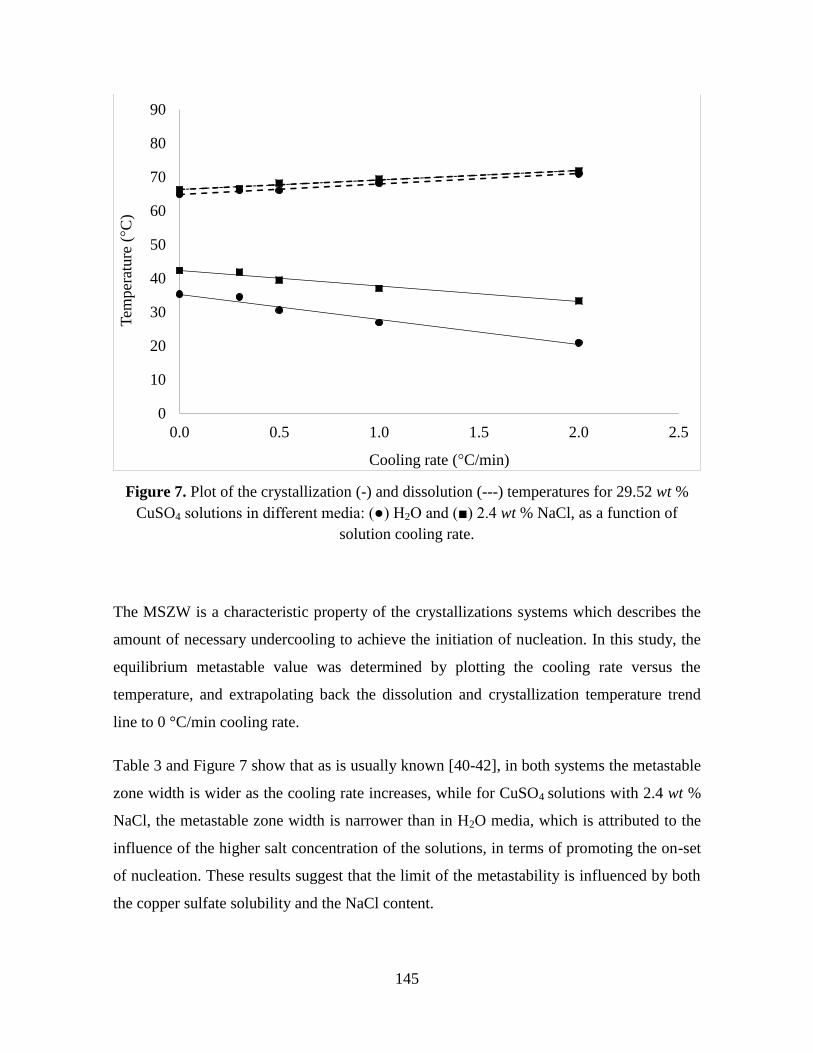
145
Figure 7. Plot of the crystallization (-) and dissolution (---) temperatures for 29.52 wt %
CuSO4 solutions in different media: (●) H2O and (■) 2.4 wt % NaCl, as a function of
solution cooling rate.
The MSZW is a characteristic property of the crystallizations systems which describes the
amount of necessary undercooling to achieve the initiation of nucleation. In this study, the
equilibrium metastable value was determined by plotting the cooling rate versus the
temperature, and extrapolating back the dissolution and crystallization temperature trend
line to 0 °C/min cooling rate.
Table 3 and Figure 7 show that as is usually known [40-42], in both systems the metastable
zone width is wider as the cooling rate increases, while for CuSO4 solutions with 2.4 wt %
NaCl, the metastable zone width is narrower than in H2O media, which is attributed to the
influence of the higher salt concentration of the solutions, in terms of promoting the on-set
of nucleation. These results suggest that the limit of the metastability is influenced by both
the copper sulfate solubility and the NaCl content.
0
10
20
30
40
50
60
70
80
90
0.0 0.5 1.0 1.5 2.0 2.5
Tem
per
ature
(°C
)
Cooling rate (°C/min)
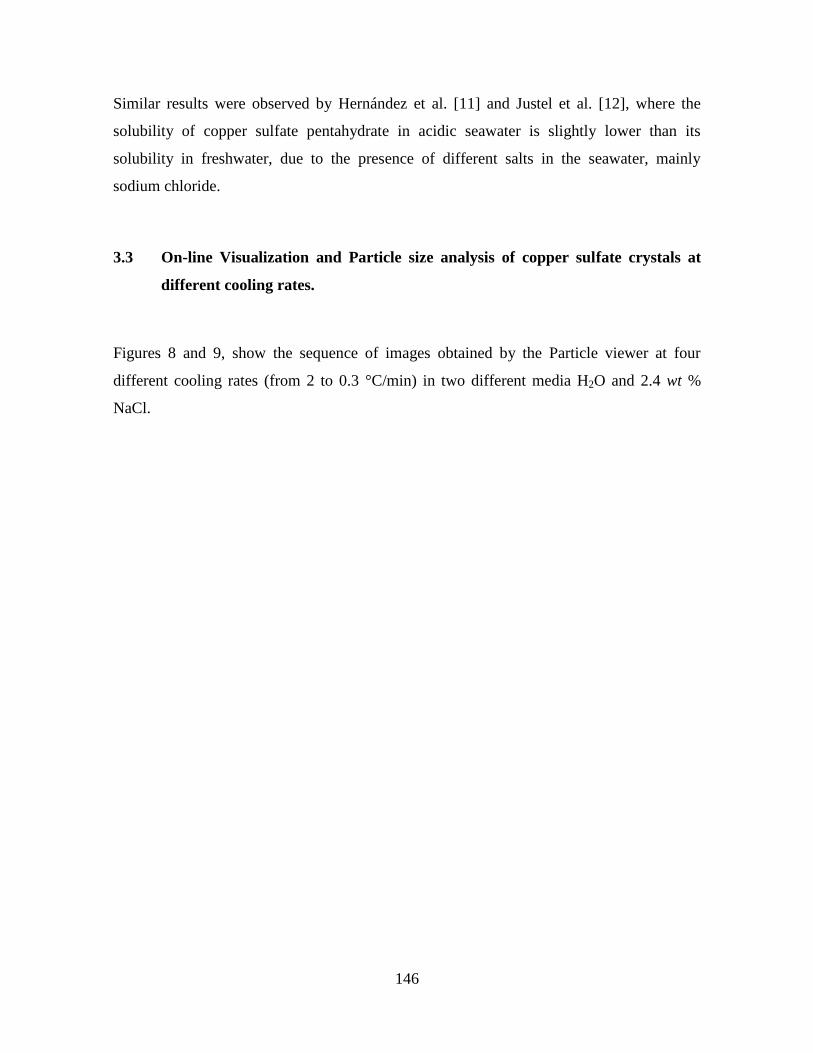
146
Similar results were observed by Hernández et al. [11] and Justel et al. [12], where the
solubility of copper sulfate pentahydrate in acidic seawater is slightly lower than its
solubility in freshwater, due to the presence of different salts in the seawater, mainly
sodium chloride.
3.3 On-line Visualization and Particle size analysis of copper sulfate crystals at
different cooling rates.
Figures 8 and 9, show the sequence of images obtained by the Particle viewer at four
different cooling rates (from 2 to 0.3 °C/min) in two different media H2O and 2.4 wt %
NaCl.
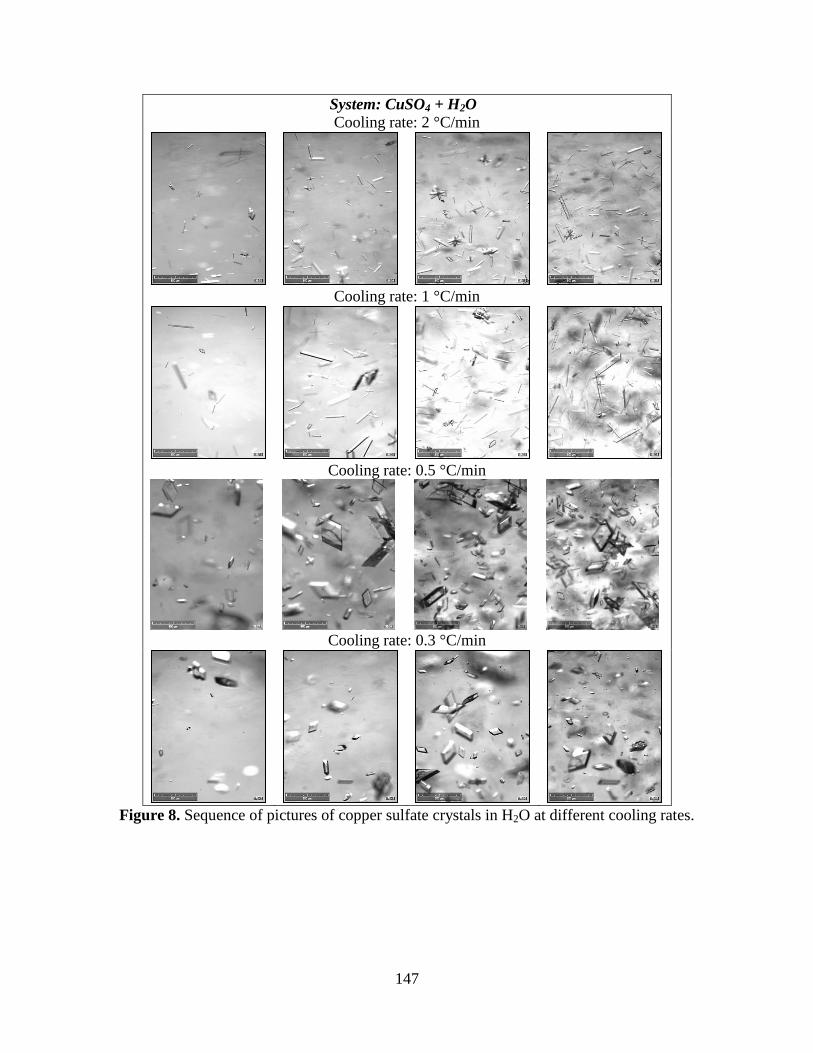
147
System: CuSO4 + H2O
Cooling rate: 2 °C/min
Cooling rate: 1 °C/min
Cooling rate: 0.5 °C/min
Cooling rate: 0.3 °C/min
Figure 8. Sequence of pictures of copper sulfate crystals in H2O at different cooling rates.
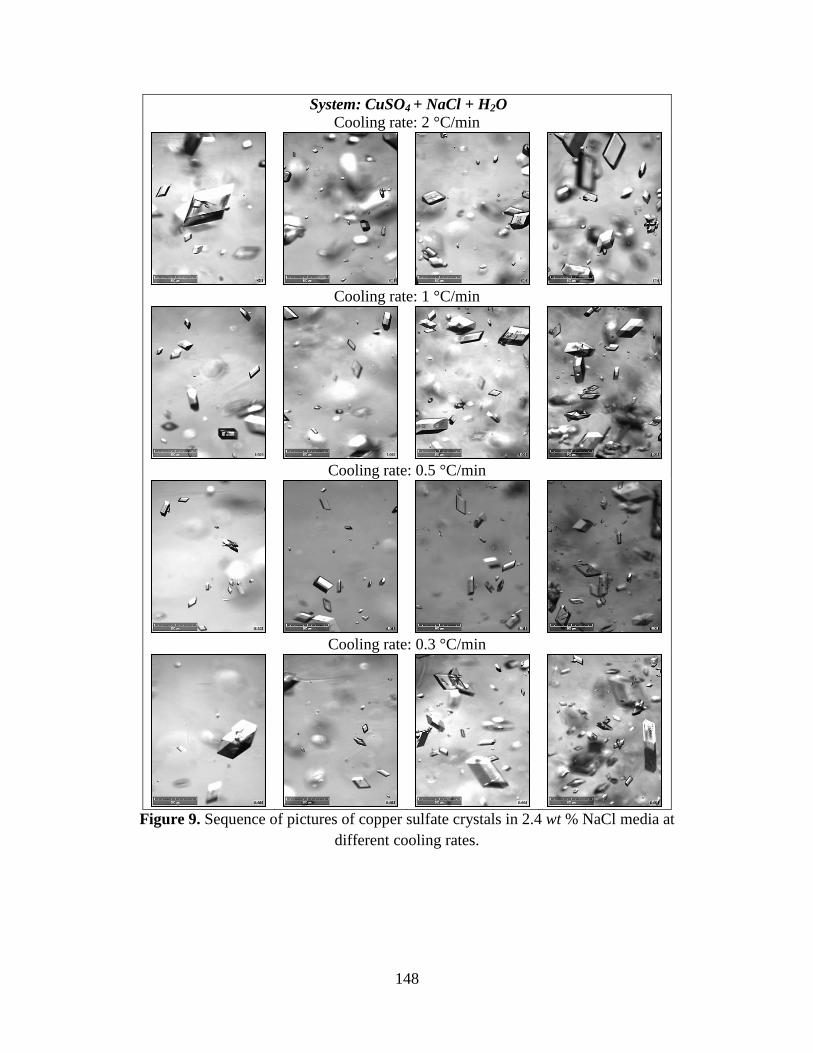
148
System: CuSO4 + NaCl + H2O
Cooling rate: 2 °C/min
Cooling rate: 1 °C/min
Cooling rate: 0.5 °C/min
Cooling rate: 0.3 °C/min
Figure 9. Sequence of pictures of copper sulfate crystals in 2.4 wt % NaCl media at
different cooling rates.
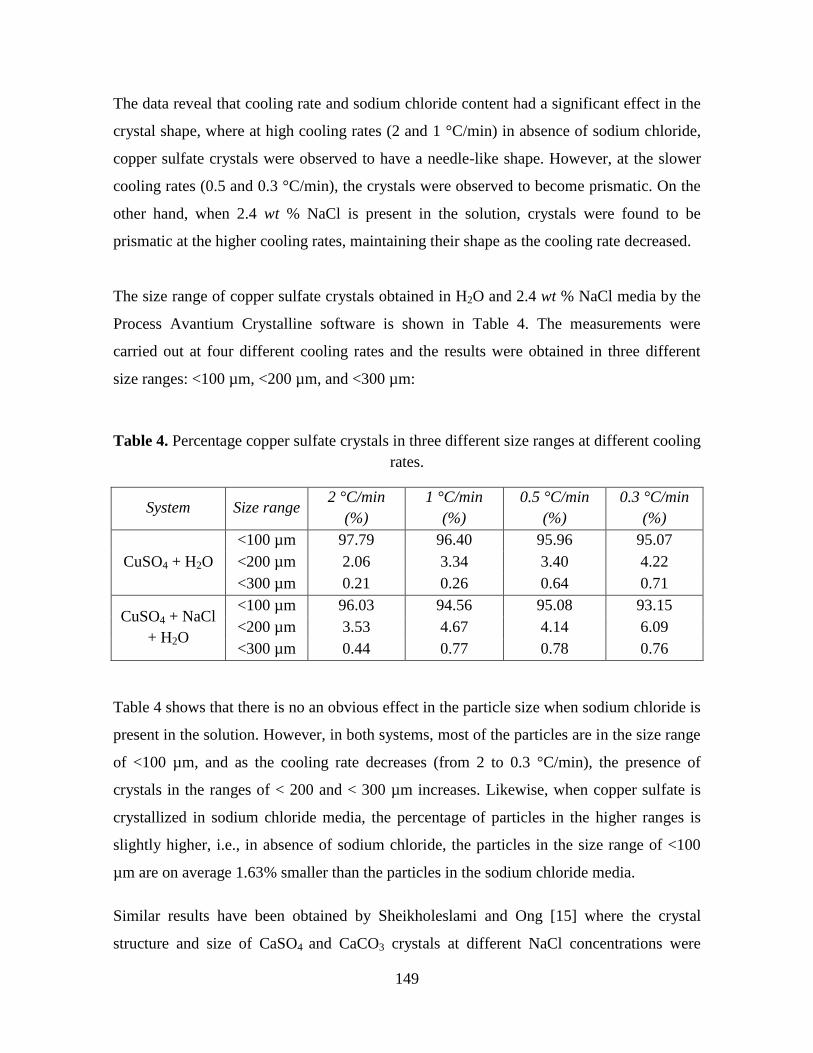
149
The data reveal that cooling rate and sodium chloride content had a significant effect in the
crystal shape, where at high cooling rates (2 and 1 °C/min) in absence of sodium chloride,
copper sulfate crystals were observed to have a needle-like shape. However, at the slower
cooling rates (0.5 and 0.3 °C/min), the crystals were observed to become prismatic. On the
other hand, when 2.4 wt % NaCl is present in the solution, crystals were found to be
prismatic at the higher cooling rates, maintaining their shape as the cooling rate decreased.
The size range of copper sulfate crystals obtained in H2O and 2.4 wt % NaCl media by the
Process Avantium Crystalline software is shown in Table 4. The measurements were
carried out at four different cooling rates and the results were obtained in three different
size ranges: <100 µm, <200 µm, and <300 µm:
Table 4. Percentage copper sulfate crystals in three different size ranges at different cooling
rates.
System Size range 2 °C/min
(%)
1 °C/min
(%)
0.5 °C/min
(%)
0.3 °C/min
(%)
CuSO4 + H2O
<100 µm 97.79 96.40 95.96 95.07
<200 µm 2.06 3.34 3.40 4.22
<300 µm 0.21 0.26 0.64 0.71
CuSO4 + NaCl
+ H2O
<100 µm 96.03 94.56 95.08 93.15
<200 µm 3.53 4.67 4.14 6.09
<300 µm 0.44 0.77 0.78 0.76
Table 4 shows that there is no an obvious effect in the particle size when sodium chloride is
present in the solution. However, in both systems, most of the particles are in the size range
of <100 µm, and as the cooling rate decreases (from 2 to 0.3 °C/min), the presence of
crystals in the ranges of < 200 and < 300 µm increases. Likewise, when copper sulfate is
crystallized in sodium chloride media, the percentage of particles in the higher ranges is
slightly higher, i.e., in absence of sodium chloride, the particles in the size range of <100
µm are on average 1.63% smaller than the particles in the sodium chloride media.
Similar results have been obtained by Sheikholeslami and Ong [15] where the crystal
structure and size of CaSO4 and CaCO3 crystals at different NaCl concentrations were
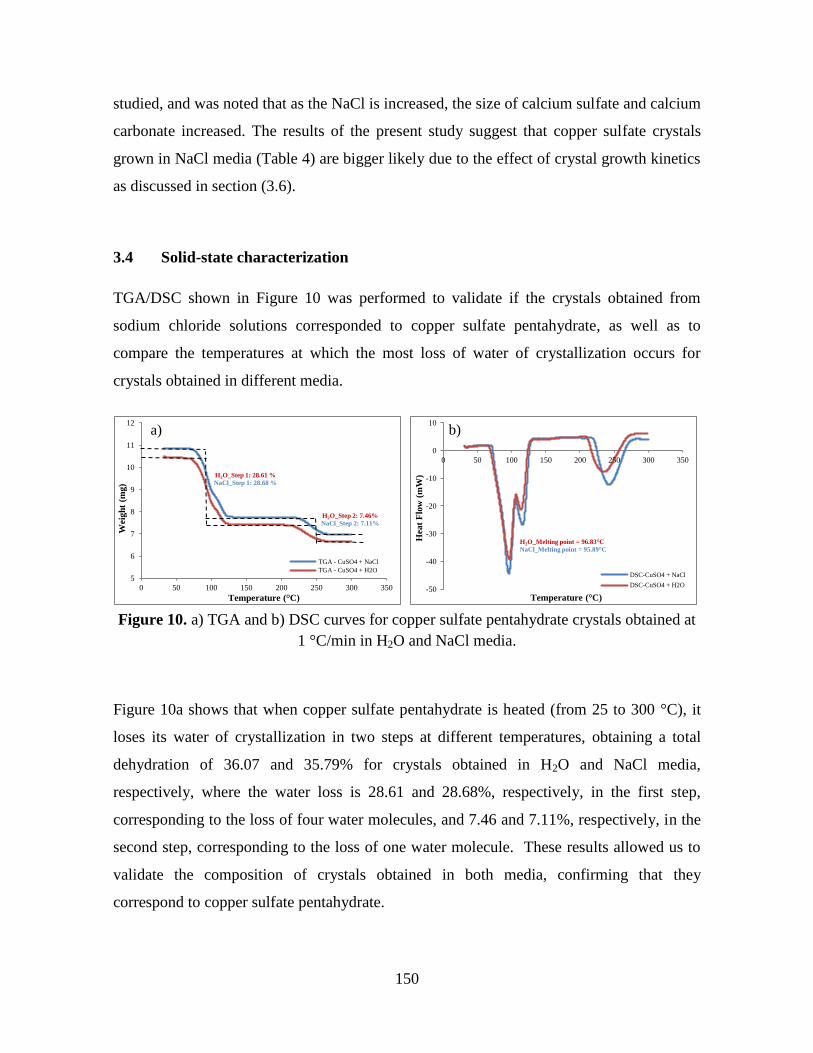
150
studied, and was noted that as the NaCl is increased, the size of calcium sulfate and calcium
carbonate increased. The results of the present study suggest that copper sulfate crystals
grown in NaCl media (Table 4) are bigger likely due to the effect of crystal growth kinetics
as discussed in section (3.6).
3.4 Solid-state characterization
TGA/DSC shown in Figure 10 was performed to validate if the crystals obtained from
sodium chloride solutions corresponded to copper sulfate pentahydrate, as well as to
compare the temperatures at which the most loss of water of crystallization occurs for
crystals obtained in different media.
Figure 10. a) TGA and b) DSC curves for copper sulfate pentahydrate crystals obtained at
1 °C/min in H2O and NaCl media.
Figure 10a shows that when copper sulfate pentahydrate is heated (from 25 to 300 °C), it
loses its water of crystallization in two steps at different temperatures, obtaining a total
dehydration of 36.07 and 35.79% for crystals obtained in H2O and NaCl media,
respectively, where the water loss is 28.61 and 28.68%, respectively, in the first step,
corresponding to the loss of four water molecules, and 7.46 and 7.11%, respectively, in the
second step, corresponding to the loss of one water molecule. These results allowed us to
validate the composition of crystals obtained in both media, confirming that they
correspond to copper sulfate pentahydrate.
5
6
7
8
9
10
11
12
0 50 100 150 200 250 300 350
Weig
ht
(mg
)
Temperature (°C)
TGA - CuSO4 + NaCl
TGA - CuSO4 + H2O
H2O_Step 1: 28.61 %
NaCl_Step 1: 28.68 %
H2O_Step 2: 7.46%
NaCl_Step 2: 7.11%
-50
-40
-30
-20
-10
0
10
0 50 100 150 200 250 300 350
Hea
t F
low
(m
W)
Temperature (°C)
DSC-CuSO4 + NaCl
DSC-CuSO4 + H2O
H2O_Melting point = 96.83°C
NaCl_Melting point = 95.89°C
a) b)
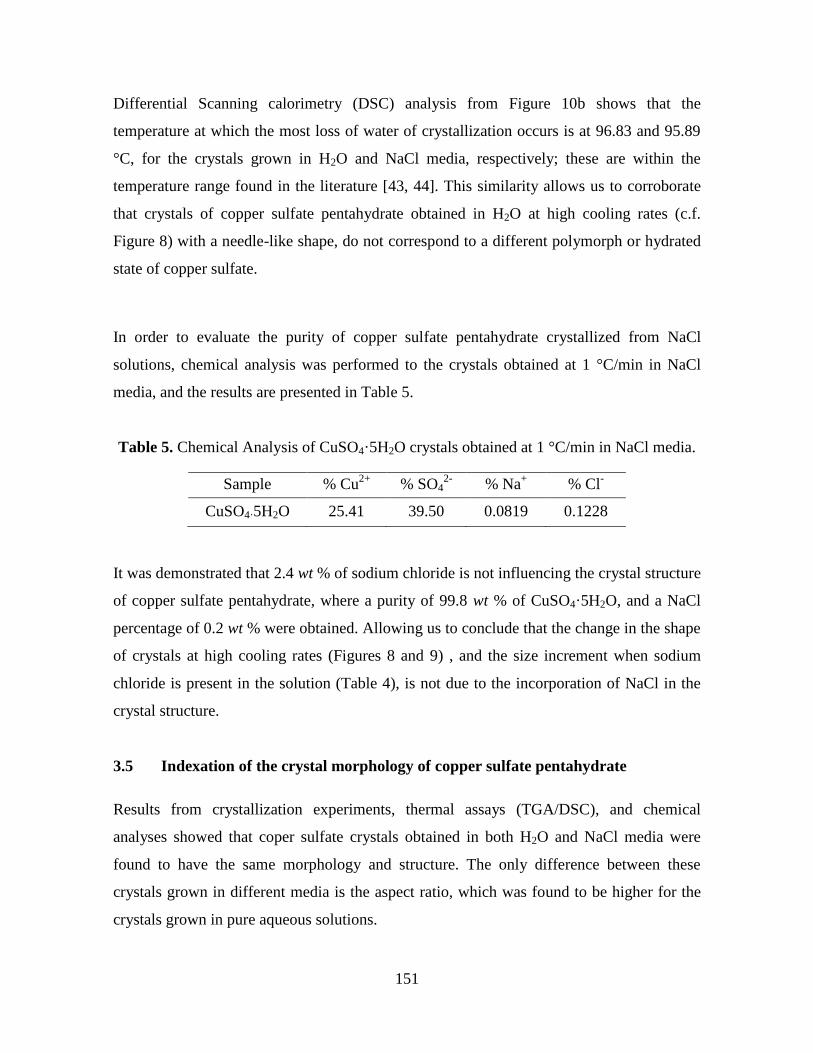
151
Differential Scanning calorimetry (DSC) analysis from Figure 10b shows that the
temperature at which the most loss of water of crystallization occurs is at 96.83 and 95.89
°C, for the crystals grown in H2O and NaCl media, respectively; these are within the
temperature range found in the literature [43, 44]. This similarity allows us to corroborate
that crystals of copper sulfate pentahydrate obtained in H2O at high cooling rates (c.f.
Figure 8) with a needle-like shape, do not correspond to a different polymorph or hydrated
state of copper sulfate.
In order to evaluate the purity of copper sulfate pentahydrate crystallized from NaCl
solutions, chemical analysis was performed to the crystals obtained at 1 °C/min in NaCl
media, and the results are presented in Table 5.
Table 5. Chemical Analysis of CuSO4·5H2O crystals obtained at 1 °C/min in NaCl media.
Sample % Cu2+
% SO42-
% Na+ % Cl
-
CuSO4·5H2O 25.41 39.50 0.0819 0.1228
It was demonstrated that 2.4 wt % of sodium chloride is not influencing the crystal structure
of copper sulfate pentahydrate, where a purity of 99.8 wt % of CuSO4·5H2O, and a NaCl
percentage of 0.2 wt % were obtained. Allowing us to conclude that the change in the shape
of crystals at high cooling rates (Figures 8 and 9) , and the size increment when sodium
chloride is present in the solution (Table 4), is not due to the incorporation of NaCl in the
crystal structure.
3.5 Indexation of the crystal morphology of copper sulfate pentahydrate
Results from crystallization experiments, thermal assays (TGA/DSC), and chemical
analyses showed that coper sulfate crystals obtained in both H2O and NaCl media were
found to have the same morphology and structure. The only difference between these
crystals grown in different media is the aspect ratio, which was found to be higher for the
crystals grown in pure aqueous solutions.
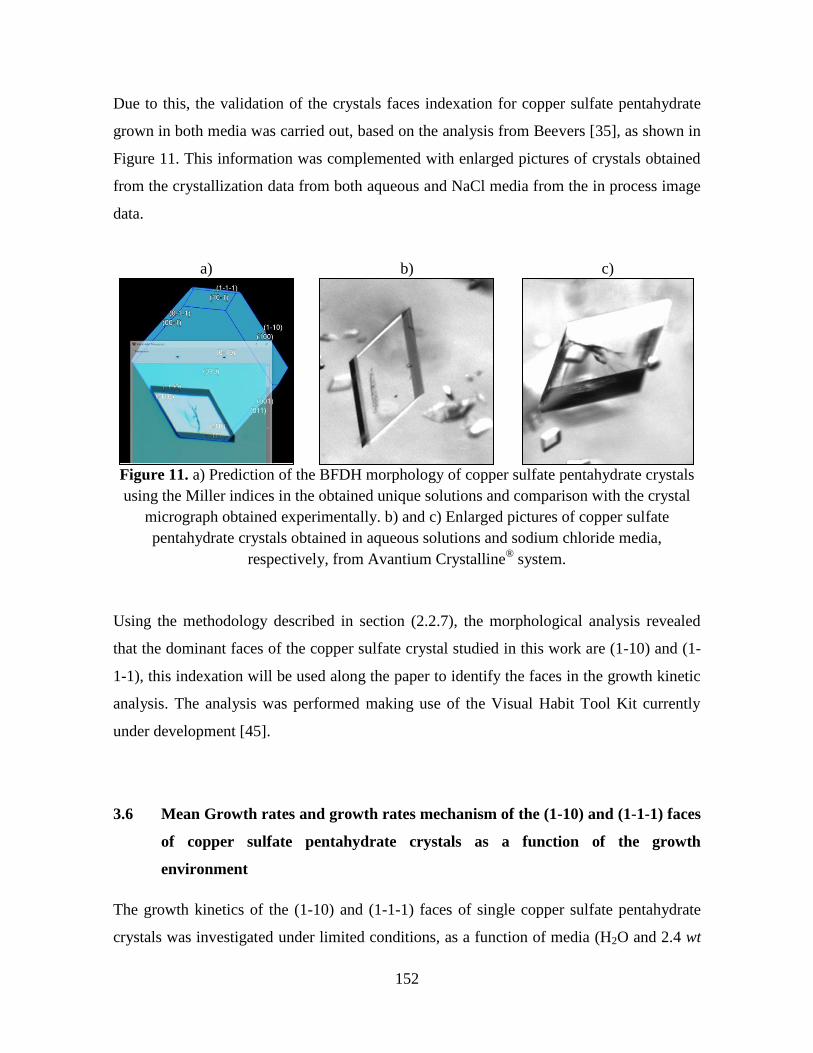
152
Due to this, the validation of the crystals faces indexation for copper sulfate pentahydrate
grown in both media was carried out, based on the analysis from Beevers [35], as shown in
Figure 11. This information was complemented with enlarged pictures of crystals obtained
from the crystallization data from both aqueous and NaCl media from the in process image
data.
a) b) c)
Figure 11. a) Prediction of the BFDH morphology of copper sulfate pentahydrate crystals
using the Miller indices in the obtained unique solutions and comparison with the crystal
micrograph obtained experimentally. b) and c) Enlarged pictures of copper sulfate
pentahydrate crystals obtained in aqueous solutions and sodium chloride media,
respectively, from Avantium Crystalline® system.
Using the methodology described in section (2.2.7), the morphological analysis revealed
that the dominant faces of the copper sulfate crystal studied in this work are (1-10) and (1-
1-1), this indexation will be used along the paper to identify the faces in the growth kinetic
analysis. The analysis was performed making use of the Visual Habit Tool Kit currently
under development [45].
3.6 Mean Growth rates and growth rates mechanism of the (1-10) and (1-1-1) faces
of copper sulfate pentahydrate crystals as a function of the growth
environment
The growth kinetics of the (1-10) and (1-1-1) faces of single copper sulfate pentahydrate
crystals was investigated under limited conditions, as a function of media (H2O and 2.4 wt
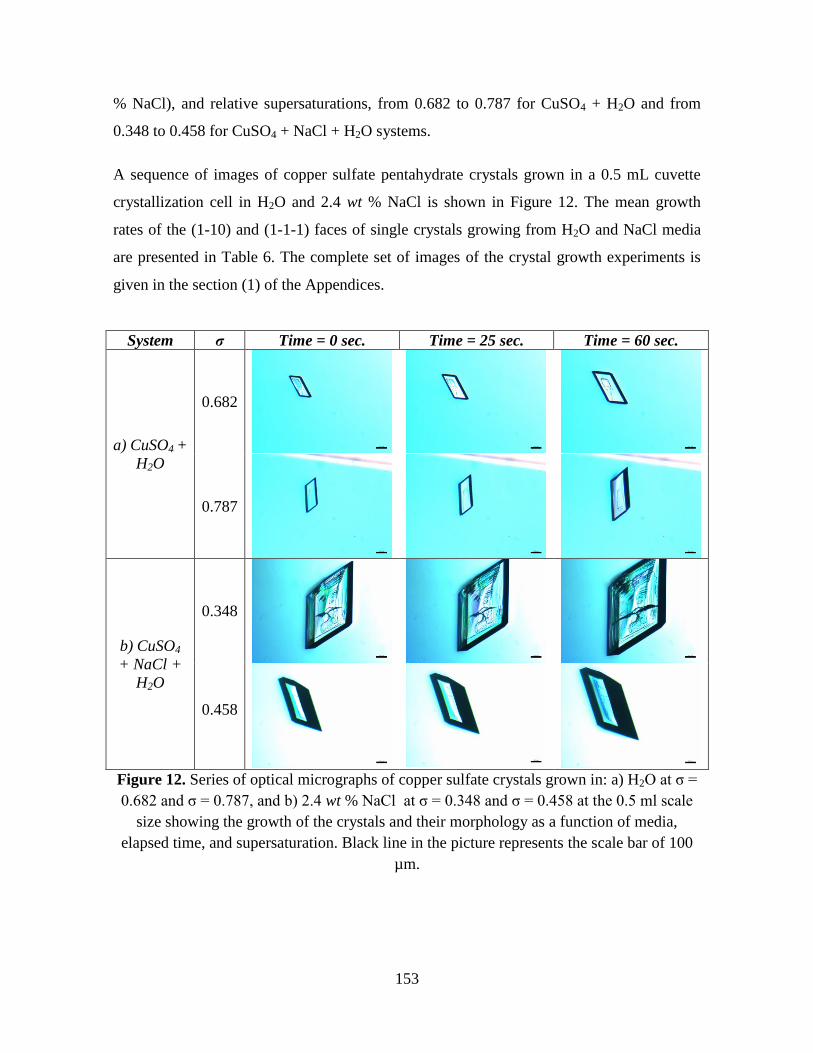
153
% NaCl), and relative supersaturations, from 0.682 to 0.787 for CuSO4 + H2O and from
0.348 to 0.458 for CuSO4 + NaCl + H2O systems.
A sequence of images of copper sulfate pentahydrate crystals grown in a 0.5 mL cuvette
crystallization cell in H2O and 2.4 wt % NaCl is shown in Figure 12. The mean growth
rates of the (1-10) and (1-1-1) faces of single crystals growing from H2O and NaCl media
are presented in Table 6. The complete set of images of the crystal growth experiments is
given in the section (1) of the Appendices.
System σ Time = 0 sec. Time = 25 sec. Time = 60 sec.
a) CuSO4 +
H2O
0.682
0.787
b) CuSO4
+ NaCl +
H2O
0.348
0.458
Figure 12. Series of optical micrographs of copper sulfate crystals grown in: a) H2O at σ =
0.682 and σ = 0.787, and b) 2.4 wt % NaCl at σ = 0.348 and σ = 0.458 at the 0.5 ml scale
size showing the growth of the crystals and their morphology as a function of media,
elapsed time, and supersaturation. Black line in the picture represents the scale bar of 100
µm.
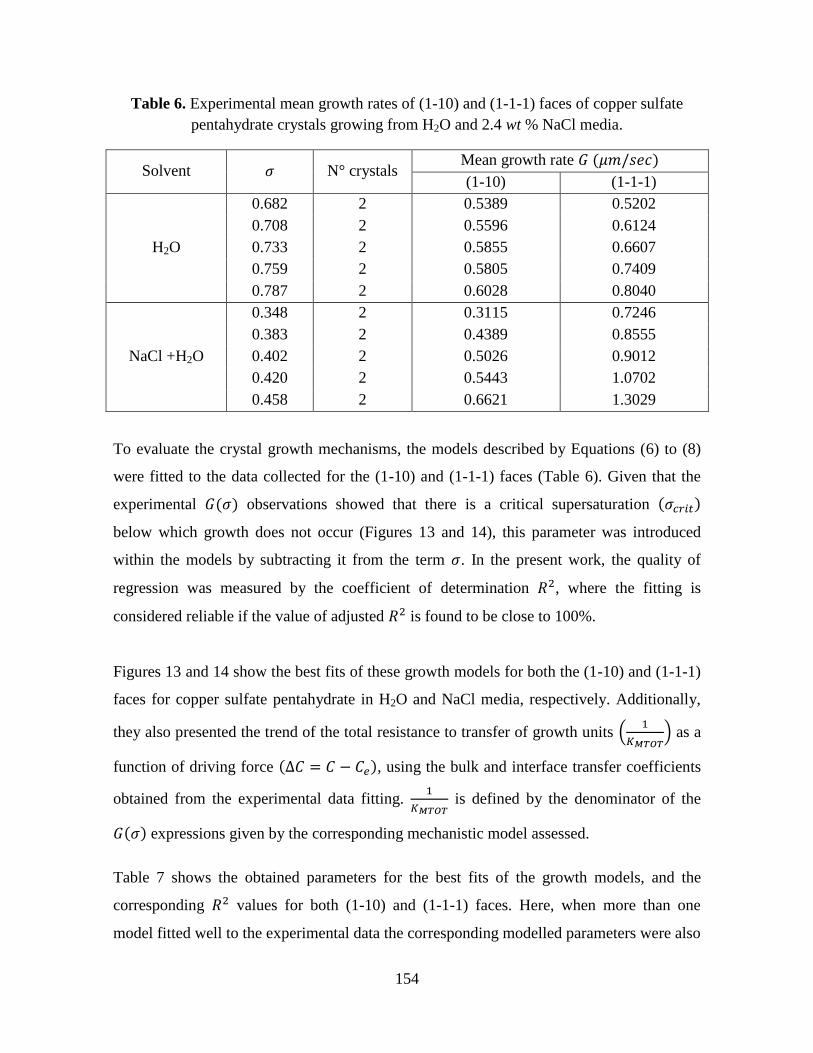
154
Table 6. Experimental mean growth rates of (1-10) and (1-1-1) faces of copper sulfate
pentahydrate crystals growing from H2O and 2.4 wt % NaCl media.
Solvent 𝜎 N° crystals Mean growth rate 𝐺 (𝜇𝑚/𝑠𝑒𝑐)
(1-10) (1-1-1)
H2O
0.682 2 0.5389 0.5202
0.708 2 0.5596 0.6124
0.733 2 0.5855 0.6607
0.759 2 0.5805 0.7409
0.787 2 0.6028 0.8040
NaCl +H2O
0.348 2 0.3115 0.7246
0.383 2 0.4389 0.8555
0.402 2 0.5026 0.9012
0.420 2 0.5443 1.0702
0.458 2 0.6621 1.3029
To evaluate the crystal growth mechanisms, the models described by Equations (6) to (8)
were fitted to the data collected for the (1-10) and (1-1-1) faces (Table 6). Given that the
experimental 𝐺(𝜎) observations showed that there is a critical supersaturation (𝜎𝑐𝑟𝑖𝑡)
below which growth does not occur (Figures 13 and 14), this parameter was introduced
within the models by subtracting it from the term 𝜎. In the present work, the quality of
regression was measured by the coefficient of determination 𝑅2, where the fitting is
considered reliable if the value of adjusted 𝑅2 is found to be close to 100%.
Figures 13 and 14 show the best fits of these growth models for both the (1-10) and (1-1-1)
faces for copper sulfate pentahydrate in H2O and NaCl media, respectively. Additionally,
they also presented the trend of the total resistance to transfer of growth units (1
𝐾𝑀𝑇𝑂𝑇) as a
function of driving force (∆𝐶 = 𝐶 − 𝐶𝑒), using the bulk and interface transfer coefficients
obtained from the experimental data fitting. 1
𝐾𝑀𝑇𝑂𝑇 is defined by the denominator of the
𝐺(𝜎) expressions given by the corresponding mechanistic model assessed.
Table 7 shows the obtained parameters for the best fits of the growth models, and the
corresponding 𝑅2 values for both (1-10) and (1-1-1) faces. Here, when more than one
model fitted well to the experimental data the corresponding modelled parameters were also
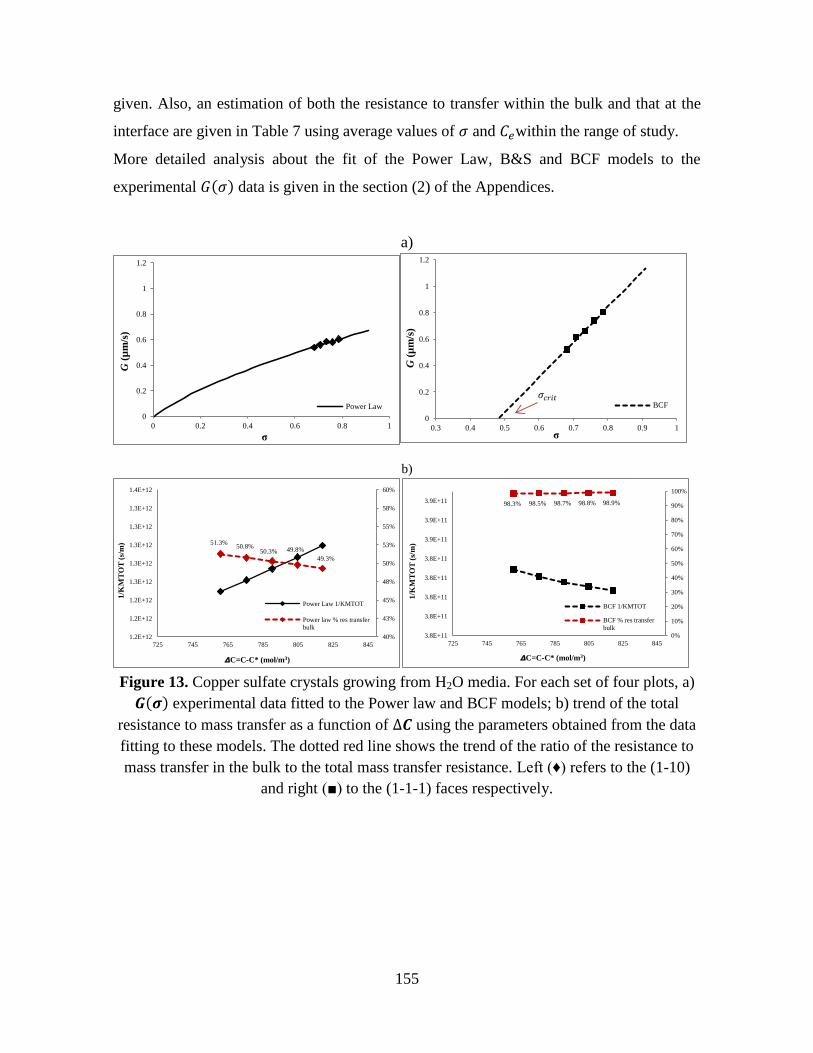
155
given. Also, an estimation of both the resistance to transfer within the bulk and that at the
interface are given in Table 7 using average values of 𝜎 and 𝐶𝑒within the range of study.
More detailed analysis about the fit of the Power Law, B&S and BCF models to the
experimental 𝐺(𝜎) data is given in the section (2) of the Appendices.
a)
b)
Figure 13. Copper sulfate crystals growing from H2O media. For each set of four plots, a)
𝑮(𝝈) experimental data fitted to the Power law and BCF models; b) trend of the total
resistance to mass transfer as a function of ∆𝑪 using the parameters obtained from the data
fitting to these models. The dotted red line shows the trend of the ratio of the resistance to
mass transfer in the bulk to the total mass transfer resistance. Left (♦) refers to the (1-10)
and right (■) to the (1-1-1) faces respectively.
0
0.2
0.4
0.6
0.8
1
1.2
0 0.2 0.4 0.6 0.8 1
G (
µm
/s)
σ
Power Law
0
0.2
0.4
0.6
0.8
1
1.2
0.3 0.4 0.5 0.6 0.7 0.8 0.9 1
G (
µm
/s)
σ
BCF
51.3% 50.8%
50.3% 49.8%
49.3%
40%
43%
45%
48%
50%
53%
55%
58%
60%
1.2E+12
1.2E+12
1.2E+12
1.3E+12
1.3E+12
1.3E+12
1.3E+12
1.3E+12
1.4E+12
725 745 765 785 805 825 845
1/K
MT
OT
(s/
m)
𝞓C=C-C* (mol/m3)
Power Law 1/KMTOT
Power law % res transfer
bulk
98.3% 98.5% 98.7% 98.8% 98.9%
0%
10%
20%
30%
40%
50%
60%
70%
80%
90%
100%
3.8E+11
3.8E+11
3.8E+11
3.8E+11
3.8E+11
3.9E+11
3.9E+11
3.9E+11
725 745 765 785 805 825 845
1/K
MT
OT
(s/
m)
𝞓C=C-C* (mol/m3)
BCF 1/KMTOT
BCF % res transfer
bulk
𝜎𝑐𝑟𝑖𝑡
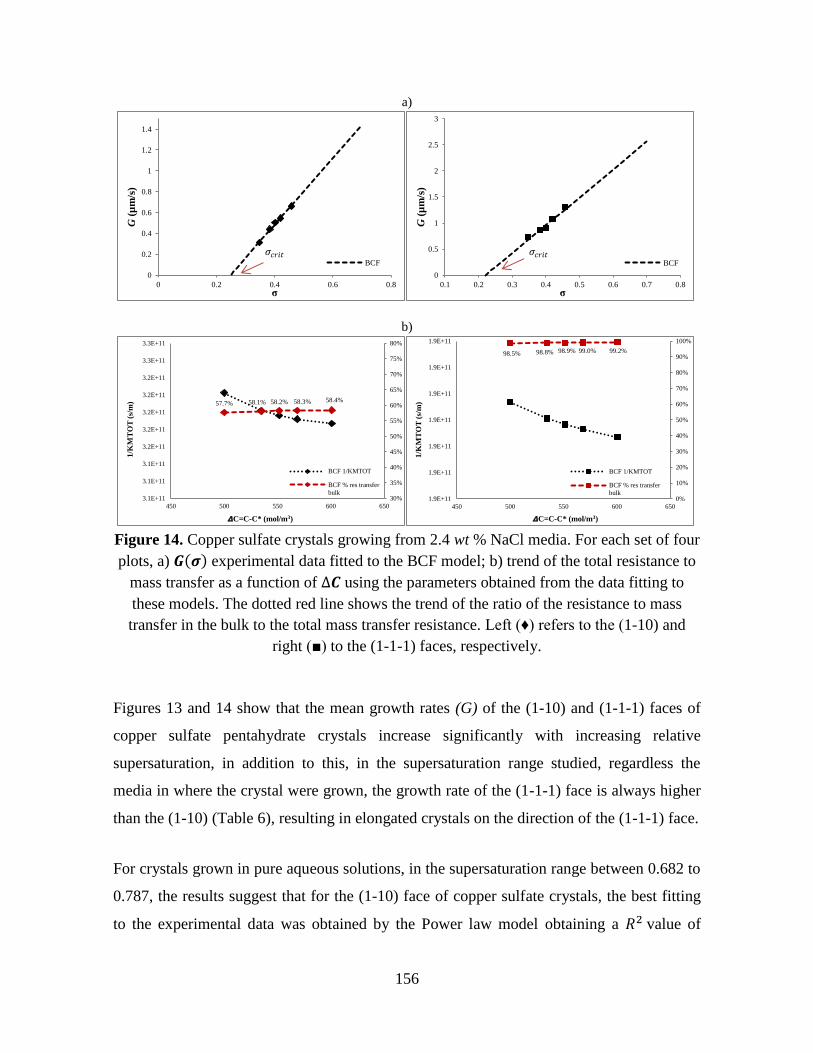
156
a)
b)
Figure 14. Copper sulfate crystals growing from 2.4 wt % NaCl media. For each set of four
plots, a) 𝑮(𝝈) experimental data fitted to the BCF model; b) trend of the total resistance to
mass transfer as a function of ∆𝑪 using the parameters obtained from the data fitting to
these models. The dotted red line shows the trend of the ratio of the resistance to mass
transfer in the bulk to the total mass transfer resistance. Left (♦) refers to the (1-10) and
right (■) to the (1-1-1) faces, respectively.
Figures 13 and 14 show that the mean growth rates (G) of the (1-10) and (1-1-1) faces of
copper sulfate pentahydrate crystals increase significantly with increasing relative
supersaturation, in addition to this, in the supersaturation range studied, regardless the
media in where the crystal were grown, the growth rate of the (1-1-1) face is always higher
than the (1-10) (Table 6), resulting in elongated crystals on the direction of the (1-1-1) face.
For crystals grown in pure aqueous solutions, in the supersaturation range between 0.682 to
0.787, the results suggest that for the (1-10) face of copper sulfate crystals, the best fitting
to the experimental data was obtained by the Power law model obtaining a 𝑅2 value of
0
0.2
0.4
0.6
0.8
1
1.2
1.4
0 0.2 0.4 0.6 0.8
G (
µm
/s)
σ
BCF
0
0.5
1
1.5
2
2.5
3
0.1 0.2 0.3 0.4 0.5 0.6 0.7 0.8
G (
µm
/s)
σ
BCF
57.7% 58.1% 58.2% 58.3% 58.4%
30%
35%
40%
45%
50%
55%
60%
65%
70%
75%
80%
3.1E+11
3.1E+11
3.1E+11
3.2E+11
3.2E+11
3.2E+11
3.2E+11
3.2E+11
3.3E+11
3.3E+11
450 500 550 600 650
1/K
MT
OT
(s/
m)
𝞓C=C-C* (mol/m3)
BCF 1/KMTOT
BCF % res transfer
bulk
98.5% 98.8% 98.9% 99.0% 99.2%
0%
10%
20%
30%
40%
50%
60%
70%
80%
90%
100%
1.9E+11
1.9E+11
1.9E+11
1.9E+11
1.9E+11
1.9E+11
1.9E+11
450 500 550 600 650
1/K
MT
OT
(s/
m)
𝞓C=C-C* (mol/m3)
BCF 1/KMTOT
BCF % res transfer
bulk
𝜎𝑐𝑟𝑖𝑡
𝜎𝑐𝑟𝑖𝑡
157
90%, with a 𝜎𝑐𝑟𝑖𝑡 value of 0.003. This means that the growth practically occurs at any
supersaturation level. For the (1-1-1) face, the best fitting to the experimental data was
obtained for the model given by the BCF mechanism, which is confirmed by the 𝑟 value of
1.09 in the case of the Power law model for high supersaturations.
For crystals grown in NaCl media, in the supersaturation range from 0.348 to 0.458, the
best fitting to the experimental data was obtained for the BCF mechanism model for both
(1-10) and (1-1-1) faces, which is confirmed by the 𝑟 value of 0.99 and 1.03, respectively,
in the case of the Power law model for high supersaturations.
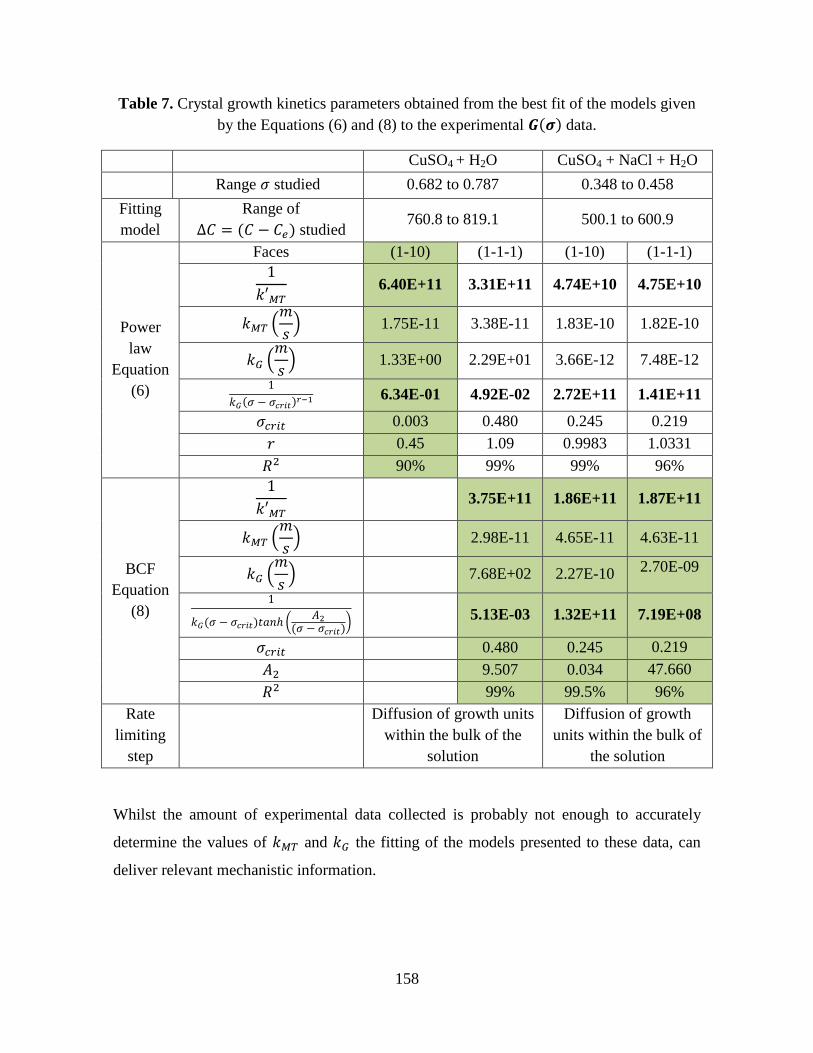
158
Table 7. Crystal growth kinetics parameters obtained from the best fit of the models given
by the Equations (6) and (8) to the experimental 𝑮(𝝈) data.
CuSO4 + H2O CuSO4 + NaCl + H2O
Range 𝜎 studied 0.682 to 0.787 0.348 to 0.458
Fitting
model
Range of
∆𝐶 = (𝐶 − 𝐶𝑒) studied 760.8 to 819.1 500.1 to 600.9
Power
law
Equation
(6)
Faces (1-10) (1-1-1) (1-10) (1-1-1)
1
𝑘′𝑀𝑇 6.40E+11 3.31E+11 4.74E+10 4.75E+10
𝑘𝑀𝑇 (𝑚
𝑠) 1.75E-11 3.38E-11 1.83E-10 1.82E-10
𝑘𝐺 (𝑚
𝑠) 1.33E+00 2.29E+01 3.66E-12 7.48E-12
1
𝑘𝐺(𝜎 − 𝜎𝑐𝑟𝑖𝑡)𝑟−1 6.34E-01 4.92E-02 2.72E+11 1.41E+11
𝜎𝑐𝑟𝑖𝑡 0.003 0.480 0.245 0.219
𝑟 0.45 1.09 0.9983 1.0331
𝑅2 90% 99% 99% 96%
BCF
Equation
(8)
1
𝑘′𝑀𝑇 3.75E+11 1.86E+11 1.87E+11
𝑘𝑀𝑇 (𝑚
𝑠) 2.98E-11 4.65E-11 4.63E-11
𝑘𝐺 (𝑚
𝑠) 7.68E+02 2.27E-10 2.70E-09
1
𝑘𝐺(𝜎 − 𝜎𝑐𝑟𝑖𝑡)𝑡𝑎𝑛ℎ (𝐴2
(𝜎 − 𝜎𝑐𝑟𝑖𝑡))
5.13E-03 1.32E+11 7.19E+08
𝜎𝑐𝑟𝑖𝑡 0.480 0.245 0.219
𝐴2 9.507 0.034 47.660
𝑅2 99% 99.5% 96%
Rate
limiting
step
Diffusion of growth units
within the bulk of the
solution
Diffusion of growth
units within the bulk of
the solution
Whilst the amount of experimental data collected is probably not enough to accurately
determine the values of 𝑘𝑀𝑇 and 𝑘𝐺 the fitting of the models presented to these data, can
deliver relevant mechanistic information.
159
From Table 7, which shows the comparison between the resistance to mass transfer within
the bulk of the solution (1
𝑘𝑀𝑇′ ) and the resistance to incorporation of growth units at the
crystal/solution interface (1
𝑘𝐺(𝜎−𝜎𝑐𝑟𝑖𝑡)𝑟−1). It was found that for both the (1-10) and (1-1-1)
faces in pure aqueous solutions media, the resistance to mass transfer is twelve and fourteen
orders of magnitude higher, respectively, than the resistance to incorporation of growth
units at the interface, which supports the diffusion of growth units within the bulk of the
solution as the rate limiting step. Likewise, a comparison of the 𝑘𝐺 (𝑚
𝑠) values showed that
𝑘𝐺 (𝑚
𝑠) is two orders of magnitude higher in the (1-1-1) face, which suggests that the
molecular integration in this face is higher, resulting in a more elongated habit of the
crystals at the studied supersaturations.
According to the Figure 13b, the trend of the total resistance to transfer of growth units
(1
𝐾𝑀𝑇𝑂𝑇) as a function of driving force (∆𝐶 = 𝐶 − 𝐶𝑒), where it is shown that in H2O
media, the resistance to mass transfer is 49.3% to 51.3% of the total resistance for the (1-
10) face, and 98.3 to 98.9% for the (1-1-1) face. In this figure, it is also shown that in the
(1-10) face, as the driving force increases, the total resistance increases, but an opposite
behaviour is observed for the (1-1-1) face where a decrease in the total resistance is
observed.
From Table 7, it is observed that for crystals grown in NaCl media, the resistance to mass
transfer is of the same order of magnitude to the resistance to transfer at the interface for
the (1-10) face. In the case of the (1-1-1) face, the resistance to mass transfer is three orders
of magnitude higher than the resistance to incorporation at the interface. Likewise, if the
𝑘𝐺 (𝑚
𝑠) values are analyzed, it is observed that these values are lower for crystals grown in
NaCl, additionally, it is noted that 𝑘𝐺 (𝑚
𝑠) is one order of magnitude higher in the (1-1-1)
face, which suggests that the molecules integration in this face is higher, resulting in a
slightly more elongated habit of the crystals at the studied supersaturations.
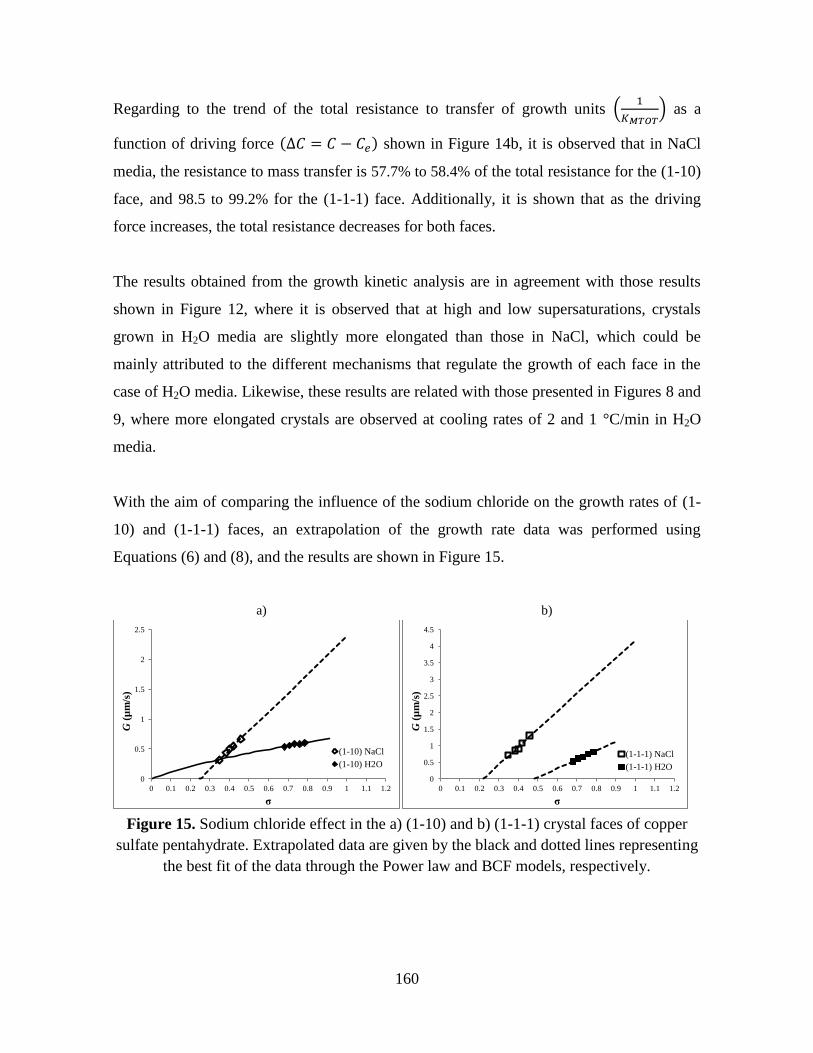
160
Regarding to the trend of the total resistance to transfer of growth units (1
𝐾𝑀𝑇𝑂𝑇) as a
function of driving force (∆𝐶 = 𝐶 − 𝐶𝑒) shown in Figure 14b, it is observed that in NaCl
media, the resistance to mass transfer is 57.7% to 58.4% of the total resistance for the (1-10)
face, and 98.5 to 99.2% for the (1-1-1) face. Additionally, it is shown that as the driving
force increases, the total resistance decreases for both faces.
The results obtained from the growth kinetic analysis are in agreement with those results
shown in Figure 12, where it is observed that at high and low supersaturations, crystals
grown in H2O media are slightly more elongated than those in NaCl, which could be
mainly attributed to the different mechanisms that regulate the growth of each face in the
case of H2O media. Likewise, these results are related with those presented in Figures 8 and
9, where more elongated crystals are observed at cooling rates of 2 and 1 °C/min in H2O
media.
With the aim of comparing the influence of the sodium chloride on the growth rates of (1-
10) and (1-1-1) faces, an extrapolation of the growth rate data was performed using
Equations (6) and (8), and the results are shown in Figure 15.
a) b)
Figure 15. Sodium chloride effect in the a) (1-10) and b) (1-1-1) crystal faces of copper
sulfate pentahydrate. Extrapolated data are given by the black and dotted lines representing
the best fit of the data through the Power law and BCF models, respectively.
0
0.5
1
1.5
2
2.5
0 0.1 0.2 0.3 0.4 0.5 0.6 0.7 0.8 0.9 1 1.1 1.2
G (
µm
/s)
σ
(1-10) NaCl
(1-10) H2O
0
0.5
1
1.5
2
2.5
3
3.5
4
4.5
0 0.1 0.2 0.3 0.4 0.5 0.6 0.7 0.8 0.9 1 1.1 1.2
G (
µm
/s)
σ
(1-1-1) NaCl
(1-1-1) H2O
161
Based on the comparison, it has been possible to conclude that for both the (1-10) and (1-1-
1) faces, the growth rates in NaCl are higher than in H2O media, the only exception is for
the (1-10) growth rates in NaCl at supersaturations below 0.348, which are lower than those
in H2O. These results are related with those of Brandse et al. [14] where the growth kinetics
of gypsum in H2O and NaCl media was studied, and was evidenced that the addition of
sodium chloride accelerates the growth rate of gypsum remarkably.
Summarizing, the increment in size of copper sulfate crystals when sodium chloride is
present in the solution (Table 4), is mainly attributed to the higher growth rate of the crystal
faces when crystals are grown in NaCl. Figure 15 also shows that the sodium chloride
effect is more relevant for the (1-10) face, where a change in its growth mechanism is
observed.
4. CONCLUSIONS
The present work studied the cooling rate and sodium chloride effect in the crystal
morphology, size, composition, and growth rates of copper sulfate pentahydrate crystals, in
order to evaluate the effect of using seawater as an alternative to pure water, for the
industrial process associated with copper sulfate pentahydrate crystallization. In general,
this research suggest that crystals grown in sodium chloride media are larger and more
prismatic compared to those grown in pure aqueous solutions. This behaviour can be
mainly attributed to changes on the growth kinetics reflecting the fact that the growth rates
of both the (1-10) and (1-1-1) faces are affected when sodium chloride is present in the
solution, especially in the case of the (1-10) face, where a change in the growth mechanism
is observed.
Higher cooling rates and/or the addition of sodium chloride were found to have a relevant
effect in the shape of copper sulfate pentahydrate crystals, where the habit was found to
change from an acicular shape, when crystals are in pure aqueous media, to prismatic
crystals in the presence of NaCl. The percentage of particles in higher size ranges was
slightly increased in the presence of NaCl.
162
For crystals grown from pure aqueous solutions, the kinetic data were found to be
consistent with the Power law and BCF interfacial growth mechanism for (1-10) and (1-1-
1) faces, respectively. On the other hand, for the crystals grown in NaCl media, the kinetic
data were found to be consistent with the BCF interfacial growth mechanism for both the
(1-10) and (1-1-1) faces.
In order to obtain a better understanding of the crystallization of copper sulfate
pentahydrate as a function of the solvation environment, it would be interesting to use
molecular and synthonic modelling techniques to carry out a chemical interaction analysis
between the solution species and the specific habit faces of the crystals.
ACKNOLEDGEMENTS: Francisca Justel acknowledge Kevin Roberts from University
of Leeds for the support in this Research which forms part of her doctoral studies, and
CONICYT, Chile for providing the Ph.D. scholarship. The authors also gratefully
acknowledge the UK's EPSRC for the support of nucleation and crystal growth research at
Leeds and Manchester through funding the Critical Mass Project: Molecules, Clusters and
Crystals (Grant references EP/IO14446/1 and EP/IO13563/1).
163
5. REFERENCES
[1] L.A. Cisternas, L. Moreno, El agua de mar en la minería: Fundamentos y aplicaciones,
in, RIL editores, 2014, pp. 234.
[2] M. Giulietti, S. Derenzo, J. Nývlt, L. Ishida, Crystallization of copper sulphate, Crystal
Research and Technology, 30 (1995) 177-183.
[3] S. Aktas, A novel purification method for copper sulfate using ethanol,
Hydrometallurgy, 106 (2011) 175-178.
[4] H.W. Richardson, Handbook of copper compounds and applications, CRC Press, 1997.
[5] M.E. Schlesinger, M.J. King, K.C. Sole, W.G. Davenport, Extractive metallurgy of
copper, Elsevier, 2011.
[6] V. Manomenova, M. Stepnova, V. Grebenev, E. Rudneva, A. Voloshin, Growth of
CuSO4·5H2O single crystals and study of some of their properties, Crystallography
Reports, 58 (2013) 513-516.
[7] T. Ishii, S. Fujita, Crystallization from supersaturated cupric sulfate solutions in a
batchwise stirred tank, The Chemical Engineering Journal, 21 (1981) 255-260.
[8] R.C. Zumstein, R.W. Rousseau, Agglomeration of copper sulfate pentahydrate crystals
within well-mixed crystallizers, Chemical engineering science, 44 (1989) 2149-2155.
[9] M. Giulietti, M. Seckler, S. Derenzo, J. Valarelli, Changes in copper sulfate crystal
habit during cooling crystallization, Journal of crystal growth, 166 (1996) 1089-1093.
[10] M. Giulietti, M. Seckler, S. Derenzo, L. Schiavon, J. Valarelli, J. Nyvlt, Effect of
selected parameters on crystallization of copper sulphate pentahydrate, Crystal Research
and Technology, 34 (1999) 959-967.
[11] P.a.C. Hernandez, H.c.R. Galleguillos, T.f.A. Graber, E.K. Flores, M.E. Taboada,
Effect of Seawater on the Solubility and Physicochemical Properties of Acidic Copper
Sulfate Solutions, Journal of Chemical & Engineering Data, 57 (2012) 2430-2436.
164
[12] F. Justel, M. Claros, M. Taboada, Solubilities and physical properties of saturated
solutions in the copper sulfate + sulfuric acid + seawater system at different temperatures,
Brazilian Journal of Chemical Engineering, 32 (2015) 629-635.
[13] F.J. Justel, M.E. Taboada, Y.P. Jimenez, Solid–liquid equilibrium and copper sulfate
crystallization process design from a sulfuric-acid–seawater system in the temperature
range from 293.15 to 333.15 K, (2017).
[14] W. Brandse, G. Van Rosmalen, G. Brouwer, The influence of sodium chloride on the
crystallization rate of gypsum, Journal of Inorganic and Nuclear Chemistry, 39 (1977)
2007-2010.
[15] R. Sheikholeslami, H. Ong, Kinetics and thermodynamics of calcium carbonate and
calcium sulfate at salinities up to 1.5 M, Desalination, 157 (2003) 217-234.
[16] J. Garside, A. Mersmann, J. Nývlt, Measurement of crystal growth and nucleation
rates, IChemE, 2002.
[17] T.T.H. Nguyen, Influence of crystallisation environment on the nucleation and growth
of single crystals of (RS)-ibuprofen, University of Leeds, 2013.
[18] J. Mullin, A. Amatavivadhana, Growth kinetics of ammonium‐and potassium‐
dihydrogen phosphate crystals, Journal of Chemical Technology and Biotechnology, 17
(1967) 151-156.
[19] R. Davey, J. Mullin, Growth of the (101) faces of ammonium dihydrogen phosphate
crystals in the presence of ionic species, Journal of crystal growth, 23 (1974) 89-94.
[20] C. Sweegers, H. Meekes, W. Van Enckevort, I. Hiralal, A. Rijkeboer, Growth rate
analysis of gibbsite single crystals growing from aqueous sodium aluminate solutions,
Crystal Growth & Design, 4 (2004) 185-198.
[21] S. Suharso, In Situ Measurement of the Growth Rate of the (111) Face of Borax Single
Crystal, Jurnal Matematika & Sains, 10 (2009) 101-106.
165
[22] T. Nguyen, R. Hammond, K. Roberts, I. Marziano, G. Nichols, Precision measurement
of the growth rate and mechanism of ibuprofen (001) and (011) as a function of
crystallization environment, CrystEngComm, 16 (2014) 4568-4586.
[23] D.M. Camacho, K.J. Roberts, K. Lewtas, I. More, The crystal morphology and growth
rates of triclinic N-docosane crystallising from N-dodecane solutions, Journal of crystal
growth, 416 (2015) 47-56.
[24] D.M. Camacho, K.J. Roberts, F. Muller, D. Thomas, I. More, K. Lewtas, Morphology
and growth of methyl stearate as a function of crystallisation environment, Crystal Growth
& Design, (2016).
[25] W.F. Linke, A. Seidell, Solubilities, inorganic and metal-organic compounds: a
compilation of solubility data from the periodical literature, American Chemical Society
Washington, DC, 1958.
[26] E. Lyall, P. Mougin, D. Wilkinson, K.J. Roberts, In situ ultrasonic spectroscopy study
of the nucleation and growth of copper sulfate pentahydrate batch crystallized from
supersaturated aqueous solutions, Industrial & Engineering Chemistry Research, 43 (2004)
4947-4956.
[27] N. Rajarao, V. Brahmajirao, A. Sarma, Studies on Ion-Solvent Interactions of
Electrolyte Solutions–Part 3: Activity Coefficient Studies of 2-2 Electrolytes (Sulphates of
Transition Metals), International Journal of Science and Technology, 1 (2012).
[28] K.S. Pitzer, G. Mayorga, Thermodynamics of electrolytes. III. Activity and osmotic
coefficients for 2–2 electrolytes, Journal of Solution Chemistry, 3 (1974) 539-546.
[29] S. Clegg, M. Whitfield, Activity coefficients in natural waters, Activity coefficients in
electrolyte solutions, 2 (1991).
[30] F.J. Justel, M.E. Taboada, Y.P. Jimenez, Thermodynamic study of the Cu-Na-H-SO4-
Cl-HSO4-H2O system for the solubility of copper sulfate in acid seawater at different
temperatures, Journal of Molecular Liquids, (not published work).
166
[31] J. Garside, Industrial crystallization from solution, Chemical engineering science, 40
(1985) 3-26.
[32] W.-K. Burton, N. Cabrera, F. Frank, The growth of crystals and the equilibrium
structure of their surfaces, Philosophical Transactions of the Royal Society of London A:
Mathematical, Physical and Engineering Sciences, 243 (1951) 299-358.
[33] J.D. Weeks, G.H. Gilmer, Dynamics of crystal growth, Adv. Chem. Phys, 40 (1979)
157-227.
[34] G. Clydesdale, R. Docherty, K. Roberts, HABIT-a program for predicting the
morphology of molecular crystals, Computer Physics Communications, 64 (1991) 311-328.
[35] C. Beevers, H. Lipson, The Crystal Structure of Copper Sulphate Pentahydrate,
CuSO4·5H2O, Proceedings of the Royal Society of London. Series A, 146 (1934) 570-582.
[36] D. Cunningham, D. Armstrong, G. Clydesdale, K. Roberts, Investigation into the
structural chemistry of Cu2+
ions in doped nearly perfect single crystals of ammonium
sulfate with reference to their role in habit modification, Faraday Discussions, 95 (1993)
347-365.
[37] J.D.H. Donnay, D. Harker, A new law of crystal morphology extending the law of
Bravais, Am. Mineral, 22 (1937) 446-467.
[38] J.O.M. Bockris, A.K.N. Reddy, Modern Electrochemistry, in: N.Y. Reverté (Ed.),
1979.
[39] J.W. Morales Saavedra, Tesis de Doctorado: Estudio Termodinámico de sistemas
ternarios Sal + PEG 4000 + Agua a las temperaturas de (288.15, 298.15 y 308.15) K, in,
2011.
[40] J. Ulrich, C. Strege, Some aspects of the importance of metastable zone width and
nucleation in industrial crystallizers, Journal of crystal growth, 237 (2002) 2130-2135.
[41] N. Kubota, A new interpretation of metastable zone widths measured for unseeded
solutions, Journal of crystal growth, 310 (2008) 629-634.
167
[42] D. Kashchiev, A. Borissova, R.B. Hammond, K.J. Roberts, Effect of cooling rate on
the critical undercooling for crystallization, Journal of crystal growth, 312 (2010) 698-704.
[43] H. Tanaka, Thermal stabilities and enthalpy changes in the thermal dehydration stages
of CuSO4·5H2O and CuSO4·5D2O, Thermochimica Acta, 43 (1981) 289-295.
[44] P. Nandi, D. Deshpande, V. Kher, Dehydration steps in CuSO4·5H2O crystals, Journal
of Chemical Sciences, 88 (1979) 113-124.
[45] J. Pickering, R.B. Hammond, V. Ramachandran, M. Soufian, K.J. Roberts, Synthonic
Engineering Modelling Tools for Product and Process Design, Chapter 10 In: Engineering
Crystallography: From Molecule to Crystal to Functional Form (edited by K J Roberts, R
Docherty R and R Tamura), 2017, in press, Springer Advanced Study Institute (ASI)
Series.
168
CHAPTER VII
GENERAL CONCLUSIONS AND RECOMMENDATIONS
1. GENERAL CONCLUSIONS FOR THIS STUDY
In the thesis entitled "Seawater effect in the thermodynamics and crystallization of copper
sulfate pentahydrate" has been studied the seawater effect in the thermodynamic behaviour
and crystallization of copper sulfate pentahydrate in order to analyze the feasibility of the
seawater use in this hydrometallurgical process.
For this, the seawater effect on the solid−liquid equilibrium and physical properties of acid
solutions of copper sulfate in a wide temperature range was studied. Moreover, the
thermodynamic representation of the solid–liquid equilibrium of the copper sulfate-sulfuric
acid-seawater system over a wide temperature range has been carried out by two different
modeling routines:
- First, the Pitzer model and a Born-type equation were used for modeling the copper
sulfate and sulfuric acid effects, respectively, using the seawater as a solvent.
- Secondly, by means of the thermodynamic study of the Cu-Na-H-SO4-Cl-HSO4-
H2O system using the Pitzer ion-interaction model.
Finally, and in order to evaluate the seawater effect in the copper sulfate pentahydrate
crystallization, sodium chloride effect in the crystal shape, particle size, composition, and
growth kinetics of copper sulfate pentahydrate crystals was studied.
Accordingly, and regarding to the seawater effect on the solid-liquid equilibrium and
physical properties of acid solutions of copper sulfate, the following conclusions are
obtained:
- The experimental values for density, viscosity, and solubility in the saturated
solutions, were correlated using the empirical equations proposed in the present
work, obtaining absolute average deviations of 0.0005, 0.0056, and, 0.0043,
respectively, at 293.15 K; 0.0004, 0.0029 and, 0.0038, respectively, at 298.15 K;
169
0.0007, 0.0048, and 0.0023, respectively, at 308.15 K; and 0.0007, 0.0055, and
0.0037, respectively, at 318.15 K.
- In the saturated solutions, with increasing temperature and acid concentration, the
solutions densities increased. Moreover, with increasing acid concentration and
temperature, there is a decrease in the solution viscosity.
- Sulfuric acid has a big effect on the reduction of the copper sulfate solubility;
however, the temperature has an inverse behavior. In addition to this, the presence
of salts in the seawater contributes to the solubility decreasing of copper sulfate
pentahydrate in seawater media.
- X-ray diffraction and thermogravimetric analyses demonstrated that the
composition of crystals obtained at different temperatures using sulfuric acid and
seawater, correspond to copper sulfate pentahydrate.
Regarding to the thermodynamic representation of the solid-liquid equilibrium of the
copper sulfate - sulfuric acid - seawater system, the following conclusions are obtained:
- From the experimental water activities of copper sulfate solutions in seawater and
freshwater was concluded that in both systems, water activities decrease as the
solution concentration increase. Additionally, values in seawater are lower than
those in freshwater; both behaviors are due to the increment in the number of water
molecules associated with the different ions in the solution. Also, the water
activities are highly affected by the solute concentration; but slightly influenced by
the temperature.
- Binary Pitzer parameters for solutions of copper sulfate in seawater were
determined and used for the determination of the solubility products of copper
sulfate pentahydrate at different temperatures, where a difference of 0.0010 between
the solubility product obtained in the present work and the one in freshwater from
the literature at 298.15 K was mainly attributed to the respective experimental
uncertainties. The similarity of these values allowed us to validate the model used in
the present work.
- Pitzer parameters for CuSO4, CuCl2, and Cu(HSO4)2 solutions in freshwater from
293.15 to 333.15 K were determined and used for the determination of their activity
170
coefficients as a function of the concentration at several temperatures, where it was
observed in all cases a decrease in the activity coefficients as the temperature
increases. Also, the concentration effect was different for each of the electrolytes.
- Values for the ternary parameters 𝜓𝐶𝑢,𝐻,𝐶𝑙, 𝜓𝐶𝑢,𝑁𝑎,𝐻𝑆𝑂4 and 𝜓𝐶𝑢,𝐶𝑙,𝐻𝑆𝑂4
were
reported, and considered as constant fitting parameters in the temperature range
from 293.15 to 333.15 K.
- Solubility product values for aqueous solutions of copper sulfate at different
temperatures were determined and the similarity of the 𝐾𝑠𝑝 values at 298.15 K
between the data reported here with the literature data allowed the validation of the
model used in the present work.
- All the information reported in this work (water activities, binary and ternary Pitzer
parameters, activity and osmotic coefficients) are a great contribution for the
thermodynamics of electrolytes, especially for those systems where the Cu2+
, Na+,
H+, SO4
2-, Cl
-, and HSO4
- ions are involved.
- A simple methodology, based on a variation of the Kan’s method, has been applied
to represent the solid–liquid equilibrium of the CuSO4-H2SO4-seawater system at
different temperatures considering the seawater as a solvent, obtaining a good
agreement between the experimental and correlated values. In addition, using this
method was possible to estimate the sulfuric acid concentration necessary to
maximize the copper sulfate precipitation.
- The ion interaction model of Pitzer was successfully used to determine the
solubilities of the CuSO4-H2SO4-seawater system at six different temperatures by
modelling the Cu-Na-H-SO4-Cl-HSO4-H2O system. Despite only sodium and
chloride ions were considered as seawater components, a good agreement between
the experimental and correlated values was obtained. By means of this finding, was
concluded that thermodynamic studies for systems containing seawater could be
performed only considering these main ions, because the others from seawater do
not have a notorious influence in the modelling.
Regarding to the sodium chloride effect in copper sulfate pentahydrate crystallization, the
following conclusions have been established:
171
- Solubility values of copper sulfate in a media with 2.4 wt % NaCl are slightly lower
than the values in H2O, with a mean deviation of 0.0037; additionally, in solutions
with NaCl, the metastable zone width is narrower than in H2O media, both
behaviors are attributed to the higher salt concentration of the solutions.
- Activity coefficients of copper sulfate solutions in H2O and NaCl media showed a
predominance of ion-solvent interactions over ion-ion interactions at low
concentrations. However, as the concentration increases, an increase of the ion-ion
interactions was observed. In addition, higher values of the activity coefficients in
H2O than in NaCl media, indicated that the ion-solvent interactions of the CuSO4 +
H2O solutions are stronger than those of CuSO4 + NaCl + H2O solutions.
- Cooling rate and sodium chloride presence have a significant effect on the crystal
shape, where at high cooling rates with no sodium chloride, copper sulfate crystals
have a needle-like shape. However, at slow cooling rates the crystals became
prismatic. On the other hand, when NaCl is present in the solution, crystals are
prismatic at high and slow cooling rates.
- DSC analysis corroborated that crystals obtained in H2O at high cooling rates with a
needle-like shape, did not correspond to a different polymorph of copper sulfate
pentahydrate.
- There is a slight increase in the particle size when sodium chloride is present in the
solution, where in absence of sodium chloride, the particles in the size range of
<100 µm are on average 1.63% smaller than the particles in the sodium chloride
media. Also, this sodium chloride concentration did not influence notoriously in the
structure of copper sulfate pentahydrate, where a purity of 99.8 wt % of
CuSO4·5H2O was obtained.
- The mean growth rates (𝐺) of the (1-10) and (1-1-1) faces of copper sulfate
pentahydrate crystals increase significantly with increasing relative supersaturation.
Additionally, in both media (H2O and NaCl), the growth rate of the (1-1-1) face is
higher than the (1-10), resulting in more elongated crystals on the direction of the
(1-1-1) face.
- For crystals grown in H2O, in the case of the (1-10) face of copper sulfate crystals,
the best fitting to the experimental data was obtained by the Power law model
172
meaning that the growth practically occurs at any supersaturation level. For the (1-
1-1) face, the best fitting was obtained for the model given by the BCF mechanism;
which suggests that growth proceeds via screw dislocations.
- For crystals grown in NaCl media, the best fittings to the experimental data were
obtained for the model given by the BCF mechanism for both (1-10) and (1-1-1)
faces; which suggest that growth in this case proceeds via screw dislocations.
- The growth rate in NaCl is higher than in H2O media for the (1-10) and (1-1-1)
faces, confirming that the increment in size of copper sulfate crystals when sodium
chloride is present in the solution was attributed to the higher growth rate of the
crystal faces in NaCl media, and not to the incorporation of NaCl in the crystal
structure.
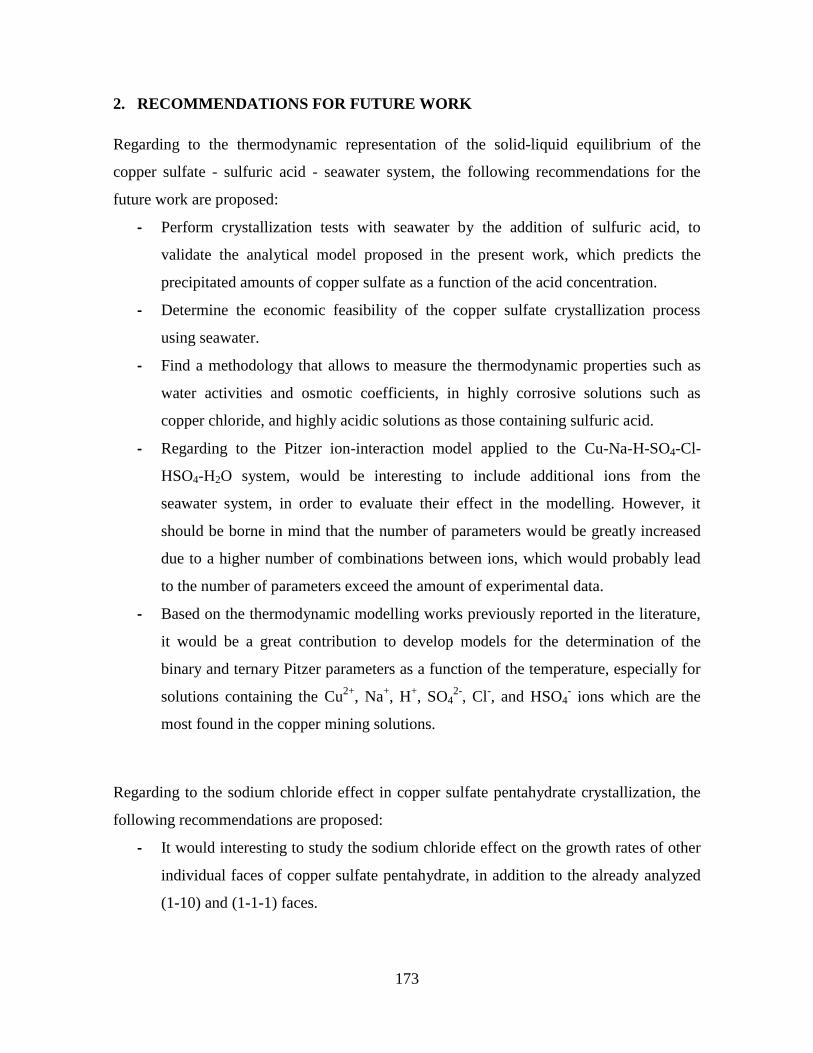
173
2. RECOMMENDATIONS FOR FUTURE WORK
Regarding to the thermodynamic representation of the solid-liquid equilibrium of the
copper sulfate - sulfuric acid - seawater system, the following recommendations for the
future work are proposed:
- Perform crystallization tests with seawater by the addition of sulfuric acid, to
validate the analytical model proposed in the present work, which predicts the
precipitated amounts of copper sulfate as a function of the acid concentration.
- Determine the economic feasibility of the copper sulfate crystallization process
using seawater.
- Find a methodology that allows to measure the thermodynamic properties such as
water activities and osmotic coefficients, in highly corrosive solutions such as
copper chloride, and highly acidic solutions as those containing sulfuric acid.
- Regarding to the Pitzer ion-interaction model applied to the Cu-Na-H-SO4-Cl-
HSO4-H2O system, would be interesting to include additional ions from the
seawater system, in order to evaluate their effect in the modelling. However, it
should be borne in mind that the number of parameters would be greatly increased
due to a higher number of combinations between ions, which would probably lead
to the number of parameters exceed the amount of experimental data.
- Based on the thermodynamic modelling works previously reported in the literature,
it would be a great contribution to develop models for the determination of the
binary and ternary Pitzer parameters as a function of the temperature, especially for
solutions containing the Cu2+
, Na+, H
+, SO4
2-, Cl
-, and HSO4
- ions which are the
most found in the copper mining solutions.
Regarding to the sodium chloride effect in copper sulfate pentahydrate crystallization, the
following recommendations are proposed:
- It would interesting to study the sodium chloride effect on the growth rates of other
individual faces of copper sulfate pentahydrate, in addition to the already analyzed
(1-10) and (1-1-1) faces.
174
- It could be worth to expand the supersaturation range used in the growth kinetics
experiments in order to evaluate if there is any additional change in the shape or
growth mechanisms of the crystals.
- Due to the crystallization experiments were performed only at the CuSO4
concentration of 29.52 wt %, it would be interesting to expand this range to
determine the metastable zone width at various concentrations, which could be
complemented by increasing the cooling rates range. This latter would also allow to
observe if there are any further changes in the copper sulfate crystals shape.
- Due to the sodium chloride effect on the shape, size, composition, and growth
kinetics of copper sulfate pentahydrate crystals is already known; it would be an
interesting contribution to use artificial seawater on these experiments in order to
determine the effect of the other ions; additionally, could be interesting to evaluate
the sulfuric acid effect on the growth kinetics. These experiments could lead to
additional changes in the crystals shape and size, and in the growth rates and
mechanisms of the individual faces of copper sulfate pentahydrate.
175
APPENDICES SECTION
THE EFFECT OF SEAWATER ON THE THERMODYNAMICS AND
CRYSTALLIZATION OF COPPER SULFATE PENTAHYDRATE
Abstract
Additional and more detailed materials are provided as a supplement to the thesis with the
above title. It includes:
1. Sequence of images of copper sulfate pentahydrate crystals growing in H2O and 2.4
wt % NaCl media at different supersaturations.
2. Fits of the Power law, B&S and BCF growth models for both the (1-10) and (1-1-1)
faces for copper sulfate pentahydrate grown in H2O and NaCl media.
3. Works presented at several national and international conferences during the
doctoral period.
4. Published works from the present Doctoral thesis.
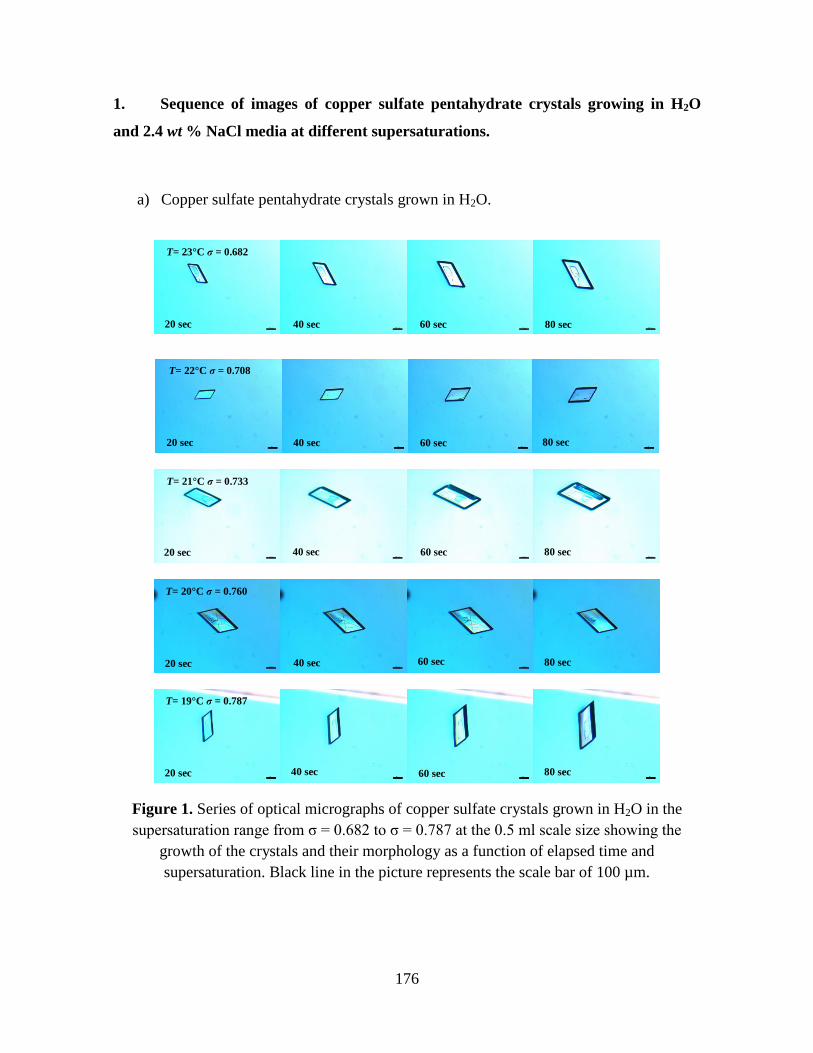
176
1. Sequence of images of copper sulfate pentahydrate crystals growing in H2O
and 2.4 wt % NaCl media at different supersaturations.
a) Copper sulfate pentahydrate crystals grown in H2O.
Figure 1. Series of optical micrographs of copper sulfate crystals grown in H2O in the
supersaturation range from σ = 0.682 to σ = 0.787 at the 0.5 ml scale size showing the
growth of the crystals and their morphology as a function of elapsed time and
supersaturation. Black line in the picture represents the scale bar of 100 µm.
20 sec
20 sec
20 sec
20 sec
20 sec
40 sec 60 sec 80 sec
40 sec 60 sec 80 sec
80 sec
40 sec
60 sec
60 sec
60 sec 40 sec
80 sec
80 sec 40 sec
T= 23°C σ = 0.682
T= 22°C σ = 0.708
T= 20°C σ = 0.760
T= 21°C σ = 0.733
T= 19°C σ = 0.787
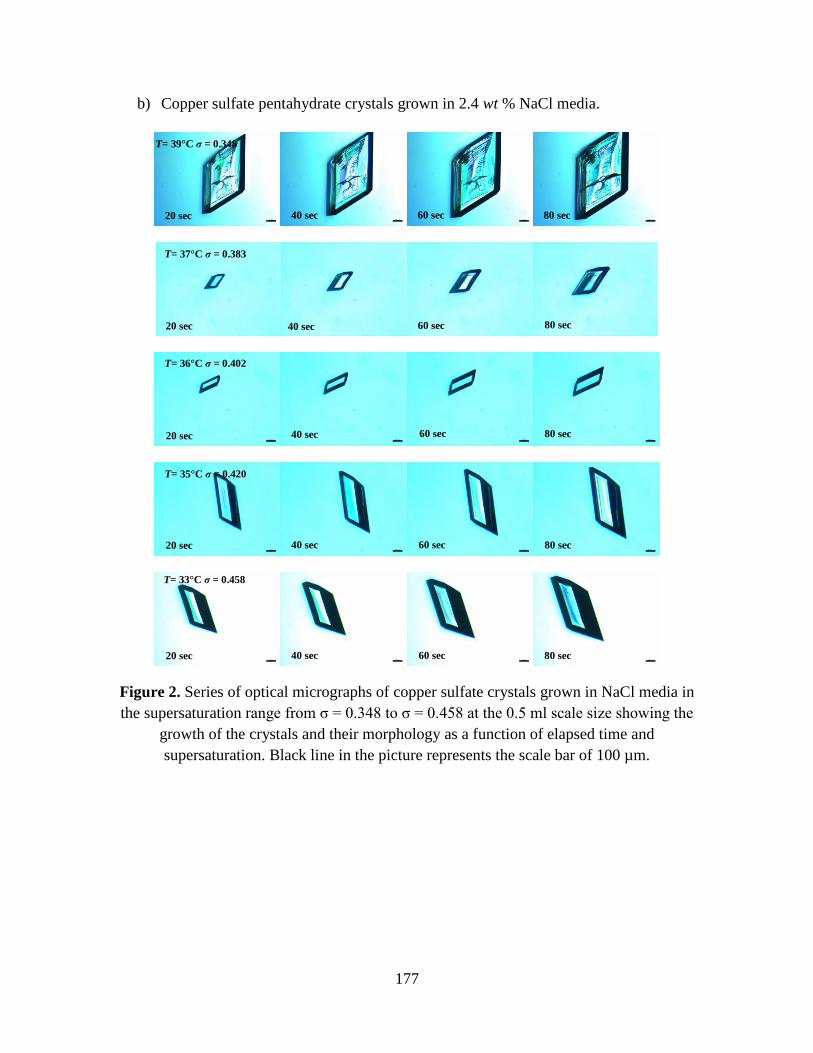
177
b) Copper sulfate pentahydrate crystals grown in 2.4 wt % NaCl media.
Figure 2. Series of optical micrographs of copper sulfate crystals grown in NaCl media in
the supersaturation range from σ = 0.348 to σ = 0.458 at the 0.5 ml scale size showing the
growth of the crystals and their morphology as a function of elapsed time and
supersaturation. Black line in the picture represents the scale bar of 100 µm.
20 sec
20 sec
20 sec
20 sec
40 sec 60 sec 80 sec 20 sec
40 sec
40 sec
40 sec
40 sec
60 sec
60 sec
60 sec
60 sec
80 sec
80 sec
80 sec
80 sec
T= 39°C σ = 0.348
T= 37°C σ = 0.383
T= 36°C σ = 0.402
T= 35°C σ = 0.420
T= 33°C σ = 0.458
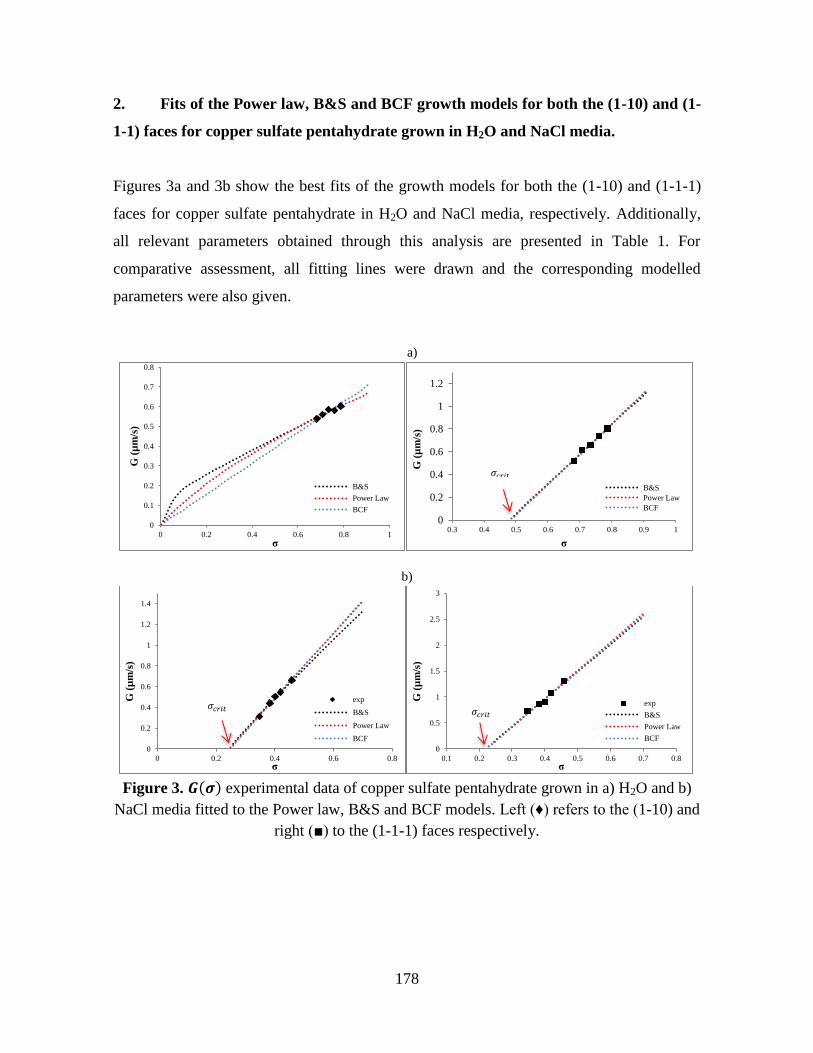
178
2. Fits of the Power law, B&S and BCF growth models for both the (1-10) and (1-
1-1) faces for copper sulfate pentahydrate grown in H2O and NaCl media.
Figures 3a and 3b show the best fits of the growth models for both the (1-10) and (1-1-1)
faces for copper sulfate pentahydrate in H2O and NaCl media, respectively. Additionally,
all relevant parameters obtained through this analysis are presented in Table 1. For
comparative assessment, all fitting lines were drawn and the corresponding modelled
parameters were also given.
a)
b)
Figure 3. 𝑮(𝝈) experimental data of copper sulfate pentahydrate grown in a) H2O and b)
NaCl media fitted to the Power law, B&S and BCF models. Left (♦) refers to the (1-10) and
right (■) to the (1-1-1) faces respectively.
0
0.1
0.2
0.3
0.4
0.5
0.6
0.7
0.8
0 0.2 0.4 0.6 0.8 1
G (
µm
/s)
σ
B&S
Power Law
BCF
0
0.2
0.4
0.6
0.8
1
1.2
0.3 0.4 0.5 0.6 0.7 0.8 0.9 1
G (
µm
/s)
σ
B&S
Power Law
BCF
0
0.2
0.4
0.6
0.8
1
1.2
1.4
0 0.2 0.4 0.6 0.8
G (
µm
/s)
σ
exp
B&S
Power Law
BCF
0
0.5
1
1.5
2
2.5
3
0.1 0.2 0.3 0.4 0.5 0.6 0.7 0.8
G (
µm
/s)
σ
exp
B&S
Power Law
BCF
𝜎𝑐𝑟𝑖𝑡
𝜎𝑐𝑟𝑖𝑡
𝜎𝑐𝑟𝑖𝑡
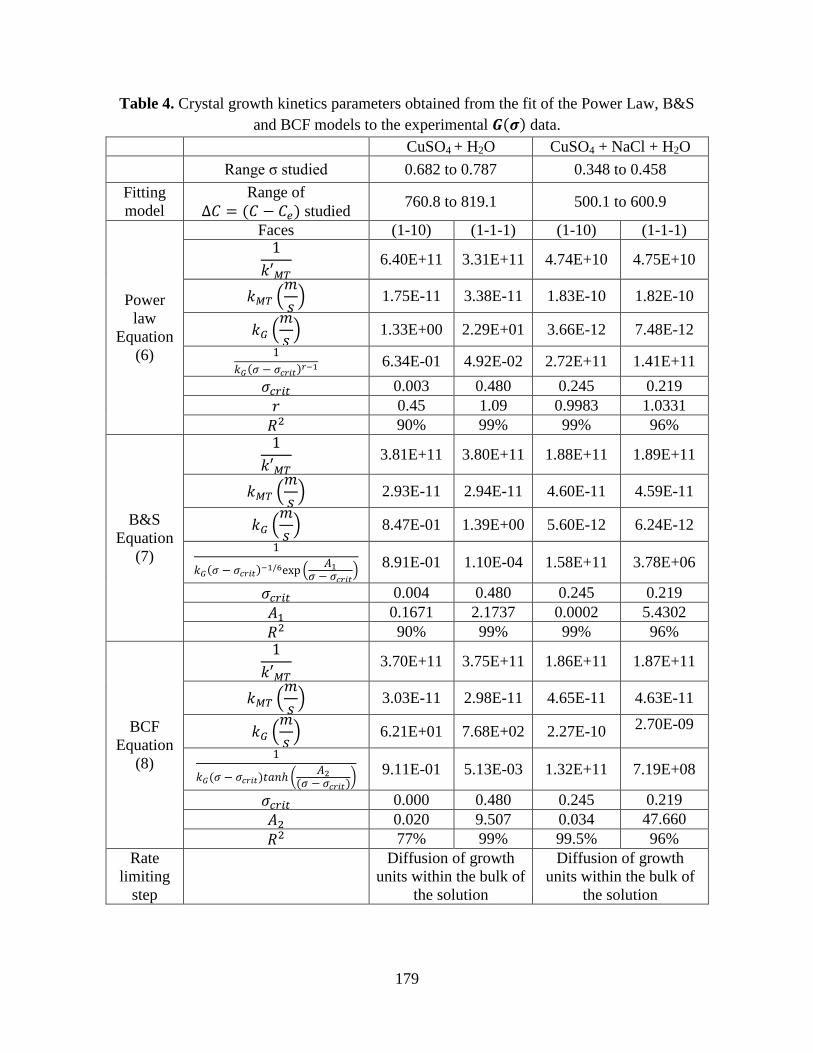
179
Table 4. Crystal growth kinetics parameters obtained from the fit of the Power Law, B&S
and BCF models to the experimental 𝑮(𝝈) data.
CuSO4 + H2O CuSO4 + NaCl + H2O
Range σ studied 0.682 to 0.787 0.348 to 0.458
Fitting
model
Range of
∆𝐶 = (𝐶 − 𝐶𝑒) studied 760.8 to 819.1 500.1 to 600.9
Power
law
Equation
(6)
Faces (1-10) (1-1-1) (1-10) (1-1-1) 1
𝑘′𝑀𝑇 6.40E+11 3.31E+11 4.74E+10 4.75E+10
𝑘𝑀𝑇 (𝑚
𝑠) 1.75E-11 3.38E-11 1.83E-10 1.82E-10
𝑘𝐺 (𝑚
𝑠) 1.33E+00 2.29E+01 3.66E-12 7.48E-12
1
𝑘𝐺(𝜎 − 𝜎𝑐𝑟𝑖𝑡)𝑟−1 6.34E-01 4.92E-02 2.72E+11 1.41E+11
𝜎𝑐𝑟𝑖𝑡 0.003 0.480 0.245 0.219
𝑟 0.45 1.09 0.9983 1.0331
𝑅2 90% 99% 99% 96%
B&S
Equation
(7)
1
𝑘′𝑀𝑇 3.81E+11 3.80E+11 1.88E+11 1.89E+11
𝑘𝑀𝑇 (𝑚
𝑠) 2.93E-11 2.94E-11 4.60E-11 4.59E-11
𝑘𝐺 (𝑚
𝑠) 8.47E-01 1.39E+00 5.60E-12 6.24E-12
1
𝑘𝐺(𝜎 − 𝜎𝑐𝑟𝑖𝑡)−1/6exp (𝐴1
𝜎 − 𝜎𝑐𝑟𝑖𝑡) 8.91E-01 1.10E-04 1.58E+11 3.78E+06
𝜎𝑐𝑟𝑖𝑡 0.004 0.480 0.245 0.219
𝐴1 0.1671 2.1737 0.0002 5.4302
𝑅2 90% 99% 99% 96%
BCF
Equation
(8)
1
𝑘′𝑀𝑇 3.70E+11 3.75E+11 1.86E+11 1.87E+11
𝑘𝑀𝑇 (𝑚
𝑠) 3.03E-11 2.98E-11 4.65E-11 4.63E-11
𝑘𝐺 (𝑚
𝑠) 6.21E+01 7.68E+02 2.27E-10
2.70E-09
1
𝑘𝐺(𝜎 − 𝜎𝑐𝑟𝑖𝑡)𝑡𝑎𝑛ℎ (𝐴2
(𝜎 − 𝜎𝑐𝑟𝑖𝑡))
9.11E-01 5.13E-03 1.32E+11 7.19E+08
𝜎𝑐𝑟𝑖𝑡 0.000 0.480 0.245 0.219
𝐴2 0.020 9.507 0.034 47.660
𝑅2 77% 99% 99.5% 96%
Rate
limiting
step
Diffusion of growth
units within the bulk of
the solution
Diffusion of growth
units within the bulk of
the solution
180
3. Summary of the different works presented at the national and international
conferences
SOLUBILITIES AND PHYSICAL PROPERTIES OF SATURATED SOLUTIONS
IN THE COPPER SULFATE + SULFURIC ACID + SEAWATER SYSTEM AT
DIFFERENT TEMPERATURES
Francisca Justel, Martha Claros, María E. Taboada
Department of Chemical Engineering, University of Antofagasta, Angamos 601,
Antofagasta, Chile
In Chile, the most important economic activity is mining, which is concentrated in the north
side of the country. The region is a desert with limited freshwater resources; therefore, the
mining sector requires research and the identification of alternative sources of water. One
alternative is Seawater, which can be substitute for the limited freshwater resources in the
region. This work determines the influence of Seawater on the solid−liquid equilibrium for
acid solutions of CuSO4 at different temperatures (298.15 to 318.15 K), and its effect on
physical properties (density, viscosity, and Solubility). Knowledge of properties and
Solubility data are useful in the design of Copper sulfate pentahydrate crystallization plants
from leaching process using Seawater by means of the addition of sulfuric acid.
Keywords: Seawater, Copper sulfate, Solubility.
181
CRYSTALLIZATION OF COPPER SULFATE FROM AQUEOUS SOLUTION
CONTAINING SEAWATER AND SULFURIC ACID
Francisca Justel, Teófilo Graber and María E. Taboada*
Chemical Engineering Department, Universidad de Antofagasta, Antofagasta,
Chile, [email protected]
ABSTRACT
In Chile, the most important economic activity is mining which is concentrated in the
northern region of the country across the Atacama Desert that is known as the driest place
in the world with limited freshwater resources. Therefore, the mining industry requires
research and identification of alternative water sources. One alternative is the use of
seawater, which can be a substitute for the limited freshwater resources. Currently, certain
mining companies are using raw seawater in their processes (Mineras Michilla, Esperanza
in copper/gold projects; and Las Luces in their beneficiation plant).
In copper hydrometallurgy, seawater is mainly used and studied in the leaching process;
however, there is no mining company that performs copper sulfate crystallization process
using seawater. Consequently, the study of copper sulfate pentahydrate crystallization with
seawater is of great importance, since this compound is the most important at industrial
level, due to the wide range of commercial applications such as agriculture as a pesticide,
germicide, and soil additive; in medicine it is used as a fungicide, and bactericide; and in
mining as a floatation reagent in recovery of zinc and lead. However, for carrying out this
process on an industrial scale, it is necessary to know the seawater effect in the
crystallization kinetics and in the morphology and size of the copper sulfate crystals.
In the present work the effect of seawater on the solid-liquid equilibrium of copper sulfate
in acidic solutions at different temperatures (from 293.15 to 333.15 K) is presented. In
182
addition physical properties, conductivity, density, and viscosity of the saturated solution
are measured and correlated with empirical equations finding a good agreement.
Knowledge of properties and solubility data are useful in the leaching process and in the
process design to obtain copper sulfate pentahydrate crystals from leaching solutions with
seawater by means of sulfuric acid addition.
Keywords: Copper sulfate, Sulfuric acid, Seawater, Crystallization.
183
SOLUBILIDADES Y PROPIEDADES FÍSICAS DEL SISTEMA CuSO4 - H2SO4 -
AGUA DE MAR
Francisca J. Justel, María E. Taboada*
Departamento de Ingeniería Química y Procesos de Minerales, Universidad de
Antofagasta, Avenida Angamos 601,1270300, Antofagasta, Chile
Resumen
La minería, es la actividad económica más importante de Chile, y se encuentra concentrada
en la zona norte del país. Ésta es una región desértica con limitadas fuentes de agua, por lo
que el sector minero requiere de la investigación e identificación de fuentes alternativas de
agua. Una alternativa es el agua de mar, la cual puede ser un substituto de las limitadas
fuentes de agua fresca en la región. Este trabajo determina la influencia del agua de mar
acidificada en el equilibrio sólido-líquido de soluciones saturadas de sulfato de cobre a
diferentes temperaturas (293.15 a 318.15 K), y su efecto en las propiedades físicas
(densidad y viscosidad) y solubilidad. Este conocimiento, es útil en el diseño de plantas de
cristalización de sulfato de cobre pentahidratado desde el proceso de lixiviación con
soluciones de ácido sulfúrico, en el que se sustituya el agua fresca por agua de mar, con el
fin de dar sustentabilidad a la actividad minera.
Palabras clave: Sulfato de cobre pentahidratado, Agua de mar, Equilibrio sólido-líquido,
Cristalización.
184
Universidad de Concepción | 15, 16, 17 de octubre de 2014
http://www.cchiq2014.cl/
EQUILIBRIO SÓLIDO-LÍQUIDO DEL SISTEMA CuSO4 – H2SO4 – AGUA DE
MAR A DIFERENTES TEMPERATURAS
Francisca J. Justel, Yecid P. Jiménez, Martha Claros, María E. Taboada*
Departamento de Ingeniería Química y Procesos de Minerales. Universidad de
Antofagasta.
Resumen
La minería es la actividad económica más importante de Chile, en donde la mayor parte de
los yacimientos están emplazados en la zona norte del país, zona que enfrenta una limitada
disponibilidad del recurso hídrico, por lo que el agua se ha convertido en un insumo crítico
y de alto costo. Esta situación ha motivado al sector minero al uso de nuevas fuentes de
agua, como lo es el agua de mar. Además, existen algunas empresas que para dar un valor
agregado a sus productos, cristalizan sulfato de cobre pentahidratado. El estudio de la
cristalización de sulfato de cobre con agua de mar sería de gran importancia, debido a que
este compuesto es muy importante a nivel industrial por la gran cantidad de aplicaciones
que posee: ya sea en agricultura, medicina, minería, industria textil, etc.
El objetivo del presente trabajo es representar el efecto del agua de mar en el equilibrio
sólido-líquido del sulfato de cobre pentahidratado en soluciones ácidas a diferentes
temperaturas (desde 293.15 a 333.15 K), y subsecuentemente utilizar esta información para
predecir la concentración de H2SO4 que proporcione un máximo rendimiento del proceso,
además se incluye el cálculo de las cantidades precipitadas de la sal desde el sistema
CuSO4-H2SO4-Agua de mar a seis diferentes temperaturas. Los datos de solubilidad del
sistema estudiado, fueron obtenidos experimentalmente mediante análisis del ion cobre por
absorción atómica. El modelo de Pitzer y una modificación del modelo de Born fueron
utilizados para correlacionar los datos de solubilidad, posteriormente esta información fue
185
utilizada para predecir los valores antes mencionados. Este conocimiento sobre los datos de
solubilidad y la correlación de los mismos son útiles en el diseño de procesos para obtener
cristales de sulfato de cobre pentahidratado desde soluciones de lixiviación con agua de
mar por medio de la adición de ácido sulfúrico.
Palabras clave: Agua de mar, Sulfato de cobre pentahidratado, Solubilidad.
186
SOLID - LIQUID EQUILIBRIUM OF CuSO4 – H2SO4 – SEAWATER SYSTEM
Francisca J. Justel , Yecid P. Jiménez and María Elisa Taboada*
Department of Chemical and Mineral Process Engineering, University of Antofagasta,
Chile
Introduction
Mining, is the most important economic activity in Chile, where there is a worldwide
shortage of available freshwater. Mining industries are developing new methods to
optimize water use, where certain mining companies are using raw seawater in their
production processes. The study of the copper sulfate crystallization using seawater would
be of great importance due to the large number of industrial applications of this salt. In this
research, we are focused in the CuSO4 - H2SO4 - seawater system, with the objective of
representing the physical properties (density and viscosity), and the solid-liquid equilibrium
of this system in a wide temperature range (from 293.15 to 333.15 K), and subsequently
use this information to estimate the composition of sulfuric acid to provide the highest yield
of the process.
Keywords: Seawater, Copper sulfate, Solid-liquid equilibrium, Crystallization.
187
PROCESS DESIGN TO OBTAIN COPPER SULFATE CRYSTALS USING SOLID–
LIQUID EQUILIBRIUM OF COPPER SULFATE – SULFURIC ACID –
SEAWATER
María E. Taboada*, Francisca J. Justel, Yecid P. Jiménez, Teófilo A. Graber
Departamento de Ingeniería Química y de Procesos de Minerales. Universidad de
Antofagasta. Av. Angamos 601. Antofagasta. Chile
Abstract
In Chile, the most important economic activity is mining, which is concentrated in the north
side of the country. This region is a desert with limited freshwater resources; therefore, the
mining sector requires research and the identification of alternative sources of water. One
alternative is seawater, which can be an alternative to the limited freshwater resources in
the region.
In this work, using solid-liquid phase equilibrium, has been designed a copper sulfate
crystallization process, from a copper leaching solution, followed by a re-crystallization
stage which allows to obtain high purity crystals. The sulfuric acid acts as a co-solvent,
because as the acid concentration increases the copper sulfate solubility decreases. Thus,
this process could be considered as a drowning-out crystallization process.
The conceptual process includes the following four stages: mixer, crystallizer, centrifuge
and dryer.
Keywords: Seawater, Copper sulfate, Crystallization.
188
SODIUM CHLORIDE EFFECT IN COPPER SULFATE PENTAHYDRATE
CRYSTALLIZATION
F. Justel1, D.M. Camacho
2, and K. J. Roberts
2
1Department of Chemical Engineering and Mineral Processing,
University of Antofagasta,
Antofagasta, Chile
2School of Chemical and Process Engineering, University of Leeds, Leeds, United Kingdom
Abstract
Copper mining is the most significant economic activity on the north side of Chile,
however, due to the arid conditions in this zone (located in the Atacama Desert) along with
water scarcity, mining industries have required innovative solutions for the optimization of
water consumption and have started to use seawater in their productive processes. Copper
sulfate (blue vitriol) is the most important industrial compound of copper, with a wide
variety of commercial uses as: soil additives, fungicides, and bulk preparation of other
copper compounds. In Chile, there are some small mining companies that crystallize copper
sulfate from hydrometallurgical processes using freshwater, thus in order to be able to
minimize the use of freshwater in the crystallization process, the effect of the seawater in
the copper sulfate pentahydrate crystals needs to be assessed.
To understand the effect of the principal ions present in seawater (Na+
and Cl-), the
objective of the present work is to study the sodium chloride effect in the crystal shape,
composition, and growth rate of copper sulfate pentahydrate crystals, and compare with
results in freshwater. This knowledge will allow us to obtain valuable information that
could be useful in the design of the copper sulfate crystallization process using seawater.
Keywords: Copper sulfate, Growth kinetics.
189
5. Published works from the present doctoral thesis
190


![L 18 Thermodynamics [3] Review Review Heat transfer processes Heat transfer processes –convection –conduction –radiation Greenhouse effect Greenhouse effect](https://img.pdfslide.net/doc/110x75/56649f0c5503460f94c1fbfb/l-18-thermodynamics-3-review-review-heat-transfer-processes-heat-transfer.jpg)