Embed Size (px)
Citation preview
Pertanika J. Soc. Sci. & Hum. 26 (T): 33 - 48 (2018)
ISSN: 0128-7702 © Universiti Putra Malaysia Press
SOCIAL SCIENCES & HUMANITIESJournal homepage: http://www.pertanika.upm.edu.my/
E-mail addresses: [email protected] (Aryo Bismo)[email protected] (Haryadi Sarjono)[email protected] (Andika Ferian) * Corresponding author
Article history:Received: 06 October 2017Accepted: 28 March 2018
ARTICLE INFO
The Effect of Service Quality and Customer Satisfaction on Customer Loyalty: A Study of Grabcar Services in Jakarta
Aryo Bismo*, Haryadi Sarjono and Andika FerianManagement Department, BINUS Business School, Undergraduate Program, Bina Nusantara University,Jl. K. H. Syahdan No. 9 Kemanggisan / Palmerah, Jakarta, Indonesia 11480
ABSTRACT
In recent years online-based transport modes have become popular in Jakarta. These ride hailing applications (apps) provide many benefits. The purpose of this research is to determine the effect of their quality of service on customer satisfaction and their impact on customer loyalty. Correlations analysis and SPSS are used to analyse data obtained from questionnaires distributed to 100 GrabCar users in Jakarta. A simple random sampling technique was employed to recruit the respondents. The results of this research showed that service quality has a positive and significant impact on customer satisfaction and has a positive but not significant impact on customer loyalty. This study can be used to help online based transportation apps develop a better strategy to improve the quality of their service by boosting customer satisfaction which in turn will increase customer loyalty.
Keywords: Customer satisfaction, customer loyalty, grabcar, ride hailing apps, service quality
INTRODUCTION
In Jakarta, road transportation consists of motorcycles, buses, cars and localised forms of transport, such as angkots (public
mini-buses) and bajaj (public three-wheeled covered motorcycles). The Department of Transport, Jakarta report in 2015 showed the number of cars and motorcycles are increasing steadily at 8.09% and 9.14% respectively. The number of motorcycles and cars in Jakarta was 13.9 million and 3.4 million respectively in 2015. In general, the motor vehicle industry as a whole grows at 8.75% annually.
The increase in the number of motorcycles and cars are due to Jakarta’s
Aryo Bismo, Haryadi Sarjono and Andika Ferian
34 Pertanika J. Soc. Sci. & Hum. 26 (T): 33 - 48 (2018)
population density and the lack of decent public transportation. Buses, bajaj, and taxis lack comfort, and service quality, and therefore people in Jakarta prefer private vehicles. According to Department of Transport, Jakarta, there were 27,079 taxis in Jakarta in 2014 but it decreased in 2015 to 24,368. Meanwhile, the number of four-wheel vehicles in Jakarta is steadily increasing.
Traditional public transport has been affected by the development of ride hailing apps (using smartphone application) technology. People no longer need to wait on the side of the road to hail a taxi; instead they can book a taxi using their smartphone. These enabled ride hailing apps to emerge and quickly became a solution to residents of Jakarta. Heru Sutadi, Executive Director of Indonesia ICT Institute, stated that ride hailing services are appealing because of the ease with which you can book your transport. Additionally, compared with conventional transport system, these ride hailing services would fetch you at your desired location without you having to wait at public location. The growing demand for these ride hailing services have led to their growing popularity. In Jakarta, Uber, Grab, and Go-Jek are the most active offering two-wheel vehicles (motorcycles, known locally as ojek) and four-wheel vehicles which consist of multi-purpose vehicles (MPVs), family cars, or sedans.
The Malaysian company, Grab, entered the Indonesian market in August 2015, offering a cash payment method (as opposed to credit card only), and was welcomed in
Jakarta. According to Kiki Rizki, Grab’s Country Head of Marketing, Grab’s three main business pillars are safety, comfort, and speed which is unique to the company. Grab provides insurance for their passengers, a review of their drivers’ attitude, assuring cleanliness, and a flat rate to increase service quality. It also provides varied services, from transportation using motorcycles or cars, to services such as delivering documents or food. . This study focused on how service quality affects customer satisfaction and its impact on customer loyalty of GrabCar users.
As expected, Grab is not the only player and one of its competitors is Go-Jek which is a local company established in 2010 that provides almost the same services in Jakarta, Bogor, Depok, Tangerang, Bekasi, Bandung, Surabaya, Bali, and Makassar. Their passenger cars are known as Go-Car. Another direct competitor of Grabcar is Uber, originally from United States, which currently provides ride hailing services in Jakarta, Bandung, and Bali using motorcycles and cars.
LITERATURE REVIEW
Service Quality
Tjiptono (2007) defined service quality as the level of excellence expected and whether it satisfies customer needs. Specifically, service quality is determined by the company’s ability to fulfil the needs and wants of the customer based on their expectations. Lewis and Booms (in Tjiptono, 2012) defined service quality as meeting customer expectations. Parasuraman,
Service Quality and Satisfaction of Ride Hailing App
35Pertanika J. Soc. Sci. & Hum. 26 (T): 33 - 48 (2018)
Zeithamal and Berry in Ivanauskiene and Volungenaite (2014) defined service quality as the difference between customers’ expectations and perceptions of the service. Tjiptono and Chandra (2011) stated that it was the customer, not the service provider, which evaluates service quality.
Parasuraman, Zeithamal and Berry (in Tjiptono, 2011) proposed variables to measure service quality:
Reliability, related to the company’s ability to deliver the services precisely as promised.
Responsiveness , re lated to the company’s willingness and ability in helping their customer on channelling the money given properly.
Assurance, related to the workers’ knowledge and politeness and their ability in building trust and the givers’ confidence
Empathy, shows how the company understands the givers’ objectives on giving donation, and gives personal affection to the givers.
Tangibles, related to the physical appearance of the service facility, the tools, the workers, and the company’s communication material.
Customer Satisfication
Kotler and Amstrong (2010) defined customer satisfaction as the extent to which a product’s perceived performance matches a buyer’s expectations. Satisfaction is defined as customers’ assessment of a
certain product or services, on whether the products or services could meet their needs and their expectations (Zeithaml, Bitner, & Gremler, 2009). Kotler, in Tjiptono (2011) defined customer satisfaction as a person’s feelings of pleasure or disappointment as a result of comparing the product’s perceived performance and whether it meets his or her expectations.
According to Kotler and Keller (2009) one of the keys to maintain a customer is customer satisfaction. According to Irawan (2008) customer satisfaction is a set of perceptions consumers have regarding the performance of products or services and if the latter meets their expectations. Customers are satisfied when the product or service meets or exceeds their expectations. Irawan (2008) reported the following factors influence customer satisfaction in relation to a product or service:
Service Quality: the quality of a service can be measured through opinions of the customers.
Emotional Factor: this factor is important because customer satisfaction can depend on customer’s level of connectedness with the product or service. Although highly intangible, this factor determines customer’s loyalty.
Ease of acquiring a product or services: if consumers feel it is difficult to communicate with the company to obtain a product or service, this will have a negative impact on the consumer’s satisfaction level.
Aryo Bismo, Haryadi Sarjono and Andika Ferian
36 Pertanika J. Soc. Sci. & Hum. 26 (T): 33 - 48 (2018)
Customer Loyalty
Kotler and Keller (2009) defined loyalty as the customers’ commitment to repurchase a certain product or service in the future even if the circumstances and rival marketing efforts may potentially make the customers turn to another company. According to Tjiptono (2011), loyalty is a behavior of customers that will lead to repeated purchases. It can be driven by price or sense of belonging to the particular brand, perhaps through an inferred exclusivity. Customer loyalty means the commitment of customer to the brand, shop, and suppliers, and is based on a very positive attitude from the customers and reflected in their positive buying behaviour (Hidayat, Zalzalah, & Ekasasi, 2016; Tjiptono, 2007). According to Griffin (2010), the factors that can measure customer loyalty are:
a. Makes regular repeat purchases.
b. Purchases across product and service lines.
c. Refers to others (referral): loyal customers will refer the brand to other people with positive WOM (word of mouth).
d. D e m o n s t r a t e s i m m u n i t y t o competitors (retention): loyal customers will not change their brand preference.
Service Quality, Customer Satisfaction and Customer Loyalty Relationship
According to Moha and Loindong (2016), service quality and facilities have both a
positive and significant relationship with the satisfaction of users. Their findings were supported by Saleh and Kadarisman (2013) who pointed to a positive relation between customer satisfaction and service and product quality. This study will test the effect of these variables in the context of online transport industry. Therefore the first hypothesis is proposed:
H1: Service Quality significantly affects Customer Satisfaction of online transportation users (GrabCar users).
In a study that examined the relationship between service quality and customer satisfaction and loyalty, Cheng and Rashid (2013) found service quality had a positive relationship with customer loyalty. The present study will test the effect of service quality on customer loyalty in the online transport industry which leads to the development of second hypothesis:
H2: Service Quality significantly affects Customer Loyalty of online transport users (GrabCar users).
Prihanto (2013) showed cus tomer satisfaction and customer loyalty have a positive relationship - the higher the level of customer satisfaction, the higher their loyalty.
Based on Hasan (2014), the relationship between customer satisfaction and customer loyalty can be summarised as shown in Table 1.
Service Quality and Satisfaction of Ride Hailing App
37Pertanika J. Soc. Sci. & Hum. 26 (T): 33 - 48 (2018)
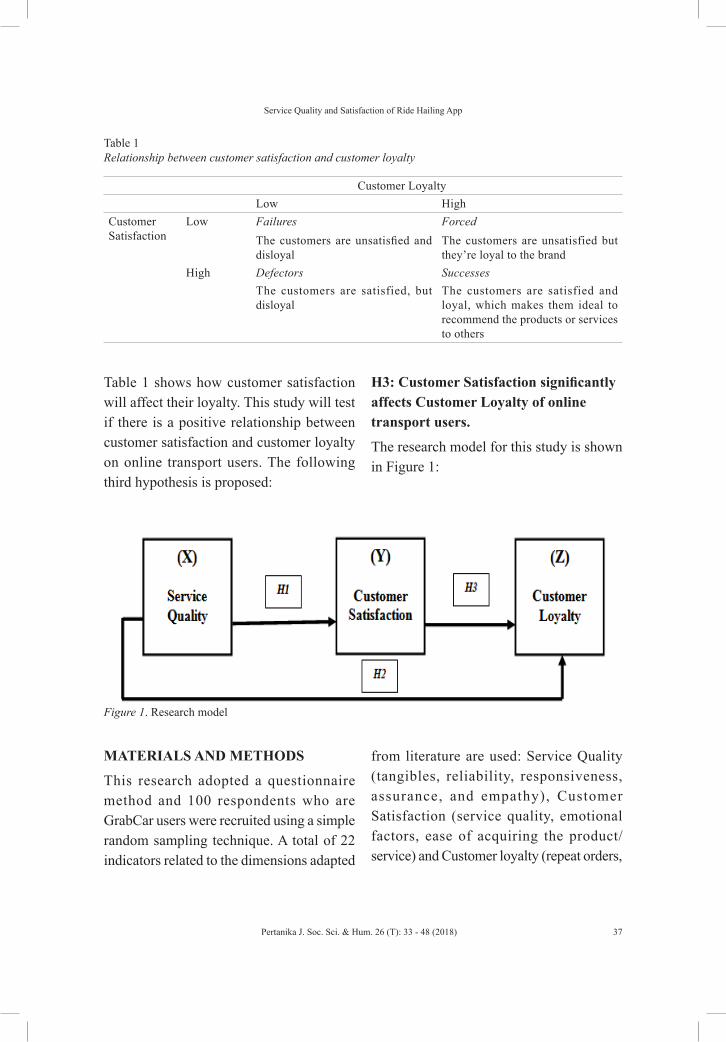
Table 1 shows how customer satisfaction will affect their loyalty. This study will test if there is a positive relationship between customer satisfaction and customer loyalty on online transport users. The following third hypothesis is proposed:
H3: Customer Satisfaction significantly affects Customer Loyalty of online transport users.
The research model for this study is shown in Figure 1:
Table 1 Relationship between customer satisfaction and customer loyalty
Customer LoyaltyLow High
Customer Satisfaction
Low Failures ForcedThe customers are unsatisfied and disloyal
The customers are unsatisfied but they’re loyal to the brand
High Defectors SuccessesThe customers are satisfied, but disloyal
The customers are satisfied and loyal, which makes them ideal to recommend the products or services to others
Figure 1. Research model
The Effect of Service Quality and Customer
10
Table 1 shows how customer satisfaction will affect their loyalty.
This study will test if there is a positive relationship between customer
satisfaction and customer loyalty on online transport users. The following
third hypothesis is proposed:
H3: Customer Satisfaction significantly affects Customer Loyalty of
online transport users.
The research model for this study is shown in Figure 1:
Figure 1. Research model
MATERIALS AND METHODS
This research adopted a questionnaire method and 100 respondents who are
GrabCar users were recruited using a simple random sampling technique. A
total of 22 indicators related to the dimensions adapted from literature are
used: Service Quality (tangibles, reliability, responsiveness, assurance, and
empathy), Customer Satisfaction (service quality, emotional factors, ease of
acquiring the product/service) and Customer loyalty (repeat orders, purchase
across product lines, referral, and retention). An associative method is used
in this study which according to Siregar (2013), shows the relationship
between two or more variables. Tests used on this study for analysing the
data are as follows: validity test, reliability test, normality test, Pearson
MATERIALS AND METHODS
This research adopted a questionnaire method and 100 respondents who are GrabCar users were recruited using a simple random sampling technique. A total of 22 indicators related to the dimensions adapted
from literature are used: Service Quality (tangibles, reliability, responsiveness, assurance, and empathy), Customer Satisfaction (service quality, emotional factors, ease of acquiring the product/service) and Customer loyalty (repeat orders,
Aryo Bismo, Haryadi Sarjono and Andika Ferian
38 Pertanika J. Soc. Sci. & Hum. 26 (T): 33 - 48 (2018)
purchase across product lines, referral, and retention). An associative method is used in this study which according to Siregar (2013), shows the relationship between two or more variables. Tests used on this study for analysing the data are as follows: validity test, reliability test, normality test, Pearson Product-Moment Correlation Test and path analysis for testing the hypotheses; all of the tests were conducted using SPSS software.
RESULTS AND DISCUSSIONS
All the tests for this study were conducted using SPSS and used a total of 100 data points from online transport users (Grab Car users) based on a survey questionnaire method.
Validity Test
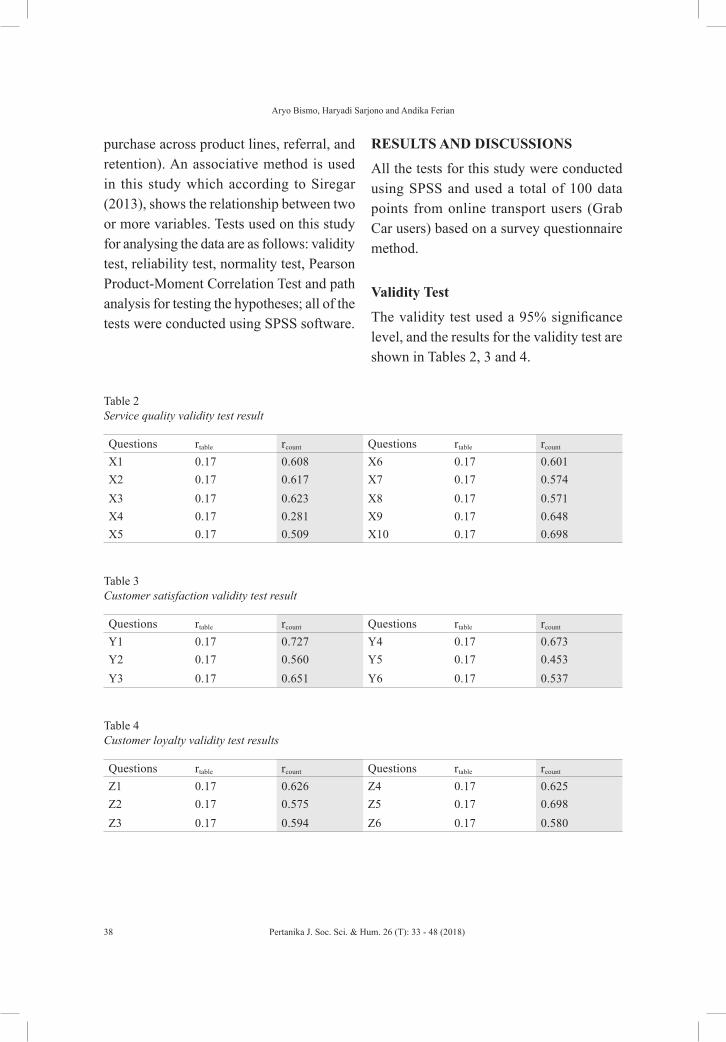
The validity test used a 95% significance level, and the results for the validity test are shown in Tables 2, 3 and 4.
Table 2 Service quality validity test result
Questions rtable rcount Questions rtable rcount
X1 0.17 0.608 X6 0.17 0.601X2 0.17 0.617 X7 0.17 0.574X3 0.17 0.623 X8 0.17 0.571X4 0.17 0.281 X9 0.17 0.648X5 0.17 0.509 X10 0.17 0.698
Table 3 Customer satisfaction validity test result
Questions rtable rcount Questions rtable rcount
Y1 0.17 0.727 Y4 0.17 0.673Y2 0.17 0.560 Y5 0.17 0.453Y3 0.17 0.651 Y6 0.17 0.537
Table 4 Customer loyalty validity test results
Questions rtable rcount Questions rtable rcount
Z1 0.17 0.626 Z4 0.17 0.625Z2 0.17 0.575 Z5 0.17 0.698Z3 0.17 0.594 Z6 0.17 0.580
Service Quality and Satisfaction of Ride Hailing App
39Pertanika J. Soc. Sci. & Hum. 26 (T): 33 - 48 (2018)
The results of the validity tests for each variable shows that all of the instruments used for measuring service quality, customer satisfaction, and customer loyalty are valid. The rcount of each question on each variable show a higher amount compared to the rtable (0.17).
Reliability Test
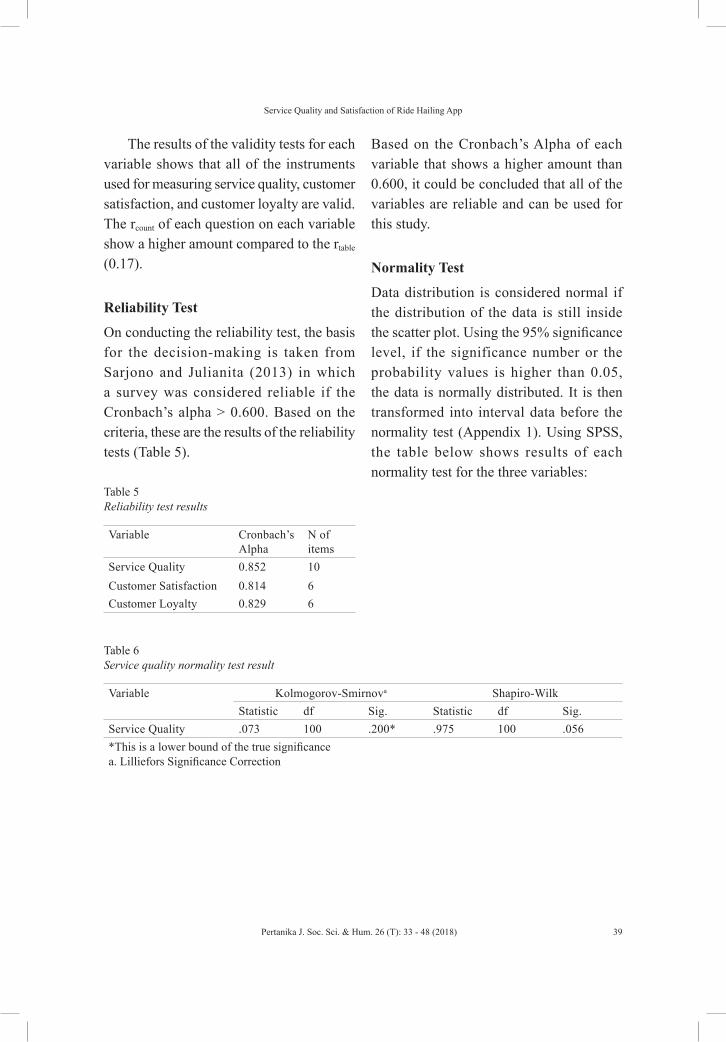
On conducting the reliability test, the basis for the decision-making is taken from Sarjono and Julianita (2013) in which a survey was considered reliable if the Cronbach’s alpha > 0.600. Based on the criteria, these are the results of the reliability tests (Table 5).
Table 5 Reliability test results
Variable Cronbach’s Alpha
N of items
Service Quality 0.852 10Customer Satisfaction 0.814 6Customer Loyalty 0.829 6
Based on the Cronbach’s Alpha of each variable that shows a higher amount than 0.600, it could be concluded that all of the variables are reliable and can be used for this study.
Normality Test
Data distribution is considered normal if the distribution of the data is still inside the scatter plot. Using the 95% significance level, if the significance number or the probability values is higher than 0.05, the data is normally distributed. It is then transformed into interval data before the normality test (Appendix 1). Using SPSS, the table below shows results of each normality test for the three variables:
Table 6 Service quality normality test result
Variable Kolmogorov-Smirnova Shapiro-WilkStatistic df Sig. Statistic df Sig.
Service Quality .073 100 .200* .975 100 .056*This is a lower bound of the true significancea. Lilliefors Significance Correction
Aryo Bismo, Haryadi Sarjono and Andika Ferian
40 Pertanika J. Soc. Sci. & Hum. 26 (T): 33 - 48 (2018)
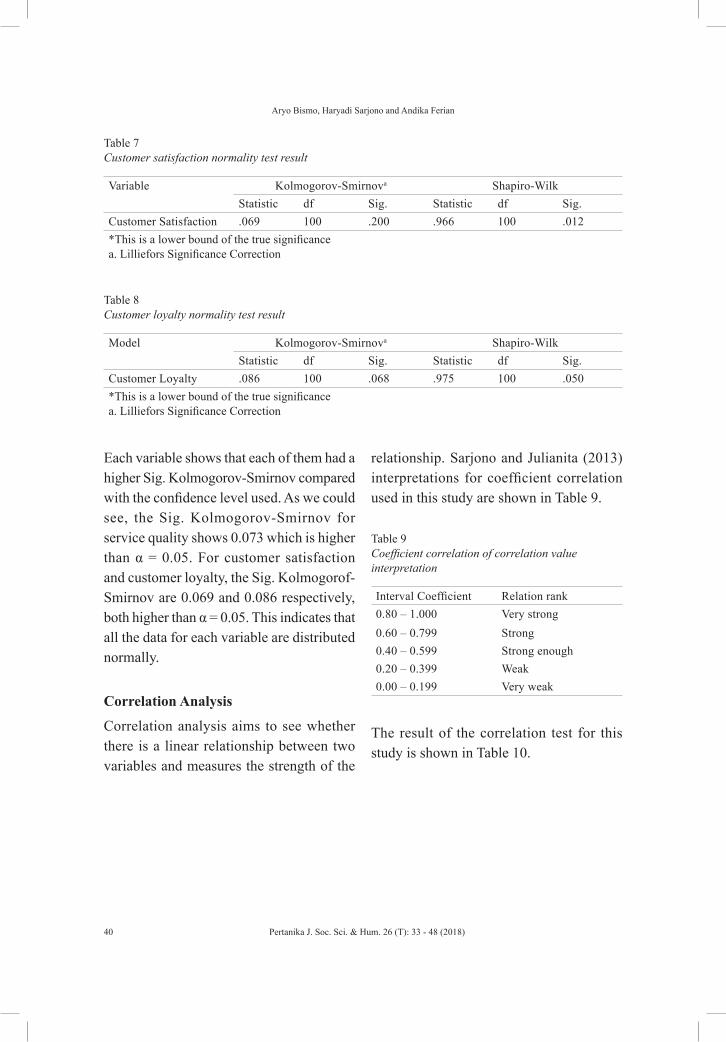
Each variable shows that each of them had a higher Sig. Kolmogorov-Smirnov compared with the confidence level used. As we could see, the Sig. Kolmogorov-Smirnov for service quality shows 0.073 which is higher than α = 0.05. For customer satisfaction and customer loyalty, the Sig. Kolmogorof-Smirnov are 0.069 and 0.086 respectively, both higher than α = 0.05. This indicates that all the data for each variable are distributed normally.
Correlation Analysis
Correlation analysis aims to see whether there is a linear relationship between two variables and measures the strength of the
Table 7 Customer satisfaction normality test result
Variable Kolmogorov-Smirnova Shapiro-WilkStatistic df Sig. Statistic df Sig.
Customer Satisfaction .069 100 .200 .966 100 .012*This is a lower bound of the true significancea. Lilliefors Significance Correction
Table 8 Customer loyalty normality test result
Model Kolmogorov-Smirnova Shapiro-WilkStatistic df Sig. Statistic df Sig.
Customer Loyalty .086 100 .068 .975 100 .050*This is a lower bound of the true significancea. Lilliefors Significance Correction
Table 9 Coefficient correlation of correlation value interpretation
Interval Coefficient Relation rank0.80 – 1.000 Very strong0.60 – 0.799 Strong0.40 – 0.599 Strong enough0.20 – 0.399 Weak0.00 – 0.199 Very weak
relationship. Sarjono and Julianita (2013) interpretations for coefficient correlation used in this study are shown in Table 9.
The result of the correlation test for this study is shown in Table 10.
Service Quality and Satisfaction of Ride Hailing App
41Pertanika J. Soc. Sci. & Hum. 26 (T): 33 - 48 (2018)
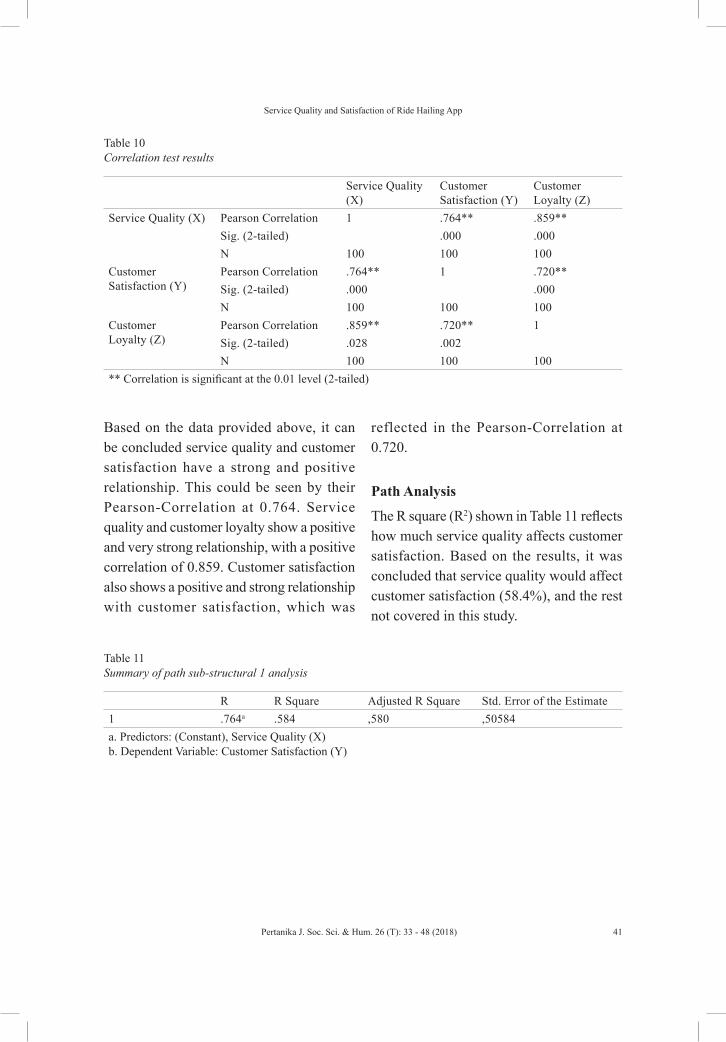
Based on the data provided above, it can be concluded service quality and customer satisfaction have a strong and positive relationship. This could be seen by their Pearson-Correlation at 0.764. Service quality and customer loyalty show a positive and very strong relationship, with a positive correlation of 0.859. Customer satisfaction also shows a positive and strong relationship with customer satisfaction, which was
reflected in the Pearson-Correlation at 0.720.
Path Analysis
The R square (R2) shown in Table 11 reflects how much service quality affects customer satisfaction. Based on the results, it was concluded that service quality would affect customer satisfaction (58.4%), and the rest not covered in this study.
Table 10 Correlation test results
Service Quality (X)
Customer Satisfaction (Y)
Customer Loyalty (Z)
Service Quality (X) Pearson Correlation 1 .764** .859**Sig. (2-tailed) .000 .000N 100 100 100
Customer Satisfaction (Y)
Pearson Correlation .764** 1 .720**Sig. (2-tailed) .000 .000N 100 100 100
Customer Loyalty (Z)
Pearson Correlation .859** .720** 1Sig. (2-tailed) .028 .002N 100 100 100
** Correlation is significant at the 0.01 level (2-tailed)
Table 11 Summary of path sub-structural 1 analysis
R R Square Adjusted R Square Std. Error of the Estimate1 .764a .584 ,580 ,50584a. Predictors: (Constant), Service Quality (X)b. Dependent Variable: Customer Satisfaction (Y)
Aryo Bismo, Haryadi Sarjono and Andika Ferian
42 Pertanika J. Soc. Sci. & Hum. 26 (T): 33 - 48 (2018)
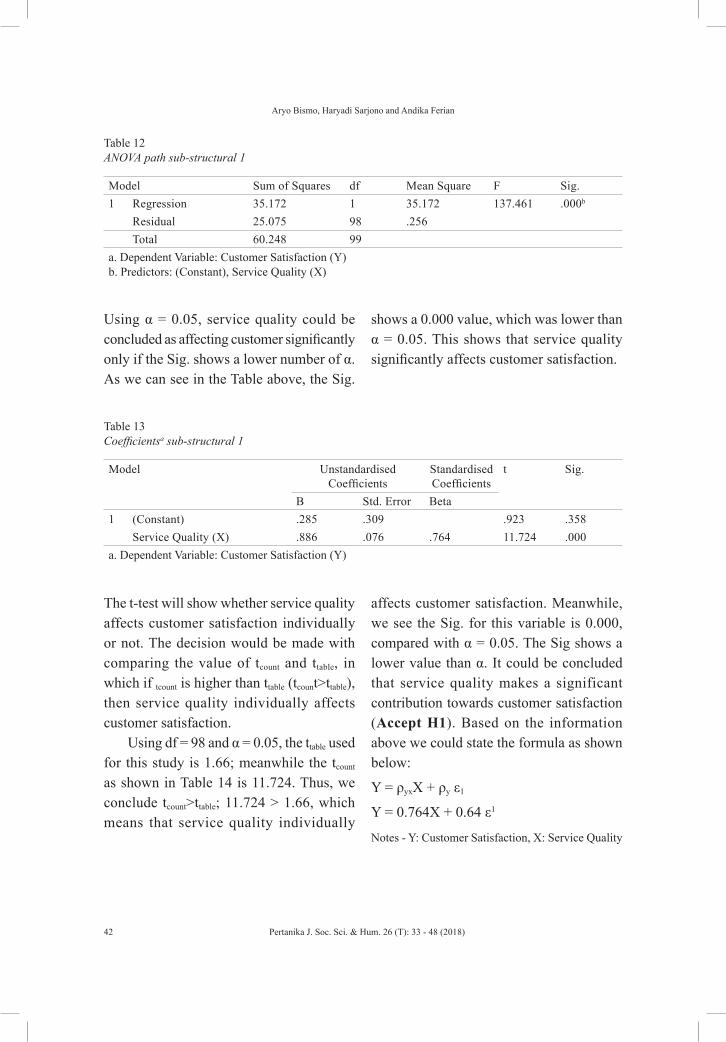
Using α = 0.05, service quality could be concluded as affecting customer significantly only if the Sig. shows a lower number of α. As we can see in the Table above, the Sig.
shows a 0.000 value, which was lower than α = 0.05. This shows that service quality significantly affects customer satisfaction.
Table 12 ANOVA path sub-structural 1
Model Sum of Squares df Mean Square F Sig.1 Regression 35.172 1 35.172 137.461 .000b
Residual 25.075 98 .256Total 60.248 99
a. Dependent Variable: Customer Satisfaction (Y)b. Predictors: (Constant), Service Quality (X)
Table 13 Coefficientsa sub-structural 1
Model Unstandardised Coefficients
Standardised Coefficients
t Sig.
B Std. Error Beta1 (Constant) .285 .309 .923 .358
Service Quality (X) .886 .076 .764 11.724 .000a. Dependent Variable: Customer Satisfaction (Y)
The t-test will show whether service quality affects customer satisfaction individually or not. The decision would be made with comparing the value of tcount and ttable, in which if tcount is higher than ttable (tcount>ttable), then service quality individually affects customer satisfaction.
Using df = 98 and α = 0.05, the ttable used for this study is 1.66; meanwhile the tcount as shown in Table 14 is 11.724. Thus, we conclude tcount>ttable; 11.724 > 1.66, which means that service quality individually
affects customer satisfaction. Meanwhile, we see the Sig. for this variable is 0.000, compared with α = 0.05. The Sig shows a lower value than α. It could be concluded that service quality makes a significant contribution towards customer satisfaction (Accept H1). Based on the information above we could state the formula as shown below:
Y = ρyxX + ρy ε1
Y = 0.764X + 0.64 ε1
Notes - Y: Customer Satisfaction, X: Service Quality

Service Quality and Satisfaction of Ride Hailing App
43Pertanika J. Soc. Sci. & Hum. 26 (T): 33 - 48 (2018)
The R square (R2) shows a number of 0.742 or 74.2%, which reflects the amount of effect service quality and customer satisfaction
have on customer loyalty. This also means that other factors outside the two variables in this study, affects customer loyalty 25.3%.
Figure 2. Sub-structural 1
The Effect of Service Quality and Customer
18
Figure 2. Sub-structural 1
The R square (R2) shows a number of 0.742 or 74.2%, which reflects
the amount of effect service quality and customer satisfaction have on
customer loyalty. This also means that other factors outside the two
variables in this study, affects customer loyalty 25.3%.
Table 14
Summary of path sub-structural 2 analysis
Model R R Square Adjusted R Square Std. Error of the Estimate
1 .865a .747 .742 .44905
a. Predictors: (Constant), Customer Satisfaction (Y), Service Quality (X)
b. Dependent Variable: Customer Loyalty (Z)
Table 15
ANOVA path sub-structural 2 Model Sum of Squares df Mean
Square
F Sig.
1 Regression 57.895 2 28.947 143.557 .000b
Residual 19.559 97 0.202
Total 77.454 99
a. Dependent Variable: Customer Loyalty (Z)
b. Predictors: (Constant), Customer Satisfaction (Y), Service Quality (X)
Table 14 Summary of path sub-structural 2 analysis
Model R R Square Adjusted R Square Std. Error of the Estimate1 .865a .747 .742 .44905a. Predictors: (Constant), Customer Satisfaction (Y), Service Quality (X)b. Dependent Variable: Customer Loyalty (Z)
Table 15 ANOVA path sub-structural 2
Model Sum of Squares df Mean Square F Sig.1 Regression 57.895 2 28.947 143.557 .000b
Residual 19.559 97 0.202 Total 77.454 99
a. Dependent Variable: Customer Loyalty (Z)b. Predictors: (Constant), Customer Satisfaction (Y), Service Quality (X)
The Sig. in the table above shows a value of 0.000. If we compare it to α = 0.05, the Sig shows a lower value than α. This concluded
that both service quality and customer satisfaction have a significant effect on customer satisfaction.
Aryo Bismo, Haryadi Sarjono and Andika Ferian
44 Pertanika J. Soc. Sci. & Hum. 26 (T): 33 - 48 (2018)
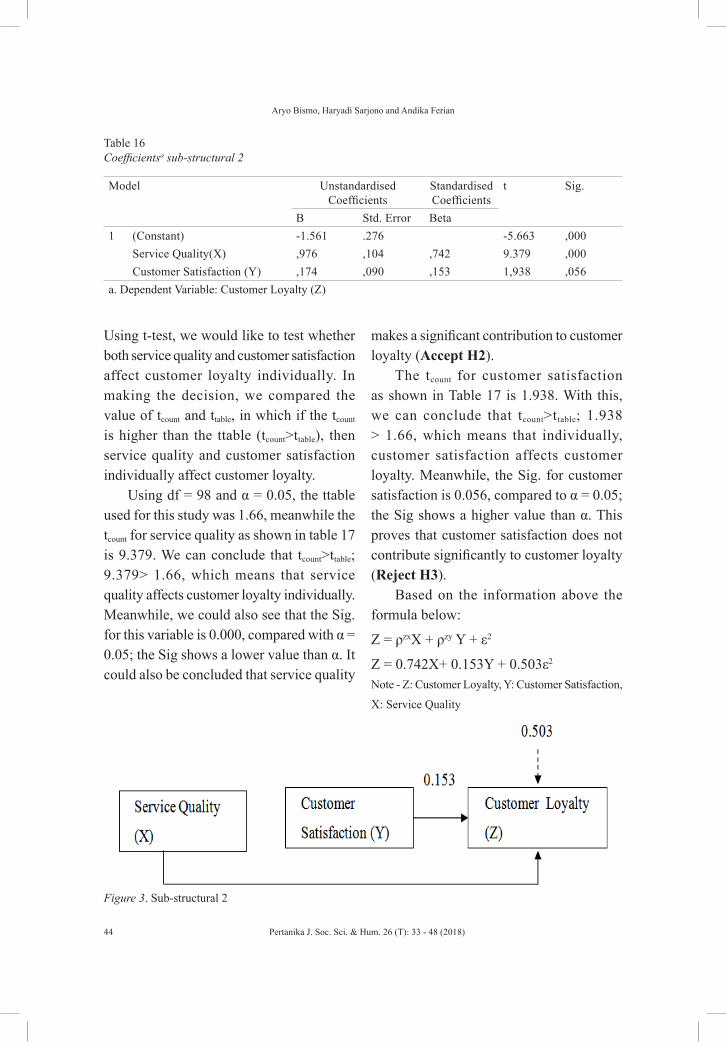
Using t-test, we would like to test whether both service quality and customer satisfaction affect customer loyalty individually. In making the decision, we compared the value of tcount and ttable, in which if the tcount is higher than the ttable (tcount>ttable), then service quality and customer satisfaction individually affect customer loyalty.
Using df = 98 and α = 0.05, the ttable used for this study was 1.66, meanwhile the tcount for service quality as shown in table 17 is 9.379. We can conclude that tcount>ttable; 9.379> 1.66, which means that service quality affects customer loyalty individually. Meanwhile, we could also see that the Sig. for this variable is 0.000, compared with α = 0.05; the Sig shows a lower value than α. It could also be concluded that service quality
Table 16 Coefficientsa sub-structural 2
Model Unstandardised Coefficients
Standardised Coefficients
t Sig.
B Std. Error Beta1 (Constant) -1.561 .276 -5.663 ,000
Service Quality(X) ,976 ,104 ,742 9.379 ,000Customer Satisfaction (Y) ,174 ,090 ,153 1,938 ,056
a. Dependent Variable: Customer Loyalty (Z)
makes a significant contribution to customer loyalty (Accept H2).
The tcount for customer satisfaction as shown in Table 17 is 1.938. With this, we can conclude that tcount>ttable; 1.938 > 1.66, which means that individually, customer satisfaction affects customer loyalty. Meanwhile, the Sig. for customer satisfaction is 0.056, compared to α = 0.05; the Sig shows a higher value than α. This proves that customer satisfaction does not contribute significantly to customer loyalty (Reject H3).
Based on the information above the formula below:
Z = ρzxX + ρzy Y + ε2
Z = 0.742X+ 0.153Y + 0.503ε2
Note - Z: Customer Loyalty, Y: Customer Satisfaction,
X: Service Quality
Figure 3. Sub-structural 2
The Effect of Service Quality and Customer
20
The tcount for customer satisfaction as shown in Table 17 is 1.938.
With this, we can conclude that tcount>ttable; 1.938 > 1.66, which means that
individually, customer satisfaction affects customer loyalty. Meanwhile, the
Sig. for customer satisfaction is 0.056, compared to α = 0.05; the Sig shows
a higher value than α. This proves that customer satisfaction does not
contribute significantly to customer loyalty (Reject H3).
Based on the information above the formula below:
Z = ρzxX + ρzy Y + ε2
Z = 0.742X+ 0.153Y + 0.503ε2
Note - Z: Customer Loyalty, Y: Customer Satisfaction, X: Service Quality
Figure 3. Sub-structural 2
Based on the test results, the path of the three variables are shown in
Table 17 and Figure 3:
Service Quality and Satisfaction of Ride Hailing App
45Pertanika J. Soc. Sci. & Hum. 26 (T): 33 - 48 (2018)
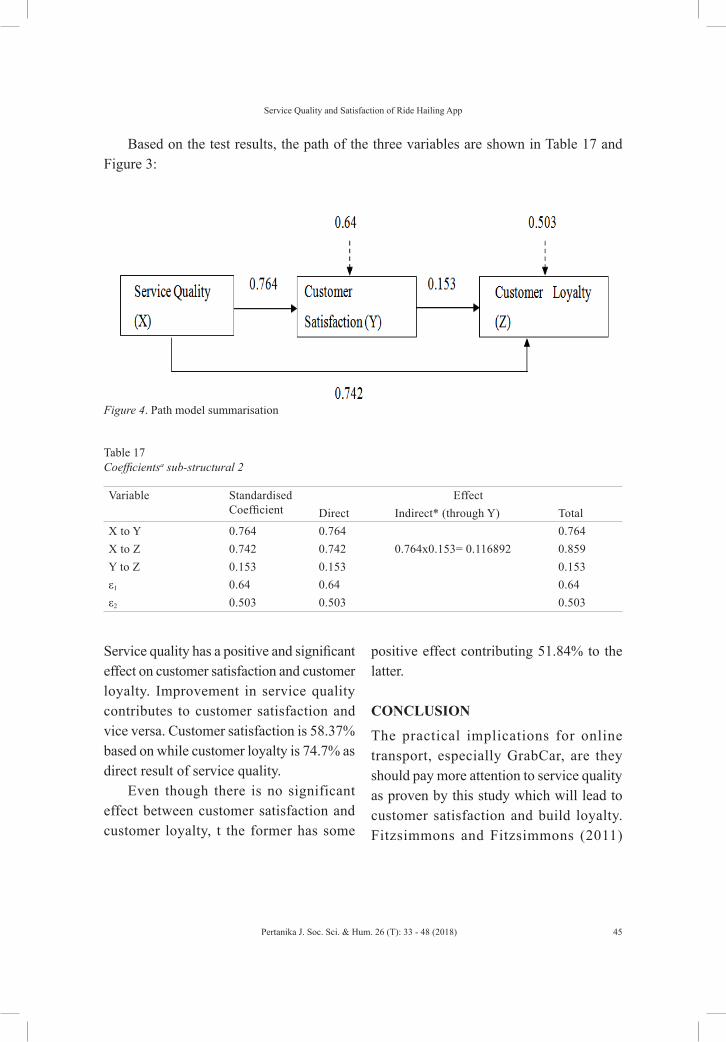
Based on the test results, the path of the three variables are shown in Table 17 and Figure 3:
Figure 4. Path model summarisation
The Effect of Service Quality and Customer
21
Table 17
Path model summarisation Variable Standardised
Coefficient EFFECT
Direct Indirect*
(through Y)
Total
X to Y 0.764 0.764 0.764
X to Z 0.742 0.742 0.764x0.153=
0.116892
0.859
Y to Z 0.153 0.153 0.153
ε1 0.64 0.64 0.64
ε2 0.503 0.503 0.503
Figure 4. Path model summarisation
Service quality has a positive and significant effect on customer
satisfaction and customer loyalty. Improvement in service quality
contributes to customer satisfaction and vice versa. Customer satisfaction is
58.37% based on while customer loyalty is 74.7% as direct result of service
quality.
Even though there is no significant effect between customer
satisfaction and customer loyalty, t the former has some positive effect
contributing 51.84% to the latter.
Table 17 Coefficientsa sub-structural 2
Variable Standardised Coefficient
EffectDirect Indirect* (through Y) Total
X to Y 0.764 0.764 0.764X to Z 0.742 0.742 0.764x0.153= 0.116892 0.859Y to Z 0.153 0.153 0.153ε1 0.64 0.64 0.64ε2 0.503 0.503 0.503
Service quality has a positive and significant effect on customer satisfaction and customer loyalty. Improvement in service quality contributes to customer satisfaction and vice versa. Customer satisfaction is 58.37% based on while customer loyalty is 74.7% as direct result of service quality.
Even though there is no significant effect between customer satisfaction and customer loyalty, t the former has some
positive effect contributing 51.84% to the latter.
CONCLUSION
The practical implications for online transport, especially GrabCar, are they should pay more attention to service quality as proven by this study which will lead to customer satisfaction and build loyalty. Fitzsimmons and Fitzsimmons (2011)
Aryo Bismo, Haryadi Sarjono and Andika Ferian
46 Pertanika J. Soc. Sci. & Hum. 26 (T): 33 - 48 (2018)
state that customers in choosing a certain service provider will consider nine criteria: availability, convenience, dependability, personalisation, price, quality, reputation, safety, and speed.
Customer will consider things such as how accessibility and reliability of service. They will also consider whether the quality of the services is worth the price they are charging, and the reputation of the service provider, or how long they will have to wait for the service. These nine criteria need to be fulfilled by GrabCar as the service provider.
Limitation of this research is that it has only examined one online service provider (Grab) in addition to using the minimum sample size (100 respondents) to draw a conclusion. For further research it will be beneficial if the sample size is larger and the focus is on other competitors such as GoJek, Uber in Indonesia.
REFERENCESCheng, B. L., & Rashid, M. Z. A. (2013). Service
quality and the mediating effect of corporate image on the relationship between customer satisfaction and customer loyalty in the Malaysian hotel industry. Gadjah Mada International Journal of Business, 15, 99-112.
Fitzsimmons, J. A., & Fitzsimmons, M. J. (2011). Service management - Operations, strategy, information technology. New York: McGraw – Hill Education.
Griffin, J. (2010). Customer loyalty: How to earn it, how to keep it. USA: A Division of Simon Schuster Inc.
Hasan, A. (2014). Marketing dan kasus-kasus pilihan. Yogyakarta: CAPS.
Hidayat, A., Zalzalah, G. G., & Ekasasi, S. R. (2016). The role of relationship marketing on customer loyalty toward Indonesian fast food restaurant. Pertanika International Journal of Social Sciences and Humanities, 24(S), 215-224.
Irawan, H. (2008). Sepuluh prinsip kepuasan pelanggan. Jakarta: Penerbit Elex Media Komputindo.
Ivanauskiene, N., & Volungenaite, J. (2014). Relations between service quality and customer loyalty: An empirical investigation of retail chain stores in emerging markets. American International Journal of Social Science, 3(2), 113-120.
Kotler, P., & Armstrong, G. (2010). Principles of marketing. Englewood Cliffs, N.J.: Prentice Hall.
Kotler, P., & Keller, K. L. (2009). Manajemen pemasaran (13th ed.). Jakarta: Erlangga.
Moha, S., & Loindong, S. (2016). Analisis kualitas pelayanan dan fasilitas terhadap kepuasan konsumen pada Hotel Yuta di kota Manado. Jurnal EMBA: Jurnal Rise t Ekonomi , Manajemen, Bisnis dan Akuntansi, 4(1).
Prihanto, A. (2013). Kepuasan dan loyalitas konsumen korporat untuk acara mice terhadap kualitas pelayanan hotel HSTH. Jurnal Manajemen dan Kewirausahaan, 15(2), 165-178.
Saleh, A., & Kadarisman, D. (2013). M u t u pelayanan, mutu produk franchise klenger burger dan kepuasan pelanggan di Tomang Jakarta Barat. Jurnal Manajemen Pengembangan Industri Kecil Menengah, 8(1), 79-87.
Sarjono, H., & Julianita, W. (2013). SPSS VS LISREL: Sebuah pengantar, aplikasi untuk riset. Jakarta: Penerbit Selemba Empat.
Sheth, J. N., & Mittal, B. (2004). Customer behavior: A managerial perspective (2nd ed.). South-Western, USA.
Service Quality and Satisfaction of Ride Hailing App
47Pertanika J. Soc. Sci. & Hum. 26 (T): 33 - 48 (2018)
Siregar, S. (2013). Metode penelitian kuantitatif. Jakarta: Kencana Prenada Media Group.
Tjiptono, F. (2007). Service, quality and satisfaction. Yogyakarta: ANDI.
Tjiptono, F. (2011). Pemasaran jasa. Malang: Banyumedia Publishing.
Tjiptono, F. (2012). Service management: Mewujudkan layanan prima (2nd ed.). Yogyakarta: ANDI.
Tjiptono, F., & Chandra, G. (2011). Pemasaran strategik. Yogyakarta:
Zeithaml, V. A., Bitner, M. J., & Gremler, D. D. (2009). Services marketing: Integrating customer focus across the firm (5th ed.). New York: McGraw-Hill.


![Contradictory Outcomes of Development Technologies on ... PAPERS/JSSH Vol. 27 (2) Jun. 2019/21 JSSH(S)-0993...tenun bukan mesin (ATBM) [stylised, non-mechanical weaving looms], which](https://img.pdfslide.net/doc/110x75/5e4db89d38ced877067eeb08/contradictory-outcomes-of-development-technologies-on-papersjssh-vol-27-2.jpg)